مهمة سطح المياه وتضاريس المحيط: تقدم في استشعار الرادار عن بُعد لسطح المحيط والمياه السطحية للأرض The Surface Water and Ocean Topography Mission: A Breakthrough in Radar Remote Sensing of the Ocean and Land Surface Water

المجلة: Geophysical Research Letters، المجلد: 51، العدد: 4
DOI: https://doi.org/10.1029/2023gl107652
تاريخ النشر: 2024-02-21

مهمة سطح المياه وتضاريس المحيط: تقدم في استشعار الرادار عن بُعد لسطح المحيط والمياه السطحية للأرض

لي-لونغ فو، تاملين بافلسكي، جان-فرانسوا كريتو، روزماري مورو، ج.توماس فارار، باراج فاز، بيير سينجينس، ناديا فينوجرادوفا-شيفر، أنيك سيلفستر-بارون، نيكولا بيكو، وآخرون.

– للاستشهاد بهذه النسخة:

لي-لونغ فو، تاملين بافلسكي، جان-فرانسوا كريتو، روزماري مورو، ج. توماس فارار، وآخرون. مهمة سطح المياه وتضاريس المحيط: تقدم في استشعار الرادار عن بُعد للمحيط ومياه سطح الأرض. رسائل البحث الجيوفيزيائي، 2024، 51 (4)، 10.1029/2023gl107652. hal-04631624

معرف HAL: hal-04631624
https://hal.science/hal-04631624v1

تم التقديم في 2 يوليو 2024
HAL هو أرشيف مفتوح متعدد التخصصات لإيداع ونشر الوثائق البحثية العلمية، سواء كانت منشورة أم لا. قد تأتي الوثائق من مؤسسات التعليم والبحث في فرنسا أو في الخارج، أو من مراكز البحث العامة أو الخاصة.
الأرشيف المفتوح متعدد التخصصات HAL مخصص لإيداع ونشر الوثائق العلمية على مستوى البحث، سواء كانت منشورة أم لا، والتي تصدر عن مؤسسات التعليم والبحث الفرنسية أو الأجنبية، أو المختبرات العامة أو الخاصة.

رسائل البحث الجيوفيزيائي

رسالة بحثية
10.1029/2023GL107652

قسم خاص:

العلوم من مهمة قمر صناعي لسطح المياه وتضاريس المحيطات

النقاط الرئيسية:

  • أول ملاحظات فضائية لسطح المحيط تحت المقياس الفرعي لفهم دور المحيط في امتصاص الحرارة من الغلاف الجوي
  • أول ملاحظات فضائية لتغير تخزين المياه في البحيرات ومعدلات تدفق الأنهار لفهم دورة المياه العذبة
  • أول ملاحظات فضائية لتفاصيل تغيير مستويات المياه الساحلية لتقييم تأثير ارتفاع مستوى سطح البحر المحلي

المراسلة إلى:

إل.-إل. فو،

اقتباس:

فو، ل.-ل.، بافلسكي، ت.، كريتو، ج.-ف.، مورو، ر.، فارار، ج. ت.، فاز، ب.، وآخرون. (2024). مهمة سطح المياه وتضاريس المحيط: تقدم في استشعار الرادار عن بُعد للمحيط ومياه سطح الأرض. رسائل البحث الجيوفيزيائي، 51، e2023GL107652.https://doi. org/10.1029/2023GL107652
تم الاستلام في 8 ديسمبر 2023
تم القبول في 5 فبراير 2024

مساهمات المؤلفين:

تصور: تاملين بافلسكي، جان-فرانسوا كريتو، روزماري مورو، ج. توماس فارار، باراج فاز، بيير سينجينس، ناديا فينوجرادوفا-شيفر، أنيك سيلفستر-بارون، نيكولا بيكو، جيرالد ديباربوري
© 2024 مختبر الدفع النفاث، معهد كاليفورنيا للتكنولوجيا والمؤلفون. تم الاعتراف برعاية الحكومة. تم المساهمة في هذه المقالة من قبل موظفي الحكومة الأمريكية وعملهم في الملكية العامة في الولايات المتحدة الأمريكية.
هذه مقالة مفتوحة الوصول بموجب شروط ترخيص المشاع الإبداعي النسب-غير التجاري-لا مشتقات، الذي يسمح بالاستخدام والتوزيع في أي وسيلة، بشرط أن يتم الاستشهاد بالعمل الأصلي بشكل صحيح، وأن يكون الاستخدام غير تجاري، وألا يتم إجراء أي تعديلات أو تكييفات.

بعثة سطح المياه وتضاريس المحيط: تقدم في استشعار الرادار عن بُعد للمحيط ومياه سطح الأرض

لي-لونغ فو (D)، تاملين بافيلسكي (D)، جان-فرانسوا كريتو روز ماري مورو (©)، ج. توماس فارار (D)، باراج فازي بيير سينجينس ناديا فينوجرادوفا-شيفر أنيك سيلفستر-بارون نيكولا بيكو (D)، وجيرالد ديباربوري (د) مختبر الدفع النفاث، معهد كاليفورنيا للتكنولوجيا، باسادينا، كاليفورنيا، الولايات المتحدة الأمريكية، جامعة نورث كارولينا، تشابل هيل، نورث كارولينا، الولايات المتحدة الأمريكية مختبر الدراسات في الجيوفيزياء والمحيطات الفضائية (LEGOS)، CNES-IRD-CNRS-UT3، جامعة تولوز، تولوز، فرنسا قسم المحيطات الفيزيائية، مؤسسة وودز هول لعلوم المحيطات، وودز هول، ماساتشوستس، الولايات المتحدة الأمريكية، المركز الوطني للدراسات الفضائية، تولوز، فرنسا مقر ناسا، واشنطن العاصمة، الولايات المتحدة الأمريكية

الملخص

تحتوي ارتفاعات أسطح المياه على معلومات مهمة حول محيطات الأرض ومياه السطح الأرضية. يرتبط ارتفاع سطح البحر في المحيطات بالتغير الداخلي في كثافة المحيط وكتلته المرتبطة بدوران المحيط واستجابته لتغير المناخ. تعتبر معدلات تدفق الأنهار وتغيرات حجم البحيرات حاسمة لإمدادات المياه العذبة والمخاطر الناتجة عن الفيضانات والجفاف الناتجة عن الأحداث المناخية المتطرفة. مهمة سطح المياه وتضاريس المحيطات (SWOT) هي قمر صناعي جديد يستخدم تقنية رادار متقدمة لتحقيق تقدم في مراقبة تباين ارتفاع أسطح المياه على مستوى العالم، مما يوفر معلومات جديدة تمامًا لم تكن متاحة سابقًا لدراسة مياه الأرض. هنا، نقدم النتائج الأولى لمهمة SWOT فوق المحيطات والأنهار والبحيرات. نحن نوضح إمكانيات المهمة للإجابة على الأسئلة العلمية في علم المحيطات والهيدرولوجيا.

الملخص

ملخص بلغة بسيطة الأرض كوكب مائي. الكمية الهائلة من مياه المحيطات قد خزنت معظم الحرارة التي أُطلقت إلى الغلاف الجوي منذ الثورة الصناعية من خلال حرق الوقود الأحفوري. وبالتالي، يتم تعديل تغير المناخ بواسطة المحيط. على اليابسة، تتأثر المياه العذبة في البحيرات والأنهار والخزانات، وهي مورد طبيعي حيوي، بالمناخ المتزايد الحرارة والتعديلات البشرية المباشرة. تحدث عمليات امتصاص المحيط للحرارة والكربون من الغلاف الجوي ودورة المياه العذبة على اليابسة على مقاييس مكانية صغيرة جداً لم يتم قياسها بشكل كافٍ من الفضاء. تم إطلاق قمر صناعي جديد، وهو مهمة سطح المياه وتضاريس المحيط (SWOT)، في ديسمبر 2022. باستخدام تكنولوجيا الرادار المتقدمة، يوفر SWOT ملاحظات عالمية غير مسبوقة لفهم دور المحيط في تغير المناخ وكيف تستجيب موارد المياه العذبة للتأثير البشري. ستعزز ملاحظات SWOT بالقرب من السواحل أيضاً فهم كيفية تأثير ارتفاع مستويات البحر على تلك السواحل.

1. المقدمة

الأرض كوكب مائي. الحضارة الإنسانية مرتبطة باستكشاف وطلب الماء. إن الاستشعار عن بُعد لكميات المحيطات الكبيرة والمياه العذبة العالمية أمر حاسم لدراسة تغير المناخ وتأثيره على المجتمع. يعتبر الاستشعار عن بُعد بالرادار مهمًا بشكل خاص لأنه يخترق غطاء السحب، مما يوفر ملاحظات تحت جميع ظروف الطقس. قبل خمسة وأربعين عامًا، وضعت ساتل سياسات، أول قمر صناعي مصمم لدراسة المحيط من الفضاء، أساس الاستشعار عن بُعد بالرادار للمحيط مع ملاحظات ارتفاع الرادار، ومقياس التشتت، والرادار ذي الفتحة الاصطناعية (SAR). لقد أصبح الاثنان الأولان أعمدة لنظام مراقبة عالمي أحدث ثورة في علم المحيطات.
على الرغم من أن القياس الدقيق لارتفاع سطح البحر بواسطة قياس الارتفاع بالرادار قد وفر سجلاً حديثًا لتغير مستوى سطح البحر العالمي والدوران المحيطي على نطاق واسع، إلا أن دقته المكانية محدودة بسبب البصمة الكبيرة للرادار. ) وضوضاء القياس. لقد جعلت هذه القيود من الصعب دراسة العمليات المحيطية الصغيرة النطاق، خاصة بالقرب من السواحل، وكذلك الأنهار والبحيرات، حيث، على الرغم من التقدم الأخير في معالجة البيانات، فإن الخصائص الهندسية لملاحظات المقياس العمودي (ومدىها المكاني أحادي البعد) قد أعقدت استخدام قياس الرادار في التطبيقات الهيدرولوجية (Le Gac، وآخرون، 2021).
تحقيق: تاملين بافلسكي، جان-فرانسوا كريتو، روزماري مورو، ج. توماس فارار، نيكولا بيكو، جيرالد ديباربوري
المنهجية: جيرالد ديباربوري التحقق: تاملين بافلسكي، جان-فرانسوا كريتو، روزماري مورو، ج. توماس فارار، باراج فاز، بيير سينجينس، ناديا فينوجرادوفا-شيفر، أنيك سيلفستر-بارون، نيكولا بيكو الكتابة – المسودة الأصلية:
تاملين بافيلسكي، جان-فرانسوا كريتو، روزماري مورو، ج. توماس فارار، باراج فاز، بيير سينجينس، ناديا فينوجرادوفا-شيفر، أنيك سيلفستر-بارون، نيكولا بيكو
بينما توفر بيانات الرادار التداخلي (SAR) صورًا عالية الدقة (مثل دقة 10 م لبيانات Sentinel 1 SAR) للعديد من ميزات المحيط والمياه الأرضية، فإنه من الصعب استخراج المعلومات الكمية اللازمة لدراسة العمليات الفيزيائية الأساسية. لقد كشفت الفروق في الطور بين الملاحظات المتتالية للرادار التداخلي عن الحركة البطيئة لصفائح الجليد منذ أوائل التسعينيات (Goldstein et al., 1993; Massonnet et al., 1993). تُسمى هذه التقنية بالرادار التداخلي ذو الفتحة الاصطناعية (InSAR). في أوائل العقد الأول من القرن الحادي والعشرين، تم إجراء مهمة تجريبية للرادار التداخلي على متن مكوك الفضاء لرسم تضاريس الأرض (Farr et al., 2007). تم تطوير مفهوم تطبيق الرادار التداخلي على متن قمر صناعي لدراسة المحيطات والهيدرولوجيا الأرضية في العقد الأول من القرن الحادي والعشرين (Biancamaria et al., 2016; Fu & Rodriguez, 2004; Morrow et al., 2019; Rodriguez et al., 2017). بعد عشرين عامًا، تم إطلاق مهمة المياه السطحية وتضاريس المحيط (SWOT) في ديسمبر 2022. باستخدام هوائيات SAR مفصولة بواسطة عمود ارتفاعه 10 م للتداخل في المدار، توفر SWOT أول قياس ثنائي الأبعاد عالي الدقة لارتفاعات المياه من الفضاء. SWOT هي مهمة مشتركة بين ناسا وCNES (الوكالة الفرنسية للفضاء)، مع مساهمات من الوكالة الكندية للفضاء ووكالة الفضاء البريطانية. العمر الافتراضي المقدر للمهمة هو 42 شهرًا، مع الأشهر الثلاثة الأولى للاختبارات الهندسية، تليها 3 أشهر للتعيير والتحقق، ثم حد أدنى من 36 شهرًا لرسم الخرائط العالمية.
في هذه الورقة نقدم النتائج الأولية من المهمة. التقدم الأساسي للمهمة هو القدرة على مراقبة ارتفاع سطح المياه بالدقة العالية التي يوفرها الرادار التداخلي. تم تحسين دقة الارتفاع والدقة المكانية بمقدار ترتيب من حيث الحجم، مما يمكّن من دراسة دوامات المحيط الصغيرة والجبهات التي تعتبر أساسية لامتصاص المحيط للحرارة والكربون من الغلاف الجوي. على اليابسة، للمرة الأولى، تقوم المهمة بإجراء مسح عالمي للتغيرات الحجمية في أنهار وبحيرات وخزانات العالم. تفتح هذه القدرة الجديدة طريقًا جديدًا لتقدم دراسة العمليات الصغيرة النطاق في المحيط التي تؤثر على تغير المناخ والموارد الحرجة والمخاطر المرتبطة بالأنهار والبحيرات والأراضي الرطبة. علاوة على ذلك، ستعزز الدقة المتزايدة دراسة العمليات القريبة من الشاطئ لتقييم تأثير ارتفاع مستوى سطح البحر والطقس القاسي، بما في ذلك في دلتا الأنهار والمصبات.

2. العمليات المحيطية الصغيرة النطاق

على مدى الثلاثين عامًا الماضية، تم استخدام الرادار التداخلي لمراقبة تضاريس المحيط (شكل ارتفاع سطح البحر) عبر مجموعة واسعة من المقاييس، من دوامات دوران المحيط على مستوى الحوض إلى دوامات كبيرة متوسطة الحجم (حوالي 200 كم في الطول الموجي) (Ballarotta et al., 2019). لقد حد ضجيج قياس الرادار من دقة المسار الطولي إلى (Vergara et al., 2019). من أجل تمييز الهيكل ثنائي الأبعاد لتضاريس المحيط، من الضروري دمج القياسات من عدة أجهزة قياس الارتفاع، مما يحد من الدقة ثنائية الأبعاد إلى 200 كم في الطول الموجي من مجموعة من 3 أجهزة قياس ارتفاع. نظام الرادار الخاص بـ SWOT، المسمى رادار التداخل بتردد Ka (أو KaRIn)، يقوم بإجراء قياسات على عرض يبلغ 120 كم (مع فجوة نادرة تبلغ 20 كم يتم أخذ عينات منها بدقة منخفضة على طول الخط المركزي بواسطة جهاز قياس ارتفاع تقليدي)، مما يوفر أول ملاحظات مباشرة لتضاريس المحيط والمياه السطحية للأرض في بعدين. تسمح الدقة العالية لنظام الرادار بمتوسط عدد كبير من البكسلات لتقليل الضجيج وما زالت تحل الإشارات الصغيرة النطاق.

2.1. التحليل الطيفي

تُستخدم طيفيات عدد الموجات على طول المسار في علم المحيطات لدراسة تسلسل الطاقة بين الديناميات المحيطية الكبيرة والصغيرة النطاق، وكذلك لوصف مستوى الضجيج الإحصائي لتقنيات قياس الارتفاع بالرادار المختلفة. يظهر طيف عدد الموجات لارتفاع سطح البحر من KaRIn في الشكل 1 (باللون الأحمر) مقارنةً بتلك من عدد من أجهزة قياس الارتفاع بالرادار، بما في ذلك جهاز قياس الارتفاع النادر على متن SWOT. إن تسطح الطيف عند عدد الموجات الأعلى من حوالي (الأطوال الموجية الأقصر من 50 كم) يعكس تأثير ضجيج القياس في أجهزة قياس الارتفاع النادرة. تُظهر المقارنة بين القياسات المتزامنة بواسطة KaRIn وجهاز قياس الارتفاع النادر لـ SWOT اتساق الاثنين عند الأطوال الموجية الأطول من 100 كم. ومع ذلك، يمكن فقط لقياس KaRIn الكشف عن طيف العمليات المحيطية الصغيرة النطاق حتى الأطوال الموجية 5 كم حيث يتسطح طيف KaRIn. تؤثر العديد من العوامل على البيانات عند أعداد الموجات العالية. لا يمكن تحديد ضجيج الجهاز بدقة من البيانات المستخدمة لحساب طيف KaRIn. تشير التحليلات الأولية لبيانات KaRIn عالية الدقة إلى أن الانحراف المعياري للضجيج الآلي في منتج البيانات 2 كم يبدو أنه أقل قليلاً من 0.4 سم. لا يزال يتم دراسة تحليل أكثر دقة لأداء نسبة الإشارة إلى الضجيج لـ KaRIn، والذي يتضمن العديد من العوامل المعقدة.
الشكل 1. طيف عدد الموجات على طول المسار لارتفاع سطح البحر من KaRIn (باللون الأحمر) مقارنةً بتلك من عدد من أجهزة قياس الارتفاع بالرادار (J3-Jason-3، AL-Altika، S3A- Sentinel-3A)، بما في ذلك جهاز قياس الارتفاع النادر على متن مهمة المياه السطحية وتضاريس المحيط (باللون البرتقالي). تم حساب الطيف العالمي المتوسط من البيانات من 1-14 مايو 2023. بالنسبة لـ KaRIn، تم تحليل البيانات من مركز كل عرض. تمثل الخط المتقطع الوردي متطلبات المهمة لأخطاء قياسات KaRIn.
تظهر متطلبات تصميم المهمة لطيف أخطاء قياسات KaRIn (JPL-D61923، 2018) أيضًا في الخط المتقطع الوردي. تم صياغة متطلبات التصميم بهذه الطريقة لتحقيق دقة متوقعة للإشارات المحيطية تصل إلى 15 كم في الطول الموجي، حيث يتسطح طيف المتطلبات. كما هو موضح في الشكل 1، فإن القدرة الظاهرة للضجيج لـ KaRIn أقل من المتطلبات بمقدار ترتيب من حيث الحجم. الطول الموجي المحلول البالغ 5 كم أقصر من دقة 50 كم لأجهزة قياس الارتفاع التقليدية أيضًا بمقدار ترتيب من حيث الحجم.
لقد تجاوز قياس KaRIn المتطلبات بمقدار ترتيب من حيث الحجم، مما يظهر استمرار تسلسل عمليات دوران المحيط من المقاييس الكبيرة إلى الصغيرة حتى في الطول الموجي، والتي لم تكن قابلة للرصد من الفضاء سابقًا. قد تكون الدوامات والجبهات الصغيرة في المحيط التي تم رصدها بواسطة SWOT مسؤولة عن جزء كبير من النقل العمودي للحرارة والمواد المغذية والمكونات الكيميائية الحيوية الأخرى في المحيط (Lapeyre & Klein، 2006). ستساهم ملاحظات SWOT بشكل كبير في تعزيز فهم دوران المحيط صغير النطاق الذي يعد حاسمًا لتقييم قدرة المحيط على الاستمرار في امتصاص الحرارة وثاني أكسيد الكربون من الغلاف الجوي المتزايد الحرارة.

2.2. الدوامات والجبهات الصغيرة النطاق في المحيط

معروض في الشكل 2 هو مثال على ملاحظات KaRIn على امتداد من المحيط في منطقة تيار الخليج قبالة كيب هاتيراس مقارنةً بالملاحظات التي أجريت بواسطة مجموعة من أجهزة قياس الارتفاع النادرة التقليدية. حتى مع وجود سبعة أجهزة قياس ارتفاع نادرة متطورة في المدار، يكشف الدقة الخشنة عن الخلايا الكتلية في الصورة، بينما تظهر صورة KaRIn تفاصيل شذوذ ارتفاع سطح البحر لتيار الخليج المتقلب والدوامات والجبهات المرتبطة به. لقد تم رصد هذه الميزات الصغيرة النطاق من الفضاء فقط بواسطة أجهزة استشعار مرئية وتحت الحمراء لدرجة حرارة سطح البحر ولونه (مثل، Castro et al., 2017)، على الرغم من أنها كانت محدودة بأيام خالية من السحب. علاوة على ذلك، فإن ارتفاع سطح البحر، كونه متناسبًا مع مجال ضغط المحيط، هو أكثر صلة مباشرة لدراسة ديناميات داخل المحيط من مجالات المؤشرات السطحية مثل لون المحيط ودرجة حرارة سطح البحر.
تتناقص المقاييس الزمنية لعمليات المحيط عمومًا مع مقاييسها المكانية. تم إطلاق SWOT في مدار خاص يمر فوق أي موقع معين ضمن نطاق القياس كل يوم وجمع البيانات في هذا المدار بين 29 مارس و11 يوليو 2023. الغرض من هذا المدار للتعيير والتحقق (CalVal) هو ثلاثة أضعاف: أولاً، يسمح المدار السريع التكرار بالعديد من الطلعات فوق محطات التحقق الأرضية في فترة زمنية قصيرة نسبيًا. ثانيًا، تتأثر أخطاء القياس بالظروف المحيطية والغلاف الجوي المتغيرة بسرعة. تتيح الملاحظات اليومية تقييم مثل هذه الأخطاء في القياس. ثالثًا، هناك
الشكل 2. مقارنة بين الملاحظات التي أجراها KaRIn على امتداد المحيط في منطقة تيار الخليج قبالة كيب هاتيراس (اللوحة اليمنى) مع الملاحظات التي أجريت بواسطة مجموعة من أجهزة قياس الارتفاع بالرادار (اللوحة اليسرى).
أيضًا إشارات المحيط المتغيرة بسرعة مثل المد والجزر والأمواج التي يتم رصدها بواسطة KaRIn. التحدي هو فصل الإشارات والأخطاء في صورة KaRIn الفورية.
في 21 يوليو 2023، انتقل SWOT إلى مرحلة رسم الخرائط العالمية حيث يغطي القمر الصناعي تقريبًا الأرض بأكملها من إلى في حوالي 21 يومًا. بدأت جمع البيانات في هذا المدار في 26 يوليو. لاحظ أن مدار CalVal السابق عينة فقط جزءًا محدودًا جدًا من الأرض بسبب المسارات الأرضية المتباعدة للقمر الصناعي في مدار التكرار الدقيق لمدة يوم واحد. في المدار الذي يستمر 21 يومًا، يغزل نطاق التغطية تدريجيًا نمطًا لتغطية السطح بالكامل للأرض التي مرت فوقها SWOT. ما يتم تعلمه من مدار CalVal الذي يتكرر كل يوم هو أمر حاسم لتفسير وتحليل الملاحظات التي تم إجراؤها في مرحلة الرسم.

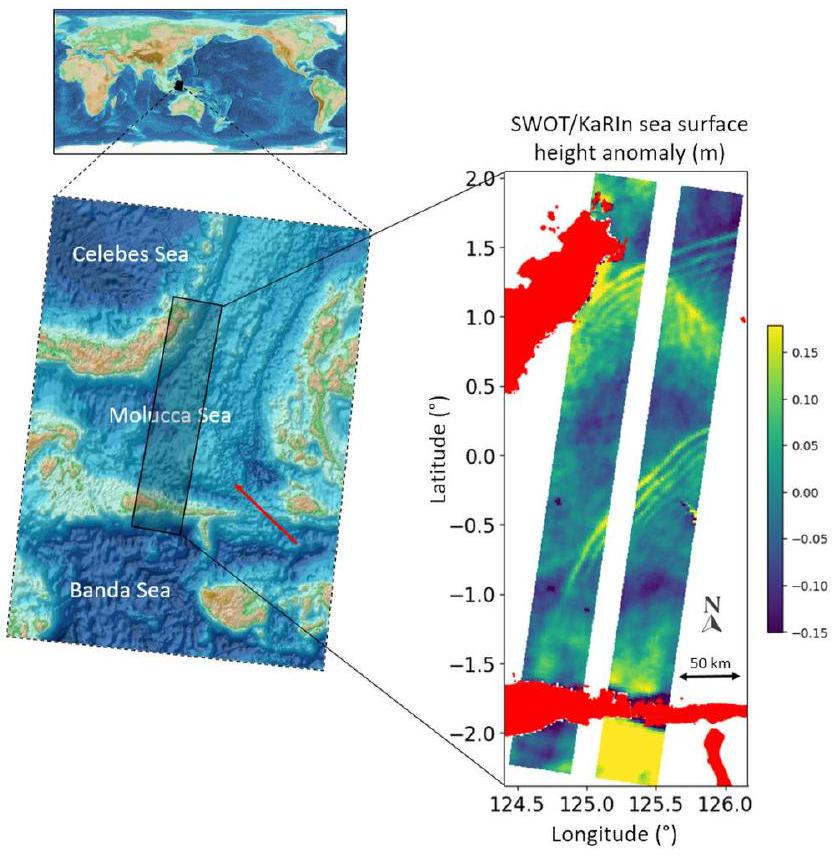
2.3. الأمواج الداخلية المنفردة

لقد التقطت دقة KaRIn العالية مجموعة واسعة من الظواهر المحيطية. على الرغم من أن الهدف المحيطي الرئيسي لـ SWOT هو تعزيز فهم الدوامات الأمواج الصغيرة والمقدمة، إلا أنه يتضح أن مجموعة متنوعة من العمليات الأخرى في المحيط يتم رصدها أيضًا بواسطة KaRIn، مما يجعل تحليل الملاحظة مثيرًا للاهتمام وتحديًا. يتم عرض مثال على مثل هذه العمليات في الشكل 3. يغطي هذا النطاق امتدادًا من المحيط في بحر مولوك، حيث تتفاعل التضاريس القاعية الوعرة مع المد والجزر المحيطي مما يخلق أنماطًا من قطارات الأمواج الداخلية المنفردة، والتي تظهر كحزم من مجموعات الأمواج مع حافة رائدة تليها سلسلة من جبهات الأمواج مع انخفاض في السعة والفواصل. هذا هو النمط الكلاسيكي للأمواج الداخلية المنفردة التي صنعتها SAR من Seasat (Fu & Holt، 1984).
منذ Seasat، كانت هناك العديد من الدراسات حول الأمواج الداخلية المنفردة من الرادار وكذلك صور اللمعان الشمسي عبر مجموعة واسعة من مواقع محيطات العالم (Jackson، 2007؛ Magalhães et al.، 2021). من خلال التوليد بواسطة تفاعل التيارات المدية مع التضاريس القاعية، ترتبط هذه الأمواج بدورة المد المحلية. أطوال موجاتها لا تتجاوز بضعة كيلومترات، قصيرة جدًا بحيث لا يمكن رصدها بواسطة جهاز قياس الارتفاع بالرادار. على الرغم من أنه تم مسح هذه الأمواج النشطة بواسطة SAR الفضائية على مدى عقود، إلا أن صور SAR لخشونة السطح لا تحتوي على معلومات حول حجم الاضطرابات السطحية المرتبطة بالطاقة للأمواج. اقترحت الدراسات السابقة استنتاجات حول الطاقة التي تحملها هذه الأمواج، مما يشير إلى أنه من الممكن يمكن أن يُعزى جزء من التبدد المدّي إلى توليد الأمواج الداخلية المنفردة فوق التضاريس القاعية الوعرة (Magalhães et al.، 2021). للمرة الأولى، ستوفر SWOT صور SAR مشتركة وخرائط ارتفاع فوق هذه الأمواج. ستؤدي مسحها بواسطة SWOT في
الشكل 3. ملاحظات سطح الماء والتضاريس المحيطية (SWOT) لارتفاعات السطح (بالمتر) للأمواج الداخلية المنفردة في بحر مولوك في المحيط الهادئ الاستوائي الغربي. المناطق الحمراء هي أراضٍ. يتم توضيح الموقع الجغرافي لملاحظات SWOT بواسطة خرائط العالم والمناطق.
مرحلة الرسم إلى تقدير عالمي لطاقة هذه الأمواج ودورها في تشتت المد والجزر المحيطي. النمط الثنائي الأبعاد المميز لهذه الأمواج يجعل من السهل اكتشافها وفصلها عن العمليات المحيطية الكبيرة المتوازنة جيوستروفياً.

3. ملاحظات الأنهار والبحيرات

في العقد الماضي، تم استخدام صور الأقمار الصناعية بشكل متزايد لدراسة الأنماط العالمية لتخزين المياه وتدفقها في الأنهار (Koblinsky et al.، 1993)، والبحيرات (Crétaux & Birkett، 2006) وسهول الفيضانات (Birkett، 1998). ومع ذلك، كانت هذه الدراسات محدودة بالبيانات المتاحة. يتم تفويت معظم البحيرات في جميع أنحاء العالم بواسطة أجهزة قياس الارتفاع القائمة على الرادار الموجودة، والتي تقيس ارتفاع المياه فقط عند النقطة العمودية (Alsdorf & Lettenmaier، 2003)، وتقلل الدقة الزمنية المحدودة للغاية للأنظمة القائمة على الليزر مثل ICESat-2 من فائدتها (Cooley et al.، 2021). بالإضافة إلى ذلك، تعني الطبيعة الأحادية البعد لهذه القياسات أن المحاولات لتقدير تصريف الأنهار وتخزين مياه البحيرات من الفضاء تتطلب دمج البيانات من مصادر أرضية أو أقمار صناعية أخرى (Crétaux et al.، 2016؛ Emery et al.، 2018؛ Tarpanelli et al.، 2022)، والتي نادرًا ما تكون متاحة في نفس الوقت. علاوة على ذلك، فإن مراقبة أعماق الفيضانات فوق سهول الفيضانات، خاصة في الأحواض غير المقاسة، هي قضية صعبة جدًا، بالكاد يمكن تحقيقها من بيانات الأقمار الصناعية الحالية. إن الجمع بين قياسات الارتفاع بواسطة الأقمار الصناعية مع بعض مجموعات البيانات العالمية المستندة إلى أجهزة استشعار الميكروويف ممكن، لكن الشكوك الناتجة ليست قابلة للقياس بسهولة وقد تكون كبيرة (Papa & Frappart، 2021).
تتناول SWOT هذه القيود، وتشير النتائج الأولية إلى أنها ستسمح بمراقبة قوية ومتزامنة للتغيرات في ارتفاع سطح المياه ومدى الفيضانات في بحيرات وأنهار وسهول الفيضانات وخزانات العالم. تظهر النتائج الأولى من SWOT فوق دلتا نهر يوكون في ألاسكا قدراتها في كل من الأنهار والبحيرات (الشكل 4أ). تم إنشاء هذه الصورة باستخدام بيانات SWOT من المستوى 2 لبحيرة المرور الفردي (LakeSP) وبيانات المستوى 2 لنهر المرور الفردي (RiverSP) التي تم جمعها في 18 يونيو 2023. في هذه الصورة فقط، نلاحظ ارتفاعات لعدة آلاف من البحيرات الصغيرة التي لا تتجاوز هكتارًا واحدًا. الارتفاعات متماسكة مكانيًا، مما يشير إلى ضوضاء قياس منخفضة نسبيًا. في الوقت نفسه، تتطابق حواف البحيرات عن كثب مع الملاحظات من صور الأقمار الصناعية البصرية عالية الدقة (الشكل 4ب). في الواقع، يُظهر فحص بيانات سحابة بكسل SWOT، وهو أدق مقياس لبيانات SWOT الجغرافية، أن العديد من المسطحات المائية التي تقل عن هكتار واحد مرئية بوضوح لـ SWOT (الشكل 4ج)، بالإضافة إلى البحيرات الأكبر المعروضة في الشكل 4أ. تمثل بيانات سحابة بكسل SWOT قياسات ارتفاع ومدى الفيضانات لـ SWOT بتنسيق مشابه لسحابة نقاط الليدار، مع تغطية كل بكسل لمنطقة محددة. تتضمن قاعدة بيانات بحيرة SWOT (PLD) فقط البحيرات التي تزيد عن هكتار واحد، ولكن قد تتطلب مراجعة بناءً على أداء SWOT الأفضل من المتوقع في هذا المجال. لم يكن هناك مصدر بيانات قبل SWOT يمكنه توفير قياسات ارتفاع سطح مياه البحيرة ومدى الفيضانات بالتفصيل المتزامن. في الوقت نفسه، تكون منحدرات الأنهار مرئية بوضوح في الشكل 4أ، حتى على طول الأنهار ذات المنحدرات الضحلة نسبيًا مثل مجرى نهر يوكون الرئيسي، الذي ينحدر من الشرق إلى الغرب بزاوية أقل من في العديد من المقاطع المعروضة هنا.
نظهر أيضًا ملاحظات SWOT الأولية فوق نهر تسيريبينا (الشكل 5)، الذي يقع في الجزء المركزي من مدغشقر ويتدفق من التلال المركزية في اتجاه قناة موزمبيق. لديه منطقة تصريف من تحتل المنطقة معظمها الأراضي العشبية، وهي ذات أهمية كبيرة للبلاد في إنتاج الأرز (ربع إجمالي الإنتاج في البلاد). المناخ شبه رطب استوائي، ويشهد موسمًا رطبًا من نوفمبر إلى مارس وموسمًا جافًا يغطي بقية السنة (أندريامبيلوسون وآخرون، 2020). خلال مرحلة التحقق من SWOT (التي بدأت في أبريل 2023)، انخفض مستوى النهر بسرعة كبيرة خلال الموسم الجاف. خلال 9 أيام من العمل الميداني في بداية أبريل، تغير ارتفاع النهر بأكثر من متر (تم قياسه باستخدام جهاز استقبال GNSS الحركي)، وهو ما يتوافق بشكل جيد مع SWOT. الصور اليومية الأولى لـ SWOT خلال هذه الفترة، التي تم جمعها بين 4 و 8 أبريل 2023، رصدت زيادة في مستوى المياه قدرها 1.06 متر (تم قياس زيادة قدرها 0.95 متر في الموقع)، ومن 8 إلى 12 أبريل، قيست SWOT انخفاضًا قدره 93 سم، بينما قيست أجهزة الاستشعار في الموقع انخفاضًا قدره 1.12 متر. ميل النهر، الذي استند إلى بيانات ميدانية في الجزء الغربي، يبلغ حوالي تم قياسه أيضًا بشكل فعال بواسطة مقياس التداخل KaRIn على SWOT (الشكل 5).
الشكل 4. (أ) بيانات ارتفاع سطح الماء من منتج بيانات SWOT RiverSP وLakeSP بتاريخ 18 يونيو 2023 على جزء من دلتا نهر يوكون في ألاسكا. (ب) تكبير لحدود البحيرات في SWOT م overlay على صور بصرية عالية الدقة تظهر التطابق الوثيق بين الحدود المستمدة من SWOT وهذه الصور. (ج) تكبير إضافي يظهر حدود البحيرات في SWOT باللون الأحمر وبكسلات الماء من SWOT التي تم اشتقاقها منها. لاحظ أن العديد من البحيرات التي تقل مساحتها عن 1 هكتار مرئية في بيانات سحابة بكسلات SWOT، مما يوضح قدرات SWOT على مراقبة المسطحات المائية حتى الأصغر من الأهداف الأصلية للمهمة.
في بعض الحالات، يؤدي الانعكاس المرآتي، حيث تؤدي السطح الأملس والمرآتي إلى انعكاس الإشارة المنبعثة من القمر الصناعي بعيدًا عن القمر الصناعي بدلاً من العودة إلى المستشعر، إلى انخفاض في إشارة القياس. نحن نسمي هذه الظاهرة المياه الداكنة. ومع ذلك، في هذه الحالة تم الحصول على عدد كافٍ من البكسلات لقياس ارتفاع النهر عند العقد وانحدار النهر في كل من المقاطع من قاعدة بيانات نهر SWOT (SWORD؛ ألتيناو وآخرون، 2021). كما تم ملاحظة عدد كبير من البحيرات الصغيرة إلى المتوسطة الحجم (بضع كيلومترات مربعة في المساحة) التي تم تحديدها في PLD بواسطة SWOT. سيكون SWOT مفيدًا للغاية في مثل هذه الأحواض غير المقاسة، التي غالبًا ما تقع في مناطق اقتصادية ضعيفة تعتمد على الزراعة المحلية.
استنادًا إلى الأدلة الأولية، فإن SWOT لديها القدرة على تلبية أو تجاوز متطلبات العلوم الخاصة بها لمراقبة البحيرات والأنهار (أي، البحيرات الأكبر من ، وأن الأنهار التي تزيد عرضها عن 100 متر). سيتطلب الأمر مزيدًا من التحليل للتحقق الكمي القوي. ستسمح قياسات SWOT بالاستنتاج من الفضاء حول تخزين مياه البحيرات (Biancamaria et al.، 2016) وتصريف الأنهار (Durand et al.، 2023) لتكملة القياسات الأرضية المحدودة جغرافيًا. تشير نتائجنا الأولية إلى أن SWOT يمكن أن تقيس هذه المتغيرات الرئيسية الحاسمة.
الشكل 5. ملاحظات سحابة بكسل لمراقبة سطح المياه وتضاريس المحيط (SWOT) فوق نهر تسيريبهيينا في 9 أبريل 2023. ارتفاع سطح المياه من المنبع إلى المصب الذي تم قياسه بواسطة SWOT على طول النهر يصل إلى 100 متر وينخفض إلى مستوى سطح البحر تقريبًا.
إلى دراسة الدورة المائية العالمية لحوالي 6 ملايين بحيرة وحوالي مناطق الأنهار (ألتيناو وآخرون، 2021).

4. الاستنتاجات

تظهر النتائج الأولية من مهمة SWOT إمكانية تحسين الفهم بشكل ملحوظ لمياه الأرض، بما في ذلك دور المحيط في مناخنا المتغير والعوامل المؤثرة في ديناميات الأنهار والبحيرات والخزانات. ستسمح المعلومات عالية الدقة المتعلقة بتغير الارتفاع في المحيطات الساحلية، والمصبات، ودلتا الأنهار بتقييم التأثير المحلي لارتفاع مستوى سطح البحر بدقة مكانية لم تكن متاحة من قبل. على المياه القارية، ستملأ SWOT الفجوات الكبيرة في مراقبة البحيرات والأنهار والأراضي الرطبة، مما يسمح بالتقدير العالمي لمتغيرات مثل التغيرات في تخزين الخزانات وتصريف الأنهار، والتي تعتبر مهمة لكل من توازن المياه العالمي وإدارة الموارد المائية. التغيرات السريعة في مياه المحيطات وسطح الأرض التي تكشفها بيانات التكرار اليومي تمثل تحديًا لتحليل بيانات التكرار لمدة 21 يومًا من المرحلة العالمية لرسم الخرائط في المهمة. المعلومات التي تقدمها بيانات التكرار اليومي حول الآليات الأساسية التي تتحكم في هذه التغيرات السريعة هي المفتاح لمواجهة هذا التحدي ولجني الفوائد من ثروة جديدة من المعلومات العالمية حول مياه الأرض.

بيان توفر البيانات

جميع مجموعات البيانات المستخدمة في هذه المخطوطة محفوظة وموزعة من قبل مستودعات بيانات الوكالات بما يتماشى مع متطلبات FAIR (مثل، شهادة Core Trust Seal المعتمدة أو الشهادة المستمرة من تحالف بيانات البحث).
  • تُوزع منتجات SWOT المستخدمة في المخطوطة من قبل مراكز المرآة التابعة لناسا وCNES. يمكن تنزيل منتجات SWOT من أي من المستودعين. تحتوي كل منتج من منتجات SWOT على وثيقة وصف منتج محددة (PDD) ومعرف كائن رقمي (DOI).
ناسا (2023) هي مستودع PODAAC لمنتجات المحيطات والهيدرولوجيا.
CNES (2023b) هو مستودع AVISO لمنتجات المحيطات
CNES (2023a) هو مستودع HYDROWEB لمنتجات الهيدرولوجيا.
  • من بين مجموعة متنوعة من منتجات تحليل SWOT المتاحة في المستودعات، يستخدم هذا البحث أربعة منتجات على وجه التحديد:

رسائل البحث الجيوفيزيائي

شكر وتقدير

يُعرب المؤلفون عن تقديرهم لمساهمات أعضاء فرق العلوم والمشاريع في SWOT، الذين طوروا العلوم وراء وبنوا قمر SWOT الصناعي. ويستحق تييري لافون تقديرًا خاصًا، حيث كان مدير مشروع SWOT في CNES منذ بدايته وتقاعد مؤخرًا. إن مساهماته في المهمة أساسية لنجاحها. كما نود أن نعرب عن تقديرنا للمساهمات الأساسية لإرنستو رودريغيز في تطوير SWOT. تم إجراء البحث جزئيًا في مختبر الدفع النفاث، معهد كاليفورنيا للتكنولوجيا، بموجب عقد مع إدارة الطيران والفضاء الوطنية (80NM0018D0004).

منتج بيانات ارتفاع سطح البحر منخفض المعدل من SWOT Level 2 KaRIn، الإصدار 1.1 متاح في مشروع SWOT (2023b).

منتج بيانات مستوى 2 KaRIn لمعدل النهر العالي SWOT، الإصدار 1.1 (PODAAC، معرف المجموعة: SWOT_L2_HR_RiverSP_1.1) متاح في مشروع SWOT (2023a).
منتج بيانات مستوى 2 من SWOT KaRIn لمعدل البحيرات العالية، الإصدار 1.1 (PODAAC، معرف المجموعة: SWOT_L2_HR_LakeSP_1.1) متاح في مشروع SWOT (2023f).
منتج بيانات مقياس الارتفاع نادير من المستوى الثاني SWOT (AVISO، المجموعة: L2_NALT_IGDR) متاح في مشروع SWOT (2023c).
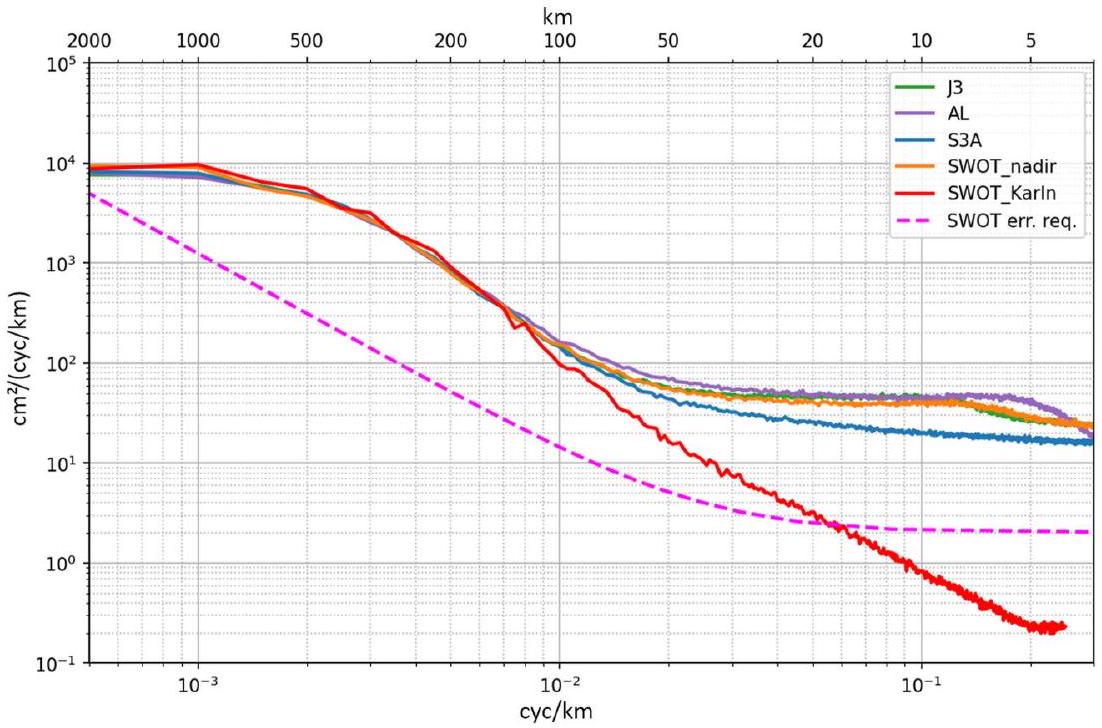
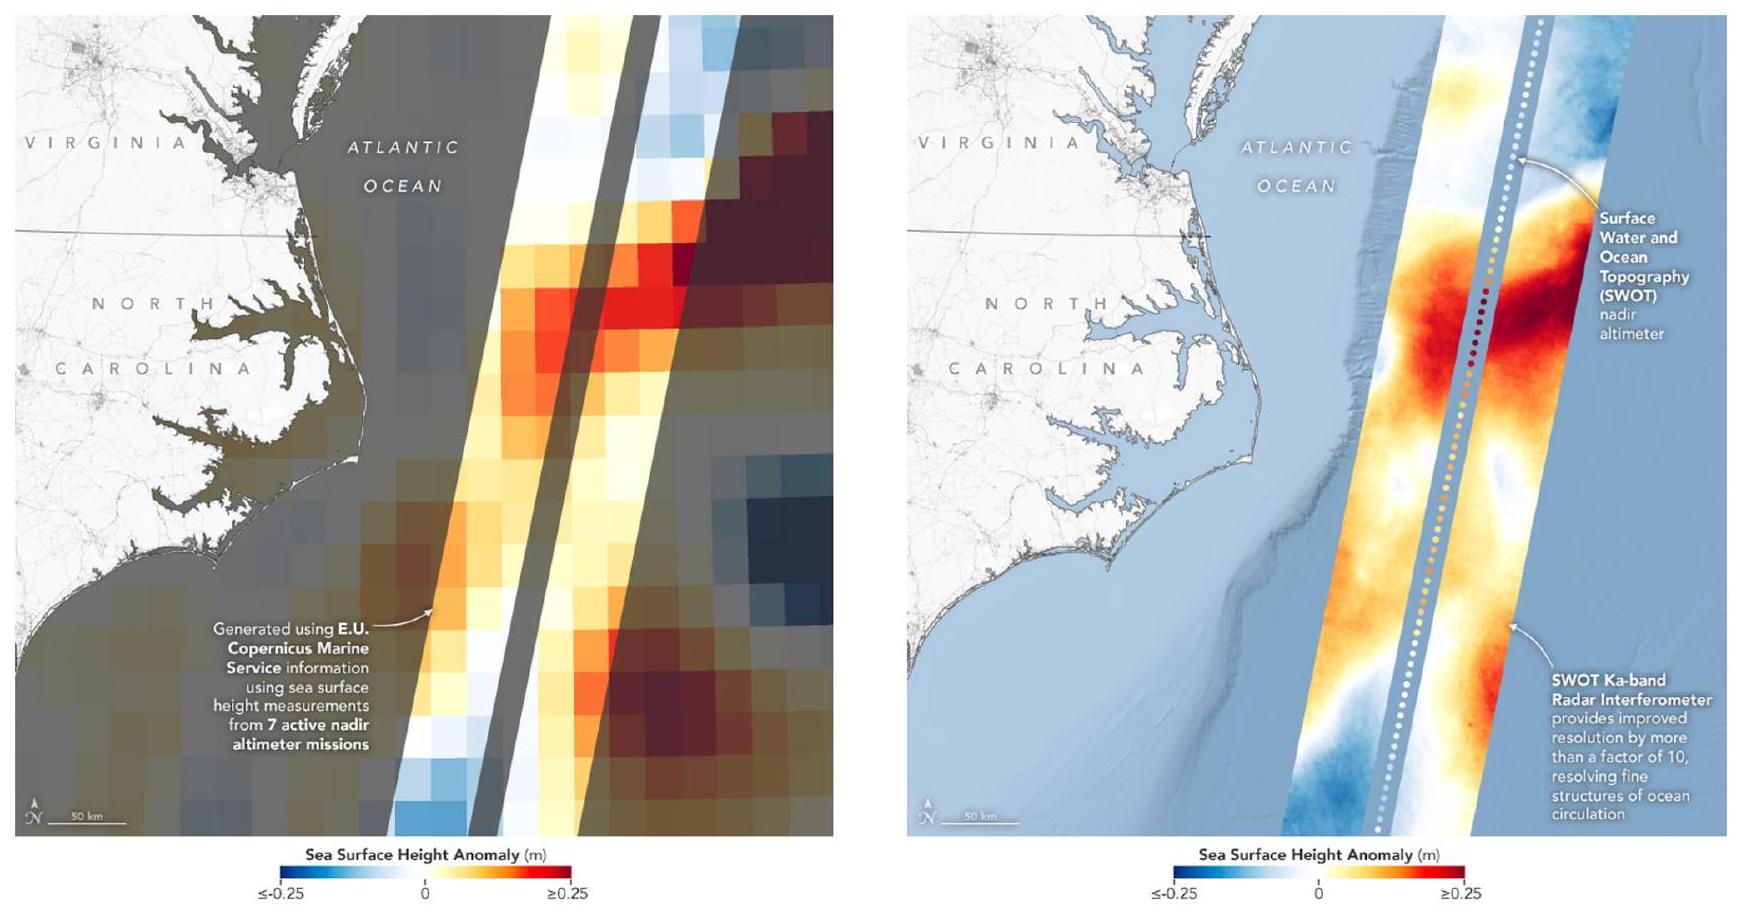
  • تستخدم هذه الورقة أيضًا منتجات المستوى الثالث من مهام القياس عن بعد الأخرى (وهي Sentinel-3 وJason-3 وSARAL) في الشكل 1، بالإضافة إلى منتجات المستوى الرابع المصفوفة من أقمار القياس عن بعد الأخرى في الشكل 2. هذه البيانات متاحة في مستودع خدمة كوبرنيكوس البحرية (2023).
المنتج من المستوى الثالث على طول المسار متاح في مشروع SWOT (2023d).
  • المنتج الشبكي من المستوى 4 هو في مشروع SWOT (2023e).
  • تم إنتاج منتجات SWOT من المستوى 1 والمستوى 2 بواسطة أقسام الأرض التابعة لقمر SWOT الصناعي من ناسا (إعادة معالجة غير متصلة بالإنترنت) وCNES (معالجة شبه حقيقية الوقت)، باستخدام خوارزميات ومعالجات موثقة في مستودع PODAAC. وثائق الأساس النظري للخوارزمية (ATBD) التي تصف هذه الخوارزميات والمعالجات متاحة ومفتوحة في PODAAC (2023). يتم تشغيل قسم الأرض التابع لناسا على خدمات أمازون ويب (AWS). يتم تشغيل قسم الأرض التابع لـ CNES على مركز بيانات خاص باستخدام نفس البرمجيات. تم إنتاج الأشكال من هذه المخطوطة باستخدام مزيج من مكتبات البرمجيات مفتوحة المصدر وحزم من مشروع PANGEO (مثل jupyter وdask وxarray وmatplotlib).
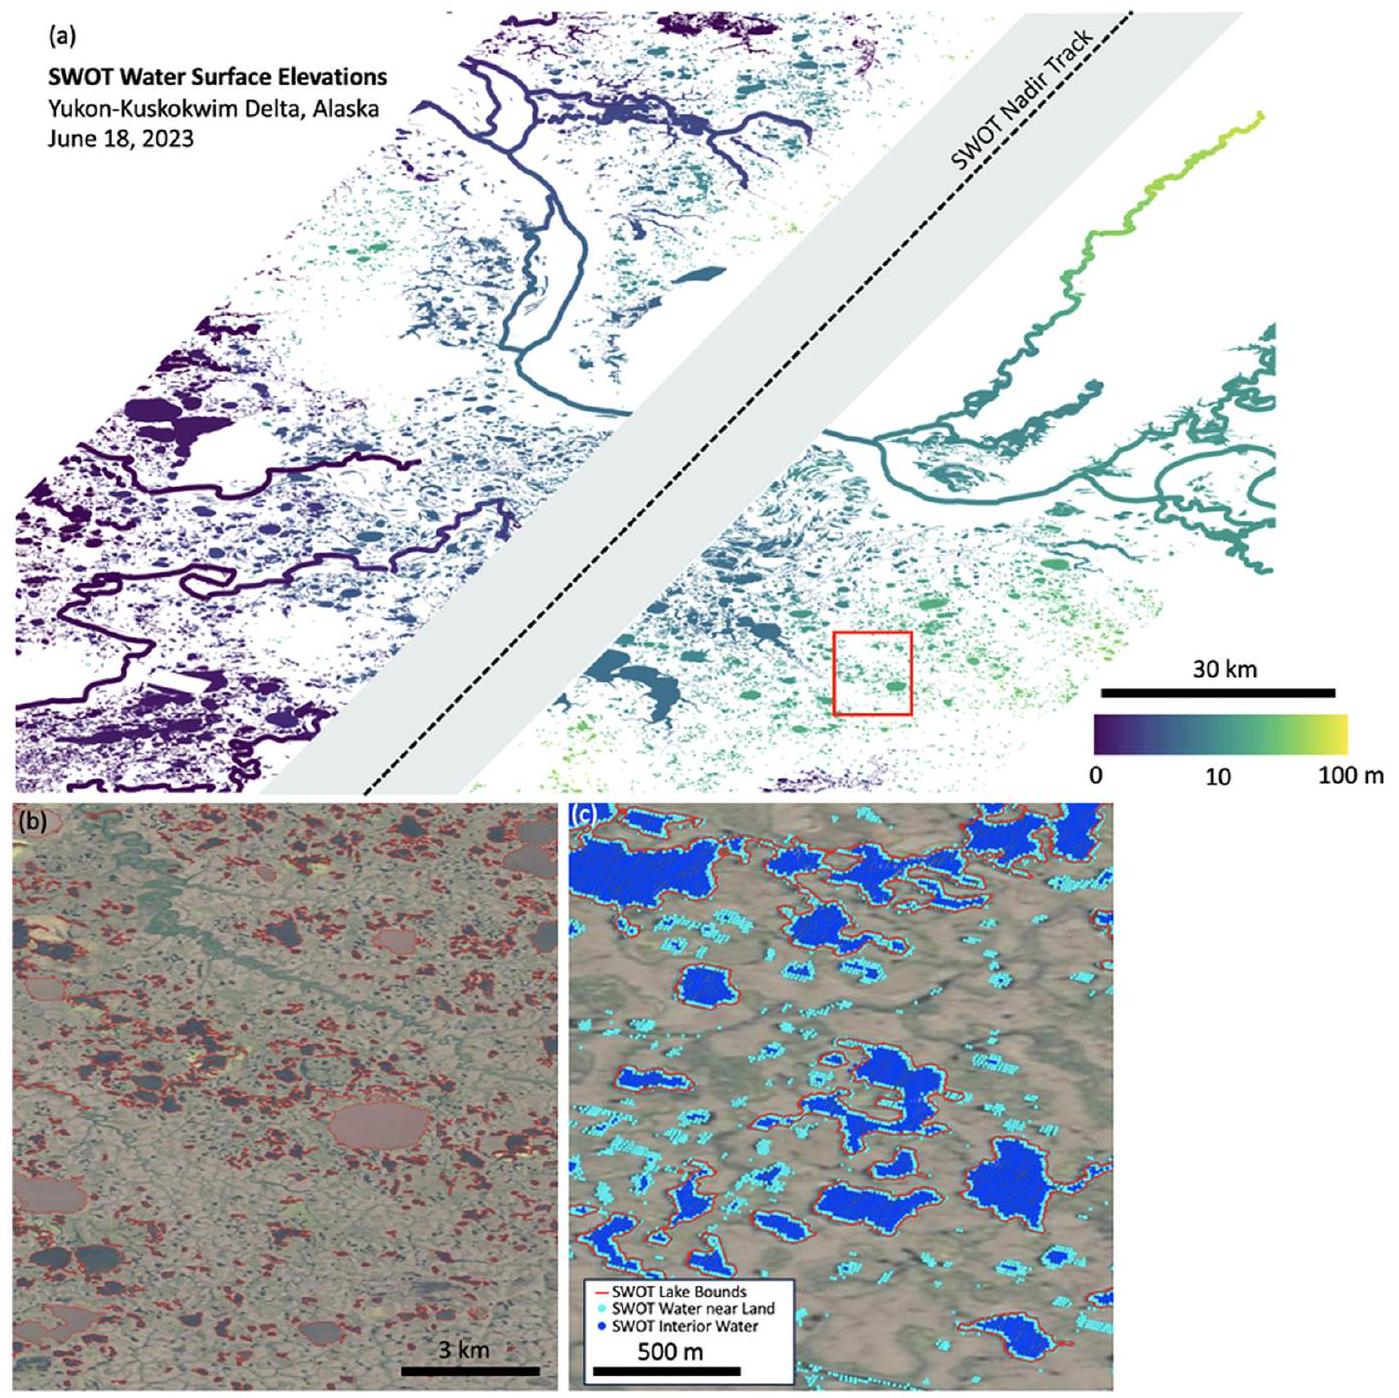
  • الصور البصرية في الشكلين 4 ب و 4 ج هي صور خلفية موحدة من جوجل وهي مزيج من بيانات لاندسات وسينتينل 2 وماكسار.

References

Alsdorf, D. E., & Lettenmaier, D. P. (2003). Tracking fresh water from space. Science, 301(5639), 1492-1494. https://doi.org/10.1126/science. 1089802
Altenau, E. H., Pavelsky, T. M., Durand, M. T., Yang, X., Frasson, R. P. D. M., & Bendezu, L. (2021). The surface water and Ocean Topography (SWOT) mission River Database (SWORD): A global river network for satellite data products. Water Resources Research, 57(7), e2021WR030054. https://doi.org/10.1029/2021wr030054
Andriambeloson, J. A., Paris, A., Calmant, S., & Rakotondraompiana, S. (2020). Re-Initiating depth-discharge monitoring in small sized ungauged watersheds by combining remote sensing and hydrological modelling: A case study in Madagascar. Hydrological Sciences Journal, 65(16), 2709-2728. https://doi.org/10.1080/02626667.2020.1833013
Ballarotta, M., Ubelmann, C., Pujol, M. I., Taburet, G., Fournier, F., Legeais, J. F., et al. (2019). On the resolutions of ocean altimetry maps. Ocean Science, 15(4), 1091-1109. https://doi.org/10.5194/os-15-1091-2019
Biancamaria, S., Lettenmaier, D. P., & Pavelsky, T. M. (2016). The SWOT mission and its capabilities for land hydrology. Surveys in Geophysics, 37(2), 307-337. https://doi.org/10.1007/s10712-015-9346-y
Birkett, C. M. (1998). Contribution of the TOPEX NASA radar altimeter to the global monitoring of large rivers and wetlands. Water Resources Research, 34(5), 1223-1239. https://doi.org/10.1029/98WR00124
Castro, S. L., Emery, W. J., Wick, G. A., & Tandy, W. (2017). Submesoscale Sea surface temperature variability from UAV and satellite measurements. Remote Sensing, 9(11), 1089. https://doi.org/10.3390/rs9111089
CNES. (2023a). HYDROWEB repository for hydrology products [Dataset]. Hydroweb. Retrieved from https://hydroweb.next.theia-land.fr
CNES. (2023b). AVISO repository for ocean products. https://doi.org/10.24400/527896/a01-2023.016
Cooley, S. W., Ryan, J. C., & Smith, L. (2021). Human alteration of global surface water storage variability. Nature, 591(7848), 78-81. https://doi. org/10.1038/s41586-021-03262-3
Copernicus Marine Service repository. (2023). Level-4 gridded products of nadir altimetry satellites [Dataset]. CMEMS. Retrieved from https:// marine.copernicus.eu/access-data
Crétaux, J.-F., Abarca Del Río, R., Bergé-Nguyen, M., Arsen, A., Drolon, V., Clos, G., & Maisongrande, P. (2016). Lake volume monitoring from Space. Survey in geophysics, 37(2), 269-305. https://doi.org/10.1007/s10712-016-9362-6
Crétaux, J.-F., & Birkett, C. (2006). Lake studies from satellite altimetry. C R Geoscience, 338(14-15), 1098-1112. https://doi.org/10.1016/J.cre. 2006.08.002
Durand, M., Gleason, C. J., Pavelsky, T. M., Prata de Moraes Frasson, R., Turmon, M., David, C. H., et al. (2023). A framework for estimating global river discharge from the Surface Water and Ocean Topography satellite mission. Water Resources Research, 59(4), e2021WR031614. https://doi.org/10.1029/2021wr031614
Emery, C., Paris, A., Santos da Silva, J., Biancamaria, S., Boone, A., Calmant, S., & Garambois, P.-A. (2018). Large scale hydrological model river storage and discharge correction using satellite altimetry-based discharge product. HESS, 22(4), 2135-2162. https://doi.org/10.5194/hess-22-2135-2018
Farr, T., Rosen, P. A., Caro, E., Crippen, R., Duren, R., Hensley, S., et al. (2007). The Shuttle radar topography mission. Review of Geophysics, 45(2), RG2004. https://doi.org/10.1029/2005RG000183
Fu, L.-L., & Holt, B. (1984). Internal waves in the Gulf of California: Observations from a spaceborne radar. Journal of Geophysical Research, 89(C2), 2053-2060. https://doi.org/10.1029/jc089ic02p02053
Fu, L.-L., & Rodriguez, R. (2004). High-resolution measurement of ocean surface topography by radar interferometry for oceanographic and geophysical applications. In R. S. J. Sparks & C. J. Hawkesworth (Eds.), AGU geophysical monograph 150, IUGG Volume 19: State of the Planet: Frontiers and challenges (pp. 209-224).
Goldstein, R., Engelhardt, H., Kamb, B., & Frolich, M. (1993). Satellite radar interferometry for monitoring ice sheet motion: Application to an Antarctic ice Stream. Science, 262(5139), 1525-1530. https://doi.org/10.1126/science.262.5139.1525
Jackson, C. R. (2007). Internal wave detection using the moderate resolution imaging spectroradiometer (MODIS). Journal of Geophysical Research, 112(C11), C11012. https://doi.org/10.1029/2007JC004220
JPL-D61923. (2018). Surface water and Ocean Topography mission (SWOT) project science requirement document. In Document custodianShailen Desai. JPL document D-61923 (p. 29).
Koblinsky, C. J., Clarke, R. T., Brenner, A. C., & Frey, H. (1993). Measurement of river level variations with satellite altimetry. Water Resources Research, 29(6), 1839-1848. https://doi.org/10.1029/93WR00542
Lapeyre, G., & Klein, P. (2006). Impact of the small-scale elongated filaments on the oceanic vertical pump. Journal of Marine Research, 64(6), 835-851. https://doi.org/10.1357/002224006779698369
Le Gac, S., Boy, F., Blumstein, D., Lasson, L., & Picot, N. (2021). Benefits of the Open-Loop Tracking Command (OLTC): Extending conventional nadir altimetry to inland waters monitoring. Advances in Space Research, 68(2), 843-852. https://doi.org/10.1016/j.asr.2019.10.031
Magalhães, J. M., Alpers, W., Santos-Ferreira, A. M., & da Silva, J. C. B. (2021). Surface wave breaking caused by internal solitary waves: Effects on radar backscattering measured by SAR and radar altimeter. Oceanography, 34(2), 166-176. https://doi.org/10.5670/oceanog.2021.203
Massonnet, D., Rossi, M., Carmona, C., Adragna, F., Peltzer, G., Feigl, K., & Rabaute, T. (1993). The displacement field of the Landers earthquake mapped by radar interferometry. Nature, 364(6433), 138-142. https://doi.org/10.1038/364138a0
Morrow, R., Fu, L.-L., Ardhuin, F., Benkiran, M., Chapron, B., Cosme, E., et al. (2019). Global observations of fine-scale ocean surface topography with the surface water and Ocean Topography (SWOT) mission. Frontiers in Marine Science, 6, 232. https://doi.org/10.3389/ fmars.2019.00232
NASA. (2023). PODAAC repository for both ocean and hydrology products [Dataset]. NASA. Retrieved from https://podaac.jpl.nasa.gov/swot? tab=datasets
Papa, F., & Frappart, F. (2021). Surface water storage in rivers and wetlands derived from satellite observations: A review of current advances and future opportunities for hydrological sciences. Remote Sensing, 13(20), 4162. https://doi.org/10.3390/rs13204162
PODAAC. (2023). SWOT algorithm theoretical Basis document. Retrieved from https://podaac.jpl.nasa.gov/swot?tab=datasetsinformation&sections=about%2Bdata
Rodriguez, E., Esteban-Fernandez, D., Peral, E., Chen, C., De Bleser, J.-W., & Williams, B. (2017). Wide-swath altimetry: A review. In D. Stammer & A. Cazenave (Eds.), Satellite altimetry over oceans and land surfaces (pp. 71-112). https://doi.org/10.1201/9781315151779-2
SWOT Project. (2023a). Level 2 KaRIn high Rate River Single pass data product, version 1.1 [Dataset]. (PODAAC, collection ID: SWOT_L2_HR_RiverSP_1.1). https://doi.org/10.5067/SWOT-RIVERSP-1.1
SWOT Project. (2023b). Level 2 KaRIn low rate Sea Surface height data product, version 1.1 [Dataset]. (AVISO, beta prevalidated collection) or (PODAAC, collection ID: SWOT_L2_LR_SSH_1.1). https://doi.org/10.24400/527896/a01-2023.015
SWOT Project. (2023c). Level-2 nadir altimeter data product [Dataset]. (AVISO, collection: L2_NALT_IGDR). https://doi.org/10.24400/ 527896/a01-2023.005
SWOT Project. (2023d). Level-3 along-track product SEALEVEL_GLO_PHY_L3_MY_008_062 [Dataset]. Earth System Science Data. https:// doi.org/10.48670/moi-00146
SWOT Project. (2023e). Level-4 gridded product SEALEVEL_GLO_PHY_L4_MY_008_047 [Dataset]. Copernicus Marine Data Store. https:// doi.org/10.48670/moi-00148
SWOT Project. (2023f). SWOT level-2 KaRIn high Rate Lake Single pass data product, version 1.1 [Dataset]. (PODAAC, collection ID: SWOT_L2_HR_LakeSP_1.1). https://doi.org/10.48670/moi-0014810.5067/SWOT-LAKESP-1.1
Tarpanelli, A., Paris, A., Sichangi, A. W., O’ Loughlin, F., & Papa, F. (2022). Water resources in Africa: The role of earth observation data and hydrodynamic modeling for derive river discharge. Survey in geophysics, 44(1), 97-122. https://doi.org/10.1007/s10712-022-09744-x
Vergara, O., Morrow, R., Pujol, I., Dibarboure, G., & Ubelmann, C. (2019). Revised global wave number spectra from recent altimeter observations. Journal of Geophysical Research: Oceans, 124(6), 3523-3537. https://doi.org/10.1029/2018jc014844

Journal: Geophysical Research Letters, Volume: 51, Issue: 4
DOI: https://doi.org/10.1029/2023gl107652
Publication Date: 2024-02-21

The Surface Water and Ocean Topography Mission: A Breakthrough in Radar Remote Sensing of the Ocean and Land Surface Water

Lee-lueng Fu, Tamlin Pavelsky, Jean-francois Cretaux, Rosemary Morrow, J.Thomas Farrar, Parag Vaze, Pierre Sengenes, Nadya Vinogradova-shiffer, Annick Sylvestre-baron, Nicolas Picot, et al.

– To cite this version:

Lee-lueng Fu, Tamlin Pavelsky, Jean-francois Cretaux, Rosemary Morrow, J. Thomas Farrar, et al.. The Surface Water and Ocean Topography Mission: A Breakthrough in Radar Remote Sensing of the Ocean and Land Surface Water. Geophysical Research Letters, 2024, 51 (4), 10.1029/2023gl107652 . hal-04631624

HAL Id: hal-04631624
https://hal.science/hal-04631624v1

Submitted on 2 Jul 2024
HAL is a multi-disciplinary open access archive for the deposit and dissemination of scientific research documents, whether they are published or not. The documents may come from teaching and research institutions in France or abroad, or from public or private research centers.
L’archive ouverte pluridisciplinaire HAL, est destinée au dépôt et à la diffusion de documents scientifiques de niveau recherche, publiés ou non, émanant des établissements d’enseignement et de recherche français ou étrangers, des laboratoires publics ou privés.

Geophysical Research Letters’

RESEARCH LETTER
10.1029/2023GL107652

Special Section:

Science from the Surface Water and Ocean Topography Satellite Mission

Key Points:

  • The first space observations of submesoscale ocean surface topography for understanding ocean’s role in heat uptake from the atmosphere
  • The first space observations of the change of water storage of lakes and flow rates of rivers for understanding the freshwater cycle
  • The first space observations of the details of the change of coastal water levels to assess the impact of local sea level rise

Correspondence to:

L.-L. Fu,

Citation:

Fu, L.-L., Pavelsky, T., Cretaux, J.-F., Morrow, R., Farrar, J. T., Vaze, P., et al. (2024). The Surface Water and Ocean Topography Mission: A breakthrough in radar remote sensing of the ocean and land surface water. Geophysical Research Letters, 51, e2023GL107652. https://doi. org/10.1029/2023GL107652
Received 8 DEC 2023
Accepted 5 FEB 2024

Author Contributions:

Conceptualization: Tamlin Pavelsky, Jean-Francois Cretaux, Rosemary Morrow, J. Thomas Farrar, Parag Vaze, Pierre Sengenes, Nadya Vinogradova-Shiffer, Annick Sylvestre-Baron, Nicolas Picot, Gerald Dibarboure
© 2024 Jet Propulsion Laboratory, California Institute of Technology and The Authors. Government sponsorship acknowledged. This article has been contributed to by U.S. Government employees and their work is in the public domain in the USA.
This is an open access article under the terms of the Creative Commons Attribution-NonCommercial-NoDerivs License, which permits use and distribution in any medium, provided the original work is properly cited, the use is non-commercial and no modifications or adaptations are made.

The Surface Water and Ocean Topography Mission: A Breakthrough in Radar Remote Sensing of the Ocean and Land Surface Water

Lee-Lueng Fu (D), Tamlin Pavelsky (D), Jean-Francois Cretaux , Rosemary Morrow (©), J. Thomas Farrar (D), Parag Vaze , Pierre Sengenes , Nadya Vinogradova-Shiffer , Annick Sylvestre-Baron , Nicolas Picot (D), and Gerald Dibarboure (D) Jet Propulsion Laboratory, California Institute of Technology, Pasadena, CA, USA, University of North Carolina, Chapel Hill, NC, USA, Laboratoire d’Études en Géophysique et Océanographie Spatiales (LEGOS), CNES-IRD-CNRS-UT3, Université de Toulouse, Toulouse, France, Department of Physical Oceanography, Woods Hole Oceanographic Institution, Woods Hole, MA, USA, Centre National d’Études Spatiales, Toulouse, France, NASA Headquarters, Washington, DC, USA

Abstract

The elevations of water surfaces hold important information on the earth’s oceans and land surface waters. Ocean sea surface height is related to the internal change of the ocean’s density and mass associated with ocean circulation and its response to climate change. The flow rates of rivers and volume changes of lakes are crucial to freshwater supplies and the hazards of floods and drought resulting from extreme weather and climate events. The Surface Water and Ocean Topography (SWOT) Mission is a new satellite using advanced radar technology to make headway in observing the variability of the elevation of water surfaces globally, providing fundamentally new information previously not available to the study of earth’s waters. Here, we provide the first results of SWOT over oceans, rivers, and lakes. We demonstrate the potential of the mission to address science questions in oceanography and hydrology.

Abstract

Plain Language Summary Earth is a water planet. The vast amount of ocean water has stored most of the heat released to the atmosphere since the Industrial Revolution through burning fossil fuels. Climate change is thus moderated by the ocean. Over land the freshwater in lakes, rivers, and reservoirs, a critical natural resource, is affected by the warming climate and direct human modifications. Processes of oceanic uptake of heat and carbon from the atmosphere and cycling of freshwater on land take place at spatial scales too small to have been adequately quantified from space. A new satellite, the Surface Water and Ocean Topography (SWOT) mission, was launched in December 2022. Using advanced radar technology, SWOT provides unprecedented global observations for understanding the ocean’s role in climate change and how freshwater resources respond to human influence. SWOT observations near coasts will also advance understanding of how rising sea levels impact those coasts.

1. Introduction

Earth is a water planet. Human civilization is linked to the exploration of and quest for water. Remote sensing of the vast amounts of ocean and global freshwater is crucial to the study of climate change and its impact on society. Radar remote sensing is particularly important because it penetrates cloud cover, providing observations under all weather conditions. Forty-five years ago, Seasat, the first satellite designed for studying the ocean from space, laid the foundation of radar remote sensing of the ocean with radar altimeter, scatterometer, and synthetic aperture radar (SAR) observations. The first two have become the pillars of a global observing system that has revolutionized oceanography.
Although the precise measurement of sea surface height by radar altimetry has provided a modern record of global sea level change and the large-scale ocean circulation, its spatial resolution is limited by the large radar footprint ( ) and measurement noise. This limitation has made it difficult to study small-scale ocean processes, especially near coasts, as well as rivers and lakes, where, despite recent advances in data processing, the geometric properties of nadir altimeter observations (and their one-dimensional spatial extent) have complicated the use of radar altimetry for hydrologic applications (Le Gac, et al., 2021).
Investigation: Tamlin Pavelsky, JeanFrancois Cretaux, Rosemary Morrow, J. Thomas Farrar, Nicolas Picot, Gerald Dibarboure
Methodology: Gerald Dibarboure Validation: Tamlin Pavelsky, JeanFrancois Cretaux, Rosemary Morrow, J. Thomas Farrar, Parag Vaze, Pierre Sengenes, Nadya VinogradovaShiffer, Annick Sylvestre-Baron, Nicolas Picot Writing – original draft:
Tamlin Pavelsky, Jean-Francois Cretaux, Rosemary Morrow, J. Thomas Farrar, Parag Vaze, Pierre Sengenes, Nadya Vinogradova-Shiffer, Annick Sylvestre-Baron, Nicolas Picot
While SAR provides high-resolution images (e.g., 10 m resolution of Sentinel 1 SAR data) of many features of the ocean and land waters, it is difficult to derive the quantitative information needed to study the underlying physical processes. Use of the phase differences of consecutive SAR observations has revealed the slow movement of ice sheets since the early 1990s (Goldstein et al., 1993; Massonnet et al., 1993). The technique is called synthetic aperture radar interferometry (InSAR). In the early 2000s, a demonstration mission of InSAR was conducted onboard the Space Shuttle to map the earth’s land topography (Farr et al., 2007). The concept of applying radar interferometry onboard a satellite to oceanography and terrestrial hydrology was developed in the 2000s (Biancamaria et al., 2016; Fu & Rodriguez, 2004; Morrow et al., 2019; Rodriguez et al., 2017). Twenty years later the Surface Water and Ocean Topography (SWOT) mission was launched in December, 2022. Using two SAR antennas separated by a 10 m mast for interferometry in orbit, SWOT provides the first two-dimensional highresolution measurement of water elevations from space. SWOT is a joint mission of NASA and CNES (the French Space Agency), with contributions from the Canadian Space Agency and the UK Space Agency. The nominal life of the mission is 42 months, with the first 3 months for engineering check out, followed by 3 months for calibration and validation, then a minimum of 36 months for global mapping.
In this paper we present early results from the mission. The fundamental advance of the mission is the capability to observe the elevation of water surface with the high resolution provided by SAR. The elevation precision and the spatial resolution are improved from that of conventional altimetry by an order of magnitude, enabling the study of small-scale ocean eddies and fronts that are essential to the ocean’s heat and carbon uptake from the atmosphere. On land, for the first time, the mission is making a global survey of volumetric changes in the world’s rivers, lakes, and reservoirs. This new capability opens a new path to advancing the study of the small-scale ocean processes affecting climate change and the critical resources and hazards associated with rivers, lakes and wetlands. Furthermore, the increased resolution will advance the study of near-shore processes to assess the coastal impact of sea level rise and severe weather, including in river deltas and estuaries.

2. Small-Scale Oceanic Processes

For the past 30 years radar altimetry has been used for observing the ocean topography (the shape of sea surface height) over a wide range of scales, from the basin-wide gyres of ocean circulation to large mesoscale eddies (circa 200 km in wavelength) (Ballarotta et al., 2019). The radar measurement noise has limited the along-track resolution to (Vergara et al., 2019). In order to discern the two-dimensional structure of ocean topography, it is necessary to combine measurements from several altimeters, limiting the two-dimensional resolution to 200 km in wavelength from a combination of 3 altimeters. The radar system of SWOT, called the Ka-band radar interferometer (or KaRIn), makes measurements over a swath of 120 km (with a 20 km nadir gap that is sampled with coarse resolution along the centerline by a conventional altimeter), providing the first direct observations of ocean topography and land surface water in two dimensions. The high resolution of the radar system allows averaging of a large number of pixels to reduce noise and still resolve small-scale signals.

2.1. Spectral Analysis

Along-track wavenumber spectra are used in oceanography to study the cascade of energy between large and small-scale ocean dynamics, and also to characterize the statistical noise level of different radar altimetry technologies. The along-track wavenumber spectrum of sea surface height from KaRIn is shown in Figure 1 (in red) in comparison with those from a number of radar altimeters, including the nadir altimeter onboard SWOT. The flattening of the spectra at wavenumbers higher than about (wavelengths shorter than 50 km ) reflects the effect of measurement noise in the nadir radar altimeters. The comparison of the simultaneous measurements by KaRIn and SWOT nadir altimeter demonstrates the consistency of the two at wavelengths longer than 100 km . However, only the KaRIn measurement can reveal the spectrum of smaller-scale ocean processes down to wavelengths of 5 km where the KaRIn spectrum flattens. Many factors affect the data at high wavenumbers. The instrument noise cannot be determined rigorously from the data used to compute the KaRIn spectrum. Preliminary analysis of the high-resolution KaRIn data suggests that the standard deviation of the instrumental noise in the 2 km data product appears to be somewhat smaller than 0.4 cm . More rigorous analysis of the KaRIn signal-to noise performance, which involves many complicated factors, is still being studied.
Figure 1. Along-track wavenumber spectrum of sea surface height from KaRIn (in red color) in comparison with those from a number of radar altimeters (J3-Jason-3, AL-Altika, S3A- Sentinel-3A), including the nadir altimeter onboard Surface Water and Ocean Topography (in orange color). Mean global spectra are calculated from the data from 1-14 May 2023. For KaRIn, the data are analyzed from the center of each swath. The pink dashed line represents the mission requirement for the KaRIn measurement errors.
The mission’s design requirement for the spectrum of KaRIn measurement errors (JPL-D61923, 2018) is also shown in the pink dashed line. The design requirement was formulated in such a way as to achieve an expected resolution of ocean signals to 15 km in wavelength, where the requirement spectrum flattens. As shown in Figure 1, the apparent noise power of KaRIn is lower than the requirement by an order of magnitude. The resolved wavelength of 5 km is shorter than the 50 km resolution of conventional altimeters also by an order of magnitude.
The KaRIn measurement has exceeded the requirement by an order of magnitude, showing the continuing cascading of ocean circulation processes from large to small scales down to in wavelength, which was previously not observable from space. The small ocean eddies and fronts observed by SWOT may be responsible for a substantial fraction of the vertical transport of heat, nutrients and other biochemical constituents of the ocean (Lapeyre & Klein, 2006). The observations of SWOT will go a long way toward advancing the understanding of small-scale ocean circulation that is crucial for assessing the ocean’s capacity to continue absorbing heat and carbon dioxide from the warming atmosphere.

2.2. Small-Scale Ocean Eddies and Fronts

Displayed in Figure 2 is an example of the KaRIn observations over a stretch of the ocean in the Gulf Stream region off Cape Hatteras compared with the observations made by a combination of conventional nadir radar altimeters. Even with seven state-of-the-art nadir altimeters in orbit, the coarse resolution is revealed by the blocky cells on the image, whereas the image of KaRIn shows the details of the sea surface height anomalies of the fluctuating Gulf Stream and associated eddies and fronts. These small-scale features have been observed from space only by visible and infrared sensors of sea surface temperature and color (e.g., Castro et al., 2017), albeit limited to cloud-free days. Furthermore, sea surface height, being proportional to the ocean pressure field, is more directly relevant for studying ocean interior dynamics than the surface tracer fields like ocean color and sea surface temperature.
The temporal scales of ocean processes generally decrease with their spatial scales. SWOT was launched into a special orbit that overflew any given location within the measurement swath every single day and collected data in this orbit between 29 March and 11 July 2023. The purpose of this Calibration and Validation (CalVal) orbit is three-fold: First, the rapid-repeat orbit allows many more overflights of CalVal ground-truth stations in a relatively short period of time. Second, the measurement errors are affected by rapidly changing oceanic and atmospheric conditions. The daily observations allow the assessment of such measurement errors. Third, there are
Figure 2. Comparison of the observations made by KaRIn over a stretch of the ocean in the Gulf Stream region off Cape Hatteras (right panel) with the observations made by a combination of radar altimeters (left panel).
also rapidly changing ocean signals such as tides and waves that are observed by KaRIn. A challenge is to separate signals and errors in a KaRIn snapshot image.
On 21 July 2023, SWOT transitioned to a global mapping phase in which the satellite covers nearly the entire earth from to in approximately 21 days. Data collection in this orbit started on 26 July . Note that the earlier CalVal orbit samples only a very limited part of the earth due to its widely separated satellite ground tracks in the 1-day exact repeat orbit. In the 21-day orbit, the swath coverage gradually weaves a pattern to cover the entire surface of the earth overflown by SWOT. What is learned from the 1-day repeat CalVal orbit is crucial to the interpretation and analysis of the observations made in the mapping phase.

2.3. Internal Solitary Waves

The high resolution of KaRIn has captured a wide range of ocean phenomena. Although the major oceanographic objective of SWOT is to advance the understanding of small-scale ocean eddies and fronts, it turns out that a variety of other processes in the ocean are also observed by KaRIn, making the analysis of the observation both interesting and challenging. An example of such processes is shown in Figure 3. This swath covers a stretch of the ocean in the Molucca Sea, where the rough bottom topography interacts with ocean tides creating the patterns of internal solitary wave trains, shown as packets of wave groups with a leading edge followed by a series of wave fronts with decreasing amplitudes and separations. This is the classical pattern of internal solitary waves made by SAR from Seasat (Fu & Holt, 1984).
Since Seasat there have been numerous studies of internal solitary waves from radar as well as sunglint images over a wide range of locations of the world’s oceans (Jackson, 2007; Magalhães et al., 2021). Through generation by interaction of tidal currents with bottom topography, these waves is tied to the local tidal cycle. Their wavelengths are only a few km, far too short to be observed by a radar altimeter. Although these energetic waves have been surveyed by spaceborne SAR over decades, SAR images of surface roughness do not have information on the magnitude of surface perturbations that are related to the energetics of the waves. Previous studies made inferences on the energy carried by these waves, suggesting possibly of tidal dissipation could be accounted for by generating internal solitary waves over rough bottom topography (Magalhães et al., 2021). For the first time, SWOT will provide joint SAR images and elevation maps over these waves. Their survey by SWOT in the
Figure 3. Surface Water and Ocean Topography (SWOT) observations of the surface elevations (in m) of Internal solitary waves in the Molucca Sea in the western tropical Pacific. Red areas are land. The geographic location of the SWOT observations is illustrated by the world and regional maps.
mapping phase will lead to a global estimate of their energy and their role in the dissipation of ocean tides. The distinct two-dimensional pattern of these waves makes it easier to detect and separate them from the large-scale geostrophically balanced ocean processes.

3. Observations of Rivers and Lakes

In the last decade, satellite imagery has increasingly been used to study global patterns of water storage and fluxes in rivers (Koblinsky et al., 1993), lakes (Crétaux & Birkett, 2006) and floodplains (Birkett, 1998). However, these studies have been limited by the available data. Most lakes worldwide are missed by existing radar-based altimeters, which measure water height only at nadir (Alsdorf & Lettenmaier, 2003), and the extremely limited temporal resolution of laser-based systems such as ICESat-2 reduce their utility (Cooley et al., 2021). In addition, the one-dimensional nature of these measurements means that attempts to estimate river discharge and lake water storage from space require incorporation of data from ground-based sources or other satellites (Crétaux et al., 2016; Emery et al., 2018; Tarpanelli et al., 2022), which are rarely available at the same time. Moreover, monitoring inundation depths over floodplains, particularly in ungauged basins, is a very challenging issue, barely achievable from current satellite data. The combination of satellite altimetry with some global data sets based on microwave sensors is doable, but the resulting uncertainties are not easily measurable and may be large (Papa & Frappart, 2021).
SWOT addresses these limitations, and preliminary results suggest that it will allow robust, simultaneous observation of changes in water surface elevation and inundation extent in the world’s lakes, rivers, floodplains and reservoirs. First results from SWOT over the Yukon River Delta in Alaska show its capabilities in both rivers and lakes (Figure 4a). This image was created using the SWOT Level 2 Lake Single Pass (LakeSP) and Level 2 River Single Pass (RiverSP) data products collected on 18 June 2023. In just this figure, we observe elevations for several thousand lakes as small as one ha. Elevations are spatially coherent, suggesting relatively low measurement noise. Meanwhile, edges of lakes closely match observations from high resolution optical satellite imagery (Figure 4b). Indeed, examination of the SWOT pixel cloud data product, the finest scale of georeferenced SWOT data, shows that many water bodies smaller than one ha are clearly visible to SWOT (Figure 4c), in addition to the larger lakes shown in Figure 4a. The SWOT pixel cloud data product represents SWOT elevation and inundation extent measurements in a formatl similar to a lidar point cloud, with each pixel covering a defined area. The SWOT Prior Lake Database (PLD) includes only lakes larger than 1 ha, but it may require revision based on SWOT’s better than expected performance in this area. No data source prior to SWOT could provide such detailed simultaneous lake water surface elevation and extent measurements. Meanwhile, river slopes are clearly visible in Figure 4a, even along relatively shallowly sloping rivers such as the mainstem of the Yukon, which descends from east to west at a grade of less than in many of the reaches shown here.
We also show preliminary SWOT observations over the Tsiribhina River (Figure 5), which is located in the central part of Madagascar and flows from the central hills in the direction to the Mozambique Channel. It has a drainage area of , occupied mostly by grassland, and it is of high importance to the country for rice production (a quarter of the total production of the country). The climate is semi-humid tropical, and it has a wet season from November to March and a dry season covering the rest of the year (Andriambeloson et al., 2020). During the validation phase of SWOT (starting in April 2023), in the dry season, the river level decreased very rapidly. During 9 days of fieldwork in the beginning of April, the river height changed by more than a meter (measured using a kinematic GNSS receiver), which compares favorably with SWOT. The first daily SWOT images during this period, collected between 4 and 8 April 2023, observe a water leve increase of 1.06 m (an increase of 0.95 m was measured in situ), and from the 8 to 12 April SWOT measured a drop of 93 cm , while the in situ sensors measured a drop of 1.12 m . The slope of the river, which based on field data in the western part is about , was also effectively measured by the KaRIn interferometer on SWOT (Figure 5).
Figure 4. (a) Surface Water and Ocean Topography (SWOT) water surface elevation data from the SWOT RiverSP and LakeSP data products for 18 June 2023 over a portion of the Yukon River Delta in Alaska. (b) Zoom-in of SWOT lake boundaries overlaid on high resolution optical imagery showing the close correspondence between SWOT-derived boundaries and this imagery. (c) Further zoom in showing SWOT lake boundaries in red and SWOT water pixels from which they are derived. Note that many lakes smaller than 1 ha are visible in SWOT pixel cloud data, illustrating SWOT’s capabilities to observe water bodies even smaller than original mission goals.
In some cases specular reflection, in which a smooth, mirror-like surface results in the satellite’s emitted signal being reflected away from the satellite rather than back to the sensor, leads to low measurement signal. We term this phenomenon dark water. However, in this case sufficient pixels were obtained to measure the river height at nodes and the river slope on each of the reaches from the SWOT River Database (SWORD; Altenau et al., 2021). A large number of small to medium size lakes (a few square kilometers in area), that are identified in the PLD, were also observed by SWOT. SWOT will be extremely useful in such ungauged basins, which often fall in economically vulnerable areas dependent on local agriculture.
Based on preliminary evidence, SWOT has the capability to meet or exceed its science requirements for monitoring lakes and rivers (i.e., lakes larger than , and rivers wider than 100 m ). Further analysis will be required for robust, quantitative validation. SWOT measurements will allow space-based inference of lake water storage (Biancamaria et al., 2016) and river discharge (Durand et al., 2023) to complement geographically limited ground-based measurements. Our preliminary results suggest that SWOT can measure these key variables crucial
Figure 5. Surface Water and Ocean Topography (SWOT) pixel cloud observations over the Tsiribihina river on 9 April 2023. Water Surface Elevation from upstream to downstream measured by SWOT along the river is as high as 100 m and drops to approximately sea level.
to the study of the global water cycle for nearly 6 million lakes and approximately river reaches (Altenau et al., 2021).

4. Conclusions

Preliminary results from the SWOT Mission show the potential to markedly improve understanding of earth’s waters, including the ocean’s role in our changing climate and the drivers of dynamics in rivers, lakes, and reservoirs. The high-resolution information regarding elevation change in coastal oceans, estuaries and river deltas will allow assessment of the localized impact of sea level rise with a spatial granularity previously unavailable. Over continental waters, SWOT will fill substantial gaps in monitoring of lakes, rivers, and wetlands, allowing global estimation of variables such as variations in reservoir storage and river discharge that are important to both the global water balance and water resource management. The rapid changes of the ocean and land surface waters revealed by the 1 -day repeat data pose a challenge to the analysis of the 21-day repeat data from the global mapping phase of the mission. The information provided by the 1 -day repeat data on the underlying mechanisms controlling these rapid changes is key to meeting this challenge and to reaping the rewards from a wealth of new global information about the earth’s waters.

Data Availability Statement

All datasets used in this manuscript are preserved and distributed by the Agencies’ data repositories in compliance with FAIR requirements (e.g., Core Trust Seal certified or ongoing certification from the Research Data Alliance).
  • The SWOT products used in the manuscript are distributed by mirror centers from NASA and CNES. The SWOT products can be downloaded from either repository. Each SWOT product has a specific product description document (PDD) and digital object identifier (DOI).
NASA (2023) is the PODAAC repository for both ocean and hydrology products
CNES (2023b) is the AVISO repository for ocean products
CNES (2023a) is the HYDROWEB repository for hydrology products.
  • Among the variety of SWOT products available on the repositories, this paper specifically uses four products:

Geophysical Research Letters

Acknowledgments

The authors acknowledge the contributions of members of the SWOT Science and Project Teams, who developed the science behind and built the SWOT satellite. Special recognition is due to Thierry Lafon, who was CNES project manager of SWOT since inception and retired recently. His contributions to the mission are key to the success. We would also like to acknowledge the fundamental contributions of Ernesto Rodriguez to the development of SWOT. The research was carried out in part at the Jet Propulsion Laboratory, California Institute of Technology, under a contract with the National Aeronautics and Space Administration (80NM0018D0004).

The SWOT Level 2 KaRIn Low Rate Sea Surface Height Data Product, Version 1.1 is available in SWOT Project (2023b).

The SWOT Level 2 KaRIn High Rate River Single Pass Data Product, Version 1.1 (PODAAC, collection ID:SWOT_L2_HR_RiverSP_1.1) is available in SWOT Project (2023a).
The SWOT Level-2 KaRIn High Rate Lake Single Pass Data Product, Version 1.1 (PODAAC, collection ID:SWOT_L2_HR_LakeSP_1.1) is available in SWOT Project (2023f).
The SWOT Level-2 Nadir Altimeter Data Product (AVISO, collection: L2_NALT_IGDR) is available in SWOT Project (2023c).
  • This paper also uses Level-3 products from other altimetry missions (namely Sentinel-3, Jason-3, SARAL) in Figure 1, as well as Level-4 gridded products other nadir altimetry satellites in Figure 2. These datasets are available in Copernicus Marine Service repository (2023).
The Level-3 along-track product is available in SWOT Project (2023d).
  • The Level-4 gridded product is in SWOT Project (2023e).
  • The SWOT Level-1 and Level-2 products were generated by the SWOT satellite ground segments from NASA (offline reprocessing) and CNES (near-real time processing), using algorithms and processors documented on the PODAAC repository. The Algorithm Theoretical Basis Documents (ATBD) describing said algorithms and processors is open and available in PODAAC (2023). The NASA ground segment is operated on the Amazon Web Services (AWS). The CNES ground segment is operated on a proprietary datacenter using the same software. The figures from this manuscript were produced with a combination of open source software libraries and packages from the PANGEO project (e.g., jupyter, dask, xarray, matplotlib).
  • The optical imagery in Figures 4 b and 4 c is standardized background imagery from Google and is an amalgam of Landsat, Sentinel 2, and Maxar data.

References

Alsdorf, D. E., & Lettenmaier, D. P. (2003). Tracking fresh water from space. Science, 301(5639), 1492-1494. https://doi.org/10.1126/science. 1089802
Altenau, E. H., Pavelsky, T. M., Durand, M. T., Yang, X., Frasson, R. P. D. M., & Bendezu, L. (2021). The surface water and Ocean Topography (SWOT) mission River Database (SWORD): A global river network for satellite data products. Water Resources Research, 57(7), e2021WR030054. https://doi.org/10.1029/2021wr030054
Andriambeloson, J. A., Paris, A., Calmant, S., & Rakotondraompiana, S. (2020). Re-Initiating depth-discharge monitoring in small sized ungauged watersheds by combining remote sensing and hydrological modelling: A case study in Madagascar. Hydrological Sciences Journal, 65(16), 2709-2728. https://doi.org/10.1080/02626667.2020.1833013
Ballarotta, M., Ubelmann, C., Pujol, M. I., Taburet, G., Fournier, F., Legeais, J. F., et al. (2019). On the resolutions of ocean altimetry maps. Ocean Science, 15(4), 1091-1109. https://doi.org/10.5194/os-15-1091-2019
Biancamaria, S., Lettenmaier, D. P., & Pavelsky, T. M. (2016). The SWOT mission and its capabilities for land hydrology. Surveys in Geophysics, 37(2), 307-337. https://doi.org/10.1007/s10712-015-9346-y
Birkett, C. M. (1998). Contribution of the TOPEX NASA radar altimeter to the global monitoring of large rivers and wetlands. Water Resources Research, 34(5), 1223-1239. https://doi.org/10.1029/98WR00124
Castro, S. L., Emery, W. J., Wick, G. A., & Tandy, W. (2017). Submesoscale Sea surface temperature variability from UAV and satellite measurements. Remote Sensing, 9(11), 1089. https://doi.org/10.3390/rs9111089
CNES. (2023a). HYDROWEB repository for hydrology products [Dataset]. Hydroweb. Retrieved from https://hydroweb.next.theia-land.fr
CNES. (2023b). AVISO repository for ocean products. https://doi.org/10.24400/527896/a01-2023.016
Cooley, S. W., Ryan, J. C., & Smith, L. (2021). Human alteration of global surface water storage variability. Nature, 591(7848), 78-81. https://doi. org/10.1038/s41586-021-03262-3
Copernicus Marine Service repository. (2023). Level-4 gridded products of nadir altimetry satellites [Dataset]. CMEMS. Retrieved from https:// marine.copernicus.eu/access-data
Crétaux, J.-F., Abarca Del Río, R., Bergé-Nguyen, M., Arsen, A., Drolon, V., Clos, G., & Maisongrande, P. (2016). Lake volume monitoring from Space. Survey in geophysics, 37(2), 269-305. https://doi.org/10.1007/s10712-016-9362-6
Crétaux, J.-F., & Birkett, C. (2006). Lake studies from satellite altimetry. C R Geoscience, 338(14-15), 1098-1112. https://doi.org/10.1016/J.cre. 2006.08.002
Durand, M., Gleason, C. J., Pavelsky, T. M., Prata de Moraes Frasson, R., Turmon, M., David, C. H., et al. (2023). A framework for estimating global river discharge from the Surface Water and Ocean Topography satellite mission. Water Resources Research, 59(4), e2021WR031614. https://doi.org/10.1029/2021wr031614
Emery, C., Paris, A., Santos da Silva, J., Biancamaria, S., Boone, A., Calmant, S., & Garambois, P.-A. (2018). Large scale hydrological model river storage and discharge correction using satellite altimetry-based discharge product. HESS, 22(4), 2135-2162. https://doi.org/10.5194/hess-22-2135-2018
Farr, T., Rosen, P. A., Caro, E., Crippen, R., Duren, R., Hensley, S., et al. (2007). The Shuttle radar topography mission. Review of Geophysics, 45(2), RG2004. https://doi.org/10.1029/2005RG000183
Fu, L.-L., & Holt, B. (1984). Internal waves in the Gulf of California: Observations from a spaceborne radar. Journal of Geophysical Research, 89(C2), 2053-2060. https://doi.org/10.1029/jc089ic02p02053
Fu, L.-L., & Rodriguez, R. (2004). High-resolution measurement of ocean surface topography by radar interferometry for oceanographic and geophysical applications. In R. S. J. Sparks & C. J. Hawkesworth (Eds.), AGU geophysical monograph 150, IUGG Volume 19: State of the Planet: Frontiers and challenges (pp. 209-224).
Goldstein, R., Engelhardt, H., Kamb, B., & Frolich, M. (1993). Satellite radar interferometry for monitoring ice sheet motion: Application to an Antarctic ice Stream. Science, 262(5139), 1525-1530. https://doi.org/10.1126/science.262.5139.1525
Jackson, C. R. (2007). Internal wave detection using the moderate resolution imaging spectroradiometer (MODIS). Journal of Geophysical Research, 112(C11), C11012. https://doi.org/10.1029/2007JC004220
JPL-D61923. (2018). Surface water and Ocean Topography mission (SWOT) project science requirement document. In Document custodianShailen Desai. JPL document D-61923 (p. 29).
Koblinsky, C. J., Clarke, R. T., Brenner, A. C., & Frey, H. (1993). Measurement of river level variations with satellite altimetry. Water Resources Research, 29(6), 1839-1848. https://doi.org/10.1029/93WR00542
Lapeyre, G., & Klein, P. (2006). Impact of the small-scale elongated filaments on the oceanic vertical pump. Journal of Marine Research, 64(6), 835-851. https://doi.org/10.1357/002224006779698369
Le Gac, S., Boy, F., Blumstein, D., Lasson, L., & Picot, N. (2021). Benefits of the Open-Loop Tracking Command (OLTC): Extending conventional nadir altimetry to inland waters monitoring. Advances in Space Research, 68(2), 843-852. https://doi.org/10.1016/j.asr.2019.10.031
Magalhães, J. M., Alpers, W., Santos-Ferreira, A. M., & da Silva, J. C. B. (2021). Surface wave breaking caused by internal solitary waves: Effects on radar backscattering measured by SAR and radar altimeter. Oceanography, 34(2), 166-176. https://doi.org/10.5670/oceanog.2021.203
Massonnet, D., Rossi, M., Carmona, C., Adragna, F., Peltzer, G., Feigl, K., & Rabaute, T. (1993). The displacement field of the Landers earthquake mapped by radar interferometry. Nature, 364(6433), 138-142. https://doi.org/10.1038/364138a0
Morrow, R., Fu, L.-L., Ardhuin, F., Benkiran, M., Chapron, B., Cosme, E., et al. (2019). Global observations of fine-scale ocean surface topography with the surface water and Ocean Topography (SWOT) mission. Frontiers in Marine Science, 6, 232. https://doi.org/10.3389/ fmars.2019.00232
NASA. (2023). PODAAC repository for both ocean and hydrology products [Dataset]. NASA. Retrieved from https://podaac.jpl.nasa.gov/swot? tab=datasets
Papa, F., & Frappart, F. (2021). Surface water storage in rivers and wetlands derived from satellite observations: A review of current advances and future opportunities for hydrological sciences. Remote Sensing, 13(20), 4162. https://doi.org/10.3390/rs13204162
PODAAC. (2023). SWOT algorithm theoretical Basis document. Retrieved from https://podaac.jpl.nasa.gov/swot?tab=datasetsinformation&sections=about%2Bdata
Rodriguez, E., Esteban-Fernandez, D., Peral, E., Chen, C., De Bleser, J.-W., & Williams, B. (2017). Wide-swath altimetry: A review. In D. Stammer & A. Cazenave (Eds.), Satellite altimetry over oceans and land surfaces (pp. 71-112). https://doi.org/10.1201/9781315151779-2
SWOT Project. (2023a). Level 2 KaRIn high Rate River Single pass data product, version 1.1 [Dataset]. (PODAAC, collection ID: SWOT_L2_HR_RiverSP_1.1). https://doi.org/10.5067/SWOT-RIVERSP-1.1
SWOT Project. (2023b). Level 2 KaRIn low rate Sea Surface height data product, version 1.1 [Dataset]. (AVISO, beta prevalidated collection) or (PODAAC, collection ID: SWOT_L2_LR_SSH_1.1). https://doi.org/10.24400/527896/a01-2023.015
SWOT Project. (2023c). Level-2 nadir altimeter data product [Dataset]. (AVISO, collection: L2_NALT_IGDR). https://doi.org/10.24400/ 527896/a01-2023.005
SWOT Project. (2023d). Level-3 along-track product SEALEVEL_GLO_PHY_L3_MY_008_062 [Dataset]. Earth System Science Data. https:// doi.org/10.48670/moi-00146
SWOT Project. (2023e). Level-4 gridded product SEALEVEL_GLO_PHY_L4_MY_008_047 [Dataset]. Copernicus Marine Data Store. https:// doi.org/10.48670/moi-00148
SWOT Project. (2023f). SWOT level-2 KaRIn high Rate Lake Single pass data product, version 1.1 [Dataset]. (PODAAC, collection ID: SWOT_L2_HR_LakeSP_1.1). https://doi.org/10.48670/moi-0014810.5067/SWOT-LAKESP-1.1
Tarpanelli, A., Paris, A., Sichangi, A. W., O’ Loughlin, F., & Papa, F. (2022). Water resources in Africa: The role of earth observation data and hydrodynamic modeling for derive river discharge. Survey in geophysics, 44(1), 97-122. https://doi.org/10.1007/s10712-022-09744-x
Vergara, O., Morrow, R., Pujol, I., Dibarboure, G., & Ubelmann, C. (2019). Revised global wave number spectra from recent altimeter observations. Journal of Geophysical Research: Oceans, 124(6), 3523-3537. https://doi.org/10.1029/2018jc014844