نحو مؤشرات الاقتصاد الدائري: أدلة من الاتحاد الأوروبي Towards circular economy indicators: Evidence from the European Union

المجلة: Waste Management & Research The Journal for a Sustainable Circular Economy، المجلد: 42، العدد: 8
DOI: https://doi.org/10.1177/0734242×241237171
PMID: https://pubmed.ncbi.nlm.nih.gov/38501268
تاريخ النشر: 2024-03-19

إدارة النفايات والبحث 1-11
© المؤلف(ون) 2024

نحو مؤشرات الاقتصاد الدائري: أدلة من الاتحاد الأوروبي

إديانو د’أدامو1 © ، دانييل فافاري ماسيمو غاستالدي وجوليان كيرشهر

الملخص

الاتحاد الأوروبي (EU) يتحرك نحو التنمية المستدامة، وتلعب نماذج الاقتصاد الدائري (CE) دورًا رئيسيًا في تقليل الضغط على الموارد الطبيعية، وتوليد الوظائف وتعزيز الفرص الاقتصادية. المؤشرات قادرة على تجميع مجموعة متنوعة من المعلومات واستخدامها، من خلال استخدام تحليل القرار متعدد المعايير (MCDA)، يسمح بمراقبة أداء البدائل. يهدف هذا العمل إلى حساب أداء دول الاتحاد الأوروبي 27 في السنوات 2019 و2020 وفقًا لـ 15 مؤشرًا للاقتصاد الدائري متاحة على يوروستات. تظهر نتائج عملية التحليل الهرمي أن أكبر تأثير على الدائرية يتحدد من خلال فئة “التنافسية والابتكار”، التي تمثل مع فئة “الاستدامة العالمية والمرونة” ثلثي الوزن الإجمالي. تظهر نتائج MCDA أن بلجيكا تتفوق في كل من السيناريوهات الأساسية والبديلة، متقدمة على إيطاليا وهولندا على التوالي. بشكل عام، تتفوق السياسات الدائرية في دول غرب أوروبا، بينما أداء دول شرق أوروبا أضعف. تسلط تداعيات هذا العمل الضوء على الحواجز الرئيسية الثلاثة لتطوير نماذج الاقتصاد الدائري: (i) إدارة النفايات غير القانونية؛ (ii) نقص المعرفة وانخفاض مستوى الاستثمار في التقنيات الدائرية و (iii) انخفاض توزيع القيمة بين أصحاب المصلحة. بهذه الطريقة، ستمكن إدارة الموارد القائمة على الدائرية أوروبا من مواجهة تحديات الاستدامة مع تقليل الاعتماد على المواد الخام المستوردة.

الكلمات الرئيسية

الاقتصاد الدائري، أوروبا، المؤشرات، تحليل القرار متعدد المعايير، إدارة الموارد
تم الاستلام في 9 يناير 2024، وقُبل في 18 فبراير 2024 من قبل المحرر المساعد أنطونيس أ. زورباس.

مقدمة

وكالة البيئة الأوروبية (2016) اقترحت الاقتصاد الدائري (CE) كعنصر مركزي في نموذج الاقتصاد الأخضر الذي يوسع إدارة النفايات (WM) والوقاية من النفايات وكفاءة الموارد إلى رفاهية الإنسان ومرونة النظام البيئي. CE هو “نظام اقتصادي يستبدل مفهوم ‘نهاية الحياة’ بتقليل، أو إعادة استخدام، أو إعادة تدوير واستعادة المواد في عمليات الإنتاج/التوزيع والاستهلاك” (كيرشر وآخرون، 2017). مفهوم CE هو موضوع حاسم نحو التنمية المستدامة (بوكرايس وراجوسنيغ، 2023؛ د’أدامو وآخرون، 2023أ؛ زورباس وآخرون، 2021)، على الرغم من أن تأثير كل مصدر من مصادر قيمة CE (إعادة التدوير، الطاقة المتجددة، الإصلاح وإعادة الاستخدام) يختلف عبر الأبعاد الثلاثة للاستدامة (كنابل وآخرون، 2022). يمكن رؤية تنفيذه على نطاق واسع مدفوعًا بسياسات مناسبة (هارتلي وآخرون، 2020) وفي مشاريع ملموسة تقوم الشركات بتنفيذها (هنري وآخرون، 2020). عند تحليل بيانات مهمة الشركات حول CE، يظهر موضوع الاستدامة ويتبعه موضوع التكنولوجيا والإنتاج والاستهلاك (PC). ومع ذلك، ضمن موضوع الاستدامة، يتلقى المكون الاجتماعي اهتمامًا أقل (كافيرا وآخرون، 2023). موضوع الاقتصاد الدائري مرتبط ارتباطًا وثيقًا بإدارة النفايات، والتي يمكن أن تُعبر عنها من حيث النماذج الرياضية (بارما وآخرون، 2022؛ بارما وموديبو، 2022)، المحلية.
نهج (لويزيا وآخرون، 2021) واندماجات في سياقات مختلفة (أربولينو وآخرون، 2021؛ فاكّي وآخرون، 2021).
النماذج الدائرية ليست مستدامة عندما يحدث انتعاش الاقتصاد الدائري، حيث يتم تعويض التحسينات في الكفاءة البيئية لنظام الإنتاج من خلال استجابات نظامية خارجية (زينك وجاير، 2017). علاوة على ذلك، تقدم الأدبيات العديد من الأعمال حول الاقتصاد الدائري، لكن ليس جميعها موجهة نحو اقتراح حلول ملموسة، وينبغي تثبيط هذه الممارسة (كيرشهر، 2023). يتم اقتراح تعريفات مختلفة للاقتصاد الدائري في الأدبيات،
يمكن ملاحظة أنه في السنوات الأخيرة كان هناك تركيز متزايد على إعادة الاستخدام وإعادة التدوير، والتي تُقترح كمبادئ أساسية للايكولوجيا (كيرشهر وآخرون، 2023، 2017). علاوة على ذلك، قد تتطلب نماذج الاقتصاد الدائري ليس فقط تغييرات تدريجية ولكن أيضًا إعادة تكوين سلاسل الإمداد. مشابهًا للتفسير أعلاه، فإن المزيد من الاهتمام بأهداف الاقتصاد الدائري هو تلك التي تميل نحو التنمية المستدامة وفي المستقبل، يجب إعطاء الكثير من الاهتمام للاحتفاظ بالقيمة وكفاءة الموارد.
الهدف من الاقتصاد الدائري هو تحسين استخدام الموارد الطبيعية من خلال تقليل الآثار السلبية للاستخراج والمعالجة على الطاقة والصحة والبيئة من خلال برامج إعادة الاستخدام وإعادة التدوير والاسترداد (Chiappetta Jabbour et al., 2019). من أجل تحقيق ذلك، بدأت سياسات إدارة النفايات في التحول من السيناريوهات التقليدية (المعتمدة على المدافن) إلى سيناريوهات جديدة (المعتمدة على المواد المعاد تدويرها والطاقة المتجددة) – (Islam et al., 2020; Voukkali et al., 2023). ومن الجدير بالذكر أن مفهوم الاقتصاد الدائري يهدف إلى إعطاء قيمة للنفايات من خلال اتباع نموذج 5R: إعادة التصميم – التقليل – الاسترداد – إعادة التدوير – إعادة الاستخدام (Chen et al., 2020). يمكن أن تُظهر تحليلات دورة الحياة لمنتجات مختلفة أي الممارسات الدائرية من المرجح أن تحقق أهداف الاستدامة.
يتطلب تنفيذ سياسات إدارة النفايات الصارمة تدابير رقابية لتجنب خطر زيادة التدفقات غير القانونية (D’Amato et al., 2018) ولا تعرف السلطات المحلية دائمًا متى لم يعد يُعتبر شيء ما نفايات (Mazzanti and Montini, 2014). يُشير بعض المؤلفين إلى أن أوروبا يجب أن تقترح معايير واضحة لا جدال فيها تحدد بالضبط متى يحصل الشيء على حالة منتج (أو مادة خام ثانوية (RM)) (Ragossnig and Schneider, 2019). في هذا الصدد، يلعب مفهوم نهاية النفايات دورًا رئيسيًا، وهو العملية التي يتوقف من خلالها الشيء عن كونه نفايات ويمكن استعادته بالكامل، مكتسبًا حالة منتج (أو مادة خام ثانوية). كما تحدد توجيهات إطار النفايات الأوروبية أن الابتكارات يمكن أن تحول النفايات إلى مورد قيم وأن المادة المستعادة بالكامل لا تسبب آثارًا سلبية على البيئة أو صحة الإنسان. تُعتبر نهاية النفايات، جنبًا إلى جنب مع التغيير الاجتماعي، عاملاً ممكنًا لممارسات إعادة الاستخدام وإعادة التدوير. إن الاقتصاد الدائري في سعيه للاستفادة من النفايات هو أيضًا مسؤولية اجتماعية تتضمن مشاركة الموارد (D’Adamo et al., 2022).
تتطلب الحاجة إلى تقديم مؤشرات واضحة لصانعي السياسات وفئات أخرى من أصحاب المصلحة مؤشرات كمية. في هذا الصدد، فإن تحديد المؤشرات يكون مفيدًا. تجعل تصنيفها من الممكن تحديد 55 مؤشرًا مقسمة إلى مستويات التنفيذ، حسب الدورات، حسب الأداء، من منظور الدائرية وحسب درجة العبور (سعيداني وآخرون، 2019). يجب أن تشمل نطاق القياس الدورات التكنولوجية مع أو بدون نهج التفكير في دورة الحياة وتأثيراتها على الأبعاد الثلاثة للاستدامة (موراكا وآخرون، 2019). يمكن تجميع المؤشرات بناءً على الأبعاد الثلاثة المكانية للاستدامة (ماكرو، ميكرو وميزو) وعلى أساس مبادئ 3R (التقليل، إعادة الاستخدام، إعادة التدوير) – (دي باسكال وآخرون، 2021). يهدف بعض المؤلفين إلى تنفيذ مؤشرات الدائرية لأهداف الاستدامة والاقتصاد الدائري. بهذه الطريقة، اعتمادًا على أهدافهم المؤسسية و
من خلال خطط الأعمال، يمكن للشركات تحديد وتنفيذ المؤشر الأكثر ملاءمة للدائرية (باروس وآخرون، 2023). المقارنة بين الدول مثيرة للاهتمام حيث يمكن أن تسمح للدول الفاضلة بأن تُكافأ من خلال التعاون الدولي في تبادل المعلومات، والحوافز لتدريب العمال، ومشاركة المعرفة والتكنولوجيا في إعادة التدوير (دي ألميدا وبورساتو، 2019). يمكن الحصول على دائرية أداء الدول الأوروبية من خلال تحليل القرار متعدد المعايير (MCDA) استنادًا إلى بيانات يوروستات (كولاسانتي وآخرون، 2022)، وهناك ارتباط بين الدائرية وكفاءة الطاقة والملاءة في دول الاتحاد الأوروبي (زيزوبولوس وآخرون، 2022).
يهدف هذا العمل إلى سد فجوة في الأدبيات حيث لا يوجد مؤشر CE يدمج المعلومات المختلفة من مجموعة من المؤشرات المتاحة على يوروستات. من خلال طريقة MCDA، يتم مقارنة أداء 27 دولة من دول الاتحاد الأوروبي في عامي 2019 و2020 مع الأخذ في الاعتبار 15 مؤشراً بالتساوي من الفئات الخمس التي حددتها يوروستات. سيتم إجراء التحليل في سيناريو أساسي يتم فيه تعيين وزن لهذه المؤشرات بناءً على مقارنة ثنائية من أكاديميين دوليين وفي سيناريو بديل يتم فيه تعيين نفس الوزن. يختتم العمل ببعض التأملات لفهم ما قد تكون عليه الحواجز أمام تطوير النماذج الدائرية.

طرق

تدعم MCDA اتخاذ القرارات المعقدة في الحالات التي يمكن فيها تقييم أهداف متعددة (متعارضة) بطرق متنوعة. إنها تتضمن بيانات حول مدى أداء كل بديل (معايير التقييم) وتقييمًا ذاتيًا لمدى قابلية تطبيق معايير معينة (عامل الوزن). يبدو أن هذه الطريقة تُستخدم على نطاق واسع في الأدبيات لتقييم أداء الدول من حيث الاستدامة (Bączkiewicz وKizielewicz، 2021؛ Colasante وآخرون، 2022). تتعلق الخطوات التي تميز هذه الطريقة أولاً بتعريف هدف البحث، الذي يتم تمثيله في هذه الدراسة من خلال تحديد مؤشر حول CE في أوروبا. لتحقيق هذا الهدف، كانت البدائل المدروسة هي 27 دولة أوروبية تم إضافة المتوسط الأوروبي إليها كمعيار مرجعي. تحتاج البدائل إلى معايير من أجل تقييمها. يتم حساب هذا المؤشر CE بدون أبعاد لكل دولة من دول الاتحاد الأوروبي ويتم توليده من خلال ضرب متجه صف – يمثل معيار التقييم – ومتجه عمود (CV) – يمثل عامل الوزن.
لذلك، في الخطوة الثانية، قمنا بتحديد معايير مناسبة لتمثيل أداء CE. كانت قاعدة البيانات المقدمة من يوروستات، وهي أداة قوية توفر مجموعة من البيانات بشكل رئيسي عن الدول الأوروبية، مفيدة في هذا الاتجاه (Korica وآخرون، 2022؛ Zisopoulos وآخرون، 2022). تم الحصول على البيانات كما يلي من موقع يوروستات: بيانات قاعدة البيانات شجرة تنقل البيانات سياسات الاتحاد الأوروبي مؤشرات CE. ضمن
الجدول 1. قائمة الفئات والمعايير.
فئة الاختصارات المعايير الاختصارات
الإنتاج والاستهلاك PC إنتاجية الموارد PC1
توليد النفايات الصلبة الحضرية للفرد PC2
توليد نفايات التعبئة للفرد PC3
إدارة النفايات WM معدل إعادة تدوير النفايات البلدية WM1
معدل إعادة تدوير نفايات التعبئة حسب نوع التعبئة WM2
معدل إعادة تدوير نفايات المعدات الكهربائية والإلكترونية التي تم جمعها بشكل منفصل WM3
المواد الخام الثانوية RM معدل استخدام المواد الدائرية RM1
تجارة المواد الخام القابلة لإعادة التدوير (الواردات) RM2
تجارة المواد الخام القابلة لإعادة التدوير (الصادرات) RM3
التنافسية والابتكار Cl الاستثمار الخاص والقيمة المضافة الإجمالية المتعلقة بقطاعات الاقتصاد الدائري Cl1
الأشخاص العاملون في قطاعات الاقتصاد الدائري Cl2
براءات الاختراع المتعلقة بإعادة التدوير والمواد الخام الثانوية Cl3
الاستدامة العالمية والمرونة SR البصمة الاستهلاكية SR1
انبعاثات غازات الدفيئة من الأنشطة الإنتاجية SR2
اعتماد استيراد المواد SR3
توجد خمسة فئات لمؤشرات CE: (i) PC؛ (ii) WM؛ (iii) RM الثانوية؛ (iv) التنافسية والابتكار (CI) و(v) الاستدامة العالمية والمرونة (SR).
ضمن هذه الفئات، كان هناك 22 مؤشراً، من بينها استبعدنا مسبقاً ‘الاكتفاء الذاتي للاتحاد الأوروبي للمواد الخام (ضمن فئة SR)’ لأنه لم يحتوي على بيانات لدول أوروبية.
يمكن إجراء مرحلة تقييم الدول باستخدام عملية التحليل الهرمي (AHP)، حيث تقترح طريقة ساتي عادةً وجود معايير (ساتي، 2008). بهذه الطريقة يجب استبعاد عدة معايير؛ لذلك، يُفضل في هذه الدراسة استخدام نهج الأولوية المحلية-global، الذي يسمح بتضمين المزيد من المعايير (D’Adamo وSassanelli، 2022). في هذا الصدد، يجب الإشارة إلى أنه من أجل السماح بمقارنة عادلة بين المعايير، يُقترح أن يكون عدد المعايير التي تملأ الفئات هو نفسه. أظهر تحليل الفئة أن هناك ثلاثة معايير لفئات RM وCI وSR. في المقابل، كان عدد أكبر من المعايير يملأ الفئتين الأخريين، لذا كان من الضروري تحديد معيار موضوعي يسمح بمقارنة عادلة بين الفئات، ولكن في نفس الوقت يسمح بمتانة النتائج التي تم الحصول عليها. في هذه المرحلة، أصبح من المهم تقييم الأفق الزمني للقيم المقدمة لهذه المؤشرات. كانت البيانات مفقودة لعام 2022، ولكن حتى لعام 2021 لم يكن هناك قاعدة بيانات مكتملة، لذا تم اعتبار آخر عامين متاحين: 2019 و2020. كانت هذه الاختيار أيضًا لخدمة مقارنة زمنية بين الدول. من خلال هذا النهج، تم اعتبار أن بيانات 2019 مفقودة للمؤشر ‘معدل إعادة تدوير جميع النفايات باستثناء النفايات المعدنية الكبرى’ ضمن فئة WM وبالتالي تم استبعاد هذا المؤشر واقتُرح ثلاثة معايير أيضًا لهذه الفئة. تم استخدام نفس النهج لفئة PC. بهذه الطريقة لم يتم اعتبار المؤشرات التالية: ‘توليد النفايات للفرد’، ‘توليد النفايات باستثناء النفايات المعدنية الكبرى لكل وحدة من الناتج المحلي الإجمالي (GDP)’ و’نفايات الطعام’. تبقى خمسة مؤشرات متاحة، وللاختيار، تم اعتبار الثلاثة
المعايير التي اعتبرناها باستبعاد مؤشرين كانا يميلان إلى أن يكونا متشابهين جدًا مع مؤشرات أخرى تم اعتبارها بالفعل: ‘توليد نفايات التعبئة البلاستيكية للفرد’ مقارنة بالمؤشر ‘توليد نفايات التعبئة للفرد’ الموجود في نفس فئة PC و’البصمة المادية’ مقارنة بالمؤشر ‘البصمة الاستهلاكية’ الموجود في فئة SR. يقترح الجدول 1 قائمة الـ 15 معيارًا مقسمة إلى 5 فئات. يمكن العثور على وصف كامل لهذه المؤشرات كما اقترحته يوروستات في الجدول التكميلي S1.
بمجرد تحديد المعايير، أصبح من الممكن الانتقال إلى الخطوة الثالثة حيث طُلب تعيين وزن لحساب متجه العمود. كان CV يتكون من 15 صفًا، يتوافق مع عدد المعايير. على سبيل المثال، هو عنصر من متجه العمود يتعلق بإنتاجية الموارد.
من خلال أخذ عوامل اتخاذ القرار المختلفة في الاعتبار والتركيز على الحساب من عدد كبير من المتغيرات إلى عدد صغير، فإنه يقدم أفضل حل ممكن (Pophali وآخرون، 2011). العيب الوحيد في المنهجية هو أنه لا يتم استخدام تحليل العناصر المنفصلة (على سبيل المثال) لاشتقاق أوزان موضوعية (Laso وآخرون، 2018). تطور AHP وزنًا لكل معيار بناءً على مقارنة ثنائية لجميع المعايير من قبل صانعي القرار. كلما كان المعيار أكثر أهمية، كان الوزن أعلى (Awasthi وآخرون، 2018).
ستحدد خبرة المستخدم في المجال المعني مدى فعالية AHP. لهذا الغرض، تم اختيار 10 أكاديميين من قاعدة بيانات Scopus الذين نشروا أعمالًا حول CE مع ما لا يقل عن 10 سنوات من الخبرة (D’Adamo وآخرون، 2022). ومع ذلك، فإن الأساليب المفيدة تشمل أيضًا تضمين فئات أخرى من الخبراء (Moktadir وآخرون، 2020) أو مزيج منهم (Tsui وآخرون، 2021)، لذا فإن هذا يمثل قيدًا على هذا العمل. بالنسبة لهذه الدراسة، تم إرسال دعوة عبر البريد الإلكتروني
إلى عدد معقول من المرشحين المحتملين (Ladu وآخرون، 2020)، وحدد البريد الإلكتروني أنه سيتم اختيار أول 10 فقط. احتوى البريد الإلكتروني على هدف الدراسة والمنهجية المستخدمة. تألفت اللجنة المختارة من النساء وجاءوا بشكل رئيسي من أوروبا (الجدول التكميلي S2). تم منح جميع الخبراء الفرصة للاجتماع لمدة تصل إلى ساعة لمناقشة المعايير، وتم إرسال ملف Excel يحتوي على أوصاف المعايير والمقارنات الثنائية لكل منهم. وفقًا لسااتي (2008)، خلال AHP، يمكن للخبراء تقديم قيمة تتراوح بين 1 (مفضل بالتساوي) و9 (مفضل بشدة) – الجدول التكميلي S3. قبل إرسال ملف Excel، طُلب من الخبراء التحقق من قيمة نسبة الاتساق (CR)، والتي يمكن أن تكون بحد أقصى 0.10 وتم حسابها تلقائيًا في الملف. تم حساب CR كنسبة من مؤشر الاتساق (المستخرج من في أي أعلى قيمة ذاتية (المنتج الداخلي للمتجه الصفّي الذي يحتوي على مجموع الأعمدة ومصفوفة المتجهات الذاتية) و عدد العوامل) إلى التباين العشوائي (الجدول التكميلي S4) – (ساتي، 2008).
في الخطوة الرابعة، كان من الضروري تحديد قيمة البدائل الفردية لكل معيار. كانت RV تتكون من 15 عمودًا، تتوافق مع عدد المعايير. على سبيل المثال هو عنصر من صف المتجه بالنسبة لإنتاجية الموارد.
لقد نظرت الأدبيات بالفعل في كيفية تأثير عدم اليقين في بيانات المدخلات على عدد من نماذج التقييم البيئي (Beekhuizen et al.، 2014). بشكل خاص، يمكن أن تكون النتائج غير موثوقة عندما يكون هناك نقص في التجانس في البيانات. لهذا السبب، كما تم الإشارة إليه سابقًا، تم استخدام بيانات من يوروستات. بالنظر إلى سنتين مرجعيتين (2019-2020)، تم تحديد 15 معيارًا و28 بديلًا، مما أدى إلى 840 قيمة. ومع ذلك، حيث كانت البيانات غائبة، تم اختيار البيانات المقابلة لأحدث سنة (Castillo-Giménez et al.، 2019). وبالتالي، كان عدد البيانات المستخدمة فعليًا هو مما تم طلبه. في الواقع، يجب الإشارة إلى أنه بالنسبة للمعيار CI3، كانت البيانات من عام 2020 بالكامل مفقودة.
تستخدم المعايير وحدات قياس مختلفة (الجدول التكميلي S5)، ومن أجل جعل البيانات قابلة للمقارنة، يتم تطبيعها. على وجه الخصوص، النهج المرتبط بأضعف وأفضل أداء، على التوالي، بين البدائل المختلفة يُستخدم (كولاسانت وآخرون، 2022). القيم الأخرى تُحسب من خلال نموذج الاستيفاء.

النتائج

يتم الحصول على مؤشر CE من حاصل ضرب المتجه الصفّي والمتجه العمودي. من أجل الحصول على المتجه الصفّي، من الضروري تجميع الإجابات المختلفة المقدمة من الخبراء (القسم ‘تجميع الأوزان’). الخطوة التالية هي تجميع التقييمات المختلفة التي تم جمعها من يوروستات (القسم ‘تجميع القيم’). بهذه الطريقة، من الممكن حساب مؤشر CE في كل من سيناريو الأساس.
(القسم ‘مؤشر الاقتصاد الدائري – سيناريو الأساس’) والسيناريو البديل (القسم ‘مؤشر الاقتصاد الدائري – السيناريو البديل’).

تجميع الأوزان

يتكون المتجه الصفّي من المدخلات المقدمة من جميع الخبراء (الجداول التكميلية S6-S15). بمجرد التحقق من أن جميع المقارنات الثنائية كانت قوية وبالتالي كانت قيمة CR لا تتجاوز 0.10. كانت البيانات الأولى التي تم جمعها هي تلك الخاصة بأولوية الفئات – الجدول 2. من الجدير بالذكر أنه لا يوجد ارتباط بين عدد الخبراء والعدد المبلغ عنه في الجداول المختلفة.
تظهر النتائج أن فئتين لهما وزن ثلثي المجموع، لذا يتضح كيف أشار الخبراء إلى أولوية واضحة. على وجه الخصوص، تهيمن فئة CI بقيمة 0.34 تليها فئة SR بقيمة 0.33، وكلاهما تم اختيارهما كالأكثر أهمية من قبل خمسة خبراء. ومن الجدير بالذكر أن الخبراء عند اختيار الفئة نظروا أيضًا إلى المؤشرات التي تتضمنها. وبالمثل، أعطى ثمانية خبراء أقل وزن لفئة PC بقيمة 0.08 بينما أعطاها اثنان من الخبراء لفئة RM بقيمة 0.11. تنتمي قيمة أعلى قليلاً إلى WM بقيمة 0.14.
نموذج الاقتصاد الدائري هو نموذج يمكن أن يدعم الشركات لتحقيق أهداف الابتكار المستدام، ولكنه في نفس الوقت يقدم حلولاً مستدامة ومرنة أيضاً. وبالتالي، هو نظام معقد قادر على التفاعل مع التغيرات الخارجية، وفي عالم يتسم بالعولمة حيث لا تتغير تفضيلات المستهلكين فحسب، بل يدخل أيضاً لاعبين جدد إلى السوق. قد تكون الحلول الدائرية في البداية مؤهلاً للطلب، لكنها مقدر لها أن تكون الفائزة بالطلب. في الواقع، يتطلب توازن النظم البيئية حلولاً مناسبة للاستخدام الملائم للموارد. في هذا السياق، لا يمكن تحقيق هدف معقد من خلال فئات قليلة فقط، بل من خلال السعي للحصول على مساعدة جميع الفئات واستغلال أي توافقات موجودة بين مؤشرات مختلفة.
بمجرد تجميع أوزان الفئات، قاموا بتكرار نفس العملية مع المؤشرات المختلفة داخل كل فئة من أجل حساب الأولوية المحلية (الجدول 3).
فيما يتعلق بفئة الحاسوب، يميل الخبراء إلى إعطاء أهمية متساوية تقريبًا لكل من PC2 بقيمة 0.40 و PC1 بقيمة 0.39. وهو اختيار انقسم فيه الخبراء بالتساوي. يتضح أنه يتم إعطاء أهمية مضاعفة للنفايات الصلبة البلدية (MSW) مقارنة بنفايات التعبئة والتغليف. يُعتبر معيار إنتاجية الموارد ذا صلة ليس فقط، بل أيضًا هجينًا بالنسبة لأهداف الاقتصاد الدائري، حيث تشير العبارة في البسط إلى الناتج المحلي الإجمالي، بينما تقيس العبارة في المقام كمية المواد المستخدمة من قبل الاقتصاد.
فيما يتعلق بإدارة النفايات، يظهر مرة أخرى أن هناك معيارين يميلان إلى أن يتم اختيارهما في الغالب. على وجه التحديد، يختار ستة خبراء WM1 كالأكثر صلة بمتوسط وزن قدره 0.42، بينما يمنح أربعة أولوياتهم لـ WM3، الذي يحصل على متوسط وزن قدره 0.38. هنا، يظهر نتيجة تتماشى مع ما تم رؤيته سابقًا، مما يدل على تركيز أكبر على النفايات الصلبة البلدية مقارنة بنفايات التعبئة والتغليف. كما أن هذا يتماشى مع الأدبيات هنا أيضًا، حيث يتم إعطاء وزن مشابه للنفايات الإلكترونية مقارنة بالنفايات الصلبة البلدية. تعتبر نسبة إعادة التدوير عنصرًا مهمًا لتطوير نماذج الاقتصاد الدائري، ولكن مع ذلك يتم التأكيد على ضرورة إعطاء المزيد من الاهتمام للجودة.
الجدول 2. تجميع الأوزان – أولوية الفئة.
الفئات E1 E2 E3 E4 E5 E6 E7 E8 E9 E10 متوسط
حاسوب شخصي 0.09 0.11 0.08 0.08 0.07 0.05 0.11 0.06 0.07 0.11 0.08
WM 0.12 0.14 0.15 0.15 0.09 0.15 0.19 0.11 0.14 0.15 0.14
RM 0.07 0.19 0.11 0.11 0.12 0.12 0.14 0.09 0.10 0.08 0.11
كلور 0.41 0.32 0.26 0.28 0.31 0.42 0.24 0.44 0.40 0.28 0.34
ريال سعودي 0.31 0.24 0.40 0.37 0.41 0.27 0.32 0.29 0.30 0.37 0.33
الوزن الأقصى الوزن الأدنى. القيم المتوسطة موضحة بخط عريض.
الجدول 3. تجميع الأوزان – الأولوية المحلية.
معايير E1 E2 E3 E4 E5 E6 E7 E8 E9 E10 متوسط
الإنتاج والاستهلاك
بي سي 1 0.49 0.49 0.31 0.31 0.49 0.31 0.49 0.49 0.31 0.20 0.39
بي سي 2 0.31 0.31 0.49 0.49 0.31 0.49 0.31 0.31 0.49 0.49 0.40
بي سي 3 0.20 0.20 0.20 0.20 0.20 0.20 0.20 0.20 0.20 0.31 0.21
إدارة النفايات
WM1 0.49 0.49 0.31 0.31 0.49 0.49 0.31 0.49 0.31 0.49 0.42
WM2 0.20 0.20 0.20 0.20 0.20 0.20 0.20 0.20 0.20 0.20 0.20
WM3 0.31 0.31 0.49 0.49 0.31 0.31 0.49 0.31 0.49 0.31 0.38
المواد الخام الثانوية
RM1 0.49 0.49 0.49 0.31 0.49 0.49 0.49 0.31 0.49 0.20 0.43
RM2 0.31 0.31 0.20 0.20 0.20 0.31 0.31 0.49 0.31 0.31 0.30
RM3 0.20 0.20 0.31 0.49 0.31 0.20 0.20 0.20 0.20 0.49 0.28
التنافسية والابتكار
كل1 0.49 0.49 0.49 0.31 0.49 0.49 0.49 0.31 0.49 0.49 0.45
Cl2 0.31 0.31 0.20 0.49 0.31 0.31 0.31 0.49 0.31 0.31 0.34
كلور ثلاثي 0.20 0.20 0.31 0.20 0.20 0.20 0.20 0.20 0.20 0.20 0.21
الاستدامة العالمية والمرونة
SR1 0.20 0.49 0.31 0.31 0.49 0.49 0.49 0.31 0.31 0.20 0.36
SR2 0.31 0.31 0.49 0.49 0.20 0.31 0.31 0.49 0.49 0.31 0.37
SR3 0.49 0.20 0.20 0.20 0.31 0.20 0.20 0.20 0.20 0.49 0.27
الوزن الأقصى الوزن الأدنى. القيم المتوسطة موضحة بخط عريض.
جمع إعادة التدوير، مما يمنح فوائد للمستهلكين الذين يقومون بسلوكيات أكثر فضيلة.
على عكس الفئات السابقة، يظهر معيار واحد في RM2 يتفوق على الفئتين الأخريين. في الواقع، يختار سبعة خبراء RM1 بمتوسط وزن قدره 0.425. وبالمثل لما حدث مع PC1، يمكن أن تكون هذه الأحكام مصحوبة أيضًا بأحكام متعارضة. في الواقع، بالنسبة لخبير واحد، يعتبر وزنه الأقل أهمية. يؤثر اختلاف معرفة الخبراء بوضوح على مثل هذه الأحكام. كما تبين أن هذا المعيار يعتبر مرتبطًا مباشرةً بأحد المخرجات الرئيسية للاقتصاد الدائري، وهو قياس المواد المعاد تدويرها التي يتم إعادتها بعد ذلك إلى دورة الإنتاج. لذلك، فإن التركيز على هذه النشاط هو ما يظهر وليس التشابه بين المعايير الأخرى (تجارة المواد القابلة لإعادة التدوير) الذي هو مجرد ظاهر. في الواقع، RM2 يشير إلى الواردات (0.295)، بينما RM3 يشير إلى الصادرات (0.28).
تظهر سيناريوهات من حيث نتائج مختلفة عن النتائج السابقة لفئة CI. في الواقع، كل معيار لديه
فرق كبير عن معيار آخر. على وجه الخصوص، أولى الخبراء اهتمامًا للميزة التي تشير إلى أن المعايير الثلاثة مرتبطة ارتباطًا وثيقًا بأنماط الاقتصاد الدائري. تم إعطاء اهتمام خاص للمعيار CI1، بمتوسط وزن قدره 0.45 اختاره ثمانية خبراء كالأكثر صلة. يشير هذا المعيار إلى ثلاثة قطاعات: (i) إعادة التدوير، (ii) الإصلاح وإعادة الاستخدام و(iii) الإيجار والتأجير. من ناحية أخرى، أعطى خبيران أهمية أكبر للمعيار CI2 (0.34) الذي يشير إلى عدد الأشخاص المتأثرين المرتبطين مرة أخرى بالقطاعات المذكورة أعلاه. أخيرًا، يُشير الخبراء إلى أن المعيار الآخر CI3، بمتوسط وزن قدره 0.21، يُعتبر أيضًا مهمًا، ولكن في مقارنة ثنائية، تظهر الأرقام المتعلقة ببراءات اختراع الحلول الدائرية في وضع غير موات.
أخيرًا، الفئة الأخيرة التي تم فحصها، المتعلقة بالمسؤولية الاجتماعية العالمية، تظهر وضعًا مشابهًا لغيرها حيث يتم اعتبار معيارين على أنهما ذوي أهمية متساوية تقريبًا. ومع ذلك، هذه هي الفئة الوحيدة التي اختلف فيها الخبراء بشكل كبير في نتائجهم. المعيار SR1 هو الأكثر صلة من قبل أربعة خبراء بنسبة 0.36 كـ
الجدول 4. الأولوية العالمية.
معايير أولوية محلية تصنيف أولوية عالمية تصنيف
الإنتاج والاستهلاك (الأولوية: 0.0847)
بي سي 1 0.390 2 0.0330 12
بي سي 2 0.401 1 0.0340 10
بي سي 3 0.209 ٣ 0.0177 15
إدارة النفايات (الأولوية: 0.1378)
WM1 0.419 1 0.0577 ٧
WM2 0.198 ٣ 0.0272 14
WM3 0.383 2 0.0528 ٨
المواد الخام الثانوية (الأولوية: 0.1127)
RM1 0.425 1 0.0479 9
RM2 0.295 2 0.0333 11
RM3 0.279 ٣ 0.0314 ١٣
التنافسية والابتكار (الأولوية: 0.3363)
كل1 0.455 1 0.1530 1
Cl2 0.336 2 0.1131 ٤
كلوريد ثلاثي 0.209 ٣ 0.0703 ٦
الاستدامة العالمية والمرونة (الأولوية: 0.3286)
SR1 0.360 2 0.1184 ٣
SR2 0.372 1 0.1222 ٢
SR3 0.268 ٣ 0.0879 ٥
الوزن المتوسط ويأتي بعده قليلاً SR2 مع 0.37 الذي يتم اختياره دائماً كالأكثر صلة من قبل أربعة خبراء. أخيراً، اختار الخبيران الأخيران SR3 مع 0.27. كما يتضح أن الوزن الأدنى قد تم تخصيصه لجميع المعايير الثلاثة اعتماداً على الخبير. الرقم البيئي النموذجي للانبعاثات يتضح أنه أكثر صلة قليلاً من بصمة الاستهلاك، التي تقدر الأثر البيئي لخمس مجالات من الاستهلاك: الغذاء، والتنقل، والإسكان، والأجهزة، والسلع المنزلية. وبالتالي، فإن كلاهما له دلالة بيئية قوية. تعتبر هذه المؤشرات مفيدة في تقييم الأثر البيئي، الذي تؤثر عليه أنشطة الاقتصاد الدائري بوضوح فقط جزء، وبالتالي تعتبر مؤشرات تُفسر على أنها أكثر عمومية. وبالمثل، يُنظر إلى الاعتماد على استيراد المواد، الذي يقيس بدقة رقم الاستيراد، مما يؤدي، مع ذلك، إلى رقم مختلف عن الرقم المقترح سابقاً.
تظهر مكونات متجه الصف في الجدول 4 حيث يتم حساب الأولوية العالمية لكل معيار كمنتج للأولوية المحلية للمعيار المحدد وأولويته الفئوية. على سبيل المثال، يحتوي المعيار PC1 على أولوية محلية تبلغ 0.390 ومع اعتبار أولوية فئوية تبلغ 0.0847 ينتج عنها أولوية عالمية تبلغ 0.0330. وبالمثل، يحتوي المعيار S3 على أولوية محلية تبلغ 0.268 مع أولوية فئوية تبلغ 0.3286 والتي يتم اشتقاق أولوية عالمية منها تبلغ 0.0879.
تظهر النتائج بوضوح كيف أن حدوث الفئات يؤثر بشكل كبير على ترتيب التصنيف العالمي. ففئات CI و SR لها وزن قدره 0.6649 وتحتل المعايير في هاتين الفئتين المراكز الستة الأولى. يتفوق المعيار CI1 بوزن 0.1530 يليه SR2 و SR3 بوزن 0.1222 و 0.1184 على التوالي. وهذا يشير إلى أنه في هذا النهج المحلي-global، فإن الفرق الموجود بين المعايير الفردية له أهمية أيضًا. وزن CI أكبر من SR، لكن الفرق بين المعيارين الأولين أقل في فئة SR.
تشهد المراكز الثلاثة الأخيرة في الترتيب وجود المعيار الأخير من حيث الأولوية المحلية، والذي يتبين أنه يتطابق مع الفئات الثلاث المتبقية، وهي RM3 و WM2 و PC3.

تجميع القيم

يتم حساب المتجه العمودي وفقًا للبيانات من يوروستات. كما هو موضح في القسم ‘الطرق’، يتم تطبيع جميع القيم ضمن النطاق ، ويقدم كل معيار قيمة محددة للبدائل المدروسة (27 دولة من دول الاتحاد الأوروبي). يتم تكرار التحليل لسنة 2019 (الجدول التكميلي S16) ولسنة 2020 (الجدول التكميلي S17).
تحليل النتائج يظهر أن بلجيكا تحقق أداءً أفضل من الجميع في أربعة معايير (WM2 و RM2 و RM3 و CI1)، وقد تم التحقق من هذه النتيجة في كلا العامين المدروسين. يتضح أن هذه الظاهرة منتشرة إلى حد كبير في عدة معايير أخرى، مثل هولندا في المعيار RM1، والسويد ومالطا في المعيار SR2، ورومانيا في المعيار PC2، وكرواتيا في المعيار PC3، وألمانيا في المعيار WM1، وكرواتيا في المعيار CI2، وفنلندا في المعيار CI3، واليونان في المعيار SR1 ورومانيا في المعيار SR3. تحدث تغييرات في القيادة في المعيار WM3 حيث تحل كرواتيا محل التشيك، وفي المعيار PC1 حيث تحل هولندا محل لوكسمبورغ. كما يجب تسليط الضوء على الأداء السلبي الذي سجلته بعض الدول التي تحتل المرتبة الأخيرة في ستة معايير (مالطا) وأربعة معايير (لوكسمبورغ). كما تظهر بلغاريا واليونان ورومانيا كالأضعف في معيارين (حيث تحتل رومانيا في عام 2020 المرتبة الأخيرة في ثلاثة معايير). النتائج موضوعية كما ذُكر في قسم ‘الطرق’ في هي بيانات مستخلصة من يوروستات. لفهم قيمة التطبيع في نطاق، نشير إلى أن أداء الدولة يتم تقييمه من خلال النظر ليس فقط في أدائها الخاص ولكن أيضًا في أداء أفضل دولة. على سبيل المثال، يتعلق أفضل أداء مع أكبر انخفاض بالمعيار CI2 حيث انخفضت القيمة القصوى من إلى إجمالي التوظيف. بالمقابل، فإن الانخفاض الأكثر أهمية، ولكن هذه المرة بشكل إيجابي، يتعلق بالمعيار SR2 حيث انخفض الحد الأدنى من 4261 إلى نصيب الفرد. وينطبق الأمر نفسه على القيم ذات الأداء الأقل، وهذا يؤثر على التغيرات في القيم الفردية المعيارية. لفهم عدد الدول التي تميل نحو قيمة عالية، من المفيد حساب مؤشر التركيز (الشكل التكميلي S1).
المعايير التي تمتلك بشكل عام عدة دول ذات قيمة موحدة عالية في عام 2020 هي SR2 (0.67) و WM3 (0.66)، تليها SR3 و SR1 بقيم 0.64 و 0.61 على التوالي. في المقابل، فإن المعيار RM2 (0.18) هو حيث يوجد تركيز أكبر من الدول نحو الأداء الضعيف. يلي ذلك المعيار CI3 بقيمة 0.22.

مؤشر CE: سيناريو الأساس

تهدف MCDA إلى مقارنة الدول الأوروبية المختلفة من حيث الاقتصاد الدائري، وقد قدمت هذه الدراسة مؤشرًا جديدًا للاقتصاد الدائري من أجل مقارنة ومراقبة أداء هذه الدول.
الشكل 1. مؤشر CE في الفترة 2019-2020 (سيناريو الأساس).
مع مرور الوقت. في السيناريو الأساسي، يتم الحصول على الأوزان من عملية تحليل الهرمية (AHP)، بينما يتم الحصول على القيم من عملية التوحيد الخاصة بـ Eurostat. يسمح حاصل ضرب متجه العمود (الجداول التكميلية S16-S17) ومتجه الصف (الجدول 4) بحساب هذا المؤشر لكل بديل – الشكل 1.
تتصدر بلجيكا الترتيب، حيث سجلت قيمة قدرها 0.599 في عام 2020، وتأتي في المقدمة بفارق بسيط عن إيطاليا (0.595) وفرنسا (0.589) ولاتفيا (0.581). في عام 2019، كانت بلجيكا أيضًا تحتفظ بالرقم القياسي، وإن كان بقيمة أعلى (0.635). لفهم هذه الفروقات، يتم تحليلها على أساس معيار تلو الآخر (الجدول التكميلي S18). يتضح أنه من ناحية، هناك انخفاض في القيمة المرتبطة ليس فقط بالمعايير PC2 و SR1، ولكن أيضًا WM1، وهو ما لا يتم تعويضه من خلال الزيادة في المعيار CI2. على الرغم من أن لاتفيا تحتل مرتبة عالية في الترتيب، إلا أنها تفقد مركزين مقارنةً برقم 2019. تنخفض المساهمة المرتبطة بالمعيار CI1 ويتم تعويضها من خلال الزيادة في المعيار CI2. ومع ذلك، يتم التحقق أيضًا من تخفيضات كبيرة في SR1. بدلاً من ذلك، تكتسب إيطاليا مركزًا واحدًا في الترتيب بفضل مساهمة CI2، بينما تكتسب فرنسا مركزًا بفضل مساهمة CI1. يُظهر المقارنة بين السنتين عدة تغييرات، ولا تتغير مواقع أربع دول فقط. من حيث الترتيب، تكتسب إسبانيا وإستونيا خمس مراكز، كما تظهر كرواتيا وسلوفاكيا وأيرلندا زيادة بمقدار ثلاث مراكز. الوضع معكوس تمامًا بالنسبة لهولندا وبولندا والبرتغال؛ ومع ذلك، فإن الرقم القياسي السلبي يعود إلى سلوفينيا، التي تفقد عشرة مراكز. في الواقع، إذا قمنا بتحليل القيمة العددية، فإن سلوفينيا هي التي شهدت أكبر انخفاض (-0.0634) تليها بلجيكا (-0.0367) والبرتغال (-0.0269). الدولة التي، من ناحية أخرى، لديها
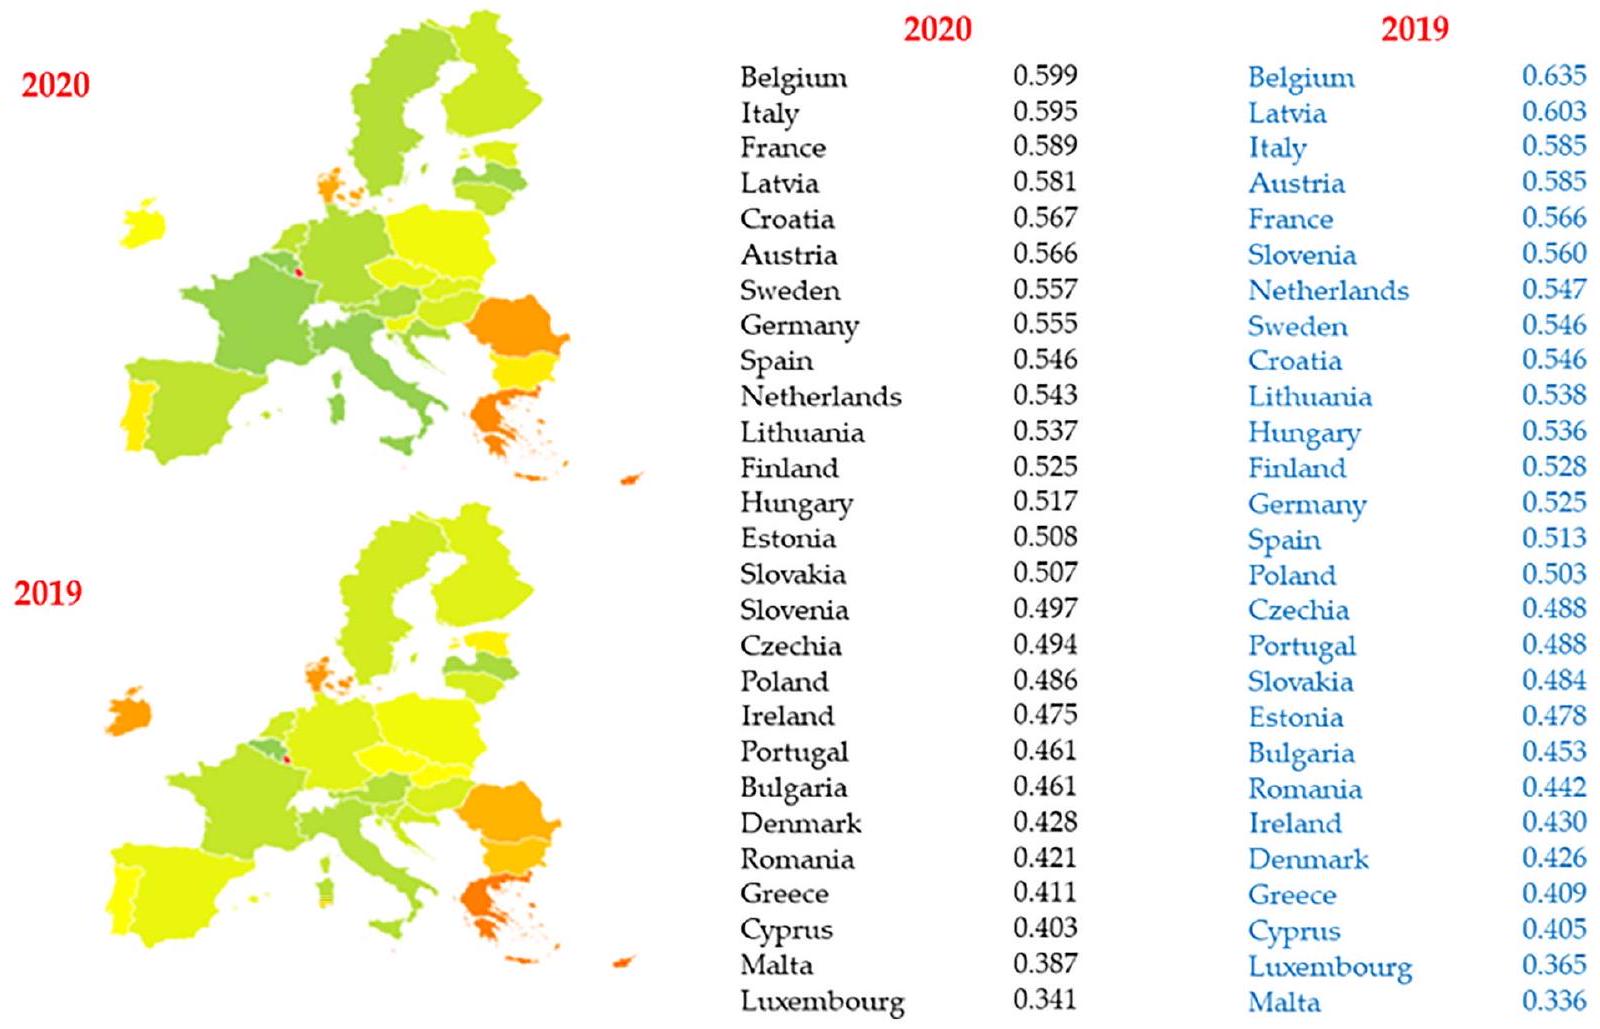
أكبر زيادة ملحوظة هي مالطا (+0.0509) تليها أيرلندا (+0.0445) وإسبانيا (+0.0326). الأداء الضعيف في عدة مؤشرات أدى إلى احتلال قبرص ومالطا ولوكسمبورغ المراتب الأخيرة في الترتيب الأوروبي.
من الممكن إجراء تحليل تفكيكي على مستوى الفئة لتقييم مساهمتها في النتائج العامة الشكل التكميلي S2. يتبين أن فئة SR تسود في 22 دولة. في المقابل، تسود فئة CI في بلجيكا والدنمارك ولوكسمبورغ ومالطا وهولندا. يؤثر الوزن المشترك للفئتين على القيمة النهائية للوكسمبورغ و مالطا.

مؤشر CE: سيناريو بديل

من أجل إعطاء قوة للنتائج التي تم الحصول عليها، يتم اعتبار سيناريو بديل. القيم لها طبيعة موضوعية وبالتالي لا تتغير، بينما تم تعيين الأوزان من خلال طريقة التحليل الهرمي (AHP). يمكن اعتبار سيناريو بديل حيث تكون جميع المعايير لها أهمية متساوية وبالتالي لن يتكون المتجه الصف من ما هو موضح في الجدول 3 (الشكل 2). وبالتالي، إذا كان في السيناريو الأساسي وزن معيار PC3 هو 0.0177 ووزن معيار CI1 هو 0.1530، فإن كلاهما في هذا البديل سيكون له وزن قدره 0.0667.
تظهر النتائج أنه بين عامي 2019 و2020، تبقى مواقع الترتيب متطابقة في أربع حالات فقط، بما في ذلك تأكيد بلجيكا لقيادتها تليها هولندا ومالطا في نهاية الترتيب. عند تقييم السيناريو البديل، من المفيد مقارنة الأداء وموقع الترتيب مع السيناريو الأساسي – الجدول 5.
الشكل 2. مؤشر CE في الفترة 2019-2020 (سيناريو بديل).
الجدول 5. ملخص مؤشر الاقتصاد الدائري.
خط الأساس Rkg بلد قيمة الأساس قيمة بديلة قيمة الأساس البديلة الخط الأساسي البديل Rkg
1 بلجيكا 0.599 0.607 0.008 0
2 إيطاليا 0.595 0.549 -0.046 -1
٣ فرنسا 0.589 0.506 -0.083 -3
٤ لاتفيا 0.581 0.505 -0.075
٥ كرواتيا 0.567 0.506 -0.061 -2
٦ النمسا 0.566 0.471 -0.095 -10
٧ السويد 0.557 0.513 -0.044 2
٨ ألمانيا 0.555 0.502 -0.052 -2
9 إسبانيا 0.546 0.499 -0.047 -3
10 هولندا 0.543 0.586 0.044 ٨
11 ليتوانيا 0.537 0.505 -0.032 2
12 فنلندا 0.525 0.502 -0.023 1
١٣ المجر 0.517 0.428 -0.088 -7
14 إستونيا 0.508 0.489 -0.019 0
15 سلوفاكيا 0.507 0.493 -0.014 ٢
16 سلوفينيا 0.497 0.517 0.021 12
17 التشيك 0.494 0.477 -0.017 2
١٨ بولندا 0.486 0.436 -0.050 -1
19 أيرلندا 0.475 0.450 -0.025 2
20 البرتغال 0.461 0.365 -0.096 -6
21 بلغاريا 0.461 0.445 -0.016 ٣
٢٢ الدنمارك 0.428 0.425 -0.003 1
23 رومانيا 0.421 0.370 -0.051 -1
٢٤ اليونان 0.411 0.410 -0.001 2
٢٥ قبرص 0.403 0.393 -0.011 2
٢٦ مالطا 0.387 0.294 -0.093 -1
27 لوكسمبورغ 0.341 0.369 0.028 2
بجانب بلجيكا، التي تزيد قيمتها بمقدار 0.008، فإن الدولة الوحيدة الأخرى التي لا تتغير موقعها هي إستونيا التي تحتل المركز الرابع عشر. تخسر إيطاليا مركزًا واحدًا لكنها تبقى على المنصة، بينما هولندا تحقق مكاسب جيدة بوضعها في المركز الثاني. من ناحية أخرى، تسقط فرنسا عن المنصة. يُظهر المقارنة بين السيناريو البديل والسيناريو الأساسي أن قيمة النمسا والبرتغال ومالطا تنخفض بأكثر من 0.09، بينما هولندا هي التي تحقق أكبر نمو بقيمة تزيد عن 0.04. من حيث الترتيب، تبرز سلوفينيا، حيث ترتفع إلى حافة المنصة بزيادة 12 مركزًا، بينما النمسا هي التي تسجل أكبر انخفاض بخسارة 10 مراكز. يعطي السيناريو البديل وزنًا أكبر للفئات الثلاث (PC و WM و RM) التي تحقق أقل أداء في AHP. وبالتالي، فإن أولئك الذين يتفوقون في هذه المعايير يحسنون ترتيبهم، وكذلك يتم تقليل الأداء الأفضل المرتبط بأولئك الذين يؤدون بشكل جيد في فئات CI و SR.
مرة أخرى، لفهم هذه الرقم، من المفيد اقتراح تحليل التفكيك – الشكل التكميلي S3.
تظل فئة SR الأكثر صلة، ولكن فقط في 15 من أصل 27 دولة تم مسحها. السبب في ذلك هو أكبر مؤشر تركيز يتعلق بالمعايير الثلاثة ذات الصلة – الشكل 1. لنفس السبب، هي الأكبر في فئة WM لتسع دول (التشيك، الدنمارك، ألمانيا، إيطاليا، لوكسمبورغ، النمسا، سلوفينيا، سلوفاكيا وفنلندا). أخيرًا، تهيمن فئة RM على أول دولتين في الترتيب البديل (بلجيكا وهولندا) وفئة CI في مالطا.

نقاش

النموذج الدائري هو نموذج يهدف إلى إعطاء قيمة للنفايات التي يمكن إعادتها إلى دورة الإنتاج. وقد أبرزت الأدبيات مدى أهمية قضية نهاية النفايات وكيف أن تعريفها ليس دائمًا سهلاً (أنتونيou وزورباس، 2019؛ د’أدامو وآخرون، 2022؛ باباميخائيل وزورباس، 2022). هناك ثلاثة جوانب تقوض إدارة الموارد بشكل فعال. الأول يتعلق بالنفايات غير القانونية، التي قد تحتوي على مواد سامة وخطيرة تتطلب تكاليف كبيرة لإدارتها بشكل صحيح، مما يدفع بعض الشركات إلى اختيار مسارات إدارة غير مناسبة. الثاني هو نقص الخبرة في هذا الموضوع حيث لا يُفهم أنه يجب علينا التفكير في نهاية حياة المنتج ليس في نهاية عمره المفيد ولكن في البداية، كما نحتاج أيضًا إلى محترفين على دراية بالموارد التكنولوجية التي يمكن أن تتعامل مع هذه النفايات وتعزيز برامج البحث والتطوير لإيجاد حلول. الثالث هو مشاركة القيمة التي يجب توزيعها بين الفئات المختلفة من أصحاب المصلحة لفهم أننا بحاجة إلى مكافأة أفعال المواطنين من خلال التفكير ليس فقط في مفهوم الجمع المنفصل ولكن في مفهوم الجمع المنفصل الجيد القادر على تقليل الشوائب وبالتالي إدارة النفايات بشكل صحيح.
في هذا الإطار، لا يمكن التفكير في أن جميع النفايات يمكن إعادة استخدامها وإعادة تدويرها، وأحيانًا يكون الاسترداد إجراءً يجب اتخاذه إذا كان يعني تجنب إرسال النفايات إلى مكب النفايات وفقًا لهرم النفايات (لومباردي وآخرون، 2021؛ كويكر وآخرون، 2020؛ شوشتياريان وآخرون، 2022). في سياق حيث أن المواد الخام الأكثر…
إن الطلب على التنمية المستدامة لا يتركز في أوروبا، يمكن أن يكون نموذج الاقتصاد الدائري استراتيجية لتقليل الاعتماد على الخارج. ومع ذلك، فإن هذا ممكن عندما يتم الحصول على المواد الخام التي لا تؤثر درجة نقائها على وظيفة المنتجات، وتصبح هذه المواد الخام بدائل لتلك التي تأتي من استخراج المواد الخام. إن خطر ارتداد الاقتصاد الدائري هو نهج غير مستدام حيث يتم تنفيذ النماذج الدائرية، ولكن لا يتبع ذلك أي تغيير في أنماط الاستهلاك (Caferra et al.، 2023؛ Kirchherr، 2022).
يمكن استكشاف العلاقة بين المعايير المختلفة المقترحة في هذا العمل من خلال مصفوفة الارتباط التي تظهر فيها قيمة متوسطة للعلاقات التالية (الجدول التكميلي S19): PC1-PC3، WM1-WM2، RM2-RM3 وPC1-RM1. يتراوح معامل الارتباط بين 0.63 و0.67 ويصبح 0.75 للمتغيرات PC1-SR3. هذا يحدد بوضوح علاقة بين الناتج المحلي الإجمالي والاعتماد على استيراد المواد. يمكن أن يساعد استخدام المواد المستعادة في تقليل اعتماد أوروبا على المواد المستوردة، مما يحسن من أمان الإمدادات ويقلل من الأثر البيئي المرتبط باستخراج ونقل هذه الموارد. قد يؤدي ذلك أيضًا إلى تحقيق استقرار اقتصادي أكبر وتقليل الضعف أمام تقلبات أسعار المواد الخام العالمية (D’Adamo et al., 2023b; Romano et al., 2022). جانب آخر مثير للاهتمام يجب فحصه هو السلوك الذي يمكن أن يتبناه كل من المواطنين والشركات لتعزيز الانتقال بنجاح إلى النموذج الدائري. من ناحية، يمكن أن يساهم المواطنون بشكل كبير في التغيير من خلال دعم إعادة التدوير وشراء المنتجات الدائرية. من ناحية أخرى، قد تضطر بعض الشركات إلى مراجعة نموذج أعمالها بعمق للتكيف بنجاح مع هذه الرؤية الجديدة. علاوة على ذلك، فإن الأخيرة تعزز إنشاء وظائف جديدة.
لهذا الغرض، فإن نهج بطاقة الأداء المتوازن مفيد لتقييم مساهمة العوامل المختلفة (Ioppolo et al., 2012) من أجل تطوير خطة استراتيجية نحو التنمية المستدامة (Zorpas et al., 2018) في سياق حيث تعتبر إعادة التصنيع وإعادة الشحن القريب مفتاحًا لتحديد حل مرن (Fernández-Miguel et al., 2022). الهدف الرئيسي للدراسة هو إجراء تقييم مجمع لدرجة تقدم الاقتصاد الدائري في الدول الأوروبية. استخدمنا MCDA للتعبير عن هذا المستوى باستخدام مؤشرات يوروستات المتاحة حاليًا لمنطقة أوروبا. لكن الدراسة الحالية ليست مثالية ويمكن تحسينها. العدد القليل من المؤشرات، خاصة في مجالات CI، هو قيد دراسي. غياب المؤشرات للمكون الاجتماعي للاقتصاد الدائري هو عيب آخر. قد تتمكن التطورات المستقبلية لقاعدة بيانات يوروستات أو استخدام قواعد بيانات أخرى حالية، مثل تلك التي تحتفظ بها البنك الدولي أو منظمة التعاون والتنمية الاقتصادية، من إزالة هذه القيود. ومع ذلك، فإن بعض البيانات المتعلقة بمؤشرات الاقتصاد الدائري لبعض دول الاتحاد الأوروبي غائبة عن هذه القواعد. علاوة على ذلك، عندما تكون المؤشرات قابلة للرصد في جميع قواعد البيانات، فإن القيم غالبًا ما تكون غير متوافقة للأسف. لهذا السبب، تم اتخاذ قرار باستخدام مصدر واحد (يوروستات) مع الأخذ في الاعتبار عددًا أقل ولكن مهمًا من المؤشرات. حيث وافقت المفوضية الأوروبية مؤخرًا على العديد من السياسات والممارسات الطموحة المتعلقة بتنفيذ الاقتصاد الدائري وقياس تقدمه، نعتقد أنه في المستقبل ستكون قاعدة البيانات حول مؤشرات الاقتصاد الدائري أكبر بكثير وأكثر شمولاً.

الاستنتاجات

يمكن أن يدعم الاقتصاد الدائري التنمية المستدامة، وهذه هي الاتجاه الذي تشير إليه أحكام الخبراء في إعداد AHP. تحدد النتائج المستخلصة من النهج المحلي-العالمي تصنيفًا ذا صلة بين 15 مؤشرًا مقترحًا من يوروستات. يؤثر دور أولوية الفئة بشكل كبير على القيمة النهائية حيث تمثل الفئتان ‘CI’ و’global SR’ ثلثي الوزن، وتشغل المعايير المعنية المراكز الستة الأولى في التصنيف العالمي. المعيار ‘الاستثمار الخاص والقيمة المضافة الإجمالية المتعلقة بقطاعات الاقتصاد الدائري’ هو الذي يسود ويبرز أن الاستدامة ليست تراجعًا سعيدًا حيث يجب أن تهدف إلى تغيير في عادات PC. في سياق ندرة الموارد، يجب على المرء تحسين استخدامه واستعادة هذه المواد الخام حيث تم استخدامها بالفعل. هناك حاجة للاستثمار في هذه التقنيات في هذا الاتجاه. ومع ذلك، فإن نموذج الاقتصاد الدائري لا يتعلق فقط بحماية البيئة، بل يهدف إلى خلق فرص اقتصادية، لذا يجب مراقبة ما إذا كان الاستثمار ينتج ثروة. في هذا الصدد، فإن وجود مواد حيوية و/أو قيمة يجعل المشروع مربحًا. ومع ذلك، فإن هذا التغيير لا يؤثر فقط على الشركات المدعوة لتنفيذ مثل هذه المشاريع ولكن يشمل أيضًا المستهلكين الذين يسلمون المنتجات إلى الأماكن المناسبة. الهدف المشترك هو تقليل استخدام مكبات النفايات والاختيار بين الحلول الدائرية لأكثرها استدامة. وبالتالي، فإن القيد الأول الذي تم تسليط الضوء عليه في هذا العمل هو أنه يمكن أن يكون هناك أكثر من خيار واحد ضمن النماذج الدائرية وأن تحليلات دورة الحياة لجميع مكونات الاستدامة الثلاثة مطلوبة.
أبرزت نتائج MCDA أداء الدول الأوروبية حيث تظهر أداءات مهمة لدول غرب أوروبا، بينما تتخلف دول شرق أوروبا. الدولة الرائدة هي بلجيكا في كل من السيناريوهات الأساسية والبديلة للسنتين المدروستين. على مسافة قريبة جدًا توجد إيطاليا وفرنسا ولاتفيا في السيناريو الأساسي، والتي تؤدي بشكل جيد جدًا في عام 2020. في السيناريو البديل، حيث تمتلك جميع المؤشرات الـ 15 الأولية نفس الأهمية، تحتل هولندا المركز الثاني في التصنيف متقدمة على إيطاليا. تظهر هذه النتائج كيف أن المنهجية المختارة قادرة على اقتراح نتائج مختلفة حيث أن دولتين فقط من بين 27 دولة تحتفظان بنفس الموقع في التصنيف. هنا، يظهر القيد الثاني للعمل، حيث يمكن أن تنخرط فئات أخرى من أصحاب المصلحة من خلال تقديم رؤية أوسع وتحديد أوزان مختلفة أيضًا.
تشير تداعيات هذا العمل إلى أن أداء الدائرية داخل الدول الأوروبية يختلف كثيرًا، مما يستدعي المزيد من التعاون لتحقيق حيادية تكنولوجية من حيث الانبعاثات ودائرية الموارد. لا يمكن أن يكون الهدف فقط أن نكون قارة محايدة من حيث الانبعاثات، بل أن تكون الشركات والمواطنون جزءًا من هذا التغيير. لكي يحدث ذلك، في رأينا، يجب التغلب على ثلاثة حدود:
  1. تقليل النفايات غير القانونية من أجل تطبيق المبادئ ليس فقط للوقاية ولكن أيضًا لمبادئ القرب.
  2. زيادة الاستثمار في التقنيات الدائرية من خلال الاستثمار في رأس المال البشري وتعزيز تطوير الشركات الناشئة والشركات الصغيرة والمتوسطة التي يقودها الشباب.
  3. توزيع أكثر استدامة للفوائد الناتجة عن النماذج الدائرية على فئات مختلفة من أصحاب المصلحة.
تحتاج هذه الدراسة إلى أن تتكرر على مر السنين لمراقبة أداء الدول الأوروبية ويمكن توسيعها عالميًا لأن هدف الاستدامة لا يمكن تحقيقه إلا من خلال مساهمة جميع الدول.

إعلان عن تضارب المصالح

أعلن المؤلفون عدم وجود تضارب محتمل في المصالح فيما يتعلق بالبحث أو التأليف أو نشر هذه المقالة.

التمويل

كشف المؤلفون عن تلقي الدعم المالي التالي للبحث أو التأليف أو نشر هذه المقالة: تم إجراء هذه الدراسة ضمن مشروع PEACE (حماية البيئة: التقدم في الاقتصاد الدائري) الذي تلقى تمويلًا من ‘Fondo per il Programma Nazionale di Ricerca e Progetti di Rilevante Interesse Nazionale (PRIN)’ استثمار 1.1-D.D. 104.02-02-2022، 2022ZFBMA4 الممول من الاتحاد الأوروبي – الجيل القادم من الاتحاد الأوروبي. تعكس هذه المخطوطة فقط آراء المؤلفين وأفكارهم، ويمكن اعتبارهم مسؤولين عنها.

معرفات ORCID

إديانو د’أدامو (D https://orcid.org/0000-0003-1861-8813
ماسيمو غاستالدي (D) https://orcid.org/0000-0002-0867-3352

المواد التكميلية

المواد التكميلية لهذه المقالة متاحة عبر الإنترنت.

References

Antoniou NA and Zorpas AA (2019) Quality protocol and procedure development to define end-of-waste criteria for tire pyrolysis oil in the framework of circular economy strategy. Waste Management 95 : 161-170.
Arbolino R, Boffardi R, De Simone L, et al. (2021) Multi-objective optimization technique: A novel approach in tourism sustainability planning. Journal of Environmental Management 285: 112016.
Awasthi A, Omrani H and Gerber P (2018) Investigating ideal-solution based multicriteria decision making techniques for sustainability evaluation of urban mobility projects. Transportation Research Part A: Policy and Practice 116: 247-259.
Bączkiewicz A and Kizielewicz B (2021) Towards sustainable energy consumption evaluation in europe for industrial sector based on MCDA methods. Procedia Computer Science 192: 1334-1346.
Barma M, Biniyamin HK, Modibbo UM, et al. (2022) Mathematical model for the optimization of municipal solid waste management. Frontiers in Sustainability 3: 880409.
Barma M and Modibbo UM (2022) Multiobjective mathematical optimization model for municipal solid waste management with economic analysis of reuse/recycling recovered waste materials. Journal of Computational and Cognitive Engineering 1: 122-137.
Barros MV, Salvador R, Gallego-Schmid A, et al. (2023) Circularity measurement of external resource flows in companies: The circular flow tool. Waste Management 158: 136-145.
Beekhuizen J, Heuvelink GBM, Huss A, et al. (2014) Impact of input data uncertainty on environmental exposure assessment models: A case study for electromagnetic field modelling from mobile phone base stations. Environmental Research 135: 148-155.
Bockreis A and Ragossnig AM (2023) Celebrating WM&R’s first 40 years. Waste Management & Research 41: 1-2.
Caferra R, Tsironis G, Morone A, et al. (2023) Is the circular economy proposed as sustainability in firm mission statements? A semantic analysis. Environmental Technology & Innovation 32: 103304.
Castillo-Giménez J, Montañés A and Picazo-Tadeo AJ (2019) Performance and convergence in municipal waste treatment in the European Union. Waste Management 85: 222-231.
Chen TL, Kim H, Pan SY, et al. (2020) Implementation of green chemistry principles in circular economy system towards sustainable development goals: Challenges and perspectives. Science of the Total Environment 716: 136998.
Chiappetta Jabbour CJ, Lopes de Sousa Jabbour AB, Sarkis J, et al. (2019) Unlocking the circular economy through new business models based on large-scale data: An integrative framework and research agenda. Technological Forecasting and Social Change 144: 546-552.
Colasante A, D’Adamo I, Morone P, et al. (2022) Assessing the circularity performance in a European cross-country comparison. Environmental Impact Assessment Review 93: 106730.
D’Adamo I, Desideri S, Gastaldi M, et al. (2023a) Sustainable food waste management in supermarkets. Sustainable Production and Consumption 43: 204-216.
D’Adamo I, Ferella F, Gastaldi M, et al. (2023b) Circular solar: evaluating the profitability of a photovoltaic panel recycling plant. Waste Management & Research 41: 1144-1154.
D’Adamo I, Mazzanti M, Morone P, et al. (2022) Assessing the relation between waste management policies and circular economy goals. Waste Managemen 154: 27-35.
D’Adamo I and Sassanelli C (2022) A mini-review of biomethane valorization: Managerial and policy implications for a circular resource. Waste Management & Research 40: 1745-1756.
D’Amato A, Mazzanti M, Nicolli F, et al. (2018) Illegal waste disposal: Enforcement actions and decentralized environmental policy. SocioEconomic Planning Sciences 64: 56-65.
De Almeida ST and Borsato M (2019) Assessing the efficiency of end of life technology in waste treatment – A bibliometric literature review. Resources, Conservation and Recycling 140: 189-208.
De Pascale A, Arbolino R, Szopik-Depczyńska K, et al. (2021) A systematic review for measuring circular economy: The 61 indicators. Journal of Cleaner Production 281: 124942.
European Environment Agency (2016) Circular Economy in EuropeDeveloping the Knowledge Base. Copenhagen: Publications Office.
Fernández-Miguel A, Riccardi MP, Veglio V, et al. (2022) Disruption in resource-intensive supply chains: Reshoring and nearshoring as strategies to enable them to become more resilient and sustainable. Sustainability 14: 10909.
Hartley K, van Santen R and Kirchherr J (2020) Policies for transitioning towards a circular economy: Expectations from the European Union (EU). Resources, Conservation and Recycling 155: 104634.
Henry M, Bauwens T, Hekkert M, et al. (2020) A typology of circular startups: An analysis of 128 circular business models. Journal of Cleaner Production 245: 118528.
Ioppolo G, Saija G and Salomone R (2012) Developing a territory balanced scorecard approach to manage projects for local development: Two case studies. Land Use Policy 29: 629-640.
Islam A, Ahmed T, Awual MR, et al. (2020) Advances in sustainable approaches to recover metals from e-waste-A review. Journal of Cleaner Production 244: 118815.
Kirchherr J (2023) Bullshit in the sustainability and transitions literature: A provocation. Circular Economy and Sustainability 3: 167-172.
Kirchherr J (2022) Circular economy and growth: A critical review of ‘post-growth’ circularity and a plea for a circular economy that grows. Resources, Conservation and Recycling 179: 1-2.
Kirchherr J, Reike D and Hekkert M (2017) Conceptualizing the circular economy: An analysis of 114 definitions. Resources, Conservation and Recycling 127: 221-232.
Kirchherr J, Yang N-HN, Schulze-Spüntrup F, et al. (2023) Conceptualizing the circular economy (revisited): An analysis of 221 definitions. Resources, Conservation and Recycling 194: 107001.
Knäble D, de Quevedo Puente E, Pérez-Cornejo C, et al. (2022) The impact of the circular economy on sustainable development: A European panel data approach. Sustainable Production and Consumption 34: 233-243.
Korica P, Cirman A and Žgajnar Gotvajn A (2022) Comparison of end-of-life vehicles management in 31 European countries: A LMDI analysis. Waste Management & Research 40: 1156-1166.
Ladu L, Imbert E, Quitzow R, et al. (2020) The role of the policy mix in the transition toward a circular forest bioeconomy. Forest Policy and Economics 110: 101937.
Laso J, Margallo M, García-Herrero I, et al. (2018) Combined application of Life Cycle Assessment and linear programming to evaluate food waste-to-food strategies: Seeking for answers in the nexus approach. Waste Management 80: 186-197.
Loizia P, Voukkali I, Chatziparaskeva G, et al. (2021) Measuring the level of environmental performance on coastal environment before and during the COVID-19 pandemic: A case study from cyprus. Sustainability 13: 2485.
Lombardi GV, Gastaldi M, Rapposelli A, et al. (2021) Assessing efficiency of urban waste services and the role of tariff in a circular economy perspective: An empirical application for Italian municipalities. Journal of Cleaner Production 323: 129097.
Mazzanti M and Montini A (2014) Waste management beyond the NorthSouth divide: Spatial analyses of geographical, economic and institutional dimensions. In: Takeuchi K and Kinnaman TC (eds.) Handbook on Waste Management. Cheltenham: Edward Elgar Pub. Ltd., pp. 1-22.
Moktadir MA, Kumar A, Ali SM, et al. (2020) Critical success factors for a circular economy: Implications for business strategy and the environment. Business Strategy and the Environment 29: 3611-3635.
Moraga G, Huysveld S, Mathieux F, et al. (2019) Circular economy indicators: What do they measure? Resources, Conservation and Recycling 146: 452-461.
Papamichael I and Zorpas AA (2022) End-of-waste criteria in the framework of end-of-life PV panels concerning circular economy strategy. Waste Management & Research 40: 1677-1679.
Pophali GR, Chelani AB and Dhodapkar RS (2011) Optimal selection of full scale tannery effluent treatment alternative using integrated AHP and GRA approach. Expert Systems with Applications 38: 10889-10895.
Quicker P, Consonni S and Grosso M (2020) The Zero Waste utopia and the role of waste-to-energy. Waste Management & Research 38: 481-484.
Ragossnig AM and Schneider DR (2019) Circular economy, recycling and end-of-waste. Waste Management & Research 37: 109-111.
Romano G, Lombardi GV, Rapposelli A, et al. (2022) The factors affecting Italian provinces’ separate waste-collection rates: An empirical investigation. Waste Management 139: 217-226.
Saaty TL (2008) Decision making with the analytic hierarchy process. International Journal of Services Sciences 1: 83-98.
Saidani M, Yannou B, Leroy Y, et al. (2019) A taxonomy of circular economy indicators. Journal of Cleaner Production 207: 542-559.
Shooshtarian S, Maqsood T, Caldera S, et al. (2022) Transformation towards a circular economy in the Australian construction and demolition waste management system. Sustainable Production and Consumption 30: 89-106.
Tsui T, Peck D, Geldermans B, et al. (2021) The role of urban manufacturing for a circular economy in cities. Sustainability 13: 23.
Vacchi M, Siligardi C, Cedillo-González EI, et al. (2021) Industry 4.0 and smart data as enablers of the circular economy in manufacturing: Product re-engineering with circular eco-design. Sustainability 13: 10366.
Voukkali I, Papamichael I, Loizia P, et al. (2023) Waste metrics in the framework of circular economy. Waste Management & Research 41: 1741-1753.
Zink T and Geyer R (2017) Circular economy rebound. Journal of Industrial Ecology 21: 593-602.
Zisopoulos FK, Schraven DFJ and de Jong M (2022) How robust is the circular economy in Europe? An ascendency analysis with Eurostat data between 2010 and 2018. Resources, Conservation and Recycling 178: 106032.
Zorpas AA, Navarro-Pedreño J, Panagiotakis I, et al. (2021) Steps forward to adopt a circular economy strategy by the tourism industry. Waste Management & Research 39: 889-891.
Zorpas AA, Voukkali I and Navarro Pedreño J (2018) Tourist area metabolism and its potential to change through a proposed strategic plan in the framework of sustainable development. Journal of Cleaner Production 172: 3609-3620.

  1. Department of Computer, Control and Management Engineering, Sapienza University of Rome, Rome, Italy
    Sapienza University of Rome, Rome, Italy
    Department of Industrial and Information Engineering and Economics, University of L’Aquila, L’Aquila, Italy
    Department of Social Sciences and Business, Roskilde University, Roskilde, Denmark
    Innovation Studies Group, Copernicus Institute of Sustainable Development, Utrecht University, Utrecht, The Netherlands Cambridge Centre for Environment, Energy and Natural Resource Governance, University of Cambridge, Cambridge, UK

    المؤلف المراسل:

    ماسيمو غاستالدي، قسم الهندسة الصناعية والمعلوماتية والاقتصاد، جامعة لاكويلا، عبر غرونشي 18، لاكويلا 67100، إيطاليا.
    البريد الإلكتروني: massimo.gastaldidunivaq.it

Journal: Waste Management & Research The Journal for a Sustainable Circular Economy, Volume: 42, Issue: 8
DOI: https://doi.org/10.1177/0734242×241237171
PMID: https://pubmed.ncbi.nlm.nih.gov/38501268
Publication Date: 2024-03-19

Waste Management & Research 1-11
© The Author(s) 2024

Towards circular economy indicators: Evidence from the European Union

Idiano D’Adamo1 © , Daniele Favari , Massimo Gastaldi and Julian Kirchherr

Abstract

The European Union (EU) is moving towards sustainable development, and a key role is played by circular economy (CE) models geared towards reducing pressure on natural resources, generating jobs and fostering economic opportunities. Indicators are able to aggregate a variety of information and their use, through the use of multi-criteria decision analysis (MCDA), allows the performance of alternatives to be monitored. This work aims to calculate the performance of the EU27 in the years 2019 and 2020 according to 15 CE indicators available on Eurostat. The results of the Analytic Hierarchy process show that the greatest impact on circularity is determined by the category ‘competitiveness and innovation’, which together with the category ‘global sustainability and resilience’ accounts for two thirds of the overall weight. The MCDA results show that Belgium prevails in both the baseline and alternative scenarios, ahead of Italy and the Netherlands respectively. In general, circular policies see western European countries excel, while the performance of eastern European countries is weaker. The implications of this work highlight the three main barriers to the development of CE models: (i) illegal waste management; (ii) lack of knowledge and low level of investment in circular technologies and (iii) low distribution of value among stakeholders. In this way, resource management based on circularity will enable Europe to meet the challenges of sustainability with less dependence on imported raw materials.

Keywords

Circular economy, Europe, indicators, multi-criteria decision analysis, resource management
Received 9th January 2024, accepted 18th February 2024 by Associate Editor Antonis A. Zorpas.

Introduction

The European Environment Agency (2016) has proposed circular economy (CE) as a central element of a green economy model that extends waste management (WM), waste prevention and resource efficiency to human well-being and ecosystem resilience. CE is “an economic system that replaces the ‘end-of-life’ concept with reducing, alternatively reusing, recycling and recovering materials in production/distribution and consumption processes” (Kirchherr et al., 2017). The concept of CE is a crucial theme towards sustainable development (Bockreis and Ragossnig, 2023; D’Adamo et al., 2023a; Zorpas et al., 2021), although the impact of each source of CE value (recycling, renewable energy, repair and reuse) varies across the three dimensions of sustainability (Knäble et al., 2022). Its implementation can be seen on a large scale driven by appropriate policies (Hartley et al., 2020) and in concrete projects that firms are implementing (Henry et al., 2020). Analysing the firm mission statements on the CE, the theme of sustainability emerges and is followed by that of technology and production and consumption (PC). However, within the sustainability theme, the social component receives less attention (Caferra et al., 2023). The topic of EC is closely related to WM, which can be declined in terms of mathematical models (Barma et al., 2022; Barma and Modibbo, 2022), local
approaches (Loizia et al., 2021) and integrations in different contexts (Arbolino et al., 2021; Vacchi et al., 2021).
Circular models are not sustainable when the CE rebound occurs, where improvements in the eco-efficiency of a production system are offset by external systemic responses (Zink and Geyer, 2017). Moreover, the literature presents many works on CE but not all of them are oriented towards proposing concrete solutions, and this practice should be discouraged (Kirchherr, 2023). Different definitions of CE are proposed in the literature,
and it can be observed that in recent years there has been an increased focus on reuse and recycling, which are proposed as basic principles of ecology (Kirchherr et al., 2023, 2017). Moreover, CE models may require not only incremental changes but also the reconfiguration of supply chains. Similar to the above explanation, more attention of CE objectives is those that tend towards sustainable development and in the future, much attention should be given to value retention and resource efficiency.
The aim of the CE is to optimise the use of natural resources by minimising the negative effects of extraction and processing on energy, health and the environment through programmes of reuse, recycling and recovery (Chiappetta Jabbour et al., 2019). In order to achieve this, WM policies have started to change from conventional (landfill-based) scenarios to novel ones (based on recycled materials and renewable energy) – (Islam et al., 2020; Voukkali et al., 2023). It is worth highlighting that the CE concept aims to give value to waste by following the 5R model: redesign-reduction-recovery-recycle-reuse (Chen et al., 2020). Life cycle analyses of different products can see which circular practices are most likely to achieve sustainability goals.
The implementation of strict WM policies requires control measures to avoid the risk of increased illegal flows (D’Amato et al., 2018) and local authorities do not always know when a waste is no longer considered as waste (Mazzanti and Montini, 2014). This aspect is recalled by some authors who point out that Europe should propose clear and indisputable criteria defining exactly when a waste obtains product (or secondary raw material (RM)) status (Ragossnig and Schneider, 2019). In this respect, a key role is played by the end of waste, that is, the process through which a waste ceases to be a waste and can be fully recovered, acquiring the status of a product (or secondary RM). The European Waste Framework Directive also defines that innovations can turn waste into a valuable resource and the fully recovered material does not cause negative impacts on the environment or human health. End of waste, together with social change, is considered an enabling factor for reuse and recycling practices. The CE in seeking to benefit from waste is also a social responsibility involving a sharing of resources (D’Adamo et al., 2022).
The need to provide clear indications to policy makers and other categories of stakeholders requires quantitative indications. In this respect, the identification of indicators is useful. A taxonomy of them makes it possible to identify 55 subdivided into levels of implementation, by cycles, by performance, by circularity perspective and by degree of transversality (Saidani et al., 2019). The scope of measurement should include technological cycles with or without a Life Cycle Thinking approach and their effects on the three dimensions of sustainability (Moraga et al., 2019). Indicators could be grouped on the basis of the three spatial dimensions of sustainability (macro, micro and meso) and on the basis of the 3R principles (reduce, reuse, recycle) – (De Pascale et al., 2021). Some authors aim to implement circularity indicators for sustainability and CE objectives. In this way, depending on their corporate objectives and
business plans, firms can determine and implement the most appropriate circularity indicator (Barros et al., 2023). The comparison between countries is interesting as it can allow virtuous countries to be rewarded through international cooperation in the exchange of information, incentives for the training of workers and the sharing of knowledge and technology on recycling (De Almeida and Borsato, 2019). The circularity of European countries’ performance can be obtained through multi-criteria decision analysis (MCDA) based on Eurostat data (Colasante et al., 2022), and there is a link between circularity, energy efficiency and soundness in EU countries (Zisopoulos et al., 2022).
This work aims to fill a gap in the literature where there is no CE indicator that integrates the different information from a multiplicity of indicators available on Eurostat. Through the MCDA method, the performance of the 27 EU countries in the years 2019 and 2020 is compared considering 15 indicators equally from the 5 categories identified by Eurostat. The analysis will be conducted in a baseline scenario in which these indicators will be assigned a weight based on a pairwise comparison from international academics and in an alternative scenario in which the same weight will be assigned. The work concludes with some reflections to understand what the barriers to the development of circular models may be.

Methods

The MCDA supports complex decision-making in situations where multiple (conflicting) goals can be assessed in a variety of ways. It incorporates data on how well each alternative performed (scoring criteria) and a subjective assessment of the applicability of particular criteria (weighting factor). This method appears to be widely applied in the literature to assess the performance of countries in terms of sustainability (Bączkiewicz and Kizielewicz, 2021; Colasante et al., 2022). The steps that characterise this method concerned first of all the definition of the research objective, which is represented in this study by the identification of an indicator on CE in Europe. To achieve this objective, the alternatives considered were the 27 European countries to which the European average was added as a benchmark. The alternatives need criteria in order to be evaluated. This CE indicator is dimensionless calculated for each European MSs and generated by the multiplication of a row vector – representing a scoring criterion – and a column vector (CV) – representing a weighting factor.
Therefore, in the second step, we had proceeded to identify suitable criteria to represent CE performance. The database provided by Eurostat, which is a powerful tool that makes available a multiplicity of data mainly on European countries, was useful in this direction (Korica et al., 2022; Zisopoulos et al., 2022). The data were obtained as follows on Eurostat’s website: Data Database Data navigation tree EU policies CE indicators. Within
Table 1. List of categories and criteria.
Category Acronyms Criteria Acronyms
Production and consumption PC Resource productivity PC1
Generation of MSW per capita PC2
Generation of packaging waste per capita PC3
Waste management WM Recycling rate of municipal waste WM1
Recycling rate of packaging waste by type of packaging WM2
Recycling rate of waste of electrical and electronic equipment separately collected WM3
Secondary raw materials RM Circular material use rate RM1
Trade in recyclable raw materials (imports) RM2
Trade in recyclable raw materials (exports) RM3
Competitiveness and innovation Cl Private investment and gross added value related to circular economy sectors Cl1
Persons employed in circular economy sectors Cl2
Patents related to recycling and secondary raw materials Cl3
Global sustainability and resilience SR Consumption footprint SR1
Greenhouse gases emissions from production activities SR2
Material import dependency SR3
the CE indicators there are five categories: (i) PC; (ii) WM; (iii) Secondary RM; (iv) Competitiveness and Innovation (CI) and (v) Global Sustainability and Resilience (SR).
Within these categories, there were 22 indicators, from which we discarded a priori ‘EU self-sufficiency for RMs (within SR category)’ because it did not contain data for European countries.
The country evaluation phase can be done with the Analytic Hierarchy Process (AHP), where Saaty’s method typically suggests having criteria (Saaty, 2008). In this way several criteria should be discarded; therefore, it is preferred in this study to use the local-global priority approach, which allows more criteria to be included (D’Adamo and Sassanelli, 2022). In this regard, it should be pointed out that in order to allow a fair comparison between criteria, it is suggested that the number of criteria populating the categories be the same. The category analysis had shown that there are three criteria for RM, CI and SR categories. In contrast, a larger number of criteria populated the other two categories, so it was necessary to identify an objective criterion that allowed for a fair comparison between the categories, but at the same time allowed for the robustness of the results obtained. At this point, it had become important to assess the time horizon of the values provided for these indicators. Data were missing for 2022, but even for 2021 there was no well-populated database, so the last two available years were considered: 2019 and 2020. This choice also served to allow a time comparison between countries. Through this approach, it was considered that 2019 data are missing for the indicator ‘Recycling rate of all waste excluding major mineral waste’ within WM category and so this indicator was discarded and three criteria are proposed also for this category. The same approach was used for PC category. In this way the following indicators were not considered: ‘Waste generation per capita’, ‘Generation of waste excluding major mineral wastes per Gross Domestic Product (GDP) unit’ and ‘Food waste’. There were five indicators left available, and for the selection, the three
criteria we had considered excluding two indicators that tended to be very similar to other indicators already considered: ‘Generation of plastic packaging waste per capita’ compared to the indicator ‘Generation of packaging waste per capita’ found in the same PC category and ‘Material footprint’ compared to the indicator ‘Consumption footprint’ found in SR category. Table 1 proposes the list of the 15 criteria divided into the 5 categories. A complete description of these indicators as proposed by Eurostat can be found in Supplemental Table S1.
Once the criteria had been determined, it was possible to proceed to the third step in which a weight was asked to be assigned to calculate the column vector. The CV was comprised of 15 rows, corresponding to the number of criteria. For example, is the element of the vector column relative to resource productivity.
By taking into account various decision-making factors and focusing computation from a large number of variables to a small number, it offers the best possible solution (Pophali et al., 2011). The methodology’s only drawback is that discrete element analysis (e.g.) is not used to derive objective weights (Laso et al., 2018). AHP develops a weight for each criterion based on a pairwise comparison of all the criteria by the decision-makers. The more significant the criterion, the higher the weight (Awasthi et al., 2018).
The user’s expertise in the relevant field will determine how well AHP works. To this end, 10 academics were selected from the Scopus database who had published works on CE with at least 10 years of experience (D’Adamo et al., 2022). However, useful approaches are also to include other categories of experts (Moktadir et al., 2020) or a mix of them (Tsui et al., 2021), so this represents a limitation of this work. For this study, an e-mail
invitation was sent to a reasonable number of potential interviewees (Ladu et al., 2020), and the e-mail specified that only the first 10 would be selected. Contained within the email was the objective of the study and the methodology used. The selected panel consisted of women and came mainly from Europe (Supplemental Table S2). All experts were given the chance to meet for up to an hour to discuss the criteria, and they were each sent an Excel file with the descriptions of the criteria and pairwise comparisons. According to Saaty (2008), during AHP, experts could provide a value between 1 (equally preferred) and 9 (extremely preferred) – Supplemental Table S3. Before sending the Excel file, experts were asked to check the value of the Consistency Ratio (CR), which could be a maximum of 0.10 and was automatically calculated in the file. CR was calculated as the ratio of the consistency index (obtained from in which highest eigenvalue (inner product of the row vector containing column sums and the eigen vector matrix) and number of factors) to the random inconsistency (Supplemental Table S4) – (Saaty, 2008).
In the fourth step, it was necessary to identify the value of the single alternatives for each criterion. The RV was comprised of 15 columns, corresponding to the number of criteria. For exam is the element of the vector row relative to resource productivity.
The literature has already looked at how input data uncertainty affects a number of environmental assessment models (Beekhuizen et al., 2014). Particularly, results can be unreliable when there is a lack of homogeneity in the data. For this reason, as pointed out earlier, data from Eurostat had been used. Considering two reference years (2019-2020), 15 criteria and 28 alternatives 840 values were identified. However, where data were absent, the one corresponding to the most recent year was chosen (Castillo-Giménez et al., 2019). Thus, the number of data actually used was of what was requested. In fact, on this percentage, it should be noted that for criterion CI3, data from all of 2020 were missing.
The criteria have different units of measurement (Supplemental Table S5), and in order to make the data comparable, they are normalised. In particular, the approach associated with the weakest and best performance, respectively, among the different alternatives is used (Colasante et al., 2022). The other values are calculated through the interpolation model.

Results

The CE indicator is obtained from the product of the row vector and the column vector. In order to obtain the row vector, it is necessary to aggregate the different answers provided by the experts (section ‘Aggregation of weights’). The next step is to aggregate the different assessments that have been collected on Eurostat (section ‘Aggregation of values’). In this way, it is possible to calculate the CE indicator in both the baseline scenario
(section ‘Circular economy indicator – Baseline scenario’) and the alternative scenario (section ‘Circular economy indicator Alternative scenario’).

Aggregation of weights

The row vector is composed of the input provided by all experts (Supplemental Tables S6-S15). Once it was verified that all pairwise comparisons were robust and thus had a CR value that did not exceed 0.10 . The first data collected were those for category priority – Table 2. It is worth noting that there is no correlation between the number of experts and the number reported in the different tables.
The results bring out that two categories have a weight of twothirds of the total, so it emerges how the experts indicated a clear priority. In particular, the CI category prevails with 0.34 followed by the SR category with 0.33 , and both were chosen as most relevant by five experts. It is worth noting how the experts in selecting the category also looked at the indicators that comprised them. Similarly, eight experts gave the least weight to the PC category with 0.08 while two experts gave it to the RM category with 0.11 . A slightly higher value belongs to WM with 0.14 .
The CE model is one that can support companies to achieve CI goals, but at the same time giving sustainable and resilient solutions as well. Thus, a complex system that is able to react to external changes, to a globalisation in which not only consumer preferences change but also the entry of new players into the market. Circular solutions may initially be an order qualifier, but they are destined to be an order winner. In fact, the balance of ecosystems requires suitable solutions for the appropriate use of resources. In this context, a complex goal cannot be achieved with only a few categories but by pursuing the help of all categories and exploiting any congruencies present among different indicators.
Once the category weights were aggregated, they proceeded to repeat the same operation with the different indicators within each category in order to calculate local priority (Table 3).
Regarding the PC category, the experts tend to give almost equal relevance to both PC2 with 0.40 and PC1 with 0.39 . A choice in which the experts were equally divided. It emerges how twice as much relevance is given to municipal solid waste (MSW) as to packaging waste. The resource productivity criterion is considered not only relevant, but also hybrid with respect to CE goals since the term in the numerator refers to gross domestic product and the term in the denominator measures the amount of material used by an economy.
Regarding WM, again it emerges that two criteria tend to be chosen most. Specifically, six experts select WM1 as the most relevant with an average weight of 0.42 , whereas four assign that priority to WM3, which receives an average weight of 0.38 . Here, a result consistent with what was seen earlier emerges, thus a greater focus on MSW than packaging waste. Also consistent with the literature here as well, similar weight is given to e-waste compared to MSW. Recycling rate is considered an important element for the development of CE models, but nevertheless more attention is emphasised that should be given to the quality
Table 2. Aggregation of weights – category priority.
Categories E1 E2 E3 E4 E5 E6 E7 E8 E9 E10 Avg
PC 0.09 0.11 0.08 0.08 0.07 0.05 0.11 0.06 0.07 0.11 0.08
WM 0.12 0.14 0.15 0.15 0.09 0.15 0.19 0.11 0.14 0.15 0.14
RM 0.07 0.19 0.11 0.11 0.12 0.12 0.14 0.09 0.10 0.08 0.11
Cl 0.41 0.32 0.26 0.28 0.31 0.42 0.24 0.44 0.40 0.28 0.34
SR 0.31 0.24 0.40 0.37 0.41 0.27 0.32 0.29 0.30 0.37 0.33
Max weight Min weight. Average values are shown in bold.
Table 3. Aggregation of weights – local priority.
Criteria E1 E2 E3 E4 E5 E6 E7 E8 E9 E10 Avg
Production and consumption
PC1 0.49 0.49 0.31 0.31 0.49 0.31 0.49 0.49 0.31 0.20 0.39
PC2 0.31 0.31 0.49 0.49 0.31 0.49 0.31 0.31 0.49 0.49 0.40
PC3 0.20 0.20 0.20 0.20 0.20 0.20 0.20 0.20 0.20 0.31 0.21
Waste management
WM1 0.49 0.49 0.31 0.31 0.49 0.49 0.31 0.49 0.31 0.49 0.42
WM2 0.20 0.20 0.20 0.20 0.20 0.20 0.20 0.20 0.20 0.20 0.20
WM3 0.31 0.31 0.49 0.49 0.31 0.31 0.49 0.31 0.49 0.31 0.38
Secondary raw materials
RM1 0.49 0.49 0.49 0.31 0.49 0.49 0.49 0.31 0.49 0.20 0.43
RM2 0.31 0.31 0.20 0.20 0.20 0.31 0.31 0.49 0.31 0.31 0.30
RM3 0.20 0.20 0.31 0.49 0.31 0.20 0.20 0.20 0.20 0.49 0.28
Competitiveness and innovation
Cl1 0.49 0.49 0.49 0.31 0.49 0.49 0.49 0.31 0.49 0.49 0.45
Cl2 0.31 0.31 0.20 0.49 0.31 0.31 0.31 0.49 0.31 0.31 0.34
Cl3 0.20 0.20 0.31 0.20 0.20 0.20 0.20 0.20 0.20 0.20 0.21
Global sustainability and resilience
SR1 0.20 0.49 0.31 0.31 0.49 0.49 0.49 0.31 0.31 0.20 0.36
SR2 0.31 0.31 0.49 0.49 0.20 0.31 0.31 0.49 0.49 0.31 0.37
SR3 0.49 0.20 0.20 0.20 0.31 0.20 0.20 0.20 0.20 0.49 0.27
Max weight Min weight. Average values are shown in bold.
of recycling collection, giving benefits to consumers who perform even more virtuous behaviour.
Unlike the previous categories, one criterion emerges in the second RMs over the other two. In fact, seven experts opt for RM1 with an average weight of 0.425 . Similarly to what happened with PC1, this time before these judgements can also be present with opposite judgements. In fact, for one expert its weight is the least relevant. The difference in experts’ know-how evidently influences such judgments. It also emerged that this criterion is considered to be directly related to one of the main outputs of the CE, namely the measurement of those recycled materials that are then fed back into a production cycle. It is therefore the emphasis on this activity that emerges and not the similarity between the other two criteria (trade in recyclable RMs) which is only apparent. In fact, RM2 is referred to imports (0.295), whereas RM3 to exports (0.28).
A scenario in terms of different results than the previous ones is manifested for the CI category. In fact, each criterion has a
significant difference from another criterion. In particular, experts paid attention to the feature that all three criteria are strongly correlated with CE patterns. Particular attention is given to criterion CI1, with an average weight of 0.45 chosen as most relevant by eight experts. This criterion refers to three sectors: (i) the recycling, (ii) repair and reuse and (iii) rental and leasing. Two experts, on the other hand, gave greater relevance to CI2 (0.34) referring to the number of people impregnated related again to the above-mentioned sectors. Finally, it is pointed out that according to the experts, the other criterion CI3, with an average weight of 0.21 , is also considered important, but in a pairwise comparison, the figure for patents of circular solutions comes out at a disadvantage.
Finally, the last category examined, relating to global SR, shows a situation similar to others in which two criteria are considered to be of almost equal importance. However, this is the only category where experts differed strongly in their results. Criterion SR1 is the most relevant by four experts with 0.36 as
Table 4. Global priority.
Criteria Local priority Ranking Global priority Ranking
Production and consumption (priority: 0.0847)
PC1 0.390 2 0.0330 12
PC2 0.401 1 0.0340 10
PC3 0.209 3 0.0177 15
Waste management (priority: 0.1378)
WM1 0.419 1 0.0577 7
WM2 0.198 3 0.0272 14
WM3 0.383 2 0.0528 8
Secondary raw materials (priority: 0.1127)
RM1 0.425 1 0.0479 9
RM2 0.295 2 0.0333 11
RM3 0.279 3 0.0314 13
Competitiveness and innovation (priority: 0.3363)
Cl1 0.455 1 0.1530 1
Cl2 0.336 2 0.1131 4
Cl3 0.209 3 0.0703 6
Global sustainability and resilience (priority: 0.3286)
SR1 0.360 2 0.1184 3
SR2 0.372 1 0.1222 2
SR3 0.268 3 0.0879 5
average weight and is slightly preceded by SR2 with 0.37 which is always opted as most relevant by four experts. Finally, the last two experts selected SR3 with 0.27 . It also emerges that the lowest weight may have been assigned to all three criteria depending on the expert. The typically environmental figure for emissions turns out to be slightly more relevant than the consumption footprint, which estimates the environmental impact of five areas of consumption: food, mobility, housing, appliances and household goods. Thus, both have a strongly environmental connotation. These indicators are considered useful in assessing environmental impact, on which CE activities evidently influence only a part and are therefore indicators interpreted as more generic. Similarly, the material import dependency is seen, which measures precisely the import figure, resulting, however, in a different figure from the one proposed earlier.
The components of the row vector are shown in Table 4 where the global priority for each criterion is calculated as the product of the local priority of the specific criterion and its category priority. For example, criterion PC1 has a local priority of 0.390 and considering a category priority of 0.0847 yields the global priority of 0.0330 . Similarly, criterion S3 has a local priority of 0.268 with a category priority of 0.3286 from which a global priority of 0.0879 is derived.
The results clearly show how the incidence of categories significantly influences the order of global ranking. The CI and SR categories have a weight of 0.6649 and the criteria in these two categories occupy the top six positions. Criterion CI1 excels with 0.1530 followed by SR2 and SR3 with 0.1222 and 0.1184 , respectively. This indicates that in this local-global priority approach, the difference that exists between individual criteria also matters. The weight of CI is greater than SR, but the difference between the first two criteria is less in the SR category.
The last three ranking positions see the presence of the last criterion in terms of local priority, which is found to be matched by the other three remaining categories, namely RM3, WM2 and PC3.

Aggregation of values

The column vector is calculated according to data from Eurostat. As explained in section ‘Methods’, all values are normalised with the range , and each criterion presents a specific value for the alternatives considered ( 27 EU countries). The analysis is repeated for the year 2019 (Supplemental Table S16) and for the year 2020 (Supplemental Table S17).
Analysis of the results shows that Belgium performs better than all in four criteria (WM2, RM2, RM3 and CI1), and this result is verified in both years examined. It is shown that this phenomenon is quite widespread in several other criteria, such as the Netherlands in criterion RM1, Sweden and Malta in criterion SR2, Romania in criterion PC2, Croatia in criterion PC3, Germany in criterion WM1, Croatia in criterion CI2, Finland in criterion CI3, Greece in criterion SR1 and Romania in criterion SR3. Variations in leadership occur in criterion WM3 with Croatia replacing Czechia and in criterion PC1 with the Netherlands replacing Luxembourg. Similarly, the negative performance recorded by some countries that turn out to occupy the last step in six criteria (Malta) and four criteria (Luxembourg) should be highlighted. Also appearing to be the worst in two criteria are Bulgaria, Greece and Romania (which in 2020 occupies the last position in three criteria). The results are objective since as mentioned in section ‘Methods’ in are data extrapolated from Eurostat. In order to understand the normalisation value in the range, we point out that a country’s performance is evaluated by considering not only its own performance but also that of the best performing country. For example, the best performance with the most significant reduction is related to criterion CI2 in which the maximum value decreased from to Total employment. In contrast, the most significant reduction, but this time in positive terms, concerns criterion SR2 in which the minimum value decreased from 4261 to eq per capita. The same is also true for less performing values, and this affects the changes in the individual normalised values. In order to understand how many countries tend towards a high value, it is useful to calculate the concentration indicator (Supplemental Figure S1).
The criteria that overall have several countries with a high normalised value in 2020 are SR2 (0.67) and WM3 (0.66), followed by SR3 and SR1 with 0.64 and 0.61 , respectively. In contrast, criterion RM2 (0.18) is where there is a greater concentration of countries towards weak performance. This is followed by criterion CI3 with 0.22 .

CE indicator: Baseline scenario

The MCDA aims to compare different European countries in terms of CE, and this work introduced a new CE indicator in order to compare and monitor the performance of these countries
Figure 1. CE indicator in the period 2019-2020 (Baseline scenario).
over time. In the baseline scenario, the weights are obtained from the AHP, whereas the values from Eurostat’s normalisation process. The product of the column vector (Supplemental Tables S16-S17) and the row vector (Table 4) allows this indicator to be calculated for each alternative – Figure 1.
The ranking is led by Belgium, which has a value of 0.599 in 2020 and is just ahead of Italy (0.595), France (0.589) and Latvia (0.581). In 2019, Belgium also holds the record, albeit with a higher value ( 0.635 ). In order to understand these differences, they are analysed on a criterion-by-criterion basis (Supplemental Table S18). It emerges that on the one hand there is a decrease in the value related to not only criteria PC2 and SR1, but also WM1 which is not balanced by the increase in criterion CI2. Although Latvia has a high position in the ranking, it loses two positions compared to the 2019 figure. The contribution associated with criterion CI1 decreases and is offset by the increase in that for CI2. However, significant reductions are also verified for SR1. Instead, Italy gains one position in the ranking due to the contribution of CI2 and France due to that of the contribution of CI1. The comparison between the 2 years shows several variations and only four countries do not change their position. In terms of ranking, Spain and Estonia gain five positions and Croatia, Slovakia and Ireland also show an increase of three positions. The situation is diametrically opposite for the Netherlands, Poland and Portugal; however, the negative record belongs to Slovenia, which loses ten positions. In fact, if we analyse the numerical value, it is Slovenia that has the largest decrease ( -0.0634 ) followed by Belgium ( -0.0367 ) and Portugal (-0.0269). The country that, on the other hand, has
the most significant increase is Malta ( +0.0509 ) followed by Ireland (+0.0445) and Spain (+0.0326). Weak performances in multiple indicators lead Cyprus, Malta and Luxembourg to close the European ranking.
It is possible to conduct a disaggregation analysis at the category level to assess their contribution on the overall results Supplemental Figure S2. It emerges that the SR category prevails in 22 countries. In contrast, Belgium, Denmark, Luxembourg, Malta and Netherlands see the CI category prevail. The combined weight of the two categories impacts of Luxembourg’s final value and of Malta’s.

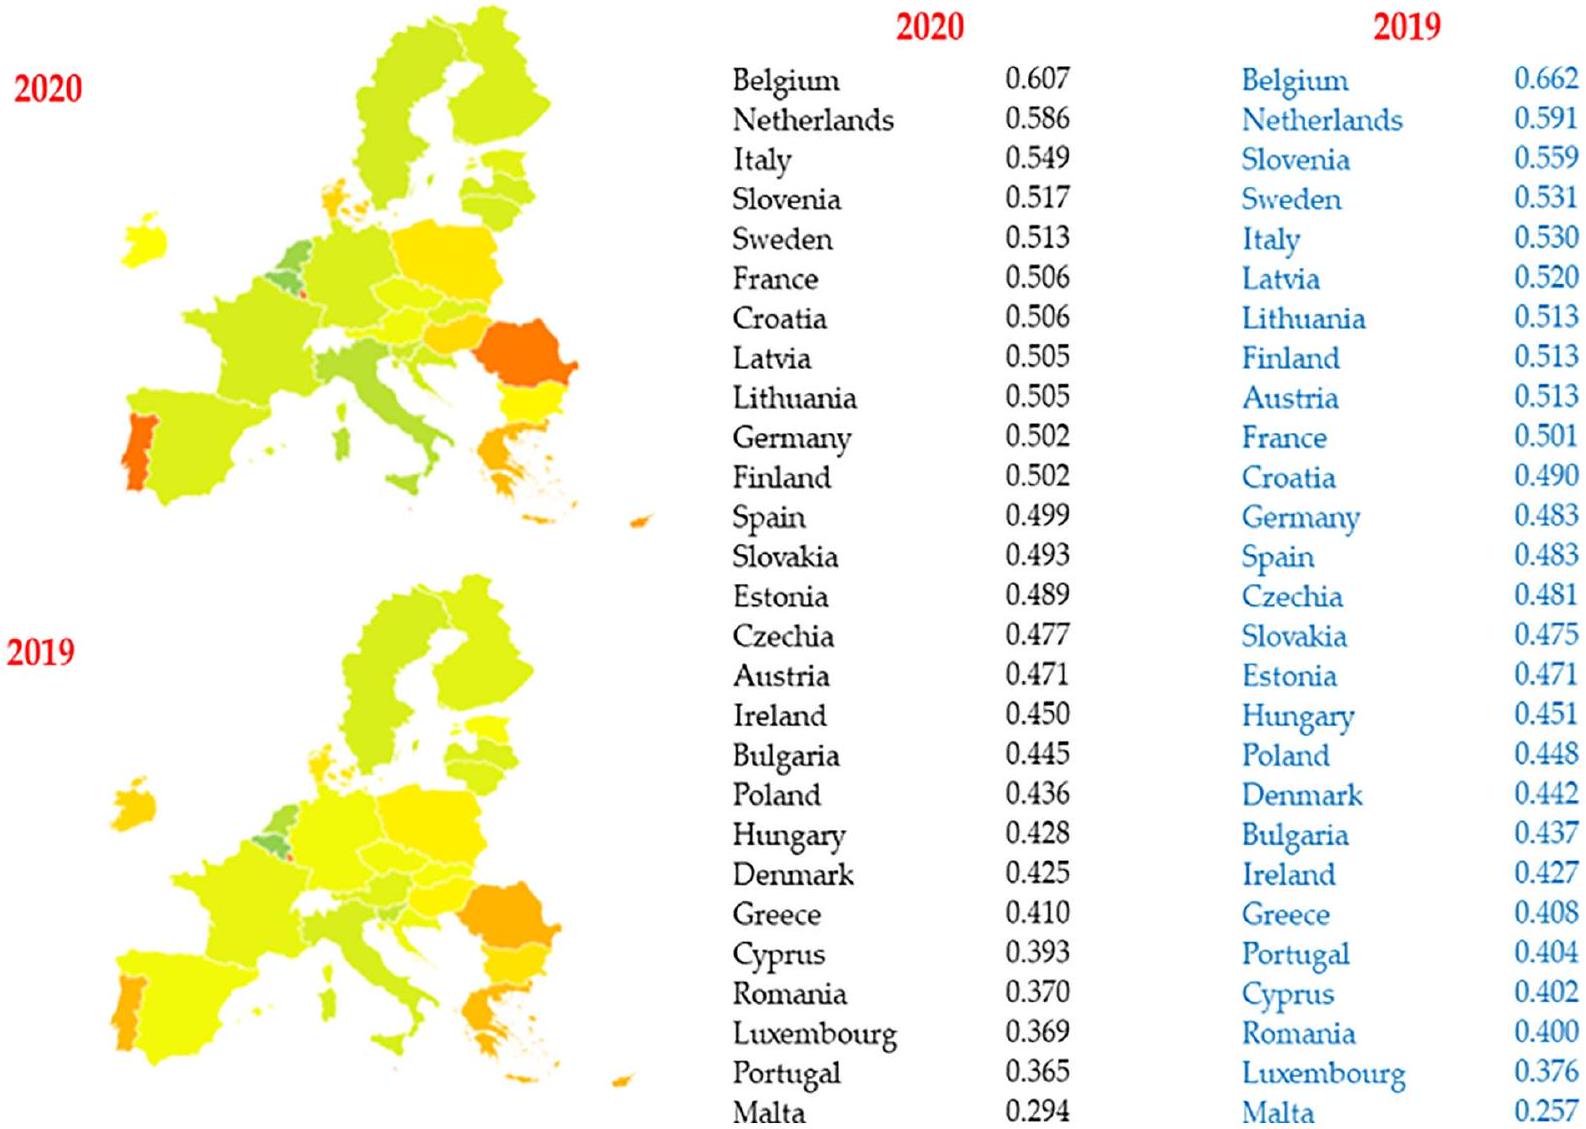
CE indicator: Alternative scenario

In order to give robustness to the results obtained, an alternative scenario is considered. The values have an objective nature and therefore are not changed, whereas the weights were assigned by means of the AHP. An alternative scenario can be considered in which all criteria have equal importance and thus the row vector will no longer be composed of what is shown in Table 3 (Figure 2). Thus, if in the baseline scenario the PC3 criterion weighed 0.0177 and the CI1 criterion 0.1530 , in this alternative both will have a weight of 0.0667 .
The results show that between 2019 and 2020, the ranking positions remain identical in only four cases, including Belgium confirming its leadership followed by the Netherlands and Malta closing the ranking. When evaluating the alternative scenario, it is useful to compare the performance and ranking position with the baseline scenario – Table 5.
Figure 2. CE indicator in the period 2019-2020 (Alternative scenario).
Table 5. Summary circular economy indicator.
Baseline Rkg Country Baseline value Alternative value Alternative-baseline value Alternative-baseline Rkg
1 Belgium 0.599 0.607 0.008 0
2 Italy 0.595 0.549 -0.046 -1
3 France 0.589 0.506 -0.083 -3
4 Latvia 0.581 0.505 -0.075 -4
5 Croatia 0.567 0.506 -0.061 -2
6 Austria 0.566 0.471 -0.095 -10
7 Sweden 0.557 0.513 -0.044 2
8 Germany 0.555 0.502 -0.052 -2
9 Spain 0.546 0.499 -0.047 -3
10 Netherlands 0.543 0.586 0.044 8
11 Lithuania 0.537 0.505 -0.032 2
12 Finland 0.525 0.502 -0.023 1
13 Hungary 0.517 0.428 -0.088 -7
14 Estonia 0.508 0.489 -0.019 0
15 Slovakia 0.507 0.493 -0.014 2
16 Slovenia 0.497 0.517 0.021 12
17 Czechia 0.494 0.477 -0.017 2
18 Poland 0.486 0.436 -0.050 -1
19 Ireland 0.475 0.450 -0.025 2
20 Portugal 0.461 0.365 -0.096 -6
21 Bulgaria 0.461 0.445 -0.016 3
22 Denmark 0.428 0.425 -0.003 1
23 Romania 0.421 0.370 -0.051 -1
24 Greece 0.411 0.410 -0.001 2
25 Cyprus 0.403 0.393 -0.011 2
26 Malta 0.387 0.294 -0.093 -1
27 Luxembourg 0.341 0.369 0.028 2
Besides Belgium, whose value increases by 0.008 , the only other country that does not change its position is Estonia placed 14th. Italy loses one position but remains on the podium, while it is the Netherlands that gains well by placing second. France, on the other hand, falls off the podium. The comparison between the alternative and baseline scenarios shows that the value of Austria, Portugal and Malta decreases more than 0.09 , whereas it is the Netherlands that has the greatest growth with a value of more than 0.04 . In terms of ranking, Slovenia stands out, rising to the edge of the podium by gaining 12 positions, whereas it is Austria that marks the steepest decline by losing 10 positions. The alternative scenario gives greater weight to the three categories (PC, WM and RM) that perform the least in the AHP. Thus, those who excel in these criteria improve their rankings and likewise the better performance associated with those who perform well in the CI and SR categories is reduced.
Again, to understand this figure, it is useful to propose disaggregation analysis – Supplemental Figure S3.
The SR category remains the most relevant, but only in 15 of the 27 countries surveyed. The reason for this is the largest concentration indicator concerning the three related criteria – Figure 1. For the same reason, it is the largest in the WM category for nine countries (Czechia, Denmark, Germany, Italy, Luxembourg, Austria, Slovenia, Slovakia and Finland). Finally, the RM category prevails for the first two countries in the alternative ranking (Belgium and Netherlands) and the CI category in Malta.

Discussion

The CE is a model in which the aim is to give value to waste that can be fed back into the production cycle. The literature has highlighted how relevant the issue of end-of-waste is and how this is not always easy to define (Antoniou and Zorpas, 2019; D’Adamo et al., 2022; Papamichael and Zorpas, 2022). There are three aspects that undermine effective resource management. The first concerns illegal waste, which may contain toxic and hazardous substances that would require significant costs to be properly managed, pushing some firms to opt for unsuitable management paths. The second is the lack of expertise on the subject where it is not understood that we need to think about the end of life of the product not at the end of its useful life but at the beginning, and we also need to have professionals who are familiar with the technological resources that can deal with this waste and promote research and development programmes to find solutions. The third is the sharing of value to be distributed among the different categories of stakeholders in order to understand that we need to reward the actions of citizens by thinking no longer of the concept of separate collection but of that of good separate collection capable of reducing impurities and thus of proper WM.
In this framework, one cannot think that all waste can be reused and recycled, and sometimes recovery is an action to be taken if this means avoiding waste going to landfill according to the waste hierarchy (Lombardi et al., 2021; Quicker et al., 2020; Shooshtarian et al., 2022). In a context where the RMs most in
demand for sustainable development are not concentrated in Europe, the CE model could be a strategy to reduce foreign dependence. However, this is possible when RMs are obtained whose degree of purity does not compromise the functionality of products, and these RMs become substitutes for those that originate from the extraction of RMs. The risk of CE rebound is an incorrect sustainable approach in which circular models are implemented, but then no change in consumption patterns follows (Caferra et al., 2023; Kirchherr, 2022).
The relationship between the different criteria proposed in this work can be explored by means of a correlation matrix in which an average value emerges for the following relationships (Supplemental Table S19): PC1-PC3, WM1-WM2, RM2-RM3 and PC1-RM1. The correlation coefficient varies between 0.63 and 0.67 and becomes 0.75 for the variables PC1-SR3. This clearly identifies a relationship between the gross domestic product and the import dependency of materials. The use of recovered materials could help reduce Europe’s dependence on imported RMs, improving security of supply and reducing the environmental impact associated with extracting and transporting these resources. This could also lead to greater economic stability and reduced vulnerabilities to global RM price fluctuations (D’Adamo et al., 2023b; Romano et al., 2022). An equally interesting aspect to examine is the behaviour that both citizens and companies could adopt to successfully promote the transition to the circular model. On the one hand, citizens could contribute significantly to the change by supporting recycling and the purchase of circular products. On the other hand, some firms might have to deeply review their business model to successfully adapt to this new perspective. Moreover, the latter promote the creation of new jobs.
To this end, a balanced scorecard approach is useful for assessing the contribution of different factors (Ioppolo et al., 2012) in order to develop a strategic plan towards sustainable development (Zorpas et al., 2018) in a context where reshoring and nearshoring are key to identifying a resilient solution (Fernández-Miguel et al., 2022). The study’s primary goal is to conduct an aggregate assessment of the degree of CE advancement in the European nations. We used MCDA to express this level using the Eurostat indicators that are currently available for the Europe zone. But the present study is not perfect and can be improved. The small number of indicators, especially in the CI domains, is a study limitation. The absence of indicators for the social component of CE is another drawback. Future developments of the Eurostat database or the use of other current databases, such as those maintained by the World Bank or the OECD, may be able to remove these restrictions. Nevertheless, certain data pertaining to CE indicators for some EU member states are absent from these databases. Moreover, when indicators are observable in all data bases, the values are often unfortunately discordant. For this reason, it was decided to use a single source (Eurostat) considering a smaller but significant number of indicators. As the European Commission has recently approved several ambitious policies and practices related to the implementation of the CE and to measure its advancement, we think that in the future the database on CE indicators will be much larger and more comprehensive.

Conclusions

The CE can be supportive of sustainable development, and this is the direction in which the experts’ judgements in the elaboration of the AHP point. The results obtained from the local-global approach identify a relevance ranking among the 15 indicators proposed by Eurostat. The role of the category priority greatly affects the final value since the two categories ‘CI’ and ‘global SR’ account for two-thirds of the weight, and the respective criteria occupy the first six positions in the global ranking. The criterion ‘private investment and gross added value related to CE sectors’ is the one that prevails and highlights that sustainability is not a happy degrowth as it must aim at a change in both PC habits. In a context of resource scarcity, one must optimise one’s use and recover these RMs where they have already been used. Investment in these technologies is needed in this direction. However, the CE model is not only about protecting the environment, but is geared towards creating economic opportunities, so it must be monitored whether the investment produces wealth. In this respect, the presence of critical and/or valuable materials makes a project profitable. However, this change does not only affect the firms called upon to implement such projects but also involves the consumers who deliver products to the appropriate places. The common goal is to minimise the use of landfill and to opt among circular solutions for the one that is the most sustainable. Thus, the first limitation highlighted by this work is that there can be more than one option within circular models and that life cycle analyses of all three components of sustainability are needed.
The results of the MCDA highlighted the performance of European countries where important performances emerge for Western European countries, whereas Eastern European countries lag behind. The leading country is Belgium in both the baseline and alternative scenarios for both years examined. At a very close distance are Italy, France and Latvia in the baseline scenario, which thus perform very well in 2020. In the alternative scenario, where the 15 starting indicators all have the same relevance, it is the Netherlands that occupies second place in the ranking ahead of Italy. These results show how the chosen methodology is able to propose different results since only two of the 27 countries hold the same position in the ranking. Here, the second limitation of the work emerges, as other categories of stakeholders could be involved by providing a broader view and also determining different weights.
The implications of this work indicate that the circularity performance within European countries is very different, calling for more collaboration to achieve technology neutrality in terms of emissions and resource circularity. The goal cannot only be to be an emission-neutral continent, but to have companies and citizens be part of this change. For this to happen, in our view, three limits must be overcome:
  1. The reduction of illegal waste in order to apply the principles not only of prevention but also those of proximity.
  2. Greater investment in circular technologies by investing in human capital and promoting the development of start-ups and youth-led small- and medium-sized enterprises.
  3. A more sustainable distribution of the benefits obtained from circular models to the different categories of stakeholders.
This study needs to be replicated over the years to monitor the performance of European countries and can be extended globally because the goal of sustainability can only be achieved through the contribution of all countries.

Declaration of conflicting interests

The authors declared no potential conflicts of interest with respect to the research, authorship, and/or publication of this article.

Funding

The authors disclosed receipt of the following financial support for the research, authorship, and/or publication of this article: This study was carried out within the PEACE (Protecting the Environment: Advances in CE) which received funding from the ‘Fondo per il Programma Nazionale di Ricerca e Progetti di Rilevante Interesse Nazionale (PRIN)’ Investimento 1.1-D.D. 104.02-02-2022, 2022ZFBMA4 funded by the European Union -Next-Generation EU. This manuscript reflects only the authors’ views and opinions, and can be considered responsible for them.

ORCID iDs

Supplemental material

Supplemental material for this article is available online.

References

Antoniou NA and Zorpas AA (2019) Quality protocol and procedure development to define end-of-waste criteria for tire pyrolysis oil in the framework of circular economy strategy. Waste Management 95 : 161-170.
Arbolino R, Boffardi R, De Simone L, et al. (2021) Multi-objective optimization technique: A novel approach in tourism sustainability planning. Journal of Environmental Management 285: 112016.
Awasthi A, Omrani H and Gerber P (2018) Investigating ideal-solution based multicriteria decision making techniques for sustainability evaluation of urban mobility projects. Transportation Research Part A: Policy and Practice 116: 247-259.
Bączkiewicz A and Kizielewicz B (2021) Towards sustainable energy consumption evaluation in europe for industrial sector based on MCDA methods. Procedia Computer Science 192: 1334-1346.
Barma M, Biniyamin HK, Modibbo UM, et al. (2022) Mathematical model for the optimization of municipal solid waste management. Frontiers in Sustainability 3: 880409.
Barma M and Modibbo UM (2022) Multiobjective mathematical optimization model for municipal solid waste management with economic analysis of reuse/recycling recovered waste materials. Journal of Computational and Cognitive Engineering 1: 122-137.
Barros MV, Salvador R, Gallego-Schmid A, et al. (2023) Circularity measurement of external resource flows in companies: The circular flow tool. Waste Management 158: 136-145.
Beekhuizen J, Heuvelink GBM, Huss A, et al. (2014) Impact of input data uncertainty on environmental exposure assessment models: A case study for electromagnetic field modelling from mobile phone base stations. Environmental Research 135: 148-155.
Bockreis A and Ragossnig AM (2023) Celebrating WM&R’s first 40 years. Waste Management & Research 41: 1-2.
Caferra R, Tsironis G, Morone A, et al. (2023) Is the circular economy proposed as sustainability in firm mission statements? A semantic analysis. Environmental Technology & Innovation 32: 103304.
Castillo-Giménez J, Montañés A and Picazo-Tadeo AJ (2019) Performance and convergence in municipal waste treatment in the European Union. Waste Management 85: 222-231.
Chen TL, Kim H, Pan SY, et al. (2020) Implementation of green chemistry principles in circular economy system towards sustainable development goals: Challenges and perspectives. Science of the Total Environment 716: 136998.
Chiappetta Jabbour CJ, Lopes de Sousa Jabbour AB, Sarkis J, et al. (2019) Unlocking the circular economy through new business models based on large-scale data: An integrative framework and research agenda. Technological Forecasting and Social Change 144: 546-552.
Colasante A, D’Adamo I, Morone P, et al. (2022) Assessing the circularity performance in a European cross-country comparison. Environmental Impact Assessment Review 93: 106730.
D’Adamo I, Desideri S, Gastaldi M, et al. (2023a) Sustainable food waste management in supermarkets. Sustainable Production and Consumption 43: 204-216.
D’Adamo I, Ferella F, Gastaldi M, et al. (2023b) Circular solar: evaluating the profitability of a photovoltaic panel recycling plant. Waste Management & Research 41: 1144-1154.
D’Adamo I, Mazzanti M, Morone P, et al. (2022) Assessing the relation between waste management policies and circular economy goals. Waste Managemen 154: 27-35.
D’Adamo I and Sassanelli C (2022) A mini-review of biomethane valorization: Managerial and policy implications for a circular resource. Waste Management & Research 40: 1745-1756.
D’Amato A, Mazzanti M, Nicolli F, et al. (2018) Illegal waste disposal: Enforcement actions and decentralized environmental policy. SocioEconomic Planning Sciences 64: 56-65.
De Almeida ST and Borsato M (2019) Assessing the efficiency of end of life technology in waste treatment – A bibliometric literature review. Resources, Conservation and Recycling 140: 189-208.
De Pascale A, Arbolino R, Szopik-Depczyńska K, et al. (2021) A systematic review for measuring circular economy: The 61 indicators. Journal of Cleaner Production 281: 124942.
European Environment Agency (2016) Circular Economy in EuropeDeveloping the Knowledge Base. Copenhagen: Publications Office.
Fernández-Miguel A, Riccardi MP, Veglio V, et al. (2022) Disruption in resource-intensive supply chains: Reshoring and nearshoring as strategies to enable them to become more resilient and sustainable. Sustainability 14: 10909.
Hartley K, van Santen R and Kirchherr J (2020) Policies for transitioning towards a circular economy: Expectations from the European Union (EU). Resources, Conservation and Recycling 155: 104634.
Henry M, Bauwens T, Hekkert M, et al. (2020) A typology of circular startups: An analysis of 128 circular business models. Journal of Cleaner Production 245: 118528.
Ioppolo G, Saija G and Salomone R (2012) Developing a territory balanced scorecard approach to manage projects for local development: Two case studies. Land Use Policy 29: 629-640.
Islam A, Ahmed T, Awual MR, et al. (2020) Advances in sustainable approaches to recover metals from e-waste-A review. Journal of Cleaner Production 244: 118815.
Kirchherr J (2023) Bullshit in the sustainability and transitions literature: A provocation. Circular Economy and Sustainability 3: 167-172.
Kirchherr J (2022) Circular economy and growth: A critical review of ‘post-growth’ circularity and a plea for a circular economy that grows. Resources, Conservation and Recycling 179: 1-2.
Kirchherr J, Reike D and Hekkert M (2017) Conceptualizing the circular economy: An analysis of 114 definitions. Resources, Conservation and Recycling 127: 221-232.
Kirchherr J, Yang N-HN, Schulze-Spüntrup F, et al. (2023) Conceptualizing the circular economy (revisited): An analysis of 221 definitions. Resources, Conservation and Recycling 194: 107001.
Knäble D, de Quevedo Puente E, Pérez-Cornejo C, et al. (2022) The impact of the circular economy on sustainable development: A European panel data approach. Sustainable Production and Consumption 34: 233-243.
Korica P, Cirman A and Žgajnar Gotvajn A (2022) Comparison of end-of-life vehicles management in 31 European countries: A LMDI analysis. Waste Management & Research 40: 1156-1166.
Ladu L, Imbert E, Quitzow R, et al. (2020) The role of the policy mix in the transition toward a circular forest bioeconomy. Forest Policy and Economics 110: 101937.
Laso J, Margallo M, García-Herrero I, et al. (2018) Combined application of Life Cycle Assessment and linear programming to evaluate food waste-to-food strategies: Seeking for answers in the nexus approach. Waste Management 80: 186-197.
Loizia P, Voukkali I, Chatziparaskeva G, et al. (2021) Measuring the level of environmental performance on coastal environment before and during the COVID-19 pandemic: A case study from cyprus. Sustainability 13: 2485.
Lombardi GV, Gastaldi M, Rapposelli A, et al. (2021) Assessing efficiency of urban waste services and the role of tariff in a circular economy perspective: An empirical application for Italian municipalities. Journal of Cleaner Production 323: 129097.
Mazzanti M and Montini A (2014) Waste management beyond the NorthSouth divide: Spatial analyses of geographical, economic and institutional dimensions. In: Takeuchi K and Kinnaman TC (eds.) Handbook on Waste Management. Cheltenham: Edward Elgar Pub. Ltd., pp. 1-22.
Moktadir MA, Kumar A, Ali SM, et al. (2020) Critical success factors for a circular economy: Implications for business strategy and the environment. Business Strategy and the Environment 29: 3611-3635.
Moraga G, Huysveld S, Mathieux F, et al. (2019) Circular economy indicators: What do they measure? Resources, Conservation and Recycling 146: 452-461.
Papamichael I and Zorpas AA (2022) End-of-waste criteria in the framework of end-of-life PV panels concerning circular economy strategy. Waste Management & Research 40: 1677-1679.
Pophali GR, Chelani AB and Dhodapkar RS (2011) Optimal selection of full scale tannery effluent treatment alternative using integrated AHP and GRA approach. Expert Systems with Applications 38: 10889-10895.
Quicker P, Consonni S and Grosso M (2020) The Zero Waste utopia and the role of waste-to-energy. Waste Management & Research 38: 481-484.
Ragossnig AM and Schneider DR (2019) Circular economy, recycling and end-of-waste. Waste Management & Research 37: 109-111.
Romano G, Lombardi GV, Rapposelli A, et al. (2022) The factors affecting Italian provinces’ separate waste-collection rates: An empirical investigation. Waste Management 139: 217-226.
Saaty TL (2008) Decision making with the analytic hierarchy process. International Journal of Services Sciences 1: 83-98.
Saidani M, Yannou B, Leroy Y, et al. (2019) A taxonomy of circular economy indicators. Journal of Cleaner Production 207: 542-559.
Shooshtarian S, Maqsood T, Caldera S, et al. (2022) Transformation towards a circular economy in the Australian construction and demolition waste management system. Sustainable Production and Consumption 30: 89-106.
Tsui T, Peck D, Geldermans B, et al. (2021) The role of urban manufacturing for a circular economy in cities. Sustainability 13: 23.
Vacchi M, Siligardi C, Cedillo-González EI, et al. (2021) Industry 4.0 and smart data as enablers of the circular economy in manufacturing: Product re-engineering with circular eco-design. Sustainability 13: 10366.
Voukkali I, Papamichael I, Loizia P, et al. (2023) Waste metrics in the framework of circular economy. Waste Management & Research 41: 1741-1753.
Zink T and Geyer R (2017) Circular economy rebound. Journal of Industrial Ecology 21: 593-602.
Zisopoulos FK, Schraven DFJ and de Jong M (2022) How robust is the circular economy in Europe? An ascendency analysis with Eurostat data between 2010 and 2018. Resources, Conservation and Recycling 178: 106032.
Zorpas AA, Navarro-Pedreño J, Panagiotakis I, et al. (2021) Steps forward to adopt a circular economy strategy by the tourism industry. Waste Management & Research 39: 889-891.
Zorpas AA, Voukkali I and Navarro Pedreño J (2018) Tourist area metabolism and its potential to change through a proposed strategic plan in the framework of sustainable development. Journal of Cleaner Production 172: 3609-3620.

  1. Department of Computer, Control and Management Engineering, Sapienza University of Rome, Rome, Italy
    Sapienza University of Rome, Rome, Italy
    Department of Industrial and Information Engineering and Economics, University of L’Aquila, L’Aquila, Italy
    Department of Social Sciences and Business, Roskilde University, Roskilde, Denmark
    Innovation Studies Group, Copernicus Institute of Sustainable Development, Utrecht University, Utrecht, The Netherlands Cambridge Centre for Environment, Energy and Natural Resource Governance, University of Cambridge, Cambridge, UK

    Corresponding author:

    Massimo Gastaldi, Department of Industrial and Information Engineering and Economics, University of L’Aquila, Via Gronchi 18, L’Aquila 67100, Italy.
    Email: massimo.gastaldidunivaq.it