نحو وجهة نظر متحيزة بشكل متزايد حول التغيرات في القطب الشمالي Towards an increasingly biased view on Arctic change

المجلة: Nature Climate Change، المجلد: 14، العدد: 2
DOI: https://doi.org/10.1038/s41558-023-01903-1
تاريخ النشر: 2024-01-22

نحو وجهة نظر متحيزة بشكل متزايد حول التغيرات في القطب الشمالي

تاريخ الاستلام: 6 يونيو 2023
تاريخ القبول: 27 نوفمبر 2023
تاريخ النشر على الإنترنت: 22 يناير 2024
(أ) تحقق من التحديثات

إيفرين لوبيز-بلانكو © , إلمر توب-يورغنسن © , توربين ر. كريستنسن (1) , مورتن راش (1) , هنريك سكوف (1) , ماري ف. أرندال® , م. سندونيا بريت-هارت® , تيري ف. كالاغان (ب) & نيلس م. شميت (ب)

الملخص

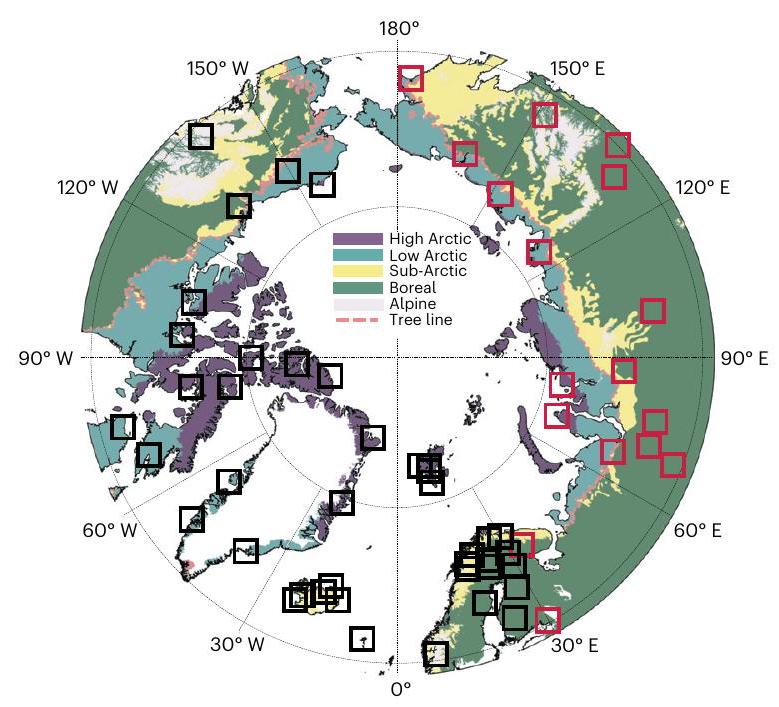
تعيق الغزو الروسي لأوكرانيا القدرة على وصف الظروف عبر القطب الشمالي بشكل كافٍ، مما يسبب تحيزًا في الرؤية حول التغير في القطب الشمالي. هنا نقوم بتقييم تمثيل القطب الشمالي الشامل لأكبر شبكة محطات بحثية في المناطق العالية، INTERACT، مع أو بدون المحطات الروسية. إن استبعاد المحطات الروسية يقلل من التمثيل بشكل ملحوظ، حيث إن بعض التحيزات تكون بنفس حجم التحولات المتوقعة الناتجة عن تغير المناخ بحلول نهاية القرن.

نتيجة للهجوم الروسي على أوكرانيا، استبعد العالم الغربي روسيا من المنتديات الدولية. هذا الصراع الجيوسياسي يتحدى بشدة التعاون عبر الحدود في القضايا العالمية. وهذا واضح بشكل خاص عندما يتعلق الأمر بالقطب الشمالي. روسيا هي أكبر دولة في القطب الشمالي من الناحية الجغرافية، وبالتالي، هي أيضًا واحدة من ثماني دول ضمن مجلس القطب الشمالي، وهو منتدى حكومي للتنسيق بين الأنشطة عبر دول القطب الشمالي (https://arctic-council.org/). ومع ذلك، بعد غزو أوكرانيا، تم تعليق عمل مجلس القطب الشمالي أولاً، وعندما استؤنف حاليًا، فإنه فقط جزئيًا وبدون روسيا.
القطب الشمالي يتغير بسرعة , والعديد من التغيرات الجارية قد يكون لها عواقب عالمية . بينما يمكن تقدير العديد من المؤشرات الرئيسية لتغير المناخ في القطب الشمالي (على سبيل المثال، المراجع 4،5) والاستجابات الناتجة عن المناخ (على سبيل المثال، المراجع 6،7) عن بُعد، فإن الكثير من فهم التغير في القطب الشمالي يعتمد على بيانات في الموقع تم قياسها على الأرض في محطات البحث. نظرًا لأن الملاحظات المستندة إلى الأرض التي تشكل الأساس لتقييم حالة المنطقة ستأتي الآن بشكل رئيسي من الأجزاء غير الروسية من القطب الشمالي، فإن القدرة العامة على مراقبة حالة واتجاه بيئة القطب الشمالي قد تكون محدودة بشدة على المدى المنظور. السؤال هو إلى أي مدى قد يسبب هذا التحدي تحيزًا في الرؤية العامة حول التغير في القطب الشمالي. ومع ذلك، لفهم هذا التحدي بشكل أفضل، يجب الاعتراف بأن الرؤية الحالية حول التغير في القطب الشمالي قد تكون بالفعل متحيزة . القيود اللوجستية والتمويل المحدود طويل الأجل لإجراء الأبحاث و
المراقبة في مناطق شاسعة ونائية أدت إلى إنشاء عدد قليل نسبيًا من محطات البحث المنتشرة عبر القطب الشمالي دون نظام أخذ عينات محدد إحصائيًا بشكل مثالي . لذلك، فإن معظم جمع البيانات المستندة إلى الأرض والمنشورات العلمية الناتجة تكون متجمعة مكانيًا , وقد لا تمثل بالتالي منطقة القطب الشمالي ككل. يبدو أن سيبيريا والقطب الشمالي الكندي ممثلة بشكل خاص بشكل ناقص .
في هذه المراسلة القصيرة، نقيم التحيزات المحتملة الإضافية في الرؤية حول التغيرات الأرضية الحالية والمتوقعة في القطب الشمالي في ظل الصراع الجيوسياسي الحالي. لتحقيق ذلك، نقوم بتحديد مدى تمثيل محطات البحث في القطب الشمالي، مع أو بدون المحطات الروسية، لظروف النظام البيئي على نطاق القطب الشمالي الشامل. نستخدم مجموعة من ثمانية نماذج متطورة لنظام الأرض (ESMs) من مشروع المقارنة بين النماذج المتصلة المرحلة 6 (CMIP6) , المدرجة في التقرير السادس لفريق الخبراء الحكومي المعني بتغير المناخ (IPCC) , عند دقتها المكانية الأصلية (البيانات الموسعة الجدول 1). نركز بشكل خاص على ثمانية متغيرات أساسية غير حيوية وحيوية تصف الظروف الرئيسية في النظم البيئية الأرضية ذات العرض العالي : متوسط درجة حرارة الهواء السنوية، إجمالي هطول الأمطار، عمق الثلج، رطوبة التربة، كتلة النبات، كربون التربة، الإنتاجية الأولية الصافية والتنفس غير الذاتي. هذه المتغيرات الأساسية للنظام البيئي تعمل كمعايير للظروف البيئية الموجودة عبر المنطقة القطبية وحول محطات البحث في القطب الشمالي الواقعة فوق , كما تمثلها شبكة البنية التحتية للقطب الشمالي
الشكل 1| التحولات في التمثيل. آثار استبعاد المحطات البحثية الروسية (الصناديق الحمراء على الخرائط) من شبكة INTERACT بالنسبة لثمانية متغيرات للنظام البيئي (درجة حرارة الهواء، إجمالي هطول الأمطار، عمق الثلج، رطوبة التربة، كتلة النبات، كربون التربة، الإنتاجية الأولية الصافية والتنفس غير الذاتي). تصور الخرائط الظروف المعاصرة فوق . لكل متغير، يتم تصوير التحيزات المحتملة لـ INTERACT بالنسبة للظروف في نطاق القطب الشمالي الشامل من خلال مجموعتين من مخططات الصندوق: [أ] و . يظهر الحد الأقصى للانحراف ( القيم) بين دالتين توزيع تراكميتين (INTERACT مع (I) أو بدون ( ) المحطات الروسية) مقابل نطاق القطب الشمالي المعاصر. يتم عرض الحد الأقصى للانحراف بين النطاق المعاصر مقابل نطاق القطب الشمالي في نهاية القرن بواسطة
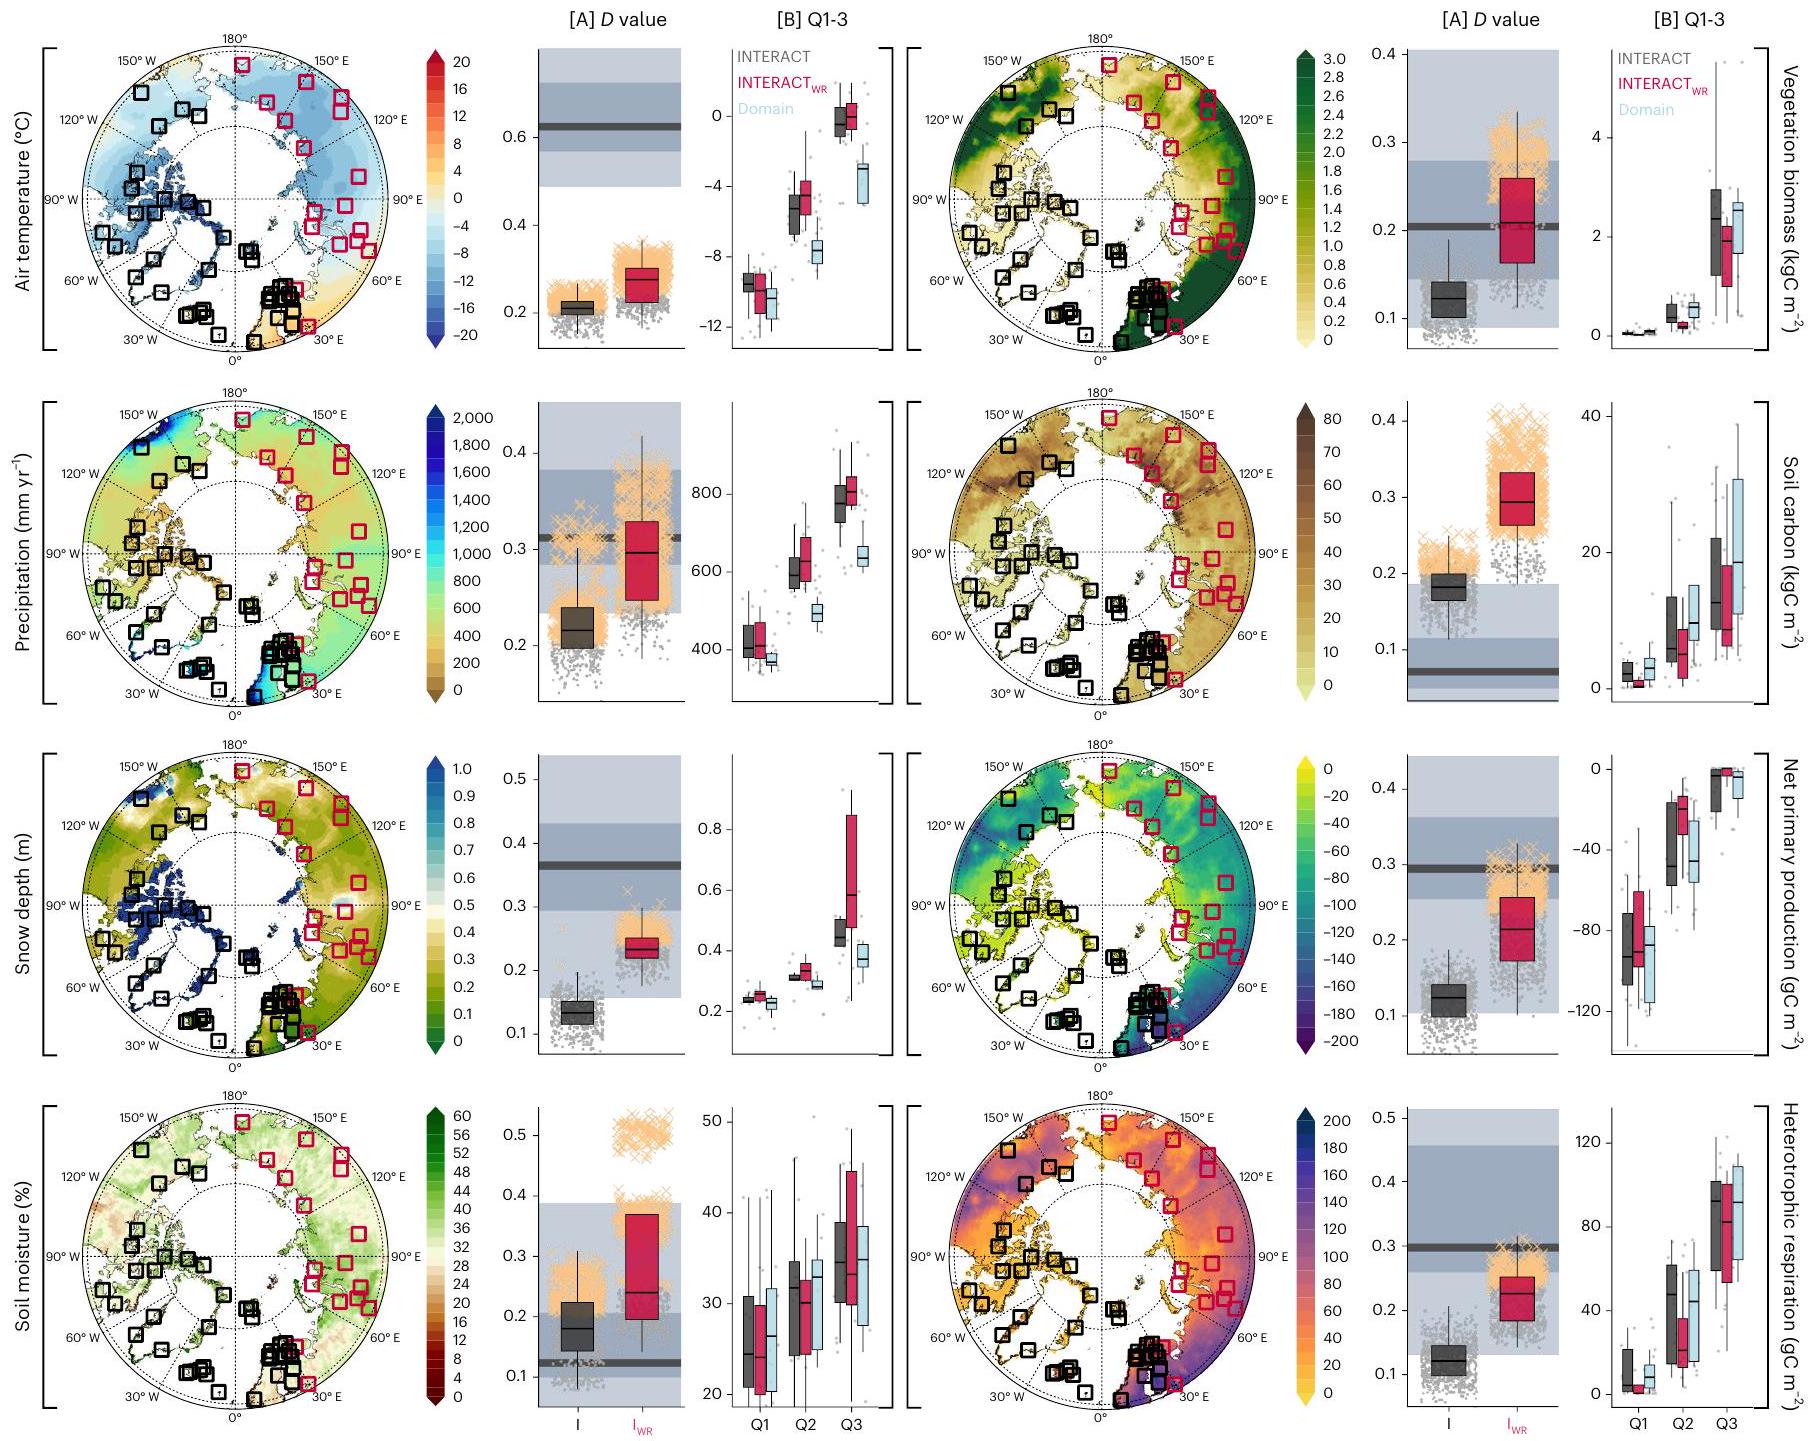
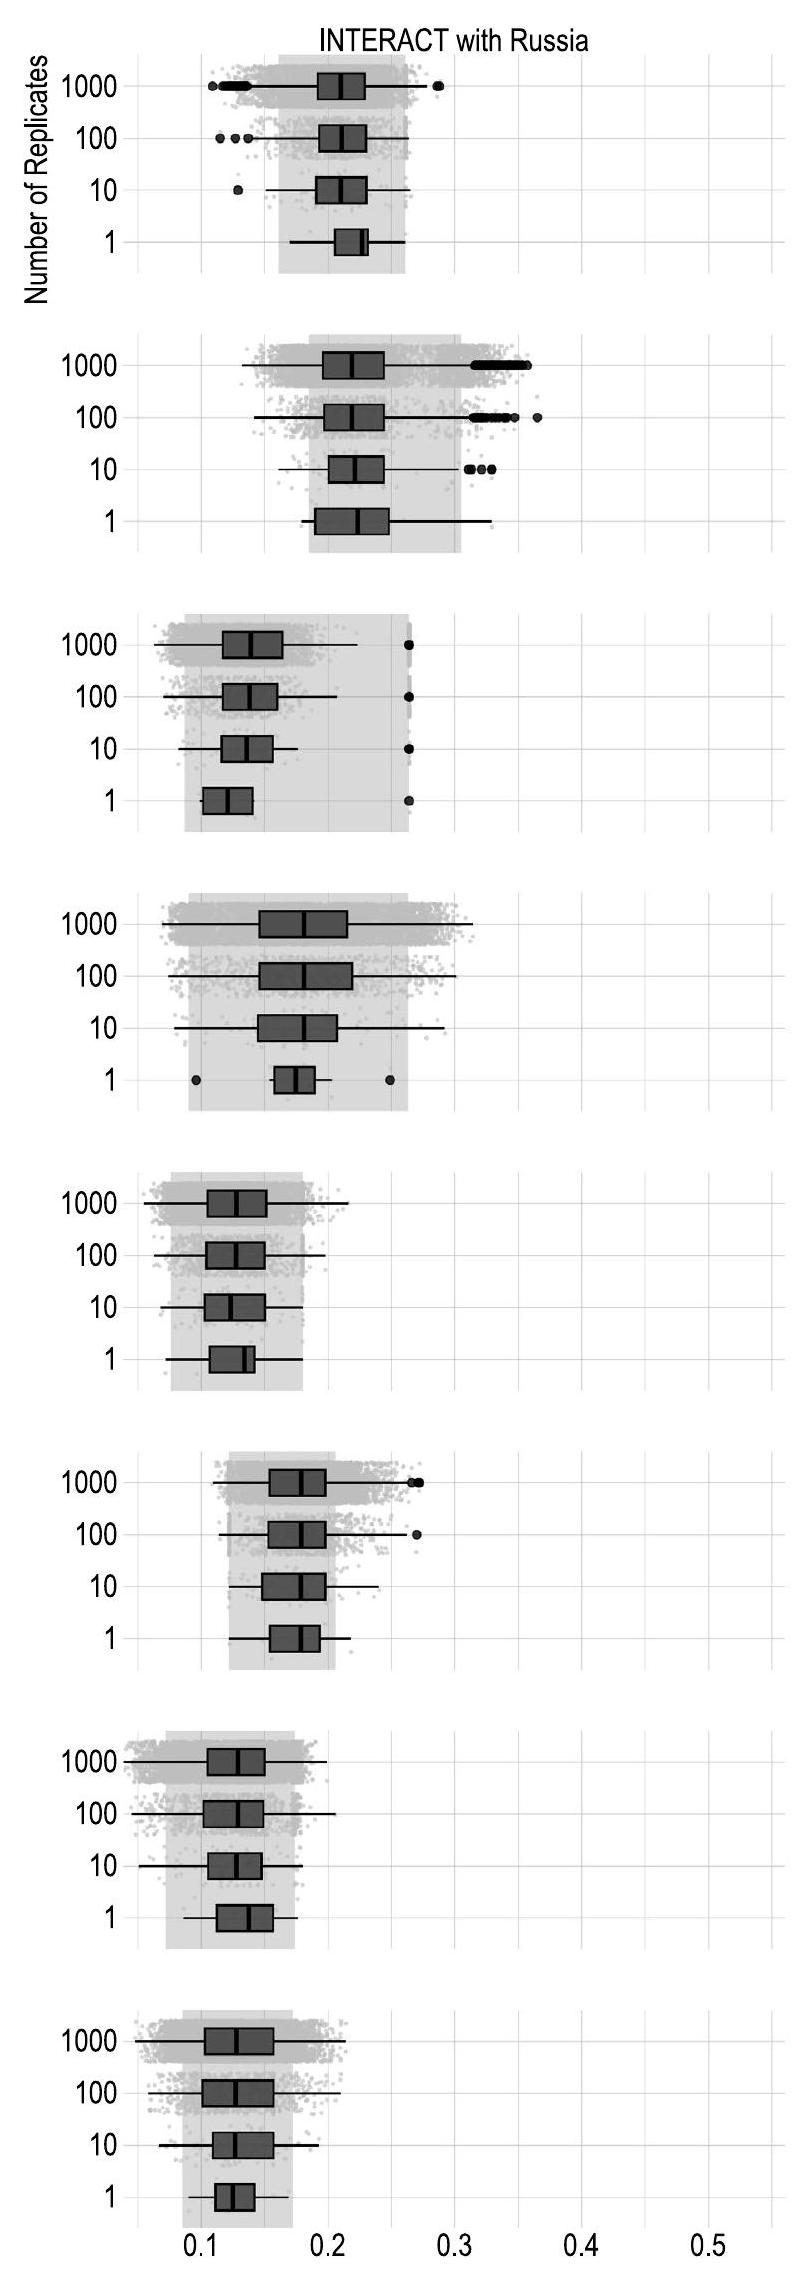
الأشرطة الرمادية الأفقية، مع الألوان الفاتحة والداكنة تمثل الوسيط و و فترات الثقة، على التوالي. [ب] يعرض القيم من الربع 1 إلى 3 لظروف النظام البيئي المعاصرة لـ INTERACT مع (أسود) وبدون (أحمر) المحطات الروسية وكذلك عبر نطاق القطب الشمالي الشامل (أزرق). لاحظ أنه بالنسبة لـ القيم، تساهم كل من النماذج الثمانية ESMs وإعادة أخذ العينات من النطاق في التباين، بينما يكون التباين للربعين 1-3 ناتجًا فقط عن النماذج ESMs. جميع مخططات الصندوق تظهر الوسيط ونطاق الربع (IQR)، مع امتداد الشوكتين العليا والسفلى إلى أكبر قيمة IQR من النسبة المئوية 75 وأصغر القيم IQR من النسبة المئوية 25، على التوالي. تم حذف القيم الشاذة لزيادة قابلية القراءة ولكنها مقدمة في الشكل الموسع 1.
الشبكة الدولية للبحث والمراقبة الأرضية في القطب الشمالي (INTERACT, https://eu-interact.org/) .
مع الاعتراف بأن شبكة INTERACT قد لا تكون ممثلة تمامًا للقطب الشمالي ككل , نقوم أولاً بتحديد أي تحيز للشبكة في تمثيل التباين المكاني المعاصر لظروف النظام البيئي الأساسية غير الحيوية والحيوية عبر منطقة القطب الشمالي الشاملة. ثم نسأل عما إذا كان استبعاد روسيا من INTERACT يبرز أي تحيز محتمل. لتحديد الفجوات بين نطاق القطب الشمالي الشامل ومحطات البحث INTERACT مع أو بدون تلك الموجودة في روسيا، قمنا بحساب مقياسين. أولاً، قمنا بحساب أقصى الفروقات بين دوال التوزيع التراكمية (القيم من اختبارات كولموغوروف-سميرنوف (K-S)) لنطاق القطب الشمالي الشامل ومحطات INTERACT مع أو بدون المحطات الروسية عبر الثمانية CMIP6ESMs لكل من ثمانية متغيرات النظام البيئي (الشكل 1أ).
القيم المهمة ( ) اعتبرت كعدم تمثيل بين شبكة INTERACT مع أو بدون روسيا ومنطقة القطب الشمالي الشاملة. كمعيار للحجم، قمنا بمقارنة هذه القيم مع تلك المستمدة من التحولات المتوقعة في ظروف النظام البيئي بين السنوات 2016-2020 و2096-2100 باستخدام سيناريو المسار الاجتماعي والاقتصادي المشترك (SSP) 5-85. ثانيًا، لتصور التحيزات المحتملة، قمنا أيضًا باستخراج القيم من الربع الأول (25%)، الثاني (الوسيط) والثالث (75%) (Q1-Q3) لدوال التوزيع لكل ESM ومتغير نظام بيئي من محطات البحث INTERACT مع أو بدون المحطات الروسية وقارناها بتلك الموجودة عبر منطقة القطب الشمالي الشاملة (الشكل 1ب). نحن نعترف بأن نماذج النظام البيئي مرتبطة بعدم اليقين (الطرق)، وبالتالي ليست وصفًا مطلقًا للتغير البيئي. ومع ذلك، فإن نماذج النظام البيئي هي أفضل أداة لدينا لاستنتاج
الشكل 2 | فقدان تمثيل المناطق البيئية. تأثير استبعاد المحطات البحثية الروسية من شبكة INTERACT على عدد محطات البحث عبر نطاق المناطق البيئية ذات العرض العالي التي تغطيها الشبكة. تمثل محطات البحث INTERACT في الخريطة بواسطة مربعات، و
تشير المربعات إلى مواقع المحطات الروسية. يوضح الرسم البياني للرادار إلى اليمين عدد المحطات داخل المناطق الإيكولوجية المختلفة، مع تصوير المضلع الأسود لجميع محطات INTERACT والمضلع الأحمر الذي يصور المحطات غير الروسية فقط.
أنماط واسعة النطاق في ظروف النظام البيئي المعاصر بطريقة متسقة ولتوقع المستقبل.
تشير نتائجنا إلى أنه، حتى مع تضمين جميع المحطات الروسية، فإن شبكة INTERACT متحيزة باستمرار لبعض متغيرات النظام البيئي وبالتالي ليست ممثلة تمامًا لظروف النظام البيئي عبر المجال القطبي الشامل (الشكل 1). تقع محطات INTERACT عمومًا في الأجزاء الأكثر دفئًا ورطوبة من القطب الشمالي في مناطق ذات تراكمات ثلجية أعمق عمومًا. كما تقع محطات INTERACT في مناطق ذات كتلة حيوية نباتية وكربون في التربة أقل من منطقة القطب الشمالي ككل. هذا النمط هو نفسه عبر الثلاثة أرباع التي تم فحصها (الشكل 1ب)، مما يشير إلى أن نقص التمثيل لهذه المتغيرات الرئيسية للنظام البيئي متسق عبر مساحة المعلمات. ومن ثم، قد تكون المعرفة المستندة إلى العلوم المجمعة من الأرض متحيزة، حتى عندما تستند إلى بيانات من جميع محطات أبحاث INTERACT في القطب الشمالي. هذا يؤكد نتائج الدراسات السابقة. ومع ذلك، فإن التباين المكاني على نطاق محلي (تحت الشبكة) في ظروف النظام البيئي حول العديد من محطات البحث يعني أن النطاق البيئي الذي تغطيه كل محطة بحثية من INTERACT أوسع مما تم تصويره من خلال تحليلاتنا واسعة النطاق هنا (انظر، على سبيل المثال، المرجع 16). وبالتالي، فإن تحيز التمثيل ربما يكون مختلفًا عما قدرناه هنا، ولكن لا يمكن القول ما إذا كان التباين تحت الشبكة يساهم عمومًا في تحيز أقل أو أعلى. من ناحية أخرى، نظرًا لأن المراقبة الحالية للنظام البيئي التي تتم محليًا في محطات INTERACT ليست منسقة تمامًا أو موحدة، فقد يكون تمثيل الشبكة للمنطقة القطبية الشاملة أقل حتى لبعض المتغيرات. فقط عندما تقيس محطات البحث عبر المنطقة القطبية الشاملة نفس المتغيرات بطريقة متسقة عبر المواقع يمكننا تحقيق فهم أكثر شمولاً وأقل تحيزًا حول التغيرات في القطب الشمالي. وبالتالي، فإن قياسنا للتمثيل هو في الواقع مقياس للتمثيل المحتمل.
تجعل الأمور أكثر تحديًا، فإن استبعاد المحطات الروسية من الشبكة (17 من 60) أدى إلى فقدان ملحوظ آخر للتمثيل عبر تقريبًا جميع متغيرات النظام البيئي، مقارنة بالمتغيرات المودلة للمنطقة القطبية الشاملة ككل. على سبيل المثال، فقدت حوالي نصف محطات INTERACT الموجودة في المنطقة البوريلية مع استبعاد روسيا (الشكل 2)، ومع ذلك، لم يعد يتم تمثيل غابة تايغا الشاسعة في سيبيريا في الشبكة. وهذا يؤدي إلى تحيزات إضافية، خاصة فيما يتعلق بكتلة النبات، مع زيادة متزامنة في التحيز في الإنتاجية الأولية الصافية والتنفس غير الذاتي (الشكل 1أ والبيانات الموسعة الجدول 2). كونها منطقة
تتميز بتغير المناخ السريع ، فإن فقدان محطات البحث في سيبيريا قد يكون ضارًا بشكل خاص للقدرة على تتبع الآثار العالمية لذوبان التربة المتجمدة ، والتحولات في التنوع البيولوجي، بما في ذلك زيادة الشجيرات وديناميات الكربون . من الجدير بالذكر أنه بالنسبة لبعض المتغيرات (على سبيل المثال، هطول الأمطار وكتلة النبات) كانت الزيادة في التعويض من نفس حجم التحولات التي أحدثتها تقريبًا 80 عامًا من التغير المناخي المتوقع (الشكل 1أ).
بسبب العواقب الجيوسياسية للهجوم الروسي على أوكرانيا، تدهورت القدرة على تتبع وتوقع تطور النظام البيئي القطبي بعد التغيرات البيئية الناتجة عن المناخ. ومع ذلك، فإن القدرة على بدء مبادرات إدارة وحفظ مستنيرة جيدًا من شأنها أن تساعد في التخفيف من بعض العواقب السلبية والمخاطر التي كشف عنها تغير المناخ قد انخفضت بشكل كبير. إن فهم الفجوات والتحيزات هو شرط أساسي، على الأقل إلى حد ما، للنظر فيها ومعالجتها، وبالتالي تحسين القدرة على إجراء توقعات موثوقة على الرغم من التغطية غير الكاملة. ومع ذلك، من أجل تتبع القطب الشمالي المتغير بشكل صحيح، يجب على المجتمع الدولي أن يستمر في السعي لإنشاء وتحسين بنية تحتية للبحث وبرامج مراقبة موحدة تمثل القطب الشمالي بأكمله. يجب أن يعزز هذا النظام أيضًا مشاركة البيانات المفتوحة لزيادة الوصول والتماسك. للأسف، حتى يتم تنفيذ ذلك، ستنخفض القدرة على دعم وتقديم المشورة للمجتمعات المحلية والعالمية أكثر بسبب فقدان المحطات الروسية التي تمثل نصف كتلة اليابسة في القطب الشمالي.

المحتوى عبر الإنترنت

أي طرق، مراجع إضافية، ملخصات تقارير Nature Portfolio، بيانات المصدر، بيانات موسعة، معلومات تكميلية، شكر وتقدير، معلومات مراجعة الأقران؛ تفاصيل مساهمات المؤلفين والمصالح المتنافسة؛ وبيانات توفر البيانات والرموز متاحة على https://doi.org/10.1038/s41558-023-01903-1.

References

  1. AMAP Arctic Climate Change Update 2021: Key Trends and Impacts (Arctic Monitoring and Assessment Programme, 2022).
  2. Box, J. E. et al. Key indicators of Arctic climate change: 1971-2017. Environ. Res. Lett. 14, 045010 (2019).
  3. Previdi, M., Smith, K. L. & Polvani, L. M. Arctic amplification of climate change: a review of underlying mechanisms. Environ. Res. Lett. 16, 093003 (2021).
  4. Bintanja, R. et al. Strong future increases in Arctic precipitation variability linked to poleward moisture transport. Sci. Adv. 6, eaax6869 (2020).
  5. Rantanen, M. et al. The Arctic has warmed nearly four times faster than the globe since 1979. Commun. Earth Environ. 3, 168 (2022).
  6. Myers-Smith, I. H. et al. Complexity revealed in the greening of the Arctic. Nat. Clim. Change 10, 106-117 (2020).
  7. Turetsky, M. R. et al. Carbon release through abrupt permafrost thaw. Nat. Geosci. 13, 138-143 (2020).
  8. Metcalfe, D. B. et al. Patchy field sampling biases understanding of climate change impacts across the Arctic. Nat. Ecol. Evol. 2, 1443-1448 (2018).
  9. Virkkala, A. M. et al. Identifying multidisciplinary research gaps across Arctic terrestrial gradients. Environ. Res. Lett. 14, 124061 (2019).
  10. Schmidt, N. M., Christensen, T. R. & Roslin, T. A high arctic experience of uniting research and monitoring. Earths Future 5, 650-654 (2017).
  11. Loescher, H. W. et al. Building a global ecosystem research infrastructure to address global grand challenges for macrosystem ecology. Earths Future 10, e2020EF001696 (2022).
  12. Callaghan, T. V., Cazzolla Gatti, R. & Phoenix, G. The need to understand the stability of arctic vegetation during rapid climate change: an assessment of imbalance in the literature. Ambio 51, 1034-1044 (2022).
  13. O’Neill, B. C. et al. The Scenario Model Intercomparison Project (ScenarioMIP) for CMIP6. Geosci. Model Dev. 9, 3461-3482 (2016).
  14. IPCC Climate Change 2021: The Physical Science Basis (eds Masson-Delmotte, V. et al.) (Cambridge Univ. Press, 2021).
  15. Callaghan, T. V. et al. in Scientific Cooperation Throughout the Arctic: The INTERACT Experience, in the New Arctic (eds Evengård, B. et al.) 269-289 (Springer, 2015).
  16. Pedersen, S. H. et al. Quantifying snow controls on vegetation greenness. Ecosphere 9, e02309 (2018).
  17. Hantemirov, R. M. et al. Current Siberian heating is unprecedented during the past seven millennia. Nat. Commun. 13, 4968 (2022).
  18. Biskaborn, B. K. et al. Permafrost is warming at a global scale. Nat. Commun. 10, 264 (2019).
  19. Frost, G. V. & Epstein, H. E. Tall shrub and tree expansion in Siberian tundra ecotones since the 1960s. Glob. Change Biol. 20, 1264-1277 (2014).
  20. Lin, X. et al. Siberian and temperate ecosystems shape Northern Hemisphere atmospheric seasonal amplification. Proc. Natl Acad. Sci. USA 117, 21079-21087 (2020).
Publisher’s note Springer Nature remains neutral with regard to jurisdictional claims in published maps and institutional affiliations.
Open Access This article is licensed under a Creative Commons Attribution 4.0 International License, which permits use, sharing, adaptation, distribution and reproduction in any medium or format, as long as you give appropriate credit to the original author(s) and the source, provide a link to the Creative Commons license, and indicate if changes were made. The images or other third party material in this article are included in the article’s Creative Commons license, unless indicated otherwise in a credit line to the material. If material is not included in the article’s Creative Commons license and your intended use is not permitted by statutory regulation or exceeds the permitted use, you will need to obtain permission directly from the copyright holder. To view a copy of this license, visit http://creativecommons. org/licenses/by/4.0/.
© The Author(s) 2024

طرق

محطات البحث في القطب الشمالي

مع 94 محطة بحثية في المجموع، منها 21 تقع في روسيا، تعتبر INTERACT (https://eu-interact.org/) أكبر شبكة لمحطات البحث في نصف الكرة الشمالي. تهدف شبكة INTERACT إلى بناء القدرة على توثيق وفهم وتوقع والاستجابة للتغيرات البيئية التي تم تحقيقها من خلال التكامل الوثيق بين البحث والمراقبة. تغطي محطات INTERACT مجموعة واسعة من المناطق المناخية (القطب الشمالي العالي/المنخفض، تحت القطبي، البوريل والألبي) ومناطق التربة المتجمدة (مستمرة، غير مستمرة ومتقطعة). لتمثيل الشبكة في القطب الشمالي بشكل صحيح، حددنا 60 خلية شبكية تحتوي على مواقع محطات INTERACT فوق ، مستبعدين صفيحة غرينلاند الجليدية ومواقع INTERACT الموجودة في سفالبارد التي تشترك في نفس الإحداثيات. تقع سبعة عشر من هذه المحطات في روسيا. تم الحصول على الإحداثيات لمحطات INTERACT من كتالوج محطات INTERACT 2020 (المتوفر على https://eu-interact.org/).

التباين المكاني في متغيرات النظام البيئي

قمنا بتوصيف التباين المكاني لمتغيرات النظام البيئي الرئيسية غير الحية والحية عبر المجال القطبي الشامل باستخدام مقتطفات من ثمانية نماذج مختلفة (البيانات الموسعة الجدول 1) ضمن توقعات CMIP6 المضمنة في تقرير التقييم السادس للهيئة الحكومية الدولية المعنية بتغير المناخ . على الرغم من أن المزيد من نماذج ESM متاحة اليوم، تم اختيار نماذج ESM المضمنة هنا لأنها (1) تشمل جميع متغيرات النظام البيئي ذات الاهتمام (انظر أدناه) و(2) هي عينة متنوعة من معظم نماذج CMIP6 كوظيفة من الحساسية المناخية الفعالة . تم تنزيل مجموعات بيانات CMIP6 من مستودعات البيانات مفتوحة المصدر . كانت النسخة المستخدمة من النماذج الثمانية هي r1i1p1f1 (r، تحقيق/عضو مجموعة؛ i، طريقة التهيئة؛ p، الفيزياء؛ f، القوة) للسماح بالمقارنة المناسبة.
قمنا بتقييم التباين المكاني في ثمانية متغيرات رئيسية للنظام البيئي: درجة حرارة الهواء ( )، إجمالي هطول الأمطار (مم في السنة)، عمق الثلج (م)، رطوبة التربة (%)، كتلة النبات ( )، كربون التربة ( )، الإنتاجية الأولية الصافية ( ) والتنفس غير الذاتي ( ). لا تميز هذه المتغيرات فقط التباين المكاني في ظروف النظام البيئي ولكنها معروفة أيضًا بأنها تخضع لتغيرات سريعة عبر المنطقة القطبية الشاملة . تم تحفيز اختيار المتغيرات من خلال الاتجاهات الرئيسية الأخيرة والتأثيرات الناتجة عن تغير المناخ في القطب الشمالي التي تم الإبلاغ عنها في تقرير تحديث تغير المناخ في القطب الشمالي 2021: الاتجاهات الرئيسية والتأثيرات . على سبيل المثال، تعتبر درجة حرارة الهواء مؤشرًا ممتازًا يجمع محليًا بين ميزانيات الطاقة السطحية والجو (العمودية والأفقية). لقد ارتفعت درجات الحرارة في القطب الشمالي ثلاث إلى أربع مرات مقارنة بالعالم، بزيادة قدرها خلال الفترة من 1971 إلى 2019 وفقًا لمجموعة بيانات EU Copernicus ERA5 الشهرية. إن إجمالي هطول الأمطار، جنبًا إلى جنب مع درجات حرارة الهواء، هي محركات التغيير للعديد من مكونات النظام البيئي. إن هطول الأمطار في القطب الشمالي في تزايد تقريبًا في نفس الفترة ويقوده زيادة بنسبة 25% في هطول الأمطار تعوض عن فقدان الغطاء الثلجي. . النظام القطبي عادة ما يكون مغطى بالثلوج في أشهر الشتاء، مما يجعل مواسم الكتف (الربيع والخريف) حساسة بشكل خاص للتغيرات الناتجة عن الاحترار. لقد انخفضت مساحة تغطية الثلوج بين مايو ويونيو بنسبة 21% خلال الفترة من 1971 إلى 2019 ; هذه نسبة فقدان أكبر من فقدان الجليد البحري في سبتمبر. كل من هطول الأمطار وديناميات الثلوج هي من بين العوامل الرئيسية التي تؤثر على توفر رطوبة التربة، والتي في نفس الوقت لها آثار مهمة على فينولوجيا النباتات وإنتاجيتها . لقد زادت خضرة التندرا بنسبة بين عامي 1982 و2019 على الرغم من أن بعض المناطق تظهر اصفرارًا . يمكن أن تزيد التندرا الأكثر خضرة من تخزين الكربون المتراكم ومؤشر مساحة الأوراق مما يعزز القدرة على التمثيل الضوئي ويحفز تدفقات الكربون الإجمالية الأعلى ولكن لها أيضًا آثار مهمة على ميزانية الطاقة لسطح الأرض كما هو الحال مع تقليل تغطية الثلوج في الربيع . أخيرًا، تمثل كتلة الكربون الأرضية في القطب الشمالي حوالي 50% من كتلة الكربون العضوي في التربة العالمية – يمكن أن تؤدي التغيرات في درجة حرارة التربة وديناميات التربة المتجمدة إلى آثار قوية على إطلاق الغازات الدفيئة في الغلاف الجوي والتغذية الراجعة للمناخ العالمي .
لجميع متغيرات النظام البيئي ولكل نموذج من نماذج المحاكاة البيئية، قمنا بتجميع ومعالجة معلومات مجمعة شهرية عبر نطاق القطب الشمالي. لوصف الظروف البيئية المعاصرة، استخدمنا متوسطات السنوات 2016-2020. للسماح بمقارنة التغيرات المكانية مقابل الزمنية (انظر أدناه)، قمنا أيضًا بتقدير التباين المكاني في ثمانية معلمات بيئية بحلول نهاية القرن الحادي والعشرين (2096-2100) لكل نموذج. استخدمنا سيناريو انبعاثات غازات الدفيئة SSP 5-85، والذي يعادل مسار التركيز التمثيلي السابق 8.5 في تقرير التقييم الخامس للهيئة الحكومية الدولية المعنية بتغير المناخ. ركزنا على هذا السيناريو المعتاد حيث تم العثور مؤخرًا على أننا قريبون جدًا من الجزء العلوي، إن لم نتجاوز، أكثر التوقعات تطرفًا على الأقل حتى منتصف القرن الحادي والعشرين .
من المنتجات العالمية المجمعة الشهرية لنماذج المحاكاة البيئية CMIP6، قمنا بعد ذلك بقص خطوط العرض تحت واستبعدنا تغطية الجليد في غرينلاند . تم الاحتفاظ بدقة الفضاء لنماذج المحاكاة البيئية الفردية.

تحليل البيانات

لتقييم تمثيل محطات INTERACT للمنطقة القطبية الشمالية بأكملها، قمنا بحساب توزيع الكثافة لكل متغير بيئي غير حيوي وحيوي. كظروف معاصرة ومستقبلية، استخدمنا المتوسط عبر السنوات 2016-2020 و2096-2100، على التوالي. أولاً، قمنا بتقدير توزيعات الكثافة (الشكل البياني الممتد 2) لـ INTERACT مع تضمين جميع المحطات، ثم مع استبعاد جميع المحطات الروسية. لوصف الظروف الأساسية عبر نطاق القطب الشمالي، قمنا بأخذ عينة عشوائية من نفس عدد خلايا الشبكة من جميع نماذج المحاكاة البيئية، بغض النظر عن دقتها المكانية الأصلية، تساوي أصغر حجم سكاني بين جميع النماذج (أي CanESM5 مع 496 نقطة بيانات، مستبعدين البكسلات التي تحتوي على المحيط وجليد غرينلاند؛ الجدول الممتد 1). لتقليل الآثار المحتملة الناجمة عن اختيار حجم العينة بشكل تعسفي، استرجعنا 100 تكرار من عينة السكان العشوائية من 496 نقطة بيانات لكل نموذج ومتغير. يمكن العثور على تحليل حساسية بسيط يقيم تأثير عدد العينات وعدد التكرارات على إحصائيات K-S في الشكل البياني الممتد 3.
لوصف أي انحياز بين ظروف النظام البيئي بين INTERACT مع وبدون المحطات الروسية ونطاق القطب الشمالي بشكل أكبر، استخدمنا القيم من اختبارات K-S غير المعلمية كمقياس لأقصى انحراف بين توزيعات الكثافة (الشكل 1a). تمثل القيم أقصى مسافة عمودية بين دالة التوزيع التراكمي الموصوفة بواسطة شبكة INTERACT (مع أو بدون روسيا) ودالة التوزيع التراكمي التي تصف نطاق القطب الشمالي. الفرضية الصفرية هي أن كلا المجموعتين تم أخذ عينات منها من توزيعات متطابقة، وبالتالي تشير اختبارات K-S المهمة إلى أن التوزيعات تختلف. كمعيار لحجم الانحياز المحتمل، استخدمنا القيم المستمدة من مقارنة التحولات المتوقعة في ظروف النظام البيئي بين السنوات 2016-2020 و2096-2100 (انظر أعلاه). لتصور الانحيازات المحتملة بشكل أكبر، استخرجنا الربع الأول والثاني (الوسيط) والثالث (Q1-Q3) من توزيعات الكثافة، كمؤشرات عامة لظروف النظام البيئي في محطات INTERACT (مع وبدون المحطات الروسية) وعبر المنطقة القطبية الشمالية (الشكل 1b).
لتصور آثار استبعاد روسيا من INTERACT كفقدان تمثيل المناطق البيئية عبر المنطقة القطبية الشمالية، قمنا بحساب توزيع محطات INTERACT لكل منطقة بيئية مع وبدون المحطات الروسية. تم تعريف المناطق البيئية في الشكل 2 على النحو التالي: (1) تغطي منطقة القطب الشمالي المرتفعة المناطق الفرعية المناخية A وB وC، من خريطة الغطاء النباتي القطبية (CAVM؛ متاحة في المرجع 31)، (2) تغطي منطقة القطب الشمالي المنخفضة المناطق الفرعية D وE من CAVM و(3) منطقة شبه القطب الشمالي مشتقة من منطقة غابة التندرا في تصنيف المناطق البيئية 2017 (متاحة على https://ecoregions. appspot.com/) الواقعة تحت خط الأشجار. كانت المنطقة البورية تتوافق مع المنطقة الفرعية للغابات البورية في تصنيف المناطق البيئية 2017، وكانت المنطقة الجبلية تغطي الارتفاعات فوق ولكن تحت خط الأشجار. تم اشتقاق الأخيرة من منتج ArcticDEM (متاحة في المرجع 34).

تحذيرات تحليل البيانات

إن دمج المعلومات الميدانية في الموقع يحمل القدرة على تقليل عدم اليقين المتوقع المرتبط بنوع التحليل المقدم في هذه الورقة. تتوفر الآن وفرة متزايدة من البيانات طويلة الأجل ذات الجودة العالية والفحص الزمني من خلال المستودعات عبر الإنترنت لكل من الأوراق العلمية والبيانات (على سبيل المثال، الشبكات العلمية الموضوعية مثل FLUXNET، والرابطة الدولية للتربة المتجمدة وما إلى ذلك). ومع ذلك، لا يزال هناك فجوة كبيرة فيما يتعلق بنهج موحد ومنسق لتوحيد ودمج بيانات المراقبة المتنوعة من مصادر مختلفة (تمتد عبر البلدان أو التخصصات)، كما تم تسليط الضوء عليه في المراجع 8،9. علاوة على ذلك، فإن غياب المنهجيات الموحدة (مثل العلامات التجارية للأدوات، وحدات المتغيرات أو الدقة الزمنية) بين محطات البحث يمثل تحديًا للمقارنات الشاملة لبيانات الميدان في الموقع.
بالإضافة إلى ذلك، بينما تتوفر منتجات مكانية قوية، مثل إعادة تحليل المناخ (على سبيل المثال، ERA5 (المرجع 35))، ومنتجات الاستشعار عن بعد (على سبيل المثال، مبادرة تغير المناخ ESA للمتغيرات المتعلقة بالنباتات مثل الكتلة الحيوية ) وتقديرات مستمدة من التعلم الآلي (على سبيل المثال، FLUXCOM لتدفقات الكربون الأرضية )، من المهم الاعتراف بأن هذه المجموعات من البيانات مرتبطة بانحيازات وعدم يقين متأصلة (كما تم تسليط الضوء عليه في، على سبيل المثال، المرجع 38). وبالمثل، يمكن أن تؤثر التمارين من أسفل إلى أعلى من خرائط تصنيف نوع الغطاء الأرضي/النباتات، على الرغم من قيمتها في التوسع، على قضايا التباين وعدم اليقين، مما يؤدي إلى انحيازات محتملة عند الاستقراء من مثل هذه التحليلات.
تظل نماذج المناخ المترابطة هي الأدوات الأفضل والأكثر توفرًا حاليًا لتقييم التحولات والاتجاهات في نظام المناخ المستقبلي ، جنبًا إلى جنب مع الاستجابات البيئية المرتبطة بها وحلقات التغذية الراجعة . بينما توفر نماذج المناخ واسعة النطاق تقديرات عددية موثوقة ومقنعة للسيناريوهات الماضية القريبة والمستقبلية على نطاق إقليمي إلى عالمي ، فإن الاختلافات في أداء النماذج بعيدة عن الكمال على سبيل المثال، تنشأ عدم اليقين في النماذج من مصادر متنوعة، بما في ذلك الاختلافات في هيكل النموذج والمعلمات (على سبيل المثال، المرجع 42)، والضغط الخارجي (على سبيل المثال، المرجع 43) وسيناريوهات الانبعاثات (على سبيل المثال، المرجع 44). مثل هذه القيود تُدخل عدم اليقين على كل من العمليات الجوية (على سبيل المثال، المراجع 45، 46) وعمليات النظام البيئي (على سبيل المثال، المراجع 47، 48)، وخاصة تلك المتعلقة بالأرض (على سبيل المثال، المراجع 38، 49). حالياً، لا يزال دورة الكربون الأرضية هي العنصر الأقل تقييداً في الميزانية العالمية للكربون (على سبيل المثال، المرجع 50). على سبيل المثال، تأخذ النماذج في الاعتبار حالات التوازن، ولكن تم الاعتراف منذ الثمانينيات بأن الأنواع النباتية من غير المحتمل أن تعيد توطينها بالسرعة التي تتناسب مع أغطية المناخ المناسبة لها (على سبيل المثال، المرجع 51). أيضاً، تفرط نماذج حركة خط الأشجار في تقدير إعادة التوطين العرضي بمقدار يصل إلى 2000 مرة. . نتيجة لذلك، ستبقى بعض النباتات في أغطية مناخية ليست متكيفة معها وستتعرض/تتعرض لتأثيرات الأحداث المتطرفة. هذه التأثيرات لها تداعيات محلية. ، وبعضها له تأثيرات إقليمية، على سبيل المثال، حركة خط الأشجار المحيط بالقطب الشمالي وتأثيرات ذوبان الجليد الدائم على ديناميات الأراضي الرطبة والنباتات/ التنوع البيولوجي .

توفر البيانات

يمكن الوصول إلى جميع مجموعات بيانات نمذجة CMIP6 المستخدمة في هذه الدراسة وتنزيلها مجانًا من مستودعات ESGF (على سبيل المثال، https:// esgf-node.llnl.gov/projects/cmip6/ و https://esgf-data.dkrz.de/ البحث/cmip6-dkrz/). مواقع محطات البحث في القطب الشمالي متاحة على بوابة INTERACT GIS https://www.interact-gis.org/Home/المحطات. تم توفير مجموعات البيانات المصدر التي تم إنشاؤها و/أو تحليلها خلال الدراسة الحالية، والتي تتوافق مع كل شكل وجدول. أي بيانات إضافية متاحة من المؤلف المراسل. تم توفير بيانات المصدر مع هذه الورقة.

توفر الشيفرة

النص المستخدم في هذه الدراسة لقياس أقصى الفروقات في دوال التوزيع التراكمي و قيم من اختبارات)
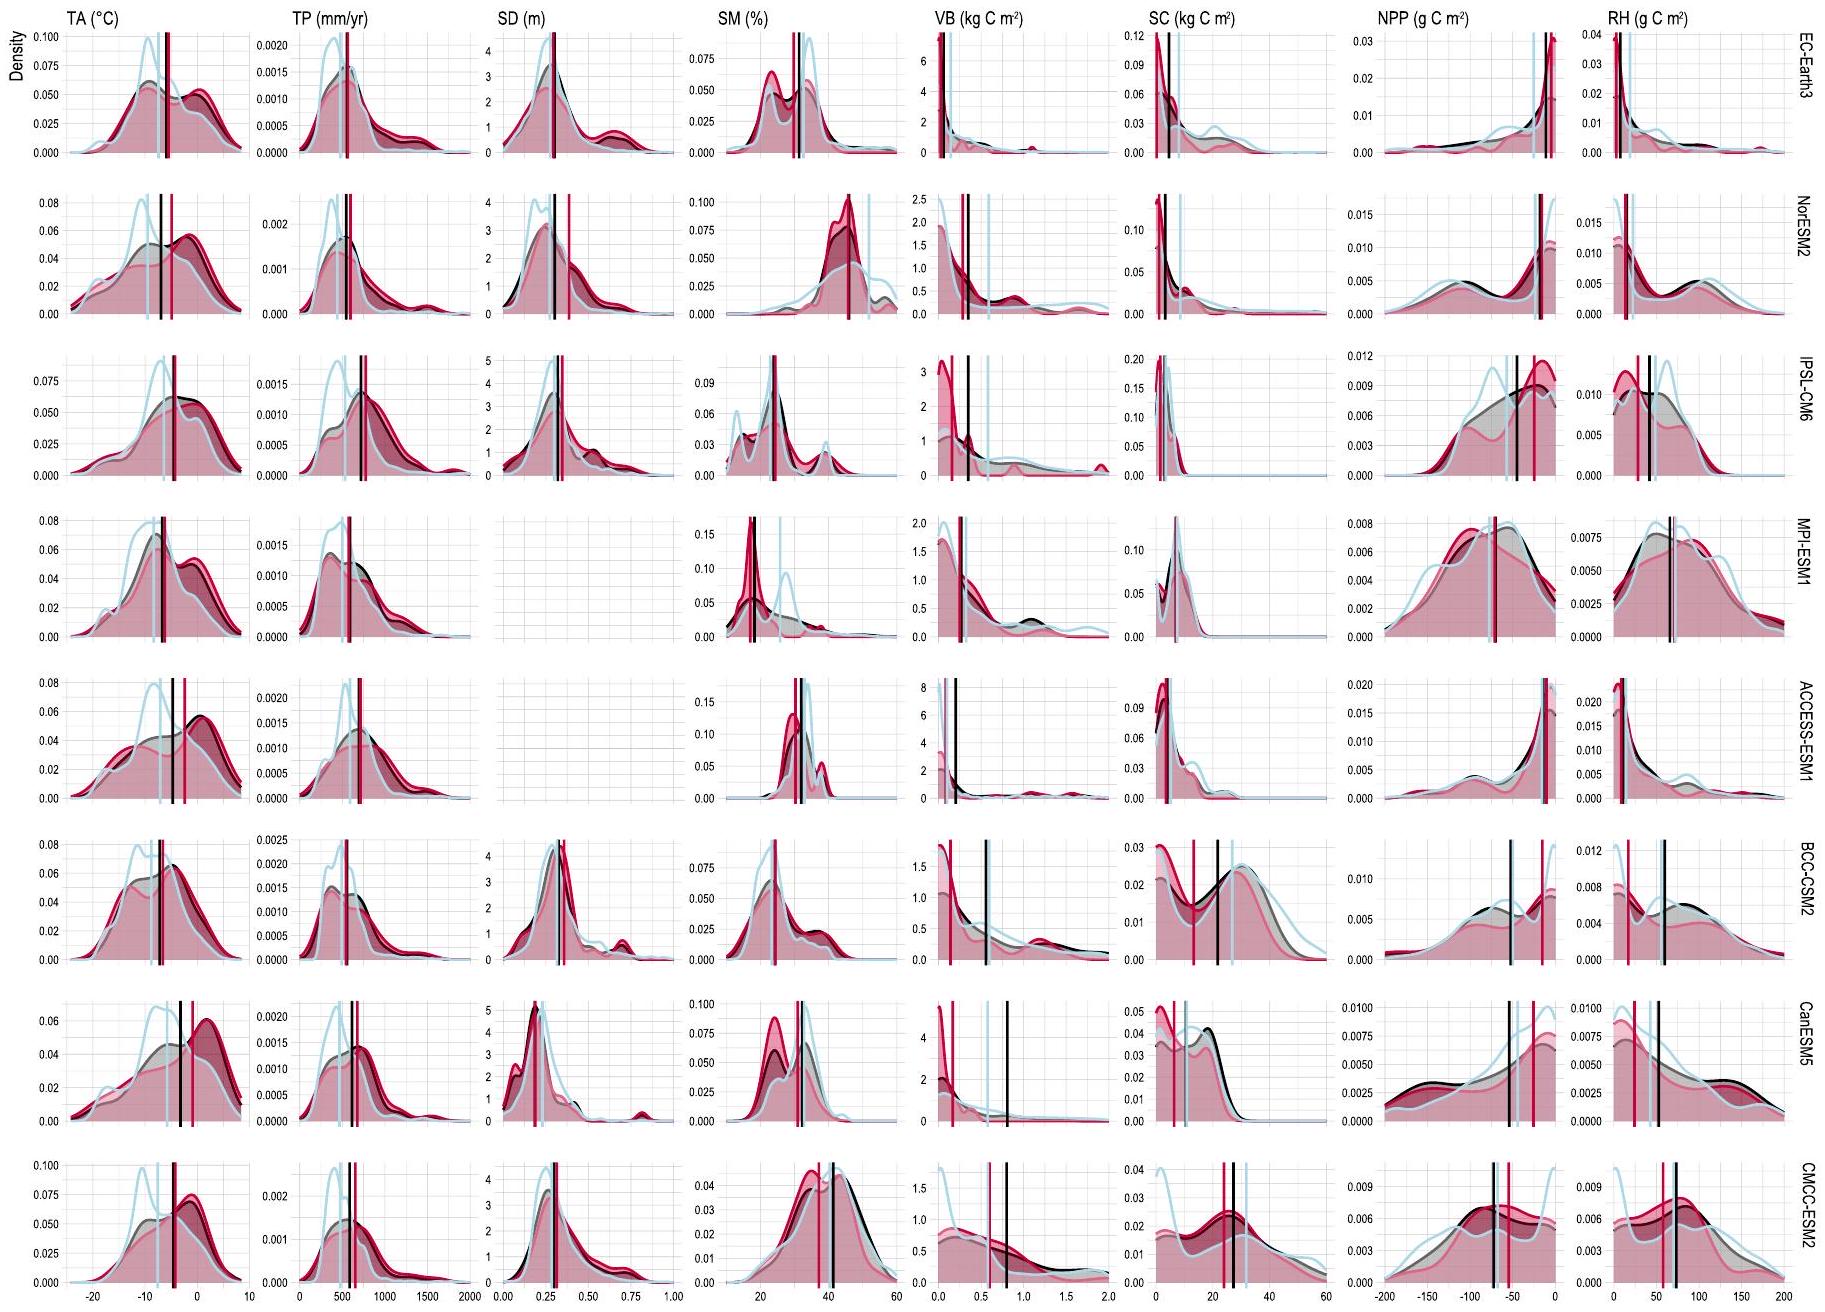
بين مجموعات العينات المختلفة (النطاق القطبي الشامل ومحطات INTERACT، مع أو بدون المحطات الروسية)، واستخراج قيم الربعيات (Q1-Q3) لدوال التوزيع لنفس المجموعات، متاحة في مستودع GitHub علىhttps://github. com/EfrenLB/KST.

References

  1. Gregory, J. M. et al. A new method for diagnosing radiative forcing and climate sensitivity. Geophys. Res. Lett. 31, LO32O5 (2004).
  2. WCRP Coupled Model Intercomparison Project (Phase 6) (World Climate Research Programme, 2021); https://esgf-node.llnl.gov/ projects/cmip6/
  3. WCRP Coupled Model Intercomparison Project (Phase 6) ESGF-DATA.DKRZ. DE node (World Climate Research Programme, 2021); https://esgf-data.dkrz.de/search/cmip6-dkrz/
  4. Zona, D. et al. Pan-Arctic soil moisture control on tundra carbon sequestration and plant productivity. Glob. Change Biol. 29, 1267-1281 (2022).
  5. López-Blanco, E. et al. The future of tundra carbon storage in Greenland-sensitivity to climate and plant trait changes. Sci. Total Environ. 846, 157385 (2022).
  6. Oehri, J. et al. Vegetation type is an important predictor of the Arctic summer land surface energy budget. Nat. Commun. 13, 6379 (2022).
  7. Hugelius, G. et al. Estimated stocks of circumpolar permafrost carbon with quantified uncertainty ranges and identified data gaps. Biogeosciences 11, 6573-6593 (2014).
  8. Schuur, E. A. G. et al. Climate change and the permafrost carbon feedback. Nature 520, 171-179 (2015).
  9. Citterio, M. & Ahlstrøm, A. P. Ice Extent (GEUS Dataverse, 2022).
  10. Walker, D. A. et al. The Circumpolar Arctic vegetation map. J. Veget. Sci. 16, 267-282 (2005).
  11. Circumpolar Arctic Vegetation Mapping Project (Alaska Geobotany Center, 2023); https://www.geobotany.uaf.edu/cavm/
  12. Dinerstein, E. et al. An ecoregion-based approach to protecting half the terrestrial realm. BioScience 67, 534-545 (2017).
  13. Porter, C. et al. ArcticDEM—Mosaics, Version 4.1 (Polar Geospatial Center, 2023).
  14. ArcticDEM (Univ. Minnesota, 2023); https://www.pgc.umn.edu/ data/arcticdem/
  15. Hersbach, H. et al. The ERA5 global reanalysis. Q. J. R. Meteorol. Soc. 146, 1999-2049 (2020).
  16. Santoro, M. & Cartus, O. ESA Biomass Climate Change Initiative (Biomass_cci): global datasets of forest above-ground biomass for the years 2010, 2017 and 2018, v3. NERC EDS Centre for Environmental Data Analysis https://doi.org/10.5285/5f331c418e9f 4935b8eb1b836f8a91b8 (2021).
  17. Jung, M. et al. Scaling carbon fluxes from eddy covariance sites to globe: synthesis and evaluation of the FLUXCOM approach. Biogeosciences 17, 1343-1365 (2020).
  18. López-Blanco, E. et al. Evaluation of terrestrial pan-Arctic carbon cycling using a data-assimilation system. Earth Syst. Dyn. 10, 233-255 (2019).
  19. van den Hurk, B. et al. LS3MIP (v1.0) contribution to CMIP6: the Land Surface, Snow and Soil moisture Model Intercomparison Project-aims, setup and expected outcome. Geosci. Model Dev. 9, 2809-2832 (2016).
  20. Jones, C. D. et al. C4MIP-The Coupled Climate-Carbon Cycle Model Intercomparison Project: experimental protocol for CMIP6. Geosci. Model Dev. 9, 2853-2880 (2016).
  21. Fisher, J. B. et al. Missing pieces to modeling the Arctic-Boreal puzzle. Environ. Res. Lett. 13, 020202 (2018).
  22. Hou, E. et al. Across-model spread and shrinking in predicting peatland carbon dynamics under global change. Glob. Change Biol. 29, 2759-2775 (2023).
  23. Fyfe, J. C. et al. Significant impact of forcing uncertainty in a large ensemble of climate model simulations. Proc. Natl Acad. Sci. USA 118, e2016549118 (2021).
  24. Nishina, K. et al. Decomposing uncertainties in the future terrestrial carbon budget associated with emission scenarios, climate projections, and ecosystem simulations using the ISI-MIP results. Earth Syst. Dyn. 6, 435-445 (2015).
  25. Im, U. et al. Present and future aerosol impacts on Arctic climate change in the GISS-E2.1 Earth system model. Atmos. Chem. Phys. 21, 10413-10438 (2021).
  26. McCrystall, M. R. et al. New climate models reveal faster and larger increases in Arctic precipitation than previously projected. Nat. Commun. 12, 6765 (2021).
  27. Carvalhais, N. et al. Global covariation of carbon turnover times with climate in terrestrial ecosystems. Nature 514, 213-217 (2014).
  28. Luo, Y., Keenan, T. F. & Smith, M. Predictability of the terrestrial carbon cycle. Glob. Change Biol. 21, 1737-1751 (2015).
  29. Virkkala, A.-M. et al. Statistical upscaling of ecosystem fluxes across the terrestrial tundra and boreal domain: regional patterns and uncertainties. Glob. Change Biol. 27, 4040-4059 (2021).
  30. Friedlingstein, P. et al. Global carbon budget 2022. Earth Syst. Sci. Data 14, 4811-4900 (2022).
  31. ACIA Arctic Climate Impact Assessment (Cambridge Univ. Press, 2005).
  32. Van Bogaert, R. et al. A century of tree line changes in sub-Arctic Sweden shows local and regional variability and only a minor influence of 20th century climate warming. J. Biogeogr. 38, 907-921 (2011).
  33. Schmidt, N. M. et al. An ecosystem-wide reproductive failure with more snow in the Arctic. PLoS Biol. 17, e3000392 (2019).
  34. Rees, W. G. et al. Is subarctic forest advance able to keep pace with climate change? Glob. Change Biol. 26, 3965-3977 (2020).
  35. Smith, L. C. et al. Disappearing Arctic lakes. Science 308, 1429-1429 (2005).

شكر وتقدير

تم دعم هذا العمل من قبل الشبكة الدولية للبحث والمراقبة الأرضية في القطب الشمالي (INTERACT،https://eu-interact.org/) الممول من برنامج البحث والابتكار HORIZON2020 التابع للاتحاد الأوروبي بموجب رقم اتفاقية المنحة 871120. نحن نُقر ببرنامج أبحاث المناخ العالمي، الذي قام، من خلال مجموعة العمل المعنية بالنمذجة المترابطة، بتنسيق وتعزيز CMIP6.
نشكر مجموعات نمذجة المناخ على إنتاجها وتوفير مخرجات نماذجها، ورابطة أرشيف بيانات نظام الأرض (ESGF) على أرشفتها للبيانات وتوفير الوصول إليها، والوكالات التمويلية المتعددة التي تدعم CMIP6 وESGF. نُعطي الفضل لمركز جيوبوتاني ألاسكا على خريطة الغطاء النباتي القطبية الشمالية الأصلية (CAVM). نعترف بالـ DEM الذي أنشأه مشروع ArcticDEM الممول من مركز الجغرافيا القطبية بموجب جوائز NSF-OPP 1043681، 1559691، 1542736، 1810976 و2129685. تم دعم E.L.-B. من قبل منحة مجلس أبحاث غرينلاند (GRC) رقم 80.35، الممولة من “البرنامج الدنماركي للبحث في القطب الشمالي”. يعتبر E.L.-B. وT.R.C. هذه الدراسة مساهمة في GreenFeedBack (تدفقات غازات الدفيئة والتغذية المرتدة لنظام الأرض) الممولة من برنامج البحث والابتكار HORIZON التابع للاتحاد الأوروبي بموجب اتفاقية المنحة رقم 101056921. يعتبر H.S. هذه الدراسة مساهمة في منحة AMAP Core Atmosphere رقم 2021-60333.

مساهمات المؤلفين

صمم E.L.-B. و N.M.S. الدراسة بناءً على مناقشات بين جميع المؤلفين. قام E.L.-B. بتحليل البيانات وأجرى التحليلات الإحصائية. قام E.L.-B. و N.M.S. بصياغة الورقة بمشاركة من جميع المؤلفين المشاركين. قرأ جميع المؤلفين ووافقوا على النسخة النهائية من الورقة.

المصالح المتنافسة

يعلن المؤلفون عدم وجود مصالح متنافسة.

معلومات إضافية

البيانات الموسعة متاحة لهذا البحث في
https://doi.org/10.1038/s41558-023-01903-1.
معلومات إضافية النسخة الإلكترونية
يتضمن مواد إضافية متاحة في
https://doi.org/10.1038/s41558-023-01903-1.
يجب توجيه المراسلات والطلبات للحصول على المواد إلى إيفرين لوبيز-بلانكو.
تشكر مجلة Nature Climate Change رولف إيمس، وماريسول مادوكس، ومارتين بالاندت، والمراجعين الآخرين المجهولين على مساهمتهم في مراجعة الأقران لهذا العمل.
معلومات إعادة الطباعة والتصاريح متاحة علىwww.nature.com/reprints.
البيانات الموسعة الجدول 1 | قائمة بمحاكيات ESM المستخدمة في التحليل (البيانات الوصفية مستمدة من https://wcrp-cmip.github.io/ CMIP6_CVs/docs/CMIP6_source_id.html)
معرف النموذج أصل معرّف المؤسسة نموذج الغلاف الجوي نموذج الهباء الجوي نموذج سطح الأرض والنباتات الدقة المكانية
EC-Earth3-CC أوروبا اتحاد EC-Earth IFS cy36r4 (TL255؛ ; 91 مستوى) HTESSEL (نموذج سطح الأرض المبني في IFS) و LPJ-GUESS v4
نورESM2-MM النرويج المركز النرويجي للمناخ كام-أوسلو (1 درجة؛ ; 32 مستوى) أوسلو أيرو CLM5
ACCESS-ESM1-5 أستراليا منظمة الكومنولث للبحوث العلمية والصناعية HadGAM2 (r1.1; N96; 192х145; 38 250 كم مستويات) كلاسيك (الإصدار 1.0) كابل 2.4
بي سي سي – سي إس إم 2 – إم آر الصين مركز بكين للمناخ بي سي سي _ أي جي سي إم 3 _ إم آر (تي 106؛ المستويات) بي سي سي _ أفي إم 2
CanESM5 كندا المركز الكندي لنمذجة المناخ والتحليل CanAM5 (T63L49؛ ; 49 مستوى) تفاعلي فئة 3.6/CTEM 1.2
CMCC-ESM2 إيطاليا المركز الأوروبي المتوسطي لتغير المناخ CAM5.3 (1 درجة؛ ; 30 مستوى) CLM4.5 (وضع BGC)
IPSL-CM6A-LR فرنسا معهد بيير سيمون لابلاس LMDZ (N96؛ المستويات) أوركيد (الإصدار 2.0، وضع الماء/الكربون/الطاقة)
MPI-ESM1-2-LR ألمانيا معهد ماكس بلانك إيشام v6.3 (T63؛ ، 47 مستوى) لا شيء، تم وصف MACv2-SP JSBACH3.20
البيانات الموسعة الجدول 2 | ملخص للقيم المتوسطة Q1-3 والقيم المتوسطة KS D للمتغيرات البيئية الثمانية (درجة حرارة الهواء، TA؛ إجمالي هطول الأمطار، TP؛ عمق الثلج، SD؛ ورطوبة التربة، SM؛ الكتلة الحيوية للنباتات، VB؛ كربون التربة، SC؛ الإنتاجية الأولية الصافية، NPP؛ والتنفس غير الذاتي، RH). تشير “INTERACT” إلى شبكة INTERACT مع جميع المحطات أعلاه مضمن، ‘تفاعل ‘ إلى شبكة INTERACT بدون المحطات الروسية، و ‘Arctic 2020’ إلى الظروف البان-أركتيكية خلال الفترة 2016-2020. تشير ‘Arctic 2100’ إلى التحول المتوقع في ظروف النظام البيئي بين المعاصرة (2016-2020) والمستقبلية (2096-2100)
متغير تفاعل تفاعل القطب الشمالي 2020
الربع الثاني (الوسيطات) تاس ) -5.32 -4.57 -7.7
علاقات عامة ( ) ٥٨٨ 625 ٤٩٠
SD (م) 0.302 0.33 0.277
نسبة SM (%) 31.6 30 ٣٢.٨
VB ( ) 0.349 0.163 0.559
5.76 ٤.٩٢ 9.52
NPP ( ) -48.6 -20.2 -46.1
٤٧.٣ ٢٠.٦ ٤٣.٩
متغير تفاعل تفاعل القطب الشمالي 2020
الربع الأول تاس ( ) -9.62 -9.99 -10.4
علاقات عامة ( ) ٤٠٢ ٤٠٨ ٣٦٦
SD (م) 0.229 0.253 0.225
نسبة SM (%) ٢٤.٣ ٢٤ ٢٦.٣
VB ( ) 0.0192 0.00005 0.0624
2.04 0.22 2.87
NPP ( ) -93.5 -91 -87.7
3.85 0.0205 ٧.٧٧
متغير تفاعل تفاعل القطب الشمالي 2020
الربع الثالث تاس ) -0.532 -0.0927 -3.05
علاقات عامة ( ) ٧٧٣ ٨٠٣ ٦٣٣
SD (م) 0.44 0.58 0.369
نسبة SM (%) ٣٤.٤ ٣٣.١ ٣٤.٧
VB ( ) ٢.٣٤ 1.89 2.52
12.5 8.54 18.4
NPP ( ) -3.71 -0.00365 -4.39
91.8 81.8 91.2
متغير تفاعل تفاعل القطب الشمالي 2100
قيم D تاس 0.206 0.271 0.621
علاقات عامة 0.214 0.294 0.31
SD 0.13 0.23 0.363
سم 0.177 0.236 0.121
VB 0.123 0.21 0.206
SC 0.183 0.294 0.0726
NPP 0.125 0.215 0.296
RH 0.122 0.227 0.3

الشكل البياني الممتد 2 | دوال توزيع الكثافة لمتغيرات النظام البيئي (درجة حرارة الهواء، TA؛ إجمالي هطول الأمطار، TP؛ عمق الثلج، SD؛ رطوبة التربة، SM؛ كتلة الكتلة الحيوية للنباتات، VB؛ كربون التربة، SC؛ الإنتاجية الأولية الصافية، NPP؛ والتنفس غير الذاتي، RH) لكل من نماذج المحاكاة المناخية CMIP6 ESMs، مقارنةً بحالات النظام البيئي في محطات INTERACT مع (أسود) وبدون (أحمر).
محطات روسية مقارنة بالنطاق القطبي الشامل (الأزرق الفاتح). تشير الأعمدة الرأسية إلى القيم الوسيطة. لم يتم عرض الربع الأول والثالث. لاحظ أن تم تقليص نطاق المحور – لتحسين قابلية القراءة. يمكن العثور على مجموعة البيانات الكاملة في بيانات المصدر الشكل الممتد 2.
الشكل البياني الممتد 3 | حساسية الانحرافات (قيم KSD) لحجم العينة لكل متغير من متغيرات النظام البيئي. تُظهر الرسوم البيانية الصندوقية التأثير على قيم K-SD عند استخدام أعداد مختلفة من النسخ المكررة. ) في إجراء إعادة العينة مع 494 خلية شبكية (انظر أعلاه). تشير المربعات الرمادية إلى النطاق (الحد الأدنى إلى

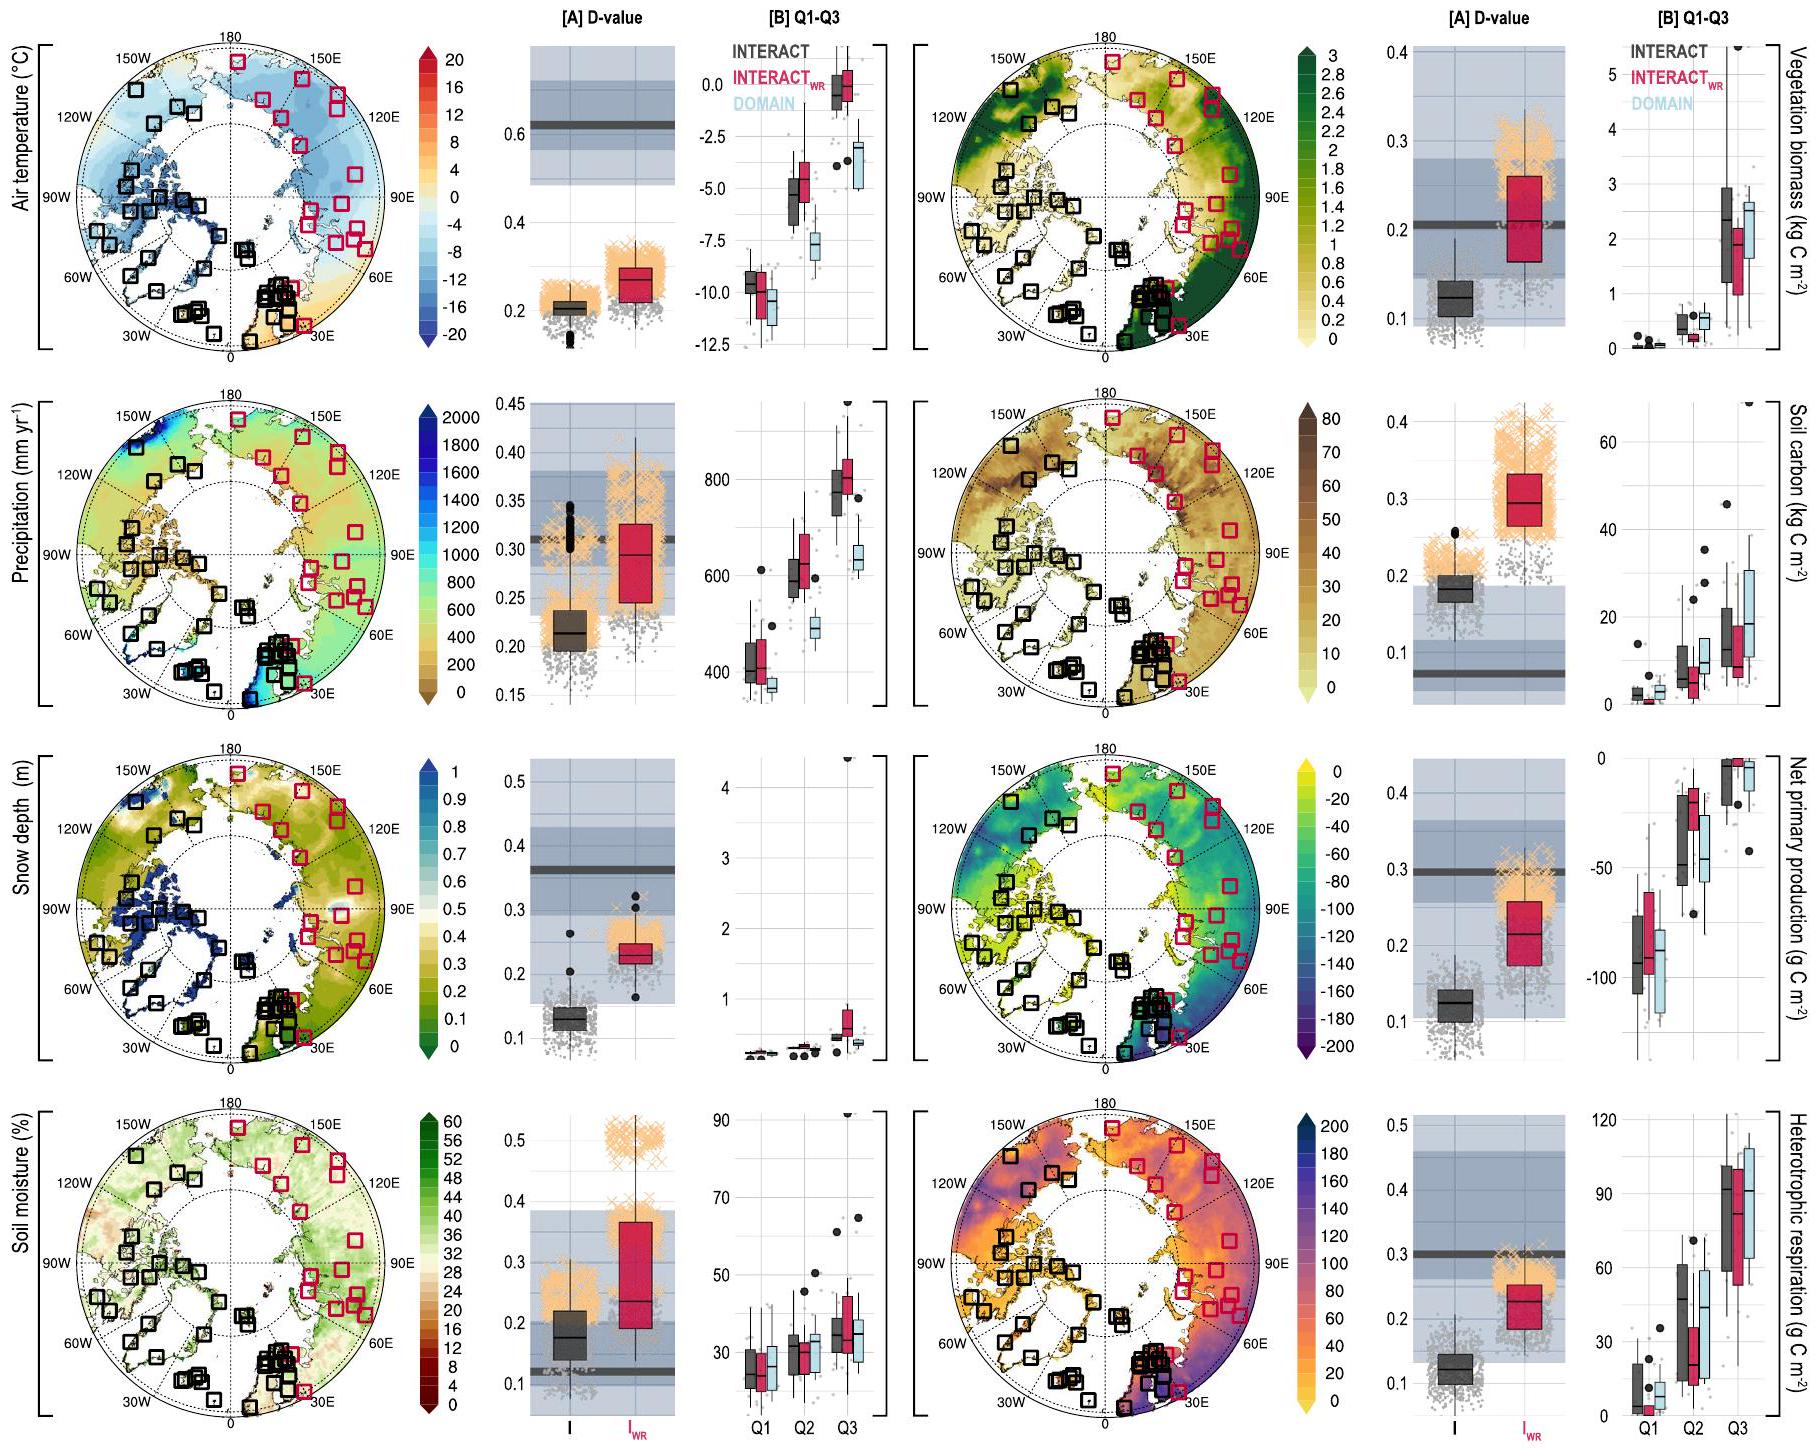
الحد الأقصى) عندما تم إعادة أخذ العينات باستخدام دقة ESM الأصلية.
تظهر الرسوم البيانية الصندوقية الوسيط والمدى الربعي (IQR)، مع امتداد الشعيرات العليا والسفلى إلى أكبر قيمة من النسبة المئوية وأصغر القيم من النسبة المئوية، على التوالي.

  1. قسم علوم البيئة، مركز الأبحاث القطبية، جامعة آرهوس، روسكيلد، الدنمارك. قسم البيئة والمعادن، معهد غرينلاند للموارد الطبيعية، نوك، غرينلاند. وحدة أبحاث المياه والطاقة والهندسة البيئية، كلية التكنولوجيا، جامعة أولو، أولو، فنلندا. قسم علوم الأرض وإدارة الموارد الطبيعية، جامعة كوبنهاغن، كوبنهاغن، الدنمارك. قسم علوم البيئة، iClimate، مركز الأبحاث القطبية، جامعة آرهوس، روسكيلد، الدنمارك. معهد البيولوجيا القطبية، جامعة ألاسكا فيربانكس، فيربانكس، ألاسكا، الولايات المتحدة الأمريكية. مدرسة علوم الحياة، جامعة شيفيلد، شيفيلد، المملكة المتحدة. مختبر النظم البيئية وتغير المناخ، جامعة تومسك الحكومية (معلقة)، تومسك، روسيا. البريد الإلكتروني: elb@ecos.au.dk

Journal: Nature Climate Change, Volume: 14, Issue: 2
DOI: https://doi.org/10.1038/s41558-023-01903-1
Publication Date: 2024-01-22

Towards an increasingly biased view on Arctic change

Received: 6 June 2023
Accepted: 27 November 2023
Published online: 22 January 2024
(A) Check for updates

Efrén López-Blanco © , Elmer Topp-Jørgensen © , Torben R. Christensen (1) , Morten Rasch (1) , Henrik Skov (1) , Marie F. Arndal® , M. Syndonia Bret-Harte® , Terry V. Callaghan (B) & Niels M. Schmidt (B)

Abstract

The Russian invasion of Ukraine hampers the ability to adequately describe conditions across the Arctic, thus biasing the view on Arctic change. Here we benchmark the pan-Arctic representativeness of the largest high-latitude research station network, INTERACT, with or without Russian stations. Excluding Russian stations lowers representativeness markedly, with some biases being of the same magnitude as the expected shifts caused by climate change by the end of the century.

As a result of the Russian attack on Ukraine, the Western world has excluded Russia from international fora. This geopolitical conflict severely challenges transnational collaboration on global issues. This is particularly evident when it comes to the Arctic. Russia is geographically the largest Arctic nation and is, hence, also one of eight nations within the Arctic Council, an intergovernmental forum for coordinated activities across the Arctic countries (https://arctic-council.org/). However, following the invasion of Ukraine, the work of the Arctic Council was first put on hold, and as currently resumed, it is only in part and without Russia.
The Arctic is rapidly changing , and many of the ongoing changes may have global consequences . While many of the key indicators of Arctic climate change (for example, refs. 4,5) and climate-induced responses (for example, refs. 6,7) can be estimated remotely, much of the understanding of Arctic change is based on in situ data measured on the ground at research stations. As ground-based observations that form the basis for assessments of the region’s state will now come mainly from the non-Russian parts of the Arctic, the overall ability to monitor the status and trajectory of the Arctic biome may be severely limited over the foreseeable future. The question is to what extent this challenge may bias the overall view on Arctic change. However, to better understand this challenge, there needs to be acknowledgement that the current view on Arctic change might already be biased . Logistical constraints and limited long-term funding for conducting research and
monitoring in vast and remote areas have led to the establishment of only relatively few research stations scattered across the Arctic without an optimal statistically determined sampling regime . Most ground-based data collection and the resultant scientific publications are therefore spatially clumped , and may thus not be representative of the Arctic region as a whole. Siberia and the Canadian high Arctic appear particularly under-represented .
In this Brief Communication, we assess potential additional biases in the view on current and projected terrestrial Arctic change amid the current geopolitical conflict. To achieve this, we quantify how well Arctic research stations, with or without Russian stations included, represent ecosystem conditions at the pan-Arctic scale. We use a suite of eight state-of-the-art Earth system models (ESMs) from the Coupled Model Intercomparison Project Phase 6 (CMIP6) , included in the Intergovernmental Panel on Climate Change (IPCC) Sixth Assessment Report , at their native spatial resolutions (Extended Data Table 1). We focus specifically on eight essential abiotic and biotic variables describing key conditions in high-latitude terrestrial ecosystems : annual mean air temperature, total precipitation, snow depth, soil moisture, vegetation biomass, soil carbon, net primary productivity and heterotrophic respiration. These essential ecosystem variables serve as benchmarks for environmental conditions found across the circumpolar region and at Arctic research stations located above , as represented by the pan-Arctic infrastructure network
Fig. 1| Shifts in representativeness. The effects of excluding Russian research stations (red boxes on the maps) from the INTERACT network with respect to eight ecosystem variables (air temperature, total precipitation, snow depth, soil moisture, vegetation biomass, soil carbon, net primary productivity and heterotrophic respiration). Maps visualize contemporary conditions above . For each variable, the potential biases of INTERACT with respect to the conditions in the pan-Arctic domain are depicted by two sets of box plots: [A] and . shows the maximum deviation ( values) between two cumulative distribution functions (INTERACT with (I) or without ( ) Russian stations) versus the contemporary pan-Arctic domain. The maximum deviation between the contemporary versus end-of-the-century pan-Arctic domain is shown by the
horizontal grey bars, with the lighter and darker colours representing the median and the and confidence intervals, respectively. [B] displays the quartiles 1 to 3 values for the ecosystem contemporary conditions of INTERACT with (black) and without (red) Russian stations as well as across the pan-Arctic domain (blue). Note that, for values, both the eight ESMs and the resampling from the domain contribute to the variation, while variation for quartiles 1-3 is attributable to only the ESMs. All box plots show the median and interquartile range (IQR), with the upper and lower whiskers extending to the largest value IQR from the 75th percentile and the smallest values IQR from the 25th percentile, respectively. Outliers have been omitted to increase readability but are presented in Extended Data Fig.1.
International Network for Terrestrial Research and Monitoring in the Arctic (INTERACT, https://eu-interact.org/) .
Acknowledging that the INTERACT network may not be fully representative of the Arctic as a whole , we first quantify any bias of the network in representing the contemporary spatial variability of key abiotic and biotic ecosystem conditions across the pan-Arctic region. We then ask whether the exclusion of Russia from INTERACT accentuates any potential bias. To quantify the discrepancies between the pan-Arctic domain and INTERACT research stations with or without those in Russia, we calculated two metrics. First, we calculated the maximum differences between the cumulative distribution functions (the values from Kolmogorov-Smirnov (K-S) tests) of the pan-Arctic domain and INTERACT stations with or without Russian stations across the eight CMIP6ESMs for each of the eight ecosystem variables (Fig.1a).
Significant values ( ) were regarded as lack of representativeness between the INTERACT network with or without Russia and the pan-Arctic region. As a yardstick of magnitude, we compared these values with those derived from the projected shifts in ecosystem conditions between the years 2016-2020 and 2096-2100 using the Shared Socioeconomic Pathway (SSP) 5-85 scenario. Second, to visualize the possible biases we also extracted the first (25%), second (median) and third (75%) quartile (Q1-Q3) values of the distribution functions for each ESM and ecosystem variable from the INTERACT research stations with or without Russian stations and compared those with the conditions across the entire pan-Arctic region (Fig.1b). We do acknowledge that ecosystem models are associated with uncertainties (Methods), and are as such not an absolute descriptor of environmental variation. Still, ecosystem models are the best tool we have for inferring
Fig. 2 | Loss of ecoregion representation. The impact of excluding Russian research stations from the INTERACT network on the count of research stations across the range of high-latitude ecoregions covered by the network. The INTERACT research stations are represented in the map by squares, and the red
squares indicate the positions of the Russian stations. The radar plot to the right illustrates the number of stations within the various ecoregions, with the black polygon depicting all INTERACT stations and red polygon depicting the nonRussian stations only.
large-scale patterns in contemporary ecosystem conditions in a consistent manner and for projecting into the future.
Our results suggest that, even with all Russian stations included, the INTERACT network is consistently biased for some ecosystem variables and is thus not fully representative of the ecosystem conditions across the pan-Arctic domain (Fig. 1). The INTERACT stations are generally located in the slightly warmer and wetter parts of the Arctic in areas with generally deeper snowpacks. INTERACT stations are also located in areas with lower vegetation biomass and soil carbon than the Arctic region as a whole. This pattern is the same across the three quartiles examined (Fig.1b), suggesting that the lack of representativeness for these key ecosystem variables is consistent across the parameter space. Hence, the knowledge based on ground-collected science may be biased, even when based on data from all Arctic INTERACT research stations. This corroborates the findings of previous studies . Yet, local-scale spatial (subgrid) variability in ecosystem conditions around many research stations means that the environmental span covered by each INTERACT research station is broader than depicted by our large-scale analyses here (see, for example, ref. 16). The representativeness bias is thus probably different from what we have estimated here, but it is not possible to say whether subgrid variation generally contributes to lower or higher bias. On the other hand, as current ecosystem monitoring conducted locally at INTERACT stations is not fully coordinated nor standardized, the representativeness of the network for the pan-Arctic region may be even lower for some variables. It is only when research stations across the pan-Arctic region measure the same variables in a consistent manner across sites that we can achieve a more comprehensive and less biased understanding on Arctic change. Our measure of representativeness is thus rather a measure of potential representativeness.
Making matters more challenging, the exclusion of the Russian stations from the network (17 out of 60) resulted in a marked further loss of representativeness across almost all ecosystem variables, compared to modelled variables for the pan-Arctic region as a whole. For example, about half of the INTERACT stations located in the boreal zone are lost with the exclusion of Russia (Fig. 2), and with that, Siberia’s extensive taiga forest is no longer represented in the network. This results in additional biases, particularly with respect to vegetation biomass, with a concomitant increased bias in net primary productivity and heterotrophic respiration (Fig. 1a and Extended Data Table 2). Being a region
characterized by rapid climate change , the loss of Siberian research stations may be particularly detrimental for the ability to track global implications of thawing permafrost , shifts in biodiversity, including shrubification and carbon dynamics . Notably, for some variables (for example, precipitation and vegetation biomass) the offset increase was of a similar magnitude as the shifts inflicted by almost 80 years of projected climate change (Fig.1a).
Because of the geopolitical consequences of the Russian attack on Ukraine, the ability to both track and further project the development of the Arctic biome following climate-induced ecosystem change has deteriorated. And with that, the ability to initiate well-informed management and conservation initiatives that would help mitigate some of the negative consequences and risks exposed by climate change is greatly reduced. Understanding the gaps and biases is a prerequisite to, at least to some extent, consider and address them, and thereby improve the ability to make credible predictions despite imperfect coverage. Still, to be able to track the changing Arctic properly, the international community should, however, continue to strive for establishing and improving a research infrastructure and standardized monitoring programmes representative of the entire Arctic. This system should also promote open-access data sharing to increase accessibility and coherency. Sadly, until that is implemented, the ability to support and advise local and global communities will decrease further due to the loss of Russian stations representing half of the Arctic’s landmass.

Online content

Any methods, additional references, Nature Portfolio reporting summaries, source data, extended data, supplementary information, acknowledgements, peer review information; details of author contributions and competing interests; and statements of data and code availability are available at https://doi.org/10.1038/s41558-023-01903-1.

References

  1. AMAP Arctic Climate Change Update 2021: Key Trends and Impacts (Arctic Monitoring and Assessment Programme, 2022).
  2. Box, J. E. et al. Key indicators of Arctic climate change: 1971-2017. Environ. Res. Lett. 14, 045010 (2019).
  3. Previdi, M., Smith, K. L. & Polvani, L. M. Arctic amplification of climate change: a review of underlying mechanisms. Environ. Res. Lett. 16, 093003 (2021).
  4. Bintanja, R. et al. Strong future increases in Arctic precipitation variability linked to poleward moisture transport. Sci. Adv. 6, eaax6869 (2020).
  5. Rantanen, M. et al. The Arctic has warmed nearly four times faster than the globe since 1979. Commun. Earth Environ. 3, 168 (2022).
  6. Myers-Smith, I. H. et al. Complexity revealed in the greening of the Arctic. Nat. Clim. Change 10, 106-117 (2020).
  7. Turetsky, M. R. et al. Carbon release through abrupt permafrost thaw. Nat. Geosci. 13, 138-143 (2020).
  8. Metcalfe, D. B. et al. Patchy field sampling biases understanding of climate change impacts across the Arctic. Nat. Ecol. Evol. 2, 1443-1448 (2018).
  9. Virkkala, A. M. et al. Identifying multidisciplinary research gaps across Arctic terrestrial gradients. Environ. Res. Lett. 14, 124061 (2019).
  10. Schmidt, N. M., Christensen, T. R. & Roslin, T. A high arctic experience of uniting research and monitoring. Earths Future 5, 650-654 (2017).
  11. Loescher, H. W. et al. Building a global ecosystem research infrastructure to address global grand challenges for macrosystem ecology. Earths Future 10, e2020EF001696 (2022).
  12. Callaghan, T. V., Cazzolla Gatti, R. & Phoenix, G. The need to understand the stability of arctic vegetation during rapid climate change: an assessment of imbalance in the literature. Ambio 51, 1034-1044 (2022).
  13. O’Neill, B. C. et al. The Scenario Model Intercomparison Project (ScenarioMIP) for CMIP6. Geosci. Model Dev. 9, 3461-3482 (2016).
  14. IPCC Climate Change 2021: The Physical Science Basis (eds Masson-Delmotte, V. et al.) (Cambridge Univ. Press, 2021).
  15. Callaghan, T. V. et al. in Scientific Cooperation Throughout the Arctic: The INTERACT Experience, in the New Arctic (eds Evengård, B. et al.) 269-289 (Springer, 2015).
  16. Pedersen, S. H. et al. Quantifying snow controls on vegetation greenness. Ecosphere 9, e02309 (2018).
  17. Hantemirov, R. M. et al. Current Siberian heating is unprecedented during the past seven millennia. Nat. Commun. 13, 4968 (2022).
  18. Biskaborn, B. K. et al. Permafrost is warming at a global scale. Nat. Commun. 10, 264 (2019).
  19. Frost, G. V. & Epstein, H. E. Tall shrub and tree expansion in Siberian tundra ecotones since the 1960s. Glob. Change Biol. 20, 1264-1277 (2014).
  20. Lin, X. et al. Siberian and temperate ecosystems shape Northern Hemisphere atmospheric seasonal amplification. Proc. Natl Acad. Sci. USA 117, 21079-21087 (2020).
Publisher’s note Springer Nature remains neutral with regard to jurisdictional claims in published maps and institutional affiliations.
Open Access This article is licensed under a Creative Commons Attribution 4.0 International License, which permits use, sharing, adaptation, distribution and reproduction in any medium or format, as long as you give appropriate credit to the original author(s) and the source, provide a link to the Creative Commons license, and indicate if changes were made. The images or other third party material in this article are included in the article’s Creative Commons license, unless indicated otherwise in a credit line to the material. If material is not included in the article’s Creative Commons license and your intended use is not permitted by statutory regulation or exceeds the permitted use, you will need to obtain permission directly from the copyright holder. To view a copy of this license, visit http://creativecommons. org/licenses/by/4.0/.
© The Author(s) 2024

Methods

Research stations in the Arctic

With 94 research stations in total, of which 21 are located in Russia, INTERACT (https://eu-interact.org/) is the most extensive network of research stations in the Northern Hemisphere. The INTERACT network aims to build capacity for documenting, understanding, predicting and responding to environmental changes achieved through the close integration of research and monitoring. The INTERACT stations cover a wide selection of climatic (high/low Arctic, sub-Arctic, boreal and alpine) and permafrost (continuous, discontinuous and sporadic) zones. To represent the network in the Arctic properly, we identified 60 grid cells containing the location of INTERACT stations above , excluding the Greenland Ice Sheet and INTERACT sites located in Svalbard sharing the same coordinates. Seventeen of these stations are located in Russia. The coordinates for the INTERACT stations have been obtained from the INTERACT Station Catalogue 2020 (available at https://eu-interact.org/).

Spatial variability in ecosystem variables

We characterized the spatial variability of key abiotic and biotic ecosystem variables across the pan-Arctic domain using extracts from eight different ESMs (Extended Data Table1) within the CMIP6 projections included in the IPCC Sixth Assessment Report . Although today more ESMs are available, the ESMs included here were selected because they (1) include all ecosystem variables of interest (see below) and (2) are a diverse sample of most of the CMIP6 models as a function of effective climate sensitivity . The CMIP6 datasets were downloaded from the open-source data repositories . The model variant used for the eight ESMs was r1i1p1f1 (r, realization/ensemble member; i, initialization method; p, physics; f, forcing) to allow for appropriate comparability.
We assessed the spatial variability in eight key ecosystem variables: air temperature ( ), total precipitation ( mm per year), snow depth (m), soil moisture (%), vegetation biomass ( ), soil carbon ( ), net primary productivity ( ) and heterotrophic respiration ( ). These variables not only characterize the spatial variability in ecosystem conditions but are also known to be undergoing rapid changes across the pan-Arctic region . The choice of variables was motivated by the key most recent trends and impacts from Arctic climate change reported by the Arctic Climate Change Update 2021:Key Trends and Impacts report . For instance, air temperature is an excellent indicator that locally aggregates surface and atmospheric (vertical and horizontal) energy budgets. The temperatures in the Arctic have warmed three to four times that of the globe, increasing by during the 1971-2019 period according to EU Copernicus ERA5 monthly dataset. The total precipitation, together with air temperatures, are drivers of change for multiple ecosystem components. Precipitation in the Arctic is increasing nearly in the same period and is driven by a 25% rainfall increase over-compensating for a loss of snow cover . The Arctic system is typically covered by snow in the winter months, making the shoulder seasons (spring and autumn) especially sensitive to changes due to warming. The snow cover extent between May and June has decreased by 21% over the 1971-2019 period ; this is a percent loss rate greater than the loss of sea ice in September. Both rainfall and snow dynamics are among the key factors driving soil moisture availability that, at the same time, have important implications over plant phenology and productivity . The tundra greenness has increased by between 1982 and 2019 despite some regions exhibiting browning . Greener tundra can increase the accumulated carbon storage and leaf area index further enhancing the photosynthetic capacity and stimulating higher gross carbon fluxes but also have important implications for land surface energy budget as does the reduction in spring snow cover . Finally, the terrestrial C pool in the Arctic accounts for approximately 50% of the global soil organic C pool -changes in soil temperature and permafrost dynamics can have strong implications on atmospheric release of greenhouse gasses and feedback to the global climate .
For each ecosystem variable and each ESM, we collated and processed monthly aggregated gridded information across the pan-Arctic domain. To describe the contemporary ecosystem conditions, we used the means of the years 2016-2020. To allow for comparison of spatial versus temporal changes (see below), we also estimated the spatial variability in the eight ecosystem parameters by the end of the twenty-first century (2096-2100) for each ESM. We used the SSP greenhouse gas emission scenario 5-85, equivalent to the former Representative Concentration Pathway 8.5 in the IPCC Fifth Assessment Report. We focused on this business-as-usual scenario as it has been recently found that we are very close to the upper part of, if not exceeding, the most drastic projection at least until the middle of the twenty-first century .
From the monthly aggregated global CMIP6 ESM products, we then cropped out latitudes below and excluded the fractional Greenland Ice Sheet cover . The spatial resolution of the individual ESMs was retained.

Data analysis

To assess the representativeness of the INTERACT stations of the entire pan-Arctic region, we calculated the density distribution for each individual abiotic and biotic ecosystem variable. As contemporary and future conditions, we used the mean across the years 2016-2020 and 2096-2100, respectively. First, we estimated the density distributions (Extended Data Fig. 2) for INTERACT with all stations included, and then with all Russian stations excluded. To describe the baseline conditions across the pan-Arctic domain, we randomly sampled the same number of grid cells from all ESMs, regardless of their native spatial resolution, equal to the smallest population size among all models (that is, the CanESM5 with 496 datapoints, excluding pixels containing ocean and the Greenland Ice Sheet; Extended Data Table1). To minimize potential artefacts emerging from the arbitrary sample size choice, we retrieved 100 replicates of the random sample populations of 496 datapoints per ESM and variable. A simple sensitivity analysis assessing the impact of the number of samples and the number of replicates on the K-S statistics can be found in Extended Data Fig. 3.
To describe any bias between ecosystem conditions between INTERACT with and without Russian stations and the pan-Arctic domain further, we used the values from non-parametric K-S tests as a measure of the maximum offset between the density distributions (Fig.1a). values represent the maximum vertical distance between the cumulative distribution function described by the INTERACT network (with or without Russia) and the cumulative distribution function describing the pan-Arctic domain. The null hypothesis is that both groups were sampled from identical distributions, and significant K-S tests thus indicate that distributions differ. As a yardstick for the magnitude of the potential bias, we used the values derived from comparing the projected shifts in ecosystem conditions between the years 2016-2020 and 2096-2100 (see above). To visualize potential biases further, we extracted the first, second (median) and third quartiles (Q1-Q3) from the density distributions, as general indicators of the ecosystem conditions at the INTERACT stations (with and without Russian stations) and across the pan-Arctic region (Fig. 1b).
To visualize the impacts of the exclusion of Russia from INTERACT as loss of ecoregion representation across the pan-Arctic region, we calculated the distribution of INTERACT stations per ecoregion with and without Russian stations. The ecoregions in Fig. 2 were defined as follows: (1) the High Arctic region covered the bioclimatic subzones A, B and C, from the Circumpolar Arctic Vegetation Map (CAVM; accessible in ref. 31), (2) the Low Arctic region covered the CAVM subzones D and E and (3) the Sub-Arctic region is derived from the tundra forest subzone in the Ecoregion 2017 classification (available at https://ecoregions. appspot.com/) situated below the tree line. The Boreal region corresponded to the Ecoregion 2017 boreal forest subzone, and the Alpine region covered altitudes above but below the tree line. The latter was derived by the ArcticDEM product (accessible in ref.34).

Data and analysis caveats

Incorporating in situ field information holds the potential to reduce the anticipated uncertainties associated with the type of analysis presented in this paper. A growing abundance of high-temporal, quality-checked, long-term data is now accessible through online repositories for both scientific papers and data (for example, thematic scientific networks like FLUXNET, International Permafrost Association and so on). However, a substantial gap still remains in terms of a unified, coordinated approach to harmonize and integrate diverse monitoring data from various sources (spanning across countries or disciplines), as highlighted in refs. 8,9. Moreover, the absence of standardized methodologies (such as instrument branding, variable units or temporal resolutions) among research stations presents a challenge to comprehensive in situ field data intercomparisons.
Additionally, while robust spatial products are available, such as re-analysis climate forcing (for example, ERA5 (ref.35)), remote sensing products (for example, ESA Climate Change Initiative for vegetationrelated variables such as biomass ) and machine learning-derived estimates (for example, FLUXCOM for terrestrial C fluxes ), it is important to acknowledge that such datasets are associated with inherent biases and uncertainties (as highlighted in, for example, ref. 38). Similarly, bottom-up exercises from land cover/vegetation type classification maps, though valuable for upscaling, can be affected by heterogeneity issues and uncertainties, leading to potential biases when extrapolating from such analyses.
Coupled climate models remain the best and currently the only tools available for evaluating shifts and trends in the future climate system , along with the associated ecosystem responses and feedback loops . While large-scale climate models provide credible and convincing numerical estimations for recent past and future scenarios on a regional-to-global scale , differences in model performance are far from perfection .For instance, model uncertainties stem from various sources, including differences in model structure and parameterization (for example, ref. 42), external forcing (for example, ref. 43) and emission scenarios (for example, ref. 44). Such limitations introduce uncertainties on both atmospheric (for example, refs. 45,46) and ecosystem processes (for example, refs. 47,48), particularly those related to land (for example, refs. 38,49). Currently, the terrestrial carbon cycle remains the least constrained component of the global carbon budget (for example, ref. 50). For example, the models account for equilibrium states, but it has been recognized since the 1980s that plant species are unlikely to relocate as fast as their appropriate climate envelopes (for example, ref. 51). Also, models of treeline movement overestimate latitudinal relocation by up to 2,000 times . A consequence of this is that some vegetation will remain in climate envelopes to which they are not adapted and will/are experiencing impacts of extreme events. These impacts have local implications , and some have regional impacts, for example, the movement of the Circum-Arctic treeline and the impacts of thawing permafrost on wetland dynamics and vegetation/ biodiversity .

Data availability

All CMIP6 modelling datasets used in this study can be accessed and downloaded freely from ESGF repositories (for example, https:// esgf-node.llnl.gov/projects/cmip6/ and https://esgf-data.dkrz.de/ search/cmip6-dkrz/). Locations of Arctic research stations are available at the INTERACT GIS portal https://www.interact-gis.org/Home/ Stations. The source datasets generated and/or analysed during the current study are provided, corresponding to each figure and table. Any additional data are available from the corresponding author. Source data are provided with this paper.

Code availability

The script employed in this study to quantify maximum differences in cumulative distribution functions ( and values from tests)
between various sample populations (the pan-Arctic domain and INTERACT stations, with or without Russian stations), and extract the quartiles (Q1-Q3) values of the distribution flunctions of the same populations, is available in the GitHub repository at https://github. com/EfrenLB/KST.

References

  1. Gregory, J. M. et al. A new method for diagnosing radiative forcing and climate sensitivity. Geophys. Res. Lett. 31, LO32O5 (2004).
  2. WCRP Coupled Model Intercomparison Project (Phase 6) (World Climate Research Programme, 2021); https://esgf-node.llnl.gov/ projects/cmip6/
  3. WCRP Coupled Model Intercomparison Project (Phase 6) ESGF-DATA.DKRZ. DE node (World Climate Research Programme, 2021); https://esgf-data.dkrz.de/search/cmip6-dkrz/
  4. Zona, D. et al. Pan-Arctic soil moisture control on tundra carbon sequestration and plant productivity. Glob. Change Biol. 29, 1267-1281 (2022).
  5. López-Blanco, E. et al. The future of tundra carbon storage in Greenland-sensitivity to climate and plant trait changes. Sci. Total Environ. 846, 157385 (2022).
  6. Oehri, J. et al. Vegetation type is an important predictor of the Arctic summer land surface energy budget. Nat. Commun. 13, 6379 (2022).
  7. Hugelius, G. et al. Estimated stocks of circumpolar permafrost carbon with quantified uncertainty ranges and identified data gaps. Biogeosciences 11, 6573-6593 (2014).
  8. Schuur, E. A. G. et al. Climate change and the permafrost carbon feedback. Nature 520, 171-179 (2015).
  9. Citterio, M. & Ahlstrøm, A. P. Ice Extent (GEUS Dataverse, 2022).
  10. Walker, D. A. et al. The Circumpolar Arctic vegetation map. J. Veget. Sci. 16, 267-282 (2005).
  11. Circumpolar Arctic Vegetation Mapping Project (Alaska Geobotany Center, 2023); https://www.geobotany.uaf.edu/cavm/
  12. Dinerstein, E. et al. An ecoregion-based approach to protecting half the terrestrial realm. BioScience 67, 534-545 (2017).
  13. Porter, C. et al. ArcticDEM—Mosaics, Version 4.1 (Polar Geospatial Center, 2023).
  14. ArcticDEM (Univ. Minnesota, 2023); https://www.pgc.umn.edu/ data/arcticdem/
  15. Hersbach, H. et al. The ERA5 global reanalysis. Q. J. R. Meteorol. Soc. 146, 1999-2049 (2020).
  16. Santoro, M. & Cartus, O. ESA Biomass Climate Change Initiative (Biomass_cci): global datasets of forest above-ground biomass for the years 2010, 2017 and 2018, v3. NERC EDS Centre for Environmental Data Analysis https://doi.org/10.5285/5f331c418e9f 4935b8eb1b836f8a91b8 (2021).
  17. Jung, M. et al. Scaling carbon fluxes from eddy covariance sites to globe: synthesis and evaluation of the FLUXCOM approach. Biogeosciences 17, 1343-1365 (2020).
  18. López-Blanco, E. et al. Evaluation of terrestrial pan-Arctic carbon cycling using a data-assimilation system. Earth Syst. Dyn. 10, 233-255 (2019).
  19. van den Hurk, B. et al. LS3MIP (v1.0) contribution to CMIP6: the Land Surface, Snow and Soil moisture Model Intercomparison Project-aims, setup and expected outcome. Geosci. Model Dev. 9, 2809-2832 (2016).
  20. Jones, C. D. et al. C4MIP-The Coupled Climate-Carbon Cycle Model Intercomparison Project: experimental protocol for CMIP6. Geosci. Model Dev. 9, 2853-2880 (2016).
  21. Fisher, J. B. et al. Missing pieces to modeling the Arctic-Boreal puzzle. Environ. Res. Lett. 13, 020202 (2018).
  22. Hou, E. et al. Across-model spread and shrinking in predicting peatland carbon dynamics under global change. Glob. Change Biol. 29, 2759-2775 (2023).
  23. Fyfe, J. C. et al. Significant impact of forcing uncertainty in a large ensemble of climate model simulations. Proc. Natl Acad. Sci. USA 118, e2016549118 (2021).
  24. Nishina, K. et al. Decomposing uncertainties in the future terrestrial carbon budget associated with emission scenarios, climate projections, and ecosystem simulations using the ISI-MIP results. Earth Syst. Dyn. 6, 435-445 (2015).
  25. Im, U. et al. Present and future aerosol impacts on Arctic climate change in the GISS-E2.1 Earth system model. Atmos. Chem. Phys. 21, 10413-10438 (2021).
  26. McCrystall, M. R. et al. New climate models reveal faster and larger increases in Arctic precipitation than previously projected. Nat. Commun. 12, 6765 (2021).
  27. Carvalhais, N. et al. Global covariation of carbon turnover times with climate in terrestrial ecosystems. Nature 514, 213-217 (2014).
  28. Luo, Y., Keenan, T. F. & Smith, M. Predictability of the terrestrial carbon cycle. Glob. Change Biol. 21, 1737-1751 (2015).
  29. Virkkala, A.-M. et al. Statistical upscaling of ecosystem fluxes across the terrestrial tundra and boreal domain: regional patterns and uncertainties. Glob. Change Biol. 27, 4040-4059 (2021).
  30. Friedlingstein, P. et al. Global carbon budget 2022. Earth Syst. Sci. Data 14, 4811-4900 (2022).
  31. ACIA Arctic Climate Impact Assessment (Cambridge Univ. Press, 2005).
  32. Van Bogaert, R. et al. A century of tree line changes in sub-Arctic Sweden shows local and regional variability and only a minor influence of 20th century climate warming. J. Biogeogr. 38, 907-921 (2011).
  33. Schmidt, N. M. et al. An ecosystem-wide reproductive failure with more snow in the Arctic. PLoS Biol. 17, e3000392 (2019).
  34. Rees, W. G. et al. Is subarctic forest advance able to keep pace with climate change? Glob. Change Biol. 26, 3965-3977 (2020).
  35. Smith, L. C. et al. Disappearing Arctic lakes. Science 308, 1429-1429 (2005).

Acknowledgements

This work was supported by the International Network for Terrestrial Research and Monitoring in the Arctic (INTERACT, https://eu-interact.org/) funded by the European Union’s HORIZON2O20 Research and Innovation programme under grant agreement number 871120 . We acknowledge the World Climate Research Programme, which, through its Working Group on Coupled Modelling, coordinated and promoted CMIP6.
We thank the climate modelling groups for producing and making available their model output, the Earth System Grid Federation (ESGF) for archiving the data and providing access, and the multiple funding agencies who support CMIP6 and ESGF. We give credit to the Alaska Geobotany Center for the original Circumpolar Arctic Vegetation Map (CAVM). We acknowledge the DEM created by the ArcticDEM project funded by the Polar Geospatial Center under NSF-OPP awards 1043681, 1559691, 1542736, 1810976 and 2129685 . E.L.-B. was supported by the Greenland Research Council (GRC) grant number 80.35, financed by the ‘Danish Program for Arctic Research’. E.L.-B. and T.R.C. consider this study a contribution to GreenFeedBack (greenhouse gas fluxes and Earth system feedbacks) funded by the European Union’s HORIZON Research and Innovation programme under grant agreement number 101056921. H.S. considers this study a contribution to AMAP Core Atmosphere grant number 2021-60333.

Author contributions

E.L.-B. and N.M.S. designed the study based on discussions between all authors. E.L.-B. analysed the data and performed the statistical analyses. E.L.-B. and N.M.S. drafted the paper with input from all co-authors. All authors read and approved the final version of the paper.

Competing interests

The authors declare no competing interests.

Additional information

Extended data is available for this paper at
https://doi.org/10.1038/s41558-023-01903-1.
Supplementary information The online version
contains supplementary material available at
https://doi.org/10.1038/s41558-023-01903-1.
Correspondence and requests for materials should be addressed to Efrén López-Blanco.
Peer review information Nature Climate Change thanks Rolf Ims, Marisol Maddox, Martijn Pallandt and the other, anonymous, reviewer(s) for their contribution to the peer review of this work.
Reprints and permissions information is available at www.nature.com/reprints.
Extended Data Table 1 | List of ESM simulations used in the analysis (metadata derived from https://wcrp-cmip.github.io/ CMIP6_CVs/docs/CMIP6_source_id.html)
Model ID Origin Institution ID Atmosphere model Aerosol model Land surface and and vegetation model Spatial resolution
EC-Earth3-CC Europe EC-Earth Consortium IFS cy36r4 (TL255; ; 91 levels) HTESSEL (land surface scheme built in IFS) and LPJ-GUESS v4
NorESM2-MM Norway Norwegian Climate Center CAM-OSLO (1 degree; ; 32 levels) OsloAero CLM5
ACCESS-ESM1-5 Australia The Commonwealth Scientific and Industrial Research Organisation HadGAM2 (r1.1; N96; 192х145; 38 250 km levels) CLASSIC (v1.0) CABLE2.4
BCC-CSM2-MR China Beijing Climate Center BCC_AGCM3_MR (T106; levels) BCC_AVIM2
CanESM5 Canada Canadian Centre for Climate Modelling and Analysis CanAM5 (T63L49; ; 49 levels) interactive CLASS3.6/CTEM1.2
CMCC-ESM2 Italy Euro-Mediterranean Centre on Climate Change CAM5.3 (1degree; ; 30 levels) CLM4.5 (BGC mode)
IPSL-CM6A-LR France Institute Pierre Simon Laplace LMDZ (N96; levels) ORCHIDEE (v2.0, Water/ Carbon/Energy mode)
MPI-ESM1-2-LR Germany Max Planck Institute ECHAM v6.3 (T63; , 47 levels) none, prescribed MACv2-SP JSBACH3.20
Extended Data Table 2 | Summary of the mean Q1-3 and mean KS D-values for the eight ecosystem variables (air temperature, TA; total precipitation, TP; snow depth, SD; and soil moisture, SM; vegetation biomass, VB; soil carbon, SC net primary production, NPP; and heterotrophic respiration, RH). ‘INTERACT’ refers to the INTERACT network with all stations above included, ‘INTERACT ‘ to the INTERACT network without the Russian stations, and ‘Arctic 2020’ to the pan-Arctic conditions during the period 2016-2020. ‘Arctic 2100’ refers to the projected shift in ecosystem conditions between contemporary (2016-2020) and future (2096-2100)
Variable INTERACT INTERACT Arctic 2020
Q2 (Medians) TAS ( ) -5.32 -4.57 -7.7
PR ( ) 588 625 490
SD (m) 0.302 0.33 0.277
SM (%) 31.6 30 32.8
VB ( ) 0.349 0.163 0.559
5.76 4.92 9.52
NPP ( ) -48.6 -20.2 -46.1
47.3 20.6 43.9
Variable INTERACT INTERACT Arctic 2020
Q1 TAS ( ) -9.62 -9.99 -10.4
PR ( ) 402 408 366
SD (m) 0.229 0.253 0.225
SM (%) 24.3 24 26.3
VB ( ) 0.0192 0.00005 0.0624
2.04 0.22 2.87
NPP ( ) -93.5 -91 -87.7
3.85 0.0205 7.77
Variable INTERACT INTERACT Arctic 2020
Q3 TAS ( ) -0.532 -0.0927 -3.05
PR ( ) 773 803 633
SD (m) 0.44 0.58 0.369
SM (%) 34.4 33.1 34.7
VB ( ) 2.34 1.89 2.52
12.5 8.54 18.4
NPP ( ) -3.71 -0.00365 -4.39
91.8 81.8 91.2
Variable INTERACT INTERACT Arctic 2100
D-values TAS 0.206 0.271 0.621
PR 0.214 0.294 0.31
SD 0.13 0.23 0.363
SM 0.177 0.236 0.121
VB 0.123 0.21 0.206
SC 0.183 0.294 0.0726
NPP 0.125 0.215 0.296
RH 0.122 0.227 0.3

Extended Data Fig. 2 | Density distribution functions for the ecosystem variables (air temperature, TA; total precipitation, TP; snow depth, SD; soil moisture, SM; vegetation biomass, VB; soil carbon, SC net primary production, NPP; and heterotrophic respiration, RH ) for each of the CMIP6 ESMs comparing the ecosystem conditions at the INTERACT stations with (black) and without (red)
Russian stations as compared to the pan-Arctic domain (light blue). Vertical bars indicate the median values. The first and third quartiles are not shown. Note that the -axis range has been truncated to improve readability. The complete dataset can be found in Source Data Extended Data Fig. 2.
Extended Data Fig. 3 | Sensitivity of offsets (KSD-values) to sample size for each ecosystem variable. Box plots show the impact on K-SD-values when using different numbers of replicates ( ) in the resampling procedure with 494 grid cells (see above). Grey boxes indicate the range (minimum to

maximum) when resampling was performed using the native ESM resolution.
The box plots show the median and interquartile range (IQR), with the upper and lower whiskers extending to the largest value from the percentile and the smallest values from the percentile, respectively.

  1. Department of Ecoscience, Arctic Research Center, Aarhus University, Roskilde, Denmark. Department of Environment and Minerals, Greenland Institute of Natural Resources, Nuuk, Greenland. Water, Energy and Environmental Engineering Research Unit, Faculty of Technology, Oulu University, Oulu, Finland. Department of Geosciences and Natural Resource Management, University of Copenhagen, Copenhagen, Denmark. Department of Environmental Science, iClimate, Arctic Research Center, Aarhus University, Roskilde, Denmark. Institute of Arctic Biology, University of Alaska Fairbanks, Fairbanks, AK, USA. School of Biosciences, University of Sheffield, Sheffield, UK. Laboratory of Ecosystems and Climate Change, Tomsk State University (on hold), Tomsk, Russia. e-mail: elb@ecos.au.dk