نصف توسع الري العالمي في القرن الحادي والعشرين كان في مناطق تعاني من نقص المياه Half of twenty-first century global irrigation expansion has been in water-stressed regions
لقد زاد توسيع الزراعة المروية من إنتاج المحاصيل العالمي ولكنه أدى إلى ضغط واسع النطاق على موارد المياه العذبة. إن ضمان حدوث زيادات في الإنتاج المروي فقط في الأماكن التي تتوفر فيها المياه بشكل نسبي هو هدف رئيسي للزراعة المستدامة، ومعرفة كيف تطورت الأراضي المروية أمر مهم لقياس التقدم نحو استدامة المياه. ومع ذلك، فإن الفهم التفصيلي المكاني لتطور المساحة العالمية المجهزة للري (AEI) مفقود. في هذه الدراسة، استخدمنا أحدث إحصائيات الري على المستوى الفرعي (تغطي 17,298 وحدة إدارية) من مصادر رسمية متنوعة لتطوير منتج عالمي مصفوف (بدقة 5 دقائق قوسية) لـ AEI للسنوات 2000 و2005 و2010 و2015. وجدنا أن AEI زادت من من 2000 (297 مليون هكتار) إلى, مع مناطق من التوسع الكبير، مثل شمال غرب الهند وشمال شرق الصين، والانخفاض، مثل روسيا. من خلال دمج هذه النتائج مع معلومات عن الضغط المائي الأخضر (أي، الأمطار) والأزرق (أي، المياه السطحية والجوفية)، قمنا أيضًا بفحص إلى أي مدى توسع الري بشكل غير مستدام في الأماكن التي تعاني بالفعل من ضغط المياه. وجدنا أن أكثر من نصف (52%) من توسيع الري قد حدث في مناطق كانت تعاني بالفعل من نقص المياه في عام 2000، حيث تمثل الهند وحدها من التوسع غير المستدام العالمي. توفر هذه النتائج رؤى جديدة حول أنماط الري العالمية المتطورة مع تداعيات مهمة على استدامة المياه العالمية وأمن الغذاء.
من المتوقع أن يزيد عدد السكان العالمي إلى أكثر من 10 مليارات شخص بحلول عام 2050 (مرجع 1) وسيحتاج إنتاج الغذاء إلى زيادة كبيرة لتلبية الطلب الغذائي المرتبط بالنمو السكاني. لأن زيادة مساحة الأراضي الزراعية تعني تحويل الغابات والأنظمة البيئية الأخرى, فإن تكثيف الزراعة على الأراضي الزراعية الحالية من خلال زيادة الري والموارد الأخرى بشكل مستدام هو بديل محتمل واعد. بينما تمثل المناطق المروية 24% من الأراضي الزراعية، فإن حوالي 40% من الإنتاج الغذائي العالمي يأتي من
الأراضي الزراعية المروية. بالإضافة إلى ذلك، يتم استخدام أكثر من 90% من استخدام المياه الاستهلاكية للبشرية في إنتاج الزراعة المروية. اعتمادًا على الطلب النسبي على المياه وتوافرها في موقع معين، يمكن أن يؤدي هذا الاستخدام الواسع للمياه إلى تغيير دورة المياه، واستنزاف المياه الجوفية والمسطحات المائية, وزيادة الضغط على المياه وتصعيد المنافسة على موارد المياه العذبة. نظرًا للدور الحاسم الذي من المحتمل أن يلعبه الري في تلبية الطلب الغذائي المستقبلي والطبيعة غير المتجانسة للغاية لتوافر المياه والطلب، من الضروري فهم كيف أنماط
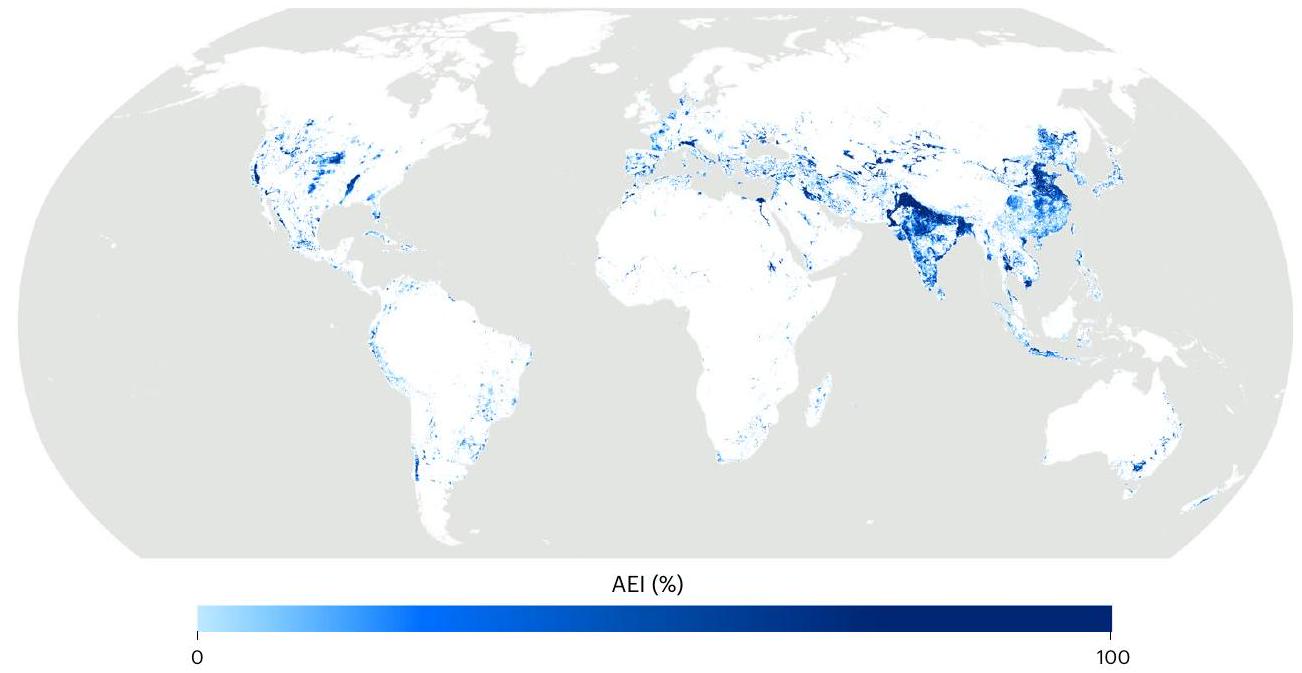
الشكل 1 | خريطة عالمية للمساحة المجهزة للري (AEI) في عام 2015. خريطة لـ AEI العالمية تظهر مناطق النشاط المحتمل العالي للري. كل بكسل 5 دقائق قوسية يظهر نسبة AEI. تظهر فقط البكسلات التي تحتوي على 1% AEI أو أكثر. خريطة أساسية من GADM.
أنماط الري العالمية قد تطورت مؤخرًا وتقييم ما إذا كانت هذه التغييرات قد حدثت في مواقع حيث تكون موارد المياه وفيرة نسبيًا أو نادرة.
بدأت عدة جهود عالمية وإقليمية في معالجة تحديات رسم أنماط مكانية واتجاهات زمنية في الري. تم تطوير مجموعات بيانات حول مدى الأراضي المروية على نطاق عالمي وإقليمي، لكن هذه التحليلات لا تمتلك التغطية المكانية والزمنية لتقييم (عدم) استدامة تغييرات الري منذ بداية القرن. كما حاول عدد متزايد من الدراسات رسم خرائط للمناطق المروية على نطاقات عالمية أو وطنية باستخدام صور الأقمار الصناعية وبيانات الاستشعار عن بعد. بينما توفر هذه الدراسات غالبًا دقة مكانية عالية، فإن الخرائط الناتجة ليست بالضرورة متسقة مع إحصائيات الري ولا تشمل المناطق التي كانت مجهزة للري ولكن لم تكن قيد الاستخدام الفعلي في سنة التقييم. توفر قواعد بيانات أخرى تغطية زمنية أكبر ولكن لوحدات وطنية أو فرعية خشنة، مما يحد من فائدتها في التقييمات المكانية الواضحة لتغييرات الري بالنسبة للمناطق التي تعاني من نقص المياه. بينما قدمت جميع هذه الجهود رؤى قيمة حول جوانب إما الأنماط المكانية أو الاتجاهات الزمنية للري العالمي، لا يزال هناك حاجة ملحة للمعلومات حول المساحة العالمية المروية التي تكون مفصلة مكانيًا وزمنيًا لفحص استدامة تطور المناطق المروية في القرن الحادي والعشرين. على وجه التحديد، لا يزال التقييم العالمي لما إذا كانت تغييرات المساحة المروية قد حدثت في مواقع كانت تعاني بالفعل من ظروف نقص المياه مفقودًا، مما قد يسلط الضوء على مدى أخذ الاستثمارات في بنية الري التحتية عبر الأراضي الزراعية في العالم في الاعتبار حالة توافر المياه واستدامتها في موقع معين.
في هذه الدراسة، قمنا بتحديد استدامة المياه لتغييرات المساحة العالمية المجهزة للري (AEI) منذ بداية القرن. للقيام بذلك، جمعنا أولاً إحصائيات الري الوطنية والفرعية من عام 2000 حتى 2015 لـ 243 دولة (تتكون من 17,298 وحدة إدارية) من قواعد بيانات دولية، وتعدادات زراعية وطنية وتقارير حكومية. إن التركيز على AEI، بدلاً من المساحة المروية فعليًا، هو ميزة لفحص الاتجاهات الزمنية الأوسع وتقليل أخطاء توحيد سنوات التعداد الزراعي المرجعية المختلفة عبر البلدان. ثم قمنا بدمج هذه البيانات مع خرائط عالمية مصفوفة من الأراضي الزراعية, والأراضي الرعوية والمساحة المروية في نموذج تخصيص مكاني وتقليل المقياس لتطوير خرائط مصفوفة عالمية (5 دقائق قوسية) لـ AEI للسنوات 2000 و2005 و2010 و2015. حيث كان هناك تداخل زمني ومكاني، قمنا بمقارنة خرائطنا مع المنتجات المصفوفة الموجودة. من خلال تقييم الأنماط المكانية لتوسع AEI وانخفاضه،
قمنا بتراكب خرائط عالمية للضغط المائي الأزرق (أي، المياه السطحية والجوفية) والأخضر (أي، الأمطار) لتقييم نسبة تغييرات AEI التي حدثت في المناطق التي تعاني من نقص المياه (أي، غير المستدامة) منذ بداية القرن. يمكن أن تشير هذه الفهم الجديد لاستدامة التغييرات الأخيرة في الري العالمي إلى المناطق التي حققت نجاحًا في توسيع الري المستدام وتوجيه الاستراتيجيات لمعالجة النتائج غير المرغوب فيها لنقص المياه.
النتائج
تغير أنماط الري العالمية
وجدنا أن AEI العالمي في عام 2015 كان 329 مليون هكتار (الشكل 1)، مع هيمنة آسيا، حيث تمثل 222 مليون هكتار (68%) من إجمالي AEI، تليها أمريكا الشمالية () وأوروبا (). وحدها، تمثل الصين (72 مليون هكتار) والهند (70 مليون هكتار) والولايات المتحدة (28 مليون هكتار) أكثر من نصف (52%) من إجمالي AEI العالمي.
كما قدرنا أن AEI العالمي زاد صافيًا بمقدار 33 مليون هكتار () من عام 2000 (297 مليون هكتار؛ الشكل 2). كان هذا الزيادة الصافية نتيجة لزيادة إجمالية قدرها 65 مليون هكتار في AEI في بعض المناطق وانخفاض إجمالي قدره 32 مليون هكتار في مناطق أخرى (الشكل 3). شهدت آسيا وأمريكا الجنوبية أكبر الزيادات الصافية في AEI بحوالي و، على التوالي، تليها إفريقيا () وأوقيانوسيا (1.7 مليون هكتار،). كانت الدول التي توسعت فيها الري (صافيًا) أكثر هي الصين (12.8 مليون هكتار) والهند (8.5 مليون هكتار؛ الجدول 1 والجدول التكميلي 3 لقائمة كاملة من الدول). أحد الأسباب الرئيسية وراء هذا التوسع هو زيادة الاستثمار في مشاريع الري للحفاظ على الاكتفاء الذاتي الغذائي. كان توسيع AEI كبيرًا بشكل استثنائي من حيث النسبة في البرازيل، حيث تضاعف AEI أكثر من الضعف في الفترة من 2000 إلى 2015 (الجدول 1).
في أوروبا، انخفضت مساحة الأراضي المجهزة للري بمقدار 4.8 مليون هكتار بشكل عام (-13%)، وهو ما يُعزى إلى حد كبير إلى البنية التحتية للري التي كانت تحت السيطرة المركزية والتي كانت مصممة لخدمة مشاريع ري كبيرة جدًا والتي خرجت من الخدمة، بالإضافة إلى الظروف الاقتصادية السلبية في دول أوروبا الشرقية، مثل رومانيا وروسيا. شهدت دول أخرى، مثل اليابان () والسعودية () أيضًا انخفاضات كبيرة في مدى الري (الشكل 2 والجدول التكميلي 3)، ربما بسبب الاعتماد المتزايد على واردات الغذاء. بشكل عام، تشير هذه النتائج إلى تحولات كبيرة في أنماط الري منذ بداية القرن.
حالة الضغط المائي في مناطق تغيير الري
بالنسبة للتحولات في مساحة الأراضي المجهزة للري، فإن مدى حدوث هذه التحولات في المواقع التي تتوفر فيها الموارد المائية بشكل نسبي ويمكن أن تدعم الطلب الإضافي على المياه الزرقاء دون
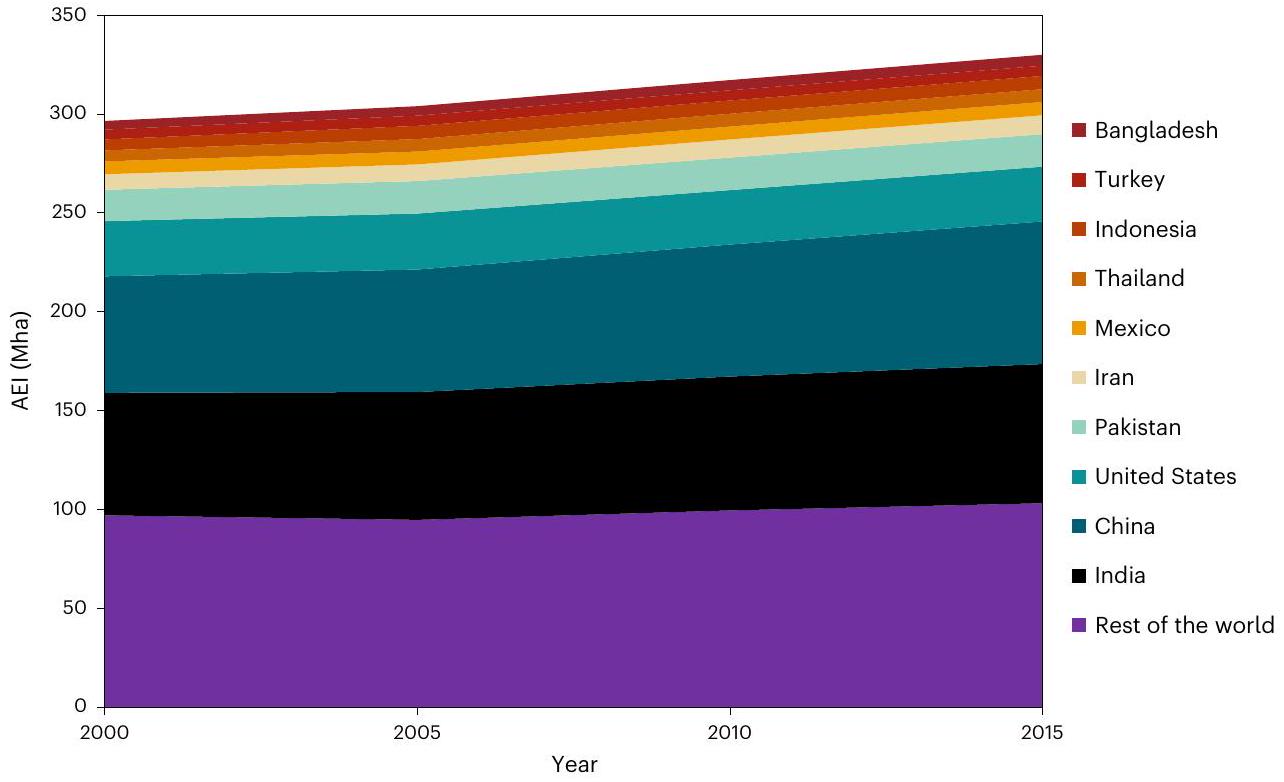
الشكل 2 | مساحة الأراضي المجهزة للري (AEI) للدول الكبرى بين عامي 2000 و2015. تُظهر AEI العالمية زيادة صافية خلال الفترة من 2000 إلى 2015. تم ترتيب الدول حسب زيادة AEI (من الأعلى إلى الأسفل) في عام 2000.
الشكل 3 | التغيرات العالمية في AEI من 2000 إلى 2015. أ، خريطة عالمية تُظهر المناطق التي شهدت زيادة في AEI والمناطق التي شهدت انخفاضًا في AEI. تُظهر المناطق التي شهدت توسعًا في AEI باللون الأزرق والمناطق التي شهدت انخفاضًا في AEI تُظهر
باللون الأرجواني كنسب مئوية للتغيرات., تُظهر الإضافات في أ الغرب الأمريكي (ب)، الهند (ج) وشرق الصين (د). تُظهر فقط البكسلات التي تحتوي على 1% AEI أو أكثر. خريطة الأساس من GADM.
استنزاف تدفق المياه أو المياه الجوفية (أي، التوسع المستدام). قمنا بتقييم التوسع المحتمل المستدام في AEI من خلال دمج قاعدة بيانات AEI المكانية الزمنية لدينا مع معلومات حول الأنماط العالمية للضغط المائي. نعرف الضغط المائي بأنه الحالة التي يتجاوز فيها الطلب الاستهلاكي (أي، السحوبات ناقص التدفقات العائدة) من جميع القطاعات توفر المياه العذبة. يمكن أن يكون الضغط المائي نتيجة إما لضغط المياه الخضراء (GWS)، عندما تكون الأمطار غير كافية لتلبية احتياجات المحاصيل من المياه ويكون الري التكميلي مطلوبًا، أو ضغط المياه الزرقاء
(BWS)، عندما تكون توفر المياه السطحية والجوفية المتجددة (أي، التوفر الكلي بعد احتساب التدفقات البيئية) غير كافٍ لتلبية الطلب على مياه الري. في حالة GWS، يمكن أن يكون توسيع البنية التحتية للري استراتيجية قيمة للتخفيف من تقلبات الأمطار، شريطة أن تكون موارد المياه الزرقاء متاحة بشكل كافٍ. في حالة BWS، يمكن أن يؤدي توسيع البنية التحتية للري إلى زيادة استنزاف المياه الجوفية وتدفق المياه.
الجدول 1 | الدول التي شهدت أكبر تغييرات إيجابية وسلبية صافية في AEI
الدولة
التغيير الصافي في AEI (مليون هكتار)
التغيير الصافي في AEI (%)
الصين
12.8
+22
الهند
8.5
+14
البرازيل
3.6
+113
إيران
1.7
+22
أستراليا
1.5
+41
إندونيسيا
1.2
+22
بنغلاديش
1.1
+25
فيتنام
1.0
+26
بيرو
0.9
+52
تايلاند
0.8
+15
اليابان
-0.3
-11
كوبا
-0.3
-36
كازاخستان
-1.4
-40
روسيا
-2.0
-53
رومانيا
-2.2
-83
بقية العالم
6.1
+5
من بين 65 مليون هكتار من التوسع الإجمالي في الري الذي لاحظناه، حدث 1.1 مليون هكتار في مناطق تعاني فقط من BWS، و19 مليون هكتار في مناطق تعاني فقط من GWS، و31.2 مليون هكتار في مناطق تعاني من كل من BWS وGWS، و13.9 مليون هكتار في مناطق لا تعاني من ضغط مائي (الشكل 4). وهذا يعني أن حواليمن التوسع الإجمالي في AEI كان غير مستدام، حيث حدث في مواقع تعاني بالفعل من نوع من BWS (انظر قائمة الدول في الجدول 2). وجدنا تقديرات متسقة عند استخدام خريطة ري بديلة(68 مليون هكتار من التوسع الإجمالي في الري،منها غير مستدام؛ الشكل التكميلي 9 والجدول التكميلي 2). من بين الدول التي لديها أكبر AEI في عام 2015، شهدت الهند وباكستان أكبر توسع غير مستدام، حيث حدث(12.1 مليون هكتار) ومن التوسع الإجمالي في AEI، على التوالي، في مواقع كانت تعاني بالفعل من BWS. كانت نسبة كبيرة من التوسع في AEI في الصين (28%) والولايات المتحدة (42%) أيضًا غير مستدامة (الجدول التكميلي 3). على العكس من ذلك، كانت هناك أيضًا دول شهدت معظم توسع AEI فيها مستدامًا (من منظور موارد المياه)، مثل البرازيل (3.4 مليون هكتار، 96% من التوسع الكلي كان مستدامًا)، إندونيسيا (), بيرو (), إيطاليا () وفرنسا (; الجدول التكميلي 3). في العديد من الأماكن، لاحظنا أيضًا انخفاضات كبيرة في AEI في مناطق كانت تعاني سابقًا من طلب مائي غير مستدام (أي، تحت ظروف BWS). على الصعيد العالمي، بلغ الانخفاض في AEI في المناطق التي تعاني من ضغط مائي (BWS وBWS + GWS) -15.4 مليون هكتار (من إجمالي الانخفاض). كانت الدول التي شهدت أكبر انخفاضات في AEI في المناطق التي تعاني من ضغط مائي تشمل الهند (-4.8 مليون هكتار، 78%)، الصين (-3.5 مليون هكتار، 52%) والولايات المتحدة (; انظر الجدول التكميلي 3 للحصول على قائمة كاملة). مجتمعة، تُظهر جميع هذه النتائج أن التحولات المستدامة وغير المستدامة في أنماط الري قد حدثت عبر جغرافيا وسياقات متنوعة (وغالبًا داخل نفس الدولة) منذ بداية القرن. توفر هذه النتائج فهمًا حاسمًا لما إذا كانت اتجاهات الري قد كانت على مسار مستدام (أي، في مواقع حيث تتوفر موارد المياه بشكل نسبي) وتسلط الضوء على المناطق التي تحتاج إلى تدخلات بشكل عاجل لمعالجة الممارسات غير المستدامة.
المناقشة
تسلط نتائجنا الضوء على مدى استدامة التحولات في الري منذ بداية القرن. على الصعيد العالمي، وجدنا أن AEI قد توسعت بمقدارمنذ عام 2000، وهو خطوة ضرورية ومهمة
نحو زيادة إمدادات الغذاء والتخفيف من تقلبات المناخ المتزايدة. ومن الجدير بالذكر أن التوسع في الري الذي لاحظناه في أفريقيا جنوب الصحراء الكبرى وجنوب وجنوب شرق آسيا لديه القدرة على المساعدة في معالجة سوء التغذية المنتشر والمستمرويساعد في إنتاجية وقدرة التكيف للعديد من المزارعين الصغار في هذه المناطق. ومع ذلك، تُظهر تحليلاتنا أيضًا أنه في العديد من الأماكن، حدث توسع الري حيث كان الضغط المائي موجودًا بالفعل، مما يشير إلى مزيد من استنزاف تدفق المياه والمياه الجوفية في هذه المواقع. بشكل عام، ترسم هذه النتائج صورة مختلطة للتقدم نحو استدامة المياه العالمية وتبرز الفروق العميقة في تحولات الري سواء داخل الدول أو بينها.
مدى زيادة الدول لإنتاج المحاصيل من خلال التوسع غير المستدام في الري سيكون له أيضًا آثار مهمة على الاكتفاء الذاتي الغذائي للأمم وكذلك الأمن الغذائي العالمي، نظرًا للاعتماد المتزايد للعديد من الدول على واردات الغذاء. الدول التي تستمر في ممارسة وتوسيع الزراعة المروية في أماكن حيث المياه نادرة تعرض نفسها لزيادة احتمال أن تصبح موارد المياه العذبة غير متاحة (أي، انخفاض مستوى المياه الجوفية واستنزاف تدفق المياه) وفي النهاية تفرض حدودًا مادية و/أو اقتصادية على مستويات الإنتاج المروي. بالنسبة للدول المستوردة للغذاء (على سبيل المثال، السعودية وجنوب أفريقيا)، قد تتسبب مثل هذه الحالة في تراجع الإنتاج الغذائي المحلي وتستلزم الاعتماد المتزايد على تجارة الغذاء. بالنسبة للدول المصدرة للغذاء (على سبيل المثال، الولايات المتحدة وأستراليا)، قد تضطر الممارسات غير المستدامة في الري إلى تقليل صادرات الغذاء لمواصلة تلبية الطلب المحلي على الغذاء. يعتبر الري المستدام مهمًا بشكل خاص في هذه الدول المصدرة حيث أن فشل موارد المياه قد يكون له آثار متتالية على الدول التي تصدر إليها الغذاء. وبالتالي، فإن ضمان حدوث توسع الري فقط في تلك الأماكن حيث تتوفر موارد المياه بشكل نسبي يمكن أن يتجنب هذه النتائج غير المرغوب فيها. من خلال قياس الأنماط العالمية لتغيير الري، يمكن أن توفر نتائجنا معلومات مفصلة مكانيًا حول الأماكن التي تحتاج فيها التدخلات المستهدفة بشكل عاجل لتجنب أو عكس التوسع غير المستدام في الري.
على الرغم من عدم اليقين المتأصل في مثل هذه الجهود العالمية لرسم الخرائط، يمكن أن تبدأ تحليلاتنا أيضًا في الإشارة إلى المناطق التي كانت فيها السياسات والاستثمارات ناجحة في التقدم نحو إدارة مستدامة لموارد المياه. يمكن أن يوفر فهم الظروف الاجتماعية والسياسية التي مكنت وأعطت معلومات لهذه الأمثلة من التوسع المستدام رؤى قيمة للتطبيقات المحتملة في مواقع وسياقات أخرى. بينما يمكن إطعام حوالي 3.8 مليار شخص إضافي من خلال توسيع الري.تظهر نتائجنا أن الكثير من توسيع الري الذي حدث بالفعل يهدد الجدوى طويلة الأمد لموارد المياه العذبة. حيث إن 129 دولة حالياً خارج المسار لإدارة مواردها المائية بشكل مستدام بحلولتُعتبر الإجراءات العاجلة ضرورية، وستلعب الري المستدام دورًا مركزيًا في ذلك. ولهذا الغرض، يمكّن دراستنا من تحديد الفرص لتحقيق الفوائد المشتركة (على سبيل المثال، زيادة إنتاج الغذاء، تحسين استدامة المياه، وتعزيز التكيف مع المناخ) وتجنب التنازلات، وهو شرط حاسم لتحقيق أهداف التنمية المستدامة المتعددة.بالإضافة إلى قياس استدامة تغيير أنماط الري العالمية والإشارة إلى المواقع التي يُنصح بالتوسع فيها، يمكن أن توفر نتائجنا أيضًا الأساس لتقييم مجموعة من الحلول المحتملة لتقليل استهلاك المياه في الأراضي الزراعية المروية، بما في ذلك تحسين كفاءات الري مقترنة بحدود استهلاك المياه.التحول إلى محاصيل أقل استهلاكًا للمياهحفظ مياه التربةوالتخلي الانتقائي.
بينما تقدم دراستنا تقدمات مهمة في توسيع الري المستدام، سيكون من الحكمة أن نأخذ في الاعتبار النقاط الأربع الرئيسية التالية عند استخدام وتفسير قاعدة بيانات AEI الخاصة بنا. أولاً، التغييرات المبلغ عنها في المناطق المروية تستند إلى أفضل المعلومات المتاحة حول مدى الري العالمي (أي، الخريطة العالمية لمناطق الري).والمراجع 28). وبالتالي، قد يختلف حجم التغيير المقدر في موقع معين اعتمادًا على كيفية إدخال هذه المدخلات
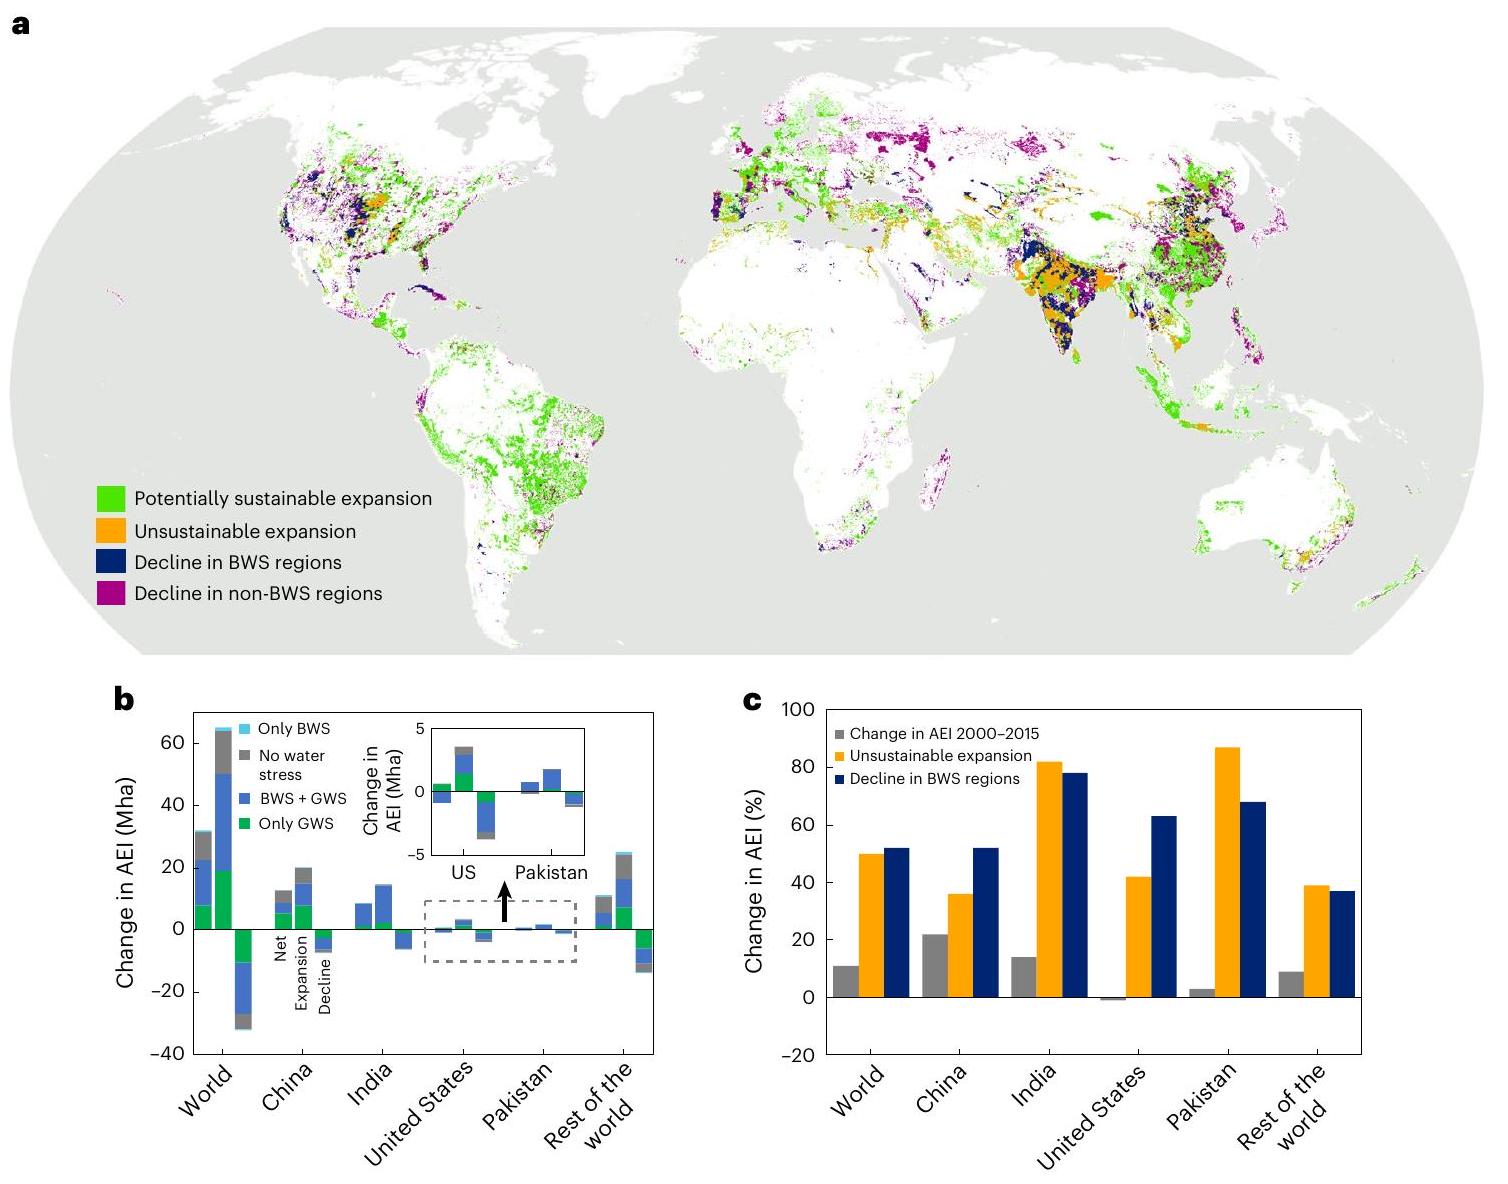
الشكل 4 | استدامة التغيرات في مؤشر استخدام المياه الزراعية في القرن الحادي والعشرين. أ، خريطة توضح أربع فئات من تغيرات مؤشر استخدام المياه الزراعية: التوسع المحتمل المستدام (أي في مناطق المياه الجوفية المستدامة أو عدم وجود ضغط مائي)، التوسع غير المستدام (أي في مناطق المياه الجوفية غير المستدامة أو المياه الجوفية غير المستدامة + المياه الجوفية المستدامة)، الانخفاض في مناطق المياه الجوفية غير المستدامة والانخفاض في المناطق غير المتأثرة بالمياه الجوفية غير المستدامة. موارد المياه الزرقاء وفيرة نسبيًا في المناطق التي تحتوي فقط على مياه جوفية مستدامة أو في المناطق التي لا تعاني من ضغط مائي (أي أنه لا يوجد مياه جوفية غير مستدامة)؛ من الضروري إجراء حساب كامل للتغيرات في الطلب على المياه المحددة للمحاصيل تحت توسع الري بشكل شامل. تحديد ما إذا كان يتم تجنب ضغط المياه في هذه المناطق من التوسع المحتمل المستدام. فقط البكسلات التيتظهر المنطقة التي تحتلها AEI. ب، التغيرات في صافي AEI بالإضافة إلى توسع AEI وانخفاضه من 2000 إلى 2015 حسب فئة ضغط المياه للدول الكبرى. ج، نسبة التغير في صافي AEI من 2000 إلى 2015، ونسبة توسع AEI غير المستدام (أي في مناطق BWS) ونسبة انخفاض AEI في مناطق BWS. خريطة الأساس في أ من GADM..
الجدول 2 | الدول التي شهدت أكبر توسع صافي في مؤشر التعليم البيئي في المناطق التي تعاني بالفعل من نقص المياه
بلد
التوسع غير المستدام (% من التوسع الإجمالي)
التغيير الصافي في AEI في مناطق BWS أو BWS+GWS (مليون هكتار)
الهند
82
7.3
الصين
٣٦
٣.٥
إيران
63
1.1
بنغلاديش
92
1.0
أستراليا
٥٧
0.9
تايلاند
٨٠
0.7
باكستان
87
0.7
فيتنام
٤٥
0.4
مصر
79
0.3
إندونيسيا
٢٢
0.2
الجزائر
٣٤
0.2
تحدد مجموعات البيانات الري وأين يتم ذلك. علاوة على ذلك، اعتمادًا على خريطة المساحة المروية العالمية المستخدمة، قد لا يتم التقاط التغيرات في مؤشر كفاءة الري في بعض المواقع (على سبيل المثال، سيرادو البرازيل وولايات تشهاتيسغاره وأوديشا في الهند) حيث تم إنشاء أراضٍ زراعية جديدة. تم تأسيسها من خلال تغيير استخدام الأراضي. ثانياً، قد لا تعكس التغييرات في مؤشر الأراضي الزراعية (AEI) التي بحثنا فيها هنا التغييرات في المنطقة التي يتم ريها فعلياً بشكل مثالي. على سبيل المثال، قد تكون تقديراتنا لانخفاض المساحة المروية مخففة في المواقع التي لا تزال فيها بنية تحتية للري ولكن تم التخلي عنها (على سبيل المثال، الدول السوفيتية السابقة). هذه الفجوة بين AEI والمساحة المروية الفعلية أقل إشكالية عند النظر في التوسع، حيث إن الاستثمار النشط في وتطوير بنية تحتية للري الموسعة يشير إلى أن المنطقة تُستخدم بنشاط. وبالمثل، نلاحظ أيضاً أن نهجنا لا يسمح لنا بالتقاط الديناميات الزمنية الدقيقة للمناطق المروية فعلياً، والتي يمكن أن تتفاوت بين السنوات وبحسب الموسم. ستكون الأساليب لدمج البيانات حول AEI والمساحة المروية فعلياً خطوة مهمة في فهم ديناميات الري العالمية بشكل أفضل. ثالثاً، بالنسبة لعدد من الدول، على سبيل المثال، في أفريقيا جنوب الصحراء الكبرى، تتوفر إحصائيات الري فقط على المستوى الوطني (الجدول التكميلي 4). وبالتالي، يجب إجراء تقييمات التغيرات على مستوى خلايا الشبكة في هذه الأماكن بحذر.. بالنسبة للإصدارات المستقبلية من قاعدة بيانات AEI هذه، ستعالج مجموعة من التحديثات لخرائط الري العالمية بالإضافة إلى إحصائيات الري الموزعة مكانيًا للدول التي تعاني من نقص البيانات حاليًا هذه القيود إلى حد كبير. رابعًا، تعتمد تقديراتنا للتوسع المستدام وغير المستدام في الري على كيفية تعريف ندرة المياه وكيفية تقدير الطلب على مياه المحاصيل. وبالتالي، فإن نهجنا مرن عمدًا ليتضمن تعريفات وتقديرات مختلفة للضغط المائي العالمي. في المناطق التي قدّرنا التوسع المستدام المحتمل (أي، فقط GWS أو عدم وجود ضغط مائي)، سيكون من الضروري إجراء حساب كامل للتغيرات في الطلب على المياه حسب المحاصيل تحت توسع الري لتحديد ما إذا كانت ظروف الضغط المائي لا تزال تُتجنب بشكل شامل. بالإضافة إلى ذلك، فإن BWS قد زاد مع مرور الوقت.، هذا يشير إلى أن تقديراتنا لتوسع الري غير المستدام قد تكون أقل من الواقع. على النقيض من ذلك، قد يتم المبالغة في تقدير ضغط المياه في المناطق التي لم يتم فيها تقييم الموارد المائية بشكل صحيح مع الأخذ في الاعتبار التحويلات بين الأحواض والشبكات الكبيرة لنقل المياه، على سبيل المثال، في الهند وباكستان وحوض النيل.
تقدم تقييمنا معلومات حيوية لت quantifying وقياس تقدم الزراعة المروية العالمية. من المحتمل أن يكون للاختلاف المكاني الدقيق في أنماط الري المتغيرة التي لاحظناها آثار تتجاوز خطوات سلسلة إمداد الغذاء اللاحقة.وتغيير نظام الغذاء بالكاملتتمتع الأساليب الشاملة والمنسقة لتعزيز الري التي تأخذ في الاعتبار هذه الترابطات بإمكانية تعظيم الفوائد البيئية والاجتماعية والاقتصادية مع تقليل التنازلات.. ومع ذلك، توضح دراستنا أيضًا بوضوح أن توسيع الري لا يزال يحدث في المناطق التي تعاني من نقص المياه، إما لأن الجهود الحالية لم تكن فعالة في تحديد أو تحقيق أهداف استدامة المياه في العديد من الأماكن، أو لأن الاستدامة طويلة الأمد لموارد المياه العذبة تظل ثانوية مقارنة بأولويات اجتماعية أخرى في هذه المواقع. وبالتالي، فإن ضمان عدم تعارض تلبية احتياجات المياه للبشرية – لزيادة إنتاج الغذاء وتلبية احتياجات أخرى – مع أبعاد الاستدامة الأخرى أمر حاسم للانتقال إلى ما بعد أوجه القصور في الثورة الخضراء وتحقيق أهداف التنمية المستدامة المتعددة.
طرق
المصطلحات
المتغير الرئيسي الذي تم رسمه في هذه الدراسة هو AEI، والذي يُعرف بأنه مساحة الأرض المجهزة بالبنية التحتية لتوفير المياه لـ. يشمل مناطق مجهزة للري السطحي، والري بالتحكم الكامل أو الجزئي، وري الفيضانات، والمناطق المنخفضة المجهزةلكنها تستثني جمع مياه الأمطار. كما تم تضمين المناطق التي تُروى موسمياً وتتحول بين الزراعة المعتمدة على الأمطار والزراعة المروية.
لتعريف ضغط المياه، اتبعنا مصطلحات المرجع 51 الذي عرف ضغط المياه كنسبة المياه المستخدمة (أي الاستهلاك) إلى إجمالي توفر المياه.
مصادر البيانات
تم أخذ الحدود الإدارية دون الوطنية من قاعدة بيانات المناطق الإدارية العالمية(الإصدار 3.6). جاءت المعلومات حول المناطق المجهزة للري في عام 2005 من الخريطة العالمية لمناطق الري (دقة 5 دقائق قوسية)جاءت بيانات الأراضي الزراعية والمراعي للسنوات من 2000 إلى 2015 من قاعدة بيانات تاريخ البيئة العالمية (HYDE، الإصدار 3.2، دقة 5 دقائق قوسية).
حصلنا على إحصائيات AEI من ثلاثة مصادر دولية رئيسية لجميع البلدان منذ عام 2000 فصاعدًا: FAOSTAT، AQUASTAT و EUROSTAT، بالإضافة إلى بيانات من عدة تعداد وطني (الجدول التكميلي 4). تجمع بعض البلدان ذات المساحات الكبيرة من الأراضي المروية (مثل كندا والصين والهند والولايات المتحدة) وتبلغ عن بيانات فقط عن المساحة المروية فعليًا (AAI؛ الجدول التكميلي 4). نظرًا لأن AEI تشير إلى جميع الأراضي المجهزة للري، نتوقع أن تكون AAI أقل أو تساوي AEI لدولة ما. يمكن أن تكون AAI أقل من AEI عندما لا يتم استخدام جزء من البنية التحتية للري، نتيجة لزراعة المحاصيل المعتمدة على الأمطار، أو ببساطة لأن الأرض لم تُستخدم في الزراعة (تُركت بورا). في هذه الحالات، قمنا بتعديل إحصائيات AAI لتتناسب مع قيم AEI المبلغ عنها.
لتطوير قاعدة البيانات المكانية لـ AEI، جمعنا أولاً إحصائيات المناطق المروية على المستوى الفرعي من مصادر وطنية ودولية متعددة (الجدول التكميلي 4). تم أخذ العديد من إحصائيات الري حول AEI من قواعد بيانات منظمة الأغذية والزراعة (FAO) AQUASTAT و FAOSTAT وبيانات الري التاريخية
مجموعة البيانات. استخدمنا أيضًا بيانات من EUROSTAT (للسنوات 2007 و2010 و2013 و2016)، التي تبلغ عن بيانات حول AEI (الأراضي القابلة للري) للدول في الاتحاد الأوروبي على مستوى الوحدات الإقليمية للتصنيف الإحصائي 2. بالإضافة إلى هذه القواعد البيانات الدولية والعالمية، حصلنا على بيانات من التعدادات الوطنية، والاستطلاعات، والتقارير، والكتب الإحصائية السنوية للعديد من البلدان حيث تحتوي هذه المصادر غالبًا على معلومات بتفاصيل مكانية أكبر (الجدول التكميلي 4).
اتباعًا للمنهجية في المرجع 12، قمنا بمعالجة بيانات الري مسبقًا باستخدام تنسيق نوع البيانات والتوافق الزمني للقضاء على التناقضات في إحصائيات الري بين مصادر المعلومات وعلى مر السنين. استخدمنا تنسيق نوع البيانات عندما اختلف تعريف الأراضي المروية في الإحصائيات عن تعريف AEI المستخدم في هذه الدراسة. استخدمنا التوافق الزمني عندما لم تتطابق خطوات الوقت لبيانات الإدخال تمامًا مع خطوات الوقت المحددة مسبقًا لهذه المجموعة من البيانات. على وجه التحديد، قمنا بالتداخل الخطي للبيانات بين السنوات المتاحة لمطابقة السنة مع السنة الدراسية الدقيقة. تم تنفيذ ذلك على المستويين الوطني والفرعي (المعلومات التكميلية).
تخفيض مستوى خلية الشبكة
ثم قمنا بتخفيض قاعدة البيانات العالمية المنظفة لـ AEI إلى دقة 5 دقائق قوسية وفقًا للمرجع 12. كان الهدف من هذه الخطوة هو تخصيص معلومات AEI مكانيًا من الإحصائيات الفرعية إلى كل خلية شبكة 5 دقائق قوسية بحيث كانت مجموع AEI المعينة لخلايا الشبكة تساوي AEI للإحصائيات الفرعية لوحدة الإدارة الفرعية والسنة المقابلة. كانت هذه العملية تهدف أيضًا إلى ضمان أن تكون قيمة AEI المعينة لكل خلية شبكة أقل من أو تساوي مجموع مساحة الأراضي الزراعية والمراعي في تلك السنة. ومع ذلك، بالنسبة لبعض الوحدات الإدارية، كانت AEI أكبر من مجموع مساحة الأراضي الزراعية والمراعي في سنة معينة. في هذه الحالات، أعطينا الأولوية لتعظيم التوافق مع إما إحصائيات الري الفرعية أو مجموعة بيانات HYDE (انظر المعلومات التكميلية للحصول على منهجية مفصلة والجدول التكميلي 1). تم تكرار جميع الحسابات باستخدام المرجع 28 الخريطة العالمية للمساحة المروية فعليًا (الأشكال التكميلية 6-9 والجدول التكميلي 1 و2).
التحقق
تم التحقق من خرائط AEI العالمية لعام 2015 مقابل الخريطة العالمية للري في المرجع 14 (الأشكال التكميلية 1 و2)، حيث تم العثور على قيم 0.56 لمناطق الري ذات الكثافة المنخفضة إلى المتوسطة و0.78 لمناطق الري ذات الكثافة العالية. تم التحقق من خرائط AEI الناتجة لعام 2015 للصين، الهند والولايات المتحدة باستخدام منتجات بيانات الاستشعار عن بعد، حيث تم العثور على دقة عامة و0.91 على مستوى البكسل، على التوالي. قد تكون الدقة المنخفضة للصين والهند نتيجة للاختلافات في نطاق الزراعة (من الصعب تحديد المزارع الصغيرة عبر الاستشعار عن بعد)، وتقنيات الري المستخدمة (من الصعب تحديد الري بالفيض أو الحدود مقارنة بالرشاشات في الولايات المتحدة)، والعوامل الطبوغرافية (التضاريس المعقدة في الصين) والعوامل المناخية (المناخ شبه الاستوائي يؤدي إلى صور ضبابية مستشعرة عن بعد). علاوة على ذلك، تعاني هذه المنتجات من الاستشعار عن بعد من عدم وجود تحقق من الحقائق الأرضية أو التحقق (في حالة خريطة الهند، مما يمنع تقدير دقة الخريطة) ومستويات دقة منخفضة (الدقة العامة المبلغ عنها في حالة خريطة الصين، مما يعني نطاقًا كبيرًا من عدم اليقين)، بينما تم التحقق من المنتج الأمريكي بشكل جيد. على الرغم من الطرق المختلفة تمامًا التي يتم بها اشتقاق تقديرات الري عبر الاستشعار عن بعد (من خلال قياسات غير مباشرة لخصائص السطح) أو التعداد الزراعي (من خلال استطلاعات المزارعين)، وجدنا بشكل مشجع توافقًا عاليًا على مستويات أكثر تجميعًا (الأشكال التكميلية 2-4). بعد التحقق من تقديراتنا مقابل جميع المصادر المستقلة الممكنة الأخرى، نؤكد أن تقديراتنا (1) تستند إلى معالجة منهجية لأفضل السجلات الإحصائية المتاحة لـ AEI لكل دولة باستخدام مصطلحات ومنهجية متسقة، (2) تقع ضمن نطاق منتجات البيانات الأخرى المعروفة جيدًا و(3) توفر معلومات متسقة منذ عام 1900 (وهو أمر فريد ولا يمكن تحقيقه
من خلال طرق أخرى مثل الاستشعار عن بعد). تجعل هذه الخصائص مجموعة بياناتنا مناسبة تمامًا لمعالجة هدف بحثنا: استكشاف الاتجاهات المكانية الزمنية على نطاق عالمي في تطوير الأراضي المروية فيما يتعلق بظروف ضغط المياه.
مقارنة تغييرات الري والمناطق المتأثرة بالضغط المائي
تم تحديد مواقع وأحجام توسيع AEI وتقلصها من خلال الفرق بين خرائط AEI لكل خلية شبكة للسنوات 2000 و2015. بعد ذلك، تم دمج خريطة الفرق الناتجة مع خرائط (5 دقائق قوسية، لسنة 2000) من BWS وGWS الشهرية الموجودة، والتي تأخذ في الاعتبار الري، واستهلاك المياه المجتمعي الآخر ومتطلبات التدفق البيئي، مأخوذة من المرجع 22. وهذا مكننا من تحديد المواقع التي حدث فيها توسيع AEI تحت أربع فئات من ظروف ضغط المياه الموجودة (أي، لسنة 2000): (1) كل من BWS وGWS، (2) BWS ولكن لا يوجد GWS، (3) GWS ولكن لا يوجد BWS و(4) لا ضغط مائي. تم تعريف توسيع AEI في الفئتين الأوليين على أنه ‘غير مستدام’ لأنه سيزيد من استنزاف موارد المياه السطحية والجوفية. تم تكرار نفس الخطوات لمناطق تقلص AEI، حيث تم تعريف تقلص AEI في الفئتين الأوليين على أنه ‘مستدام محتمل’. بعبارة أخرى، ستظهر أكثر النتائج استدامة لتغييرات AEI توسيع AEI في الأماكن التي تكون فيها موارد المياه السطحية والجوفية وفيرة نسبيًا وتقلص AEI في الأماكن التي تكون فيها موارد المياه نادرة نسبيًا. تم اختيار مجموعة بيانات ضغط المياه هذه بسبب توافقها من حيث الدقة المكانية مع خرائط AEI لهذه الدراسة (لتجنب التجميع أو إعادة العينة غير الضرورية)، وتزامنها مع بداية فترة الدراسة (لتمكين تقييم ظروف ضغط المياه الموجودة)، وقياسها لكل من ضغط المياه الشهري والسنوي (للتقاط مواقع الطلب غير المستدام على المياه الموسمية). نلاحظ أن نهجنا يمكن أن يتضمن بسهولة مجموعات بيانات بديلة تقيس الأنماط العالمية لضغط المياه أو الندرة.
توفر البيانات
جميع البيانات المستخدمة في هذه الدراسة متاحة للجمهور من خلال https://zenodo.org/record/7809342أو عند الطلب من المؤلف المقابل.
توفر الشيفرة
جميع الشيفرات المستخدمة في هذه الدراسة متاحة عند الطلب من المؤلف المقابل.
Global Agriculture Towards 2050 (FAO, 2009); https://www.fao. org/fileadmin/templates/wsfs/docs/Issues_papers/HLEF2O5O_ Global_Agriculture.pdf
Foley, J. A. et al. Solutions for a cultivated planet. Nature 478, 337-342 (2011).
Mueller, N. D. et al. Closing yield gaps through nutrient and water management. Nature 490, 254-257 (2012).
Wang, X. et al. Global irrigation contribution to wheat and maize yield. Nat. Commun. 12, 1236 (2021).
Portmann, F. T., Siebert, S. & Döll, P. MIRCA2OOO-global monthly irrigated and rainfed crop areas around the year 2000: a new high-resolution data set for agricultural and hydrological modeling. Global Biogeochem. Cycles 24, GB1011 (2010).
Water in Agriculture (World Bank, 2020); https://www.worldbank. org/en/topic/water-in-agriculture
Hoekstra, A. Y. & Mekonnen, M. M. The water footprint of humanity. Proc. Natl Acad. Sci. USA 109, 3232-3237 (2012).
Brauman, K. A., Richter, B. D., Postel, S., Malsy, M. & Flörke, M. Water depletion: an improved metric for incorporating seasonal and dry-year water scarcity into water risk assessments. Elementa 2016, 1-12 (2016).
D’Odorico, P. et al. The global food-energy-water nexus. Rev. Geophys. 56, 456-531 (2018).
Chiarelli, D. D. et al. Competition for water induced by transnational land acquisitions for agriculture. Nat. Commun. 13, 505 (2022).
Siebert, S. et al. A global data set of the extent of irrigated land from 1900 to 2005. Hydrol. Earth Syst. Sci. 19, 1521-1545 (2015).
Deines, J. M., Kendall, A. D. & Hyndman, D. W. Annual irrigation dynamics in the US northern High Plains derived from Landsat satellite data. Geophys. Res. Lett. 44, 9350-9360 (2017).
Nagaraj, D., Proust, E., Todeschini, A., Rulli, M. C. & D’Odorico, P. A new dataset of global irrigation areas from 2001 to 2015. Adv. Water Resour. 152, 103910 (2021).
Xie, Y., Gibbs, H. K. & Lark, T. J. Landsat-based Irrigation Dataset (LANID): 30 m resolution maps of irrigation distribution, frequency, and change for the US, 1997-2017. Earth Syst. Sci. Data 13, 5689-5710 (2021).
Ambika, A. K., Wardlow, B. & Mishra, V. Remotely sensed high resolution irrigated area mapping in India for 2000 to 2015. Sci. Data 3, 160118 (2016).
Goldewijk, K. K., Beusen, A., Doelman, J. & Stehfest, E. Anthropogenic land use estimates for the Holocene-HYDE 3.2. Earth Syst. Sci. Data 9, 927-953 (2017).
Siebert, S., Henrich, V., Frenken, K. & Burke, J. Update of the Digital Global Map of Irrigation Areas to Version 5171 (Rheinische Friedrich-Wilhelms-University and Food and Agriculture Organization of the United Nations, 2013); https://doi. org/10.13140/2.1.2660.6728
Rosa, L., Chiarelli, D. D., Rulli, M. C., Dell’Angelo, J. & D’Odorico, P. Global agricultural economic water scarcity. Sci. Adv. 6, eaaz6031 (2020).
Wang, J. et al. Forty years of irrigation development and reform in China. Aust. J. Agric. Resour. Econ. 64, 126-149 (2020).
Birthal, P. S., Joshi, P. K., Negi, D. S. & Agarwal, S. Changing Sources of Growth in Indian Agriculture: Implications for Regional Priorities for Accelerating Agricultural Growth Discussion Paper No. 01325 (IFPRI, 2014); http://ebrary.ifpri.org/cdm/ref/collection/ p15738coll2/id/128025
Romania-Irrigation Rehabilitation and Reform Project: Restructuring: Main report (English). Report No. 55568 (World Bank Group, 2010); http://documents.worldbank.org/curated/ en/352081468296098754/Main-report
Rosa, L. et al. Potential for sustainable irrigation expansion in a warmer climate. Proc. Natl Acad. Sci. USA 117, 29526-29534 (2020).
Meier, J., Zabel, F. & Mauser, W. A global approach to estimate irrigated areas-a comparison between different data and statistics. Hydrol. Earth Syst. Sci. 22, 1119-1133 (2018).
FAO, IFAD, UNICEF, WFP & WHO The State of Food Security and Nutrition in the World 2021. Transforming Food Systems for Food Security, Improved Nutrition and Affordable Healthy Diets for All (FAO, 2021); https://www.fao.org/documents/card/en/c/cb4474en
Samberg, L. H., Gerber, J. S., Ramankutty, N., Herrero, M. & West, P. C. Subnational distribution of average farm size and smallholder contributions to global food production. Environ. Res. Lett. 11, 174-186 (2016).
Ricciardi, V., Mehrabi, Z., Wittman, H., James, D. & Ramankutty, N. Higher yields and more biodiversity on smaller farms. Nat. Sustain. 4, 651-657 (2021).
Kummu, M. et al. Interplay of trade and food system resilience: gains on supply diversity over time at the cost of trade independency. Glob. Food Sec. 24, 100360 (2020).
Jain, M. et al. Groundwater depletion will reduce cropping intensity in India. Sci. Adv. 7, eabd2849 (2021).
Dalin, C., Wada, Y., Kastner, T. & Puma, M. J. Groundwater depletion embedded in international food trade. Nature 543, 700-704 (2017).
Rosa, L. et al. Closing the yield gap while ensuring water sustainability. Environ. Res. Lett. 13, 14762 (2018).
Sachs, J., Kroll, C., Lafortune, G., Fuller, G. & Woelm, F. The Decade of Action for the Sustainable Development Goals: Sustainable Development Report 2021 (Sustainable Development Solutions Network, Cambridge Univ. Press, 2021); https://doi. org/10.1017/9781009106559
Zhang, X. et al. Quantitative assessment of agricultural sustainability reveals divergent priorities among nations. One Earth 4, 1262-1277 (2021).
Jägermeyr, J. et al. Water savings potentials of irrigation systems: global simulation of processes and linkages. Hydrol. Earth Syst. Sci. 19, 3073-3091 (2015).
Grafton, R. Q. et al. The paradox of irrigation efficiency. Science 361, 748-750 (2018).
Marston, L. T. et al. Reducing water scarcity by improving water productivity in the United States. Environ. Res. Lett. 15094033 (2020).
Chakraborti, R. et al. Crop switching for water sustainability in India’s food bowl yields co-benefits for food security and farmers’ profits. Nat. Water 1, 864-878 (2023).
Davis, K. F., Rulli, M. C., Seveso, A. & D’Odorico, P. Increased food production and reduced water use through optimized crop distribution. Nat. Geosci. 10, 919-924 (2017).
Richter, B. D. et al. Water scarcity and fish imperilment driven by beef production. Nat. Sustain. 3, 319-328 (2020).
Richter, B. D. et al. Alleviating water scarcity by optimizing crop mixes. Nat. Water 1, 1035-1047 (2023).
Puy, A. et al. The delusive accuracy of global irrigation water withdrawal estimates. Nat. Commun. 13, 3183 (2022).
Mekonnen, M. M. & Hoekstra, A. Y. Four billion people facing severe water scarcity. Sci. Adv. 2, e1500323 (2016).
Davis, K. F., Downs, S. & Gephart, J. A. Towards food supply chain resilience to environmental shocks. Nat. Food 2, 54-65 (2021).
Herrero, M. et al. Articulating the effect of food systems innovation on the Sustainable Development Goals. Lancet Planet. Health 5, e50-e62 (2021).
O’Neill, D. W., Fanning, A. L., Lamb, W. F. & Steinberger, J. K. A good life for all within planetary boundaries. Nat. Sustain. 1, 88-95 (2018).
AQUASTAT Periodical Detailed Survey on Water and Agriculture. AQUASTAT Detailed Survey. Country Survey on Water Use for Agriculture and Rural Development (FAO, 2014).
Kummu, M. et al. The world’s road to water scarcity: shortage and stress in the 20th century and pathways towards sustainability. Sci. Rep. 6, 38495 (2016).
Xiang, K., Yuan, W., Wang, L. & Deng, Y. An LSWI-based method for mapping irrigated areas in China using moderate-resolution satellite data. Remote Sens. 12, 4181 (2020).
Brown, J. F. & Pervez, M. S. Merging remote sensing data and national agricultural statistics to model change in irrigated agriculture. Agric. Syst. 127, 28-40 (2014).
الشكر والتقدير
تم دعم م.ك. من قبل مشاريع ممولة من مجلس أبحاث فنلندا WATVUL (رقم المنحة 317320) وTREFORM (رقم المنحة 339834)، برنامج العلم الرائد لمجلس أبحاث فنلندا تحت مشروع المياه الرقمية (رقم المنحة 359248)، والمجلس الأوروبي للبحث (ERC) تحت برنامج أفق 2020 للبحث والابتكار التابع للاتحاد الأوروبي (SOS.aquaterra، رقم اتفاقية المنحة 819202). حصلت س.س. على تمويل من مؤسسة الأبحاث الألمانية (Deutsche Forschungsgemeinschaft؛ SFB 1502-1-2022، رقم المشروع 450058266). تم دعم ك.ف.د. و ل.م. من قبل المعهد الوطني للغذاء والزراعة التابع لوزارة الزراعة الأمريكية (رقم المنحة 2022-67019-37180). تم دعم ك.ف.د. أيضًا من قبل صندوق الأبحاث العامة بجامعة ديلاوير. تم دعم و.إكس.، ت.أ. و ق.د. من قبل البرنامج الوطني الرئيسي للبحث والتطوير في الصين (رقم المنحة 2023YFD2300301) وNSFC (72261147472، 72348003)
مساهمات المؤلفين
قام ب.م. و ك.ف.د. بتصور الدراسة. صمم ب.م.، س.س.، م.ك. و ك.ف.د. جميع التحليلات. جمع ب.م.، ق.د.، ت.أ.، ل.م. و و.إكس. البيانات. قام ب.م. و س.س. بإجراء التحليلات. كتب ب.م. و ك.ف.د. المسودة الأولى من الورقة. ساهم جميع المؤلفين في كتابة ومراجعة الورقة.
ملاحظة الناشر تظل Springer Nature محايدة فيما يتعلق بالمطالبات القضائية في الخرائط المنشورة والانتماءات المؤسسية.
الوصول المفتوح هذه المقالة مرخصة بموجب رخصة المشاع الإبداعي للاستخدام والمشاركة والتكيف والتوزيع وإعادة الإنتاج في أي وسيلة أو صيغة، طالما أنك تعطي الائتمان المناسب للمؤلفين الأصليين والمصدر، وتوفر رابطًا لرخصة المشاع الإبداعي، وتوضح ما إذا تم إجراء تغييرات. الصور أو المواد الأخرى من طرف ثالث في هذه المقالة مشمولة في رخصة المشاع الإبداعي للمقالة، ما لم يُذكر خلاف ذلك في سطر الائتمان للمادة. إذا لم تكن المادة مشمولة في رخصة المشاع الإبداعي للمقالة واستخدامك المقصود غير مسموح به بموجب اللوائح القانونية أو يتجاوز الاستخدام المسموح به، ستحتاج إلى الحصول على إذن مباشرة من صاحب حقوق الطبع والنشر. لعرض نسخة من هذه الرخصة، قم بزيارة http://creativecommons. org/licenses/by/4.0/.
قسم الجغرافيا والعلوم المكانية، جامعة ديلاوير، نيوارك، ديلاوير، الولايات المتحدة الأمريكية.قسم علوم المحاصيل، جامعة غوتنغن، غوتنغن، ألمانيا.قسم البيئة المبنية، جامعة آلتو، إسبو، فنلندا.مدرسة الاقتصاد وإدارة الموارد، جامعة بكين نورمال، بكين، الصين.مدرسة الاقتصاد والإدارة، جامعة جيانغشي الزراعية، نانتشانغ، الصين.قسم الهندسة المدنية والبيئية، معهد فرجينيا للتكنولوجيا وجامعة الولاية، بلاكسبرغ، فيرجينيا، الولايات المتحدة الأمريكية.مركز الصين للسياسة الزراعية، مدرسة العلوم الزراعية المتقدمة، جامعة بكين، بكين، الصين.قسم علوم النبات والتربة، جامعة ديلاوير، نيوارك، ديلاوير، الولايات المتحدة الأمريكية.البريد الإلكتروني: piyush@udel.edu
The expansion of irrigated agriculture has increased global crop production but resulted in widespread stress on freshwater resources. Ensuring that increases in irrigated production occur only in places where water is relatively abundant is a key objective of sustainable agriculture and knowledge of how irrigated land has evolved is important for measuring progress towards water sustainability. Yet, a spatially detailed understanding of the evolution of the global area equipped for irrigation (AEI) is missing. In this study, we used the latest subnational irrigation statistics (covering 17,298 administrative units) from various official sources to develop a gridded ( 5 arcmin resolution) global product of AEI for the years 2000, 2005, 2010 and 2015. We found that AEI increased by from 2000 ( 297 Mha ) to , with areas of both substantial expansion, such as northwest India and northeast China, and decline, such as Russia. Combining these outputs with information on green (that is, rainfall) and blue (that is, surface and ground) water stress, we also examined to what extent irrigation has expanded unsustainably in places already experiencing water stress. We found that more than half (52%) of the irrigation expansion has taken place in areas that were already water-stressed in the year 2000, with India alone accounting for of global unsustainable expansion. These findings provide new insights into the evolving patterns of global irrigation with important implications for global water sustainability and food security.
The global population is projected to increase to over 10 billion people by 2050 (ref. 1) and food production will need to increase substantially to meet the associated food demand of the growing population . Because increasing the amount of cropland area would mean the conversion of forests and other ecosystems , intensifying agriculture on existing croplands by sustainably increasing irrigation and other inputs is a promising potential alternative . While irrigated areas account for 24% of croplands, roughly 40% of global food production is from
irrigated croplands . In addition, over 90% of humanity’s consumptive water use is used for irrigated agricultural production . Depending on the relative water demand and availability in a location, this extensive water use can alter the water cycle, deplete aquifers and surface water bodies , increase water stress and escalate competition for freshwater resources . Given the critical role that irrigation will probably play in meeting future food demand and the highly heterogeneous nature of water availability and demand, it is essential to understand how spatial
Fig. 1 | Global map of area equipped with irrigation (AEI) in 2015. Map of global AEI showing areas of high potential irrigation activity. Each 5 arcmin pixel shows the percentage of AEI. Only pixels having 1% AEI or higher are shown. Basemap from GADM .
patterns of global irrigation have recently evolved and to evaluate whether these changes have tended to occur in locations where water resources are relatively abundant or scarce.
Several global and regional efforts have begun to address the challenges of mapping spatial patterns and temporal trends in irrigation. Datasets on the extent of irrigated land have been developed at global and regional scales, but these analyses do not have the spatio-temporal coverage to evaluate the (un)sustainability of irrigation changes since the start of the century. A growing number of studies have also attempted to map irrigated areas at global or national scales using satellite imagery and remotely sensed data . While these studies often provide fine spatial resolution, the resultant maps are not necessarily consistent with irrigation statistics and do not include areas that were equipped for irrigation but not actively in use in the year of the assessment . Other databases offer greater temporal coverage but for coarse national or subnational units, limiting their utility in spatially explicit assessments of irrigation changes with respect to regions experiencing water scarcity. While all of these efforts have provided valuable insights into aspects of either spatial patterns or temporal trends of global irrigation, there remains a critical need for information on the global irrigated area that is both spatially and temporally detailed to examine the sustainability of the evolution of irrigated areas in the twenty-first century. Specifically, a global assessment of whether changes in irrigated area have occurred in locations where conditions of water scarcity already existed is still missing, which could shed new light on the extent to which investments in irrigation infrastructure across the world’s croplands have taken into account the state of water availability and sustainability in a particular location.
In this study, we quantified the water sustainability of changes in the global area equipped for irrigation (AEI) since the start of the century. To do so, we first gathered national and subnational irrigation statistics from the year 2000 through to 2015 for 243 countries (consisting of 17,298 administrative units) from international databases, national agricultural censuses and government reports. This focus on AEI, as opposed to the area actually irrigated, is advantageous for examining broader temporal trends and minimizing the errors of harmonizing different agricultural census reference years across countries. We then combined these data with global gridded maps of cropland , pastureland and irrigated area into a spatial allocation and downscaling model to develop global gridded ( 5 arcmin) maps of AEI for the years 2000, 2005, 2010 and 2015. Where there was temporal and spatial overlap, we compared our maps with existing gridded products. Assessing the spatial patterns of AEI expansion and decline,
we overlaid global maps of blue (that is, surface and ground) and green (that is, rainfall) water stress to evaluate the fraction of AEI changes that have occurred in water-stressed regions (that is, unsustainable) since the start of the century. This new understanding of the sustainability of recent changes in global irrigation could point to areas that have had success in sustainable irrigation expansion and inform strategies to address undesirable water scarcity outcomes.
Results
Changing patterns of global irrigation
We found that the global AEI in the year 2015 was 329 Mha (Fig. 1), with Asia dominating, accounting for 222 Mha (68%) of the total AEI, followed by North America ( ) and Europe ( ). China ( 72 Mha ), India ( 70 Mha ) and the United States ( 28 Mha ) alone accounted for more than half (52%) of the total global AEI.
We also estimated that the global AEI increased on net by 33 Mha ( ) from the year 2000 ( 297 Mha ; Fig. 2). This net increase was the result of a 65 Mha gross increase in AEI in some areas and a 32 Mha gross decrease in other areas (Fig. 3). Asia and South America observed the largest net increases in AEI of about and , respectively, followed by Africa ( ) and Oceania ( 1.7 Mha , ). The countries in which irrigation expanded (on net) the most were China ( 12.8 Mha ) and India ( 8.5 Mha ; Table 1 and Supplementary Table 3 for a full list of countries). A major reason behind this expansion is the increasing investment in irrigation projects to maintain food self-sufficiency . AEI expansion was exceptionally large in relative terms in Brazil, where AEI more than doubled in the period 2000-2015 (Table 1).
In Europe, AEI decreased by 4.8 Mha overall (-13%), which is largely attributable to former centrally controlled irrigation infrastructure designed to serve very large irrigation schemes going out of operation and adverse economic conditions in Eastern European countries, for example, Romania and Russia . Other countries, such as Japan ( ) and Saudi Arabia ( ), also saw substantial declines in the extent of irrigation (Fig. 2 and Supplementary Table3), potentially due to a growing reliance on food imports . Overall, these findings point to substantial shifts in irrigation patterns since the start of the century.
The state of water stress in areas of irrigation change
Of equal importance to shifts in AEI is the extent to which these shifts have occurred in locations where water resources are relatively abundant and can potentially support additional blue water demand without
Fig. 2 | Area equipped for irrigation (AEI) for major countries between 2000 and 2015. The global AEI shows a net increase for the period 2000-2015. Countries are arranged in order of increasing AEI (top to bottom) in the year 2000.
Fig. 3 | Global changes in AEI from 2000 to 2015. a, Global map showing areas that have experienced an increase in AEI and areas that have seen a decline in AEI. Areas of AEI expansion are shown in blue and areas of AEI decline are shown
in purple as percentage changes. , The insets in a show the western United States (b), India (c) and eastern China (d). Only pixels with 1% AEI or higher are shown. Basemap from GADM .
depleting streamflow or aquifers (that is, sustainable expansion). We assessed potentially sustainable AEI expansion by combining our spatio-temporal AEI database with information on global patterns of water stress. We define water stress as the condition in which consumptive demand (that is, withdrawals minus return flows) by all sectors exceeds freshwater availability . Water stress can be the result of either green water stress (GWS), when rainfall is insufficient to meet a crop’s water requirement and supplementary irrigation is needed, or blue
water stress (BWS), when renewable surface and groundwater availability (that is, total availability after accounting for environmental flows) is insufficient to meet irrigation water demand. In the case of GWS, expansion of irrigation infrastructure can be a valuable strategy for buffering against variations in rainfall, provided that blue water resources are sufficiently available. In the case of BWS, expansion of irrigation infrastructure can lead to enhanced depletion of aquifers and streamflow.
Table 1 | Countries with the largest net positive and net negative changes in AEI
Country
AEl net change (Mha)
AEI net change (%)
China
12.8
+22
India
8.5
+14
Brazil
3.6
+113
Iran
1.7
+22
Australia
1.5
+41
Indonesia
1.2
+22
Bangladesh
1.1
+25
Vietnam
1.0
+26
Peru
0.9
+52
Thailand
0.8
+15
Japan
-0.3
-11
Cuba
-0.3
-36
Kazakhstan
-1.4
-40
Russia
-2.0
-53
Romania
-2.2
-83
Rest of the world
6.1
+5
Of the 65 Mha of gross irrigation expansion that we observed, 1.1 Mha occurred in regions with only BWS, 19 Mha occurred in regions with only GWS, 31.2 Mha occurred in regions with both BWS and GWS, and 13.9 Mha occurred in regions with no water stress (Fig. 4). This means that approximately of gross AEI expansion has been unsustainable, taking place in locations already experiencing some form of BWS (see country list in Table 2). We found consistent estimates when using an alternative base irrigation map ( 68 Mhagross irrigation expansion, of which is unsustainable; Supplementary Fig. 9 and Supplementary Table 2). Of the countries with the largest AEI in 2015, India and Pakistan have seen the most unsustainable expansion, with ( 12.1 Mha ) and of the gross expansion in AEI, respectively, taking place in locations that were already experiencing BWS. A substantial fraction of the AEI expansion in China (28%) and the United States (42%) was also unsustainable (Supplementary Table3). Conversely, there were also countries in which most of the AEI expansion was sustainable (from the perspective of water resources), such as Brazil (3.4 Mha, 96% of the total expansion was sustainable), Indonesia ( ), Peru ( ), Italy ( ) and France ( ; Supplementary Table3). In many places, we also observed substantial declines in AEI in areas that were previously experiencing unsustainable water demand (that is, under BWS conditions). Globally, the decline in AEI in water-stressed regions (BWS and BWS + GWS) totalled – 15.4 Mha ( of the total decline). The countries with the largest decreases in AEI in waterstressed regions included India (-4.8 Mha, 78%), China (-3.5 Mha, 52%) and the United States ( ; see Supplementary Table 3 for a full list). Taken together, all of these results demonstrate that both sustainable and unsustainable shifts in irrigation patterns have occurred across diverse geographies and contexts (and often within the same country) since the start of the century. These findings provide a critical understanding of whether and where irrigation trends have been on a sustainable trajectory (that is, in locations where water resources are relatively abundant) and highlight regions where interventions are most urgently needed to address unsustainable practices.
Discussion
Our findings shed new light on the extent to which shifts in irrigation have been sustainable since the start of the century. Globally, we found that AEI has expanded by since 2000, a necessary and important
step towards increasing food supply and buffering against rising climate variability. Most notably, the expansion of irrigation that we observed in sub-Saharan Africa and South and Southeast Asia has potential to help to address widespread and persistent malnutrition and aid the productivity and adaptive capacity of the many smallholder farmers in these regions . Yet, our analysis also demonstrates that in many places, irrigation expansion has occurred where water stress already existed, suggesting the further depletion of streamflow and aquifers in these locations. In all, these findings paint a mixed picture of progress towards global water sustainability and highlight deep differences in irrigation shifts both within and between countries.
The extent to which countries increase crop production through unsustainable irrigation expansion will also have important implications for the food self-sufficiency of nations as well as global food security, given the growing reliance of many countries on food imports . Countries continuing to practise and expand irrigated agriculture in places where water is scarce subject themselves to an increasing likelihood that freshwater resources could become inaccessible (that is, groundwater table drawdown and streamflow depletion) and ultimately impose physical and/or economic limits on the levels of irrigated production . For food-importing countries (for example, Saudi Arabia and South Africa), such a situation may cause local food production to falter and necessitate a growing reliance on food trade. For food exporters (for example, the United States and Australia), continued unsustainable irrigation practices could force a reduction in food exports to continue to meet domestic food demand. Sustainable irrigation is particularly important in these exporting countries as a failure of water resources would potentially have cascading effects on the nations to which they export food . Thus, ensuring that irrigation expansion occurs only in those places where water resources are relatively abundant could avoid these undesirable outcomes. By quantifying the global patterns of irrigation change, our results can provide spatially detailed information on where targeted interventions are most urgently needed to avoid or reverse unsustainable irrigation expansion.
Despite the uncertainty inherent in such global mapping efforts, our analysis can also begin to point to areas where policies and investments have been successful in moving towards sustainable water resource management. Understanding the socio-political conditions that enabled and informed these examples of sustainable expansion can provide valuable insights for potential applications in other locations and contexts. While an estimated 3.8 billion additional people could be fed through irrigation expansion , our findings demonstrate that much of the irrigation expansion that has already taken place is compromising the long-term viability of freshwater resources. With 129 countries currently off-track to sustainably manage their water resources by , urgent action is needed and sustainable irrigation will play a central role. To this end, our study enables the identification of opportunities to realize co-benefits (for example, increased food production, improved water sustainability and enhanced climate adaptation) and avoid trade-offs, a critical condition for achieving multiple Sustainable Development Goals (SDGs) . In addition to quantifying the sustainability of changing global irrigation patterns and pointing to locations where expansion is advisable, our results can also provide the basis for evaluating a suite of potential solutions for reduced water consumption in irrigated croplands, including improved irrigation efficiencies paired with water consumption caps , switching to less water-intensive crops , soil water conservation and selective fallowing .
While our study provides important advances in sustainable irrigation expansion, it would be prudent to consider the following four key caveats when using and interpreting our AEI database. First, the reported changes in irrigated areas are based on the best available information on global irrigation extent (that is, the Global Map of Irrigation Areas and ref. 28). Thus, the magnitude of the estimated change in a particular location may vary depending on how these input
Fig. 4 | Sustainability of changes in AEI in the twenty-first century. a, Map showing four categories of AEI change: potentially sustainable expansion (that is, in areas of GWS or no water stress), unsustainable expansion (that is, in areas of BWS or BWS+GWS), decline in BWS regions and decline in non-BWS regions. Blue water resources are relatively abundant in areas with only GWS or with no water stress (that is, there is no BWS); a full accounting of changes in crop-specific water demand under irrigation expansion is necessary to comprehensively
determine whether water stress continues to be avoided in these areas of potentially sustainable expansion. Only pixels with of the area occupied by AEI are shown.b, Changes in net AEI as well as AEI expansion and decline from 2000 to 2015 by water stress category for major countries. c, Percentage change in net AEI from 2000 to 2015, percentage of unsustainable AEI expansion (that is, in areas of BWS) and percentage of AEI decline in BWS regions. Basemap in a from GADM .
Table 2 | Countries with the largest net expansion of AEI in already water-stressed regions
Country
Unsustainable expansion (% of gross expansion)
Net AEI change in BWS or BWS+GWS regions (Mha)
India
82
7.3
China
36
3.5
Iran
63
1.1
Bangladesh
92
1.0
Australia
57
0.9
Thailand
80
0.7
Pakistan
87
0.7
Vietnam
45
0.4
Egypt
79
0.3
Indonesia
22
0.2
Algeria
34
0.2
datasets define irrigation and for where. Furthermore, depending on the underlying global irrigated area map used, changes in AEI may not be captured in certain locations (for example, Brazilian Cerrado and India’s Chhattisgarh and Odisha states) where new croplands have
been established via land use change. Second, the changes in AEI that we investigated here may not perfectly mirror changes in the area that is actually irrigated. For instance, our estimates of declines in irrigated area may be muted in locations where irrigation infrastructure still exists but has been abandoned (for example, former Soviet states). This difference between AEI and actual irrigated area is less problematic when considering expansion as active investment in and development of expanded irrigation infrastructure suggests that the area is being actively used. Relatedly, we also note that our approach does not allow us to capture the finer temporal dynamics of actually irrigated areas, which can vary interannually and by season. Approaches to fuse data on AEI and area actually irrigated will be an important next step in better understanding global irrigation dynamics. Third, for a number of countries, for example, in sub-Saharan Africa, irrigation statistics are only available at the national level (Supplementary Table 4). As such, assessments of grid cell level changes in these places should be performed with caution . For future versions of this AEI database, a combination of updates to global maps of irrigated extent as well as spatially disaggregated irrigation statistics for currently data-scarce nations will largely address these limitations. Fourth, our estimates of sustainable and unsustainable irrigation expansion depend on how water scarcity is defined and how crop water demand is estimated. As such, our approach is intentionally flexible to incorporate different definitions and estimations of global water stress. In areas where
we estimated potentially sustainable expansion (that is, only GWS or no water stress), a full accounting of changes in crop-specific water demand under irrigation expansion would be necessary to comprehensively determine whether conditions of water stress continue to be avoided. Combined with the fact that BWS has increased with time , this suggests that our estimates for unsustainable irrigation expansion might be understated. In contrast, water stress may be overestimated in regions where the assessment of water resources has not accounted properly for interbasin transfers and water transfer by large-scale irrigation canal networks, for example, in India, Pakistan and the Nile Basin.
Our assessment provides critical information for quantifying and measuring the progress of global irrigated agriculture. The fine-scale spatial heterogeneity of changing irrigation patterns that we observed will probably have implications that propagate to subsequent food supply chain steps and alter the entire food system . Holistic and coordinated approaches to promoting irrigation that account for these interconnections have potential to maximize environmental and socio-economic co-benefits while minimizing trade-offs . Yet, our study also clearly demonstrates that irrigation expansion continues to occur in water-stressed areas either because current efforts have been ineffective in defining or achieving water sustainability targets in many places or because the long-term sustainability of freshwater resources remains secondary to other societal priorities in these locations. Thus, ensuring that meeting the water demands of humanity-to increase food production and meet other needs-does not compromise other dimensions of sustainability is critical to moving beyond the shortcomings of the Green Revolution and meeting multiple SDGs.
Methods
Terminology
The main variable mapped in this study was AEI, defined as the area of land equipped with infrastructure to provide water to . It includes areas equipped for surface irrigation, full or partial control irrigation, spate irrigation and equipped lowland areas , but excludes rainwater harvesting. Areas that are irrigated seasonally and switch between rainfed and irrigation farming were also included.
To define water stress, we followed the terminology of ref. 51 who defined water stress as the ratio of water used (that is, consumption) to total water availability.
Data sources
Subnational administrative boundaries were taken from the Global Administrative Areas database (version 3.6). Information on the areas equipped for irrigation in the year 2005 came from the Global Map of Irrigation Areas ( 5 arcmin resolution) . Data on cropland and pastureland for the years 2000 through to 2015 came from the History Database of the Global Environment (HYDE, version 3.2, 5 arcmin resolution) .
We acquired AEI statistics from three major international sources for all countries for the years 2000 onwards: FAOSTAT , AQUASTAT and EUROSTAT , as well as from various national censuses (Supplementary Table 4). A few countries with large extents of irrigated area (that is, Canada, China, India and the United States) collect and report data only on area actually irrigated (AAI; Supplementary Table 4). As AEI refers to all land that is equipped with irrigation, we expect AAI to be lower or equal to the AEI of a country. AAI can be lower than AEI when part of the irrigation infrastructure is not used, as a result of rainfed crop cultivation, or simply because the land was not used for agriculture (left fallow). In these cases, we scaled the statistics on AAI to match reported AEI values.
To develop the spatial database of AEI, we first collected subnational irrigated area statistics from multiple national and international sources (Supplementary Table 4). Many of the irrigation statistics on AEI were taken from the Food and Agricultural Organization (FAO) databases AQUASTAT and FAOSTAT and the Historical Irrigation
Dataset . We also used data from EUROSTAT (for the years 2007, 2010, 2013 and 2016), which reports data on AEI (irrigable land) for countries in the European Union at the Nomenclature of territorial units for statistics 2 subnational level. In addition to these international and global databases, we obtained data from the national censuses, surveys, reports and statistical yearbooks of many countries as these sources often contain information with greater spatial detail (Supplementary Table 4).
Following the methodology of ref. 12, we pre-processed the irrigation data using data-type and temporal harmonizing to eliminate inconsistencies in the irrigation statistics between information sources and across years. We used data-type harmonizing when the definition of irrigated land in statistics differed from the definition of AEI used in this study. We used temporal harmonizing when the time steps of the input data did not exactly correspond to the pre-defined time steps of this dataset. Specifically, we linearly interpolated the data between available years to match the year with the exact study year. This was carried out at both national and subnational levels (Supplementary Information).
Grid cell level downscaling
We then downscaled the cleaned global database of AEI to 5 arcmin resolution following ref. 12 . The objective of this step was to spatially allocate AEI information from the subnational statistics to each 5 arcmin grid cell so that the sum of the AEI assigned to grid cells was equal to the AEI of the subnational statistics for the corresponding subnational administrative unit and year. This process was also meant to ensure that for each grid cell, the assigned AEI value was less than or equal to the sum of cropland and pasture area in that year. However, for certain administrative units, AEI was larger than the sum of cropland and pasture extent in a specific year. In these cases, we prioritized maximizing consistency with either subnational irrigation statistics or the HYDE dataset (see Supplementary Information for a detailed methodology and Supplementary Table 1). All calculations were repeated using the ref. 28 global map of the area actually irrigated (Supplementary Figs. 6-9 and Supplementary Tables 1 and 2).
Validation
Global AEI maps for 2015 were validated against the global irrigation map of ref. 14 (Supplementary Figs. 1 and 2), finding values of 0.56 for low-to-medium-intensity irrigation areas and 0.78 for high-intensity irrigation areas. The output AEI maps for 2015 were validated for China , India and the United States using remotely sensed data products, finding overall accuracies of and 0.91 at the pixel level, respectively. The low accuracies for China and India could be a result of differences in the scale of planting (smallholder farms are difficult to locate by remote sensing), the irrigation techniques used (flood or border irrigation are difficult to identify compared with sprinklers in the United States), topographic factors (complex terrains in China) and meteorological factors (a subtropical climate results in cloudy remotely sensed images). Furthermore, these remote sensing products suffer from either no ground truthing or validation (in the case of the India map , which prevents an estimation of map accuracy) and low levels of accuracy (reported overall accuracy in the case of the China map , which implies a large range of uncertainty), while the US product is well validated . Despite the vastly different methods by which irrigation estimates are derived via remote sensing (through indirect measures of surface properties) or agricultural census (through farmer surveys), encouragingly, we found high agreement at more aggregated levels (Supplementary Figs. 2-4). Having validated our estimates against all other possible independent sources, we emphasize that our estimates (1) are based on the systematic processing of the best available statistical records of AEI for each country using a consistent terminology and methodology, (2) fall in the range of other well-established data products and (3) provide consistent information back to the year 1900 (which is unique and not possible to achieve
through other methods such as remote sensing). These characteristics make our dataset ideally suited to address our research objective: to explore global-scale spatio-temporal trends in the development of irrigated land in relation to conditions of water stress.
Comparison of irrigation changes and water-stressed areas
The locations and magnitudes of AEI expansion and decline were identified by the difference between the AEI maps for each grid cell for the years 2000 and 2015. Subsequently, the resulting difference map was combined with maps ( 5 arcmin, for the year 2000) of existing monthly BWS and GWS, which account for irrigation, other societal water consumption and environmental flow requirements, taken from ref. 22. This enabled us to identify the locations where AEI expansion occurred under four categories of existing (that is, for the year 2000) water stress conditions: (1) both BWS and GWS, (2) BWS but no GWS, (3) GWS but no BWS and (4) no water stress. AEI expansion in the first two categories was defined as ‘unsustainable’ because they would exacerbate the depletion of surface water and groundwater resources . The same steps were repeated for areas of AEI decline, where AEI decline in the first two categories was defined as ‘potentially sustainable’. In other words, the most sustainable outcomes for changes in AEI would show AEI expansion in places where surface water and groundwater resources are relatively abundant and AEI decline in places where water resources are already relatively scarce. This water stress dataset was selected because of its agreement in terms of spatial resolution with this study’s AEI maps (to avoid unnecessary aggregation or resampling), its coincidence with the beginning of the study period (to enable assessment of existing conditions of water stress), and its quantification of both monthly and annual water stress (to capture locations of seasonal unsustainable water demand). We note that our approach can readily incorporate alternative datasets quantifying global patterns of water stress or scarcity.
Data availability
All of the data used in this study are publicly available through https:// zenodo.org/record/7809342 or upon request from the corresponding author.
Code availability
All of the code used in this study is available upon request from the corresponding author.
Global Agriculture Towards 2050 (FAO, 2009); https://www.fao. org/fileadmin/templates/wsfs/docs/Issues_papers/HLEF2O5O_ Global_Agriculture.pdf
Foley, J. A. et al. Solutions for a cultivated planet. Nature 478, 337-342 (2011).
Mueller, N. D. et al. Closing yield gaps through nutrient and water management. Nature 490, 254-257 (2012).
Wang, X. et al. Global irrigation contribution to wheat and maize yield. Nat. Commun. 12, 1236 (2021).
Portmann, F. T., Siebert, S. & Döll, P. MIRCA2OOO-global monthly irrigated and rainfed crop areas around the year 2000: a new high-resolution data set for agricultural and hydrological modeling. Global Biogeochem. Cycles 24, GB1011 (2010).
Water in Agriculture (World Bank, 2020); https://www.worldbank. org/en/topic/water-in-agriculture
Hoekstra, A. Y. & Mekonnen, M. M. The water footprint of humanity. Proc. Natl Acad. Sci. USA 109, 3232-3237 (2012).
Brauman, K. A., Richter, B. D., Postel, S., Malsy, M. & Flörke, M. Water depletion: an improved metric for incorporating seasonal and dry-year water scarcity into water risk assessments. Elementa 2016, 1-12 (2016).
D’Odorico, P. et al. The global food-energy-water nexus. Rev. Geophys. 56, 456-531 (2018).
Chiarelli, D. D. et al. Competition for water induced by transnational land acquisitions for agriculture. Nat. Commun. 13, 505 (2022).
Siebert, S. et al. A global data set of the extent of irrigated land from 1900 to 2005. Hydrol. Earth Syst. Sci. 19, 1521-1545 (2015).
Deines, J. M., Kendall, A. D. & Hyndman, D. W. Annual irrigation dynamics in the US northern High Plains derived from Landsat satellite data. Geophys. Res. Lett. 44, 9350-9360 (2017).
Nagaraj, D., Proust, E., Todeschini, A., Rulli, M. C. & D’Odorico, P. A new dataset of global irrigation areas from 2001 to 2015. Adv. Water Resour. 152, 103910 (2021).
Xie, Y., Gibbs, H. K. & Lark, T. J. Landsat-based Irrigation Dataset (LANID): 30 m resolution maps of irrigation distribution, frequency, and change for the US, 1997-2017. Earth Syst. Sci. Data 13, 5689-5710 (2021).
Ambika, A. K., Wardlow, B. & Mishra, V. Remotely sensed high resolution irrigated area mapping in India for 2000 to 2015. Sci. Data 3, 160118 (2016).
Goldewijk, K. K., Beusen, A., Doelman, J. & Stehfest, E. Anthropogenic land use estimates for the Holocene-HYDE 3.2. Earth Syst. Sci. Data 9, 927-953 (2017).
Siebert, S., Henrich, V., Frenken, K. & Burke, J. Update of the Digital Global Map of Irrigation Areas to Version 5171 (Rheinische Friedrich-Wilhelms-University and Food and Agriculture Organization of the United Nations, 2013); https://doi. org/10.13140/2.1.2660.6728
Rosa, L., Chiarelli, D. D., Rulli, M. C., Dell’Angelo, J. & D’Odorico, P. Global agricultural economic water scarcity. Sci. Adv. 6, eaaz6031 (2020).
Wang, J. et al. Forty years of irrigation development and reform in China. Aust. J. Agric. Resour. Econ. 64, 126-149 (2020).
Birthal, P. S., Joshi, P. K., Negi, D. S. & Agarwal, S. Changing Sources of Growth in Indian Agriculture: Implications for Regional Priorities for Accelerating Agricultural Growth Discussion Paper No. 01325 (IFPRI, 2014); http://ebrary.ifpri.org/cdm/ref/collection/ p15738coll2/id/128025
Romania-Irrigation Rehabilitation and Reform Project: Restructuring: Main report (English). Report No. 55568 (World Bank Group, 2010); http://documents.worldbank.org/curated/ en/352081468296098754/Main-report
Rosa, L. et al. Potential for sustainable irrigation expansion in a warmer climate. Proc. Natl Acad. Sci. USA 117, 29526-29534 (2020).
Meier, J., Zabel, F. & Mauser, W. A global approach to estimate irrigated areas-a comparison between different data and statistics. Hydrol. Earth Syst. Sci. 22, 1119-1133 (2018).
FAO, IFAD, UNICEF, WFP & WHO The State of Food Security and Nutrition in the World 2021. Transforming Food Systems for Food Security, Improved Nutrition and Affordable Healthy Diets for All (FAO, 2021); https://www.fao.org/documents/card/en/c/cb4474en
Samberg, L. H., Gerber, J. S., Ramankutty, N., Herrero, M. & West, P. C. Subnational distribution of average farm size and smallholder contributions to global food production. Environ. Res. Lett. 11, 174-186 (2016).
Ricciardi, V., Mehrabi, Z., Wittman, H., James, D. & Ramankutty, N. Higher yields and more biodiversity on smaller farms. Nat. Sustain. 4, 651-657 (2021).
Kummu, M. et al. Interplay of trade and food system resilience: gains on supply diversity over time at the cost of trade independency. Glob. Food Sec. 24, 100360 (2020).
Jain, M. et al. Groundwater depletion will reduce cropping intensity in India. Sci. Adv. 7, eabd2849 (2021).
Dalin, C., Wada, Y., Kastner, T. & Puma, M. J. Groundwater depletion embedded in international food trade. Nature 543, 700-704 (2017).
Rosa, L. et al. Closing the yield gap while ensuring water sustainability. Environ. Res. Lett. 13, 14762 (2018).
Sachs, J., Kroll, C., Lafortune, G., Fuller, G. & Woelm, F. The Decade of Action for the Sustainable Development Goals: Sustainable Development Report 2021 (Sustainable Development Solutions Network, Cambridge Univ. Press, 2021); https://doi. org/10.1017/9781009106559
Zhang, X. et al. Quantitative assessment of agricultural sustainability reveals divergent priorities among nations. One Earth 4, 1262-1277 (2021).
Jägermeyr, J. et al. Water savings potentials of irrigation systems: global simulation of processes and linkages. Hydrol. Earth Syst. Sci. 19, 3073-3091 (2015).
Grafton, R. Q. et al. The paradox of irrigation efficiency. Science 361, 748-750 (2018).
Marston, L. T. et al. Reducing water scarcity by improving water productivity in the United States. Environ. Res. Lett. 15094033 (2020).
Chakraborti, R. et al. Crop switching for water sustainability in India’s food bowl yields co-benefits for food security and farmers’ profits. Nat. Water 1, 864-878 (2023).
Davis, K. F., Rulli, M. C., Seveso, A. & D’Odorico, P. Increased food production and reduced water use through optimized crop distribution. Nat. Geosci. 10, 919-924 (2017).
Richter, B. D. et al. Water scarcity and fish imperilment driven by beef production. Nat. Sustain. 3, 319-328 (2020).
Richter, B. D. et al. Alleviating water scarcity by optimizing crop mixes. Nat. Water 1, 1035-1047 (2023).
Puy, A. et al. The delusive accuracy of global irrigation water withdrawal estimates. Nat. Commun. 13, 3183 (2022).
Mekonnen, M. M. & Hoekstra, A. Y. Four billion people facing severe water scarcity. Sci. Adv. 2, e1500323 (2016).
Davis, K. F., Downs, S. & Gephart, J. A. Towards food supply chain resilience to environmental shocks. Nat. Food 2, 54-65 (2021).
Herrero, M. et al. Articulating the effect of food systems innovation on the Sustainable Development Goals. Lancet Planet. Health 5, e50-e62 (2021).
O’Neill, D. W., Fanning, A. L., Lamb, W. F. & Steinberger, J. K. A good life for all within planetary boundaries. Nat. Sustain. 1, 88-95 (2018).
AQUASTAT Periodical Detailed Survey on Water and Agriculture. AQUASTAT Detailed Survey. Country Survey on Water Use for Agriculture and Rural Development (FAO, 2014).
Kummu, M. et al. The world’s road to water scarcity: shortage and stress in the 20th century and pathways towards sustainability. Sci. Rep. 6, 38495 (2016).
Xiang, K., Yuan, W., Wang, L. & Deng, Y. An LSWI-based method for mapping irrigated areas in China using moderate-resolution satellite data. Remote Sens. 12, 4181 (2020).
Brown, J. F. & Pervez, M. S. Merging remote sensing data and national agricultural statistics to model change in irrigated agriculture. Agric. Syst. 127, 28-40 (2014).
Acknowledgements
M.K. was supported by Research Council of Finland funded projects WATVUL (grant no. 317320) and TREFORM (grant no. 339834), Research Council of Finland’s Flagship Programme under project Digital Waters (grant no. 359248), and the European Research Council (ERC) under the European Union’s Horizon 2020 research and innovation programme (SOS.aquaterra, grant agreement no. 819202). S.S. received funding from the Deutsche Forschungsgemeinschaft (German Research Foundation; SFB 1502-1-2022, Projektnummer 450058266). K.F.D. and L.M. were supported by the United States Department of Agriculture’s National Institute of Food and Agriculture (grant no. 2022-67019-37180). K.F.D. was also supported by the University of Delaware General University Research fund. W.X., T.A. and Q.D. were supported by National Key R&D Program of China (Grant no. 2023YFD2300301) and NSFC (72261147472, 72348003)
Author contributions
P.M. and K.F.D. conceived the study. P.M., S.S., M.K. and K.F.D. designed all of the analyses. P.M., Q.D., T.A., L.M. and W.X. collected the data. P.M. and S.S. performed the analyses. P.M. and K.F.D. wrote the first draft of the paper. All authors contributed to the writing and revision of the paper.
Publisher’s note Springer Nature remains neutral with regard to jurisdictional claims in published maps and institutional affiliations.
Open Access This article is licensed under a Creative Commons Attribution 4.0 International License, which permits use, sharing, adaptation, distribution and reproduction in any medium or format, as long as you give appropriate credit to the original author(s) and the source, provide a link to the Creative Commons licence, and indicate if changes were made. The images or other third party material in this article are included in the article’s Creative Commons licence, unless indicated otherwise in a credit line to the material. If material is not included in the article’s Creative Commons licence and your intended use is not permitted by statutory regulation or exceeds the permitted use, you will need to obtain permission directly from the copyright holder. To view a copy of this licence, visit http://creativecommons. org/licenses/by/4.0/.
Department of Geography and Spatial Sciences, University of Delaware, Newark, DE, USA. Department of Crop Sciences, University of Göttingen, Göttingen, Germany. Department of Built Environment, Aalto University, Espoo, Finland. School of Economics and Resource Management, Beijing Normal University, Beijing, China. School of Economics and Management, Jiangxi Agricultural University, Nanchang, China. Department of Civil and Environmental Engineering, Virginia Polytechnic Institute and State University, Blacksburg, VA, USA. China Center for Agricultural Policy, School of Advanced Agricultural Sciences, Peking University, Beijing, China. Department of Plant and Soil Sciences, University of Delaware, Newark, DE, USA. e-mail: piyush@udel.edu