ثروة من الطوبولوجيات القطبية المعقدة التي تم العثور عليها مؤخرًا في الفيروكهربائيات على النانو مقياس تنجم عن توازن دقيق بين الميل الجوهري للمواد لتطوير استقطاب متجانس وظروف الحدود الكهربائية والميكانيكية المفروضة عليها. تعتبر واجهات الفيروكهربائية-العازلة أنظمة نموذجية حيث ينشأ التواء الاستقطاب من ظروف الحدود الكهربائية الشبيهة بالدائرة المفتوحة، لتجنب تراكم شحنات الاستقطاب من خلال تشكيل مجالات تتطور إلى هياكل شبيهة بالدوامات على مقياس النانو المستوى. على الرغم من أن الفيروكهربائية معروفة بأنها ترتبط بقوة مع التشوه (كلاهما متجانس وغير متجانس )، إلا أن تأثير القيود الميكانيكية على الفيروكهربائيات الرقيقة على مقياس النانو تم استكشافه بشكل أقل نسبيًا بسبب الندرة النسبية لأنماط التشوه التي يمكن تنفيذها تجريبيًا. هنا نوضح أن تكديس طبقات الفيروكهربائية البيروفيسكايت القائمة بذاتها بزاويا التواء محكومة يوفر فرصة لتشكيل هذه الهياكل النانوية الطوبولوجية بطريقة تحددها تعديل التشوه الجانبي المرتبط بالتواء. علاوة على ذلك، نجد أن نمطًا غريبًا من دوامات الاستقطاب والدوامات المضادة يظهر من الارتباط الفلكي للاستقطاب مع تدرجات التشوه. توفر هذه النتيجة فرصًا لإنشاء بلورات دوامات ثنائية الأبعاد عالية الكثافة قد تمكننا من استكشاف تأثيرات وخصائص فيزيائية غير معروفة سابقًا.
تعتمد استمرارية الفيروكهربائية على مستوى النانو على تعويض الشحنات المرتبطة بالاستقطاب والحقول المبددة التي تتراكم على الأسطح أو الواجهات. في الأفلام الفيروكهربائية مع أقطاب معدنية، يمكن أن يتم حجب الحقول المبددة بواسطة تراكم الشحنات (الحرة) ومن خلال تشكيل مجالات . الوضع أكثر وضوحًا في عينات الفيروكهربائية على مقياس النانو مع حدود عازلة (بما في ذلك الفراغ أو طبقات سطح غير قطبية عازلة) حيث يمكن أن يخضع الاستقطاب لانتقال إلى دوامات أو حالات طوبولوجية أكثر تعقيدًا ، مع استمرار تكوينات قطبية دورانية إلى أقطار صغيرة حيث يبتعد الاستقطاب عن الاتجاهات ذات التناظر العالي التي تفضلها الأنيسوتروبي للشبكة .
تلعب ظروف الحدود الميكانيكية , مثل تلك المفروضة بواسطة التشوه بين الواجهات، دورًا مهمًا في تحديد حالة الاستقطاب النهائية، حيث قد تتحد مع ظروف الحدود الكهربائية بطرق غير تافهة. من الجدير بالذكر أن الارتباط القوي بين الفيروكهربائية مع كل من التشوه المتجانس وغير المتجانس هو أصل فعالية ظروف الحدود الميكانيكية في تحفيز تأثيرات غير متوقعة، مثل تعزيز الفيروكهربائية في الطبقات المتوترة بشكل إبيتاكسي أو تبديل الاستقطاب تحت تدرجات التشوه التي أنشأها طرف مجهر القوة الذرية الذي يضغط على سطح العينة . ومع ذلك، يتضح أن الوصول إلى أنماط التشوه القابلة للتعديل خارجيًا محدود جدًا في الممارسة.
في الأفلام الرقيقة الإبيتاكسي، تكون ظروف الحدود الميكانيكية، إلى حد كبير، محددة بشكل ثابت وحصري من خلال تكرار الذرات على الذرات لهيكل الركيزة بواسطة الفيلم المتنامي. وبالتالي، على الرغم من أن الواجهة مع الركيزة تخضع لتشوهات في المستوى تفرضها عدم تطابق الشبكة، فإن سطح العينة في حالة عدم إجهاد، حيث لا توجد قوى تؤثر عليه. في طبقات أحادية المجال متوترة بشكل موحد إبيتاكسي، تكون الحقول المرنة الداخلية متجانسة وموضوعة بشكل صارم بواسطة هذه الظروف الحدود المختلطة. عادة ما ينتج التشوه غير المتجانس عن استرخاء التشوه غير القابل للتحكم، أو تشوهات عدم التطابق أو تشكيل مجالات فيروإيلاستيك . تترك القيود الهيكلية المفروضة بواسطة الإبيتاكسي مساحة صغيرة أو معدومة لتعديل ظروف الحدود الميكانيكية. علاوة على ذلك، فإن أنماط التشوه القابلة للتحكم أو غير المتجانسة غالبًا ما تكون بعيدة المنال. هذه هي السبب في أنه، على الرغم من أنه يمكن توقع أن تؤدي الحالات الفيروكهربائية الغريبة من حيث المبدأ إلى نتيجة من التلاعب في ظروف الحدود الميكانيكية، إلا أن هذا السيناريو لا يزال غير مستكشف إلى حد كبير.
في هذه الورقة، نوضح استراتيجية لتصميم ظروف الحدود الميكانيكية بناءً على تعديل التشوه الناتج عند الواجهة بين طبقتين أكسيديتين ملتويتين قائمة بذاتها. في المواد الطبقية مثل الجرافين أو ثنائي كبريتيد المعادن الانتقالية، أدت الطبقات الثنائية الملتوية إلى ظهور حالات جماعية غير متوقعة . يؤدي التفاعل الضعيف بين الطبقات في مثل هذه الطبقات الثنائية الملتوية
مقال
إلى أنماط تشوه غير متجانسة مع تشوهات تصل إلى حوالي 1% (مرجع 27). ومع ذلك، فإن توسيع الاستكشاف إلى أكوام ملتوية اصطناعية من أكاسيد المعادن الانتقالية ذات الروابط الأيونية-التساهمية القوية قد تم عرقلته بسبب صعوبة عزل هذه الأنظمة في شكل قائم بذاته. التقارير الأخيرة عن تصنيع أفلام أكسيد أحادية البلورة قائمة بذاتها التي تظهر طوبولوجيات فيروكهربائية مثيرة ، والتي يمكن التعامل معها بطريقة مشابهة للمواد ثنائية الأبعاد (2D) ذات القوى الضعيفة ، تفتح إمكانية تكديس طبقات قائمة بذاتها بزاويا التواء تعسفية وبالتالي تصميم أنماط تشوه غير معروفة سابقًا. هنا نوضح أن تعديل التشوه الجانبي الناتج عن تطابق الواجهة بين طبقتين من الفيروكهربائية الملتوية (BTO) يحدد شرط حدود ميكانيكي لا يمكن تحقيقه بواسطة التشوه الإبيتاكسي، وإلى حد كبير يمكن التحكم فيه بواسطة زاوية الدوران النسبية. ينتج عن توزيع التشوهات القصية المتناظرة وغير المتناظرة المعدلة على مقياس النانو نسيج استقطاب دوراني ملحوظ مع دوامات ودورات مضادة متناوبة، يتم التحكم في توزيعها، والمسافة، والحجم بواسطة زاوية الالتواء. تظهر محاكاة المبادئ الأولى أن هذا التكوين المعقد من القصوص المتناظرة وغير المتناظرة المركزة يتزامن مع تعديل دوامة الفيروكهربائية 2D ويشكل حالة توازن مستقرة. يتم مناقشة الارتباط بين تدرجات التشوه القصي ونسيج الاستقطاب المعقد من حيث تأثير فلكي مباشر.
تحليل التشوه والاستقطاب للطبقات الثنائية الملتوية
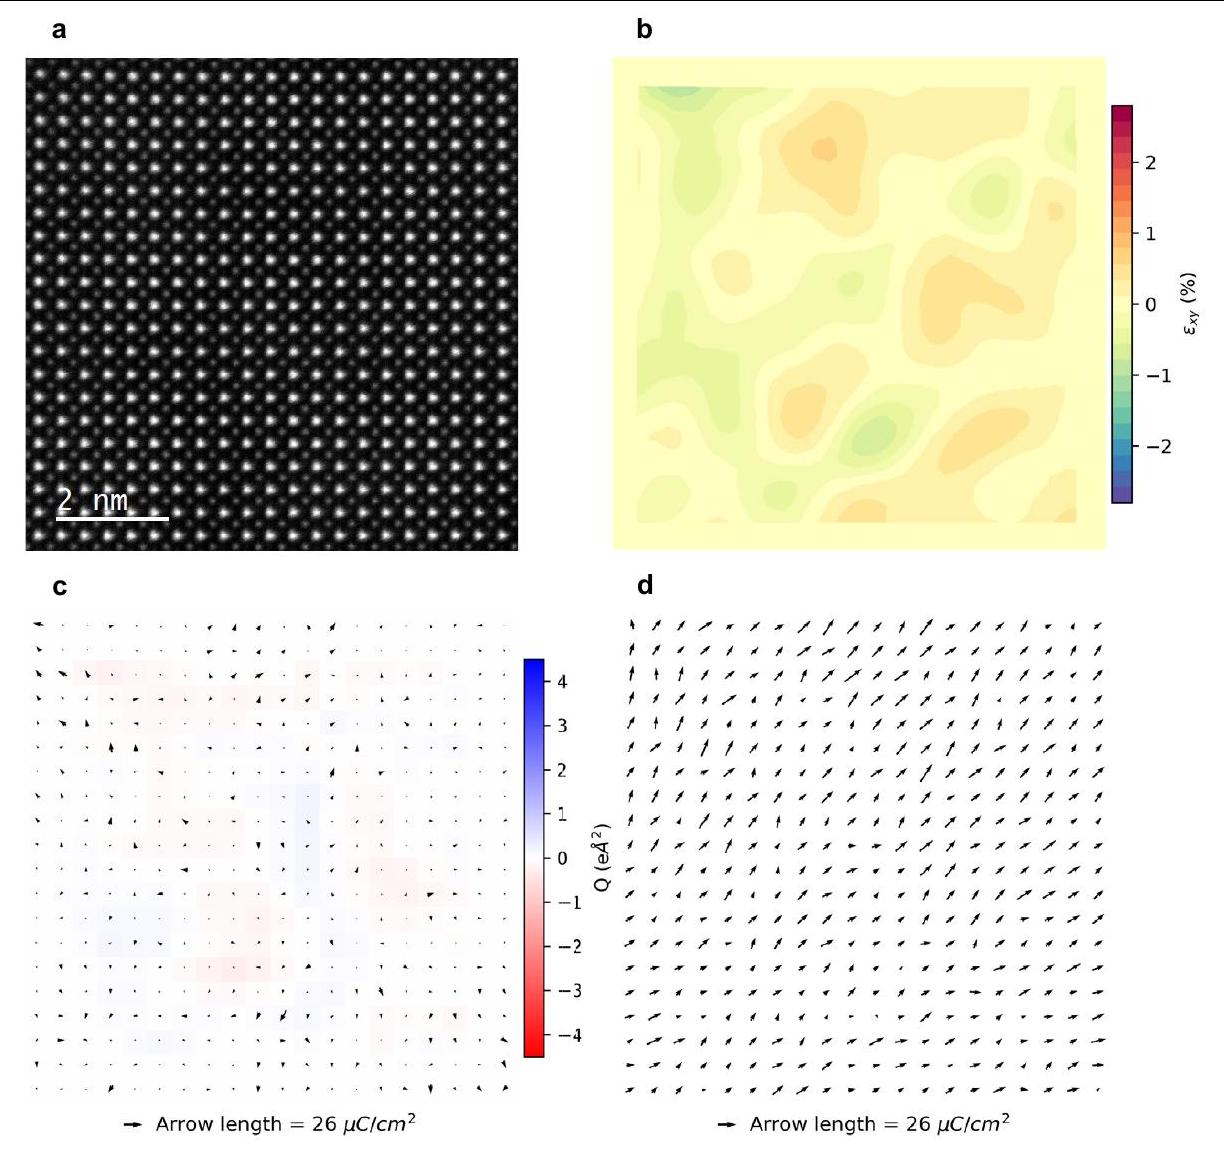
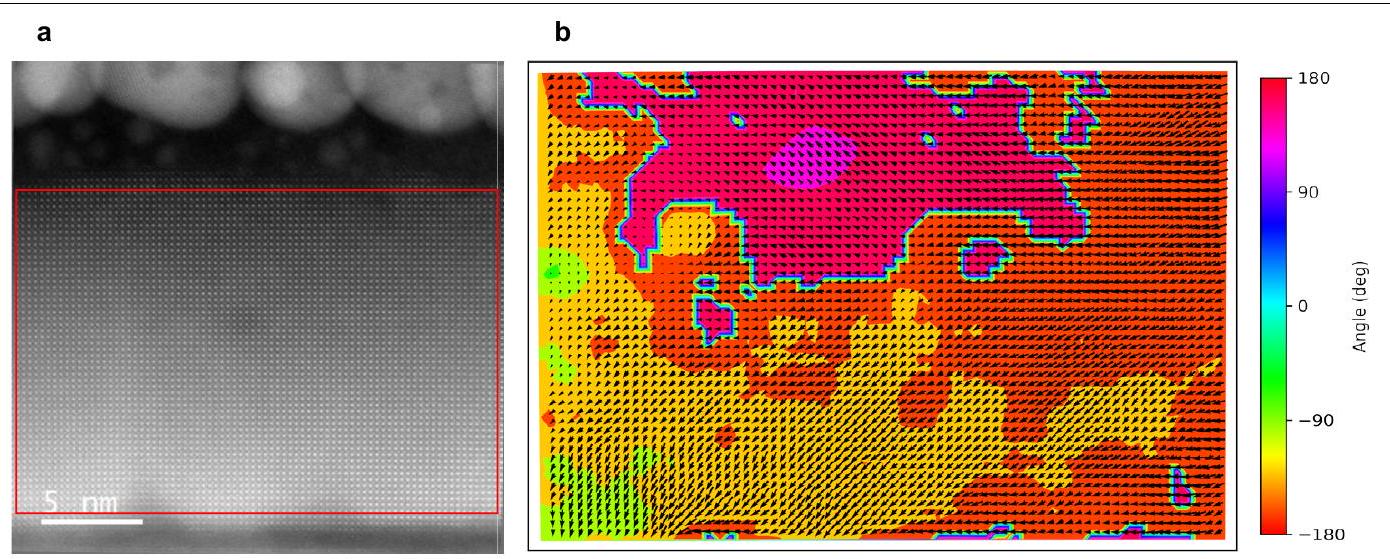
تمت زراعة طبقات BTO بسمك 15 نانومتر بشكل إبيتاكسي على (001) تم فصلها لتشكيل تقاطعات ثنائية ملتوية بزاويا التواء محددة (انظر الطرق والشكل الممتد 1أ لوصف مفصل لعملية تصنيع العينة). لدراسة الخصائص الهيكلية للطبقات الفردية من الطبقات الثنائية الملتوية، قمنا بإجراء تجربة مجهر إلكتروني للانتقال الماسح (STEM) بتقنية الحقل الداكن الزاوي العالي (HAADF) (الطرق) تركز على السطح العلوي للتكديس (عدم التركيز ) وعلى الواجهة (عدم التركيز ; انظر الشكل الممتد 1ب والفيلم التكميلي 1). تظهر الطبقات الثنائية الفيروكهربائية الملتوية ميزات موير المميزة التي تحددها نمط التوافق الذري بين الطبقتين (الشكل الممتد 1ج). درسنا هياكل موير التي تشكلت في و الطبقات الثنائية الملتوية BTO.
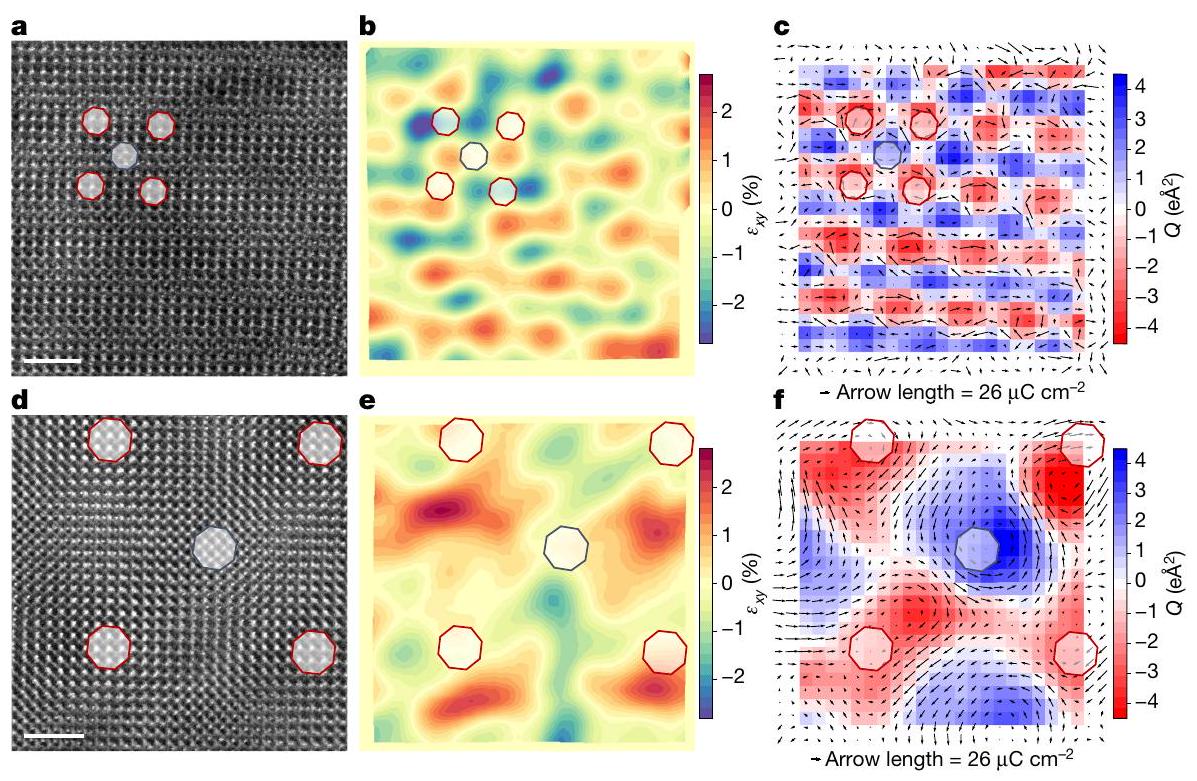
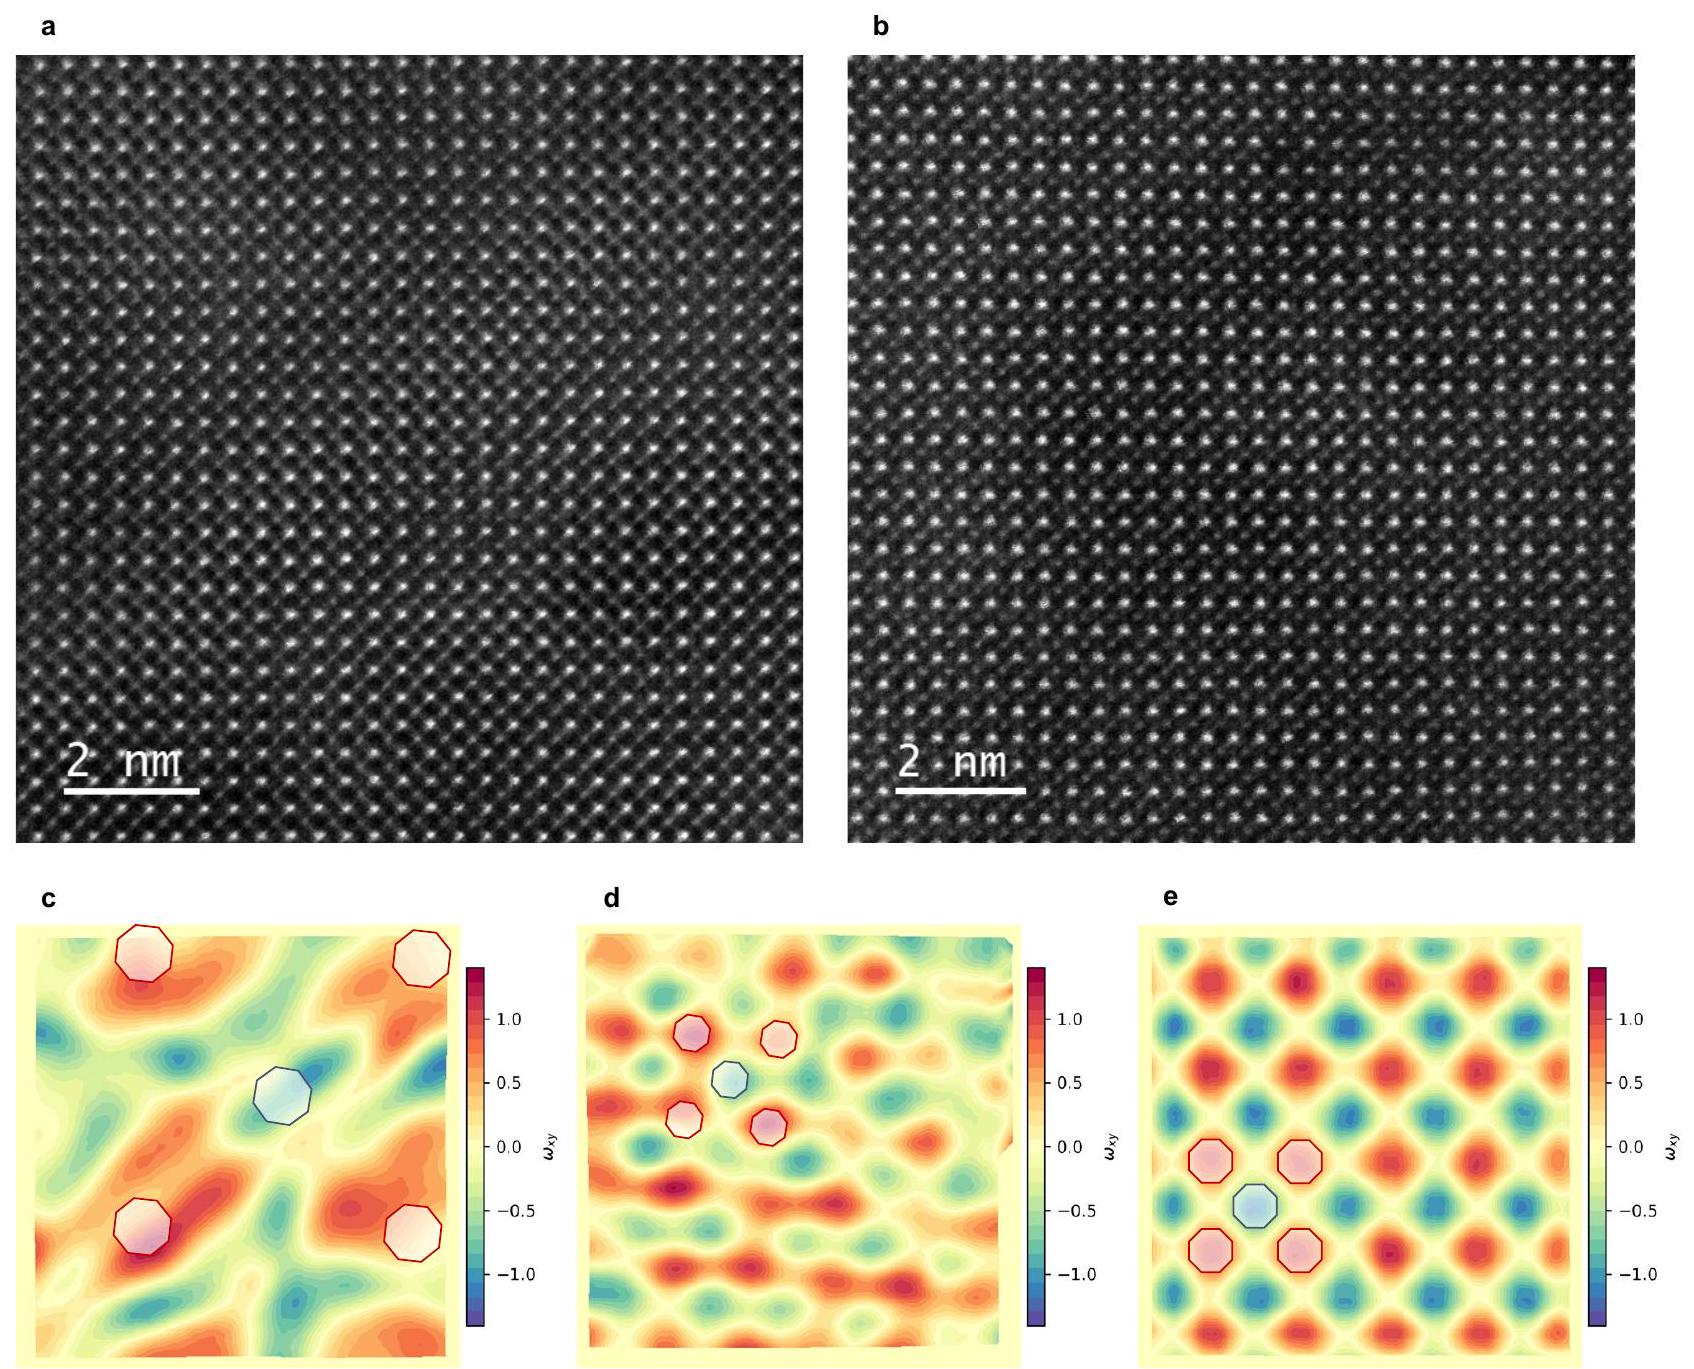
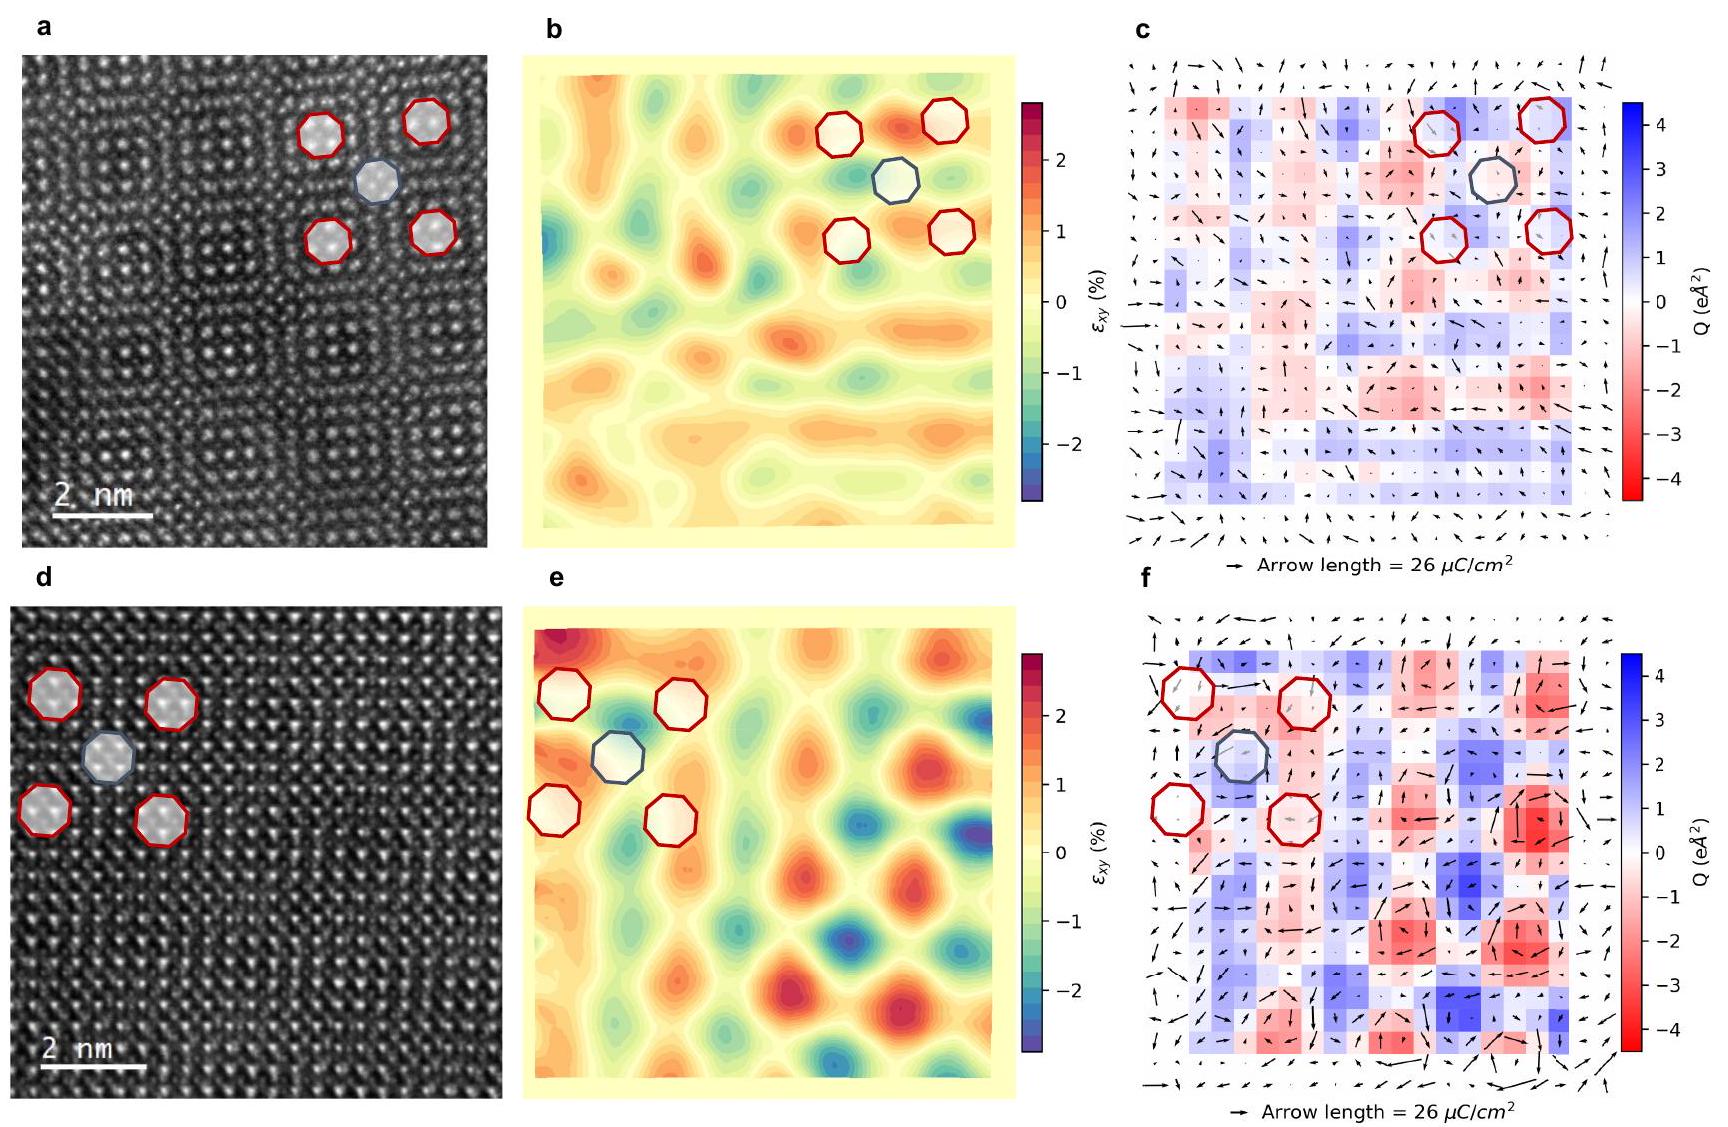
الشكل 1أ، د يظهر صور STEM-HAADF (عرض مسطح) لـ و طبقات ملتوية. يظهر نمط الموير ميزتين متميزتين تشبهان الهضبة في المناطق المتطابقة (ذرة على ذرة) في كلا الطبقتين: AA (با على با وتي على تي) وAB (با على تي وتي على با) (انظر أيضًا الشكل 1 في البيانات الموسعة). تم قياس الإجهاد داخل الطبقة على الطبقة العليا باستخدام صورة مركزة على السطح المدخل (عدم التركيز = 0؛ الطرق). إن ظهور مشهد إجهاد متغير مكانيًا بشكل قوي بنفس التكرارية مثل شبكة الموير – والمحدد على الطبقة العليا – يوضح التفاعل القوي بين الطبقتين الملتويتين. تُظهر خريطة الإجهاد الناتجة نمطًا متغيرًا دوريًا من إجهادات القص المتماثلة.مع نوى قصية متناوبة إيجابية وسلبية (انظر الشكل 1ب، e لـ و الطبقات الملتوية، على التوالي). بين مواقع AA وAB في نمط الموير، نجد مناطق من أقصى إجهاد، تُسمى مواقع S فيما بعد، مع قص إيجابي وسلبي شبه متجانس. يظهر تعديل إجهاد القص نفس التكرارية مثل نمط الموير، مما يشير إلى أن الإجهاد ناتج عن إعادة بناء في الطبقة العليا ناتجة عن التوافق عند الواجهة. ملاحظة مهمة هي أن مثل هذا المشهد الدوري لإجهاد القص فريد، حيث لا يمكن تحقيقه، على حد علمنا، سواء من خلال الإجهاد البصري أو من خلال أي نمط من الضغوط المطبقة خارجيًا.
للتحقيق في كيفية تأثير تعديل الإجهاد الذي لوحظ على الطبقة العلوية من ثنائي الطبقات BTO الملتوية على الاستقطاب الفيروكهربائي، قمنا بقياس انحراف كاتيونات الموقع B في خلايا الوحدة الفردية (الانزياح النسبي لكاتيون Ti في الموقع B عن الموضع المركزي، المحدد من كاتيونات Ba في الموقع A ضمن نفس) أظهرت الطبقات الثنائية الملتوية استقطابًا صافياً في المستوى يشير في اتجاه [1,1] في المستوى، مع نسيج قطبي متراكب (الشكل 4 من البيانات الموسعة). تم الحصول على إزاحات قطبية في نطاق 0.15-0.20 Å، وهو ما يتماشى مع ما يوجد في BTO الكتلي. في BTO، يُعرف أن مقدار الاستقطاب التلقائي ثابت تقريبًا بغض النظر عن الاتجاه الذي قد يتخذه في المراحل المختلفة للفيروإلكتريك التي يمكن أن يتبناها هذا المركب.مما يشير إلى أن الاستقطاب عند السطح يجب أن يكون محصورًا إلى حد كبير في المستوى. ومع ذلك، نظرًا لأن الرؤى المستوية تستكشف فقط الاستقطاب في المستوى، فإننا نلجأ إلى تحليل الاستقطاب لصور المقطع العرضي لإظهار أن هناك مكونًا من الاستقطاب خارج المستوى (الطرق والبيانات الموسعة الأشكال 5 و 6).
يمكن تقييم النسيج القطبي المعقد الموضح في المناظر المسطحة للطبقات الملتوية بشكل أفضل من خلال طرح الاستقطاب المتوسطتنتج حالة الاستقطاب النهائية من تراكب الاستقطاب شبه المتجانس الذي تتميز به الطبقات المعزولة المستقلة وتعديل الفيروكهربائية المحلية الشبيهة بالدوامة المفروضة بواسطة الواجهة، مما ينتج نمطًا ثنائي الأبعاد غريبًا من موجات الاستقطاب.. الاستقطاب (تظهر الخرائط في الشكل 1c و f التواءً مستمراً للإزاحات القطبية، مما يشكل شبكة دورية من الهياكل الطوبولوجية غير التافهة مع دوامات متناوبة (مواقع AA و AB) وضد الدوامات (مواقع S من نمط الموير) لإمكانات الفيروكهربائية المحلية. يمكننا وصف الهيكل الطوبولوجي من حيث لحظة توريد غير صفرية.موازي لـ-الاتجاه معرف على أنه، حيث هو العزم الثنائي المحلي الموجود في و هو عدد الأقطاب (الخلايا).
يتناوب العزم الحلزوني في الاتجاهات القطرية لنمط الموير (الشكل 1c، f) بطريقة تحددها مجموعة دورية من الدوامات المتناوبة في اتجاه عقارب الساعة وعكس اتجاه عقارب الساعة في مواقع AA وAB، على التوالي. الدوامات الفيروكهربائية هي كائنات طوبولوجية تتميز برقم التواء. (الملاحظة التكميلية 1) بغض النظر عن قطبيتها (في اتجاه عقارب الساعة أو عكس اتجاه عقارب الساعة). تعتمد قيم العزم الحلزوني في مواقع الدوامات على حجم الدوامة وعلى الإزاحات الفيروكهربائية (عزم ثنائي القطب). نحصل على قيم مشابهة لتلك المبلغ عنها لنانوبارتicles BTO المسطحة المتجانسة.. في نمط الموير، تتناوب الدوامات مع مضادات الدوامات (التي تقع في مواقع S)، وهي هياكل طوبولوجية مع عدد الالتفاف واللحظة التوروسية الصفرية.
يتم الحصول على تأكيد إضافي لوجود نمط الدوامة من تحليل الإجهاد والاستقطاب لصورة المقطع العرضي، حيث يوفر معلومات تكميلية للعرض المستوي (الذي يظهر فقط مكونات الاستقطاب في المستوى) مما يوفر عرضًا جانبيًا لشبكة الدوامة، حيث يكون في المستوى (على طول الاتجاه) وخارج المستوى ( يمكن استكشاف مكونات متجه الاستقطاب (على طول اتجاه النمو) ، بالإضافة إلىمكون السلالة في المستوى من موتر السلالة. كما تم مناقشته في الملاحظة التكميلية 2، فإن تحليل الاعتماد المكاني على متجه الاستقطاب، بعد طرح قيمة استقطاب متوسطة محلية )، أظهرت تعديلًا جانبيًا لكل من و مكونات (اتجاه النمو) متوافقة تمامًا مع وجود شبكة الدوامات. علاوة على ذلك، هناك تطابق وثيق بين دورية التعديل لعينات المقطع العرضي ووجهات النظر المسطحة، مما يشير إلى أن الدوامة التي تنشأ عند الواجهة تنتشر في الطبقة في اتجاه النمو.
تقليل سمك الطبقة إلى 8 نانومتر يثبت حالة دوامة بدون استقطاب متجانس. بالمقابل، مع زيادة السمك، يتم ملاحظة مكون استقطاب متجانس بالإضافة إلى بعض درجة من استرخاء الإجهاد (الطرق والشكل البياني الممتد 8). أيضًا، تظهر الطبقات الفردية حالات إجهاد شبه متجانسة دون أي مؤشر على الطوبولوجيا القطبية التي لوحظت في الطبقات الثنائية الملتوية (الشكل البياني الممتد 3). تظهر الصورة أن توزيع الإجهاد غير المتجانس المفروض بواسطة الواجهة بين الطبقات الفيروكهربائية الملتوية يؤدي إلى ت modulations شبيهة بالدوامة لإمكانات الفيروكهربائية المحلية. ومع ذلك، بالنسبة للعينات ذات الطبقات الرقيقة بما فيه الكفاية، فإن حالة الدوامة الحقيقية مع
الشكل 1 | التغيرات في الإجهاد والاستقطاب في طبقات BTO الملتوية. صورة STEM-HAADF (عرض مسطح) لـتكديس ثنائي الطبقة ملتوي يركز على واجهة الطبقة الثنائية (عدم التركيز) ). ب، إجهاد القص ( مكون من موتر إجهاد الشبكة) يصور تعديل إجهاد دوري في الطبقة العليا من BTO. ج، خريطة إزاحة التيتانيوم ( ) بعد طرح المكون المتجانس (الأسهم السوداء) المقاسة على الطبقة العليا من BTO والتي تتوافق مع نفس المنطقة المتراكبة على اللحظة الدائرية من الاستقطاب الفيروكهربائي يظهر شبكة من الدوامات في اتجاه عقارب الساعة (حمراء) وعكس اتجاه عقارب الساعة (زرقاء). إزاحات التيتانيوم ( ) يتم تضخيمها بمعدل 20 من أجل الوضوح. نفس التحليل لـطبقة ثنائية ملتوية من BTO. تشير الأشكال الثمانية الحمراء والزرقاء في جميع اللوحات إلى المواقع ذات التكديس AA (مواقع AA) و AB (مواقع AB) على التوالي. متوسط الاستقطاب (المقدار) حوالي، قريب من قيمة BTO الإجمالية. شريط القياس، . يلاحظ وجود استقطاب متجانس غائب. ومن الجدير بالذكر أن هناك تطابقًا وثيقًا بين شبكة الدوامات وتوزيع إجهادات القص التي تشكل نمط الموير. تقع الدوامات في اتجاه عقارب الساعة أو عكس اتجاه عقارب الساعة في مواقع AA وAB مع إجهاد قص قريب من الصفر (على الرغم من وجود إجهاد دوراني أقصى). بالمقابل، تقع الدوامات المضادة في مواقع S مع أقصى إجهاد قص (ولكن مع إجهاد دوراني قريب من الصفر).
الوصف النظري لنمط الفيروكهربائية
للحصول على تأكيد إضافي لهذا النمط القطبي الطوبولوجي، نلجأ إلى نظرية الكثافة الوظيفية (DFT)، مع الأخذ في الاعتبار أنظمة محاكاة مبسطة (قابلة للحساب) ومع ذلك ذات صلة بمشكلتنا. بشكل أكثر دقة، نعمل مع خلية فائقة مكررة دوريًا تتكون منوحدات BTO العنصرية. كنقطة انطلاق لمحاكياتنا، نستخدم تكوينًا ذريًا يحاكي عن كثب نمط الاستقطاب غير المتجانس الذي لوحظ تجريبيًا فيطبقات ملتوية. ثم نقوم بإجراء استرخاء هيكلي حيث يُسمح لجميع مواقع الذرات وضغوط السوبرسيل بالتطور لتقليل طاقة DFT للنظام. نحصل، كحل مستقر، على خرائط الاستقطاب والضغط الموضحة في الشكل 2، والتي تتفق نوعياً مع النتائج التجريبية في الشكل 1 وبالتالي تؤكد العلاقة بين الضغط المرصود وتعديلات ثنائي القطب. وفقاً لمحاكياتنا، فإن هذه الحالة الطوبولوجية هي 9 ميلي إلكترون فولت لكل وحدة صيغة فوق المرحلة المتجانسة الأرثورمبية مع استقطاب على القطر [1،1]. هذه الفجوة الصغيرة نسبياً هي حد أعلى (الطرق) لتكلفة الطاقة الناتجة عن تشويه الحالة المتجانسة التافهة لاكتساب الميزات الطوبولوجية في الأشكال 1 و 2. ومن ثم، تدعم حساباتنا الفكرة القائلة بأن التفاعلات بين الطبقات قد تكون كافية لتحفيز الضغط ونماذج ثنائي القطب المرصودة تجريبياً. تتحكم الزوايا المتعرجة في الترتيبات شبه الدورية، مما يشير إلى أنها نتيجة للتفاعلات بين الطبقات. علاوة على ذلك، من الواضح أن ترتيبات الديوبول الشبيهة بالدوامات والدوامات المضادة في الشكل 1c و1f مرتبطة بأنماط الإجهاد المقاسة في الشكل 1b و1e. وهذا يقترح أنه لفهم هذه الأنسجة القطبية، من المعقول تجاهل التفاصيل المجهرية للارتباطات عبر الواجهة المتعرجة، وبدلاً من ذلك، التركيز على كيفية تأثير التعديل المرن الملحوظ على الاستقطاب. تقدم البيروفسكايتات الفيروكهربائية مثل BTO ارتباطات كهربائية ميكانيكية قوية تجعلها مرشحة محتملة لشرح ملاحظاتنا.
دعونا نبدأ بالنظر في أبسط ارتباطات الإجهاد والاستقطاب. من النماذج المعروفة جيدًا للبيروفسكيتات الفيروكهربائية مثل BTO (المرجع 38)، نعلم أن إجهاد القصعادة ما يفضل استقطابًا موجهًا على طولقطري في المستوى، بينمايؤدي إلى استقطابات على طول؛ ومن ثم، يمكننا أن نتوقع، حيث ( ) تشير إلى الجزء غير المتجانس من الاستقطاب المقاس، كما هو موضح في الشكل 1c، f (وكذلك في الشكل 2c). ومع ذلك، من الواضح من نتائجنا أن هذه العلاقة لا تنطبق على الضغوط المقاسة (الأشكال 1b، e و 2b) والاستقطابات غير المتجانسة (الأشكال 1c، f و 2c)، حيث يمكننا، على سبيل المثال، العثور على مناطق مع وإما إيجابي أو سلبيمنتج. تأثير بيزوالكتروني قوي سيؤدي أيضًا إلىولم تدعمها ملاحظاتنا أيضًا. ومن ثم، فإن هذه ليست الروابط السائدة في عيناتنا.
بعد ذلك، نلاحظ أن خرائط الإجهاد المقاسة لدينا تتميز بتدرجات إجهاد كبيرة مع قيم قصوى تصل إلى (الشكل 3). من خلال الاقتران الفلكسوي الكهربائي المباشريجب أن تؤدي هذه التدرجات إلى تغيير في الاستقطاب، مع كون التأثيرات السائدة المتوقعة هي
اقتران الإجهاد والاستقطاب
دعونا نتناول أخيرًا هذا السؤال المهم حول ما الذي يسبب الأنسجة القطبية غير المتجانسة الغريبة في طبقاتنا. هذه المعقدة
الشكل 2 | نموذج DFT لشبكة دوامة فرّوإلكترونية في BTO. أ، خريطة إزاحة التيتانيوم (الأسهم السوداء) للنموذج المحسوب بواسطة DFT. لم تُظهر محاكاة DFT من المبادئ الأولى أي مكون استقطاب متجانس. ب، إجهاد القص (مكون من موتر إجهاد الشبكة) تم الحصول عليه من نموذج DFT. خريطة إزاحة Ti (الأسهم السوداء) مدمجة على العزم الحلزوني (Q) للاستقطاب الفيروكهربائي المستمد من نموذج DFT. الأسهم
في و تشير إلى ثنائيات القطب المحلية كما تم الحصول عليها من ناتج الإزاحات الذرية المحلية (بالنسبة لهيكل مرجعي مركزي متماثل) وشحنات بورن الفعالة. تم تضخيم إزاحات التيتانيوم في الاتجاه c بعامل 40 من أجل الوضوح. تشير العلامات الحمراء والزرقاء في جميع اللوحات إلى مناطق التكديس AA و AB، على التوالي. لاحظ أن هو تكبير لخريطة الاستقطاب المعروضة في لرؤية أفضل لطوبولوجيا مشهد الاستقطاب. أين هو معامل فليكسو كهربائي فعال. من الجدير بالذكر أنه من تدرجات الانفعال المقاسة (الأشكال 1ب، هـ و 2ب) والاستقطاب غير المتجانس (الأشكال 1ج، ف و 2ج)، نرى دعماً مباشراً لارتباط من هذا النوع في نتائجنا. نجد أن المناطق التي تحتوي على ، الموضحة كأهداب حمراء عمودية في الشكل 3، تتميز بالإيجابية؛ وعلى العكس، المناطق التي، التي تظهر كخيوط عمودية زرقاء في الشكل 3، تظهرعلاقة مماثلة تنطبق علىالتدرجات ومكون الاستقطاب. يمكن التقاط العلاقة بين الإجهاد وأنماط الاستقطاب بطريقة هندسية بسيطة. كما هو موضح في الشكل 4، فإن كسر التناظر الناتج عن تعديل الإجهاد القص (والدوراني) يؤدي بسهولة إلى الترتيب الملحوظ للدوامات القطبية والدوامات المضادة. إجهاد قص محلييكسر التناظر المربع لـ خلايا الشكل 4، مما ينتج عنه زوايا كبيرة وزوايا صغيرة. في هذه الصورة، تم رسم الأسهم (الاستقطابات الفلكية) على افتراض أن الكاتيونات تتحرك نحو الزوايا الصغيرة، مما يؤدي بشكل طبيعي إلى ترتيب ثنائي القطب يشبه المضاد الدوامة مع دوران صفر لمجال الاستقطاب المركز في الخلايا مع. وبالمثل، تتشكل دوامات الاستقطاب (اللف غير الصفري) حول الخلايا مع .
تتيح لنا نتائجنا التجريبية تقدير الاقتران الفلكسوي الفعال على النحو التالي
الشكل 3|تدرجات إجهاد القص لطبقات BTO الملتوية. أ-ج، مشتق إجهاد القص على طول-محور منطبقة ثنائية ملتوية من BTO (أ) وطبقة ثنائية ملتوية BTO (ب) ونموذج محسوب باستخدام نظرية الكثافة الإلكترونية (DFT) يتوافق معطبقات ملتوية (ج). -d-f، مشتق إجهاد القص على طول-محور منطبقة ثنائية ملتوية (d) وأطبقة ثنائية ملتوية BTO (e) ونموذج محسوب باستخدام نظرية الكثافة (DFT) يتوافق معطبقات ملتويةخريطة إزاحة Ti ( (الأسهم السوداء) تتراكب على جميع الصور. تم تضخيم إزاحات التيتانيوم لتكون أكثر وضوحًا بعامل 20 في و وبنسبة 40 في و .
الشكل 4 | عرض تصويري للارتباطات الفلكسويكترية. رسم لطبقة BTO، يظهر مناطق من إجهاد القص الثابت تقريبًا كخلايا لشبكة دورية. نشير إلى النظائر لـ و المواقع التي تم مناقشتها في النص. الأسهم السوداء تمثل الاستقطاب الناتج عن تأثير الفليكسوإلكتريك؛ هذه الأسهم تتماشى مع المعادلتين (1) و (2) لـ“، وهم يقدمون الدوامات والدوامات المضادة التي تم ملاحظتها تجريبياً. لاحظ أن الاستقطاب المرن الكهربائي يمكن فهمه بشكل بديهي من كسر التناظر الناتج عن تعديل الإجهاد. على سبيل المثال، في أي نقطة شبكة معينة (تشاركها أربع خلايا، مع أربع زوايا خلايا مرتبطة)، نجد دائماً سهمًا يشير نحو الخلية ذات أصغر (زاوية.
حيث تشير القيمة الصغيرة نسبيًا التي تم الحصول عليها إلى أن تدرجات الإجهاد الكبيرة في عيناتنا تتجاوز التقريب الخطي (الطرق). من المثير للاهتمام أيضًا أن المشتقات الثانية للإجهاد القص يمكن استخدامها لحساب التدوير المتوقع لعنصر الاستقطاب. من الربط الفلكسوكهربائي بين تدرجات الإجهاد والاستقطاب (المعادلتان (1) و(2))، فإن العلاقة التالية صحيحة:
تم التقاطها عن كثب بواسطة النتائج التجريبية (انظر الشكل 9 في البيانات الموسعة الذي يظهر المشتقات الثانية لتدرج الإجهاد والشكل 10 في البيانات الموسعة الذي يظهر دوران الاستقطاب). أخيرًا، يجدر بالذكر الادعاءات الأخيرة حول وجود كهربائية فرّوإلكتريكية ناتجة عن تأثير الموير في طبقات الهترو الملتوية من مواد فان دير وولز.علاوة على ذلك، تم ملاحظة المجالات القطبية دون استجابة فرّوإلكتريكية شاملة.بالإضافة إلى تبديل الاستقطاب في مجال التكديس من نيتريد البورون السداسي باستخدام الانزلاق فان دير فالزالدراسات النظرية نستنتج أن وجود استقطاب قابل للتبديل يبقى مستمراً في مجال كهربائي صفر يجب أن يُظهر لدعم ادعاء الفيروكهربائية. بالمقابل، في حالتنا، تمتلك الطبقات المستقلة حالة أرضية فيروكهربائية قوية، وتنتج الطوبولوجيا القطبية عن تعديلها بواسطة نمط إجهاد واجهة الموير. علاوة على ذلك، فإن تحفيز الإجهاد ومناظر الاستقطاب الدوراني في الطبقات الفيروكهربائية التي تبلغ سمكها نانومتر واحد يتجنب ظهور العيوب في طبقات الجرافين الرقيقة الملتوية (التي تبلغ سمكها ذرة واحدة)، حيث تبقى أسئلة مفتوحة حول الإجهاد الناتج عن السوبرلattice الموير واسترخائه..
ملخص وتطلعات
باختصار، وجدنا أنه من الممكن تحفيز أنسجة كهربائية غير تافهة في طبقات كهربائية مقلوبة حرة. القوة الدافعة هي الروابط عبر الواجهة بين الطبقات الملتوية – أي، الشروط الحدودية الميكانيكية التي تفرضها بشكل فعال على بعضها البعض. تتسبب هذه الروابط في حدوث تدرجات كبيرة في الإجهاد في الطبقات الكهربائية، مما يؤدي بدوره إلى تعديل يشبه الدوامة في حالة الاستقطاب المتجانس من خلال تأثير الفليكسوإلكتريك. وبناءً عليه، نجد أن دورية نمط الدوامة ثنائية الأبعاد يمكن ضبطها بشكل كبير من خلال التحكم في زاوية الالتواء.
هذا يوفر فرصًا ممكنة بفضل التعديلات الفريدة التي يمكن تحقيقها في الطبقات المورائية لاستكشاف التأثيرات والوظائف الفيزيائية، بالإضافة إلى ما إذا كانت يمكن أن تستضيف توبولوجيات مثل الهوبفيون وحلقات سولومون التي تم العثور عليها مؤخرًا فينانوكريستالاتالنمط الطوبولوجي المرتبط بشدة مع الدوامات والدوامات المضادة يذكر بشبكة الميرونات المربعة، وهي كائنات ذاترقم طوبولوجي موجود فقط في الشبكات، تم ملاحظته في المغناطيسات الكيرالية ذات الأنيسوتروبية المغناطيسيةيتعارض مع الأنسجة الفيروكهربائية السابقة الموجودة في الأفلام الفيروكهربائية المحصورة في اتجاه النمو، فإن المنظر القطبي لدينا ثنائي الأبعاد وقابل للتعديل بشكل كبير من خلال التحكم في زاوية الالتواء للطبقتين، وبالتالي فهو أكثر ملاءمة للتطبيقات في الذاكرات الفيروكهربائية عالية الكثافة التي تصل إلى جيجابت.حدوده التي تتيحها قلة صغيرةالأجسام الطوبولوجيةفي اتجاه أكثر أساسية، نعتقد أن التفاعلات القريبة بين الطبقات ذات الترتيبات الفيرويكية المختلفة قد تعتمد بشكل كبير على زاوية الالتواء. ستوفر الطبقات المتشابكة بالتأكيد فرصًا لاستكشاف ظواهر غير معروفة سابقًا في فيزياء السطح وكيمياء السطح.
المحتوى عبر الإنترنت
أي طرق، مراجع إضافية، ملخصات تقارير Nature Portfolio، بيانات المصدر، بيانات موسعة، معلومات إضافية، شكر وتقدير، معلومات مراجعة الأقران؛ تفاصيل مساهمات المؤلفين والمصالح المتنافسة؛ وبيانات توفر البيانات والرموز متاحة علىhttps://doi.org/10.1038/s41586-023-06978-6.
هسو، س.-ل. وآخرون. ظهور حالة الدوامة في الهياكل الفيروكهربائية المحصورة. مواد متقدمة 31، 1901014 (2019).
شافر، ب. وآخرون. الكيرالية الناشئة في نسيج الاستقطاب الكهربائي لطبقات التايتانات الفائقة. وقائع الأكاديمية الوطنية للعلوم في الولايات المتحدة الأمريكية 115، 915-920 (2018).
غروفيرمان، أ. وآخرون. مجالات الفيروكهربائية الدوامية. مجلة الفيزياء: المادة المكثفة 20، 342201 (2008).
نيلسون، سي. وآخرون. مصفوفات نانوية عفوية من الدوامات عند واجهات المواد الفيروكهربائية. رسائل نانو. 11، 828-834 (2011).
داس، س. وآخرون. ملاحظة السكيرميونات القطبية في درجة حرارة الغرفة. ناتشر 568، 368-372 (2019).
كاريتا، ل. وآخرون. التحكم غير المتطاير في مجال الكهرباء في تناظر الانعكاس. نات. ماتير. 22، 207-215 (2023).
يوان، س. وآخرون. شبكة بولار-سكايرميون ذات التعبئة السداسية في الفيروكهربائية الرقيقة للغايةأفلام. ريف. ليت. 130، 226801 (2023).
تشين، س. وآخرون. التقدم الأخير في الهياكل الطوبولوجية في الأفلام الرقيقة الفيرويكية والهياكل المختلطة. مواد متقدمة. 33، 2000857 (2021).
روسو، د. وآخرون. بلورات الدوران غير المتوافقة الكهروضغطية. ناتشر 602، 240-244 (2022).
جيا، سي.-إل، أوربان، ك. و، أليكسي، م.، هيس، د. وفريجيو، إ. الملاحظة المباشرة للدوران المستمر للثنائي الكهربائي في مجالات إغلاق التدفق في المواد الفيروكهربائية. العلوم 331، 1420-1423 (2011).
بيترز، ج. ج. ب.، أباتشيتاي، ج.، بينلاند، ر.، أليكس، م. & سانشيز، أ. م. التواء الاستقطاب وإغلاق التدفق في وصلات النفق متعددة ferroic. نات. كوميون. 7، 13484 (2016).
شيلينغ، أ. وآخرون. المجالات في النقاط النانوية الفيروكهربائية. نانو ليت. 9، 3359-3364 (2009).
تانغ، ي. ل. وآخرون. ملاحظة مجموعة دورية من أرباع إغلاق التدفق في الفيروكهربائيات المتوترةأفلام. العلوم 348، 547-551 (2015).
ناوموف، إ. إ.، بيلاييش، ل. وفو، هـ. انتقالات طور غير عادية في الأقراص النانوية والفوانيس النانوية الفيروكهربائية. ناتشر 432، 737-740 (2004).
كورنيف، إ.، فو، هـ. وبيلتش، ل. أفلام رقيقة جداً من المحاليل الصلبة الفيروكهربائية تحت مجال تفريغ متبقي. فيز. ريف. ليت. 93، 196104 (2004).
ناوموف، إ. و براتكوفسكي، أ. م. أنماط استقطاب غير عادية في جزيئات نانوية فرّوإلكتريكية مسطحة. فيز. ريف. ليت. 101، 107601 (2008).
تشوي، ك. ج. وآخرون. تعزيز الخصائص الكهروإلكترونية في المواد المشدودةالأفلام الرقيقة. العلوم 306، 1005-1009 (2004).
كاتالان، ج. وآخرون. دوران الاستقطاب الفلكسوي في الأفلام الرقيقة الفيروكهربائية. نات. ماتير. 10، 963-967 (2011).
مقالة
زوبكو، ب.، كاتالان، ج. وتاجانتسيف، أ. ك. تأثير الفليكسوإلكتريك في المواد الصلبة. مراجعة سنوية لأبحاث المواد 43، 387-421 (2013).
أغوادو-بونتي، ب. وجونكيرا، ج. مجالات الإغلاق الشبيهة بالمغناطيسية الحديدية في الأفلام الفيروكهربائية الرقيقة جداً: محاكاة من المبادئ الأولى. فيز. ريف. ليت. 100، 177601 (2008).
هونغ، ج.، كاتالان، ج.، فانغ، د. ن.، أرتاشو، إ. وسكوت، ج. ف. طوبولوجيا حقل الاستقطاب في الأسلاك النانوية الفيروكهربائية من المبادئ الأولى. فيز. ريف. ب 81، 172101 (2010).
لو، هـ. وآخرون. الكتابة الميكانيكية للاستقطاب الفيروكهربائي. العلوم 336، 59-61 (2012).
كاو، ي. وآخرون. حالات مترابطة قابلة للتعديل وطور مغزلي مستقطب في جرافين مزدوج الطبقات ملتوي. ناتشر 583، 215-220 (2020).
كازميرتشاك، ن. ب. وآخرون. مجالات الإجهاد في الجرافين ثنائي الطبقة الملتوي. نات. ماتير. 20، 956-963 (2021).
لو، د. وآخرون. تخليق أفلام بيروفسكايت أحادية البلورة قائمة بذاتها وهياكل غير متجانسة عن طريق حفر طبقات قابلة للذوبان في الماء. نات. ماتير. 15، 1255-1260 (2016).
هونغ، س. س. وآخرون. حالات إجهاد الشد القصوى فيالأغشية. العلوم 368، 71-76 (2020).
دونغ، ج. وآخرون. غشاء بلوري مفرد فائق المرونة مع دوران مستمر للثنائي الكهربائي. العلوم 366، 475-479 (2019).
هان، ل. وآخرون. مجالات قطبية شبيهة بالسكيرميون قابلة للتبديل بكثافة عالية مدمجة على السيليكون. ناتشر 603، 63-67 (2022).
شاو، ي.-ت. وآخرون. ظهور اللولبية في انتقال الطور من الميرون القطبي إلى السكيرميون. نات. كوميونيك. 14، 1355 (2023).
يو، إكس. زد. وآخرون. التحول بين الميرون والسكيرميون في أنسجة الدوران الطوبولوجية في مغناطيس حلزوني. ناتشر 564، 95-98 (2018).
ملاحظة الناشر: تظل شركة سبرينغر ناتشر محايدة فيما يتعلق بالمطالبات القضائية في الخرائط المنشورة والانتماءات المؤسسية.
الوصول المفتوح هذه المقالة مرخصة بموجب رخصة المشاع الإبداعي النسب 4.0 الدولية، التي تسمح بالاستخدام والمشاركة والتكيف والتوزيع وإعادة الإنتاج بأي وسيلة أو صيغة، طالما أنك تعطي الائتمان المناسب للمؤلفين الأصليين والمصدر، وتوفر رابطًا لرخصة المشاع الإبداعي، وتوضح ما إذا كانت هناك تغييرات قد أُجريت. الصور أو المواد الأخرى من طرف ثالث في هذه المقالة مشمولة في رخصة المشاع الإبداعي الخاصة بالمقالة، ما لم يُشار إلى خلاف ذلك في سطر الائتمان للمواد. إذا لم تكن المادة مشمولة في رخصة المشاع الإبداعي الخاصة بالمقالة وكان استخدامك المقصود غير مسموح به بموجب اللوائح القانونية أو يتجاوز الاستخدام المسموح به، فسيتعين عليك الحصول على إذن مباشرة من صاحب حقوق الطبع والنشر. لعرض نسخة من هذه الرخصة، قم بزيارةhttp://creativecommons.org/licenses/by/4.0/. (ج) المؤلف(ون) 2024
طرق
تصنيع أفلام البيروفسكايت المستقلة
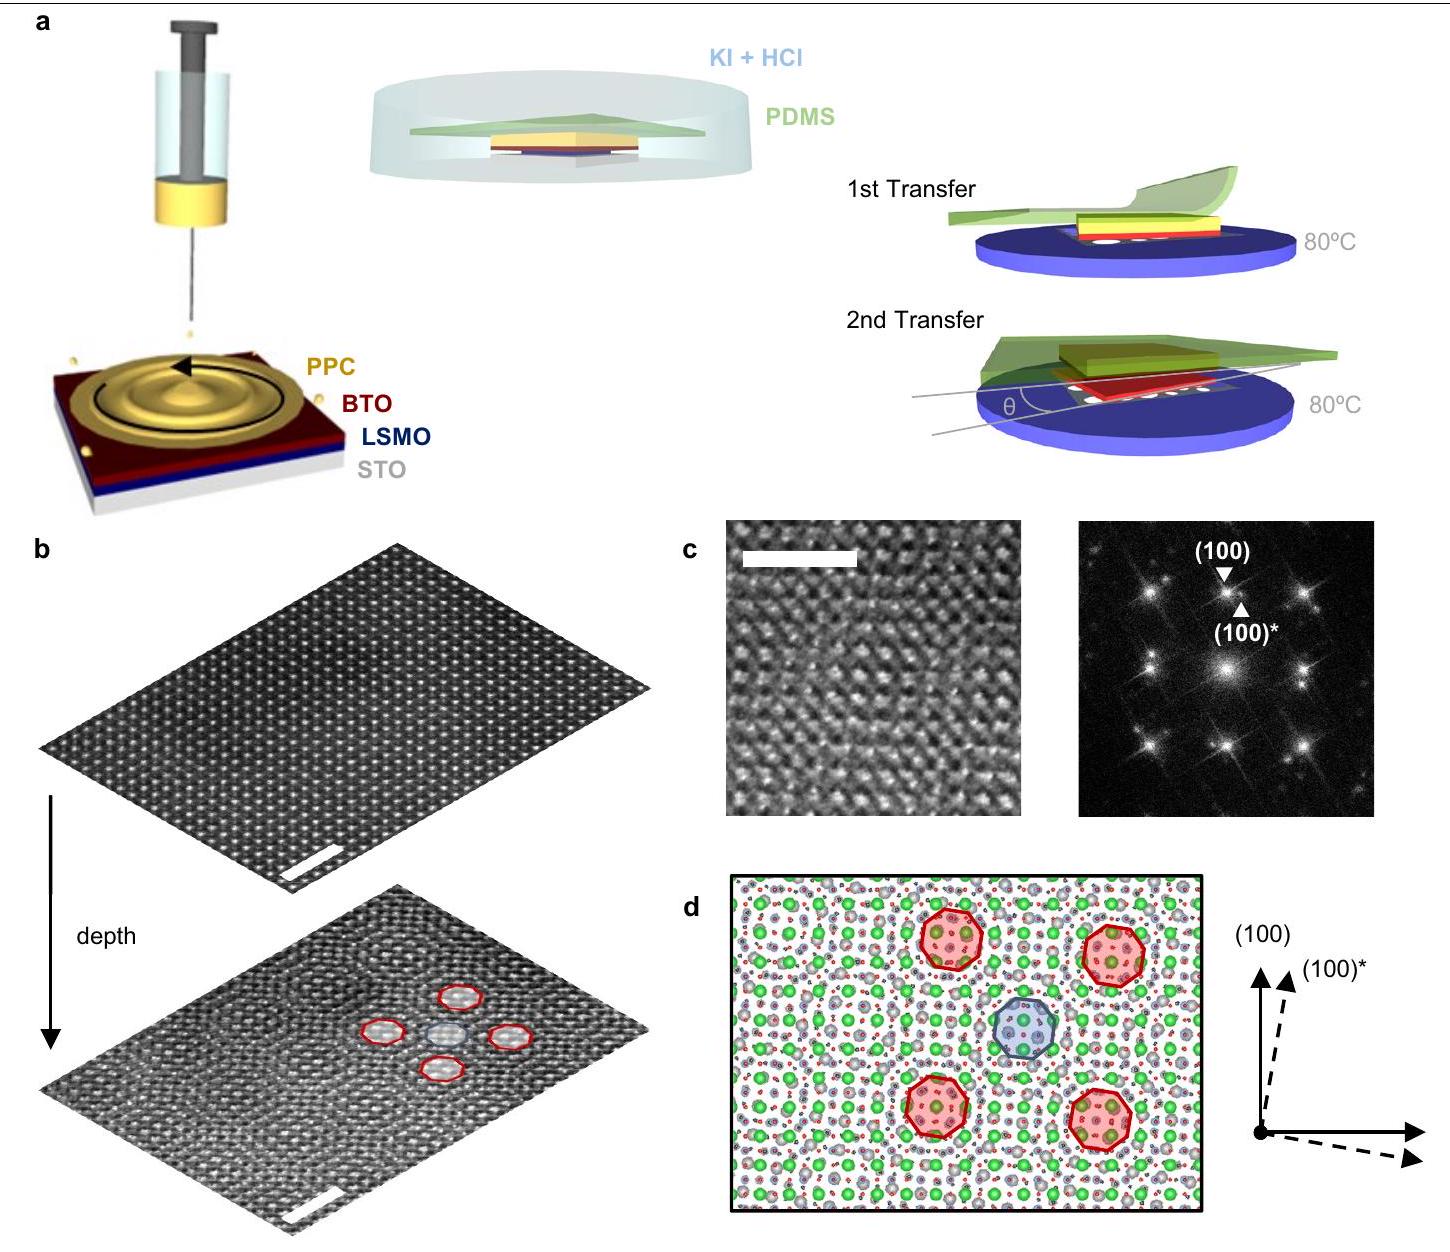
تم زراعة طبقات BTO بسماكة 15 نانومتر على (LSMO) مخزن (100) المواد الأساسية باستخدام تقنية الرش بالأكسجين النقي تحت ضغوط عالية (3.2 مللي بار) (المرجع 47). تنتج هذه التقنية نموًا عالي التبلور مع واجهات حادة وانحرافات ضئيلة في النسبة الكيميائية (انظر القسم التالي حول تحليل EELS). يعمل LSMO كطبقة تضحوية تسمح بإطلاق طبقة BTO عند الغمر في مادة انتقائية.مادة حامضة (33 ملغ من KI في محلول HCl)تركيز الحجم) لمدة متوسطة تبلغ 3 أيام (مرجع 48). قبل الغمر، تم تحضير محلول من كربونات البولي بروبيلين (PPC؛ سيغما ألدريتش) (10 جرام من PPC لكل 100 مل من الأنيسول) وتم تطبيقه بواسطة الطلاء الدوراني ( لمدة 30 ثانية ) على عينة BTO النقية. بعد معالجة PPC في لمدة 10 دقائق على صفيحة ساخنة، تم لصق العينة على بولي ديميثيل سيليكون تجاري (PDMS؛ جل-فيلم WFختم mil بواسطة Gel-Pak). تم غمر العينة في محلول الإيتشانت لمدة 3 أيام، وهي فترة يتم خلالها عادةً فصل الركيزة عن الفيلم المدعوم بواسطة البوليمر. ثم تم غسل العينة في ماء منزوع الأيونات لمدة 30 ثانية. يمكّن البوليمر الداعم من معالجة طبقة الأكسيد المستقلة حتى يتم نقلها إلى الفتحة.شبكات الغشاء لمراقبة STEM. تم إجراء النقل عن طريق وضع الشبكة على لوحة بيلتييه عندلتفضيل نقل الكل (حواليحجم) طبقة BTO. بعد إزالة PDMS، تم غمر الأغشية في الأسيتون والكحول الأيزوبروبيلي لإزالة PPC المتبقي وتنظيف سطح طبقة الأكسيد المستقلة. تم تنفيذ التجميع الحتمي للطبقة الثنائية الملتوية عن طريق تثبيت الطبقة الأولى على منصة قابلة للدوران تحت المجهر في إعداد مخصص لنقل الطبقات. تم محاذاة حواف الطبقة (الموازية لحواف الركيزة على طول اتجاهات [100]) مع علامات مرجعية لحامل العينة. يمكن وضع الطبقة الثانية في الأعلى مع دورانها بالنسبة للأولى باستخدام حواف الطبقة (التي تتوازى مع اتجاهات بلورية BTO [100]) لتحديد الزاوية. تم ضبط زاوية الالتواء بدقة . قيمة أكثر دقة لزاوية الالتواء (دقة يمكن قياسه من التحول بين نقاط تحويل فورييه السريع (FFT) لصور المجهر الإلكتروني. توضح الشكل التوضيحي 1 صورة مجهر ضوئي لطبقة مزدوجة ملتوية تم نقلها إلى شريحة سيليكون مغطاة بالذهب. لاحظ المساحة الكبيرة (حواليحجم) العينة. على الرغم من أنه يمكن ملاحظة بعض التجاعيد، إلا أنها مفصولة بمسافات كبيرة بما يكفي لتوفير مناطق واسعة حيث تتراكب الطبقتان بشكل مسطح فوق بعضها البعض. أظهرت ملاحظات المجهر الذري للقوة على أسطح الطبقات الثنائية الملتوية خشونة صغيرة مماثلة، حيث كانت القيم في نطاق 0.5 نانومتر (جذر متوسط المربعات) على مسافات بحجم الميكرون (الشكل التوضيحي 2).
ميكروسكوبية المسح الإلكتروني الناقل
تم إجراء توصيف STEM باستخدام مجهر إلكتروني مصحح للانحراف JEOL JEM-ARM 200cF مزود بمسدس انبعاث بارد ومطياف Gatan Quantum، يعمل عند 200 كيلوفولت. تم تنفيذ تقسيم العمق باستخدام STEM-HAADF من خلال الحصول على صور STEM-HAADF بدقة ذرية كدالة للتركيز.، مما يمكننا من استكشاف أعماق مختلفة من العينة والتفريق بين الطبقات العليا والسفلى من الكومة. تم الحصول على صور STEM-HAADF باستخدام زاوية نصف فتحة تشكيل البروبي 30 م rada و زاوية نصف جمع كاشف HAADF من .
تحليل EELS الكمي
لتحليل EELS، تم الحصول على طيف فقدان طاقة الإلكترون لكل بكسل أثناء مسح الشعاع مع وقت اكتساب قدره 1 ثانية لكل بكسل. لاكتساب البيانات، استخدمنا وضع Dual-EELS معالتشتت الذي مكننا من تسجيل قمة عدم الفقدان وحواف فقدان النواة BTO في نفس الوقت. بالنسبة لتحليل التركيب العنصري باستخدام EELS، قمنا بإجراء تقدير قائم على النموذج، بما في ذلك التشتت المتعدد.، باستخدام الروتينات المتاحة في جاتان
مجموعة الميكروغراف الرقمي. الشكل التوضيحي الإضافي 3 يظهر النسبةملفات التركيز. تُظهر تحليلاتنا أن العينات المزروعة تحتوي على تركيزات متوازنة من التيتانيوم والأكسجين.
تحليل الإجهاد والاستقطاب في الطبقات الثنائية الملتوية
بسمك نانومترتم فصل طبقات BTO لتشكيل تقاطعات ثنائية ملتوية بزاويا التواء محددة تم نقلها إلى ثقوبالأغشية لتصوير المجهر الإلكتروني. لدراسة الخصائص الهيكلية للطبقات الفردية من الطبقات الملتوية، قمنا بإجراء تجربة STEM-HAADF (انظر القسم السابق). مع التركيز على سطح المدخل للكتلة (عدم التركيز )، لاحظنا الهيكل النموذجي لبيروفسكايت BTO الذي يتوافق مع الطبقة العلوية. تم إظهار تباين الموير من خلال تغيير التركيز للوصول إلى واجهة الطبقة الثنائية الملتوية (التركيز غير المحدد ) (الشكل البياني الموسع 1b). يؤدي زيادة عدم التركيز إلى جعل الطبقة السفلية واضحة، والتي تبدو مائلة بزاوية الالتواء للطبقتين. تظهر الطبقات الثنائية الفيروكهربائية الملتوية ميزات موير المميزة التي تحددها نمط التوافق الذري بين الطبقتين (الشكل البياني الموسع 1c). زاوية الالتواء، المحددة من صورة تحويل فورييه السريع، متجانسة على طول العينة المصنعة وقريبة من القيمة الاسميةدوران الأفلام خلال عملية النقل الحتمية. تُظهر تحويل فورييه السريع النقاط من كل من طبقات BTO الملتوية العلوية والسفلية؛ ولتوضيح الأمر، نشير إلى الاتجاهات التي تتوافق مع الطبقة الملتوية التي تشكل نمط الموير على أنها (100).و (010). يظهر نمط الموير ميزتين متميزتين (شبيهة بالهضبة) في المناطق المتطابقة بشكل كبير (ذرة على ذرة) من كلا الطبقتين، والمُعلمة كـ AA و AB في الشكل الإضافي 1 ب وعلى النموذج الذري الصلب الموضح في الشكل الإضافي 1 د. حول مواقع AA، هناك تكديس AA (با على با، تي على تي وأو على أو) بين الطبقتين العلوية والسفلية، بينماالمواقع تظهرتكديس (Ba على Ti وTi على Ba) لأيونات Ba وTi في الطبقات الملتوية مع الحفاظ على تكديس AA لأنيونات O.
قمنا بتحليل الإجهاد باستخدام حزمة برمجيات تحليل أزواج القمم (PPA) (HREM Research) لبرنامج Digital Micrograph.قمنا بتحليل صور STEMHAADF لـ و تراكمات ثنائية الطبقات ملتوية تم الحصول عليها مع التركيز على سطح المدخل للتراكم (عدم التركيز) ). لتحسين دقة التحليل، تم تدوير اتجاه المسح بعيدًا عن المحاور البلورية لـ BTO. من أجل التحليل، قمنا بتنفيذ فلتر براج الذي يختار الانعكاسين الرئيسيين على طول الاتجاهين (100) و (010) كمتجهات أساسية. ثم تم تحديد مواقع القمم على الصورة المفلترة، وتم تحديد مجالات الإزاحة النسبية ( تم حساب ) من الشبكة المقاسة بالنسبة لمنطقة الشبكة المرجعية. في هذه الحالة، استخدمنا الصورة الكاملة كمنطقة مرجعية. أخيرًا، تم حساب مكونات موتر الإجهاد من مجالات الإزاحة كـ و .
تظهر الأشكال البيانية الممتدة 2a و 2b (صور) غير معالجة للطبقة العليا من كلا الطبقتين. تم قياس الإجهاد داخل الطبقة على الطبقة العليا (عدم التركيز ). باستثناء إجهادات القص المتماثلة ( شملت تحليل الإجهاد المكونات غير المتماثلة لموتر الإجهاد ) المرتبطة بالدورات المحلية لشبكة البيروفسكايت (الشكل البياني الممتد 2c، d). تظهر التجارب الضابطة على طبقات BTO المستقلة المفردة توزيع إجهاد شبه متجانس (الشكل البياني الممتد 3)، مما يوضح أن خرائط الإجهاد المعقدة التي تم الحصول عليها في الطبقات الثنائية تنشأ من تكديس الطبقات الملتوية. لاحظ أن هناك تطابقًا أقصى بين الذرات في الطبقات الملتوية عند و المواقع؛ نجد إجهادات قص صغيرة جداً في تلك المناطق.
لتحديد الاستقطاب الفيروكهربائي، تم قياس مواقع الذرات لكل من كاتيونات Ba في موقع A وTi في موقع B على صور STEM-HAADF المفلترة بسرعة باستخدام تحويل فورييه لطبقات BTO الملتوية، التي تم الحصول عليها مع التركيز على سطح المدخل للطبقة (عدم التركيزلتحديد المواقع الذرية بدقة، قمنا بإجراء تركيب غاوسي ثنائي الأبعاد باستخدام Atomapتم حساب الاستقطاب من انحراف أيونات التيتانيوم في الموقع B في خلايا الوحدة الفردية (الانزياح النسبي لأيون التيتانيوم في الموقع B عن الموضع المركزي، المحدد مع أيونات الباريوم في الموقع A ضمن نفس خلية الوحدة).
مقالة
الشكل 4 من البيانات الموسعة يظهر تحليل الاستقطاب لـطبقة ثنائية ملتوية من BTO. تشير الأسهم في اللوحة اليسرى (التي تتناسب أطوالها مع لحظات الفيروكهربائية الكتلية لـ BTO) إلى نمط من موجات الاستقطاب. يمكن ملاحظة مجموعة الفقاعات الفيروكهربائية بشكل أفضل بعد طرح الاستقطاب المتوسط. ) القيمة في الصورة (الشكل البياني الموسع 4، اليمين).
أثر تشوهات الصورة الناتجة عن الانحرافات والعيوب الناتجة عن تحليل تحويل فورييه السريع وتأثيرات توجيه الإلكتروناتيتم وصف النظام الثنائي الطبقات بالكامل في الملاحظة التكميلية 3.
عينات مقطع عرضي لتحليل الاستقطاب خارج المستوى
أصل الإجهاد غير المتجانس هو الروابط الفيزيائية الناتجة عن القرب بين الطبقتين الفيروكهربائيتين، والتي تمكّنها الواجهة الضيقة بين الطبقات الملتوية. تُظهر البيانات الموسعة الشكل 5 صور STEM-HAADF مقطعية.طبقة ثنائية من BTO الملتوية. عرض الواجهة المقاس من ملفات الكثافة عبر الواجهة في صور FFT المعكوسة المفلترة بالماسكة (الشكل 5c من البيانات الموسعة) هو من حيث ترتيب وحدة خلوية واحدة. لاحظ أن التباين الداكن عند واجهة الكومة مشابه للصور التي تم الإبلاغ عنها مؤخرًا للالتواء.الأغشيةويمكن تفسيره بتقليل تأثير التوجيه عند الواجهةكما يتضح من صور المجهر عالي الدقة للمقاطع العرضية، هناك تواصل ‘حميم’ بين الطبقات يسمح بالتفاعل بينها.الذي من المتوقع أن يكون قويًا لأكاسيدنا القطبيةوقد تبقى حية حتى عبر طبقات الذرات المعلقة. في بعض الأحيان، نجد مناطق ذات عرض واجهة متزايد نتيجة للاضطراب أو المواد الممتصة، حيث لا يُلاحظ نمط الموير ولا تعديل الإجهاد.
تظهر البيانات الموسعة الشكل 6 خريطة استقطاب للطبقة العلوية من الطبقة الثنائية في البيانات الموسعة الشكل 5. لاحظ أنه على الرغم من وجود مناطق كبيرة ذات استقطاب في المستوى على السطح العلوي، إلا أن الاستقطاب عند الواجهة (الجزء السفلي من الصورة) يكون في الغالب قطريًا. تشير النتيجة المتعلقة بالاستقطاب خارج المستوى بالقرب من الواجهة إلى نشوء طور شبيه بالمجسم المعيني مع إزاحات قطبية تقريبًا في الـالاتجاه. (بدقة، هذه المرحلة ربما تكون أحادية الميل.) هذا ليس غير متوقع تمامًا نظرًا لوجود الواجهة السفلية التي قد تفضل فيها العيوب و/أو المواد الممتصة حدوث مكون استقطاب خارج المستوى.
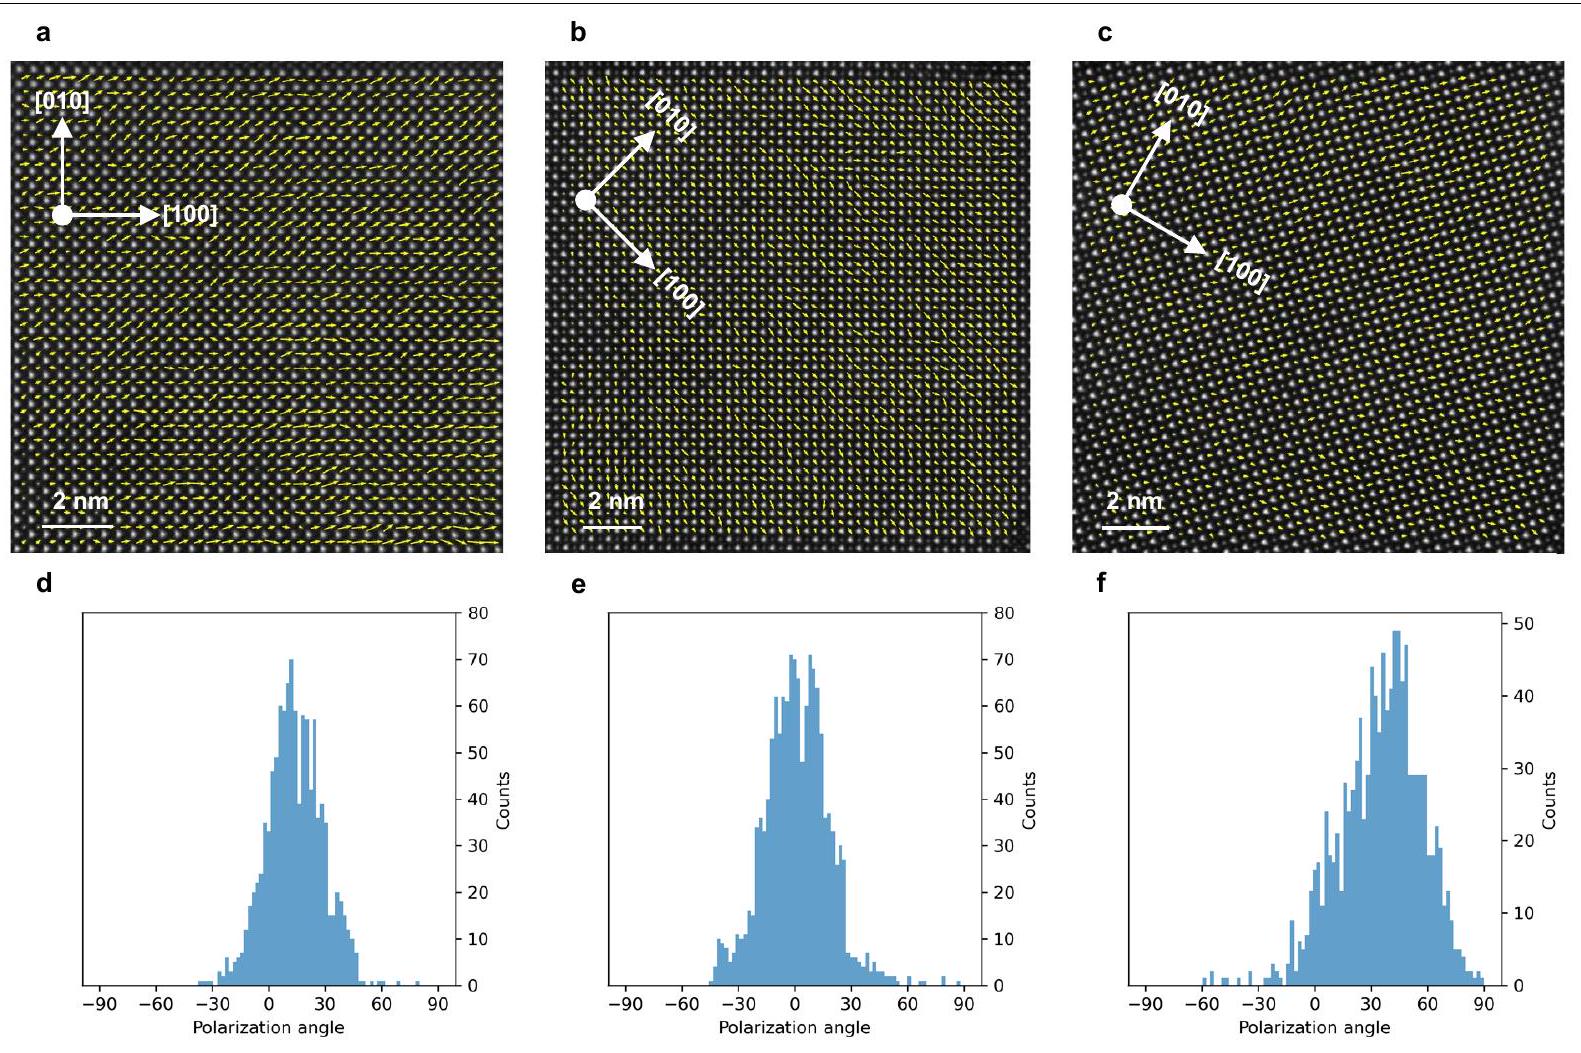
على النقيض من ذلك، تشير الاستقطابية الصافية في المستوى عند سطح الطبقة العليا إلى أن طبقاتنا تعرض مراحل الفيروكهربائية التربيعية والمستطيلة التي تحدث أيضًا في المادة الكتلية. تظهر بلورات BTO هيكلًا تربيعيًا في درجة حرارة الغرفة، مما يوحي باستقطاب على طول الاتجاهات [1،0] أو [0،1] الموجودة أيضًا في طبقاتنا. أظهرت طبقات BTO المستقلة المفردة استقطابًا متوسطًا في المستوى في الاتجاه [1،0]، على الرغم من أنه تم ملاحظة مجالات مستطيلة [1،1] في بعض الأحيان (انظر الشكل 7 في البيانات الموسعة، الذي يظهر مخططات المدرج لاستقطاب الفيروكهربائية في طبقات BTO المستقلة المفردة). نظرًا لقربها من الانتقال من التربيعي إلى المستطيل في المادة الكتلية (الذي يحدث عند 278 كلفن، مما يعني أن هذه المراحل لها طاقات حرة مشابهة جدًا في الظروف المحيطة) وحقيقة أن الواجهات الموجودة قد تسبب المزيد من الاسترخاءات خارج المستوى، فإن المجالات الفيروكهربائية الملحوظة التي تشير إلى نواة مراحل مختلفة تبدو مقبولة تمامًا، حيث قد يتم تثبيتها بواسطة أي من العوامل العديدة التي تميز طبقات BTO لدينا عن المركب الكتلي. من المثير للاهتمام أن نلاحظ أن الطبقات المفردة، بخلاف المجالات الكبيرة ذات الاستقطاب الفيروكهربائي المتجانس التي تم مناقشتها أعلاه، تظهر أيضًا حالات إجهاد شبه متجانسة دون أي مؤشر على الطوبولوجيا القطبية التي لوحظت في الطبقات الثنائية الملتوية (انظر الشكل 3 في البيانات الموسعة، الذي يظهر تحليلًا مشابهًا لطبقة مفردة كما هو موضح في الشكل 1 للطبقات الثنائية الملتوية).
اعتماد سمك الطبقة
تعتمد سمك نمط الإجهاد-الاستقطاب الملحوظ على تقديم دليل مهم حول أصل التأثير (بيانات موسعة)
الشكل 8، الذي يظهر الطوبولوجيا القطبية للطبقات الثنائية مع و طبقات BTO السميكة معزاوية الالتواء). بسبب عمق التركيز في المجهر الخاص بنا، فإن سمك 8 نانومتر هو الحد الأدنى الذي يسمح بحل مواقع الذرات في الطبقتين بشكل مستقل (الشكل التكميلي 4). يؤدي السمك الأكبر للطبقة الفردية إلى قيم أصغر من إجهاد القص في مواقع المضاد الدوامة (حواليلـعينة بدلاً من حوللثنائي الطبقة مع طبقات بسمك 15 نانومتر) وأيضًا قيم أصغر من العزم الحلزوني في مواقع الدوامات بعد طرح الاستقطاب المتجانس (حوالي 1.5 eلـعينة بدلاً منوجدت لـطبقة ثنائية). على العكس من ذلك، في العينة التي تبلغ 8 نانومتر، يتم ملاحظة الطوبولوجيا القطبية حتى دون طرح الاستقطاب المتجانس، مما ينتج عنه تغييرات ضئيلة في مشهد الاستقطاب. أيضًا، قيم متوسطة أكبر من إجهاد القص ( ) و لحظة تورoidal ( )، قابل للمقارنة مع يتم الحصول على العينة في العينة الأرق. وهذا يدل على أن نمط إجهاد القص الناتج عن الدوران النسبي للطبقات يثبت حالة دوامة لطبقات رقيقة بما فيه الكفاية (8 نانومتر). مع زيادة السماكة، يتم ملاحظة مكون استقطاب متجانس.
حسابات من المبادئ الأساسية
قمنا بإجراء حسابات DFT كما هو مُنفذ في حزمة المحاكاة الأولية فيينا (VASP)استخدمنا صيغة بيردو-بورك-إرنزرهوف للمواد الصلبة (PBEsol)تنفيذ التقريب العام للتدرج لوظيفة التبادل-الارتباط. يتم التعامل مع النوى الذرية ضمن نهج الموجة المعززة بواسطة المشروع.، مع الأخذ في الاعتبار الدول التالية بشكل صريح: و لبا؛ و لتي؛ و و لـ O. استخدمنا حد الطاقة لمجموعة الأساس الموجي المسطح. كانت خلايا المحاكاة تتكون منخلايا وحدة البيروفيسكايت وتم حسابها باستخداممونكهورست-باك-نقطة الشبكة. تم استرخاء الهياكل بالكامل حتى انخفضت القوى المتبقية تحتوانخفضت الضغوط المتبقية إلى أقل من 0.001 جيجا باسكال.
دعونا نؤكد أن محاكاة DFT لدينا تت correspond إلى حد درجة حرارة منخفضة جداً (رسميًا، 0 كلفن). وبالتالي، يمكن اعتبار الفروق في الطاقة المحسوبة – أي 9 ميلي إلكترون فولت لكل وحدة صيغة تفصل بين حالة الفيروكهربائية أحادية المجال وبنية الدوامة-مضاد الدوامة – كحد أعلى للفارق في الطاقة الحرة ذات الصلة عند درجة حرارة الغرفة. (في جوهرها، تأتي الفارق في الطاقة المحسوبة من جدران المجالات الفيروكهربائية – التي يُعرف أن طاقتها تنخفض عند التسخين – وتعديل الإجهاد غير المتجانس الذي يفرضه الترابط بين الطبقات.) لاحظ أيضًا أنه في محاكاة لدينا نتعامل مع تكوينات المجال الأحادي والدوامة-مضاد الدوامة كحالتين منفصلتين، بينما في التجربة (باستثناء في أرق الطبقات) تكون الميزات الطوبولوجية تعديلًا صغيرًا نسبيًا للحالة المتجانسة. لهذا السبب أيضًا، فإن الفارق في الطاقة المحسوبة هو حد أعلى للتكلفة الفعلية للطاقة اللازمة لإحداث ميزات طوبولوجية (صغيرة نسبيًا) مضافة على الحالة المتجانسة. ومن ثم، تشير نتائج DFT لدينا إلى أن الهيكل الطوبولوجي الذي تم ملاحظته تجريبيًا يمكن الوصول إليه بسهولة ويكون سليمًا من الناحية الفيزيائية.
تفسر الاعتبارات المذكورة أعلاه أيضًا الفروق الكمية بين الاستقطابات المحلية التي تم ملاحظتها تجريبيًا (حوالي ) وتلك التي تم الحصول عليها في حالة الدوامة – مضاد الدوامة (حوالي على الرغم من أن الحالة الأولى مرتبطة بدولة قطبية متجانسة إلى حد كبير، فإن الحالة الثانية تتوافق مع تكوين يتغير فيه الاستقطاب الكلي في مقاييس طولية تتراوح بين عدد قليل من خلايا الوحدة. من الطبيعي أن نجد استقطابات محلية ذات حجم مخفض في مثل هذه الحالة غير المتجانسة بشدة، حيث يؤدي ذلك إلى تقليل تدرجات الاستقطاب وانخفاض العقوبة الطاقية المرتبطة بها.
أخيرًا، دعونا نلاحظ أن محاكاة الحالة المتجانسة المضطربة مباشرة ستتطلب استرخاءات نظرية الكثافة (DFT) مقيدة لاحترام نمط الإجهاد غير المتجانس الذي لوحظ تجريبيًا؛ ستتضمن هذه الحسابات عدة افتراضات غير تافهة وتعقيدات تقنية، ولم نتناولها هنا.
تقديرات كمية لمعامل الفليكسوإلكتريك
تمكننا قياساتنا الكمية من حساب تدرجات الإجهاد وتعديلات الاستقطاب، وبالتالي تقدير معامل الفليكسوإلكتريك الخطي الفعال.. لدينا
الذي هو أصغر بكثير من النتائج التجريبية النموذجية لـ BTO الكتلي عند درجة حرارة الغرفة (قيم بين و تم الإبلاغ عنومع ذلك، نعتقد أن هذا الاختلاف ربما لا يكون مفاجئًا، لسببين رئيسيين: (1) طبقاتنا الملتوية تختلف كثيرًا عن المواد الكتلية الموصوفة في الأدبيات؛ (2) تدرجات الإجهاد التي نقيسها أكبر بكثير من تلك المستخدمة في قياسات معاملات الفليكسوإلكتريك. فيما يتعلق بالنقطة الأولى، قد تكون طبقات BTO المقيدة لدينا أكثر صلابة كهربائيًا من المادة الكتلية وبالتالي تقدم استجابة فليكسوإلكتريك أصغر. (من المعروف أن مقدار الاقتران الفليكسوإلكتريك يتناسب مع مقدار الاستجابة العازلة..) فيما يتعلق بالنقطة الثانية، لاحظ أنه لتحديد معاملات الفليكسوإلكتريك تجريبيًا، يتم اختيار تدرجات الإجهاد المدروسة عمداً صغيرة، من حيث الحجم (المرجع 69). تدرجات الإجهاد من رتبة -كما هو الحال مع المجالات الفيروالاستية-تعتبر كبيرة جدًا. التدرجات في عيناتنا أكبر حتى، بحوالي درجتين من حيث الحجم. وهذا يشير إلى أن التأثيرات المرنة الكهربائية التي تلعب دورًا في عيناتنا يجب أن تكون غير خطية بشكل قوي. لذلك، لا يمكن تبرير مقارنة تقديرنا للتوصيل الخطي الفعال مع التأثيرات الخطية الصارمة المبلغ عنها في الأدبيات التجريبية.
علاوة على ذلك، قد تكون لدينا اختلافات بسبب المساهمات السطحية في تأثير الفليكسوإلكتريك.. علاوة على ذلك، دعونا نلاحظ أن هناك توقعات نظرية تؤدي إلىقيم حولبالنسبة لـ BTO (المرجع 71) – أي تأثير أصغر مما نقدره. سيكون تسليط مزيد من الضوء على هذه القضايا تحديًا كبيرًا، سواء من حيث التجربة أو النظرية، ويتجاوز نطاق العمل الحالي.
توفر البيانات
البيانات الخام المعروضة في الأشكال الرئيسية متاحة على زينودو (https:// doi.org/10.5281/zenodo.10439374). البيانات الأخرى التي تدعم نتائج هذه الدراسة متاحة من المؤلفين المقابلين عند الطلب المعقول. 47. سانشيز-سانتولينو، ج. وآخرون. نفق الإلكترونات الرنانة المدعومة بواسطة جدران المجال المشحونة في وصلات النفق متعددة ferroic. نات. نانو تكنولوج. 12، 655-662 (2017). 48. بيسكيرا، د. وآخرون. ما وراء الركائز: هندسة السلالات للأغشية الفيروكهربائية. مواد متقدمة 32، 2003780 (2020). 49. بوريسيفيتش، أ. ي.، لوبييني، أ. ر. و بينيكوك، س. ج. تقسيم العمق باستخدام مجهر الإلكترون الناقل الماسح المصحح للانحراف. وقائع الأكاديمية الوطنية للعلوم في الولايات المتحدة الأمريكية 103، 3044-3048 (2006). 50. إيشيكاوا، ر.، لوبييني، أ. ر.، هينوم، ي. وبينيكوك، س. ج. الإضاءة بزاوية كبيرة في STEM: نحو تصوير ثلاثي الأبعاد ذرة بذرة. الميكروسكوبية الفائقة 151، 122-129 (2015). 51. فيربيك، ج. وفان آرت، س. تقدير قائم على النموذج لطيف EELS. الميكروسكوبية الفائقة 101، 207-224 (2004). 52. توماس، ب. ج. وتويستين، ر. د. نهج بسيط قائم على النموذج للتقدير القوي لطيف EELS وصور الطيف. المجهر. التحليل المجهري. 18، 968-969 (2012). 53. غاليندو، ب. ل. وآخرون. خوارزمية Peak Pairs لرسم الخرائط للضغط من صور HRTEM. Ultramicroscopy 107، 1186-1193 (2007). 54. نورد، م.، فولوم، ب. إ.، ماكلارين، آي.، تيبل، ت. & هولمستاد، ر. أتماب: أداة برمجية جديدة للتحليل الآلي لصور الدقة الذرية باستخدام التوافق الغاوسي ثنائي الأبعاد. تقدم في الكيمياء الهيكلية والتصوير 3، 9 (2017). 55. غوز، ف.، ميشينو، ج. وغونز، إكس. الشحنات الذرية الديناميكية: حالةالمركبات. مراجعة الفيزياء B 58، 6224-6240 (1998). 56. سميتون، م. أ.، شنيتزر، ن.، تشنغ، هـ.، ميتشل، ج. ف. وكوركوتيس، ل. ف. العيوب الناتجة عن التوجيه في تتبع الذرات الموجبة في البيروفسكيتات المشوهة المصورة بواسطة HAADF-STEM. المجهر. التحليل المجهري. 28، 1736-1738 (2022). 57. أوفيزي، إ.، سبادارو، م. ج.، روتونو، إ.، غريلو، ف. و هبرت، ج. رؤى حول تباين الصورة من العيوب في ADF-STEM. الميكروسكوبية الفائقة 200، 139-148 (2019). 58. كيم، ي. وآخرون. التبلور عن بُعد من خلال الجرافين يمكّن نقل الطبقات المعتمدة على المواد ثنائية الأبعاد. ناتشر 544، 340-343 (2017). 59. كوم، هـ. س. وآخرون. التكامل غير المتجانس لأغشية أكسيد معقد أحادي البلورة. ناتشر 578، 75-81 (2020). 60. كونغ، و. وآخرون. القطبية تحكم التفاعل الذري من خلال المواد ثنائية الأبعاد. نات. ماتير. 17، 999-1004 (2018). 61. كريسي، ج. وفورثميلر، ج. مخططات تكرارية فعالة لحسابات الطاقة الكلية من أولى المبادئ باستخدام مجموعة أساس الموجة المستوية. فيز. ريف. ب 54، 11169-11186 (1996). 62. كريسي، ج. وجوبيرت، د. من البوتentials فوق الناعمة إلى طريقة الموجة المعززة بالمشاريع. فيز. ريف. ب 59، 1758-1775 (1999). 63. بيردو، ج. ب. وآخرون. استعادة توسيع تدرج الكثافة للتبادل في المواد الصلبة والأسطح. فيز. ريف. ليتر. 100، 136406 (2008). 64. بلوتشل، ب. إ. طريقة الموجة المعززة بواسطة البروجيكتور. فيزيكال ريفيو ب 50، 17953-17979 (1994). 65. مونكهورست، هـ. ج. وباك، ج. د. نقاط خاصة لتكاملات منطقة بريلوان. فيزيكال ريفيو ب 13، 5188-5192 (1976). 66. هارادا، ج.، آكس، ج. د. وشيراني، ج. دراسة تشتت النيوترونات للأنماط اللينة في BaTiO المكعب. فيز. ريف. ب 4، 155-162 (1971). 67. يودين، ب. ف.، أهلواليا، ر. و تاجانتسيف، أ. ك. حدود عليا لمعاملات الفليكسوإلكتريك في المواد الفيروكهربائية. رسائل الفيزياء التطبيقية 104، 082913 (2014). 68. وانغ، ب.، غو، ي.، تشانغ، س. & تشين، ل.-كيو. المرونة الكهربائية في المواد الصلبة: التقدم، التحديات، ووجهات النظر. تقدم في علوم المواد 106، 100570 (2019). 69. ما، و. و كروس، ل. إي. الاستقطاب الكهربائي الناتج عن تدرج الإجهاد في سيراميك زركونات الرصاص والتيتانيوم. رسائل الفيزياء التطبيقية 82، 3293-3295 (2003). 70. ستينجل، م. التحكم السطحي في المرونة الكهربائية. فيز. ريف. ب 90، 201112 (2014). 71. دراير، سي. إي.، ستينجل، م. وفاندربيلت، د. تنفيذ كثافة التيار لحساب معاملات الفليكسوإلكتريك. فيز. ريف. ب 98، 075153 (2018).
الشكر والتقدير نعرب عن شكرنا للتمويل الذي تم الحصول عليه من مشروع To2Dox التابع لـ FlagERA ERA-NET Cofund في تقنيات الكم، والذي تم تنفيذه في برنامج هورايزن 2020 للاتحاد الأوروبي. حصل كل من J.S. وC.L. وF.M. وM.G.-H. على دعم من الوكالة الإسبانية للبحث (AEI) من خلال المنح PID2020-118078RB-IOO ومن حكومة مدريد الإقليمية (CAM) من خلال مشروع SINERGICO Y2020/NMT-6661 CAIRO-CM. كما يشكر G.S.-S. الدعم المالي من منحة وزارة العلوم الإسبانية (MCI) برقم RTI2018-099054-J-IOO (MCI/AEI/FEDER، الاتحاد الأوروبي) ومنحة IJC2018-038164-I. نحن في UCM نشكر الدعم من مشروع (MAD2D-CM)-UCM الممول من مجتمع مدريد؛ ومن خطة التعافي والتحول والمرونة؛ ومن NextGenerationEU من الاتحاد الأوروبي. حصل V.R. على دعم من حكومة مدريد (Comunidad de Madrid-Spain) بموجب الاتفاقية متعددة السنوات مع جامعة كومبلوتنسي في مدريد في إطار حوافز البحث للدكتوراه الشابة، في سياق برنامج V PRICIT (البرنامج الإقليمي للبحث والابتكار التكنولوجي)، وبرنامج هورايزن 2020 للبحث والابتكار التابع للاتحاد الأوروبي (اتفاقية المنحة رقم 755655 ERC-StG 2017 مشروع 2D-TOPSENSE، اتفاقية المنحة رقم 785219 Graphene Core2-التقنيات المبتكرة المعتمدة على الجرافين، واتفاقية المنحة رقم 881603 Graphene Core3-التقنيات المبتكرة المعتمدة على الجرافين)، ومشروع FLAG-ERA للاتحاد الأوروبي To2Dox (JTC-2019-009)، ومجتمع مدريد من خلال مشروع CAIRO-CM (Y2020/NMT-6661) ووزارة العلوم والابتكار الإسبانية (منحة PID2020-118078RB-IOO وزمالة PRE2018084818). تم إجراء ملاحظات المجهر الإلكتروني في المركز الوطني للمجهر الإلكتروني، CNME-UCM. تم دعم العمل في LIST من قبل صندوق البحث الوطني في لوكسمبورغ من خلال المنحة FNR/C18/MS/12705883/REFOX.
مساهمات المؤلفين: قام V.R. و V.Z. و S.P. و F.A.C. بإعداد العينات بمساعدة وإرشاد C.M. و F.M. و M.G.-H. و A.C.-G.; قام G.S.-S. و M.C. بإجراء المجهر الإلكتروني; قام G.S.-S. و V.R. و V.Z. و C.L. و J.S. بتحليل بيانات المجهر الإلكتروني; قام H.A. و J.Í. بإجراء تحليل النظرية; وكتب G.S.-S. و V.R. و H.A. و J.Í. و C.L. و J.S. الورقة بمساهمة ومساعدة من جميع المؤلفين.
المصالح المتنافسة يعلن المؤلفون عدم وجود مصالح متنافسة.
معلومات إضافية
معلومات إضافية النسخة الإلكترونية تحتوي على مواد إضافية متاحة علىhttps://doi.org/10.1038/s41586-023-06978-6. يجب توجيه المراسلات والطلبات للحصول على المواد إلى ج. سانشيز-سانتولينو، ف. روكو أو ج. سانتاماريا.
تُعرب مجلة Nature عن شكرها لـ هوبينغ هوانغ والمراجعين الآخرين المجهولين على مساهمتهم في مراجعة هذا العمل. معلومات إعادة الطباعة والتصاريح متاحة علىhttp://www.nature.com/reprints.
الشكل البياني الموسع 1 | تصنيع هيكل ملتوي مستقلطبقات مزدوجة. a) مخطط لعملية النقل الحتمية ذات الخطوتين. ب) تجربة STEM-HAADF بتقسيم العمق لهيكل ملتويترتيب طبقات ثنائية تركز على سطح المدخل للترتيب (عدم التركيز ) وواجهة تعتيمج) هيكل موير يتكون عند الواجهة بينطبقات. يتم تشكيل شبكة من دافعين متميزين AA و AB بسبب التحويل. الصورة على اليمين تظهر تحويل فورييه السريع مع ملاحظة الانعكاسات لكل من الجزء العلوي والسفلي المستقل.الأفلام. مقياس الرسم هو 2 نانومترنموذج الهيكل الذري الصلب الذي يتوافق مع اثنينالشبكات بزاوية التواءتظهر ذرات الباريوم باللون الأخضر، والتيتانيوم باللون الأزرق والأكسجين باللون الأحمر في الطبقة العليا. أما الذرات في الطبقة السفلية فهي باللون الرمادي. تم تمييز مواقع AA و AB باللونين الأحمر والأزرق على التوالي.
الشكل البياني الموسع 2 | (أ)، (ب) صور عرضية خام (غير معالجة) بتقنية HAADF-STEM للهيكل الملتويطبقات ثنائية. أ) صورة STEM-HAADF لـم twistedتكديس الطبقتين مع التركيز على سطح الطبقة الثنائية (عدم التركيز) ). صورة STEM-HAADF لـم twistedتكديس الطبقتين مع التركيز على سطح الطبقة الثنائية (عدم التركيز) ). ج)-هـ) المكون غير المتماثل لـ موتر الإجهاد ( ) مقاسة على صورة HAADF التجريبية لـ م twistedصورة HAADF التجريبية لطبقة ثنائيةم twistedطبقة ثنائية و ج) صورة نموذجية تم الحصول عليها باستخدام نموذج DFT لـم twistedطبقة مزدوجة. تشير الأشكال الثمانية الحمراء والزرقاء إلى المواقع ذات التكديس AA (مواقع AA) و AB (مواقع AB) على التوالي.
الشكل البياني الممتد 3 | تحليل الإجهاد والاستقطاب لواحدفيلم قائم بذاته. أ) صورة STEM-HAADF (عرض مسطح) لـفيلم قائم بذاته على طول اتجاه [001]. ب) إجهاد القص (مكون من موتر إجهاد الشبكة) ج) إزاحة التيتانيوم ( ) خريطة (سهام سوداء) يتوافق مع نفس المنطقة المتراكبة على اللحظة الدائريةمن الاستقطاب الفيروكهربائي. د) إزاحة التيتانيوم ( ) تظهر الاستقطاب المتجانس لواحد طبقة. تم تضخيم إزاحات Ti في (ج) و (د) بعامل 20 من أجل الوضوح.
أ
الشكل 4 من البيانات الموسعة | تحليل الاستقطاب لـم twistedتكديس الطبقات الثنائية مع التركيز على السطح العلوي (عدم التركيز) ). أ) خريطة إزاحة التيتانيوم المقاسة على الصورة في الشكل 1f التي تظهر الاستقطاب قبل الطرح
ب
قيمة الاستقطاب المتوسطة للمنطقة التي تم تحليلها. ب) خريطة إزاحة التيتانيوم بعد طرح قيمة الاستقطاب المتوسطة. تم تضخيم إزاحات التيتانيوم بعامل 20 من أجل الوضوح.
مقالة
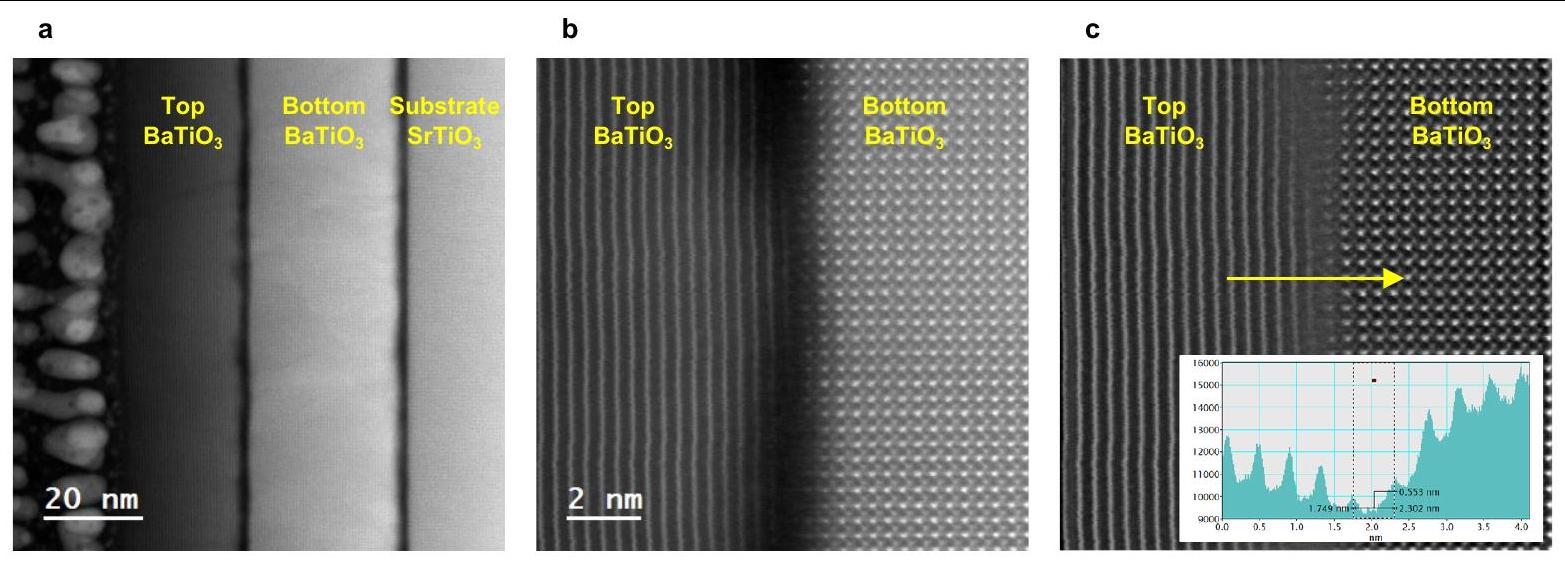
الشكل التوضيحي الممتد 5 | صور HAADF-STEM مقطعيةم twistedطبقة ثنائية. أ) صورة STEM-HAADF (مقطع عرضي) لـم twistedطبقة ثنائية تم نقلها فوقالركيزة. كانت الطبقة السفلية من الطبقة الثنائية متوافقة مع الركيزة. ب) صورة STEM-HAADF للواجهة بين الطبقات العليا والسفلى من الكومة. ج) صورة مصفاة بواسطة فورييه من (ب). يظهر الإطار الصغير ملف تعريف الكثافة على طول السهم الأصفر الذي يوضح مسافة من ترتيب وحدة خلوية واحدة بين الطبقات العليا والسفلى من الكومة.
طول السهم
الشكل البياني الموسعتحليل الاستقطاب لصورة مقطع عرضي لـم twistedطبقة ثنائية تم نقلها إلى الركيزة. أ) صورة STEM-HAADF على طول اتجاه الطبقة العليا في م twistedطبقة مزدوجة. ب) إزاحة التيتانيوم ( ) خريطة (الأسهم السوداء) تم قياسها في المنطقة المحددة في (أ) في الأعلىالطبقة. تُظهر خريطة الألوان زاوية الاستقطاب المقاسة بالنسبة للاتجاه الإيجابي (من اليسار إلى اليمين) للمحور الأفقي. تم تغطية العينة المقطعية بطبقة من الذهب المتبخر (الجزء العلوي من الصورة) لحماية الطبقات المستقلة الملتوية أثناء إعداد العينة.
مقالة
الشكل 7 من البيانات الموسعة | تحليل الاستقطاب لمناطق مختلفة من عينة واحدةفيلم قائم بذاته. أ)، ب)، ج) صور STEM-HAADF لمناطق مختلفة منفيلم قائم بذاته تم الحصول عليه مع اتجاهات مسح مختلفة. تم التقاط كل صورة مع اتجاهات مسح لتجنب العيوب المحتملة. تم تراكب خرائط إزاحة التيتانيوم (الأسهم الصفراء) على الصور وتم تضخيم الإزاحات بعامل 20 من أجل الوضوح. لاحظ أنه في اللوحة أ) و ب) يكون الاستقطاب في المستوى بشكل رئيسي في اتجاه [1,0]، بينما في اللوحة ج) يكون… نقاط في اتجاه [1،1]. د)، هـ)، و) هيستوجرامات اتجاه الاستقطاب المقابلة للصور في أ)، ب)، ج). يتم ضبط اتجاهات الهيستوجرام بحيثالاتجاه يتوافق معزاوية الاستقطاب في جميع الحالات. الانحراف الموجود في المنطقة (أ) ليس مرتبطًا باتجاه المسح ولكنه ناتج عن وجود مجال صغير يشير في اتجاه [11] في الجزء الأيسر من الصورة.
الشكل 8 من البيانات الموسعة | التغيرات في الإجهاد والاستقطاب لـمُلتَوٍطبقات ثنائية بسماكات مختلفة. أ) صورة STEM-HAADF (عرض مسطح) لـم twistedتكديس ثنائي الطبقة بسمك 30 نانومتر يركز على واجهة الطبقة الثنائية (عدم التركيز) ). ب) إجهاد القص ( مكون من موتر إجهاد الشبكة) يصور تعديل إجهاد دوري في الأعلىطبقة. ج) خريطة الألوان للحظة الدائرية (Q) للاستقطاب الفيروكهربائي التي تتوافق مع نفس المنطقة، تظهر شبكة من الاتجاهات في اتجاه عقارب الساعة (أحمر) و دوامات عكس عقارب الساعة (زرقاء). تم تراكب إزاحة التيتانيوم ( ) خريطة (الأسهم السوداء) مقاسة في الأعلى طبقة بعد طرح المكون المتجانس. تم تضخيم إزاحات التيتانيوم بعامل 20 من أجل الوضوح. تظهر الصور d)، e)، f) نفس التحليل لـم twistedطبقة ثنائية بسمك 8 نانومتر لكل طبقة فردية (عدم التركيز ). لاحظ أن خريطة السهم في f ) تم إنشاؤها دون طرح الاستقطاب المتجانس. تشير العلامات الحمراء والزرقاء في جميع اللوحات إلى مواقع التكديس AA و AB على التوالي.
مقالة
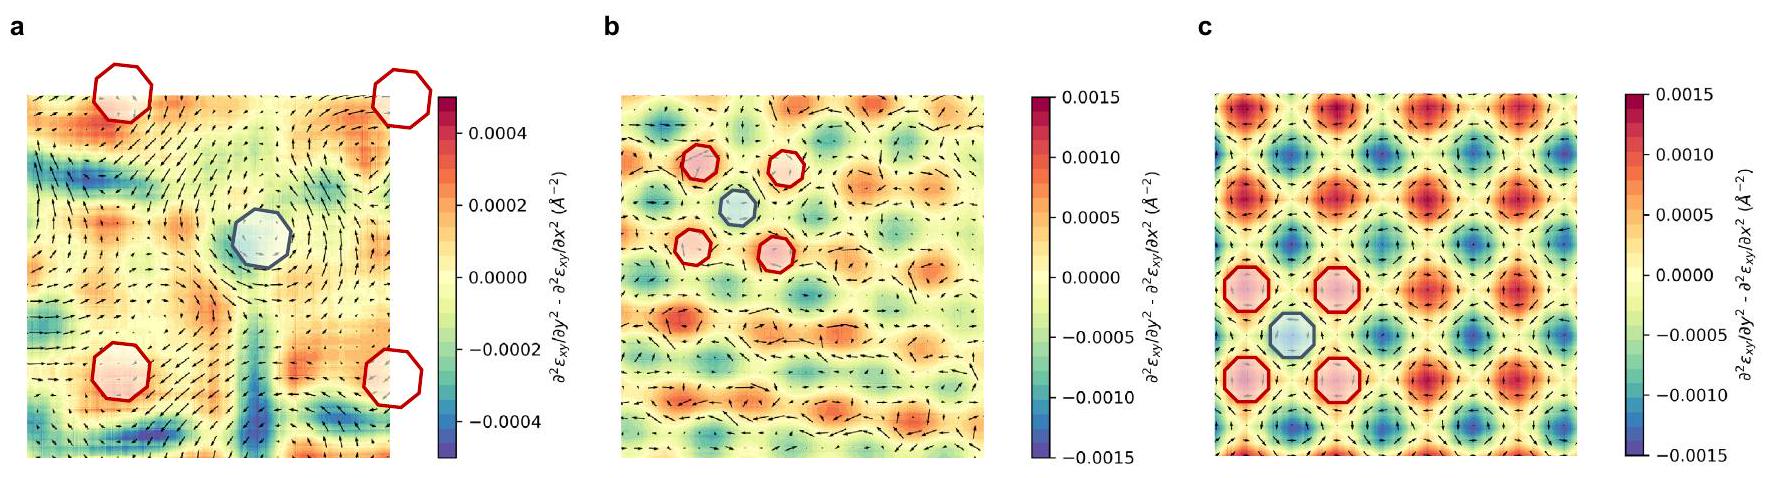
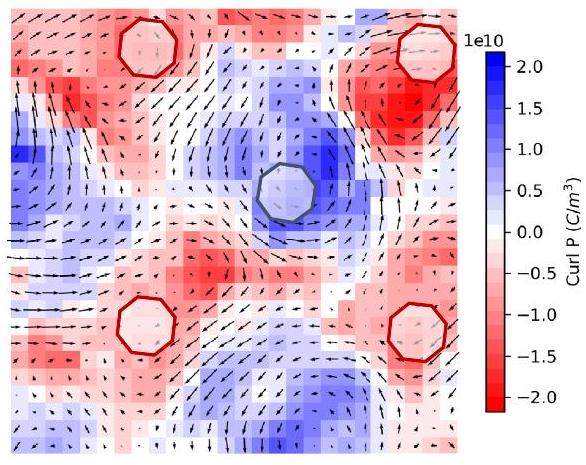
الشكل البياني الموسع 9 | المشتقات الثانية لإجهاد القص. (متناسب مع دوران متجه الاستقطاب) لـ a) a ملتوي طبقة ثنائية b) لـ ملتوي طبقة ثنائية و c) لصورة نموذجية تم الحصول عليها من حساب DFT لـ ملتوي طبقة ثنائية. لاحظ التشابه مع
اللحظة الدائرية الموضحة في الشكل 1 التي تظهر شبكة من الدوامات في اتجاه عقارب الساعة (حمراء) وعكس اتجاه عقارب الساعة (زرقاء) في مواقع AA و AB على التوالي (محددة بمثمنات). خريطة إزاحة Ti (أسهم سوداء) مكدسة على جميع الصور. يتم تضخيم إزاحات Ti بعامل من و .
a
b
c
الشكل البياني الموسع 10| دوران متجه الاستقطاب. لـ a) صورة HAADF التجريبية لـ a ملتوي طبقة ثنائية b) صورة HAADF التجريبية لـ a ملتوي طبقة ثنائية و c) صورة نموذجية تم الحصول عليها باستخدام نموذج DFT لـ a ملتوي طبقة ثنائية. لاحظ التشابه مع اللحظة الدائرية الموضحة في الشكل 1 التي تظهر شبكة من الدوامات في اتجاه عقارب الساعة (حمراء) وعكس اتجاه عقارب الساعة
(زرقاء) في مواقع AA و AB على التوالي (محددة بمثمنات). خريطة إزاحة Ti بعد طرح مكون متجانس (أسهم سوداء). يتم تضخيم إزاحات Ti من أجل الوضوح بعامل 20 في (a,b) و 40 في (c).
G. Sánchez-Santolino , V. Rouco , S. Puebla , H. Aramberri , V. Zamora , M. Cabero , F. A. Cuellar , C. Munuera , F. Mompean , M. Garcia-Hernandez , A. Castellanos-Gomez , J. Íñiguez , C. Leon & J. Santamaria
Abstract
The wealth of complex polar topologies recently found in nanoscale ferroelectrics results from a delicate balance between the intrinsic tendency of the materials to develop a homogeneous polarization and the electric and mechanical boundary conditions imposed on them. Ferroelectric-dielectric interfaces are model systems in which polarization curling originates from open circuit-like electric boundary conditions, to avoid the build-up of polarization charges through the formation of fluxclosure domains that evolve into vortex-like structures at the nanoscale level. Although ferroelectricity is known to couple strongly with strain (both homogeneous and inhomogeneous ), the effect of mechanical constraints on thin-film nanoscale ferroelectrics has been comparatively less explored because of the relative paucity of strain patterns that can be implemented experimentally. Here we show that the stacking of freestanding ferroelectric perovskite layers with controlled twist angles provides an opportunity to tailor these topological nanostructures in a way determined by the lateral strain modulation associated with the twisting. Furthermore, we find that a peculiar pattern of polarization vortices and antivortices emerges from the flexoelectric coupling of polarization to strain gradients. This finding provides opportunities to create two-dimensional high-density vortex crystals that would enable us to explore previously unknown physical effects and functionalities.
The persistence of ferroelectricity at the nanoscale level hinges on the compensation of the polarization-bound charges and depolarizing fields building up at the surfaces or interfaces. In ferroelectric films with metallic electrodes, the depolarizing fields can be screened by (free) charge accumulation and by the formation of domains . The situation is even more pronounced in nanoscale ferroelectric samples with dielectric boundaries (including vacuum or insulating non-polar surface layers) in which the polarization can undergo a transition into vortex or more complex topological states, with rotational polar configurations persisting to small diameters in which polarization departs from the high-symmetry directions favoured by the lattice anisotropy .
Mechanical boundary conditions , as those imposed by interfacial strain, play an important part in determining the final polarization state, as they may combine with electric boundary conditions in non-trivial ways. Notably, the strong coupling of ferroelectricity with both homogeneous and inhomogeneous strain is at the origin of the effectiveness of mechanical boundary conditions in triggering unexpected effects, such as enhanced ferroelectricity in epitaxially strained layers or polarization switching under the strain gradients created by an atomic force microscopy tip pressing on the sample surface .As it turns out, however, access to externally tunable strain patterns is in practice very limited.
In epitaxial thin films, mechanical boundary conditions are, to a large extent, immovably and solely determined by the atom-on-atom replication of the structure of the substrate by the growing film. Hence, although the interface with the substrate is subject to in-plane strains imposed by the lattice mismatch, the sample surface is in a zero-stress state, as there are no tractions acting on it. In epitaxial uniformly strained single-domain layers, internal elastic fields are homogeneous and rigidly imposed by these mixed boundary conditions. Inhomogeneous strain results typically from uncontrollable strain relaxation, misfit dislocations or ferroelastic domain formation . The structural constraints imposed by epitaxy leave little or no room for the modification of the mechanical boundary conditions. Moreover, controllable shear or inhomogeneous strain patterns are commonly out of reach. This is the reason why, although on general grounds exotic ferroelectric states can be expected to result from the manipulation of mechanical boundary conditions, this scenario remains mostly unexplored.
In this paper, we demonstrate a strategy to engineer mechanical boundary conditions based on the strain modulation induced at the interface between two twisted freestanding oxide layers. In layered materials such as graphene or transition metal dichalcogenides, twisted bilayers have led to the emergence of unexpected collective states . The weak van der Waals interlayer interaction in such twisted bilayers
Article
leads to inhomogeneous strain patterns with deformations up to about 1% (ref. 27). Extending the exploration to artificial twisted stacks of transition metal oxides with strong mixed ion-covalent bonds, however, has been hampered by the difficulty in isolating these systems in freestanding form. The recent reports on the fabrication of freestanding single crystalline oxide thin films showing exciting ferroelectric topologies , and which can be handled in a way similar to van der Waals two-dimensional (2D) materials , open up the possibility of stacking freestanding layers with arbitrary twist angles and thus design previously unknown strain patterns. Here we show that the lateral strain modulation caused by the interface matching between two twisted freestanding ferroelectric (BTO) layers sets a mechanical boundary condition not attainable by epitaxial strain, and to a large extent controllable by the relative rotation angle. The nanoscale-modulated distribution of symmetric and antisymmetric shear strains yields a notable rotational polarization texture with alternating clockwise and anticlockwise vortices and antivortices, the distribution, spacing and size of which are controlled by the twist angle. First-principles simulations show that this complex configuration of highly localized symmetric and antisymmetric shears is concomitant with the ferroelectric vortex 2D modulation and constitutes a stable equilibrium state. The coupling between shear strain gradients and complex polarization texture is discussed in terms of a direct flexoelectric effect.
Strain and polarization analysis of twisted bilayers
BTO layers of thickness 15 nm epitaxially grown on (001) substrates were delaminated to form twisted bilayer homojunctions with deterministic twist angles (see Methods and Extended Data Fig. 1a for a detailed description of the sample fabrication process). To study the structural properties of individual layers of the twisted bilayers, we performed a depth-sectioning high-angle annular dark-field (HAADF) scanning transmission electron microscopy (STEM) experiment (Methods) focusing on the top surface of the stack (defocus ) and on the interface (defocus ; see Extended Data Fig. 1b and Supplementary Movie1). Twisted ferroelectric bilayers exhibit characteristic moiré features determined by the atomic coincidence pattern between the two layers (Extended Data Fig. 1c). We studied moiré structures formed in and twisted BTO bilayers.
Figure 1a,d shows the STEM-HAADF (planar view) images of and twisted bilayers. The moiré pattern shows two distinct plateau-like features at the highly (atom-on-atom) coincidental regions of both layers: AA ( Ba on Ba and Ti on Ti ) and AB ( Ba on Ti and Ti on Ba ) (see also Extended Data Fig. 1). The intralayer strain was measured on the top layer using the entrance surface focused image (defocus = 0; Methods). The emergence of a strongly spatially varying strain landscape with the same periodicity as the moiré lattice-and determined on the top layer-demonstrates the strong interaction between the two twisted layers. The resultant strain map shows a periodically modulated pattern of symmetric shear strains with alternating positive and negative shear strain cores (see Fig.1b, efor and twisted bilayers, respectively). In between the AA and AB sites of the moiré pattern, we find regions of maximum strain, named S sites hereafter, with nearly homogeneous positive and negative shears. The shear strain modulation shows the same periodicity as the moiré pattern, indicating that the strain results from a reconstruction in the top layer induced by the matching at the interface. An important remark is that such a periodic shear strain landscape is unique, as it cannot be attained, to the best of our knowledge, either by epitaxial strain or by any pattern of externally applied stresses.
To investigate how the strain modulation observed on the top layer of the twisted BTO bilayers affects the ferroelectric polarization, we measured the off-centring of the B-site cations in the individual unit cells (relative displacement of the B-site Ti cation from the centrosymmetric position, determined from the A-site Ba cations within the same
unit cell). Twisted bilayers showed net in-plane polarization pointing in the in-plane [ 1,1 ] direction, with a superimposed polar texture (Extended Data Fig. 4). Polar displacements in the range of 0.15-0.20 Å were obtained, which is consistent with what is found in bulk BTO. In BTO, the magnitude of the spontaneous polarization is known to be approximately constant regardless of the orientation it may present in the different ferroelectric phases this compound can adopt , which suggests that the polarization at the surface must be largely confined to the plane. Yet, as planar views only probe the in-plane polarization, we resort to the polarization analysis of cross-section images to show that there is an out-of-plane polarization component (Methods and Extended Data Figs. 5 and 6).
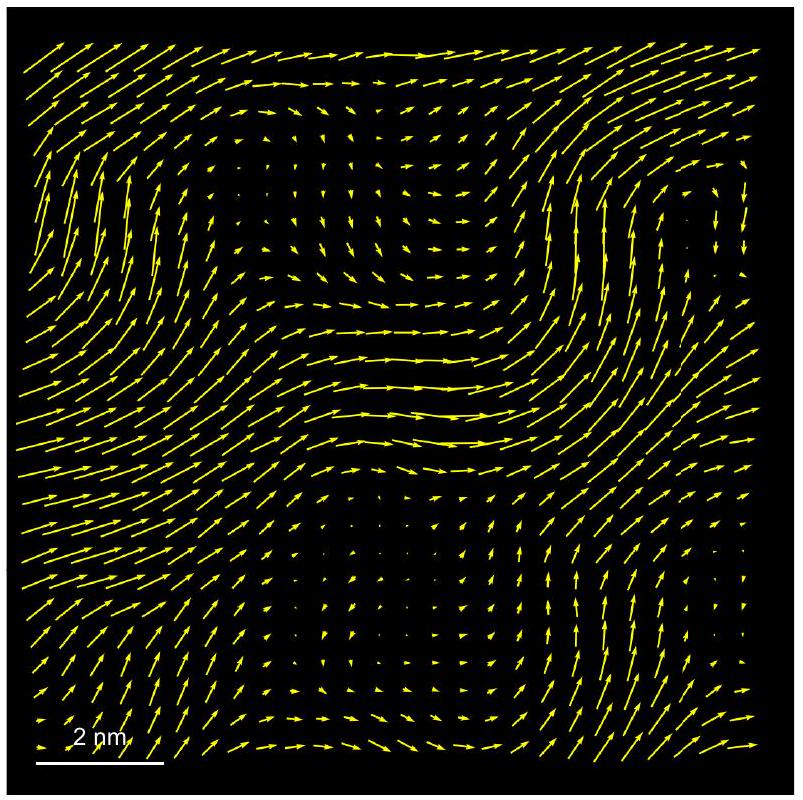
The complex polar texture shown in the planar views of the twisted bilayers can be better assessed by subtracting the average polarization ( ) value in the image (Extended Data Fig. 4). The final polarization state results from the superposition of the nearly homogeneous polarization featured by isolated freestanding layers and the vortex-like modulation of the local ferroelectric potential imposed by the interface, yielding a peculiar 2D pattern of polarization waves . The polarization ( ) maps in Fig. 1c, f show a continuous curling of the polar displacements, forming a periodic network of non-trivial topological structures with alternating vortices (AA and AB sites) and antivortices (S sites of the moiré pattern) of the local ferroelectric potential. We can describe the topological structure in terms of a non-zero toroidal moment parallel to the -direction defined as , where is the local dipole moment located at and is the number of dipoles (cells).
The toroidal moment alternates sign periodically in diagonal directions of the moiré pattern (Fig.1c,f) in a way determined by a periodic array of alternating clockwise and anticlockwise vortices in AA and AB sites, respectively. Ferroelectric vortices are topological objects characterized by a winding number (Supplementary Note 1) regardless of their polarity (clockwise or anticlockwise). Values of the toroidal moment at the vortex sites depend on the size of the vortex and on the ferroelectric displacements (dipole moment). We obtain values similar to those reported for flat epitaxial BTO nanoparticles . In the moiré pattern, vortices alternate with antivortices (sitting at S sites), which are topological structures with winding number and zero toroidal moment.
Further confirmation of the presence of the vortex pattern is obtained from the strain and polarization analysis of the cross-section image, as it supplies complementary information to planar views (showing only in-plane polarization components) providing a lateral view of the vortex lattice, in which the in-plane ( along the direction) and out-of-plane ( along the growth direction) components of the polarization vector can be probed, as well as the in-plane component of the strain tensor. As discussed in Supplementary Note 2, an analysis of the spatial dependence of the polarization vector, after subtracting a local averaged polarization value ( ), showed a lateral modulation of both the and (growth direction) components fully consistent with the presence of the vortex lattice. Moreover, there is a close correspondence between the modulation periodicity of cross-section samples and planar views, suggesting that the vortex originating at the interface propagates in the layer in the direction of growth.
Reducing layer thickness to 8 nm stabilizes a vortex state with no homogeneous polarization. By contrast, as the thickness is increased, a homogeneous polarization component is observed as well as some degree of strain relaxation (Methods and Extended Data Fig. 8). Also, single layers show nearly homogeneous strain states with no indication of the polar topology observed in the twisted bilayers (Extended Data Fig. 3). The picture emerges that the inhomogeneous strain distribution imposed by the interface between the twisted ferroelectric layers results in vortex-like modulations of the local ferroelectric potential. Yet, for samples with sufficiently thin layers, a true vortex state with
Fig. 1| Strain and polarization modulations at twisted BTO bilayers.
a, STEM-HAADF (planar view) image of a twisted BTO bilayer stack focusing on the interface of the bilayer (defocus ). b, Shear strain ( component of the lattice strain tensor) depicting a periodic strain modulation at the top BTO layer. c, Ti displacement map ( ) after subtracting the homogeneous component (black arrows) measured on the top BTO layer corresponding to the same area superimposed on the toroidal moment of
the ferroelectric polarization showing a network of clockwise (red) and anticlockwise (blue) vortices. Ti displacements ( ) are amplified by a factor of 20 for clarity. , The same analysis for a twisted BTO bilayer. Red and blue octagons in all panels indicate sites with AA (AA sites) and AB (AB sites) stacking, respectively. The averaged polarization (modulus) is approximately , close to the bulk BTO value. Scale bar, .
absent homogenous polarization is observed. Notably, there is a close correspondence between the vortex lattice and the distribution of shear strains underlying the moiré pattern. Clockwise or anticlockwise vortices are located at the AA and AB sites with nearly zero shear strain (albeit maximal rotational strain). By contrast, antivortices sit at the S sites with maximal shear strain (but nearly zero rotational strain).
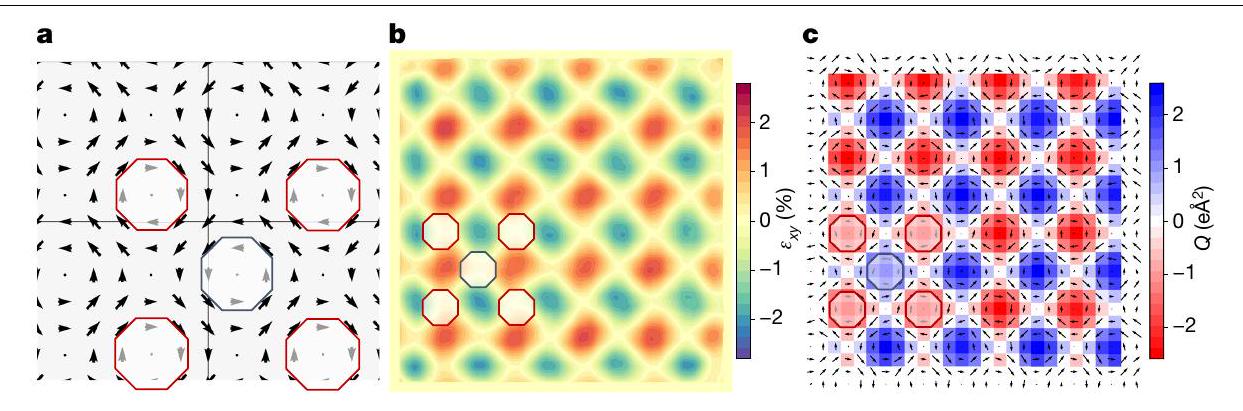
Theoretical description of the ferroelectric pattern
To get further confirmation of this topological polar pattern, we resort to density functional theory (DFT), considering simplified (computationally tractable) simulated systems that are nevertheless relevant to our problem. More precisely, we work with a periodically repeated supercell composed of elemental BTO units. As the starting point of our simulations, we use an atomic configuration that mimics as closely as possible the inhomogeneous polarization pattern observed experimentally in the twisted layers. We then run a structural relaxation in which all atomic positions and supercell strains are allowed to evolve to minimize the DFT energy of the system. We obtain, as a stable solution, the polarization and strain maps shown in Fig. 2, in qualitative agreement with the experimental results of Fig. 1 and thus confirming the connection between the observed strain and dipole modulations. According to our simulations, this topological state is 9 meV per formula unit above the homogeneous orthorhombic phase with polarization along the [1,1] diagonal. This relatively small difference is an upper bound (Methods) for the energy cost of deforming the trivial homogeneous state to acquire the topological features of Figs. 1 and 2 . Hence, our calculations support the notion that interlayer interactions may suffice to induce the experimentally observed strain and dipole patterns.
quasi-periodic orders are controlled by the twist angle, which indicates that they are the result of interlayer interactions. Furthermore, it is apparent that the vortex- and antivortex-like dipole arrangements in Fig. 1c,f are correlated with the measured strain patterns of Fig. 1b,e. This suggests that, to understand these polar textures, it is reasonable to ignore the microscopic details of the couplings across the twisted interface and, instead, focus on how the observed elastic modulation affects the polarization. Ferroelectric perovskites such as BTO present strong electromechanical couplings that are potential candidates to explain our observations.
Let us begin by considering the simplest strain-polarization couplings. From well-established models of ferroelectric perovskites such as BTO (ref. 38), we know that a shear strain typically favours a polarization oriented along the in-plane diagonal, whereas leads to polarizations along ; hence, we can expect , where ( ) refers to the inhomogeneous part of the measured polarization, as shown in Fig. 1c, f (and also in Fig. 2c). However, it is clear from our results that this relationship does not hold for the measured strains (Figs.1b,e and 2b) and inhomogeneous polarizations (Figs.1c,f and 2c), as we can, for example, find regions with and an either positive or negative product. A strong piezoelectric effect would also lead to and is not supported by our observations either. Hence, these are not the dominant couplings in our samples.
Next, we note that our measured strain maps feature large strain gradients with maximum values reaching (Fig. 3). By direct flexoelectric coupling , these gradients should yield a polarization change, the expected dominant effects being
Strain-polarization coupling
Let us finally tackle this important question of what causes the peculiar inhomogeneous polarization textures in our layers. These complex
Fig. 2 |DFT model of a ferroelectric vortex lattice in BTO. a, Ti displacement map (black arrows) of the DFT-calculated model. DFT first-principles simulations did not show any homogeneous polarization component.b, Shear strain ( component of the lattice strain tensor) obtained from the DFT model.
c, Ti displacement map (black arrows) superimposed on the toroidal moment (Q) of the ferroelectric polarization obtained from the DFT model. The arrows
in and denote local dipoles as obtained from the product of local atomic displacements (with respect to a centrosymmetric reference structure) and Born effective charges. Ti displacements in c are amplified by a factor of 40 for clarity. Red and blue marks in all panels indicate the AA and AB stacking regions, respectively. Note that is a magnification of the polarization map shown in , to better see the topology of the polarization landscape.
where is an effective flexoelectric coefficient. Notably, from the measured strain gradients (Figs. 1b, e and 2b) and inhomogeneous polarization (Figs. 1c,f and 2c), we see direct support for a coupling of this kind in our results. We find that the regions with , shown as red vertical fringes in Fig. 3, feature positive ; conversely, the regions with , shown as blue vertical fringes in Fig. 3, show . A similar relation holds for the gradients and the component of the polarization.
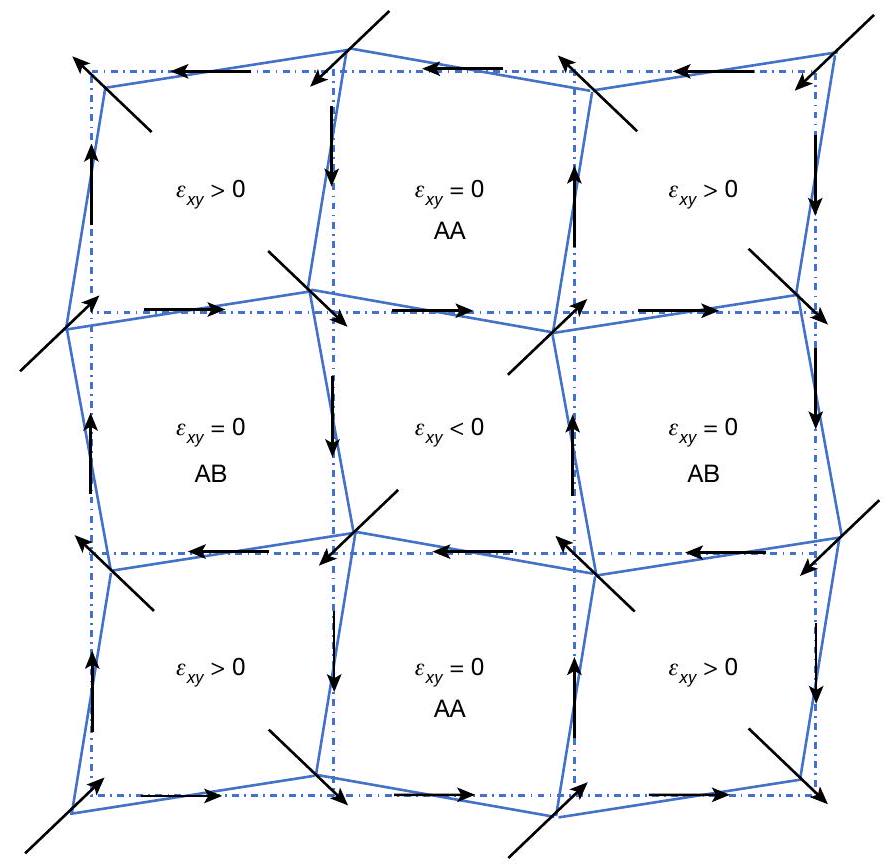
The relationship between strain and polarization patterns can be captured in a simple geometric manner. As shown in Fig. 4, the symmetry breaking caused by the shear (and rotational) strain modulation readily leads to the observed arrangement of polar vortices and antivortices. A local shear strain breaks the square symmetry of
the cells of Fig. 4 , yielding two large-angle corners and two small-angle corners. In this figure, the arrows (flexoelectric polarizations) are drawn assuming that the cations displace towards the small-angle corners, which naturally yields an antivortex-like dipole arrangement with zero curl of the polarization field centred at the cells with . Correspondingly, polarization vortices (non-zero curl) form around the cells with .
Our experimental results enable us to estimate the effective flexoelectric coupling as
Fig. 3|Shear strain gradients of twisted BTO bilayers. a-c, Derivative of the shear strain along the -axis of a twisted BTO bilayer (a) and a twisted BTO bilayer (b) and a DFT-calculated model corresponding to twisted layers(c).
d-f, Derivative of the shear strain along the -axis of a twisted BTO bilayer (d)
and a twisted BTO bilayer (e) and a DFT-calculated model corresponding to twisted layers ( ). Ti displacement map ( ) (black arrows) is superimposed on all images. Ti displacements are amplified for clarity by a factor of 20 in and and by a factor of 40 in and .
Fig. 4 | Pictorial view of the flexoelectric couplings. Sketch of the BTO layer, showing regions of approximately constant shear strain as cells of a periodic lattice. We indicate the analogues of the and sites discussed in the text. The black arrows stand for the polarization induced by the flexoelectric effect; these arrows are consistent with equations (1) and (2) for , and they present the vortices and antivortices observed experimentally. Note that the flexoelectric polarization can be intuitively understood from the symmetry breaking caused by the strain modulation. For example, at any given lattice point (shared by four cells, with four associated cell angles), we always find an arrow pointing towards the cell with the smallest ( ) angle.
where the relatively small value obtained suggests that the large strain gradients in our samples are beyond the linear approximation (Methods).
It is also interesting to note that the second derivatives of the shear strain can be used to compute the expected curl of the polarization vector. From the flexoelectric coupling between strain gradients and polarization (equations (1) and (2)), the following relation holds:
closely captured by experimental results (see Extended Data Fig. 9 showing the second derivatives of the strain gradient and Extended Data Fig. 10 showing the curl of the polarization).
Finally, it is worth noting the recent claims of moiré-induced ferroelectricity in twisted heterobilayers of van der Waals materials . Moreover, polar domains have been observed without an overall ferroelectric response as well as switching of polarization in a stacking domain of hexagonal boron nitride using van der Waals sliding . Theoretical studies conclude that a switchable polarization that is remanent in zero applied electric field remains to be demonstrated to substantiate the claim of ferroelectricity. By contrast, in our case, the freestanding layers possess a robust ferroelectric ground state and the polar topology results from its modulation by the moiré interface strain pattern. Moreover, inducing strain and rotational polarization landscapes in nanometre-thick ferroelectric layers avoids artefacts appearing in twisted ultrathin (atomically thick) graphene layers, in which open questions remain on the strain induced by the moiré superlattice and its relaxation .
Summary and outlook
In summary, we have found that it is possible to induce non-trivial ferroelectric textures in twisted freestanding ferroelectric layers. The driving force is the couplings across the interface between the twisted layers-that is, the mechanical boundary conditions they effectively impose on each other. These couplings cause large strain gradients in the ferroelectric layers, which in turn yield vortex-like modulations of the homogeneous polarization state by flexoelectric effect. Accordingly, we find that the periodicity of the 2D vortex pattern can be largely tuned by controlling the twisting angle.
This provides opportunities enabled by the unique modulations that are possible in moiré bilayers to explore physical effects and functionalities, as well as whether they could host topologies such as the hopfions and Solomon rings recently found in nanocrystals . The highly correlated topological pattern with vortices and antivortices is reminiscent of the square lattice of merons, objects with topological number existing only in lattices, observed in chiral magnets with magnetic anisotropy . At variance with previous ferroelectric textures found in ferroelectric films confined in the growth direction, our polar landscape is 2D and highly tunable by controlling the twisting angle of the bilayer and, thus, it is more amenable for applications in high-density ferroelectric memories reaching the Gbit in limit enabled by small few topological objects . In a more fundamental direction, we believe that proximity interactions between layers with different ferroic orders may strongly depend on the twist angle. Twisted heterolayers will certainly provide opportunities for exploring previously unknown phenomena in surface physics and chemistry.
Online content
Any methods, additional references, Nature Portfolio reporting summaries, source data, extended data, supplementary information, acknowledgements, peer review information; details of author contributions and competing interests; and statements of data and code availability are available at https://doi.org/10.1038/s41586-023-06978-6.
Yadav, A. K. et al. Observation of polar vortices in oxide superlattices. Nature 530, 198-201 (2016).
Hsu, S.-L. et al. Emergence of the vortex state in confined ferroelectric heterostructures. Adv. Mater. 31, 1901014 (2019).
Shafer, P. et al. Emergent chirality in the electric polarization texture of titanate superlattices. Proc. Natl Acad. Sci. USA 115, 915-920 (2018).
Gruverman, A. et al. Vortex ferroelectric domains. J. Phys. Condens. Matter 20, 342201 (2008).
Nelson, C. et al. Spontaneous vortex nanodomain arrays at ferroelectric heterointerfaces. Nano Lett. 11, 828-834 (2011).
Das, S. et al. Observation of room-temperature polar skyrmions. Nature 568, 368-372 (2019).
Caretta, L. et al. Non-volatile electric-field control of inversion symmetry. Nat. Mater. 22, 207-215 (2023).
Yuan, S. et al. Hexagonal close-packed polar-skyrmion lattice in ultrathin ferroelectric films. Phys. Rev. Lett. 130, 226801 (2023).
Chen, S. et al. Recent progress on topological structures in ferroic thin films and heterostructures. Adv. Mater. 33, 2000857 (2021).
Rusu, D. et al. Ferroelectric incommensurate spin crystals. Nature 602, 240-244 (2022).
Jia, C.-L., Urban, K. W., Alexe, M., Hesse, D. & Vrejoiu, I. Direct observation of continuous electric dipole rotation in flux-closure domains in ferroelectric . Science 331, 1420-1423 (2011).
Peters, J. J. P., Apachitei, G., Beanland, R., Alexe, M. & Sanchez, A. M. Polarization curling and flux closures in multiferroic tunnel junctions. Nat. Commun. 7, 13484 (2016).
Schilling, A. et al. Domains in ferroelectric nanodots. Nano Lett. 9, 3359-3364 (2009).
Tang, Y. L. et al. Observation of a periodic array of flux-closure quadrants in strained ferroelectric films. Science 348, 547-551 (2015).
Naumov, I. I., Bellaiche, L. & Fu, H. Unusual phase transitions in ferroelectric nanodisks and nanorods. Nature 432, 737-740 (2004).
Kornev, I., Fu, H. & Bellaiche, L. Ultrathin films of ferroelectric solid solutions under a residual depolarizing field. Phys. Rev. Lett. 93, 196104 (2004).
Naumov, I. & Bratkovsky, A. M. Unusual polarization patterns in flat epitaxial ferroelectric nanoparticles. Phys. Rev. Lett. 101, 107601 (2008).
Choi, K. J. et al. Enhancement of ferroelectricity in strained thin films. Science 306, 1005-1009 (2004).
Catalan, G. et al. Flexoelectric rotation of polarization in ferroelectric thin films. Nat. Mater. 10, 963-967 (2011).
Article
Zubko, P., Catalan, G. & Tagantsev, A. K. Flexoelectric effect in solids. Annu. Rev. Mater. Res. 43, 387-421 (2013).
Pertsev, N. A., Zembilgotov, A. G. & Tagantsev, A. K. Effect of mechanical boundary conditions on phase diagrams of epitaxial ferroelectric thin films. Phys. Rev. Lett. 80, 1988-1991 (1998).
Aguado-Puente, P. & Junquera, J. Ferromagneticlike closure domains in ferroelectric ultrathin films: first-principles simulations. Phys. Rev. Lett. 100, 177601 (2008).
Hong, J., Catalan, G., Fang, D. N., Artacho, E. & Scott, J. F. Topology of the polarization field in ferroelectric nanowires from first principles. Phys. Rev. B 81, 172101 (2010).
Lu, H. et al. Mechanical writing of ferroelectric polarization. Science 336, 59-61 (2012).
Cao, Y. et al. Tunable correlated states and spin-polarized phases in twisted bilayer-bilayer graphene. Nature 583, 215-220 (2020).
Andrei, E. Y. et al. The marvels of moiré materials. Nat. Rev. Mater. 6, 201-206 (2021).
Kazmierczak, N. P. et al. Strain fields in twisted bilayer graphene. Nat. Mater. 20, 956-963 (2021).
Lu, D. et al. Synthesis of freestanding single-crystal perovskite films and heterostructures by etching of sacrificial water-soluble layers. Nat. Mater. 15, 1255-1260 (2016).
Hong, S. S. et al. Extreme tensile strain states in membranes. Science 368, 71-76 (2020).
Dong, G. et al. Super-elastic ferroelectric single-crystal membrane with continuous electric dipole rotation. Science 366, 475-479 (2019).
Han, L. et al. High-density switchable skyrmion-like polar nanodomains integrated on silicon. Nature 603, 63-67 (2022).
Shao, Y.-T. et al. Emergent chirality in a polar meron to skyrmion phase transition. Nat. Commun. 14, 1355 (2023).
Puebla, S. et al. Combining freestanding ferroelectric perovskite oxides with twodimensional semiconductors for high performance transistors. Nano Lett. 22, 7457-7466 (2022).
Shen, J. et al. Observation of moiré patterns in twisted stacks of bilayer perovskite oxide nanomembranes with various lattice symmetries. ACS Appl. Mater. Interfaces 14, 50386-50392 (2022).
Li, Y. et al. Stacking and twisting of freestanding complex oxide thin filmsAdv. Mater. 34, e2203187 (2022).
Devonshire, A. F. XCVI. Theory of barium titanate. London, Edinburgh, Dublin Philos. Mag. J. Sci. 40, 1040-1063 (1949).
Íñiguez, J., Ivantchev, S., Perez-Mato, J. M. & García, A. Devonshire-Landau free energy of from first principles. Phys. Rev. B 63, 144103 (2001).
King-Smith, R. D. & Vanderbilt, D. First-principles investigation of ferroelectricity in perovskite compounds. Phys. Rev. B 49, 5828-5844 (1994).
López-Pérez, J. & Íñiguez, J. Ab initio study of proper topological ferroelectricity in layered perovskite . Phys. Rev. B 84, 075121 (2011).
Zheng, Z. et al. Unconventional ferroelectricity in moiré heterostructures. Nature 588, 71-76 (2020).
Yasuda, K., Wang, X., Watanabe, K., Taniguchi, T. & Jarillo-Herrero, P. Stacking-engineered ferroelectricity in bilayer boron nitride. Science 372, 1458-1462 (2021).
Woods, C. R. et al. Charge-polarized interfacial superlattices in marginally twisted hexagonal boron nitride. Nat. Commun. 12, 347 (2021).
Vizner Stern, M. et al. Interfacial ferroelectricity by van der Waals sliding. Science 372, 1462-1466 (2021).
Bennett, D. Theory of polar domains in moiré heterostructures. Phys. Rev. B 105, 235445 (2022).
Wang, J. et al. Polar Solomon rings in ferroelectric nanocrystals. Nat. Commun. 14, 3941 (2023).
Yu, X. Z. et al. Transformation between meron and skyrmion topological spin textures in a chiral magnet. Nature 564, 95-98 (2018).
Publisher’s note Springer Nature remains neutral with regard to jurisdictional claims in published maps and institutional affiliations.
Open Access This article is licensed under a Creative Commons Attribution 4.0 International License, which permits use, sharing, adaptation, distribution and reproduction in any medium or format, as long as you give appropriate credit to the original author(s) and the source, provide a link to the Creative Commons licence, and indicate if changes were made. The images or other third party material in this article are included in the article’s Creative Commons licence, unless indicated otherwise in a credit line to the material. If material is not included in the article’s Creative Commons licence and your intended use is not permitted by statutory regulation or exceeds the permitted use, you will need to obtain permission directly from the copyright holder. To view a copy of this licence, visit http://creativecommons.org/licenses/by/4.0/.
(c) The Author(s) 2024
Methods
Fabrication of freestanding perovskite films
BTO layers of thickness 15 nm were grown onto (LSMO)buffered (100) substrates using pure oxygen sputtering technique at high pressures ( 3.2 mbar ) (ref. 47). This technique produces highly epitaxial growth with sharp interfaces and negligible stoichiometry deviations (see the next section on EELS analysis). The LSMO acts as a sacrificial layer that allows the release of the BTO layer on immersion in a selective etchant ( 33 mg of KI in an HCl solution volume concentration) for an average time of 3 days (ref. 48). Before immersion, a polypropylene carbonate (PPC;Sigma Aldrich) solution ( 10 g of PPC per 100 ml of anisole) was spin-coated ( for 30 s ) onto the pristine BTO sample. After curing the PPC at for 10 min in a hot plate, the sample was adhered to a commercial polydimethylsiloxane (PDMS; Gel-Film WF mil by Gel-Pak) stamp. The sample was dipped into the etchant solution for 3 days, a period within which the substrate typically detaches on its own from the film supported by the polymer. The sample was then washed in deionized water for 30 s . The supporting polymer enables the manipulation of the freestanding oxide layer until transferred onto holey membrane grids for STEM observation. The transfer was performed by keeping the grid onto a Peltier plate at to favour the transfer of the entire (about size) BTO layer. After removing the PDMS, the membranes were dipped in acetone and isopropyl alcohol to remove the remaining PPC and clean the surface of the freestanding oxide layer. The deterministic assembly of the twisted bilayer was performed by mounting the first layer on a rotatable platform under the microscope in a custom-made layer-transfer setup. Layer edges (parallel to substrate edges along the [100] directions) were aligned with reference markers of the sample holder. The second layer can be placed on the top rotated with respect to the first using layer edges (which are parallel to [100] BTO crystallographic directions) to determine the angle. The twist angle was set with an accuracy of . A more precise value of the twist angle (accuracy of ) can be measured from the shift between the fast Fourier transform (FFT) spots of electron microscopy images. Supplementary Fig. 1 shows an optical microscopy image of a twisted bilayer transferred onto a gold-capped silicon wafer. Note the large area (around size) of the sample. Although some wrinkles can be observed, they are separated by sufficiently large distances to have extensive areas in which the two layers superpose flat on top of the other.
Atomic force microscopy observation on the surfaces of twisted bilayers showed similar small roughness, taking values in the range of 0.5 nm (rms) over micron-sized distances (Supplementary Fig. 2).
Scanning transmission electron microscopy
STEM characterization was carried out using a JEOL JEM-ARM 200cF aberration-corrected electron microscope equipped with a cold field emission gun and a Gatan Quantum spectrometer, operated at 200 kV . Depth-sectioning STEM-HAADF was performed by acquiring atomic-resolution STEM-HAADF images as a function of defocus , enabling us to probe different depths of the sample and discriminate between the top and bottom layers of the stack. STEM-HAADF images were acquired using a 30 -mrad probe forming aperture semiangle and a HAADF detector collection semiangle of .
Quantitative EELS analysis
For EELS characterization, an electron energy-loss spectrum was acquired for every pixel while scanning the beam with an acquisition time of 1 s per pixel. For acquisition, we used Dual-EELS mode with a dispersion that enabled us to simultaneously record the zero-loss-peak and the BTO core-loss edges. For EELS elemental composition analysis, we performed a model-based quantification, including plural scattering , using the routines available in the Gatan
Digital Micrograph suite. Supplementary Fig. 3 shows the relative concentration profiles. Our analysis shows that the as-grown samples have stoichiometric Ti and O concentrations.
Analysis of strain and polarization in twisted bilayers
Nanometre-thick ( ) BTO layers delaminated to form twisted bilayer homojunctions with deterministic twist angles were transferred onto holey membranes for electron microscopy imaging. To study the structural properties of individual layers of the twisted bilayers, we performed a STEM-HAADF experiment (see the previous section). Focusing on the entrance surface of the stack (defocus ), we observed the typical structure of a BTO perovskite that corresponds to the top layer. The moiré contrast was shown by changing the defocus to reach the interface of the twisted bilayer (defocus ) (Extended Data Fig. 1b). A further increasing defocus brings the bottom layer in focus, which appears rotated by the twist angle of the bilayer. Twisted ferroelectric bilayers exhibit characteristic moiré features determined by the atomic coincidence pattern between the two layers (Extended Data Fig. 1c). The twist angle, determined from the FFT image, is homogeneous along the fabricated sample and close to the nominal rotation of the films during the deterministic transfer process. The FFT shows the spots from both the top and bottom twisted BTO layers; for clarity, we denote the directions corresponding to the twisted layer forming the moiré pattern as (100)and (010). The moiré pattern shows two distinct (plateau-like) features at the highly (atom-on-atom) coincidental regions of both layers, marked as AA and AB in Extended Data Fig. 1 b and on the rigid atomic model shown in Extended Data Fig. 1d. Around the AA sites, there is AA stacking (Ba on Ba, Ti on Ti and O on O) between the top and bottom layers, whereas sites show an stacking (Ba on Ti and Ti on Ba) for the Ba and Ti cations of the twisted layers while preserving the AA stacking for the O anions.
We analysed strain using the Peak Pairs Analysis (PPA) software package (HREM Research) for Digital Micrograph . We analysed the STEMHAADF images of and twisted BTO bilayer stacks acquired focusing on the entrance surface of the stack (defocus ). To improve the precision of the analysis, the scanning direction was rotated off the crystallographic axes of BTO. For the analysis, we performed a Bragg filter selecting the two main reflections along the (100) and (010) directions as the base vectors. The peak positions were then determined on the filtered image, and the relative displacement fields ( ) of the measured lattice with respect to a reference lattice area were calculated. In this case, we used the whole image as a reference area. Finally, the components of the strain tensor were calculated from the displacement fields as and .
Extended Data Fig. 2a,b shows (raw) unprocessed images of the top layer of both bilayers. Intralayer strain was measured on the top layer (defocus ). Apart from the symmetric shear strains ( ), strain analysis included the antisymmetric components of the strain tensor ( ) associated with local rotations of the perovskite lattice (Extended Data Fig. 2c,d). Control experiments on single BTO freestanding layers show a nearly homogeneous strain distribution (Extended Data Fig. 3), making it clear that the complex strain maps obtained in the bilayers originate at the stacking of the twisted layers. Note that there is a maximal atom-on-atom coincidence between the twisted layers at the and sites; we find very small shear strains in those areas.
To determine the ferroelectric polarization, the atomic positions of both A-site Ba and B-site Ti cations were measured on fast-Fourier-filtered STEM-HAADF images of twisted BTO bilayer stacks acquired focusing on the entrance surface of the stack (defocus ). To precisely determine the atomic positions, we performed a 2D Gaussian fitting using Atomap . Polarization was calculated from the off-centring of the B-site Ti cations in the individual unit cells (relative displacement of the B-site Ti cation from the centrosymmetric position, determined with the A-site Ba cations within the same unit cell) .
Article
Extended Data Fig. 4 shows the polarization analysis of a twisted BTO bilayer. Arrows on the left panel (whose length scales with the BTO bulk ferroelectric moments) feature a pattern of polarization waves. The array of ferroelectric vortices can be better observed after subtracting the average polarization ( ) value in the image (Extended Data Fig. 4, right).
The effect of image distortions due to aberrations and artefacts due to FFT analysis and electron channelling effects through the whole bilayer system is described in Supplementary Note 3.
Cross-section samples for the analysis of out-of-plane polarization
The origin of the inhomogeneous strain is the interfacial proximityinduced physical couplings between both ferroelectric layers enabled by a narrow interface between the twisted layers. Extended Data Fig. 5 shows cross-sectional STEM-HAADF images of a twisted BTO bilayer. The width of the interface measured from intensity profiles across the interface in mask-filtered inversed FFT images (Extended Data Fig. 5c) is of the order of a single unit cell. Note that the dark contrast at the interface of the stack is similar in recently reported images of twisted membranes and can be explained by a reduced channelling effect at the interface . As demonstrated by cross-section high-resolution microscopy images, there is a quite ‘intimate’ contact between the layers that enables the interaction between the layers , which is expected to be strong for our polar oxides and may survive even across the adatom layers . Occasionally, we find regions with increased interface width resulting from disorder or adsorbates, in which neither the moiré pattern nor the strain modulation is observed.
Extended Data Fig. 6 shows a polarization map of the top layer of the bilayer of Extended Data Fig. 5. Note that although at the top surface there are large regions with in-plane polarization, at the interface (bottom part of the image) polarization is mostly diagonal. The finding of an out-of-plane polarization close to the interface suggests the nucleation of a rhombohedral-like phase with polar displacements approximately in the direction. (Strictly speaking, this phase is probably monoclinic.) This is not completely unexpected given the presence of the bottom interface in which the defects and/or adsorbates may favour the occurrence of an out-of-plane polarization component.
By contrast, the net in-plane polarization at the surface of the top layer indicates that our layers present the tetragonal and orthorhombic ferroelectric phases that also occur in the bulk material. BTO crystals present a tetragonal structure at room temperature, which would suggest a polarization along the [1,0] or [0,1] direction also found in our layers. Single BTO freestanding layers showed averaged in-plane polarization in the [1,0] direction, although occasionally [1,1] orthorhombic domains were also observed (see Extended Data Fig. 7, which shows the histogram plots of the ferroelectric polarization direction in single BTO freestanding layers). Given the proximity to the bulk tetragonal to orthorhombic transition (which occurs at 278 K , implying that these phases have very similar free energies at ambient conditions) and the fact that the existing interfaces may cause more out-of-plane relaxations, the observed ferroelectric domains suggesting nucleation of different phases seem perfectly acceptable, as they may be stabilized by any of many factors distinguishing our BTO layers from the bulk compound. It is interesting to remark that single layers, apart from the large domains with homogeneous ferroelectric polarization discussed above, also show nearly homogeneous strain states with no indication of the polar topology observed in the twisted bilayers (see Extended Data Fig. 3, which shows a similar analysis for a single layer to that shown in Fig. 1 for the twisted bilayers).
Layer thickness dependence
The thickness dependence of the observed strain-polarization pattern provides an important clue on the origin of the effect (Extended Data
Fig. 8, which shows the polar topology of bilayers with and thick BTO layers with twist angle). Owning to the focus depth of our microscope, 8 nm thickness is the lower limit allowing to resolve the atomic positions of the two layers independently (Supplementary Fig. 4). The larger thickness of the individual layer results in smaller values of the shear strain at the antivortex sites (around for the sample instead of about for the bilayer with 15 – nm layers) and also smaller values of the toroidal moment at vortex sites after subtracting the homogeneous polarization (approximately 1.5 e for the sample instead of found for the bilayer). On the contrary, in the 8 -nm sample, the polar topology is observed even without subtracting the homogeneous polarization, which produces negligible changes in the polarization landscape. Also, larger average values of shear strain ( ) and toroidal moment ( ), comparable to the sample, are obtained in the thinner sample. This demonstrates that the pattern of shear strains induced by the relative rotation of the layers stabilizes a vortex state for sufficiently thin ( 8 nm ) layers. As the thickness increases, a homogeneous polarization component is observed.
First-principles calculations
We performed DFT calculations as implemented in the Vienna Ab initio Simulation Package (VASP) . We used the Perdew-Burke-Ernzerhof formulation for solids (PBEsol) implementation of the generalized gradient approximation for the exchange-correlation functional. The atomic cores are treated within the projector-augmented wave approach , considering the following states explicitly: and for Ba; and for Ti; and and for O. We used a energy cutoff for the plane-wave basis set. The simulation cells consisted of perovskite unit cells and were computed using a Monkhorst-Pack -point grid. The structures were fully relaxed until the residual forces fell below and the residual stresses fell below 0.001 GPa .
Let us stress that our DFT simulations correspond to the limit of very low temperature (formally, 0 K ). Thus, the computed energy differences-that is, the 9 meV per formula unit separating the monodomain ferroelectric state from the vortex-antivortex structure-can be taken as an upper bound for the relevant free energy difference at room temperature. (In essence, the calculated energy difference comes from the ferroelectric domain walls-the energy of which is known to decrease on heating-and the inhomogeneous strain modulationwhich is imposed by the interlayer couplings.) Note also that in our simulations we treat the monodomain and vortex-antivortex configurations as two separate cases, whereas in experiment (except in the thinnest layers) the topological features are a relatively small modulation of the homogeneous state. For this reason too, the computed energy difference is an upper bound for the actual energy cost of inducing (relatively small) topological features superimposed on the homogeneous state. Hence, our DFT results indicate that the experimentally observed topological structure can be easily accessed and physically sound.
The above considerations also explain the quantitative differences between the experimentally observed local polarizations (of about ) and those obtained in the simulated vortex-antivortex state (of about ). Although the former is associated with a largely homogeneous polar state, the latter corresponds to a configuration in which the total polarization changes sign in length scales of a few unit cells. It is natural to find local polarizations of reduced magnitude in such a strongly inhomogeneous state, as this yields smaller polarization gradients and a decrease in the associated energy penalty.
Finally, let us remark that simulating directly the perturbed homogeneous state would require DFT relaxations constrained to respect the experimentally observed inhomogeneous strain pattern; these calculations would involve several non-trivial assumptions and technical complications, and we did not pursue them here.
Quantitative estimates of the flexoelectric coefficient
Our quantitative measurements enable us to compute strain gradients and polarization modulations and, thus, estimate the effective linear flexoelectric coefficient . We have
which is substantially smaller than the typical experimental results for bulk BTO at room temperature (values between and have been reported ). However, we believe that this disagreement is probably not that surprising, for two main reasons: (1) our twisted layers are very different from the model bulk materials described in the literature; (2) the strain gradients we measure are orders of magnitude larger than the ones used for measurements of flexoelectric coefficients. Concerning the first point, our constrained BTO layers might be electrically stiffer than the bulk material and thus present a smaller flexoelectric response. (The magnitude of the flexoelectric coupling is known to be proportional to the magnitude of the dielectric response .) Concerning the second point, note that to determine flexoelectric coefficients experimentally, the considered strain gradients are chosen intentionally small, of the order of (ref. 69). Strain gradients of the order of -as those associated with ferroelastic domains -are considered to be very large. The gradients in our samples are even larger, by almost two orders of magnitude. This suggests that the flexoelectric effects at play in our samples must be strongly non-linear. Hence, it is not justified to compare our estimated effective linear coupling with the strictly linear effects reported in the experimental literature.
Moreover, we may have differences because of surface contributions to the flexoelectric effect . Furthermore, let us note that there are theoretical predictions yielding values around for BTO (ref. 71)-that is, a smaller effect than what we estimate. Shedding further light on these issues would be a great challenge, for both experiment and theory, and is beyond the scope of the present work.
Data availability
The raw data shown in the main figures are available at Zenodo (https:// doi.org/10.5281/zenodo.10439374). Other data that support the findings of this study are available from the corresponding authors upon reasonable request.
47. Sanchez-Santolino, G. et al. Resonant electron tunnelling assisted by charged domain walls in multiferroic tunnel junctions. Nat. Nanotechnol. 12, 655-662 (2017).
48. Pesquera, D. et al. Beyond substrates: strain engineering of ferroelectric membranes. Adv. Mater. 32, 2003780 (2020).
49. Borisevich, A. Y., Lupini, A. R. & Pennycook, S. J. Depth sectioning with the aberrationcorrected scanning transmission electron microscope. Proc. Natl Acad. Sci. USA 103, 3044-3048 (2006).
50. Ishikawa, R., Lupini, A. R., Hinuma, Y. & Pennycook, S. J. Large-angle illumination STEM: Toward three-dimensional atom-by-atom imaging. Ultramicroscopy 151, 122-129 (2015).
51. Verbeeck, J. & Van Aert, S. Model based quantification of EELS spectra. Ultramicroscopy 101, 207-224 (2004).
52. Thomas, P. J. & Twesten, R. D. A simple, model based approach for robust quantification of EELS spectra and spectrum-images. Microsc. Microanal. 18, 968-969 (2012).
53. Galindo, P. L. et al. The Peak Pairs algorithm for strain mapping from HRTEM images. Ultramicroscopy 107, 1186-1193 (2007).
54. Nord, M., Vullum, P. E., MacLaren, I., Tybell, T. & Holmestad, R. Atomap: a new software tool for the automated analysis of atomic resolution images using two-dimensional Gaussian fitting. Adv. Struct. Chem. Imaging 3, 9 (2017).
55. Ghosez, Ph., Michenaud, J. & Gonze, X. Dynamical atomic charges: The case of compounds. Phys. Rev. B 58, 6224-6240 (1998).
56. Smeaton, M. A., Schnitzer, N., Zheng, H., Mitchell, J. F. & Kourkoutis, L. F. ChannelingInduced Artifacts in Atom Tracking of Cations in Distorted Perovskites Imaged by HAADF-STEM. Microsc. Microanal. 28, 1736-1738 (2022).
57. Oveisi, E., Spadaro, M. C., Rotunno, E., Grillo, V. & Hébert, C. Insights into image contrast from dislocations in ADF-STEM. Ultramicroscopy 200, 139-148 (2019).
58. Kim, Y. et al. Remote epitaxy through graphene enables two-dimensional material-based layer transfer. Nature 544, 340-343 (2017).
59. Kum, H. S. et al. Heterogeneous integration of single-crystalline complex-oxide membranes. Nature 578, 75-81 (2020).
60. Kong, W. et al. Polarity governs atomic interaction through two-dimensional materials. Nat. Mater. 17, 999-1004 (2018).
61. Kresse, G. & Furthmüller, J. Efficient iterative schemes for ab initio total-energy calculations using a plane-wave basis set. Phys. Rev. B 54, 11169-11186 (1996).
62. Kresse, G. & Joubert, D. From ultrasoft pseudopotentials to the projector augmented-wave method. Phys. Rev. B 59, 1758-1775 (1999).
63. Perdew, J. P. et al. Restoring the density-gradient expansion for exchange in solids and surfaces. Phys. Rev. Lett. 100, 136406 (2008).
64. Blöchl, P. E. Projector augmented-wave method. Phys. Rev. B 50, 17953-17979 (1994).
65. Monkhorst, H. J. & Pack, J. D. Special points for Brillouin-zone integrations. Phys. Rev. B 13, 5188-5192 (1976).
66. Harada, J., Axe, J. D. & Shirane, G. Neutron-scattering study of soft modes in cubic BaTiO . Phys. Rev. B 4, 155-162 (1971).
67. Yudin, P. V., Ahluwalia, R. & Tagantsev, A. K. Upper bounds for flexoelectric coefficients in ferroelectrics. Appl. Phys. Lett. 104, 082913 (2014).
68. Wang, B., Gu, Y., Zhang, S. & Chen, L.-Q. Flexoelectricity in solids: Progress, challenges, and perspectives. Prog. Mater. Sci. 106, 100570 (2019).
69. Ma, W. & Cross, L. E. Strain-gradient-induced electric polarization in lead zirconate titanate ceramics. Appl. Phys. Lett. 82, 3293-3295 (2003).
70. Stengel, M. Surface control of flexoelectricity. Phys. Rev. B 90, 201112 (2014).
71. Dreyer, C. E., Stengel, M. & Vanderbilt, D. Current-density implementation for calculating flexoelectric coefficients. Phys. Rev. B 98, 075153 (2018).
Acknowledgements We acknowledge the funding received from the project To2Dox of FlagERA ERA-NET Cofund in Quantum Technologies implemented in the Horizon 2020 programme of the European Union. J.S., C.L., F.M. and M.G.-H. received support from the Spanish AEI through grants PID2020-118078RB-IOO and from the Regional Government of Madrid CAM through SINERGICO project Y2020/NMT-6661 CAIRO-CM. G.S.-S. acknowledges financial support from the Spanish MCI grant nos. RTI2018-099054-J-IOO (MCI/AEI/FEDER, UE) and IJC2018-038164-I. We, at UCM, acknowledge support from the (MAD2D-CM)-UCM project funded by the Comunidad de Madrid; by the Recovery, Transformation and Resilience Plan; and by the NextGenerationEU from the European Union. V.R. was supported by the Madrid Government (Comunidad de Madrid-Spain) under the Multiannual Agreement with Universidad Complutense de Madrid in the line Research Incentive for Young PhDs, in the context of the V PRICIT (Regional Programme of Research and Technological Innovation), the Horizon 2020 research and innovation programme of the European Union (grant agreement no. 755655 ERC-StG 2017 project 2D-TOPSENSE, grant agreement no. 785219 Graphene Core2-Graphenebased disruptive technologies and grant agreement no. 881603 Graphene Core3-Graphenebased disruptive technologies), the EU FLAG-ERA project To2Dox (JTC-2019-009), the Comunidad de Madrid through the CAIRO-CM project (Y2020/NMT-6661) and the Spanish Ministry of Science and Innovation (grant PID2020-118078RB-IOO and fellowship PRE2018084818). Electron microscopy observations were carried out at the Centro Nacional de Microscopia Electrónica, CNME-UCM. The work at LIST was supported by the Luxembourg National Research Fund through grant FNR/C18/MS/12705883/REFOX.
Author contributions V.R., V.Z., S.P. and F.A.C. prepared the samples with the help and guidance of C.M., F.M., M.G.-H. and A.C.-G.; G.S.-S. and M.C. did the electron microscopy; G.S.-S., V.R., V.Z., C.L. and J.S. analysed the electron microscopy data; H.A. and J.Í. did the theory analysis; and G.S.-S., V.R., H.A., J.Í., C.L. and J.S. wrote the paper with input and help from all authors.
Competing interests The authors declare no competing interests.
Additional information
Supplementary information The online version contains supplementary material available at https://doi.org/10.1038/s41586-023-06978-6.
Correspondence and requests for materials should be addressed to G. Sánchez-Santolino, V. Rouco or J. Santamaria.
Peer review information Nature thanks Houbing Huang and the other, anonymous, reviewer(s) for their contribution to the peer review of this work.
Reprints and permissions information is available at http://www.nature.com/reprints.
Extended Data Fig. 1 | Fabrication of twisted freestanding bilayers.
a) Schematic of the deterministic two steps transfer process. b) Depth sectioning STEM-HAADF experiment of a twisted bilayer stack focusing on the entrance surface of the stack (defocus ) and the interface defocus c) Moiré structure formed at the interface between the layers. A network of two distinct AA and AB motives is formed due to
the twist. The image on the right shows the Fast Fourier Transform noting the reflections of both the top and bottom freestanding films. The scale bar is 2 nm d Model of the rigid atomic structure corresponding to two lattices with a twist angle of showing Ba atoms in green, Ti in blue and O in red for the top layer. Atoms in the bottom layer are in gray colors. AA and AB sites are marked in red and blue respectively.
Extended Data Fig. 2 | (a), (b) HAADF-STEM raw (unprocessed) planar view images of twisted bilayers. a) STEM-HAADF image of a twisted bilayer stack focusing on the surface of the bilayer (defocus ).
b) STEM-HAADF image of a twisted bilayer stack focusing on the surface of the bilayer (defocus ). c)-e) Antisymmetric component of the
strain tensor ( ) measured on a) experimental HAADF image of a twisted bilayer b) experimental HAADF image of a twisted bilayer and c) model image obtained using a DFT model of a twisted bilayer. Red and blue octagons indicate sites with AA (AA-sites) and AB (AB-sites) stacking respectively.
Extended Data Fig. 3 | Strain and polarization analysis of a single freestanding film. a) STEM-HAADF image (planar view) of a freestanding film along the [001] direction. b) Shear strain ( component of the lattice strain tensor) c) Ti displacement ( ) map (black arrows)
corresponding to the same area superimposed to the toroidal moment of the ferroelectric polarization. d) Ti displacement ( ) showing the homogeneous polarization of a single layer. Ti displacements in (c) and (d) are amplified by a factor of 20 for clarity.
a
Extended Data Fig. 4 | Polarization analysis of a twisted bilayer stack focusing on the top surface (defocus ). a) Ti displacement map measured on the image in Fig. 1f showing the polarization before subtracting
b
the mean polarization value of the analyzed region. b) Ti displacement map after subtracting the mean polarization value. Ti displacements are amplified by a factor of 20 for clarity.
Article
Extended Data Fig. 5 | Cross-sectional HAADF-STEM images of twisted bilayer. a) STEM-HAADF (cross-section) image of a twisted bilayer transferred over a substrate. The bottom layer of the bilayer was aligned with the substrate.b) STEM-HAADF image of the interface between the
top and bottom layers of the stack.c) Fourier-filtered image from (b). The inset shows an intensity profile along the yellow arrow depicting a distance of the order of one unit cell between the top and bottom layers of the stack.
Arrow length
Extended Data Fig. Polarization analysis of a cross-section image of twisted bilayer transferred onto substrate. a) STEM-HAADF image along the direction of the top layer in a twisted bilayer.
b) Ti displacement ( ) map (black arrows) measured on the marked region in (a)
at the top layer. The color map shows the angle of the polarization measured respect to the positive direction (left to right) of the horizontal axis. The cross-sectional sample was capped with an evaporated gold layer (top part of the image) to protect the twisted freestanding layers during sample preparation.
Article
Extended Data Fig. 7|Polarization analysis of different regions of a single freestanding film. a), b), c) STEM-HAADF images of different regions of a freestanding film acquired with different scanning directions. Each image was taken with scan directions to avoid possible artefacts. Ti displacement maps (yellow arrows) are superimposed to the images and displacements are amplified by a factor of 20 for clarity. Notice that in panel a) and b) in-plane polarization is mainly in the [ 1,0 ] direction, while in panel c) it
points in [1,1] direction. d), e), f) Histograms of the polarization direction corresponding to the images in a), b), c). Histogram directions are set so the direction corresponds to a polarization angle in all cases. The offset found in region (a) is not related to the scan direction but it results from the presence of a small domain pointing along the [11] direction on the left part of the image.
Extended Data Fig. 8 | Strain and polarization modulations of twisted bilayers of different thickness. a) STEM-HAADF (planar view) image of a twisted bilayer stack with 30 nm thick layers focusing on the interface of the bilayer (defocus ). b) Shear strain ( component of the lattice strain tensor) depicting a periodic strain modulation at the top layer. c) Color map of the toroidal moment (Q) of the ferroelectric polarization corresponding to the same area showing a network of clockwise (red) and
anticlockwise (blue) vortices. Superposed is the Ti displacement ( ) map (black arrows) measured on the top layer after subtracting the homogeneous component. Ti displacements are amplified by a factor of 20 for clarity. d), e), f) show the same analysis for a twisted bilayer with 8 nm thick individual layers (defocus ). Notice that the arrow map in f ) has been constructed without subtracting the homogeneous polarization. Red and blue marks in all panels indicate the AA and AB stacking sites, respectively.
Article
Extended Data Fig. 9 | Second derivatives of the shear strain. (proportional to curl of the polarization vector) for a) a twisted bilayer b) for twisted bilayer and c) for a model image obtained from DFT calculation of twisted bilayer. Notice the similarity with
the toroidal moment shown in Fig. 1 showing a network of clockwise (red) and counterclockwise (blue) vortices at AA and AB sites respectively (marked with octagons). Ti displacement map (black arrows) are superimposed to all images. Ti displacements are amplified by a factor of and .
a
b
c
Extended Data Fig. 10|Curl of the polarization vector. for a) experimental HAADF image of a twisted bilayer b) experimental HAADF image of a twisted bilayer and c ) model image obtained using a DFT model of a twisted bilayer. Notice the similarity with the toroidal moment shown in Fig. 1 showing a network of clockwise (red) and counterclockwise
(blue) vortices at AA and AB sites respectively (marked with octagons). Ti displacement map after subtracting a homogeneous component (black arrows). Ti displacements are amplified for clarity by a factor of 20 in (a,b) and 40 in (c).