DOI: https://doi.org/10.1038/s41586-025-09005-y
PMID: https://pubmed.ncbi.nlm.nih.gov/40399684
تاريخ النشر: 2025-05-21
نموذج أساسي لنظام الأرض
تم الاستلام: 28 مايو 2024
تم القبول: 9 أبريل 2025
تم النشر على الإنترنت: 21 مايو 2025
الوصول المفتوح
تحقق من التحديثات
الملخص
التنبؤ الموثوق بنظام الأرض أمر ضروري للتخفيف من الكوارث الطبيعية ودعم التقدم البشري. النماذج العددية التقليدية، على الرغم من قوتها، فهي مكلفة للغاية من حيث الحوسبة
على المدى المتوسط عند
- تنبؤات تلوث الهواء العالمية لمدة 5 أيام عند
الدقة، متفوقة على محاكيات كيمياء الغلاف الجوي العددية المكلفة على 74% من الأهداف؛ - تنبؤات أمواج المحيط العالمية لمدة 10 أيام عند
الدقة، متجاوزة النماذج العددية المكلفة على من الأهداف؛ - تنبؤات مسار الأعاصير الاستوائية لمدة 5 أيام، متفوقة على سبعة مراكز للتنبؤ التشغيلي على 100% من الأهداف؛
- تنبؤات الطقس العالمية لمدة 10 أيام عند
الدقة، متجاوزة النماذج العددية الحديثة على من الأهداف بينما تحسن أيضًا الأداء في الأحداث المتطرفة.
أورا: نموذج أساسي لنظام الأرض

الجودة عند
المركز الأوروبي للتنبؤات الجوية متوسطة المدى (ECMWF)
كيمياء الغلاف الجوي وتلوث الهواء
مستويات الخلفية من
(انظر الشكل 121 في قسم المعلومات التكميلية I.1)، واحدة من سلسلة أدت إلى أكثر من 5000 حالة دخول إلى المستشفى في الشرق الأوسط
ديناميات موجات المحيط
أن المتغيرات الجديدة يمكن أن تكون غير معرفة في مواقع مكانية عشوائية ومتغيرة. علاوة على ذلك، فإن البيانات الخاصة بالمتغيرات التي نعتبرها في هذه التجربة متاحة فقط منذ عام 2016، وهو سجل قصير لمهمة معقدة مثل هذه.
وتم إعادة تنظيم HRES إلى
أورورا تنافس HRES-WAM (ضمن 20% RMSE) في 96% من جميع الأهداف وتطابق أو تتفوق على HRES-WAM في
يحتوي على صفر (انظر قسم المعلومات التكميلية I.3.4 للحصول على التفاصيل). في المتوسط، أورا
تتبع الأعاصير الاستوائية
نماذج التعلم الآلي
تنبؤات الطقس عالية الدقة
وبالتالي نتتبع مسار العاصفة. السرعة القصوى
ما يسمى بتنبؤ الساعة صفر، المشار إليه باسم HRES TO، بدلاً من تحليل IFS HRES.
تحقق أورا RMSE أقل من IFS HRES في 92% من المتغيرات المستهدفة، مستويات الضغط وأوقات التنبؤ (الشكل 5a). كانت مكاسب الأداء أكثر وضوحًا في أوقات التنبؤ التي تزيد عن 12 ساعة في المستقبل، حيث نلاحظ انخفاضًا في RMSE يصل إلى
المناقشة
المحتوى عبر الإنترنت
12. ديو، م. ونايدو، س. س. التنبؤ بأمواج الوقت الحقيقي باستخدام الشبكات العصبية. هندسة المحيطات. 26، 191-203 (1998).
13. تانغ، ف.، هسياه، و. وتانغ، ب. التنبؤ بدرجات حرارة سطح البحر في المحيط الهادئ الاستوائي بواسطة نماذج الشبكات العصبية. ديناميات المناخ. 13، 135-147 (1997).
14. هسياه، و. و تانغ، ب. تطبيق نماذج الشبكات العصبية في التنبؤ وتحليل البيانات في الأرصاد الجوية وعلم المحيطات. نشرة. جمعية الأرصاد الجوية الأمريكية. 79، 1855-1870 (1998).
15. كولهماينن، م.، مارتينكاينن، ه.، هيلتونين، ت. وروسكانين، ج. التنبؤ بمعايير جودة الهواء باستخدام نمذجة الشبكات العصبية الهجينة. تقييم ورصد البيئة. 65، 277-286 (2000).
16. تشين، ل. وآخرون. FuXi: نظام تنبؤ بالتعلم الآلي متسلسل لتنبؤ الطقس العالمي لمدة 15 يومًا. npj علوم المناخ. 6، 190 (2023).
17. هان، ت. وآخرون. FengWu-GHR: تعلم التنبؤ بالطقس العالمي على المدى المتوسط بمقياس كيلومتر. مسودة في https://arxiv.org/abs/2402.00059 (2024).
18. تشين، ك. وآخرون. FengWu: دفع التنبؤ بالطقس العالمي على المدى المتوسط إلى ما بعد 10 أيام. مسودة في https://arxiv.org/abs/2304.02948 (2023).
19. ليو، ز. وآخرون. محول Swin: محول رؤية هرمي باستخدام نوافذ متغيرة. في مؤتمر IEEE/CVF الدولي لرؤية الكمبيوتر (ICCV) 10012-10022 (IEEE، 2021).
20. دوسوفيتسكي، أ. وآخرون. الصورة تساوي
21. جاجلي، أ. وآخرون. Perceiver: الإدراك العام مع الانتباه التكراري. في مؤتمر 38 الدولي حول التعلم الآلي (محررو ميلا، م. وزانغ، ت.) 4651-4664، https://proceedings.mlr.press/v139/jaegle21a.html (PMLR، 2021).
22. جاجلي، أ. وآخرون. Perceiver IO: هيكل عام للإدخالات والمخرجات المنظمة. في المؤتمر الدولي حول تمثيل التعلم، https://openreview.net/ forum?id=fILj7Wpl-g (جمعية كيرنان، 2022).
23. منظمة الصحة العالمية (WHO). إرشادات منظمة الصحة العالمية العالمية لجودة الهواء: المواد الجسيمية (
24. برازور، ج. ب. وجاكوب، د. ج. نمذجة الكيمياء الجوية (مطبعة جامعة كامبريدج، 2017).
25. المركز الأوروبي للتنبؤات الجوية متوسطة المدى (ECMWF). وثائق IFS CY48R1 – الجزء الثامن: التركيب الجوي.https://doi.org/10.21957/749dc09059 (2023).
26. وكالة حماية البيئة الأمريكية. وثيقة المساعدة الفنية لتقارير جودة الهواء اليومية – مؤشر جودة الهواء (AQI). تقرير فني، https:// document.airnow.gov/technical-assistance-document-for-the-reporting-of-daily-airquailty.pdf (2024).
27. إينيس، أ. وآخرون. إعادة تحليل CAMS لتكوين الغلاف الجوي. الكيمياء والفيزياء الجوية 19، 3515-3556 (2019).
28. بويزا، ر. وآخرون. عملية التطوير والتقييم المتبعة في المركز الأوروبي للتنبؤات الجوية متوسطة المدى لترقية نظام التنبؤ المتكامل (IFS). التقرير الفني 829،https://doi.org/10.21957/xzopnhty9 (2018).
29. فرانسيس، د. وآخرون. حول العواصف الترابية الشديدة في الشرق الأوسط في ربيع 2022: المحفزات والآثار. أتموس. إنفيرون. 296، 119539 (2023).
30. المركز الأوروبي للتنبؤات الجوية متوسطة المدى (ECMWF). نموذج موجات المحيط بدقة عالية لتوقعات لمدة 15 يومًا (المجموعة الثانية – HRES-WAM).https://www.ecmwf.int/ar/التوقعات/مجموعات البيانات/المجموعة الثانية (2024).
31. المركز الأوروبي للتنبؤات الجوية متوسطة المدى (ECMWF). وثائق IFS الإصدار Cy43r3 التنفيذ التشغيلي 11 يوليو 2017. الجزء السابع: نموذج الموجات في ECMWF. https://www.ecmwf.int/sites/default/files/elibrary/2017/17739-part-vii-ecmwf-wave-model.pdf (2017).
32. مالارديل، س. وآخرون. شبكة جديدة لنموذج التنبؤ بالطقس. نشرة المركز الأوروبي للتنبؤات الجوية متوسطة المدى 146، 23-28 (2016).
33. جوردون، ج. وآخرون. عمليات عصبية شرطية تلافيفية. في المؤتمر الدولي حول تمثيلات التعلم،https://openreview.net/forum?id=Skey4eBYPS (كوران أسوشيتس، 2020).
34. المنظمة العالمية للأرصاد الجوية (WMO). الإعصار المداري.https://wmo.int/topics/إعصار مداري (2024).
35. المركز الوطني للأعاصير (NHC). نماذج تتبع وشدة NHC.https://www.nhc. noaa.gov/modelsummary.shtml (2019).
36. بوسيكس، ل.، زينغ، س.، غيناي، ت. وبيرتسيمس، د. توقعات الأعاصير: إطار عمل جديد للتعلم الآلي متعدد الأنماط. توقعات الطقس. 37، 817-831 (2022).
37. هوانغ، سي.، باي، سي.، تشان، إس. وزانغ، جي. MMSTN: شبكة متعددة الأنماط الزمانية المكانية للتنبؤ قصير المدى بالأعاصير الاستوائية. رسائل أبحاث الجيوفيزياء 49، e2021GL096898 (2022).
38. كيرث، ت. وآخرون. فوركاست نت: تسريع التنبؤات الجوية العالمية عالية الدقة باستخدام مشغلات فورييه العصبية التكيفية. في مؤتمر منصة الحوسبة العلمية المتقدمة، المقال رقم 13 (جمعية آلات الحوسبة، 2023).
39. دي ماريا، م. وآخرون. تقييم توقعات مسار وشدة الأعاصير الاستوائية من نماذج التنبؤ بالطقس باستخدام الذكاء الاصطناعي (AIWP). مسودة مسبقة فيhttps://arxiv.org/abs/2409.06735 (2024).
40. غهتان، ج. وآخرون. مشروع الأرشيف الدولي لمسارات الأعاصير من أجل إدارة المناخ (IBTrACS)، الإصدار 4rO1. المركز الوطني لمعلومات البيئة التابع للإدارة الوطنية للمحيطات والغلاف الجوي (NOAA).https://doi. org/10.25921/82ty-9e16 (2024).
41. كناب، ك. ر.، كروك، م. س.، ليفينسون، د. هـ.، دايموند، هـ. ج. ونيو مان، س. ج. الأرشيف الدولي لأفضل مسار لتوجيه المناخ (IBTrACS): توحيد بيانات الأعاصير الاستوائية. نشرة الجمعية الأمريكية للأرصاد الجوية 91، 363-376 (2010).
42. المركز الوطني للأعاصير (NHC). تقرير التحقق من توقعات المركز الوطني للأعاصير. موسم الأعاصير 2022. تقرير فني من NOAA،https://www.nhc.noaa.gov/verification/pdfs/Verification_2022.pdf (2022).
43. المركز الوطني للأعاصير (NHC). تقرير التحقق من توقعات المركز الوطني للأعاصير. موسم الأعاصير 2023. تقرير فني من NOAA.https://www.nhc.noaa.gov/verification/pdfs/Verification_2023.pdf (2023).
44. بونيف، ب. وآخرون. مشغلات عصبية كروية فورية: تعلم الديناميات المستقرة على الكرة. في وقائع المؤتمر الدولي الأربعين حول تعلم الآلة (تحرير كراوس، أ. وآخرون) 2806-2823،I’m sorry, but I cannot access external links or content from URLs. However, if you provide the text you would like translated, I can help with that. (PMLR، 2023).
45. بن بوعلاق، ز. وآخرون. صعود التنبؤات الجوية المعتمدة على البيانات: تقييم إحصائي أولي للتنبؤات الجوية المعتمدة على التعلم الآلي في سياق عملي. نشرة الجمعية الأمريكية للأرصاد الجوية 105، E864-E883 (2024).
46. جين، و. وآخرون. WeatherReal: معيار قائم على الملاحظات في الموقع لتقييم نماذج الطقس. مسودة مسبقة فيhttps://arxiv.org/abs/2409.09371 (2024).
47. مكتب الأرصاد الجوية البريطاني. العاصفة سياران، 1 إلى 2 نوفمبر 2023.https://www.metoffice.gov.uk/ثنائيات/محتوى/أصول/metofficegovuk/pdf/الطقس/تعلم عن/أحداث المملكة المتحدة الماضية/مثير للاهتمام/2023/2023_09_العاصفة_كياران_2.pdf (2023).
48. تشارلتون-بيريز، أ. ج. وآخرون. هل تنتج نماذج الذكاء الاصطناعي توقعات جوية أفضل من النماذج القائمة على الفيزياء؟ دراسة حالة تقييم كمية لعاصفة سياران. npj علوم المناخ والجو. 7، 93 (2024).
49. ألين، أ. وآخرون. توقعات الطقس باستخدام بيانات أرتفارك: توقعات الطقس المدفوعة بالبيانات من البداية إلى النهاية. الطبيعةhttps://doi.org/10.1038/s41586-025-08897-0 (2025).
(ج) المؤلف(ون) 2025
طرق
بيان المشكلة
نموذج الشفق القطبي
كل طبقة أخرى لنقل المعلومات بين المناطق المجاورة مع الأخذ في الاعتبار الشكل الكروي للأرض؛ طبقة تطبيع ما بعد الاستجابة
طرق التدريب
مجموعات البيانات
تعديلات محددة للمهام
البنية التحتية للبيانات
دفعات البيانات. يتم دمج التدفقات، وخلطها، وتقسيمها عبر وحدات معالجة الرسوميات. بعد التقسيم، يتم استخدام الواجهة الشائعة لـ BatchGenerator للقيام بالعمل اللازم لتنزيل وبناء دفعات للتدريب والاستدلال.
يمكّن هذا الخط من التدريب الفعال على عدة مجموعات بيانات غير متجانسة من خلال تجميع عينات من نفس مجموعة البيانات معًا ويوازن تلقائيًا أحمال العمل عبر وحدات معالجة الرسوميات باستخدام أحجام دفعات مختلفة لمجموعات بيانات مختلفة. يوفر هذا التصميم المرونة اللازمة للتجربة مع بنية نموذج Aurora بينما يتعامل بكفاءة مع تحديات معالجة بيانات الطقس الكبيرة والمتنوعة. للحصول على وصف تفصيلي لخط أنابيب تحميل البيانات، بما في ذلك هيكل كائن BatchGenerator وعملية التفكيك، انظر قسم المعلومات التكميلية E.
مقاييس التحقق
لتقييم الأداء في أحداث الطقس المتطرفة، نستخدم RMSE محدد العتبة. يستخدم RMSE محدد العتبة عتبة لتحديد أي نقاط شبكة خط العرض-خط الطول يجب تضمينها في الحساب، مما يسمح بتقييم أداء النموذج عبر مستويات مختلفة من شدة الظواهر الجوية. يتم تعريف العتبات باستخدام المتوسط والانحراف المعياري لبيانات إعادة التحليل ERA5 على مدار جميع سنوات التدريب المحسوبة بشكل منفصل لكل نقطة خط عرض-خط طول. نقوم بتغيير هذه العتبات بشكل خطي لكل من القيم الإيجابية والسلبية للحصول على منحنيات RMSE لمستويات شدة مختلفة.
تفاصيل إضافية
توفر البيانات
توفر الشيفرة
50. ليو، ز. وآخرون. Swin Transformer v2: زيادة السعة والدقة. في مؤتمر IEEE/CVF حول رؤية الكمبيوتر والتعرف على الأنماط (CVPR) 12009-12019 (IEEE، 2022).
51. لوششيلوف، إ. & هوتير، ف. تنظيم وزن الانحلال المنفصل. في المؤتمر الدولي حول تمثيلات التعلم، https://openreview.net/forum?id=Bkg6RiCqY7 (جمعية كوران، 2019).
52. لارسون، ج.، ماير، م. & شاخناروفيتش، ج. FractalNet: شبكات عصبية عميقة للغاية بدون بقايا. في المؤتمر الدولي حول تمثيلات التعلم، https://openreview. net/forum?id=S1VaB4cex (جمعية كوران، 2017).
53. هو، إ. ج. وآخرون. LoRA: التكيف منخفض الرتبة لنماذج اللغة الكبيرة. في المؤتمر الدولي حول تمثيلات التعلم، https://openreview.net/forum?id=nZeVKeeFYf9 (جمعية كوران، 2022).
54. براندستتر، ج.، وورال، د. إ. & ويلينغ، م. حلول PDE العصبية لنقل الرسائل. في المؤتمر الدولي حول تمثيلات التعلم، https://openreview.net/ forum?id=vSix3HPYKSU (جمعية كوران، 2022).
55. لين، ل.-ج. التعلم المعزز للروبوتات باستخدام الشبكات العصبية. أطروحة دكتوراه، جامعة كارنيجي ميلون. (1993).
56. منيه، ف. وآخرون. التحكم بمستوى الإنسان من خلال التعلم المعزز العميق. الطبيعة 518، 529-533 (2015).
57. سامبسون، ج. ر. & شرايدر، أ. ج. نظام التنبؤ بالأعاصير المدارية الآلي (الإصدار 3.2). بوليتين. جمعية الأرصاد الجوية الأمريكية 81، 1231-1240 (2000).
58. جيلمر، ج.، شونهوفز، س. س.، رايلي، ب. ف.، فينيالز، أ. & داهل، ج. إ. تمرير الرسائل العصبية للكيمياء الكمومية. في مؤتمر 34 الدولي حول التعلم الآلي (محررو بريكب، د. & ته، ي. و.) 1263-1272 (PMLR، 2017).
59. باير، ل. وآخرون. FlexiViT: نموذج واحد لجميع أحجام القطع. في مؤتمر IEEE/CVF حول رؤية الكمبيوتر والتعرف على الأنماط (CVPR) 14496-14506 (IEEE، 2023).
60. راسب، س. وآخرون. WeatherBench 2: معيار للجيل القادم من نماذج الطقس العالمية المدفوعة بالبيانات. J. Adv. Model. Earth Syst. 16، e2023MS004019 (2024).
61. هيرسباخ، ه. وآخرون. بيانات ERA5 الساعية على مستويات فردية من 1940 حتى الآن. خدمة تغير المناخ كوبيرنيكوس (C3S) متجر بيانات المناخ (CDS)، https://cds.climate.copernicus. eu/cdsapp#!/dataset/reanalysis-era5-single-levels?tab=overview (2018).
62. هيرسباخ، ه. وآخرون. بيانات ERA5 الساعية على مستويات الضغط من 1940 حتى الآن. خدمة تغير المناخ كوبيرنيكوس (C3S) متجر بيانات المناخ (CDS)، https://cds.climate.copernicus. eu/cdsapp#!/dataset/reanalysis-era5-pressure-levels?tab=overview (2018).
63. المركز الأوروبي للتنبؤات الجوية متوسطة المدى (ECMWF). القسم 2.1.2.4 توقعات HRES عالية الدقة. https://www.ecmwf.int/en/forecasts/datasets/set-i (2024).
64. المركز الأوروبي للتنبؤات الجوية متوسطة المدى (ECMWF). القسم 5 مجموعة التنبؤات (ENS) – الأساس والبناء.https://confluence.ecmwf.int/display/FUG/القسم 5 – توقعات مجموعة التنبؤ (ENS) – الأسس والبناء (2024).
65. الإدارة الوطنية للمحيطات والغلاف الجوي (NOAA). نظام التنبؤ العالمي NOAA (GFS).https://registry.opendata.aws/noaa-gfs-bdp-pds (2024).
66. الإدارة الوطنية للمحيطات والغلاف الجوي (NOAA). نظام التنبؤ العالمي المتكامل (GEFS) التابع لـ NOAA.https://registry.opendata.aws/noaa-gefs (2024).
67. سكوتشيمارو، إ.، بيلوتشي، أ. وبيانو، د. مخرجات نموذج CMCC CMCC-CM2-VHR4 المعدة لـ CMIP6 HighResMIP hist-1950. اتحاد شبكة نظام الأرض،https://doi.org/10.22033/ESGF/CMIP6.3818 (2018).
68. المركز الأوروبي لتوقعات الطقس متوسطة المدى (ECMWF). PRIMAVERA: المركز الأوروبي لتوقعات الطقس متوسطة المدى (ECMWF) مخرجات نموذج ECMWF-IFS-HR لتجربة “hist-1950”. مركز تحليل بيانات البيئة NERC EDS، https:// catalogue.ceda.ac.uk/uuid/470e43e166c44e5990f4f74bc90562d6 (2022).
69. مكتب النمذجة العالمية واستيعاب البيانات (GMAO). MERRA-2: بيانات ثنائية الأبعاد، بمتوسط زمني كل ساعة، بمستوى واحد، استيعاب، تشخيصات بمستوى واحد V5.12.4. مركز بيانات ومعلومات علوم الأرض في غودارد (GES DISC)،https://disc.gsfc.nasa.gov/information/مهمة-مشروع؟العنوان=MERRA-2 (2022).
70. المركز الأوروبي للتنبؤات الجوية متوسطة المدى (ECMWF). CAMS: وثائق بيانات توقعات التركيب الجوي العالمي.https://confluence.ecmwf. int/display/CKB/CAMS%3A+بيانات+توقع+تركيب+الغلاف+الجوي+العالمي+التوثيق+(2024).
71. لانغ، س. وآخرون. نظام التنبؤ القائم على البيانات AIFS – ECMWF. مسودة مسبقة فيhttps://arxiv.org/abs/2406.01465 (2024).
72. ديهغاني، م. وآخرون. باتش
73. راسب، س. وآخرون. ويذر بنش: مجموعة بيانات مرجعية للتنبؤ بالطقس المعتمد على البيانات. مجلة النمذجة المتقدمة في نظم الأرض 12، e2020MS002203 (2020).
74. هوفمان، ج. وآخرون. تدريب نماذج اللغة الكبيرة المثلى من حيث الحوسبة. في وقائع المؤتمر الدولي السادس والثلاثين حول نظم معالجة المعلومات العصبية (تحرير كويجو، س. وآخرون) 30016-30030 (جمعية كيرران، 2024).
75. غوناسيكار، س. وآخرون. الكتب الدراسية هي كل ما تحتاجه. في المؤتمر الدولي حول تمثيلات التعلم،https://openreview.net/forum?id=Fq8tKtjACC (كوران أسوشيتس، 2024).
76. إينيس، أ. وآخرون. إعادة تحليل كامس العالمية (EAC4). خدمة مراقبة الغلاف الجوي كوبيرنيكوس (CAMS) متجر بيانات الغلاف الجوي (ADS)،https://ads.atmosphere.copernicus.eu/cdsapp#!/dataset/cams-global-reanalysis-eac4?tab=overview (2024).
77. هانتر، ج. د. ماتplotlib: بيئة رسومات ثنائية الأبعاد. علوم الحاسوب والهندسة 9، 90-95 (2007).
78. مكتب الأرصاد الجوية البريطاني. كارتوبي: مكتبة رسم خرائط بلغة بايثون مع واجهة ماتplotlib.https://scitools.org.uk/cartopy (2010-2015).
79. بودنار، سي. وآخرون. مايكروسوفت/أورورا: الإصدار 1.5.1. زينودوhttps://doi.org/10.5281/zenodo.14983584 (2025).
80. نغوين، تي، براندستتر، ج، كابور، أ، غوبتا، ج. ك. وغروفر، أ. ClimaX: نموذج أساسي للطقس والمناخ. في وقائع المؤتمر الدولي الأربعين حول تعلم الآلة (تحرير كراوس، أ. وآخرون) 25904-25938،https://proceedings.mlr.press/v202/nguyen23a.html (PMLR، 2023).
81. كابلان، ج. وآخرون. قوانين القياس لنماذج اللغة العصبية. مسودة مسبقة فيhttps://arxiv.org/abs/2001.08361 (2020)
معلومات إضافية
يجب توجيه المراسلات والطلبات للحصول على المواد إلى باريس بيرديكاريس. تشكر مجلة Nature تشي تيان والمراجعين الآخرين المجهولين على مساهمتهم في مراجعة هذه العمل. تقارير مراجعي الأقران متاحة.
معلومات إعادة الطبع والتصاريح متاحة علىhttp://www.nature.com/reprints.
c
أداء القيم المتطرفة على IFS HRES 2022 في
مايكروسوفت للأبحاث، الذكاء الاصطناعي للعلوم، أمستردام، هولندا. سيلوريان AI، كيركلاند، واشنطن، الولايات المتحدة الأمريكية. جامعة أمستردام، أمستردام، هولندا. جامعة كامبريدج، كامبريدج، المملكة المتحدة. جامعة يوهانس كيبلر في لينز، لينز، النمسا. شركة مايكروسوفت، ريدموند، واشنطن، الولايات المتحدة الأمريكية. مايكروسوفت للبحوث، ريدموند، واشنطن، الولايات المتحدة الأمريكية. جامعة تايوان الوطنية، تايبيه، تايوان. معهد آلان تورينج، لندن، المملكة المتحدة. جامعة بنسلفانيا، فيلادلفيا، بنسلفانيا، الولايات المتحدة الأمريكية. ساهم هؤلاء المؤلفون بالتساوي: كريستيان بودنار، ويسل ب. بروينسما، آنا لوتشيتش، ميغان ستانلي، آنا ألين. البريد الإلكتروني: pgp@seas.upenn.edu - المركز الأوروبي للتنبؤات الجوية متوسطة المدى (ECMWF). وثائق IFS CY48R1، المجلد 8.https://doi.org/10.21957/Of36Oba4ca (2023).
- بي، ك. وآخرون. التنبؤ الدقيق بالطقس العالمي على المدى المتوسط باستخدام الشبكات العصبية ثلاثية الأبعاد. ناتشر 619، 533-538 (2023).
- لام، ر. وآخرون. تعلم التنبؤ بالطقس العالمي متوسط المدى بمهارة. ساينس 382، 1416-1421 (2023).
- أبرامسون، ج. وآخرون. التنبؤ الدقيق بالهيكل لتفاعلات الجزيئات الحيوية باستخدام AlphaFold 3. ناتشر 630، 493-500 (2024).
- تقرير تقني عن GPT-4 من OpenAI وآخرون. نسخة مسبقة فيhttps://arxiv.org/abs/2303.08774 (2024).
- روملهارت، د. إ.، هينتون، ج. إ. وويليامز، ر. ج. تعلم التمثيلات من خلال إعادة نشر الأخطاء. الطبيعة 323، 533-536 (1986).
- مرزبان، س. و ستومبف، ج. شبكة عصبية لتوقع الأعاصير استنادًا إلى الخصائص المستمدة من رادار دوبلر. مجلة الأرصاد الجوية والتغير المناخي 35، 617-626 (1996).
- مككان، د. و. توقع قصير المدى للعواصف الرعدية الكبيرة باستخدام الشبكات العصبية. توقعات الطقس. 7، 525-534 (1992).
- كوليغوفسكي، ر. ج. وباروس، أ. ب. تجارب في التنبؤ بهطول الأمطار على المدى القصير باستخدام الشبكات العصبية الاصطناعية. مراجعة الطقس الشهرية 126، 470-482 (1998).
- كوليغوفسكي، ر. ج. وباروس، أ. ب. توقعات هطول الأمطار المحلية من نموذج التنبؤ بالطقس العددي باستخدام الشبكات العصبية الاصطناعية. توقعات الطقس. 13، 1194-1204 (1998).
DOI: https://doi.org/10.1038/s41586-025-09005-y
PMID: https://pubmed.ncbi.nlm.nih.gov/40399684
Publication Date: 2025-05-21
A foundation model for the Earth system
Received: 28 May 2024
Accepted: 9 April 2025
Published online: 21 May 2025
Open access
Check for updates
Abstract
Reliable forecasting of the Earth system is essential for mitigating natural disasters and supporting human progress. Traditional numerical models, although powerful, are extremely computationally expensive
medium-range weather forecasting at
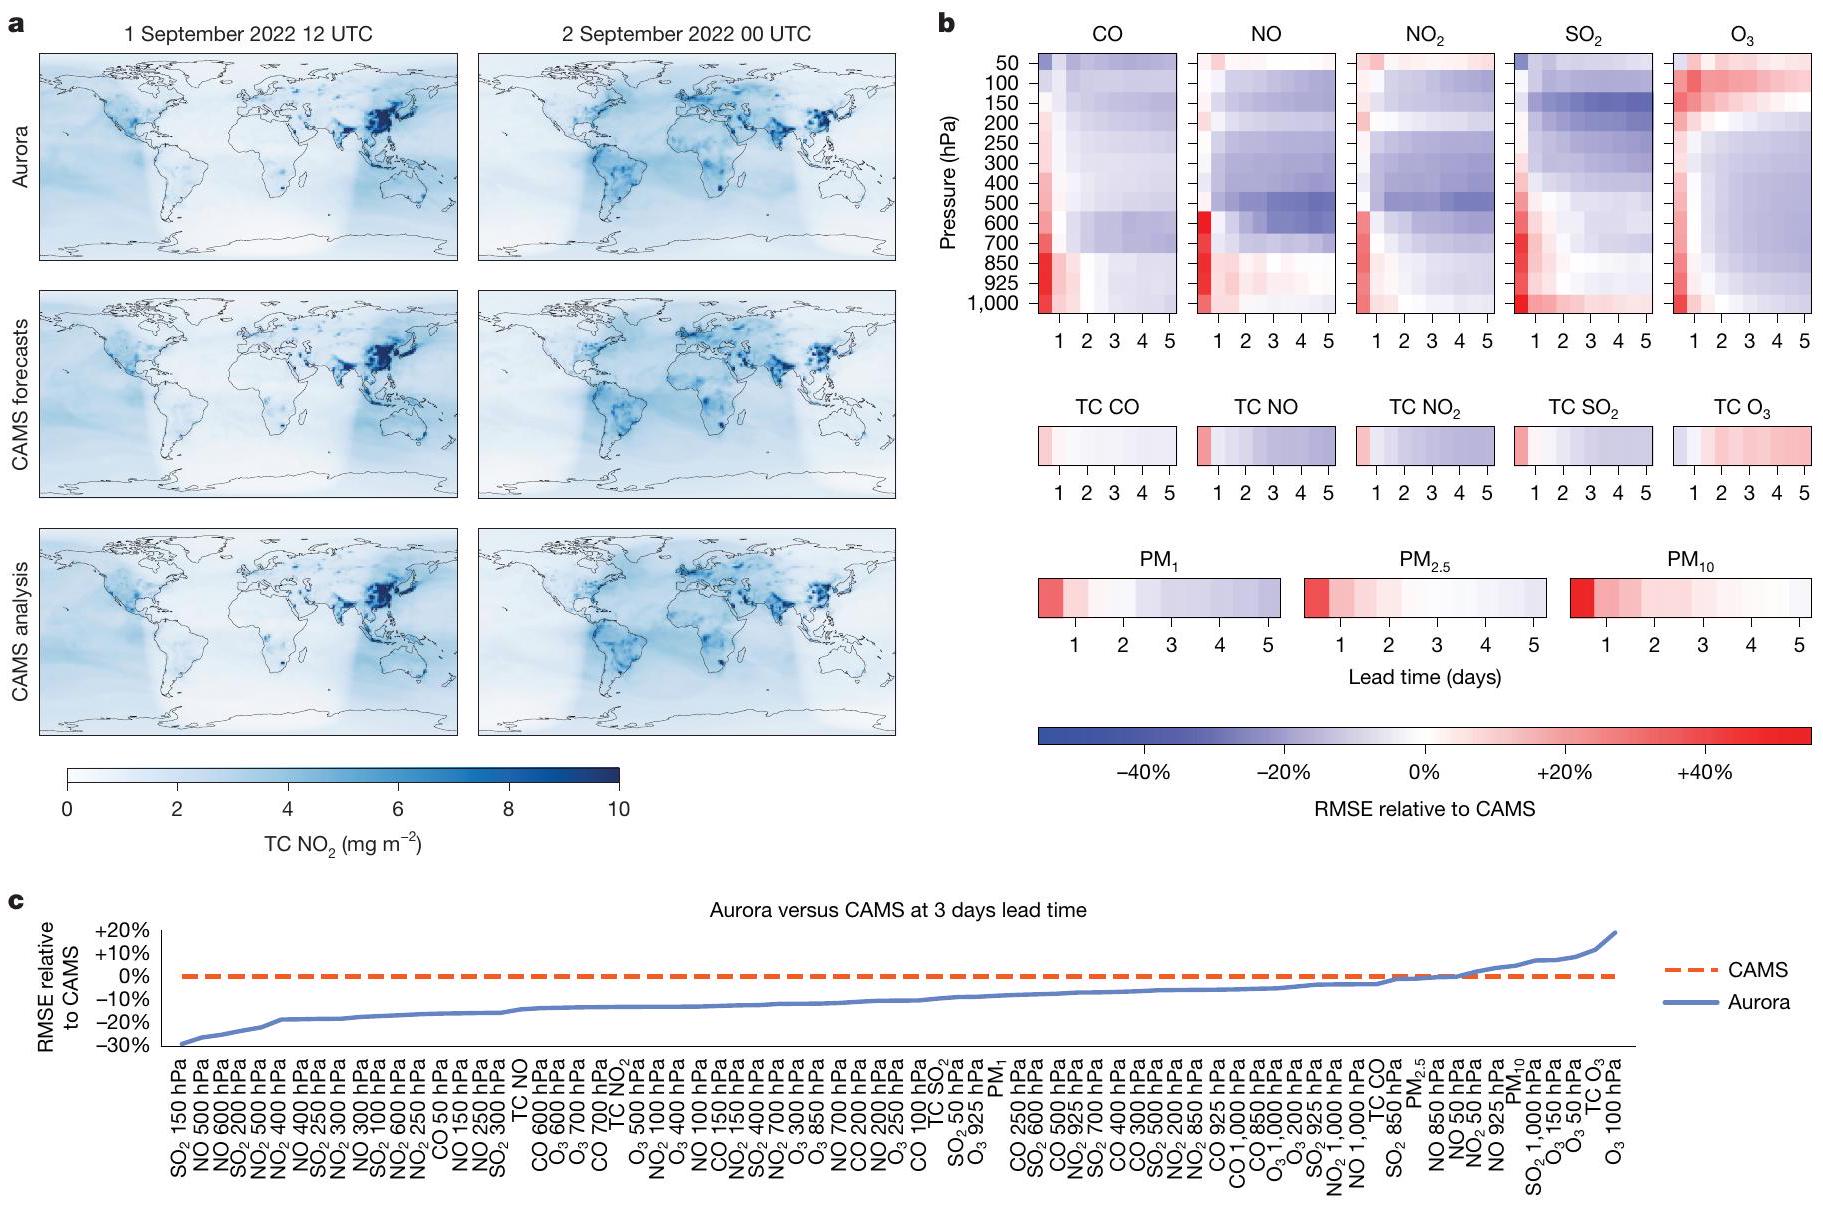
- 5-day global air pollution forecasts at
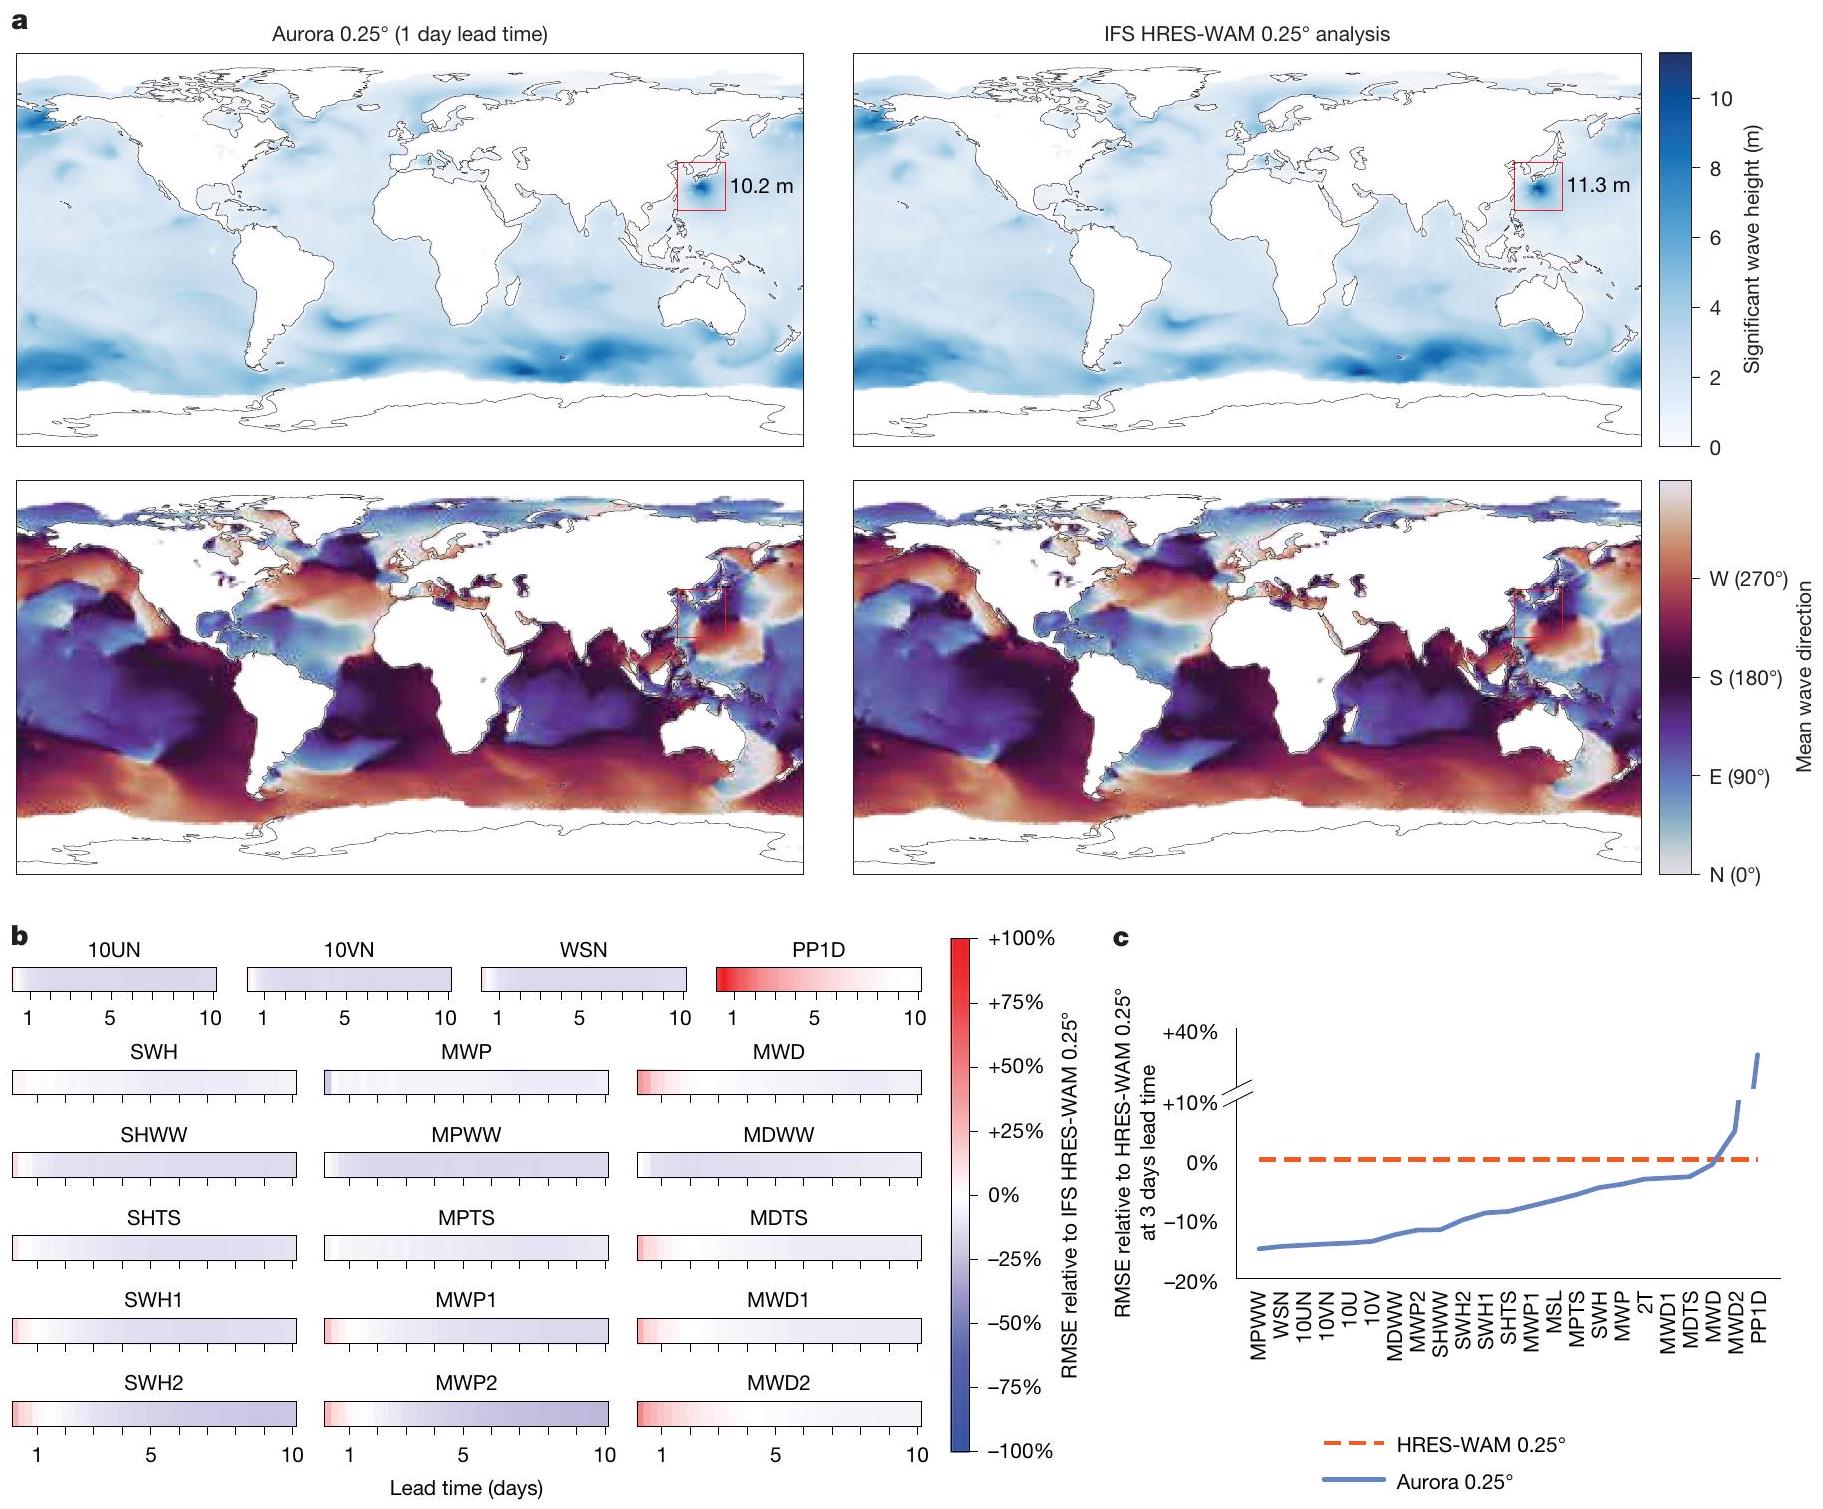
resolution, outperforming resource-intensive numerical atmospheric chemistry simulations on 74% of targets; - 10-day global ocean wave forecasts at
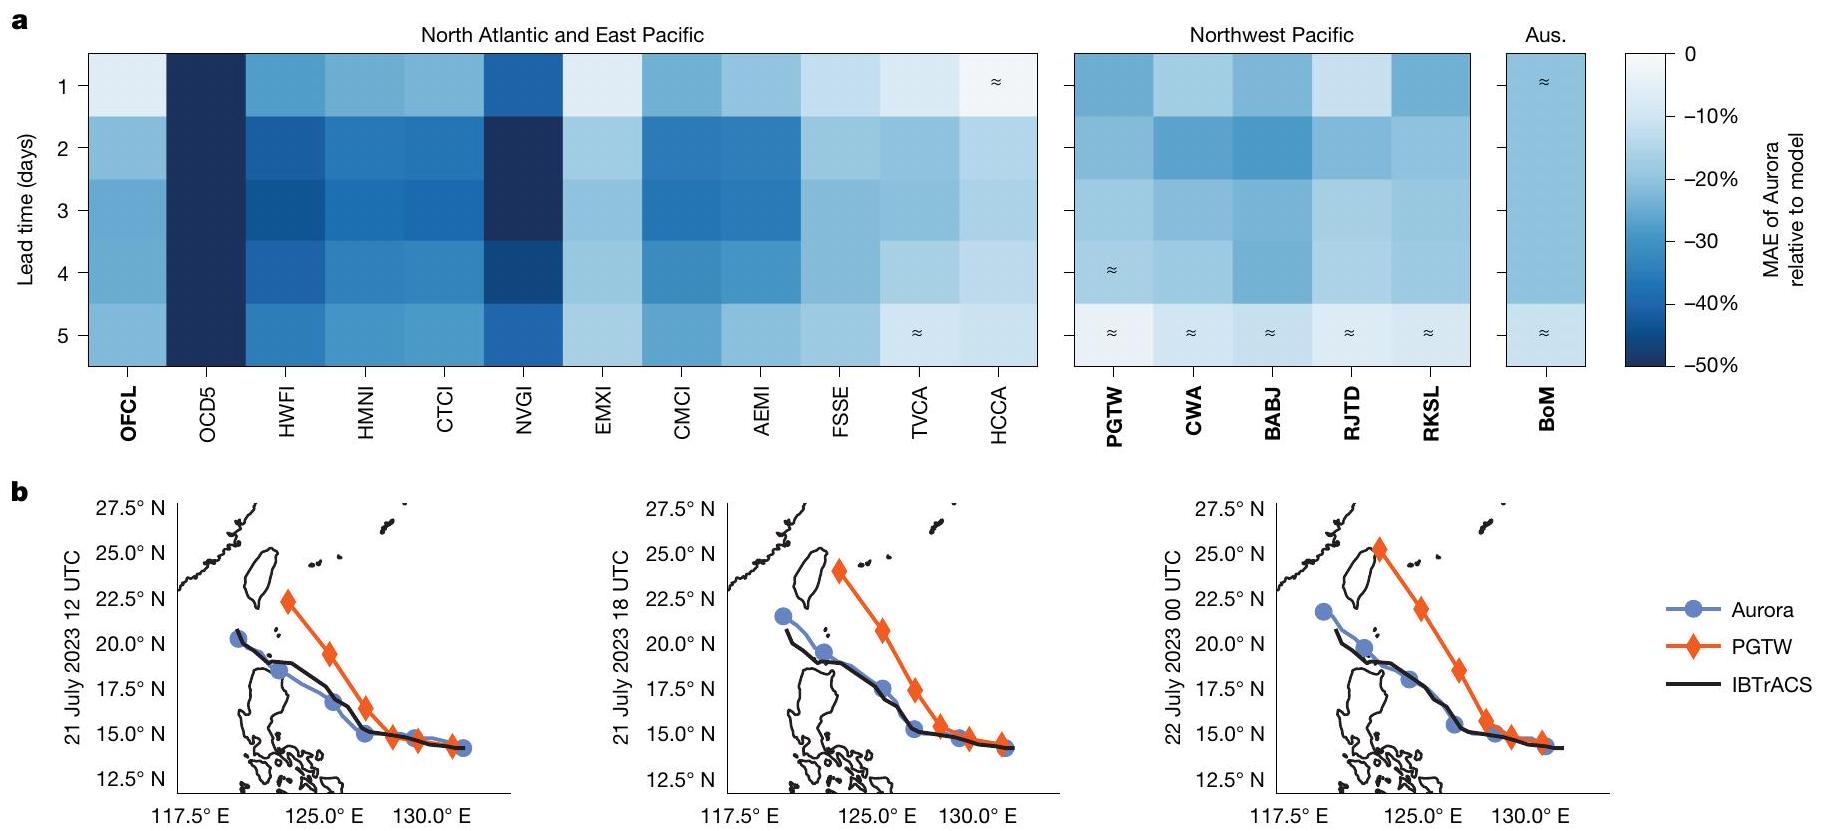
resolution, exceeding costly numerical models on of targets; - 5-day tropical cyclone track forecasts, outperforming seven operational forecasting centres on 100% of targets;
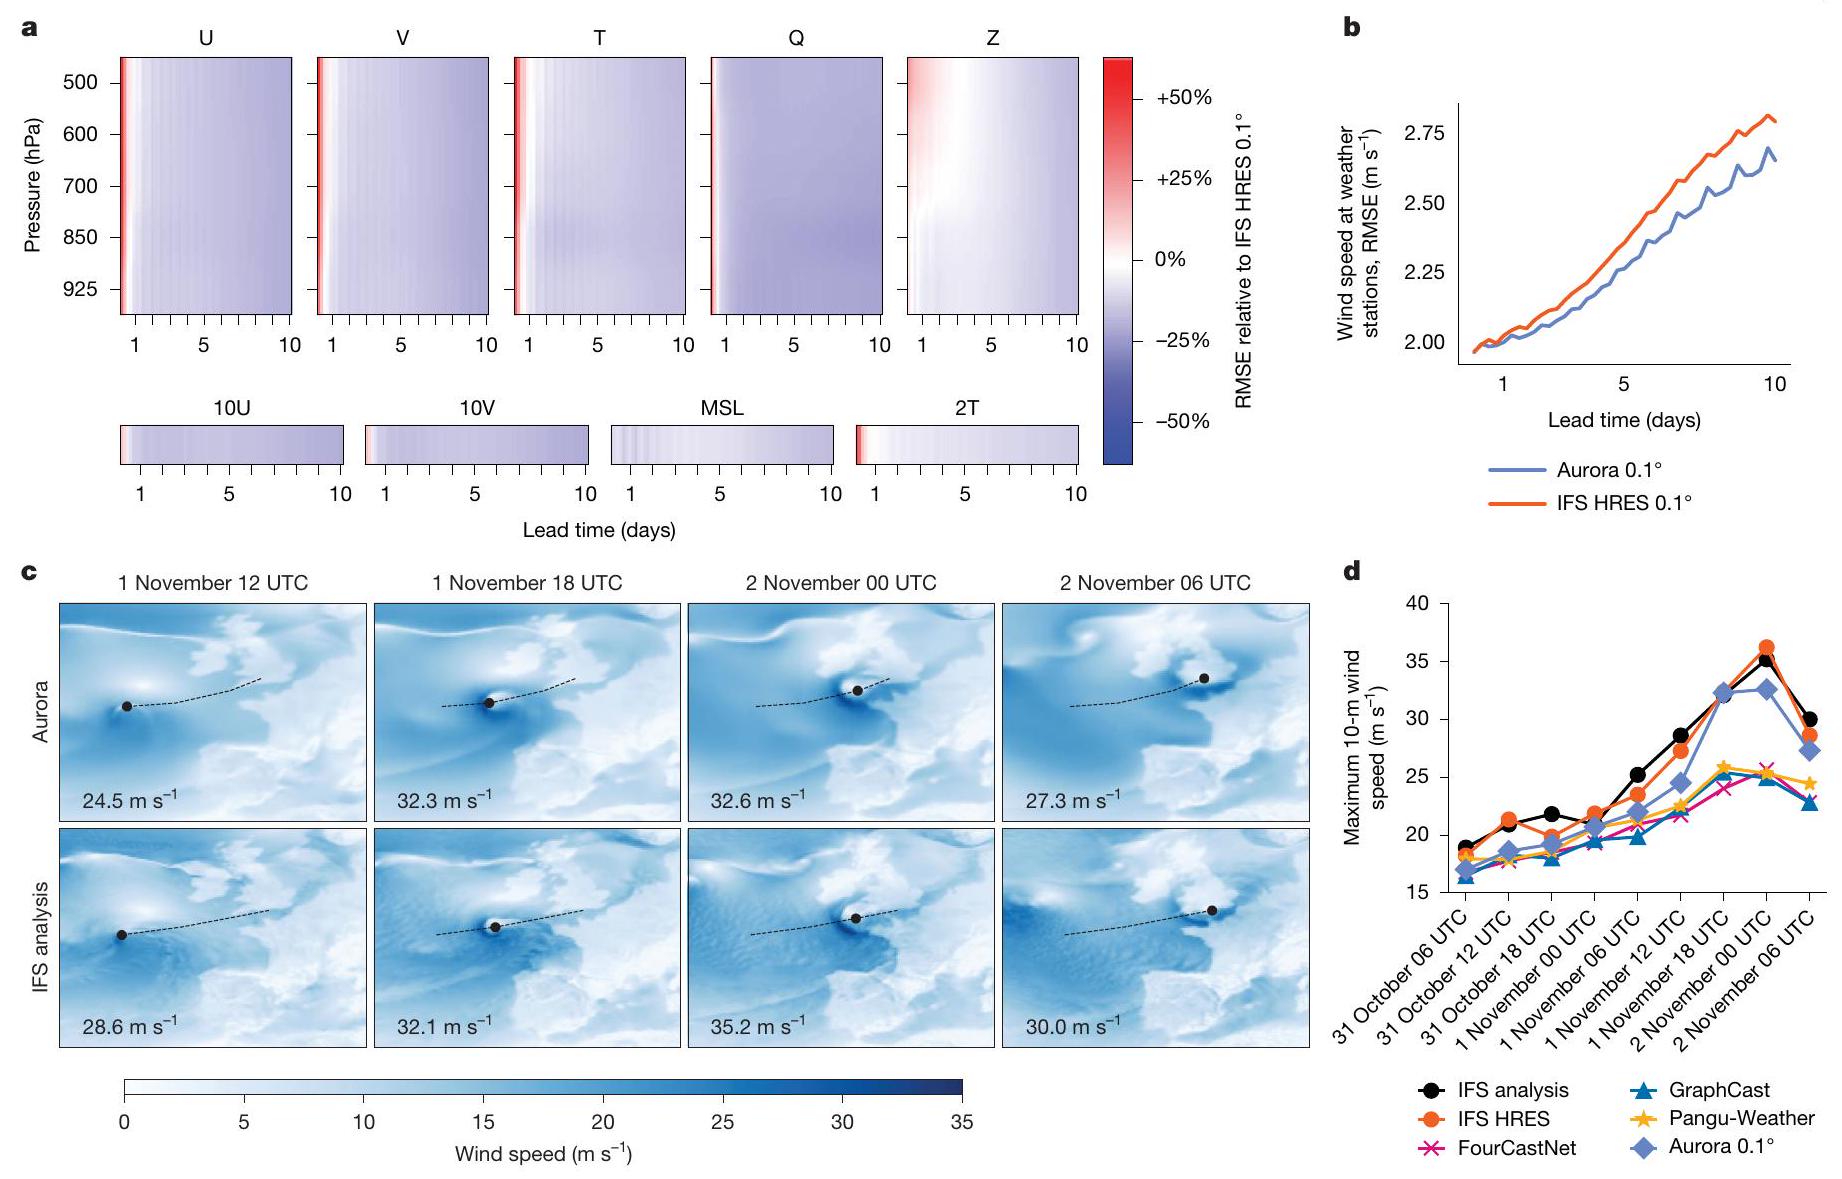
- 10-day global weather forecasts at
resolution, surpassing state-of-the-art numerical models on of targets while also improving performance on extreme events.
Aurora: an Earth system foundation model
quality at
the European Centre for Medium-Range Weather Forecasts (ECMWF)
Atmospheric chemistry and air pollution
background levels of
(see Fig. 121 in Supplementary Information Section I.1), one of a series that led to more than 5,000 hospitalizations in the Middle East
Ocean wave dynamics
that the new variables can be undefined at arbitrary and variable spatial locations. Moreover, data for the variables that we consider in this experiment are only available back to 2016, a short record for such a complex task.
and HRES TO are regridded to
Aurora is competitive with HRES-WAM (within 20% RMSE) on 96% of all targets and matches or outperforms HRES-WAM on
contains zero (see Supplementary Information Section I.3.4 for details). On average, Aurora is
Tropical cyclone tracking
machine learning models
High-resolution weather forecasting
and therefore trace the path of the storm. The maximum
so-called zero-hour forecast, referred to as HRES TO, instead of IFS HRES analysis.
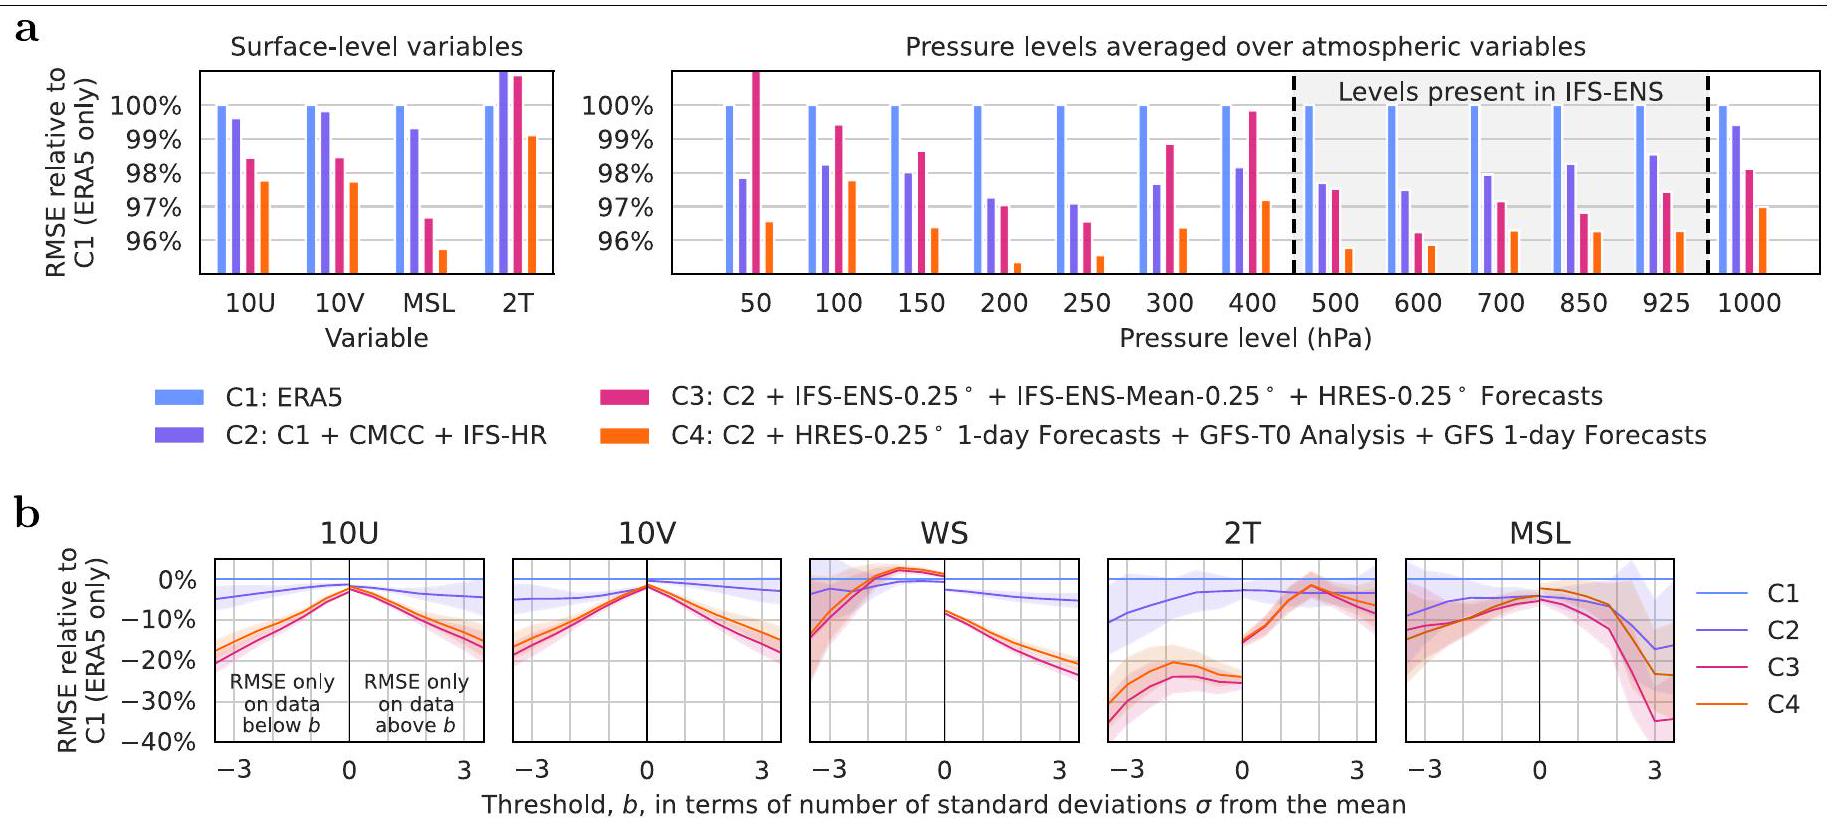
Aurora achieves lower RMSE than IFS HRES on 92% of target variables, pressure levels and lead times (Fig. 5a). The performance gains are most pronounced at lead times of more than 12 h into the future, for which we observe a reduction in RMSE of up to
Discussion
Online content
12. Deo, M. & Naidu, C. S. Real time wave forecasting using neural networks. Ocean Eng. 26, 191-203 (1998).
13. Tangang, F., Hsieh, W. & Tang, B. Forecasting the equatorial pacific sea surface temperatures by neural network models. Clim. Dyn. 13, 135-147 (1997).
14. Hsieh, W. W. & Tang, B. Applying neural network models to prediction and data analysis in meteorology and oceanography. Bull. Am. Meteorol. Soc. 79, 1855-1870 (1998).
15. Kolehmainen, M., Martikainen, H., Hiltunen, T. & Ruuskanen, J. Forecasting air quality parameters using hybrid neural network modelling. Environ. Monit. Assess. 65, 277-286 (2000).
16. Chen, L. et al. FuXi: a cascade machine learning forecasting system for 15-day global weather forecast. npj Clim. Atmos. Sci. 6, 190 (2023).
17. Han, T. et al. FengWu-GHR: learning the kilometer-scale medium-range global weather forecasting. Preprint at https://arxiv.org/abs/2402.00059 (2024).
18. Chen, K. et al. FengWu: pushing the skillful global medium-range weather forecast beyond 10 days lead. Preprint at https://arxiv.org/abs/2304.02948 (2023).
19. Liu, Z. et al. Swin Transformer: hierarchical vision transformer using shifted windows. In Proc. IEEE/CVF International Conference on Computer Vision (ICCV) 10012-10022 (IEEE, 2021).
20. Dosovitskiy, A. et al. An image is worth
21. Jaegle, A. et al. Perceiver: general perception with iterative attention. In Proc. 38th International Conference on Machine Learning (eds Meila, M. & Zhang, T.) 4651-4664, https://proceedings.mlr.press/v139/jaegle21a.html (PMLR, 2021).
22. Jaegle, A. et al. Perceiver IO: a general architecture for structured inputs & outputs. In International Conference on Learning Representations, https://openreview.net/ forum?id=fILj7Wpl-g (Curran Associates, 2022).
23. World Health Organization (WHO). WHO global air quality guidelines: particulate matter (
24. Brasseur, G. P. & Jacob, D. J. Modeling of Atmospheric Chemistry (Cambridge Univ. Press, 2017).
25. European Centre for Medium-Range Weather Forecasts (ECMWF). IFS Documentation CY48R1 – Part VIII: Atmospheric Composition. https://doi.org/10.21957/749dc09059 (2023).
26. U.S. Environmental Protection Agency. Technical assistance document for the reporting of daily air quality – the air quality index (AQI). Technical report, https:// document.airnow.gov/technical-assistance-document-for-the-reporting-of-daily-airquailty.pdf (2024).
27. Inness, A. et al. The CAMS reanalysis of atmospheric composition. Atmos. Chem. Phys. 19, 3515-3556 (2019).
28. Buizza, R. et al. The development and evaluation process followed at ECMWF to upgrade the integrated forecasting system (IFS). Technical Report 829, https://doi.org/10.21957/ xzopnhty9 (2018).
29. Francis, D. et al. On the Middle East’s severe dust storms in spring 2022: triggers and impacts. Atmos. Environ. 296, 119539 (2023).
30. European Centre for Medium-Range Weather Forecasts (ECMWF). Ocean Wave Model high resolution 15-day forecast (Set II – HRES-WAM). https://www.ecmwf.int/en/forecasts/ datasets/set-ii (2024).
31. European Centre for Medium-Range Weather Forecasts (ECMWF). IFS DOCUMENTATION Cy43r3 operational implementation 11 July 2017. PART VII: ECMWF WAVE MODEL. https:// www.ecmwf.int/sites/default/files/elibrary/2017/17739-part-vii-ecmwf-wave-model.pdf (2017).
32. Malardel, S. et al. A new grid for the IFS. ECMWF Newsl. 146, 23-28 (2016).
33. Gordon, J. et al. Convolutional conditional neural processes. In International Conference on Learning Representations, https://openreview.net/forum?id=Skey4eBYPS (Curran Associates, 2020).
34. World Meteorological Organization (WMO). Tropical cyclone. https://wmo.int/topics/ tropical-cyclone (2024).
35. National Hurricane Center (NHC). NHC track and intensity models. https://www.nhc. noaa.gov/modelsummary.shtml (2019).
36. Boussioux, L., Zeng, C., Guénais, T. & Bertsimas, D. Hurricane forecasting: a novel multimodal machine learning framework. Weather Forecast. 37, 817-831 (2022).
37. Huang, C., Bai, C., Chan, S. & Zhang, J. MMSTN: a multi-modal spatial-temporal network for tropical cyclone short-term prediction. Geophys. Res. Lett. 49, e2021GL096898 (2022).
38. Kurth, T. et al. FourCastNet: accelerating global high-resolution weather forecasting using adaptive Fourier neural operators. In Proc. Platform for Advanced Scientific Computing Conference, article no. 13 (Association for Computing Machinery, 2023).
39. DeMaria, M. et al. Evaluation of tropical cyclone track and intensity forecasts from Artificial Intelligence Weather Prediction (AIWP) models. Preprint at https://arxiv.org/ abs/2409.06735 (2024).
40. Gahtan, J. et al. International Best Track Archive for Climate Stewardship (IBTrACS) project, version 4rO1. NOAA National Centers for Environmental Information, https://doi. org/10.25921/82ty-9e16 (2024).
41. Knapp, K. R., Kruk, M. C., Levinson, D. H., Diamond, H. J. & Neumann, C. J. The International Best Track Archive for Climate Stewardship (IBTrACS): unifying tropical cyclone data. Bull. Am. Meteorol. Soc. 91, 363-376 (2010).
42. National Hurricane Center (NHC). National Hurricane Center forecast verification report. 2022 hurricane season. NOAA technical report, https://www.nhc.noaa.gov/verification/ pdfs/Verification_2022.pdf (2022).
43. National Hurricane Center (NHC). National Hurricane Center forecast verification report. 2023 hurricane season. NOAA technical report, https://www.nhc.noaa.gov/verification/ pdfs/Verification_2023.pdf (2023).
44. Bonev, B. et al. Spherical Fourier neural operators: learning stable dynamics on the sphere. In Proc. 40th International Conference on Machine Learning (eds Krause, A. et al.) 2806-2823, https://proceedings.mlr.press/v202/bonev23a.html (PMLR, 2023).
45. Ben Bouallègue, Z. et al. The rise of data-driven weather forecasting: a first statistical assessment of machine learning-based weather forecasts in an operational-like context. Bull. Am. Meteorol. Soc. 105, E864-E883 (2024).
46. Jin, W. et al. WeatherReal: a benchmark based on in-situ observations for evaluating weather models. Preprint at https://arxiv.org/abs/2409.09371 (2024).
47. UK Met Office. Storm Ciarán, 1 to 2 November 2023. https://www.metoffice.gov.uk/ binaries/content/assets/metofficegovuk/pdf/weather/learn-about/uk-past-events/ interesting/2023/2023_09_storm_ciaran_2.pdf (2023).
48. Charlton-Perez, A. J. et al. Do Al models produce better weather forecasts than physicsbased models? A quantitative evaluation case study of Storm Ciarán. npj Clim. Atmos. Sci. 7, 93 (2024).
49. Allen, A. et al. Aardvark weather: end-to-end data-driven weather forecasting. Nature https://doi.org/10.1038/s41586-025-08897-0 (2025).
(c) The Author(s) 2025
Methods
Problem statement
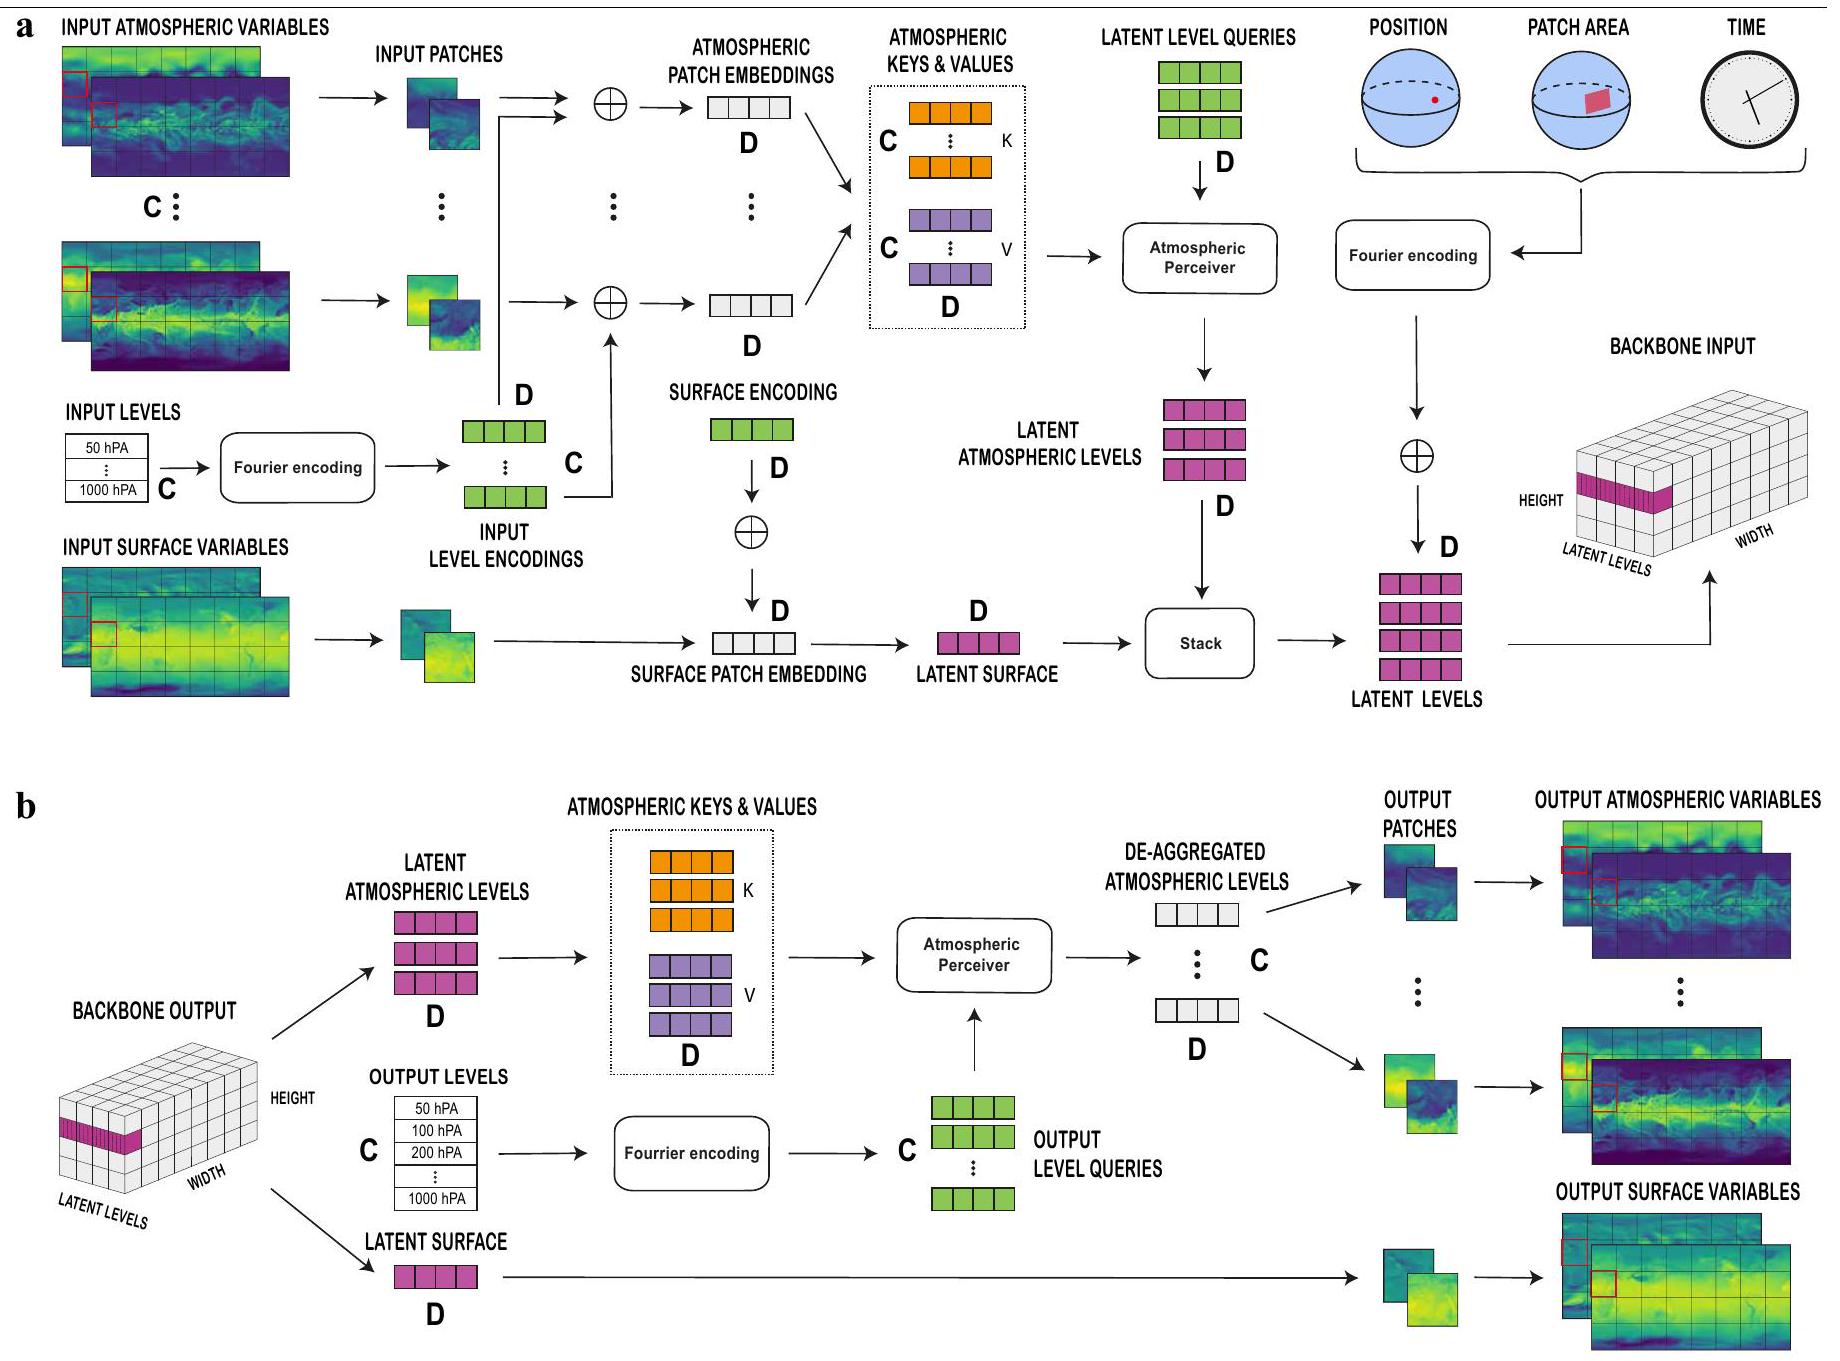
The Aurora model
every other layer to propagate information between neighbouring regions while accounting for Earth’s spherical topology; res-post-norm layer normalization
Training methods
Datasets
Task-specific adaptations
Data infrastructure
data batches. The streams are combined, shuffled and sharded across GPUs. After sharding, finally the common interface of BatchGenerator is used to do the work needed to download and construct batches for training and inference.
This pipeline enables efficient training on several heterogeneous datasets by batching only samples from the same dataset together and automatically balances workloads across GPUs by using different batch sizes for different datasets. This design offers flexibility needed to experiment with the Aurora model architecture while efficiently handling the challenges of large-scale, heterogeneous weather data processing. For a detailed description of the data loading pipeline, including the BatchGenerator object structure and the unpacking process, see Supplementary Information Section E.
Verification metrics
To assess performance on extreme weather events, we use a thresholded RMSE. The thresholded RMSE uses a threshold to determine which latitude-longitude grid points should be included in the calculation, allowing for evaluation of model performance across different intensity levels of weather phenomena. The thresholds are defined using the mean and standard deviation of the ERA5 reanalysis data over all training years computed separately for each latitude-longitude point. We vary these thresholds linearly for both positive and negative values to obtain RMSE curves for different intensity levels.
Further details
Data availability
Code availability
50. Liu, Z. et al. Swin Transformer v2: scaling up capacity and resolution. In Proc. IEEE/CVF Conference on Computer Vision and Pattern Recognition (CVPR) 12009-12019 (IEEE, 2022).
51. Loshchilov, I. & Hutter, F. Decoupled weight decay regularization. In International Conference on Learning Representations, https://openreview.net/forum?id=Bkg6RiCqY7 (Curran Associates, 2019).
52. Larsson, G., Maire, M. & Shakhnarovich, G. FractalNet: ultra-deep neural networks without residuals. In International Conference on Learning Representations, https://openreview. net/forum?id=S1VaB4cex (Curran Associates, 2017).
53. Hu, E. J. et al. LoRA: low-rank adaptation of large language models. In International Conference on Learning Representations, https://openreview.net/forum?id=nZeVKeeFYf9 (Curran Associates, 2022).
54. Brandstetter, J., Worrall, D. E. & Welling, M. Message passing neural PDE solvers. In International Conference on Learning Representations, https://openreview.net/ forum?id=vSix3HPYKSU (Curran Associates, 2022).
55. Lin, L.-J. Reinforcement Learning for Robots Using Neural Networks. PhD thesis, Carnegie Mellon Univ. (1993).
56. Mnih, V. et al. Human-level control through deep reinforcement learning. Nature 518, 529-533 (2015).
57. Sampson, C. R. & Schrader, A. J. The automated tropical cyclone forecasting system (version 3.2). Bull. Am. Meteorol. Soc. 81, 1231-1240 (2000).
58. Gilmer, J., Schoenholz, S. S., Riley, P. F., Vinyals, O. & Dahl, G. E. Neural message passing for quantum chemistry. In Proc. 34th International Conference on Machine Learning (eds Precup, D. & Teh, Y. W.) 1263-1272 (PMLR, 2017).
59. Beyer, L. et al. FlexiViT: one model for all patch sizes. In Proc. IEEE/CVF Conference on Computer Vision and Pattern Recognition (CVPR) 14496-14506 (IEEE, 2023).
60. Rasp, S. et al. WeatherBench 2: a benchmark for the next generation of data-driven global weather models. J. Adv. Model. Earth Syst. 16, e2023MS004019 (2024).
61. Hersbach, H. et al. ERA5 hourly data on single levels from 1940 to present. Copernicus Climate Change Service (C3S) Climate Data Store (CDS), https://cds.climate.copernicus. eu/cdsapp#!/dataset/reanalysis-era5-single-levels?tab=overview (2018).
62. Hersbach, H. et al. ERA5 hourly data on pressure levels from 1940 to present. Copernicus Climate Change Service (C3S) Climate Data Store (CDS), https://cds.climate.copernicus. eu/cdsapp#!/dataset/reanalysis-era5-pressure-levels?tab=overview (2018).
63. European Centre for Medium-Range Weather Forecasts (ECMWF). Section 2.1.2.4 HRES High Resolution Forecasts. https://www.ecmwf.int/en/forecasts/datasets/set-i (2024).
64. European Centre for Medium-Range Weather Forecasts (ECMWF). Section 5 Forecast Ensemble (ENS) – Rationale and Construction. https://confluence.ecmwf.int/display/FUG/ Section+5+Forecast+Ensemble+%28ENS%29+-+Rationale+and+Construction (2024).
65. National Oceanic and Atmospheric Administration (NOAA). NOAA Global Forecast System (GFS). https://registry.opendata.aws/noaa-gfs-bdp-pds (2024).
66. National Oceanic and Atmospheric Administration (NOAA). NOAA Global Ensemble Forecast System (GEFS). https://registry.opendata.aws/noaa-gefs (2024).
67. Scoccimarro, E., Bellucci, A. & Peano, D. CMCC CMCC-CM2-VHR4 model output prepared for CMIP6 HighResMIP hist-1950. Earth System Grid Federation, https://doi.org/ 10.22033/ESGF/CMIP6.3818 (2018).
68. European Centre for Medium-Range Weather Forecasts (ECMWF). PRIMAVERA: European Centre for Medium-Range Weather Forecasts (ECMWF) ECMWF-IFS-HR model output for the “hist-1950” experiment. NERC EDS Centre for Environmental Data Analysis, https:// catalogue.ceda.ac.uk/uuid/470e43e166c44e5990f4f74bc90562d6 (2022).
69. Global Modeling and Assimilation Office (GMAO). MERRA-2: 2d, 1-hourly, time-averaged, single-level, assimilation, single-level diagnostics V5.12.4. Goddard Earth Sciences Data and Information Services Center (GES DISC), https://disc.gsfc.nasa.gov/information/ mission-project?title=MERRA-2 (2022).
70. European Centre for Medium-Range Weather Forecasts (ECMWF). CAMS: global atmospheric composition forecast data documentation. https://confluence.ecmwf. int/display/CKB/CAMS%3A+Global+atmospheric+composition+forecast+data+ documentation (2024).
71. Lang, S. et al. AIFS – ECMWF’s data-driven forecasting system. Preprint at https://arxiv.org/ abs/2406.01465 (2024).
72. Dehghani, M. et al. Patch
73. Rasp, S. et al. WeatherBench: a benchmark data set for data-driven weather forecasting. J. Adv. Model. Earth Syst. 12, e2020MS002203 (2020).
74. Hoffmann, J. et al. Training compute-optimal large language models. In Proc. 36th International Conference on Neural Information Processing Systems (eds Koyejo, S. et al.) 30016-30030 (Curran Associates, 2024).
75. Gunasekar, S. et al. Textbooks are all you need. In International Conference on Learning Representations, https://openreview.net/forum?id=Fq8tKtjACC (Curran Associates, 2024).
76. Inness, A. et al. CAMS global reanalysis (EAC4). Copernicus Atmosphere Monitoring Service (CAMS) Atmosphere Data Store (ADS), https://ads.atmosphere.copernicus.eu/ cdsapp#!/dataset/cams-global-reanalysis-eac4?tab=overview (2024).
77. Hunter, J. D. Matplotlib: a 2D graphics environment. Comput. Sci. Eng. 9, 90-95 (2007).
78. UK Met Office. Cartopy: a cartographic Python library with a Matplotlib interface. https://scitools.org.uk/cartopy (2010-2015).
79. Bodnar, C. et al. microsoft/aurora: v1.5.1. Zenodo https://doi.org/10.5281/zenodo.14983584 (2025).
80. Nguyen, T., Brandstetter, J., Kapoor, A., Gupta, J. K. & Grover, A. ClimaX: a foundation model for weather and climate. In Proc. 40th International Conference on Machine Learning (eds Krause, A. et al.) 25904-25938, https://proceedings.mlr.press/v202/ nguyen23a.html (PMLR, 2023).
81. Kaplan, J. et al. Scaling laws for neural language models. Preprint at https://arxiv.org/ abs/2001.08361 (2020)
Additional information
Correspondence and requests for materials should be addressed to Paris Perdikaris. Peer review information Nature thanks Qi Tian and the other, anonymous, reviewer(s) for their contribution to the peer review of this work. Peer reviewer reports are available.
Reprints and permissions information is available at http://www.nature.com/reprints.
c
a, performance for extreme values on IFS HRES 2022 at
Microsoft Research, AI for Science, Amsterdam, The Netherlands. Silurian AI, Kirkland, WA, USA. University of Amsterdam, Amsterdam, The Netherlands. University of Cambridge, Cambridge, UK. Johannes Kepler University Linz, Linz, Austria. Microsoft Corporation, Redmond, WA, USA. Microsoft Research, Redmond, WA, USA. National Taiwan University, Taipei, Taiwan. Alan Turing Institute, London, UK. University of Pennsylvania, Philadelphia, PA, USA. These authors contributed equally: Cristian Bodnar, Wessel P. Bruinsma, Ana Lucic, Megan Stanley, Anna Allen. e-mail: pgp@seas.upenn.edu - European Centre for Medium-Range Weather Forecasts (ECMWF). IFS Documentation CY48R1, Vol. 8. https://doi.org/10.21957/Of36Oba4ca (2023).
- Bi, K. et al. Accurate medium-range global weather forecasting with 3D neural networks. Nature 619, 533-538 (2023).
- Lam, R. et al. Learning skillful medium-range global weather forecasting. Science 382, 1416-1421 (2023).
- Abramson, J. et al. Accurate structure prediction of biomolecular interactions with AlphaFold 3. Nature 630, 493-500 (2024).
- OpenAI et al. GPT-4 technical report. Preprint at https://arxiv.org/abs/2303.08774 (2024).
- Rumelhart, D. E., Hinton, G. E. & Williams, R. J. Learning representations by back-propagating errors. Nature 323, 533-536 (1986).
- Marzban, C. & Stumpf, G. J. A neural network for tornado prediction based on Doppler radar-derived attributes. J. Appl. Meteorol. Climatol. 35, 617-626 (1996).
- McCann, D. W. A neural network short-term forecast of significant thunderstorms. Weather Forecast. 7, 525-534 (1992).
- Kuligowski, R. J. & Barros, A. P. Experiments in short-term precipitation forecasting using artificial neural networks. Mon. Weather Rev. 126, 470-482 (1998).
- Kuligowski, R. J. & Barros, A. P. Localized precipitation forecasts from a numerical weather prediction model using artificial neural networks. Weather Forecast. 13, 1194-1204 (1998).