لقد ظهرت مؤخرًا عملية تخليق اليوريا الكهروكيميائية كخيار بديل مثير وموفر للطاقة، بينما لا يزال من الصعب تحقيق معدل إنتاج مرتفع وكفاءة فاراداي في الوقت نفسه. هنا، نحقق مسار اقتران كيميائي كهربائي موفر للطاقة من خلال CO2 وNO3.تقليل النواة عند واجهات التداخل لـالميكروجزئيات، الناتجة عن الهندسة الكهروكيميائية في الموقع على الكتلةنحقق معدل إنتاج اليوريا بـمع كفاءة فارادائية مقابلة لـعند -0.3 فولت (مقابل RHE) تحت ظروف بيئية. تكشف الأشعة السينية المتزامنة – مطيافية تحويل فورييه للأشعة تحت الحمراء، جنبًا إلى جنب مع الحسابات النظرية، عن اقتران الوسائط. و في واجهات الهترو، مستفيدًا من الهيكل الإلكتروني المعدل. يوفر هذا العمل طريقًا عمليًا لتصميم المحفزات ورؤى حول أنظمة تخليق اليوريا الكهربائي.
يورياكأحد أهم الأسمدة النيتروجينية، لا يعمل فقط كمنتج زراعي لتلبية احتياجات السكان المتزايدين، بل أيضًا كمادة خام كيميائية صناعية لصناعة مواد كيميائية متنوعة.تقليديًا، يتم إجراء تخليق اليوريا من خلال عمليات هابر-بوش وبوش-مايسر التي تحتوي على خطوتين تفاعليتين متتاليتين.، التي تتطلب ظروفًا قاسية ( ) بأكثر من استهلاك الطاقة العالمي. بالمقارنة مع النهج التقليدي، فإن الطريقة الكهروكيميائيةنهج الاقتران باستخدامومصادر النيتروجين المتاحة و ) في الحياة اليومية هو قرار “قتل عصفورين بحجر واحد” لإنتاج اليوريا يتميز باستدامة المواد المتفاعلة وكفاءة الطاقة العامة، حيث تم تحقيق بعض التقدم الرائد.مؤخراً جداً، أبلغ وانغ وآخرون عن استراتيجية تخليق اليوريا باستخدام و كمواد متفاعلة مع معدل إنتاج وكفاءة فاراداي (FE) لـ استخدام جزيئات نانوية من PdCu مثبتة علىأغشية نانويةعلاوة على ذلك، أفاد زانغ وآخرون بوجود نانوصفائح مسامية غنية بالفراغات من ZnO التي تحقق التخليق الكهربائي لليوريا منومع FEs أعلىعلى الرغم من هذه الاختراقات الملهمة، لا يزال التحدي الكبير هو تحقيق “عالي شامل” (معدل إنتاج عالي لليوريا، كفاءة، انتقائية واستقرار) في تخليق اليوريا الكهربائي بسبب القيود على المحفزات الكهربائية المثاليةالأهم من ذلك، هو تطوير شيء فريدلا يزال مسار الاقتران في مرحلة الطفولة، حيث يجب تكريس الكثير من الجهود من أجل توفير بروتوكولات لتصميم المحفزات، بهدف تحقيق تخليق اليوريا بكفاءة وبتكلفة فعالة.
تم تطوير المواد القائمة على النحاس كعائلة من المحفزات لـلإنتاج منتجات متعددة الكربون عند التحكم في المواقع النشطة الحقيقية لتقارب الكربون-كربون. في الآونة الأخيرة، أظهرت بعض الأعمال الرائدة إمكانية تفعيل قدرة الاقتران لمحفزات قائمة على النحاس في تخليق اليوريا الكهربائي من خلال هندسة هيكلها الإلكترونيعلى سبيل المثال، أفاد وانغ وآخرون أن ذرات النحاس الفردية يمكن استخدامها في تخليق اليوريا الكهروكيميائي عند اقتران و المتوسطات، تحقيق معدل عائد قدرهعند -1.6 فولت مع الكفاءة فاراداي. بعد ذلك، كشف بان وآخرون أن بناء يمكن أن يعزز المحفز ثنائي الذرة بشكل فعال معدل الإنتاج إلىمع كفاءة فاراداي أعلى منعلى تميّزمسار الاقتران. هذه النتائج حفزت الالتزام المستمر لاستكشاف المزيد من الكفاءةمسار الاقتران من خلال هندسة محفزات قائمة على النحاس من أجل دفع حدود معدل العائد وكفاءة التحويل في تخليق اليوريا. تشمل القضايا الرئيسية في المرحلة الحالية: (ط) استكشاف
استراتيجية قابلة للتوسع وفعالة من حيث التكلفة للتلاعب بالمواقع النشطة في المحفزات القائمة على الكوبالت لتفعيل خصائص فريدة ولكنها مواتية للطاقة.مسار الاقتران؛ (ii) التحقيق المنهجي ولكنه متعمق في الآلية التحفيزية الأساسية من أجل إنشاء بروتوكول للتطوير المستقبلي؛ (iii) عرض إثبات المفهوم للجدوى في تخليق اليوريا في نظام ذو قطبين.
هنا، اكتشفنا شيئًا فريدًامسار الاقتران لـ و المت intermediates لتخليق اليوريا تم تحقيقها من خلال بناءالواجهات غير المتجانسة من خلال الاختزال الكهروكيميائي في الموقع للكتلحيث الأداء الكهربائي الكيميائي الشامل العالي، أي معدل إنتاج متوسط من عند -0.3 فولت (مقابل RHE)، بالإضافة إلى كفاءة عالية لـ اختيارية النيتروجين-الانتقائية) وانتقائية الكربون (-اختيارية. من خلال استخدام إشعاع السنكروترون operando – مطيافية تحويل فورييه للأشعة تحت الحمراء (SR-FTIR) ومطيافية رامان في الموقع، كشفنا عن تكوين روابط كيميائية من نوع C-N ووضحنا التغيرات الديناميكية للأنواع الوسيطة من الكربون والنيتروجين خلال سلسلة الاقتران الكهروكيميائي لتخليق اليوريا. على وجه التحديد، يُقترح أن الـ h- كان النواب فعالين في تشكيل وسائط NOH*، مما أدى إلى كمية كبيرة من و الوسطاء فيواجهة غير متجانسة، التي تعمل أيضًا كـربط المواقع النشطة، مما يؤدي إلى انخفاض حاجز الطاقة لتكوين اليوريا. تظهر حسابات نظرية الكثافة الوظيفية (DFT) أن نقل الإلكترون عندالواجهات غير المتجانسة لا تنتج فقط طاقات ربط خالية من الحرارة أكثر حيادية ) ولكنها تشكل أيضًا فريدة المواقع النشطة، مقارنة بالنحاس النقي أوكنموذج لإثبات الجدوى، يمكن لنظام الأقطاب الكهربائية الثنائية المرتبط بتفاعل أكسدة الهيدرازين (HzOR) تحسين التيار الكلي حتى مرات (من 5 إلى مما يؤدي إلى زيادة إنتاج اليوريا الكاثودية حتى.
النتائج والمناقشة
في المقام الأول، قمنا بإعداد h-النواب عبر الاختزال الكهروكيميائي للمواد التجارية السائبةجزيئات بأحجام متوسطة من (الشكل التوضيحي 1). تشمل ظروف الاختزال الكهروكيميائي اختزال الكتلةالمادة عند -1.5 فولت مقابل RHE لمدة 1200 ثانية. نمط حيود الأشعة السينية (XRD) للعينة (الشكل 1a) يضمن وجود كل من النحاس (رقم JCPDS 89-2838) و (رقم JCPDS 050667) الأطوار بعد عملية الاختزال الكهروكيميائي، مما يشير إلى تكوين النواب. شكليةيظهر النواب (الشكل التوضيحي الإضافي 2) عدم وجود اختلاف واضح مقارنةً بما هو موجود في الكتلة. (الشكل التكميلي 3). ومع ذلك، فإن الدقة العالية
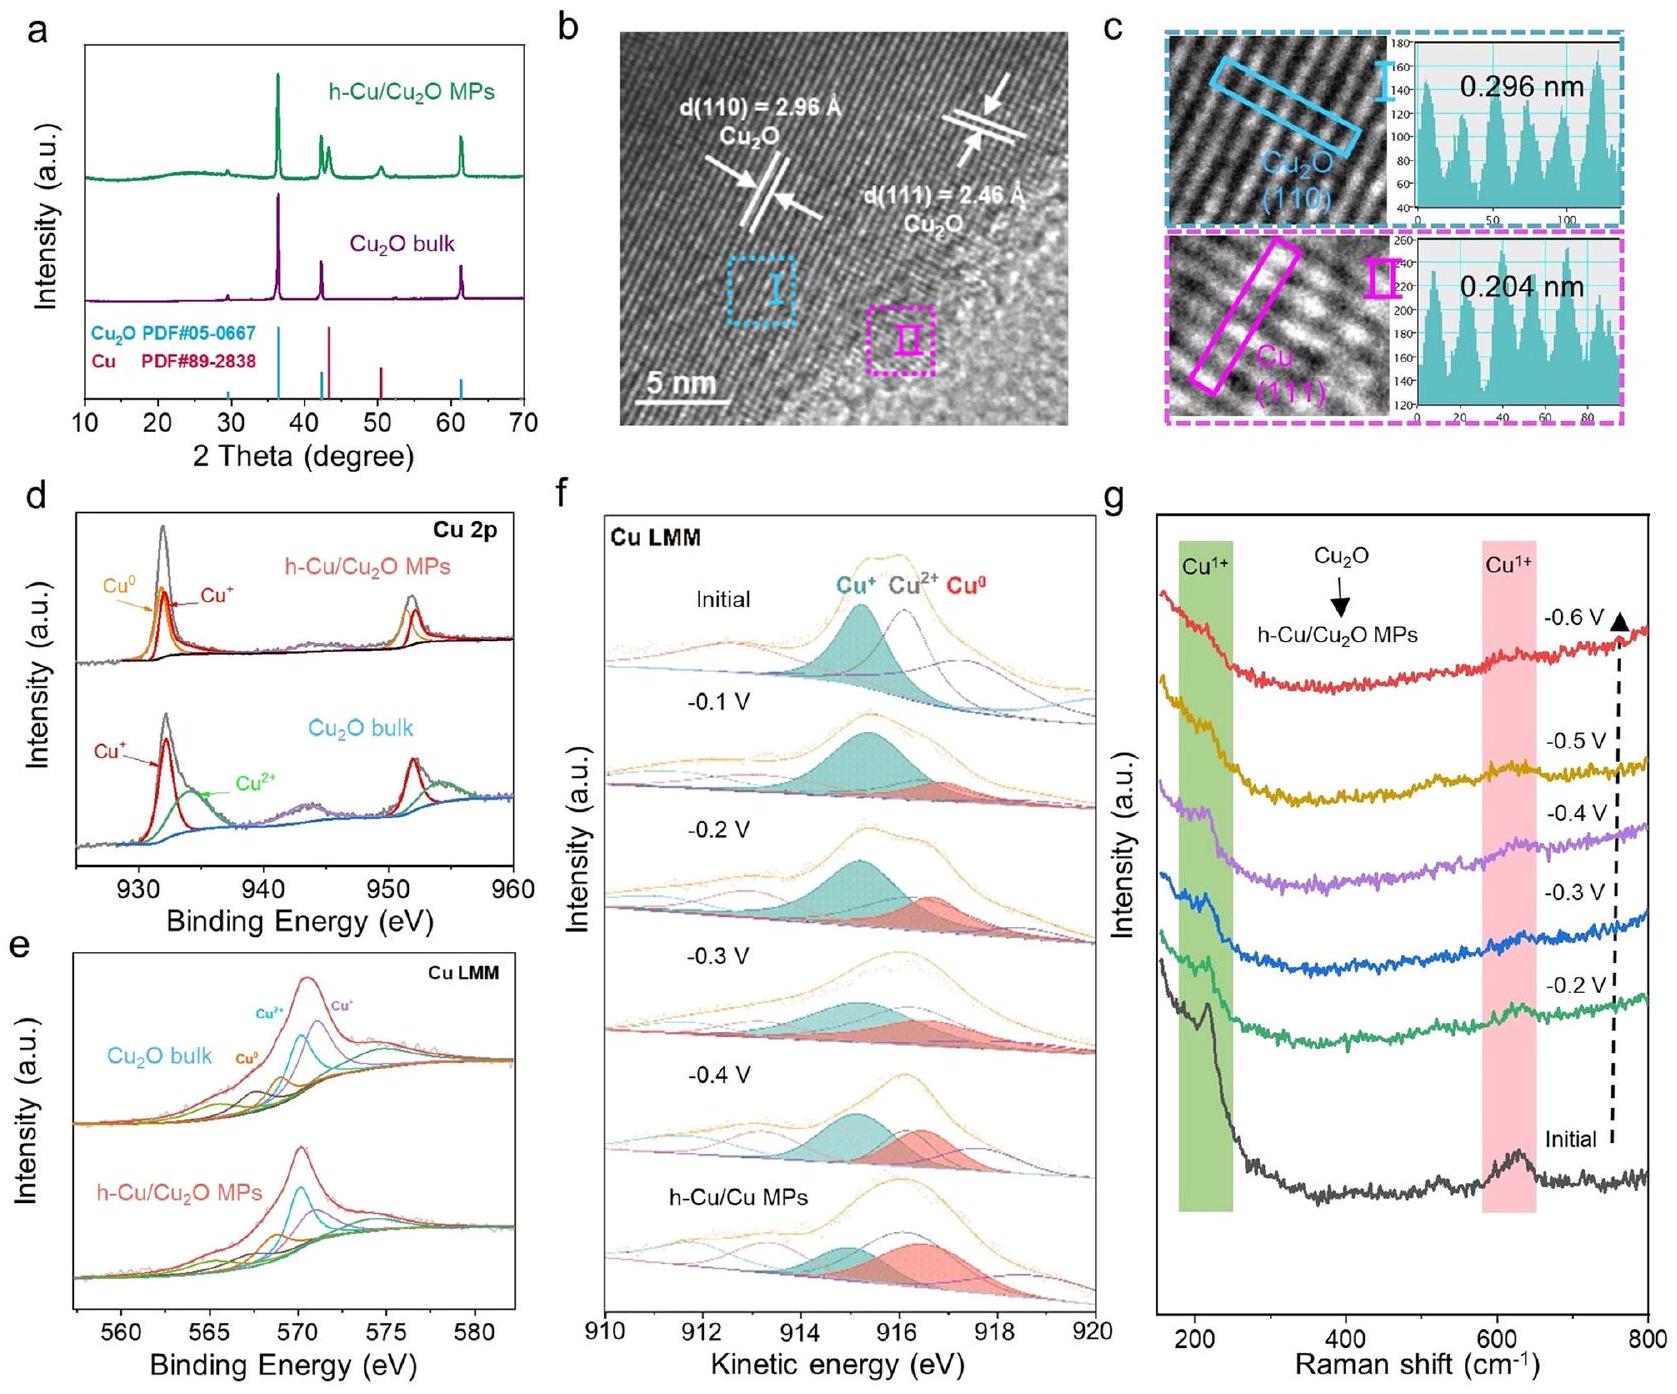
الشكل 1 | الخصائص الشكلية والبنائية لـنواب. أنماط XRD لـ h-النواب والكتل. ب، ج صور HRTEM لـ h-طيف XPS لنوط Cu 2 p و هـ – النواب. طيف LMM AES لـ و نواب. منحنيات XPS في الموقع المعتمدة على الجهد المحتمل (f) لـ Cu LMM
طيف AES للكتلةتحت الاختزال الكهروكيميائي. (ز) طيف رامان الكهروكيميائي في الموقع للكتلةتحت الاختزال الكهروكيميائي. تم توفير بيانات المصدر للشكل 1 كملف بيانات مصدر. تحليل المجهر الإلكتروني الناقل عالي الدقة (HRTEM) (الشكل 1ب) يوفر دليلاً مباشراً على تشكيلالواجهات غير المتجانسة على السطح، حيث يمكن فهرسة تباعد الحواف الشبكية البالغ 0.204 نانومتر إلى مستويات (111) من مرحلة النحاس (الشكل 1c)، وهو ما يتماشى مع أنماط حيود الإلكترونات في المنطقة المختارة (الرسوم التوضيحية التكميلية 4، 5). تظهر نتائج تصوير الميكروسكوب الإلكتروني الماسح بتقنية الحقل المظلم الحلقي بزاوية عالية (HAADF-STEM) وتحليل الأشعة السينية المشتتة بالطاقة (EDS) (الرسوم التوضيحية التكميلية 6) أن عناصر النحاس والأكسجين موزعة بالتساوي على سطح h- النواب، مع نسبة ذرية من النحاس إلى الأكسجين تقارب 2.5:1. وبناءً عليه، تشير طيف Cu 2p المقارن (الشكل 1d) بوضوح إلى أنه يمكن ملاحظة ذروتين عند حوالي 933 و 952 إلكترون فولت، مما يُعزى إلى أوعلى التواليتظهر تغير إشارة O 1s قبل وبعد الاختزال الكهروكيميائي أن تحتوي النواب على مزيد من الأكسجين في حالة الامتصاص الكيميائي بعد التنشيط (الشكل التوضيحي 7). علاوة على ذلك، يؤكد طيف AES ل Cu LMM (الشكل 1e) وجود ولتحليل تحول الطور للكتلةخلال عملية الاختزال الكهربائي، قمنا بإجراء دراسة XPS في الموقع، كما هو موضح في الشكل التخطيطي للإعداد في الشكل التكميلية 8. يمكن ملاحظة من الشكل إذا أنه ضمن نطاق جهد الاختبار (-0.1 إلى -0.4 فولت مقابل RHE)، إشارة يزداد تدريجياً مع زيادة الجهد، ويتم زيادة الجهد إلى -1.5 فولت. و الإشارات في h-عينات MPs التي تم الحصول عليها بعد تقليل 1200 ثانية لا تزال موجودة. تؤكد مطيافية رامان في الموقع (الشكل 1 ج) إعادة بناء السطح.إلى Cu كما يتضح من تراجع شدة الذروة تدريجياً عند 218 وعند زيادة الفولتية المطبقة.
لتأكيد بيئة التنسيق غير المشبعة، تم إجراء طيف امتصاص الأشعة السينية بالقرب من حافة كوبر (XANES) كما هو موضح في الشكل 2a. إن الحافة السابقة لموقع حافة امتصاص كوبر K-النواب NWs قريبون من Cu لكنهم ينتقلون إلى طاقة أقل مقارنة بتلك الخاصة بالنقاء.، مما يوفر دليلاً مباشراً على تقليل السطح الجزئي الناتج عن التنسيق غير المشبع لـفيالتحويل فورييه لهيكل الامتصاص الدقيق للأشعة السينية الممتد (FT-EXAFS) للمنحنياتنواب البرلمان لـ و الرابطة (الشكل 2ب، ج) زادت من 1.84 إلىومن 2.57 إلىعلى التوالي، مقارنةً بتلك الخاصة بـ، مما يشير إلى التشويه الهيكلي لـالنواب بسبب إدخالهيكل التنسيق لـتم تحليل MPs بشكل إضافي من خلال ملاءمة منحنيات FT-EXAFS الموزونة بـ k3. كما هو موضح في الجدول التكميلية 4، فإن عدد التنسيق (CN) لـفيحوالي 6.6، والتي انخفضت إلى 5.4 في h-أعضاء البرلمان، مما يدل على أن ذرة النحاس ذات البيئة التنسيقية غير المشبعة قد تم توليدها بالفعل بعد معالجة الاختزال الكهروكيميائي. تحليل EXAFS باستخدام تحويل الموجات (WT) في كل من K وتوفير المساحات (الشكل 2د) مؤشر بديهي للاختلاف في و التنسيق فينواب البرلمان.
أداء تخليق اليوريا الكهربائي لـتم قياس MPs في خلية إلكتروليتية من نوع H (الشكل التوضيحي 9). “تركيزتم ضبطه على 0.05 م، والذي تم الحصول عليه من خلال معالجة تركيز مياه الصرف الصحي النيتريتي، بما في ذلك التبخر والتناضح العكسي. تظهر منحنيات LSV المقارنة (الشكل 3 أ) أنه يظهر أعلى كثافة تيار مع وجودوفي الإلكتروليت، مقارنةً مع ذلك الذي يحتوي فقط على أو ، مما يوحي بالإمكانية تفاعل الاقتران. تم تحديد كميات اليوريا والأمونيا الناتجة بشكل كمي باستخدام كل من طريقة دياستيل مونوكسيم وNMR (الطرق والأشكال التكميلية 10-15).تم إجراء الاختبارات لمدة ساعتين لكل جهد في النطاق من -0.2 إلى -0.6 فولت (مقابل RHE) في خلية التدفق (الشكل التكميلي 16). وفقًا لنتائج الأشعة فوق البنفسجية-المرئية (UV-Vis) (الشكل التكميلي 17)، يمكن أن تصل معدل إنتاج اليوريا إلى أعلى مستوىتحت FE متفوق منلـ hتم قياس MPs عند -0.3 فولت مقابل RHE (الشكل 3ب). بالإضافة إلى ذلك، تم معايرة FE للمنتجات الرئيسية الأخرى بما في ذلك الأمونيا، أول أكسيد الكربون، النيتريت، حمض الفورميك، منتجات C2+ والهيدروجين كما هو موضح في الشكل 3ج.
درسنا أيضًا العلاقة بين تفاعل تطور الهيدروجين (HER) وتفاعلات الاقتران من خلال منحنيات LSV للتفاعلات المترابطة وHER (الشكل التكميلي 18). في الوقت نفسه، نظرًا لوجود المزيد من المنتجات في تفاعل اختزال النترات عند الجهد المنخفض، درسنا بشكل مستقل أداء اختزال النترات لـوجد النواب أن المادة لديها أداء جيد في تقليل النترات، وأن تقليل النترات يمكن أن ينتج الأمونيا والنتريت في نطاق -0.2 إلى -0.6 فولت مقابل RHE، ويمكن أن تحافظ على حوالي من إجمالي FE (الشكل التكميلي 19). وهذا يوفر أيضًا شرطًا مسبقًا لـ النواب ليصبحوامحفز مزدوج. بالمقارنة مع النحاس المعدني و الكتلة، ال- تظهر النواب أداءً أعلى في معدل إنتاج اليوريا وكفاءة التحويل (الشكل التكميلي 20)، والذي يتضمن تركيب النحاس في المعلومات التكميلية. بالإضافة إلى ذلك، قدم توزيع المنتج للنحاس المعدني عند إمكانيات مختلفة بيانات إضافية في الشكل التكميلي 21. عند الإمكانية -0.3 فولت (مقابل RHE)، النحاس ولديها FE أقل في تفاعل الاقتران و ). للتحقيق في العلاقة بين الواجهة والأداء الكهروكيميائي في تخليق اليوريا، تم إجراء سلسلة من التجارب المقارنة. أولاً، تم تقليل النقي تحت ظروف الاختبار لدينا (-0.3 فولت إلى -0.5 فولت مقابل RHE) نتج عن العينةأعضاء البرلمان، ومقارنة منحنى XRD توضح بوضوح أن تأثير التخفيض لـ تحت ظروف الاختبار لدينا غير مرضية (الشكل التوضيحي 22). ثانياً، تم إجراء اختبار استقرار طويل الأمد على عينة MPs (الأشكال التكميلية 23، 24). التغيير في أداء المادة بعد 12 ساعة منأظهرت الاختبارات استقرارًا جيدًا، مما يؤكد أن أداء h-تتأثر MPs بشكل طفيف في بيئة الاختبار لدينا (محايدة إلى قلوية قليلاً، جهد محتمل من -0.2 فولت إلى -0.6 فولت مقابل RHE).
لتحقيق العلاقة بين محتوى الواجهة والأداء، تم إجراء مجموعتين من التجارب المقارنة، حيث تم تصنيع دفعتين من العينات: (1)تم تقليل المادة السائبة كهربائيًا مع وقت تقليل ثابت قدره 1200 ثانية، وتم ضبط جهد التقليل ( )، مما أدى إلى سلسلة من تم إجراء تخليق اليوريا الكهروكيميائي تحت تيار ثابت لمدة ساعتين في و البيئة عند -0.3 فولت مقابل RHE. (2)تم تقليل المادة السائبة كهربائيًا بجهد اختزال ثابت قدره -1.5 فولت مقابل RHE، وتم تعديل وقت الاختزال ( ) للحصول على سلسلة من العينات لدراسات الأداء (الشكل التوضيحي 26). تم إجراء التحليل الكهربائي لهذه العينات عند -0.3 فولت مقابل RHE لمدة ساعتين من أجل التخليق الكهربائي لليوريا تحت ظروف هذه الدراسة. أظهرت النتائج أنه في المرحلة الأولية من زيادة محتوى الواجهة، كان الأداء الكهربائي لليوريا مرتبطًا إيجابيًا بمحتوى الواجهة. عندما وصل محتوى الواجهة إلى مستوى معين (ظروف التخليق: -1.5 فولت مقابل RHE، 1200 ثانية)، بدأ الأداء الكهربائي لليوريا يميل إلى التشبع. أظهرت الدراسات السابقة الواسعة أن يتم تقليله بالكامل إلى النحاس النقي عند الجهود العالية. لذلك، قمنا أيضًا بالتحقيق في الأداء عندماتم تقليلها بالكامل إلى النحاس النقي (الشكل التكميلي 20)، وأشارت النتائج إلى انخفاض كبير في أداء التخليق الكهروكيميائي لليوريا على النحاس النقي. يمكن الاستنتاج أنه مع تقدم عملية الاختزال بشكل أكبر، فإن درجةعندما تزداد نسبة الاختزال إلى النحاس النقي، تنخفض محتويات الواجهة، وتتناقص الأداء الكهروكيميائي لتخليق اليوريا من ذروته إلى مستوى أدنى قابل للمقارنة مع النحاس النقي. باختصار، تُظهر العلاقة بين محتوى الواجهة والأداء الكهروكيميائي لتخليق اليوريا في البداية ارتباطًا إيجابيًا، حيث يصل الأداء الكهروكيميائي إلى ذروته ويميل إلى التشبع عندما يصل محتوى الواجهة إلى مستوى معين. عندما يتم اختزاله بالكامل إلى النحاس، تختفي الواجهة، وينخفض أداء اليوريا بشكل ملحوظ.
علاوة على ذلك، تم استكشاف المساحة السطحية النشطة كهربائياً (ECSA) المتعلقة بالعينة المذكورة أعلاه (الأشكال التكميلية 27، 28). المساحة السطحية النشطة المحسوبة هي، وتم تطبيع منحنيات كثافة التيار تحت إمكانيات مختلفة (المكمل
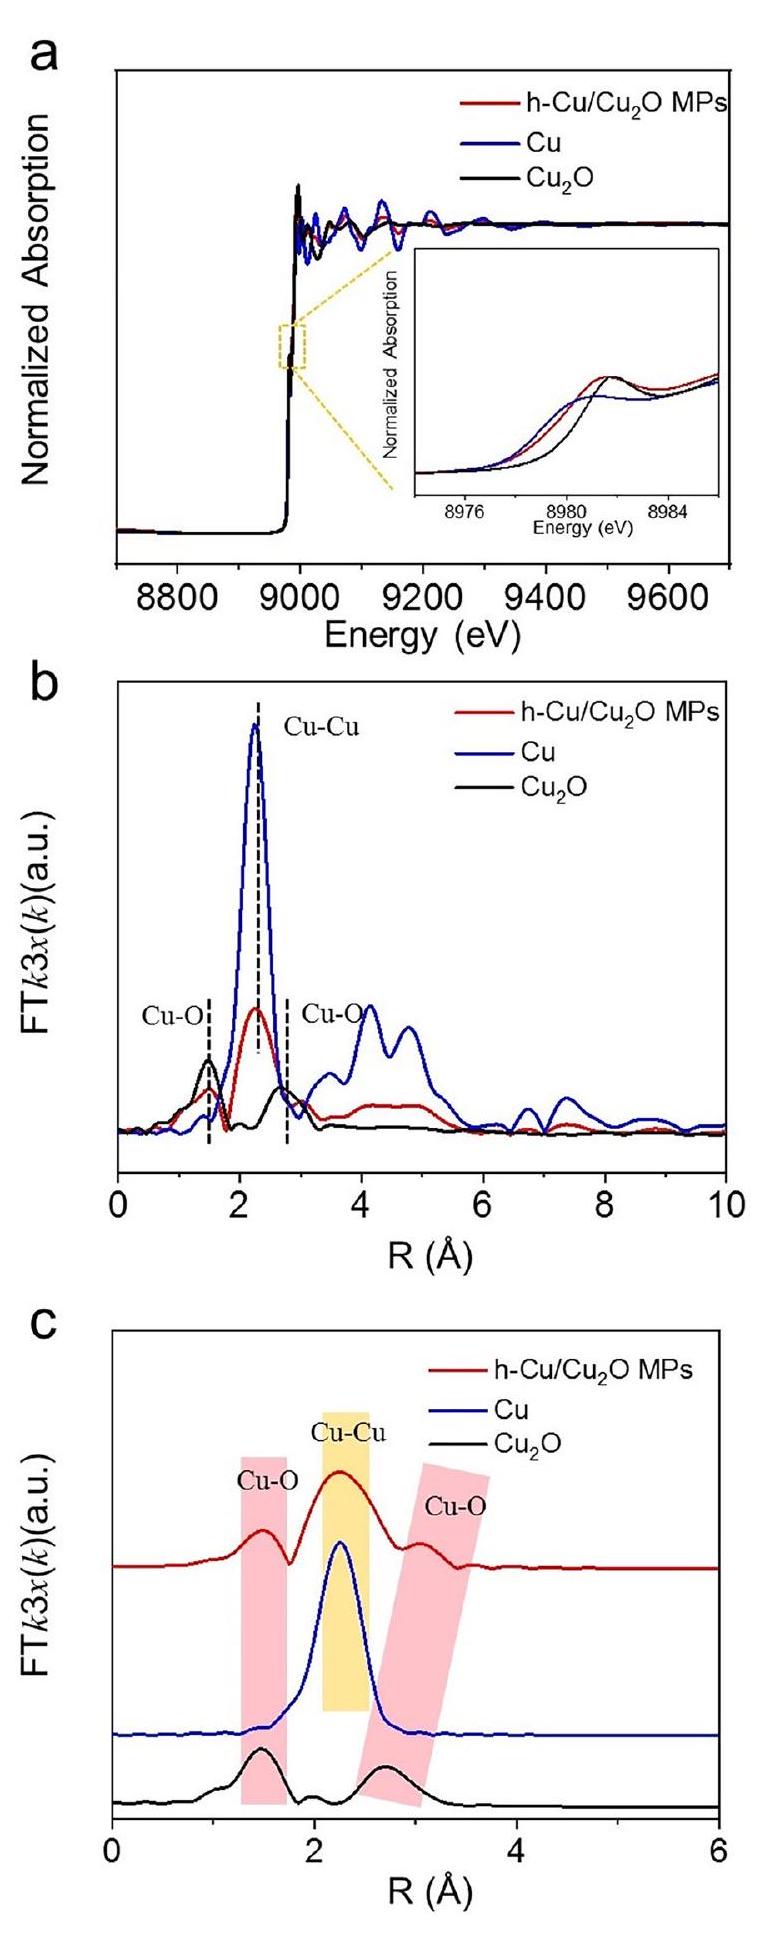
الشكل 2 | بيئة التنسيق للنحاس. أ طيف XANES عند حافة K للنحاس و (ب) الوزن المقابل k3وظائف طيف FT-EXAFS لـنواب البرلمانورقة النحاس. منحنيات تركيب FT-EXAFS لـنواب البرلمان،
ورقة النحاس و (د) WT لإشارات EXAFS الموزونة بـ k3 لـ h-نواب البرلمانورقة النحاس. تم توفير بيانات المصدر للشكل 2 كملف بيانات مصدر.
الشكل 28). لإثبات الجدوى، استخدمنا خلية تدفق مع أقطاب طبقة انتشار الغاز (GDL)، تتميز بـتمتاز الخلايا النمطية (MPs) بوجود كاثود مرتبط بأنود من رغوة النيكل، مفصول بواسطة غشاء نافيوني (الشكل 3d). بالمقارنة مع الخلية من النوع H، يمكن أن تعزز الخلية الجارية معدل إنتاج اليوريا بشكل أكبر حتى (الشكل التوضيحي 29). الـاختبار ونتيجة CA (الشكل التكميلي 30) تظهر الاستقرار العالي لـ h-نواب البرلمان، معتدهور كثافة التيار بعد 12 ساعة. بالإضافة إلى ذلك، مخطط التوزيع لـ تم عرض المنتجات التي تم تصنيعها كهربائياً في نظام خلية التدفق في نطاق -0.2 إلى -0.6 فولت مقابل RHE في الشكل التكميلي 31. تم تمثيل النسخ ذات شريط الخطأ من الشكل 3c والشكل التكميلي 31 في الشكل التكميلي 32. قمنا بمقارنة أداء تخليق اليوريا لدينا مع الأدبيات المنشورة ووجدنا أنه على الرغم من استخدام جهد أقل بكثير من المحفزات المتطورة المبلغ عنها في الأدبيات، إلا أن المحفز الخاص بنا حقق معدل إنتاج اليوريا وكفاءة مشابهة، مما يدل على كفاءته العالية في تخليق اليوريا و
الشكل 3 | التخليق الكهروكيميائي لليوريا مننواب. منحنيات LSV لـ hنواب البرلمان في، و إلكتروليت مشبع 0.5 م KHCO3 في خلية التدفق. ب إنتاج اليوريا وكفاءة فاراداي لـ h-النواب عند إمكانيات تطبيق مختلفة و (ج) توزيع المنتج في خلية H. د مخطط تخطيطي اختبار استقرار تخليق اليوريا المتتالي عند -0.3 فولت مقابل RHE على خلية تدفق ثلاثية الأقطاب.نواب في خلية تدفق ذات ثلاثة أقطاب. تظهر أشرطة الخطأ الانحرافات المعيارية المحسوبة من ثلاث تجارب مستقلة. تم توفير بيانات المصدر للشكل 3 كملف بيانات مصدر. إمكانية توفير الطاقة. (الجدول التكميلي 1). يمكن أن يحافظ مثل هذا العائد العالي من اليوريا وكفاءة التحويل على استقرار ممتاز مع خمس جولات متتالية (الشكل 3e) ونتائج CA.
تم اعتبار كثافة التيار الصغيرة نسبيًا كواحدة من القيود على التطبيقات القابلة للتوسع. من أجل تقليل إمكانات عملية تخليق اليوريا لزيادة إنتاج اليوريا، يتم استخدام الإمكانات الديناميكية الحرارية المنخفضة لأكسدة الهيدرازين (-0.33 فولت مقابل RHE) لاستبدال تفاعل OER الأنودي (الشكل 4أ)، مما يمكن أن يعزز بشكل فعال كثافة التيار في نظام الأقطاب الكهربائية الثنائية (الشكل 4ب). للتحقيق في تفاعلات أخرى في نظام الأقطاب الكهربائية الثنائية، مثل أكسدة اليوريا عند الأنود واختزال الهيدرازين عند الكاثود، أجرينا دراسة. أولاً، قمنا بفحص منحنيات LSV مع وبدون اليوريا في النظام (الشكل التكميلي 33). من الواضح أن منحنيات LSV، مع وبدون اليوريا، تتداخل بشكل أساسي ضمن نطاق الإمكانات منبالجمع بين هذا ودراستنا حول الكفاءة فارادايك لحمض الفورميك كمنتج (الشكل التكميلي 34)، نستنتج أنه تحت ظروف هذه الدراسة، لا undergo الأوكسدة في الأنود ضمن نطاق الجهد من 0 إلى -1.8 فولت. من الصعب استبعاد التفاعلات الضئيلة مثل اختزال الهيدرازين عند الكاثود؛ لذلك، قمنا أيضًا بدراسة النظام باستخدام خلية تدفق غشائية. من خلال مقارنة LSV والتغيرات في محتويات المنتجات الأخرى مع وبدون الغشاء، يمكننا أن نستنتج أن بعض التفاعلات المحتملة في نظام الغشاء لا تؤثر بشكل كبير على الأداء النهائي تحت ظروف اختبارنا (الأشكال التكملية 35، 36). للتحقيق في استقرار نظام القطبين، تم دراسة كل من استقرار الدورة والاستقرار على المدى الطويل.تم إجراء اختبار عند 1.5 فولت (الشكل 4c، d). بالإضافة إلى ذلك، يتغير معامل الفعالية للمادة خلالتم اكتشاف اختبار t أيضًا عند فاصل زمني قدره 5 ساعات (الشكل التوضيحي 37)، مما يشير بوضوح إلى المتانة. بشكل ملهم، اليمكن أن تصل الانتقائية إلى مستوى عالٍ يصل إلىعند -0.4 فولت مقابل RHE (الشكل 4e).تم استخدام طريقة الوسم النظائري (الشكل 4f والشكل التكميلي 38) لتأكيد مصدر منتج اليورياعلاوة على ذلك، يتم التحقق من موثوقية النتائج أيضًا من خلال قياس معدل العائد باستخدام كل من طريقة الأشعة فوق البنفسجية وطريقة المغناطيسية النووية (الشكل 4g)، حيث يمكن ملاحظة توافق جيد.
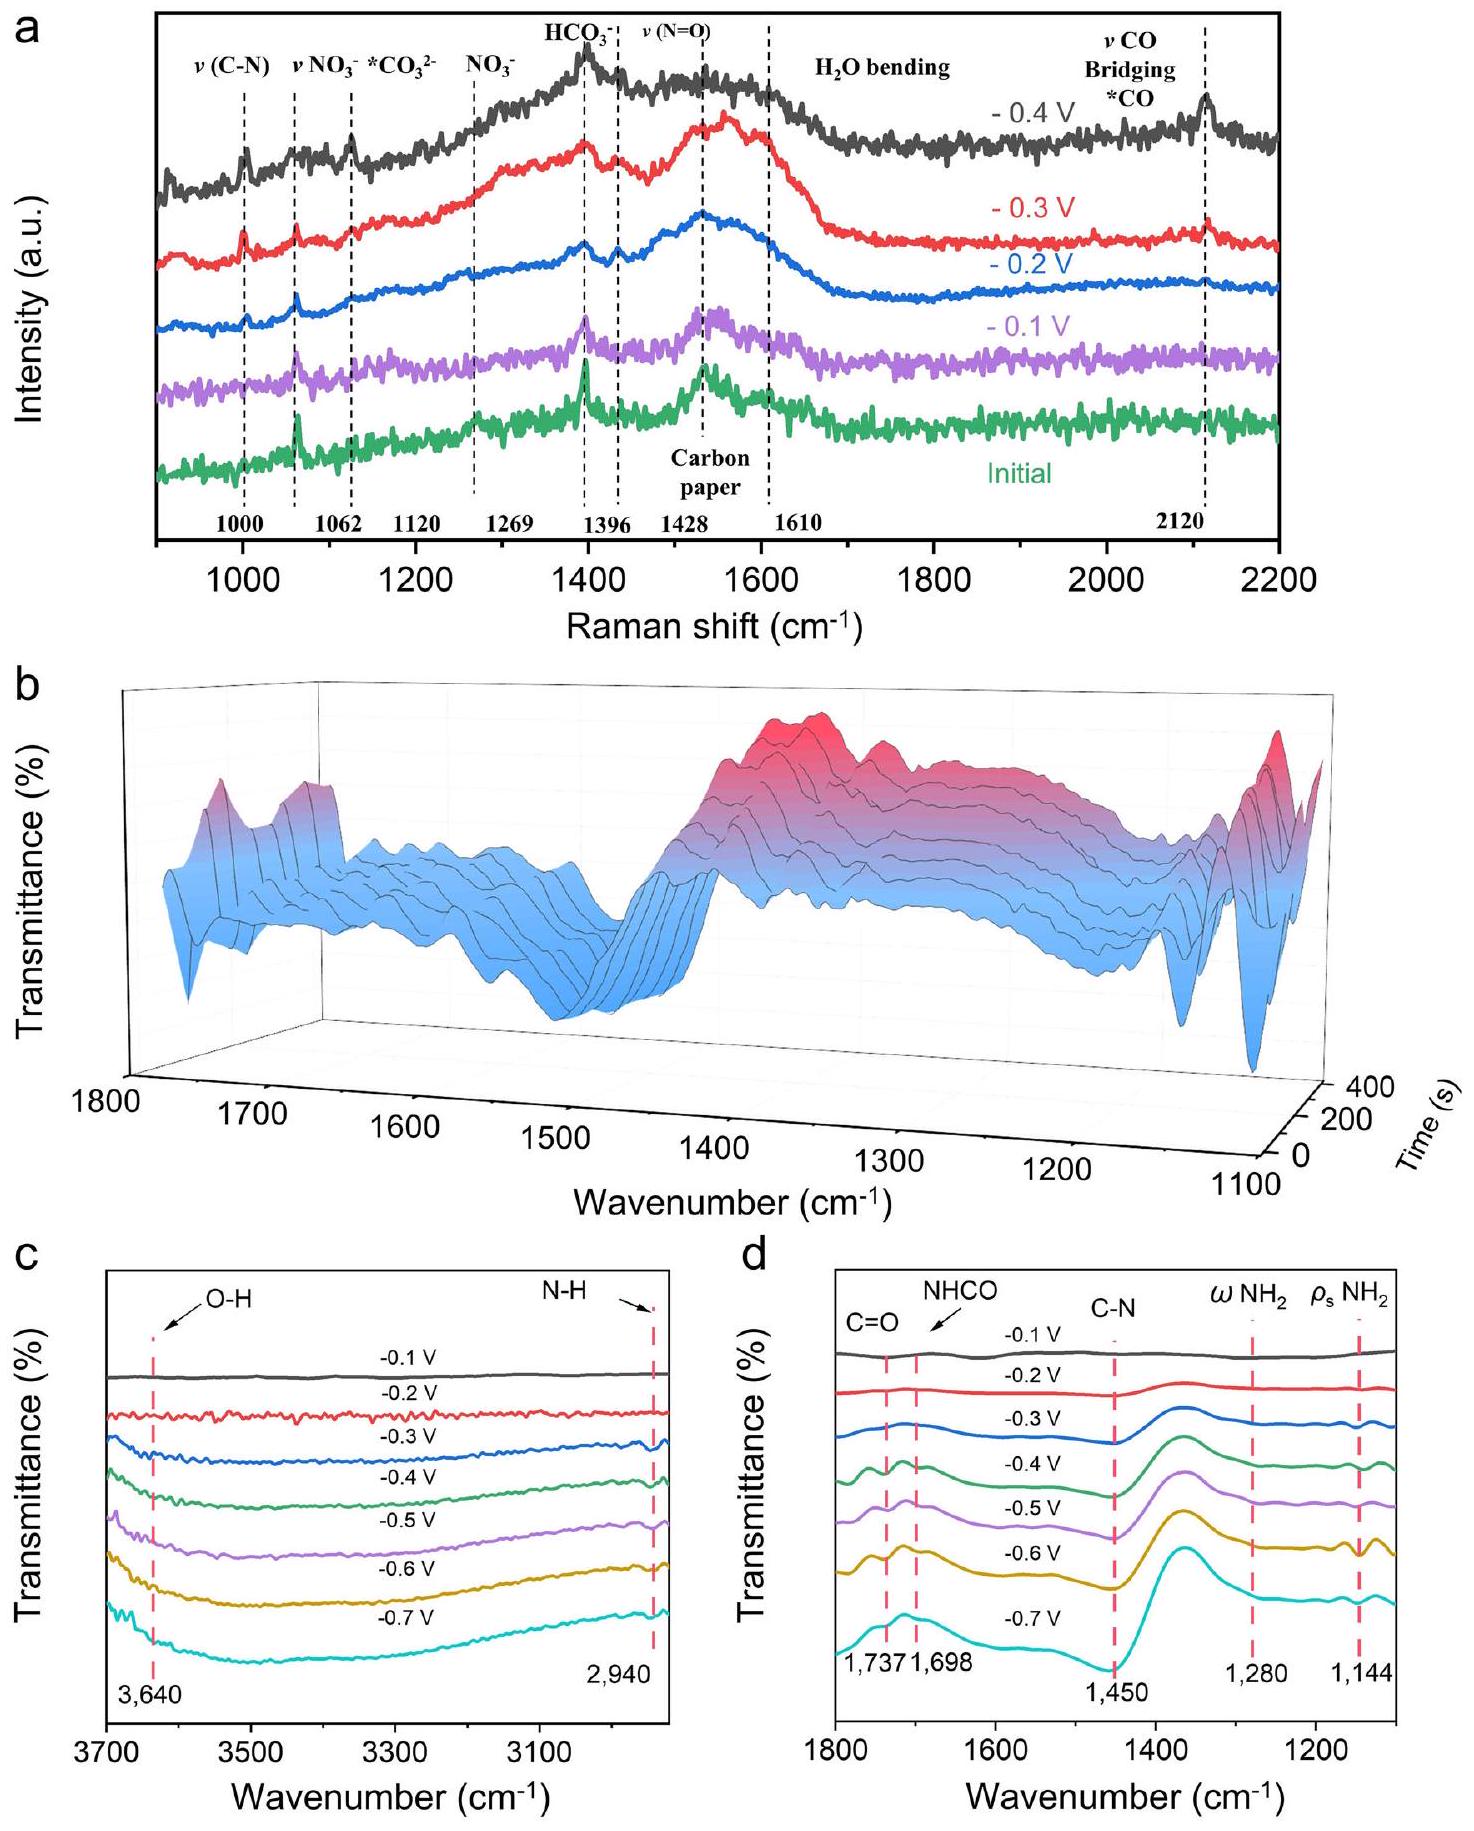
من أجل استكشاف معلومات المكونات المحددة للوسطاء، قمنا بإجراء سلسلة من التجارب الكهروكيميائية في الموقع، بما في ذلك تجارب رامان المتقدمة في الموقع وقياسات SR-FTIR التشغيلية (الأشكال التكميلية 39-41)، والتي تكون حساسة للغاية للوسطاء الناتجين.تم الحصول على بيانات رامان في الموقع في الشكل 5a في نظام ثلاثي الأقطاب تحت ظروف تتراوح بين -0.1 إلى -0.4 فولت مقابل RHE، مع إجراء الاختزال الكهروكيميائي لمدة 5 دقائق عند كل جهد. تشير تغييرات الإشارة إلى زيادة كبيرة في الـإشارة عندمع زيادة الإمكانيات، مما يوفر دليلاً قويًا على حدوثاقتران. علاوة على ذلك، مع زيادة الإمكانيات، إشارات في و فيفي نظام الإلكتروليت انخفض بشكل ملحوظ. كشفت تجارب رامان في الموقع عن تغييرات في محتوى الأنواع C و N خلالتفاعل الاقتران.
للمزيد من التحقيق في معلومات الوسطاء خلال عملية التفاعل، تم إجراء تجارب الأشعة تحت الحمراء في الموقع. تم جمع إشارات الأشعة تحت الحمراء من 1100 إلىخلال المسح السالب من -0.1 إلى -0.7 فولت مقابل RHE، تم إجراء الاختزال الكهروكيميائي لمدة 5 دقائق عند كل جهد. كما هو موضح في الشكل 5a، يمكن ملاحظة بوضوح أنتم إثبات تكوين الروابط بشكل إيجابي، ومعدلتكوين الروابط زاد تدريجياً عندما تم اختباره عند -0.3 فولت في النطاق من 1100 إلى. نتائج SR-FTIR أثناء التشغيل من 2800 إلىأكد ظهور الـوضع الانحناء عند“، الذي بدأ يظهر من -0.3 فولت (الشكل 5ب). في النطاق من 1100 إلىتم استكشاف الأطياف تحت الحمراء في (الشكل 5ج)، والتي يمكن نسبها إلى وضع الانحناء ووضع التمايل لـفي اليوريا. تم فحص الأطياف تحت الحمراء عند 1280 و، التي تنشأ من أوضاع الانحناء والتأرجح لـرابطة في اليوريا. بالإضافة إلى نطاقات الأشعة تحت الحمراء و وضع التمدد لـيمكن ملاحظته في. كما يتضح من نتائج SR-FTIR أثناء التشغيل، تم تحقيق الاقتران بنجاح من أجل تخليق اليوريا اللاحق، مما يتوافق جيدًا مع تجارب التحفيز الكهربائي. بالمقارنة مع اليوريا الحرة، فإن انزياح تردد الشد لـيشير إلى أن اليوريا
الشكل 4 | التخليق الكهروكيميائي لليوريا المرتبط بتفاعل أكسدة هيدرازين هيدرات في نظام ذو قطبين. أ رسم تخطيطي لخلية ذات قطبين. ب منحنيات LSV في إلكتروليتات مختلفة. ج منحنيات الكرونو-أمبيرومترية في إلكتروليتات مختلفة لمدة 20 ساعة. د اختبار استقرار تخليق اليوريا المتتالي على مدى ساعة.نواب خلية التدفق ذات القطبين عند 1.5 فولت. الانتقائية عند تطبيقات مختلفة إمكانات خلية التدفق ذات الثلاثة أقطاب.اختبار وسم النظائر لخلية التدفق ذات الثلاثة أقطاب عند -0.3 فولت مقابل RHE. ج مقارنة نتائج اختبارات UV و 1H NMR. تظهر أشرطة الخطأ الانحرافات المعيارية المحسوبة من ثلاث تجارب مستقلة. تم توفير بيانات المصدر للشكل 4 كملف بيانات مصدر. قد تم التنسيق مع وجود واجهات غير متجانسة على السطح ) من خلال ذرة الأكسجين لـ مجموعة.
بالإضافة إلى ذلك، يظهر نطاق الاهتزاز NHCO عند (الشكل 5د) . مع تغير طاقة الروابط الكيميائية تحت تراكم إمكانيات الربط، يمكننا أن نستنتج أن تعزيز NHCO و متزامن، بينما الرابطة تضعف تدريجياً مع تكوين C-N. باختصار، تؤكد تجارب رامان والأشعة تحت الحمراء في الموقع أن النواب، كعامل محفز، يشكلون بالفعل الروابط الكيميائية في بيئة الإلكتروليت.
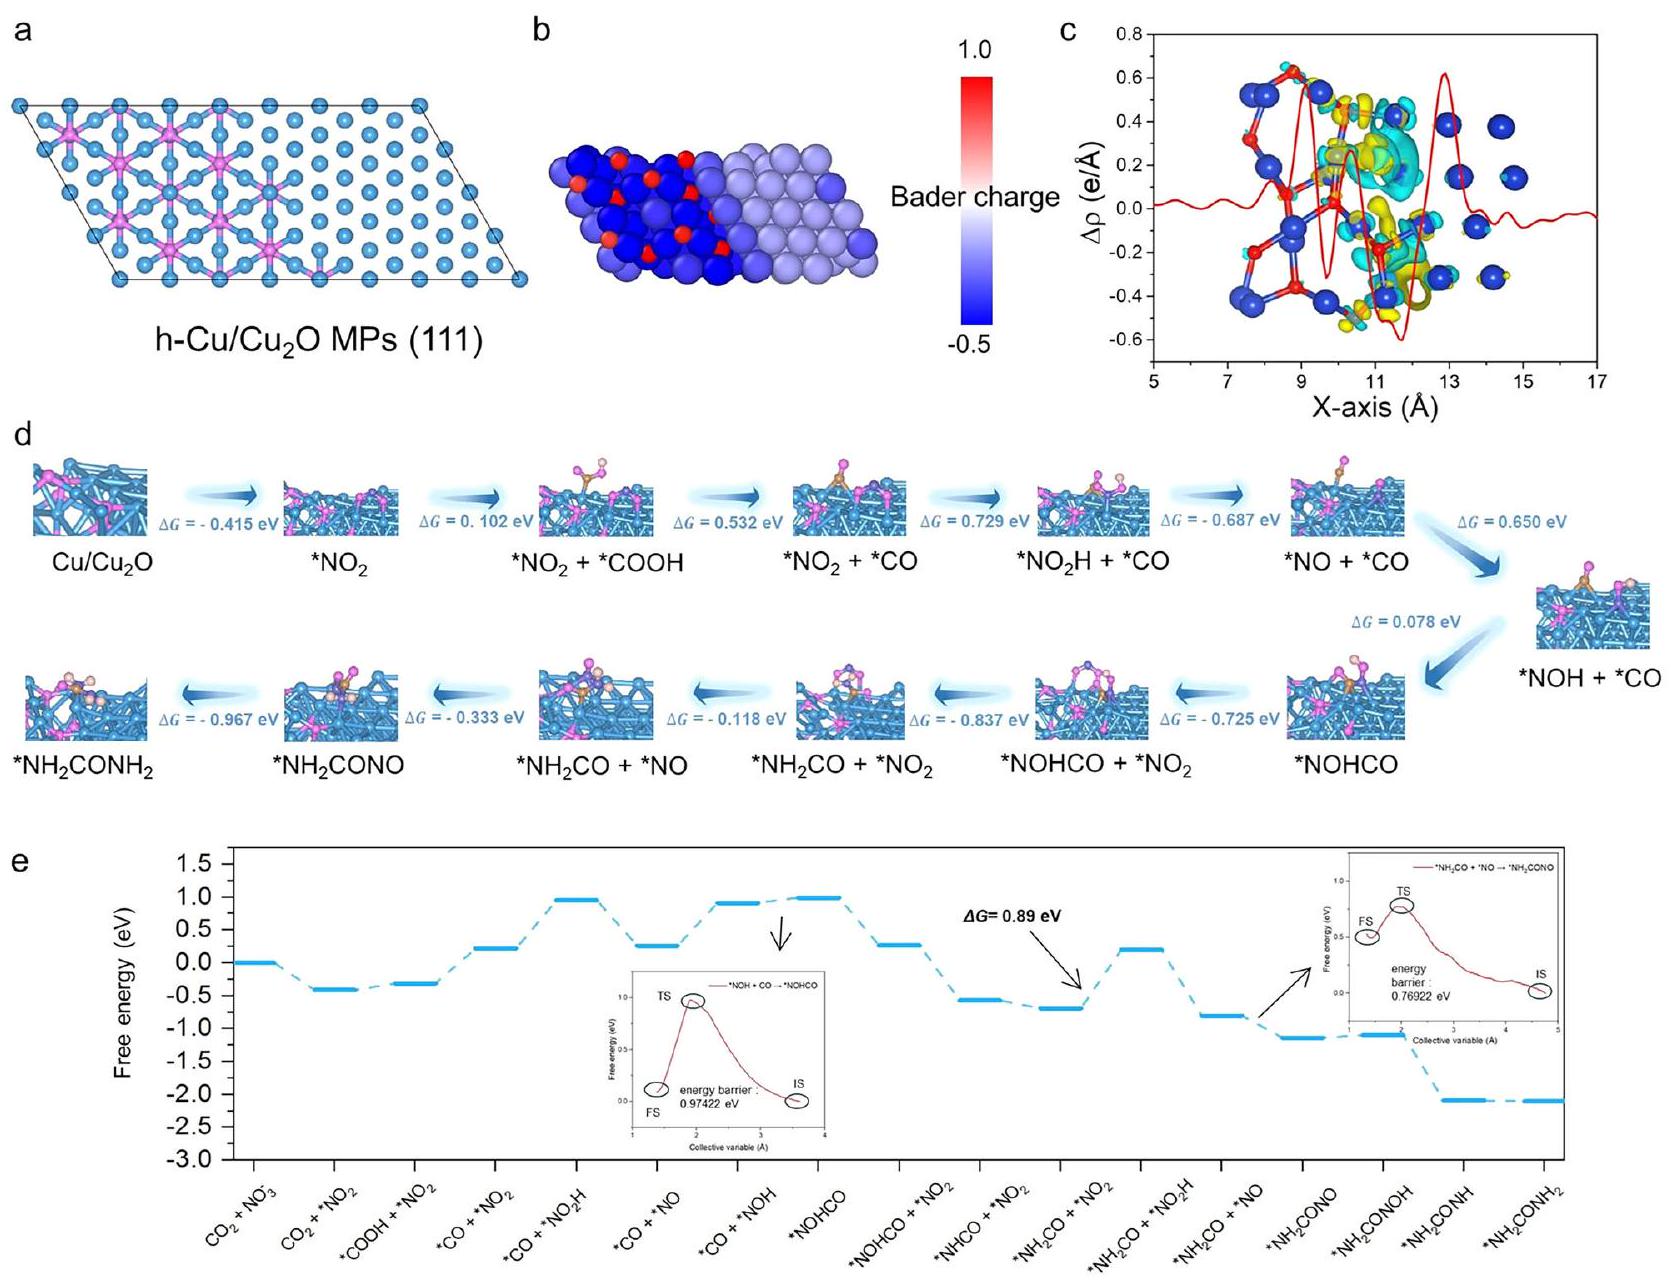
تم إجراء حسابات نظرية الكثافة الوظيفية (DFT) للتحقيق في مصدر نشاط الموقع وآليةالتوصيل علىواجهة. نماذج دقيقة مطلوبة لوصف ذرة النحاس ( ) عند الواجهة. هو الموقع النشط لـ الترابط ويجب أن يكون عدد تنسيق O بين (ذرة نحاس نقية)، (منسق بشكل منخفضذرة)، و (النحاس المشبع تنسيقياً) . ال- نموذج النواب موضح في الشكل 6أ، و ونماذج النحاس مقدمة في الأشكال التكميلية 42 و 43، على التوالي (انظر قسم المعلومات الإضافية لطرق النمذجة). (111) السطح على اليسار وسطح Cu (111) على اليمين يشكلان واجهة مستقرة، وموقع Cu في المنتصف كافٍ لوصف دقيق . بسبب كسر O تنسيقيمتلك خاصية هيكلية إلكترونية فريدة، كما يتضح من نتائج شحنة بادر (الشكل 6ب). على سطح الموقع،فقد متوسطفقد متوسط 0 e،فقد متوسط 0.5 e، وفقد متوسط 0.3 إلكترون فولت. في الوقت نفسه، فإن الشحنة التفاضلية بين (111) المرحلة ومرحلة Cu (111) (الشكل 6c) تؤكد أن هناك مجال كهربائي مدمج بين المرحلتين، وأن إلكترونات Cu (111) على اليمين تميل إلى التدفق نحو (111) على اليسار، وهو ما يتماشى مع استنتاج الشكل..
لتسهيل الفهم، حدوثيتطلب الاقتران عادة شرطين هامين. أولاً، يجب أن تكون هناك علاقة تفاعل تنافسية مناسبة، مما يعني أن حاجز الطاقة لتفاعل اقتران C-N أقل من أي تفاعل تنافسي آخر، مثل الهدرجة وإزالة N وC الوسيطة.ثانيًا، يجب أن تكون الموقعين النشطين لاحتجاز الوسائط C و N متجاورين، ويجب ألا تكون هناك تأثيرات ستيريو قوية.. لشرح المصدر لـفي نشاط الاقتران، قمنا بحساب الطاقة الحرة لمسار التفاعل بالكامل خطوة بخطوة. بالنسبة لكل تفاعل أساسي، أخذنا في الاعتبار العلاقات التنافسية للهدرجة، والامتزاز، والانفصال، وتفاعلات الاقتران، وستحدد الاتجاه الأسهل لكل خطوة الطاقة المتوسطة التي سيتم أخذها في الاعتبار في الخطوة التالية. بناءً على ذلك،
الشكل 5 | قياسات رامان الكهروكيميائية في الموقع وأشعة السنكروترون العاملة لتحويل فورييه للأشعة تحت الحمراء (FTIR) تحت إمكانيات مختلفة لـ h- النواب خلال التخليق الكهروكيميائي لليوريا. أ مخطط رامان في الموقع تحت الكهروكيميائيظروف اختبار الاقتران. إشارات الأشعة تحت الحمراء في نطاق في أوقات مختلفة ). إشارات الأشعة تحت الحمراء في نطاق وفي نطاق (د)تحت إمكانيات مختلفة لـالنواب خلال الاقتران الكهربائيوتم توفير بيانات المصدر للشكل 5 كملف بيانات مصدر. قمنا بالتحقيق في إمكانيةالتوصيل فيموقع النواب، موقع Cu (111)، وموقع (111). بالنسبة لسطح Cu (111)، فإن حاجز الطاقة لتفاعل هدرجة الوسائط N يكون دائمًا أقل من ذلك لـ و سريعيؤدي إلى فشل Cu (111) في التكوينالسندات. في الوقت نفسه، تم إثبات أنعلى (111) السطح لديه ارتفاع و الأداء، الذي يوفر فرصة لـالتزاوج. ومع ذلك، تظهر النتائج أنه بالنسبة لاثنين متجاورينالمواقع، ستعيق امتصاص الوسائط النيتروجينية في موقع واحد تفعيلبجوار. قد يكون ذلك بسبب التأثير الفراغي أثر الجوارعلى شكلالتوزيع، الذي يقدم طردًا أقوى للوسطاء C و N. علاوة على ذلك، من الصعب علىمع مستقرلتشكيل روابط مع وسائط N، مما يؤدي إلى تفاعل الهدرجة السائد لوسائط N عند المواقع. لذلك،من غير المحتمل أن يحدث الاقتران في (111).
من المدهش أن امتصاص الوسائط النيتروجينية يحدث عندموقع hالنواب يعززون تفعيل المجاورالمواقع نحو. بالإضافة إلى ذلك، قمنا بإجراء سلسلة من حسابات نظرية الكثافة (DFT) (الأشكال التكميلية 44، 45)، تشير هذه النتائج إلى
الشكل 6 | حسابات DFT. أ هيكل محسّن بواسطة DFT لـ h-نواب. ب، ج باردي الشحنة واختلاف كثافة الشحنة لـالنواب. تشير الألوان الحمراء والزرقاء إلى تراكم الشحنات واستنفادها، على التوالي. د مسارات التفاعل، مخططات تخطيطية لتكوين الامتزاز الوسيط و التغيرات الطاقية المقابلة لتخليق اليوريا الكهربائي لـالنواب. الرسم البياني للطاقة الحرة لتخليق اليوريا الكهربائي على h-أعضاء البرلمان. تم توفير بيانات المصدر للشكل 6 كملف بيانات مصدر. أن وجودفيالواجهة تسهل بروتنةلكن هذه الظاهرة لا توجد في النحاس البسيط والمواقع. حاجز الطاقة لـتنخفض تفعيل الهدرجة من 0.75 إلى 0.11 إلكترون فولت بعد تشكيلالذي يُنسب إلى التركيب الإلكتروني الفريد لـموقع ناتج عن كسر تنسيق O. هذه البنية تمكّنموقع لامتصاص وسائط النيتروجين وتعزيز تفعيل الجوار بشكل كبيرالمواقع نحو. نتيجة لذلك، الـترابط الوسائط N الماصة عندالمواقع لا تعتمد على CO ومن الحل، بل على العينة المحلية لثاني أكسيد الكربون من المناطق المجاورة المواقع. على عكس يحدث بشكل طبيعيلا يمتلك تأثيرًا حجميًا وله علاقة تنافسية مناسبة لتعزيز حدوث الاقتران. تفاصيل الحساب خطوة بخطوة موضحة في الأشكال التكميلية 46-50. وقد أفادت دراسات سابقة أيضًا أن الوسائط N يمكن أن تعزز تفعيللتحقيق في هذه الظاهرة، استخدمنا حسابات تدريجية لبناء نماذج مختلفة لامتصاص المذيب الضمني في، و واجهات. الـمسار الاقتران الذي تم الحصول عليه عند h-واجهة النواب موضحة في الشكل 6d. الخطوة الأولى منيحدث الاقتران عند، مع حاجز طاقة قدره 0.078 إلكترون فولت، وهو أقل من تفاعلات الهيدروجين لنزع الأكسيد (NOH) وأول أكسيد الكربون (CO) (0.89 إلكترون فولت و1.49 إلكترون فولت، على التوالي). في نفس الوقت، تم حساب طاقة حالة الانتقال لهذه العملية، والحاجز الطاقي المحسوب هو 0.97422 إلكترون فولت (الشكل 6e، الشكل التكميلي 51)، والذي تمت مقارنته مع النتائج المنشورة (الجدول التكميلي 2). الخطوة النهائية المحددة لمعدل التفاعل بأكمله تحدث عند الهدرجة لـ، مع حاجز طاقة قدره 0.89 إلكترون فولت، والذي يتم مقارنته مع النتائج المنشورة (الجدول التكميلي 3). تأثير الإذابة هو المفتاح للحصول على نتائج محاكاة كهرضغطية أكثر دقة، والعمليات الحسابية المذكورة أعلاه تم الحصول عليها تحت نموذج الإذابة. بشكل عام، تسلط هذه النتائج الضوء على الآلية الكامنة وراء الارتفاعأداء الاقترانوتقديم رؤى حول تصميم المحفزات الفعالة لـتحويل.
بروتوناتيتطلب إدخال طاقة قدره 0.75 إلكترون فولت، على عكس التكوين التلقائي لـ *NO. وهذا يؤدي إلى تراكم كبير لـ *NOH على سطح المحفز أثناء التحفيز الكهربائي، مما يعيقالامتصاص والتقليل مننواب. محليتكوين النواب يدعم نقل الإلكترونات إلى *تمكينتكوين الروابط من خلال تفاعل هذه الوسائط. حاجز الطاقة لتكوين *CONOH أقل بكثير (0.078 إلكترون فولت) مقارنة بـ 0.729 إلكترون فولت المطلوبة لبروتنة * إلى * ، مفضلًا المراحل المبكرة الاقتران (الشكل 6e). تسلط هذه النتائج الضوء على الدور الحاسم لمستويات البلورة (111) في تعزيز تخليق اليوريا الانتقائي . بالإشارة إلى نتائج التحفيز الكهربائي، فإن الزيادة في الطاقة الأقل لـ الاقتران والتشكل التلقائي لـ * قد تحدد بشكل تآزري القيم العالية للغاية لاختيار الكرياتين واختيار اليوريا. خطوات الاختزال اللاحقة هي طاردة للحرارة، ويمكن بسهولة إزالة اليوريا من أسطح جزيئات h-Cu/Cu2 O. آلية تفاعل مفصلة مع أكثر الهياكل الهندسية استقرارًا للمواد المتفاعلة والوسطاء. والمنتجات خلال تشكيل اليوريا مدرجة في الطريقة الحسابية. وبالمثل، يتم عرض النموذج وخطوات التفاعل للنحاس النقي وتم حسابها كما هو موضح في الأشكال التكميلية 52-59. تكشف النتائج الحاسوبية أن وجودتفاعل الاقتران والآلية المقابلة لتخليق اليوريا.
في الختام، لقد قمنا ببناءالمحفزات النانوية من خلال عملية الاختزال الكهربائي المباشرة، وأظهرت فعاليتها في الاختزال المشترك لـ و الملوثات لإنتاج اليوريا. أكدت تقنيات التوصيف عالية الدقة، مثل XANES، وجود الواجهة والتنسيق غير المشبع للنحاس. كما وجدنا أن الكفاءة الفارادائية المحسّنة والعائد لليوريا علىكانت مستويات MPs أعلى بكثير من تلك الموجودة في Cu ووحيدًا. من خلال مجموعة من تحليل ATR-FTIR في الموقع وتحليل DFT، أثبتنا أن نقل الإلكترون منتساعد القشرة على النحاس في تشكيل وترابط الوسائط *CO و *NOH، مما يؤدي إلى تحسين الأداء التحفيزي. بشكل عام، يقدم هذا العمل نهجًا عقلانيًا لتصنيع محفزات فعالة نحو الإنتاج المستدام للمواد الكيميائية المحتوية على الكربون والنيتروجين منونترات تحت الظروف المحيطة.
طرق
المواد
أوراق الكربون (HCPO20N، السماكة: ) تم الحصول عليها من شركة هيسن (شنغهاي، الصين). الميثانول إيزوبروبانول, ، -ثنائي ميثيل الفورماميد (DMF)، بيروكسيد الهيدروجين (محلول مائي)، كلوريد الأمونيومكلوريد البوتاسيومهيدروكسيد البوتاسيوموهيدروكسيد الصوديوم ( ) تم شراؤها من شركة سينوفارم للمواد الكيميائية المحدودة. ( أساس المعادنأساس جاف)، أكسيد النحاس (I) ( )، وغني بالنظائر تم توفير (99% وفرة نظيرية) من قبل شركة ألا الدين للتكنولوجيا الحيوية المحدودة. ثنائي هيدرات نيتروبروسيد الصوديومتم الحصول عليه من شركة Energy Chemical. هيبوكلوريت الصوديوم (NaClO،تم الحصول على الكلور المتاح من شركة ثيرمو فيشر. نترات البوتاسيومجاء من شركة سينوفارم للمواد الكيميائية المحدودة. الغازات بما في ذلك و تم شراءها من Airgas. تم استخدام جميع المواد الكيميائية كما هي دون مزيد من التنقية ما لم يُذكر خلاف ذلك.
تركيب المحفزات
تركيب النحاس المعدني. تم تصنيع أقطاب النحاس المعدني من خلال عملية اختزال كهربائي بسيطة من خطوة واحدة. في إجراء نموذجي، باستخدام تجاريمسحوق كإلكترود عمل. تم تقليل المواد التجارية كهربائيًا في الموقع عند -2.05 فولت (مقابل RHE) لمدة 12 ساعة في جو مشبع بالآرغون.الحل. المنتج النهائي يُشار إليه بـ Cu.
تركيبنواب البرلمان
التم تخليق الأقطاب الكهربائية من خلال عملية اختزال كهربائي سهلة من خطوة واحدة. في إجراء نموذجي، باستخدام تجاريمسحوق ككهرباء عمل. تم تقليل المواد التجارية في الموقع كهربائياً عند -1.5 فولت (مقابل RHE) لمدة 1200 ثانية في محلول مشبع بالآرغون بتركيز 0.5 م.الحل. يُشار إلى المنتج النهائي بـ.
توصيف المواد
تم تحليل الشكل والبنية للعينات باستخدام تقنيات توصيف متنوعة. تم استخدام المجهر الإلكتروني الماسح بالانبعاث الميداني (FESEM، JSM-6700F) والمجهر الإلكتروني الناقل (TEM، JEOL، JEM-2010) لمراقبة الهياكل السطحية والداخلية. تم استخدام حيود الأشعة السينية البودرة (XRD، TTR-III) وطيف رامان (LabRamHR) مع ليزر بقدرة 532 نانومتر لدراسة الأطوار البلورية وخصائص الاهتزاز. تم إجراء مجهر إلكتروني عالي الدقة (HRTEM) ورسم خرائط التحليل الطيفي للطاقة المشتتة (EDS) على مجهر إلكتروني ناقل Talox F200X (Thermo Fisher Scientific، الولايات المتحدة الأمريكية) يعمل عند 200 كيلوفولت. تم تحليل الحالات الكيميائية للعينات باستخدام مطياف الأشعة السينية للالكترونات الم photoelectron ESCALAB 250 المزود بـمصدر أشعة – تم تحديد التراكيب العنصرية باستخدام مطياف الانبعاث الذري ICP من بيركن إلمر Optima 7300 DV. تم استخدام الرنين المغناطيسي النووي للبروتونات (تم تسجيل أطياف الرنين المغناطيسي النووي (NMR) على جهاز طيفي Avance II 400 (Bruker). تم استخدام كروماتوغرافيا الغاز (GC 7900) مع عمود TDX-01 وكاشف الموصلية الحرارية لتحليل الغازات الناتجة، التي تم أخذ عينات منها باستخدام حقنة SCE. تم إجراء مطيافية رامان المعتمدة على الجهد تحت جهد مطبق مُتحكم فيه فيمعتفاعل الفقاعات. تم تثبيت المحفز الكهربائي لمدة 300 ثانية عند الجهد المطلوب لضمان ظروف الحالة المستقرة قبل تسجيل كل طيف.
القياسات الكهروكيميائية
كان المحلول الكهربائي يتكون من محلول مختلط من 0.5 م KHCO3 و (التوصيلية: ). خلال الاختبار، تم استخدام أحجام متساوية من الإلكتروليتكلتمت إضافتها إلى غرف الكاثود والأنود في الخلية الكهروكيميائية. تم تطهير الإلكتروليت بشكل متتابع باستخدام الأرجون عالي النقاء ولمدة 10 دقائق لكل منهما قبل الاختبار. المحلول الكهربائي المحضر لا يتطلب أي شروط تخزين إضافية بخلاف درجة حرارة الغرفة..
قبل التحفيز الكهربائياختبار الاقترانتم تزويد الغاز باستمرار إلى غرفة الكاثود بمعدل تدفق قدره، مع وجود الإلكتروليت الكاثودي المكون من محلول مختلط من و . في تجارب وسم النظائر، تم استبدال مصدر النيتروجين بـتم إجراء تجارب التحفيز الكهربائي في خلايا من نوع H وخلايا تدفق باستخدام تكوين ثلاثي الأقطاب، باستخدام محطة عمل كهربائية كيميائية CHI760E (شركة CH Instruments، الصين). كان القطب المرجعي هوالقطب الكهربائي المملوء بمحلول KCl المشبع، وكان القطب المضاد عبارة عن قضيب كربوني. في هذه الدراسة، كانت جميع الجهود مرجعية إلىالقطب الكهربائي وتم تحويله إلى مقياس RHE باستخدام المعادلة:، حيث أن الرقم الهيدروجيني هو متوسط الرقم الهيدروجيني للكهارل. تم قياس الرقم الهيدروجيني للكهارل باستخدام مقياس الرقم الهيدروجيني (ميتلر توليدو)، مع الرقم الهيدروجيني لـإلكتروليت مشبع بـوأن محلول الإلكتروليت المشبع بالآر هو. الـتم الحصول على المنحنيات من خلال ضبط الجهد المطبق (مقابل RHE) ووقت التحليل الكهربائي باستخدام قياسات الكرونوأمبرو مترية. تم تسجيل منحنيات LSV بواسطة الفولتمترية ذات المسح الخطي مع وضع المسح السالب على مدى جهد يتراوح من 0.0 فولت إلى -2.0 فولت (مقابل RHE).
تم فصل غرف الكاثود والأنود بواسطة غشاء نافييون 117 (المساحة الهندسية: سمك: ). كانت عملية المعالجة المسبقة لغشاء نافيون كما يلي: تم غمر غشاء نافيون 117 في محلول مائي وغلي عندلمدة ساعة واحدة لإزالة الشوائب العضوية. ثم تم شطف الغشاء عدة مرات بالماء المقطر وغمره في الماء المقطر عندلمدة ساعة واحدة لإزالة أي بقايا تمامًاتم تخزين غشاء نافيون في ماء منزوع الأيونات عند درجة حرارة الغرفة قبل الاستخدام.
تم إجراء تجارب التحفيز الكهربائي في خلايا من نوع H وخلايا تدفق باستخدام تكوين ثلاثي الأقطاب، وذلك باستخدام محطة عمل كهربائية كيميائية CHI760E (شركة CH Instruments، الصين).تم تسجيل المنحنيات من خلال تطبيق جهد محدد (مقابل RHE) ووقت التحليل الكهربائي، باستخدام طريقة الكرونوأمبرو متري. تم الحصول على منحنيات LSV عبر الفولتمترية ذات المسح الخطي مع وضع المسح السالب على مدى الجهد من 0.0 فولت إلى -2.0 فولت (مقابل RHE). تم تسجيل منحنيات LSV و CV بمعدل مسح قدره.
لإجراء اختبارات الكرونوأمبرو متري، تم تحضير القطب العامل عن طريق تعديل ورق الكربون باستخدام محفز. في البداية، تم تسخين ورق الكربون عندلمدة 16 ساعة لتعزيز قابليتها للاحتفاظ بالماء. بعد التبريد، تم قطع الورق إلى قطع مستطيلة ذات مساحة هندسية منتم تحضير حبر المحفز عن طريق توزيع 5 ملغ من المحفز ومحلول نافيون ( ) إلى من خليط مذيبات (كحول إيزوبروبيل: ماء ) وتم تسليط الموجات فوق الصوتية عليها لمدة
40 دقيقة لتشكيل خليط متجانس. حبر المحفزثم تم إسقاطه على الركيزة الكربونية وترك ليجف بشكل طبيعي، مما أدى إلى تحميل المحفز بـ.
طيف رامان في الموقع
تم إجراء مطيافية رامان في الموقع باستخدام مجهر رامان كونفوكال من رينيشاو inVia، مزود بعدسة ذات مسافة عمل طويلة 50X (0.5 N.A.) (أوليمبوس). تم استخدام ليزر تحفيز بطول موجي 532 نانومتر بقوة 2.5 مللي واط و1800 خط.تم استخدام شبكة الحيود للقياسات. كانت القطب العامل، المصنوعة من ورق الكربون ( )، تم اقترانه مع سلك من التيتانيوم كقطب مضاد و (كلوريد البوتاسيوم المشبع) كإلكترود مرجعي. تم تسجيل طيف رامان تحت الجهود المطبقة في محلول 0.5 م.الكهربائي، مع وجود المحفز الكهربائي عند الجهد المحدد لمدة 300 ثانية لتحقيق ظروف الحالة المستقرة قبل كل قياس. لكل طيف، تم جمع 15 مسحًا ضمن النطاق من 175 إلى.
قياسات XPS في الموقع
تم إجراء قياسات XPS في الموقع باستخدام إعداد XPS تحت ضغط جوي متكامل مع خلية كيميائية كهربائية ثابتة. كانت القطب المضاد عبارة عن سلك من البلاتين (Pt)، بينما كان القطب المرجعي يتكون من سلك Pt مغطى بـمعجون. كانت الإلكترود العامل ورقة كربونية، محملة بـمحفز ضخم، مشكل في دائرة بقطر 5.5 مم. خلال تحليل XPS في الموقع، تم غمر كل من الأقطاب المرجعية والمرجعية في الإلكتروليت وتم ختمها بغشاء نافيوني. تم وضع قطب ورق الكربون بين غشاء نافيوني ورقة من التنتالوم (Ta) لضمان اتصال كهربائي صحيح. تم الحفاظ على غرفة التحليل عند ضغط يقارب 0.3 مللي بار. من أجلفي اختبارات الوضع الكهروكيميائي، تم ضبط نطاق الجهد المطبق بين -0.1 فولت و -0.4 فولت مقابل RHE، مع الاحتفاظ بكل جهد لمدة ساعة واحدة.
قياسات SR-FTIR أثناء التشغيل
تم إجراء قياسات SR-FTIR أثناء التشغيل في خط الأشعة تحت الحمراء BLO1B في مختبر الإشعاع السنكروتروني الوطني (NSRL) في الصين، باستخدام إعداد خاص مصمم لخلايا انعكاس الأشعة تحت الحمراء مع بلورة ZnSe كنافذة لنقل الأشعة تحت الحمراء، مع طاقة قطع تبلغ حوالي. تم تجهيز الإعداد بجهاز مطياف FTIR (بروكير )، مقسم شعاع KBr، وكاشف من الزئبق والكادميوم والتيلوريوم (MCT) المبرد بالنيتروجين السائل. تم استخدام ميكروسكوب الأشعة تحت الحمراء (Bruker Hyperion 2000) مع عدسة × 15. يتم عرض إعداد الخلايا والتكوين الكهربائي في الشكل التوضيحي التكميلي 38. لضمان الحصول على طيف SR-FTIR عالي الجودة، عمل النظام في وضع الانعكاس، وتم الحصول على كل طيف امتصاص للأشعة تحت الحمراء من خلال متوسط 128 مسحًا بدقة تم تسجيل طيف الخلفية لقطب التحفيز عند جهد الدائرة المفتوحة قبل كل قياس، وكانت نطاقات الجهد المقاسة لتفاعل التحفيز الكهربائي تتراوح من -0.1 إلى -0.7 فولت (بالنسبة لـ RHE) مع خطوة جهد قدرها 0.1 فولت.
تحديد اليوريا
تم تحديد اليوريا في الإلكتروليت الكاثودي طيفياً باستخدام طريقة داي أستيل مونوكسيم. كانت إجراءات تطوير اللون كما يلي: تم أخذ 1 مل من الإلكتروليت، و1 مل من محلول داي أستيل مونوكسيم – ثيوsemicarbazide (TSC) (5 جرام من داي أستيل مونوكسيم و100 ملغ من TSC مذابة في 1000 مل من الماء المنزوع الأيونات) و2 مل من محلول الحديد الحمضي.تم إضافة 300 مل من حمض الفوسفوريك المركز، 600 مل من حمض الكبريتيك المركز، 600 مل من الماء المنزوع الأيونات، و100 ملغ من كلوريد الحديد الثلاثي. تم خلط المحلول جيدًا ثم تم تسخينه إلىلمدة 20 دقيقة. بعد التبريد إلى درجة حرارة الغرفة، تم قياس الامتصاصية باستخدام مطياف الأشعة فوق البنفسجية والمرئية (Shimadzu UV-2700) عند 525 نانومتر، كما هو موضح في الأشكال التكميلية 9 و 10، حيث يتم ملاحظة قمة امتصاص اليوريا.
تحديد الأمونيا
تحديدتمت العملية باستخدام كاشف نيسلر ككاشف لوني. الإجراء كالتالي: تم تخفيف حجم معين من الإلكتروليت الكاثودي إلى 5 مل، تلاه إضافة 0.1 مل من محلول تارترات البوتاسيوم والصوديوم. ) و 0.1 مل من كاشف نيسلر. تم خلط المحلول جيدًا وتركه لمدة 20 دقيقة. تم قياس الامتصاص عند طول موجي 420 نانومتر. تم معايرة منحنى التركيز-الامتصاص باستخدام سلسلة من محاليل كلوريد الأمونيوم القياسية، مع بلورات كلوريد الأمونيوم المجففة مسبقًا عند لمدة ساعتين. تم استخدام محاليل كبريتات الأمونيوم القياسية أيضًا للمعايرة، كما هو موضح في الأشكال التكميلية 11 و 12، والتي تحتوي على نفس تركيزات الإلكتروليت المستخدمة في تجارب التحفيز الكهربائي.
تحديد الهيدرازين ( )
تم تقدير الهيدرازين الموجود في الإلكتروليت بواسطة طريقة وات وكريسب.تم تحضير كاشف اللون عن طريق خلط بارا-(ثنائي ميثيل أمينو) بنزالدهيدحمض الهيدروكلوريك المركز، والإيثانوللإعداد منحنى المعايرة، تم أولاً تحضير سلسلة من المحاليل المرجعية عن طريق سحب كميات مناسبة من محلول هيدرازين هيدرات-نيتروجين 0.1 M HCl في أنابيب لونية. ثم تم ضبط حجم كل محلول إلى 5 مل باستخدام مخفف.الإلكتروليت. بعد ذلك، تم إضافة 5 مل من كاشف اللون المحضر إلى كل أنبوب، وتم تحريك المزيج لمدة 10 دقائق في درجة حرارة الغرفة. تم قياس امتصاصية المحلول الناتج عند 457 نانومتر. ثم تم حساب عوائد الهيدرازين من المنحنى القياسي باستخدام 5 مل من الإلكتروليت المتبقي و5 مل من كاشف اللون. تم إجراء المعايرة المطلقة للطريقة باستخدام تركيزات معروفة من محاليل هيدرازين مونوهيدرات كمعايير، وأظهر منحنى المعايرة الناتج ارتباطًا خطيًا قويًا بين الامتصاصية والتركيز، استنادًا إلى ثلاثة معايرات مستقلة.
تحديد أيونات النيتريت ()
تم تحديد تركيز النيتريت باستخدام مطيافية الأشعة فوق البنفسجية والمرئية مع إعداد كاشف اللون كما يلي: تم إضافة 0.02 جرام من N -(1-نافثيل) إيثيلين ثنائي الأمين ثنائي الهيدروكلوريد و0.4 جرام من p-أمينوبنزين سلفوناميد بشكل متتابع إلى خليط من 5 مل من الماء المنزوع الأيونات و1 مل من حمض الفوسفوريك، وتم خلط المحلول جيدًا. لقياس تركيز النيتريت، تم أخذ كمية معينة من الكاثوليت وتخفيفها إلى 5 مل. ثم، تم إضافة 0.1 مل من كاشف اللون المحضر إلى محلول 5 مل وخلطه جيدًا. بعد السماح للخليط بالجلوس لمدة 20 دقيقة، تم قياس الامتصاص عند 540 نانومتر. تم بناء منحنى معايرة التركيز-الامتصاص باستخدام سلسلة من المعايير.حلول.
تحديد أول أكسيد الكربون (CO)، الهيدروجين ( ) و ثنائي النيتروجين ( )
المبالغ من، و تم قياسها بواسطة جهاز الكروماتوغراف الغازي المتصل (7890B، أجيليت) المزود بجهاز الكشف الحراري (TCD) وجهاز الكشف اللهبي (FID).
حسابات معدل إنتاج اليوريا المتوسط و FE
تم تحديد إنتاج اليوريا من خلال قياس امتصاص الكاثوليت باستخدام مطياف الأشعة فوق البنفسجية والمرئية. تم الحصول على تركيز اليوريا في الإلكتروليت من خلال الإشارة إلى منحنى معايرة امتصاص تركيز اليوريا. ثم تم حساب العائد بناءً على وقت الاختبار، كما هو موضح في الصيغة التالية:
أين اليوريا هي تركيز اليوريا المقاس ( ) ، هو الحجم الكلي للإلكتروليت (مل)هو الوقت (س) للتفاعل الكهروكيميائي وهو تحميل المحفزات (ملغ). الكفاءة فاراداي (FE) لليوريا هي نسبة الشحنة المستهلكة لتخليق اليوريا خلال وقت التحليل الكهربائي إلى إجمالي الشحنة المارة. يمكن حسابها باستخدام ما يلي صيغة:
أين هو ثابت فاراداي ( ) و هو الشحنة الكلية التي مرت عبر القطب العامل (C).
حسابات معدل إنتاج الأمونيا المتوسط و FE
يتم حساب معدل إنتاج الأمونيا من خلال قياس امتصاص الكاثوليت باستخدام مطياف الأشعة فوق البنفسجية والمرئية، وتحديد تركيز الأمونيا في الإلكتروليت بناءً على منحنى قياسي للتركيز-الامتصاص، ثم استخدام وقت الاختبار لحساب العائد. الصيغة المحددة هي كما يلي:
أينهو المقاستركيز ) ، هو الحجم الكلي للإلكتروليت (مل)هو الوقت (س) لـتفاعل الاختزال و m هو تحميل المحفز (ملغ). تشير الكفاءة فاراداي (FE) في تخليق الأمونيا إلى نسبة الشحنة المستخدمة لإنتاج الأمونيا خلال وقت التحليل الكهربائي إلى إجمالي الشحنة المارة، ويتم حسابها باستخدام الصيغة التالية:
أين هو ثابت فاراداي ( ) و هو الشحنة الكلية التي مرت عبر القطب العامل (C).
تحليل منتج CER
تم تحليل المنتجات الناتجة باستخدام كروماتوغرافيا الغاز (GC) وطيف الرنين المغناطيسي النووي على جهاز رنين مغناطيسي نووي بتردد 400 ميجاهرتز. المنتجات الغازية منتم الكشف عن وتقليل المركبات مثل أول أكسيد الكربون، والميثان، والإيثيلين، والإيثان، والبروبلين باستخدام جهاز كروماتوغرافيا الغاز مع كاشف تأين اللهب (FID) وفرن تحويل النيكل. تم قياس الهيدروجين كميًا باستخدام كاشف الموصلية الحرارية (TCD). تم تحديد المنتجات السائلة، بما في ذلك حمض الفورميك، باستخدام الرنين المغناطيسي النووي (NMR)، مع استخدام ثنائي ميثيل سلفوكسيد (DMSO) كمعيار داخلي. لتحليل NMR، تم خلط 0.5 مل من إلكتروليت KOH، الذي تم جمعه بعد التحليل الكهربائي، معمن و من DMSO يحتوي على 5 مللي مول كمعيار داخلي. الـتم تسجيل طيف NMR مع تقليل الماء باستخدام تقنية ما قبل التشبع. تم تحديد الكفاءة فاراداي بناءً على منحنى المعايرة باستخدام الصيغة التالية:
أين هو العدد الإجمالي لنقل الإلكترونات للمنتج، هو تركيز المنتج، هو حجم الإلكتروليت أو الغازات، NA: ثابت أفوجادرو، هو عدد الإلكترونات المنقولة لتكوين المنتج، هو الإلكترون، هو عدد رسوم التحويل،هو العدد الإجمالي للإلكترونات المنقولة.
حسابات-اختيارية و-اختيارية
تم تحديد انتقائية إنتاج اليوريا (انتقائية Nurea) باستخدام المعادلة التالية:
في هذه المعادلة،يشير إلى عدد مولات النيتروجين الموجودة في اليوريا المنتجة، بينمايمثل إجمالي مولات النيتروجين في جميع المنتجات الناتجة من النترات. الـتم حساب الانتقائية على النحو التالي:
هنا،يمثل عدد مولات الكربون الموجودة في اليوريا المنتجة، ويشير إلى إجمالي مولات الكربون في جميع المنتجات المشتقة من.
الطريقة الحسابية
تم إجراء جميع الحسابات باستخدام حزمة محاكاة فيينا Ab Initio (VASP) مع نظرية الكثافة الوظيفية (DFT). تم تطبيق إمكانيات الموجة المعززة بالمشاريع (PAW) ووظيفة التبادل والتفاعل Perdew-Burke-Ernzerhof (PBE) ضمن تقريب التدرج العام (GGA). لالتقاط التفاعلات البعيدة المدى فان دير فالز (vdW)، تم استخدام تصحيح DFT-D3. تم استخدام حد طاقة موجة مستوية قدره 500 إلكترون فولت، وتم تعيين معيار تقارب المجال الذاتي المتسق (SCF) إلىتم إجراء تحسين الهندسة باستخدام طريقة التدرج المترافق، مع تقارب القوى على كل ذرة تحتتم استخدام نموذج المذيب الضمني VASPsol مع نفاذية الماء البالغة 78.4 لأخذ تأثير الإذابة في الاعتبار.. الـ يتم الحصول على النموذج عن طريق حذف بعض ذرات الأكسجين من خلية الوحدة) ثم تحسين الشبكة وموقع الذرات. تم تحسينلديه معلمات الشبكة، . الـتم استخدام مجموعة شبكة ذات نقاط-نماذج الألواح المركبة.تم الحصول على النموذج باستخدامخلية الوحدة، وتم الحصول على النموذج أيضًا باستخدامخلية الوحدة. لأخذ التفاعل الكهروستاتيكي في الموقع بين إلكترونات 3d للنحاس في الاعتبار،تم استخدام نهج مماثل بقيمة UJ تبلغ 4 إلكترون فولت. لاحظ أنلا يستخدم GGA +U. يمكن الحصول على تغيير الطاقة الحرة للتفاعل باستخدام المعادلة أدناه:
أينهو الفرق في الطاقة الكلية قبل وبعد الامتصاص الوسيط، و هي، على التوالي، الفروق في طاقة النقطة الصفرية والإنتروبيا. تم الحصول على طاقة النقطة الصفرية والإنتروبيا للجزيئات الحرة والمواد الماصة من حسابات التردد الاهتزازي. نظرًا لأن VASP لا يمكنه وصف النظام المشحون بدقة، فإن طاقةيجب قياسه وفقًا لهذه الأدبيات. بالإضافة إلى ذلك، كلما زادت قيمة الرقم الهيدروجيني، زادت صعوبة عملية البروتنة. لذلك، من الأهم أن نأخذ في الاعتبار قيمة رقم هيدروجيني معقولة لتحديد تفاعل المنافسة. عند إدخال الرقم الهيدروجيني، يتم الحصول على تغير الطاقة الحرة لجيبس لجميع عمليات البروتنة من خلال المعادلة التالية:
أين هو ثابت بولتزمان، و هي درجة الحرارة، هنا تؤخذ كـ 298.15 كلفن. قيمة pH المستخدمة في هذه المقالة محددة بـ 9. يتم تحديد مسار التفاعل بالكامل خطوة بخطوة من خلال اختيار الخطوة ذات أقل طاقة تفاعل بين البروتنة، الامتزاز، إزالة الامتزاز، والترابط.
توفر البيانات
تم إيداع ملف بيانات المصدر في Figshare تحت رمز الوصول DOIالبيانات الخام للأرقام في المخطوطة الرئيسية متاحة في figshare مع المعرف (المعرفات)https://doi.org/10.6084/m9. figshare.27964467. جميع البيانات الأخرى اللازمة لتقييم الاستنتاجات في الورقة موجودة في الورقة والمعلومات التكميلية أو يمكن الحصول عليها من المؤلفين المقابلين عند الطلب. تم توفير بيانات المصدر مع هذه الورقة.
توفر الشيفرة
يمكن الحصول على الشيفرة المستخدمة في هذا العمل من المؤلفين المعنيين عند الطلب.
References
Zhang, X. et al. Managing nitrogen for sustainable development. Nature 528, 51-59 (2015).
Erisman, J. W. et al. How a century of ammonia synthesis changed the world. Nat. Geosci. 1, 636-639 (2008).
Chen, J. et al. Schrock, Beyond fossil fuel-driven nitrogen transformations. Science 360, 6391 (2018).
F. M. a. M. P. Francesco Barzagli. From greenhouse gas to feedstock: formation of ammonium carbamate from and in organic solvents and its catalytic conversion into urea under mild conditions. Green Chem. 13, 1267-1274 (2011).
Service, R. F. Chemistry New recipe produces ammonia from air, water, and sunlight. Science 345, 610-610 (2014).
Chen, C. et al. Coupling and in to synthesize urea under ambient conditions. Nat. Chem. 12, 717-724 (2020).
Meng, N. et al. Electrosynthesis of urea from nitrite and over oxygen vacancy-rich ZnO porous nanosheets. Cell Rep. Phys. Sci. 2, 100378 (2021).
Lv, C. et al. Selective electrocatalytic synthesis of urea with nitrate and carbon dioxide. Nat. Sustain. 4, 868-876 (2021).
Geng, J. et al. Ambient electrosynthesis of urea with nitrate and carbon dioxide over iron-based dual-sites. Angew. Chem. Int. Ed 62, e202210958 (2023).
Wei, X. et al. Oxygen vacancy-mediated selective C-N coupling toward electrocatalytic urea synthesis. J. Am. Chem. Soc. 144, 11530-11535 (2022).
Zhang, X. et al. Identifying and tailoring C-N coupling site for efficient urea synthesis over diatomic Fe-Ni catalyst. Nat. Commun. 13, 5337 (2022).
Yuan, M. et al. Highly selective electroreduction of and to urea over artificial frustrated lewis pairs. Energy Environ. Sci. 14, 6605-6615 (2021).
Wang, Y. et al. Nitrate electroreduction: mechanism insight, in situ characterization, performance evaluation, and challenges. Chem. Soc. Rev. 50, 6720-6733 (2021).
Chen, W. et al. Unveiling the electrooxidation of urea: Intramolecular coupling of the N-N bond. Angew. Chem. Int. Ed. 60, 7297-7307 (2021).
Yuan, M. et al. Unveiling electrochemical urea synthesis by CoActivation of and with Mott-Schottky heterostructure catalysts. Angew. Chem. Int. Ed. 60, 10910-10918 (2021).
. et al. Kinetically matched coupling toward efficient urea electrosynthesis enabled on copper single-atom alloy. Nat. Commun. 14, 6994 (2023).
Feng, Y. et al. Te-doped Pd nanocrystal for electrochemical urea production by efficiently coupling carbon dioxide reduction with nitrite reduction. Nano Lett. 20, 8282-8289(2020).
Zhu, X. et al. Electrochemical synthesis of urea on MBenes. Nat. Commun. 12, 4080 (2021).
Wang, P. et al. Molecular assembled electrocatalyst for highly selective fixation to products. ACS Nano 16, 17021-17032 (2022).
Yang, Y. et al. Operando studies reveal active Cu nanograins for electroreduction. Nature 614, 262-269 (2023).
Yao, K. et al. Mechanistic insights into OC-COH coupling in electroreduction on fragmented copper. J. Am. Chem. Soc. 144, 14005-14011 (2022).
Zhao, Z. et al. Polydopamine coating of a metal-organic framework with Bi -copper sites for highly selective electroreduction of to products. ACS Catal. 12, 7986-7993 (2022).
Zhu, C. et al. Dynamic restructuring of epitaxial Au-Cu biphasic interface for tandem -to- alcohol conversion. Chem. 8, 3288-3301 (2022).
Zhu, H. et al. A porous stacking framework with dicopper(I) sites and adjacent proton relays for electroreduction of to products. J. Am. Chem. Soc. 144, 13319-13326 (2022).
Wei, X. et al. Dynamic reconstitution between copper single atoms and clusters for electrocatalytic urea synthesis. Adv. Mater. 35, 2300020 (2023).
Pan, L. et al. Single-atom or dual-atom in nanosheet: Which is the better choice for electrocatalytic urea synthesis? Angew. Chem. Int. Ed. 62, e202216835 (2023).
Leverett, J. et al. Tuning the coordination structure of Cu-N-C single atom catalysts for simultaneous electrochemical reduction of and to urea. Adv. Energy Mater. 12, 2201500 (2022).
Meng, N. et al. Oxide-derived core-shell Cu@Zn nanowires for urea electrosynthesis from carbon dioxide and nitrate in water. ACS Nano 16, 9095-9104 (2022).
Liu, S. et al. AuCu nanofibers for electrosynthesis of urea from carbon dioxide and nitrite. Cell Rep. Phys. Sci. 3, 100869 (2022).
Shin, S. et al. Copper with an atomic-scale spacing for efficient electrocatalytic co-reduction of carbon dioxide and nitrate to urea. Energy Environ. Sci. 16, D3EE00008G (2023).
Mukherjee, J. et al. Understanding the site-selective electrocatalytic Co-reduction mechanism for green urea synthesis using copper phthalocyanine nanotubes. Adv. Funct. Mater. 32, 2200882 (2022).
Li, Z. et al. Magic hybrid structure as multifunctional electrocatalyst surpassing benchmark Pt/C enables practical hydrazine fuel cell integrated with energy-saving production. eScience 2, 416-427 (2022).
Liu, Y. et al. Manipulating dehydrogenation kinetics through dualdoping electrode enables highly efficient hydrazine oxidation assisting self-powered production. Nat. Commun. 11, 1853 (2020).
Li, Y. et al. Partially exposed surface in hybrid structure endows its bifunctionality for hydrazine oxidation and hydrogen evolution catalysis. Sci. Adv. 6, eabb4197 (2020).
Platzman, I. et al. Oxidation of polycrystalline copper thin films at ambient conditions. J. Phys. Chem. C 112, 1101-1108 (2008).
Li, D. et al. Accelerating electron-transfer dynamics by immobilized reversible single-atom copper for enhanced artificial photosynthesis of urea. Adv. Mater. 34, 2207793 (2022).
Wang, Y. et al. Unveiling the activity origin of a copper-based electrocatalyst for selective nitrate reduction to ammonia. Angew. Chem. Int. Ed. 59, 5350-5354(2020).
Larson, P. X-Ray Induced photoelectron and auger-spectra of Cu, , and thin-films. J. Electron Spectrosc 4, 213-218 (1974).
Hu, Y. et al. Fabrication of coral-like nanoelectrode for solar hydrogen generation. J. Power Sources 242, 541-547 (2013).
Mao, Y. et al. Electrochemical synthesis of hierarchical stars with enhanced photoelectrochemical properties. Electrochim. Acta 62, 1-7 (2012).
Cheng, W. et al. Lattice-strained metal-organic-framework arrays for bifunctional oxygen electrocatalysis. Nat. Energy 4, 115-122 (2019).
Zhao, Y. et al. Efficient urea electrosynthesis from carbon dioxide and nitrate via alternating Cu-W bimetallic C-N coupling sites. Nat. Commun. 14, 4491 (2023).
Chitsiga, T. et al. Effect of the presence of water-soluble amines on the carbon dioxide ( ) adsorption capacity of amine-grafted poly-succinimide (PSI) adsorbent during capture. Energy Procedia 86, 90-105 (2016).
Manivannan, M. Investigation of inhibitive action of urea- system in the corrosion control of carbon steel in sea water. Int. J. Eng. Sci. Technol. 3, 0975-5462 (2011).
Zhang, S. et al. High-efficiency electrosynthesis of urea over bacterial cellulose regulated Pd-Cu bimetallic catalyst. EES Catal. 1, 45-53 (2023).
Xiao, H. et al. Cu metal embedded in oxidized matrix catalyst to promote activation and CO dimerization for electrochemical reduction of . Proc. Natl Acad. Sci. 114, 6685-6688 (2017).
Jiao, D. et al. monolayer as a superior electrocatalyst for urea synthesis from nitrogen and carbon dioxide fixation: a computational study. Energy Environ. Mater. 2, 12496 (2022).
Roy, Prodyut et al. Dual-Silicon-Doped Graphitic Carbon Nitride Sheet: An Efficient Metal-Free Electrocatalyst for Urea Synthesis. J. Phys. Chem. Lett. 12, 10837-10844 (2021).
Fields, M. et al. Role of subsurface oxygen on Cu surfaces for electrochemical reduction. J. Phys. Chem. C 122, 16209-16215 (2018).
Liu, X. et al. Mechanism of C-N bonds formation in electrocatalytic urea production revealed by ab initio molecular dynamics simulation. Nat. Commun. 13, 5471 (2022).
Yang, G. et al. Gaseous coupling with N-Containing intermediates for key C-N bond formation during urea production from coelectrolysis over Cu. ACS Catal. 12, 11494-11504 (2022).
Li, H. et al. Ligand engineering towards electrocatalytic urea synthesis on a molecular catalyst. Nat. Commun. 15, 8858 (2024).
Wei, J. et al. Constructing Co@C nanoparticles with chainmailstructure for highly efficient hydroformylation of 1-hexene. Chem. Eng. J. 492, 151963 (2024).
Mathew, K. et al. Implicit Solvation Model for Density-Functional Study of Nanocrystal Surfaces and Reaction Pathways. J. Chem. Phys. 140, 084106 (2014).
Dai, Z. et al. Surface Engineering on bulk for efficient electrosynthesis of Urea, Figshare, https://doi.org/10.6084/m9. figshare. 27964467 (2025).
شكر وتقدير
يقر G.Q.Z. بمؤسسة العلوم الطبيعية الوطنية في الصين (رقم المنحة 52072359)، وبرنامج توظيف الخبراء العالميين، وصناديق البحث الأساسية للجامعات المركزية (WK2060000016). تم إجراء الحسابات العددية في هذه الورقة في مركز الحوسبة الفائقة بجامعة العلوم والتكنولوجيا في الصين. المؤلفون ممتنون لخط الأشعة تحت الحمراء (BLO1B) في NSRL لدعم وقت التجربة. تم تنفيذ هذا العمل جزئيًا في مركز أدوات العلوم الفيزيائية بجامعة العلوم والتكنولوجيا في الصين.
مساهمات المؤلفين
ساهم ز.س.د. و ج.ق.ز. في تصور الدراسة. قام ز.س.د. بإجراء التجارب. أجرى ي.إكس.س. تحليل الكثافة الوظيفية.
تحليل حسابات النظرية (DFT). قدم H.K.Z. المساعدة في تحليل المجهر الإلكتروني الماسح (SEM) وساعد في تحليل الطيف الكهرومغناطيسي بالأشعة تحت الحمراء فورييه (FTIR) في الموقع. قدم M.Y.C. وB.C.Z. وP.Y.F. وY.F.F. المساعدة في الجزء التجريبي. ساهم G.Q.Z. بشكل كبير في التحليل وإعداد المخطوطة. تم الإشراف على المشروع من قبل G.Q.Z. شارك جميع المؤلفين في التحليل من خلال مناقشات بناءة.
يجب توجيه المراسلات والطلبات للحصول على المواد إلى جينكيانغ تشانغ.
معلومات مراجعة الأقران تشكر مجلة Nature Communications براناب ساركار والمراجعين المجهولين الآخرين على مساهمتهم في مراجعة هذا العمل. يتوفر ملف مراجعة الأقران.
ملاحظة الناشر: تظل شركة سبرينجر ناتشر محايدة فيما يتعلق بالمطالبات القضائية في الخرائط المنشورة والانتماءات المؤسسية.
الوصول المفتوح هذه المقالة مرخصة بموجب رخصة المشاع الإبداعي النسب-غير التجارية-عدم الاشتقاق 4.0 الدولية، التي تسمح بأي استخدام غير تجاري، ومشاركة، وتوزيع، وإعادة إنتاج في أي وسيلة أو صيغة، طالما أنك تعطي الائتمان المناسب للمؤلفين الأصليين والمصدر، وتوفر رابطًا لرخصة المشاع الإبداعي، وتوضح إذا قمت بتعديل المادة المرخصة. ليس لديك إذن بموجب هذه الرخصة لمشاركة المواد المعدلة المشتقة من هذه المقالة أو أجزاء منها. الصور أو المواد الأخرى من طرف ثالث في هذه المقالة مشمولة في رخصة المشاع الإبداعي الخاصة بالمقالة، ما لم يُشار إلى خلاف ذلك في سطر الائتمان للمادة. إذا لم تكن المادة مشمولة في رخصة المشاع الإبداعي الخاصة بالمقالة وكان استخدامك المقصود غير مسموح به بموجب اللوائح القانونية أو يتجاوز الاستخدام المسموح به، فستحتاج إلى الحصول على إذن مباشرة من صاحب حقوق الطبع والنشر. لعرض نسخة من هذه الرخصة، قم بزيارة http:// creativecommons.org/licenses/by-nc-nd/4.0/. (ج) المؤلف(ون) 2025
مركز هيفي الوطني للبحوث في العلوم الفيزيائية على المقياس المجهري، مختبر المواد الرئيسي لتحويل الطاقة، قسم علوم المواد والهندسة، جامعة العلوم والتكنولوجيا في الصين، 230026 هيفي، آنهوي، الصين.ساهم هؤلاء المؤلفون بالتساوي: زيشوان داي، يانكسو تشين. البريد الإلكتروني:gqzhangmse@ustc.edu.cn
Electrochemical urea synthesis has recently emerged as a fascinating energyefficient alternative route, while it remains challenging to achieve simultaneously high production rate and Faradaic efficiency. Herein, we realize an energy-favorable electrochemical C-N coupling path through CO2 and NO3 coreduction at the heterointerfaces of microparticles, generated by insitu electrochemical engineering on bulk . We achieve urea production rate of with a corresponding Faradaic efficiency of at -0.3 V (versus RHE) under ambient conditions. Operando synchrotron radiation-Fourier transform infrared spectroscopy, along with theoretical calculations, reveals the coupling of intermediates and at the heterointerfaces, benefiting from the modified electronic structure. This work provides a practical route for catalyst design and insights into urea electrosynthesis systems.
Urea as one of the most significant nitrogen fertilizers, not only serves as agricultural product to meet the needs of the growing population, but also the industrial chemical feedstock to manufacture various chemicals . Conventionally, urea synthesis is conducted by Haber-Bosch and Bosch-Meiser processes containing two consecutive reaction steps , which require harsh conditions ( ) with more than of global energy consumption . Compared with the conventional approach, the electrochemical coupling approach using and the available nitrogen sources ( and ) in daily life is a “kill twobird with one stone” decision for urea production featuring reactant sustainability and the overall energy efficiency, where some pioneering progresses have been achieved . Very recently, Wang et al. reported a urea electrosynthesis strategy by using and as reactants with a yield rate of and faradaic efficiency (FE) of using PdCu nanoparticle anchored on nanosheets . Moreover, Zhang et al. reported the vacancy-rich ZnO porous nanosheets which realize electrosynthesis of urea from and with a higher FEs . Although these inspiring breakthroughs, it remains grand challenge to achieve “all-round high” (high urea yield rate, FE, selectivity and stability) for urea electrosynthesis owing to the limitations of
ideal electrocatalysts . More importantly, the development of unique coupling path is still at the infant stage, where much input should be devoted in order to provide protocols for catalyst design, aiming to achieve efficient and cost-effective urea electrosynthesis.
Copper-based materials have been developed as a family of catalysts for to generate multi-carbon products upon niche control over the real active sites for C-C coupling . Very recently, some pioneering work demonstrated the possibility to activate the coupling capability of Cu-based catalysts for urea electrosynthesis by engineering its electronic structure . For example, Wang et al. reported that the Cu single atoms can be utilized for electrocatalytic urea synthesis upon the coupling of and intermediates, achieving a yield rate of at -1.6 V with the Faradaic efficiency of . Subsequently, Pan et al. disclosed that constructing dual-atom catalyst can effectively enhance the yield rate to with a higher Faradaic efficiency of upon a distinctive coupling path . These results stimulated the unremitting dedication to explore more efficient coupling path by engineering Cu based catalyst in order to further push the limits of yield rate and FE for urea electrosynthesis. The major bottleneck issues in current stage include: (i) The exploration of
scalable yet cost-effective strategy for active sites manipulation in Cubased catalysts to activate unique yet energy favorable coupling path; (ii) The systematic yet in-depth investigation on the underlying catalytic mechanism in order to generate protocol for future development; (iii) The proof-of-concept demonstration for the practicability on the urea electrosynthesis in two-electrode system.
Herein, we discovered a unique coupling pathway of and intermediates for urea electrosynthesis achieved by constructing heterointerfaces through in situ electrochemical reduction of bulk , where all-round high electrochemical performance, i.e. an average yield rate of at -0.3 V (versus RHE), as well as high FE of , nitrogen selectivity ( -selectivity) and carbon selectivity ( -selectivity) of . Utilizing Operando synchrotron radiation-Fourier transform infrared spectroscopy (SR-FTIR) and in situ Raman spectroscopy, we revealed the formation of C-N chemical bonds and elucidated the dynamic changes of C and N intermediate species during the electrochemical coupling cascade for urea synthesis. Specifically, it is suggested that the h- MPs was effective for the formation of NOH* intermediates, resulting in a large quantity of and intermediates at the heterointerface, which also acts as coupling active sites, leading to an low
energy barrier for urea formation. Density functional theory (DFT) calculations show that the electron transfer at the heterointerfaces not only produces more thermally neutral bond free energies ( ) but also forms unique active sites, compared to pure Cu or . As a proof-of-concept demonstration for practicability, the two-electrode system coupled with hydrazine oxidation reaction (HzOR) can improve the overall current up to times (from 5 to , leading to an increased cathodic urea yield up to .
Results and discussion
Primarily, we prepared h- MPs via electrochemical reduction of commercial bulk particles with average sizes of (Supplementary Fig. 1). The electrochemical reduction conditions involve the reduction of bulk material at -1.5 V versus RHE for 1200 s . The X-ray diffraction (XRD) pattern of the samples (Fig. 1a) ensures the co-existence of both Cu (JCPDS No. 89-2838) and (JCPDS No. 050667) phases after electrochemical reduction process, implying the formation of MPs. The morphology of MPs (Supplementary Fig. 2) exhibits no obvious variation compared with that of bulk (Supplementary Fig. 3). However, high-resolution
Fig. 1 | Morphological and structural characterizations of the MPs. a XRD patterns of h- MPs and bulk . b, c HRTEM images of h- MPs. d XPS spectra of Cu 2 p of and h- MPs. e Cu LMM AES spectra of and MPs. Potential-dependent (f) in situ XPS curves of Cu LMM
AES spectra of bulk under electrochemical reduction. (g) in situ electrochemical Raman spectra of bulk under electrochemical reduction. Source data for Fig. 1 are provided as a Source Data file.
transmission electron microscopy (HRTEM) analysis (Fig. 1b) provides direct evidence for the formation of heterointerfaces at the surface, where the spacing of lattice fringes of 0.204 nm can be indexed to (111) planes of Cu phase (Fig. 1c), which is consistent with selected-area electron diffraction (SAED) patterns (Supplementary Figs. 4, 5). The high-angle annular dark-field scanning TEM (HAADFSTEM) and energy-dispersive X-ray spectroscopy (EDS) mapping results (Supplementary Fig. 6) show that Cu and O elements are evenly distributed on the surface of h- MPs, with an atomic ratio of Cu to O approximately 2.5:1. Accordingly, the comparing Cu 2p spectra (Fig. 1d) clearly suggest that two peaks at about 933 and 952 eV can be observed, assigning to or , respectively . The change of O 1 s signal before and after electrochemical reduction shows that MPs have more O in chemisorbed state after activation (Supplementary Fig. 7). Moreover, the Cu LMM AES spectrum (Fig. 1e) further confirms the existence of and . To analyze the phase transformation of bulk during electroreduction, we conducted an in-situ XPS study, the schematic diagram of the setup is shown in Supplementary Fig. 8. It can be seen from Fig. If that within the range of test potential ( -0.1 to -0.4 V versus RHE), the signal of gradually increases with the increase of potential, and the potential is increased to -1.5 V . The and signals in h- MPs samples obtained after 1200 s reduction are still coexisting. In situ Raman spectroscopy (Fig. 1 g ) further confirms the surface reconstruction from to Cu evidenced by the gradually weakening peak intensity at 218 and upon the increasing applied voltages .
To confirm the unsaturated coordination environment, the Cu K-edge X-ray absorption near-edge spectra (XANES) were carried out as exhibited in Fig. 2a. The pre-edge of the Cu K-edge absorption edge position for h- MPs NWs is close to Cu yet shift to lower energy compared to that of pure , which gives direct evidence for the partial surface reduction derived unsaturated coordination of the in . The Fourier transform extended X-ray absorption fine structure (FT-EXAFS) curves of MPs for and bond (Fig. 2b, c) increased from 1.84 to and from 2.57 to , respectively, compared with those of pure , suggesting the structural distortion of MPs due to the introduction of . The coordination structure of the MPs was further analyzed by fitting the k3-weighted FT-EXAFS curves. As shown in Supplementary Table 4, the coordination number (CN) of the in is about 6.6, which decreased to 5.4 in h- MPs, demonstrating that the Cu atom with unsaturated coordination environment was indeed generated after the electrochemical reduction treatment. The wavelet transform (WT) EXAFS analysis in both K and spaces (Fig. 2d) provides intuitive indication for the difference in and coordination in MPs.
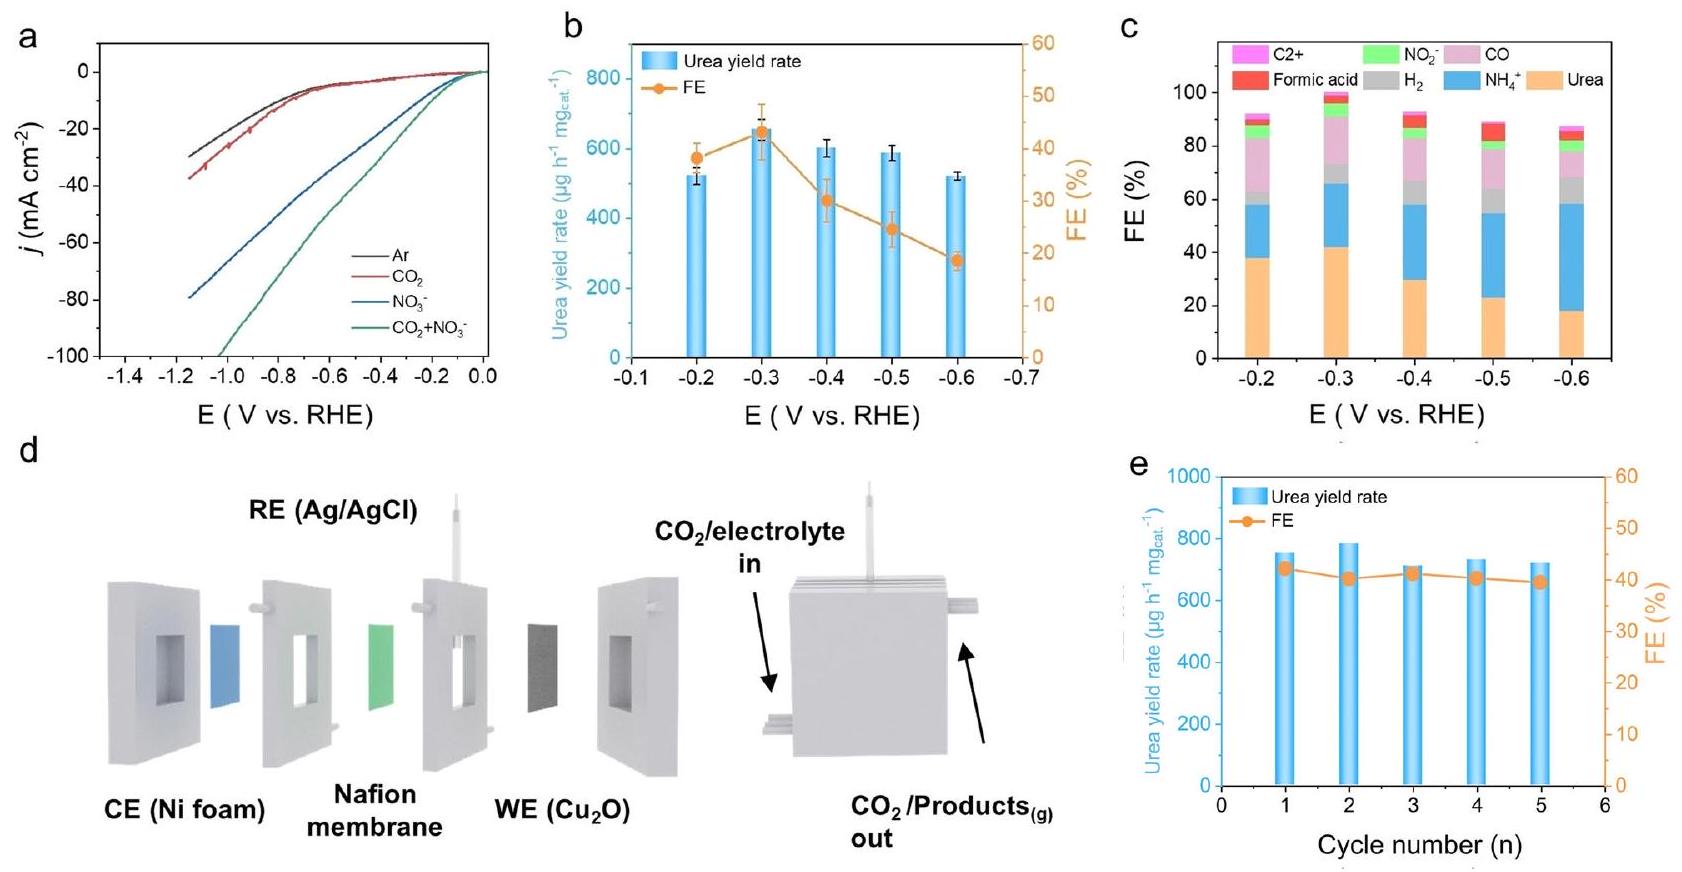
The urea electrosynthesis performance of MPs was measured in an H-type electrolytic cell (Supplementary Fig. 9). “The concentration of was set to 0.05 M , which was obtained through concentration treatments of nitrate wastewater, including evaporation and reverse osmosis. The comparing LSV curves (Fig. 3a) show that it exhibits the highest current density with the coexistence of and in the electrolyte, compared with that with only or , implying the possible coupling reaction. The amounts of urea and ammonia produced were then quantitatively determined by both diacetylmonoxime method and NMR (Methods and Supplementary Figs. 10-15). tests were performed for 2 h for each potential in the range -0.2 to -0.6 V (versus RHE) in the flow-cell (Supplementary Fig. 16). According to the violet-visible(UV-Vis) results (Supplementary Fig. 17), the urea yield rate can reach as high as under a superior FE of for h MPs at -0.3 V versus RHE (Fig. 3b). In addition, the FE of other major products including ammonia, carbon monoxide, nitrite, formic acid, C2+ product and hydrogen was clibrated as shown in Fig. 3c.
We also studied the relationship between the HER (Hydrogen Evolution Reaction) and coupling reactions through the LSV curves of coupled reactions and HER (Supplementary Fig. 18). Meanwhile, Since there are more products in the nitrate reduction reaction at low potential, we independently studied the nitrate reduction performance of MPs, and found that the material has good nitrate reduction performance, and the nitrate reduction can produce ammonia and nitrite in the range of -0.2 to -0.6 V versus RHE, and can maintain about of the total FE (Supplementary Fig. 19). This also provides a prerequisite for MPs to become an coupled catalyst. Compared with metallic Cu and bulk, the h- MPs exhibits higher performance on urea yield rate and FE (Supplementary Fig. 20), which the synthetic of Cu in Supplementary Information. In addition, the product distribution of metallic Cu at various potentials, provided additional data in Supplementary Fig. 21. At the potential on -0.3 V (versus RHE), the Cu and have lower FE on coupling reaction ( and ). To investigate the relationship between the interface and the electrochemical performance in urea synthesis, a series of comparative experiments were conducted. Firstly, the reduction of pure under our testing conditions ( -0.3 V to -0.5 V versus RHE) resulted in the sample MPs, and the XRD curve comparison clearly shows that the reduction effect of under our testing conditions is not satisfactory (Supplementary Fig. 22). Secondly, a long-term stability test was performed on the MPs sample (Supplementary Figs. 23, 24). The change in material performance after 12 h of testing showed good stability, confirming that the performance of h- MPs is minimally affected under our testing environment (neutral to slightly alkaline, potential -0.2 V to -0.6 V versus RHE).
To investigate the relationship between interface content and performance, two sets of comparative experiments were conducted, synthesizing two batches of samples: (1) bulk material was electrochemically reduced with a fixed reduction time of 1200 s , and the reduction potential was adjusted ( ), resulting in a series of heterojunction samples (Supplementary Fig. 25). Urea electrochemical synthesis was performed under constant current for 2 h in a and environment at -0.3 V vs. RHE. (2) bulk material was electrochemically reduced with a fixed reduction potential of -1.5 V vs. RHE, and the reduction time was adjusted ( ) to obtain a series of samples for performance studies (Supplementary Fig. 26). These samples were electrolyzed at -0.3 V vs. RHE for 2 h for the electrochemical synthesis of urea under the conditions of this study. The results showed that at the initial stage of increasing interface content, the electrochemical performance of urea was positively correlated with the interface content. When the interface content reached a certain level (synthesis conditions: -1.5 V vs. RHE, 1200 s ), the electrochemical performance of urea tended to saturate. Previous extensive studies have shown that is completely reduced to pure Cu at high potentials. Therefore, we also investigated the performance when was completely reduced to pure Cu (Supplementary Fig. 20), and the results indicated a significant decrease in the electrochemical synthesis performance of urea on pure Cu. It can be concluded that as the reduction proceeds further, the degree of reduction to pure Cu increases, the interface content decreases, and the electrochemical performance for urea synthesis declines from its peak to a lower level comparable to pure Cu . In summary, the relationship between interface content and electrochemical urea synthesis initially shows a positive correlation, with the electrochemical performance reaching a peak and tending to saturate as the interface content reaches a certain level. When completely reduced to Cu , the interface disappears, and the urea performance significantly decreases.
Moreover, electrochemical active surface area (ECSA) was explored corresponding to the above samples (Supplementary Figs. 27, 28). The calculated ecsa is , and the current density curves under different potentials are normalized (Supplementary
Fig. 2 | The coordination environment of Cu. a Cu K-edge XANES spectra and (b) the corresponding k3-weighted functions of the FT-EXAFS spectra for MPs, and Cu foil. c FT-EXAFS fitting curves for MPs, ,
and Cu foil and (d) WT for the k3-weighted EXAFS signals of h- MPs, and Cu foil. Source data for Fig. 2 are provided as a Source Data file.
Fig. 28). To demonstrate the practicability, we utilized a flow cell with gas diffusion layer (GDL) electrodes, featuring an MPs cathode paired with a nickel foam anode, separated by a Nafion membrane (Fig. 3d). Compared with the H-type cell, the flow cell can further promote the urea yield rate up to (Supplementary Fig. 29). The test and CA result (Supplementary Fig. 30) exhibits the high stability of h- MPs, with a current density decay after 12 h . In addition, the distribution diagram of
electrochemically synthesized products in the flow cell system in the range of -0.2 to -0.6 V versus RHE is shown in Supplementary Fig. 31. The error-bar versions of Fig. 3c and Supplementary Fig. 31 are represented in Supplementary Fig. 32. We compared our urea synthesis performance with published literature and found that despite using a much lower potential than the state-of-the-art catalysts reported in the literature, our catalyst achieved comparable urea yield rate and FE, indicating its high efficiency for urea synthesis and the
Fig. 3 | Electrochemical synthesis of urea from MPs. a LSV curves of h MPs in , and saturated 0.5 M KHCO 3 electrolyte in the flow-cell. b Urea yield and Faraday efficiency of h- MPs at different applied potentials and (c) product distribution in the H-cell. d Schematic diagram
of three-electrode flow cell. e Consecutive urea synthesis stability test at -0.3 V versus RHE over MPs in three-electrode flow cell. Error bars show the standard deviations calculated from three independent experiments. Source data for Fig. 3 are provided as a Source Data file.
potential for energy savings. (Supplementary Table 1). Such high urea yield and FE can maintain outstanding stability with five successive runs (Fig. 3e) and CA results.
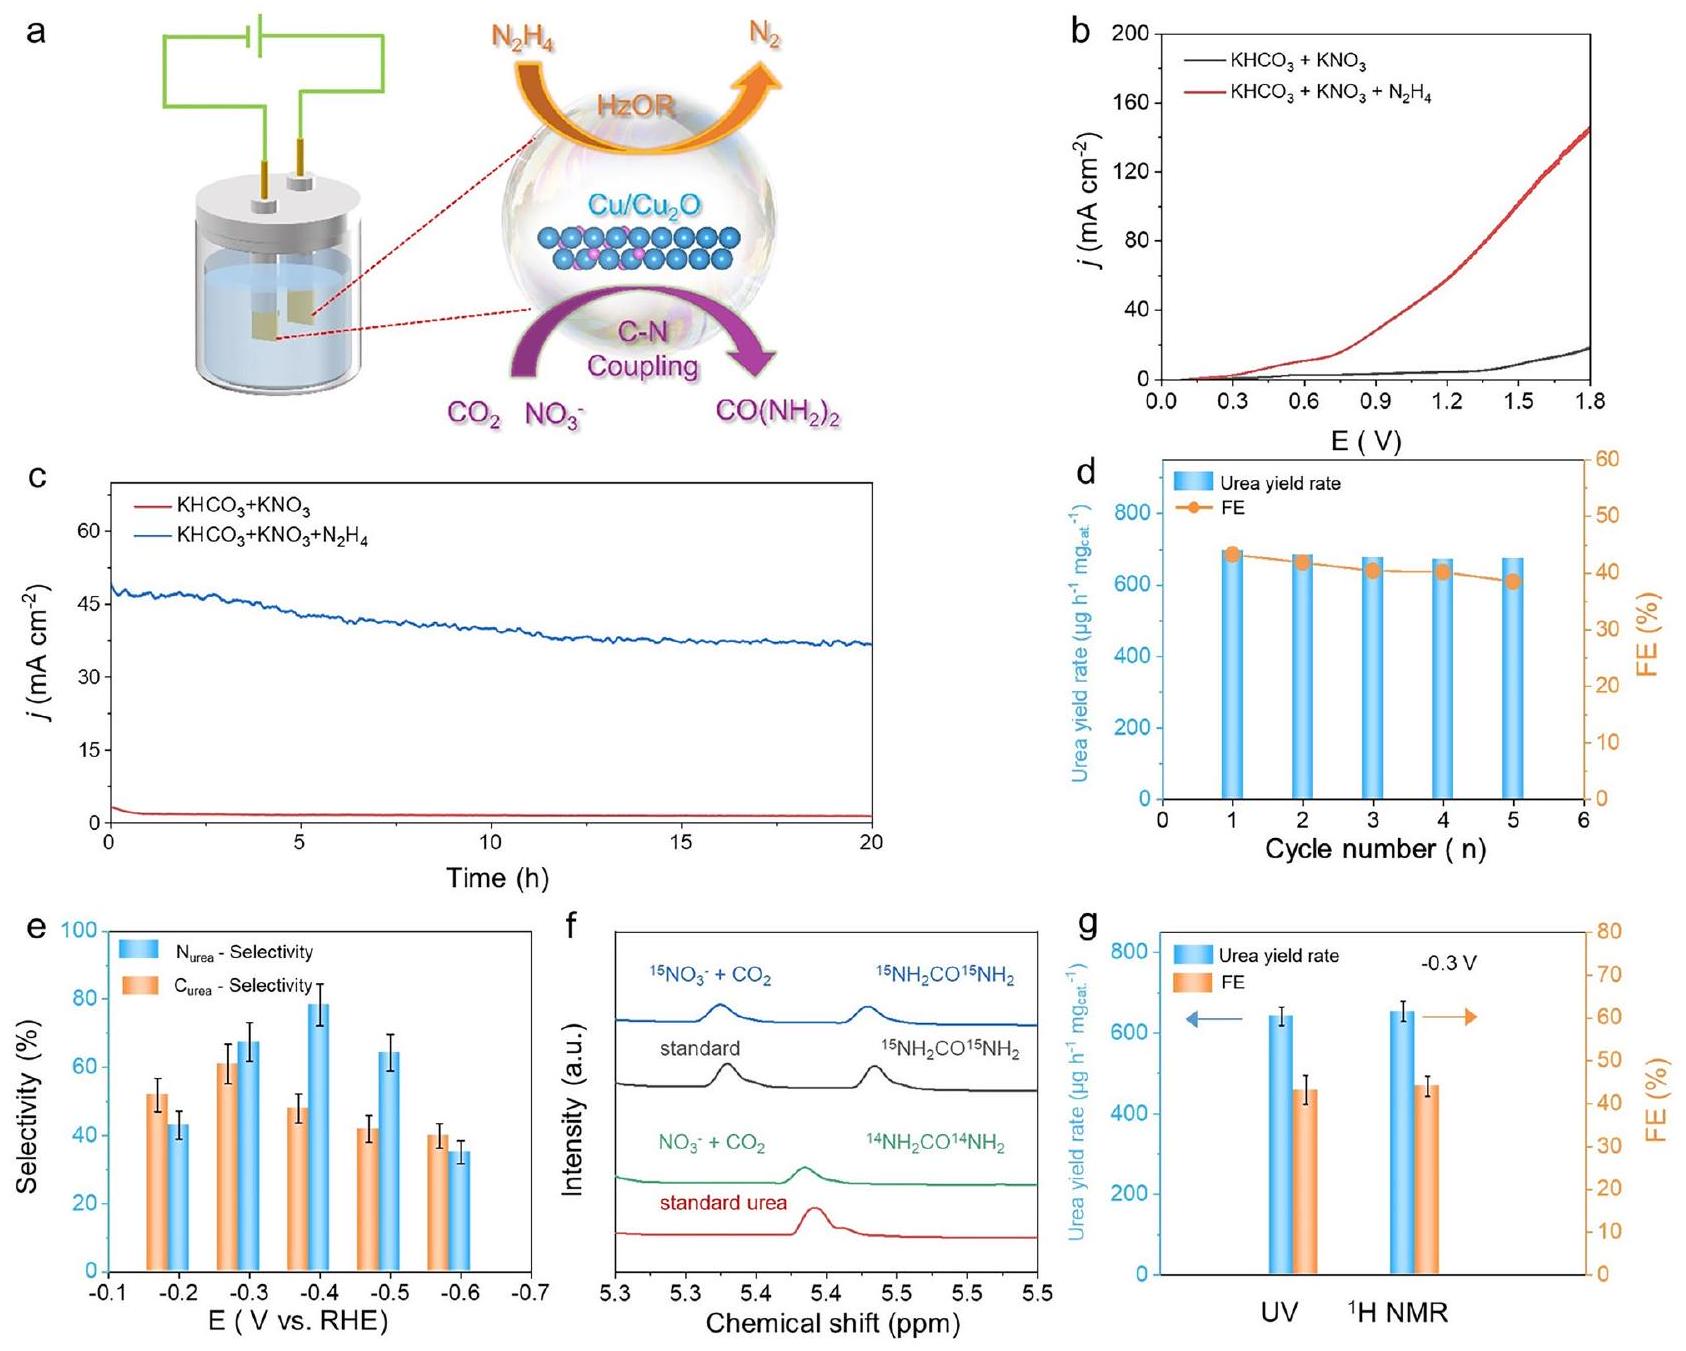
The relatively small current density has been considered as one of the limitations for scalable applications. In order to reduce the potential of urea synthesis process to increase urea yield, the lower thermodynamic potential of hydrazine oxidation ( -0.33 V vs RHE) is utilized to replace the anodic OER reaction (Fig. 4a), which can effectively enhance the current density of two-electrode system (Fig. 4b). To investigate other reactions in the two-electrode system, such as the oxidation of urea at the anode and the reduction of hydrazine at the cathode, we conducted a study. Firstly, we examined the LSV curves with and without urea in the system (Supplementary Fig. 33). It is evident that the LSV curves, with and without urea, essentially overlap within the potential range of . Combining this with our study on the Faradaic efficiency of formic acid as a product (Supplementary Fig. 34), we conclude that under the conditions of this study, urea does not undergo oxidation at the anode within the potential range of 0 to -1.8 V . It is challenging to rule out trace reactions such as the reduction of hydrazine at the cathode; therefore, we also investigated the system with a membrane flow cell. By comparing the LSV and the variations in other product contents with and without the membrane, we can infer that some potential reactions in the membrane system do not significantly impact the final performance under our testing conditions (Supplementary Figs. 35, 36). To investigate the stability of the twoelectrode system, both the cycling stability and long-time test at 1.5 V are conducted (Fig. 4c, d). In addtion, the FE change of the material during the t test is also detected at a unit interval of 5 h (Supplementary Fig. 37), which clearly suggest the durability. Inspiringly, the -selectivity can reach as high as at -0.4 V versus RHE (Fig. 4e). The isotopic labeling method (Fig. 4f and Supplementary Fig. 38) is utilized to confirm the source of the urea product . Furthermore, the reliability of the results is also validated by measuring the yield rate within both UV and nuclear magnetism method (Fig. 4g), where good agreement can be observed.
In order to explore the specific component information of the intermediates, we conducted a series of in-situ electrochemical experiments, including advanced in situ Raman experiments and operando SR-FTIR measurements (Supplementary Figs. 39-41), which are highly sensitive to the generated intermediates . The insitu Raman data in Fig. 5a were obtained in a three-electrode system under conditions of -0.1 to -0.4 V versus RHE, with electrochemical reduction performed for 5 min at each potential. The signal changes indicate a significant increase in the signal at with the increase of potential, providing strong evidence for the occurrence of coupling . Furthermore, with the increase of potential, the signals of at and at in the electrolyte system significantly decreased. In situ Raman experiments revealed the content changes of C and N species during the coupling reaction.
To further investigate the information of intermediates during the reaction process, in situ infrared experiments were conducted. The infrared signals were collected from 1100 to during the negative scan from -0.1 to -0.7 V versus RHE, with electrochemical reduction performed for 5 min at each potential. As shown in Fig. 5a, it can be clearly observed that the bond formation was favorably demonstrated, and the rate of bond formation gradually increased when tested at -0.3 V in the range of 1100 to . Operando SR-FTIR results from 2800 to confirmed the emergence of the bending mode at , which started to appear from -0.3 V (Fig. 5b). In the range from 1100 to , infrared bands were probed at (Fig. 5c), which are assignable to the bending mode and rocking mode of in urea. Infrared bands were probed at 1280 and , which originate from the bending and rocking modes of the bond in urea . In addition to the infrared bands of and , the stretching mode of can be observed at . Evidenced by the operando SR-FTIR results, the coupling is successfully realized for subsequent urea synthesis, correlating well with the electrocatalysis experiments. In contrast with free urea, the stretching frequency shift of implies that urea
Fig. 4 | Electrochemical synthesis of urea coupled with hydrazine Hydrate Oxidation Reaction in a two-electrode system. a Schematic diagram of Two electrode cell. b LSV curves in different electrolytes. c Chrono-amperometry curves in different electrolytes for 20 h . d Consecutive urea synthesis stability test over h MPs of two-electrode flow cell at 1.5 V . e Selectivity at different applied
potentials of three-electrode flow cell. isotope labeling test of three-electrode flow cell at -0.3 V versus RHE. g Comparison of UV and 1H NMR test results. Error bars show the standard deviations calculated from three independent experiments. Source data for Fig. 4 are provided as a Source Data file.
has coordinated with the existence of surface heterointerfaces ( ) through the oxygen atom of the group.
Additionally, the NHCO vibrational band arises at (Fig. 5d) . With the change of chemical bond energy under the accumulation of binding potentials, we can conclude that the strengthening of NHCO and is synchronous, while the bond gradually weakens with the formation of C-N. In summary, in-situ infrared Raman and infrared experiments confirm that MPs, as a catalyst, indeed form chemical bonds in the electrolyte environment.
Density functional theory (DFT) calculations were performed to investigate the source of site activity and the mechanism of coupling on the interface. Accurate models are needed to describe the Cu atom ( ) at the interface. is the active site for coupling and should have an O coordination number between (pure Cu atom), (low-coordinated atom), and (the coordinatively saturated copper) . The h- MPs model is shown in Fig. 6a, and the and Cu models are presented in Supplementary Figs. 42, 43, respectively (see SI section for modeling methods). The (111) surface on the left and the Cu (111) surface on the right form a stable interface, and the Cu site in the middle is sufficient to accurately describe . Due to the breaking of O
coordination, has a unique electronic structural characteristic, as demonstrated by the results of the Bader charge (Fig. 6b). On the surface of the site, lost an average of lost an average of 0 e, lost an average of 0.5 e , and lost an average of 0.3 eV . Meanwhile, the differential charge between the (111) phase and the Cu (111) phase (Fig. 6c) confirms that there is a built-in electric field between the two phases, and the electrons of the Cu (111) on the right tend to flow to the (111) on the left, which is consistent with the conclusion of Fig. .
To facilitate understanding, the occurrence of coupling usually requires two significant conditions. Firstly, there must be a suitable competitive reaction relationship, meaning that the energy barrier of a C-N coupling reaction is lower than that of any competitive reaction, such as the hydrogenation and desorption of N and C intermediates . Secondly, the two active sites for trapping the C and N intermediates should be adjacent, and there should be no strong steric effects . To explain the source of coupling activity, we calculated the free energy of the entire reaction path step by step. For each elementary reaction, we considered the competitive relationships of hydrogenation, adsorption, desorption, and coupling reactions, and the easiest direction of each step would determine the intermediate energy to be considered in the next step. Based on this,
Fig. 5 | In situ electrochemical Raman and Operando Synchrotron radiation Fourier Transform Infrared Spectroscopy (FTIR) measurements under various potentials for h- MPs during Electrochemical synthesis of urea. a In situ Raman diagram under electrochemical coupling test conditions.
b Infrared signals in the range of at different times ( ). c Infrared signals in the range of and in the range of (d) under various potentials for MPs during the electrocoupling of and . Source data for Fig. 5 are provided as a Source Data file.
we investigated the possibility of coupling at the site of MPs, the site of Cu (111), and the site of (111). For the Cu (111) surface, the energy barrier of the hydrogenation reaction of N intermediates is always lower than that of and . Fast causes Cu (111) to fail to form bonds. Meanwhile, it has been demonstrated that on the (111) surface have high and performance, which provides an opportunity for coupling. However, the results show that for two adjacent sites, the adsorption of N intermediates at one site will inhibit the activation of by the adjacent . This may be due to the steric
effect of neighboring in the form of distribution, which introduces stronger repulsion of C intermediates and N intermediates. Moreover, it is difficult for with stable to form bonds with N intermediates, resulting in the dominant hydrogenation reaction of N intermediates at sites. Therefore, coupling is unlikely to occur in (111).
Surprisingly, the adsorption of N intermediates at the site of h MPs promotes the activation of adjacent sites towards . In addition, we conducted a series of density functional theory (DFT) calculations (Supplementary Figs. 44, 45), These results indicate
Fig. 6 | DFT calculations. a DFT-optimized structures of h- MPs. b, c Barde Charge and Charge density difference for the MPs. The red and blue colors indicate charge accumulation and depletion, respectively. d Reaction pathways, schematic diagrams of intermediate adsorption configuration and
corresponding energy changes of urea electrosynthesis for MPs. e Free energy diagram of urea electrosynthesis on h- MPs. Source data for Fig. 6 are provided as a Source Data file.
that the presence of at the interface is conducive to the protonation of , but this phenomenon does not exist at the simple Cu and sites. The energy barrier of hydrogenation activation decreases from 0.75 to 0.11 eV after the formation of , which is attributed to the unique electronic structure of the site induced by O coordination breaking. This structure enables the site to adsorb N intermediates and greatly promote the activation of adjacent sites towards . As a result, the coupling of N intermediates adsorbed at sites does not rely on CO and from solution, but rather on local sampling of CO from nearby sites. Unlike , naturally occurring does not have a steric effect and has a suitable competitive relationship to promote the occurrence of coupling. The step-by-step calculation details are shown in Supplementary Figs. 46-50. Previous studies have also reported that N intermediates can enhance activation . To investigate this phenomenon, we employed stepwise calculations to construct various implicit solvent adsorption models at the , and interfaces. The coupling pathway obtained at the h- MPs interface is shown in Fig. 6d. The first step of coupling occurs at , with an energy barrier of 0.078 eV , lower than the hydrogenation reactions of NOH and CO ( 0.89 eV and 1.49 eV , respectively). At the same time, the transition state energy of this process is calculated, and the calculated energy barrier is 0.97422 eV (Fig. 6e, Supplementary Fig. 51), which is compared with the published results (Supplementary Table 2). The final rate-determining step of the entire reaction occurs at the
hydrogenation of , with an energy barrier of 0.89 eV , which is compared with the published results (Supplementary Table 3). The solvation effect is the key to obtain more accurate electrocatalytic simulation results, and the above calculation processes are obtained under the solvation model. Overall, these findings shed light on the mechanism underlying the high coupling performance of and provide insights into the design of efficient catalysts for conversion.
The protonation of demands an energy input of 0.75 eV , unlike the spontaneous formation of *NO. This results in a high accumulation of *NOH on the catalyst surface during electrocatalysis, obstructing adsorption and reduction of MPs. A localized MPs configuration supports electron transfer to * , enabling bond formation through the reaction of these intermediates. The energy barrier for *CONOH formation is significantly lower ( 0.078 eV ) compared to the 0.729 eV required for protonating * to * , favoring early-stage coupling (Fig. 6e). These findings highlight the critical role of the (111) crystal planes in promoting selective urea synthesis . Referring to the electrocatalysis results, the lower energy increase for coupling and the spontaneous formation of * might synergistically determine the extremely high values of Curea-selectivity and Nurea-selectivity. The subsequent reduction steps are exothermic, and the urea can be easily desorbed from the h-Cu/Cu2 O MPs surfaces. A detailed reaction mechanism with the most stable geometric structures of the reactants, intermediates
and products throughout the urea formation is listed in the computational method. Similarly, the model and reaction steps of pure Cu and were calculated which shown in Supplementary Figs. 52-59. The computational results reveal that the presence of exist of coupling reaction and the corresponding mechanistic of urea synthesis.
In conclusion, we have successfully constructed MPs catalysts through a straightforward electroreduction process, and demonstrated their effectiveness in the co-reduction of and pollutants for the production of urea. High-resolution characterization techniques, such as XANES, confirmed the presence of the interface and unsaturated coordination of Cu . We also found that the optimized faradaic efficiency and yield for urea on MPs were significantly higher than those on Cu and alone. Through a combination of in situ ATR-FTIR and DFT analysis, we established that the electron transfer from the shell to the Cu facilitates the formation and coupling of *CO and *NOH intermediates, leading to enhanced catalytic performance. Overall, this work presents a rational approach for the fabrication of efficient catalysts towards the sustainable production of carbon-nitrogen chemicals from and nitrate under ambient conditions.
Methods
Materials
Carbon papers (HCPO20N, thickness: ) were obtained from Hesen Company (Shanghai, China). Methanol , isopropanol , , -dimethylformamide (DMF), hydrogen peroxide ( aqueous solution), ammonium chloride , potassium chloride , potassium hydroxide , and sodium hydroxide ( ) were purchased from Sinopharm Chemical Reagent Co., Ltd. ( metals basis, dry basis), copper (I) oxide ( ), and isotopically enriched (99 atom% isotopic abundance) were supplied by Aladdin Biochemical Technology Co., Ltd. Sodium nitroprusside dihydrate was sourced from Energy Chemical. Sodium hypochlorite ( NaClO , available chlorine) was procured from Thermo Scientific. Potassium nitrate came from Sinopharm Chemical Reagent Co., Ltd. Gases including and were purchased from Airgas. All reagents were utilized as supplied without further purification unless otherwise indicated.
Synthesis of catalysts
Synthesis of metallic Cu. The metallic Cu electrode were synthesized via a facile one-step electroreduction process. In a typical procedure, using commercial powder as working electrode. The commercial were in situ electrochemical reduced at -2.05 V (vs. RHE) for 12 h in an Ar-saturated solution. The final product is denoted as Cu .
Synthesis of MPs
The electrode were synthesized via a facile one-step electroreduction process. In a typical procedure, using commercial powder as working electrode. The commercial were in situ electrochemical reduced at -1.5 V (vs. RHE) for 1200 s in an Ar-saturated 0.5 M solution. The final product is denoted as .
Materials characteriazation
The morphology and structure of the samples were analyzed using various characterization techniques. Field-emission scanning electron microscopy (FESEM, JSM-6700F) and transmission electron microscopy (TEM, JEOL, JEM-2010) were employed to observe the surface and internal structures. Powder X-ray diffraction (XRD, TTR-III) and Raman spectroscopy (LabRamHR) with a 532 nm laser were utilized to study the crystalline phases and vibrational properties. Highresolution TEM (HRTEM) and energy dispersive spectroscopy (EDS) mapping were performed on a Talox F200X transmission electron microscope (Thermo Fisher Scientific, USA) operating at 200 kV . The
chemical states of the samples were analyzed using an ESCALAB 250 X-ray photoelectron spectrometer equipped with an -ray source ( ). Elemental compositions were determined using a PerkinElmer Optima 7300 DV ICP atomic emission spectrometer. Proton nuclear magnetic resonance ( NMR) spectra were recorded on an Avance II 400 spectrometer (Bruker). Gas chromatography (GC 7900) with a TDX-01 column and thermal conductivity detector was used to analyze generated gases, which were sampled with a SCE syringe. Potential-dependent Raman spectroscopy was conducted under controlled applied potentials in with bubbling. The electrocatalyst was stabilized for 300 s at the desired potential to ensure steady-state conditions before recording each spectrum.
Electrochemical measurements
The electrolyte consisted of a mixed solution of 0.5 M KHCO 3 and (conductivity: ). During the test, equal volumes of electrolyte each were added into the cathodic and anodic chambers of the electrolytic cell. The electrolyte was purged sequentially with high-purity Ar and for 10 min each before the test. The prepared electrolyte requires no additional storage conditions other than room temperature .
Before the electrocatalytic coupling test, gas was continuously supplied into the cathodic chamber at a flow rate of , with the cathodic electrolyte consisting of a mixed solution of and . In isotope labeling experiments, the nitrogen source was replaced with . Electrocatalytic experiments were conducted in H-type and flow cells with a threeelectrode configuration, using a CHI760E electrochemical workstation (CH Instruments Inc., China). The reference electrode was an electrode filled with saturated KCl solution, and the counter electrode was a carbon rod. In this study, all potentials were referenced to the electrode and converted to the RHE scale using the formula: , where pH is the average pH of the electrolyte. The pH of the electrolyte was measured with a pH meter (Mettler Toledo), with the pH of -saturated electrolyte being , and that of Ar-saturated electrolyte being . The curves were obtained by setting the applied potential (versus RHE) and electrolysis time using chronoamperometric measurements. The LSV curves were recorded by linear sweep voltammetry with a negative scan mode over a potential range from 0.0 V to -2.0 V (versus RHE).
The cathodic and anodic chambers were separated by a Nafion 117 membrane (geometric area: , thickness: ). The pretreatment process for the Nafion membrane was as follows: The Nafion 117 membrane was immersed in a aqueous solution and boiled at for 1 h to remove organic impurities. Then, the membrane was repeatedly rinsed with deionized water and immersed in deionized water at for 1 h to completely remove any residual . The Nafion membrane was stored in deionized water at room temperature prior to use.
Electrocatalytic experiments were conducted in both H-type and flow cells with a three-electrode configuration, using a CHI76OE electrochemical workstation (CH Instruments Inc., China). The curves were recorded by applying a set potential (versus RHE) and electrolysis time, using a chronoamperometric method. The LSV curves were obtained via linear sweep voltammetry with a negative scan mode over the potential range from 0.0 V to -2.0 V (versus RHE). The LSV and CV curves were recorded at a scan rate of .
For the chronoamperometry tests, the working electrode was prepared by modifying carbon paper with a catalyst. Initially, the carbon paper was annealed at for 16 h to enhance its hydrophilicity. After cooling, the paper was cut into rectangular pieces with a geometric area of . A catalyst ink was prepared by dispersing 5 mg of catalyst and of Nafion solution ( ) into of a dispersant mixture (isopropyl alcohol: water ) and sonicated for
40 min to form a uniform mixture. The catalyst ink was then drop-cast onto the carbon substrate and allowed to dry naturally, resulting in a catalyst loading of .
In situ Raman spectroscopy
In-situ Raman spectroscopy was carried out using a Renishaw inVia Confocal Raman Microscope, equipped with a 50X (0.5 N.A.) long working distance objective (Olympus). A 532 nm excitation laser with a power of 2.5 mW and an 1800 lines diffraction grating was used for the measurements. The working electrode, made of carbon paper ( ), was paired with a titanium wire as the counter electrode and an (saturated KCl ) as the reference electrode. Raman spectra were recorded under applied potentials in a 0.5 M electrolyte, with the electrocatalyst held at the specified potential for 300 sec to achieve steady-state conditions before each measurement. For each spectrum, 15 sweeps were collected within the range of 175 to .
In situ XPS measurements
In situ XPS measurements were conducted using an ambient pressure XPS setup integrated with a static electrochemical cell. The counter electrode was a platinum (Pt) wire, while the reference electrode consisted of a Pt wire coated with paste. The working electrode was carbon paper, loaded with a bulk catalyst, shaped into a 5.5 mm diameter circle. During the in-situ XPS analysis, both the counter and reference electrodes were submerged in the electrolyte and sealed with a Nafion membrane. The carbon paper electrode was placed between the Nafion membrane and a tantalum (Ta) foil to ensure proper electrical connection. The analysis chamber was maintained at a pressure of approximately 0.3 mbar. For the mode electrochemical tests, the applied potential range was set between -0.1 V and -0.4 V vs. RHE, with each potential held for 1 h .
Operando SR-FTIR measurements
Operando SR-FTIR measurements were performed at the BLO1B infrared beamline of the National Synchrotron Radiation Laboratory (NSRL) in China, using a custom-designed top-plate cell-reflection infrared setup with a ZnSe crystal as the infrared transmission window, with a cutoff energy of approximately . The setup was equipped with an FTIR spectrometer (Bruker ), a KBr beam splitter, and a liquid nitrogen-cooled mercury cadmium telluride (MCT) detector. An infrared microscope (Bruker Hyperion 2000) with a × 15 objective was used. The electrochemical setup and cell configuration are shown in Supplementary Fig. 38. To ensure highquality SR-FTIR spectra, the system operated in reflection mode, and each infrared absorption spectrum was acquired by averaging 128 scans with a resolution of . The background spectrum of the catalyst electrode was recorded at open-circuit voltage before each measurement, and the measured potential ranges for the electrocatalytic reaction were from -0.1 to -0.7 V (vs. RHE) with a potential step of 0.1 V .
Determination of urea
The urea in the cathodic electrolyte was determined spectrophotometrically using the diacetylmonoxime method. The color development procedure was as follows: 1 mL of the electrolyte was taken, and 1 mL of DAMO-thiosemicarbazide (TSC) solution (5 g DAMO and 100 mg TSC dissolved in 1000 mL of deionized water) and 2 mL of acid-ferric solution concentrated phosphoric acid, 300 mL concentrated sulfuric acid, 600 mL deionized water, and 100 mg ferric chloride) were added. The solution was mixed thoroughly and then heated to for 20 min . After cooling to room temperature, the absorbance was measured using a UV-Vis spectrophotometer (Shimadzu UV-2700) at 525 nm , as shown in Supplementary Figs. 9, 10, where the urea absorption peak is observed.
Determination of ammonia
The determination of was performed using Nessler’s reagent as the colorimetric reagent. The procedure is as follows: a certain volume of cathodic electrolyte was diluted to 5 mL , followed by the addition of 0.1 mL of potassium sodium tartrate solution ( ) and 0.1 mL of Nessler’s reagent. The solution was mixed thoroughly and allowed to stand for 20 min . The absorbance was measured at a wavelength of 420 nm . The concentration-absorbance curve was calibrated using a series of standard ammonium chloride solutions, with ammonium chloride crystals pre-dried at for 2 h . Standard ammonia sulfate solutions were also used for calibration, as shown in Supplementary Figs. 11, 12, which contained the same electrolyte concentrations as those used in the electrocatalysis experiments.
Determination of hydrazine ( )
The hydrazine presented in the electrolyte was estimated by the method of Watt and Chrisp . The color reagent was prepared by mixing para-(dimethylamino) benzaldehyde , concentrated hydrochloric acid , and ethanol . To establish the calibration curve, a series of reference solutions were first prepared by pipetting appropriate volumes of hydrazine hydrate-nitrogen 0.1 M HCl solution into colorimetric tubes. The volume of each solution was then adjusted to 5 mL with diluted electrolyte. Next, 5 mL of the prepared color reagent was added to each tube, and the mixture was stirred for 10 min at room temperature. The absorbance of the resulting solution was measured at 457 nm . Hydrazine yields were then calculated from the standard curve using 5 mL of residual electrolyte and 5 mL of the color reagent. Absolute calibration of the method was performed using known concentrations of hydrazine monohydrate solutions as standards, and the resulting calibration curve showed a strong linear correlation between absorbance and concentration, based on three independent calibrations.
Determination of nitrite ions ( )
The nitrite concentration was determined using UV-Vis spectroscopy with the following color reagent preparation: 0.02 g of N -(1-Naphthyl) ethylenediamine dihydrochloride and 0.4 g of p-aminobenzenesulfonamide were sequentially added to a mixture of 5 mL deionized water and 1 mL phosphoric acid, and the solution was thoroughly mixed. For the nitrite concentration measurement, a certain amount of catholyte was taken and diluted to 5 mL . Then, 0.1 mL of the prepared color reagent was added to the 5 mL solution and mixed thoroughly. After allowing the mixture to sit for 20 min , the absorbance was measured at 540 nm . A concentrationabsorbance calibration curve was constructed using a series of standard solutions.
Determination of carbon monoxide (CO), hydrogen ( ) and dinitrogen ( )
The amounts of , and were quantified by in-line gas chromatograph (7890B, Agilent) equipped with a TCD and an FID .
Calculations of average urea yield rate and FE
The urea yield was determined by measuring the absorbance of the catholyte using a UV-Vis spectrophotometer. The urea concentration in the electrolyte was obtained by referencing a urea concentrationabsorbance calibration curve. The yield was then calculated based on the test time, as shown in the following formula:
where urea is the measured urea concentration ( ), is the total volume of electrolyte (ml), is time (h) for electrocatalysis and is the catalyst loadings (mg). The Faradaic efficiency (FE) for urea is the ratio of the charge consumed for urea synthesis during the electrolysis time to the total charge passed. It can be calculated using the following
formula:
where is the Faraday constant ( ) and is the total charge passed through the working electrode (C).
Calculations of average ammonia yield rate and FE
The ammonia yield rate is calculated by measuring the absorbance of the catholyte using a UV-Vis spectrophotometer, determining the ammonia concentration in the electrolyte based on a concentration-absorbance standard curve, and then using the testing time to calculate the yield. The specific formula is as follows:
where is the measured concentration ( ), is the total volume of electrolyte (ml), is time (h) for reduction reaction and m is the catalyst loadings (mg). The Faradaic efficiency (FE) for ammonia synthesis refers to the ratio of the charge used to produce ammonia during the electrolysis time to the total charge passed, and is calculated using the following formula:
where is the Faraday constant ( ) and is the total charge passed through the working electrode (C).
CER product analysis
The products obtained were analyzed using gas chromatography (GC) and NMR spectroscopy on a 400 MHz NMR instrument. Gaseous products from reduction, such as carbon monoxide, methane, ethylene, ethane, and propylene, were detected and quantified using GC with a flame ionization detector (FID) and a nickel conversion furnace. Hydrogen was measured quantitatively with a thermal conductivity detector (TCD). The liquid products, including formic acid, were quantified using NMR, with dimethyl sulfoxide (DMSO) serving as the internal standard. For NMR analysis, 0.5 mL of KOH electrolyte, collected after electrolysis, was mixed with of and of DMSO containing 5 mM as the internal standard. The NMR spectra were recorded with water suppression using a pre-saturation technique. The Faradaic efficiency was determined based on a calibration curve using the following formula:
where is the total number of product transfer electron, is the concentration of product, is the volume of electrolyte or gases, NA: avogadro constant, is the number of electron transferred for product formation, is the electron, is the number of transfer charge, is the total number of transfer electron.
Calculations of -selectivity and -selectivity
The selectivity for urea production (Nurea-selectivity) was determined using the following equation:
In this equation, refers to the number of moles of nitrogen present in the produced urea, while represents the total moles of nitrogen in all the products obtained from nitrate . The -selectivity was calculated as follows:
Here, represents the number of moles of carbon found in the produced urea, and refers to the total moles of carbon in all products derived from .
Computational method
All calculations were conducted using the Vienna Ab Initio Simulation Package (VASP) with density functional theory (DFT). Projector augmented wave (PAW) pseudopotentials and the Perdew-Burke-Ernzerhof (PBE) exchange-correlation functional within the generalized gradient approximation (GGA) were applied. To capture long-range van der Waals (vdW) interactions, the DFT-D3 correction was used. A plane wave energy cutoff of 500 eV was employed, and the self-consistent field (SCF) convergence criterion was set to . Geometry optimization was performed using the conjugate gradient method, with forces on each atom converging below . The implicit solvent model VASPsol with water permittivity of 78.4 was used to consider the solvation effect . The model is obtained by deleting some of the O atoms from unit cell) and then optimizing the lattice and atomic position. The optimized has the lattice parameters , . The -point mesh set was used for composite slab models. The model was obtained using a unit cell, and the model was also obtained using a unit cell. To take into account the on-site Coulomb interaction between 3 d electrons of Cu , the approach was also employed with a UJ value of 4 eV . Note that does not use GGA +U . The reaction free energy change can be obtained with the equation below:
where is the total energy difference before and after intermediate adsorbed, and are, respectively, the differences of zero-point energy and entropy. The zero point energy and entropy of free molecules and adsorbents were obtained from the vibrational frequency calculations. Since VASP cannot precisely describe the charged system, the energy of needs to be measured according to this literature. In addition, the greater the pH value, the more difficult the protonation process. Therefore, it is more important to consider a reasonable pH value to determine the competition reaction. When the PH is introduced, the Gibbs free energy change for all protonation processes is obtained by the following equation:
where is the Boltzmann constant, and is the temperature, here taken as 298.15 K . The pH value used in this article is set to 9 . The entire reaction path is determined step by step by selecting the step with the lowest reaction energy among protonation, adsorption, desorption and coupling.
Data availability
Source Data file has been deposited in Figshare under accession code DOI link . The raw data of the figures in the main manuscript are available in figshare with the identifier(s) https://doi.org/10.6084/m9. figshare.27964467. All other data needed to evaluate the conclusions in the paper are present in the paper and the Supplementary Information or can be obtained from the corresponding authors upon request. Source data are provided with this paper.
Code availability
The code used in this work can be obtained from the corresponding authors on request.
References
Zhang, X. et al. Managing nitrogen for sustainable development. Nature 528, 51-59 (2015).
Erisman, J. W. et al. How a century of ammonia synthesis changed the world. Nat. Geosci. 1, 636-639 (2008).
Chen, J. et al. Schrock, Beyond fossil fuel-driven nitrogen transformations. Science 360, 6391 (2018).
F. M. a. M. P. Francesco Barzagli. From greenhouse gas to feedstock: formation of ammonium carbamate from and in organic solvents and its catalytic conversion into urea under mild conditions. Green Chem. 13, 1267-1274 (2011).
Service, R. F. Chemistry New recipe produces ammonia from air, water, and sunlight. Science 345, 610-610 (2014).
Chen, C. et al. Coupling and in to synthesize urea under ambient conditions. Nat. Chem. 12, 717-724 (2020).
Meng, N. et al. Electrosynthesis of urea from nitrite and over oxygen vacancy-rich ZnO porous nanosheets. Cell Rep. Phys. Sci. 2, 100378 (2021).
Lv, C. et al. Selective electrocatalytic synthesis of urea with nitrate and carbon dioxide. Nat. Sustain. 4, 868-876 (2021).
Geng, J. et al. Ambient electrosynthesis of urea with nitrate and carbon dioxide over iron-based dual-sites. Angew. Chem. Int. Ed 62, e202210958 (2023).
Wei, X. et al. Oxygen vacancy-mediated selective C-N coupling toward electrocatalytic urea synthesis. J. Am. Chem. Soc. 144, 11530-11535 (2022).
Zhang, X. et al. Identifying and tailoring C-N coupling site for efficient urea synthesis over diatomic Fe-Ni catalyst. Nat. Commun. 13, 5337 (2022).
Yuan, M. et al. Highly selective electroreduction of and to urea over artificial frustrated lewis pairs. Energy Environ. Sci. 14, 6605-6615 (2021).
Wang, Y. et al. Nitrate electroreduction: mechanism insight, in situ characterization, performance evaluation, and challenges. Chem. Soc. Rev. 50, 6720-6733 (2021).
Chen, W. et al. Unveiling the electrooxidation of urea: Intramolecular coupling of the N-N bond. Angew. Chem. Int. Ed. 60, 7297-7307 (2021).
Yuan, M. et al. Unveiling electrochemical urea synthesis by CoActivation of and with Mott-Schottky heterostructure catalysts. Angew. Chem. Int. Ed. 60, 10910-10918 (2021).
. et al. Kinetically matched coupling toward efficient urea electrosynthesis enabled on copper single-atom alloy. Nat. Commun. 14, 6994 (2023).
Feng, Y. et al. Te-doped Pd nanocrystal for electrochemical urea production by efficiently coupling carbon dioxide reduction with nitrite reduction. Nano Lett. 20, 8282-8289(2020).
Zhu, X. et al. Electrochemical synthesis of urea on MBenes. Nat. Commun. 12, 4080 (2021).
Wang, P. et al. Molecular assembled electrocatalyst for highly selective fixation to products. ACS Nano 16, 17021-17032 (2022).
Yang, Y. et al. Operando studies reveal active Cu nanograins for electroreduction. Nature 614, 262-269 (2023).
Yao, K. et al. Mechanistic insights into OC-COH coupling in electroreduction on fragmented copper. J. Am. Chem. Soc. 144, 14005-14011 (2022).
Zhao, Z. et al. Polydopamine coating of a metal-organic framework with Bi -copper sites for highly selective electroreduction of to products. ACS Catal. 12, 7986-7993 (2022).
Zhu, C. et al. Dynamic restructuring of epitaxial Au-Cu biphasic interface for tandem -to- alcohol conversion. Chem. 8, 3288-3301 (2022).
Zhu, H. et al. A porous stacking framework with dicopper(I) sites and adjacent proton relays for electroreduction of to products. J. Am. Chem. Soc. 144, 13319-13326 (2022).
Wei, X. et al. Dynamic reconstitution between copper single atoms and clusters for electrocatalytic urea synthesis. Adv. Mater. 35, 2300020 (2023).
Pan, L. et al. Single-atom or dual-atom in nanosheet: Which is the better choice for electrocatalytic urea synthesis? Angew. Chem. Int. Ed. 62, e202216835 (2023).
Leverett, J. et al. Tuning the coordination structure of Cu-N-C single atom catalysts for simultaneous electrochemical reduction of and to urea. Adv. Energy Mater. 12, 2201500 (2022).
Meng, N. et al. Oxide-derived core-shell Cu@Zn nanowires for urea electrosynthesis from carbon dioxide and nitrate in water. ACS Nano 16, 9095-9104 (2022).
Liu, S. et al. AuCu nanofibers for electrosynthesis of urea from carbon dioxide and nitrite. Cell Rep. Phys. Sci. 3, 100869 (2022).
Shin, S. et al. Copper with an atomic-scale spacing for efficient electrocatalytic co-reduction of carbon dioxide and nitrate to urea. Energy Environ. Sci. 16, D3EE00008G (2023).
Mukherjee, J. et al. Understanding the site-selective electrocatalytic Co-reduction mechanism for green urea synthesis using copper phthalocyanine nanotubes. Adv. Funct. Mater. 32, 2200882 (2022).
Li, Z. et al. Magic hybrid structure as multifunctional electrocatalyst surpassing benchmark Pt/C enables practical hydrazine fuel cell integrated with energy-saving production. eScience 2, 416-427 (2022).
Liu, Y. et al. Manipulating dehydrogenation kinetics through dualdoping electrode enables highly efficient hydrazine oxidation assisting self-powered production. Nat. Commun. 11, 1853 (2020).
Li, Y. et al. Partially exposed surface in hybrid structure endows its bifunctionality for hydrazine oxidation and hydrogen evolution catalysis. Sci. Adv. 6, eabb4197 (2020).
Platzman, I. et al. Oxidation of polycrystalline copper thin films at ambient conditions. J. Phys. Chem. C 112, 1101-1108 (2008).
Li, D. et al. Accelerating electron-transfer dynamics by immobilized reversible single-atom copper for enhanced artificial photosynthesis of urea. Adv. Mater. 34, 2207793 (2022).
Wang, Y. et al. Unveiling the activity origin of a copper-based electrocatalyst for selective nitrate reduction to ammonia. Angew. Chem. Int. Ed. 59, 5350-5354(2020).
Larson, P. X-Ray Induced photoelectron and auger-spectra of Cu, , and thin-films. J. Electron Spectrosc 4, 213-218 (1974).
Hu, Y. et al. Fabrication of coral-like nanoelectrode for solar hydrogen generation. J. Power Sources 242, 541-547 (2013).
Mao, Y. et al. Electrochemical synthesis of hierarchical stars with enhanced photoelectrochemical properties. Electrochim. Acta 62, 1-7 (2012).
Cheng, W. et al. Lattice-strained metal-organic-framework arrays for bifunctional oxygen electrocatalysis. Nat. Energy 4, 115-122 (2019).
Zhao, Y. et al. Efficient urea electrosynthesis from carbon dioxide and nitrate via alternating Cu-W bimetallic C-N coupling sites. Nat. Commun. 14, 4491 (2023).
Chitsiga, T. et al. Effect of the presence of water-soluble amines on the carbon dioxide ( ) adsorption capacity of amine-grafted poly-succinimide (PSI) adsorbent during capture. Energy Procedia 86, 90-105 (2016).
Manivannan, M. Investigation of inhibitive action of urea- system in the corrosion control of carbon steel in sea water. Int. J. Eng. Sci. Technol. 3, 0975-5462 (2011).
Zhang, S. et al. High-efficiency electrosynthesis of urea over bacterial cellulose regulated Pd-Cu bimetallic catalyst. EES Catal. 1, 45-53 (2023).
Xiao, H. et al. Cu metal embedded in oxidized matrix catalyst to promote activation and CO dimerization for electrochemical reduction of . Proc. Natl Acad. Sci. 114, 6685-6688 (2017).
Jiao, D. et al. monolayer as a superior electrocatalyst for urea synthesis from nitrogen and carbon dioxide fixation: a computational study. Energy Environ. Mater. 2, 12496 (2022).
Roy, Prodyut et al. Dual-Silicon-Doped Graphitic Carbon Nitride Sheet: An Efficient Metal-Free Electrocatalyst for Urea Synthesis. J. Phys. Chem. Lett. 12, 10837-10844 (2021).
Fields, M. et al. Role of subsurface oxygen on Cu surfaces for electrochemical reduction. J. Phys. Chem. C 122, 16209-16215 (2018).
Liu, X. et al. Mechanism of C-N bonds formation in electrocatalytic urea production revealed by ab initio molecular dynamics simulation. Nat. Commun. 13, 5471 (2022).
Yang, G. et al. Gaseous coupling with N-Containing intermediates for key C-N bond formation during urea production from coelectrolysis over Cu. ACS Catal. 12, 11494-11504 (2022).
Li, H. et al. Ligand engineering towards electrocatalytic urea synthesis on a molecular catalyst. Nat. Commun. 15, 8858 (2024).
Wei, J. et al. Constructing Co@C nanoparticles with chainmailstructure for highly efficient hydroformylation of 1-hexene. Chem. Eng. J. 492, 151963 (2024).
Mathew, K. et al. Implicit Solvation Model for Density-Functional Study of Nanocrystal Surfaces and Reaction Pathways. J. Chem. Phys. 140, 084106 (2014).
Dai, Z. et al. Surface Engineering on bulk for efficient electrosynthesis of Urea, Figshare, https://doi.org/10.6084/m9. figshare. 27964467 (2025).
Acknowledgements
G.Q.Z. acknowledges the National Natural Science Foundation of China (Grant No. 52072359), the Recruitment Program of Global Experts and the Fundamental Research Funds for the Central Universities (WK2060000016). The numerical calculations in this paper have been done in the Supercomputing Center of University of Science and Technology of China. The authors are grateful to infrared beamline (BLO1B) at NSRL for the experimental beamtime support. This work was partially carried out at the Instruments Center for Physical Science, University of Science and Technology of China.
Author contributions
Z.C.D., and G.Q.Z. contributed to the conception of the study. Z.C.D. performed the experiments. Y.X.C. conducted the Density Functional
Theory (DFT) calculations analysis. H.K.Z. provided assistance with the Scanning Electron Microscope (SEM) analysis and assisted with the electrochemical in situ Fourier Transform Infrared (FTIR) spectroscopy analysis. M.Y.C., B.C.Z., P.Y.F., and Y.F.F. provided help in the experimental part. G.Q.Z. contributed significantly to the analysis and manuscript preparation. The project was supervised by G.Q.Z. All authors participated in the analysis with constructive discussions.
Correspondence and requests for materials should be addressed to Genqiang Zhang.
Peer review information Nature Communications thanks Pranab Sarkar and the other anonymous, reviewers for their contribution to the peer review of this work. A peer review file is available.
Publisher’s note Springer Nature remains neutral with regard to jurisdictional claims in published maps and institutional affiliations.
Open Access This article is licensed under a Creative Commons Attribution-NonCommercial-NoDerivatives 4.0 International License, which permits any non-commercial use, sharing, distribution and reproduction in any medium or format, as long as you give appropriate credit to the original author(s) and the source, provide a link to the Creative Commons licence, and indicate if you modified the licensed material. You do not have permission under this licence to share adapted material derived from this article or parts of it. The images or other third party material in this article are included in the article’s Creative Commons licence, unless indicated otherwise in a credit line to the material. If material is not included in the article’s Creative Commons licence and your intended use is not permitted by statutory regulation or exceeds the permitted use, you will need to obtain permission directly from the copyright holder. To view a copy of this licence, visit http:// creativecommons.org/licenses/by-nc-nd/4.0/.
(c) The Author(s) 2025
Hefei National Research Center for Physical Sciences at the Microscale, CAS Key Laboratory of Materials for Energy Conversion Department of Materials Science and Engineering, University of Science and Technology of China, 230026 Hefei, Anhui, China. These authors contributed equally: Zechuan Dai, Yanxu Chen. e-mail: gqzhangmse@ustc.edu.cn