يؤدي الاحترار إلى تسريع شدة الجفاف العالمي Warming accelerates global drought severity

المجلة: Nature، المجلد: 642، العدد: 8068
DOI: https://doi.org/10.1038/s41586-025-09047-2
PMID: https://pubmed.ncbi.nlm.nih.gov/40468063
تاريخ النشر: 2025-06-04

يؤدي الاحترار إلى تسريع شدة الجفاف العالمي

تاريخ الاستلام: 29 أكتوبر 2024
تاريخ القبول: 18 أبريل 2025
تاريخ النشر على الإنترنت: 4 يونيو 2025
الوصول المفتوح
تحقق من التحديثات

سليمان هـ. جبريشوركوس , جاستين شيفيلد , سيرجيو م. فيسنتي-سيرانو , كريس فونك , دييغو ج. ميرانيس , جيان بينغ , إلين داير , جوشوا طالب , هيلكي إ. بيك , مايكل ب. سينجر & سايمون ج. دادسون

الملخص

يعتبر الجفاف من أكثر المخاطر الطبيعية شيوعًا وتعقيدًا التي تؤثر على البيئة والاقتصادات والسكان على مستوى العالم . ومع ذلك، هناك عدم يقين كبير في اتجاهات الجفاف العالمية , وفهم محدود لمدى تأثير محرك رئيسي، وهو الطلب التبخيري الجوي (AED)، على التطور الأخير لشدة الجفاف وتكراره ومدته ومدى انتشاره. هنا، من خلال تطوير مجموعة من بيانات الجفاف العالمية عالية الدقة للفترة من 1901 إلى 2022، نجد اتجاهًا متزايدًا في شدة الجفاف على مستوى العالم. تشير نتائجنا إلى أن AED قد زاد من شدة الجفاف بمعدل على مستوى العالم. لا تقتصر المناطق الجافة عادة على أن تصبح أكثر جفافًا، بل إن المناطق الرطبة أيضًا تشهد اتجاهات جفاف. خلال السنوات الخمس الماضية (2018-2022)، توسعت المناطق المتأثرة بالجفاف بمعدل مقارنة بالفترة من 1981 إلى 2017، مع مساهمة AED في من هذه الزيادة. كان عام 2022 عامًا قياسيًا، حيث تأثرت من مساحة اليابسة العالمية بالجفاف المعتدل والشديد، منها نُسب إلى زيادة AED. تشير نتائجنا إلى أن AED له دور متزايد الأهمية في دفع الجفاف الشديد وأن هذا الاتجاه من المحتمل أن يستمر تحت سيناريوهات الاحترار المستقبلية.

توافر المياه له دور حاسم في تشكيل النظم البيئية والأنشطة الاقتصادية وسبل عيش البشر. المياه هي مورد أساسي للزراعة والطاقة والصناعة والاستخدام المنزلي، مما يؤثر على الاستدامة العامة وتطور المجتمعات . كما أن الجفاف ضار أيضًا بالنباتات، حيث يقلل من امتصاص الكربون من النظم البيئية، مما يتسبب في وفاة واسعة النطاق للنباتات ويؤدي إلى اضطرابات كبيرة في وظائف النظام البيئي والتنوع البيولوجي . كما أنها تؤثر سلبًا على إنتاجية المحاصيل السنوية والدائمة، مما يزيد من انعدام الأمن الغذائي وعدم الاستقرار الاقتصادي . مع تغير المناخ، هناك توقع بأن يصبح الجفاف أكثر تكرارًا وشدة , مع زيادة التأثيرات على الأنظمة الزراعية والبيئية والهيدرولوجية . تشير الأدلة الملاحظة إلى زيادة شدة الجفاف الهيدرولوجي والزراعي في عدة مناطق على مدى العقود الأخيرة، بسبب الزيادة الواسعة في الطلب التبخيري الجوي (AED) بالإضافة إلى الانخفاضات الإقليمية في هطول الأمطار . تشير التوقعات المستقبلية من نماذج المناخ أيضًا إلى زيادة شدة الجفاف في بعض المناطق بسبب انخفاض هطول الأمطار وزيادة AED .
على الرغم من أن العديد من الدراسات قد ركزت على تقدير اتجاهات الجفاف ومحركاتها على المستوى العالمي، إلا أنها كانت محدودة بجودة البيانات العالمية المتاحة , مما يضيف عدم اليقين في تقييم هذه الاتجاهات. من المهم أن مدى تأثير زيادة AED على شدة الجفاف نتيجة للاحتباس الحراري لا يزال غير مستكشف بشكل كافٍ . يزيد AED من العجز المائي من خلال تعزيز التبخر , خاصة في ظل ظروف رطوبة التربة المنخفضة. علاوة على ذلك، يمكن أن تؤدي التفاعلات بين اليابسة والغلاف الجوي إلى تغذية راجعة إيجابية حيث تؤدي التربة والنباتات الجافة إلى تقليل تدفقات الحرارة الكامنة، مما يؤدي إلى زيادة في درجة الحرارة وAED، وزيادة أخرى
شدة الجفاف . على الرغم من أنه يمكن تصنيف الجفاف بطرق عديدة لتعكس محركات مختلفة من المناخ والهيدرولوجيا والبيئة، فإن النظر في تأثير AED بالنسبة لهطول الأمطار أمر حاسم لفهم كيف يؤثر تغير المناخ على التغيرات في الجفاف. اقترحت بعض الدراسات أن مقاييس الجفاف المعتمدة على AED قد تفرط في تقدير الشدة مقارنة بالمؤشرات الهيدرولوجية والبيئية . ومع ذلك، فإن هذا stems بشكل رئيسي من عدم اليقين في توقعات نماذج النظام الأرضي والتأثيرات الفسيولوجية لثاني أكسيد الكربون الجوي على التبخر . التحديات المنهجية تؤثر أيضًا على المقارنات بين مقاييس الجفاف، ولكن تطبيق أساليب إحصائية متسقة يظهر توافقًا أقوى بين المؤشرات التي تشمل AED . تبرز الأدلة المتزايدة دور AED في تضخيم شدة الجفاف البيئي من خلال التبخر . نظرًا للزيادة الأخيرة والتوقعات بزيادة AED بسبب الاحترار الناتج عن الأنشطة البشرية , فإن تقييم مساهمته في شدة الجفاف أمر ضروري للتخطيط للتكيف.
ومع ذلك، فقد أبرزت الدراسات السابقة عدم اليقين الكبير في تقييمات الجفاف على المستوى العالمي وفي تحديد دور AED على شدة الجفاف، ويرجع ذلك إلى حد كبير إلى اختيار النماذج لمجموعة بيانات AED والبيانات المناخية . وبالتالي، في الدراسات السابقة، أدى اختيار الأساليب ومجموعات البيانات إلى نتائج متضاربة في أنماط الجفاف العالمية , مما يبرز الحاجة إلى مزيد من البحث لتقليل عدم اليقين الناتج عن اختلاف الأساليب ومجموعات البيانات. على سبيل المثال، تفرط الأساليب الأبسط المعتمدة على درجة الحرارة في تقدير AED في المناطق الرطبة، بينما تقدم النماذج الأكثر شمولاً مثل نموذج بنمان-مونتيث، التي تأخذ في الاعتبار كل من المصطلحات الإشعاعية والديناميكية الحرارية، نتائج أكثر دقة عبر مناخات وفصول مختلفة . أيضًا، تعتبر الملاحظات الموثوقة والدقيقة لـ
الهطول ضرورية لتحديد الجفاف بشكل واقعي. على مدى العقود القليلة الماضية، تم تطوير العديد من مجموعات بيانات الهطول بناءً على بيانات القياس وإعادة التحليل والبيانات الساتلية. ومع ذلك، يمكن أن تصل الفروق في متوسط الهطول العالمي السنوي بين مجموعات البيانات إلى ويمكن أن تصل الخطأ إلى 100 مم في الشهر عند مقارنتها بملاحظات القياس . أخيرًا، من الضروري أن نذكر أن تقييمات الجفاف تعتمد على المؤشر المختار ومنهجية الحساب. على سبيل المثال، يمكن أن يؤثر اختيار فترة المعايرة لنماذج مؤشر شدة الجفاف مثل مؤشر شدة جفاف بالمر بشكل كبير على تفسير اتجاهات الجفاف العالمية، مما يزيد من مناطق الجفاف الشديد بنسبة تصل إلى 15% (مرجع 28). بشكل عام، تؤدي عدم اليقين في مجموعات البيانات والأساليب وبنية النموذج إلى عدم يقين كبير في تقييم الجفاف واتجاهاته، كما تم تسليط الضوء عليه في التقرير السادس لتقييم اللجنة الحكومية الدولية المعنية بتغير المناخ .
هنا، نظرًا للأولوية الحرجة الحالية لتقليل عدم اليقين في تقدير الاتجاهات الحديثة في شدة الجفاف، استخدمنا أكثر مجموعات بيانات الهطول العالمية دقة وحسبنا AED باستخدام طريقة بنمان-مونتيث الشاملة. بالنسبة لنموذج مؤشر الجفاف لدينا، طبقنا مؤشر تبخر الهطول القياسي (SPEI) , الذي يوازن بين التعقيد والفائدة من خلال تمثيل ديناميات العرض والطلب للجفاف بشكل فعال من خلال الفرق بين الهطول وAED، مما يسمح بالمقارنة الكمية والمكانية والزمانية لحساسية المؤشر لتغيرات AED في مناطق العالم المختلفة وظروف المناخ . علاوة على ذلك، تولد طريقة SPEI تقديرات لتغيرات الجفاف عبر مقاييس زمنية متعددة (1-48 شهرًا) دون الحاجة إلى فترة معايرة، مما يسمح بتقييم موضوعي للاتجاهات الحديثة في شدة الجفاف وتقدير تأثير زيادة AED. لقد حللت العديد من الدراسات اتجاهات الجفاف على المستويات الإقليمية والوطنية باستخدام SPEI، مما يظهر قدرتها على تحديد اتجاهات الجفاف المرتبطة بالضغط البشري . على الرغم من أن بعض الدراسات قد استكشفت توقعات الجفاف باستخدام SPEI , إلا أن القليل منها فقط قد درس الاتجاهات على المستوى العالمي، مما يشير إلى زيادة في شدة الجفاف المرتبطة بالاحترار العالمي . وقد قيمت دراسات عالمية أخرى اتجاهات الجفاف باستخدام SPEI مع بيانات ملاحظة ولكنها لم تقيم تأثير AED على شدة الجفاف أو تعالج عدم اليقين في مجموعات بيانات الهطول وAED – وهي قيود حاسمة لاستنتاج استنتاجات قوية . دراسة واحدة فقط لقد فحصت دور التغير المناخي الناتج عن الأنشطة البشرية على شدة الجفاف باستخدام محاكاة مشروع المقارنة بين النماذج المتصلة المرحلة 6، لكنها تقدم عدم يقين كبير بسبب قيود الأساليب المعتمدة على النماذج. على الرغم من أن مؤشر الجفاف المتكامل (SPEI) قد تم استخدامه على نطاق واسع لتقييم اتجاهات الجفاف، فإن هذه الدراسة تقيس، على المستوى العالمي وبناءً على الملاحظات، دور زيادة AED في شدة الجفاف. بالإضافة إلى ذلك، تقيم عدم اليقين في مجموعات البيانات العالمية، مما يوفر منظورًا أكثر شمولاً حول هذه القضية الحرجة.
قمنا بتطوير 4 نماذج عالمية عالية الدقة مجموعة بيانات SPEI للفترة من 1981 إلى 2022 باستخدام بيانات هطول الأمطار من مجموعة المناخ للمخاطر (CHIRPS) أو هطول الأمطار المعزز بالوزن المتعدد المصادر (MSWEP) ، جنبًا إلى جنب مع AED من نموذج تبخر الأراضي العالمي أمستردام النسخة 4.2a (GLEAM) أو التبخر والنتح المحتمل الساعي (hPET) على الرغم من أن كلا منتجي الهطول يؤديان بشكل جيد ، المدخلات والأساليب المستخدمة لإنتاج CHIRPS و MSWEP مختلفة تمامًا. وبالمثل، تعتمد مجموعات بيانات GLEAM و hPET AED المستخدمة على نطاق واسع بشكل أساسي على بيانات الأقمار الصناعية وبيانات إعادة التحليل. لذلك، فإن استخدام تركيبات من الأربعة جميعها يبني أساسًا قويًا لتقييم الاتجاهات. لتقييم الاتجاهات العالمية قبل الثمانينيات، قمنا أيضًا بتطوير مجموعتين إضافيتين من بيانات SPEI استنادًا إلى إعادة التحليل ERA5-Land (إعادة التحليل من الجيل الخامس من المركز الأوروبي للتنبؤات الجوية متوسطة المدى، ERA5؛ حوالي 25 كم) وسلسلة بيانات وحدة البحث المناخي (CRU-TS؛
حوالي 50 كم)، تغطي الفترة من 1950 إلى 2022 ومن 1901 إلى 2022، على التوالي. من خلال دمج مجموعات بيانات متعددة وفترات زمنية مختلفة، نهدف إلى التقاط نطاق أوسع من عدم اليقين المحتمل في بيانات القوة وتقديم تقييم أكثر شمولاً لأنماط الجفاف. من خلال استخدام AED المناخي وهطول الأمطار، قمنا بتطوير مجموعات بيانات مكافئة تمكننا من قياس مساهمات تغييرات AED وهطول الأمطار في اتجاه SPEI، فضلاً عن تكرار ومدة وشدة أحداث الجفاف. هنا نركز على SPEI لمدة 6 أشهر، حيث إنه يلتقط ظروف الجفاف السائدة على المدى القصير إلى المتوسط.
استنادًا إلى متوسط مجموعات بيانات SPEI عالية الدقة الأربعة (HRSPEI)، فإن المتوسط شبه العالمي ( إلى تظهر مؤشرات SPEI لمدة 6 أشهر اتجاهًا متناقصًا، مما يشير إلى ظروف جفاف خلال الفترة من 1981 إلى 2022 (الشكل 1). تُظهر مؤشرات HRSPEI لمدة 6 أشهر دلالة كبيرة ( اتجاه تنازلي لـ (الشكل 1أ). تُظهر المنطقة شبه العالمية المتأثرة بالجفاف (SPEI < -1) اتجاهًا متزايدًا ملحوظًا يتناسب مع (الشكل 1ب). للحالات الشديدة (SPEI ) والجفاف الشديد (SPEI < -1.8)، تظهر المنطقة المتأثرة بالجفاف اتجاهًا متزايدًا ملحوظًا في و على أساس CRU-TS و ERA5، تظهر الفترة من 1950 إلى 1980 اتجاهات متزايدة ملحوظة في مؤشر الجفاف المتكامل لمدة 6 أشهر -وحدات و -وحدات على التوالي. تم تقديم ملخص لاتجاه SPEI لمدة 6 أشهر في الشكل 1f من البيانات الموسعة.
من الناحية المكانية، يُظهر مؤشر الجفاف لمدة 6 أشهر اتجاهًا نحو الجفاف عبر أجزاء كبيرة من العالم مثل أوروبا وأفريقيا وغرب أمريكا الشمالية وأمريكا الجنوبية خلال الفترة من 1981 إلى 2022 (الشكل 1c)، مع اتجاه جفاف يصل إلى -وحدات . على العكس من ذلك، تظهر مناطق مثل جنوب وجنوب شرق آسيا، وغويانا في أمريكا الجنوبية، ووسط جنوب إفريقيا، وشرق أمريكا الشمالية اتجاهًا متزايدًا في الرطوبة خلال نفس الفترة. يتم تقديم الاتجاهات للبيانات الفردية التي تشكل مجموعات بيانات HRSPEI وCRU-TS وERA5 في الأشكال البيانية الممتدة 1 و2، على التوالي.
لقد زادت الاتجاهات في حجم وتكرار الجفاف في أجزاء مختلفة من العالم خلال الفترة من 1981 إلى 2022 (الشكل 2). يظهر حجم الجفاف (الشكل 2أ) وتكراره (الشكل 2ب) اتجاهات تناقص وزيادة ملحوظة في مناطق مختلفة، لا سيما في الأجزاء الجنوبية من أمريكا الجنوبية، وشرق ووسط أفريقيا، وجنوب أوروبا، وغرب الولايات المتحدة. بالمقارنة مع معظم أنحاء العالم، تظهر أجزاء من أفريقيا وأمريكا الجنوبية زيادة أكبر في تكرار الجفاف وانخفاضًا في حجمه، مما يبرز أن هذه الاتجاهات مدفوعة أساسًا بنقص الأمطار. بالمقابل، فإن التغيرات في مدة الجفاف ذات دلالة إحصائية فقط في مناطق متفرقة، مما يعارض فكرة حدوث تغيير واسع النطاق في مدة الجفاف (الشكل 3 من البيانات الموسعة).
من الجدير بالذكر تسارع انخفاض مؤشر الجفاف البيئي (SPEI) وزيادة المناطق التي تعاني من الجفاف خلال السنوات الخمس الماضية، حيث سجل عام 2022 أعلى نسبة من المناطق المتأثرة (الشكل 4 في البيانات الموسعة). خلال هذه الفترة، زاد مدى الجفاف الشديد والقصوى عالميًا بمقدار ثلاثة أضعاف وخمسة أضعاف، على التوالي، مقارنةً بالفترة من 1981 إلى 2022. في أوروبا، عانت 82% من الأراضي من الجفاف، حيث كانت 50% منها تحت جفاف معتدل إلى شديد (الشكل 1d). في عام 2022، انخفض معدل هطول الأمطار السنوي في جميع أنحاء أوروبا بنسبة تصل إلى أقل من متوسط 1981-2022، وزاد الدرهم حتى (الشكل 5 من البيانات الموسعة).

محركات التغيرات في الجفاف

لتقييم كيفية تأثير التغيرات في AED وهطول الأمطار على الجفاف، نقارن اتجاهات SPEI المحسوبة من التغيرات الملحوظة في AED وهطول الأمطار مع تلك المستندة إلى المتوسطات المناخية لـ AED (AEDclm) وهطول الأمطار (Prclm). الاتجاه شبه العالمي المتوسط لـ SPEI لمدة 6 أشهر، استنادًا إلى هطول الأمطار الملحوظ و AEDclm، هو -وحدات الذي يدور حول أعلى من الاتجاه الملحوظ (الشكل 3)، مما يشير إلى أن الحفاظ على AED عند قيمته المناخية يؤدي إلى اتجاه إيجابي. عند استخدام AED الملحوظ وPrclm، فإن اتجاه SPEI هو -وحدات الذي هو أكثر سلبية من الاتجاه الملحوظ (الشكل 3أ). بالمثل،
الشكل 1| مؤشر SPEI الشهري، نسبة المساحة المتأثرة بالجفاف وخرائط اتجاهات SPEI وجفاف عام 2022. أ، ب، ” شبه العالمية إلى متوسط ونسبة المساحة العالمية في الجفاف (ب). ج، الاتجاه في مؤشر الجفاف النسبي لمدة 6 أشهر للفترة من 1981 إلى 2022 ( -وحدات ) ، مع اتجاهات غير ذات دلالة ( ) المميزة باللون الرمادي للتصور. د، قيم HRSPEI لمدة 6 أشهر لفترة الجفاف القياسية في أغسطس 2022 ( -الوحدات). تستخدم السلسلة الزمنية HRSPEI ( ), CRU-TS ( ) و ERA5 ، مع كون HRSPEI هو المتوسط الجماعي لـ MSWEP_hPET،
MSWEP_GLEAM و CHIRPS_hPET و CHIRPS_GLEAM (1981-2022). تغطي CRU-TS الفترة من 1901-2022 ويمتد ERA5 من 1950-2022. يتم حساب متوسط السلاسل الزمنية على المناطق الأرضية الاستوائية وشبه الاستوائية. إلى )، باستثناء المناطق التي يقل متوسط هطول الأمطار السنوي فيها عن 180 مم. للمناطق التي تزيد عن ، الاتجاه المكاني يعتمد على متوسط MSWEP_hPET و MSWEP_GLEAM، حيث أن CHIRPS متاح حتى . تشير الخطوط العمودية إلى الفترة من 1950 إلى 1980، حيث تظهر قيم SPEI الإيجابية الأعلى استنادًا إلى ERA5 و CRU-TS مقارنةً بالفترة من 1981 إلى 2022.
الاتجاه في المناطق المتأثرة بالجفاف بناءً على هطول الأمطار الملحوظ و AEDclm هو ، وهو أقل من الاتجاه الملحوظ. تشير هذه النتائج إلى أن التغيرات في AED من 1981 إلى 2022 قد زادت من الاتجاه التنازلي في SPEI وتوسع المناطق المتأثرة بالجفاف. تظهر السلاسل الزمنية المستندة إلى Prclm تطورًا من قيم SPEI الإيجابية في بداية فترة الدراسة إلى قيم سلبية في السنوات الأخيرة (الشكل 3a). يتم ملاحظة هذا النمط أيضًا مع قيم SPEI المستندة إلى ERA5 (الشكل البياني الممتد 6)، مما يبرز التأثير المتزايد لـ AED حيث تظل الأمطار ثابتة عند قيمها المناخية.
إقليمياً، تشير النتائج إلى مساهمة ملحوظة لـ AED في الاتجاه السلبي لمؤشر SPEI (حتى ) في أجزاء كبيرة من أوروبا (باستثناء النرويج والسويد) وآسيا وأستراليا وغرب الولايات المتحدة والأجزاء الجنوبية من أمريكا الجنوبية (الشكل 3ب). بالإضافة إلى ذلك، في أجزاء من شرق وجنوب إفريقيا، أدت التغيرات في AED إلى تفاقم الاتجاه السلبي لـ SPEI بنسبة تصل إلى -وحدات . في المقابل، فإن AED له تأثير ضئيل أو معدوم على اتجاهات الجفاف في أمريكا الشمالية (كندا، الغرب الأوسط وجنوب شرق الولايات المتحدة)، شمال أمريكا الجنوبية (حوض نهر الأمازون) ووسط أفريقيا. ومع ذلك، يبدو أن AED قد زاد من اتجاه SPEI (حتى -وحدات ) في جنوب (الهند) و
جنوب شرق آسيا. يمكن أن يُعزى هذا التغيير إلى الاتجاه المتزايد الملحوظ في هطول الأمطار والاتجاه المتناقص في AED (الشكل البياني الإضافي 7). عند استخدام Prclm، يظهر مؤشر SPEI لمدة 6 أشهر اتجاهًا سلبيًا أكثر بشكل ملحوظ (حتى -وحدات ) مقارنة بالاتجاه الملحوظ عالميًا، باستثناء جنوب وجنوب شرق آسيا (الشكل 3c). كما يظهر الاتجاه المستند إلى بيانات ERA5 تغييرًا مشابهًا خلال الفترة من 1981 إلى 2022 (الشكل البياني الممتد 6).
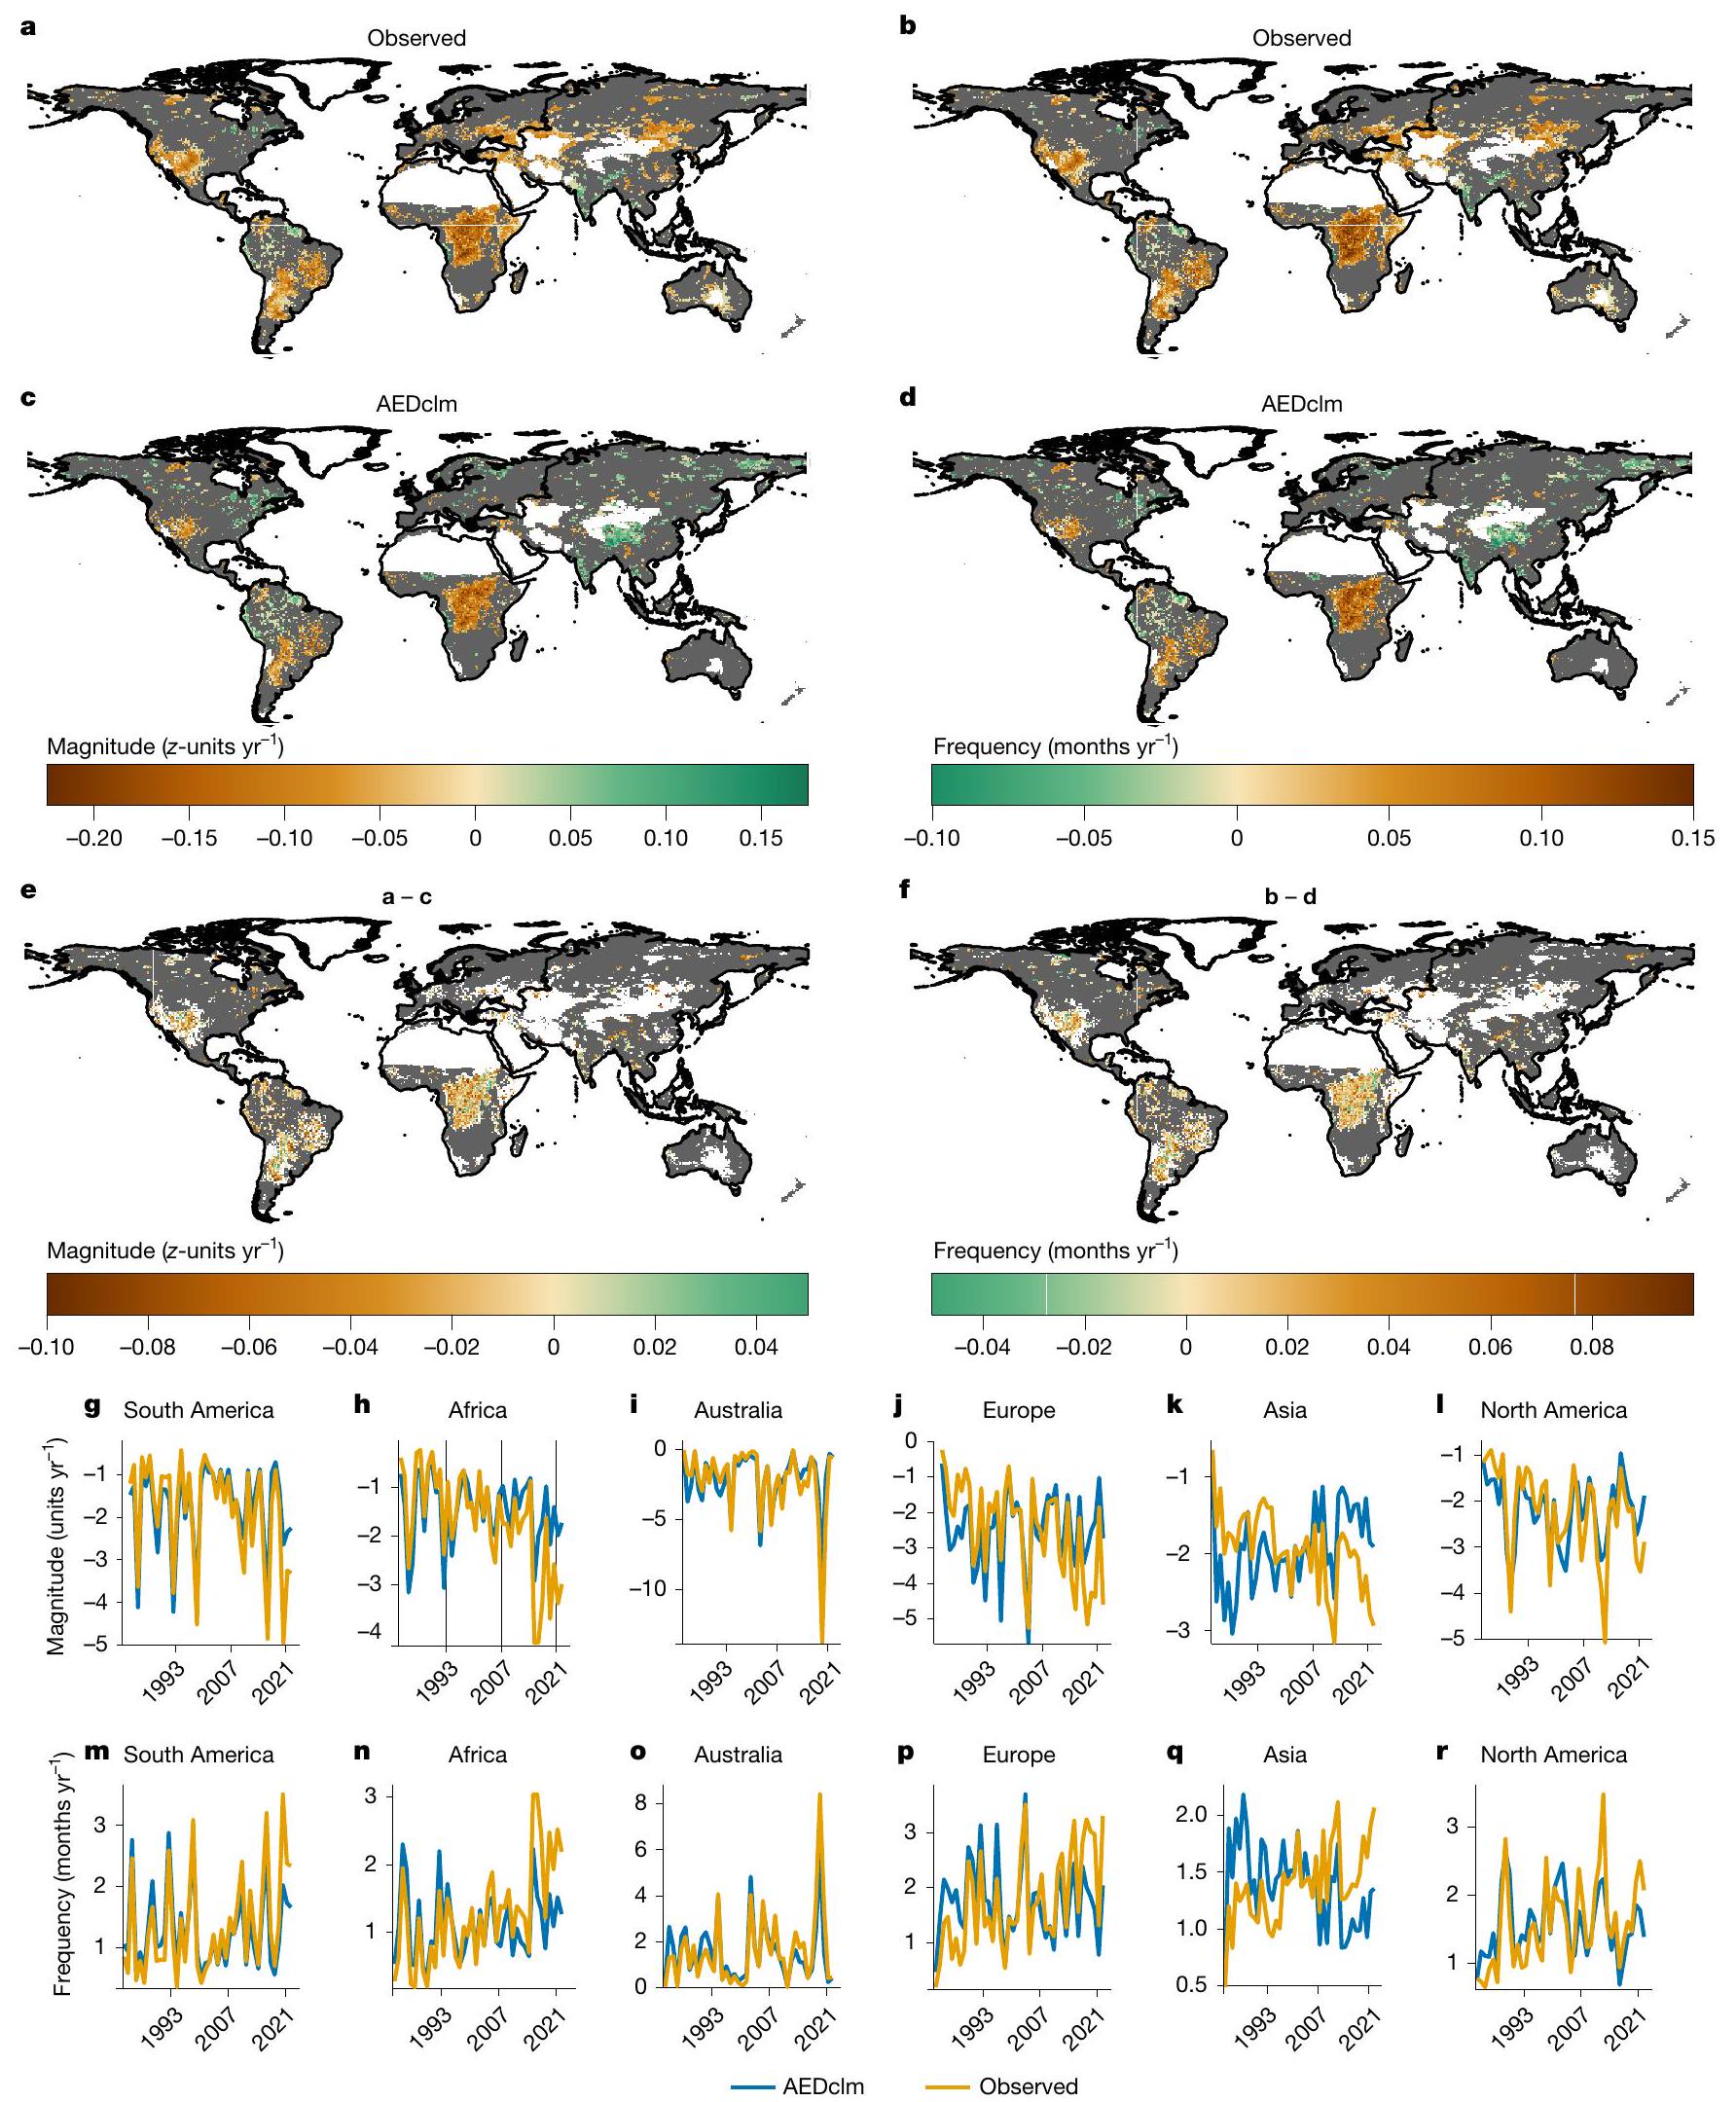
لقد زادت التغيرات الملحوظة في AED أيضًا من شدة وتكرار الجفاف على مستوى العالم (الشكل 2). مقارنةً بـ AEDcIm، تُظهر الاتجاهات الملحوظة شدة جفاف أكثر سلبية (حتى -وحدات ) واتجاه تردد أكثر إيجابية (حتى +0.16 شهر تظهر المتوسطات الإقليمية أن شدة الجفاف، استنادًا إلى AED الملاحظ، تُظهر اتجاهًا تنازليًا ملحوظًا بين و بينما الاتجاه ليس له دلالة إحصائية مع AEDcIm في أمريكا الجنوبية والشمالية، وأفريقيا، وأوروبا، وأستراليا (الشكل 2g-r). تظهر تكرارية الجفاف اتجاهًا متزايدًا ذا دلالة إحصائية بمقدار 0.02 شهر و 0.07 شهر مع ملاحظة AED، في حين أن الاتجاه منخفض جدًا وغير ذي دلالة باستخدام AEDclm. في آسيا، يظهر AEDclm زيادة ملحوظة في شدة الجفاف ( -وحدات ) وانخفاض في
الشكل 2 | اتجاهات شدة الجفاف وتكراره لمؤشر الجفاف القياسي لمدة 6 أشهر خلال الفترة من 1981 إلى 2022. أ، ب، الاتجاه في الشدة ( -وحدات ; أ) وتكرار (الشهور ) من الجفاف (SPEI<-1) للفترة من 1981 إلى 2022 استنادًا إلى هطول الأمطار المرصودة و AED (‘مرصود’). ج، د، الاتجاه في الحجم (ج) والتكرار (د) استنادًا إلى هطول الأمطار المرصودة و AEDclm (‘AEDclm’). هـ، و، الفرق في الاتجاه بين هطول الأمطار المرصودة و AEDclm لحجم الجفاف (هـ) والتكرار (و). يعتمد SPEI على MSWEP_hPET.
الاتجاه والمتوسط الإقليمي يستثنيان المناطق الجافة التي تقل فيها كمية الأمطار السنوية المتوسطة عن 180 مم. الاتجاهات غير ذات دلالة. مُعلمة باللون الرمادي لتعزيز الوضوح. يتم حساب الحجم كمجموع تراكمي لمؤشر SPEI. القيم خلال حدث الجفاف لكل عام وتُمثل التكرارية عدد الأحداث في السنة مع SPEI<-1.g-r، متوسط الحجم (الوحدات ) وتكرار (الشهور ) من الجفاف المتوسط عبر أمريكا الجنوبية (ج،م)، أفريقيا (هـ،ن)، أستراليا (ي،o)، أوروبا (ج،ب)، آسيا (ك،ق) وأمريكا الشمالية (ل،ر).
الشكل 3 | السلاسل الزمنية الشهرية واختلافات الاتجاه لمؤشر SPEI لمدة 6 أشهر خلال
1981-2022. أ، المتوسط شبه العالمي ( ) 6 أشهر من SPEI بناءً على AEDclm و Prclm و HRSPEI. تشير MSWEP_AEDclm و CHIRPS_AEDclm إلى متوسط SPEI بناءً على هطول الأمطار من MSWEP و CHIRPS و AEDclm (المتوسط المناخي لـ GLEAM و hPET). تُظهر GLEAM_Prclm و hPET_Prclm متوسط SPEI بناءً على AED من GLEAM و hPET و Prclm (المتوسط المناخي لـ MSWEP و CHIRPS). ب، الفرق في الاتجاه بين SPEI بناءً على
الملاحظات (هطول الأمطار الملاحظ و AED) و SPEI بناءً على هطول الأمطار الملاحظ والمناخ لـ AED (AEDclm). ج، الفرق في الاتجاه بين SPEI بناءً على الملاحظات و SPEI بناءً على AED الملاحظ والمناخ لهطول الأمطار (Prclm). الاتجاهات غير المهمة ( ) تم تمييزها باللون الرمادي لتعزيز الوضوح. الاتجاه يستثني المناطق الجافة التي تقل فيها متوسط ​​هطول الأمطار السنوي عن 180 مم. بالنسبة للمناطق التي تزيد عن ، الاتجاه يعتمد على متوسط MSWEP_hPET و MSWEP_GLEAM، حيث أن CHIRPS متاح حتى .
التردد ( -0.02 شهر ). على النقيض، تشير AED الملاحظة إلى انخفاض في الحجم ( -وحدات ) وزيادة في التكرار ( 0.02 شهر ).
بشكل عام، على الرغم من أن هطول الأمطار يمثل من الاتجاه العالمي المتوسط لمؤشر الجفاف (SPEI) خلال الفترة من 1981 إلى 2022، فإن دور درجة الحرارة الفعالة (AED) التي تساهم بنسبة 40% يعتبر كبيرًا (الشكل 4). وهذا ملحوظ بشكل خاص بالنظر إلى الحساسية الأقوى لمؤشر الجفاف (SPEI) تجاه هطول الأمطار مقارنةً بدرجة الحرارة الفعالة (AED) في معظم المناطق البرية. . في أفريقيا وأستراليا والمناطق الجافة في أمريكا الشمالية والجنوبية، يكون تأثير AED ملحوظًا بشكل خاص، حيث يساهم بنسبة تصل إلى 65% في اتجاهات الجفاف خلال الفترة من 1981 إلى 2022. على وجه التحديد، يمثل AED 44% من اتجاه الجفاف في أفريقيا و في أستراليا، تلعب دورًا كبيرًا في زيادة شدة الجفاف في هذه المناطق. على النقيض، فإن
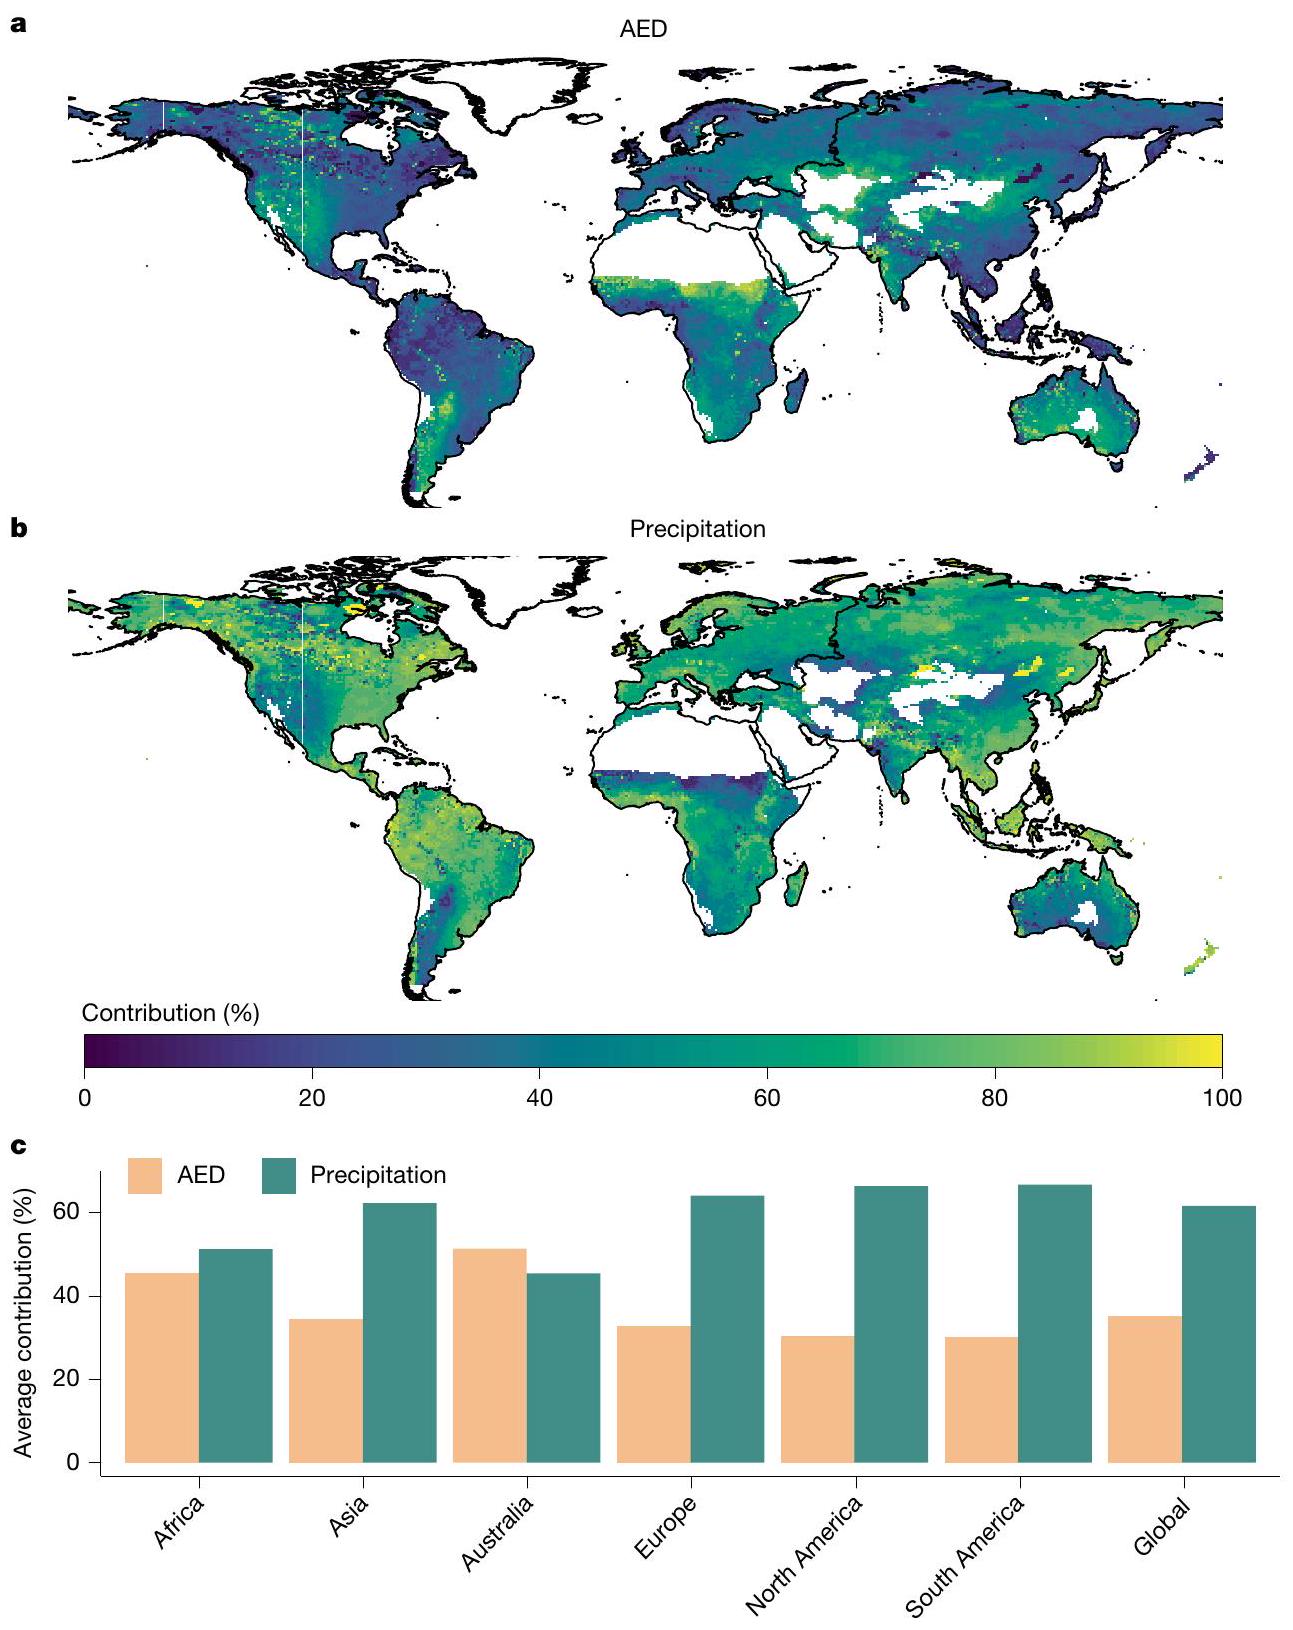
مساهمة AED في اتجاهات الجفاف في أمريكا الشمالية والجنوبية، وأوروبا، وآسيا حوالي .

تسارع الجفاف

لقد توسعت المنطقة المتأثرة بالجفاف بشكل كبير، لا سيما خلال السنوات الخمس الماضية (الشكل 4 من البيانات الموسعة). عالميًا، خلال السنوات الخمس الماضية (2018-2022)، كانت المساحة الملاحظة في حالة جفاف في المتوسط الذي هو أعلى من الفترة بين 1981-2017 و أعلى مقارنةً بـ AEDcIm للفترة من 2018 إلى 2022. إقليمياً، زادت المناطق المتأثرة بالجفاف بـ في أستراليا، في جنوب أمريكا الجنوبية، و في غرب الولايات المتحدة في 2018-2022 مقارنةً بـ
الشكل 4 | النسبة المئوية لمساهمة AED وهطول الأمطار في الاتجاهات في SPEI لمدة 6 أشهر. أ، ب، النسبة المئوية لمساهمة AED (أ) والنسبة المئوية لمساهمة هطول الأمطار (ب) في التغيرات الملحوظة في HRSPEI لمدة 6 أشهر خلال الفترة من 1981 إلى 2022. يتم حساب المساهمات من خلال حساب الفرق بين الاتجاه الملحوظ والاتجاه المستند إلى القيم المناخية لـ AED (AEDclm) وهطول الأمطار (Prclm). يتم تحديد مساهمة AED من خلال الفرق بين الاتجاه باستخدام AED وهطول الأمطار الملحوظة و
الاتجاه باستخدام هطول الأمطار الملاحظ و AEDcIm. وبالمثل، يتم حساب مساهمة هطول الأمطار كفرق بين الاتجاه باستخدام هطول الأمطار الملاحظ و AED والاتجاه باستخدام AED الملاحظ و Prclm. ثم يتم حساب النسبة المئوية لمساهمة كل عامل كقيمة مطلقة للاختلاف مقسومة على إجمالي الفرق المطلق، مما يوفر مقياسًا نسبيًا لتأثير كل عامل على الاتجاه الملاحظ. ج، المساهمة الإقليمية والعالمية المتوسطة لهطول الأمطار و AED في التغيرات في SPEI.
1981-2017 (الشكل البياني الممتد 8). وبالمثل، في السنوات الخمس الماضية، زادت مناطق الجفاف بنسبة 75% و80% و56% في شرق إفريقيا وآسيا الشمالية وأوروبا، على التوالي. في المقابل، عند استخدام AEDclm، كانت الزيادات أقل بكثير في أستراليا. )، جنوب أمريكا الجنوبية (62%)، غرب الولايات المتحدة (58%) وآسيا الشمالية (0.5%)، في حين شهدت أوروبا وشرق إفريقيا انخفاضًا بنحو 8%. تم تقديم ملخص لهذه التغييرات في الشكل 8h من البيانات الموسعة.
كانت شدة الجفاف في عام 2022 غير مسبوقة مقارنةً بالفترة من 1981 إلى 2022 (الشكل 8 من البيانات الموسعة). كان عام 2022 هو العام الذي شهد أكبر مساحة جفاف. )، وهو أعلى من AEDclm. كما هو موضح في الشكل 1d، يشير مؤشر SPEI لمدة 6 أشهر لشهر أغسطس 2022 إلى جفاف معتدل إلى شديد في جميع أنحاء أوروبا وشرق إفريقيا وغرب الولايات المتحدة وجنوب أمريكا الجنوبية، مع المناطق المتأثرة بالجفاف تقريبًا
أكبر من AEDcIm. بالإضافة إلى ذلك، كان متوسط SPEI -0.85 وحدة ، مقارنة بـ 0.52 وحدة استنادًا إلى AEDclm. بشكل عام، بسبب الزيادة الملحوظة في AED، تشير الاتجاهات في SPEI والمناطق المتأثرة بالجفاف خلال الفترة من 1981 إلى 2022 إلى أن المناطق الأكثر جفافًا أصبحت أكثر جفافًا، كما أن المناطق الرطبة تشهد أيضًا اتجاهات جفاف.

نقاش

وفقًا لمؤشر SPEI، فقد زادت شدة الجفاف العالمي على مدى الـ 42 عامًا الماضية (1981-2022). في السنوات الخمس إلى العشر الماضية، تسارعت هذه الاتجاه نتيجة الزيادة الكبيرة في AED، والتي ترتبط ارتباطًا مباشرًا بالاحترار العالمي وزيادة عجز ضغط البخار. ، حيث إن إمدادات المياه إلى الغلاف الجوي ليست كافية لـ
تعويض الزيادة الكبيرة في درجة الحرارة. وقد اقترحت بعض الدراسات الحديثة أيضًا زيادة في شدة أحداث الجفاف على مساحات شاسعة من الأراضي استنادًا إلى مقاييس مثل رطوبة التربة المحاكاة. ومؤشر شدة الجفاف بالبالمر جميعها حساسة للتغيرات في الدرهم الإماراتي. ومع ذلك، في دراستنا، قمنا بت quantifying مساهمة الدرهم الإماراتي في تفاقم ظروف الجفاف، والتي بلغت حتى في بعض المناطق، وخاصة في أفريقيا، أستراليا، غرب الولايات المتحدة وجنوب أمريكا الجنوبية. علاوة على ذلك، فإن التغيرات في AED قد زادت من اتجاه الجفاف عالميًا، خاصة في العقد الماضي. كان عام 2022 على وجه الخصوص عامًا قياسيًا من حيث شدة ومدى الجفاف في أوروبا وشرق أفريقيا. في أوروبا، يمكن أن يُعزى شدة حدث الجفاف في 2022 إلى الاحترار الناتج عن الأنشطة البشرية، حيث لا يمكن تفسير الشذوذات الملحوظة في تدفق المياه ورطوبة التربة من خلال نقص الأمطار وحده، بل بشكل رئيسي من خلال زيادة AED، التي زادت من فقدان المياه عن طريق التبخر. علاوة على ذلك، لا يمكن تفسير شدة الجفاف البيئي المسجلة في الغابات الطبيعية في أوروبا بشكل كامل دون النظر في تأثير درجات الحرارة العالية و AED على فسيولوجيا النباتات. في غياب دراسات نسبية رسمية في مناطق أخرى من العالم التي شهدت جفافًا في عام 2022، تشير النسبة في أوروبا وزيادة الشدة عالميًا المدفوعة بزيادة AED كما هو موضح في هذه الدراسة إلى أنه من المعقول أن نستنتج أن الاحترار العالمي الناتج عن الأنشطة البشرية قد ساهم على الأرجح في تفاقم شدة الجفاف العالمي في عام 2022.
مقارنة بالدراسات السابقة التي تحلل الاتجاهات الحديثة للجفاف استنادًا إلى مؤشرات الجفاف الجوية التي تستخدم AED في الحسابات لقد عزلت هذه الدراسة تأثير AED على شدة الجفاف، بالإضافة إلى أن دراستنا قد قللت أيضًا من الشكوك نظرًا لاستخدام بيانات عالية الدقة المكانية ومتعددة المصادر، مما يسمح بفهم أوضح لتفاقم الجفاف. يتماشى الزيادة الملحوظة في شدة الجفاف مع التأثيرات المرتبطة على الأنظمة الزراعية والبيئية والهيدرولوجية، كما يتضح في أحداث مثل جفاف أوروبا في عام 2022، الذي ساهم في زيادة وفيات الأشجار، وزيادة حرائق الغابات، وانخفاض رطوبة التربة على المدى الطويل. على الرغم من أن مؤشر SPEI هو مؤشر جفاف جوي يلتقط بفعالية تأثيرات الهطول و AED على شدة الجفاف، إلا أنه قد يمثل تأثيرات الجفاف بشكل فعال جداً. ومع ذلك، هناك حاجة إلى مزيد من الدراسات، مع الأخذ في الاعتبار متغيرات مثل رطوبة التربة، وإجهاد النباتات، والتدفقات الهيدرولوجية لفهم أفضل للتأثيرات الأوسع للتغيرات الملحوظة على النظم البيئية والأنشطة البشرية. علاوة على ذلك، فإن التسارع الملحوظ في اتجاهات الجفاف في السنوات القليلة الماضية يتماشى مع توقعات المناخ المستقبلية التي تشير إلى زيادة أخرى في شدة الجفاف بسبب الاحترار المتوقع. الذي يحذر من الحاجة إلى تحسين تدابير التكيف الاجتماعية والاقتصادية والبيئية للحد من آثار الجفاف وتحسين الجفاف العالمي.

المحتوى عبر الإنترنت

أي طرق، مراجع إضافية، ملخصات تقارير Nature Portfolio، بيانات المصدر، بيانات موسعة، معلومات تكميلية، شكر وتقدير، معلومات مراجعة الأقران؛ تفاصيل مساهمات المؤلفين والمصالح المتنافسة؛ وبيانات توفر البيانات والرموز متاحة علىhttps://doi.org/10.1038/s41586-025-09047-2.
8. فورست، ك.، تاروجا، ب.، تشيانغ، ف.، أغاكوشاك، أ. وسامويلسن، س. تقييم آثار تغير المناخ على توليد الطاقة الكهرومائية في كاليفورنيا وتوفير الخدمات المساعدة. تغير المناخ 151، 395-412 (2018).
9. غريف، ب.، غودموندسون، ل. وسينيفيراتني، س. آي. القياس الإقليمي لمتوسط هطول الأمطار السنوي وتوافر المياه مع تغير درجة الحرارة العالمية. ديناميات نظام الأرض 9، 227-240 (2018).
10. غريف، ب.، رودريك، م. ل. وسينيفيراتني، س. أ. التغيرات المحاكاة في الجفاف من الحد الأقصى الجليدي الأخير إلى 4xCO2. رسائل البحث البيئي 12، 114021 (2017).
11. بادرو، ر. س. وآخرون. التغيرات الملحوظة في توفر المياه خلال موسم الجفاف المنسوبة إلى التغير المناخي الناتج عن الأنشطة البشرية. نات. جيوسي. 13، 477-481 (2020).
12. ماهيتشا، م. د. وآخرون. فقدان التنوع البيولوجي والظواهر المناخية المتطرفة – دراسة التفاعلات. ناتشر 612، 30-32 (2022).
13. سيني فيراتني، س.إ. وآخرون. أحداث الطقس والمناخ المتطرفة في مناخ متغير. في تغير المناخ 2021: الأساس العلمي الفيزيائي. مساهمة مجموعة العمل الأولى في التقرير التقييمي السادس للهيئة الحكومية الدولية المعنية بتغير المناخ (تحرير ماسون-ديلموتي، ف. وآخرون) الفصل 11، 1513-1766 (مطبعة جامعة كامبريدج، كامبريدج، 2021)؛https://doi.org/10.1017/9781009157896.013.
14. زو، ب. وآخرون. الاحترار يقلل من الإنتاج الزراعي العالمي من خلال تقليل تكرار الزراعة والمحاصيل. نات. مناخ. تغيير 12، 1016-1023 (2022).
15. باومان، د. وآخرون. زادت وفيات الأشجار الاستوائية مع ارتفاع ضغط المياه في الغلاف الجوي. ناتشر 608، 528-533 (2022).
16. كيكسترا، ج. وآخرون. تقرير التقييم السادس للهيئة الحكومية الدولية المعنية بتغير المناخ WGIII تقييم المناخ لمسارات التخفيف: من الانبعاثات إلى درجات الحرارة العالمية. EGUspherehttps://doi.org/10.5194/egusphere-2022-471 (2022).
17. فيسنتي-سيرانو، س. م. وآخرون. الاتجاهات العالمية للجفاف والتوقعات المستقبلية. فيل. ترانس. ر. سوس. رياضيات. فيزيائية. هندسية. علوم. 380، 20210285 (2022).
18. دوفيلي، هـ. وويليت، ك. م. مستقبل أكثر جفافًا مما كان متوقعًا، مدعومًا بملاحظات الرطوبة النسبية القريبة من السطح. ساينس أدفانس 9، eade6253 (2023).
19. داي، أ. زيادة الجفاف تحت الاحترار العالمي في الملاحظات والنماذج. نات. مناخ. تغيير 3، 52-58 (2013).
20. تقرير التقييم الشامل لتغير المناخ 2014 (تحرير فريق الكتابة الأساسي، باتشوري، ر. ك. وماير، ل. أ.) (الهيئة الحكومية الدولية المعنية بتغير المناخ، 2014).
21. ألين، سي. دي.، بريشيرز، دي. دي. ومكدوال، إن. جي. حول التقليل من تقدير الضعف العالمي تجاه موت الأشجار وموت الغابات بسبب الجفاف الأكثر حرارة في الأنثروبوسين. إيكوسفير 6، 129 (2015).
22. بيرغ، أ. وشيفيلد، ج. تغير المناخ والجفاف: منظور رطوبة التربة. تقارير تغير المناخ الحالية 4، 180-191 (2018).
23. كوك، ب. آي. وآخرون. توقعات الجفاف في القرن الحادي والعشرين في سيناريوهات الضغط CMIP6. مستقبل الأرض 8، e2019EF001461 (2020).
24. غاريدو-بيريز، ج. م. وآخرون. دراسة الجفاف البارز في منطقة اليورو-المتوسط لعام 2021-2022 وسياقه التاريخي. مجلة الهيدرولوجيا 630، 130653 (2024).
25. بيفاكوا، إ. وآخرون. أثرت تأثيرات تغير المناخ المباشرة والمتأخرة على جفاف أوروبا في عام 2022. نات. جيوساي. 17، 1100-1107 (2024).
26. تقرير الهيئة الحكومية الدولية المعنية بتغير المناخ 2022: الآثار، التكيف، والضعف (تحرير بورتنر هـ.-أو. وآخرون) (مطبعة جامعة كامبريدج، 2022).
27. كينغستون، د. ج.، تود، م. س.، تايلور، ر. ج.، طومسون، ج. ر. وأرنيل، ن. و. عدم اليقين في تقدير التبخر المحتمل تحت تغير المناخ. رسائل أبحاث الجيوفيزياء 36، L20403 (2009).
28. فان دير شراير، ج.، باريتشيفيتش، ج.، بريفا، ك. ر. وجونز، ب. د. مجموعة بيانات عالمية قائمة على scPDSI لفترات الجفاف والرطوبة من 1901 إلى 2009. مجلة أبحاث الجيوفيزياء. أتموس. 118، 4025-4048 (2013).
29. بيك، هـ. إ. وآخرون. تقييم عالمي لـ 22 مجموعة بيانات هطول الأمطار باستخدام ملاحظات القياس والنمذجة الهيدرولوجية. علوم الأرض والهيدرولوجيا 21، 6201-6217 (2017).
30. Gebrechorkos، S. H. وآخرون. تقييم عالمي لمجموعات بيانات الهطول لنمذجة الهيدرولوجيا. علوم الأرض والهيدرولوجيا 28، 3099-3118 (2024).
31. فيسنتي-سيرانو، س. م.، بيغويريا، س. و لوبيز-مورينو، ج. I. مؤشر جفاف متعدد المقاييس حساس للاحتباس الحراري: مؤشر التبخر والنتح المطري الموحد. مجلة المناخ 23، 1696-1718 (2010).
32. توماس-بورغويرا، م. وآخرون. التوصيف العالمي للاستجابات المتنوعة لمؤشر التبخر-النتح القياسي للطلب التبخيري الجوي. مجلة أبحاث الغلاف الجوي، 125، e2020JD033017 (2020).
33. هايل، ج. ج. وآخرون. التغير الزمني والمكاني طويل الأمد لأنماط الجفاف في منطقة القرن الأفريقي الكبرى. العلوم. البيئة الكلية 704، 135299 (2020).
34. كامروززمان، م. وآخرون. تحليل الجفاف الزماني والمكاني في بنغلاديش باستخدام مؤشر هطول الأمطار المعياري (SPI) ومؤشر تبخر هطول الأمطار المعياري (SPEI). تقارير علمية 12، 20694 (2022).
35. سبينوني، ج. وآخرون. النقاط الساخنة المستقبلية للجفاف الميتورولوجي العالمي: دراسة مستندة إلى بيانات CORDEX. مجلة المناخ 33، 3635-3661 (2020).
36. وانغ، تي، تو، إكس، سينغ، في. بي، تشين، إكس. ولين، ك. تقييم وتحليل البيانات العالمية لخصائص الجفاف استنادًا إلى CMIP6. مجلة الهيدرولوجيا 596، 126091 (2021).
37. سبينوني، ج. وآخرون. قاعدة بيانات عالمية جديدة لأحداث الجفاف المناخي من 1951 إلى 2016. مجلة الدراسات الإقليمية للهيدرولوجيا 22، 100593 (2019).
38. بيغويريا، س.، فيسنتي-سيرانو، س. م.، ريج، ف. ولاتور، ب. إعادة النظر في مؤشر تبخر-تعرق الأمطار الموحد (SPEI): ملاءمة المعلمات، نماذج التبخر-تعرق، الأدوات، مجموعات البيانات ومراقبة الجفاف. المجلة الدولية لعلم المناخ 34، 3001-3023 (2014).
39. وانغ، ق. وآخرون. الخصائص الزمنية والمكانية لأحداث الجفاف الشديدة وتأثيرها على الزراعة على نطاق عالمي. كوات. إنترن. 349، 10-21 (2014).
40. فنك، سي. وآخرون. سجلات المناخ للأمطار بالأشعة تحت الحمراء مع المحطات – سجل بيئي جديد لرصد الظروف المتطرفة. بيانات العلوم 2، 150066 (2015).
41. بيك، هـ. إ. وآخرون. MSWEP V2 العالمية كل 3 ساعات هطول الأمطار: المنهجية والتقييم الكمي. نشرة. جمعية الأرصاد الجوية الأمريكية 100، 473-500 (2019).
42. ميرانيس، د. ج. وآخرون. GLEAM4: مجموعة بيانات تبخر المياه من اليابسة ورطوبة التربة على مستوى من 1980 حتى الوقت الحاضر. بيانات علمية 12، 416 (2025).
43. سينجر، م. ب. وآخرون. التبخر المحتمل الساعي عند على مستوى الأرض العالمية من 1981 حتى الآن. بيانات علمية 8، 224 (2021).
44. داي، أ. وزهاو، ت. عدم اليقين في التغيرات التاريخية والتوقعات المستقبلية للجفاف. الجزء الأول: تقديرات التغيرات التاريخية للجفاف. تغير المناخ 144، 519-533 (2017).
45. سونغ، إكس، سونغ، واي وتشين، واي. الاتجاه العلماني للجفاف العالمي منذ 1950. رسائل البحث البيئي 15، 094073 (2020).
46. علي زاده، م. ر. وآخرون. الاحترار مكن التقدم في حرائق الغابات في غرب الولايات المتحدة. إجراءات الأكاديمية الوطنية للعلوم في الولايات المتحدة 118، e2009717118 (2021).
47. باخماير، س.، تانغوي، م.، هانا فورد، ج. وستال، ك. إلى أي مدى تمثل المؤشرات الجوية الجفاف الزراعي والغابات عبر أوروبا؟ رسائل البحث البيئي 13، 034042 (2018).
48. ناومان، ج. وآخرون. التغيرات العالمية في ظروف الجفاف تحت مستويات مختلفة من الاحترار. رسائل البحث الجيوفيزيائي 45، 3285-3296 (2018).
ملاحظة الناشر: تظل Springer Nature محايدة فيما يتعلق بالمطالبات القضائية في الخرائط المنشورة والانتماءات المؤسسية.
ترخيص دولي 4.0، الذي يسمح بالاستخدام والمشاركة والتكيف والتوزيع وإعادة الإنتاج في أي وسيلة أو تنسيق، طالما أنك تعطي الائتمان المناسب للمؤلفين الأصليين والمصدر، وتوفر رابطًا لرخصة المشاع الإبداعي، وتوضح ما إذا كانت هناك تغييرات قد تم إجراؤها. الصور أو المواد الأخرى من طرف ثالث في هذه المقالة مشمولة في رخصة المشاع الإبداعي للمقالة، ما لم يُشار إلى خلاف ذلك في خط ائتمان للمادة. إذا لم تكن المادة مشمولة في رخصة المشاع الإبداعي للمقالة وكان استخدامك المقصود غير مسموح به بموجب اللوائح القانونية أو يتجاوز الاستخدام المسموح به، فستحتاج إلى الحصول على إذن مباشرة من صاحب حقوق الطبع والنشر. لعرض نسخة من هذه الرخصة، قم بزيارة http://creativecommons.org/licenses/by/4.0/.
© المؤلفون 2025

طرق

مؤشر الجفاف

SPEI هو أداة تقييم جفاف مستخدمة على نطاق واسع تدمج كل من AED وهطول الأمطار لتقييم شدة الجفاف عبر مقاييس زمنية مختلفة. يتم حساب قيم SPEI عن طريق طرح AED من هطول الأمطار. يتم توحيد هذه الفروقات باستخدام توزيع احتمالي لوغاريتمي-لوغاريتمي لضمان الاتساق عبر المناطق والمواسم والمقاييس الزمنية. يتضمن نموذج التوزيع هذا ثلاثة معلمات ( و ), والتي يتم تقديرها باستخدام إجراء L-moment. تم حساب مؤشرات SPEI باستخدام الفترة الكاملة من 1981-2022 كخط أساس، مما يضمن التقاط النطاق الكامل للتغيرات في بيانات الإدخال. على عكس مؤشرات الجفاف الأخرى، لا يتطلب SPEI خط أساس محدد مسبقًا أو فترة معايرة، حيث يقوم بتوحيد البيانات مباشرة من سلسلة الزمن المدخلة، مما يضمن الاتساق عبر مجموعات البيانات والمقاييس الزمنية. توفر قيم SPEI فئات للأحداث الرطبة والجافة (البيانات الموسعة الجدول 1).
باستخدام SPEI، قمنا بتطوير أربعة مؤشرات SPEI عالية الدقة باستخدام مجموعة من مجموعتي بيانات هطول الأمطار ومجموعتي بيانات التبخر المحتمل (أي، AED). كانت مجموعات بيانات هطول الأمطار المستخدمة هي MSWEP و CHIRPS وهما مجموعتا بيانات AED هما GLEAM و . تم تطوير المؤشرات الأربعة الناتجة: MSWEP_GLEAM، MSWEP_hPET، CHIRPS_GLEAM و CHIRPS_hPET، بدقة مكانية قدرها للفترة من 1981-2022. تم أولاً استيفاء مجموعات البيانات ذات الدقة لتتناسب مع دقة CHIRPS باستخدام الاستيفاء الثنائي. بالإضافة إلى ذلك، قمنا بتطوير متوسط جماعي (HRSPEI) استنادًا إلى جميع مجموعات البيانات الأربعة. بالنسبة لخطوط العرض فوق ، يتم اشتقاق المتوسط من MSWEP_GLEAM و MSWEP_hPET، حيث تتوفر بيانات CHIRPS فقط حتى خط عرض . تكون AED وتغيرات AED في المناطق ذات الخطوط العرض العالية صغيرة عمومًا، وتؤدي التغيرات في AED، حتى عند النسب العالية، إلى أحجام مطلقة منخفضة، مما يجعل SPEI أقل حساسية لـ AED في هذه المناطق .
لتقييم مساهمات هطول الأمطار و AED، قمنا بتطوير مؤشرات إضافية استنادًا إلى AED المرصود (أي، القيم الفعلية من hPET و GLEAM) مع هطول الأمطار المناخي الشهري (Prclm)، وهطول الأمطار المرصود (أي، مزيج من بيانات القياس والبيانات الساتلية وبيانات إعادة التحليل) مع AED المناخي (AEDclm) للفترة من 1981-2022. باستخدام AEDcIm و Prclm، يمكننا قياس تأثير التغيرات والتقلبات في هطول الأمطار و AED على الجفاف على مدى السنوات الـ 42 الماضية. لتقييم التغيرات في الجفاف خلال أوائل ومنتصف التسعينيات، قمنا بتطوير مؤشرين SPEI بدقة خشن استنادًا إلى ERA5 و CRU-TS . تم حساب SPEI استنادًا إلى ERA5 باستخدام هطول الأمطار الشهري و AED المشتق من مجموعات بيانات ERA5 الجوية باستخدام معادلة بنمان-مونتيث (المعادلة (1)) للفترة من 1950-2022. وبالمثل، تم حساب SPEI استنادًا إلى CRU-TS باستخدام هطول الأمطار الشهري و AED المشتق من مجموعات بيانات CRU-TS الجوية باستخدام معادلة بنمان-مونتيث (المعادلة (1)) للفترة من 1901-2022.
في هذه الدراسة، نستخدم SPEI < -1 كعتبة لتعريف الجفاف، مع اعتبار القيم بين -1 و 1 ظروفًا قريبة من الطبيعية والقيم تشير إلى ظروف رطبة (البيانات الموسعة الجدول 1). باستخدام قيم SPEI<-1، قمنا بتقييم مقاييس الجفاف الرئيسية: الحجم، المدة، الشدة والتكرار. نتبع النهج الكلاسيكي والأساليب المعتمدة على نطاق واسع لتعريف هذه المقاييس . يتم حساب حجم الجفاف كمجموع تراكمي (إجمالي جاري) لقيم SPEI < -1 خلال حدث الجفاف. يتم تعريف شدة الجفاف على أنها القيمة السلبية القصوى لـ SPEI التي تم ملاحظتها خلال الحدث. تمثل المدة طول الفترة من الأشهر المتتالية مع SPEI ، والتكرار هو العدد الإجمالي لحدوثات الجفاف خلال فترة معينة . أخيرًا، يتم استخدام الشدة كمصطلح شامل للإشارة إلى جميع جوانب الجفاف: الشدة، الحجم، المدة والنطاق.

مجموعات بيانات المناخ العالمية و AED

تقدم مجموعة بيانات MSWEP (الإصدار 2.8) تقديرات هطول الأمطار العالمية كل 3 ساعات، يوميًا وشهريًا بدقة مكانية قدرها من 1979
حتى الآن . وبالمثل، توفر مجموعة بيانات CHIRPS (الإصدار 2.0) تقديرات هطول الأمطار اليومية والعشرية والشهرية على اليابسة، بدقة مكانية قدرها لخطوط العرض تحت ، تغطي الفترة من 1981 حتى الآن . تم تطوير كل من MSWEP و CHIRPS كمجموعات بيانات هطول أمطار عالية الدقة من خلال دمج ملاحظات محطات الأرض، وبيانات الأقمار الصناعية ومنتجات إعادة التحليل.
تم اختيار CHIRPS و MSWEP لأنها عمومًا تتفوق على مجموعات بيانات هطول الأمطار المماثلة الأخرى عند مقارنتها بملاحظات الأرض . تم تصميم CHIRPS ( ) بشكل خاص لمراقبة الجفاف واكتشاف التغيرات البيئية، حيث يوفر تقديرات هطول الأمطار اليومية من 1981 حتى الآن. يجمع بين بيانات هطول الأمطار المستمدة من الأقمار الصناعية من مركز مخاطر المناخ (CHIRP) وبيانات مناخ هطول الأمطار لمجموعة مخاطر المناخ (CHPclim) مع بيانات محطات الأرض من الشبكة العالمية للمناخ التاريخي والعديد من المصادر الأخرى. يستفيد منتج CHIRPS من درجة عالية من التجانس، التي توفرها أساسه البسيط ولكن المتسق من ملاحظات الأقمار الصناعية الحرارية الجيوديسية. كما يتضمن CHIRPS مدخلات ملاحظة فريدة من إفريقيا وأمريكا اللاتينية وأمريكا الوسطى. تم تصميم MSWEP ( ) مع مراعاة كل من الدقة والتجانس، حيث يوفر تقديرات هطول الأمطار كل 3 ساعات من 1979 حتى الآن. يدمج الملاحظات اليومية من أكثر من 77,000 محطة من مصادر بيانات وطنية ودولية مختلفة، وتقديرات الأقمار الصناعية من مجموعات بيانات الأقمار الصناعية المستندة إلى الأشعة تحت الحمراء والميكروويف، وبيانات إعادة التحليل، مما يوفر بيانات دقيقة عن هطول الأمطار العالمية من 1979 حتى الآن. تم تقييم كل من CHIRPS و MSWEP سابقًا على مستوى العالم باستخدام مقاييس إحصائية مثل كفاءة كلينغ-غوبتا وكفاءة ناش-سوتكليف، بالإضافة إلى مقاييس مختلفة للانحياز والخطأ . على سبيل المثال، تفوقت MSWEP على 22 مجموعة بيانات هطول أمطار عالمية أخرى في التقاط هطول الأمطار اليومية من 76,086 محطة قياس وفي دفع النماذج الهيدرولوجية عبر 9,053 حوضًا. . بالإضافة إلى ذلك، وُجد أن كل من MSWEP و CHIRPS يتفوقان على مجموعات البيانات الأخرى المعتمدة على القياسات عالية الدقة في نمذجة تدفق المياه اليومي والشهري والسنوي عبر 1,825 مقياس تدفق مياه. . ومع ذلك، تظل كلتا مجموعتي البيانات عرضة لعدم اليقين الكامن، وبالتالي، فإن النظر في كلاهما يساعد على تقليل التحيزات والحصول على تقديرات أكثر موثوقية، نظرًا لأنهما مستقلتان إلى حد ما. على سبيل المثال، تختلف مصادر بياناتهما، حيث يستخدم CHIRPS فقط الملاحظات الحرارية تحت الحمراء الثابتة، بينما يستخدم MSWEP أيضًا ملاحظات الميكروويف، ويستخدمان مجموعات مختلفة من بيانات المحطات للتصحيح محليًا. على الرغم من هذه الاختلافات، فإن الارتباط الشهري بين MSWEP و CHIRPS يظهر ارتباطًا عاليًا عبر معظم المناطق، باستثناء وسط آسيا (الشكل التمديدي 9a). يختلف متوسط الفرق الشهري بين مجموعتي البيانات بمساحة معينة، ليصل إلى (الشكل التمديدي 9d). من الجدير بالذكر أن الفروقات الأكبر تحدث في مناطق مثل الأمازون، وسط أفريقيا وأجزاء من جنوب شرق آسيا. يساعد هذا التقارب بين المنتجين في تقليل المخاوف بشأن عدم اليقين الناتج عن الأساليب المختلفة والتغيرات في كوكبة الأقمار الصناعية لمراقبة الأرض التي يمكن أن تؤثر على قوة تمثيلها للتغيرات بمرور الوقت.
تعتبر hPET مجموعة بيانات عالمية للطلب على التبخر المحتمل AED تم تطويرها باستخدام مجموعات بيانات المناخ ERA5 ومعادلة بنمان-مونتيث التابعة لمنظمة الأغذية والزراعة (FAO) (المعادلة (1)). hPET متاحة لسطح الأرض العالمي بدقة تغطي الفترة من 1981 إلى 2022 . بالإضافة إلى ذلك، فإن AED من GLEAM (الإصدار 4.2a) هي مجموعة بيانات عالمية مستمدة باستخدام المعادلة الأصلية لبنمان (المعادلة (2))، باستخدام مجموعات بيانات الأقمار الصناعية وإعادة التحليل . GLEAM متاحة بدقة وتغطي الفترة من 1980 إلى 2023. تعتمد hPET على معادلة بنمان-مونتيث التابعة لمنظمة الأغذية والزراعة، التي تحسب تبخر المحاصيل المرجعي من خلال افتراض خصائص سطحية وديناميكية هوائية معينة ثابتة مع مرور الوقت. في المقابل، تحسب GLEAM التوصيل الديناميكي كمتغير ديناميكي يعتمد على خصائص النظام البيئي والأرصاد الجوية المحلية وبالتالي فهي تعتمد على المكان والزمان. ومع ذلك، نظرًا للتأثير السائد للقوة الإشعاعية والجفاف الجوي في كلا الحسابين، فإن تقديراتهما متشابهة بشكل عام. يتجاوز الارتباط بين GLEAM و hPET 0.9 عبر من
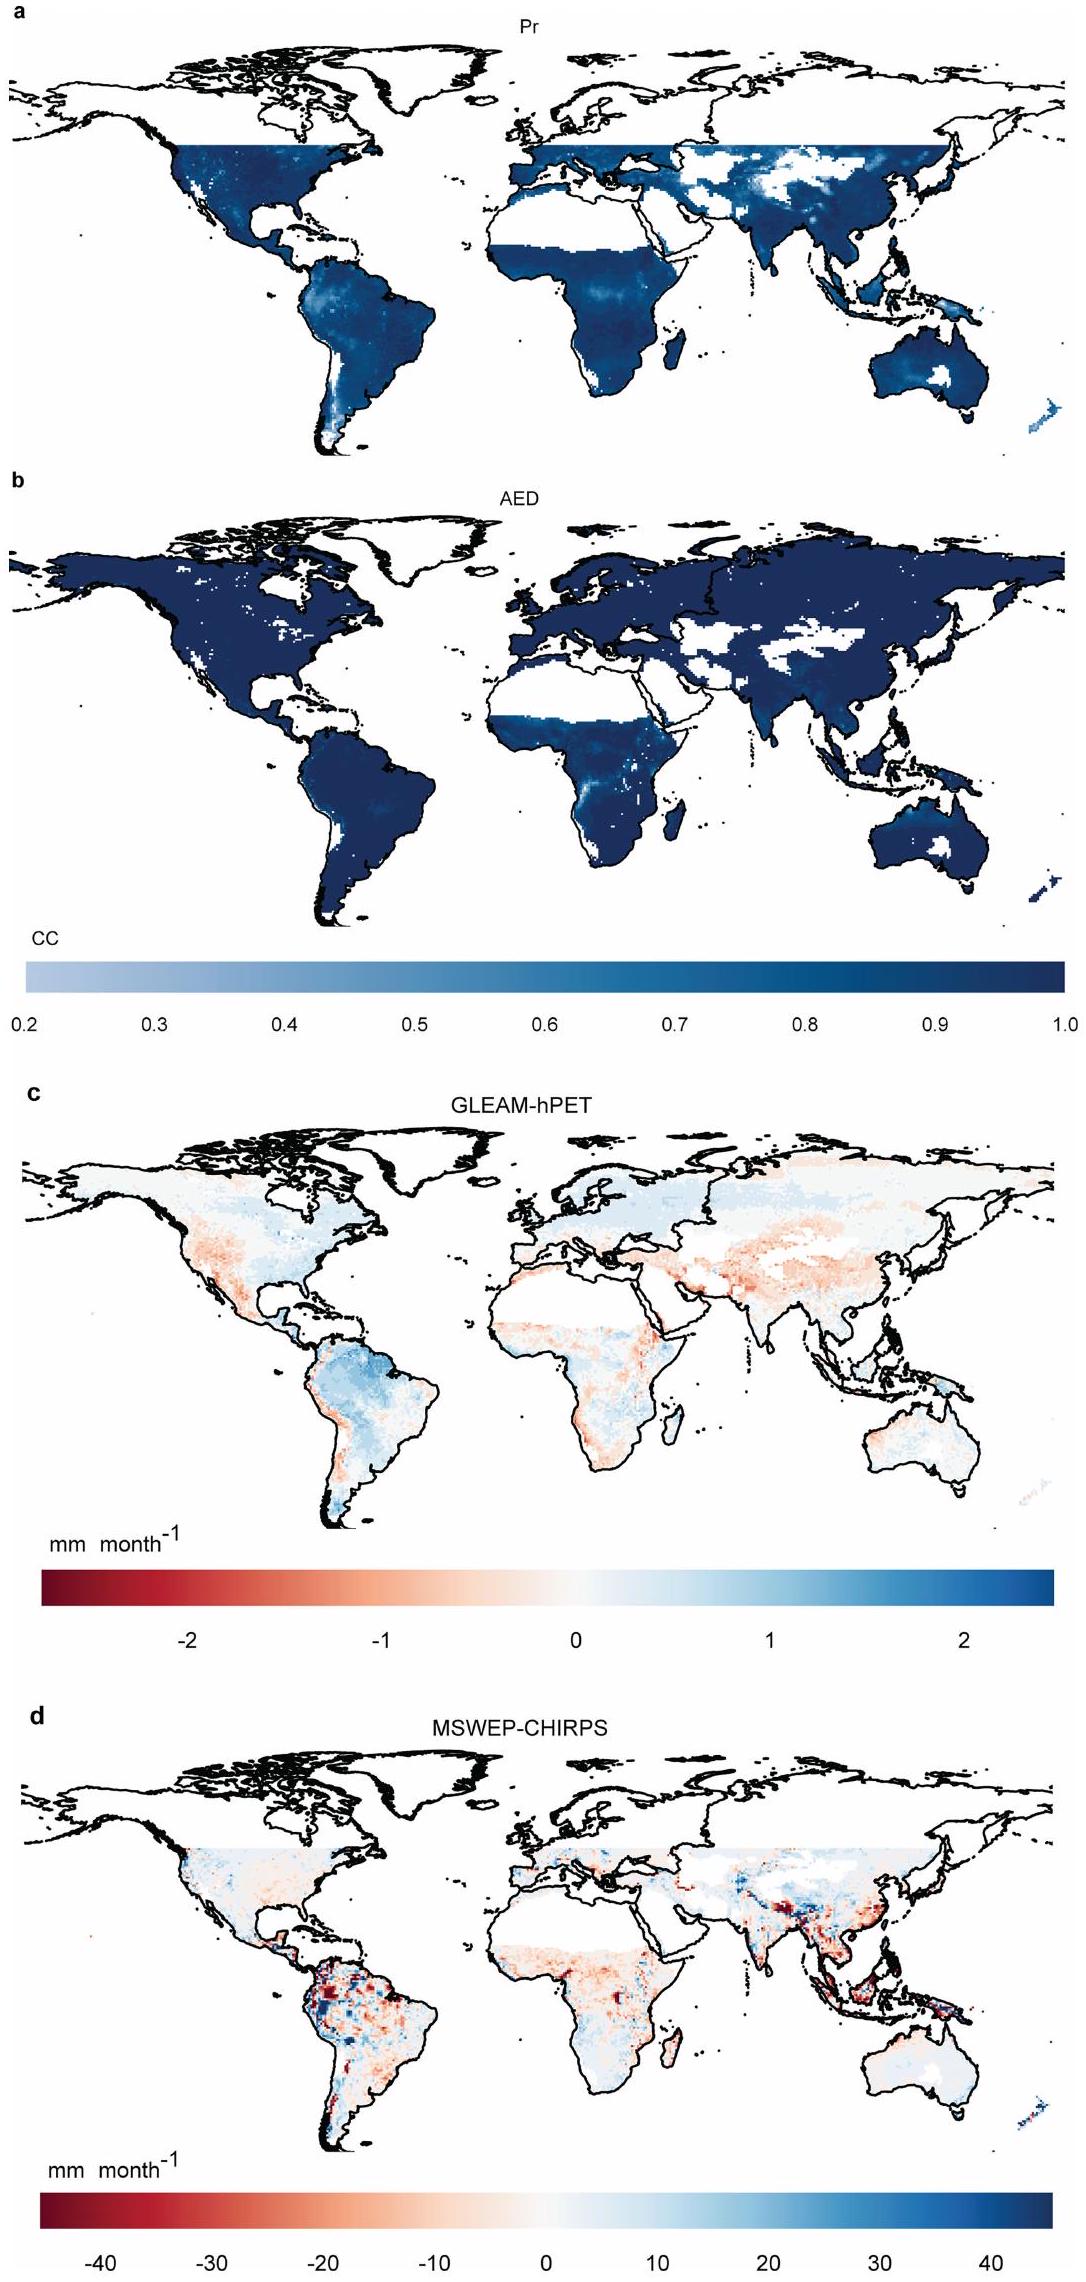
سطح الأرض العالمي (الشكل التمديدي 9b)، ومتوسط الفرق الشهري بينهما يصل إلى (الشكل التمديدي 9c).
تتوفر بيانات AED العالمية وبيانات الهطول من مجموعة بيانات CRU-TS بدقة ، تغطي الفترة من 1901 حتى الآن . وبالمثل، فإن مجموعة بيانات إعادة التحليل ERA5، التي تمثل إعادة التحليل من الجيل الخامس من المركز الأوروبي للتنبؤات الجوية متوسطة المدى (ECMWF)، متاحة بدقة من 1940 حتى الآن .

الطلب على التبخر الجوي

يتم تقدير hPET باستخدام معادلة بنمان-مونتيث FAO-56 (المعادلة (1))، ويتم حساب PET (التبخر المحتمل، AED) من GLEAM باستخدام معادلة بنمان، بما في ذلك التوصيل الديناميكي (المعادلة (2)). بالإضافة إلى ذلك، يتم تطبيق طريقة بنمان-مونتيث FAO-56 لحساب AED من مجموعات بيانات المناخ ERA5 للفترة من 1950 إلى 2022 ومجموعات بيانات المناخ CRU-TS للفترة من 1901 إلى 2022. تأخذ طرق بنمان وبنمان-مونتيث FAO-56 في الاعتبار متغيرات أرصادية مختلفة مثل سرعة الرياح، ودرجة حرارة الهواء، والإشعاع والرطوبة لتقدير AED:
حيث هو ميل الرسم البياني لعلاقة ضغط بخار التشبع ودرجة الحرارة، هو الإشعاع الصافي، هو تدفق حرارة التربة، هو الثابت النفسي، هو متوسط درجة حرارة الهواء اليومية عند الارتفاع، هو سرعة الرياح عند الارتفاع، هو عجز ضغط بخار الهواء (الفرق بين ضغط بخار التشبع وضغط بخار الهواء الفعلي)، هو كثافة الهواء، هو السعة الحرارية النوعية للهواء عند ضغط ثابت، هو التوصيل الديناميكي، و هو الحرارة الكامنة للتبخر.

تحليل الاتجاه

يتم تقييم الاتجاه في SPEI باستخدام اختبار مان-كيندال غير المعلمي ومقدر ميل سين. يحدد اختبار مان-كيندال الاتجاهات الصاعدة أو الهابطة في سلسلة زمنية SPEI لكل بكسل. يحسب مقدر ميل سين ميل التغير في سلسلة SPEI من خلال حساب الوسيط لجميع الميلان الممكنة بين نقاط البيانات. توفر هذه الطريقة تقديرًا قويًا للاتجاه، خاصة في وجود القيم الشاذة أو الأنماط غير الخطية. لتحديد أحداث الجفاف على مستوى البكسل، نستخدم فئات SPEI (الجدول التمديدي 1). تُستخدم قيم SPEI الأقل من -1.0 لتحديد المناطق المتأثرة بالجفاف. نقيم تكرار ومدة وشدة هذه الأحداث الجفاف (SPEI < -1) من خلال تحليل عدد الحدوث، وطول الفترات المتتالية وشدة قيم SPEI خلال الفترة من 1981 إلى 2022.

توفر البيانات

تتوفر مجموعات بيانات SPEI عالية الدقة ، التي تم تطويرها باستخدام مؤشر التبخر المحتمل المطور (SPEI) ، بشكل مجاني
من خلال مركز تحليل بيانات البيئة (CEDA) على https:// doi.org/10.5285/ac43da11867243a1bb414e1637802dec وعلى JASMIN على/badc/hydro-jules/data/Global_drought_indices. يمكن الوصول إلى بيانات CHIRPS عبر مجموعة مخاطر المناخ (CHG) على https://www. chc.ucsb.edu/data/chirps/ (المرجع 40). مجموعة بيانات هطول الأمطار MSWEP متاحة من موقع GloH2O على https://www.gloh2o.org/ mswep/ (المرجع 41). مجموعة بيانات hPET مستضافة من قبل جامعة بريستول على https://data.bris.ac.uk/data/dataset/qb8ujazzda0s2aykkv0oq0ctp (المرجع 43). يمكن الوصول إلى بيانات AED من GLEAM على https://www. gleam.eu/ (المرجع 42). تتوفر مجموعات بيانات هطول الأمطار و AED من CRU-TS من خلال CEDA على https://data.ceda.ac.uk/badc/cru/data/ cru_ts/cru_ts_4.08/(المرجع 50). مجموعة بيانات ERA5 متاحة للتنزيل من متجر بيانات المناخ لخدمة تغير المناخ كوبيرنيكوس على https://cds.climate.copernicus.eu/datasets (المرجع 51).

توفر الكود

استخدمت هذه الدراسة كود SPEI لحساب مؤشرات الجفاف. كود SPEI متاح للجمهور على GitHub على https://github.com/sbegueria/ SPEI/. لتحليل الاتجاه، تم استخدام حزمة Trend في R، المتاحة للجمهور على https://github.com/cran/trend. الكود المستخدم لتطوير مجموعات بيانات SPEI العالمية، وإجراء اختبارات الاتجاه وإنتاج الأشكال متاح على Zenodo على https://doi.org/10.5281/ zenodo. 15073433 (المرجع 53).
49. أغنيو، سي. تي. استخدام SPI لتحديد الجفاف. أخبار شبكة الجفاف 1994-2001 (مركز معلومات الجفاف الدولي ومركز التخفيف من آثار الجفاف، كلية الموارد الطبيعية، جامعة نبراسكا – لينكولن، 2000).
50. هاريس، آي.، أوزبورن، تي. جي.، جونز، بي. وليستر، دي. الإصدار 4 من مجموعة بيانات المناخ الشهرية عالية الدقة CRU TS. بيانات Sci. 7، 109 (2020).
51. هيرسباخ، إتش. وآخرون. إعادة التحليل العالمية ERA5. كوارتر. ج. ر. جمعية الأرصاد الجوية 146، 1999-2049 (2020).
52. جيبريتشوركوس، إس. إتش. وآخرون. مؤشرات الجفاف العالمية عالية الدقة للفترة من 1981 إلى 2022. بيانات علوم الأرض 15، 5449-5466 (2023).
53. جيبريتشوركوس، إس. إتش. solomonsg/Globdrought: حساب مؤشرات الجفاف والاتجاهات. زينودو https://doi.org/10.5281/zenodo. 15073433 (2025).
نشكر الدعم المالي المقدم من مكتب الشؤون الخارجية والكومنولث والتنمية في المملكة المتحدة (FCDO، رقم المنحة 201880) ومجلس الأبحاث البيئية في المملكة المتحدة (NERC، رقم المنحة NE/SO17380/1). نشكر مركز تحليل بيانات البيئة (CEDA، https://www.ceda.ac.uk/) لاستضافته مجموعات بيانات الجفاف العالمية.
مساهمات المؤلفين S.H.G. طور مجموعات بيانات الجفاف، وأجرى تقييمات الاتجاه وصاغ الورقة. قاد S.J.D. المشروع، وصمم S.H.G. و S.J.D. الدراسة بمشاركة جميع المؤلفين. قدم C.F. و H.E.B. و D.G.M. و M.B.S. مجموعات بيانات CHIRPS و MSWEP و GLEAM و hPET، على التوالي. قدم S.M.V.-S. مؤشر SPEI. ساهم J.S. و S.M.V.-S. و D.G.M. و J.P. في تصميم التجربة، وأسئلة البحث واختيار مجموعة البيانات. دعم E.D. و J.T. تحليل البيانات وقاما بتحرير الورقة. ساهم جميع المؤلفين في تطوير الورقة.
المصالح المتنافسة يعلن المؤلفون عدم وجود مصالح متنافسة.

معلومات إضافية

معلومات إضافية النسخة الإلكترونية تحتوي على مواد إضافية متاحة علىhttps://doi.org/10.1038/s41586-025-09047-2.
يجب توجيه المراسلات والطلبات للحصول على المواد إلى سليمان هـ. جبرخوركوس. معلومات مراجعة الأقران تشكر Nature المراجعين المجهولين على مساهمتهم في مراجعة الأقران لهذا العمل. تقارير مراجعي الأقران متاحة.
معلومات إعادة الطباعة والتصاريح متاحة علىhttp://www.nature.com/reprints.
الشكل 1 من البيانات الموسعة | انظر الصفحة التالية للتعليق.
الشكل البياني الممتد 1| الاتجاهات في مؤشر الجفاف القياسي لمدة 6 أشهر (SPEI) للفترة من 1981 إلى 2022. تعرض الألواح a) و b) و c) و d) اتجاهات SPEI لمدة 6 أشهر (وحدات z في السنة) المستمدة من مجموعات بيانات MSWEP_hPET و MSWEP_GLEAM و CHIRPS_hPET و CHIRPS_GLEAM، على التوالي. الاتجاهات غير المهمة (قيمة P ) تم تمييزها باللون الرمادي لتحسين الوضوح. يستثني التحليل المناطق الجافة التي يبلغ متوسط هطول الأمطار السنوي فيها أقل من 180 مم. توضح اللوحة e) الوضع شبه العالمي ( إلى ) متوسط سلسلة زمنية لمؤشر SPEI لمدة 6 أشهر. اللوحة (f) تلخص اتجاهات SPEI
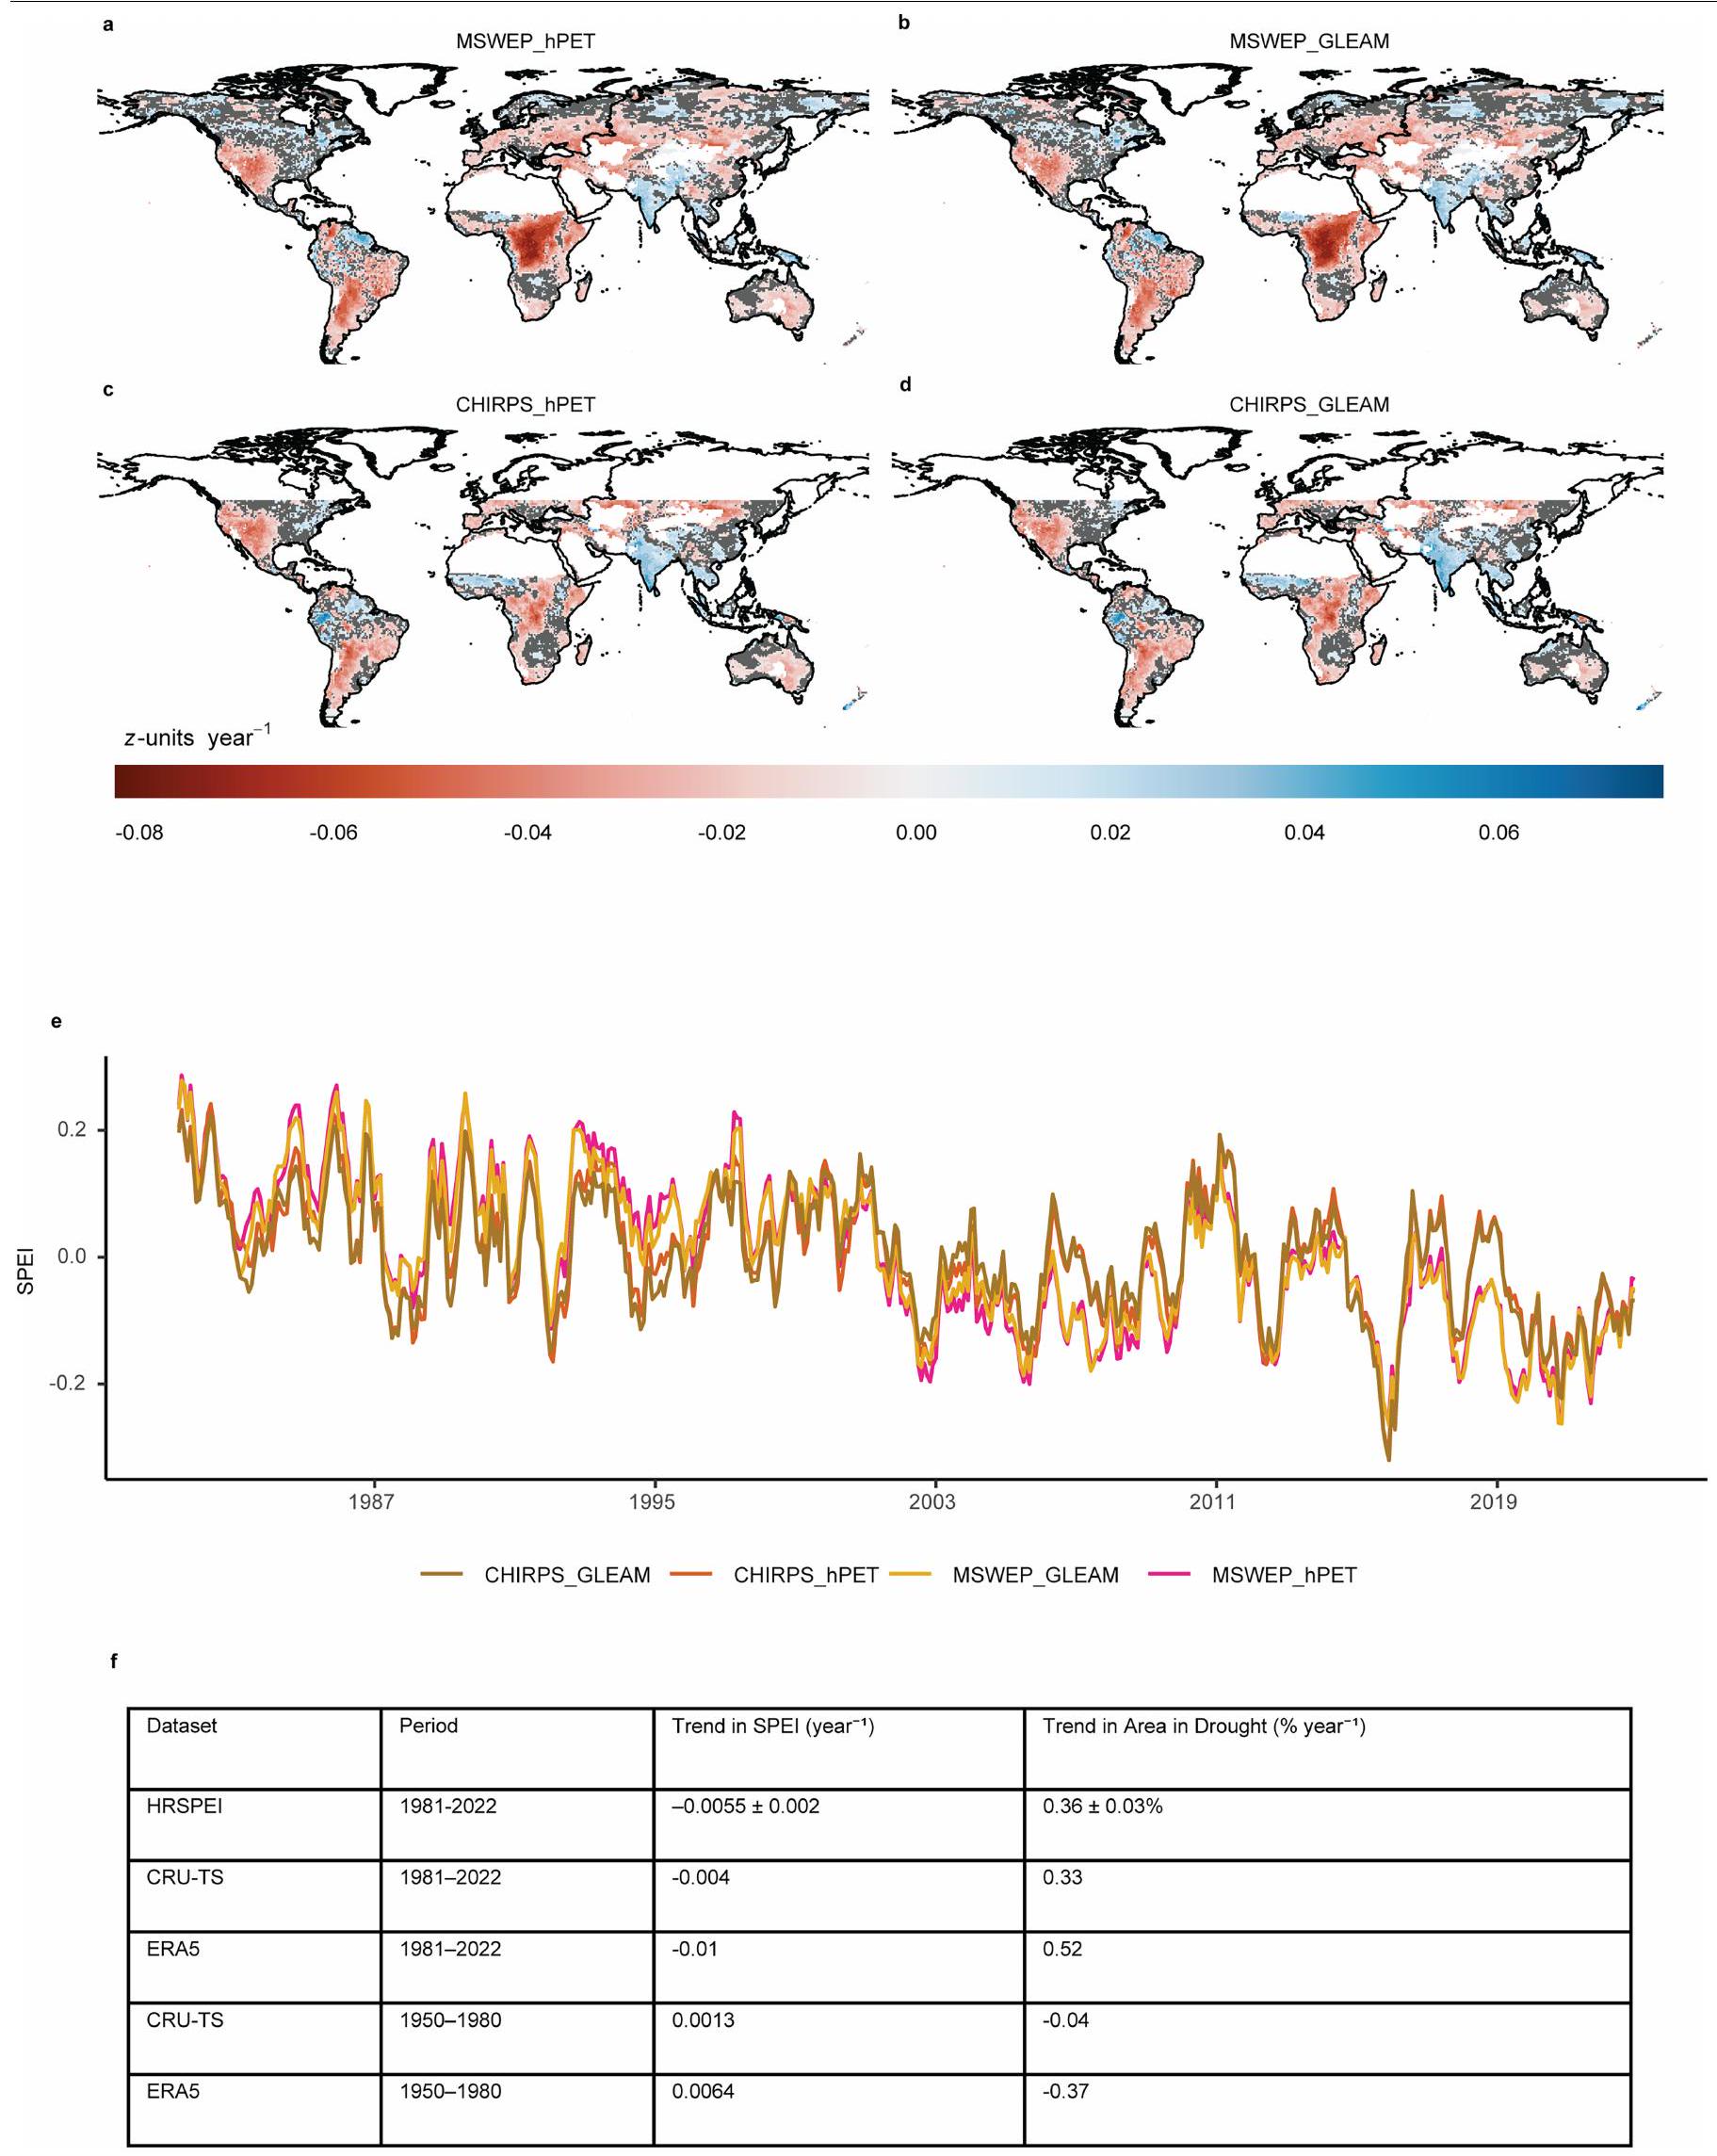
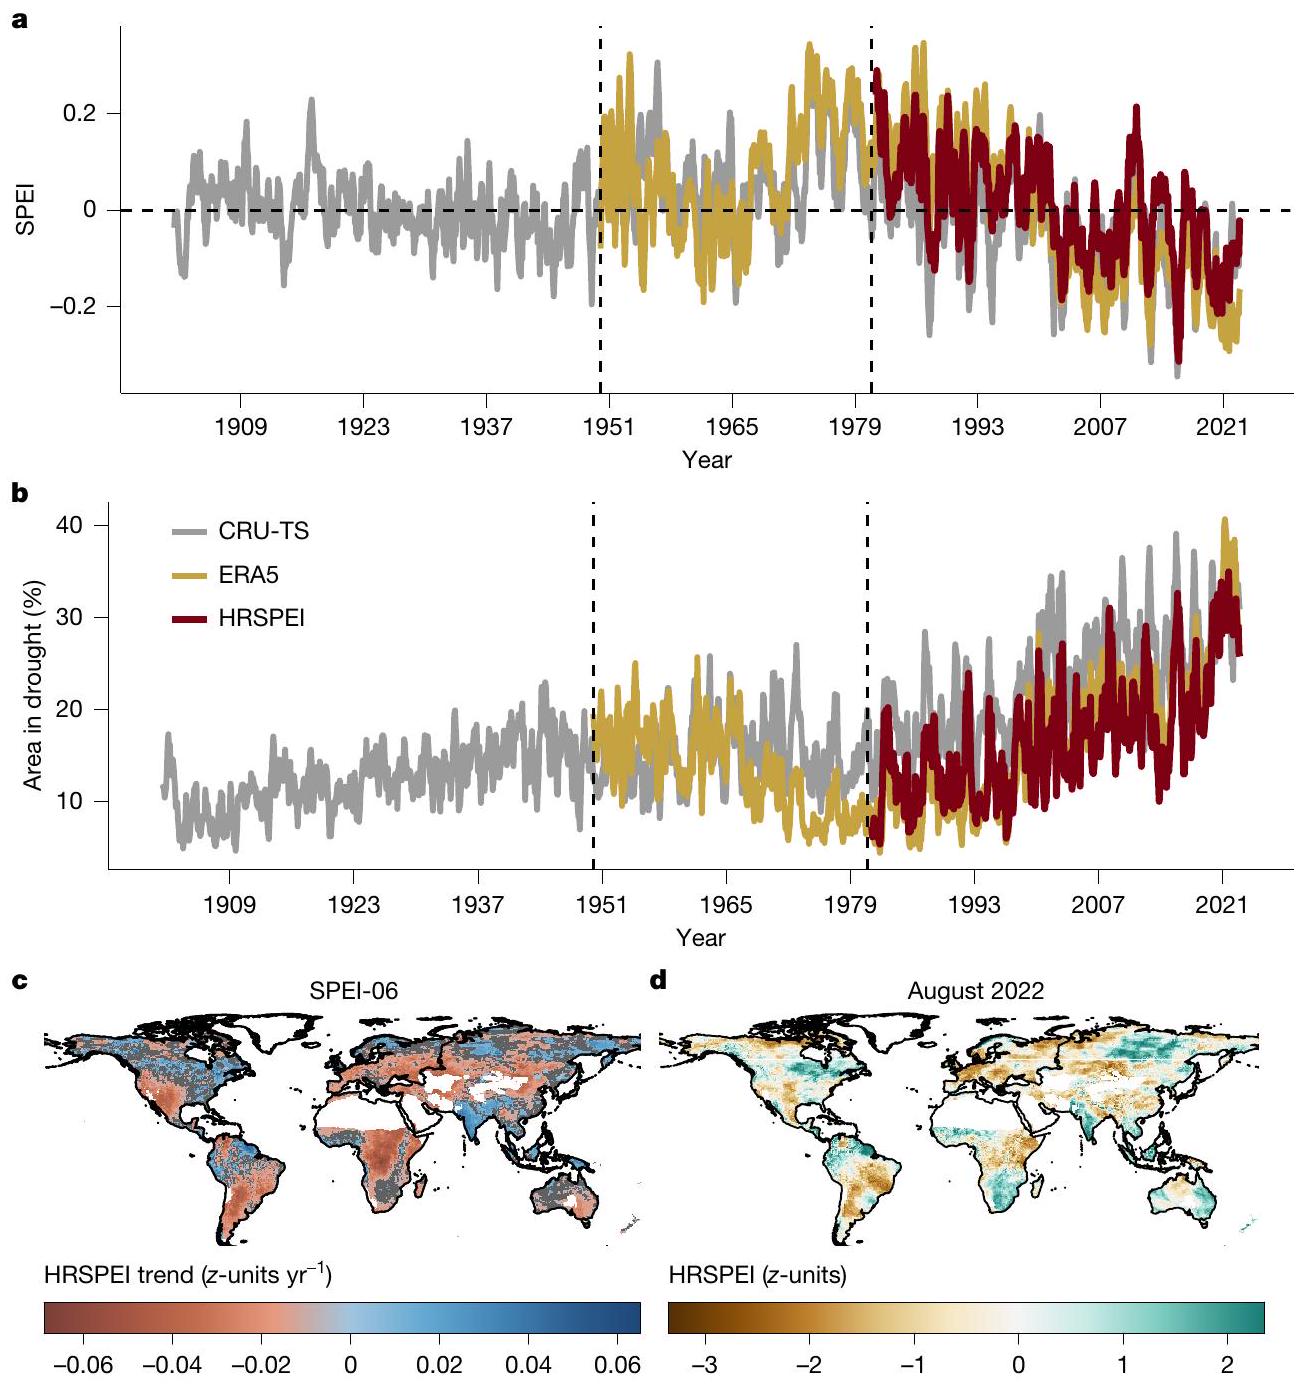
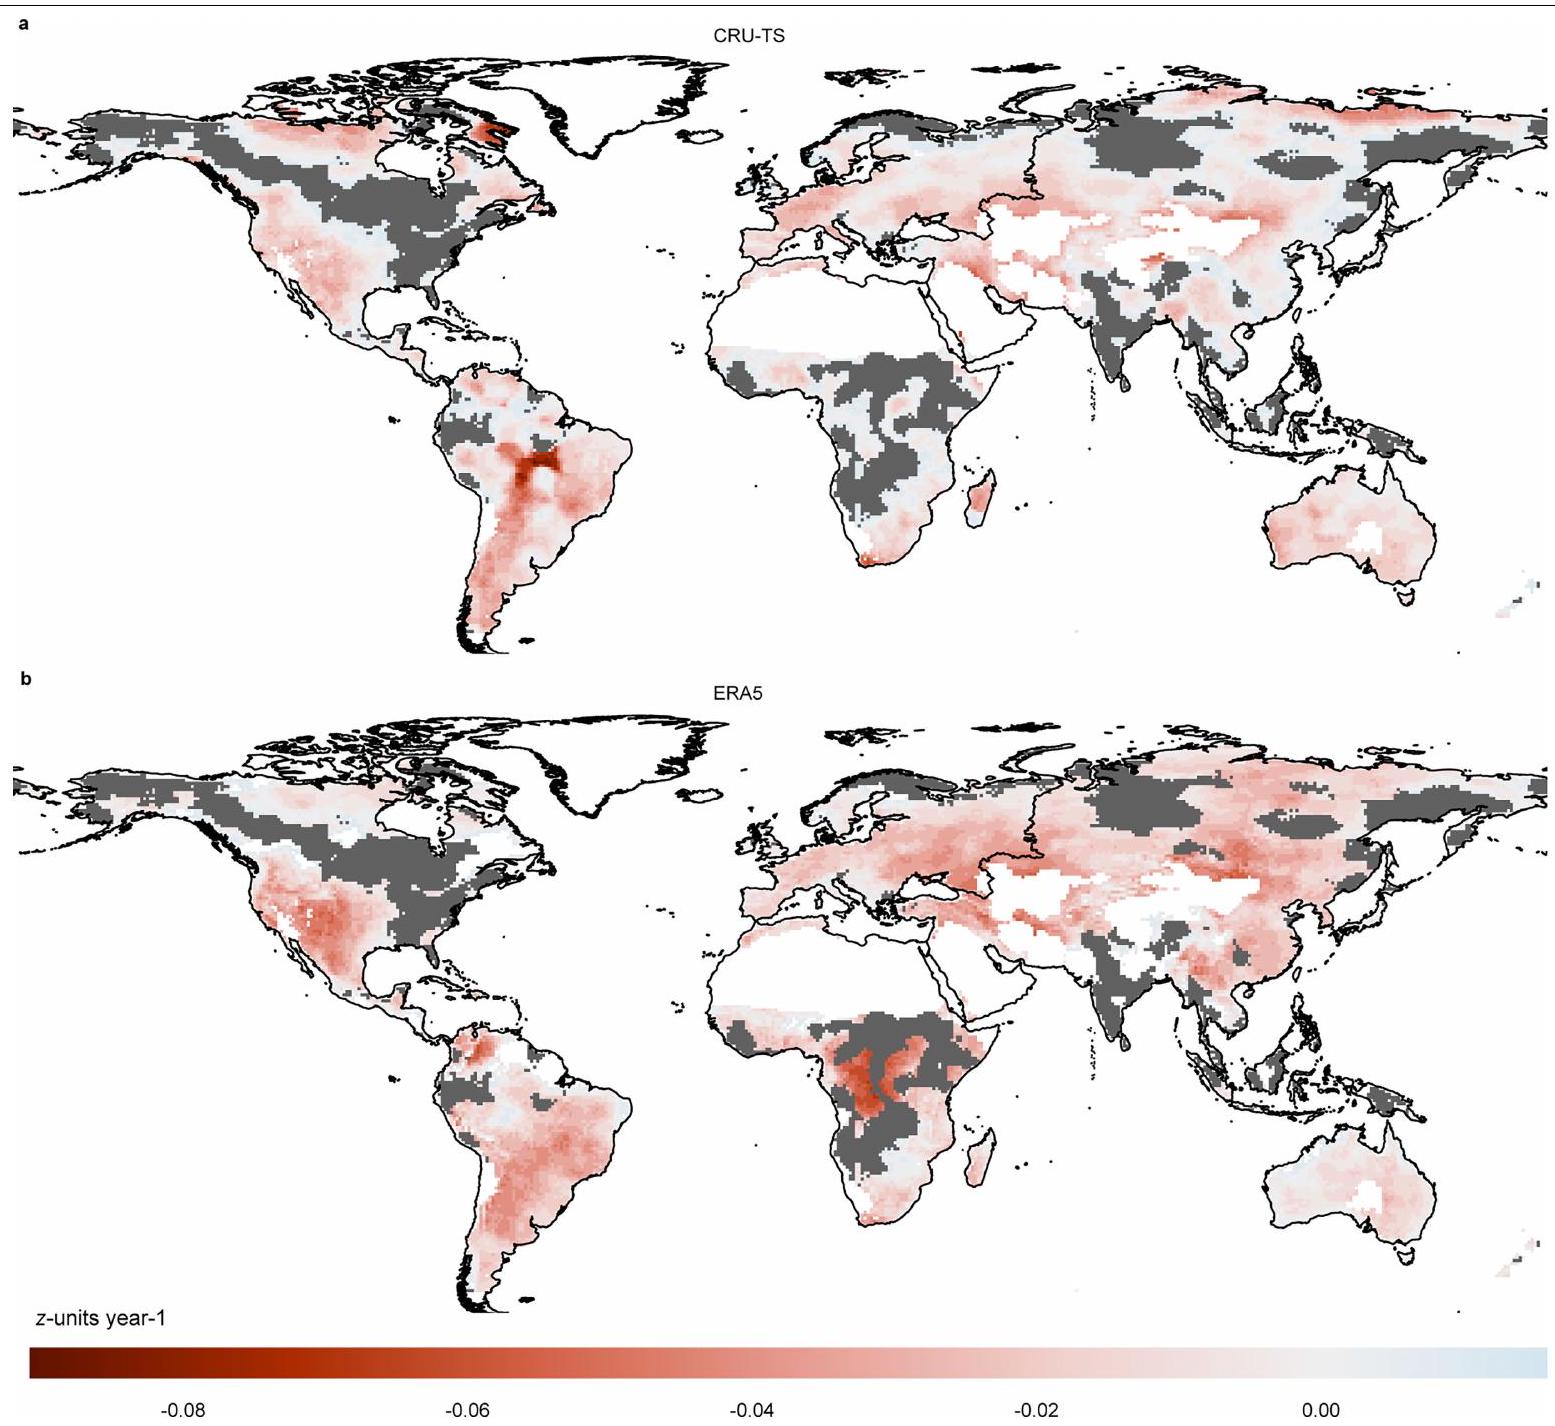
ومناطق الجفاف بناءً على HRSPEI وCRU-TS وERA5. الاتجاه المستمد من HRSPEI يمثل الاتجاه العام، بينما الانحراف (±) يعكس انتشار الاتجاهات لمجموعات البيانات الفردية (MSWEP_hPET وMSWEP_GLEAM وCHIRPS_hPET وCHIRPS_GLEAM) حول الاتجاه المتوسط لـ HRSPEI. يتم حساب الانحراف كمعيار الانحراف للاتجاهات عبر هذه المجموعات الأربعة، مما يبرز التباين في الاتجاهات بالنسبة لاتجاه HRSPEI.
الشكل البياني الممتد 2 | الاتجاه في مؤشر الجفاف القياسي لمدة 6 أشهر استنادًا إلى بيانات CRU-TS وERA5 خلال الفترة من 1981 إلى 2022. توضح اللوحة (أ) الاتجاهات في مؤشر الجفاف القياسي لمدة 6 أشهر باستخدام بيانات الهطول وAED من مجموعة بيانات CRU-TS. توضح اللوحة (ب) الاتجاهات في مؤشر الجفاف القياسي لمدة 6 أشهر المستمدة من الهطول وAED استنادًا إلى مجموعات بيانات ERA5.
اتجاهات غير ذات دلالة (قيمة P ) تم تمييزها باللون الرمادي لتحسين الوضوح. يستثني التحليل المناطق الجافة التي يبلغ متوسط هطول الأمطار السنوي فيها أقل من 180 مم.
الشكل البياني الممتد 3 | الاتجاهات في مدة جفاف SPEI لمدة 6 أشهر. تستند الاتجاهات في SPEI لمدة 6 أشهر إلى a) AED المرصود والهطول (Obs) و b) AED المناخي والهطول المرصود (AEDclm). تُظهر اللوحة c) الفرق بين اتجاهات الجفاف بناءً على Obs و AEDclm. الـ SPEI
يستند إلى MSWEP_hPET، مع حساب مدة الجفاف لكل عام حيث تكون قيم SPEI أقل من -1. الاتجاهات غير المهمة (قيمة P ) تم تمييزها باللون الرمادي من أجل الوضوح، ويستثني الاتجاه المناطق الجافة التي يبلغ متوسط هطول الأمطار السنوي فيها أقل من 180 مم.
الشكل البياني الممتد 4 | نسبة المناطق المتأثرة بالجفاف الشديد والقصوى. توضح اللوحتان أ) و ب) السلاسل الزمنية لنسبة المناطق المتأثرة بالجفاف الشديد (SPEI < -1.4) والجفاف القصوى (SPEI < -1.8) على التوالي.
تحدد الخطوط العمودية المتقطعة السنوات الخمس الأخيرة (2018-2022)، مما يبرز الزيادة في المناطق المتأثرة بالجفاف مقارنةً بالفترة من 1981 إلى 2017.

الشكل البياني الممتد 5 | نسبة هطول الأمطار السنوية وشذوذ AED في عام 2022. توضح اللوحات أ) و ب) شذوذ نسبة هطول الأمطار و AED في عام 2022 بالنسبة للمتوسط طويل الأجل (1981-2022). تشير القيم السلبية إلى
تشير القيم السلبية إلى الانخفاضات، بينما تشير القيم الإيجابية إلى الزيادات مقارنةً بالمتوسط طويل الأجل. يتم احتساب هطول الأمطار بناءً على MSWEP، و AED يعتمد على hPET.
الشكل البياني الممتد 6 | الاتجاهات في مؤشر الجفاف القياسي لمدة 6 أشهر بناءً على ERA5 خلال
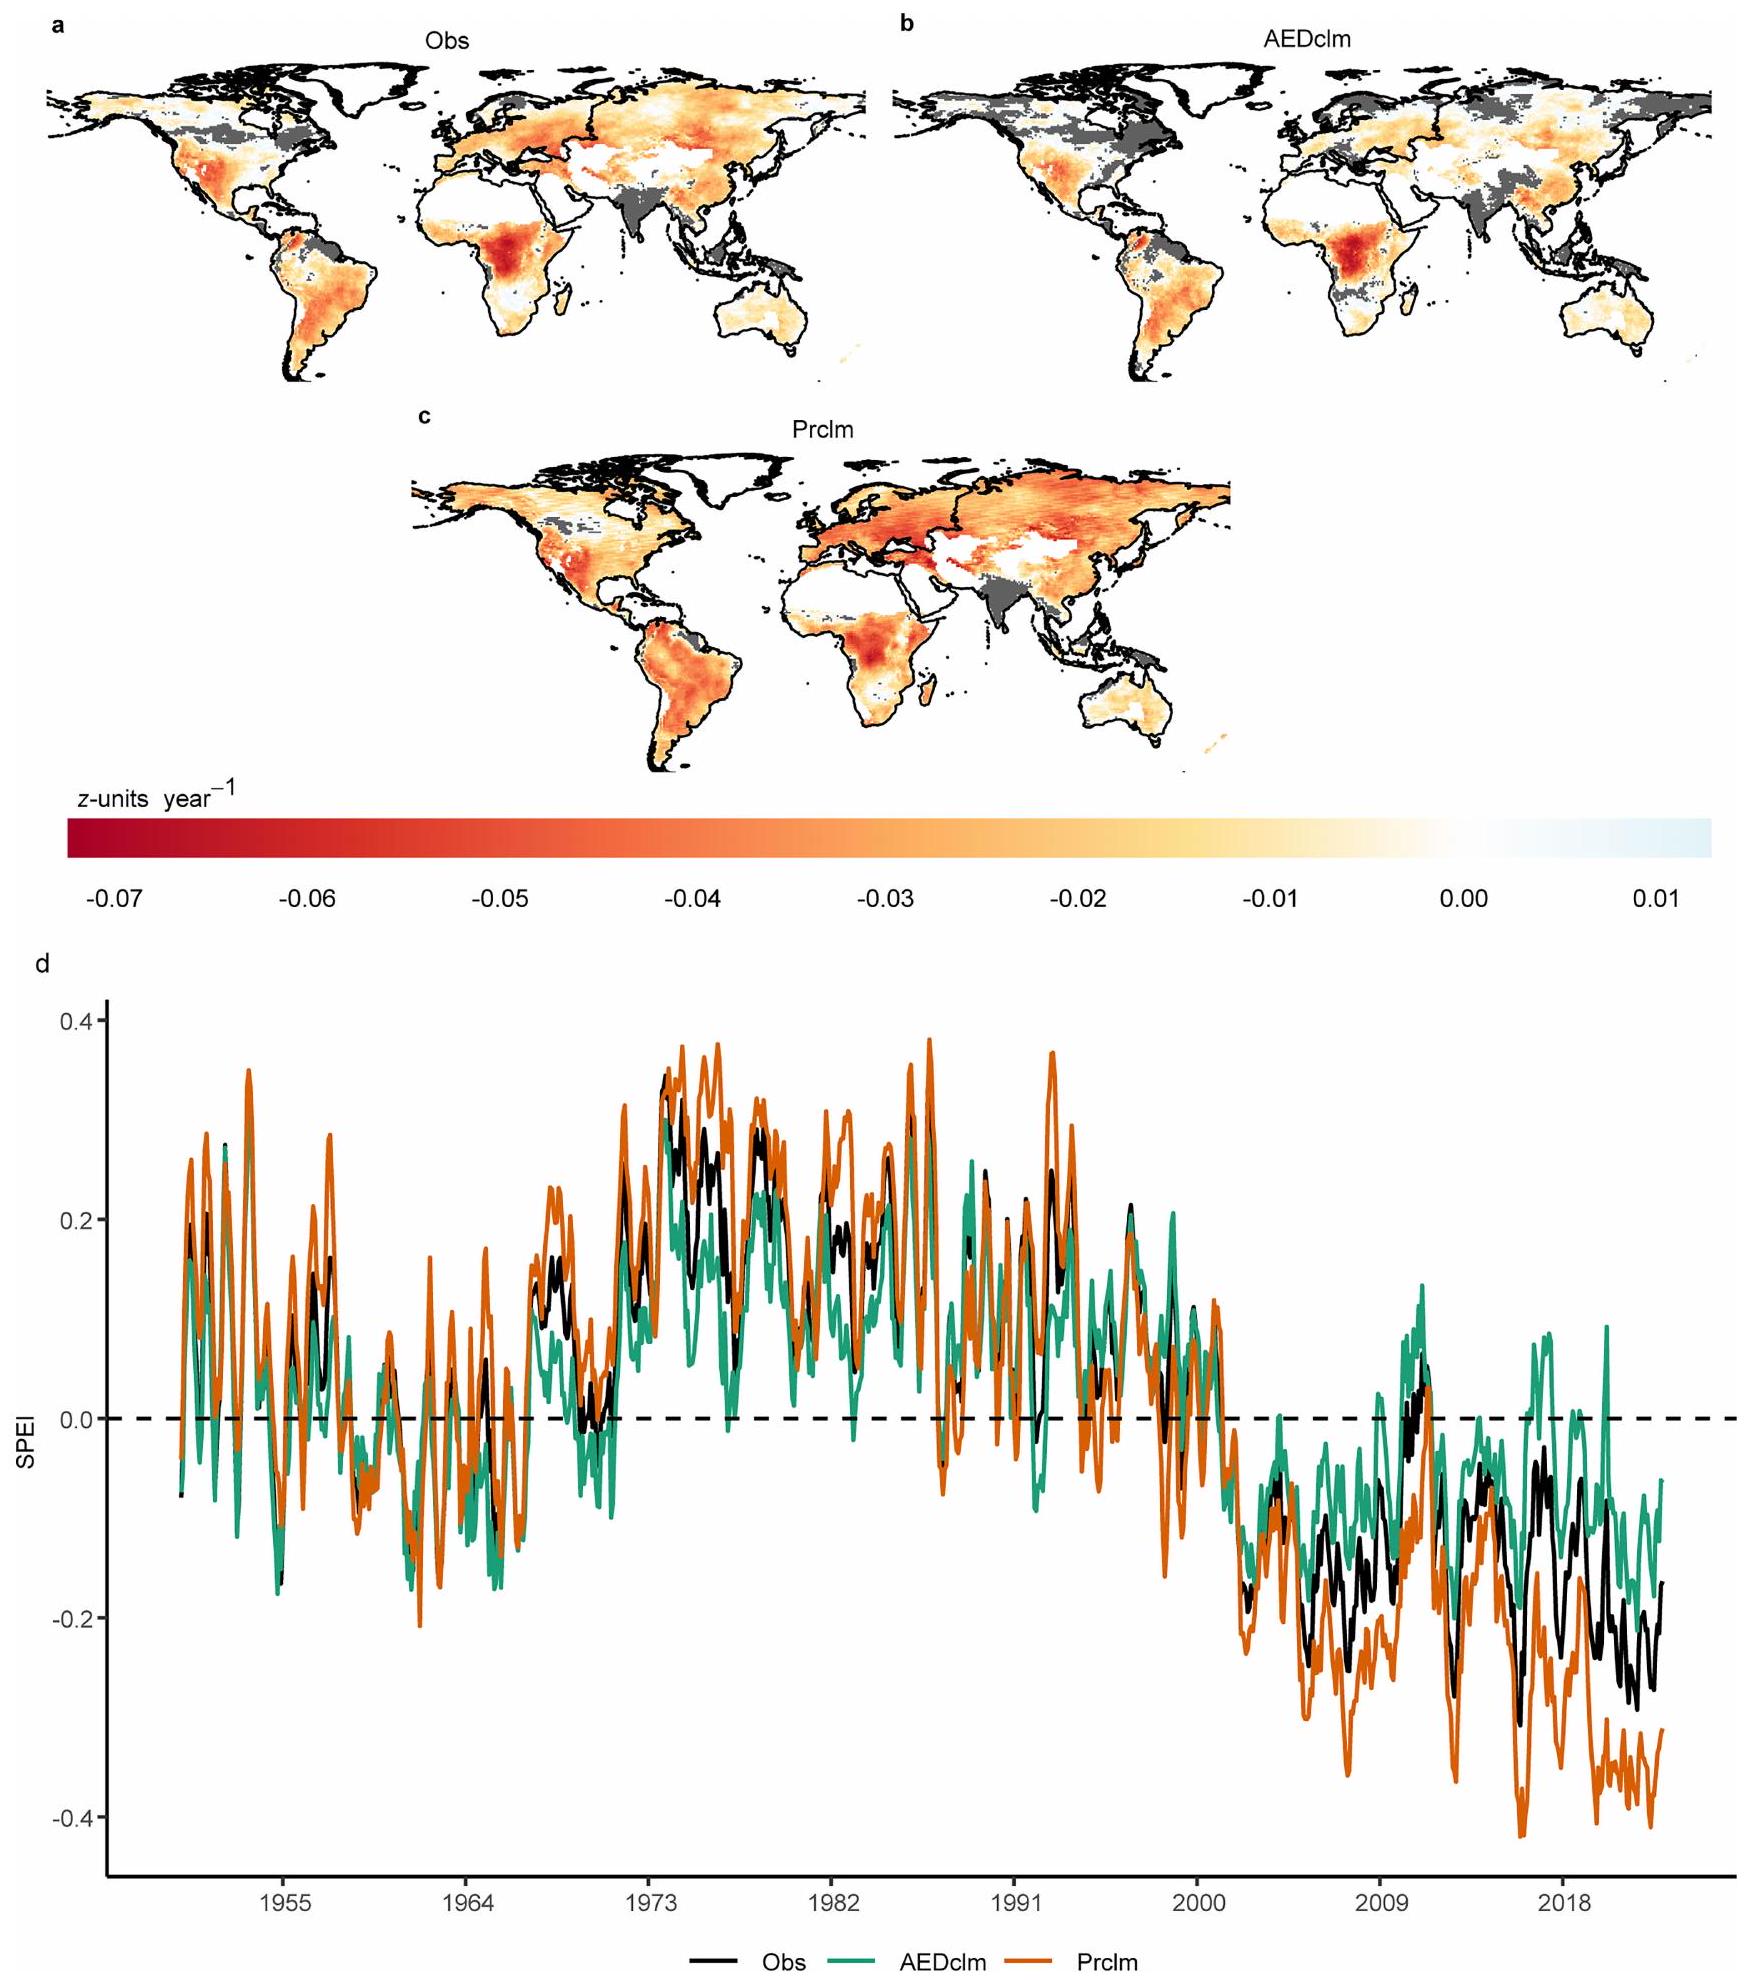
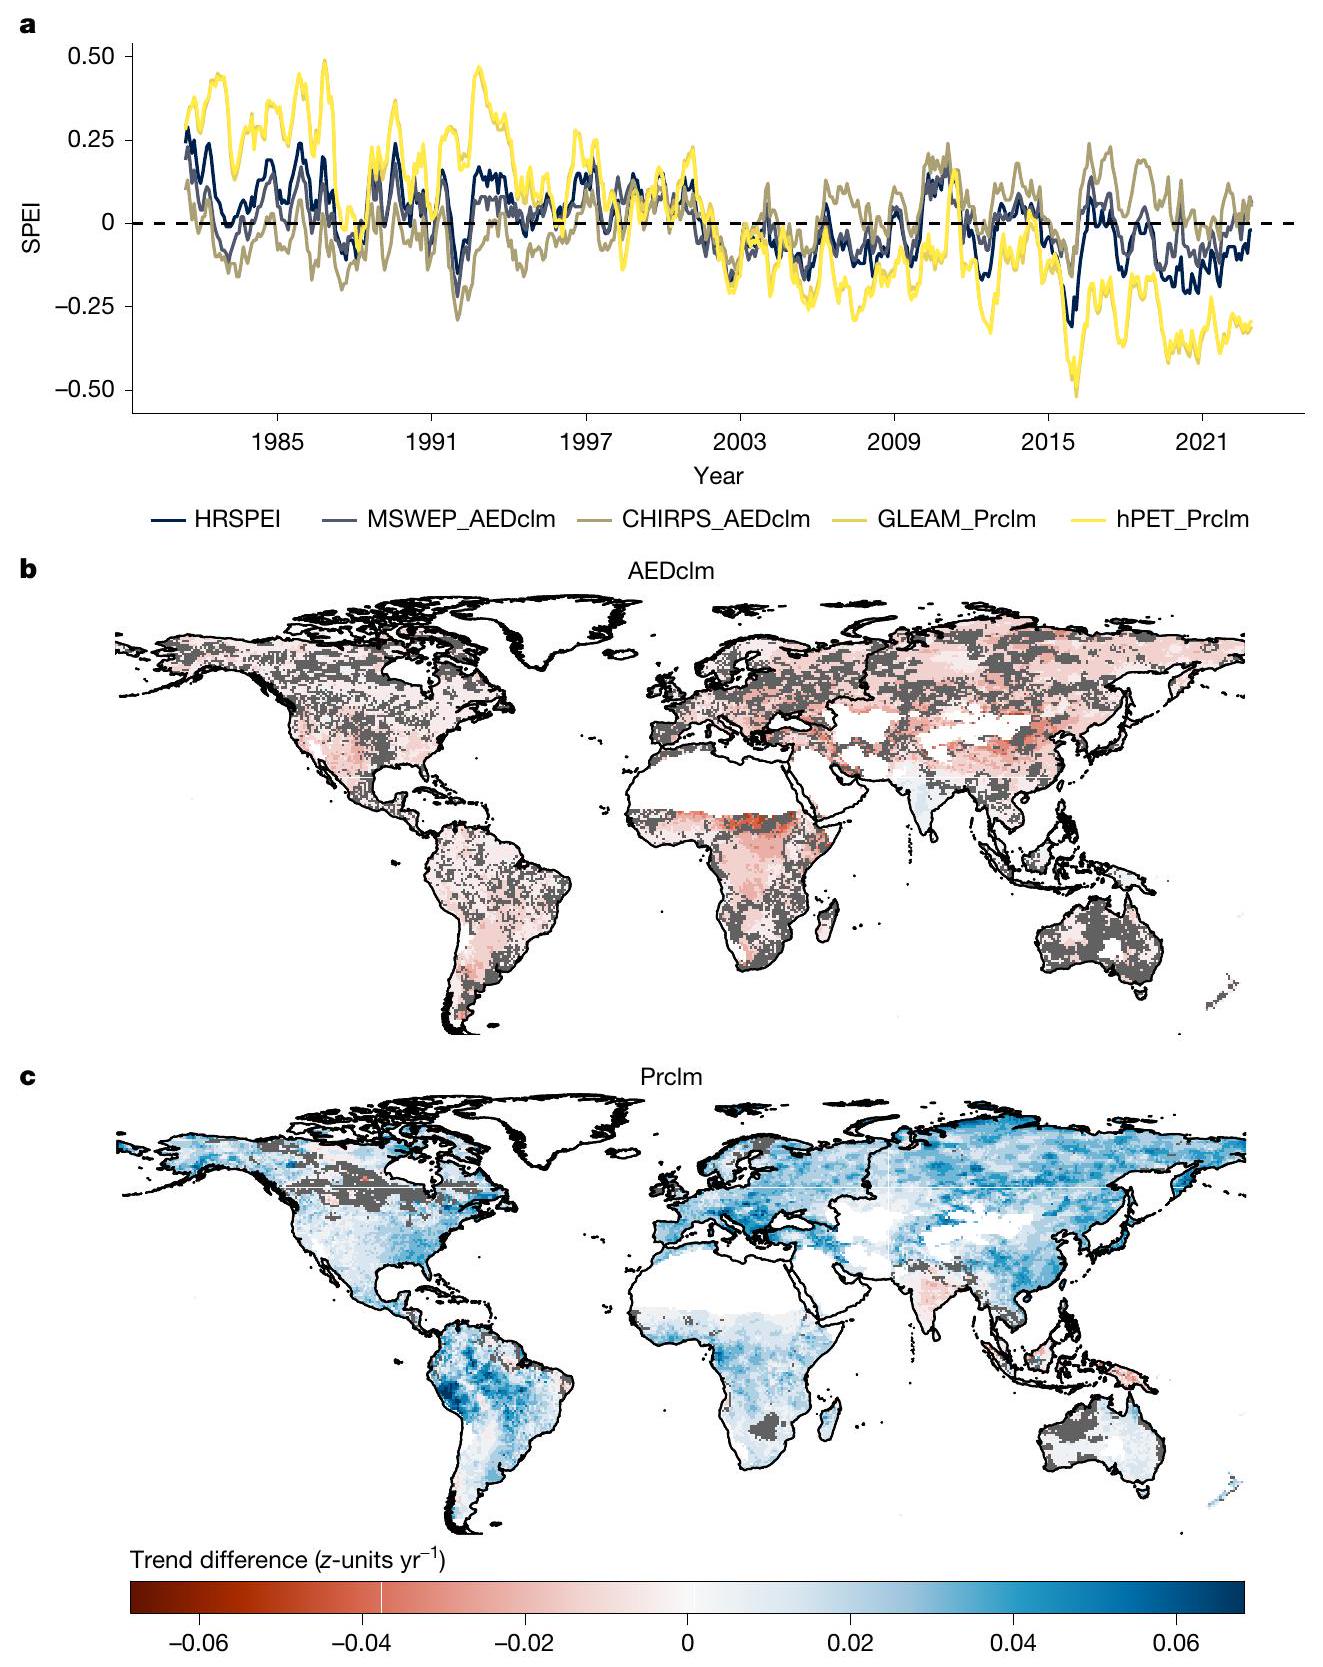
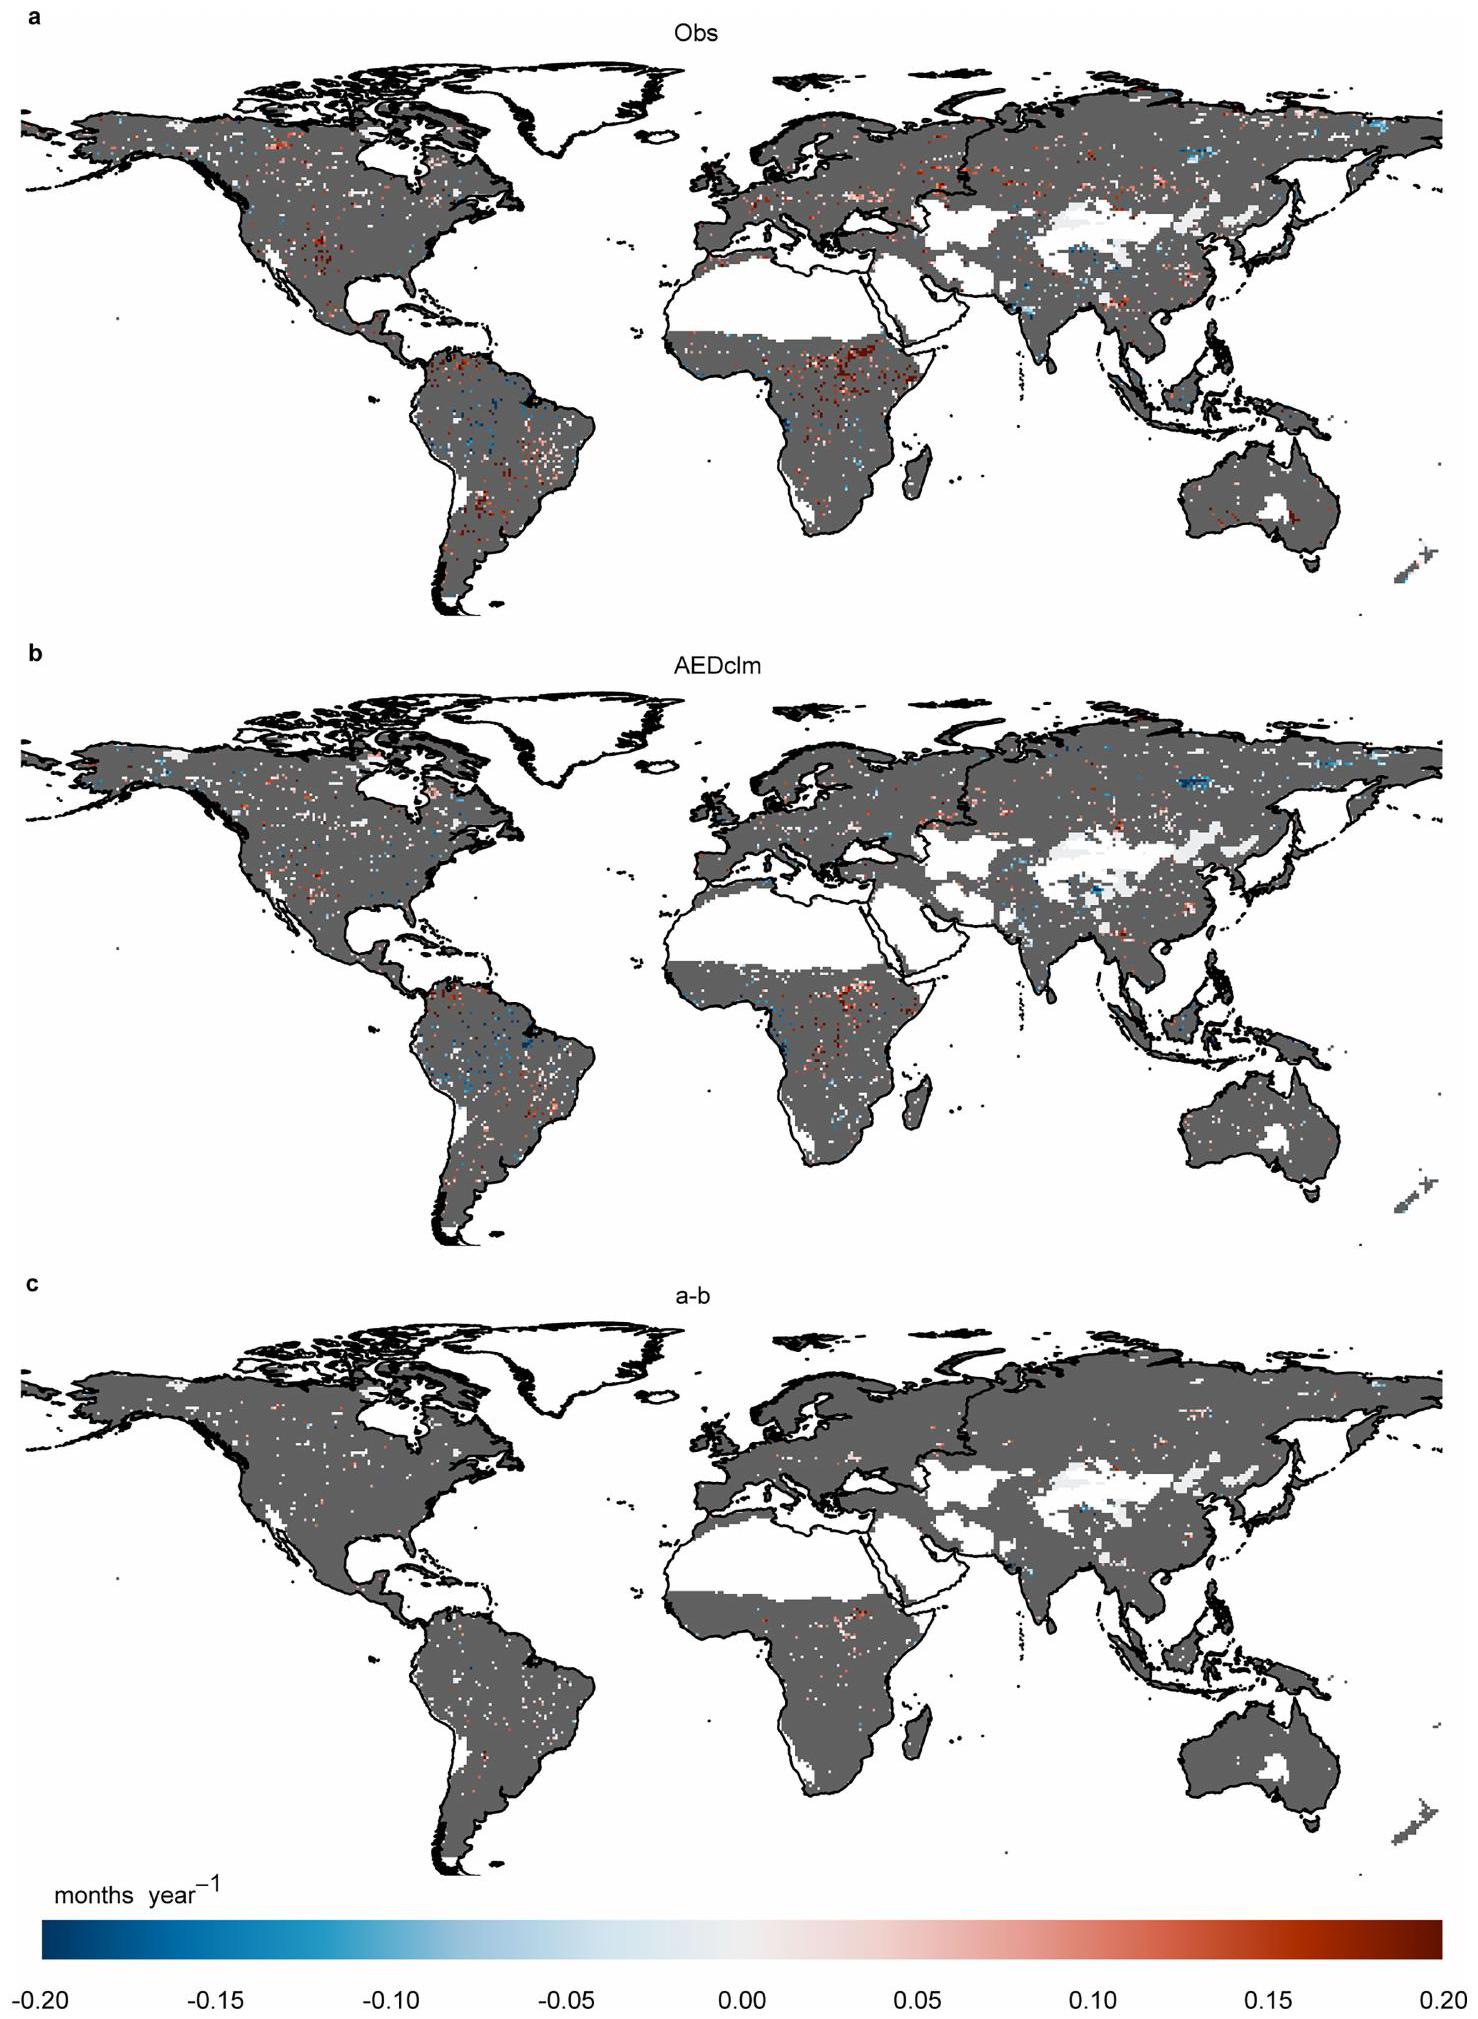
1981-2022. تم حساب قيم SPEI لمدة 6 أشهر باستخدام مجموعة بيانات ERA5 المناخية مع تركيبات من AED المرصود، وهطول الأمطار المرصود، وAED المناخي (AEDclm)، وهطول الأمطار المناخي (Prclm). توضح اللوحة (أ) الاتجاه بناءً على هطول الأمطار المرصود وAED (Obs). تقدم اللوحة (ب) الاتجاه بناءً على AEDclm وهطول الأمطار المرصود.
(AEDclm)، بينما توضح اللوحة ج) الاتجاه بناءً على Prclm و AED الملحوظ (Prclm). الاتجاهات غير المهمة (قيمة P ) تم تمييزها باللون الرمادي لتحسين الوضوح. كما تستبعد الاتجاهات المناطق الجافة التي يبلغ متوسط هطول الأمطار السنوي فيها أقل من 180 مم. تعرض اللوحة د) المتوسط شبه العالمي ( سلسلة زمنية لمؤشر الجفاف SPEI لمدة 6 أشهر للفترة من 1950 إلى 2022، استنادًا إلى الملاحظات، و AEDclm، و Prclm.
الشكل البياني الموسع 7 | الاتجاهات الشهرية في هطول الأمطار و AED خلال الفترة من 1981 إلى 2022. توضح اللوحات a) و b) الاتجاهات في هطول الأمطار الشهري استنادًا إلى مجموعات بيانات MSWEP و CHIRPS الشهرية، بينما اللوحات c) و d)
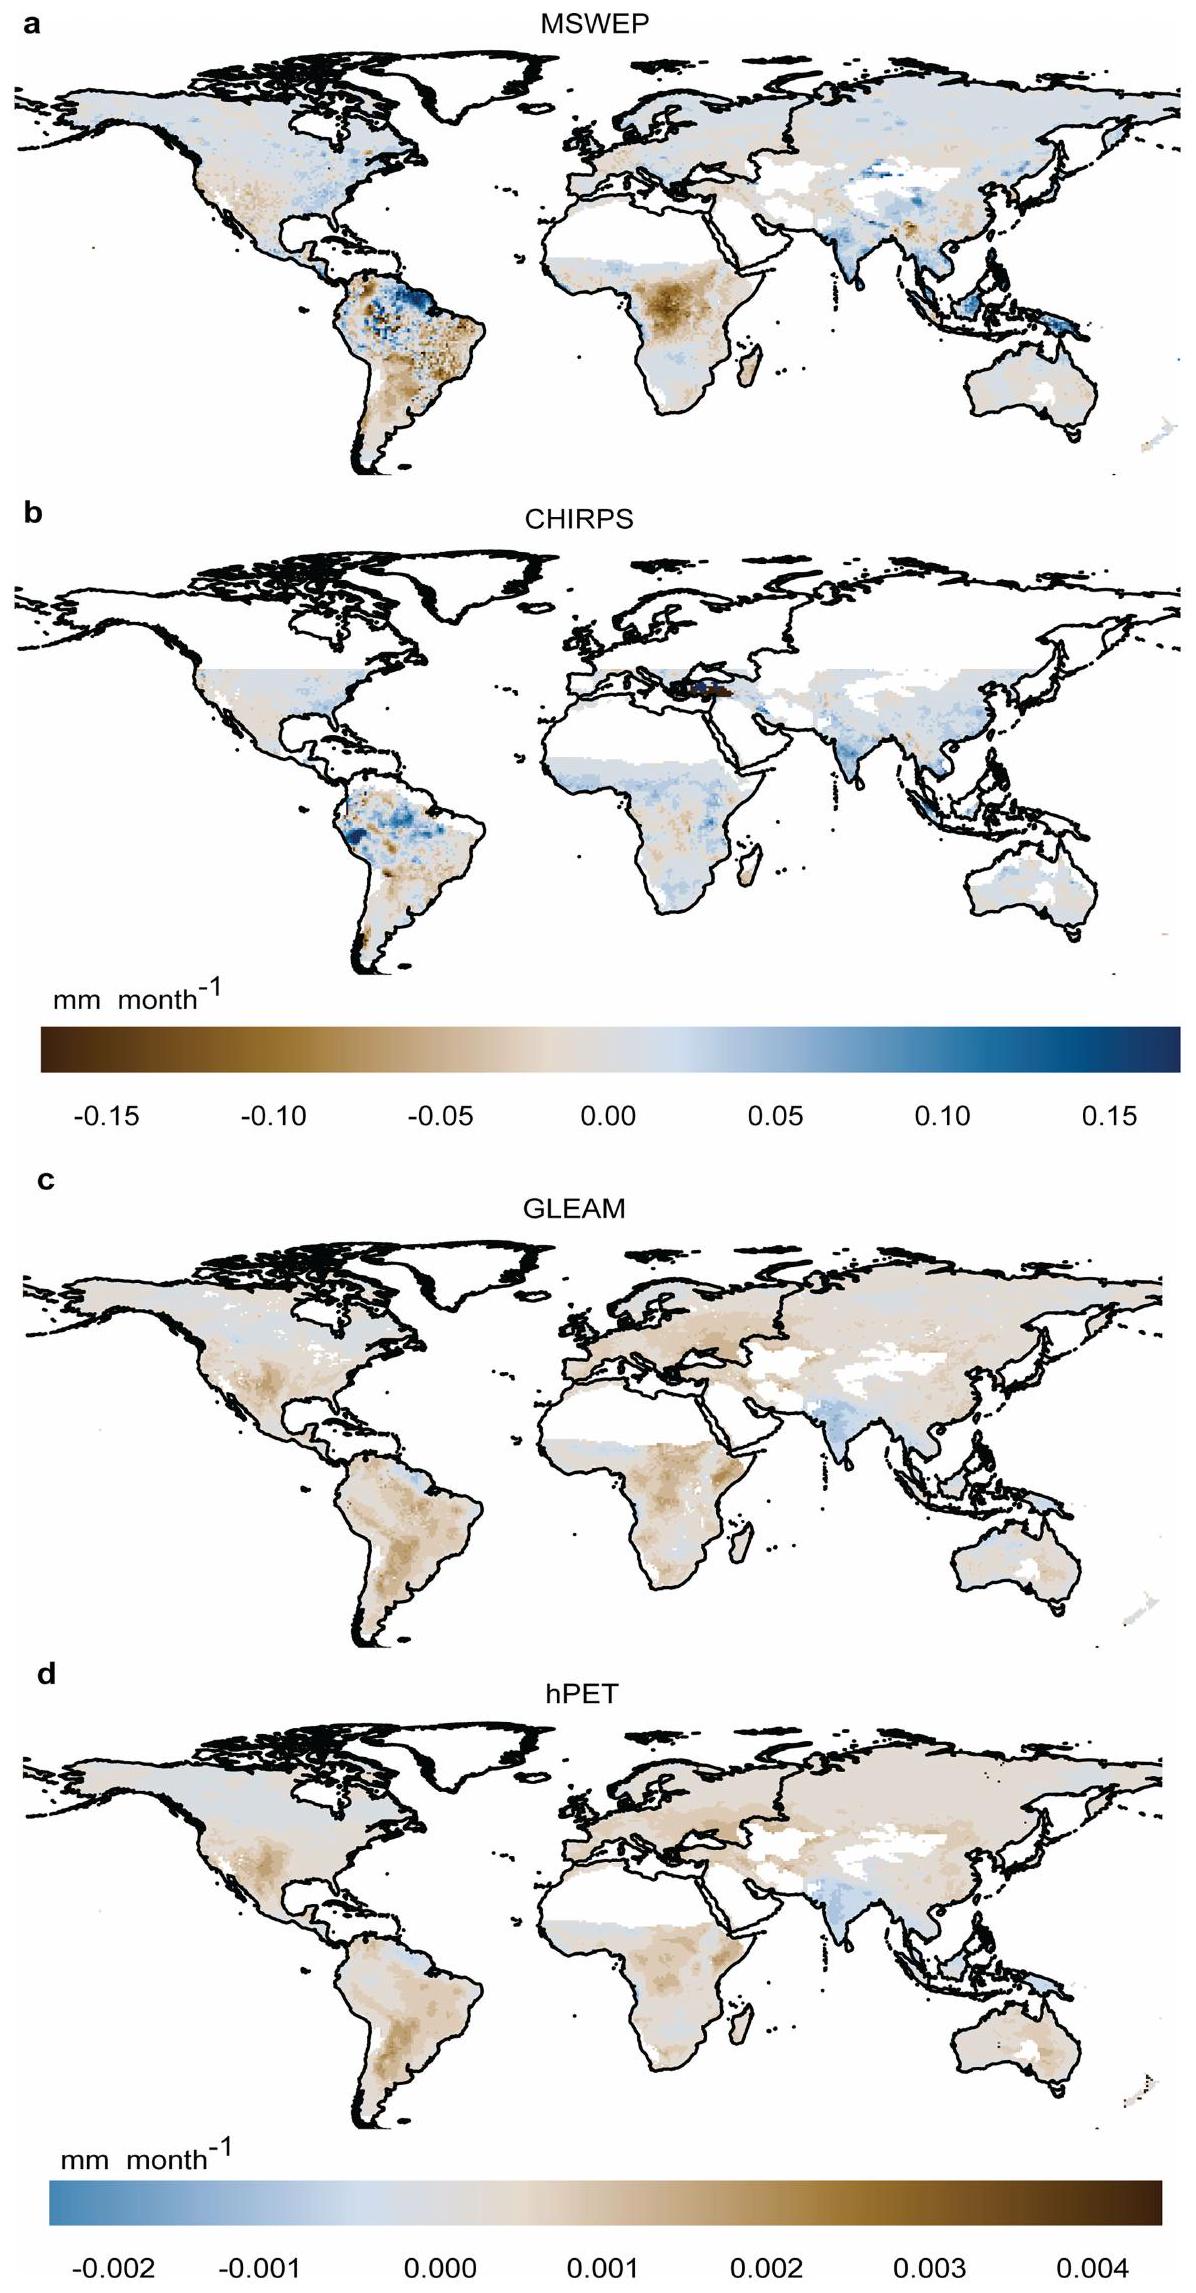
تقديم الاتجاهات في AED الشهري، المستمدة من مجموعات بيانات GLEAM و hPET، على التوالي. لاحظ أن مجموعة بيانات CHIRPS تغطي خطوط العرض حتى .
الشكل 8 من البيانات الموسعة | انظر الصفحة التالية للتعليق.
الشكل البياني الممتد 8 | نسبة المناطق المتأثرة بالجفاف خلال 1981-2022. تُظهر السلسلة الزمنية النسبة السنوية للمناطق المتأثرة بالجفاف (SPEI < -1) لـ a) أستراليا، b) شرق إفريقيا، c) أوروبا، d) جنوب أمريكا الجنوبية، e) غرب الولايات المتحدة، f) شمال آسيا، و g) على مستوى العالم. تمثل الخطوط الزرقاء نسبة المناطق المتأثرة بالجفاف بناءً على SPEI لمدة 6 أشهر المحسوبة باستخدام بيانات AED و الهطول المرصودة (Obs)، بينما تشير الخطوط البرتقالية إلى
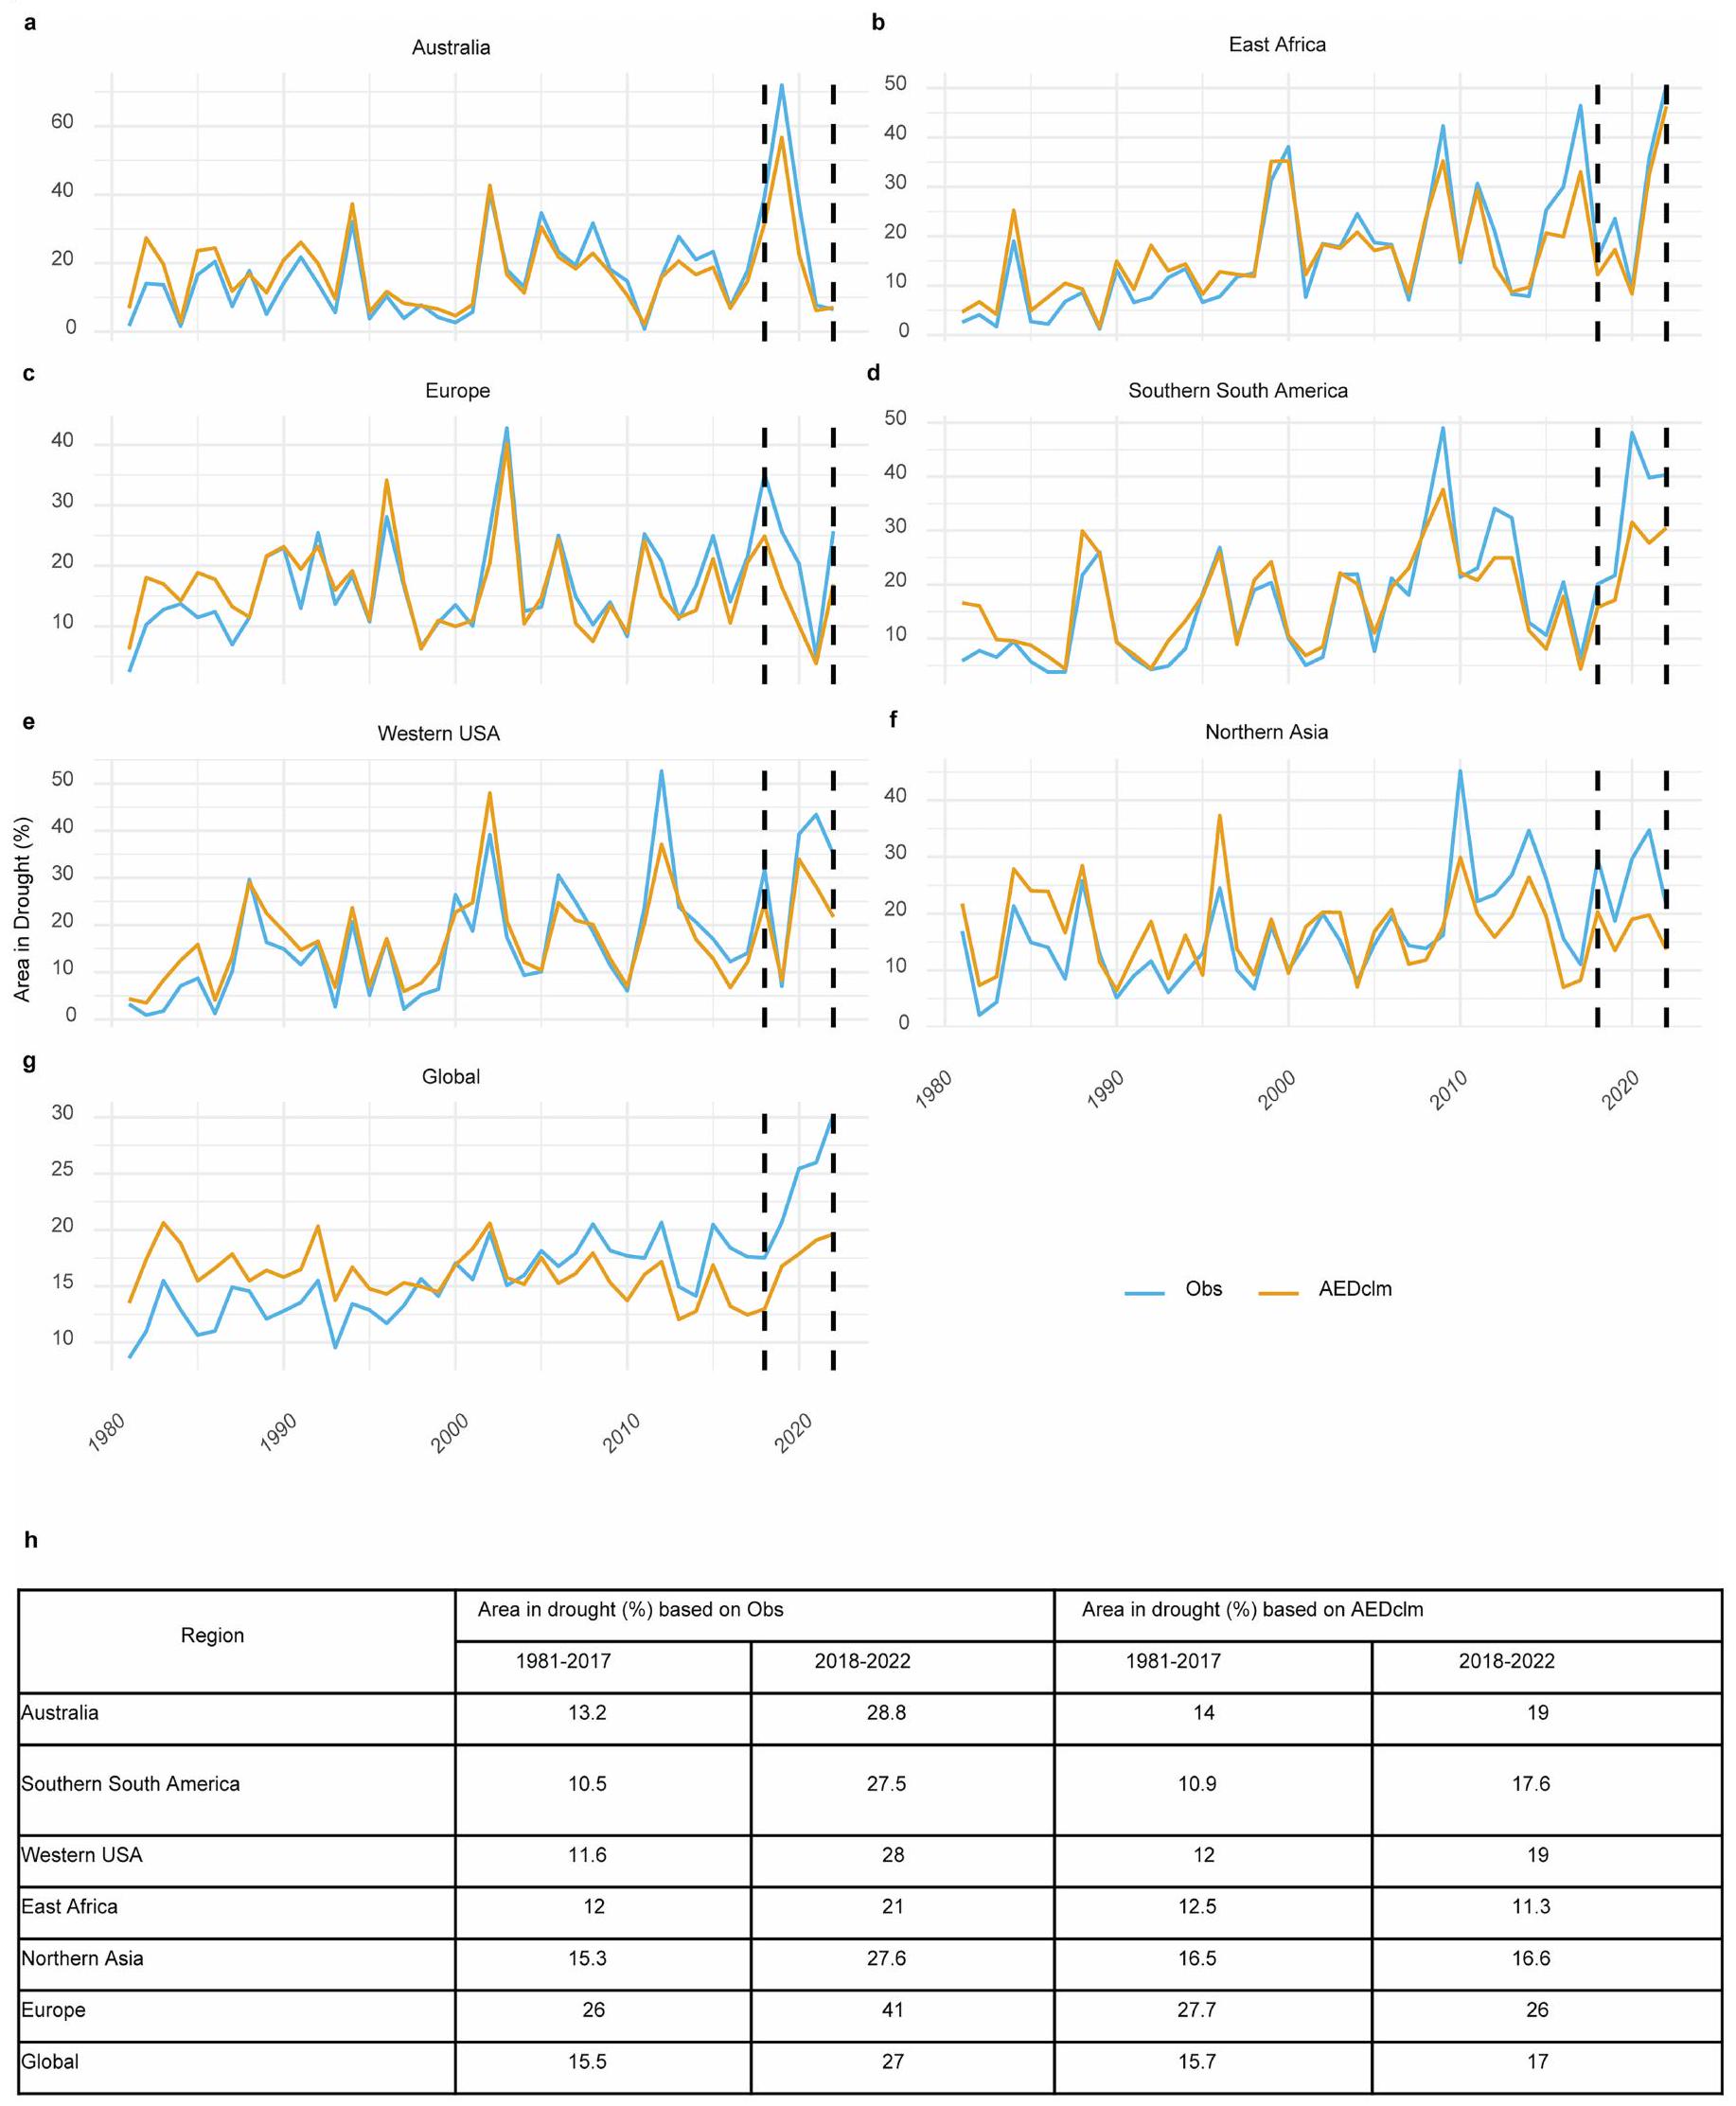
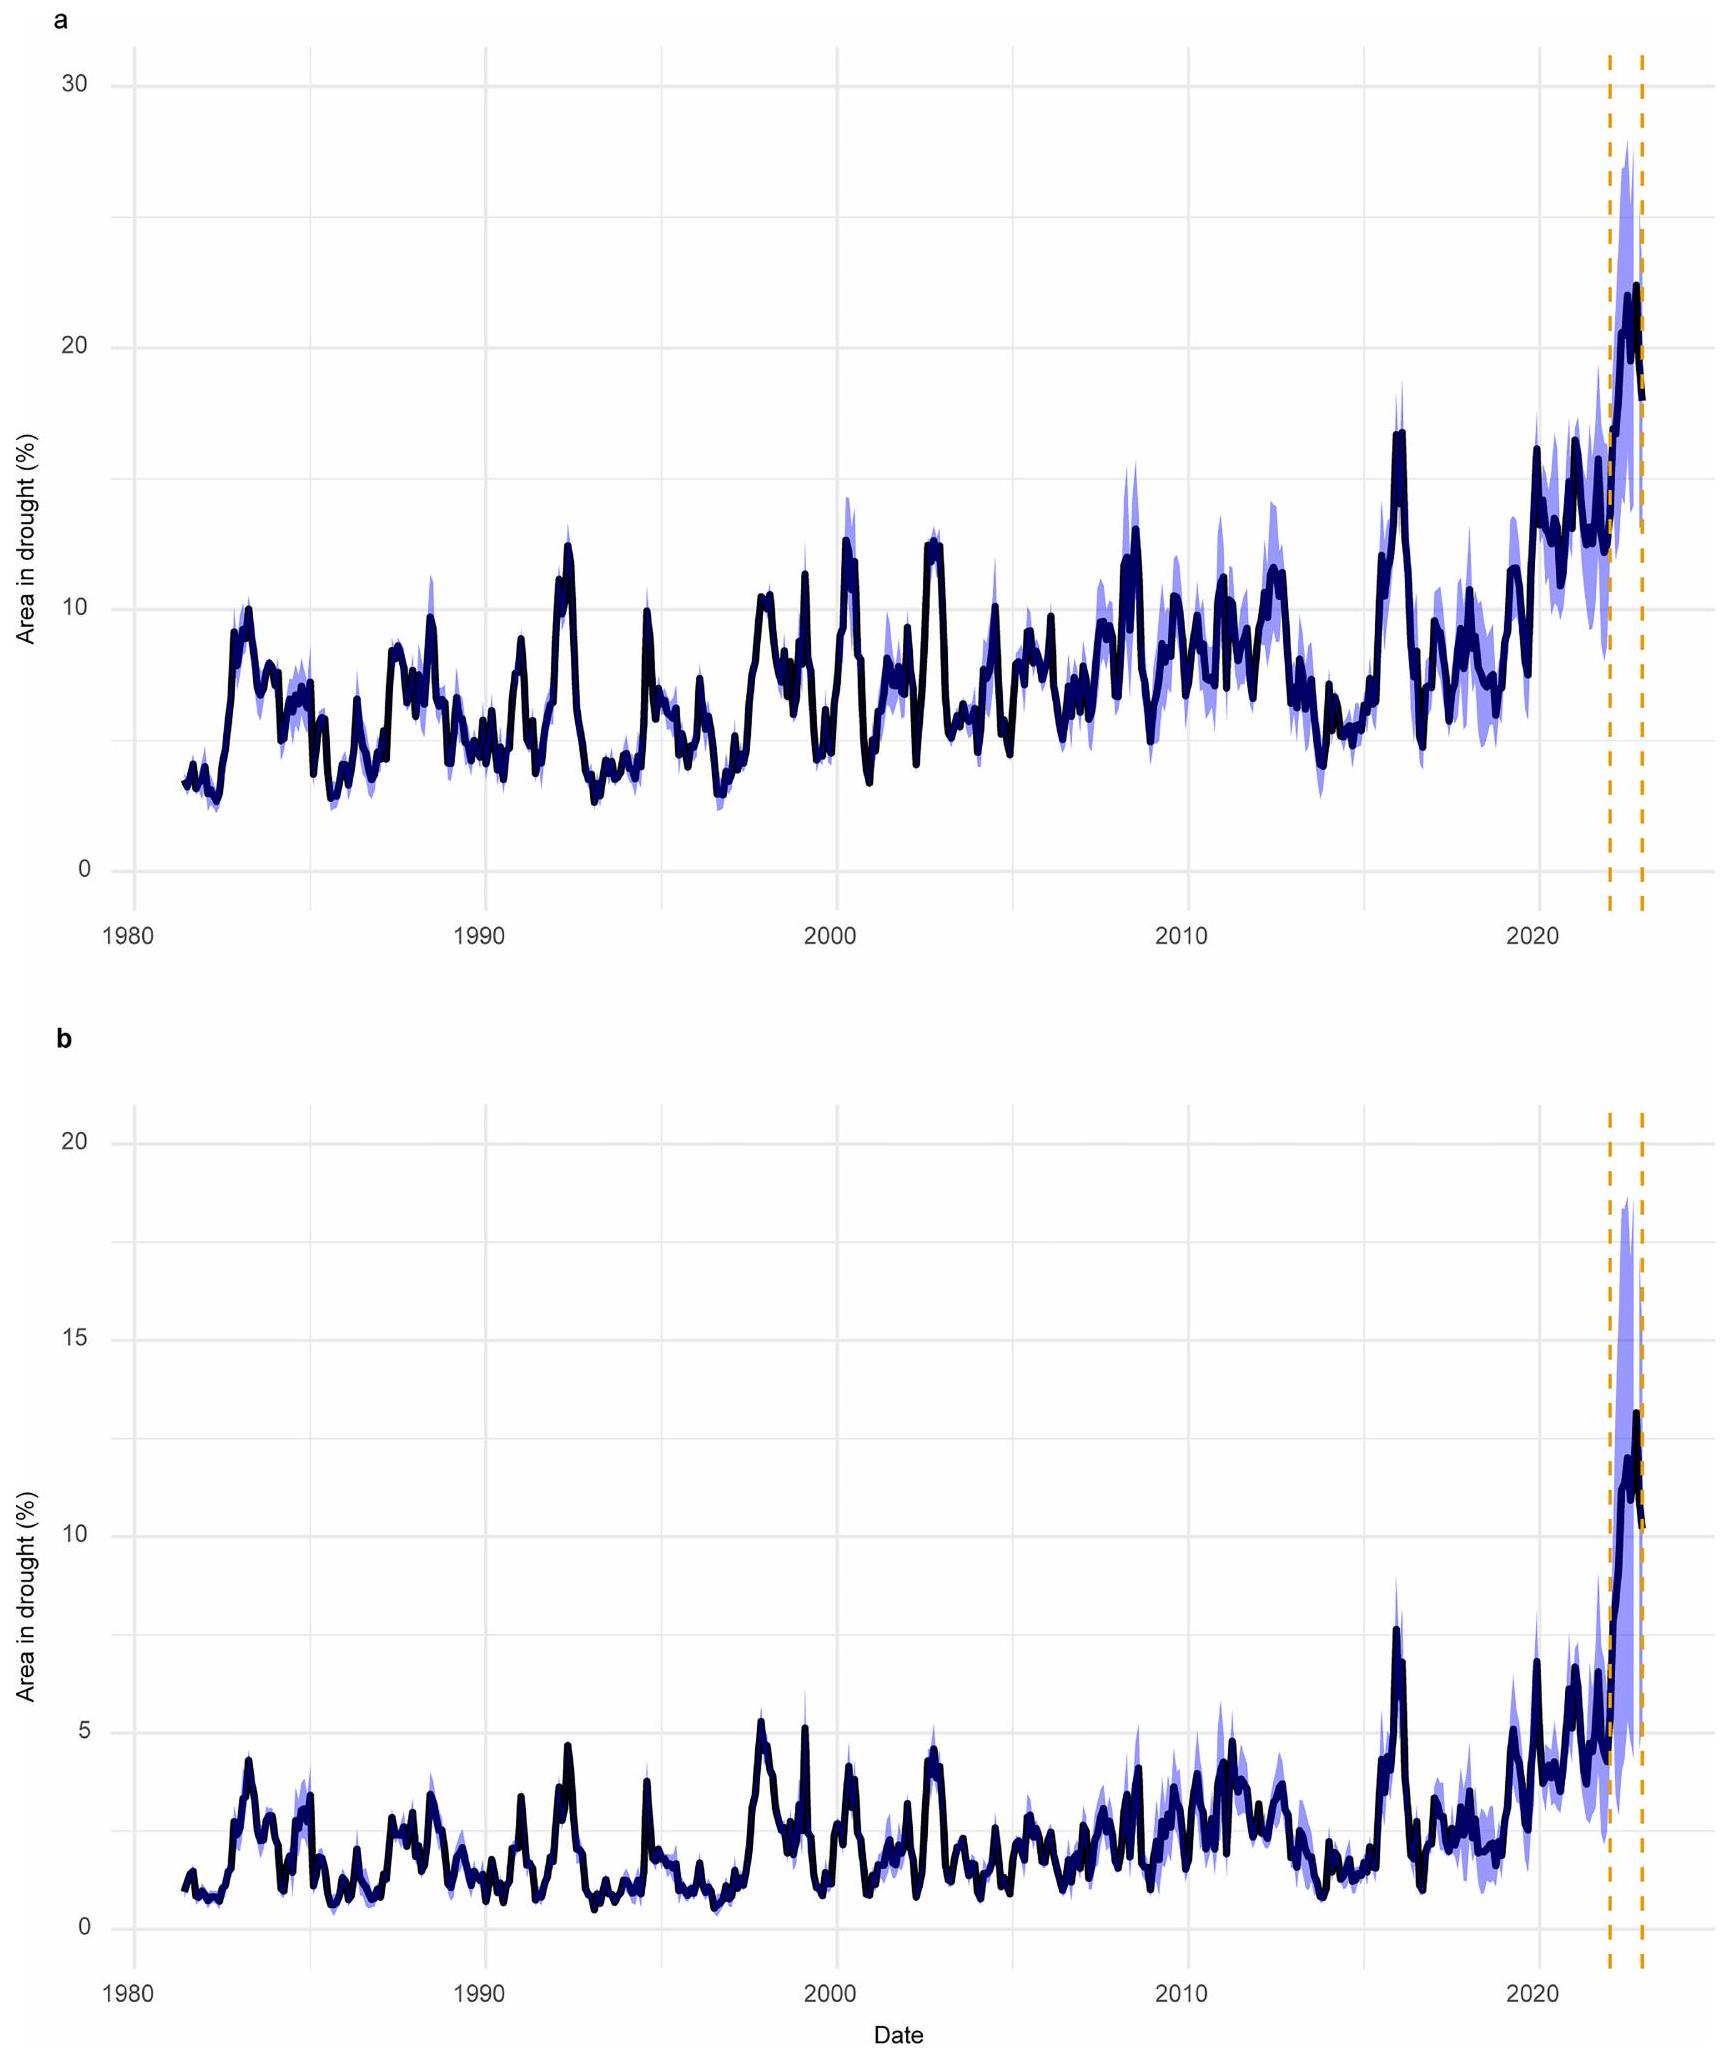
نسبة المناطق المتأثرة بالجفاف استنادًا إلى مؤشر SPEI المحسوب باستخدام هطول الأمطار المرصود و AED المناخي (AEDclm). تبرز الخطوط العمودية السوداء المتقطعة الفترة من 2018 إلى 2022. تلخص اللوحة h) نسبة المناطق المتأثرة بالجفاف خلال 2018-2022، مقارنة بالفترة 1981-2017، استنادًا إلى كل من البيانات المرصودة و AEDclm.
الشكل البياني الموسع 9 | انظر الصفحة التالية للتعليق.
الشكل البياني الممتد 9 | الارتباط الشهري والفروق بين هطول الأمطار و AED خلال الفترة من 1981 إلى 2022. تُظهر اللوحة (أ) الارتباط (CC) لهطول الأمطار الشهري بين MSWEP و CHIRPS (Pr)، بينما تعرض اللوحة (ب) الارتباط لـ AED الشهري بين GLEAM و hPET (AED).
تظهر اللوحات ج) و د) الفروقات الشهرية المتوسطة بين GLEAM و hPET (GLEAM-hPET، مم شهر) ) و MSWEP و CHIRPS (MSWEP-CHIRPS، مم شهر )، على التوالي. تحليل ارتباط وهامش الهطول محدود لخطوط العرض حتى بسبب توفر بيانات CHIRPS.

مقالة

البيانات الموسعة الجدول 1 | فئات الأحداث الرطبة والجافة
فئات SPEI قيم SPEI
رطب للغاية >1.83
رطب جداً 1.43 إلى 1.82
معتدل رطب 1.0 إلى 1.42
قريب من الطبيعي -0.99 إلى 0.99
جاف بشكل معتدل -1.0 إلى -1.42
جاف بشكل شديد -1.43 إلى -1.82
جاف للغاية <-1.83

  1. مدرسة الجغرافيا والبيئة، جامعة أكسفورد، أكسفورد، المملكة المتحدة. مدرسة الجغرافيا وعلوم البيئة، جامعة ساوثهامبتون، ساوثهامبتون، المملكة المتحدة. المعهد البيريني للإيكولوجيا، المجلس الأعلى للبحوث العلمية (IPE-CSIC)، سرقسطة، إسبانيا. مركز مخاطر المناخ في سانتا باربرا، جامعة كاليفورنيا، سانتا باربرا، كاليفورنيا، الولايات المتحدة الأمريكية. مختبر extremes المناخية المائية (H-CEL)، جامعة غنت، غنت، بلجيكا. قسم الاستشعار عن بُعد، مركز هيلمهولتز للبحوث البيئية – UFZ، لايبزيغ، ألمانيا. معهد علوم نظام الأرض والاستشعار عن بُعد، جامعة لايبزيغ، لايبزيغ، ألمانيا. المركز البريطاني لعلم البيئة والهيدرولوجيا، والينغفورد، المملكة المتحدة. مبادرة المناخ وقابلية العيش، جامعة الملك عبدالله للعلوم والتقنية، ثول، المملكة العربية السعودية. مدرسة علوم الأرض والبيئة، جامعة كارديف، كارديف، المملكة المتحدة. معهد أبحاث الأرض، جامعة كاليفورنيا، سانتا باربرا، كاليفورنيا، الولايات المتحدة الأمريكية. معهد أبحاث المياه، جامعة كارديف، كارديف، المملكة المتحدة. البريد الإلكتروني: solomon.gebrechorkos@ouce.ox.ac.uk
    1. بوخرل، ي. وآخرون. التخزين العالمي للمياه الأرضية وشدة الجفاف تحت تغير المناخ. نات. مناخ. تغيير 11، 226-233 (2021).
    2. تشيانغ، ف.، مزدياسني، أ. وأغا كوشاك، أ. دليل على التأثيرات البشرية على تكرار الجفاف العالمي، ومدته، وشدته. نات. كوم. 12، 2754 (2021).
    3. شيفيلد، ج.، وود، إ. ف. & رودريك، م. ل. تغير طفيف في الجفاف العالمي على مدى الستين عامًا الماضية. ناتشر 491، 435-438 (2012).
    4. ترينبيرث، ك. إ. وآخرون. الاحترار العالمي والتغيرات في الجفاف. نات. مناخ. تغيير 4، 17-22 (2014).
    5. سيني فيراتني، س. آي. إعادة النظر في اتجاهات الجفاف التاريخية. ناتشر 491، 338-339 (2012).
    6. لو، ج.، كاربون، ج. ج. & جريغو، ج. م. عدم اليقين والنقاط الساخنة في توقعات الجفاف الزراعي في القرن الحادي والعشرين من نماذج CMIP5. ساينس. ريب. 9، 4922 (2019).
    7. تاروجا، ب.، تشيانغ، ف.، أغا كوشاك، أ. وسامويلسن، س. تقييم قيود موارد المياه المستقبلية على موارد الطاقة المتجددة المعتمدة على الحرارة في كاليفورنيا. الطاقة التطبيقية 226، 49-60 (2018).

Journal: Nature, Volume: 642, Issue: 8068
DOI: https://doi.org/10.1038/s41586-025-09047-2
PMID: https://pubmed.ncbi.nlm.nih.gov/40468063
Publication Date: 2025-06-04

Warming accelerates global drought severity

Received: 29 October 2024
Accepted: 18 April 2025
Published online: 4 June 2025
Open access
Check for updates

Solomon H. Gebrechorkos , Justin Sheffield , Sergio M. Vicente-Serrano , Chris Funk , Diego G. Miralles , Jian Peng , Ellen Dyer , Joshua Talib , Hylke E. Beck , Michael B. Singer & Simon J. Dadson

Abstract

Drought is one of the most common and complex natural hazards affecting the environment, economies and populations globally . However, there are significant uncertainties in global drought trends , and a limited understanding of the extent to which a key driver, atmospheric evaporative demand (AED), impacts the recent evolution of the magnitude, frequency, duration and areal extent of droughts. Here, by developing an ensemble of high-resolution global drought datasets for 1901-2022, we find an increasing trend in drought severity worldwide. Our findings suggest that AED has increased drought severity by an average of globally. Not only are typically dry regions becoming drier but also wet areas are experiencing drying trends. During the past 5 years (2018-2022), the areas in drought have expanded by on average compared with 1981-2017, with AED contributing to of this increase. The year 2022 was record-breaking, with of the global land area affected by moderate and extreme droughts, of which was attributed to increased AED. Our findings indicate that AED has an increasingly important role in driving severe droughts and that this tendency will likely continue under future warming scenarios.

Water availability has a critical role in shaping ecosystems, economic activities and human livelihoods. Water is an essential resource for agriculture, energy, industry and domestic use, influencing the overall sustainability and development of societies . Droughts are also detrimental for vegetation, reducing the carbon uptake of ecosystems, causing widespread plant mortality and leading to significant disruptions in ecosystem functioning and biodiversity . They also negatively affect the productivity of annual and perennial crops, exacerbating food insecurity and economic instability . With climate change, there is an expectation that droughts will be more frequent and intense , with increased impacts on agricultural, environmental and hydrological systems . Observational evidence indicates an increase in hydrological and agricultural drought severity in several regions over recent decades, owing to the widespread increase in atmospheric evaporative demand (AED) as well as regional declines in precipitation . Future projections from climate models also suggest a heightened severity of droughts in some regions owing to decreases in precipitation and enhanced AED .
Although numerous studies have focused on estimating drought trends and their drivers at the global scale, they have been limited by the quality of available global data , which adds uncertainties in the assessment of these trends. Crucially, the extent of the effect of increased AED on drought severity as a consequence of global warming remains inadequately explored . AED intensifies water deficits by enhancing evaporation , particularly under low-soil-moisture conditions. Moreover, land-atmosphere interactions can lead to positive feedback whereby drying soils and plants decrease latent heat fluxes, leading to increases in temperature and AED, and further increasing
drought severity . Although drought can be characterized in many ways to reflect different meteorological, hydrological and ecological drivers, consideration of the influence of AED with respect to precipitation is crucial to understand how climate change is impacting on changes in drought. Some studies have suggested that AED-based drought metrics may overestimate severity compared with hydrological and ecological indicators . However, this mainly stems from uncertainties in Earth system model projections and the physiological effects of atmospheric carbon dioxide on evaporation . Methodological challenges also affect comparisons between drought metrics, but applying consistent statistical approaches shows stronger agreement between AED-inclusive indices . Increasing evidence highlights the role of AED in amplifying ecological drought severity through evaporation . Given the recent rise and projected increase of AED owing to anthropogenic warming , assessing its contribution to drought severity is essential for adaptation planning.
Nevertheless, previous studies have highlighted significant uncertainties in global-scale drought assessments and in the determination of the role of AED on drought severity, largely owing to the choice of models for AED and mete orological forcing dataset . Thus, in previous studies, the selection of methods and datasets have resulted in conflicting results in global drought patterns , highlighting the need for further research to reduce uncertainties induced by varying methods and forcing datasets. For example, simpler temperature-based methods overestimate AED in humid regions, whereas more comprehensive models such as Penman-Monteith, which consider both radiative and thermodynamic terms, offer more accurate results across different climates and seasons . Also, reliable and accurate observations of
precipitation are crucial for realistic drought quantification. Over the past few decades, numerous precipitation datasets have been developed based on gauge, reanalysis and satellite data. Nevertheless, differences in annual mean global precipitation between datasets can be up to and the error can reach up to 100 mm per month when compared with gauge observations . Finally, it is necessary to mention that drought assessments depend on the selected index and calculation methodology. For example, selecting a calibration period for drought index models such as the Palmer Drought Severity Index can significantly influence global drought trend interpretation, amplifying extreme drought areas by up to 15% (ref. 28). Overall, uncertainties in datasets, methods and model structure introduce substantial uncertainty in assessing drought and its trends, as highlighted in the Sixth Assessment Report of the Intergovernmental Panel on Climate Change .
Here, given the existing critical priority of reducing uncertainties in the quantification of recent trends in drought severity, we used the most accurate global precipitation datasets and computed AED using the comprehensive Penman-Monteith method. For our drought index model, we applied the Standardized Precipitation Evapotranspiration Index (SPEI) , which balances complexity and utility by effectively representing the supply-demand dynamics of drought through the difference between precipitation and AED, allowing spatial and temporal comparability and quantification of the sensitivity of the index to variations of AED in different world regions and climate conditions . Moreover, the SPEI method generates estimates of drought variability across multiple timescales (1-48 months) without requiring a calibration period, which allows an objective assessment of the recent trends in drought severity and quantification of the influence of increased AED. Numerous studies have analysed drought trends at the regional and national scales using SPEI, demonstrating its ability to identify drought trends linked to anthropogenic forcing . Although some studies have explored drought projections using SPEI , only a few have examined global-scale trends, indicating an increase in drought severity associated with global warming . Other global studies have assessed drought trends using SPEI with observational data but did not evaluate the influence of AED on drought severity or address uncertainties in precipitation and AED datasets-critical limitations for drawing robust conclusions . Only one study has examined the role of anthropogenic climate change on drought severity using Coupled Model Intercomparison Project Phase 6 simulations, but it introduces significant uncertainties owing to the limitations of model-based approaches. Although SPEI has been widely used to assess drought trends, this study quantifies, at the global scale and based on observations, the role of increasing AED in drought severity. In addition, it evaluates uncertainties in global datasets, offering a more comprehensive perspective on this critical issue.
We developed 4 global, high-resolution ( ) SPEI datasets for 1981-2022 using precipitation from Climate Hazards Group Infrared Precipitation with Station Data (CHIRPS) or Multi-Source Weighted-Ensemble Precipitation (MSWEP) , combined with AED from the Global Land Evaporation Amsterdam Model version 4.2a (GLEAM) or hourly potential evapotranspiration (hPET) .Although both precipitation products perform well , the inputs and methods used to produce CHIRPS and MSWEP are quite different. Similarly, the widely used GLEAM and hPET AED datasets rely primarily on satellite and reanalysis data sources. Hence using combinations of all four builds a robust foundation for assessing trends. To assess global trends before the 1980s, we also developed two additional SPEI datasets based on ERA5-Land reanalysis (the fifth-generation reanalysis from the European Centre for Medium-Range Weather Forecasts, ERA5; about 25 km ) and the Climatic Research Unit Time-Series (CRU-TS;
about 50 km ), covering 1950-2022 and 1901-2022, respectively. By incorporating multiple datasets and different periods, we aim to capture a broader range of potential uncertainties in the forcing data and provide a more comprehensive assessment of drought patterns. Through using climatological AED and precipitation, we developed equivalent datasets that enable us to quantify the contributions of AED and precipitation changes to the SPEI trend, as well as to the frequency, duration and magnitude of drought events. Here we focus on the 6-month SPEI, as it captures prevalent short-to medium-term drought conditions.
On the basis of the mean of the four high-resolution SPEI datasets (HRSPEI) datasets, the quasi-global average ( to ) 6-month SPEI shows a decreasing trend, indicating drying conditions during the period 1981-2022 (Fig. 1). The 6-month HRSPEI shows a significant ( ) decreasing trend of (Fig.1a). The quasi-global area in drought (SPEI < -1) shows a commensurate significant increasing trend of (Fig. 1b). For severe (SPEI ) and extreme (SPEI < -1.8) droughts, the area in drought shows a significant increasing trend of and , respectively. On the basis of CRU-TS and ERA5, the period from 1950 to 1980 shows significant increasing trends in 6-month SPEI of -units and -units , respectively. A summary of the 6 -month SPEI trend is provided in Extended Data Fig. 1f.
Spatially, the 6-month HRSPEI shows a drying trend across large parts of the world such as in Europe, Africa, western North America and South America during 1981-2022 (Fig. 1c), with a drying trend of up to -units . Conversely, regions such as South and Southeast Asia, the Guyanas in South America, central Southern Africa and eastern North America show an increasing wetting trend over the same period. The trends for individual datasets that constitute the HRSPEI and CRU-TS and ERA5 datasets are provided in Extended Data Figs. 1 and 2, respectively.
The trend in magnitude and frequency of droughts has increased in different parts of the world during 1981-2022 (Fig. 2). The drought magnitude (Fig. 2a) and frequency (Fig. 2b) show significant decreasing and increasing trends in various regions, particularly in the southern parts of South America, eastern and central Africa, southern Europe and the western United States. Compared with much of the world, parts of Africa and South America show a greater increase and decrease in drought frequency and magnitude, respectively, highlighting that these trends are primarily driven by precipitation deficits. In contrast, changes in drought duration are statistically significant only in scattered areas, arguing against a widespread change in drought duration (Extended Data Fig. 3).
Of note is the acceleration in the decrease in SPEI and increase in areas experiencing drought during the past 5 years, with 2022 recording the highest percentage of impacted areas (Extended Data Fig. 4). During this period, the global extent of severe and extreme drought increased threefold and fivefold, respectively, compared with 1981-2022. In Europe, 82% of land experienced drought, with 50% under moderate to severe drought (Fig.1d). In 2022, annual precipitation across Europe dropped by up to below the 1981-2022 average, and AED increased by up to (Extended Data Fig. 5).

Drivers of changes in drought

To assess how changes in AED and precipitation affect drought, we compare SPEI trends calculated from observed AED and precipitation variations with those based on climatological means of AED (AEDclm) and precipitation (Prclm). The quasi-global average 6-month SPEI trend, based on observed precipitation and AEDclm, is -units , which is about higher than the observed trend (Fig. 3), indicating that holding AED to its climatological value results in a positive trend. When using observed AED and Prclm, the SPEI trend is -units , which is more negative than the observed trend (Fig. 3a). Similarly, the
Fig. 1|Monthly SPEI, percentage of area in drought and maps of SPEI trends and the 2022 drought. a,b, The quasi-global to average and global percentage of area in droughts (b). c, The trend in 6-month HRSPEI for 1981-2022 ( -units ), with non-significant trends ( ) marked in grey for visualization. d, The 6-month HRSPEI values for the record-breaking drought in August 2022 ( -units). The time series uses HRSPEI ( ), CRU-TS ( ) and ERA5 , with HRSPEI being the ensemble mean of MSWEP_hPET,
MSWEP_GLEAM, CHIRPS_hPET and CHIRPS_GLEAM (1981-2022). CRU-TS covers 1901-2022 and ERA5 spans 1950-2022. The time series are averaged over tropical and subtropical land areas ( to ), excluding regions with average annual rainfall below 180 mm . For regions above , the spatial trend is based on the mean of MSWEP_hPET and MSWEP_GLEAM, as CHIRPS is available up to . The vertical lines indicate the period from 1950 to 1980, showing higher positive SPEI values based on ERA5 and CRU-TS compared with 1981-2022.
trend in areas in drought based on the observed precipitation and AEDclm is , which is lower than the observed trend. These findings indicate that AED changes from 1981 to 2022 intensified both the downwards trend in SPEI and the expansion of drought-affected areas. The time series based on Prclm shows an evolution from positive SPEI values at the beginning of the study period to negative in recent years (Fig. 3a). This pattern is also observed with the SPEI values based on ERA5 (Extended Data Fig. 6), highlighting the increased impact of AED as precipitation remains fixed at its climatological value.
Regionally, the results indicate a notable contribution of AED to the negative SPEI trend (up to ) in large parts of Europe (excluding Norway and Sweden), Asia, Australia, the western United States and southern parts of South America (Fig. 3b). In addition, in parts of East and South Africa, changes in AED have exacerbated the negative SPEI trend by up to -units . In contrast, AED has minimal or no effect on drought trends in North America (Canada, Midwest and Southeast United States), northern South America (Amazon River Basin) and Central Africa. However, AED appears to have increased the SPEI trend (up to -units ) in South (India) and
Southeast Asia. This change can be attributed to the observed increasing trend in precipitation and decreasing trend in AED (Extended Data Fig. 7). When using Prclm, the 6-month SPEI shows a significantly more negative trend (up to -units ) compared with the observed trend globally, except in South and Southeast Asia (Fig. 3c). The trend based on ERA5 datasets also shows a similar change during 1981-2022 (Extended Data Fig. 6).
Observed changes in AED have also intensified the magnitude and frequency of droughts globally (Fig. 2). Compared with AEDcIm, observed trends show a more negative drought magnitude (up to -units ) and a more positive frequency trend (up to +0.16 months ). Regional averages reveal that drought magnitude, based on observed AED, shows a significant decreasing trend between and , whereas the trend is not statistically significant with AEDcIm in South and North America, Africa, Europe, and Australia (Fig. 2g-r). Drought frequency shows a significant increasing trend between 0.02 months and 0.07 months with observed AED, whereas the trend is very low and not significant using AEDclm. In Asia, AEDclm shows a significant increase in drought magnitude ( -units ) and a decrease in
Fig. 2 | Trends in drought magnitude and frequency for 6-month SPEI during 1981-2022.a,b, The trend in magnitude ( -units ; a) and frequency (months ) of droughts (SPEI<-1) for the period 1981-2022 based on observed precipitation and AED (‘Observed’). c,d, The trend in magnitude (c) and frequency (d) based on observed precipitation and AEDclm (‘AEDclm’). e,f, The difference in trend between observed precipitation and AEDclm for drought magnitude (e) and frequency (f). The SPEI is based on MSWEP_hPET.
The trend and regional average exclude dry land areas with average annual rainfall below 180 mm . Non-significant trends are marked in grey to enhance clarity. Magnitude is calculated as the cumulative sum of SPEI values during a drought event for each year and frequency represents the number of events in a year with SPEI<-1.g-r, The average magnitude (units ) and frequency (months ) of droughts averaged over South America(g,m), Africa (h,n), Australia (i,o), Europe (j,p), Asia (k,q) and North America (l,r).
Fig. 3 | Monthly time series and trend differences of 6-month SPEI during
1981-2022. a, The quasi-global average ( ) 6-month SPEI based on AEDclm, Prclm and HRSPEI. MSWEP_AEDclm and CHIRPS_AEDclm refer to the average SPEI based on MSWEP and CHIRPS precipitation and AEDclm (climatological mean of GLEAM and hPET). GLEAM_Prclm and hPET_Prclm show the average SPEI based on AED from GLEAM and hPET and Prclm (climatological mean of MSWEP and CHIRPS).b, The trend difference between SPEI based on
observations (observed precipitation and AED) and SPEI based on observed precipitation and climatology of AED (AEDclm). c, The trend difference between SPEI based on observations and SPEI based on observed AED and climatology of precipitation (Prclm). Non-significant trends ( ) are marked in grey to enhance clarity. The trend excludes dry land areas with average annual rainfall below 180 mm . For regions above , the trend is based on the mean of MSWEP_hPET and MSWEP_GLEAM, as CHIRPS is available up to .
frequency ( -0.02 months ). In contrast, observed AED indicates a decrease in magnitude ( -units ) and an increase in frequency ( 0.02 months ).
Overall, even though precipitation accounts for of the global average SPEI trend during 1981-2022, the role of AED, contributing 40%, is substantial (Fig. 4). This is especially notable considering the stronger sensitivity of SPEI to precipitation than to AED in most land regions . In Africa, Australia, and the drylands of North and South America, the influence of AED is particularly pronounced, contributing up to 65% to drought trends during 1981-2022. Specifically, AED accounts for 44% of the drought trend in Africa and in Australia, playing a significant role in intensifying drought severity in these regions. In contrast, the
contribution of AED to drought trends in North and South America, Europe, and Asia is around .

Acceleration of droughts

The area affected by drought has expanded significantly, particularly during the past 5 years (Extended Data Fig. 4). Globally, during the past 5 years (2018-2022), the observed area in drought was on average , which is higher than during 1981-2017 and higher compared with AEDcIm for 2018-2022. Regionally, drought-affected areas increased by in Australia, in southern South America, and in the western United States in 2018-2022 compared with
Fig. 4 | Percentage contribution of AED and precipitation to trends in 6-month SPEI. a,b, The percentage contribution of AED (a) and the percentage contribution of precipitation (b) to the observed changes in 6-month HRSPEI during 1981-2022. The contributions are computed by calculating the difference between the observed trend and the trend based on the climatological values of AED (AEDclm) and precipitation (Prclm). The contribution of AED is determined by the difference between the trend using observed AED and precipitation and
the trend using observed precipitation and AEDcIm. Similarly, the contribution of precipitation is calculated as the difference between the trend using observed precipitation and AED and the trend using observed AED and Prclm. The percentage contribution of each factor is then calculated as the absolute value of the difference divided by the total absolute difference, providing a relative measure of each factor’s influence on the observed trend. c, The regional and global average contribution of precipitation and AED to the changes in SPEI.
1981-2017 (Extended Data Fig. 8). Similarly, in the past 5 years, drought areas increased by 75%, 80% and 56% in East Africa, Northern Asia and Europe, respectively. In contrast, when using AEDclm, the increases were substantially lower in Australia ( ), southern South America (62%), western United States (58%) and Northern Asia (0.5%), whereas Europe and East Africa experienced a decrease of about 8%. A summary of these changes is provided in Extended Data Fig. 8h.
Drought severity in 2022 was record-breaking relative to the 19812022 period (Extended Data Fig. 8). The year 2022 had the highest drought area ( ), which is higher than AEDclm. As shown in Fig. 1d, the 6-month SPEI for August 2022 indicates moderate to extreme droughts across Europe, East Africa, western United States and southern South America, with drought-affected areas approximately
greater than AEDcIm. In addition, the average SPEI was -0.85 units , compared with 0.52 units based on AEDclm. Overall, owing to the observed increase in AED, the trends in SPEI and areas in drought during 1981-2022 indicate that not only are drier regions becoming drier but also wet areas are experiencing drying trends.

Discussion

According to the SPEI, over the past 42 years (1981-2022), global drought severity has intensified. In the past 5-10 years, this trend has accelerated as a consequence of the strong increase in AED, which is directly related to global warming and an increased vapour pressure deficit , as the water supply to the atmosphere is not enough to
compensate for the large temperature increase. Some recent studies have also suggested an increase in the severity of drought events over large land areas based on metrics such as modelled soil moisture and the Palmer Drought Severity Index , all of which are sensitive to changes in the AED. Nevertheless, in our study, we have quantified the contribution of AED to worsening drought conditions, which has been up to in some regions, particularly in Africa, Australia, western United States and southern South America. Moreover, changes in AED have exacerbated the drying trend globally, particularly in the past decade. The year 2022 specifically was a record-breaking year for drought severity and extent in Europe and East Africa. In Europe, the severity of the 2022 drought event can be largely attributed to anthropogenic warming, as the anomalies observed in streamflow and soil moisture cannot be explained by the precipitation deficit alone, but mostly by enhanced AED, which increased water losses by evaporation . Moreover, the ecological drought severity recorded in Europe’s natural forests cannot be fully explained without considering the influence of high temperatures and AED on plant physiology. In the absence of formal attribution studies in other regions of the world that experienced drought in 2022, the attribution in Europe and the increase in severity globally driven by enhanced AED as shown in this study suggests that it is reasonable to conclude that anthropogenic global warming likely contributed to exacerbate global drought severity in 2022.
Compared with previous studies analysing recent drought trends based on atmospheric drought indices that use AED in calculations , this study has isolated the effect of AED on drought severity and in addition our study has also reduced uncertainties given the use of high-spatial-resolution and multi-source data, which allows for a clearer understanding of drought intensification. The observed increase in drought severity aligns with associated impacts on agricultural, environmental and hydrological systems, as seen in events like the 2022 European drought, which contributed to enhanced tree mortality, increased forest fires and long-term soil moisture decline . Although the SPEI is an atmospheric drought index that effectively captures the effects of precipitation and AED on drought severity, it may represent drought-related impacts very effectively . However, further studies are needed, considering variables such as soil moisture, vegetation stress and hydrological flows for better understanding of the broader impacts of the observed changes on ecosystems and human activities . Moreover, the observed acceleration of drought trends in the past few years aligns with future climate projections that indicate further increases in drought severity owing to projected warming , which warns of the need for better socioeconomic and environmental adaptation measures to reduce drought impacts and improve global drought.

Online content

Any methods, additional references, Nature Portfolio reporting summaries, source data, extended data, supplementary information, acknowledgements, peer review information; details of author contributions and competing interests; and statements of data and code availability are available at https://doi.org/10.1038/s41586-025-09047-2.
8. Forrest, K., Tarroja, B., Chiang, F., AghaKouchak, A. & Samuelsen, S. Assessing climate change impacts on California hydropower generation and ancillary services provision. Climatic Change 151, 395-412 (2018).
9. Greve, P., Gudmundsson, L. & Seneviratne, S. I. Regional scaling of annual mean precipitation and water availability with global temperature change. Earth Syst. Dyn. 9, 227-240 (2018).
10. Greve, P., Roderick, M. L. & Seneviratne, S. I. Simulated changes in aridity from the last glacial maximum to 4xCO2. Environ. Res. Lett. 12, 114021 (2017).
11. Padrón, R. S. et al. Observed changes in dry-season water availability attributed to human-induced climate change. Nat. Geosci. 13, 477-481(2020).
12. Mahecha, M. D. et al. Biodiversity loss and climate extremes-study the feedbacks. Nature 612, 30-32 (2022).
13. Seneviratne, S.I. et al. Weather and climate extreme events in a changing climate. In Climate Change 2021: The Physical Science Basis. Contribution of Working Group I to the Sixth Assessment Report of the Intergovernmental Panel on Climate Change (eds Masson-Delmotte, V. et al.) Ch. 11, 1513-1766 (Cambridge Univ. Press, Cambridge, 2021); https://doi.org/10.1017/9781009157896.013.
14. Zhu, P. et al. Warming reduces global agricultural production by decreasing cropping frequency and yields. Nat. Clim. Change 12, 1016-1023 (2022).
15. Bauman, D. et al. Tropical tree mortality has increased with rising atmospheric water stress. Nature 608, 528-533 (2022).
16. Kikstra, J. et al. The IPCC Sixth Assessment Report WGIII climate assessment of mitigation pathways: from emissions to global temperatures. EGUsphere https://doi.org/10.5194/ egusphere-2022-471 (2022).
17. Vicente-Serrano, S. M. et al. Global drought trends and future projections. Phil. Trans. R. Soc. Math. Phys. Eng. Sci. 380, 20210285 (2022).
18. Douville, H. & Willett, K. M. A drier than expected future, supported by near-surface relative humidity observations. Sci. Adv. 9, eade6253 (2023).
19. Dai, A. Increasing drought under global warming in observations and models. Nat. Clim. Change 3, 52-58 (2013).
20. IPCC Climate Change 2014: Synthesis Report (eds Core Writing Team, Pachauri, R. K. & Meyer L. A.) (IPCC, 2014).
21. Allen, C. D., Breshears, D. D. & McDowell, N. G. On underestimation of global vulnerability to tree mortality and forest die-off from hotter drought in the Anthropocene. Ecosphere 6, 129 (2015).
22. Berg, A. & Sheffield, J. Climate change and drought: the soil moisture perspective. Curr. Clim. Change Rep. 4, 180-191 (2018).
23. Cook, B. I. et al. Twenty-first century drought projections in the CMIP6 forcing scenarios. Earths Future 8, e2019EF001461 (2020).
24. Garrido-Perez, J. M. et al. Examining the outstanding Euro-Mediterranean drought of 2021-2022 and its historical context. J. Hydrol. 630, 130653 (2024).
25. Bevacqua, E. et al. Direct and lagged climate change effects intensified the 2022 European drought. Nat. Geosci. 17, 1100-1107(2024).
26. IPCC Climate Change 2022: Impacts, Adaptation, and Vulnerability (eds Pörtner H.-O. et al.) (Cambridge Univ. Press, 2022).
27. Kingston, D. G., Todd, M. C., Taylor, R. G., Thompson, J. R. & Arnell, N. W. Uncertainty in the estimation of potential evapotranspiration under climate change. Geophys. Res. Lett. 36, L20403 (2009).
28. van der Schrier, G., Barichivich, J., Briffa, K. R. & Jones, P. D. A scPDSI-based global data set of dry and wet spells for 1901-2009. J. Geophys. Res. Atmos. 118, 4025-4048 (2013).
29. Beck, H. E. et al. Global-scale evaluation of 22 precipitation datasets using gauge observations and hydrological modeling. Hydrol. Earth Syst. Sci. 21, 6201-6217 (2017).
30. Gebrechorkos, S. H. et al. Global-scale evaluation of precipitation datasets for hydrological modelling. Hydrol. Earth Syst. Sci. 28, 3099-3118 (2024).
31. Vicente-Serrano, S. M., Beguería, S. & López-Moreno, J. I. A multiscalar drought index sensitive to global warming: the Standardized Precipitation Evapotranspiration Index. J. Clim. 23, 1696-1718 (2010).
32. Tomas-Burguera, M. et al. Global characterization of the varying responses of the Standardized Precipitation Evapotranspiration Index to atmospheric evaporative demand. J. Geophys. Res. Atmos. 125, e2020JD033017 (2020).
33. Haile, G. G. et al. Long-term spatiotemporal variation of drought patterns over the Greater Horn of Africa. Sci. Total Environ. 704, 135299 (2020).
34. Kamruzzaman, M. et al. Spatiotemporal drought analysis in Bangladesh using the Standardized Precipitation Index (SPI) and Standardized Precipitation Evapotranspiration Index (SPEI). Sci. Rep. 12, 20694 (2022).
35. Spinoni, J. et al. Future global meteorological drought hot spots: a study based on CORDEX data. J. Clim. 33, 3635-3661(2020).
36. Wang, T., Tu, X., Singh, V. P., Chen, X. & Lin, K. Global data assessment and analysis of drought characteristics based on CMIP6. J. Hydrol. 596, 126091 (2021).
37. Spinoni, J. et al. A new global database of meteorological drought events from 1951 to 2016. J. Hydrol. Reg. Stud. 22, 100593 (2019).
38. Beguería, S., Vicente-Serrano, S. M., Reig, F. & Latorre, B. Standardized Precipitation Evapotranspiration Index (SPEI) revisited: parameter fitting, evapotranspiration models, tools, datasets and drought monitoring. Int. J. Climatol. 34, 3001-3023 (2014).
39. Wang, Q. et al. Temporal-spatial characteristics of severe drought events and their impact on agriculture on a global scale. Quat. Int. 349, 10-21 (2014).
40. Funk, C. et al. The climate hazards infrared precipitation with stations-a new environmental record for monitoring extremes. Sci. Data 2, 150066 (2015).
41. Beck, H. E. et al. MSWEP V2 global 3-hourly precipitation: methodology and quantitative assessment. Bull. Am. Meteorol. Soc. 100, 473-500 (2019).
42. Miralles, D. G. et al. GLEAM4: Global Land Evaporation and Soil Moisture dataset at resolution from 1980 to near present. Sci. Data 12, 416 (2025).
43. Singer, M. B. et al. Hourly potential evapotranspiration at resolution for the global land surface from 1981-present. Sci. Data 8, 224 (2021).
44. Dai, A. & Zhao, T. Uncertainties in historical changes and future projections of drought. Part I: estimates of historical drought changes. Clim. Change 144, 519-533 (2017).
45. Song, X., Song, Y. & Chen, Y. Secular trend of global drought since 1950. Environ. Res. Lett. 15, 094073 (2020).
46. Alizadeh, M. R. et al. Warming enabled upslope advance in western US forest fires. Proc. Natl Acad. Sci. USA 118, e2009717118 (2021).
47. Bachmair, S., Tanguy, M., Hannaford, J. & Stahl, K. How well do meteorological indicators represent agricultural and forest drought across Europe? Environ. Res. Lett. 13, 034042 (2018).
48. Naumann, G. et al. Global changes in drought conditions under different levels of warming. Geophys. Res. Lett. 45, 3285-3296 (2018).
Publisher’s note Springer Nature remains neutral with regard to jurisdictional claims in published maps and institutional affiliations.
4.0 International License, which permits use, sharing, adaptation, distribution and reproduction in any medium or format, as long as you give appropriate credit to the original author(s) and the source, provide a link to the Creative Commons licence, and indicate if changes were made. The images or other third party material in this article are included in the article’s Creative Commons licence, unless indicated otherwise in a credit line to the material. If material is not included in the article’s Creative Commons licence and your intended use is not permitted by statutory regulation or exceeds the permitted use, you will need to obtain permission directly from the copyright holder. To view a copy of this licence, visit http://creativecommons.org/licenses/by/4.0/.
© The Author(s) 2025

Methods

Drought index

The SPEI is a widely utilized drought assessment tool that incorporates both AED and precipitation to evaluate drought severity across different timescales. SPEI values are computed by subtracting AED from precipitation. These differences are standardized using a log-logistic probability distribution to ensure consistency across regions, seasons and timescales. This distribution model involves three parameters ( and ), which are estimated using the L -moment procedure. The SPEI indices were calculated using the entire 1981-2022 period as a baseline, ensuring that the full range of variability in the input data is captured. Unlike other drought indices, the SPEI does not require a predefined baseline or calibration period, as it standardizes the data directly from the input time series, ensuring consistency across datasets and timescales. The SPEI values provide categories for wet and dry events (Extended Data Table 1).
Using SPEI, we developed four high-resolution SPEI indices using a combination of two precipitation datasets and two potential evapotranspiration (that is, AED) datasets. The precipitation datasets used were the MSWEP and CHIRPS precipitation and the AED datasets were GLEAM and . The resulting four indices: MSWEP_GLEAM, MSWEP_hPET, CHIRPS_GLEAM and CHIRPS_hPET, were developed at a spatial resolution of for the period 1981-2022. The -resolution datasets were first interpolated to match the resolution of CHIRPS using bilinear interpolation. In addition, we developed an ensemble mean (HRSPEI) based on all four datasets. For latitudes above , the mean is derived from MSWEP_GLEAM and MSWEP_hPET, as CHIRPS data are available only up to latitude. AED and AED variability in high-latitude areas are generally small, and changes in AED, even at high percentages, result in low absolute magnitudes, making SPEI less sensitive to AED in these regions .
To assess the contributions of precipitation and AED, we developed additional indices based on observed (that is, actual values from hPET and GLEAM) AED with monthly climatological precipitation (Prclm), and observed (that is, a combination of gauge and satellite and reanalysis data) precipitation with climatological AED (AEDclm) for the period 1981-2022. Using AEDcIm and Prclm allows us to quantify the impact of precipitation and AED changes and variability on droughts over the past 42 years. To further assess changes in drought during the early and mid-1990s, we developed two coarse-resolution SPEI indices based on ERA5 and CRU-TS . The SPEI based on ERA5 was computed using monthly precipitation and AED derived from ERA5 meteorological datasets using the Penman-Monteith equation (equation (1)) for the period 1950-2022. Similarly, the SPEI based on CRU-TS was calculated using monthly precipitation and AED derived from CRU-TS meteorological datasets using the Penman-Monteith equation (equation (1)) for the period 1901-2022.
In this study, we use SPEI < -1 as the threshold to define a drought, with values between -1 and 1 considered near-normal conditions and values indicating wet conditions (Extended Data Table 1). Using SPEI<-1 values, we assessed key drought metrics: magnitude, duration, intensity and frequency. We follow the classic approach and widely adopted methods to define these metrics . Drought magnitude is calculated as the cumulative sum (running total) of SPEI < -1 values during a drought event. Drought intensity is defined as the maximum negative value of SPEI observed during the event. Duration represents the run length of consecutive months with SPEI , and frequency is the total number of drought events within a given period . Finally, severity is used as an overarching term to refer to all aspects of drought: intensity, magnitude, duration and extent.

Global climate and AED datasets

The MSWEP (version 2.8) dataset offers global 3-hourly, daily and monthly precipitation estimates at a spatial resolution from 1979
to present . Similarly, the CHIRPS (version 2.0) dataset provides daily, decadal and monthly precipitation estimates over land, with a spatial resolution of for latitudes below , covering the period from 1981 to present . Both MSWEP and CHIRPS are high-resolution precipitation datasets developed by integrating ground-station observations, satellite data and reanalysis products.
CHIRPS and MSWEP were chosen as they generally outperform other similar gridded precipitation datasets when compared with ground observations . CHIRPS ( ) is particularly designed for monitoring droughts and detecting environmental changes, providing daily precipitation estimates from 1981 to present. It combines satellite-derived Climate Hazards Center Infrared Precipitation (CHIRP) and the Climate Hazards Group Precipitation Climatology (CHPclim) with ground-station data from the Global Historical Climate Network and many other sources. The CHIRPS product benefits from a high degree of homogeneity, provided by its simple but consistent foundation of geostationary thermal infrared satellite observations. CHIRPS also incorporates unique observation inputs from Africa, Latin America and Central America. MSWEP ( ) has been designed with both accuracy and homogeneity in mind, providing 3-hourly precipitation estimates from 1979 to present. It integrates daily observations from over 77,000 stations from various national and international data sources, satellite estimates from infrared- and microwave-based satellite datasets, and reanalysis data, offering accurate global precipitation data from 1979 to present. Both CHIRPS and MSWEP have previously been evaluated globally using statistical metrics such as Kling-Gupta efficiency and Nash-Sutcliffe efficiency, as well as various bias and error metrics . For instance, MSWEP outperformed 22 other global precipitation datasets in capturing daily precipitation from 76,086 gauging stations and in driving hydrological models across 9,053 catchments . In addition, both MSWEP and CHIRPS were found to outperform other high-resolution gauge-based datasets in modelling daily, monthly and annual streamflow across 1,825 streamflow gauges . However, both datasets remain subject to inherent uncertainties, and, therefore, considering both helps reduce biases and obtain more reliable estimates, given that they are somewhat independent. For example, they differ in their data sources, with CHIRPS using only geostationary thermal infrared observations, whereas MSWEP also uses microwave observations, and they use different sets of station data to correct locally. Despite these differences, the monthly correlation between MSWEP and CHIRPS shows a high correlation across most regions, except for Central Asia (Extended Data Fig. 9a). The average monthly difference between the 2 datasets varies spatially, reaching up to (Extended Data Fig. 9d). Notably, Iarger discrepancies occur in regions such as the Amazon, Central Africa and parts of Southeast Asia. Such convergence between the two products helps reduce concerns about the uncertainties owing to different approaches and changes in the constellation of Earth-observing satellites that can affect the robustness of their representation of changes over time.
The hPET is a global hourly AED dataset developed using ERA5 climate datasets and the Food and Agriculture Organization (FAO)’s PenmanMonteith equation (equation (1)). hPET is available for the global land surface at spatial resolution covering the period 1981-2022 . In addition, the AED from GLEAM (version 4.2a) is a global dataset derived using Penman’s original equation (equation (2)), using satellite and reanalysis datasets . GLEAM is available at a spatial resolution and covers the period 1980-2023. hPET is based on the FAO PenmanMonteith equation, which computes reference crop evaporation by assuming certain surface and aerodynamic characteristics that are constant in time. In contrast, GLEAM calculates aerodynamic conductance as a dynamic variable depending on ecosystem characteristics and local meteorology and therefore is space and time dependent. Nonetheless, given the dominant influence of radiative forcing and atmospheric aridity in both computations, their estimates are overall similar. The correlation between GLEAM and hPET exceeds 0.9 across of the
global land surface (Extended Data Fig. 9b), and the monthly average difference between them is up to (Extended Data Fig. 9c).
The global AED and precipitation data from the CRU-TS dataset are available at a spatial resolution of , covering the period from 1901 to present . Similarly, the ERA5 reanalysis dataset, representing the fifth-generation reanalysis from the European Centre for Medium-Range Weather Forecasts (ECMWF), is available at a spatial resolution of from 1940 to present .

Atmospheric evaporative demand

The hPET is estimated using the FAO-56 Penman-Monteith equation (equation (1)), and the GLEAM PET (potential evapotranspiration, AED) is calculated using Penman’s equation, including aerodynamic conductance (equation (2)). In addition, the FAO-56 Penman-Monteith method is applied to calculate AED from ERA5 climate datasets for the period 1950-2022 and CRU-TS climate datasets for 1901-2022. The Penman and FAO-56 Penman-Monteith methods consider various meteorological variables such as wind speed, air temperature, radiation and humidity to estimate AED:
where is the slope of the plot of saturation vapour pressuretemperature relationship, is the net radiation, is the soil heat flux, is the psychrometric constant, is the mean daily air temperature at height, is the wind speed at height, is the vapour pressure deficit of the air (difference between saturation vapour pressure and actual vapour pressure), is the air density, is the specific heat capacity of air at constant pressure, is the aerodynamic conductance, and is the latent heat of vaporization.

Trend analysis

The trend in SPEI is assessed using the non-parametric Mann-Kendall test and Sen’s slope estimator. The Mann-Kendall test identifies upwards or downwards trends in the SPEI time series for each pixel. Sen’s slope estimator calculates the slope of change in the SPEI series by computing the median of all possible slopes between data points. This method provides a robust estimate of the trend, particularly in the presence of outliers or nonlinear patterns. To identify drought events at the pixel scale, we utilize SPEI categories (Extended Data Table 1). SPEI values less than -1.0 are used to identify areas affected by droughts. We evaluate the frequency, duration and magnitude of these drought events (SPEI < -1) by analysing the number of occurrences, the length of consecutive periods and the intensity of SPEI values during the period from 1981 to 2022.

Data availability

The high-resolution SPEI datasets , developed using the Standardized Precipitation Evapotranspiration Index (SPEI) , are freely accessible
through the Centre for Environmental Data Analysis (CEDA) at https:// doi.org/10.5285/ac43da11867243a1bb414e1637802dec and onJASMIN at/badc/hydro-jules/data/Global_drought_indices. The CHIRPS data can be accessed via the Climate Hazards Group (CHG) at https://www. chc.ucsb.edu/data/chirps/ (ref. 40). The MSWEP precipitation dataset is available from the GloH2O website at https://www.gloh2o.org/ mswep/ (ref. 41). The hPET dataset is hosted by the University of Bristol at https://data.bris.ac.uk/data/dataset/qb8ujazzda0s2aykkv0oq0ctp (ref. 43). The AED data from GLEAM can be accessed at https://www. gleam.eu/ (ref. 42). The CRU-TS precipitation and AED datasets are available through CEDA at https://data.ceda.ac.uk/badc/cru/data/ cru_ts/cru_ts_4.08/(ref.50). The ERA5 dataset is available for download from the Copernicus Climate Change Service’s Climate Data Store at https://cds.climate.copernicus.eu/datasets (ref. 51).

Code availability

This study utilized the SPEI code to calculate drought indices. The SPEI code is publicly available on GitHub at https://github.com/sbegueria/ SPEI/. For trend analysis, the Trend package in R was used, which is publicly available at https://github.com/cran/trend. The code used to develop the global SPEI datasets, perform the trend tests and produce the figures is available on Zenodo at https://doi.org/10.5281/ zenodo. 15073433 (ref. 53).
49. Agnew, C. T. Using the SPI to identify drought. Drought Network News 1994-2001 (International Drought Information Center and National Drought Mitigation Center, School of Natural Resources, University of Nebraska – Lincoln, 2000).
50. Harris, I., Osborn, T. J., Jones, P. & Lister, D. Version 4 of the CRU TS monthly high-resolution gridded multivariate climate dataset. Sci. Data 7, 109 (2020).
51. Hersbach, H. et al. The ERA5 global reanalysis. Q. J. R. Meteorol. Soc. 146, 1999-2049 (2020).
52. Gebrechorkos, S. H. et al. Global high-resolution drought indices for 1981-2022. Earth Syst. Sci. Data 15, 5449-5466 (2023).
53. Gebrechorkos, S. H. solomonsg/Globdrought: drought indices and trends calculation. Zenodo https://doi.org/10.5281/zenodo. 15073433 (2025).
Acknowledgements We acknowledge the financial support provided by the UK Foreign, Commonwealth and Development Office (FCDO, grant number 201880) and the UK Natural Environment Research Council (NERC, grant number NE/SO17380/1). We thank the Centre for Environmental Data Analysis (CEDA, https://www.ceda.ac.uk/) for hosting the global drought datasets.
Author contributions S.H.G. developed the drought datasets, conducted trend assessments and drafted the paper. S.J.D. led the project, and S.H.G. and S.J.D. designed the study with input from all authors. C.F., H.E.B., D.G.M. and M.B.S. provided and developed the CHIRPS, MSWEP, GLEAM and hPET datasets, respectively. S.M.V.-S. provided the SPEI index. J.S., S.M.V.-S., D.G.M. and J.P. contributed to the experimental design, research questions and dataset selection. E.D. and J.T. supported the data analysis and edited the paper. All authors contributed to the development of the paper.
Competing interests The authors declare no competing interests.

Additional information

Supplementary information The online version contains supplementary material available at https://doi.org/10.1038/s41586-025-09047-2.
Correspondence and requests for materials should be addressed to Solomon H. Gebrechorkos. Peer review information Nature thanks the anonymous, reviewers for their contribution to the peer review of this work. Peer reviewer reports are available.
Reprints and permissions information is available at http://www.nature.com/reprints.
Extended Data Fig.1|See next page for caption.
Extended Data Fig. 1| Trends in 6-month SPEI for the period 1981-2022. Panels a), b), c), and d) display the 6-month SPEI trends (z-units year-1) derived from the MSWEP_hPET, MSWEP_GLEAM, CHIRPS_hPET, and CHIRPS_GLEAM datasets, respectively. Non-significant trends ( P -value ) are marked in gray to improve clarity. The analysis excludes dryland regions with an average annual rainfall of less than 180 mm . Panel e) shows the quasi-global ( to ) average 6-month SPEI time series. Panel f) summarizes the SPEI trends
and areas in drought based on HRSPEI, CRU-TS, and ERA5. The trend derived from HRSPEI represents the overall trend, while the deviation ( ± ) reflects the spread in trends of the individual datasets (MSWEP_hPET, MSWEP_GLEAM, CHIRPS_hPET, and CHIRPS_GLEAM) around the HRSPEI mean trend. The deviation is calculated as the standard deviation of trends across these four datasets, highlighting the variability in the trends relative to the HRSPEI trend.
Extended Data Fig. 2 | Trend in 6-month SPEI based on CRU-TS and ERA5 during 1981-2022. Panel a) shows the trends in 6-month SPEI using precipitation and AED from the CRU-TS dataset. Panel b) illustrates the trends in 6-month SPEI derived from precipitation and AED based on ERA5 datasets.
Non-significant trends ( P -value ) are marked in gray to improve clarity. The analysis excludes dryland regions with an average annual rainfall of less than 180 mm .
Extended Data Fig. 3 | Trends in the duration of 6-month SPEI droughts. The trends in 6-month SPEI are based on a) observed AED and precipitation(Obs) and b) climatological AED and observed precipitation (AEDclm). Panel c) shows the difference between the drought trends based on Obs and AEDclm. The SPEI
is based on MSWEP_hPET, with drought duration calculated for each year where SPEI values fall below -1 . Non-significant trends ( P -value ) are marked in gray for clarity and the trend excludes dry land areas with an average annual rainfall below 180 mm .
Extended Data Fig. 4 | Percentage of areas impacted by severe and extreme droughts. Panels a) and b) show the time series of the percentage of areas affected by severe (SPEI < -1.4) and extreme (SPEI < -1.8) droughts, respectively.
The dashed vertical lines mark the last five years (2018-2022), highlighting the increase in drought-affected areas compared to 1981-2017.

Extended Data Fig. 5 | Annual percentage precipitation and AED anomalies in 2022. Panels a) and b) show the 2022 precipitation and AED percentage anomalies relative to the long-term mean (1981-2022). Negative values indicate
reductions, while positive values indicate increases compared to the long-term average. Precipitation is based on MSWEP, and AED is based on hPET.
Extended Data Fig. 6 | Trends in 6-month SPEI based on ERA5 during
1981-2022. The 6-month SPEI values were computed using the ERA5 meteorological dataset with combinations of observed AED, observed precipitation, climatological AED (AEDclm), and climatological precipitation (Prclm). Panel a) shows the trend based on observed precipitation and AED (Obs). Panel b) presents the trend based on AEDclm and observed precipitation
(AEDclm), while panel c) illustrates the trend based on Prclm and observed AED (Prclm). Non-significant trends (P-value ) are marked in gray to improve clarity. The trends also exclude dryland areas with average annual rainfall below 180 mm . Panel d) displays the quasi-global average ( ) 6-month SPEI time series for 1950-2022, based on Obs, AEDclm, and Prclm.
Extended Data Fig. 7 | Monthly trends in precipitation and AED during 1981-2022. Panels a) and b) illustrate the trends in monthly precipitation based on monthly MSWEP and CHIRPS datasets, respectively, while panels c) and d)
present the trends in monthly AED, derived from GLEAM and hPET datasets, respectively. Note that the CHIRPS dataset covers latitudes up to .
Extended Data Fig. 8|See next page for caption.
Extended Data Fig. 8 | Percentage of areas affected by drought during 1981-2022. The time series shows the annual percentage of areas in drought (SPEI < -1) for a) Australia, b) East Africa, c) Europe, d) Southern South America, e) Western USA, f) Northern Asia, and g) globally. The blue lines represent the percentage of areas in drought based on the 6-month SPEI calculated using observed AED and precipitation (Obs), while the orange lines indicate the
percentage of areas in drought based on the SPEI computed using observed precipitation and climatological AED (AEDclm). The dashed black vertical lines highlight the period from 2018 to 2022. Panel h) summarizes the percentage of areas affected by drought during 2018-2022, compared to the period 1981-2017, based on both Obs and AEDclm.
Extended Data Fig. 9 | See next page for caption.
Extended Data Fig. 9 | Monthly correlation and differences between precipitation and AED during 1981-2022. Panel a) shows the correlation (CC) of monthly precipitation between MSWEP and CHIRPS (Pr), while panel b) displays the correlation of monthly AED between GLEAM and hPET (AED).
Panels c) and d) show the average monthly differences between GLEAM and hPET (GLEAM-hPET, mm month ) and MSWEP and CHIRPS (MSWEP-CHIRPS, mm month ), respectively. The precipitation correlation and difference analysis is limited to latitudes up to due to CHIRPS data availability.

Article

Extended Data Table 1 | Categories of wet and dry events
SPEI categories SPEI values
Extremelywet >1.83
Very wet 1.43 to 1.82
Moderatewet 1.0 to 1.42
Near Normal -0.99 to 0.99
Moderately dry -1.0 to -1.42
Severely dry -1.43 to -1.82
Extremelydry <-1.83

  1. School of Geography and the Environment, University of Oxford, Oxford, UK. School of Geography and Environmental Science, University of Southampton, Southampton, UK. Instituto Pirenaico de Ecología, Consejo Superior de Investigaciones Científicas (IPE-CSIC), Zaragoza, Spain. Santa Barbara Climate Hazards Center, University of California, Santa Barbara, CA, USA. Hydro-Climatic Extremes Lab (H-CEL), Ghent University, Ghent, Belgium. Department of Remote Sensing, Helmholtz Centre for Environmental Research – UFZ, Leipzig, Germany. Institute for Earth System Science and Remote Sensing, Leipzig University, Leipzig, Germany. UK Centre for Ecology and Hydrology, Wallingford, UK. Climate and Livability Initiative, King Abdullah University of Science and Technology, Thuwal, Saudi Arabia. School of Earth and Environmental Sciences, Cardiff University, Cardiff, UK. Earth Research Institute, University of California, Santa Barbara, CA, USA. Water Research Institute, Cardiff University, Cardiff, UK. e-mail: solomon.gebrechorkos@ouce.ox.ac.uk
    1. Pokhrel, Y. et al. Global terrestrial water storage and drought severity under climate change. Nat. Clim. Change 11, 226-233 (2021).
    2. Chiang, F., Mazdiyasni, O. & AghaKouchak, A. Evidence of anthropogenic impacts on global drought frequency, duration, and intensity. Nat. Commun. 12, 2754 (2021).
    3. Sheffield, J., Wood, E. F. & Roderick, M. L. Little change in global drought over the past 60 years. Nature 491, 435-438 (2012).
    4. Trenberth, K. E. et al. Global warming and changes in drought. Nat. Clim. Change 4, 17-22 (2014).
    5. Seneviratne, S. I. Historical drought trends revisited. Nature 491, 338-339 (2012).
    6. Lu, J., Carbone, G. J. & Grego, J. M. Uncertainty and hotspots in 21st century projections of agricultural drought from CMIP5 models. Sci. Rep. 9, 4922 (2019).
    7. Tarroja, B., Chiang, F., AghaKouchak, A. & Samuelsen, S. Assessing future water resource constraints on thermally based renewable energy resources in California. Appl. Energy 226, 49-60 (2018).