IL-10 يقيّد استقلاب السفينغوليبيد للحد من الالتهاب
https://doi.org/10.1038/s41586-024-07098-5 تاريخ الاستلام: 17 يناير 2023 تم القبول: 22 يناير 2024 نُشر على الإنترنت: 21 فبراير 2024 الوصول المفتوح (أ) التحقق من التحديثات
إنترلوكين-10 (IL-10) هو سيتوكين مضاد للالتهابات رئيسي يمكنه الحد من تنشيط خلايا المناعة وإنتاج السيتوكينات في أنواع خلايا المناعة الفطرية.فقدان إشارات IL-10 يؤدي إلى مرض التهاب الأمعاء المهدد للحياة لدى البشر والفئران – ومع ذلك، فإن الآلية الدقيقة التي من خلالها تخفف إشارات IL-10 الالتهاب لا تزال غير واضحة.. هنا نجد أن زيادة السيراميدات المشبعة ذات السلسلة الطويلة جداً (VLC) ضرورية للتعبير الجيني الالتهابي المرتفع الذي يعد سمة مميزة لنقص IL-10. وبناءً عليه، فإن الحذف الجيني لإنزيم سيراميد سينثاز 2 (المشفر بواسطة Cers2)، وهو الإنزيم المسؤول عن إنتاج السيراميد VLC، قد حد من برنامج التعبير الجيني الالتهابي المتفاقم المرتبط بنقص IL-10 سواء في المختبر أو في الجسم الحي. تم تنظيم تراكم السيراميدات المشبعة VLC من خلال انخفاض في التدفق الأيضي عبر مسار تخليق الأحماض الدهنية الأحادية غير المشبعة de novo. إن استعادة توفر الأحماض الدهنية الأحادية غير المشبعة للخلايا التي تعاني من نقص في إشارات IL-10 قد حدت من إنتاج السيراميد VLC المشبع والالتهاب المرتبط به. من الناحية الآلية، نجد أن الالتهاب المستمر الذي يتوسطه السيراميدات VLC يعتمد إلى حد كبير على النشاط المستمر لـ REL، وهو عامل نسخي مناعي تعديل. معًا، تشير هذه البيانات إلى أن برنامج إزالة التشبع للأحماض الدهنية المدفوع بـ IL-10 يعيد توصيل تراكم السيراميد VLC والتنشيط الشاذ لـ REL. تدعم هذه الدراسات الفكرة القائلة بأن توازن الأحماض الدهنية في خلايا المناعة الفطرية يعمل كنقطة تنظيم رئيسية للتحكم في الالتهاب المرضي، وتقترح أن “التصحيح الأيضي” لتوازن VLC قد يكون استراتيجية مهمة لتطبيع الالتهاب غير المنظم الناجم عن غياب IL-10.
IL-10 هو سيتوكين مضاد للالتهابات يحد من تنشيط المناعة للخلايا المناعية الفطرية والتكيفية.يلعب إشارات IL-10 دورًا مهمًا في تعديل الالتهاب المخاطي في الأمعاء، ويؤدي حذف السيتوكين أو مستقبلاته (IL-10R) إلى مرض التهاب الأمعاء الشديد (IBD) في كل من الفئران والبشر.على الرغم من الأهمية الواضحة لـ IL-10 في الحفاظ على التوازن المعوي، إلا أن الآلية الدقيقة التي من خلالها يقلل إشارات IL-10-IL-10R الالتهاب ليست مفهومة جيدًا. وقد كشفت الأعمال المتراكمة أن الإشارات الالتهابية تعيد بسرعة تشكيل برامج الأيض الدهني لخلايا المناعة.لدعم الالتهاب ووظائف المؤثرين، مما يؤدي إلى فرضية أن السيتوكينات المضادة للالتهابات مثل IL-10 قد توجه التغيرات في استقلاب الدهون لمواجهة المحفزات الالتهابية. هنا نختبر هذه الفرضية ونكشف عن دور إشارات IL-10 في تنظيم استقلاب السفينغوليبيد في البلعميات أسفل مستقبلات Toll-like 2 (TLR2). في غياب IL-10، نجد أن البلعميات المنشطة بواسطة TLR2 لديها زيادة في التدفق الأيضي عبر مسار تخليق السفينغوليبيد de novo، مما يؤدي إلى تراكم تمت تخليق السيراميدات بشكل داخلي. وجدنا أن المستويات المرتفعة من السيراميدات المشبعة ذات السلسلة الطويلة جداً (VLC) ساهمت بشكل خاص في الأنماط الالتهابية سواء في المختبر أو في الجسم الحي. ومن المدهش أن تغيرات في استقلاب السفينغوليبيد في الخلايا التي تفتقر إلى IL-10 كانت ناتجة عن انخفاض في تخليق الأحماض الدهنية الأحادية غير المشبعة (MUFAs)، ويمكن تصحيحها من خلال توفير MUFAs خارجية. نجد أن برنامج التعبير الجيني الالتهابي المطول الذي يفرضه تغير توازن السيراميد VLC يتطلب عامل النسخ من عائلة NF-кB المعروف باسم REL. توفر هذه الدراسات دليلاً قوياً على أن التنظيم المنسق لاستقلاب الدهون بواسطة IL-10 ضروري للحد من الالتهاب المرضي المعتمد على REL، وتقترح أن استهداف جوانب محددة من توازن الدهون في الأمعاء يمكن أن يتحكم في الالتهاب الشاذ الذي يقف وراء مرض التهاب الأمعاء (IBD).
IL-10 ينظم استقلاب السفينغوليبيد
أظهرت الأعمال السابقة أن إشارات TLR الالتهابية تعيد تشكيل تركيبة الدهون في البلعميات بشكل عميق لتؤثر على الفاعلية.
وظيفة تم إنتاج IL-10 في مجرى بعض مستقبلات TLR لتعزيز حل الالتهاب، مما دفعنا لاستكشاف ما إذا كانت إشارات IL-10 مطلوبة لإعادة برمجة التمثيل الغذائي للدهون في مجرى تنشيط TLR2. لهذا الغرض، قمنا بمقارنة ملفات الدهون للخلايا البالعة المشتقة من نخاع العظام (BMDMs) من النوع البري أو المنشطة بواسطة TLR2، سواء كانت جديدة أو غير موجودة IL-10 (KO) باستخدام تحليل الدهون المستهدف. اكتشفنا حوالي 1,100 نوع من الدهون من 13 فئة دهنية. أظهرت تحليل المكونات الرئيسية لبيانات الدهون أن الخلايا البالعة الجديدة من النوع البري وIL-10-KO كانت متشابهة إلى حد كبير بالنسبة للمكونات الرئيسية PC1 وPC2 (الشكل 1a). التقط PC1 حوالي 80% من التباين الملحوظ في الخلايا البالعة المنشطة بواسطة TLR2 في الخلايا البالعة من النوع البري وIL-10-KO. حدد PC2 (8% من التباين) تأثير إشارات IL-10 على تركيبة الدهون في مجرى TLR2 (الشكل 1a). أظهر الفحص الدقيق للدهون المتأثرة بشكل خاص بإشارات IL-10 بعد تنشيط TLR2 تراكمًا ملحوظًا للدهون الشمعية، والدهون الشمعية المعدلة (الدهون الشمعية الهيكسوسيلية والدهون الشمعية اللاكتوسيلية)، وانخفاض في السفينغوميلينات (الشكل 1b-d والشكل الممتد 1a).
تحتوي السيراميدات والسفينغوميلينات على قاعدة سفينغويد وسلسلة دهنية N-acylated ذات طول متغير. (الشكل البياني الموسع 1ب). تولد خلايا الثدييات السيراميدات بأطوال ذيول الأسيلي من 14-18 كربون (سفينغوليبيدات طويلة السلسلة) أو 20 كربون أو أكثر (سفينغوليبيدات طويلة السلسلة جدًا) التي يمكن أن تكون مشبعة (بدون روابط مزدوجة) أو أحادية غير مشبعة (رابطة مزدوجة واحدة) (الشكل البياني الموسع 1ج). باستخدام منهجيتنا، تمكنا من قياس أنواع السفينغوليبيدات بشكل متسق مع ذيول أسيلي مشبعة وأحادية غير مشبعة من 16-24 كربون في عينات البلعميات. بالمقارنة مع الأقران من النوع البري، زادت جميع أنواع السيراميدات وجميع السيراميدات الهكسوسيلية في البلعميات المنشطة Il10-KO (الشكل البياني الموسع 1د، هـ). بالمقابل، انخفضت جميع السفينغوميلينات غير المشبعة وعدد من السفينغوميلينات المشبعة في البلعميات II1O-KO (الشكل البياني الموسع 1و).
لاختبار ما إذا كانت هذه الملاحظة صحيحة في الجسم الحي، قمنا بإجراء تحليل الدهون على البلعميات البريتونية المستخرجة من الفئران البرية أو الفئران التي تفتقر إلى IL-10 والتي تلقت منبهات TLR2 عبر الحقن داخل البطن. تماشيًا مع نتائجنا في المختبر، نجد أن البلعميات المستخرجة التي تفتقر إلى IL-10 تظهر زيادات كبيرة في العديد من أنواع السيراميد (الشكل 1e والشكل الإضافي 1g) وانخفاضات كبيرة في أنواع السفينغوميلين الأحادية غير المشبعة (الشكل الإضافي 1g). وبالتالي، نستنتج أن إشارات IL-10 تنظم استقلاب السفينغوليبيد في البلعميات استجابةً للمؤثرات الالتهابية سواء في المختبر أو في الجسم الحي.
يمكن توليد السيراميدات من خلال مسار تخليق جديد ويمكن تعديلها بشكل أكبر لتوليد السفينغوليبيدات المعقدة مثل السفينغومييلينات، والسيراميدات المعدلة باللاكتوزيل أو الهيكسوزيل. بدلاً من ذلك، يمكن أن تحول مسارات الإنقاذ المنتجات النهائية مرة أخرى إلى سيراميدات. (الشكل 1ج) (تمت مراجعتها في المرجع 16). وقد وجدت عدة دراسات أن الالتهاب يمكن أن يؤثر على مسارات إنقاذ السفينغوليبيدات.، لكن القليل معروف عن كيفية تأثير الإشارات الالتهابية على تنظيم تخليق السفينغوليبيد الجديد. لفهم ما إذا كانت إشارات IL-10 تؤثر على تخليق السيراميد، قمنا بتحليل التدفق إلى مسار تخليق السفينغوليبيد الجديد باستخدام متتبعات مستقرة النظائر. تم تغذية ثقافات البلعميات-سيرين (U تشير إلى الوسم العالمي)، وهو مستقلب مطلوب للخطوة الأولى في تخليق السفينغوليبيد (الشكل 1c). أظهرت قياسات الكروماتوغرافيا السائلة المرتبطة بالكتلة المستهدفة (LC-MS) للخلايا البالعة التي تفتقر إلى إشارات IL-10 (II1O-KO أو II1Orb-KO) وجود المزيد من السفينغوزين الكلي والموسوم بالنظائر مقارنةً بالتحكمات من النوع البري (الشكل 1f والشكل الممتد 1h)، مما يشير إلى أن زيادة تخليق السيراميد de novo تساهم في التراكم الشاذ للسيراميدات التي لوحظت في الخلايا البالعة التي تفتقر إلى إشارات IL-10.
قمنا بعد ذلك باختبار ما إذا كانت تراكم السيراميدات يساهم في برنامج التعبير الجيني الالتهابي للخلايا البالعة المنشطة بواسطة TLR2. للقيام بذلك، أنشأنا أغشية دهنية تتكون من كوليستيريل-فوسفو كولين، والتي تم تركها فارغة (يشار إليها بـ CholPC) أو معقدة مع سيراميد 16:0 (Cer16:0، وهو السيراميد طويل السلسلة الأكثر وفرة) أو سيراميد 24:0 (Cer24:0، وهو السيراميد الأكثر وفرة من نوع VLC) (الشكل التمديدي 1d). كما هو متوقع، فإن المواد الخارجية
الشكل 1 | إشارات IL-10 تنظم استقلاب السفينغوليبيد. أ، تحليل المكونات الرئيسية (PCA) للدهون الفردية التي تم قياسها بواسطة مطياف الكتلة من الخلايا الساذجة أو المنشطة بواسطة TLR2 (تمت معالجة خلايا بون مارrow المستخرجة من الفئران (BMDMs) من النوع البري (Pam3CysK4) و II1O-KO لمدة 48 ساعة. يتم الإشارة إلى النسبة المئوية للتباين الكلي الذي تفسره المكونات الرئيسية الفردية (PC1 و PC2). تم ضبط الإهليلجات التنبؤية عند 95% من الاحتمالية. ). ب، خريطة حرارية لأنواع الدهون الفردية المقاسة بواسطة مطيافية الكتلة بالتسريب المباشر من خلايا بونت مكونة من نخاع العظام (BMDMs) غير المنشطة (العمودان الأيسر) أو خلايا BMDMs المنشطة بواسطة TLR2 (العمودان الأيمن) كما هو موضح في أ. مقاسة حسب الصف (أنواع الدهون). النص المميز يشير إلى*بين BMDMs من النوع البري المنشط بواسطة TLR2 و II10-KO. CE، استرات الكوليسترول؛ Cer، سيراميدات؛ DAG، ثنائي الجليسريدات؛ FFA، الأحماض الدهنية الحرة؛ HCer، سيراميدات هكسوسيل؛ LCer، سيراميدات لاكتوسيل؛ LPC، ليسوفوسفوليديل كولين؛ LPE، ليسوفوسفوليديل إيثانولامين؛ PC، فوسفوليديل كولين؛ PE، فوسفوليديل إيثانولامين؛ SM، سفينغوميلينات؛ TAG، ثلاثي الجليسريدات. ج، مخطط مبسط لتمثيل الدهون السفينغولية. يتم إنتاج السيراميدات من خلال مسار التخليق الجديد في الشبكة الإندوبلازمية. يمكن تعديل السيراميدات بشكل أكبر لإنتاج سيراميدات هكسوسيل ولاكتوسيل (سيراميدات معدلة)، والتي يمكن أن تتحلل مرة أخرى إلى سيراميدات. تعمل السيراميدات ككتل بناء لجميع أنواع السفينغوميلين، والتي يمكن أيضًا أن تتحلل إلى سيراميدات. د، تم قياس إجمالي السيراميدات وأنواع السفينغوميلين بواسطة مطيافية الكتلة من BMDMs المحفزة كما في. e، أنواع السيراميد التي تم قياسها بواسطة مطيافية الكتلة من الحقن المباشر من البلعميات البريتونية المستخرجة من الفئران البرية وفئران II10-KO بعد 48 ساعة من ربط TLR2 (Pam3CysK4 لكل فأر) تم إعطاؤه عن طريق الحقن داخل البطن (تحليل LC-MS للسفينغوزين الكلي والموسوم في خلايا بون مارو المستخرجة من النخاع العظمي (BMDMs) من النوع البري و IIIO-KO المفعلة بواسطة TLR2 لمدة 48 ساعة.تحليل PCR الكمي (qPCR) للتعبير الجيني الالتهابي في خلايا بون مارrow المستخرجة من الفئران (BMDMs) غير المنشطة أو BMDMs المنشطة بواسطة ligand TLR2تم تحفيز الماكروفاجات بواسطة TLR2 مع Pam3CysK4 لمدة 24 ساعة. تم حضن الماكروفاجات المحفزة مع الكوليسترول: الفوسفatidylcholine (cholPC) بمفرده أو مع cholPC المحمّل بـ Cer16:0 أو Cer24:0 أو cholPC بالإضافة إلى الأجسام المضادة المحايدة ضد IL-10R. ) لآخر 20 ساعة من التفعيل ( لكل مجموعة). تم إعطاء جميع الدهون بتركيز نهائي منجميع البيانات هي متوسط النسخ البيولوجيةس.د.اختبار ستودنت غير المتزاوج ذو الذيلين-اختبار). زادت السيراميدات من مستخلصات السفينغوليبيد في مجرى الدم دون تغيير كبير في فئات الدهون الأخرى (الشكل البياني الممتد 2a-d). في البلعميات الساذجة، لم تؤثر الكولينيك فوسفاتيديل كولين أو السيراميدات بمفردها على التعبير الجيني الالتهابي (الشكل البياني الممتد 2e). وبالمثل، لم يؤثر إضافة Cer16:0 إلى البلعميات النمطية البرية المنشطة بواسطة TLR2 على
مقالة
تعبير الجينات الالتهابية. بالمقابل، أدت إضافة Cer24:0 إلى زيادة تعبير الجينات الالتهابية إلى مستويات مشابهة لتلك التي لوحظت في غياب إشارات IL-10/IL-10R (الشكل 1g)، دون التأثير على بقاء البلعميات (الشكل التمديدي 2f). كما أدت إضافة Cer22:0، وهو ثاني أكثر السيراميدات طويلة السلسلة وفرة (الشكل التمديدي 1d)، إلى تحفيز تعبير الجينات الالتهابية بشكل مشابه لذلك الناتج عن إضافة Cer24:0 (الشكل التمديدي 2g,h). معًا، تشير هذه البيانات إلى أن تراكم السيراميدات طويلة السلسلة يمكن أن يعزز تعبير الجينات الخاصة بالسيتوكينات والكيموكينات في البلعميات المنشطة بواسطة TLR، وتقترح أن عدم تنظيم توازن السيراميدات طويلة السلسلة يساهم في تفاقم الالتهاب الملحوظ في نقص IL-10.
فقدان سيراميدات VLC يحد من الالتهاب
يتم تحديد طول ذيل الأسيلي المتغير (الشكل البياني 1ب) المدمج في السيراميدات خلال التخليق الجديد بواسطة سينثاز السيراميد (CerS) (الشكل 1ج). في الفئران والبشر، هناك ستة سينثازات سيراميد (CerS1-6 (المعروفة أيضًا باسم Lass1-6)). أظهرت بيانات تسلسل RNA (RNA-seq) من البلعميات من النوع البري غير المنشطة وTLR2 المنشطة (المطابقة لمجموعة بيانات الدهون؛ تم إعداد الخلايا وتحفيزها في نفس الوقت مع الخلايا من تجارب الدهون في الشكل 1 ولكن تم جمعها بعد 24 ساعة من تنشيط TLR2) أن BMDMs تعبر بشكل كبير عن Cers2 وCers5 وCers6 (الشكل البياني 3أ). في أنواع الخلايا غير المناعية، يُبلغ عن أن CerS 2 ينظم تخليق السيراميدات VLC Cer20:0-Cer26:0.لتحديد ما إذا كان CerS2 ينظم السيراميدات ذات السلاسل الطويلة جدًا في البلعميات، قمنا بإنشاء فئران Cers2-KO وأجرينا تحليل الدهون على بلعميات نخاع العظام من الفئران المعدلة وراثيًا والفئران الضابطة. بما يتماشى مع الدراسات في الخلايا غير المناعية، تحتوي بلعميات Cers2-KO على مستويات شبه غير قابلة للاكتشاف من السيراميدات ذات السلاسل الأطول من 20 كربونًا (الشكل 3b من البيانات الموسعة)، مما يؤدي إلى انخفاض صافي في إجمالي السيراميدات (الشكل 3c من البيانات الموسعة). وبناءً عليه، أدى فقدان CerS2 إلى تقليل كبير في كمية أنواع السفينغوميلين ذات السلاسل الطويلة جدًا (الشكل 3d من البيانات الموسعة). وبالتالي، فإن فقدان CerS2 في البلعميات المنشطة بواسطة TLR2 يعطل توازن السيراميد والسفينغوميلين ذو السلاسل الطويلة جدًا.
لتحديد ما إذا كانت CerS2 ومنتجاتها من السفينغوليبيد مهمة للالتهاب، قمنا بإنتاج خلايا بونت مكونة من نخاع العظام من الفئران البرية والفئران المعدلة وراثيًا Cers2-KO وقمنا بتنشيطها باستخدام ربيطة TLR2. بينما أظهرت البلعميات الهجينة Cers2 تعبيرًا جينيًا التهابيًا مشابهًا لنظرائها من النوع البري (الشكل التمديدي 3e)، أظهرت البلعميات Cers2-KO انخفاضًا كبيرًا في التعبير الجيني الالتهابي استجابةً لربيطات TLR2 (الشكل 2a) ولم تحفز بالكامل التعبير الجيني الالتهابي خلال حجب IL-10R (الشكل التمديدي 3f). وهذا يشير إلى أن وظيفة CerS2 مهمة لالتهاب البلعميات المدفوع بـ TLR2 بمفرده أو في سياق نقص IL-10. تماشيًا مع هذه الفكرة، أدى فقدان CerS2 في الخلفية التي تفتقر إلى IL-10R إلى تقليل كبير في التعبير الجيني الالتهابي للبلعميات استجابةً لـ TLR2 (الشكل 2b والشكل التمديدي 3g) وربيطات TLR4 (الشكل التمديدي 3h). ومن الجدير بالذكر أن إضافة Cer24:0 الخارجي، وليس Cer16:0، أعادت الالتهاب في البلعميات Il1Orb/Cers2-DKO (الشكل 2b والشكل التمديدي 3g)، مما يشير إلى أن تراكم السيراميدات ذات السلسلة الطويلة جدًا، وهي المنتجات الدهنية لـ CerS2، مهمة لتوسط زيادة التعبير الجيني الالتهابي في البلعميات التي تفتقر إلى IL-10.
نظرًا لأن فقدان CerS2 قلل من تعبير الجينات الالتهابية في البلعميات التي تفتقر إلى IL-10R، افترضنا أن CerS2 قد يكون مهمًا في تنظيم الالتهاب القولوني الذي يعد سمة مميزة لفئران II1O-KO أو II1Orb-KO.لقد لاحظنا أن الفئران التي تعاني من نقص جين Cers2 (Cers2-KO) والفئران التي تعاني من نقص مزدوج في جين Cers2 وجين Il1Orb (DKO) كانت صغيرة في القامة، وتعاني من نوبات صرع عفوية، وغالبًا ما تموت قبل بلوغ 10 أسابيع من العمر في مستعمرتنا. وهذا يتماشى مع الأنماط الظاهرية التي نشرتها مجموعات أخرى والتي تظهر أن حذف جين Cers2 في الجسم الحي يؤدي إلى عيوب في إنتاج غلاف المايلين ونوبات صرع عفوية.لتجنب التعقيدات الناتجة عن هذه القضايا النظامية، قمنا بإنشاء كيميرات من نخاع العظم من CD45.2إل1أورب(تحكم) الفئران، وفئران Il1Orb-KO، وفئران Il1Orb/Cers2-DKO من نفس السلالة إلى CD45.1المستلمين. كانت التغيرات الميكروبية
الشكل 2 | التثبيط الجيني لتخليق السيراميد عالي السلسلة يحد من الالتهاب. أ، تحليل qPCR للتعبير الجيني الالتهابي في 48 ساعة من تنشيط TLR2
تم تقليلها بواسطة تربية الفئران الهجينة فيتم نقل فرشة القفص بالتساوي بين الأقفاص كل أسبوعين. بعد 10 أسابيع من الزرع، تم جمع عينات البراز من الفئران الهجينة لقياس الليبوكالين، وهو علامة نموذجية للالتهاب القولوني.في هذه المرحلة الزمنية، لم نلاحظ أي علامات واضحة على التهاب القولون (على سبيل المثال، هبوط المستقيم أو فقدان الوزن؛ البيانات غير معروضة). ومع ذلك، يتماشى ذلك مع الدراسات السابقة على الفئران المعدلة وراثياً Il1O-KO و Il1Orb-KO.كانت الفئران الهجينة Il1Orb-KO تحتوي على مستويات أعلى بشكل ملحوظ من الليبوكالين البرازي مقارنة بالفئران الضابطة (الشكل 3i من البيانات الموسعة). ومن الجدير بالذكر أن الفئران الهجينة Il1Orb/Cers2-DKO كانت تحتوي على مستويات منخفضة من الليبوكالين البرازي مقارنة بالفئران الهجينة IL-10R KO في كل من الفئران الذكور والإناث (الشكل 3i من البيانات الموسعة والبيانات غير المعروضة). لفحص أهمية CerS2 في الجسم الحي بشكل أكبر، قمنا بجمع أنسجة القولون من الفئران الهجينة، وعزلنا الخلايا المناعية من الغشاء المخاطي للقولون وقمنا بتقييم تجمعات الخلايا باستخدام تقنية تدفق الخلايا (لإستراتيجيات التصفية، انظر الشكل التكميلية 1). يتماشى ذلك مع الدراسات السابقة.كانت الكيميرات التي تعاني من نقص IL1Orb تحتوي على زيادة في تسرب الخلايا الالتهابية، بما في ذلك البلعميات، الأحادية، العدلات، وإجمالي CD4خلايا T (IFN ) و (IL-17A ) خلايا (الشكل 2c والشكل الإضافي 4a). بشكل ملحوظ، أدى فقدان CerS2 في الخلفية التي تفتقر إلى IL-10R إلى تقليل تسرب خلايا المناعة مقارنةً بالهجين Il1Orb-KO (الشكل 2c والشكل الإضافي 4a)، مما يشير إلى أن تخليق السيراميدات ذات السلسلة الطويلة جداً مهم لدفع التهاب القولون الذي تسببه خلايا المناعة في غياب إشارات IL-10.
لفهم كيفية تأثير CerS2 على توازن القولون بشكل أفضل، قمنا بإنشاء فئران هجينة من النوع البري وفئران هجينة ذات نقص جيني في Cers2. تم تربية هذه الفئران الهجينة معًا لمدة 12 أسبوعًا، ثم تم تحليل تجمعات الخلايا المناعية في الغشاء المخاطي للقولون. في هذا النموذج، لا توجد عوامل واضحة تسبب الالتهاب (مثل فقدان IL-10R)، مما يمكننا من تحديد ما إذا كان CerS2 مهمًا لتوازن الخلايا المناعية الطبيعية في القولون. ومن الجدير بالذكر أننا لم نجد أي انخفاض في عدد وحيدات النوى، أو العدلات، أو إجمالي خلايا CD4 T.خلايا T CD4خلايا T CD4 في الغشاء المخاطي للقولون في الفئران الهجينة Cers2-KO مقارنة بالتحكمات من النوع البري (الشكل 4b من البيانات الموسعة). ومع ذلك، أظهرت الفئران الهجينة Cers2-KO انخفاضًا في عدد البلعميات.والمكروفاجات الناضجة(الشكل 2د)، مما يشير إلى أنه في ظل الظروف الأساسية، يعتبر CerS2 مهمًا للحفاظ على تجمعات البلعميات القولونية. يتم تجديد البلعميات القولونية باستمرار في ‘شلال البلعميات’، حيث تهاجر الكريات البيضاء الدموية إلى القولون، وتكتسب CD11c وMHCII وأخيرًا CD64 (المشفر بواسطة Fcgr1)، وتصبح أكثر استجابة لإشارات TLR، قبل أن تصبح ‘تحملية’ للحفاظ على التوازن في القولون. مع تجدد البلعميات، تنضج بلعميات جديدة لإعادة توطين القولون. لتحديد كيف أثر فقدان CerS2 على توازن البلعميات في الجسم الحي، قمنا بفرز CD45تم عزل خلايا المناعة من الفئران الهجينة III1Orb-KO أو Il1Orb/Cers2-DKO وتم إجراء تحليل النسخ الجيني على مستوى الخلية الواحدة على البلعميات. أظهر تحليل تقريب وتوقع متعدد الأبعاد (UMAP) أن البلعميات القولونية المعزولة من الفئران الهجينة Il1Orb-KO تجمعت في خمسة تجمعات متميزة، حيث احتوت التجمع 5 على خلايا التهابية عالية (الشكل 2e، f والشكل التمديدي 4c). ومن الجدير بالذكر أن الفئران الهجينة Il1Orb/Cers2-DKO كانت تفتقر إلى التجمع 5 وكان لديها تعبير منخفض لمؤشرات البلعميات الالتهابية، السيتوكينات والكيموكينات مقارنة بالفئران الهجينة Il1Orb-KO (الشكل 2e، f والشكل التمديدي 4c، d). ومن الجدير بالذكر أن البلعميات التي تفتقر إلى CerS2 أظهرت تعبيرًا عاليًا عن CD206 (المشفر بواسطة Mrc1) ومؤشرات أخرى موجهة نحو التحمل، مما يشير إلى أن فقدان CerS2 قد يعزز نمط ظاهري للبلعميات أكثر تحملاً.بالمقارنة مع فقدان IL-10R وحده (الشكل 4e، f من البيانات الموسعة). معًا، تشير هذه البيانات إلى أن فقدان CerS2 في خلفية نقص IL-10R يمكن أن يخفف من تسرب خلايا المناعة إلى القولون ويقلل من تعبير الجينات الالتهابية للبلاعم في الجسم مقارنة بفقدان IL-10R وحده.
تحديد تخليق MUFA لإنتاج السيراميد
لفهم أفضل لكيفية تنظيم تخليق السيراميد في خلايا II10-KO، قمنا بفحص جميع الجينات المعروفة المطلوبة لتمثيل الشحميات السفينغولية من مجموعة بيانات RNA-seq الخاصة بالدهون المتطابقة لدينا (الشكل التمديدي 5a). على الرغم من أننا لم نجد أي اختلاف في مستويات mRNA لجينات الشحميات السفينغولية عبر النمط الجيني أو حالة التنشيط، لاحظنا أن تعبير stearoyl-CoA desaturase 2 (Scd2) قد انخفض بشكل ملحوظ في BMDMs من نوع Il1O-KO (الشكل 3a والشكل التمديدي 5a، الصف السفلي). SCD2 هو جزء من عائلة SCD (SCD1-4) من9-ديستراتازات المسؤولة عن تخليق الأحماض الدهنية غير المشبعة الأحادية من الأحماض الدهنية المشبعة طويلة السلسلةعلى سبيل المثال، تقوم الأحماض الدهنية المشبعة بتحويل حمض الستاريك المشبع (المشار إليه بـ 18:0) إلى حمض الأوليك الأحادي غير المشبع (المشار إليه بـ 18:1). وقد تم ربط الأحماض الدهنية الأحادية غير المشبعة بالالتهابات وتوازن السفينغوليبيد.لكن الآليات المباشرة لتنظيم هذه المسارات بواسطة تشبع الأحماض الدهنية لا تزال غير واضحة. وجدت دراساتنا السابقة أن نشاط إنزيم SCD ينظم الالتهاب في مرحلة ما بعد تنشيط TLR. ، مما يقودنا إلى افتراض أن تغيير تخليق الأحماض الدهنية الأحادية غير المشبعة قد يربط بين الالتهاب وتخليق السيراميد في البلعميات التي تفتقر إلى IL-10. لتحديد ما إذا كان الانخفاض في تمت ملاحظة تعبير الجينات في البلعميات المفقودة IL10 وكان كافياً لتغيير تخليق MUFA الجديد، قمنا بإجراء تحليل تتبع النظائر المستقرة على البلعميات التي تم تغذيتها-الجلوكوز لمدة 48 ساعة مع أو بدون تنشيط TLR2. وفقًا لعملنا السابق، وجدنا أن تحفيز TLR2 زاد من تكوين الدهون الجديد في BMDMs من النوع البري مما أدى إلى زيادة في كل من 18:1 المُصنَّعة والإجمالية (الشكل 3b). لم تتمكن البلعميات التي تفتقر إلى IL-10 من تحقيق ذلك بالكامل.
الشكل 3 | تخليق الأحماض الدهنية الأحادية غير المشبعة المستحث بواسطة IL-10 يقيّد إنتاج السيراميد. أ، تحليل qPCR للتعبير الجيني لجين Scd2 في خلايا BMDMs البرية أو خلايا BMDMs KO لـ IL-10 التي تم تنشيطها بواسطة TLR2 لمدة 24 ساعة..ب، تم تصنيع وإجمالي حمض الأوليك (18:1) من خلايا بون مارrow المستخرجة من الفئران البرية غير المنشطة أو المنشطة بواسطة TLR2 لمدة 48 ساعة أو خلايا II1O-KO.تحليل qPCR لـ و تعبير الجينات في خلايا بونت مكونة من نخاع العظام من النوع البري أو خلايا Il10-KO المنشطة بواسطة TLR2 لمدة 48 ساعة والمحضرة مع BSA، أو BSA-16:0، BSA-18:1، BSA-18:2 أو BSA-24:1 للأخيرأنواع السيراميد المشبعة وغير المشبعة من خلايا بون مارrow المستخرجة من الفئران البرية أو الفئران المعدلة وراثياً (Il10-KO) المعالجة بعد 48 ساعة من تنشيط TLR2للأخيرةإجمالي أنواع السيراميدات في LysM-cre غير الناضجة أو المنشطة بواسطة TLR2بروتينات بون دموية وحيدة النواة من النوع البري و Scd2-cKOتحليل qPCR للتعبير الجيني عن Cxcl1 و Cxcl2 و Il6 في خلايا مفعلة بواسطة TLR2 لمدة 48 ساعةبروتينات بومب BMDMs من النوع البري تم تحضينها مع BSA، وBMDMs من النوع Scd2-cKO تم تحضينها مع BSA، وBMDMs من النوع Scd2-cKO تم تحضينها مع BSA-18:1، BSA-18:2 أو BSA-24:1 للأخيرتحليل اختبار الامتصاص المناعي المرتبط بالإنزيم (ELISA) لليبوكالين البرازي لفئران ذكور التحكم وScd2-cKO).h، تحليل خلايا المناعة المستند إلى قياس التدفق من الغشاء المخاطي القولوني من ذكور الفئران الضابطة السليمة وScd2-cKO ( ) . i ، فقدان الوزن الناتج عن DSS في إناث الفئران الضابطة و Scd2 – cKO ( البيانات هي المتوسط توصيف خلايا المناعة المستند إلى قياس التدفق الخلوي من الغشاء المخاطي القولوني لفئران ذكرية متغايرة الزيجوت Il1Orb (Het) التي تم تغذيتها بـ BSA وفئران ذكرية KO من Il1Orb التي تم تغذيتها بـ BSA أو BSA-24:1).تحليل ELISA لـ IL-6 و IL-12في زراعة القولون من فئران Il1Orb-هتيروزيجوس التي تم تغذيتها بـ BSA وفئران Il1Orb-KO الذكور التي تم تغذيتها بـ BSA أو BSA-24:1، تم حضنها خارج الجسم لمدةجميع التجارب مُبلغ عنها كمتوسط النسخ البيولوجية.س.د. ما لم يُذكر خلاف ذلك. ، اختبار ستودنت غير المتزاوج ذو الذيلين-اختبار).
زيادة تخليق الأحماض الدهنية الأحادية غير المشبعة (MUFA) بعد مستقبلات TLR2، مما أدى إلى تقليل مخزونات الأحماض الدهنية المصنعة والإجمالية 18:1 بعد 48 ساعة من التحفيز (الشكل 3ب). بالمقابل، لم يتغير تخليق حمض البالمتيك (16:0) ولم تنخفض الكميات الإجمالية للخلايا من حمض البالمتيك وحمض اللينوليك (18:2)، وهو حمض دهني متعدد غير مشبع مستورد (البيانات الموسعة الشكل 5ب، ج). لتحديد ما إذا كان تغير محتوى MUFA في خلايا BMDMs من نوع II10-KO مهمًا للالتهاب، قمنا بتنشيط خلايا BMDMs من النوع البري وII10-KO وIl1Orb-KO باستخدام ربيطة TLR2 لمدة 48 ساعة وأضفنا أنواعًا مختلفة من الأحماض الدهنية الحرة المرتبطة بالألبومين البقري (BSA) خلال الـ 44 ساعة الأخيرة. أدت إضافة 18:1، التي زادت إجمالي 18:1 بحوالي الضعف (البيانات الموسعة الشكل 5د)، إلى تقليل الجينات الالتهابية. تعبير في خلايا بون الدم المستخرجة من نخاع العظام (BMDMs) الخاصة بـ Il10-KO أو Il1Orb-KO (الشكل 3c والشكل الإضافي 5e). علاوة على ذلك، فإن إضافة 24:1 (حمض النيرفونيك)، وهو منتج إطالة لـ 18:1، قللت أيضًا من تعبير الجينات الالتهابية في خلايا BMDMs الخاصة بـ Il10-KO، في حين أن 16:0 و 18:2 لم تفعل ذلك (الشكل 3c والشكل الإضافي 5e).
لاختبار ما إذا كان تغيير محتوى الأحماض الدهنية الأحادية غير المشبعة في البلعميات التي تفتقر إلى IL-10 يؤثر على التدفق إلى مسار تخليق السفينغوليبيد الجديد، قمنا بتنشيط البلعميات المستمدة من نخاع العظام من النوع البري و Il1Orb-KO باستخدام ربيطات TLR2 في وسط يحتوي على U- ج N-سيرين مع BSA أو BSA-18:1. من الجدير بالذكر أن إضافة 18:1 خارجي يمكن أن تخفف من زيادة U--إدماج السيرين في السفينغينين في ماكروفاجات Il1Orb-KO (الشكل البياني الممتد 5f). بعد ذلك، قمنا بإجراء تحليل الدهون الشامل لفحص كيف أثر تجديد 18:1 في ماكروفاجات BMDMs II10-KO على توازن السيراميد. وجدنا أن إضافة 18:1 لم تقلل من وفرة السيراميد الكلي في ماكروفاجات Il10-KO (الشكل البياني الممتد 5g)، ومع ذلك، فقد خفضت بشكل كبير مستويات السيراميدات المشبعة ذات السلسلة الطويلة جدًا، بما في ذلك Cer24:0 (الشكل 3d والشكل البياني الممتد 5h). ومن الجدير بالذكر أن إضافة 18:1 زادت من كمية Cer24:1 والسيراميدات الأحادية غير المشبعة الكلية (الشكل 3d والشكل البياني الممتد 5h). بناءً على هذه النتيجة، اختبرنا ما إذا كانت السيراميدات المشبعة وغير المشبعة ذات السلسلة الطويلة جدًا مسؤولة بشكل متساوٍ عن زيادة الالتهاب. على عكس Cer24:0، لم تعزز Cer24:1 الخارجية التعبير الجيني الالتهابي في الماكروفاجات (الشكل البياني الممتد 5i)، مما يشير إلى أن السيراميدات المشبعة ذات السلسلة الطويلة جدًا فقط يمكن أن تحفز نمط الالتهاب.
بعد ذلك، سعينا لتحديد ما إذا كانت تخليق السيراميد يتأثر بتخليق الأحماض الدهنية الأحادية غير المشبعة de novo في البلعميات. تماشيًا مع بيانات Il10-KO لدينا، وجدنا أن التثبيط الدوائي الحاد لـ SCDs (المشار إليه بـ SCDi) زاد من تعبير الجينات الالتهابية، والإجمالي الكلي للسيراميدات وجميع أنواع السيراميد (الشكل التمديدي 5j-1). مشابهًا لحذف IL-10، يمكن التخفيف من الزيادة الملحوظة في تعبير الجينات الالتهابية الناتجة عن SCDi من خلال إضافة 18:1 (الشكل التمديدي 5j). بالإضافة إلى ذلك، منعت 18:1 الخارجية تراكم جميع السيراميدات المشبعة ذات السلسلة الطويلة في البلعميات المعالجة بـ SCDi (الشكل التمديدي 5k,l). ومن الجدير بالذكر أن إضافة 18:1 الخارجية لم تغير أنواع السيراميدات ذات السلسلة الطويلة مع ذيول أحادية غير مشبعة (حيث كانت Cer24:1 هي النوع غير المشبع الأكثر هيمنة) (الشكل التمديدي 5k,l). وبالتالي، يبدو أن نشاط SCD وحجم مجموعة 18:1 ينظمان بشكل محدد كميات السيراميدات المشبعة ذات السلسلة الطويلة.
الحذف الجيني لـ Scd2 يؤدي إلى وفاة الأجنة في الفئرانلتحديد تأثير SCD2 على الالتهاب في الجسم الحي، قمنا بإنشاءفئران وعبّرناها إلى LysM-creتم إنشاء فئران مع حذف محدد لنوع النخاع العظمي لـ SCD2 (المشار إليه بـ Scd2-cKO). على غرار BMDMs II10-KO، أظهرت BMDMs Scd2-cKO انخفاضًا مشابهًا في 18:1 المُصنَّعة والإجمالية، دون التأثير على 16:0 المُصنَّعة، والإجمالية 16:0 والإجمالية 18:2 من الأنواع الدهنية (الشكل التمديدي 6a، b). ومن الجدير بالذكر أن البلعميات Scd2-cKO أظهرت زيادة في تصنيع السفينغينين (الشكل التمديدي 6c) وتراكم السيراميدات طويلة السلسلة المشبعة (الشكل 3e والشكل التمديدي 6d)، مشابهة لـ Il1O-KOs. وبالمثل، لاحظنا زيادة في تعبير الجينات الالتهابية في البلعميات Scd2-cKO استجابةً لتنشيط TLR2، والتي يمكن تقليلها بإضافة 18:1 أو 24:1، ولكن ليس 18:2 (الشكل 3f). للتحقق مما إذا كانت السيراميدات مهمة لتعزيز تعبير الجينات الالتهابية، عالجنا BMDMs Scd2-cKO المنشطة بواسطة TLR2 مع الميرياسين، وهو مثبط لوحدة قاعدة السلسلة الطويلة من ناقل بالميتويل السيرين 2 (SPTLC2). أدى علاج الميرياسين إلى تقليل مستويات السفينغينين (الشكل التمديدي 6e)، وأنتج انخفاضًا متجهًا في Cer24:0 (الشكل التمديدي 6f)، وقلل من بعض تعبير الجينات الالتهابية دون التأثير على حيوية الخلايا (الشكل التمديدي 6g والبيانات غير المعروضة). تشير هذه البيانات إلى أن التدفق إلى مسار تخليق السيراميد de novo مهم للظواهر الالتهابية في البلعميات التي تفتقر إلى SCD2. معًا، تشير هذه النتائج إلى أن عدم القدرة على زيادة تصنيع MUFA هو سبب رئيسي لتراكم السيراميدات المشبعة وزيادة الالتهاب في نقص IL-10.
تماشيًا مع بياناتنا في المختبر، أظهرت الفئران المعدلة وراثيًا Scd2-cKO ارتفاعًا أساسيًا في الليبوكالين البرازي مقارنة بالفئران المرباة معًا.رفيق القمامة التحكم (الشكل 3g). بالإضافة إلى ذلك، كان هناك زيادة في عدد البلعميات في القولون لدى فئران Scd2-cKO، دون وجود فرق في أعداد العدلات أو المونوسيتات (الشكل 3h والشكل التمديدي 7a؛ لاستراتيجية التصفية، انظر الشكل التوضيحي 2). كما كان لدى فئران Scd2-cKO زيادة في أعداد IFNو IL-17ACD4تظهر خلايا T (الشكل 3h) أن تعبير SCD2 المحدد لنوع النخاع يؤثر على تنشيط خلايا T في القولون. دعمًا لهذه الفكرة، أنتجت عينات القولون المستخرجة من الفئران Scd2-cKO كميات أكبر من IL-12p40 القابلة للذوبان مقارنةً بالأنسجة المجمعة من الفئران المشتركة.تحكمات الأشقاء (الشكل 7b من البيانات الموسعة). افترضنا أن الالتهاب القاعدي المتزايد الموجود في فئران Scd2-cKO قد يجعل هذه الفئران عرضة لنماذج التهاب القولون الناتج عن المواد الكيميائية، مثل كبريتات الصوديوم الدكستران (DSS). مشابهة للدراسات المنشورة سابقًا في فئران ناقصة IL-10.وجدنا أن الفئران المعالجة بـ DSS من نوع Scd2-cKO فقدت وزنًا أكبر بكثير من الفئران المتقاربة في السكن.فئران التحكم، وكان لديها أعداد متزايدة بشكل ملحوظ من الخلايا المناعية المايلويدية واللمفاوية المتسللة في الغشاء المخاطي للقولون (الشكل 3i والشكل الإضافي 7c). كانت فئران SCD2 الهجينة الشرطية تحمل نمط ظاهري وسيط استجابةً لالتهاب القولون الناتج عن DSS (الشكل الإضافي 7d). باختصار، الأنماط الظاهرية التي لوحظت في البلعميات الناقصة لـ SCD2 والفئران تعيد تجسيد الأنماط الظاهرية في البلعميات والفئران التي تفتقر إلى إشارات IL-10.
“نظرًا لأن الأحماض الدهنية الأحادية غير المشبعة الخارجية يمكن أن تحد من الالتهاب في البلعميات التي تفتقر إلى IL-10، وأن فقدان SCD2 المحدد لنوع النخاع أدى إلى زيادة الالتهاب القولوني، فقد افترضنا أن الأحماض الدهنية الأحادية غير المشبعة الخارجية يمكن أن تقلل من الالتهاب القولوني في الفئران II1O-KO أو Il1Orb-KO. لاختبار ذلك، بدأنا بمجموعتين من الفئران Il1Orb-KO ومجموعتين من الفئران Il10-KO التي كانت لديها مستويات مشابهة من الالتهاب القولوني، كما تم قياسه من خلال محتوى الليبوكالين في البراز (الشكل التمديدي 7e، f). لكل نوع جيني، تم تغذية مجموعة من الفئران عن طريق الفم ببروتين BSA، وهو البروتين الحامل المستخدم لإذابة الأحماض الدهنية الحرة، أو مع BSA المرتبط بـ 18:1 أو 24:1. تم تغذية الفئران لمدة 14 يومًا قبل جمع الأنسجة القولونية لتحليل خلايا المناعة وإفراز السيتوكينات. بشكل ملحوظ، أدى تغذية MUFA إلى تقليل الليبوكالين في البراز بشكل كبير مقارنةً بـ BSA وحده (الشكل التمديدي 7f). علاوة على ذلك، قلل تغذية MUFA من تجمعات خلايا المناعة النخاعية واللمفاوية في القولون وقلل من إفراز IL-6 وIL-12p40 من الأنسجة القولونية (الشكل 3j، k والشكل التمديدي 7g، h)، بمستويات مشابهة لتلك الناتجة عن إزالة CerS2 (الشكل 2c والشكل التمديدي 5a). على العكس من ذلك، لم يؤثر تغذية 16:0 على تسلل خلايا النخاع في الفئران من النوع البري أو الفئران Il1Orb-KO (الشكل التمديدي 7i). تدعم هذه البيانات معًا الفكرة القائلة بأن زيادة تصنيع MUFA في البلعميات تعمل كآلية تغذية راجعة سلبية في مجرى إشارة IL-10 لتقليل الالتهاب، وأن توفر MUFA في البلعميات له دور مهم في التحكم في الالت
السيراميدات VLC لا تنشط الانفلامازوم
بعد ذلك، سعينا لتحديد الآلية التي من خلالها تعزز السيراميدات ذات السلسلة الطويلة الالتهاب. وقد اقترحت الدراسات السابقة أن إنزيم NLRP3 قد يكون مهمًا في الأمراض الناتجة عن السيراميد في الأنسجة الدهنية.لاختبار ما إذا كانت السيراميدات VLC قد حفزت تنشيط الإنفلامسوم، قمنا بإجراء اختبارات ELISA للكشف عن IL-1 المقسوم.في السائل فوق الطاف للمكروفاجات المعالجة بالسيراميدات ذات السلسلة الطويلة جدًا. على الرغم من زيادة مستويات mRNA لـ IL-1β استجابةً للسيراميدات ذات السلسلة الطويلة جدًا (الشكل 1g)، لم يُحدث كل من Cer22:0 أو Cer24:0 IL-1.الانقسام والإفراز، على عكس التحفيز القوي لـ IL-1الانقسام والإفراز الناتج عن علاج النيجيريسين (الشكل 8a من البيانات الموسعة). علاوة على ذلك، لم يؤثر فقدان نشاط NLRP3 على تعزيز التعبير الجيني الالتهابي الناتج عن VLC سيراميد في خلايا BMDMs (الشكل 8b من البيانات الموسعة)، مما يشير إلى أن inflammasome NLRP3 غير متورط في الالتهاب الناتج عن السيراميد في هذا النظام. هذه الملاحظات تتماشى مع البيانات المنشورة سابقًا التي تشير إلى أن توليد السيراميد de novo ليس مطلوبًا لتفعيل inflammasome NLRP3..
REL مطلوب للالتهاب الناتج عن السيراميد
يُعتبر على نطاق واسع أن إشارات IL-10 تعمل على مستوى النسخ لقمع التعبير الجيني الالتهابي؛ ومع ذلك، فإن الخطوات الدقيقة التي تحكم هذه العملية لا تزال غير واضحة.متسقًا مع هذه الفكرة، لاحظنا مستويات نووية مرتفعة من NF-кعوامل النسخ العائلية REL (المعروفة أيضًا باسم cRel) وRELA (المعروفة أيضًا باسم p65) فقط في النقاط الزمنية المتأخرة (24 و48 ساعة) بعد تنشيط TLR2 في البلعميات II10-KO، دون تغييرات في النقل النووي لعوامل النسخ الأولية (الشكل البياني الممتد 8c) أو IкB.أنماط الانحلال وإعادة التراكم (الشكل البياني الممتد 8d). هذا قادنا إلى افتراض أن زيادة السيراميدات ذات السلسلة الطويلة جدًا قد تلعب دورًا فقط في الاستجابات الالتهابية في المراحل المتأخرة التي تتميز بنقص IL-10. لاختبار هذه الفكرة، قمنا بمعالجة BMDMs مسبقًا بـ cholPC أو Cer24:0 لمدة 48 ساعة، تلتها تحفيز قصير لمدة ساعة واحدة بواسطة TLR2. تم مقارنة أنماط التعبير الجيني الالتهابي للخلايا المعالجة مسبقًا بالدهون مع BMDMs التي تم تنشيطها بواسطة ربيطات TLR2 لمدة 48 ساعة ومع Cer24:0 الخارجي خلال آخر 44 ساعة من التنشيط (كما في تجاربنا السابقة). لم تؤثر المعالجة المسبقة بـ Cer24:0 على التحفيز المبكر للجينات الالتهابية، ولكنها أدت إلى تعبير مطول في نقاط زمنية لاحقة (الشكل 4a). كما وجدنا أن معالجة Cer24:0، ولكن ليس معالجة Cer16:0، أدت إلى زيادة في REL و RELA النووي بعد 24 ساعة و 48 ساعة من تنشيط TLR2 (الشكل 4b والشكل البياني الممتد 8e)، دون التأثير على الكميات الكلية للخلايا. (الشكل 8f من البيانات الموسعة)، REL أو RELA (الشكل 8f,g من البيانات الموسعة)، مشابهة للنتائج الناتجة عن نقص IL-10 (الشكل 8c-e من البيانات الموسعة).
RELA و REL هما عوامل نسخ مرتبطة يمكن أن تتشكل كديمرات ذاتية مع نفسها أو كديمرات غير ذاتية مع بعضها البعض لتحفيز التعبير الجيني الالتهابي.RELA مطلوب تمامًا للتفعيل الأولي للسيتوكينات الكيميائية والكيماويات في البلعميات المنشطة وغيرها من الخلايا المناعية وغير المناعية.يُعتقد أن REL له دور أكثر محدودية في الالتهاب، حيث إن التحفيز المعتمد على TLR لجينات Il12a وIl12b يعتمد بشكل كبير على REL في الخلايا النخاعية.لقد لاحظنا عدم تنظيم IL12 وإل12 في معظم تجاربنا في المختبر وفي الجسم الحي، مما يقودنا إلى افتراض أن السيراميدات المشبعة ذات السلسلة الطويلة جداً (مثل Cer24:0) تؤثر على الالتهاب من خلال تعديل نشاط REL بشكل محدد. تماشياً مع هذه الفكرة، أظهرت خلايا بونت مونوكليار المستخرجة من نخاع العظام (BMDMs) التي تفتقر إلى REL تعبيرًا منخفضًا عن الجينات الالتهابية استجابةً للسيراميدات ذات السلسلة الطويلة جداً عند تنشيطها بواسطة لجنات TLR2 أو TLR4 (الشكل 4c والشكل الإضافي 8h). بشكل ملحوظ، لم تتغير مستويات السيراميد الداخلية وامتصاص السيراميد الخارجي بسبب نقص REL، مما يشير إلى أن REL يقع في مجرى الالتهاب الناتج عن السيراميد (الشكل الإضافي 8i، j). بشكل ملحوظ، وجدنا أن فقدان REL ألغى تحفيز RELA بواسطة Cer24:0 (الشكل 4d والشكل الإضافي 8g)، مما يشير إلى أن حجم مجموعة السيراميدات ذات السلسلة الطويلة جداً قد ينظم REL بشكل مباشر، وأن زيادة توطين RELA في النواة تعتمد إما على التزاوج مع REL أو يتم توجيهها بواسطة إشارات في مجرى تنشيط REL.
في الدراسات التكميلية، وجدنا أن تحفيز الجينات الالتهابية بواسطة SCDi يعتمد على REL (الشكل 4e)، وأن علاج SCDi أو الإزالة الشرطية لـ Scd2 يمكن أن يحفز توطين REL في النواة في البلعميات، والذي يمكن التخفيف منه بإضافة 18:1 خارجياً (الشكل 4f والشكل التمديدي 9a). علاوة على ذلك، كان توطين REL في البلعميات Il10-KO أو Il1Orb-KO محدوداً أيضاً بإضافة 18:1 (الشكل 4f) أو 24:1 (الشكل 4g)، في حين كانت التغيرات في توطين RELA أقل تأثراً. معاً، تشير هذه البيانات إلى أن REL له دور أساسي في تحفيز الجينات الالتهابية بواسطة السيراميد طويل السلسلة، وهو المسؤول إلى حد كبير عن الظواهر الالتهابية المعززة الموجودة في الفئران والبلعميات التي تفتقر إلى IL-10 أو MUFA.
نظرًا لدوره في الالتهاب المرتبط بالدهون، افترضنا أن REL قد يكون له دور أوسع في تنظيم الالتهاب مما تم وصفه سابقًا. يتماشى ذلك مع النتائج السابقة.وجدنا أن REL مطلوب لتحفيز تعبير جين Il12b، ولكن ليس لبقية جينات السيتوكين أو الكيموكين، بعد تنشيط TLR2 لمدة ساعة واحدة (الشكل البياني الممتد 9b). ومع ذلك، بعد 48 ساعة، أدى الحذف الجيني لـ Rel في الفئران المعدلة وراثيًا Il10-KO
الشكل 4 | REL مطلوب لتحفيز التعبير الجيني الالتهابي بواسطة السيراميد. أ، تحليل qPCR لتعبير الجينات الالتهابية في خلايا BMDM المعالجة مسبقًا بـ Cer24:0 لمدة 48 ساعة، تليها ساعة واحدة من التنشيط باستخدام ligand TLR2 (Pam3CSK4) مقابل تنشيط TLR2 لمدة 48 ساعة مععلاج Cer24:0تحليل Western blot لـ RELA و REL و TBP (التحكم في التحميل) من مستخلصات نووية من البلعميات البريتونية البرية غير المنشطة أو المنشطة بواسطة TLR2 لمدة 48 ساعة بالإضافة إلى cholPC (العقار) أو Cer16:0 أو Cer24:0 خلال آخر 44 ساعة من التنشيط. تمثل ثلاثة تجارب فردية.تحليل التعبير الجيني الالتهابي في خلايا بون مارrow المستخرجة من الفئران (BMDMs) من النوع البري أو Rel-KO المنشطة بواسطة TLR2 لمدة 48 ساعة بالإضافة إلى cholPC (العقار الوهمي) أو Cer24:0 لآخر 44 ساعة من التفعيل ( ). د، تحليل Western blot لـ RELA و REL و TBP (تحكم التحميل) من مستخلصات نووية من خلايا BMDMs البرية أو المعطلة Rel-KO التي تم تنشيطها بواسطة TLR2 لمدة 48 ساعة بالإضافة إلى cholPC (العقار) أو Cer24:0 لمدة 44 ساعة الأخيرة من التنشيط. تم نقل RELA بالتوازي مع REL و TBP. تمثل تجربتين فرديتين. e، تحليل qPCR للتعبير الجيني الالتهابي في BMDMs من النوع البري أو Rel-KO المنشط بواسطة TLR2 لمدة 48 ساعة مع أو بدون 10 نانومتر SCDi (Cay10566) لمدة 44 ساعة الأخيرة من التنشيط. ). في، مركبة. تحليل البقعة الغربية لـ REL و RELA و TBP (تحكم التحميل) في المستخلصات النووية من خلايا بون مارrow المستمدة من الخلايا المناعية (BMDMs) البرية أو المعطلة II10-KO التي تم تنشيطها بواسطة TLR2 لمدة 48 ساعة بالإضافة إلى SCDi و BSA أو BSA-18:1 لمدة 44 ساعة الأخيرة من التفعيل. تمثيلي لثلاث تجارب فردية. ج، تحليل Western blot لاستخراجات نووية من خلايا BMDMs البرية غير المنشطة أو المنشطة بواسطة TLR2 لمدة 48 ساعة أو Il1Orb-KO بالإضافة إلى BSA أولـ 44 ساعة الأخيرة من التنشيط لـ RELA و REL و TBP (تحكم التحميل). تمثيليتان من تجربتين. جميع التجارب مُبلغ عنها كمتوسط النسخ البيولوجية.س.د.اختبار ستودنت غير المتزاوج ذو الذيلين-اختبار).
(فئران Il1O/Rel-DKO) ألغت تمامًا التعبير الجيني الالتهابي المعزز إلى مستويات النوع البري (الشكل 9c من البيانات الموسعة)، مما يشير إلى أن REL ضروري للتعبير الجيني الالتهابي في المراحل المتأخرة في البلعميات Il10-KO. علاوة على ذلك، كان REL مطلوبًا للتحفيز الكامل للتعبير الجيني الالتهابي استجابةً لتحييد IL-10R بمفرده وبالاشتراك مع إضافة Cer24:0 (الشكل 9d من البيانات الموسعة) بعد 48 ساعة من تنشيط TLR2، مما يدعم الفرضية القائلة بأن REL حاسم للالتهاب الناتج عن السيراميد VLC المشبع.
بسبب نقص IL-10. علاوة على ذلك، تظهر فئران Il10/Rel-DKO إفرازًا معويًا منخفضًا من IL-12p40 (الشكل البياني الممتد 9e)، وانخفاضًا في الليبوكالين البرازي (الشكل البياني الممتد 9f) وانخفاضًا في أعداد الخلايا النخاعية في الغشاء المخاطي للقولون مقارنة بفئران II1O-KO (الشكل البياني الممتد 9g)، مما يشير إلى أن REL حاسم للحفاظ على الالتهاب غير المحلول في البلعميات والفئران التي تعاني من نقص IL-10.
نقاش
في هذه الدراسة، نحدد بشكل آلي التفاعل بين المنظمات المعروفة للتعبير الجيني للاستجابة المناعية، وعمليات الأيض الدهني، واستقرار الأمعاء. هنا، نكشف عن آلية غير موصوفة سابقًا من خلالها ينظم السيتوكين المضاد للالتهابات IL-10 مدة الالتهاب. بشكل محدد، في غياب إشارات IL-10، نجد زيادة في التدفق إلى مسار تخليق السفينغوليبيد الجديد، مما يؤدي إلى تراكم السيراميدات ذات السلسلة الطويلة جدًا التي تعزز التعبير الجيني الالتهابي. بشكل غير متوقع، وجدنا أن إنتاج السفينغوليبيد المتغير لم يكن ناتجًا عن مستويات النسخ للجينات التي تشفر الإنزيمات في مسار التخليق (الشكل البياني الممتد 5a). بدلاً من ذلك، تم تتبع التغيرات في تكوين السيراميد إلى قدرة IL-10 على التحكم في التعبير الجيني لـ Scd2 والتخليق اللاحق للأحماض الدهنية الأحادية غير المشبعة ذات السلسلة الطويلة (الشكل 3a،b). من الجدير بالذكر أن تثبيط الأدوية أو الحذف الجيني لـ SCD2 قد شغل مسار تخليق السيراميد الجديد بطريقة مشابهة لحذف IL-10 (الشكل 3e والأشكال البيانية الممتدة 5k،1 و ). هناك عدد قليل من نقاط التفتيش المعروفة التي تنظم التدفق إلى مسار تخليق السيراميد الجديد، وكيف تعارض تخليق MUFA الجديد هذا المسار لا يزال غير واضح. إحدى الاحتمالات هي أنه عندما يكون تخليق MUFA محدودًا، فإن ذلك يؤدي إلى زيادة في سوابق الأحماض الدهنية المشبعة مثل البالمتيت. تكثيف بالميتويل-CoA والسيرين هو الخطوة الأولى في مسار تخليق السيراميد الجديد وهو مطلوب لتوليد جميع المستقلبات السفينغوليبيدية اللاحقة. في الواقع، يزيد نقص IL-10 قليلاً من إجمالي البالمتيت الخلوي في البلعميات (الشكل البياني الممتد 5c). ومع ذلك، فإن الحذف الجيني لـ SCD2، الذي يخفف أيضًا من تخليق MUFA ويزيد من إجمالي السيراميدات، لا يؤثر على إجمالي أو البالمتيت المُصنّع (الشكل البياني الممتد 6a،b)، مما يشير إلى أن آليات تنظيم أخرى هي الأكثر احتمالًا. من الجدير بالذكر أننا نجد أن معالجة SCDi أو الحذف الشرطي لـ يزيد من كمية معظم أنواع السيراميد بغض النظر عن تشبع الذيل N-acylated (الأشكال البيانية الممتدة 51 و6d). وهذا يشير إلى أن MUFAs ليست محدودة فيما يتعلق بذيل السيراميد وقد يكون لها دور أوسع في تنظيم التدفق إلى تكوين السيراميد خارج توفر الركيزة. وبالتالي، فإن احتمالًا آخر هو أن تخليق MUFA الذي يتم بوساطة IL-10 قد يشغل نشاط بروتينات عائلة الأوروسوموكويد (ORM). تتعارض بروتينات ORM مع ناقلات بالميتويل السيرين مثل SPTLC2 لتقليل التدفق إلى مسار السفينغوليبيد. من الجدير بالذكر أن ORMs معروفة بتأثيرها على التهاب مجرى الهواء وقد تم الإبلاغ عن أنها تخضع للتحكم بواسطة برامج أيضية أخرى. سيتطلب الأمر مزيدًا من التحليل الكيميائي الحيوي لفحص العوامل المطلوبة لتأثير إشارات IL-10 وMUFAs على تخليق السيراميد الجديد.
تستخدم العديد من الدراسات السابقة التي تفحص تأثير السيراميدات على الالتهاب والموت الخلوي نظائر السيراميد C2 قصيرة السلسلة التي لا يتم تصنيعها داخليًا بواسطة خلايا الثدييات. هنا نركز على السيراميدات طويلة السلسلة وVLC التي يتم إنتاجها داخليًا بواسطة خلايا المناعة، ونجد أن الإضافة الخارجية للسيراميدات طويلة السلسلة وVLC – على عكس السيراميد C2 – لا تبدو أنها تحفز موت الخلايا أو تدفع تنشيط الانفلامازوم. بالإضافة إلى ذلك، نلاحظ أن السيراميدات VLC المشبعة فقط، ولكن ليس نظائرها طويلة السلسلة، يمكن أن تعزز التهاب البلعميات (الشكل 1g والشكل البياني الممتد 2g،h)، مما يوفر دليلًا تجريبيًا للنتائج المتوقعة في السليكو. علاوة على ذلك، نحدد أن ‘حالة عدم التشبع’ لذيول السيراميدات VLC هي ميزة إضافية حاسمة لتعديل حجم التهاب البلعميات (الشكل البياني الممتد 5i). تشير هذه النتائج إلى درجة ملحوظة من التخصص في كيفية نقل السيراميدات VLC المعلومات إلى
آلية الالتهاب، وسيكون من المهم في الدراسات المستقبلية التركيز على كيفية تأثير السيراميدات VLC المشبعة ولكن غير المشبعة على التعبير الجيني الالتهابي. بالإضافة إلى ذلك، هناك حاجة إلى مزيد من الدراسات لاستكشاف كيفية تأثير المستقلبات السفينغوليبيدية اللاحقة على الالتهاب. على سبيل المثال، تزيد علاجات السيراميد VLC من السيراميدات hexosyl VLC (الشكل البياني الممتد 2c)، والتي يُعتقد أنها ربيطات لـ CD1d، وهو MHCII غير الكلاسيكي المطلوب لتنشيط خلايا T القاتلة الطبيعية غير المتغيرة. علاوة على ذلك، لا يزال غير معروف كيف تؤثر إشارات IL-10 على توليد السفينغوزين-1-فوسفات، وهو دهن حيوي نشط للغاية معروف بدوره الحاسم في تنقل خلايا المناعة التكيفية (تمت مراجعته في المراجع 56،57). وبالتالي، هناك حاجة إلى مزيد من الدراسات لتوضيح دور إشارات IL-10 وsphingolipidome في البلعميات. من الجدير بالذكر أيضًا أن فقدان إشارات IL-10 يقلل من معظم السفينغوميلينات المشبعة وجميع السفينغوميلينات الأحادية غير المشبعة (الشكل 1d والشكل البياني الممتد 1f). قد يكون ذلك بسبب انخفاض في MUFAs (الشكل 3b)، أو اضطراب في النقل من الشبكة الإندوبلازمية إلى جولجي المطلوب لتخليق السفينغوميلين، أو زيادة في تحلل السفينغوميلين. لقد لوحظت زيادة في تحلل السفينغوميلين استجابةً لإشارات السيتوكين الالتهابية في أنواع خلايا المناعة, ولكن الآلية الدقيقة لكيفية تأثير زيادة تحلل السفينغوميلين على الالتهاب لا تزال غير مفهومة جيدًا. هناك حاجة إلى مزيد من الدراسات لتحديد ما إذا كانت وكيف تؤثر إشارات IL-10 على مسارات إنقاذ السفينغوليبيد.
وجدنا أن الالتهاب المستمر الذي لوحظ استجابةً للسيراميدات VLC أو غياب تخليق MUFA يمكن تتبعه إلى النشاط المستمر لعضو عائلة NF-кB REL. تم دراسة التفاعل بين IL-10 وREL سابقًا في البلعميات, ولكن الملاحظة بأن نشاط REL النسخي يمكن أن يتأثر بتشبع الأحماض الدهنية أسفل إشارات IL-10 تعزز الفكرة القائلة بأن التلاعب في توازن الأحماض الدهنية مرتبط مباشرة بتنشيط خلايا المناعة. نقدم أيضًا دليلًا قويًا على أن REL حاسم للتعبير الجيني الالتهابي المستمر في غياب إشارات IL-10 وهو حاسم للتعبير الجيني الالتهابي خارج Il12a وIl12b، أهدافه النموذجية في الخلايا النخاعية. وبالتالي، قد يكون تحديد مسارات إشارات حساسات الدهون التي تنظم نشاط REL بمثابة أهداف جديدة لتعديل الالتهاب الشاذ الذي لوحظ في مجموعة واسعة من الأمراض الالتهابية الأيضية وغير الميكروبية. لا تزال الآلية الدقيقة التي توجه بها السيراميدات VLC المشبعة بشكل خاص موقع REL الخلوي غير واضحة وستكون موضوعًا مهمًا للدراسات المستقبلية. لماذا يتأثر موقع REL النووي أكثر من RELA استجابةً للسيراميدات VLC لا يزال غير واضح – قد يكون ذلك بسبب ديناميات الالتهاب، أو تعديلات ما بعد الترجمة الخاصة بعوامل النسخ، أو cascades إشارية غير معروفة تستهدف أعضاء عائلة NF-кB المحددة. ستكون هناك حاجة إلى مزيد من الدراسات لفهم كيفية تفاعل السيراميدات VLC مع تنشيط REL.
أخيرًا، نجد أن تقليل السيراميدات VLC جينيًا أو إعطاء MUFAs عن طريق الفم يمكن أن يقلل من الالتهاب القولوني الموجود في الفئران التي تعاني من نقص IL-10 أو IL-10R (الشكل 2c-f والأشكال البيانية الممتدة 3i-k، 4a-d و, مما يشير إلى أن تنظيم مسارات تخليق الدهون الجديدة مهم للحفاظ على استقرار القولون وصحته. يعاني البشر الذين لديهم طفرات ضارة في IL-10 أو IL-10R من التهاب القولون الحاد المهدد للحياة خلال الأشهر القليلة الأولى من الحياة. هؤلاء الأفراد لا يستجيبون بشكل إيجابي لأشكال القياس القياسية من قمع المناعة مثل الأدوية البيولوجية المضادة لـ TNF أو الستيرويدات. بخلاف زراعة خلايا جذعية دموية، لا يوجد خيار علاج فعال لمرض التهاب الأمعاء لدى الأشخاص الذين يفتقرون إلى إشارات IL-10 الوظيفية.من المثير للاهتمام أن التدخل الغذائي مع النظام الغذائي المتوسطي، الذي يحتوي على نسبة عالية من الدهون غير المشبعة، قد أظهر تقليل معايير المرض لدى المرضى الذين يعانون من التهاب الأمعاء في غضون ستة أشهر فقط.مكون رئيسي في النظام الغذائي المتوسطي هو زيت الزيتون، الذي يحتوي على نسبة عالية من الأحماض الدهنية الأحادية غير المشبعة. وبالتالي، من المغري التكهن بأن فوائد النظام الغذائي المتوسطي قد تعتمد، جزئيًا، على قمع الالتهاب القولوني بواسطة الأحماض الدهنية الأحادية غير المشبعة من خلال تغييرات في استقلاب السيراميد طويل السلسلة. في الواقع، تشير بياناتنا على الفئران بقوة إلى أن الإمداد الفموي بالأحماض الدهنية الأحادية غير المشبعة الخارجية يمكن أن يساهم بشكل مفيد في تقليل الالتهاب في القولون وقد يساعد في تطوير علاجات جديدة لالتهاب القولون تركز على ‘تصحيح نواتج الأيض للأحماض الدهنية’.
المحتوى عبر الإنترنت
أي طرق، مراجع إضافية، ملخصات تقارير Nature Portfolio، بيانات المصدر، بيانات موسعة، معلومات إضافية، شكر وتقدير، معلومات مراجعة الأقران؛ تفاصيل مساهمات المؤلفين والمصالح المتنافسة؛ وبيانات توفر البيانات والرموز متاحة علىhttps://doi.org/10.1038/s41586-024-07098-5.
ساريفا، م. وأو غارا، أ. تنظيم إنتاج IL-10 بواسطة خلايا المناعة. نات. ريف. إيمونول. 10، 170-181 (2010).
زو، ل. وآخرون. طفرات IL-10 وم receptors IL-10 في مرض الأمعاء الالتهابي الذي يظهر في وقت مبكر جداً. أبحاث أمراض الجهاز الهضمي. 10، 65-69 (2017).
ساكاتا، أ. وآخرون. تثبيط إنزيم السفينغوميلاين الحمضي يقلل من إفراز السيتوكينات الالتهابية الناتج عن الليبوسكاريد من البلعميات ويحمي من مرض التهاب القولون الناتج عن كبريتات الدكستران في الفئران. المناعة 122، 54-64 (2007).
لافياد، إ. ل. وآخرون. توصيف سينثاز السيراميد 2: توزيع الأنسجة، خصوصية الركيزة، والتثبيط بواسطة سفينغوزين 1-فوسفات. مجلة الكيمياء الحيوية. 283، 5677-5684 (2008).
إيمغروند، س. وآخرون. الفئران التي تعاني من نقص في سينثاز السيراميد 2 (CERS2) تظهر عيوبًا في غمد المايلين، وضمورًا في المخيخ، وسرطانات كبدية. ج. كيمياء حيوية. 284، 33549-33560 (2009).
شاساينغ، ب. وآخرون. ليبوكالين 2 البرازي، علامة حيوية غير جراحية حساسة وديناميكية بشكل واسع للالتهاب المعوي. PLoS ONE 7، e44328 (2012).
مولر، ب. أ.، ماثيس، ف. وموكيدا، د. ماكروفاجات الأمعاء: اللاعبون الرئيسيون في المناعة المعوية وفيزيولوجيا الأنسجة. الرأي الحالي في المناعة 62، 54-61 (2020).
بين، سي. سي. وآخرون. تمثل البلعميات المقيمة والمسببة للالتهابات في القولون مصائر بديلة تعتمد على السياق لنفس Ly6C.سلفيات الخلايا الوحيدة. مناعة الغشاء المخاطي. 6، 498-510 (2013).
فان فليت، س. ج.، بايسنس، ل. س.، بروكس-فان دن بيرغ، ف. س.، غييتنبك، ت. ب. وفان كويك، ي. إن لكتين الماكروفاج من نوع C – يمنع هجرة APCs غير الناضجة. ج. المناعة. 181، 3148-3155 (2008).
شوفال، د. س. وآخرون. إشارات مستقبلات الإنترلوكين-10 في خلايا المناعة الفطرية تنظم تحمل المناعة المخاطية ووظيفة البلعميات المضادة للالتهابات. المناعة 40، 706-719 (2014).
يو، ت. وآخرون. تعديل استقطاب البلعميات M2 من خلال التفاعل بين Stat6 وTrim24. نات. كوميون. 10، 4353 (2019).
بيكر-ماير، ك. وآخرون. CD83 الذي تعبر عنه البلعميات هو جزيء مهم لنقطة تفتيش المناعة في حل الالتهاب. فرونت. إيمونول. 14، 1085742 (2023).
أونيل، ل. م. وآخرون. ديساتوراز ستيرويل-CoA-2 في تطور الفئران، والتمثيل الغذائي، والمرض. المجلة الدولية للعلوم الجزيئية 21، 8619 (2020).
أكرمان، د. وآخرون. تساهم الدهون الثلاثية في الحفاظ على توازن الدهون خلال الضغط الناجم عن نقص الأكسجين من خلال موازنة تشبع الأحماض الدهنية. تقرير الخلية. 24، 2596-2605.e2595 (2018).
شو، سي.، سونغ، دي.، هولك، أ. ل.، زو، واي. وليو، آر. تحديد المستقلبات الدهنية المتأثرة بإدارة حمض الأوليك باستخدام كروماتوغرافيا السائل عالية الأداء-الطيف الكتلي القائم على علم الدهون. ACS أوميغا 5، 11314-11323 (2020).
هونغ، هـ. س. وآخرون. تؤثر الأحماض الدهنية الغذائية بشكل مختلف على إفراز السيتوكينات المؤيدة للالتهابات في أحادية النواة البشرية THP-1. تقارير العلوم 13، 5511 (2023).
هاو، أ. م.، بيرك، س.، أوريلي، م. إ.، مكغيللي كادي، ف. س. وكوستيلو، د. أ. حمض النخيل وحمض الأوليك ينظمان استجابات التهابية مختلفة بوساطة TLR2 في الخلايا الدبقية الصغيرة والبلعميات. مول. نيوروبولوجي. 59، 2348-2362 (2022).
فاندانماجسار، ب. وآخرون. إن إنزيم NLRP3 يثير الالتهاب الناتج عن السمنة ومقاومة الأنسولين. نات. ميد. 17، 179-188 (2011).
كاميل، سي. دي. وآخرون. التخليق الجديد للسييراميد المحدد للماكروفاج غير ضروري للالتهاب المدفوع بالإنفلامازوم ومقاومة الأنسولين في السمنة. مجلة الكيمياء الحيوية 290، 29402-29413 (2015).
موري، ب. ج. الآلية الأساسية للاستجابة المضادة للالتهابات المنظمة بواسطة IL-10 هي تثبيط النسخ بشكل انتقائي. وقائع الأكاديمية الوطنية للعلوم في الولايات المتحدة الأمريكية 102، 8686-8691 (2005).
وانغ، ب.، وو، ب.، سيجل، م. آي.، إيغن، ر. و. & بيلا، م. م. إنترلوكين (IL)-10 يثبط العامل النوويالتفعيل في أحادية النواة البشرية. IL-10 و IL-4 يثبطان تخليق السيتوكينات بآليات مختلفة. J. Biol. Chem. 270، 9558-9563 (1995).
شوتيليوس، أ. ج.، مايو، م. و.، سارتور، ر. ب. وبولدوين، أ. س. جونيور. إشارة الإنترلوكين-10 تمنع نشاط مثبط كيناز ك ب وتربط عامل النسخ ك ب بالحمض النووي. ج. كيمياء حيوية. 274، 31868-31874 (1999).
جيلمور، ت. د. وجيروندكيس، س. عامل النسخ c-Rel في التطور والمرض. جينات السرطان 2، 695-711 (2011).
أويكنغهاوس، أ. وغوش، س. عائلة عوامل النسخ NF-kB وتنظيمها. وجهات نظر كولد سبرينغ هاربور. بيولوجيا 1، a000034 (2009).
هايدن، م. س. وغوش، س. المبادئ المشتركة في إشارات NF-кB. خلية 132، 344-362 (2008).
أواز، ف.، لي، م. وبغ، أ. أ. دور حاسم لوحدة RelA من عامل نواة كابا في تنظيم العديد من جينات الاستجابة المناعية وفي موت الخلايا المستحث بواسطة فاس. ج. تجريبي. ميد. 189، 999-1004 (1999).
بيتيت، ل. أ. وآخرون. تتطلب أقدم الاستجابات المناعية الفطرية وجود RelA في البلعميات خلال الالتهاب الرئوي الناتج عن المكورات الرئوية. المجلة الأمريكية لبيولوجيا الخلايا الجذعية والتنفس 45، 573-581 (2011).
هوفمان، أ. وبالتيمور، د. دوائر إشارات العامل النووي كابا بي. مراجعة المناعة 210، 171-186 (2006).
سانجابي، س. وآخرون. منطقة فرعية من c-Rel مسؤولة عن زيادة affinity لارتباط الحمض النووي وتفعيل الجينات الانتقائي. جينات التطور. 19، 2138-2151 (2005).
سانجابي، س.، هوفمان، أ.، ليو، هـ. ج.، بالتيمور، د. وسميل، س. ت. الحاجة الانتقائية لـ c-Rel خلال تحفيز جين IL-12 P40 في البلعميات. وقائع الأكاديمية الوطنية للعلوم في الولايات المتحدة الأمريكية 97، 12705-12710 (2000).
بريسلوا، د. ك. وآخرون. بروتينات عائلة أورم تتوسط توازن السفينغوليبيد. ناتشر 463، 1048-1053 (2010).
أوينيران، سي. وآخرون. التعبير الشاذ لنظير البروتين ORM (مثل الخميرة) 3 (ORMDL3) يخل بتوازن السيراميد في الخلايا والسيراميد يزيد من حدة الربو التحسسي في الفئران. مجلة الحساسية والمناعة السريرية 136، 1035-1046.e1036 (2015).
غوروراج، سي.، فدرمان، ر. س. وتشانغ، أ. بروتينات أورم تدمج إشارات متعددة للحفاظ على توازن السفينغوليبيد. مجلة الكيمياء الحيوية 288، 20453-20463 (2013).
كوبيرلين، م. س. وآخرون. شبكة دائرية محفوظة من الدهون المنظمة بشكل مشترك تعدل الاستجابات المناعية الفطرية. خلية 162، 170-183 (2015).
بوبوفيتش، ز. ف. وآخرون. إن إنزيم جلوكوزيل سيراميد يلعب دورًا في تطوير خلايا القاتل الطبيعي غير المتغيرة. فرونت. إيمونول. 8، 848 (2017).
برينان، ب. ج. وآخرون. تحديد البنية لمستضدات الدهون الملتقطة عند واجهة مستقبل CD1d-خلايا T. وقائع الأكاديمية الوطنية للعلوم في الولايات المتحدة الأمريكية 114، 8348-8353 (2017).
شرانتز، ن. وآخرون. بروتين نيمان-بيك النوع C2 يحمل الإيزوغلوبيوتريهكسوسيلسيراميد على جزيئات CD1d ويساهم في اختيار الخلايا NKT في الغدة الصعترية. ج. تجريبي. طب. 204، 841-852 (2007).
ماندالا، س. وآخرون. تغيير حركة اللمفاويات بواسطة منبهات مستقبلات السفينغوزين-1-فوسفات. ساينس 296، 346-349 (2002).
فيرستوك، ب. وآخرون. تعديل السفينغوزين 1-فوسفات وحركة خلايا المناعة في مرض الأمعاء الالتهابي. نات. ريف. غاستروينترول. هيباتول. 19، 351-366 (2022).
كوبايشي، ت. وآخرون. IL-10 ينظم تعبير Il12b عبر إزالة الأسيتيل من الهيستونات: تداعيات على توازن البلعميات المعوية. مجلة المناعة. 189، 1792-1799 (2012).
هوينتجن، ف.، سارتور، ر. ب.، أوزاكي، م. وجوبين، س. ينظم STAT3 تجنيد NF-kB إلى المحفز IL-12p40 في الخلايا الشجرية. بلود 105، 689-696 (2005).
شيكو، ف. وآخرون. التأثير متعدد الأبعاد للنظام الغذائي المتوسطي على مرضى التهاب الأمعاء. أمراض الأمعاء الالتهابية 27، izaa097 (2021).
ملاحظة الناشر: تظل شركة سبرينغر ناتشر محايدة فيما يتعلق بالمطالبات القضائية في الخرائط المنشورة والانتماءات المؤسسية.
الوصول المفتوح هذه المقالة مرخصة بموجب رخصة المشاع الإبداعي النسب 4.0 الدولية، التي تسمح بالاستخدام والمشاركة والتكيف والتوزيع وإعادة الإنتاج بأي وسيلة أو صيغة، طالما أنك تعطي الائتمان المناسب للمؤلفين الأصليين والمصدر، وتوفر رابطًا لرخصة المشاع الإبداعي، وتوضح إذا ما تم إجراء تغييرات. الصور أو المواد الأخرى من طرف ثالث في هذه المقالة مشمولة في رخصة المشاع الإبداعي الخاصة بالمقالة، ما لم يُشار إلى خلاف ذلك في سطر الائتمان للمواد. إذا لم تكن المادة مشمولة في رخصة المشاع الإبداعي الخاصة بالمقالة وكان استخدامك المقصود غير مسموح به بموجب اللوائح القانونية أو يتجاوز الاستخدام المسموح به، فسيتعين عليك الحصول على إذن مباشرة من صاحب حقوق الطبع والنشر. لعرض نسخة من هذه الرخصة، قم بزيارةhttp://creativecommons.org/licenses/by/4.0/. (ج) المؤلف(ون) 2024
طرق
سلالات الفئران
تم شراء فئران II10-KO (JAX 002251) و II1Orb-KO (JAX 005027) من مختبرات جاكسون. تم تهجين كلا سلالتي النقص الجيني مع سلالة C57BL/6 البرية (JAX 000664) لإنتاج فئران متغايرة الزيجوت. تم إنتاج جميع مجموعات الفئران المستقبلية من المتغايرات الزيجوت.تربية الهتيروزيجوت لتقليل التنوع الميكروبي. تم تربية مجموعات من الفئران في أقفاص مشتركة مع ثلاثة فئران من النوع البري وثلاثة فئران ناقصة الجينات ما لم يُذكر خلاف ذلك. لايسم-cre(JAX 004781) تم شراء الفئران أيضًا من مختبر جاكسون. Scd2تم إنتاج الفئران وCers2-KO في مركز كريسبر الداخلي لدينا وهي متاحة عند الطلب. بالنسبة للكيماويات النخاع العظمي، تم نقل نخاع العظام المتبرع (250,000-500,000 خلية لكل فأر) إلى فئران متلقية CD45.1 PepBoy (Jax 002014). تم زراعة الفئران لمدة 10 أسابيع قبل الاستخدام التجريبي. تم إجراء جميع التجارب على الحيوانات وفقًا لبروتوكولات لجنة رعاية واستخدام الحيوانات في جامعة ييل. تم إيواء الفئران في غرف تحتوي على 14 ساعة ضوء: 10 ساعات ظلام.معرطوبة الغرفة. في تجارب الفئران الحية، تم تحديد أحجام العينات بناءً على توفر الفئران وكانت أكبر حجم ممكن. لم يتم عشوائية الفئران حيث تم تحليلها بناءً على جيناتها. لم يكن الباحثون معميين عن تخصيص المجموعات خلال جمع البيانات أو تحليلها. لم يكن التعمية ذات صلة بدراستنا نظرًا لأن معظم الملاحظات التي تم إجراؤها في هذه الدراسة كانت قائمة على قياس التدفق وتم تأكيد جينات الفئران قبل وبعد التحليل.
التهاب القولون الناتج عن مضادات حيوية
تم إعطاء الفئران 1.5% DSS في مياه الشرب لمدة 5 أيام، قبل العودة إلى زجاجات المياه العادية. تم وزن الفئران خلال فترة التجربة وتم euthanized في اليوم 12. كانت الفئران في عمر 10 أسابيع أو أكبر بوزن ابتدائي يبلغ 20 جرام أو أكثر.
خلايا الفأر خارج الجسم
لـ BMDMs، تم تمايز نخاع العظام إلى بلاعم في DMEM يحتوي على 10% FBS (سيغما)، 5% وسط مشروط M-CSF أو-CSF (بيوليجند) (لم تختلف النتائج)البنسيلين ستربتوميسين (جيبكو)، 1% جلوتامين (إنفيتروجين) 0.5% صوديوم بايروفات (إنفيتروجين) لمدة 7-9 أيام قبل الاستخدام التجريبي. تم جمع البلعميات البريتونية بعد 96 ساعة من معالجة الثيوغليكولات. تم غسل البلعميات، وعدها، وزرعها في الوسط الموصوف أعلاه، وتم تنشيطها بواسطة منبهات TLR وتم الحفاظ عليها في الثقافة لمدة 24-48 ساعة.
المواد الكيميائية
تم معالجة الخلايا بـPam3CSK4 (Invivogen tlrl-pms). CholPC (700123)، Cer16:0 (860516)، Cer22:0 (860525)، Cer24:0 (860524) أو Cer24:1 (860525) (Avanti Lipids). تم استخدام جميع السيراميدات بتركيز نهائي منتم إذابة الميريوسين (كيمن كيميكالز) في DMSO. تم إعداد محلول العمل عن طريق تخفيف 1:1000 للحصول على محلول عمل نهائي بتركيز 10 نانومول خلال آخر 24 ساعة من تنشيط TLR.
تحضير السيراميد: الكول PC. تم تعديل هذه الطريقة من المرجع 61. تم إذابة السيراميدات والكول PC في 100% كلوروفورم إلى 12.5 مللي مول. تم خلط كميات متساوية من السيراميد والكول PC وتجفيفها تحت النيتروجين. تم إعادة ترطيب الدهون في PBS إلى 3.125 مللي مول سيراميد: 3.125 مللي مول كول PC (أو كول PC: فارغ)، وتم استخدام الموجات فوق الصوتية عندلـحتى تم إذابة جميع الرواسب. تم إضافة خلطات الدهون إلى ثقافات الخلايا بتركيز 1:100 لـالتركيز النهائي لكل نوع من السيراميد.
إعدادتم إضافة ستة جرامات من BSA خالية من الأحماض الدهنية ومنخفضة الإندوتوكسين (سيغما A8806) تدريجياً إلى 17.5 مل من محلول NaCl بتركيز 150 مليمول في وعاء.أثناء التحريك. بمجرد أن يذوب BSA تمامًا، تم ضبط الرقم الهيدروجيني على 7.4 باستخدام 1 N NaOH (إضافة 1 M NaOH ببطء فيالزيادات، أثناء التحريك). تم تكرار ذلك مع الزيادات تم تخفيف المحاليل ببطء حتى تم تحقيق الرقم الهيدروجيني المطلوب. تم ضبط الحجم النهائي على 25 مل باستخدام 150 مللي مولار من NaCl.
تحضير الأحماض الدهنية الحرة المرتبطة ببروتين الألبومين البشري. تم إذابة الأحماض الدهنية الحرة (Nucheck Prep) في 150 مليمول من كلوريد الصوديوم عند pH 7.4 للوصول إلى تركيز نهائي قدره 25 مليمول (أي، تم إذابته في 7 مل من محلول 150 مليمول/لتر من NaCl بالإضافة إلى ). تم خلط المزيج بقوة، وتم تسخينه عند حتى في المحلول. محلول BSA (، بارد جداً) تم دمجه أخيراً مع محلول حمض الأوليك بتركيز 25 مللي مولار (درجة حرارة الغرفة) بنسبة 54:46 ليعطي تركيز نهائي يقارب 12.5 مللي مولار مع pH 7.4. تم تخزين هذا فيوتم خلطه لمدة 10 دقائق في درجة حرارة الغرفة على جهاز الخلط قبل الاستخدام.
إضافة الأحماض الدهنية الحرة إلى زراعة الخلايا. تم تخفيف الأحماض الدهنية الحرة في وسط زراعة الخلايا بتركيز 1:500 لـالتركيز النهائي. تم إضافة الأحماض الدهنية الحرة بعد 4 ساعات من تحفيز TLR.
إعطاء BSA-18:1 عن طريق الفم. تم إعطاء الفئران (15-18 جرام، 5-6 أسابيع من العمر) عن طريق الفم لمدة 14 يومًا مع BSA وحده أو BSA-18:1 (التحضير الموصوف أعلاه، مخففمع PBS).
تثبيط تخليق الأحماض الدهنية الأحادية غير المشبعة بواسطة SCDi. تم إذابة SCDi (Cay10566؛ Fisher NC0493687) في DMSO إلى تركيز نهائي من. تم استخدام هذا المحلول على الفور، مرة واحدة فقط، ولم يخضع لأي دورات تجميد-ذوبان (أي دورات تجميد-ذوبان قتلت نشاط هذا المركب كما تم قياسه بواسطة تحليل تتبع النظائر). تم إنتاج المحلول العامل عن طريق تخفيف 1:1000 للحصول على محلول عامل نهائي بتركيز 10 نانومولار.
تم تقييم حيوية الخلايا باستخدام AOPI من خلال نظام عد الخلايا Nexcelom K2.
ELISAs
تم إجراء اختبارات ELISA لـ Lipocalin (R&D) و IL-6 (R&D) و IL-12b (Biolegend) وفقًا لتعليمات الشركة المصنعة.
جمع البلعميات البريتونية خارج الجسم
تم معالجة الفئران من النوع البري والفئران المعدلة وراثياً IIIO-KO بمادة الثيوغليكولات عن طريق الحقن داخل البطن لمدة 48 ساعة، تلتها حقنة داخل البطن منتم تحفيز كل فأر بواسطة ربيطة TLR2 (Pam3CSK4) لمدة 48 ساعة إضافية. تم جمع البلعميات عن طريق غسل الصفاق، وتم عدها، وتحضيرها لتحليل الدهون بواسطة مطيافية الكتلة الموضحة أدناه. تم تقييم عينة من الخلايا خارج الجسم من حيث النقاء بواسطة تحليل تدفق الخلايا (97% من الخلايا النخاعية لكل من الخلايا البرية والخلايا II1O-KO).
تحليل الدهون
تم زراعة البلعميات في أطباق 6 آبار (Fisher 08-772-1B) وتم تحفيزها بواسطة ربيطات TLR كما هو موضح أعلاه. بعد ثماني وأربعين ساعة من التحفيز، تم تصوير الخلايا لعد الخلايا كما هو موضح سابقًا.تمت إزالتها وتجميعها في PBS، ثم تم تجميدها بسرعة ككتل خلوية. تم استخدام استخراج معدل لطريقة بليغ وداير.تم إجراء ذلك على العينات. قبل الاستخراج ثنائي الطور، تم إضافة مزيج معيار داخلي من 13 صنف دهني إلى كل عينة (AB Sciex، 5040156). في التجارب اللاحقة، تم إضافة مزيج معيار داخلي يتكون من 70 معيار دهني عبر 17 صنفًا إلى كل عينة (AB Sciex 5040156، Avanti 330827، Avanti 330830، Avanti 330828 وAvanti 791642). في أحدث التجارب، تم إضافة مزيج معياري من 75 معيار دهني عبر 17 صنفًا (Avanti 330820، Avanti 861809، Avanti 330729، Avanti 330727 وAvanti 791642) إلى كل عينة. بعد إجراء عمليتين متتاليتين من الاستخراج، تم تجفيف الطبقات العضوية المجمعة في جهاز Thermo SpeedVac SPD300DDA باستخدام إعداد التدرج 4 عندلمدة 45 دقيقة مع وقت تشغيل إجمالي قدره 90 دقيقة. تم إعادة تعليق عينات الدهون في ميثانول: ثنائي كلورو ميثان بنسبة 1:1 مع 10 مللي مول من أسيتات الأمونيوم ونقلها إلى زجاجات روبو (Thermo 10800107) للتحليل. تم تحليل العينات على منصة Sciex Lipidyzer (Sciex 5500 مع DMS وShimadzu LC-30) لقياس كمي مستهدف لـ 1100 نوع من الدهون عبر 13 فئة فرعية. في التجارب اللاحقة، تم توسيع الاختبار ليشمل 1400 نوع مستهدف من الدهون عبر 17 فئة فرعية. تم استخدام جهاز التنقل التفاضلي على Lipidyzer مع مجموعة ضبط SelexION (Sciex 5040141) أو EquiSPLASH LIPIDOMIX (Avanti 330731). تم نشر إعدادات الجهاز، وإعدادات الضبط، وقوائم المراقبة المتعددة التفاعلات سابقًا.تم إجراء تحليل البيانات باستخدام برنامج Lipidyzer (الإصدار 1.0). تم تحليل التجارب اللاحقة باستخدام مساعد شوتغن ليديدوميكس (SLA الإصدار 1.3).تم تطبيع القيم الكمية إلى عدد الخلايا. تم إنشاء تحليل المكونات الرئيسية (PCA) وخرائط الحرارة باستخدام الإرشادات الموضحة..
كشف السفينغوزين
تم إجراء الكشف والتقدير الكمي للسفينغوزين باستخدام جهاز قياس الطيف الكتلي Agilent 6490 ESI-QQQ-MS/MS أو جهاز قياس الطيف الكتلي Agilent iFunnel 6550 رباعي الأبعاد مع وقت الطيران (QTOF)، مزود بمصدر تأين بالرش الكهربائي (ESI) (إيجابي) متصل بنظام HPLC Agilent 1290 Infinity. تم تحليل الدهون المستهدفة باستخدام برنامج تدرج على عمود Phenomenex Kinetex 1.7 مم C18.في الماء معحمض الفورميك لـدرجة حرارة العمود:تم إجراء الكشف باستخدام ESI-QQQ-MS/MS مع طاقة تصادم محسّنة تبلغ 20 فولت، وتم تسهيله بواسطة وضع المراقبة الديناميكية للتفاعلات المتعددة (MRM) مع انتقال الكتلة.تم إجراء الكشف باستخدام مطياف الكتلة QTOF مع المعلمات المصدرية التالية: درجة حرارة الغازغاز التجفيفجهاز النيبولايزر 40 رطل لكل بوصة مربعة، درجة حرارة غاز الغلافوتدفق غاز الغلاف.
لكشف السفينغوزين المعلم، تم زراعة الخلايا في وسط خالٍ من السيرين (تيكنوفا؛ خالٍ من السيرين والجلوكوز والجليسين) معزز بـ-سيرين (مختبرات كامبريدج لل isotopes 202407-34-9) لمدة 48 ساعة قبل استخراج الدهون وتحليل الطيف الكتلي كما هو موضح أعلاه. تم الكشف عن السفينغوزين الكلي والموسوم (+3 Da) باستخدام برنامج Mass Hunter (Agilent) وتم تطبيعه على منحنى قياسي. تم إضافة الجلوكوز البارد والجليسين إلى مستويات DMEM العادية. و ، على التوالي.
تجارب إثراء النظائر
تم نقل خلايا BMDMs المتميزة في اليوم الثامن إلى وسط كامل يحتوي على-الجلوكوز مع أو بدون تحفيز TLR لمدة 48 ساعة قبل الجمع. انظر المرجع 9 لمزيد من التفاصيل. تم إجراء تحليل الأحماض الدهنية المشعة والكوليسترول كما هو موضحتم تحديد المساهمات النسبية للتخليق في إجمالي حوض الكوليسترول خلال فترة التوسيم التي استمرت 48 ساعة من خلال ملاءمة توزيعات النظائر للكوليسترول في نموذج مشابه لتحليل الطيف النظائري كما هو موصوف..
تحليل تعبير الجينات
تم استخراج RNA من جميع الخلايا باستخدام Trizol وفقًا لبروتوكولات الشركة المصنعة. تم تخليق cDNA باستخدام مجموعة تخليق cDNA عالية السعة من Applied Biosystems وفقًا لتعليمات الشركة المصنعة.تم إجراء تفاعل تخليق cDNA باستخدام RNA). تم إجراء qPCR على جهاز BioRad qPCR باستخدام SYBR Green Master Mix (BioRad) والمبادئ التوجيهية. يتم تطبيع قيم التعبير النسبية إلى الجين الضابط (rRNA 36B4) ويتم التعبير عنها من حيث قيم mRNA النسبية الخطية. تتوفر تسلسلات المبادئ التوجيهية عند الطلب.
تم حضن مليوني من خلايا البلعميات الكبيرة المستمدة من نخاع العظام أو البلعميات الصفاقية مع ALLN عندلمدة 15 دقيقة قبل الجمع. تم غسل الخلايا بمحلول PBS + ALLN، ثم تم نقلها إلى أنابيب إيبندورف. تم حضن الخلايا فيمحلول عازل مفرط الانخفاض أ (10 مللي مول هيبس pHEGTA، 0.1 مليمول EDTA + مثبطات البروتياز) لمدة 15 دقيقة على الثلج، ثم تم إضافة 10% من NP-40 وتم خلط الخلايا بواسطة جهاز الخلط لمدة 10 ثوانٍ لتمزيق الغشاء البلازمي. تم جمع النوى بواسطة الطرد المركزي.لمدة 5 دقائق، ثم أعيد تعليقها فيمحلول عازل مفرط التوتر (20 مللي مولار هيبس pH 7.9،EDTAالجليسرول + مثبطات البروتياز). بعد الخلط الجيد، تم حضانة النوى عند 4 درجات مئوية على جهاز دوار لمدة ساعة واحدة. تم خلط العينات بسرعة، ثم تم تدويرها للأسفل فيلمدة 5 دقائق لفصل الكريات النووية. تم جمع المستخلصات النووية وتجميدها على الفور على الثلج الجاف أو خلطها مع محلول التحميل، وغليها لمدة 10 دقائق وتشغيلها على SDS-PAGE لتحليل المناعية.
التحليل المناعي
تم تطبيع العينات حسب عدد الخلايا (نظام عد الخلايا Nexcelom K2) وتم تحللها مباشرة فيعازلة تحميل لايملي. تم فصل مستخلصات البروتين على تدرجإلىجل SDS-PAGE من نوع Bis-Tris (Invitrogen) ثم تم نقله إلى غشاء نيتروسليلوز (Amersham). بعد حجب الغشاء لمدة ساعة في محلول TBS يحتوي على 0.1% Tween 20 (TBST) و5% حليب خالي من الدسم، تم فحص الغشاء بالأجسام المضادة المحددة المخففة في TBST معالحليب طوال الليل. تم غسل الأغشيةمع TBST، تليهاتحضين في درجة حرارة الغرفة مع الأجسام المضادة الثانوية المرتبطة بالبيروكسيداز من الفجل المخفف في TBST بالإضافة إلىالحليب. تم غسل الأغشية كما في السابق ثم تم تطويرها باستخدام مجموعة كشف Pierce ECL2 وتم تصويرها باستخدام Typhoon.
تحضير الليبوكالين البرازي
تم جمع براز كل فأر، ووزنه، وذوبانه في محلول PBS مع 0.1% توين. تم تكسير كريات البراز باستخدام جهاز هز الأنابيب لمدة 5 دقائق بسرعة كاملة. تم تدوير العينات وتم تخفيف السوبرناتنت الناتج بنسبة 1:10 واستخدامه في اختبارات ELISA للليبوكالين.
عزل خلايا المناعة من الغشاء المخاطي للقولون
تم جمع القولون، وغسله بـ 10 مل من PBS، ثم تم تقسيمه بالطول، وغسله مرة أخرى في PBS. وتم إزالة الجزء الظهاري باستخدام غسلتين من محلول غسيل الظهارة بكمية 10 مل.HBSS، 5 مللي مول EDTA، 1 مللي مول DTTلمدة 20 دقيقة مع التحريك بسرعة 220 دورة في الدقيقة. تم إزالة القولون من محلول الغسيل الإيبي، وغسلها في PBS وقطعها بدقة باستخدام شفرة حلاقة. تم نقل الأنسجة المقطعة إلى 5 مل من محلول الهضم (دي إم إي إمFBSكولاجيناز ددي إن أيز) وتم حضنه فيلمدة 60 دقيقة مع التحريك بسرعة 220 دورة في الدقيقة. بعد الهضم، تم تصفية العينات من خلالتم تصفيته وغسله مرتين بـدي إم إي إمFBS. ثم تم تقسيم الخلايا إلى خمس مجموعات للوحات صبغ مختلفة. تم صبغ الخلايا بالأجسام المضادة (تخفيف 1:400) وصبغة حيوية قابلة للتثبيت (تخفيف 1:1,000) في لمدة 30 دقيقة في محلول FACS (تم غسل FBS في PBS مرتين، ثم تم تشغيله على الفور على LSR2 أو تثبيته (BD Cytofix/ CytoPerm 554722) لتلوين الخلايا الداخلية باستخدام أجسام مضادة للسيتوكين (تخفيف 1:100). تم استخدام كرات عد الخلايا AccuCheck (Invitrogen PCB100) لت quantification عدد الخلايا. تم جمع جميع بيانات تدفق السيتومتر على BD LSR2s باستخدام برنامج FACSDiva 7. تم تحليل بيانات تدفق السيتومتر باستخدام FlowJo (من الإصدار 9 إلى 10.6.1).
تم فرز خلايا معزولة من القولون لـالخلايا لاستبعاد العدلات، والخلايا التائية، والخلايا البائية. تم إعداد الخلايا بشكل إضافي باستخدام جهاز التحكم الفردي 10X وفقًا لتعليمات الشركة المصنعة.
مقالة
التعليمات. تم إنشاء مكتبات scRNA-seq باستخدام مجموعة مكتبة Gel Bead و Chromium Next GEM Single Cell 3′ v3.1 (10X Genomics) وفقًا لبروتوكول الشركة المصنعة. باختصار، تم إنشاء المستحلبات باستخدام جهاز 10X Chromium Controller (10X Genomics) لاستعادة مستهدفة لـ 10,000 خلية. تم عزل cDNAs المشفرة بالباركود من المستحلب وتم تضخيمها بواسطة PCR (11 دورة). خضعت cDNAs للتجزئة، وإصلاح الأطراف، وإضافة ذيول A قبل إضافة مؤشرات العينة بواسطة PCR (16 دورة). تم تسلسل منتجات المكتبة باستخدام NovaSeq 6000.
تحليل بيانات تسلسل RNA أحادي الخلية
تم استخدام Cellranger v6.0.1 لمحاذاة عينات scRNA-seq إلى جينوم الفأر (mm10). تم إجراء تحليل البيانات باستخدام حزمة R Seurat v4.3.0.بما في ذلك تحديد نوع الخلايا والتحليلات المقارنة بين الظروف. في خطوة مراقبة الجودة، يتم استبعاد الخلايا ذات الجودة المنخفضة التي تحتوي على عدد قليل من الجينات المعبر عنها أو تم استبعادها. كما استبعدنا الخلايا إذا كانت نسبة جيناتها الميتوكوندرية تتجاوز. بعد دمج الخلايا من جميع العينات، قمنا أولاً بتطبيع مصفوفة العد الخام ثم حددنا 2000 من أعلى الجينات المتغيرة. بعد ذلك، طبقنا تحليل المكونات الرئيسية (PCA) لتقليل الأبعاد واحتفظنا بـ 30 مكونًا رئيسيًا رائدًا لتجميع الخلايا. على وجه التحديد، تم بناء رسم الجوار الأقرب المشترك من خلال حساب مؤشر جاكارد بين كل خلية وجيرانها العشرين الأقرب، والذي تم استخدامه بعد ذلك لتجميع الخلايا بناءً على خوارزمية لوفين (مع دقة 0.3). بعد تحديد الجينات الخاصة بالتجمع، قمنا بتعريف أنواع الخلايا بناءً على جينات العلامة الكلاسيكية (Lyz2 للبلاعم) وركزنا على تجمعات البلاعم في التحليلات اللاحقة. لاختبار التعبير التفاضلي للجينات الالتهابية بين Il1Orb-KO و Il1Orb/Cers2-DKOs، قمنا أولاً بتطبيق ALRA.لإدخال ملفات التعبير الجيني ثم استخدم اختبار ويلكوكسون غير المعلمي لمجموع الرتب للحصول علىالقيم. البيانات متاحة في NCBI Gene Expression Omnibus (GEO) رقم الوصول GSE252548.
تحضير عينة RNA-seq
تم إعداد RNA باستخدام بروتوكول هجين من مجموعة Trizol/Qiagen RNeasy وتم تقديمه إلى مركز ييل لتحليل الجينوم لإعداد مكتبة RNA (اختيار بولي A) وتسلسل NovaSeq.
معلومات إضافية حول تصميم البحث متاحة في ملخص تقارير مجموعة ناتشر المرتبط بهذه المقالة.
توفر البيانات
تتوفر مجموعات البيانات التي تم إنشاؤها خلال الدراسة الحالية في NCBI GEO بأرقام الوصول: GSE252548 (scRNA-seq) و GSE252547 (bulk RNA-seq). تم توفير بيانات المصدر مع هذه الورقة. 61. سوكوماران، ب. وآخرون. تعقيد c6-سيراميد مع فوسفات الكوليسترول، تركيبة فعالة لتوصيل السيراميد خالية من المذيبات للخلايا في الثقافة. PLoS ONE 8، e61290 (2013). 62. هسيه، و. ي.، ويليامز، ك. ج.، سو، ب. وبنسينجر، س. ج. تحليل دهنات البلعميات في الفئران باستخدام مطيافية الكتلة بالحقن المباشر. بروتوكولات ستار. 2، 100235 (2021). 63. سو، ب. وآخرون. تطبيق سير عمل دMS لليبدوميكس السريع لتسهيل تحليل الليبيدات الشامل عالي الإنتاجية. مجلة الجمعية الأمريكية لقياس الطيف الكتلي 32، 2655-2663 (2021). 64. ميتسال، ت. وفيلو، ج. كلستفيس: أداة ويب لتصور تجميع البيانات متعددة المتغيرات باستخدام تحليل المكونات الرئيسية وخريطة الحرارة. أبحاث الأحماض النووية. 43، W566-W570 (2015). 65. ويليامز، ك. ج. وآخرون. متطلب أساسي لمحور الإشارة SCAP/SREBP لحماية خلايا السرطان من السمية الدهنية. أبحاث السرطان 73، 2850-2862 (2013). 66. ستيوارت، ت. وآخرون. التكامل الشامل لبيانات الخلايا المفردة. خلية 177، 1888-1902.e1821 (2019). 67. ليندرمان، ج. س. وآخرون. تقدير القيم المفقودة مع الحفاظ على الصفر في بيانات تسلسل RNA أحادي الخلية. نات. كوميونيك. 13، 192 (2022). 68. دوبين، أ. وآخرون. ستار: محاذي تسلسل RNA عالمي فائق السرعة. المعلوماتية الحيوية 29، 15-21 (2013). 69. أندرس، س.، بيل، ب. ت. وهوبير، و. HTSeq – إطار عمل بايثون للعمل مع بيانات التسلسل عالي الإنتاجية. المعلوماتية الحيوية 31، 166-169 (2014). 70. لوف، م. آي.، هوبر، و. & أندرس، س. تقدير معتدل لتغير الطي والتشتت لبيانات RNA-seq باستخدام DESeq2. جينوم بيو. 15، 550 (2014).
الشكر والتقدير يشكر المؤلفون J. Alderman و C. Hughes و L. Evangelisti و E. Hughes-Picard و B. Cadugan على مساعدتهم في المهام الفنية والإدارية. نود أن نشكر مركز ييل لتحليل الجينوم (YGCA) حيث تم دعم البحث المبلغ عنه في هذه المنشورة من قبل المعهد الوطني للعلوم الطبية العامة التابع للمعاهد الوطنية للصحة بموجب رقم الجائزة 1S10OD030363-01A1. هذه المقالة تخضع لسياسة الوصول المفتوح إلى المنشورات الخاصة بـ HHMI. لقد منح رؤساء مختبرات HHMI سابقًا ترخيصًا غير حصري CC BY 4.0 للجمهور وترخيصًا قابلًا للتراخيص الفرعية لـ HHMI في مقالاتهم البحثية. وفقًا لتلك التراخيص، يمكن أن تتاح النسخة المقبولة من المؤلف لهذه المقالة مجانًا بموجب ترخيص CC BY 4.0 فور نشرها. A.G.Y. مدعوم من معهد هوارد هيوز الطبي من خلال زمالة هانا إتش. غراي. M.H.S. مدعوم من NSF GRFP وزمالة ييل ترودو. W.K.M. مدعوم من NIH T32-DK007356، وهو متلقي زمالة ما بعد الدكتوراه من معهد أبحاث السرطان/إيرفينغتون.
مساهمات المؤلفين: A.G.Y. وضع تصور المشروع، صمم ونفذ التجارب (داخل الجسم وخارجه)، أعد عينات الدهون المستهدفة وعينات الشوتغن، حلل البيانات، قدم التمويل وبنى المخطوطة. M.H.S. صمم ونفذ التجارب، وحلل البيانات (عزل الخلايا المناعية، والتوصيف والتحليل، تربية الحيوانات وتوليد الفئران الهجينة) وساعد في بناء المخطوطة. J.O. وE.K. صمما ونفذا استراتيجيات قياس الطيف الكتلي المستهدفة وتحليل البيانات. Q.D.Z. وW.-Y.H. وK.J.W. أداروا عينات الدهون وحللوا البيانات. W.K.M. وJ.R.B. صمما ونفذا التجارب (جمع بيانات قياس التدفق وساعدا في بناء الفئران الهجينة) وقدموا نصائح حاسمة لبناء المخطوطة. R.Q. قدم تحليلاً رسمياً للدهون، وتحليل RNA-seq وتحليل scRNA-seq. Y.K. وJ.M.C. وS.T.S. وS.J.B. وR.A.F. قدموا الموارد، والإشراف والتمويل لهذا المشروع، وساهموا في وضع التصور ومراجعة المخطوطة.
المصالح المتنافسة: R.A.F. هو مستشار لشركة غلاكسو سميث كلاين. المؤلفون الآخرون يعلنون عدم وجود مصالح متنافسة.
معلومات إضافية
معلومات إضافية النسخة الإلكترونية تحتوي على مواد إضافية متاحة علىhttps://doi.org/10.1038/s41586-024-07098-5. يجب توجيه المراسلات والطلبات للحصول على المواد إلى أوتوم غ. يورك، ستيفن ج. بنسنجر أو ريتشارد أ. فلافيل. تُعرب مجلة Nature عن شكرها لتيموثي هلا والمراجعين الآخرين المجهولين على مساهمتهم في مراجعة هذا العمل. معلومات إعادة الطباعة والتصاريح متاحة علىhttp://www.nature.com/reprints.
أ.
ب.
سيراميد 16:0 إلى سفينغومييلين 16:0
ج.
السيراميد المشبع مقابل السيراميد غير المشبع
د.
هـ.
أنواع السيراميد
ف.
سير16:0 سير18:0 سير24:1
ج.
الشكل البياني الممتد 1|انظر الصفحة التالية للتعليق.
مقالة
الشكل البياني الموسع 1|إشارات IL-10 تتحكم في استقلاب السفينغوليبيد. أ) إجمالي استرات الكوليسترول (CE)، ثنائي الجليسريدات (DAG)، الأحماض الدهنية الحرة (FFAs)، سيراميدات الهيكسوزيل (HCer)، سيراميدات اللاكتوزيل (LCer)، ليسوفوسفatidylcholine (LPCs)، ليسوفوسفatidylethanolamine (LPE)، فوسفatidylcholine (PC)، فوسفatidylethanolamine (PE) وثلاثي الجليسريدات (TAGs) تم قياسها بواسطة MS من الحقن المباشر من BMDMs WT و IL10 KO المعزولة من الفئران السليمة أو المفعلة بواسطة TLR2 لمدة 48 ساعة.” ). ب) مخطط للسيراميد 16:0 والسفينغوميلين (SM) 16:0. كلا السفينغوليبيدين يحتويان على سلسلة ثابتة بطول 18 كربون (الأعلى، الأرقام السوداء)، وسلسلة متغيرة بطول 16 كربون (الأسفل، الأرقام الحمراء). الشكل تم إنشاؤه باستخدام ChemDraw V22.2.0.3300. ج) مخطط للسيراميدات المشبعة (Cer24:0) مقابل السيراميدات غير المشبعة (Cer24:1). يقع الرابطة المزدوجة في 24:1 عند السهم. الشكل تم إنشاؤه باستخدام ChemDraw V22.2.0.3300. د) أنواع السيراميد التي تم قياسها بواسطة MS من الحقن المباشر من WT و IL10 KO BMDMs التي تكون غير نشطة أو مفعلة بواسطة ligand TLR2 (Pam3CysK4) لمدة 48 ساعة. E) خريطة حرارية لأنواع الهكسوسيل سيراميد (HCer) المقاسة بواسطة قياس الطيف الكتلي بالتسريب المباشر من WT و IL10 KO
الخلايا البالعة المستمدة من نخاع العظام التي تكون غير نشطة أو مفعلة بواسطة ربيطة TLR2Pam3CysK4) لمدة 48 ساعة. مقاسة حسب الصف (أنواع الدهون)* تشير إلى دلالةبين WT و IL-10 KO المفعلة بواسطة TLR2. F) خريطة حرارية لأنواع السفينغومييلين (SM) الفردية التي تم قياسها بواسطة MS من الحقن المباشر من BMDMs WT و IL10 KO التي تكون غير نشطة أو مفعلة بواسطة ربيطة TLR2.Pam3CysK4) لمدة 48 ساعة. تم قياسها حسب الصف (أنواع الدهون) * تشير إلى دلالةبين WT و IL-10 KO المنشطين بواسطة TLR2. G) تم قياس إجمالي السيراميد والسفينغوميلينات (SM) بواسطة قياس الطيف الكتلي المباشر من البلعميات البريتونية المستخرجة من الفئران WT و IL10 KO بعد 48 ساعة من إعطاء ligand TLR2 (50 ميكروغرام/فأر Pam3CysK4) عبر حقن داخل الصفاق.تحليل LC-MS للسفينغوزين الكلي والموسوم في خلايا BMDMs من النوع البري وIL-10RKO المفعلة بواسطة TLR2 لمدة 48 ساعة ). جميع التجارب مُبلغ عنها كمتوسطات الانحراف المعياري من 3 تجارب مستقلة، ما لم يُذكر خلاف ذلك.اختبار ستودنت غير المتزاوج ذو الذيليناختبار).
الشكل البياني الممتد 2 | انظر الصفحة التالية للتعليق.
مقالة
البيانات الموسعة الشكل 2 | السيراميدات ذات السلسلة الطويلة الخارجية تحفز الالتهاب. أ) إجمالي استرات الكوليسترول (CE)، السيراميدات (Cer)، الدياسيلغليسيرول (DAG)، الأحماض الدهنية الحرة (FFAs)، السيراميدات الهيكسوسيلية (HCer)، الليسوفوسفوليديل كولين (LPCs)، الليسوفوسفوليديل إيثانولامين (LPE)، الفوسفوليديل كولين (PC)، الفوسفوليديل إيثانولامين (PE) والدهون الثلاثية (TAGs) تم قياسها بواسطة MS من الحقن المباشر من خلايا BMDMs WT غير المنشطة أو المنشطة بواسطة TLR2 لمدة 48 ساعة المعالجة بـ CholPC (العقار الوهمي)، Cer16:0 أو Cer24:0. جميع الدهون تم إعطاؤها بتركيز نهائي قدره 30 ميكرومول. ب) أنواع السيراميد تم قياسها بواسطة MS من الحقن المباشر من خلايا BMDMs WT غير المنشطة أو المنشطة بواسطة TLR2 لمدة 48 ساعة المعالجة بـ CholPC (العقار الوهمي)، Cer16:0 أو Cer24:0. جميع الدهون تم إعطاؤها بتركيز نهائي قدره 30 ميكرومول. ج) أنواع السيراميد الهيكسوسيلية تم قياسها بواسطة MS من الحقن المباشر من خلايا BMDMs WT غير المنشطة أو المنشطة بواسطة TLR2 لمدة 48 ساعة المعالجة بـ CholPC (العقار الوهمي)، Cer16:0 أو Cer24:0. جميع الدهون تم إعطاؤها بتركيز نهائي قدره 30 ميكرومول. د) أنواع السفينغوميلين تم قياسها بواسطة MS من الحقن المباشر من خلايا BMDMs WT غير المنشطة أو المنشطة بواسطة TLR2 لمدة 48 ساعة المعالجة بـ CholPC (العقار الوهمي)، Cer16:0 أو Cer24:0. جميع الدهون تم إعطاؤها بتركيز نهائي قدره 30 ميكرومول. هـ) تحليل qPCR لـ، الثالث و III2 تعبير الجينات في خلايا بونت ميدولار ديريفيد ماكروفاجس (BMDMs) الساذجة المعالجة بـ
CholPC أو Cer24:0 بمفردهما لمدة 48 ساعة مقابل BMDMs المنشطة بواسطة TLR2 المعالجة بنفس الدهون (30 ميكرومتر لجميع العلاجات) ). F) نسبة البقاء على قيد الحياة المقاسة بواسطة صبغة AOPI لبروتينات BMDMs غير الناضجة أو المنشطة بواسطة TLR2 المعالجة بـ CholPC أو Cer16:0 أو Cer24:0 (30 ميكرومتر لجميع الدهون) لمدة 48 ساعة. G) تحليل qPCR لـ Cxcl1 وتعبير الجينات في خلايا البلعمة الكبيرة المستخرجة من نخاع العظام (BMDMs) المنشطة بواسطة ربيطة TLR2تم تحفيز البلعميات بواسطة TLR2 لمدة 48 ساعة. تم حضن البلعميات المحفزة بـ TLR2 مع صفائح الدهون Cholesteryl:Phosphatidylcholine (CholPC) بمفردها أو مع CholPC المحملة بالسيراميد 22:0 (Cer22:0) أو السيراميد 24:0 (Cer24:0) لمدة 44 ساعة الأخيرة من التحفيز.لكل مجموعة). تم إعطاء جميع الدهون بتركيز نهائي منتحليل لـ و تعبير الجينات في خلايا البلعمة الكبيرة المستمدة من نخاع العظام (BMDMs) المنشطة بواسطة ربيطة TLR2تم تحفيز ماكروفاج TLR2 باستخدام Pam3CysK4 لمدة 48 ساعة. تم حضن ماكروفاج TLR2 المحفز مع صفائح الدهون Cholesteryl:Phosphatidylcholine (CholPC) بمفردها أو مع CholPC المحملة بالسيراميد 22:0 (Cer22:0) أو السيراميد 24:0 (Cer24:0) لمدة 44 ساعة الأخيرة من التحفيز.لكل مجموعة). تم إعطاء جميع الدهون بتركيز نهائي قدره 30 ميكرومول. جميع التجارب مُبلغ عنها كمتوسطاتالانحراف المعياري من 3 تجارب مستقلة، ما لم يُذكر خلاف ذلك.اختبار ستودنت غير المتزاوج ذو الذيليناختبار).
الشكل البياني الممتد 3 | انظر الصفحة التالية للتعليق.
مقالة
الشكل 3 من البيانات الموسعة | يتطلب CerS2 إنتاج السيراميد طويل السلسلة والالتهاب. A) تحليل RNAseq لجينات سينثاز السيراميد من خلايا BMDM البرية WT و IL10 KO غير المنشطة أو المنشطة بواسطة TLR2 من تحليل RNAseq من عينات متطابقة مع تحليل الدهون في الشكل 1 (يجب أن تكون TPMs أعلى من 0 لتكون مدرجة). ). ب) أنواع السيراميد المقاسة بواسطة قياس الطيف الكتلي بالتسريب المباشر من خلايا بون مارrow المستخرجة من الفئران البرية أو الفئران المعدلة وراثيًا CerS2 KO التي تم تنشيطها بواسطة TLR2 لمدة 48 ساعة ( ). ج) إجمالي السيراميدات المقاسة بواسطة قياس الطيف الكتلي بالتسريب المباشر من خلايا بونت مكونة من نخاع العظام WT أو CerS2 KO غير المنشطة أو المنشطة بواسطة TLR2 لمدة 48 ساعة ( لكل مجموعة). د) أنواع السفينغومييلين (SM) التي تم قياسها بواسطة قياس الطيف الكتلي بالتسريب المباشر من خلايا بون مارك المستخرجة من النخاع العظمي (BMDMs) غير المنشطة أو المنشطة بواسطة TLR2 لمدة 48 ساعة ( تحليل qPCR للتعبير الجيني عن Cxcl1 و Cxcl2 و Il1b في خلايا مفعلة بواسطة TLR2 لمدة 48 ساعة (بام3سيسكي4) WT أو خلايا بامد متماثلة الزيجوت سيرس2تحليل qPCR للتعبير الجيني عن Cxcl1 و Cxcl2 و Il6 و Ilb في 48 ساعة من تنشيط TLR2بام3سيسكي4) WT أو سيرس2KO BMDMsمضاد IL-10R الأجسام المضادة المعادلة ( ) لآخر 44 ساعة من التفعيل ( تحليل qPCR للتعبير الجيني لجين Cxcl2 في خلايا مفعلة بواسطة TLR2 لمدة 48 ساعة (ماكروفاج البريتوني من نوع WT (الأشرطة البيضاء)، IL-10R KO (الشريط الأحمر) أو IL-10R/CerS2 DKO (الأشرطة الزرقاء) تم تكميلها بـ CholPC (العقار الوهمي)، Cer16:0 أو Cer24:0 خلال آخر 44 ساعة من التنشيط. H) تحليل qPCR للتعبير الجيني عن Cxcl1 وCxcl2 وIl6 وIl1b في 48 ساعة من التنشيط بواسطة TLR4.ماكروفاج البريتوني LPS) WT (الأشرطة البيضاء)، IL-10R KO (الشريط الأحمر) أو IL-10R/CerS2 DKO (الأشرطة الزرقاء) لمدة 48 ساعة. I) تحليل ELISA للليبوكالين من براز الفئران الشاهينية (IL-10R هتيروزيجوس)، IL-10R KO و IL-10R/CerS2 DKO.الفروق الإحصائية تم قياسها بواسطة اختبارات مان-ويتني ذات الجانبين. جميع التجارب تم الإبلاغ عنها كمتوسطاتالانحراف المعياري من 3 تجارب مستقلة، ما لم يُذكر خلاف ذلك.اختبار ستودنت غير المتزاوج ذو الذيليناختبار).
الشكل البياني الممتد 4 | انظر الصفحة التالية للتعليق.
مقالة
الشكل الممتد 4 | ينظم CerS2 الالتهاب القولوني في الجسم الحي. A) تحليل خلايا المناعة المعتمد على تدفق السيتومتر لعدد إجمالي خلايا CD4 T (Lin-/TCRB +/ CD4 +) أو خلايا CD4 T الإيجابية لـ IFNg+ أو IL-17A من الغشاء المخاطي القولوني من الفئران الضابطة (IL-10R هتيروزيجوس)، IL-10R KO و IL-10R/CerS2 DKO. B) تحليل خلايا المناعة المعتمد على تدفق السيتومتر من الغشاء المخاطي القولوني من الفئران WT و CerS2 KO. C) تحليل UMAP باستخدام scRNAseq لعلامات البلعميات والجينات الالتهابية من البلعميات من IL-10R KO و IL-10R/ CerS2 DKO LPs. D) تحليل تعبير الجينات باستخدام scRNAseq من جميع المجموعات من
Fcgr1 (CD64)، Cxcl2، Il1b و Cd38 من الماكروفاجات المفروزة من LP القولون لفئران IL-10R KO أو IL-10R/CerS2 DKO الشيميرية. E) تحليل تعبير الجينات باستخدام scRNAseq من جميع المجموعات. و من الماكروفاجات المرتبة من LP القولون لفئران IL-10R KO أو IL-10R/CerS2 DKO الشيميرية. F) تحليل UMAP باستخدام scRNAseq لعلامات الماكروفاجات التوليروجينية وM2 كما في S5E من الماكروفاجات من LP القولون لفئران IL-10R KO وIL-10R/CerS2 DKO. جميع التجارب مُبلغ عنها كمتوسطات.الانحراف المعياري من 3 تجارب مستقلة، ما لم يُذكر خلاف ذلك.اختبار ستودنت غير المتزاوج ذو الذيليناختبار).
الشكل البياني الموسعانظر الصفحة التالية للتعليق.
مقالة
الشكل البياني الموسع |IL-10 يتحكم في تخليق MUFA. A) خريطة حرارية لجميع جينات مسار استقلاب السفينغوليبيدمن خلايا BMDMs من النوع البري (WT) وIL10 KO التي تم تنشيطها بواسطة TLR2 من تحليل RNAseq من عينات متطابقة مع تحليل الدهون في الشكل 1 (يجب أن تكون قيم TPM أعلى من 0 لتدرج). القيم غير مقاسة. ب) التركيب الصافي (نانو مول/مليون خلية) لحمض النخيل (16:0) كما تم قياسه بواسطة تحليل تتبع نظائر التدفق الأيضي في خلايا غير المنشطة أو التي تم تنشيطها بواسطة TLR2 لمدة 48 ساعة.بام3CSK4) WT (الأشرطة البيضاء) أو IL-10R KO (الأشرطة الحمراء) BMDMs ( لكل مجموعة). ج) إجمالي الخلوية 16:0 و 18:2 كما تم قياسه بواسطة تحليل GCMS للخلايا الساذجة أو الخلايا المنشطة بواسطة TLR2 لمدة 48 ساعة (Pam3CSK4) IL-10 KO BMDMs + BSA أو 25 ميكرومتر 18:1(لكل مجموعة). د) إجمالي 18:1 كما تم قياسه بواسطة تحليل GCMS للعينات غير المعالجة أو العينات المنشطة بواسطة TLR2 لمدة 48 ساعة (Pam3CSK4) IL-10 KO BMDMs + BSA أو 25 ميكرومتر 18:1( لكل مجموعة). E) تحليل qPCR لـ و تعبير الجينات في خلايا بونت مكونة من نخاع العظام (BMDMs) غير المنشطة أو المنشطة بواسطة TLR2 لمدة 48 ساعة (50 نانوغرام/مل من Pam3CSK4) من النوع البري (الأعمدة البيضاء) أو KO IL-10R (الأعمدة الزرقاء) التي تم حضنها مع المركب (BSA) أو BSA المرتبط بـ 18:1 أو 18:2 خلال آخر 44 ساعة من التنشيط.لكل مجموعة). تم إعطاء جميع الدهون بتركيز نهائي قدره 25 ميكرومول. تم قياس السفينغوزين الموسوم بواسطة MS من WT المنشط بواسطة TLR2 لمدة 48 ساعة + BSA (المركب)، IL-10 KO + BSA (المركب) أو IL-10 KO + 25 ميكرومول 18:1 BMDMs (لكل مجموعة). ج) إجمالي أنواع السيراميدات المقاسة مباشرة حقن MS من 48 ساعة من BMDMs المعززة بواسطة TLR2 مع IL-10 KO بالإضافة إلى BSA أو BSA-18:1 للآخرخريطة حرارية لأنواع السيراميد الفردية المقاسة بواسطة قياس الطيف الكتلي بالتسريب المباشر من WT + BSA (العقار) المنشط بواسطة TLR2 لمدة 48 ساعة، IL-10 KO + BSA (العقار) أو IL-10 KO + 25 ميكرومتر 18:1 BMDMs ( لكل مجموعة). مقاسة حسب الصف (أنواع الدهون). I) تحليل qPCR للتعبير الجيني لـ Il6 و Il1b في 48 ساعة من تنشيط TLR2 (تم تزويد خلايا BMDMs WT المعالجة بـ Pam3CysK4) بـ CholPC (العقار) أو Cer24:0 أو Cer24:1 خلال آخر 44 ساعة من التنشيط.لكل مجموعة). تم إعطاء جميع السيراميدات بتركيز نهائي قدره 30 ميكرومول. تحليل qPCR لتعبير جين Cxcl1 في 48 ساعة من تنشيط TLR2 (Pam3CysK4) WT BMDMs +/- DMSO (المركب)، 10 نانومولار SCDi (Cay10566) +/- BSA أولآخر 44 ساعة. ك) الأنواع الكاملة والمشبعة وغير المشبعة من السيراميد التي تم قياسها بواسطة MS من الحقن المباشر من BMDMs WT غير المنشطة أو المنشطة بواسطة TLR2 لمدة 48 ساعة +/- DMSO (العقار)، 10 نانومتر SCDi (Cay10566) +/- BSA أو 25 ميكرومتر 18:1 لآخر 44 ساعة. ل) الأنواع السيراميد التي تم قياسها بواسطة MS من الحقن المباشر من BMDMs WT غير المنشطة أو المنشطة بواسطة TLR2 لمدة 48 ساعة +/- DMSO (العقار)، 10 نانومتر SCDi (Cay10566) +/- BSA أولـ 44 ساعة الماضية. جميع التجارب تم الإبلاغ عنها كمتوسطاتالانحراف المعياري من 3 تجارب مستقلة، ما لم يُذكر خلاف ذلك.; ، اختبار ستودنت غير المتزاوج ذو الذيليناختبار).
الشكل 6 من البيانات الموسعة | الأحماض الدهنية الأحادية غير المشبعة تنظم تخليق السيراميد الجديد. أ. التخليق الصافي (نانو مول/مليون خلية) لحمض الأوليك (18:1) وحمض النخيل (16:0) كما تم قياسه بواسطة تحليل تتبع نظائر التدفق الأيضي في الخلايا السليمة أو الخلايا المنشطة بواسطة TLR2 لمدة 48 ساعة.Pam3CSK4) WT (الأشرطة البيضاء) أو SCD2 cKO (الأشرطة الخضراء) BMDMs لكل مجموعة). ب. إجمالي الخلوي ( مليون خلية) وفرة حمض الأوليك (18:1) وحمض النخيل (16:0) وحمض اللينوليك (18:2) كما تم قياسه بواسطة تحليل GCMS للخلايا الساذجة أو الخلايا المنشطة بواسطة TLR2 لمدة 48 ساعة (Pam3CSK4) WT (الأشرطة البيضاء) أو SCD2 cKO (الأشرطة الخضراء) BMDMsتم قياس السفينغوزين المعلم بواسطة LC-MS من خلايا BMDM المنشطة بواسطة TLR2 لمدة 48 ساعة (الأشرطة البيضاء) أو SCD2 cKO (الأشرطة الخضراء).لكل مجموعة). د. إجمالي الأنواع المشبعة وغير المشبعة من السيراميدات التي تم قياسها بواسطة MS من الحقن المباشر من Cre+ WT (LysM Cre+/-SCD2) غير المنشطة أو المنشطة بواسطة TLR2. ) و SCD2 cKO (LysM Creبمدم لكل مجموعة). هـ. إجمالي السفينغوزين المقاس بواسطة
LC-MS من خلايا BMDMs المنشطة بواسطة TLR2 لمدة 48 ساعة (الأعمدة البيضاء)، SCD2 cKO (الأعمدة الخضراء) أو SCD2 cKO + 10 نانومتر ميرياسين (الأعمدة الزرقاء). تم إضافة الميرياسين إلى الثقافة خلال آخر 24 ساعة من التحفيز لمدة 48 ساعة. لكل مجموعة). تم قياس F. Cer24:0 بواسطة LC-MS من خلايا BMDMs المنشطة بواسطة TLR2 لمدة 48 ساعة (الأعمدة البيضاء) ، SCD2 cKO (الأعمدة الخضراء) أو SCD2 cKO +10 نانومتر ميرياسين (الأعمدة الزرقاء). تم إضافة ميرياسين إلى الثقافة خلال آخر 24 ساعة من التحفيز لمدة 48 ساعة.تحليل qPCR للتعبير الجيني الالتهابي من خلايا BMDM التي تم تنشيطها بواسطة TLR2 لمدة 48 ساعة (الأشرطة البيضاء) ، SCD2 cKO (الأشرطة الخضراء) أو SCD2 cKO + 10 نانومتر ميرياسين (الأشرطة الزرقاء). تم إضافة الميرياسين إلى الثقافة خلال آخر 24 ساعة من التحفيز لمدة 48 ساعة.لكل مجموعة). جميع التجارب مُبلغ عنها كمتوسطاتالانحراف المعياري من 3 تجارب مستقلة، ما لم يُذكر خلاف ذلك.; اختبار ستودنت غير المتزاوج ذو الذيليناختبار).
الشكل البياني الممتد 7| انظر الصفحة التالية للتعليق.
الشكل البياني الممتد 7 | SCD2 والأحماض الدهنية غير المشبعة المتعددة تنظم الالتهاب القولوني. A) تحليل خلايا المناعة باستخدام تقنية تدفق الخلايا من الغشاء المخاطي القولوني من المجموعة الضابطة (LysM Cre +/-) و SCD2 cKO (LysM Cre +/-Scd2ذكور الفئران الساذجة لكل جينوتيب). ب) تحليل ELISA لـ IL-12B (IL12p40) من نسيج القولون المستخرج من مجموعة التحكم السليمة (LysM Cre +/-) و SCD2 cKO (LysM Cre +/-Scd2ذكور الفئران التي تم حضانتها خارج الجسم لمدة 24 ساعة.بناءً على النمط الجيني). ج) تحليل خلايا المناعة باستخدام تقنية قياس التدفق الخلوي من الغشاء المخاطي القولوني من المجموعة الضابطة (LysM Cre +/-) و SCD2 cKO (LysM Cre +/-Scd2إناث الفئران التي تم جمعها في اليوم الثاني عشر من تحدي DSSفقدان الوزن المقاس خلال التهاب القولون الناتج عن DSS في مجموعة التحكم (LysM Cre +/-)، والإناث الحاملة للهيتيرو زيجوت SCD2 (Het) (LysM Cre +/-, Scd2 flox/WT) وSCD2 cKO (LysM Cre +/- Scd2 flox/flox). لكل مجموعة). تشير النجوم الحمراء إلى الفروق الإحصائية بين الفئران الضابطة وفئران SCD2 cKO، بينما تمثل النجوم السوداء الفروق الإحصائية بين الفئران الضابطة وفئران Het. لا توجد فروق إحصائية في فقدان الوزن بين حيوانات SCD2 cHet و SCD2 cKO. تمثل أشرطة الخطأ
خطأ المعيار للمتوسط (SEM). E) تحليل ELISA للليبوكالين من براز اليوم 0: الفئران الهجينة (het) مقابل فئران IL-10R KO، (جميع الفئران ذكور). F) تحليل ELISA للليبوكالين من براز اليوم 0: الفئران الإناث IL-10 KO مقابل اليوم 14: الفئران IL-10 KO التي تم تغذيتها بـ BSA أو BSA-18:1 (جميع الفئران إناث). G) تحليل تدفق الخلايا القائم على تدفق الخلايا لتوصيف الخلايا النخاعية من الغشاء المخاطي القولوني للفئران الهجينة (het) التي تم تغذيتها بـ BSA، فئران IL-10R KO التي تم تغذيتها بـ BSA أو فئران IL-10R KO التي تم تغذيتها بـ BSA-24:1 (جميع الفئران ذكور). H) تحليل تدفق الخلايا القائم على تدفق الخلايا لتوصيف الخلايا النخاعية من الغشاء المخاطي القولوني للفئران WT التي تم تغذيتها بـ BSA، فئران IL-10 KO التي تم تغذيتها بـ BSA أو فئران IL-10 KO التي تم تغذيتها بـ BSA-18:1 (جميع الفئران إناث). I) تحليل تدفق الخلايا القائم على تدفق الخلايا لتوصيف الخلايا النخاعية من الغشاء المخاطي القولوني للفئران الهجينة (het) التي تم تغذيتها بـ BSA، فئران IL-10R KO التي تم تغذيتها بـ BSA أو فئران IL-10R KO التي تم تغذيتها بـ BSA-16:0 (جميع الفئران ذكور). جميع التجارب تم الإبلاغ عنها كمتوسطات.الانحراف المعياري من 3 تجارب مستقلة، ما لم يُذكر خلاف ذلك.اختبار ستودنت غير المتزاوج ذو الذيليناختبار).
الشكل البياني الموسع | انظر الصفحة التالية للتعليق.
الشكل البياني الموسع-تم تحفيز الالتهاب الناتج عن السيراميد بواسطة Rel. A) تحليل ELISA لـ IL-1B من السوبرناتات الخاصة بخلايا BMDMs من النوع البري (WT) التي تم تنشيطها بواسطة ligand TLR2، وتم علاجها بـ CholPC (المركب الضابط)، Cer22:0، Cer24:0 لمدة 48 ساعة. كان التحكم في النيجرسين هو 1 ساعة من الحضانة بعد 48 ساعة من تحضير ligand TLR2. تم توصيل جميع الدهون بتركيز نهائي قدره 30 ميكرومول. B) تحليل qPCR للتعبير الجيني الالتهابي في خلايا BMDMs من النوع البري (WT) أو KO NLRP3 التي تم تنشيطها بواسطة ligand TLR2 (تم تحفيز ماكروفاج TLR2 باستخدام Pam3CysK4 لمدة 48 ساعة. تم حضن ماكروفاج TLR2 المحفز مع صفائح الدهون Cholesteryl:Phosphatidylcholine (CholPC) بمفردها أو مع CholPC المحملة بالسيراميد 24:0 (Cer24:0) خلال آخر 44 ساعة من التحفيز.لكل مجموعة). تم إعطاء جميع الدهون بتركيز نهائي قدره 30 ميكرومول. ج) تحليل الوسترن بلوت لاستخراجات النواة من العينات السليمة،“، و 48 ساعة من BMDMs المعززة بـ TLR2 من النوع البري و KO IL-10R لـ RelA و cRel و TBP (تحكم التحميل). تمثيلي لـتجارب فردية. D) تحليل Western blot لمستخلصات خلايا كاملة من BMDMs WT و IL-10R KO المعززة بواسطة TLR2 لمدة 1 ساعة أو 24 ساعة ل c-Rel و Ik و -توبولين (تحكم التحميل). E) تحليل الوسترن بلوت لاستخراجات نووية من البلعميات البريتونية البرية غير المنشطة أو المنشطة بواسطة TLR2 لمدة 24 ساعة بالإضافة إلى CholPC (العقار الوهمي)، Cer16:0، Cer24:0 أو جسم مضاد محايد ضد IL-10R ( ) لآخر 20 ساعة من التنشيط لـ cRel و TBP (تحكم التحميل).
تمثيل لـ 4 تجارب فردية. F) تحليل Western blot لمستخلصات الخلايا الكاملة من BMDMs WT المفعلة بواسطة TLR2 لمدة 24 ساعة والمعالجة بـ CholPC أو 30 ميكرومتر Cer24:0 أو BMDMs KO IL-10R لـ Ik و -توبولين (تحكم التحميل). تمثيلي لـتجارب فردية. G) تحليل Western blot لاستخراجات النواة و lysates الخلوية الكاملة من BMDMs WT أو c-Rel KO غير المنشطة أو المنشطة بواسطة TLR2 لمدة 48 ساعة (المشار إليها باللون الأحمر) بالإضافة إلى CholPC (العقار) أو 30 ميكرومتر Cer24:0 خلال آخر 44 ساعة من التنشيط لـ RelA و c-Rel مع B-Tubulin و TBP كضوابط تحميل. تم إجراء عملية التلطيخ لـ RelA بالتوازي مع cRel و B Tub و TBP. تمثيلي لـتجارب فردية. H) تحليل qPCR للتعبير الجيني الالتهابي في خلايا TLR4 المنشطة لمدة 48 ساعة ( LPS) WT أو cRel KO BMDMs بالإضافة إلى CholPC (العقار الوهمي)، 30 ميكرومتر Cer22:0 أو 30 ميكرومتر Cer24:0 لآخر 44 ساعة من التنشيط (أنواع السيراميد في خلايا بون مارrow المستخرجة من الفئران البرية (WT) والفئران المعدلة وراثيًا (c-Rel KO) التي تم تنشيطها بواسطة ligand TLR2Pam3CysK4) لمدة 48 ساعة تم قياسها بواسطة قياس الطيف الكتلي بالتسريب المباشر ). ج) إجمالي Cer24:0 بعد إضافة 30 ميكرومتر Cer24:0 الخارجي إلى خلايا BMDMs من النوع البري أو KO c-Rel المفعلة بواسطة ligand TLR2 ( Pam3CysK4 لمدة 48 ساعة تم قياسه بواسطة قياس الطيف الكتلي بالتسريب المباشر ). جميع التجارب مُبلغ عنها كمتوسطات الانحراف المعياري من 3 تجارب مستقلة، ما لم يُذكر خلاف ذلك.; اختبار ستودنت غير المتزاوج ذو الذيليناختبار).
مقالة
+TLR2 ligand
أ.
ب.
الشكل 9 من البيانات الموسعة | c-Rel مطلوب لالتهاب المرحلة المتأخرة في المختبر وفي الجسم الحي. أ. تحليل Western blot لاستخراجات نووية من خلايا غير معالجة أو خلايا تم تنشيطها بواسطة TLR2 لمدة 48 ساعة من Cre+ WT (LysM Cre +/-SCD2 ) و SCD2 cKO (LysM Cre +/Scd2 ) بالإضافة إلى BSA أو BSA-18:1 لآخر 44 ساعة من التفعيل لـ cRel و TBP (تحكم التحميل). تمثيلي لـ تجارب فردية. ب. تحليل qPCR للتعبير الجيني الالتهابي في خلايا TLR2 المفعلة لمدة ساعة واحدةبروتين Pam3CysK4) WT أو خلايا بون مار ديريفد ماكروفاج (BMDMs) من نوع c-Rel KOتحليل qPCR للتعبير الجيني الالتهابي في 48 ساعة من تنشيط TLR2 (بروتين Pam3CysK4) WT، IL-10 KO أو IL-10/c-Rel DKO BMDMs (تحليل qPCR للتعبير الجيني الالتهابي في خلايا BMDMs من النوع البري أو KO cRel المفعلة بواسطة TLR2 لمدة 48 ساعة + أجسام مضادة محايدة لـ IL-10R ( ) ، Cer24:0 لآخر 44 ساعة من التفعيل (تحليل ELISA لـ IL-12B (IL12p40) من زراعة القولون لفئران ذكرية من النوع البري (WT) أو الفئران المعدلة وراثيًا IL-10 KO أو IL-10/cREL DKO التي تم حضانتها خارج الجسم لمدة 24 ساعة.تحليل ELISA للليبوكالين البرازي من الفئران WT و IL-10 KO و IL-10/c-Rel DKO” ). تحليل خلايا المناعة المستند إلى قياس التدفق من الغشاء المخاطي القولوني من ذكور الفئران البرية WT، IL-10 KO أو IL-10/c-Rel DKO ( ). جميع التجارب مُبلغ عنها كمتوسطات الانحراف المعياري من 3 تجارب مستقلة، ما لم يُذكر خلاف ذلك.; ، اختبار ستودنت غير المتزاوج ذو الذيليناختبار).
محفظة الطبيعة
أوتوم يورك، ستيفن بنسنجر، ريتشارد المؤلف(المؤلفون) المراسلون: فلافيل آخر تحديث بواسطة المؤلفين: 01/09/2024
ملخص التقرير
تتمنى Nature Portfolio تحسين إمكانية تكرار العمل الذي ننشره. يوفر هذا النموذج هيكلًا للاتساق والشفافية في التقرير. لمزيد من المعلومات حول سياسات Nature Portfolio، يرجى الاطلاع على سياسات التحرير وقائمة مراجعة سياسة التحرير.
الإحصائيات
لجميع التحليلات الإحصائية، تأكد من أن العناصر التالية موجودة في أسطورة الشكل، أسطورة الجدول، النص الرئيسي، أو قسم الطرق.
مؤكد
حجم العينة بالضبط ( ) لكل مجموعة/شرط تجريبي، معطاة كرقم منفصل ووحدة قياس
بيان حول ما إذا كانت القياسات قد أُخذت من عينات متميزة أو ما إذا كانت نفس العينة قد تم قياسها عدة مرات
اختبار(ات) الإحصاء المستخدمة وما إذا كانت أحادية الجانب أو ثنائية الجانب يجب أن تُوصف الاختبارات الشائعة فقط بالاسم؛ واصفًا التقنيات الأكثر تعقيدًا في قسم الطرق.
وصف لجميع المتغيرات المشتركة التي تم اختبارها
وصف لأي افتراضات أو تصحيحات، مثل اختبارات الطبيعية والتعديل للمقارنات المتعددة
وصف كامل للمعلمات الإحصائية بما في ذلك الاتجاه المركزي (مثل المتوسطات) أو تقديرات أساسية أخرى (مثل معامل الانحدار) و التباين (مثل الانحراف المعياري) أو تقديرات مرتبطة بعدم اليقين (مثل فترات الثقة)
لاختبار الفرضية الصفرية، إحصائية الاختبار (على سبيل المثال، ) مع فترات الثقة، أحجام التأثير، درجات الحرية وقيمة ملحوظة أعطِالقيم كقيم دقيقة كلما كان ذلك مناسبًا.
لتحليل بايزي، معلومات حول اختيار القيم الأولية وإعدادات سلسلة ماركوف مونت كارلو للتصاميم الهرمية والمعقدة، تحديد المستوى المناسب للاختبارات والتقارير الكاملة عن النتائج تقديرات أحجام التأثير (مثل حجم تأثير كوهين)بيرسون )، مما يشير إلى كيفية حسابها تحتوي مجموعتنا على الإنترنت حول الإحصائيات لعلماء الأحياء على مقالات تتناول العديد من النقاط المذكورة أعلاه.
البرمجيات والشيفرة
معلومات السياسة حول توفر كود الكمبيوتر جمع البيانات تم جمع جميع بيانات تحليل تدفق الخلايا باستخدام برنامج FACSDiva 7. وتم جمع بيانات الدهون باستخدام منصة Sciex Lipidyzer (Sciex 5500 مع DMS وShimadzu LC-30).
تحليل البيانات لتحليل البيانات الإحصائية والرسوم البيانية، استخدمنا GraphPad Prism 9.0 و Microsoft Excel الإصدار 16.33. تم تحليل بيانات تدفق الخلايا باستخدام FlowJo (الإصدار من 9 إلى 10.6.1). تم إجراء تحليل بيانات الدهون باستخدام برنامج Lipidyzer (الإصدار 1.0). تم تحليل التجارب اللاحقة باستخدام مساعد الدهون Shotgun (SLA الإصدار 1.3).
بالنسبة للمخطوطات التي تستخدم خوارزميات أو برامج مخصصة تكون مركزية في البحث ولكن لم يتم وصفها بعد في الأدبيات المنشورة، يجب أن تكون البرمجيات متاحة للمحررين والمراجعين. نحن نشجع بشدة على إيداع الشيفرة في مستودع مجتمعي (مثل GitHub). راجع إرشادات مجموعة Nature لتقديم الشيفرة والبرمجيات لمزيد من المعلومات.
بيانات
معلومات السياسة حول توفر البيانات يجب أن تتضمن جميع المخطوطات بيانًا حول توفر البيانات. يجب أن يتضمن هذا البيان المعلومات التالية، حيثما ينطبق:
رموز الانضمام، معرفات فريدة، أو روابط ويب لمجموعات البيانات المتاحة للجمهور
وصف لأي قيود على توفر البيانات
بالنسبة لمجموعات البيانات السريرية أو بيانات الطرف الثالث، يرجى التأكد من أن البيان يتماشى مع سياستنا
مشاركون في البحث البشري
معلومات السياسة حول الدراسات التي تشمل المشاركين في الأبحاث البشرية والجنس والنوع في البحث.
التقارير عن الجنس والنوع الاجتماعي
غير متوفر
خصائص السكان
غير متوفر
التوظيف
غير متوفر
رقابة الأخلاقيات
غير متوفر
يرجى ملاحظة أنه يجب أيضًا تقديم معلومات كاملة حول الموافقة على بروتوكول الدراسة في المخطوطة.
التقارير المتخصصة في المجال
يرجى اختيار الخيار أدناه الذي يناسب بحثك بشكل أفضل. إذا لم تكن متأكدًا، اقرأ الأقسام المناسبة قبل اتخاذ قرارك. علوم الحياة العلوم السلوكية والاجتماعية العلوم البيئية والتطورية والبيئية لنسخة مرجعية من الوثيقة بجميع الأقسام، انظرnature.com/documents/nr-reporting-summary-flat.pdf
تصميم دراسة العلوم الحياتية
يجب على جميع الدراسات الإفصاح عن هذه النقاط حتى عندما يكون الإفصاح سلبياً.
حجم العينة
لأن تجارب الفئران الحية، تم تحديد أحجام العينات بناءً على توفر الفئران وكانت أكبر حجم ممكن.
استثناءات البيانات
لا شيء
التكرار
تم إعادة إنتاج جميع التجارب بشكل مستقل كما هو مذكور في أساطير الأشكال.
العشوائية
تم تخصيص الحيوانات حسب النمط الجيني لمعظم التجارب الحية. لم يكن هناك حاجة للتوزيع العشوائي في تجاربنا، حيث تم تحليل الفئران بناءً على نمطها الجيني. بالنسبة لتجارب إعطاء MUFA، تم فحص مجموعات كبيرة من فئران IL-10 أو IL-10R KO في البداية بوسائل غير جراحية (ليبوسين البراز) لتحديد حالة الالتهاب في القولون. تم تقسيم الحيوانات إلى مجموعتين بمتوسطات متساوية من ليبوسين البراز (تم قياسها بواسطة اختبار T لطلاب ذو طرفين) لإجراء تجارب مقارنة إضافية.
مُعَمي
لم يكن المحققون معزولين عن تخصيص المجموعات خلال جمع البيانات أو تحليلها. لم تكن العزل ذات صلة بدراستنا نظرًا لأن معظم الملاحظات التي تم إجراؤها في هذه الدراسة كانت قائمة على تحليل تدفق الخلايا، وتم تأكيد الأنماط الجينية/الظروف للعناصر عدة مرات قبل وبعد التحليل.
التقارير عن مواد وأنظمة وطرق محددة
نحتاج إلى معلومات من المؤلفين حول بعض أنواع المواد والأنظمة التجريبية والأساليب المستخدمة في العديد من الدراسات. هنا، يرجى الإشارة إلى ما إذا كانت كل مادة أو نظام أو طريقة مدرجة ذات صلة بدراستك. إذا لم تكن متأكدًا مما إذا كان عنصر القائمة ينطبق على بحثك، يرجى قراءة القسم المناسب قبل اختيار رد.
المواد والأنظمة التجريبية
طرق
غير متوفر
مشارك في الدراسة
غير متوفر
مشارك في الدراسة
الأجسام المضادة
تسلسل شريحة الكروماتين
تدفق الخلايا
علم الحفريات وعلم الآثار
الأجسام المضادة
الأجسام المضادة المستخدمة
أجسام مضادة لتدفق الخلايا: بيوليجند: PerCPCy5.5- Cd45.2 (النسخة 104)، رقم الكاتالوج 109828؛ AF700- Cd45.2 (النسخة 104)، رقم الكاتالوج 109822؛ BV421 CD45.1 (النسخة A20)، رقم الكاتالوج
110731; BV711 Cd11b (Clone M1/70)، رقم الكاتالوج# 101242 APC CD11c (Clone N418)، رقم الكاتالوج# 117310؛ AF700 MHC II (I-A/I-E، clone M5/114.15.2)، رقم الكاتالوج# 107628؛ PE CD64 (clone X54-5/7.1)، رقم الكاتالوج# 139303؛ APC Cy7 Epcam (clone G8.8)، رقم الكاتالوج# 118218؛ AF488 Ly6G (clone 1A8)، رقم الكاتالوج# 127262؛ BV605 Ly6C (clone HK1.4)، رقم الكاتالوج# 128036؛ BV711 TCRb (clone H57-597)، رقم الكاتالوج# 109243؛ BV605 CD4 (clone RM4-5)، رقم الكاتالوج# 100548؛ PE IFNg (clone XMG1.2)، رقم الكاتالوج# 505808؛ FITC CD19 (clone 6D5) رقم الكاتالوج# 115506؛
BD Pharmagen: APC IL-17A (النسخة TC11-18H10)، رقم الكات# 560184؛ صبغة صلاحية قابلة للإصلاح BD Horizon BV510 (BD #564406). لـ Western blots: c-REL (سانتا كروز #SC-71)؛ RelA (Cell Signaling #8242)؛ TBP (Cell Signaling، النسخة D5C9H)، رقم الكاتالوج 44059S؛ Tubulin (Cell Signaling، النسخة 9F3)، رقم الكاتالوج 2128S
التحقق جميع الأجسام المضادة متاحة تجارياً. تم التحقق من صحة الأجسام المضادة المستخدمة في تحليل التدفق الخلوي من قبل الشركة المصنعة عبر تحليل التدفق الخلوي. تم التحقق من صحة الأجسام المضادة المستخدمة في تحليل الوسترن بلوت من قبل الشركة المصنعة من خلال تحليل الوسترن بلوت. نحن أيضاً قمنا بالتحقق من صحة جسم مضاد c-Rel المستخدم في تحليل الوسترن بلوت مع حيواناتنا التي تعاني من نقص Rel.
الحيوانات وغيرها من الكائنات البحثية
معلومات السياسة حول الدراسات التي تشمل الحيوانات؛ إرشادات ARRIVE الموصى بها للإبلاغ عن أبحاث الحيوانات، والجنس والنوع في البحث
الحيوانات المخبرية
الحيوانات البرية
التقارير عن الجنس عينات تم جمعها من الميدان رقابة الأخلاقيات
تم شراء بقع الفئران التالية من مختبر جاكس: WT C57BL/6 (JAX 000664)، IL-10 KO (JAX #002251)، IL-10R KO (JAX #005027)، CD45.1 PepBoy (Jax #002014) وLysM-Cre+/- (JAX #004781). تم إنتاج CerS2 وSCD2 Flox/Flox في مختبر فلافيل وهي متاحة عند الطلب. كانت الفئران…أسابيع للاستخدام التجريبي. تم وضع الفئران في غرف تحتوي على 14 ساعة من الضوء و10 ساعات من الظلام في غرف maintained at 21.5 درجة مئوية معرطوبة الغرفة.
لا شيء
تم استخدام مجموعات من الحيوانات الذكور أو مجموعات من الحيوانات الإناث في دراساتنا. لم يتم استخدام أي حيوانات تم جمعها من الميدان في هذه الدراسة تم إجراء جميع تجارب الحيوانات وفقًا لبروتوكولات لجنة رعاية واستخدام الحيوانات في جامعة ييل.
يرجى ملاحظة أنه يجب أيضًا تقديم معلومات كاملة حول الموافقة على بروتوكول الدراسة في المخطوطة.
تدفق الخلايا
المؤامرات
أكد أن: توضح تسميات المحاور العلامة والفلوركروم المستخدم (مثل CD4-FITC). المقاييس على المحاور مرئية بوضوح. قم بتضمين الأرقام على المحاور فقط للرسم البياني في أسفل اليسار من المجموعة (المجموعة هي تحليل للعلامات المتطابقة). جميع الرسوم البيانية هي رسوم بيانية متساوية الارتفاع مع نقاط شاذة أو رسوم بيانية بالألوان الزائفة. تم توفير قيمة عددية لعدد الخلايا أو النسبة المئوية (مع الإحصائيات).
المنهجية
تحضير العينة
آلة
برمجيات وفرة تجمع الخلايا
عزل خلايا المناعة من الطبقة تحت المخاطية في القولون: تم جمع القولونات، وغسلها بـ 10 مل من محلول فوسفات البفر، ثم تم تقسيمها بالطول، وغسلها مرة أخرى في محلول فوسفات البفر. تم إزالة الجزء الظهاري باستخدام غسلتين كل منهما 10 مل من محلول غسيل الظهارة.EDTA، 1 مللي مول DTT) عند 37 درجة مئوية لمدة 20 دقيقة مع الاهتزاز بسرعة 220 دورة في الدقيقة. تم إزالة القولون من محلول Epi Wash Buffer، وغسلها في PBS وقطعها بدقة باستخدام شفرة حلاقة. تم نقل الأنسجة المقطعة إلى 5 مل من محلول الهضم (دي إم إي إمكولاجيناز دتمت معالجة العينات باستخدام DNAase وتم تحضينها عند 37 درجة مئوية لمدة 60 دقيقة مع الاهتزاز بسرعة 220 دورة في الدقيقة. بعد الهضم، تم تصفية العينات من خلال فلتر بفتحة 70 ميكرومتر وغسلها.معدي إم إي إم FBS. ثم تم تقسيم الخلايا إلى 5 مجموعات للوحات صبغ مختلفة. تم صبغ الخلايا بالأجسام المضادة (تخفيف) وصبغة حيوية قابلة للإصلاح (تخفيف) عند 4 درجات لمدة 30 دقيقة في محلول FACS (2% FBS في PBS)، تم غسلها مرتين، وتشغيلها على الفور على جهاز LSR2 أو تثبيتها (BD Cytofix/CytoPerm #554722) للتلوين داخل الخلايا باستخدام أجسام مضادة للسيتوكينات.تم استخدام كرات عد الخلايا AccuCheck (Invitrogen PCB100) لت quantification عدد الخلايا. تم جمع جميع بيانات تحليل الخلايا باستخدام BD LSR2s مع برنامج FACSDiva 7. تم تحليل بيانات تحليل الخلايا باستخدام FlowJo (من الإصدار 9 إلى 10.6.1).
تم إجراء التحليلات على جهاز تحليل التدفق BD LSR II، وتم فرز الخلايا باستخدام جهاز فرز الخلايا BD FACSAria II.
تم جمع جميع بيانات تحليل التدفق الخلوي باستخدام برنامج FACSDiva 7 وتم تحليلها بواسطة FlowJo (الإصدار 9 إلى 10.6.1). تم توفير وفرة من تجمعات الخلايا في كل شكل.
قم بتحديد هذا المربع لتأكيد أنه تم تقديم رقم يوضح استراتيجية البوابة في المعلومات التكميلية.
قسم المناعة البيولوجية، جامعة ييل، نيو هافن، كونيتيكت، الولايات المتحدة الأمريكية.معهد هوارد هيوز الطبي، جامعة ييل، نيو هافن، كونيتيكت، الولايات المتحدة الأمريكية.قسم الكيمياء، جامعة ييل، نيو هافن، كونيتيكت، الولايات المتحدة الأمريكية.معهد التصميم والاكتشاف الجزيئي الحيوي، جامعة ييل، ويست هافن، كونيتيكت، الولايات المتحدة الأمريكية.برنامج البيولوجيا الحاسوبية والمعلوماتية الحيوية، جامعة ييل، نيو هافن، كونيتيكت، الولايات المتحدة الأمريكية.قسم الميكروبيولوجيا، المناعة وعلم الوراثة الجزيئية، جامعة كاليفورنيا، لوس أنجلوس، كاليفورنيا، الولايات المتحدة الأمريكية.قسم الكيمياء الحيوية، كلية ديفيد غيفن للطب، جامعة كاليفورنيا، لوس أنجلوس قسم المناعة، كلية الطب، جامعة واشنطن، سياتل، واشنطن، الولايات المتحدة الأمريكية.البريد الإلكتروني: AGYork@UW.edu; SBensinger@mednet.ucla.edu; Richard.Flavell@yale.edu
Autumn G. York , Mathias H. Skadow , Joonseok , Rihao Qu , Quan D. Zhou , Wei-Yuan Hsieh , Walter K. Mowel , J. Richard Brewer , Eleanna Kaffe , Kevin J. Williams , Yuval Kluger , Stephen T. Smale , Jason M. Crawford , Steven J. Bensinger Richard A. Flavell
Abstract
Interleukin-10 (IL-10) is a key anti-inflammatory cytokine that can limit immune cell activation and cytokine production in innate immune cell types . Loss of IL-10 signalling results in life-threatening inflammatory bowel disease in humans and mice-however, the exact mechanism by which IL-10 signalling subdues inflammation remains unclear . Here we find that increased saturated very long chain (VLC) ceramides are critical for the heightened inflammatory gene expression that is a hallmark of IL-10 deficiency. Accordingly, genetic deletion of ceramide synthase 2 (encoded by Cers2), the enzyme responsible for VLC ceramide production, limited the exacerbated inflammatory gene expression programme associated with IL-10 deficiency both in vitro and in vivo. The accumulation of saturated VLC ceramides was regulated by a decrease in metabolic flux through the de novo mono-unsaturated fatty acid synthesis pathway. Restoring mono-unsaturated fatty acid availability to cells deficient in IL-10 signalling limited saturated VLC ceramide production and the associated inflammation. Mechanistically, we find that persistent inflammation mediated by VLC ceramides is largely dependent on sustained activity of REL, an immuno-modulatory transcription factor. Together, these data indicate that an IL-10-driven fatty acid desaturation programme rewires VLC ceramide accumulation and aberrant activation of REL. These studies support the idea that fatty acid homeostasis in innate immune cells serves as a key regulatory node to control pathologic inflammation and suggests that ‘metabolic correction’ of VLC homeostasis could be an important strategy to normalize dysregulated inflammation caused by the absence of IL-10.
IL-10 is an anti-inflammatory cytokine that limits immune activation of innate and adaptive immune cells .IL-10 signalling has an important role in modulating mucosal inflammation in the intestine, and deletion of the cytokine or its receptor (IL-10R) results in severe inflammatory bowel disease (IBD) in both mouse and humans . Despite the clear importance of IL-10 in maintaining intestinal homeostasis, the exact mechanism of how IL-10-IL-10R signalling reduces inflammation is not well understood. Accumulated work has revealed that inflammatory signals rapidly rewire lipid metabolic programmes of immune cells to support inflammation and effector functions, leading to the hypothesis that anti-inflammatory cytokines such as IL-10 may direct changes in lipid metabolism to counteract inflammatory stimuli. Here we test this supposition and uncover a role for IL-10 signalling in the regulation of sphingolipid metabolism in macrophages downstream of toll-like receptor 2 (TLR2). In the absence of IL-10, we find that TLR2-activated macrophages have increased metabolic flux through the de novo sphingolipid biosynthesis pathway, resulting in the accumulation of
endogenously synthesized ceramides. We found that increased levels of saturated VLC ceramides specifically contributed to inflammatory phenotypes both in vitro and in vivo. Surprisingly, altered sphingolipid metabolism in IL-10 deficient cells was mediated by reduced synthesis of mono-unsaturated fatty acids (MUFAs), and could be corrected by providing exogenous MUFAs. We find that the prolonged inflammatory gene expression programme enforced by altered VLC ceramide homeostasis requires the NF-кB family transcription factor REL. These studies provide strong evidence that coordinate regulation of lipid metabolism by IL-10 is necessary to constrain REL-dependent pathologic inflammation and suggest that targeting specific aspects of lipid homeostasis in the intestine could control aberrant inflammation underlying IBD.
IL-10 regulates sphingolipid metabolism
Previous work has shown that inflammatory TLR signals profoundly reshape the lipid composition of macrophages to influence effector
function . IL-10 is produced downstream of select TLRs to promote the resolution of inflammation, leading us to explore whether IL-10 signalling was required for lipid metabolic reprogramming downstream of TLR2 activation. To that end, we compared lipid profiles of naive or TLR2-activated wild-type and IllO-knockout (KO) bone marrow-derived macrophages (BMDMs) using targeted shotgun lipidomic analysis. We detected approximately 1,100 lipid species from 13 lipid subclasses. Principal component analysis of lipidomics data showed that naive wild-type and II1O-KO macrophages were largely similar for principal components PC1 and PC2 (Fig. 1a). PC1 captured approximately 80% of the variance observed in TLR2-activated macrophages in wild-type and Il10-KO macrophages. PC2 (8% of variance) delineated the influence of IL-10 signalling of lipid composition downstream of TLR2 (Fig. 1a). Closer inspection of lipids influenced specifically by IL-10 signalling after TLR2 activation revealed a marked accumulation of ceramides, modified ceramides (hexosyl ceramides and lactosyl ceramides), and a decrease in sphingomyelins (Fig. 1b-d and Extended Data Fig. 1a).
Ceramides and sphingomyelins contain a sphingoid base and an N -acylated fatty acyl chain of variable length (Extended Data Fig. 1b). Mammalian cells generate ceramides with acyl tail lengths of 14-18 carbons (long chain sphingolipids) or 20 or more carbons (VLC sphingolipids) that can be saturated (no double bonds) or mono-unsaturated (one double bond) (Extended Data Fig. 1c). Using our methodology, we were able to consistently quantify sphingolipid species with saturated and mono-unsaturated acyl tails from 16-24 carbons in macrophage samples. Compared with wild-type counterparts, all species of ceramides and all hexosyl ceramides were increased in activated Il10-KO macrophages (Extended Data Fig. 1d,e). By contrast, all unsaturated sphingomyelins and several saturated sphingomyelins were decreased in the II1O-KO macrophages (Extended Data Fig. 1f).
To test if this observation was true in vivo, we preformed lipdiomic analysis on ex vivo peritoneal macrophages collected from wild-type or Il1O-KO mice that received TLR2 agonists via intraperitoneal injection. In line with our in vitro results, we find that IL-10 deficient ex vivo macrophages exhibit significant increases in many ceramide species (Fig. 1e and Extended Data Fig. 1g) and significant decreases in mono-unsaturated sphingomyelin species (Extended Data Fig. 1g). Thus, we conclude that IL-10 signalling regulates sphingolipid metabolism of macrophages in response to inflammatory stimuli both in vitro and in vivo.
Ceramides can be generated via a de novo synthesis pathway and can be further modified to generate complex sphingolipids such as sphingomyelins, and lactosyl- or hexosyl-modified ceramides. Alternatively, salvage pathways can convert downstream products back to ceramides. (Fig. 1c) (reviewed in ref. 16). Several studies have found that inflammation can affect sphingolipid salvage pathways , but less is known about how inflammatory signals affect the regulation of de novo sphingolipid synthesis. To understand whether IL-10 signalling influences ceramide synthesis, we analysed flux into the de novo sphingolipid synthesis pathway using stable-isotope tracers. Macrophage cultures were fed -serine (U denotes universally labelled), a required metabolite for the first step of sphingolipid synthesis (Fig.1c). Targeted liquid chromatography mass spectrometry (LC-MS) of macrophages deficient in IL-10 signalling (II1O-KO or II1Orb-KO) contained more total and isotope-labelled sphinganine compared with wild-type controls (Fig. 1f and Extended Data Fig. 1h), indicating that increased de novo ceramide synthesis contributes to the aberrant accumulation of ceramides observed in macrophages that lack IL-10 signalling.
We next tested whether accumulation of ceramides contributes to inflammatory gene expression programme of TLR2-activated macrophages. To do so, we generated lipid bilayers consisting of cholesteryl-phosphocholine that were either left empty (denoted CholPC) or complexed with ceramide 16:0 (Cer16:0, the most abundant long chain ceramide) or ceramide 24:0 (Cer24:0, the most abundant VLC ceramide) (Extended Data Fig. 1d). As expected, exogenous
Fig. 1 | IL-10 signalling regulates sphingolipid metabolism. a, Principal component analysis (PCA) of individual lipids quantified by mass spectrometry from naive or TLR2-activated ( Pam3CysK4) wild-type and II1O-KO BMDMs for 48 h . The percentage of total variance explained by individual principal components (PC1 and PC2) is indicated. Prediction ellipses are set at 95% probability ( ). b, Heat map of individual lipid species measured by direct infusion mass spectrometry from naive BMDMs (left two columns) or TLR2-activated BMDMs (right two columns) stimulated as in a. Scaled by row (lipid species). Bolded text indicates* between TLR2-activated wild-type and II10-KO BMDMs. CE, cholesteryl esters; Cer, ceramides; DAG, diacylglycerols; FFA, free fatty acids; HCer, hexosyl ceramides; LCer, lactosyl ceramides;LPC,lysophosphatidylcholine;LPE,lysophosphatidylethanolamine; PC, phosphatidylcholine; PE, phosphatidylethanolamine; SM, sphingomyelins; TAG, triglycerides. c, Simplified schematic of sphingolipid metabolism. Ceramides are generated by de novo synthesis pathway at the endoplasmic reticulum. Ceramides can be further modified to generate hexosyl and lactosyl ceramides (modified ceramides), which can be broken back down into ceramides. Ceramides serve as the building blocks for all sphingomyelin species, which can also be broken down into ceramides. d, Total ceramides and sphingomyelin species measured by direct infusion mass spectrometry from BMDMs stimulated as in . e, Ceramide species measured by direct infusion mass spectrometry from ex vivo peritoneal macrophages collected from wild-type and II10-KO mice after 48 h TLR2 ligand ( Pam3CysK4 per mouse) administered via intraperitoneal injection ( ). f, LC-MS analysis of total and labelled sphinganine in 48 h TLR2-activated wild-type and IIIO-KO BMDMs. ( ). g, Quantitative PCR ( qPCR ) analysis of inflammatory gene expression in naive BMDMs or BMDMs activated with TLR2 ligand ( Pam3CysK4) for 24 h . TLR2-activated macrophages were incubated with cholesteryl:phosphatidylcholine (cholPC) alone or with cholPC loaded with Cer16:0 or Cer24:0 or cholPC plus neutralizing anti-IL-10R ( ) for the last 20 h of the activation ( for each group). All lipids administered at a final concentration of . All data are mean of biological replicates s.d. (two-tailed unpaired Student’s -test).
ceramides increased downstream sphingolipids metabolites without largely altering other lipid classes (Extended Data Fig. 2a-d). In naive macrophages, cholPC or ceramides alone did not affect inflammatory gene expression (Extended Data Fig. 2e). Similarly, the addition of Cer16:0 to TLR2-activated wild-type macrophages did not alter
Article
inflammatory gene expression. By contrast, addition of Cer24:0 upregulated inflammatory gene expression to levels similar to those seen in the absence of IL-10/IL-10R signalling (Fig. 1g), without affecting macrophage viability (Extended Data Fig. 2f). Addition of Cer22:0, the second most abundant VLC ceramide (Extended Data Fig. 1d), also induced inflammatory gene expression similar to that resulting from Cer24:0 addition (Extended Data Fig. 2g,h). Together, these data indicate that accumulation of VLC ceramides can enhance cytokine and chemokine gene expression in TLR-activated macrophages, and suggests that dysregulation of VLC ceramide homeostasis contributes to the exacerbated inflammation observed in IL-10 deficiency.
Loss of VLC ceramides limits inflammation
The length of the variable acyl tail (Extended Data Fig. 1b) incorporated into ceramides is specified during de novo synthesis by ceramide synthases (CerS) (Fig. 1c). In mouse and humans, there are six ceramide synthases (CerS1-6 (also known as Lass1-6)). RNA-sequencing (RNA-seq) data from naive and TLR2-activated wild-type and Il10-KO macrophages (matched to the lipidomics dataset; cells were prepared and stimulated at the same time as cells from the lipidomics experiments in Fig. 1 but were collected 24 h after TLR2 activation) showed that BMDMs highly express Cers2, Cers5 and Cers6 (Extended Data Fig. 3a). In non-immune cell types, CerS 2 is reported to regulate the synthesis of VLC ceramides Cer20:0-Cer26:0 . To determine whether CerS2 regulates VLC ceramides in macrophages, we generated Cers2-KO mice and performed lipidomics on BMDMs from knockout and control mice. Consistent with studies in non-immune cells, Cers2-KO BMDMs have nearly undetectable levels of ceramides with acyl chains longer than 20 carbons (Extended Data Fig. 3b), resulting in a net decrease in total ceramides (Extended Data Fig. 3c). Accordingly, loss of CerS2 markedly reduced the amount of VLC sphingomyelin species (Extended Data Fig. 3d). Thus, loss of CerS2 in TLR2-activated macrophages disrupts VLC ceramide and sphingomyelin homeostasis.
To determine whether CerS2 and its sphingolipid products are important for inflammation, we generated BMDMs from wild-type and Cers2-KO mice and activated them with TLR2 ligand. Whereas Cers2-heterozygous macrophages exhibited similar inflammatory gene expression to wild-type counterparts (Extended Data Fig. 3e), Cers2-KO macrophages showed significantly reduced inflammatory gene expression in response to TLR2 ligands (Fig. 2a) and did not fully induce inflammatory gene expression during IL-10R blockade (Extended Data Fig. 3f). This suggests that CerS2 function is important for TLR2-driven macrophage inflammation alone or in the context of IL-10 deficiency. In line with this idea, loss of CerS2 on the IL-10R-deficient background significantly reduced macrophage inflammatory gene expression in response to TLR2 (Fig. 2b and Extended Data Fig. 3g) and TLR4 ligands (Extended Data Fig. 3h). Notably, addition of exogenous Cer24:0, but not Cer16:0, restored inflammation in the Il1Orb/Cers2-DKO macrophages (Fig. 2b and Extended Data Fig. 3g), indicating that accumulation of VLC ceramides, the lipid products of CerS2, are important for mediating the increased inflammatory gene expression in IL-10-deficient macrophages.
Since loss of CerS2 reduced inflammatory gene expression in IL-10R-deficient macrophages, we hypothesized that CerS2 may be important for regulating the colonic inflammation that is the hallmark of II1O-KO or II1Orb-KO mice . We observed that Cers2-KO and Cers2and Il1Orb-double knockout (DKO) mice were small in stature, had spontaneous seizures, and often died before 10 weeks of age in our colony. This is consistent with phenotypes published by other groups that show that in vivo Cers2 deletion results in defects in myelin sheath production and spontaneous seizures . To circumvent complications resulting from these systemic issues, we generated bone marrow chimeras from CD45.2 Il1Orb (control) mice,Il1Orb-KO mice and Il1Orb/Cers2-DKO littermate mice into CD45.1 recipients. Microbial variation was
Fig. 2 | Genetic inhibition of VLC ceramide synthesis limits inflammation. a, qPCR analysis of Inflammatory gene expression in 48 h TLR2-activated
minimized by cohousing chimeric mice in a format for each donor genotype. Bedding was also transferred equally between cages every other week. At 10 weeks after engraftment, faecal samples from the chimeric mice were collected to quantify lipocalin, a canonical marker of colonic inflammation . At this timepoint, we observed no overt signs of colonic inflammation (for example, rectal prolapse or weight loss; data not shown). However, consistent with previous studies in whole-body Il1O-KO and Il1Orb-KO mice , Il1Orb-KO chimeric mice had significantly higher faecal lipocalin compared with control mice (Extended Data Fig.3i). Notably,Il1Orb/Cers2-DKO chimeric mice had reduced faecal lipocalin compared with IL-10R KO chimeric mice in both male and female mice (Extended Data Fig. 3i and data not shown). To further examine the importance of CerS2 in vivo, we collected colon tissue from the chimeric mice, isolated the immune cells from the colon lamina propria and assessed cell populations by flow cytometry (for gating strategies, see Supplementary Fig. 1). Consistent with previous studies ,Il1Orb-KO chimeras had increased inflammatory cell infiltrates, including macrophages, monocytes, neutrophils, total CD4 T cells, (IFN ) and (IL-17A ) cells (Fig. 2c and Extended Data Fig. 4a). Markedly, loss of CerS2 on the IL-10R-deficient background reduced immune cell infiltrates compared with the Il1Orb-KO chimeras (Fig. 2c and Extended Data Fig. 4a), indicating that synthesis of VLC ceramides is important for driving immune cell-mediated colitis in the absence of IL-10 signalling.
To further understand how CerS2 affects colonic homeostasis,we generated wild-type and Cers2 single-knockout chimeric mice.These chimeric mice were cohoused for 12 weeks and then immune cell popu- lations in the colonic lamina propria were analysed.In this model,there are no overt drivers of inflammation(such as loss of IL-10R),which enables us to determine whether CerS2 is important for normal immune cell homeostasis in the colon.Notably,we found no reduction in mono- cytes,neutrophils,total CD4 T cells, CD4 T cells or CD4 T cells in the colon lamina propria of Cers2-KO chimeric mice compared with wild-type controls(Extended Data Fig.4b).However,Cers2-KO chi- meric mice exhibited a reduction in macrophages( )and mature macrophages( )(Fig.2d),suggesting that under basal conditions,CerS2 is important for maintenance of colonic macrophage populations.Colonic macrophages are continually replen- ished in the'macrophage waterfall'22,23',in which circulating monocytes migrate to the colon,acquire CD11c and MHCII and eventually CD64 (encoded by Fcgr1),and become more responsive to TLR signalling, before becoming'tolerogenic'to maintain homeostasis in the colon. As macrophages are turned over,new macrophages mature to repopu- late the colon.To determine how loss of CerS2 affected macrophage homeostasis in vivo,we sorted CD45 immune cells from III1Orb-KO or Il1Orb/Cers2-DKO chimeric mice and single-cell transcriptomics performed on macrophages.Uniform manifold approximation and projection(UMAP)analysis revealed that colonic macrophages iso- lated from Il1Orb-KO chimeras grouped into five distinct clusters, with cluster 5 containing highly inflammatory cells(Fig.2e,f and Extended Data Fig.4c).Notably,Il1Orb/Cers2-DKO chimeras lacked cluster 5 and had reduced expression of inflammatory macrophage markers,cytokines and chemokines compared with Il1Orb-KO chime- ras(Fig.2e,f and Extended Data Fig.4c,d).Notably,CerS2-deficient macrophages showed high expression of CD206(encoded by Mrc1) and other tolerogenic markers,suggesting that loss of CerS2 may promote a more tolerogenic macrophage phenotype compared with loss of IL-10R alone(Extended Data Fig.4e,f).Together,these data indicate that loss of CerS2 on an IL-10R deficient background can mitigate immune cell infiltrates into the colon and reduce in vivo macrophage inflammatory gene expression compared with loss of IL-10R alone.
MUFA synthesis limits ceramide production
To better understand how ceramide synthesis was regulated in II10-KO cells,we examined all known genes required for sphingolipid metabo- lism from our matched lipidomics RNA-seq dataset(Extended Data Fig.5a).Although we found no difference in levels of sphingolipid gene mRNA across genotype or activation status,we observed that expres- sion of stearoyl-CoA desaturase 2 (Scd2)was significantly decreased in Il1O-KO BMDMs(Fig.3a and Extended Data Fig.5a,bottom row). SCD2 is part of the SCD family(SCD1-4)of 9-desaturases that are responsible for the synthesis of MUFAs from saturated long chain fatty acids .For example,SCDs convert saturated stearic acid(denoted 18:0)into mono-unsaturated oleic acid(denoted 18:1).MUFAs have been implicated in inflammation and sphingolipid homeostasis , but the direct mechanisms of the regulation of these pathways by fatty acid desaturation remain unclear.Our previous studies found that SCD enzymatic activity regulates inflammation downstream of TLR activa- tion ,leading us to hypothesize that altered MUFA synthesis could link inflammation and ceramide synthesis in IL-10-deficient macrophages. To determine whether the reduced gene expression observed in Il10-KO macrophages was sufficient to alter de novo MUFA synthe- sis,we performed stable-isotope tracer analysis on macrophages fed -glucose for 48 h with or without TLR2 activation.In line with our previous work,we found that TLR2 stimulation increased de novo lipogenesis in wild-type BMDMs resulting in an increase in both syn- thesized and total 18:1(Fig.3b).Macrophages lacking IL-10 did not fully
Fig.3|IL-10-induced mono-unsaturated fatty acid synthesis constrains ceramide production.a,qPCR analysis of Scd2 gene expression in naive or 24 h TLR2-activated wild-type or II1O-KO BMDMs .b,Synthesized and total oleic acid(18:1)from naive or 48 h TLR2-activated wild-type or II1O-KO BMDMs .c,qPCR analysis of and gene expression in 48 h TLR2-activated wild-type or Il10-KO BMDMs incubated with BSA,or BSA-16:0,BSA-18:1,BSA-18:2 or BSA-24:1 for the last .d,Saturated and unsaturated ceramide species from 48 h TLR2-activated wild-type or Il10-KO or Il10-KO BMDMs treated with for the last . e,Total ceramides species in naive or TLR2-activated LysM-cre wild-type and Scd2-cKO BMDMs .f,qPCR analysis of Cxcl1,Cxcl2 and Il6 gene expression in 48 h TLR2-activated wild-type BMDMs incubated with BSA,Scd2-cKO BMDMs incubated with BSA,and Scd2-cKO BMDMs incubated with BSA-18:1,BSA-18:2 or BSA-24:1 for the last .g,Enzyme-linked immunosorbent assay(ELISA)analysis of faecal lipocalin of control and Scd2-cKO male mice( ).h,Flow cytometry-based immune cell profiling of the colonic lamina propria from naive control and Scd2-cKO male mice ( ).i,DSS-induced weight loss in control and Scd2-cKO female mice ( ).Data are mean s.e.m.j,Flow cytometry-based immune cell profiling of the colonic lamina propria from Il1Orb-heterozygous(Het)male mice gavaged with BSA and II1Orb-KO male mice gavaged with BSA or BSA-24:1( ). ,ELISA analysis of IL-6 and IL-12 in colonic explants from Il1Orb-heterozygous mice gavaged with BSA and Il1Orb-KO male mice gavaged with BSA or BSA-24:1, incubated ex vivo for .All experiments are reported as mean of biological replicates s.d.unless noted otherwise. , (two-tailed unpaired Student's -test).
upregulate MUFA synthesis downstream of TLR2,resulting in reduced pools of synthesized and total 18:148 h after stimulation(Fig.3b).By contrast,palmitate(16:0)synthesis was unchanged and total cellular amounts of palmitate and linoleic acid(18:2),an imported polyun- saturated fatty acid,were not decreased(Extended Data Fig.5b,c). To determine whether altered MUFA content in II10-KO BMDMs was important for inflammation,we activated wild-type,II1O-KO,and Il1Orb-KO BMDMs with TLR2 ligand for 48 h and added back different bovine serum albumin(BSA)-conjugated free fatty acid species for the last 44 h .The addition of 18:1,which increased total 18:1 by approxi- mately twofold(Extended Data Fig.5d),reduced inflammatory gene
expression in the Il10-KO or Il1Orb-KO BMDMs (Fig. 3c and Extended Data Fig. 5e). Furthermore, addition of 24:1 (nervonic acid), an elongation product of 18:1, also reduced inflammatory gene expression in the Il10-KO BMDMs, whereas 16:0 and 18:2 did not (Fig. 3c and Extended Data Fig. 5e).
To test whether altered MUFA content in IL-10 deficient macrophages affected flux into the de novo sphingolipid synthesis pathway, we activated wild-type and Il1Orb-KO BMDMs with TLR2 ligands in medium containing U- C, N-serine with BSA or BSA-18:1. Notably, addition of exogenous 18:1 could blunt enhanced U- -serine incorporation into sphinganine in the Il1Orb-KO macrophages (Extended Data Fig. 5f). Next, we performed shotgun lipidomics to examine how replenishment of 18:1 in II10-KO BMDMs influenced ceramide homeostasis. We found that addition of 18:1 did not lower total ceramide abundance in the Il10-KO macrophages (Extended Data Fig. 5g), however, it significantly lowered the levels of saturated VLC ceramides, including Cer24:0 (Fig. 3d and Extended Data Fig. 5h). Notably, addition of 18:1 increased the amount of Cer24:1 and total mono-unsaturated ceramides (Fig. 3d and Extended Data Fig. 5h). Based on this result, we tested whether saturated and unsaturated VLC ceramides were equally responsible for heightened inflammation. In contrast to Cer24:0, exogenous Cer24:1 did not enhance inflammatory gene expression in macrophages (Extended Data Fig. 5i), indicating that only saturated VLC ceramides can drive an inflammatory phenotype.
Next, we sought to determine whether ceramide biosynthesis is influenced by macrophage de novo MUFA synthesis. In line with our Il10-KO data, we found that acute pharmacologic inhibition of SCDs (denoted SCDi) increased inflammatory gene expression, total ceramides and all ceramide species (Extended Data Fig. 5j-1). Similar to IL-10 deletion, the observed increase in inflammatory gene expression produced by SCDi could be mitigated by the addition of 18:1 (Extended Data Fig. 5j). Additionally, exogenous 18:1 blocked the excess accumulation of all saturated VLC ceramides in SCDi-treated macrophages (Extended Data Fig. 5k,l). Notably, addition of exogenous 18:1 did not alter VLC ceramide species with mono-unsaturated tails (with Cer24:1 being the most dominant unsaturated species) (Extended Data Fig. 5k,l). Thus, SCD activity and the pool size of 18:1 appears to specifically regulate the amounts of saturated VLC ceramides.
Genetic deletion of Scd2 is embryonic lethal in mice . To determine the influence of SCD2 on inflammation in vivo, we generated mice and crossed them to LysM-cre mice to generate mice with myeloid-specific deletion of SCD2 (denoted Scd2-cKO). Analogous to II10-KO BMDMs, Scd2-cKO BMDMs exhibited a similar reduction in synthesized and total 18:1, without affecting synthesized 16:0, total 16:0 and total 18:2 lipid species (Extended Data Fig. 6a,b). Notably, Scd2-cKO macrophages showed increased synthesis of sphinganine (Extended Data Fig. 6c) and accumulation of total and saturated VLC ceramides (Fig. 3e and Extended Data Fig. 6d), similar to Il1O-KOs. Similarly, we observed increased inflammatory gene expression in Scd2-cKO macrophages in response to TLR2 activation that could be reduced by the addition of 18:1 or 24:1, but not 18:2 (Fig. 3f). To validate whether ceramides were important for enhanced inflammatory gene expression, we treated TLR2-activated Scd2-cKO BMDMs with myriocin, an inhibitor of serine palmitoyl transferase long chain base subunit 2 (SPTLC2). Myriocin treatment reduced sphinganine levels (Extended Data Fig. 6e), produced a trending decrease in Cer24:0 (Extended Data Fig. 6f), and reduced some inflammatory gene expression without affecting cell viability (Extended Data Fig. 6g and data not shown). These data suggest that flux into the ceramide de novo synthesis pathway is important for inflammatory phenotypes in SCD2-deficient macrophages. Together, these findings suggest that an inability to upregulate MUFA synthesis is a major underlying cause for accumulation of saturated ceramides and increased inflammation in IL-10 deficiency.
In line with our in vitro data, Scd2-cKO mice exhibited a basal elevation of faecal lipocalin compared with cohoused littermate
controls (Fig. 3g). Additionally, there were increased numbers of macrophages in the colon of Scd2-cKO mice, with no difference in neutrophil or monocyte populations (Fig. 3h and Extended Data Fig. 7a; for gating strategy, see Supplementary Fig. 2). Scd2-cKO mice also had increased numbers of IFN and IL-17A CD4 T cells (Fig. 3h), indicating that myeloid-specific SCD2 expression affects T cell activation in the colon. In support of this idea, ex vivo colonic explants from Scd2-cKO mice produced more soluble IL-12p40 compared with tissue collected from cohoused cre littermate controls (Extended Data Fig. 7b). We hypothesized that the increased basal inflammation found in the Scd2-cKO mice might predispose these mice to models of chemically-induced colitis, such as dextran sodium sulfate (DSS). Similar to previously published studies in IL-10 deficient mice , we found that DSS-treated Scd2-cKO mice lost significantly more weight than the cohoused littermate control mice, and had significantly increased numbers of infiltrating myeloid and lymphoid immune cells in the colon lamina propria (Fig. 3i and Extended Data Fig. 7c). SCD2 conditional heterozygous mice had an intermediary phenotype in response to DSS-induced colitis (Extended Data Fig. 7d). In sum, the phenotypes observed in SCD2-deficient macrophages and mice recapitulate phenotypes in macrophages and mice lacking IL-10 signalling.
Since exogenous MUFAs could limit inflammation in IL-10 deficient macrophages, and loss of myeloid-specific SCD2 resulted in increased colonic inflammation, we reasoned that exogenous MUFAs could reduce colonic inflammation in the II1O-KO or Il1Orb-KO mice. To test this, we started with two groups of Il1Orb-KO mice and two groups of Il10-KO mice that had similar levels of colonic inflammation, as measured by faecal lipocalin content (Extended Data Fig. 7e,f). For each genotype, one group of mice was orally gavaged with BSA, the carrier protein used to solubilize free fatty acids, or with BSA conjugated to 18:1 or 24:1. Mice were gavaged for 14 days before colonic tissue was collected for immune cell analysis and cytokine secretion. Markedly, MUFA gavage significantly reduced faecal lipocalin compared with BSA alone (Extended Data Fig. 7f). Furthermore, MUFA gavage reduced myeloid and lymphoid immune cell populations in the colon and reduced secretion of IL-6 and IL-12p40 from colonic explants (Fig. 3j,k and Extended Data Fig. 7g,h), at levels similar to those resulting from ablation of CerS2 (Fig. 2c and Extended Data Fig. 5a). Conversely, 16:0 gavage did not affect myeloid cell infiltration in wild-type or Il1Orb-KO mice (Extended Data Fig. 7i). Together, these data support the idea that upregulation of MUFA synthesis in macrophages serves as a negative feedback mechanism downstream of IL-10 signalling to dampen inflammation, and that MUFA availability in macrophages has an important role in the control intestinal inflammation.
VLC ceramides do not activate the inflammasome
Next, we sought to determine the mechanism by which VLC ceramides enhance inflammation. Previous studies have suggested that the NLRP3 inflammasome may be important for ceramide-induced pathology in adipose tissue . To test whether VLC ceramides induced inflammasome activation, we performed ELISAs to detect cleaved IL-1 in the supernatants of macrophages treated with VLC ceramides. Despite an increase in Ill b mRNA levels in response to VLC ceramides (Fig. 1g), neither Cer22:0 nor Cer24:0 induced IL-1 cleavage and secretion, in contrast to the strong induction of IL-1 cleavage and secretion induced by nigericin treatment (Extended Data Fig. 8a). Moreover, loss of NLRP3 activity did not influence VLC ceramide-mediated enhancement of inflammatory gene expression in BMDMs (Extended Data Fig. 8b), indicating that the NLRP3 inflammasome is not involved in ceramide-mediated inflammation in this system. These observations are consistent with previously published data indicating that de novo ceramide biogenesis is not required for NLRP3 inflammasome activation .
REL is required for ceramide-induced inflammation
It is widely accepted that IL-10 signalling acts at the level of transcription to repress inflammatory gene expression; however, the exact steps that govern this process remain unclear . Consistent with this idea, we observed elevated nuclear levels of the NF-к family transcription factors REL (also known as cRel) and RELA (also known as p65) only at late timepoints ( 24 and 48 h ) after TLR2 activation in II10-KO macrophages, without alterations in initial transcription factor nuclear translocation (Extended Data Fig. 8c) or IкB degradation and re-accumulation patterns (Extended Data Fig. 8d). This led us to hypothesize that increased VLC ceramides may have a role only in late-stage inflammatory responses that are characteristic of IL-10 deficiency. To test this idea, we pretreated BMDMs with cholPC or Cer24:0 for 48 h , followed by a brief 1 h TLR2 stimulation. Inflammatory gene expression patterns of cells pretreated with lipid were compared to BMDMs activated with TLR2 ligands for 48 h and with exogenous Cer24:0 for the last 44 h of activation (as in our previous experiments). Pretreatment with Cer24:0 did not alter early induction of inflammatory genes, but resulted in prolonged expression at later timepoints (Fig. 4a). We also found that Cer24:0 treatment, but not Cer16:0 treatment, resulted in increased nuclear REL and RELA after 24 h and 48 h TLR2 activation (Fig. 4b and Extended Data Fig. 8e), without affecting total cellular amounts of (Extended Data Fig. 8f), REL or RELA (Extended Data Fig. 8f,g), similar to results from IL-10 deficiency (Extended Data Fig. 8c-e).
RELA and REL are related transcription factors that can homodimerize with themselves or heterodimerize with one another to induce inflammatory gene expression . RELA is absolutely required for the initial induction of inflammatory cytokines and chemokines in activated macrophages and other immune and non-immune cells . REL is thought to have a more limited role in inflammation, in which only TLR-mediated induction of Il12a and Il12b is strongly dependent on REL in myeloid cells . We observed dysregulation of Il12 and Il12 in most of our in vitro and in vivo experiments, leading us to hypothesize that saturated VLC ceramides (such as Cer24:0) influence inflammation by specifically modulating REL activity. In line with this idea, Rel-KO BMDMs displayed reduced inflammatory gene expression in response to VLC ceramides when activated with TLR2 or TLR4 ligands (Fig. 4c and Extended Data Fig. 8h). Markedly, endogenous ceramide levels and exogenous ceramide uptake were not altered by REL deficiency, suggesting that REL is downstream of ceramide-induced inflammation (Extended Data Fig. 8i, j). Markedly, we found that loss of REL abrogated Cer24:0-mediated induction of RELA (Fig. 4d and Extended Data Fig. 8g), suggesting that the pool size of VLC ceramides may directly regulate REL, and that enhanced RELA nuclear localization is either dependent on dimerization with REL or is mediated by signals downstream of REL activation.
In complementary studies, we found that SCDi-mediated induction of inflammatory genes is dependent on REL (Fig. 4e), and that SCDi treatment or conditional knockout of Scd2 can induce REL nuclear localization in macrophages, which can be mitigated by addition of exogenous 18:1 (Fig. 4 f and Extended Data Fig. 9a). Moreover, nuclear localization of REL in Il10-KO or Il1Orb-KO macrophages was also limited by addition of 18:1 (Fig. 4f) or 24:1 (Fig. 4g), whereas changes in localization of RELA were less affected. Together, these data indicate that REL has an essential role in VLC ceramide-mediated induction of inflammatory genes, and is largely responsible for enhanced inflammatory phenotypes found in IL-10 or MUFA-deficient mice and macrophages.
Owing to its role in lipid-mediated inflammation, we hypothesized that REL may have a broader role in regulating inflammation than previously described. Consistent with previous results , we found that REL is required for induction of Il12b gene expression, but not other cytokine or chemokine genes, after 1 h TLR2 activation (Extended Data Fig. 9b). However, after 48 h , genetic deletion of Rel in Il10-KO mice
Fig. 4 | REL is required for ceramide-mediated induction of inflammatory gene expression. a, qPCR analysis of inflammatory gene expression in BMDMs pretreated with Cer24:0 for 48 h , followed by 1 h activation with TLR2 ligand ( Pam3CSK4) versus 48 h TLR2 activation with Cer24:0 treatment ( ). b, Western blot analysis of RELA, REL and TBP (loading control) from nuclear extracts from naive or 48 h TLR2-activated wild-type peritoneal macrophages plus cholPC (vehicle), Cer16:0, or Cer24:0 for the last 44 h of the activation. Representative of three individual experiments. analysis of inflammatory gene expression in 48 h TLR2-activated wild-type or Rel-KO BMDMs plus cholPC (vehicle) or Cer24:0 for the last 44 h of activation ( ). d, Western blot analysis of RELA, REL and TBP (loading control) from nuclear extracts from naive or 48 h TLR2-activated wild-type or Rel-KO BMDMs plus cholPC (vehicle) or Cer24:0 for the last 44 h of activation. RELA was blotted in parallel with REL and TBP. Representative of two individual experiments. e, qPCR analysis of inflammatory gene expression in 48 h TLR2-activated wild-type or Rel-KO BMDMs with or without 10 nM SCDi (Cay10566) for the last 44 h of activation ( ). Veh, vehicle.f, Western blot analysis of REL, RELA and TBP (loading control) in nuclear extracts from naive or 48 h TLR2-activated wild-type or II10-KO BMDMs plus SCDi, BSA or BSA-18:1 for the last 44 h of the activation. Representative of three individual experiments. g, Western blot analysis of nuclear extracts from naive or 48 h TLR2-activated wild-type or Il1Orb-KO BMDMs plus BSA or for the last 44 h of the activation for RELA, REL and TBP (loading control). Representative of two experiments. All experiments are reported as mean of biological replicates s.d. (two-tailed unpaired Student’s -test).
(Il1O/Rel-DKO mice) completely ablated the enhanced inflammatory gene expression back to wild-type levels (Extended Data Fig. 9c), indicating that REL is critical for late-stage inflammatory gene expression in Il10-KO macrophages. Furthermore, REL was required for full induction of inflammatory gene expression in response to IL-10R neutralization alone and in combination with Cer24:0 addition (Extended Data Fig. 9d) after 48 h of TLR2 activation, which supports the hypothesis that REL is crucial for saturated VLC ceramide-driven inflammation caused
by IL-10 deficiency. Furthermore, Il10/Rel-DKO mice exhibit reduced colonic secretion of IL-12p40 (Extended Data Fig. 9e), reduced faecal lipocalin (Extended Data Fig. 9f) and reduced myeloid cell numbers in the colon lamina propria compared with II1O-KO mice (Extended Data Fig. 9 g ), indicating that REL is critical for maintaining unresolved inflammation in IL-10-deficient macrophages and mice.
Discussion
In this study we mechanistically delineate crosstalk between known transcriptional regulators of the immune response, lipid metabolism and intestinal homeostasis. Here, we uncover a previously undescribed mechanism by which the anti-inflammatory cytokine IL-10 regulates the duration of inflammation. Specifically, in the absence of IL-10 signalling, we find enhanced flux into the de novo sphingolipid synthesis pathway, resulting in the accumulation of VLC ceramides that promote inflammatory gene expression. Unexpectedly, we found that altered sphingolipid production was not mediated by transcript levels of genes encoding enzymes in the synthesis pathway (Extended Data Fig. 5a). Instead, changes in ceramide biogenesis were traced to the ability of IL-10 to control Scd2 gene expression and subsequent synthesis of long chain MUFAs (Fig. 3a,b). Notably, pharmacologic inhibition or genetic deletion of SCD2 engaged the de novo ceramide synthesis pathway in a similar manner to IL-10 deletion (Fig. 3e and Extended Data Figs. 5k,1 and ). There are few known checkpoints that regulate flux into the de novo ceramide synthesis pathway, and how de novo MUFA synthesis antagonizes this pathway remains unclear. One possibility is that when MUFA synthesis is limited, this results in an increase in saturated fatty acid precursors such as palmitate. The condensation of palmitoyl-CoA and serine is the first step in ceramide de novo synthesis pathway and is required for the generation of all downstream sphingolipid metabolites. Indeed, IL-10 deficiency slightly increases total cellular palmitate in macrophages (Extended Data Fig. 5c). However, genetic deletion of SCD2, which also blunts MUFA synthesis and increases total ceramides, does not affect total or synthesized palmitate (Extended Data Fig. 6a,b), suggesting that other mechanisms of regulation are more likely. Notably, we find that SCDi treatment or conditional knockout of increases the amount of most ceramide species regardless of saturation of the N-acylated tail (Extended Data Figs. 51 and 6d). This suggests that MUFAs are not limiting with regard to the ceramide acyl tail and may have a broader role in regulating flux into ceramide biogenesis outside of substrate availability. Thus, another possibility is that IL-10-mediated MUFA synthesis may engage the activity of orosomucoid (ORM) family proteins. ORM proteins antagonize serine palmitoyl transferases such as SPTLC2 to reduce flux into the sphingolipid pathway . Notably, ORMs are known to influence airway inflammation and have been reported to be controlled by other metabolic programmes . Further biochemical analysis will be required to fully examine what factors are required for the effect of IL-10 signalling and MUFAs on ceramide de novo synthesis.
Many previous studies examining the influence of ceramides on inflammation and apoptosis utilize short chain C2 ceramide analogues that are not endogenously synthesized by mammalian cells. Here we focus on long chain and VLC ceramides that are produced endogenously by immune cells, and find that exogenous addition of long chain and VLC ceramides-in contrast to C2 ceramide-do not appear to induce cell death or drive inflammasome activation. Additionally, we observe that only saturated VLC ceramides, but not their long chain counterparts, can enhance macrophage inflammation (Fig. 1g and Extended Data Fig. 2g,h), providing experimental evidence for results predicted in silico . Furthermore, we identify that the ‘desaturation status’ of the tails of VLC ceramides is an additional feature that is critical for modulating the magnitude of macrophage inflammation (Extended Data Fig. 5i). These findings suggest a remarkable degree of specificity in how VLC ceramides convey information to the inflammation
machinery, and it will be important for in future studies to focus on how saturated but not unsaturated VLC ceramides mediate inflammatory gene expression. Additionally, further studies are required to explore how downstream sphingolipid metabolites affect inflammation. For example, VLC ceramide treatments increase VLC hexosyl ceramides (Extended Data Fig. 2c), which are thought to be ligands for CD1d, a noncanonical MHCII required for activation of invariant natural killer T cells . Further, it remains unknown how IL-10 signalling affects the generation of sphingosine-1-phosphate, a highly bioactive lipid that is known for this critical role in adaptive immune cell trafficking (reviewed in refs. 56,57). Thus, further studies are required to fully elucidate the role IL-10 signalling and the sphingolipidome in macrophages. It is also worth noting that loss of IL-10 signalling reduces most saturated and all mono-unsaturated sphingomyelins (Fig. 1d and Extended Data Fig. 1f). This could be due to a reduction in MUFAs (Fig.3b), perturbed endoplasmic reticulum-to-Golgi transport that is required for sphingomyelin synthesis, or enhanced sphingomyelin degradation. Enhanced sphingomyelin degradation has been observed in response to inflammatory cytokine signalling in immune cell types , but the exact mechanism for how increased sphingomyelin degradation influences inflammation remains poorly understood. Further studies are required to determine if and how IL-10 signalling affects sphingolipid salvage pathways.
We found that the persistent inflammation observed in response to VLC ceramides or the absence of MUFA synthesis could be traced to sustained activity of the NF-кB family member REL. Crosstalk between IL-10 and REL has previously been studied in macrophages , but the observation that REL transcriptional activity can be influenced by fatty acid desaturation downstream of IL-10 signalling strengthens the idea that manipulation of fatty acid homeostasis is directly linked with immune cell activation. We also provide strong evidence that REL is pivotal for persistent inflammatory gene expression in the absence of IL-10 signalling and is critical for inflammatory gene expression outside of Il12a and Il12b, its prototypic targets in myeloid cells . Thus, identification of lipid sensor signalling pathways that regulate REL activity may serve as new targets to modulate the aberrant inflammation observed in a broad array of metabolic and sterile inflammatory diseases. The exact mechanism by which saturated VLC ceramides specifically direct REL cellular location remains unclear and will be an important topic of future studies. Why REL nuclear location is more greatly affected than RELA in response to VLC ceramides also remains unclear-this may be due to inflammatory kinetics, transcription factor-specific post-translational modifications, or unknown signalling cascades that target specific NF-кB family members. Further studies will be required to fully understand how VLC ceramides engage with REL activation.
Finally, we find that genetic reduction of VLC ceramides or oral gavage with MUFAs can reduce colonic inflammation found in IL-10- or IL-10R-deficient mice (Fig. 2c-f and Extended Data Figs. 3i-k, 4a-d and , suggesting that regulation of de novo lipid synthesis pathways is important for the maintenance of colonic homeostasis and health. Humans with deleterious mutations in IL-10 or IL-10R present with severe, life-threatening enterocolitis within the first few months of life. These individuals do not respond positively to standard forms of immune suppression such as anti-TNF biologicals or steroids. Besides haematopoietic stem cell transplant, there is no effective treatment option for IBD in people who lack functional IL-10 signalling . Intriguingly, dietary intervention with the Mediterranean diet, which is high in unsaturated fats, has been shown to reduce disease parameters in patients with IBD in as little as six months . A key component of the Mediterranean diet is olive oil, which is high in MUFAs. Thus, it is tempting to speculate that the benefits of the Mediterranean diet may be dependent, in part, on MUFA-mediated repression of colonic inflammation via changes in VLC ceramide metabolism. Indeed, our mouse data strongly suggest that oral delivery of exogenous MUFAs
can beneficially curb inflammation in the colon and may serve to establish new treatments for colitis focused on fatty acid ‘metabolite correction’.
Online content
Any methods, additional references, Nature Portfolio reporting summaries, source data, extended data, supplementary information, acknowledgements, peer review information; details of author contributions and competing interests; and statements of data and code availability are available at https://doi.org/10.1038/s41586-024-07098-5.
Saraiva, M. & O’Garra, A. The regulation of IL-10 production by immune cells. Nat. Rev. Immunol. 10, 170-181 (2010).
Zhu, L. et al. IL-10 and IL-10 receptor mutations in very early onset inflammatory bowel disease. Gastroenterology Res. 10, 65-69 (2017).
Glocker, E. O., Kotlarz, D., Klein, C., Shah, N. & Grimbacher, B. IL-10 and IL-10 receptor defects in humans. Ann. NY Acad. Sci. 1246, 102-107 (2011).
Li, B., Alli, R., Vogel, P. & Geiger, T. L. IL-10 modulates DSS-induced colitis through a macrophage-ROS-NO axis. Mucosal Immunol. 7, 869-878 (2014).
Groux, H. & Cottrez, F. The complex role of interleukin-10 in autoimmunity. J. Autoimmun. 20, 281-285 (2003).
O’Neill, L. A. & Pearce, E. J. Immunometabolism governs dendritic cell and macrophage function. J. Exp. Med. 213, 15-23 (2016).
Kelly, B. & O’Neill, L. A. Metabolic reprogramming in macrophages and dendritic cells in innate immunity. Cell Res. 25, 771-784 (2015).
Dang, E. V., McDonald, J. G., Russell, D. W. & Cyster, J. G. Oxysterol restraint of cholesterol synthesis prevents AIM2 inflammasome activation. Cell 171, 1057-1071.e1011 (2017).
York, A. G. et al. Limiting cholesterol biosynthetic flux spontaneously engages type I IFN signaling. Cell 163, 1716-1729 (2015).
Hsieh, W. Y. et al. Toll-like receptors induce signal-specific reprogramming of the macrophage lipidome. Cell Metab. 32, 128-143.e125 (2020).
Zhou, Q. D. et al. Interferon-mediated reprogramming of membrane cholesterol to evade bacterial toxins. Nat. Immunol. 21, 746-755 (2020).
Reboldi, A. et al. 25-Hydroxycholesterol suppresses interleukin-1-driven inflammation downstream of type I interferon. Science 345, 679-684 (2014).
Mukhopadhyay, S. et al. Loss of IL-10 signaling in macrophages limits bacterial killing driven by prostaglandin E2. J. Exp. Med. 217, e20180649 (2020).
Apostolidis, S. A. et al. Phosphatase PP2A is requisite for the function of regulatory T cells. Nat. Immunol. 17, 556-564 (2016).
Hannun, Y. A. & Obeid, L. M. Sphingolipids and their metabolism in physiology and disease. Nat. Rev. Mol. Cell Biol. 19, 175-191 (2018).
Maceyka, M. & Spiegel, S. Sphingolipid metabolites in inflammatory disease. Nature 510, 58-67 (2014).
Al-Rashed, F. et al. Neutral sphingomyelinase 2 regulates inflammatory responses in monocytes/macrophages induced by TNF-a. Sci Rep. 10, 16802 (2020).
Sakata, A. et al. Acid sphingomyelinase inhibition suppresses lipopolysaccharidemediated release of inflammatory cytokines from macrophages and protects against disease pathology in dextran sulphate sodium-induced colitis in mice. Immunology 122, 54-64 (2007).
Laviad, E. L. et al. Characterization of ceramide synthase 2: tissue distribution, substrate specificity, and inhibition by sphingosine 1-phosphate. J. Biol. Chem. 283, 5677-5684 (2008).
Imgrund, S. et al. Adult ceramide synthase 2 (CERS2)-deficient mice exhibit myelin sheath defects, cerebellar degeneration, and hepatocarcinomas. J. Biol. Chem. 284, 33549-33560 (2009).
Chassaing, B. et al. Fecal lipocalin 2, a sensitive and broadly dynamic non-invasive biomarker for intestinal inflammation. PLoS ONE 7, e44328 (2012).
Bain, C. C. & Schridde, A. Origin, differentiation, and function of intestinal macrophages. Front. Immunol. 9, 2733 (2018).
Muller, P. A., Matheis, F. & Mucida, D. Gut macrophages: key players in intestinal immunity and tissue physiology. Curr. Opin. Immunol. 62, 54-61 (2020).
Bain, C. C. et al. Resident and pro-inflammatory macrophages in the colon represent alternative context-dependent fates of the same Ly6C monocyte precursors. Mucosal Immunol. 6, 498-510 (2013).
van Vliet, S. J., Paessens, L. C., Broks-van den Berg, V. C., Geijtenbeek, T. B. & van Kooyk, Y. The C -type lectin macrophage galactose-type lectin impedes migration of immature APCs. J. Immunol. 181, 3148-3155 (2008).
Shouval, D. S. et al. Interleukin-10 receptor signaling in innate immune cells regulates mucosal immune tolerance and anti-inflammatory macrophage function. Immunity 40, 706-719 (2014).
Yu, T. et al. Modulation of M2 macrophage polarization by the crosstalk between Stat6 and Trim24. Nat. Commun. 10, 4353 (2019).
Peckert-Maier, K. et al. CD83 expressed by macrophages is an important immune checkpoint molecule for the resolution of inflammation. Front. Immunol. 14, 1085742 (2023).
O’Neill, L. M. et al. Stearoyl-CoA desaturase-2 in murine development, metabolism, and disease. Int. J. Mol. Sci. 21, 8619 (2020).
Ackerman, D. et al. Triglycerides promote lipid homeostasis during hypoxic stress by balancing fatty acid saturation. Cell Rep. 24, 2596-2605.e2595 (2018).
Xu, C., Song, D., Holck, A. L., Zhou, Y. & Liu, R. Identifying lipid metabolites influenced by oleic acid administration using high-performance liquid chromatography-mass spectrometry-based lipidomics. ACS Omega 5, 11314-11323 (2020).
Hung, H. C. et al. Dietary fatty acids differentially affect secretion of pro-inflammatory cytokines in human THP-1 monocytes. Sci. Rep. 13, 5511 (2023).
Howe, A. M., Burke, S., O’Reilly, M. E., McGillicuddy, F. C. & Costello, D. A. Palmitic acid and oleic acid differently modulate TLR2-mediated inflammatory responses in microglia and macrophages. Mol. Neurobiol. 59, 2348-2362 (2022).
Vandanmagsar, B. et al. The NLRP3 inflammasome instigates obesity-induced inflammation and insulin resistance. Nat. Med. 17, 179-188 (2011).
Jin, C. & Flavell, R. A. Molecular mechanism of NLRP3 inflammasome activation. J. Clin. Immunol. 30, 628-631 (2010).
Camell, C. D. et al. Macrophage-specific de novo synthesis of ceramide is dispensable for inflammasome-driven inflammation and insulin resistance in obesity. J. Biol. Chem. 290, 29402-29413 (2015).
Murray, P. J. The primary mechanism of the IL-10-regulated antiinflammatory response is to selectively inhibit transcription. Proc. Natl Acad. Sci. USA 102, 8686-8691 (2005).
Wang, P., Wu, P., Siegel, M. I., Egan, R. W. & Billah, M. M. Interleukin (IL)-10 inhibits nuclear factor activation in human monocytes. IL-10 and IL-4 suppress cytokine synthesis by different mechanisms. J. Biol. Chem. 270, 9558-9563 (1995).
Schottelius, A. J., Mayo, M. W., Sartor, R. B. & Baldwin, A. S. Jr. Interleukin-10 signaling blocks inhibitor of kB kinase activity and nuclear factor kB DNA binding. J. Biol. Chem. 274, 31868-31874 (1999).
Gilmore, T. D. & Gerondakis, S. The c-Rel transcription factor in development and disease. Genes Cancer 2, 695-711 (2011).
Oeckinghaus, A. & Ghosh, S. The NF-kB family of transcription factors and its regulation. Cold Spring Harb. Perspect. Biol. 1, a000034 (2009).
Hayden, M. S. & Ghosh, S. Shared principles in NF-кB signaling. Cell 132, 344-362 (2008).
Ouaaz, F., Li, M. & Beg, A. A. A critical role for the RelA subunit of nuclear factor kB in regulation of multiple immune-response genes and in Fas-induced cell death. J. Exp. Med. 189, 999-1004 (1999).
Pittet, L. A. et al. Earliest innate immune responses require macrophage RelA during pneumococcal pneumonia. Am. J. Respir. Cell Mol. Biol. 45, 573-581 (2011).
Hoffmann, A. & Baltimore, D. Circuitry of nuclear factor kB signaling. Immunol. Rev. 210, 171-186 (2006).
Sanjabi, S. et al. A c-Rel subdomain responsible for enhanced DNA-binding affinity and selective gene activation. Genes Dev. 19, 2138-2151 (2005).
Sanjabi, S., Hoffmann, A., Liou, H. C., Baltimore, D. & Smale, S. T. Selective requirement for c-Rel during IL-12 P40 gene induction in macrophages. Proc. Natl Acad. Sci. USA 97, 12705-12710 (2000).
Breslow, D. K. et al. Orm family proteins mediate sphingolipid homeostasis. Nature 463, 1048-1053 (2010).
Oyeniran, C. et al. Aberrant ORM (yeast)-like protein isoform 3 (ORMDL3) expression dysregulates ceramide homeostasis in cells and ceramide exacerbates allergic asthma in mice. J. Allergy Clin. Immunol. 136, 1035-1046.e1036 (2015).
Gururaj, C., Federman, R. S. & Chang, A. Orm proteins integrate multiple signals to maintain sphingolipid homeostasis. J. Biol. Chem. 288, 20453-20463 (2013).
Köberlin, M. S. et al. A conserved circular network of coregulated lipids modulates innate immune responses. Cell 162, 170-183 (2015).
Popovic, Z. V. et al. Glucosylceramide synthase is involved in development of invariant natural killer T cells. Front. Immunol. 8, 848 (2017).
Brennan, P. J. et al. Structural determination of lipid antigens captured at the CD1d-T-cell receptor interface. Proc. Natl Acad. Sci. USA 114, 8348-8353 (2017).
Schrantz, N. et al. The Niemann-Pick type C2 protein loads isoglobotrihexosylceramide onto CD1d molecules and contributes to the thymic selection of NKT cells. J. Exp. Med. 204, 841-852 (2007).
Mandala, S. et al. Alteration of lymphocyte trafficking by sphingosine-1-phosphate receptor agonists. Science 296, 346-349 (2002).
Verstockt, B. et al. Sphingosine 1-phosphate modulation and immune cell trafficking in inflammatory bowel disease. Nat. Rev. Gastroenterol. Hepatol. 19, 351-366 (2022).
Baeyens, A. A. L. & Schwab, S. R. Finding a way out: S1P signaling and immune cell migration. Annu. Rev. Immunol. 38, 759-784 (2020).
Kobayashi, T. et al. IL-10 regulates Il12b expression via histone deacetylation: implications for intestinal macrophage homeostasis. J. Immunol. 189, 1792-1799 (2012).
Hoentjen, F., Sartor, R. B., Ozaki, M. & Jobin, C. STAT3 regulates NF-kB recruitment to the IL-12p40 promoter in dendritic cells. Blood 105, 689-696 (2005).
Chicco, F. et al. Multidimensional impact of mediterranean diet on IBD patients. Inflamm. Bowel Dis. 27, izaa097 (2021).
Publisher’s note Springer Nature remains neutral with regard to jurisdictional claims in published maps and institutional affiliations.
Open Access This article is licensed under a Creative Commons Attribution 4.0 International License, which permits use, sharing, adaptation, distribution and reproduction in any medium or format, as long as you give appropriate credit to the original author(s) and the source, provide a link to the Creative Commons licence, and indicate if changes were made. The images or other third party material in this article are included in the article’s Creative Commons licence, unless indicated otherwise in a credit line to the material. If material is not included in the article’s Creative Commons licence and your intended use is not permitted by statutory regulation or exceeds the permitted use, you will need to obtain permission directly from the copyright holder. To view a copy of this licence, visit http://creativecommons.org/licenses/by/4.0/.
(c) The Author(s) 2024
Methods
Mouse Strains
II10-KO (JAX 002251) and II1Orb-KO (JAX 005027) mice were purchased from Jackson Laboratories. Both knockout strains were crossed to wild-type C57BL/6 (JAX 000664) to generate heterozygous mice. All future cohorts of mice were generated from heterozygote heterozygote breeding to minimize microbial diversity. Cohorts of mice were aged in cohoused cages with three wild-type mice and three knockout mice unless noted otherwise. LysM-cre (JAX 004781) mice were also purchased from Jackson Laboratory. Scd2 mice and Cers2-KO mice were generated in our in-house CRISPR Core and are available upon request. For bone marrow chimeras, donor bone marrow (250,000500,000 cells per mouse) was transferred into CD45.1 PepBoy (Jax 002014) recipient mice. Mice were engrafted for 10 weeks prior to experimental use. All animal experimentation was performed in compliance with Yale Institutional Animal Care and Use Committee protocols. Mice were housed with 14 h light: 10 h dark cycles in rooms maintained at with room humidity.
For in vivo mouse experiments, sample sizes were determined based upon the availability of mice and were the largest possible. Mice were not randomized since mice were analysed based upon their genotype. Investigators were not blinded to group allocation during data collection or analysis. Blinding were not relevant to our study given that most observations made in this study were flow cytometry based and the genotypes of the mice were confirmed before and after analysis.
DSS colitis
Mice were given 1.5% DSS in their drinking water for 5 days, before changing back to normal water bottles. Mice were weighted through the duration of the experiment and euthanized at day 12 . Mice were 10 weeks or older with a starting weigh of 20 g or higher.
Ex vivo mouse cells
For BMDMs, bone marrow was differentiated into macrophages in DMEM containing 10% FBS (Sigma), 5% M-CSF conditioned medium or -CSF (Biolegend) (results did not differ), penicillinstreptomycin (Gibco), 1% glutamine (Invitrogen) 0.5% sodium pyruvate (Invitrogen) for 7-9 days prior to experimental use. Peritoneal macrophages were collected after 96 h thioglycallate treatment. Macrophages were washed, counted, plated in the medium described above, activated by TLR agonists and maintained in culture for 24-48 h.
Reagents
Cells were treated with Pam3CSK4 (Invivogen tlrl-pms). CholPC (700123), Cer16:0 (860516), Cer22:0 (860525), Cer24:0 (860524) or Cer24:1(860525) (Avanti Lipids). All ceramides were used at a final concentration of . Myriocin (Cayman Chemicals) was solubilized in DMSO. Working solution was generated by 1:1,000 dilution for a final working solution of 10 nM for the last 24 h of TLR activations.
Preparation of ceramide:cholPC. This method was adapted from ref. 61. Ceramides and cholPC were dissolved into 100% chloroform to 12.5 mM . Equal mixtures of ceramide and cholPC were mixed and dried under nitrogen. Lipids were rehydrated in PBS to 3.125 mM Cer:3.125 mM cholPC (or cholPC:blank), and sonicated at for until all precipitates were in solution. Lipid mixtures were added to cell cultures at 1:100 dilution for final concentration for each ceramide species.
Preparation of . Six grams of fatty acid-free, endotoxin-low BSA (Sigma A8806) was gradually added to 17.5 ml 150 mM NaCl in a beaker at while stirring. Once BSA was completely dissolved, pH was adjusted to 7.4 with 1 N NaOH (adding 1 M NaOH slowly in increments, while stirring). This was repeated with incremental dilutions slowly until the desired pH was achieved. Final volume was adjusted to 25 ml with 150 mM NaCl .
Preparation of BSA-conjugated free fatty acids. FFAs (Nucheck Prep) were dissolved 150 mM NaCl pH 7.4 to 25 mM final concentration (that is, was dissolved into 7 ml 150 mM NaCl plus ). Mixture was shaken vigorously, and heated at until in solution. BSA solution ( , ice cold) was finally combined with 25 mM oleic acid solution (room temp) in a 54:46 ratio to yield approximately 12.5 mM final concentration with pH 7.4 . This was stored at and mixed for 10 min at room temperature on a shaker before use.
Addition of FFAs into cell culture. FFAs were diluted into cell culture medium at 1:500 dilution for final concentration. Free fatty acids were added 4 h post TLR stimulation.
Oral gavage of BSA-18:1. Mice (15-18 g, 5-6 weeks old) were gavaged for 14 days with BSA alone or BSA-18:1 (preparation described above, diluted with PBS).
Inhibition of MUFA synthesis by SCDi. SCDi (Cay10566; Fisher NC0493687) was dissolved into DMSO to a final concentration of . This solution was used immediately, only once, and did not undergo any freeze-thaw cycles (any freeze-thaw cycles killed the activity of this compound as measured by isotope tracer analysis). Working solution was generated by 1:1,000 dilution for a final working solution of 10 nM .
Cell viability was assessed with AOPI using the Nexcelom K2 cell counting system.
ELISAs
Lipocalin (R&D), IL-6 (R&D) and IL-12b (Biolegend) ELISAs were preformed to manufacturer’s instructions.
Ex vivo peritoneal macrophage collection
Wild-type and IIIO-KO mice were treated with thioglycallate via intraperitoneal injection for 48 h , followed by intraperitoneal injection of per mouse TLR2 ligand (Pam3CSK4) for an additional 48 h . Macrophages were collected by peritoneal lavage, counted, and prepared for mass spectrometry lipidomic analysis described below. A sample of ex vivo cells were assessed for purity by flow cytometry (97% myeloid for both wild-type and II1O-KO cells).
Lipidomics analysis
Macrophages were cultured in 6-well dishes (Fisher 08-772-1B) and stimulated with TLR ligands as described above. Forty-eight hours after stimulation, cells were imaged for cell count as previously described , scraped and spun down in PBS, and snap-frozen as cell pellets. A modified Bligh and Dyer extraction was carried out on samples. Prior to biphasic extraction, a 13 lipid subclass Lipidyzer Internal Standard Mix was added to each sample (AB Sciex, 5040156). In later experiments, internal standard mixture consisting of 70 lipid standards across 17 subclasses was added to each sample (AB Sciex 5040156, Avanti 330827, Avanti 330830, Avanti 330828 and Avanti 791642). In most recent experiments, a standard mixture of 75 lipid standards across 17 subclasses (Avanti 330820, Avanti 861809, Avanti 330729, Avanti 330727 and Avanti 791642) was added to each sample. Following 2 successive extractions, pooled organic layers were dried down in the Thermo SpeedVac SPD300DDA using ramp setting 4 at for 45 min with a total run time of 90 min . Lipid samples were resuspended in 1:1 methanol:dichloromethane with 10 mM ammonium acetate and transferred to Robovials (Thermo 10800107) for analysis. Samples were analysed on the Sciex Lipidyzer Platform (Sciex 5500 with DMS and Shimadzu LC-30) for targeted quantitative measurement of 1100 lipid species across 13 subclasses. In later experiments, an expanded assay consisting of 1,400 targeted lipid species across 17 subclasses was
used. Differential Mobility Device on Lipidyzer was tuned with SelexION tuning kit (Sciex 5040141) or EquiSPLASH LIPIDOMIX (Avanti 330731). Instrument settings, tuning settings, and multiuple reaction monitoring lists have been previously published . Data analysis was performed on Lipidyzer software (v1.0). Later experiments were analysed with the Shotgun Lipidomics Assistant (SLA v1.3) . Quantitative values were normalized to cell counts. PCA and heat maps were generated using guidelines described .
Detection of sphinganine
The detection and quantification of sphinganine were performed using an Agilent 6490 ESI-QQQ-MS/MS or an Agilent iFunnel 6550 quadrupole time of-flight (QTOF) mass spectrometer, fitted with an electrospray ionization (ESI) source (positive) coupled to an Agilent 1290 Infinity HPLC system. The target lipid was analysed utilizing a gradient program on a Phenomenex Kinetex 1.7 mm C18100 in water with formic acid for , column temperature: ). The detection with ESI-QQQ-MS/MS was conducted with the optimized collision energy at 20 V and facilitated by dynamic multiple reaction monitoring (MRM) mode with the mass transition . The QTOF mass spectrometry detection was performed with the following source parameters: gas temperature , drying gas , nebulizer 40 psi , sheath gas temperature , and sheath gas flow .
For labelled sphinganine detection, cells were grown in serine-free medium (Teknova; serine-, glucose- and glycine-free) supplemented with -serine (Cambridge Isotope Laboratories 202407-34-9) for 48 h before lipid extraction and mass spec analysis as described above. Total and labelled (+3 Da) sphinganine was detected with Mass Hunter Software (Agilent) and normalized to a standard curve. Cold glucose and glycine were supplemented to normal DMEM levels of and , respectively.
Isotope enrichment experiments
Day 8 differentiated BMDMs were transferred to complete medium containing -glucose with or without TLR stimulation for 48 h before collection. See ref. 9 for further details. Analysis of labelled fatty acids and cholesterol was performed as described . The relative contributions of synthesis to the total cholesterol pool over the 48 h labelling period were determined by fitting the isotopologue distributions for cholesterol in a model similar to isotopomer spectral analysis as described .
Gene expression analysis
RNA was extracted from all cells with Trizol using manufacturer’s protocols.cDNA was synthesized with Applied Biosystems High Capacity cDNA Synthesis Kit as per manufacturer’s instructions ( RNA per cDNA synthesis reaction). qPCR was conducted on the BioRad qPCR machine using SYBR Green Master Mix (BioRad) and primers. Relative expression values are normalized to control gene (rRNA 36B4) and expressed in terms of linear relative mRNA values. Primer sequences are available upon request.
Two million BMDMs or peritoneal macrophages were incubated with ALLN at for 15 min before collection. Cells were washed with PBS + ALLN, then transferred to Eppendorf tubes. Cells were incubated in hypotonic buffer A ( 10 mM Hepes pH EGTA, 0.1 mM EDTA + protease inhibitors) for 15 min on ice, then
of 10% NP-40 was added and cells for vortexed for 10 s to lyse the plasma membrane. Nuclei were collected by centrifugation for 5 min , and resuspended in hypertonic buffer ( 20 mM Hepes pH 7.9, EDTA, glycerol + protease inhibitors). After thorough mixing, nuclei were incubated at 4 deg C on a rotator for 1 h . Samples were quickly vortexed, spun down at for 5 min to separate the nuclear pellet. Nuclear extracts were collected and immediately frozen on dry ice or mixed with loading buffer, boiled for 10 min and run on an SDS-PAGE for immunoblot analysis.
Immunoblots
Samples were normalized by cell number (Nexcelom K2 cell counting system) and lysed directly into Laemmli loading buffer. Protein extracts were separated on gradient to Bis-Tris SDS-PAGE gel (Invitrogen) and then transferred to a nitrocellulose membrane (Amersham). After blocking for 1 h in a TBS containing 0.1% Tween 20 (TBST) and 5% nonfat milk, the membrane was probed with indicated antibodies diluted into TBST with milk overnight. Membranes were washed with TBST, followed by a room temperature incubation with secondary antibodies conjugated to horseradish peroxidase diluted in TBST plus milk. Membranes were washed as before and then developed using Pierce ECL2 detection kit and imaged with Typhoon.
Faecal lipocalin preparation
Faeces of each mouse were collected, weighed and dissolved in PBS plus 0.1% Tween. Faecal pellets were disrupted using a tube shaker for 5 min at full speed. Samples were spun down and the resulting supernatants were diluted 1:10 and utilized for lipocalin ELISAs.
Isolation of immune cells from the colon lamina propria
Colons were collected, flushed with 10 ml PBS, and split lengthwise, and rinsed again in PBS. The epithelial fraction was removed with two 10 ml washes of epi wash buffer ( HBSS, 5 mM EDTA, 1 mM DTT) at for 20 min while shaking at 220 rpm . Colons were removed from epi wash buffer, washed in PBS and finely minced with a razor blade. Minced tissue was transfer into 5 ml digestion buffer ( DMEM, FBS, collagenase D, DNAase) and incubated at for 60 min while shaking at 220 rpm . After digestion, samples were strained though at filter and washed twice with DMEM FBS. Cells were then divided into five groups for different staining panels. Cells were stained with antibodies (1:400 dilution) and fixable viability dye (1:1,000 dilution) at for 30 min in FACS buffer ( FBS in PBS), washed twice, and run immediately on an LSR2 or fixed (BD Cytofix/ CytoPerm 554722) for intracellular staining with cytokine antibodies (1:100 dilution). AccuCheck cell counting beads (Invitrogen PCB100) were utilized for cell number quantification. All flow cytometry data was collected on BD LSR2s with FACSDiva 7 software. Flow cytometry data were analysed with FlowJo (v9 to v10.6.1).
Isolated cells from the colons were sorted for cells to exclude neutrophils, T cells and B cells. Cells were further prepared using the 10X Single Cell comptroller per manufacturer’s
Article
instructions. scRNA-seq libraries were generated using the Chromium Next GEM Single Cell 3′ v3.1 Library & Gel Bead Kit (10X Genomics) according to the manufacturer’s protocol. In brief, emulsions were generated using the 10X Chromium Controller (10X Genomics) for a targeted recover 10,000 cells. Barcoded cDNAs were isolated from the emulsion and amplified by PCR (11 cycles). The cDNAs underwent fragmentation, end repair, and A-tailing before addition of sample indexes by PCR ( 16 cycles). Library products were sequenced with NovaSeq 6000.
scRNA-seq data analysis
Cellranger v6.0.1 was used to align scRNA-seq samples to the mouse genome (mm10). Data analysis was performed using Seurat v4.3.0 R package , including cell-type identification and comparative analyses between conditions. In the step of quality control, poor-quality cells with the number of expressed genes or were filtered out. We also excluded cells if their mitochondrial gene percentages were over . After combining cells from all samples, we first normalized the raw count matrix and then defined the 2,000 top variable genes. We then applied PCA for dimensionality reduction and retained 30 leading principal components for cell clustering. Specifically, the shared nearest neighbour graph was constructed by calculating the Jaccard index between each cell and its 20 nearest neighbours, which was then used for cell clustering based on Louvain algorithm (with a resolution of 0.3). After identifying cluster-specific genes, we annotated cell types based on canonical marker genes (Lyz2 for macrophages) and focused on macrophage populations in the downstream analyses. To test the differential expression of inflammatory genes between Il1Orb-KO and Il1Orb/Cers2-DKOs, we first applied ALRA to impute the gene expression profiles and then used the non-parametric Wilcoxon rank sum test to obtain their values. Data are available at NCBI Gene Expression Omnibus (GEO) accession GSE252548.
RNA-seq sample preparation
RNA was prepared with a Trizol/Qiagen RNeasy Kit hybrid protocol and submitted to Yale Center for Genome Analysis for RNA Library prep (poly A selection) and NovaSeq sequencing.
RNA-seq data analysis
Adapter sequences were removed from the raw sequencing reads using the tool Cutadapt (https://journal.embnet.org/index.php/embnetjournal/article/view/200). STAR v2.5.3 was then used to align the trimmed sequencing reads to the mouse genome (mm10) with default parameters. After sorting the generated SAM files (as the output of alignment) with Picard Toolkit (https://broadinstitute.github.io/picard/; Broad Institute), we counted the number of reads mapped to each gene using HTSeq v0.6.1. Subsequently, we employed DESeq2 v1.26.0 R package to identify significantly differential genes between naive and TLR2-activated ( 24 h ) wild-type and IIIO-KO BMDMs. Data are available at NCBI GEO accession GSE252547.
Reporting summary
Further information on research design is available in the Nature Portfolio Reporting Summary linked to this article.
Data availability
The datasets generated during the current study are available at NCBI GEO with accession numbers: GSE252548 (scRNA-seq) and GSE252547 (bulk RNA-seq). Source data are provided with this paper.
61. Sukumaran, P. et al. Complexation of c6-ceramide with cholesteryl phosphocholine a potent solvent-free ceramide delivery formulation for cells in culture. PLoS ONE 8, e61290 (2013).
62. Hsieh, W. Y., Williams, K. J., Su, B. & Bensinger, S. J. Profiling of mouse macrophage lipidome using direct infusion shotgun mass spectrometry. STAR Protoc. 2, 100235 (2021).
63. Su, B. et al. A DMS shotgun lipidomics workflow application to facilitate high-throughput, comprehensive lipidomics. J. Am. Soc. Mass. Spectrom. 32, 2655-2663 (2021).
64. Metsalu, T. & Vilo, J. ClustVis: a web tool for visualizing clustering of multivariate data using principal component analysis and heatmap. Nucleic Acids Res. 43, W566-W570 (2015).
65. Williams, K. J. et al. An essential requirement for the SCAP/SREBP signaling axis to protect cancer cells from lipotoxicity. Cancer Res. 73, 2850-2862 (2013).
66. Stuart, T. et al. Comprehensive integration of single-cell data. Cell 177, 1888-1902.e1821 (2019).
67. Linderman, G. C. et al. Zero-preserving imputation of single-cell RNA-seq data. Nat. Commun. 13, 192 (2022).
68. Dobin, A. et al. STAR: ultrafast universal RNA-seq aligner. Bioinformatics 29, 15-21 (2013).
69. Anders, S., Pyl, P. T. & Huber, W. HTSeq-a Python framework to work with high-throughput sequencing data. Bioinformatics 31, 166-169 (2014).
70. Love, M. I., Huber, W. & Anders, S. Moderated estimation of fold change and dispersion for RNA-seq data with DESeq2. Genome Biol. 15, 550 (2014).
Acknowledgements The authors thank J. Alderman, C. Hughes, L. Evangelisti, E. Hughes-Picard and B . Cadugan for their help with technical and administrative duties. We would like to thank the Yale Center for Genome Analysis (YGCA) where research reported in this publication was supported by the National Institute of General Medical Sciences of the National Institutes of Health under Award Number 1S10OD030363-01A1. This article is subject to HHMI’s Open Access to Publications policy. HHMI lab heads have previously granted a nonexclusive CC BY 4.0 license to the public and a sublicensable license to HHMI in their research articles. Pursuant to those licenses, the author-accepted manuscript of this article can be made freely available under a CC BY 4.0 license immediately upon publication. A.G.Y. is supported by the Howard Hughes Medical Institute Hanna H. Gray Fellowship. M.H.S. is supported by the NSF GRFP and the Yale Trudeau Fellowship. W.K.M. is supported by NIH T32-DK007356, and is the recipient of a Cancer Research Institute/Irvington Postdoctoral Fellowship.
Author contributions A.G.Y. conceptualized the project, designed and implemented experiments (in vivo and in vitro), prepared targeted and shotgun lipidomic samples, analysed data, provided funding and constructed the manuscript. M.H.S. designed and implemented experiments, and analysed data (immune cell isolation, characterization and analysis, animal husbandry and chimeric mouse generation) and helped construct the manuscript. J.O. and E.K. designed and implemented targeted mass spectrometry strategies and data analysis. Q.D.Z., W.-Y.H. and K.J.W. ran lipidomic samples and analysed data. W.K.M. and J.R.B. designed and implemented experiments (collected flow cytometry data and assisted in construction of chimeric mice) and offered critical advice for manuscript construction. R.Q. provided formal lipidomics analysis, RNA-seq analysis and scRNA-seq analysis. Y.K., J.M.C., S.T.S., S.J.B. and R.A.F. provided resources, supervision and funding for this project, and contributed to conceptualization and revision of the manuscript.
Competing interests R.A.F. is an advisor to Glaxo Smith Kline. The other authors declare no competing interests.
Additional information
Supplementary information The online version contains supplementary material available at https://doi.org/10.1038/s41586-024-07098-5.
Correspondence and requests for materials should be addressed to Autumn G. York, Steven J. Bensinger or Richard A. Flavell.
Peer review information Nature thanks Timothy Hla and the other, anonymous, reviewer(s) for their contribution to the peer review of this work.
Reprints and permissions information is available at http://www.nature.com/reprints.
A.
B.
Ceramide 16:0 to Sphingomyelin 16:0
c.
Saturated vs UnSaturated Ceramide
D.
E.
Ceramide Species
F.
Cer16:0
Cer18:0 Cer24:1
G.
Extended Data Fig.1|See next page for caption.
Article
Extended Data Fig. 1|IL-10 signaling controls sphingolipid metabolism. A) Total Cholesteryl Esters (CE), Diacylglycerols (DAG), Free Fatty Acids (FFAs), Hexosyl Ceramides (HCer), Lactosyl Ceramides (LCer), Lysophosphatidylcholine (LPCs), Lysophosphatidylethanolamine (LPE), phosphatidylcholine (PC), phosphatidylethanolamine (PE) and triglycerides (TAGs) measured by direct infusion MS from naïve or 48 h TLR2 activated WT and IL10 KO BMDMs ( ). B) Schematic of Ceramide 16:0 and Sphingomyelin (SM) 16:0. Both sphingolipids contain an 18 carbon long constant chain (top, black numbers), and a 16 carbon long variable chain (bottom, red numbers). Figure made with ChemDraw V22.2.0.3300.C) Schematic of saturated (Cer24:0) versus unsaturated (Cer24:1) ceramides. Double bond in 24:1 is located at the arrow. Figure made with ChemDraw V22.2.0.3300.D) Ceramide species measured by direct infusion MS from WT and IL10 KO BMDMs that are naïve or activated with TLR2 ligand ( Pam3CysK4) for 48 h . E) Heat map of individual hexosyl ceramide (HCer) species measured by direct infusion MS from WT and IL10 KO
BMDMs that are naïve or activated with TLR2 ligand ( Pam3CysK4) for 48 h . Scaled by row (lipid species)* indicate significance of between WT and IL-10 KO activated with TLR2. F) Heat map of individual sphingomyelin (SM) species measured by direct infusion MS from WT and IL10 KO BMDMs that are naïve or activated with TLR2 ligand ( Pam3CysK4) for 48 h . Scaled by row (lipid species) * indicate significance of between WT and IL-10 KO activated with TLR2. G) Total Ceramide and Sphingomyelins (SM) measured by direct infusion MS from ex vivo peritoneal macrophage collected from WT and IL10 KO mice after 48 h TLR2 ligand (50ug/mouse Pam3CysK4) administered via IP injection ( ). H) LC-MS analysis of total and labeled sphinganine in 48 h TLR2-activated WT and IL-10RKO BMDMs ( ). All experiments are reported as means SD from 3 independent experiments, unless noted otherwise. (two-tailed unpaired Student’s test).
Extended Data Fig. 2 | See next page for caption.
Article
Extended Data Fig. 2 | Exogenous very long chain ceramides induce inflammation.A) Total Cholesteryl Esters (CE), Ceramides (Cer), Diacylglycerols (DAG), Free Fatty Acids (FFAs),Hexosyl Ceramides (HCer), Lysophosphatidylcholine (LPCs), Lysophosphatidylethanolamine (LPE), phosphatidylcholine (PC), phosphatidylethanolamine (PE) and triglycerides (TAGs) measured by direct infusion MS from naïve or 48 h TLR2 activated WT BMDMs treated with CholPC (vehicle), Cer16:0 or Cer24:0. All lipids are administered at final concentration of 30 uM . B) Ceramide species measured by direct infusion MS from naïve or 48 h TLR2 activated WT BMDMs treated with CholPC (vehicle), Cer16:0 or Cer24:0. All lipids are administered at final concentration of 30 u M.C) Hexosyl Ceramide species measured by direct infusion MS from naïve or 48 h TLR2 activated WT BMDMs treated with CholPC (vehicle), Cer16:0 or Cer24:0. All lipids are administered at final concentration of 30uM.D) Sphingomyelin species measured by direct infusion MS from naïve or 48 h TLR2 activated WT BMDMs treated with CholPC (vehicle), Cer16:0 or Cer24:0. All lipids are administered at final concentration of 30 uM . E) qPCR analysis of , III and III2 gene expression in naïve BMDMs treated with
CholPC or Cer24:0 alone for 48 h versus TLR2-activated BMDMs treated with the same lipids (30um for all treatments) ( ). F) Percent viability measured by AOPI staining for naïve or TLR2- activated BMDMs treated with CholPC, Cer16:0 or Cer24:0 (30uM for all lipids) for 48 h . G) qPCR analysis of Cxcl1 and gene expression in BMDMs activated with TLR2 ligand ( Pam3CysK4) for 48 h . TLR2-activated macrophage were incubated with Cholesteryl:Phosphatidylcholine (CholPC) lipid sheets alone or with CholPC loaded with ceramide 22:0 (Cer22:0) or ceramide 24:0 (Cer24:0) for the last 44 h of the activation ( for each group). All lipids administered at a final concentration of analysis of and gene expression in BMDMs activated with TLR2 ligand ( Pam3CysK4) for 48 h . TLR2activated macrophage were incubated with Cholesteryl:Phosphatidylcholine (CholPC) lipid sheets alone or with CholPC loaded with ceramide 22:0 (Cer22:0) or ceramide 24:0 (Cer24:0) for the last 44 h of the activation ( for each group). All lipids administered at a final concentration of 30 uM . All experiments are reported as means SD from 3 independent experiments, unless noted otherwise. (two-tailed unpaired Student’s test).
Extended Data Fig. 3 | See next page for caption.
Article
Extended Data Fig. 3 | CerS2 is required for VLC ceramide production and inflammation.A) RNAseq analysis of Ceramide synthase genes from naïve or TLR2 activated WT and IL10 KO BMDMs from RNAseq analysis from samples matched to lipidomics analysis in Fig. 1 (TPMs must be above 0 to be listed). ( ). B) Ceramide species measured by direct infusion MS from naïve or 48 h TLR2-activated WT or CerS2 KO BMDMs ( ). C) Total ceramides measured by direct infusion MS from naïve or 48 h TLR2-activated WT or CerS2 KO BMDMs ( per group). D) Sphingomyelin (SM) species measured by direct infusion MS from naïve or 48 h TLR2-activated WT or CerS2 KO BMDMs ( ). E) qPCR analysis of Cxcl1, Cxcl2, and Il1b gene expression in 48 h TLR2-activated ( Pam3CysK4) WT or CerS2 Heterzygous BMDMs ( per group). F) qPCR analysis of Cxcl1, Cxcl2, Il6, and Ilb gene expression in 48 h TLR2activated ( Pam3CysK4) WT or CerS2KO BMDMs anti-IL-10R
neutralizing antibody ( ) for the last 44 h of the activation ( per group). G) qPCR analysis of Cxcl2 gene expression in 48 h TLR2-activated ( Pam3CysK4) WT (white bars), IL-10R KO (red bar) or IL-10R/CerS2 DKO (Blue bars) peritoneal macrophage supplemented with CholPC (vehicle), Cer16:0 or Cer24:0 for the last 44 h of activation. H) qPCR analysis of Cxcl1, Cxcl2,Il6, and Il1b gene expression in 48 h TLR4-activated ( LPS) WT (white bars), IL-10R KO (red bar) or IL-10R/CerS2 DKO (Blue bars) peritoneal macrophage for 48 h . I) ELISA analysis of lipocalin from feces of control (IL-10R Heterozygous), IL-10R KO and IL-10R/CerS2 DKO chimeric mice ( ) Statistical differences measured by two-sided Mann-Whitney tests. All experiments are reported as means SD from 3 independent experiments, unless noted otherwise. (two-tailed unpaired Student’s test).
Extended Data Fig. 4 | See next page for caption.
Article
Extended Data Fig. 4 | CerS2 regulates colonic inflammation in vivo. A) Flow cytometry-based immune cell profiling of the total CD4 T cells (Lin-/TCRB +/ CD4 +) or IFNg+ or IL-17A + CD4 T cells from colonic lamina propria from control (IL-10R Heterozygous), IL-10R KO and IL-10R/CerS2 DKO chimeric mice. B) Flow cytometry-based immune cell profiling of the colonic lamina propria from WT and CerS2 KO chimera mice. C) scRNAseq UMAP analysis of macrophage markers and inflammatory genes from macrophage from IL-10R KO and IL-10R/ CerS2 DKO colon LPs. D) scRNAseq gene expression analysis from all clusters of
Fcgr1 (CD64),Cxcl2,Il1b and Cd38 from sorted macrophage from the colon LP of IL-10R KO or IL-10R/CerS2 DKO chimera mice.E) scRNAseq gene expression analysis from all clusters of and from sorted macrophage from the colon LP of IL-10R KO or IL-10R/CerS2 DKO chimera mice. F) scRNAseq UMAP analysis of macrophage tolerogenic and M2 markers as in S5E from macrophage from IL-10R KO and IL-10R/CerS2 DKO colon LPs. All experiments are reported as means SD from 3 independent experiments, unless noted otherwise. (two-tailed unpaired Student’s test).
Extended Data Fig. See next page for caption.
Article
Extended Data Fig. |IL-10 controls MUFA synthesis. A) Heatmap of all sphingolipid metabolism pathway genes and from naïve or TLR2 activated WT and IL10 KO BMDMs from RNAseq analysis from samples matched to lipidomics analysis in Fig. 1 (TPMs must be above 0 to be listed). Values not scaled. B) Net synthesis (nmol/million cells) of palmitic acid (16:0) as measured by metabolic flux isotope tracer analysis in naïve or 48 h TLR2-activated ( Pam3CSK4) WT (white bars) or IL-10R KO (red bars) BMDMs ( per group). C) Total cellular 16:0 and 18:2 as measured by GCMS analysis of naïve or 48 h TLR2-activated ( Pam3CSK4) IL-10 KO BMDMs + BSA or 25uM 18:1( per group). D) Total 18:1 in measured by GCMS analysis of naïve or 48 h TLR2-activated ( Pam3CSK4) IL-10 KO BMDMs + BSA or 25uM 18:1( per group). E) qPCR analysis of and gene expression in naïve or 48 h TLR2-activated (50 ng/mL Pam3CSK4) WT (white bars) or IL-10R KO (blue bars) BMDMs incubated with vehicle (BSA), or BSA-conjugated 18:1 or 18:2 for the last 44 h of activation. ( per group). All lipids administered at a final concentration of 25 uM.F) Labeled Sphinganine measured by MS from 48 h TLR2-activated WT + BSA (vehicle), IL-10 KO + BSA (vehicle) or IL-10 KO + 25 uM 18:1 BMDMs ( per group). G) Total ceramides species measured by direct
infusion MS from 48 h TLR2- activated IL-10 KO BMDMs plus BSA or BSA-18:1 for the last . H) Heat map of individual ceramide species measured by direct infusion MS from 48 h TLR2-activated WT + BSA (vehicle), IL-10 KO + BSA (vehicle) or IL-10 KO + 25 uM 18:1 BMDMs ( per group). Scaled by row (lipid species). I) qPCR analysis of Il6 and Il1b gene expression in 48 h TLR2-activated ( Pam3CysK4) WT BMDMs supplemented with CholPC (vehicle), Cer24:0 or Cer24:1 for the last 44 h of activation ( per group). All ceramides administered at a final concentration of 30 uM .J) qPCR analysis of Cxcl1 gene expression in 48 h TLR2-activated ( Pam3CysK4) WT BMDMs +/- DMSO (vehicle), 10 nMSCDi (Cay10566) +/- BSA or for the last 44 h . K) Total, saturated and unsaturated ceramide species measured by direct infusion MS from naïve or 48 h TLR2- activated WT BMDMs +/- DMSO (vehicle), 10 nM SCDi (Cay10566) +/- BSA or 25uM 18:1 for the last 44 h. L) Ceramide species measured by direct infusion MS from naïve or 48 h TLR2- activated WT BMDMs +/- DMSO (vehicle), 10 nMSCDi (Cay10566) +/- BSA or for the last 44 h . All experiments are reported as means SD from 3 independent experiments, unless noted otherwise. ; , (two-tailed unpaired Student’s test).
Extended Data Fig. 6 | MUFAs regulates de novo ceramide synthesis. A. Net synthesis (nmol/million cells) of oleic acid (18:1) and palmitic acid (16:0) as measured by metabolic flux isotope tracer analysis in naïve or 48 h TLR2activated ( Pam3CSK4) WT (white bars) or SCD2 cKO (green bars) BMDMs ( per group). B. Total cellular ( million cells) abundance of oleic acid (18:1), palmitic acid (16:0) and linoleic acid (18:2) as measured by GCMS analysis of naïve or 48 h TLR2-activated ( Pam3CSK4) WT (white bars) or SCD2 cKO (green bars) BMDMs ( per group). C. Labeled sphinganine measured by LC-MS from 48 h TLR2-activated WT (white bars) or SCD2 cKO (green bars) BMDMs ( per group). D. Total Saturated and unsaturated ceramides species measured by direct infusion MS from naïve or TLR2-activated Cre+ WT (LysM Cre+/-SCD2 ) and SCD2 cKO (LysM Cre BMDMs ( per group). E. Total sphinganine measured by
LC-MS from 48 h TLR2-activated Control (white bars), SCD2 cKO (green bars) or SCD2 cKO + 10 nM Myriocin (blue bars) BMDMs. Myriocin was spiked into culture for last 24 h of 48 h stim. ( per group). F. Cer24:0 in measured by LC-MS from 48 h TLR2-activated Control (white bars), SCD2 cKO (green bars) or SCD2 cKO +10 nM Myriocin (blue bars) BMDMs. Myriocin was spiked into culture for last 24 h of 48 h stim. ( per group). G. qPCR analysis of inflammatory gene expression from 48 h TLR2 activated Control (white bars), SCD2 cKO (green bars) or SCD2 cKO +10 nM Myriocin (blue bars) BMDMs. Myriocin was spiked into culture for last 24 h of 48 h stim. ( per group). All experiments are reported as means SD from 3 independent experiments, unless noted otherwise. ; (two-tailed unpaired Student’s test).
Extended Data Fig. 7| See next page for caption.
Extended Data Fig. 7 | SCD2 and MUFAs regulate colonic inflammation. A) Flow cytometry based immune cell profiling of the colonic lamina propria from Control (LysM Cre +/-) and SCD2 cKO (LysM Cre +/-Scd2 ) naïve male mice ( per genotype). B) ELISA analysis of IL-12B (IL12p40) from colonic explants of naïve Control (LysM Cre +/-) and SCD2 cKO (LysM Cre +/-Scd2 ) male mice incubated ex vivo for 24 h . ( per genotype). C) Flow cytometry based immune cell profiling of the colonic lamina propria from Control (LysM Cre +/-) and SCD2 cKO (LysM Cre +/-Scd2 ) female mice harvested on day 12 of DSS challenge ( per genotype). D) Weight loss measured during DSSinduced colitis in Control (LysM Cre +/-), SCD2 conditional heterozygous (Het) (LysM Cre +/-,Scd2 flox/WT) and SCD2 cKO (LysM Cre +/-Scd2 flox/flox) female mice ( per group). Red stars indicated statistical differences between Control and SCD2 cKO mice, while black stars represent statistical differences between Control and Het mice. There is no statistical difference in weight loss between SCD2 cHet and SCD2 cKO animals. Error bars represent
Standard Error of the Mean (SEM). E) ELISA analysis of lipocalin from feces of Day 0: heterozygous (het) vs IL-10R KO mice, (all male mice). F) ELISA analysis of lipocalin from feces of Day 0: IL-10 KO female mice versus Day 14: IL-10 KO mice gavaged with BSA or BSA-18:1 (all female mice). G) Flow cytometry based myeloid cell profiling of the colonic lamina propria from heterozygous (het) mice gavaged with BSA, IL-10R KO mice gavaged with BSA or IL-10R KO mice gavaged with BSA-24:1 (all male mice). H) Flow cytometry based myeloid cell profiling of the colonic lamina propria from WT mice gavaged with BSA, IL-10 KO mice gavaged with BSA or IL-10 KO mice gavaged BSA-18:1 (all female mice). I) Flow cytometry based myeloid cell profiling of the colonic lamina propria from heterozygous (het) mice gavaged with BSA, IL-10R KO mice gavaged with BSA or IL-10R KO mice gavaged with BSA-16:0 (all male mice). All experiments are reported as means SD from 3 independent experiments, unless noted otherwise. (two-tailed unpaired Student’s test).
Extended Data Fig. | See next page for caption.
Extended Data Fig. -Rel mediated ceramide induced inflammation. A) ELISA analysis of IL-1B from the supernatants of WT BMDMs activated with TLR2 ligand, treated with CholPC (vehicle), Cer22:0, Cer24:0 for 48 h. Nigericin control was 1 h incubation after 48 h TLR2 ligand priming. All lipids were delivered at a final concentration of 30 uM . B) qPCR analysis of inflammatory gene expression in WT or NLRP3 KO BMDMs activated with TLR2 ligand ( Pam3CysK4) for 48 h . TLR2-activated macrophage were incubated with Cholesteryl:Phosphatidylcholine (CholPC) lipid sheets alone or with CholPC loaded with ceramide 24:0 (Cer24:0) for the last 44 h of the activation ( for each group). All lipids administered at a final concentration of 30 uM . C) Western blot analysis of nuclear extracts from naïve, , and 48 h TLR2activated WT and IL-10R KO BMDMs for RelA, cRel and TBP (loading control). Representative of individual experiments. D) Western blot analysis of whole cell lysates from naïve, 1 h or 24 h TLR2 activated WT and IL-10R KO BMDMs for c-Rel, Ik and -tubulin (loading control). E) Western blot analysis of nuclear extracts from naïve or 24 h TLR2-activated WT peritoneal macrophage plus CholPC (vehicle), Cer16:0, Cer24:0 or anti-IL-10R neutralizing antibody ( ) for the last 20 h of the activation for cRel and TBP (loading control).
Representative of 4 x individual experiments. F) Western blot analysis of whole cell lysates from 24 h TLR2 activated WT BMDMs treated with CholPC or 30 um Cer24:0 or IL-10R KO BMDMs for Ik and -tubulin (loading control). Representative of individual experiments. G) Western blot analysis of nuclear extracts and whole cell lysates from naïve or 48 h TLR2-activated (indicated in Red) WT or c-Rel KO BMDMs plus CholPC (vehicle) or 30 uM Cer24:0 for the last 44 h of activation for RelA, c -Rel with B -Tubulin and TBP as loading controls. RelA was blotted in parallel with cRel and, B Tub and TBP. Representative of individual experiments. H) qPCR analysis of inflammatory gene expression in 48 h TLR4-activated ( LPS) WT or cRel KO BMDMs plus CholPC (vehicle), 30 uM Cer22:0 or 30 uM Cer24:0 for the last 44 h of activation ( per group). I) Ceramide species in WT and c-Rel KO BMDMs activated with TLR2 ligand ( Pam3CysK4) for 48 h measured by direct infusion MS ( ). J) Total Cer24:0 after exogenous 30 uM Cer24:0 addback to WT or c-Rel KO BMDMs activated with TLR2 ligand ( Pam3CysK4 for 48 h measured by direct infusion MS ( ). All experiments are reported as means SD from 3 independent experiments, unless noted otherwise. ; (two-tailed unpaired Student’s test).
Article
+TLR2 Ligand
A.
B.
Extended Data Fig. 9 | c-Rel is required for late stage inflammation in vitro and in vivo. A. Western blot analysis of nuclear extracts from naïve or 48 h TLR2-activated Cre+ WT (LysM Cre +/-SCD2 ) and SCD2 cKO (LysM Cre +/Scd2 ) plus BSA or BSA-18:1 for the last 44 h of the activation for cRel and TBP (loading control). Representative of individual experiments. B. qPCR analysis of inflammatory gene expression in 1 h TLR2-activated Pam3CysK4) WT or c-Rel KO BMDMs ( per group). C. qPCR analysis of inflammatory gene expression in 48 h TLR2-activated ( Pam3CysK4) WT, IL-10 KO or IL-10/c-Rel DKO BMDMs ( per group). D. qPCR analysis of inflammatory gene expression in 48 h TLR2-activated WT or cRel KO BMDMs +
anti-IL-10R neutralizing antibody ( ), Cer24:0 for the last 44 h of the activation ( per group). E. ELISA analysis of IL-12B (IL12p40) from colonic explants of WT, IL-10 KO or IL-10/cREL DKO male mice incubated ex vivo for 24 h . ( ). F. ELISA analysis of fecal lipocalin from WT, IL-10 KO and IL-10/c-Rel DKO mice ( ). G. Flow cytometry based Immune cell profiling of the colonic lamina propria from naive WT, IL-10 KO or IL-10/c-Rel DKO male mice ( ). All experiments are reported as means SD from 3 independent experiments, unless noted otherwise. ; , (two-tailed unpaired Student’s test).
natureportfolio
Autumn York, Steven Bensinger, Richard
Corresponding author(s):
Flavell
Last updated by author(s):
01/09/2024
Reporting Summary
Nature Portfolio wishes to improve the reproducibility of the work that we publish. This form provides structure for consistency and transparency in reporting. For further information on Nature Portfolio policies, see our Editorial Policies and the Editorial Policy Checklist.
Statistics
For all statistical analyses, confirm that the following items are present in the figure legend, table legend, main text, or Methods section.
Confirmed
The exact sample size ( ) for each experimental group/condition, given as a discrete number and unit of measurement
A statement on whether measurements were taken from distinct samples or whether the same sample was measured repeatedly
The statistical test(s) used AND whether they are one- or two-sided
Only common tests should be described solely by name; describe more complex techniques in the Methods section.
A description of all covariates tested
A description of any assumptions or corrections, such as tests of normality and adjustment for multiple comparisons
A full description of the statistical parameters including central tendency (e.g. means) or other basic estimates (e.g. regression coefficient) AND variation (e.g. standard deviation) or associated estimates of uncertainty (e.g. confidence intervals)
For null hypothesis testing, the test statistic (e.g. ) with confidence intervals, effect sizes, degrees of freedom and value noted Give values as exact values whenever suitable.
For Bayesian analysis, information on the choice of priors and Markov chain Monte Carlo settings
For hierarchical and complex designs, identification of the appropriate level for tests and full reporting of outcomes
Estimates of effect sizes (e.g. Cohen’s , Pearson’s ), indicating how they were calculated
Our web collection on statistics for biologists contains articles on many of the points above.
Software and code
Policy information about availability of computer code
Data collection
All flow cytometry data was collected with FACSDiva 7 software. Lipidomic data were collected with the Sciex Lipidyzer Platform (Sciex 5500 with DMS and Shimadzu LC-30)
Data analysis
For statistical analyses and graphs we used GraphPad Prism 9.0 and Microsoft Excel ver. 16.33. Flow cytometry data was analyzed with FlowJo (v9 to v10.6.1). Lipidomics data analysis was performed with Lipidyzer software (v1.0). Later experiments were analyzed with the Shotgun Lipidomics Assistant (SLA v1.3).
For manuscripts utilizing custom algorithms or software that are central to the research but not yet described in published literature, software must be made available to editors and reviewers. We strongly encourage code deposition in a community repository (e.g. GitHub). See the Nature Portfolio guidelines for submitting code & software for further information.
Data
Policy information about availability of data
All manuscripts must include a data availability statement. This statement should provide the following information, where applicable:
Accession codes, unique identifiers, or web links for publicly available datasets
A description of any restrictions on data availability
For clinical datasets or third party data, please ensure that the statement adheres to our policy
Human research participants
Policy information about studies involving human research participants and Sex and Gender in Research.
Reporting on sex and gender
NA
Population characteristics
NA
Recruitment
NA
Ethics oversight
NA
Note that full information on the approval of the study protocol must also be provided in the manuscript.
Field-specific reporting
Please select the one below that is the best fit for your research. If you are not sure, read the appropriate sections before making your selection.
Life sciences Behavioural & social sciences Ecological, evolutionary & environmental sciences
For a reference copy of the document with all sections, see nature.com/documents/nr-reporting-summary-flat.pdf
Life sciences study design
All studies must disclose on these points even when the disclosure is negative.
Sample size
For in vivo mouse experiments, sample sizes were determined based upon the availability of mice and were the largest possible.
Data exclusions
none
Replication
All experiments were independently reproduced as stated in the figure legends.
Randomization
Animals were allocated by genotype for most in vivo experiments. There was no need for randomization in our experiments, since mice were analyzed based upon their genotype. For MUFA gavage experiments, large cohorts of either IL-10 or IL-10R KO mice were initialy screened by non-invasive (fecal lipocalin) means to determine colon inflammatory status. Animals were split into two group with equal averages of fecal lipocalin (measured by 2 -tailed Students T-test) for further comparative experiments.
Blinding
Investigators were not blinded to group allocation during data collection or analysis. Blinding were not relevant to our study given that most observations made in this study were flow cytometry based and the genotypes/conditions of the samples were confirmed for multiple times prior and after the analysis.
Reporting for specific materials, systems and methods
We require information from authors about some types of materials, experimental systems and methods used in many studies. Here, indicate whether each material, system or method listed is relevant to your study. If you are not sure if a list item applies to your research, read the appropriate section before selecting a response.
Validation
All antibodies are commercially available. Flow cytometry antibodies validated by manufacturer via flow cytometry. Western blot antibodies were validated by manufacturer with western blot analysis. We further validated c-Rel western blot antibody with our Rel KO animals.
Animals and other research organisms
Policy information about studies involving animals; ARRIVE guidelines recommended for reporting animal research, and Sex and Gender in Research
Laboratory animals
Wild animals
Reporting on sex
Field-collected samples
Ethics oversight
The following mouse stains were purchased from Jackson Labs: WT C57BL/6 (JAX 000664), IL-10 KO (JAX #002251), IL-10R KO (JAX #005027), CD45.1 PepBoy (Jax #002014) and LysM-Cre+/- (JAX #004781). CerS2 and SCD2 Flox/Flox were made in the Flavell lab and are available on request. Mice were were weeks for experimental use. Mice were housed with 14 h light/10h dark cycles in rooms maintained at 21.5 Deg C with room humidity.
None
Groups of male or groups of female animals were used for our studies.
no field-collected animals were used in this study
All animal experimentation was performed in compliance with Yale Institutional Animal Care and Use Committee protocols.
Note that full information on the approval of the study protocol must also be provided in the manuscript.
Flow Cytometry
Plots
Confirm that:
The axis labels state the marker and fluorochrome used (e.g. CD4-FITC).
The axis scales are clearly visible. Include numbers along axes only for bottom left plot of group (a ‘group’ is an analysis of identical markers).
All plots are contour plots with outliers or pseudocolor plots.
A numerical value for number of cells or percentage (with statistics) is provided.
Methodology
Sample preparation
Instrument
Software
Cell population abundance
Isolation of immune cells from the colon LP: Colons were collected, flushed with 10 mL PBS, and split length wise, and rinsed again in PBS. The epithelia fraction was removed with two 10 mL washes of Epi Wash Buffer ( EDTA, 1 mM DTT) at 37 deg C for 20 mins while shaking at 220 RPMs . Colons were removed from Epi Wash Buffer, washed in PBS and finely minced with a razor blade. Minced tissue was transfer into 5 mL Digestion buffer ( DMEM, Collagenase D, DNAase) and incubated at 37 deg C for 60 mins while shaking at 220 RPMs. After digestion, samples were strained though at 70um filter and washed with DMEM FBS. Cells were then divided into 5 groups for different staining panels. Cells were stained with antibodies ( dilution) and fixable viability dye ( dilution) at 4 deg for 30 mins in FACS buffer (2% FBS in PBS), washed 2x, and run immediately on an LSR2 or fixed (BD Cytofix/CytoPerm #554722) for intracellular staining wit cytokine antibodies ( dilution). AccuCheck cell counting beads (Invitrogen PCB100) were utilized for cell number quantification. All flow cytometry data was collected on BD LSR2s with FACSDiva 7 software. Flow cytometry data was analyzed with FlowJo (v9 to v10.6.1).
Samples were run on BD LSR II flow cytometer, and cell sorting was performed with a BD FACSAria II sorter.
All flow cytometry data was collected with FACSDiva 7 software and analyzed by FlowJo (v 9 to v10.6.1).
Abundance of cell populations were provided in each figure.
Tick this box to confirm that a figure exemplifying the gating strategy is provided in the Supplementary Information.
Department of Immunobiology, Yale University, New Haven, CT, USA. Howard Hughes Medical Institute, Yale University, New Haven, CT, USA. Department of Chemistry, Yale University, New Haven, CT, USA. Institute of Biomolecular Design and Discovery, Yale University, West Haven, CT, USA. Computational Biology and Bioinformatics Program, Yale University, New Haven, CT, USA. Department of Microbiology, Immunology and Molecular Genetics, UCLA, Los Angeles, CA, USA. Department of Biological Chemistry, David Geffen School of Medicine, UCLA, Department of Immunology, School of Medicine, University of Washington, Seattle, WA, USA. e-mail: AGYork@UW.edu; SBensinger@mednet.ucla.edu; Richard.Flavell@yale.edu
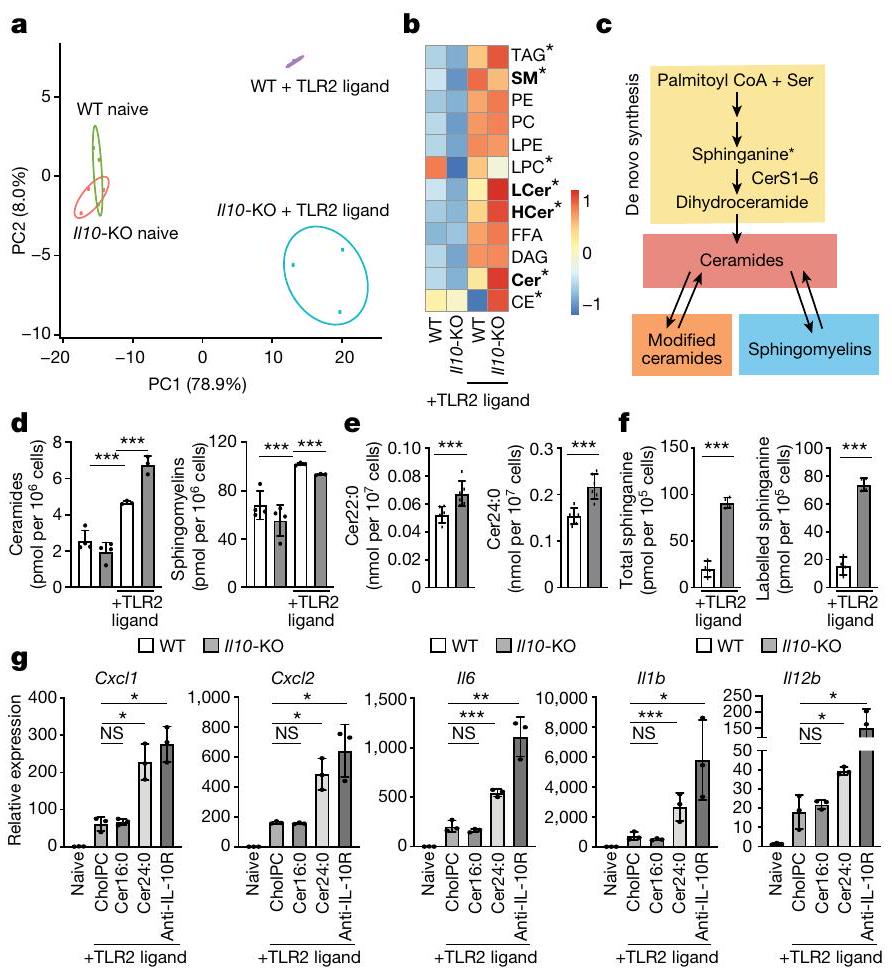
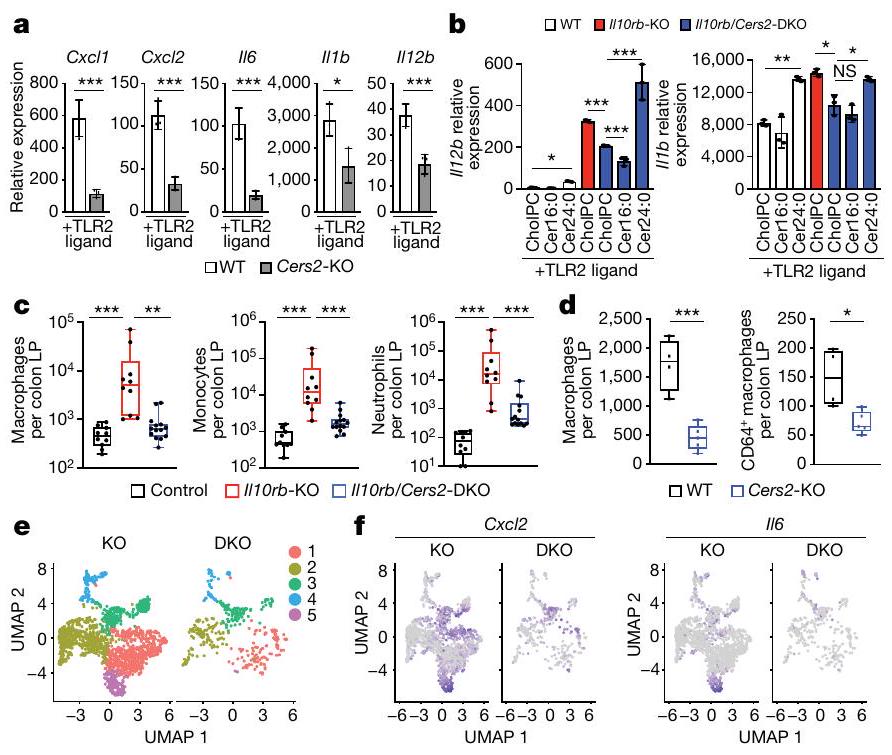
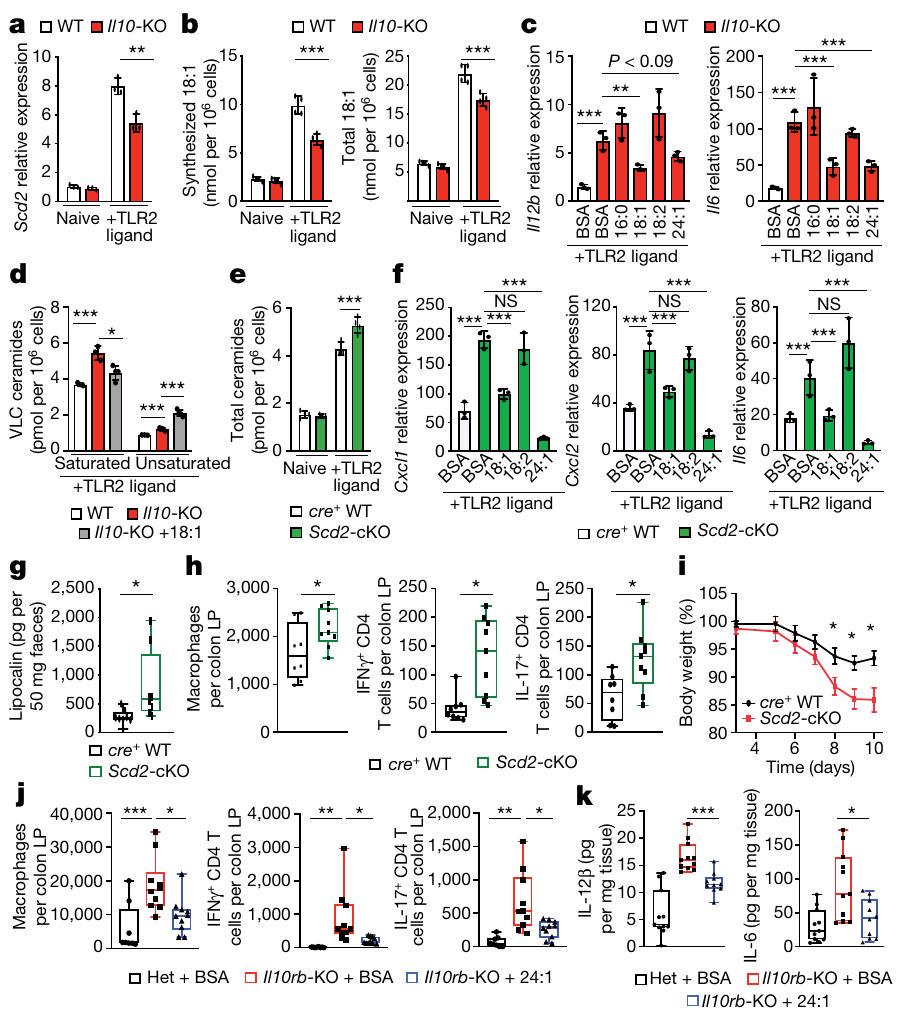
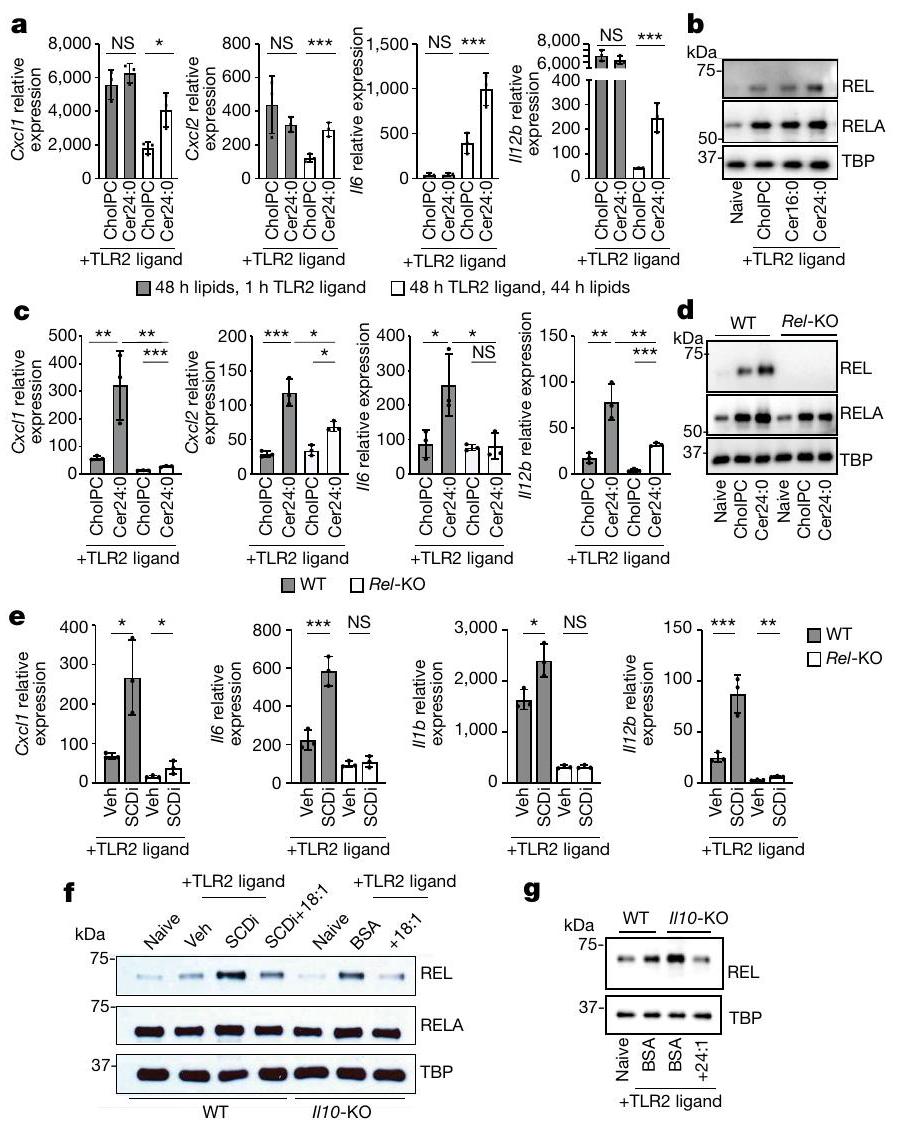
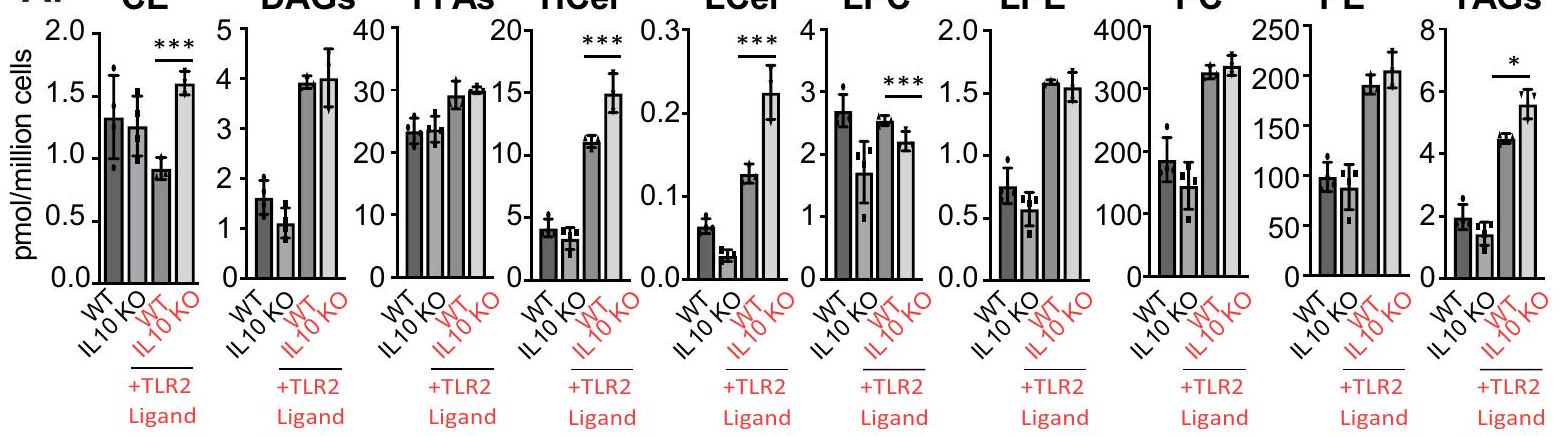
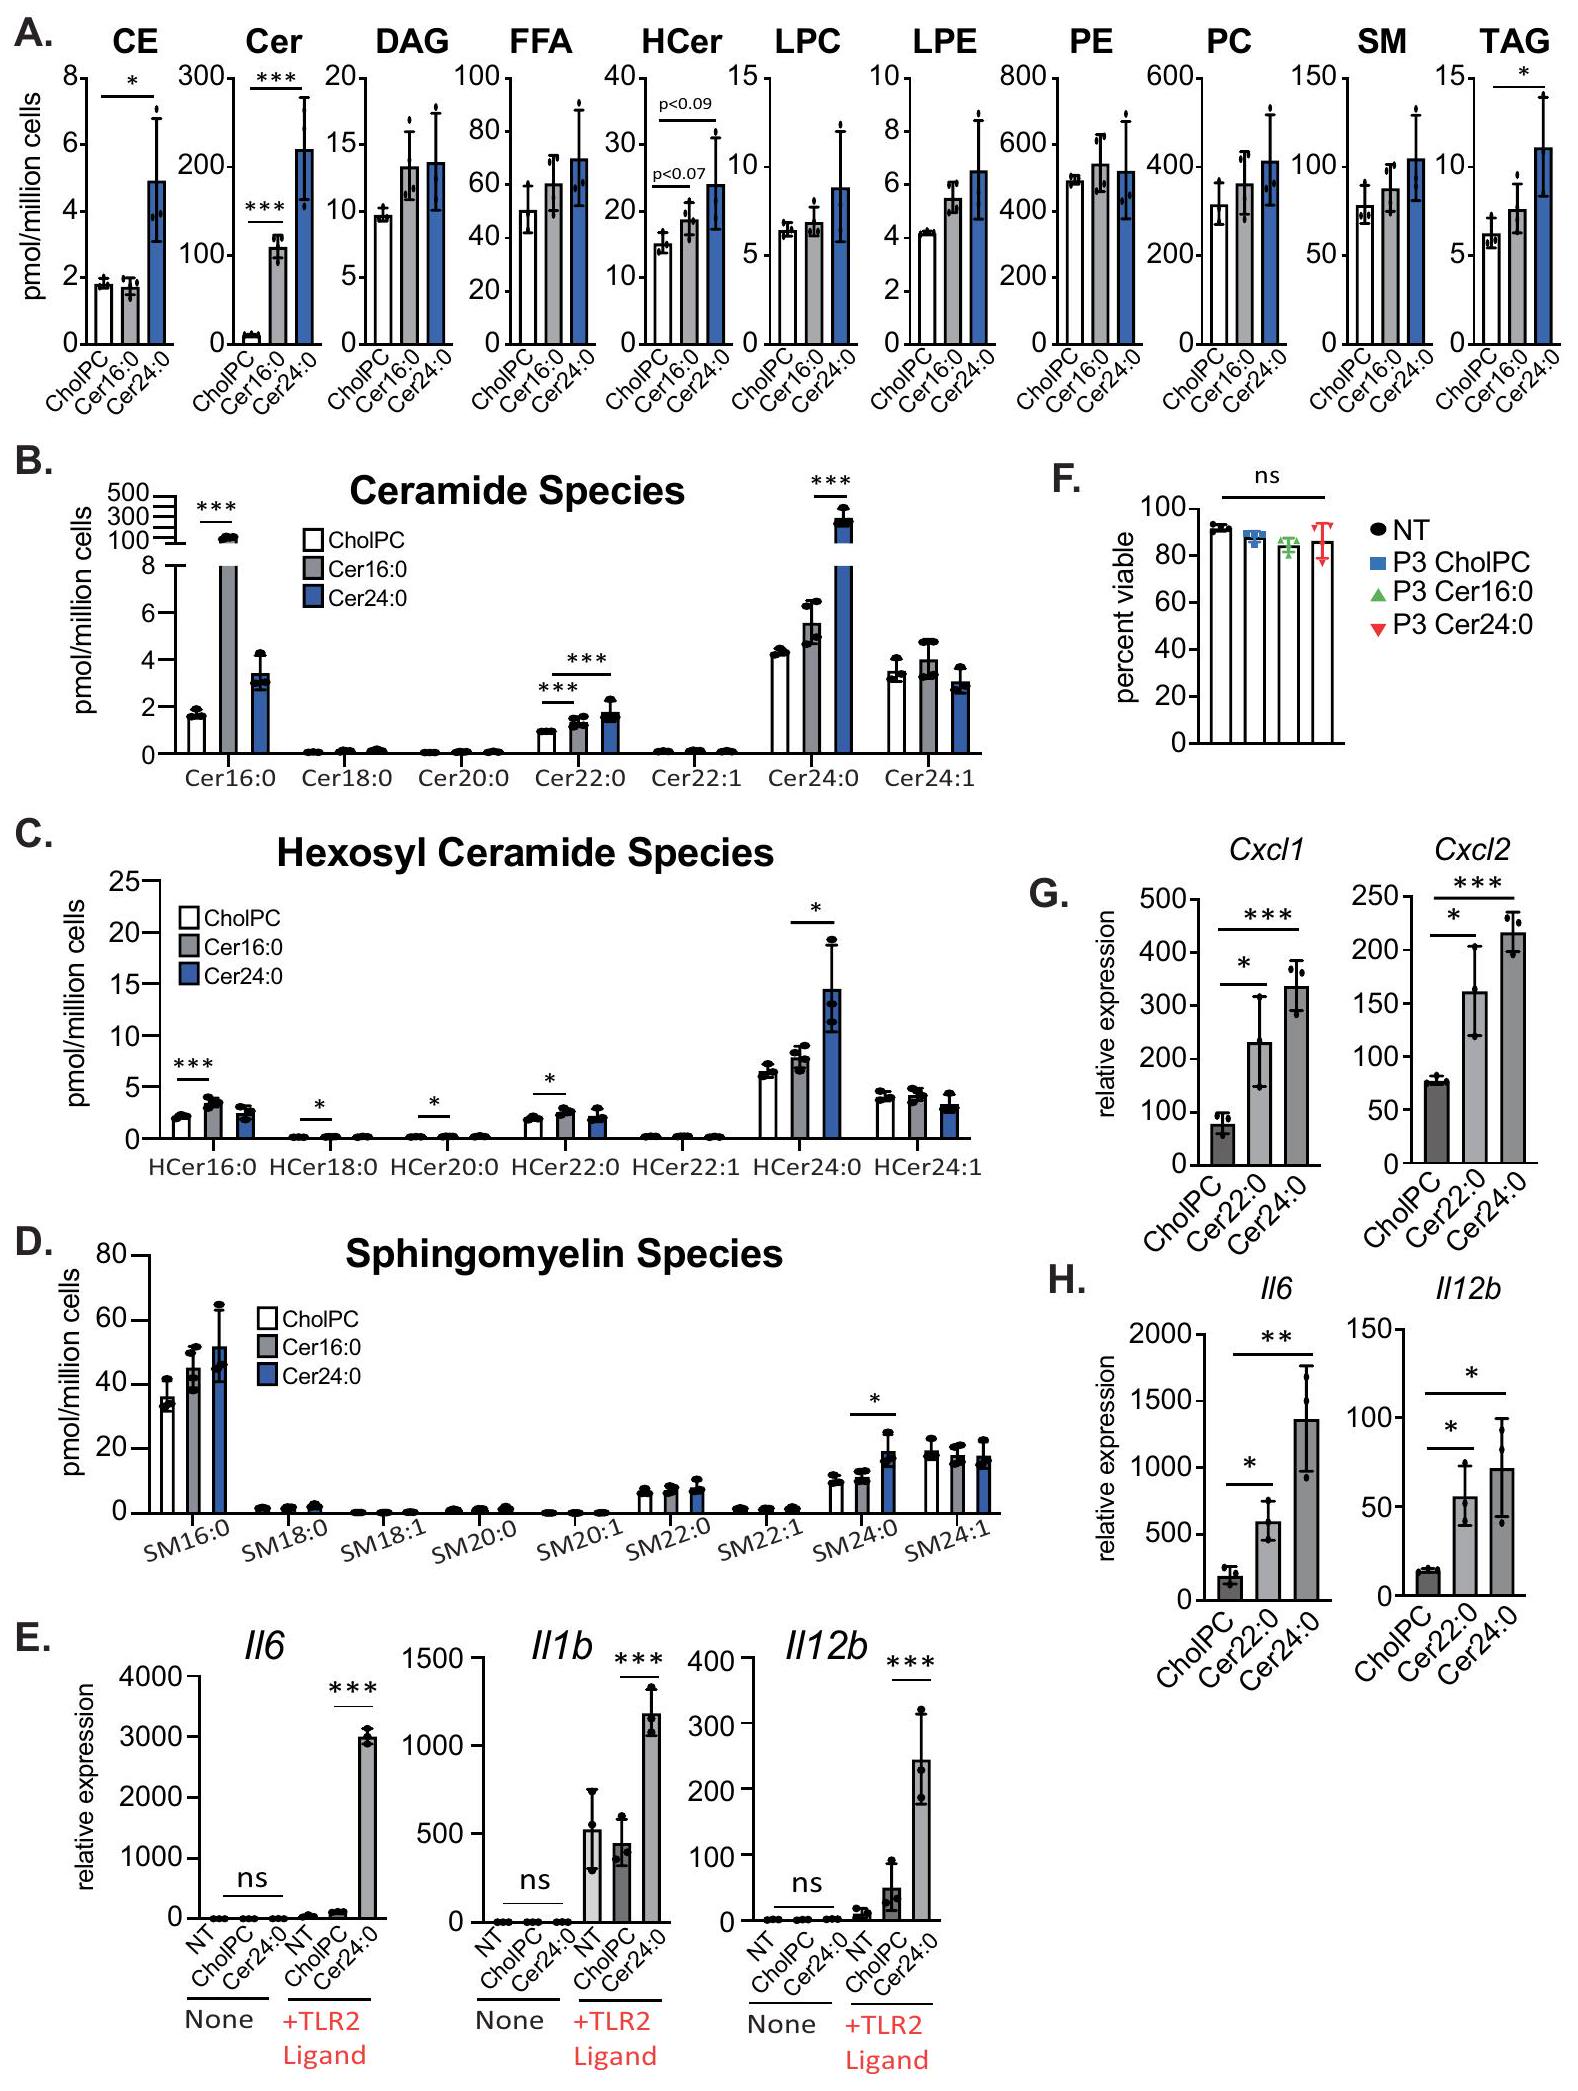
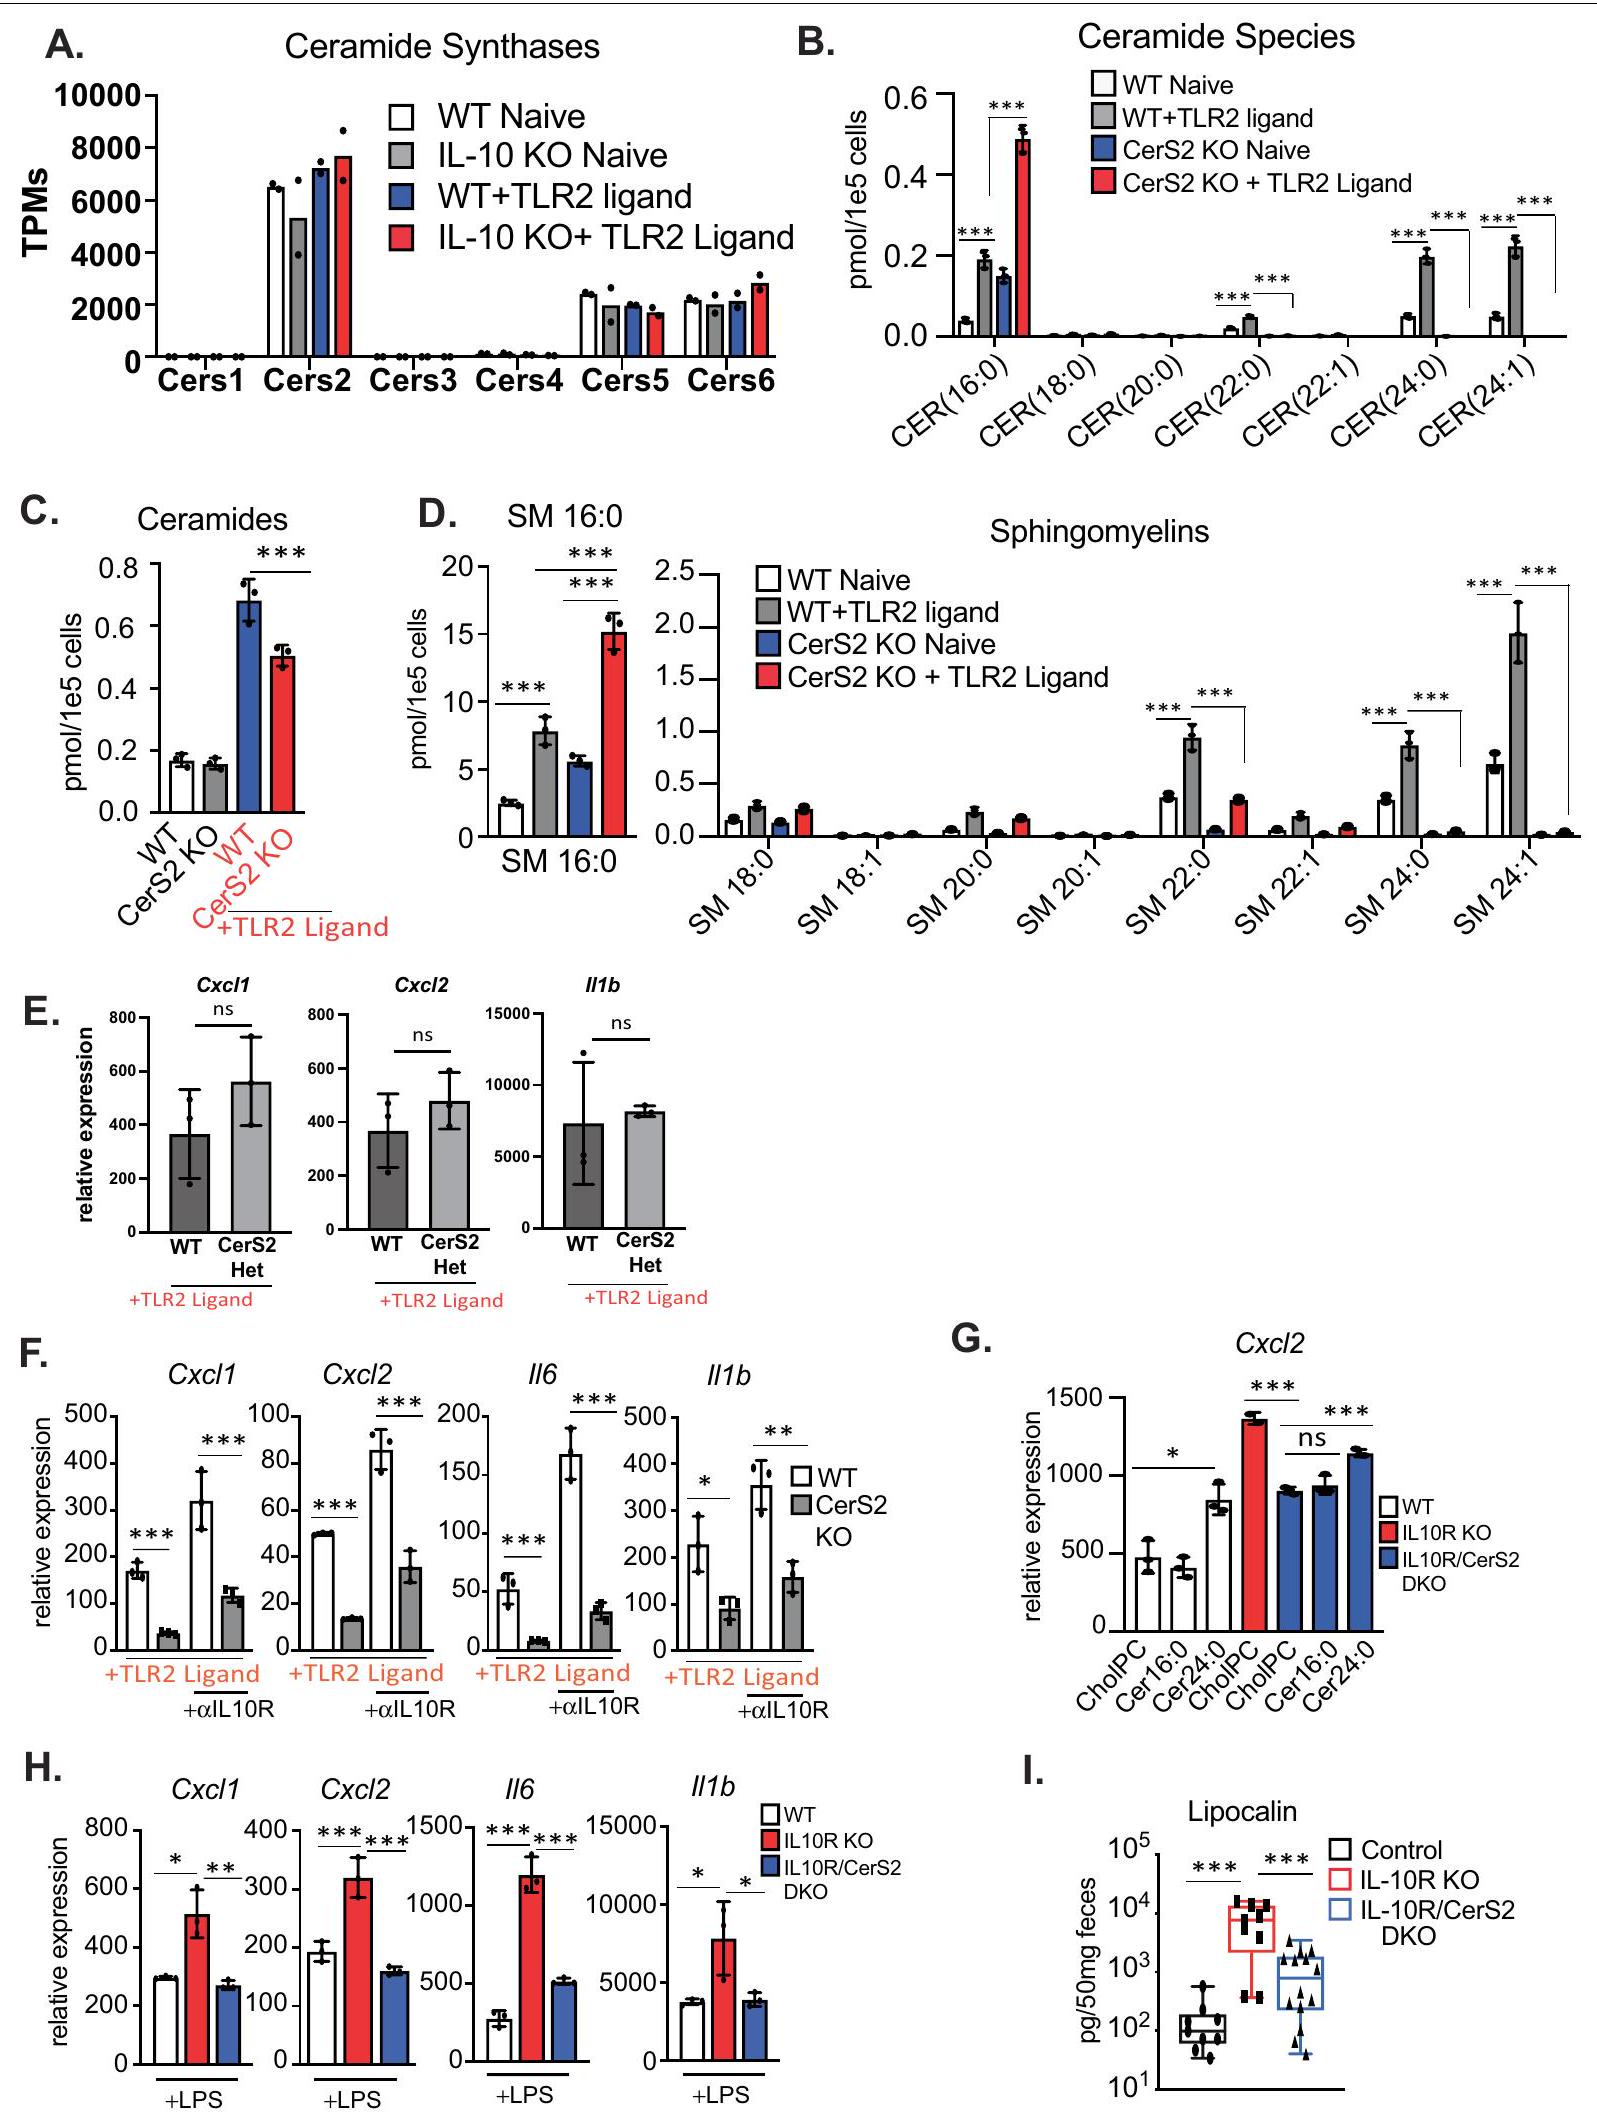
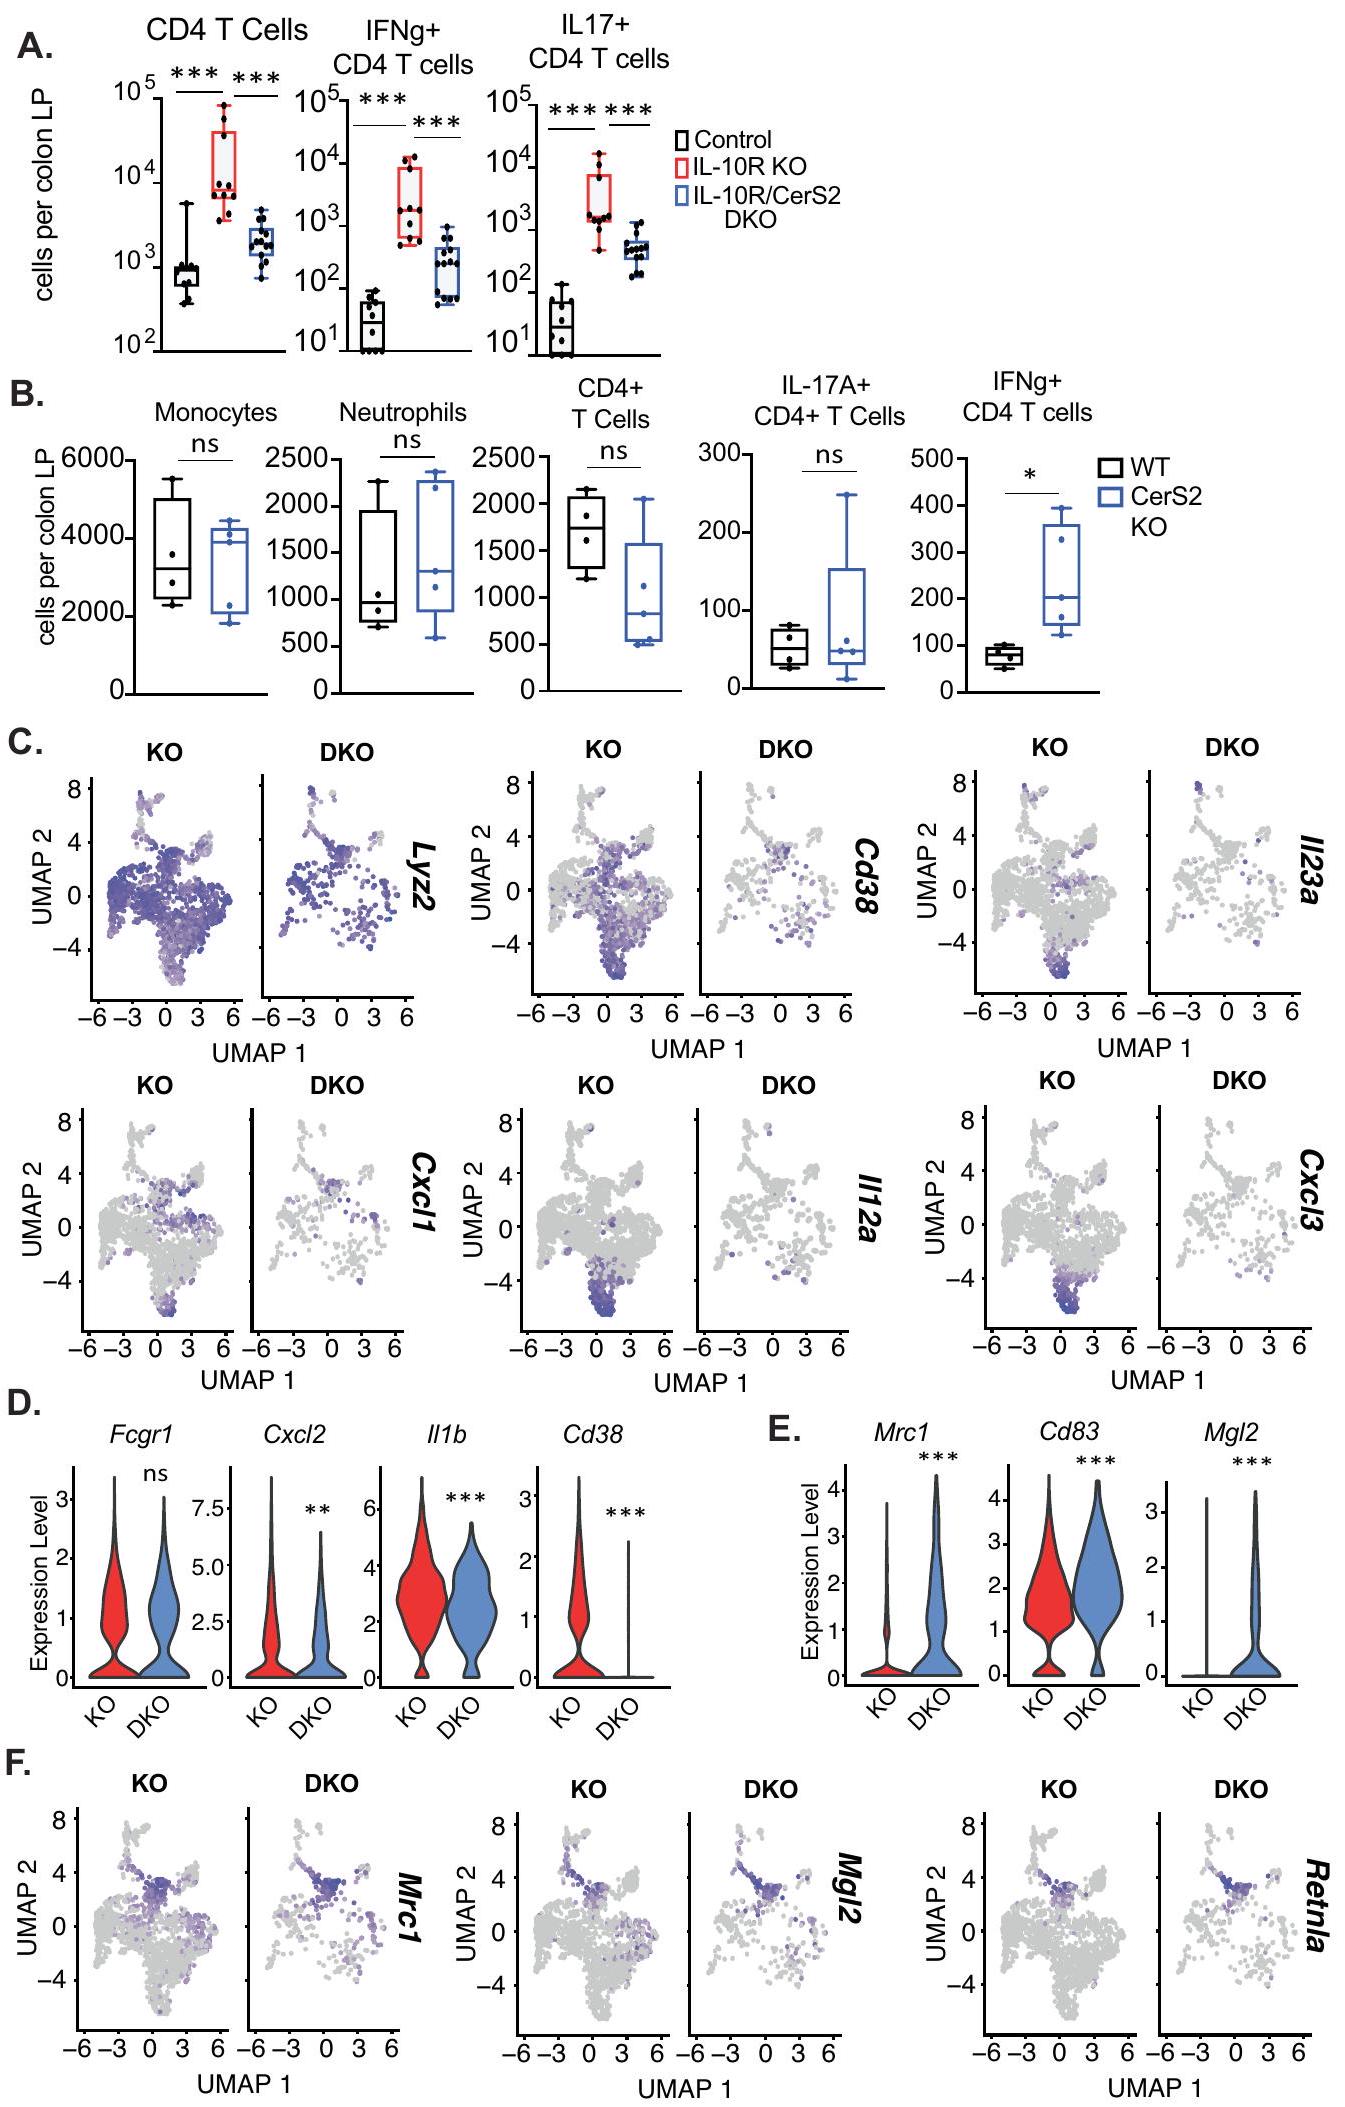
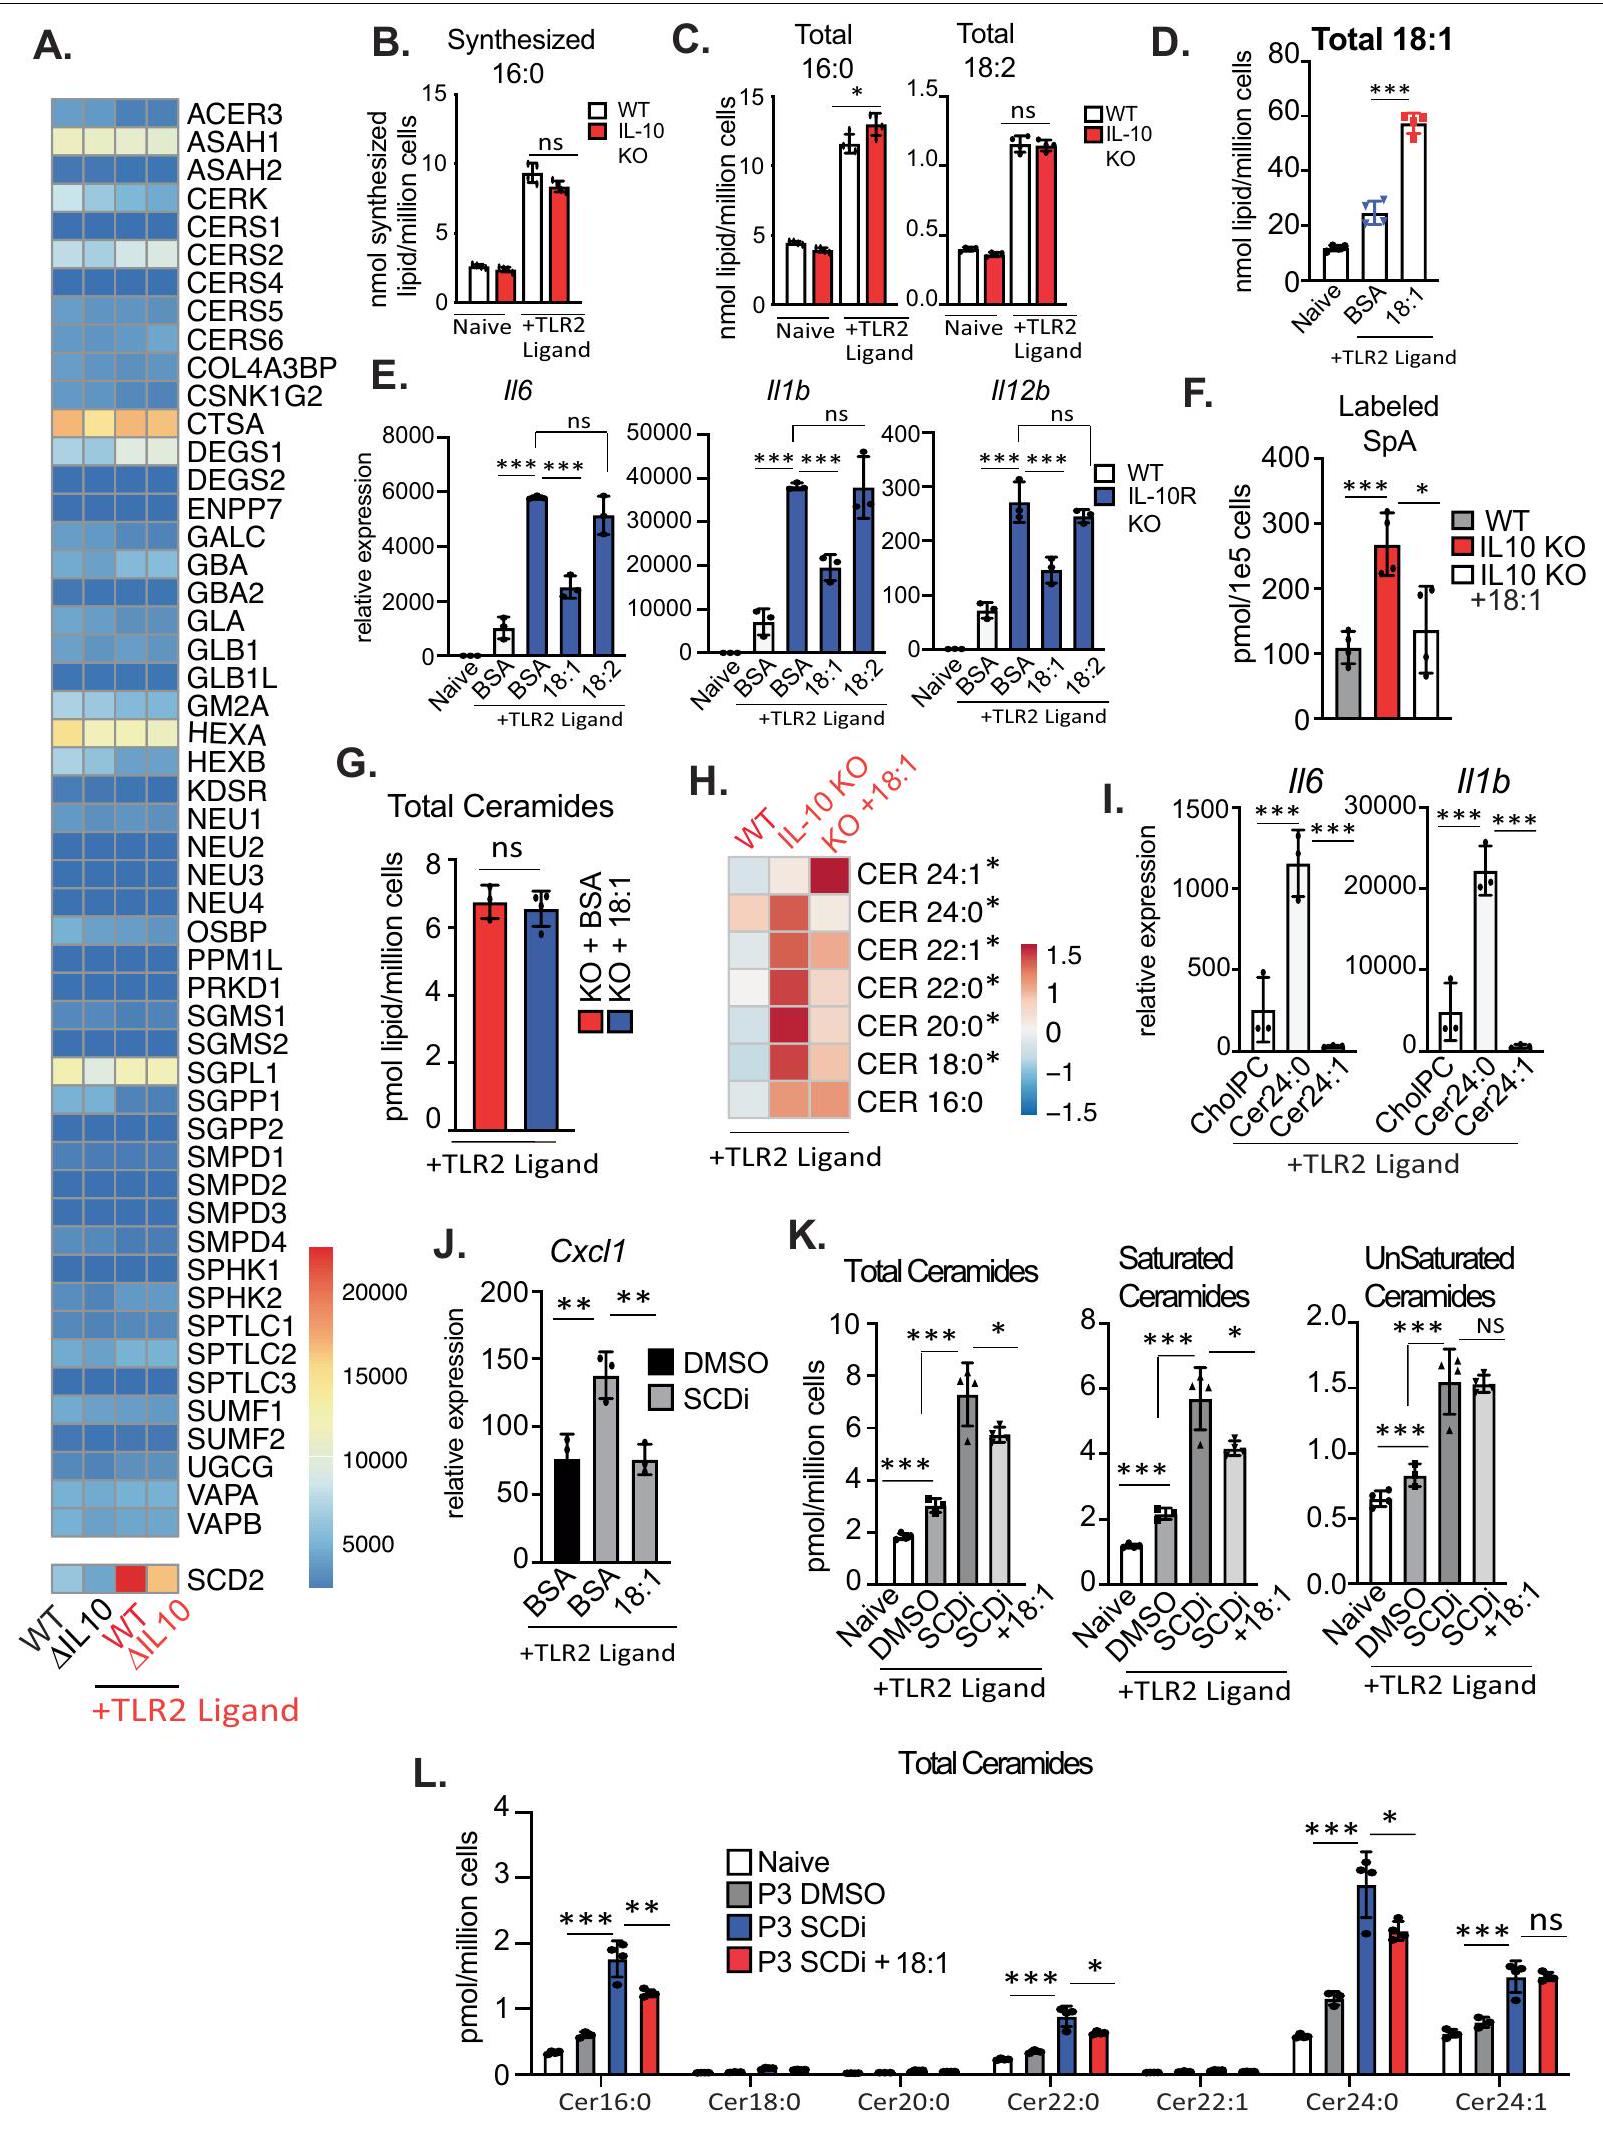
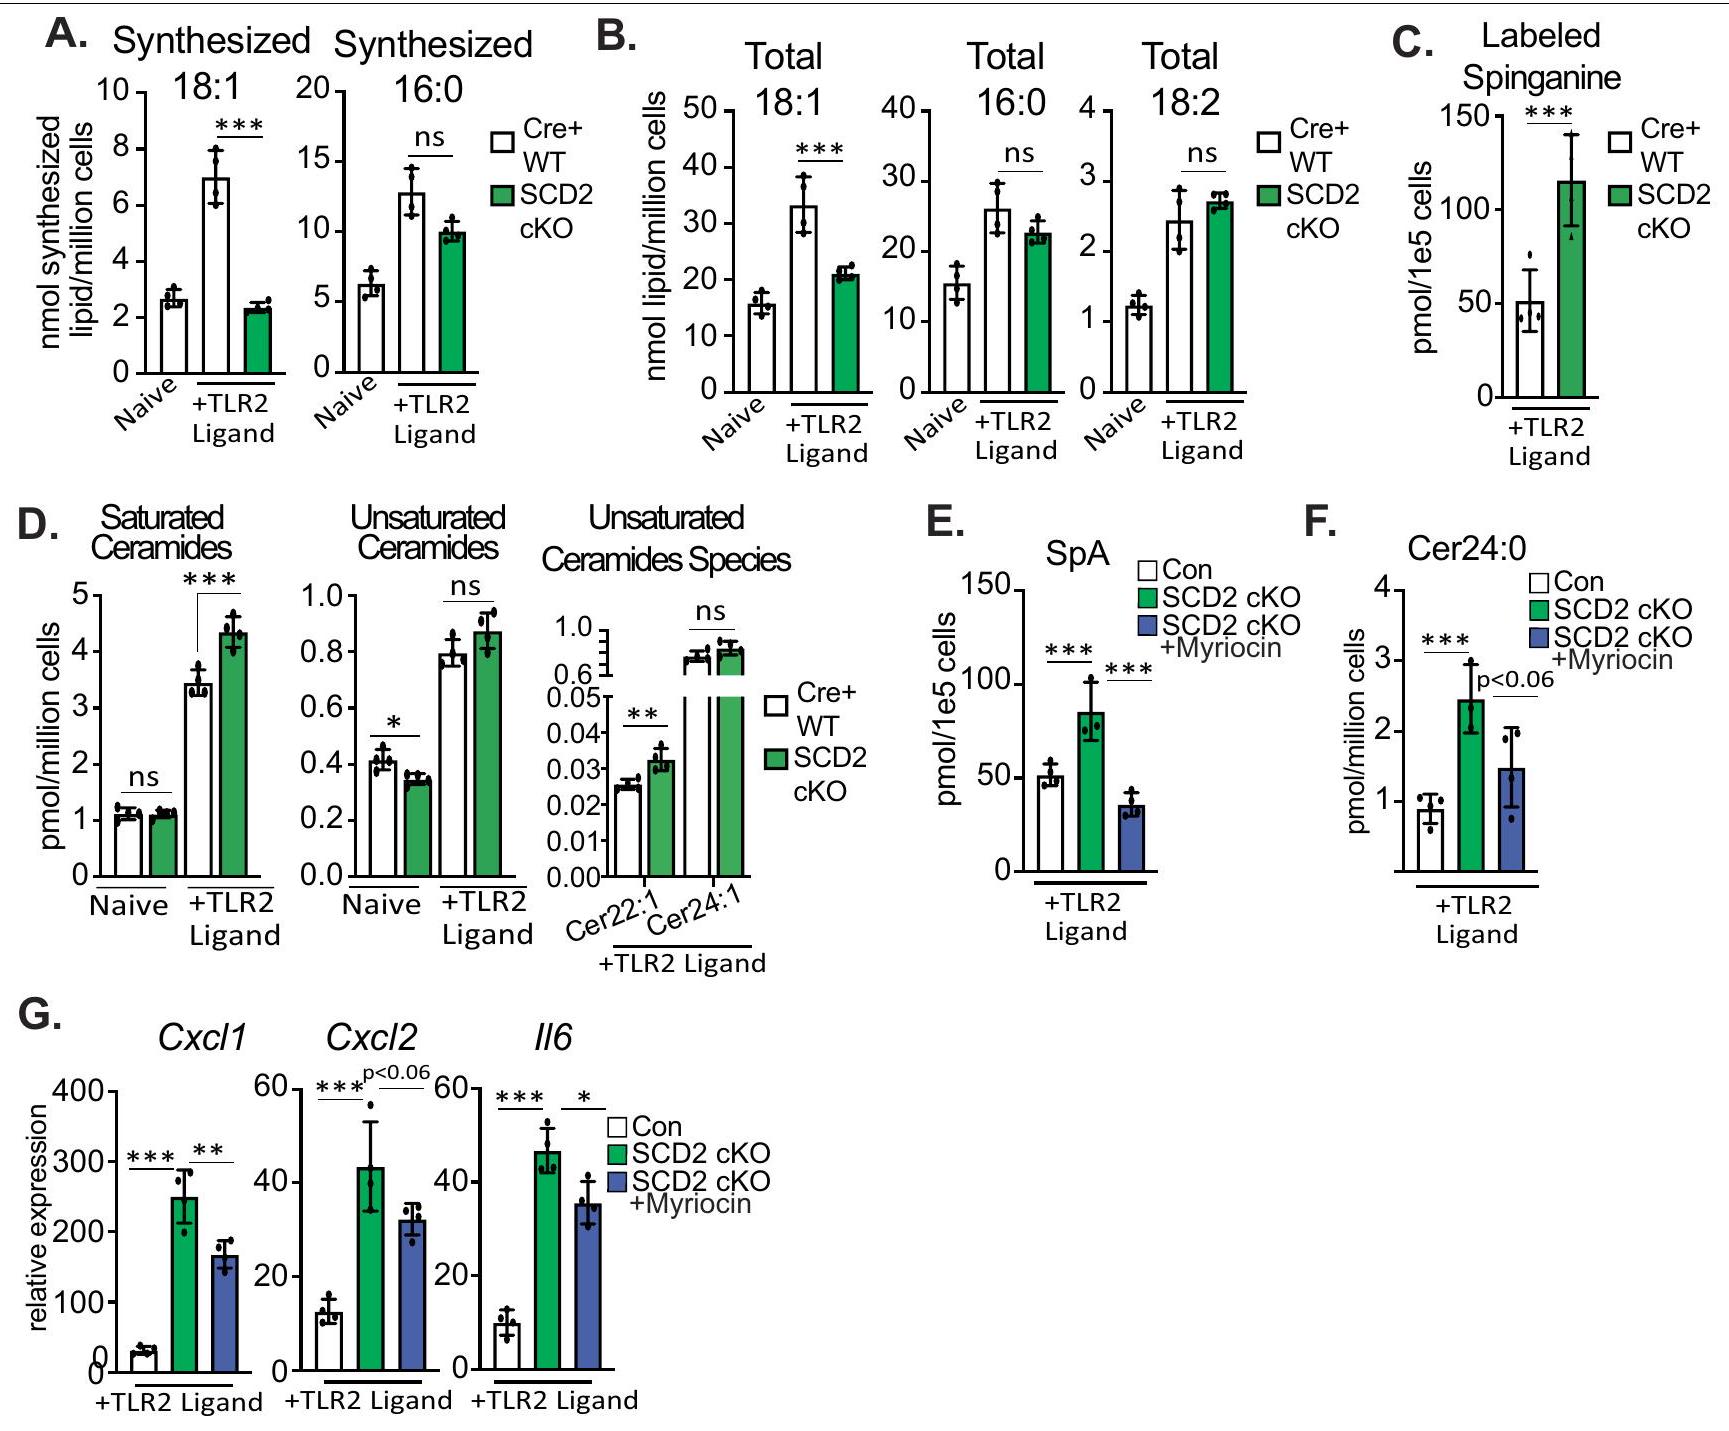
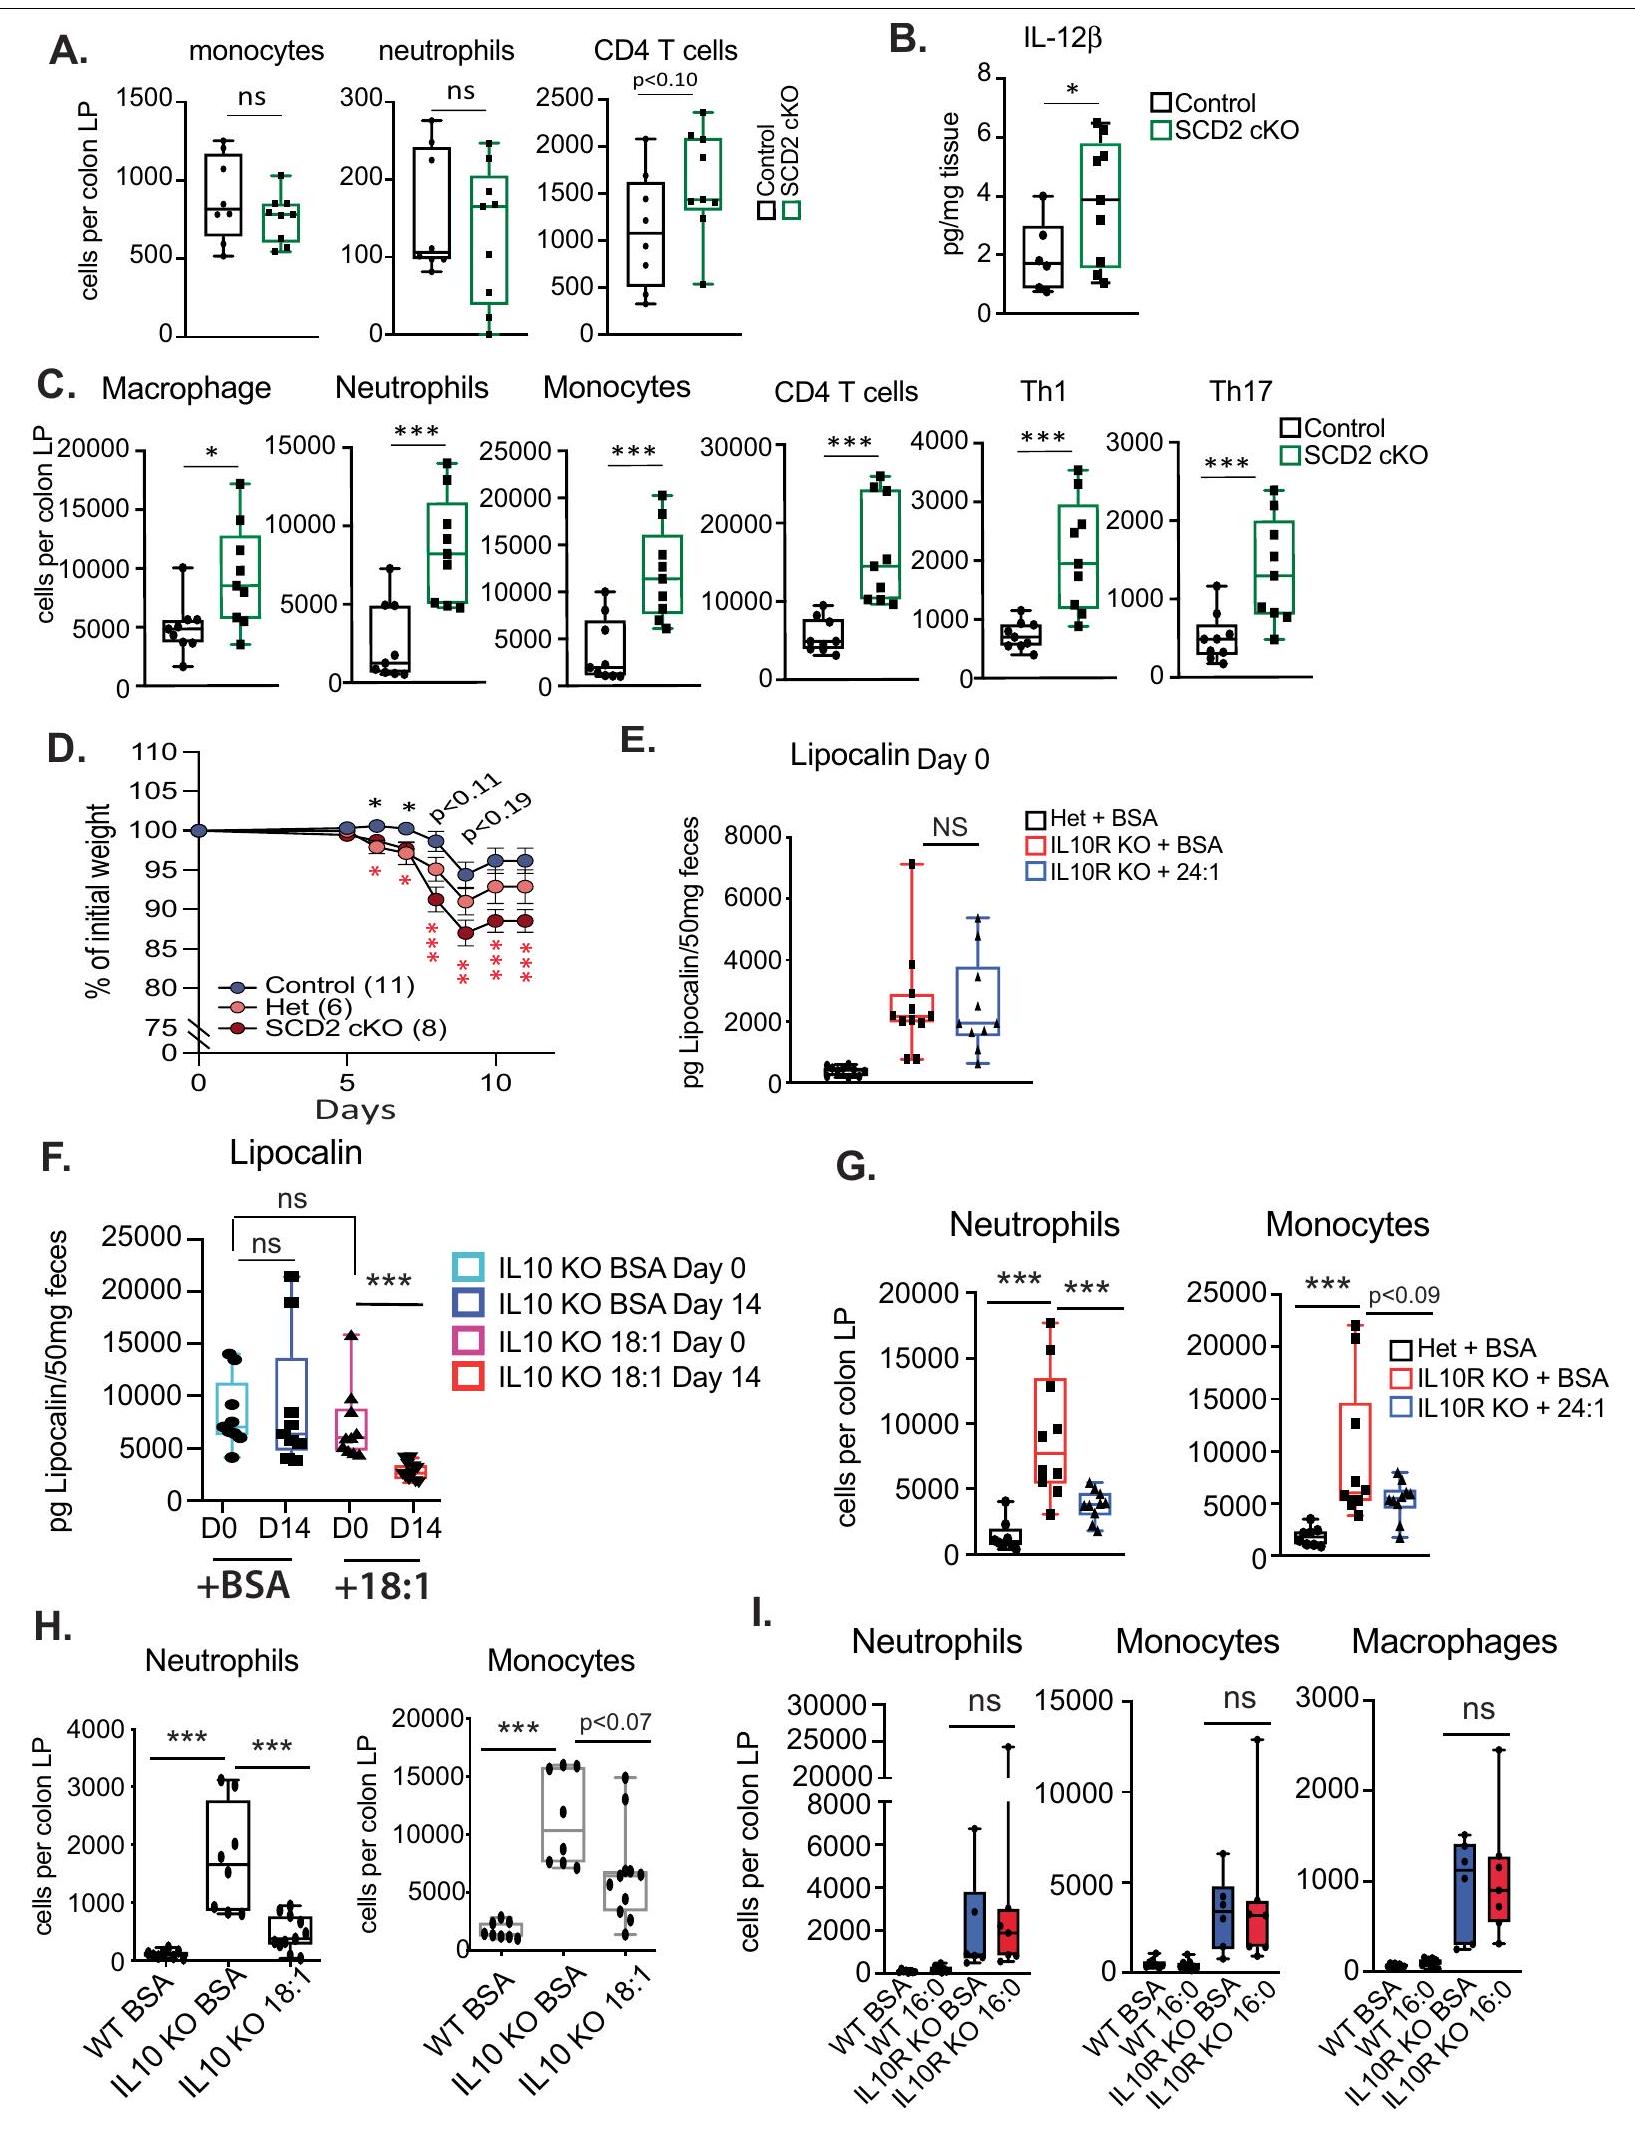
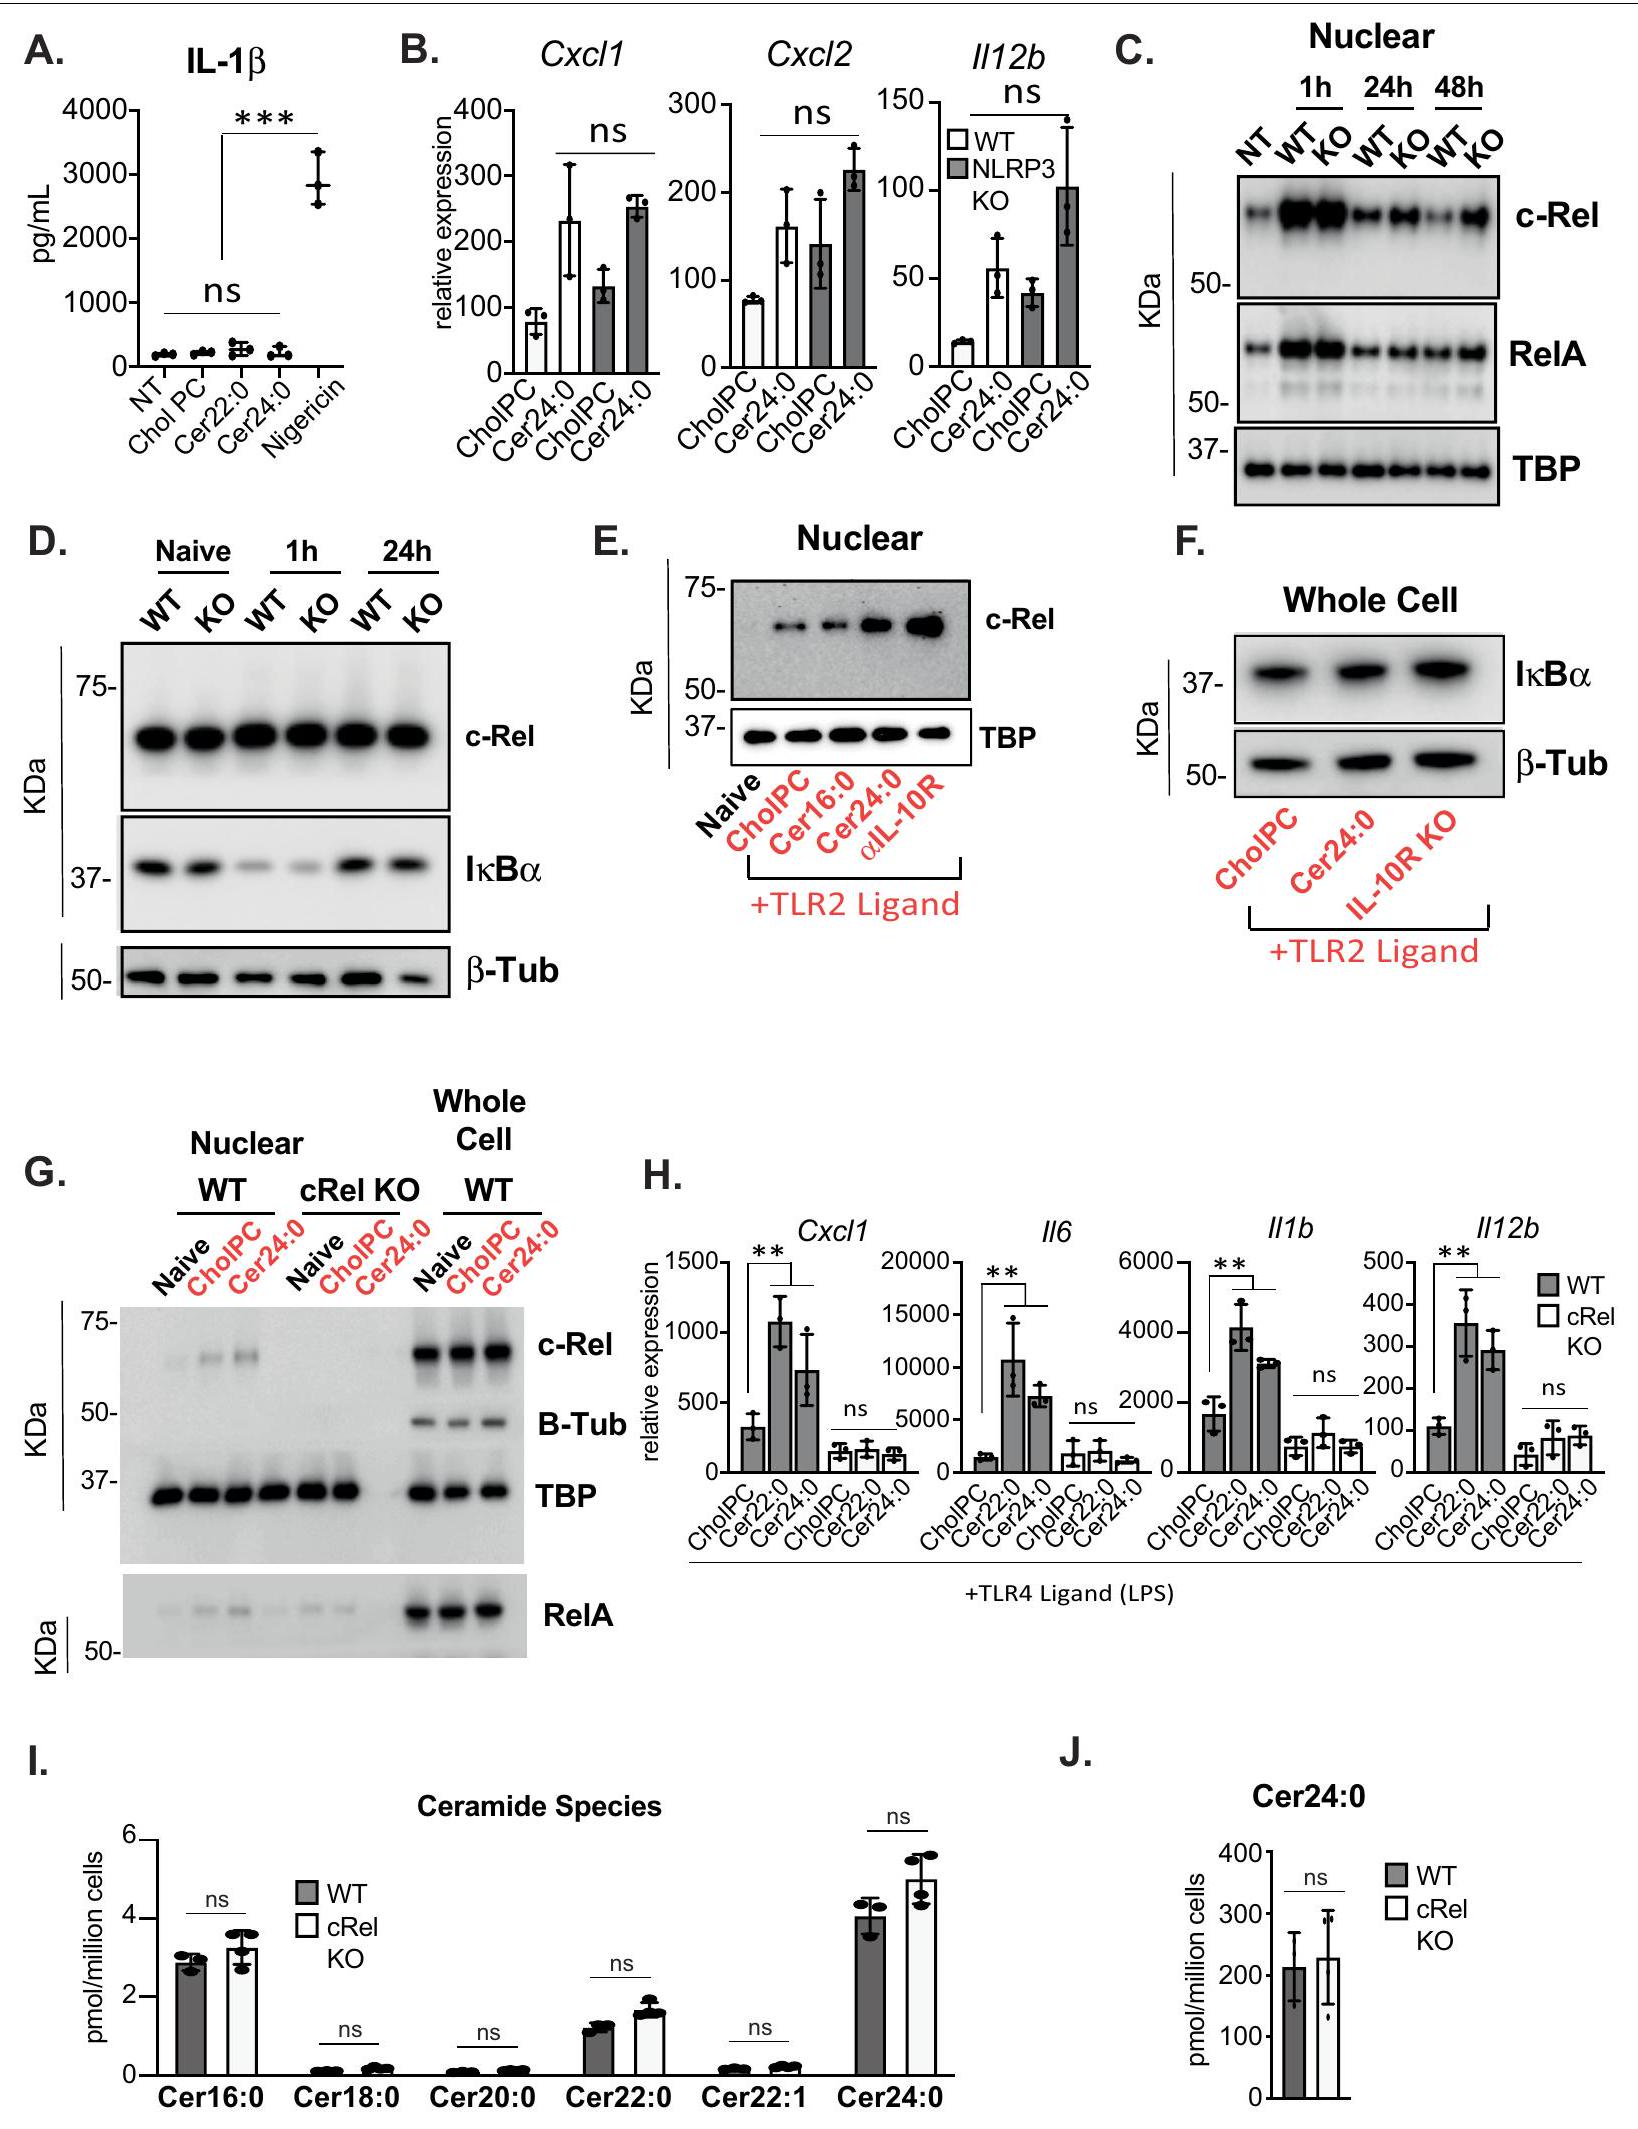
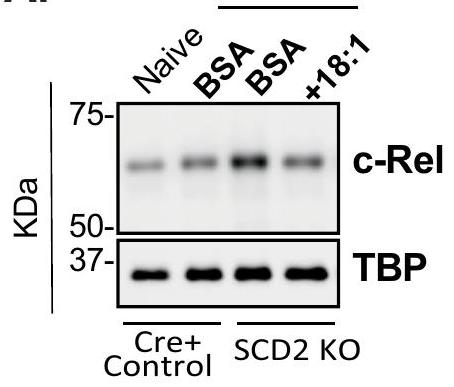

 قسم المناعة، كلية الطب، جامعة واشنطن، سياتل، واشنطن، الولايات المتحدة الأمريكية.