PDF-5+: ملف شامل لتشتت المسحوق™ لتوصيف المواد PDF-5+: a comprehensive Powder Diffraction File™ for materials characterization

المجلة: Powder Diffraction، المجلد: 39، العدد: 2
DOI: https://doi.org/10.1017/s0885715624000150
تاريخ النشر: 2024-04-15

PDF-5+: ملف شامل لتشتت المسحوق™ لتوصيف المواد

سوريا ن. كابيكودو (ب، أنجا دوسن (د)، وتوماس ن. بلانتون (د)المركز الدولي لبيانات الحيود، نيوتاون سكوير، بنسلفانيا، الولايات المتحدة الأمريكية

(استلم في 22 نوفمبر 2023؛ قبل في 19 مارس 2024)

الملخص

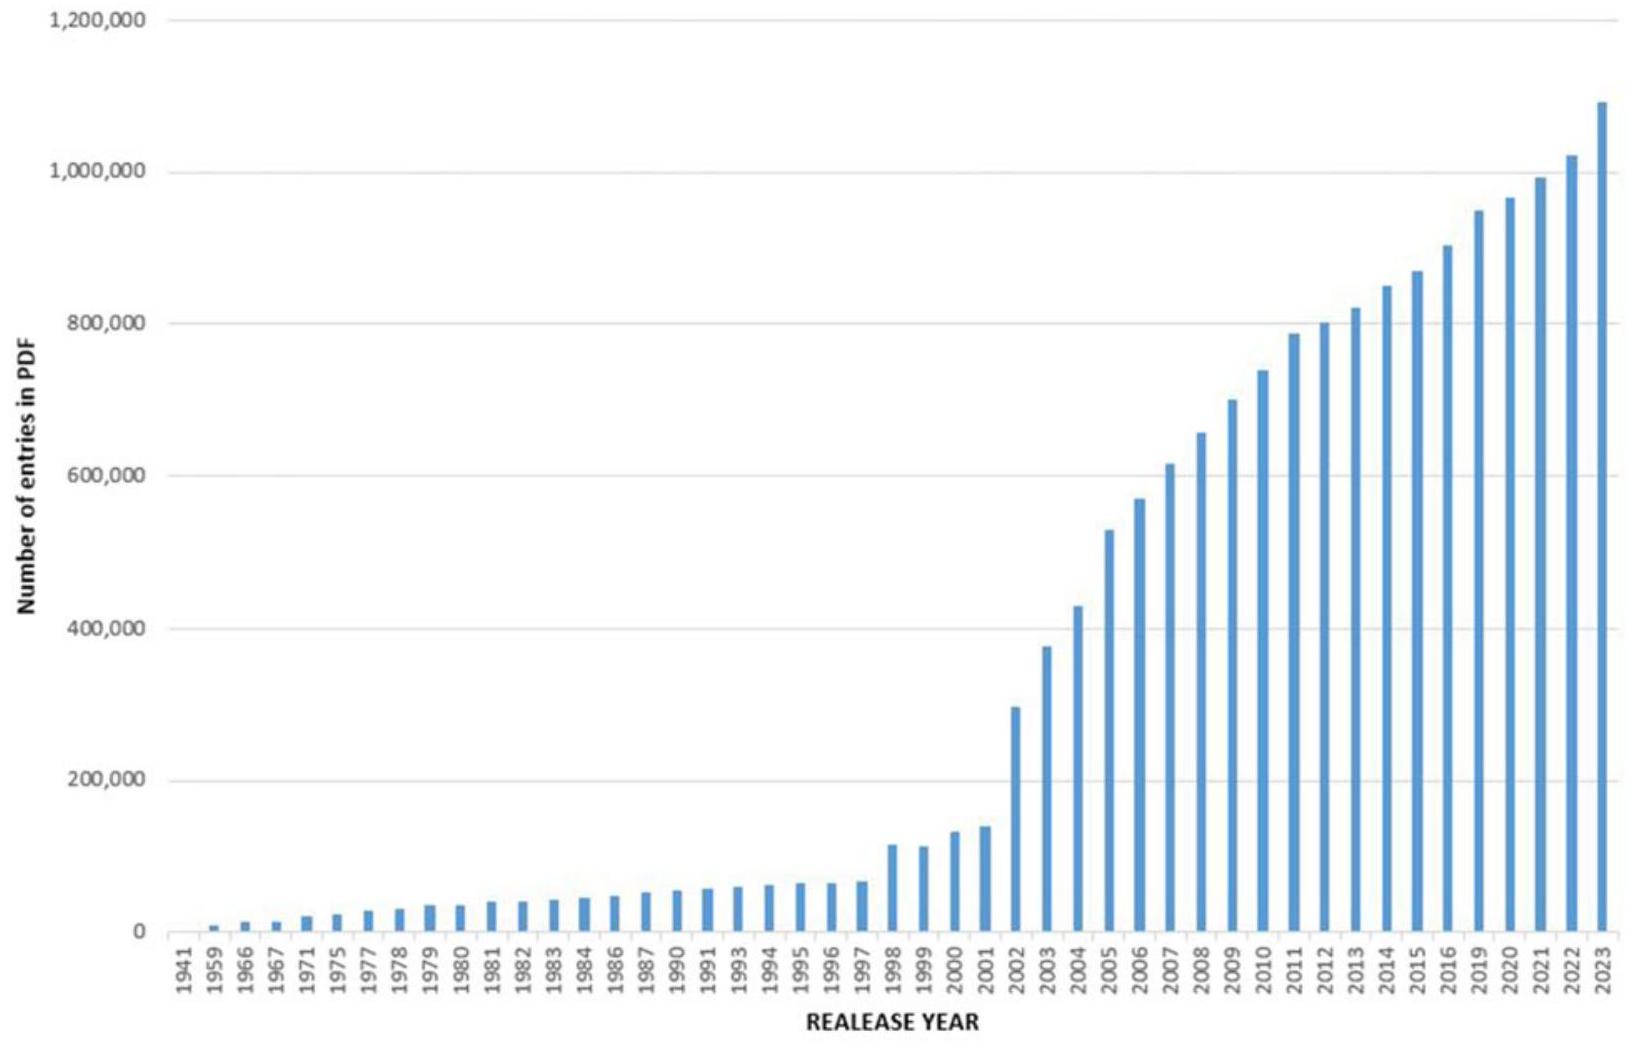
على مدى أكثر من 80 عامًا، استخدمت المجتمع العلمي بشكل واسع ملف حيود المسحوق (PDF®) من المركز الدولي لبيانات الحيود (ICDD®) لتوصيف المواد، بما في ذلك تحليل حيود الأشعة السينية للمسحوق. تاريخيًا، تم توفير PDF لنوعين رئيسيين من المواد: واحد للتحليل غير العضوي والآخر للتحليل العضوي. في السنوات الأولى من PDF، تم تنفيذ هذا النهج المكون من مادتين بسبب القدرات المحدودة للحواسيب. مع الإصدار 2024، يقدم ICDD قاعدة بيانات شاملة تتكون من كامل PDF في قاعدة بيانات واحدة تُسمى PDF-5+، وتتكون من أكثر من مليون إدخال. ). يحتوي PDF-5+ مع بناء قاعدة البيانات العلائقية (RDB) على بيانات كيميائية وفيزيائية وببليوغرافية وبلورية واسعة النطاق، بما في ذلك الإحداثيات الذرية والبيانات الخام، مما يمكّن من التحليل النوعي والكمّي للطور. هذه الثروة من المعلومات في قاعدة بيانات واحدة مفيدة لتحديد الطور، وتوصيف المواد، والعديد من تطبيقات استخراج البيانات في علم المواد. تحتاج قاعدة بيانات بهذا الحجم إلى تنسيق بيانات صارم وتصنيفات هيكلية وكيميائية لتحسين طرق البحث/المطابقة والتوصيف. كل إدخال في PDF يحمل علامة جودة معينة تم تعيينها تحريرياً. ستصف تعليق تحرير السبب إذا لم يستوفِ الإدخال علامة الجودة العليا. تتميز العمليات التحريرية لنظام إدارة الجودة في ICDD بأنها معتمدة وفقاً لمعيار ISO 9001:2015. من بين عدة تصنيفات تم تنفيذها في PDF-5+، تؤثر الملفات الفرعية (مثل المواد النشطة حيوياً، والأدوية، والمعادن، إلخ) بشكل مباشر على البحث/المطابقة في تقليل الإيجابيات الكاذبة. يقوم العلماء ذوو الخبرة في مجالات محددة بمراجعة هذه الملفات الفرعية باستمرار للحفاظ على جودتها. تصف هذه الورقة ميزات PDF مع التركيز على PDF-5+ الذي تم إصداره حديثاً.

© المؤلفون، 2024. نُشر بواسطة مطبعة جامعة كامبريدج نيابةً عن المركز الدولي لبيانات الحيود. هذه مقالة مفتوحة الوصول، موزعة بموجب شروط رخصة المشاع الإبداعي للاستخدام.http://creativecommons.org/licenses/by/4.0/الذي يسمح بإعادة الاستخدام والتوزيع والاستنساخ دون قيود، بشرط أن يتم الاستشهاد بالمقالة الأصلية بشكل صحيح.
[doi:10.1017/S0885715624000150]
الكلمات المفتاحية: حيود الأشعة السينية بالمسحوق، قاعدة بيانات XRD، علامة الجودة، الملفات الفرعية، بطاقة PDF

المقدمة

لقد أصبحت حيود المسحوق أداة لا غنى عنها في توصيف المواد نظرًا لتنوع تطبيقاتها، من تحديد المواد، والكمية، وتوضيح البنية إلى تحليل الملمس. يُعتبر حيود الأشعة السينية بالمسحوق (PXRD) واحدة من أكثر التقنيات استخدامًا في أبحاث المواد الصلبة، حيث يُعتبر نمط PXRD غالبًا بصمة للمادة قيد الدراسة. يُعد PXRD أداة حيوية لتوصيف الأطوار التي يكون من الصعب أو غير الممكن عمليًا تنمية بلورة مفردة لها، أو عندما تكون الطور المعني عضوًا واحدًا من خليط مكون من مادتين أو أكثر من المواد البلورية المتعددة.
تعود أصول الطريقة المستخدمة لتحديد الطور (الأطوار) الموجودة في عينة معينة باستخدام حيود الأشعة السينية إلى عام 1938 (هانوالت وآخرون، 1938). في هذه الورقة، قدم المؤلفون تقنية لتحديد الأطوار باستخدام حوالي ألف نمط PXRD للأطوار البلورية، مما أدى إلى نشوء تحديد الطور (Phase ID) باستخدام PXRD. تُعرف هذه الطريقة بشكل شائع باسم بحث هانوالت.
يتضمن تطوير فهرس باستخدام أقوى 3 خطوط (قمم) من نمط الانكسار وتجميعها في 77 تقسيمًا (هانوال و آخرون، 1938؛ هانوال، 1986). يمكن مقارنة خطوط PXRD القوية للطور غير المعروف مع فهرس هانوال لتحديد الطور. كانت أهمية معلومات الانكسار مركزية في تشكيل اللجنة المشتركة للتحليل الكيميائي بواسطة طرق الانكسار بالمسحوق في عام 1941، برعاية مشتركة من لجنة ASTM E-4، وجمعية البلورات الأمريكية، والمعهد البريطاني للفيزياء (فابر وفوسيت، 2002). تم نشر أول مجموعة من قاعدة بيانات الانكسار بالمسحوق في عام 1941 كالمجموعة 1 من ملف الانكسار بالمسحوق (PDF) (فابر وفوسيت، 2002). بحلول عام 1969، تم تشكيل لجنة ASTM كمنظمة غير ربحية في بنسلفانيا تحت عنوان اللجنة المشتركة لمعايير الانكسار بالمسحوق (JCPDS). في عام 1978، تم اعتماد الاسم الحالي، المركز الدولي لبيانات الانكسار (ICDD). تم تلخيص ملخص لسنوات التأسيس لملف PDF لاحقًا بواسطة ميسيك، 2012. لا يزال يتم إدارة PDF وصيانته من قبل المركز الدولي لبيانات الانكسار (ICDD،www.icdd.com) منظمة علمية غير ربحية مكرسة لجمع وتحرير ونشر وتوزيع المسحوق
بيانات الحيود لتحديد المواد. تتكون عضوية ICDD من تمثيل عالمي من الأكاديميا والحكومة والصناعة. هذه الورقة هي تحديث لورقة سابقة تم نشرها (Gates-Rector و Blanton، 2019) حول PDF®. في هذه الورقة، نحاول التركيز على التغييرات الأخيرة في قاعدة بيانات PDF وبرامج قواعد البيانات العلائقية وتقليل تكرار الميزات التي تم تقديمها في ورقة Gates-Rector و Blanton لعام 2019.

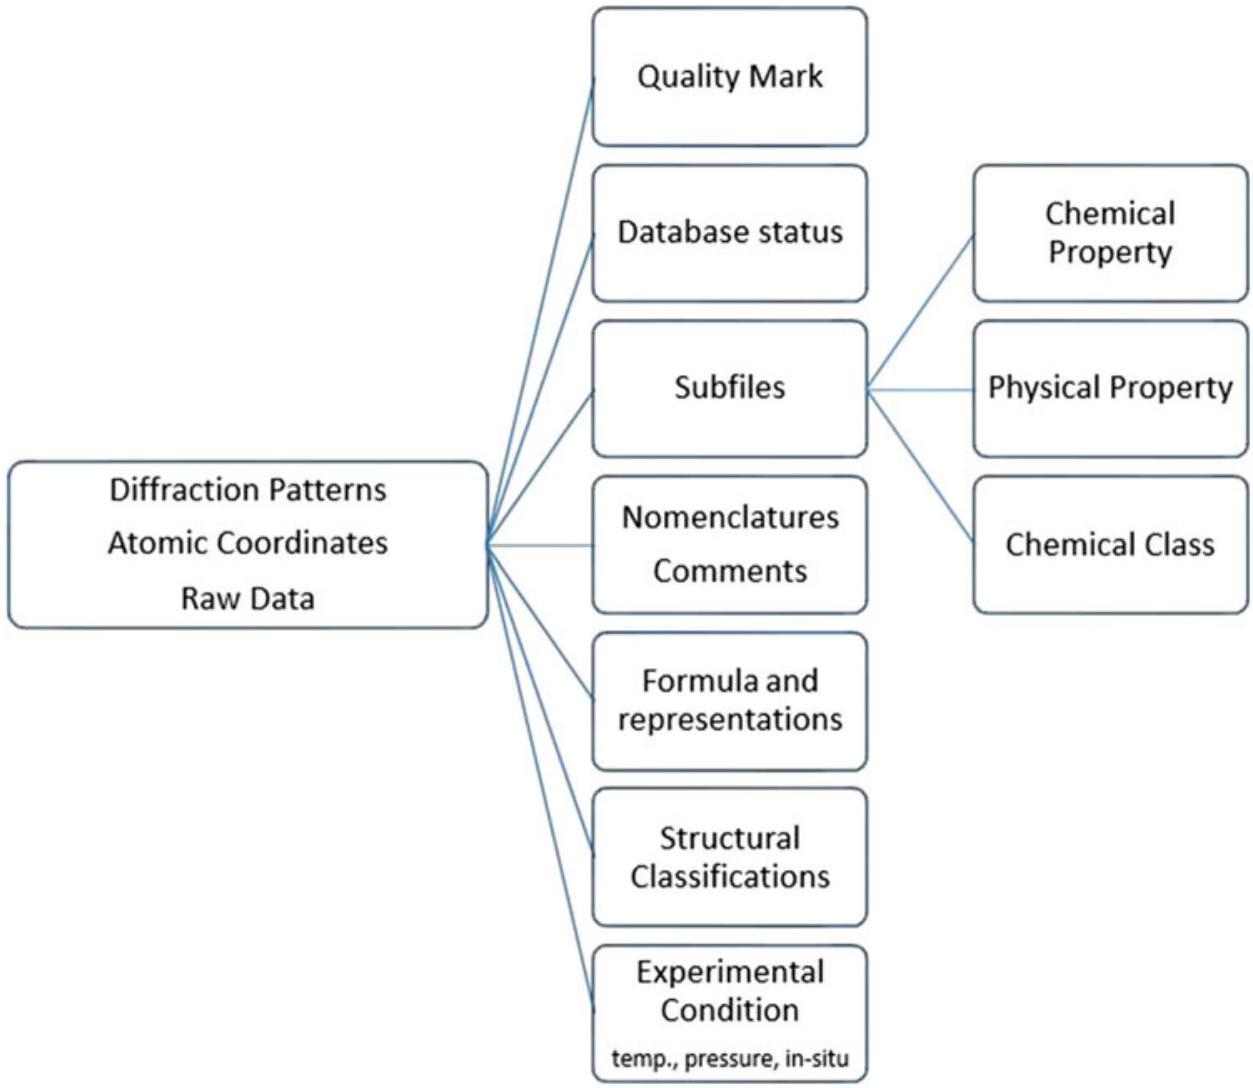
II. تطوير قاعدة البيانات: PDF

في المجموعة 1 من ملف PDF المنشور في عام 1941، تم نشر بيانات حيود المسحوق على 3 بوصات في بطاقة ورقية (الشكل 1(أ)) تسرد المسافات بين الطبقات ( المسافات) والكثافات النسبية ( ) خصائص المركب (جينكينز وآخرون، 1987). يظهر الكتاب الأصلي المكتوب بخط اليد من قبل هاناوالت وآخرون (1938) في الشكل 1(b). تم تقديم النسخة الإلكترونية الأولى من PDF في عام 1967 بتنسيق ملف مسطح مما يتيح البحث/المطابقة الآلية (جونستون وفاند، 1967). كانت هذه هي النسخة الإلكترونية الأولى من قاعدة بيانات بلورية. على مر السنين، تعاونت ICDD مع منظمات قاعدة بيانات مختلفة لتوسيع نطاق تغطية المواد في PDF لتسهيل توصيف المواد باستخدام PXRD. تم بدء مشروع تعاوني مع المكتب الوطني للمعايير في عام 1953 واستمر لأكثر من 30 عامًا (وونغ-نج وآخرون، 2001). يظهر نمو PDF منذ بدايته في عام 1941 حتى 2023 في الشكل 2. كما هو موضح في الشكل 2، فإن الارتفاعات في البيانات في سنوات 1998 و2002 و2005 تعود إلى بدء التعاون مع ICSD (بيانات بنية البلورات غير العضوية، FIZ كارلسروه؛ زاغوراك وآخرون، 2019)، CSD (بيانات بنية كامبريدج، مركز بيانات البلورات كامبريدج؛ غرووم وآخرون، 2016؛ برونو وآخرون، 2017)، و LPF (ملف لينوس باولينغ، نظام بيانات مراحل المواد؛ فيلارز وسينزوال، 2018) على التوالي. استجابت ICDD للحاجة المتزايدة لمتطلبات قاعدة البيانات في توصيف المواد باستخدام حيود الأشعة السينية بالمسحوق من خلال تنفيذ مشروع فريد يستهدف جمع البيانات، بما في ذلك البيانات الخام، والملفات الفرعية المخصصة. لدى ICDD برنامج منح للمساعدة في الحصول على بيانات الحيود عن المواد المستهدفة ومعلومات حول هذه المنحة متاحة على موقع ICDD الإلكتروني.https://www.icdd.com/grant-in-aid/).
شهد نظام إدارة البيانات لملف PDF تغييرًا كبيرًا في عام 2005 من خلال اعتماد قاعدة بيانات علائقية.
نظام إدارة قواعد البيانات العلائقية (RDBMS). يحتوي ملف PDF بتنسيق قاعدة البيانات العلائقية (RDB) على بيانات كيميائية وفيزيائية وببليوغرافية وكريستالوجرافية شاملة، بما في ذلك الإحداثيات الذرية التي تمكن من التوصيف والتحليل الحسابي. يوفر بناء RDB وصولاً مرنًا إلى قاعدة البيانات لدراسات استخراج البيانات ويعزز قدرات توصيف مواد PDF (Faber و Fawcett، 2002؛ Kabekkodu وآخرون، 2002). واحدة من الفوائد العميقة لـ RDB هي التنفيذ الأكثر بساطة لمبادئ FAIR (قابلية الاكتشاف، الوصول، التشغيل البيني، وإعادة الاستخدام) (Wilkinson وآخرون، 2016) وتحسين التشغيل البيني للبيانات. هذا النوع من البناء حيوي من منظور التشغيل البيني، نظرًا لوجود العديد من الروتينات البرمجية الآلية (من قبل مختلف مصنعي أجهزة قياس الحيود أو مطوري البرمجيات) المستخدمة لتحديد الكتلة وكمية الطور.
حتى إصدار 2024، كانت منتجات قاعدة بيانات PDF مفصولة كـ PDF-4+ و PDF-4/Organics للتركيز على تحديدات الأطوار غير العضوية والعضوية. مع تزايد عدد الإدخالات المتداخلة التي تشمل كل من الأطوار غير العضوية والعضوية، يحتاج المجتمع الذي يستخدم PDF بشكل متكرر إلى كل من محتوى PDF غير العضوي والعضوي لإكمال توصيف الأطوار في العينة بنجاح. لمواجهة هذا التحدي المتزايد، يجمع PDF-5+ الجديد بين الملفات غير العضوية والعضوية السابقة في قاعدة بيانات واحدة تحتوي على 1061898 إدخال. هناك العديد من مرشحات قاعدة البيانات المفيدة (الشكل 3، التسميات 1، 2، و 3) لتحسين آليات البحث. بعبارة أخرى، إذا رغب المستخدم، يمكنه تقليد وظيفة PDF-4+ أو PDF-4/Organics.

III. تنسيق البيانات

في تحديد الطور أو التوصيفات ذات الصلة، تتم مقارنة نمط مسحوق المستخدم مع قاعدة البيانات. تعتبر قاعدة البيانات المنسقة جيدًا ضرورية لجعل هذا التحليل فعالًا وموثوقًا. بالإضافة إلى أنماط الحيود والمعلمات الكريستالوجرافية، تلعب تنسيق البيانات الوصفية دورًا حيويًا في تحديد الطور حيث يحاول المرء ربط جميع القمم في نمط الحيود المقاس مع إدخال واحد أو أكثر في قاعدة بيانات PDF-5+ للطور. يوضح الشكل 4 نظرة عامة عامة على البيانات المنسقة في PDF. العديد من البيانات الوصفية في الشكل 4 واضحة بذاتها؛ ستصف القسم التالي بإيجاز بعض الميزات الرئيسية في تحديد الطور ودراسات استخراج البيانات. يمكن البحث في جميع هذه الحقول، ويمكن دمج عدة
الشكل 1. (أ) بطاقة PDF المبكرة و (ب) كتاب الفهرس العددي الأصلي هانوالت (بإذن من شركة داو الكيميائية).
الشكل 2. نمو الإدخالات في ملف حيود المسحوق (ملاحظة: من أجل وضوح أفضل، تم عرض سنوات مختارة فقط خلال الفترة من 1941-1993 لتوضيح الاتجاه).
الشكل 3. شريط أدوات PDF-5+ مع الأوصاف المدرجة في الجدول I.
يمكن دمج عمليات البحث باستخدام عوامل التشغيل البوليانية لتسريع دراسات البحث/المطابقة واستخراج البيانات.

A. علامة الجودة وحالة قاعدة البيانات

تعتبر PDF ICDD قاعدة بيانات منسقة حيث يتم تقييم كل إدخال باستخدام مزيج من الكمبيوتر والمراجعة التحريرية البشرية
وتقدم باستخدام تسمية علامة الجودة (QM) (Hubbard وآخرون، 1980؛ Jenkins و Smith، 1987؛ Bruno وآخرون، 2017؛ Gates-Rector و Blanton، 2019؛ Kaduk، 2019) التي توفر للمستخدم عملية منهجية لفهم جودة إدخال البيانات ونهج متسق في تقييم جودة المطابقة (GOM) لتحديد الطور. لقد مرت جميع البيانات في PDF بعملية تحرير متعددة المستويات.
الجدول I. أوصاف شريط أدوات PDF-5+.
التسمية الوصف
1 جميع البيانات: تستخدم قاعدة البيانات بالكامل
2 التركيز على غير العضوي: بشكل رئيسي للأطوار غير العضوية مع بعض المواد العضوية الشائعة (رمز DB 02- ومعظم 05- غير مدرجة)
3 التركيز على العضوي: بشكل رئيسي للأطوار العضوية مع بعض المواد غير العضوية الشائعة (مثل المواد المساعدة، والأصباغ، إلخ.)
A بطاقات PDF: تفتح بطاقة PDF (إدخال) بالرقم PDF المعطى. كما تحتوي على ميزة لفتح إدخالات PDF المقابلة لمعرف قاعدة البيانات المتعاون (CSD، ICSD، NIST، LPF)
B التفضيلات: يمكن تخصيص تفضيلات العرض مثل الحقول المرغوبة ومعلمات محاكاة الأنماط.
C البحث: يفتح نافذة البحث الرئيسية. يمكن استخدام زر القائمة المنسدلة لاختيار عمليات البحث الأخيرة.
D التاريخ: يحتوي على معايير البحث السابقة. يمكن دمج هذه العمليات باستخدام عوامل التشغيل البوليانية “و”، “أو”
E النتائج: باستخدام زر القائمة المنسدلة، يمكن إعادة ملء نتائج البحث السابقة
F رسم بياني للتكوين: يمكن رسم أي مجموعة من عنصرين أو ثلاثة كدالة لنسبة الذرات أو الوزن%. على سبيل المثال، النظام
G SIeve+: يطلق برنامج البحث/المطابقة SIeve+
H التحليل الدقيق: التركيب العنصري من تحليل micro-XRF، تحليل المجهر، أو تحليل عنصر آخر
الشكل 4. نظرة عامة عامة على البيانات المنسقة في ملف حيود المسحوق.
الشكل 5. عرض تخطيطي لعملية تعيين علامة الجودة (QM). الصف العلوي يتوافق مع نطاق الفحوصات بينما يوفر الصف الثاني من الصناديق مخططًا للفحوصات التي يتم إجراؤها. تشير QM المعينة إلى جودة عالية ( أو G)، جودة متوسطة ( ، أو M)، جودة منخفضة أو O ، أو أنماط افتراضية ( ).
العملية. نظام إدارة الجودة ICDD معتمد من المنظمة الدولية للتوحيد القياسي (ISO 9001:2015، رقم الشهادة: 110409.01). يلخص الشكل 5 بإيجاز معايير تقييم QM التي يتم فحصها بواسطة روتينات الكمبيوتر ثم مراجعتها بواسطة أحد محرري PDF قبل تعيين QM.
كل إدخال في PDF له QM معين تحريرياً. ستصف تعليق تحرير السبب الذي يجعل الإدخال لا يفي بعلامة الجودة العليا. يحتوي PDF على نوعين من أنماط PXRD، تجريبية ومحسوبة من هياكل بلورية منشورة. تأخذ عملية تعيين QM في الاعتبار كل منهما بشكل منفصل بعد المرور بأكثر من 100 فحص تحقق من البيانات كما هو موضح في الشكل 5. من المهم أن نلاحظ هنا أن تعيين QM يتم بشكل صارم من وجهة نظر تحديد الطور. على سبيل المثال، يمكن أن تؤثر أنماط PXRD المحسوبة باستخدام بيانات هيكل بلوري مع ذرة مفقودة، أو اضطراب، أو موقع غير صحيح
عامل الإشغال، أو معلمات إزاحة مشكوك فيها بشكل كبير على تحديد الطور وبالتالي سيكون لها QM أقل. تتطلب أنماط PXRD التجريبية نوعًا مختلفًا من المعالجة من خلال مراعاة نقاء الطور، وجودة نمط الحيود، والفهرسة. تنطبق QMs G و M فقط على الأنماط ذات البلورات الضعيفة، والمواد النانوية، والأنماط غير المتبلورة. في هذه الحالة، تؤكد معايير QM على الجودة الكيميائية، وجودة البيانات، وتوصيفات أخرى (الطيفية، دالة توزيع الزوج، والميكروسكوبية). يصف الجدول II QMs المستخدمة في PDF.
من الشائع في قواعد البيانات الكريستالوجرافية الكيميائية أن يكون هناك إدخالات متعددة لطور معين، خاصة في حالة الهياكل المدروسة على نطاق واسع. تستخدم PDF علامة حالة قاعدة البيانات لتصنيف الإدخالات المتعددة كإدخال أساسي، بديل، أو محذوف. يصف الجدول III معنى هذه الرموز. يجمع بين الجودة
الجدول II. المعايير الرئيسية لتعيين علامة جودة PDF.
علامة معلومات كريستالوجرافية تحذيرات أخرى
S أو (*) متوسط
– بيانات عالية الجودة من جهاز قياس الحيود أو بيانات غينييه
– خلية وحدة معروفة
– فهرسة كاملة
– لا شيء محدد للأنماط المعتمدة تجريبياً. بالنسبة للأنماط المحسوبة من ICDD، يجب ألا تكون هناك أي تحذيرات كريستالوجرافية.
G
– مكونات غير متبلورة كبيرة موجودة
– نسبة إشارة إلى ضوضاء جيدة في نمط الحيود الرقمي (PD3) المقدمة
– معلومات التحليل الكيميائي المقدمة التي تدعم التركيب المحدد لمادة ما
(أي الطيفية، دوال توزيع الزوج، مصدر تجاري، إلخ).
I
متوسط
مطلق لجميع الانعكاسات
– نمط مفهرس
– خلية وحدة معروفة
– نطاق معقول وتوزيع متساوٍ في الشدات
– لا أخطاء منهجية خطيرة
– بحد أقصى اثنين من الانعكاسات غير المفهرسة، أو مجموعة الفضاء المنقرضة، أو انعكاسات الشوائب؛ لا يوجد أي من هذه الانعكاسات من بين أقوى ثمانية خطوط
– بالنسبة للأنماط المحسوبة، يُسمح فقط بالتحذيرات الهيكلية الطفيفة
يكون اكتمال النمط معقولًا. الانعكاسات التي تحتوي على – قيمة أقل من أو تساوي 2.000 أنغستروم تحتوي على ثلاث أرقام معنوية على الأقل بعد الفاصلة.
C
– تم حساب النمط من معلمات الهيكل البلوري الأحادي التي كان عامل تحسين الهيكل R -factor لها .
– تم التحقق من بيانات |F(calc)| مقابل البيانات المقابلة (obs)|
– أو –
– تم إجراء فحص كامل لمسافات الروابط والزوايا جنبًا إلى جنب مع فحوصات الكثافة والصيغة
– عدد الأرقام المهمة المطلوبة هو نفسه لعلامة الجودة “S”
– إذا كان النمط المحسوب لا يفي بمعايير علامة الجودة “S”، يتم تعيين QM = B هذا QM يشير إلى الأنماط المحسوبة المنشورة من قبل المؤلف. يجب عدم الخلط بين تلك التي تحمل “C” والأنماط المحسوبة من قبل ICDD بناءً على الهياكل البلورية من قواعد البيانات المتعاونة. سيكون للنمط المحسوب من قبل ICDD QM غير C/G/M.
M
– غير متبلور (أو بلوري بشكل ضعيف) كمكون رئيسي موجود
– نسبة إشارة إلى ضوضاء جيدة في نمط الانكسار الرقمي (PD3) المقدمة
لا توجد بيانات تحليل كيميائي لدعم تركيبة المواد المقدمة (عادةً عينات تجارية).
B
– قد تكون وحدة الخلية غير معروفة
إذا تم فهرستها، أعلى من QM “I”
– بالنسبة للأنماط المحسوبة من قبل ICDD، تحتوي هذه على تحذيرات كبيرة بشأن الهيكل غير المكتمل، تحذيرات التناظر، معلمات الإزاحة غير الإيجابية، إلخ. قد يحتوي النمط التجريبي على خطوط غير مفهرسة
P – ينطبق فقط على الأنماط المحسوبة – بالنسبة للأنماط المحسوبة من قبل ICDD بناءً على نموذج الهيكل. هذه هي الحالات التي عيّن فيها المؤلف أو المحرر نوع الهيكل
0
– مادة غير موصوفة بشكل جيد أو البيانات معروفة (أو مشكوك فيها) أنها ذات دقة منخفضة.
– عدد الانعكاسات غير المفهرسة، مجموعة الفضاء المنقرضة، أو الشوائب
واحدة من أقوى 3 انعكاسات غير مفهرسة
– وصف كيميائي ضعيف
– لم يتم الإبلاغ عن وحدة الخلية
– عادةً، قام المحرر بإدراج تعليق لشرح سبب تعيين “O”. تعني علامة الجودة ذات الدقة المنخفضة أن بيانات الانكسار قد تم أخذها على عينة مشكوك فيها أو واحدة تحتوي على شوائب كبيرة.
H – ينطبق فقط على الأنماط المحسوبة بالنسبة للأنماط المحسوبة من قبل ICDD بناءً على الهياكل النظرية [مثل حسابات نظرية الكثافة الوظيفية (DFT)]
الجدول III. وصف حالة قاعدة البيانات.
حالة قاعدة البيانات الوصف
أساسي (P) تم اختياره تحريرياً كمدخل تمثيلي لمرحلة معينة
بديل (A) خيارات بديلة لمرحلة معينة. هذا لا يعني بالضرورة جودة أقل من الأساسي
محذوف (D) عادةً ما تكون إدخالات مكررة، أخطاء غير محلولة، تم استبدالها بإدخالات تحتوي على بيانات أفضل.
العلامات مع حالة قاعدة البيانات مفيدة للغاية كمرشح في البحث في قاعدة البيانات، خاصة في الحالات التي توجد فيها عدة إدخالات لمرحلة معينة. على سبيل المثال، في الإصدار 2024 من PDF، هناك 77 نمطًا من الكوارتز، ولكن إذا استخدم المرء نمط الجودة الأساسي كمرشح، فإن مجموعة نتائج البحث ستحتوي على نمط واحد.

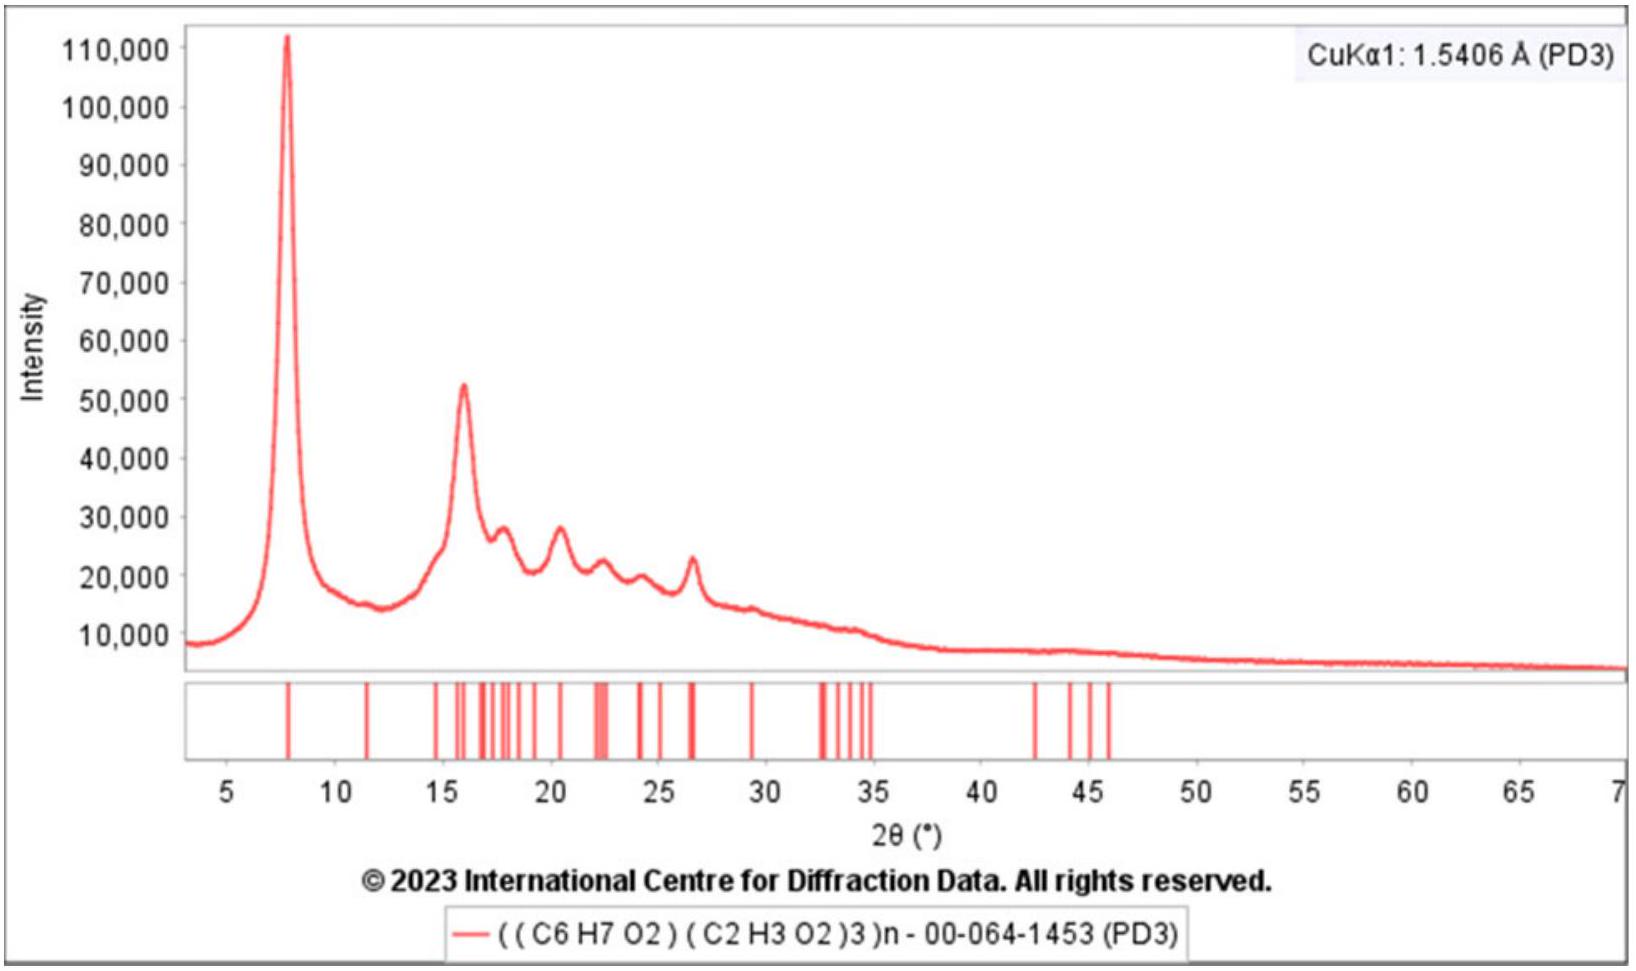
B. أرشفة البيانات الخام

الاهتمام بإيداع البيانات الخام المرتبطة بالتقرير في مقال مجلة له العديد من الجوانب الإيجابية. أولاً، يمكن لمراكز البيانات استرداد البيانات الخام وإذا رغبت في ذلك أرشفتها في قاعدة بيانات. لقد كانت IUCr تروج لهذه المبادرة كما فعلت ICDD لسنوات عديدة. الورقة الاستعراضية التي تحمل عنوانًا مناسبًا “العلم في البيانات” (Helliwell et al., 2017 والمراجع هناك) تلخص بشكل أنيق الحاجة إلى البيانات الخام في البلورات. التحديات في أرشفة أنماط الانكسار الخام متعددة بسبب الشوائب في المرحلة، استراتيجيات جمع البيانات، هندسة جهاز الانكسار، إعداد العينة، الأخطاء النظامية، والتوجه المفضل. في خوارزمية البحث/المطابقة التقليدية، يتم مقارنة أزواج المستخدمين ضد
قاعدة البيانات (Fawcett et al., 2017, 2020)، والتي تعمل بشكل جيد للمرحلة البلورية بسبب قممها الحادة (الضيقة). من الواضح من الشكل 6 أن وجود البيانات الخام أمر ضروري لإجراء تحديد المرحلة في حالة الأنماط البلورية الضعيفة أو غير المتبلورة حيث لا يمكن تمثيلها بشكل مرضٍ كقائمة من المسافات بين المستويات ( القيم) وشدة النسبية ( القيم) بسبب القمم العريضة التي تحتوي على عدة القيم. مطابقة البيانات الخام باستخدام مؤشر التشابه (Hofmann و Kuleshova، 2005) هي واحدة من أفضل الطرق لأداء البحث/المطابقة، خاصة في الحالات التي تكون فيها قمم الانكسار عريضة.
اعتبارًا من الإصدار 2024، يتوفر أكثر من 19,000 نمط انكسار مسحوق خام (1D) في PDF للمستخدمين لتحليل بيانات انكسار المسحوق. في تطبيق موسع، تم حل الهيكل البلوري لتراندولابريل (Reid et al., 2016) باستخدام البيانات الخام المودعة من PDF. هناك عدد متزايد من الأمثلة حيث تكون البيانات الخام ضرورية في توصيف العينات الصيدلانية (Fawcett et al., 2019) والبوليمرات (Gates et al., 2014).

C. التصنيفات الهيكلية

تلعب التصنيفات الهيكلية (الشكل 7) دورًا أساسيًا في التحقق من جودة الهيكل المنشور أو أنماط انكسار المسحوق. إنها أداة ممتازة لتحديد المراحل المماثلة التي لا يمكن التعرف عليها بسهولة. كما أنها أداة تحريرية جيدة لتحديد القيم الشاذة في مرحلة يُفترض أنها مرتبطة في مجموعة. من وجهة نظر التطبيق، فإن نماذج الهيكل مفيدة للغاية في اشتقاق نموذج ابتدائي لتحسين Rietveld عندما تكون قاعدة البيانات مفقودة الكيمياء الدقيقة [أي العنصر (العناصر)]. تستخدم ICDD عدة رموز تصنيف هيكلي لتلبية متطلبات العلماء من مجالات مختلفة الذين يستخدمون انكسار الأشعة السينية من أجل
الشكل 6. نمط PXRD من السليلوز ثلاثي الأسيتات I مع مواقع القمم المبلغ عنها إدخال PDF 00-064-1453.
الشكل 7. التصنيفات الهيكلية في ملف انكسار المسحوق.
توصيف المواد. لكل من هذه استخدام محدد في الكيمياء الهيكلية. التصنيفات الهيكلية المستخدمة حاليًا في PDF مدرجة أدناه.
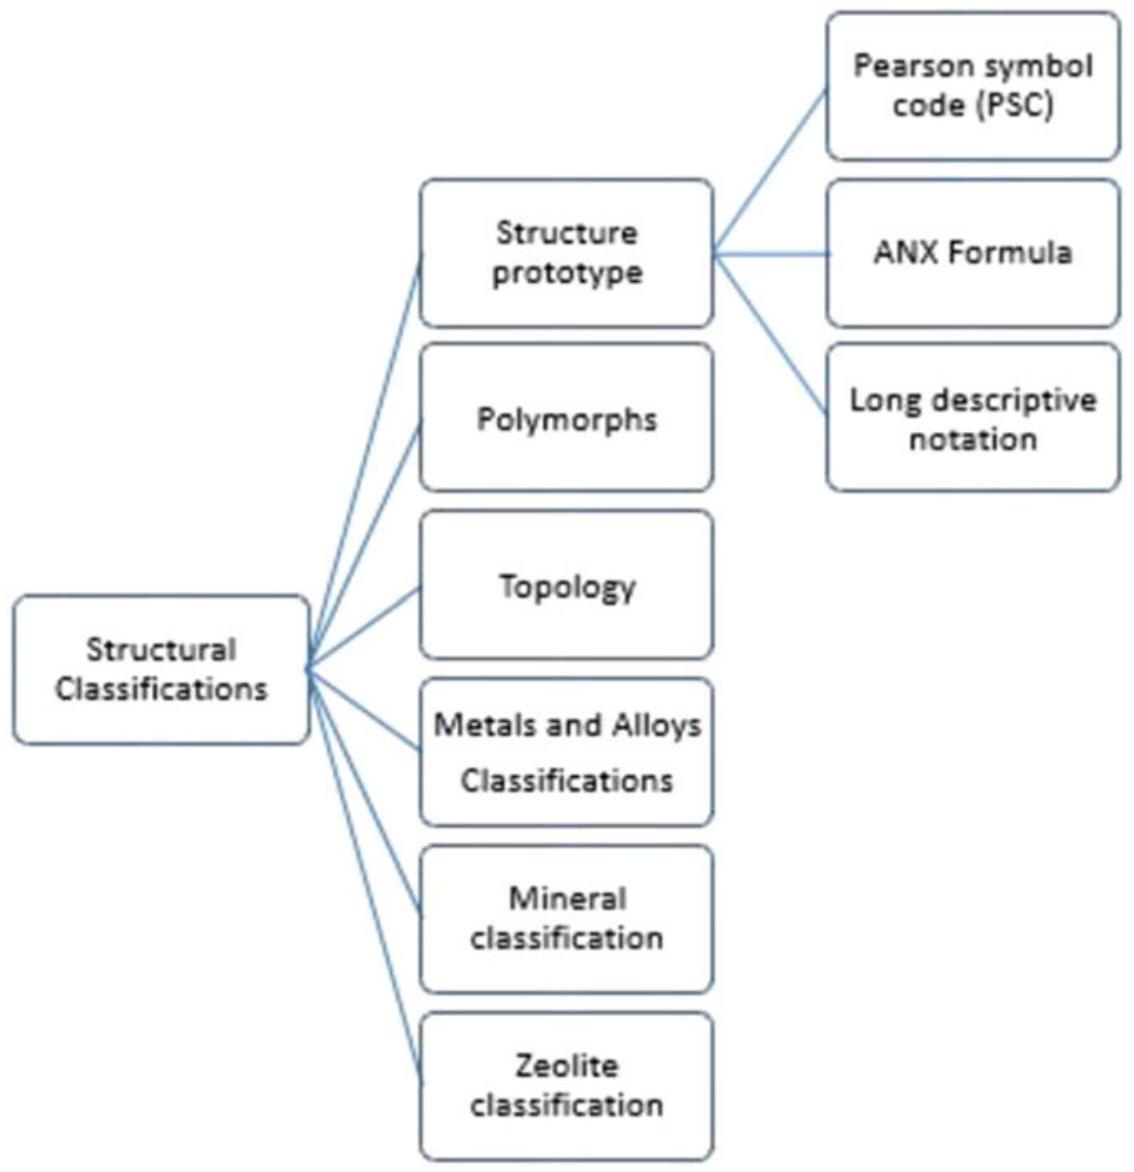
a. يعتمد تدوين نوع الهيكل التقليدي على وحدة خلوية موحدة، ونسب محورية، ومجموعة فضاء، ورمز رمز بيرسون (Pearson، 1967)، وكيمياء (Wallace et al., 1994). عادةً ما يتم تعيين هذه الأوصاف يدويًا، على سبيل المثال، هيكل من نوع . إنها مفيدة في مقارنات مخططات المراحل للأنظمة التي يُتوقع أن تكون متشابهة (على سبيل المثال، مقابل ) (Wallace et al., 1994)، ونسب المحاور ومعلمات الشبكة، والتي تكون مفيدة للغاية في التحكم في جودة إدخالات قاعدة البيانات.
b. يعتمد نوع ANX على نوع الأيون واحتلال الموقع. على سبيل المثال، من نوع ABX 3 و من نوع AB2X4.
c. يعتمد نموذج الهيكل على طريقة التوحيد القياسي الموضحة بواسطة Gelato و Parthé، 1987، تليها تحليل بلوري مفصل للبيئة الذرية (Villars et al., 1998؛ Allmann و Hinek، 2007). على سبيل المثال، (صيغة نوع الهيكل، رمز رمز بيرسون، رقم مجموعة الفضاء). يعتبر التوحيد القياسي أمرًا حيويًا في الحفاظ على جودة البيانات البلورية حيث تم اعتبار بعض الهياكل التي تحمل نفس مجموعة الفضاء ورمز رمز بيرسون بشكل خاطئ على أنها متشابهة لأن معلمات وحدة الخلية المبلغ عنها متشابهة (Allmann و Hinek، 2007).
d. يعتمد تصنيف الزيوليت على نوع الإطار (Baerlocher et al., 2007). عادةً ما يتم ملاحظتها بواسطة رمز مكون من ثلاثة أحرف كبيرة يصف شبكة من ذرات الإطار المنسقة رباعيًا.
تشارك ذرات الإطار. تنشر الجمعية الدولية للزيوليت (IZA) هذه الرموز ويتم إدراج الرموز على موقعها الإلكتروني (https:// america.iza-structure.org/IZA-SC/ftc_table.php)
e. يعتمد تصنيف المعادن على الخصائص الكيميائية البلورية (Smith et al., 1997). يهدف التصنيف إلى استغلال الخصائص الكيميائية البلورية والتشابه في نمط انكسار المسحوق بين أعضاء المجموعة المتشابهة لتعزيز جودة مراحل المعادن في PDF.
f. الطوبولوجيا: على عكس التحليل الهندسي، يوفر التحليل الطوبولوجي أداة لاستخدام البيانات البلورية واستكشاف الهيكل الطوبولوجي والتشابهات في الفضاء البلوري (Blatov et al., 2014). من وجهة نظر قاعدة البيانات، من المفيد البحث عن سلاسل متشابهة أو متشابهة. يمكن أيضًا استخدام التحليلات الطوبولوجية لتحسين جودة قاعدة البيانات.

D. الملفات الفرعية

في تحديد المرحلة، هناك احتمالات لوجود إيجابيات كاذبة بسبب التشابه في أنماط الانكسار، وغالبًا ما تكون هذه هي الحالة مع الإدخالات المتشابهة. على سبيل المثال، مع مجموعة الفضاء و (2) Åيوجد 577 إدخالًا في الإصدار 2024. تقلل الملفات الفرعية، وهي فئة مختارة بناءً على الكيمياء أو الخصائص أو التطبيق، بشكل فعال من حدوث مثل هذه الإيجابيات الكاذبة. على سبيل المثال، يمكن للمستخدم المهتم بتحليل المعادن تقييد بحثه/مطابقته ليشمل فقط المعادن للتخلص من مجموعات النتائج غير المرغوب فيها. لضمان جودة الملفات الفرعية، يقوم الخبراء في المجال بمراجعة الملفات الفرعية بشكل مستمر. هؤلاء الخبراء هم
عادةً ما يكون أعضاء لجنة فرعية معينة من ICDD (https://www.icdd.com/technical-subcommittees/).

الرابع. إدخال PDF

كما هو موضح في الشكل 3، فإن النمو الأسي لملفات PDF قد جعل من الصعب منذ فترة طويلة نشر البيانات بصيغة الكتب المطبوعة جنبًا إلى جنب مع النسخة الرقمية. كانت آخر صيغة كتاب مطبوعة هي 67 والتي كانت إصدار 2017. ومع ذلك، لا تزال التسمية التاريخية للبطاقات موجودة، ولا تزال إدخالات PDF تُشار إليها باسم بطاقات PDF. يتم تحديد هذه الإدخالات بواسطة نظام ترقيم. تم تنفيذها في ملف PDF في عام 2003. الرقمين الأولين ( حدد مصدر البيانات: ; (قاعدة بيانات هياكل البلورات غير العضوية)؛ 02 = CSD (قاعدة بيانات الهياكل البلورية في كامبريدج)؛ 03 = NIST (المعهد الوطني للمعايير والتكنولوجيا)؛ (ملف لينوس بولينغ)؛ و (بيانات بلورية مجردة، بما في ذلك الهياكل المعدلة). الجزء المتبقي، يتوافق مع أرقام المجموعة والنمط، على التوالي. يتم استخدام المعدن كاليوبلايت (الدخول 00-071-0879) كمثال في الشكل 8 لتوضيح إدخال PDF.
داخل إدخال PDF، هناك أنواع مختلفة من محتوى البيانات وميزات المحاكاة لاستكشافها، وهذه هي
ملخص في الشكلين 9 و 10. بالإضافة إلى هذه الميزات، يقدم PDF-5+ امتدادات مجموعة أدوات JADE ويمكن تشغيلها من إدخال PDF كما هو موضح في الشكل 11.

أ. برافيس-فريدل-دوناي-هاركر (BFDH)

هذه المجموعة من الأدوات مخصصة لتوقع شكل البلورات. يعتمد نموذج BFDH على هندسة الشبكة والتناسق وقد اقترحه برافيس وفريديل ودوناي وهاكر (دوناي وهاكر، 1937). يفترض هذا النموذج أن الوجوه الأكثر استقرارًا من الناحية الطاقية والأبطأ نموًا هي تلك التي تتمتع بأعلى كثافة وأكبر تباعد بين الطبقات المجاورة، وأن معدل نمو سطح معين يتناسب عكسيًا مع المسافة بين المستويات. تباعد ( يمكن أيضًا اختيار طرق للتشبع الفائق/النمو السريع مع (داوتي، 1976). يمكن للمستخدمين تغيير قيمة إذا لزم الأمر للحصول على منحنى معدل النمو ( يتناسب عكسياً مع التشبع الفائق). كمثال، توضح الشكل 12 الشكل المتوقع بشكل صحيح (المؤكد من خلال التعليق تحت “العادة” على بطاقة PDF) لمورفولوجيا الإبرة باستخدام هذه الوحدة BFDH لإدخال PDF الصيدلاني يوباتورين (PDF# 02-076-2266). يمكن أيضًا استخدام وحدة BFDH للتنبؤ بالاتجاهات المفضلة المحتملة.
الشكل 8. لقطة شاشة لعرض بطاقة PDF. مثال PDF# 00-071-0879: سيليكات الألمنيوم البوتاسيوم، مع محددات باللون الأحمر تتوافق مع الأوصاف في الجداول IV و V. لاحظ أن الطول الموجي على البطاقة تم تخصيصه لطول الموجة لجمع البيانات الخام (المسرع الخطي).
الشكل 9. نظرة عامة على محتوى بيانات إدخال PDF.
الشكل 10. ميزات المحاكاة في إدخال PDF.
الشكل 11. إطلاق ملحق مجموعة أدوات JADE من إدخال PDF باستخدام السهم المنسدل بجوار أيقونات الهيكل ثلاثي الأبعاد، الروابط، نمط SAED، ونمط EBSD. رقم PDF للإدخال المستخدم في كل مثال موجود بين قوسين.

ب. حيّز الانكسار الإلكتروني المختار (SAED)

تقوم هذه الوحدة بمحاكاة SAED (غوينر وميشيل، 1996) وتقدم ميزة استيراد صور SAED للمقارنة. توفر ميزة تمديد SAED محاكاة حركية بناءً على بنية البلورة، واستيراد صور SAED، وأدوات المعالجة والقياس، وفهرسة الشبكة. تقدم هذه الوحدة ميزات رسومية قوية مثل عرض البنية المتزامن (الرسوم البيانية المتجهة) والإسقاطات الاستيريوغرافية على شبكة وولف. واحدة من الميزات القوية لهذه الوحدة هي البحث في قاعدة بيانات PDF-5+ عن خلايا ثنائية الأبعاد باستخدام صورة SAED المستوردة.

ج. حيود الإلكترونات المرتدة

تظهر هذه الأداة المحاكاة أنماط كيكوتشي للإلكترونات المرتدة (غوينر وميشيل، 1996). يوفر امتداد مجموعة أدوات EBSD وضعًا تفاعليًا لعرض أنماط k (كيكوتشي أو كوسيل) وإسقاطاتها الاستيريوغرافية المقابلة.

مخطط توزيع الروابط

يمكن استخدام وحدة رسم بياني لطول الروابط لرؤية توزيع طول الروابط لزوج من الذرات محدد من قبل المستخدم. الشكل 13
الشكل 12. توقع شكل بلورات الإيوباتورين (PDF# 02-076-2266) باستخدام امتداد BFDH.
الشكل 13. هيستوغرام طول رابطة الألمنيوم-الأكسجين تم إنشاؤه باستخدام الهياكل البلورية في PDF-5+ مع روابط الألمنيوم-الأكسجين.
الشكل 14. مثال على تحديد الطور باستخدام بيانات حيود ثنائية الأبعاد.
الجدول الرابع. محتويات إدخال PDF.
1 PDFID رقم الدخول
2 نوع الإشعاع الأشعة السينية، الإلكترون، النيوترون؛ الطول الموجي، وتباعد الشعاع، فتحات الأجهزة، إلخ.
٣ -قائمة فواصل الطبقات بين المستويات (d) والشدة (I). يتم سرد مؤشرات ميلر عند توفرها
٤ علامات التحقق تمثيل بياني لموقع الذروة
٥ مخطط التشتت الملف التجريبي (بيانات الانكسار الخام) أو ملف الانكسار المحاكى
٦ مفاتيح الوظائف الأدوات والمحاكيات المرتبطة بإدخال PDF. تشير الرموز الرمادية إلى أن الأداة أو المحاكاة غير متاحة لهذا الإدخال.
٧ علامات المعلومات التكميلية
يوفر تفاصيل إضافية تتعلق بـ:
(أ) “PDF” – الكيمياء ومعلومات عامة
(ب) “تجريبي” – تجربة الحيود
(C) “فيزيائي” – بيانات وحدة الخلية (من المؤلف)
(D) “كريستال” – بيانات وحدة الخلية المحسوبة بواسطة ICDD
(E) “الهيكل” – الهيكل الذري
الجدول الخامس. تفاصيل الحقول في علامة التبويب “معلومات إضافية PDF” (علامة A في الشكل 8).
أ1 تعيينات تحريرية الحالة – أساسية، بديلة، أو محذوفة
علامة الجودة – انظر الجدول II: المعايير الرئيسية لتعيين علامة جودة PDF
A2 شروط العينة يحدد البيئة ودرجة الحرارة والضغط لجمع البيانات.
A3 كيمياء تشير إلى التسمية المتعددة الأشكال لمرحلة معينة، بالإضافة إلى الصيغة (الصيغ)، ونسبة الوزن، ونسبة الذرات المرتبطة بالدخول؛ حسب المتاح.
A4 معرف المركب (المعرفات) الأسماء وأرقام التسجيل المستخدمة لتحديد المركب
A5 تاريخ التفاصيل المتعلقة بالنشر الأولي للإدخالات، وإذا كان ذلك مناسبًا، التعديلات الأخيرة
يظهر توزيع طول الرابطة باستخدام 8180 مدخلات PDF-5+ الروابط. من الواضح من الرسم البياني أن التوزيع ثنائي القمة يتوافق مع التنسيق الرباعي والثماني. يحتوي هذا النموذج أيضًا على ميزة لتصفية حسب عدد التنسيق. هذه المعلومات مفيدة في التحقق من بنية البلورة وكذلك في إعداد قيود طول الروابط أثناء تحسينات ريتفيلد.
قاعدة بيانات PDF-5+ تأتي أيضًا مع ميزات تعدين البيانات المدمجة وبرنامج البحث/المطابقة (SIeve+) لتحديد الطور. التطور الأخير بين العديد في Sever هو القدرة على إجراء تحديد الطور باستخدام صور/بيانات حيود ثنائية الأبعاد (يدعم عدة تنسيقات). يمكن لـ Sleve+ معالجة ودمج وإجراء البحث/المطابقة بسلاسة باستخدام صور/بيانات حيود ثنائية الأبعاد كما هو موضح في الشكل 14. واحدة من أكثر الميزات استخدامًا في SIeve+ هي التحليل الكمي للطور باستخدام طريقة نسبة الكثافة المرجعية (Hubbard و Snyder، 1988).
يمتلك PDF-5+ قدرة واسعة على استخراج البيانات مدعومة بـ 137 حقل عرض مقترن بـ 83 بحثًا. تمييز مهم جدًا في PDF-5+ 2024 هو أنه من بين أكثر من 1,061,800 إدخال، تحتوي الإدخالات على إحداثيات ذرية لتمكين التحليل الكمي للطور باستخدام طريقة ريتفيلد. يمر ملف PDF الخاص بـ ICDD بإضافة مستمرة للبيانات والتصنيفات الهامة كل عام، ومن المهم في أي مختبر بحثي أو تحليلي أن يكون لديه قاعدة بيانات محدثة.

V. التوفر

تقدم ICDD مجموعة متنوعة من منتجات قواعد البيانات بمستويات مختلفة لتلبية متطلبات المستخدمين. تتوفر ملخصات المنتجات ومعلومات الترخيص والمواصفات التشغيلية لكل عضو في خط منتجات PDF على موقع ICDD.www.icdd.com).
على مر السنين، كانت ICDD تتعاون بشكل وثيق مع مطوري البرمجيات المرخصين، بما في ذلك المعدات
المصنعون والمطورون المستقلون، ويعملون بجد على تطوير برامج تحليل البيانات التجارية التي تعمل بشكل مثالي مع قواعد بياناتنا.

VI. الخاتمة

تلعب قواعد البيانات المنسقة بشكل جيد دورًا حيويًا في أي عملية توصيف مواد ناجحة أو أي دراسات تعتمد على البيانات. إن النمو الأسي والاهتمام بالبحث القائم على البيانات المستند إلى التعلم الآلي (ML) والذكاء الاصطناعي (AI) يجعل من الضروري وجود قاعدة بيانات يمكن الوثوق بها. وقد استجابت ICDD، وهي منظمة علمية غير ربحية أسسها علماء، للحاجة المتزايدة لمتطلبات قواعد البيانات في توصيف المواد من خلال توفير قاعدة بيانات منسقة وعالية الجودة، وهي PDF. لقد مكنت التقدم في سرعة الكمبيوتر وحجم وسائط التخزين الرقمية وسرعة الاسترجاع من دمج ملفات PDF غير العضوية والعضوية في منتج قاعدة بيانات شاملة PDF-5+ المخصصة للإصدار 2024.

شكر وتقدير

يتطلب تحرير وتنظيم وإنتاج قاعدة بيانات وبرامج عالية الجودة جهدًا جماعيًا كبيرًا من موظفي ICDD وأعضاء ICDD ومجلس إدارة ICDD. نشكر مئات الباحثين والعلماء الذين ساهموا في ملف حيود المسحوق ومنظمة ICDD على مدار أكثر من 80 عامًا.

REFERENCES

Allmann, R., and R. Hinek. 2007. “The Introduction of Structure Types into the Inorganic Crystal Structure Database ICSD.” Acta Crystallographica Section A Foundations of Crystallography 63 (5): 412-17. doi:10.1107/ S0108767307038081.
Baerlocher, C. H., L. B. McCusker, D. Olson, & W. M. Meier. 2007. Atlas of Zeolite Framework Types. 6th rev. ed. Amsterdam Boston, Published on behalf of the Structure Commission of the International Zeolite Association by Elsevier.
Blatov, V. A., A. P. Shevchenko, and D. M. Proserpio. 2014. “Applied Topological Analysis of Crystal Structures with the Program Package ToposPro.” Crystal Growth & Design 14 (7): 3576-86. doi:10.1021/ cg500498k.
Bruno, I., S. Gražulis, J. R. Helliwell, S. N. Kabekkodu, B. McMahon, and J. Westbrook. 2017. “Crystallography and Databases.” Data Science Journal 16: 38. doi:10.5334/dsj-2017-038.
Donnay, J. D. H., and D. Harker. 1937. “A New Law of Crystal Morphology Extending the Law of Bravais” American Mineralogist 22: 446-67.
Dowty, E. 1976. “Crystal Structure and Crystal Growth: I. The Influence of Internal Structure on Morphology.” American Mineralogist 61: 448-59.
Faber, J., and T. Fawcett. 2002. “The Powder Diffraction File: Present and Future.” Acta Crystallographica Section B Structural Science 58 (3): 325-32. doi:10.1107/S0108768102003312.
Fawcett, T. G., S. N. Kabekkodu, J. R. Blanton, and T. N. Blanton. 2017. “Chemical Analysis by Diffraction: The Powder Diffraction File .” Powder Diffraction 32 (2): 63-71. doi:10.1017/S0885715617000288.
Fawcett, T. G., S. Gates-Rector, A. M. Gindhart, M. Rost, S. N. Kabekkodu, J. R. Blanton, and T. N. Blanton. 2019. “A Practical Guide to Pharmaceutical Analyses Using X-Ray Powder Diffraction.” Powder Diffraction 34 (2): 164-83. doi:10.1017/S088571561900023X.
Fawcett, T. G., S. Gates-Rector, A. M. Gindhart, M. Rost, S. N. Kabekkodu, J. R. Blanton, and T. N. Blanton. 2020. “Total Pattern Analyses for Non-Crystalline Materials.” Powder Diffraction 35 (2): 82-8. doi:10.1017/S0885715620000263.
Gates, S. D., T. N. Blanton, and T. G. Fawcett. 2014. “A New ‘Chain’ of Events: Polymers in the Powder Diffraction File (PDF ).” Powder Diffraction 29 (2): 102-7. doi:10.1017/S088571561400013X.
Gates-Rector, S., and T. Blanton. 2019. “The Powder Diffraction File: A Quality Materials Characterization Database.” Powder Diffraction 34 (4): 352-60. doi:10.1017/S0885715619000812.
Gelato, L. M., and E. Parthé. 1987. “STRUCTURE TIDY – A Computer Program to Standardize Crystal Structure Data.” Journal of Applied Crystallography 20 (2): 139-43. doi:10.1107/S0021889887086965.
Goehner, R. P., and J. R. Michael. 1996. “Phase Identification in a Scanning Electron Microscope Using Backscattered Electron Kikuchi Patterns.” Journal of Research of the National Institute of Standards and Technology 101 (3): 301. doi:10.6028/jres.101.031.
Groom, C. R., I. J. Bruno, M. P. Lightfoot, and S. C. Ward. 2016. “The Cambridge Structural Database.” Acta Crystallographica Section B Structural Science, Crystal Engineering and Materials 72 (2): 171-79. doi:10.1107/S2052520616003954.
Hanawalt, J. D. 1986. “Manual Search/Match Methods for Powder Diffraction in 1986.” Powder Diffraction 1 (1): 7-13.
Hanawalt, J. D., H. W. Rinn, and L. K. Frevel. 1938. “Chemical Analysis by X-ray Diffraction.” Industrial & Engineering Chemistry Analytical Edition 10 (9): 457-512.
Helliwell, J. R., B. McMahon, J. Mitchell Guss, and L. M. J. KroonBatenburg. 2017. “The Science Is in the Data.” IUCrJ 4 (6): 714-22. doi:10.1107/S2052252517013690.
Hofmann, D. W. M., and L. Kuleshova. 2005. “New Similarity Index for Crystal Structure Determination from X-Ray Powder Diagrams.” Journal of Applied Crystallography 38 (6): 861-66. doi:10.1107/S0021889805023484.
Hubbard, C. R., and R. L. Snyder. 1988. “RIR – Measurement and Use in Quantitative XRD.” Powder Diffraction 3 (2): 74-77. doi:10.1017/ S0885715600013257.
Hubbard, C. R., J. K. Stalick, and A. D. Mighell. 1980. “NBS* AIDS80: A Fortran Program to Evaluate Crystallographic Data.” Advances in X-Ray Analysis 24: 99-109.
Jenkins, R. & Smith, D. (1987). Powder Diffraction File in F. H. Allen, G. Bergerhoff, and R. Sievers (Eds.) Crystallographic Databases (pp. 159-74). Data Commission of the International Union of Crystallography.
Jenkins, R., M. Holomany, and W. Wong-Ng. 1987. “On the Need for Users of the Powder Diffraction File to Update Regularly.” Powder Diffraction 2 (2): 84-87. doi:10.1017/S0885715600012434.
Johnson, G., and V. Vand. 1967. “A Computerized Powder Diffraction Identification System.” Industrial & Engineering Chemistry 59 (8): 19-31.
Kabekkodu, S. N., J. Faber, and T. Fawcett. 2002. “New Powder Diffraction File (PDF-4) in Relational Database Format: Advantages and Data-Mining Capabilities.” Acta Crystallographica Section B Structural Science 58 (3): 333-37. doi:10.1107/S0108768102002458.
Kaduk, J. A. (2019). Crystallographic Databases and Powder Diffraction in J. A. K. C. Gilmore and H. Schenk (Eds.) International Tables for Crystallography Volume H: Powder Diffraction. 1st ed. (Chap. 3.7, pp. 304-24). New York, Wiley.
Messick, J. 2012. “The History of the International Centre for Diffraction Data.” Powder Diffraction 27 (1): 36-44. doi:10.1017/ S0885715612000085.
Pearson, W. B. 1967. Handbook of Lattice Spacings and Structures of Metals. Oxford: Pergamon Press.
Reid, J. W., J. A. Kaduk, and M. Vickers. 2016. “The Crystal Structure of Trandolapril, : An Example of the Utility of Raw Data Deposition in the Powder Diffraction File.” Powder Diffraction 31 (3): 205-10. doi:10.1017/S0885715616000294.
Smith, D. K., P. Bayliss, and A. C. Roberts. 1997. “Mineral Classification in the Mineral Powder Diffraction File.” Advances in X-Ray Analysis 41: 606-13.
Villars, P., & K. Cenzual. 2018. Pearson’s Crystal Data: Crystal Structure Database for Inorganic Compounds. Materials Park, OH, USA: ASM International.
Villars, P., N. Onodera, and S. Iwata. 1998. “The Linus Pauling File (LPF) and Its Application to Materials Design.” Journal of Alloys and Compounds 279 (1): 1-7. doi:10.1016/S0925-8388(98)00605-7.
Wallace, P. L., S. Weissmanna, M. H. Mueller, L. D. Calveit, and R. Jenkins. 1994. “The New ICDD Metals and Alloys Indexes: Usefulness and Potentialities.” Powder Diffraction 9 (4): 239-45. doi:10.1017/ S0885715600018947.
Wilkinson, M. D., M. Dumontier, I. J. Aalbersberg, G. Appleton, M. Axton, A. Baak, N. Blomberg, et al. 2016. “The FAIR Guiding Principles for Scientific Data Management and Stewardship.” Scientific Data 3 (1): 160018. doi:10.1038/sdata.2016.18.
Wong-Ng, W., H. F. McMurdie, C. R. Hubbard, and A. D. Mighell. 2001. “JCPDS-ICDD Research Associateship (Cooperative Program with NBS/NIST).” Journal of Research of the National Institute of Standards and Technology 106 (6): 1013. doi:10.6028/jres.106.052.
Zagorac, D., H. Müller, S. Ruehl, J. Zagorac, and S. Rehme. 2019. “Recent Developments in the Inorganic Crystal Structure Database: Theoretical Crystal Structure Data and Related Features.” Journal of Applied Crystallography 52 (5): 918-25. doi:10.1107/S160057671900997X.

  1. Author to whom correspondence should be addressed. Electronic mail: kabekkodu@icdd.com

Journal: Powder Diffraction, Volume: 39, Issue: 2
DOI: https://doi.org/10.1017/s0885715624000150
Publication Date: 2024-04-15

PDF-5+: a comprehensive Powder Diffraction File for materials characterization

Soorya N. Kabekkodu (B, Anja Dosen (D), and Thomas N. Blanton (D)International Centre for Diffraction Data, Newtown Square, PA, USA

(Received 22 November 2023; accepted 19 March 2024)

Abstract

For more than 80 years, the scientific community has extensively used International Centre for Diffraction Data’s (ICDD®) Powder Diffraction File (PDF®) for material characterization, including powder X-ray diffraction analysis. Historically, PDF was made available for two major material types: one for inorganic analysis and the other for organic analysis. In the early years of the PDF, this twomaterial approach was implemented due to limited computer capabilities. With Release 2024, ICDD provides a comprehensive database consisting of the entire PDF in one database called PDF-5+, comprised of more than one million entries ( ). The PDF-5+ with a relational database (RDB) construct houses extensive chemical, physical, bibliographic, and crystallographic data, including atomic coordinates and raw data, enabling qualitative and quantitative phase analysis. This wealth of information in one database is advantageous for phase identification, materials characterization, and several data mining applications in materials science. A database of this size needs rigorous data curation and structural and chemical classifications to optimize pattern search/match and characterization methods. Each entry in the PDF has an editorially assigned quality mark. An editorial comment will describe the reason if an entry does not meet the top-quality mark. The editorial processes of ICDD’s quality management system are unique in that they are ISO 9001:2015 certified. Among several classifications implemented in PDF-5+, subfiles (such as Bioactive, Pharmaceuticals, Minerals, etc.) directly impact the search/match in minimizing false positives. Scientists with specific field expertise continuously review these subfiles to maintain their quality. This paper describes the features of PDF with an emphasis on the newly released PDF-5+.

© The Author(s), 2024. Published by Cambridge University Press on behalf of International Centre for Diffraction Data. This is an Open Access article, distributed under the terms of the Creative Commons Attribution licence (http://creativecommons.org/licenses/by/4.0/), which permits unrestricted re-use, distribution and reproduction, provided the original article is properly cited.
[doi:10.1017/S0885715624000150]
Keywords: Powder X-ray diffraction, XRD database, quality mark, subfiles, PDF card

I. INTRODUCTION

Powder diffraction has become an indispensable tool in materials characterization owing to its wide variety of applications, from materials identification, quantification, and structure elucidation to texture analysis. Powder X-ray diffraction (PXRD) is one of the most widely used techniques in solid-state materials research, as the PXRD pattern is often considered a fingerprint of the material under study. PXRD is a vital characterization tool for phases where growing a single crystal is difficult or not attainable in practice or the phase of interest is an one member of a mixture of two or more polycrystalline materials.
The origin of the method for identifying the phase(s) present in a given sample using X-ray diffraction dates back to 1938 (Hanawalt et al., 1938). In this paper, using approximately a thousand PXRD patterns of crystalline phases, the authors presented a technique for identifying phases leading to the genesis of phase identification (Phase ID) using PXRD. The method, popularly known as Hanawalt search
involves developing an index using the 3 strongest lines (peaks) of a diffraction pattern and grouping them into 77 subdivisions (Hanawalt et al., 1938; Hanawalt, 1986). Strong PXRD lines of the unknown phases can be compared against the Hanawalt index to identify the phase. The importance of diffraction information was central to forming the Joint Committee for Chemical Analysis by Powder Diffraction Methods in 1941, co-sponsored by ASTM Committee E-4, the Crystallographic Society of America, and the British Institute of Physics (Faber and Fawcett, 2002). The first powder diffraction database collection was published in 1941 as Set 1 of the Powder Diffraction File (PDF) (Faber and Fawcett, 2002). By 1969, the ASTM Committee was constituted as a Pennsylvania nonprofit cooperation under the title of the Joint Committee on Powder Diffraction Standards (JCPDS). In 1978, the current name, International Centre for Diffraction Data (ICDD), was adopted. A summary of the formative years of the PDF was subsequently summarized by Messick, 2012. The PDF continues to be managed and maintained by the International Center for Diffraction Data (ICDD, www.icdd.com), a nonprofit scientific organization dedicated to collecting, editing, publishing, and distributing powder
diffraction data to identify materials. The membership of the ICDD consists of worldwide representation from academe, government, and industry. This paper is an update of a previously published paper (Gates-Rector and Blanton, 2019) on the PDF®. In this paper, we attempt to focus on the recent changes to the PDF database and relational database software and to minimize the duplication of features that were presented in the Gates-Rector and Blanton paper of 2019.

II. DATABASE DEVELOPMENT: PDF

In Set 1 of the PDF published in 1941, powder diffraction data were published on a 3 in in paper card (Figure 1(a)) listing interplanar spacings ( spacings) and relative intensities ( ) characteristic of the compound (Jenkins et al., 1987). The original handwritten index book by Hanawalt et al. (1938) is shown in Figure 1(b). The first electronic version of PDF was introduced in the year 1967 in a flat file format enabling automated search/match (Johnson and Vand, 1967). This was the first electronic version of a crystallographic database. Over the years, ICDD has collaborated with various database organizations to expand the scope of materials coverage in the PDF to facilitate materials characterization using PXRD. A collaborative project with the National Bureau of Standards was started in 1953 and lasted more than 30 years (Wong-Ng et al., 2001). The growth of the PDF since its inception in 1941 to 2023 is shown in Figure 2. As seen in Figure 2, data spikes in the years 1998, 2002, and 2005 are due to the onset of collaborations with ICSD (Inorganic Crystal Structure Data, FIZ Karlsruhe; Zagorac et al., 2019), CSD (Cambridge Structural Data, Cambridge Crystallographic Data Centre; Groom et al., 2016; Bruno et al., 2017), and LPF (Linus Pauling File, Materials Phases Data System; Villars and Cenzual, 2018) respectively. ICDD has responded to the growing need for database requirements in materials characterization using powder X-ray diffraction by implementing a unique project targeting data acquisition, including raw data, and customized subfiles. The ICDD has a Grant-in-Aid program to acquire diffraction data on targeted materials and information about this grant is available on the ICDD website (https://www.icdd.com/grant-in-aid/).
The data management system for the PDF underwent a significant change in 2005 by adopting a relational database
management system (RDBMS). The PDF in relational database format (RDB) contains extensive chemical, physical, bibliographic, and crystallographic data, including atomic coordinates enabling characterization and computational analysis. The RDB construct provides pliable access to the database for data mining studies and enhances the PDF materials characterization capabilities (Faber and Fawcett, 2002; Kabekkodu et al., 2002). One of the profound benefits of RDB is the more straightforward implementation of FAIR (Findability, Accessibility, Interoperability, and Reusability) principles (Wilkinson et al., 2016) and better data interoperability. This type of construct is vital from an interoperability perspective, given the existence of multiple automated software routines (by various diffractometer manufacturers or software developers) used for phase identification and quantification.
Until the release of 2024, PDF database products were separated as PDF-4+ and PDF-4/Organics to focus on inorganic and organic phase identifications. With the growing number of crossover entries involving both inorganic and organic phases, the community using the PDF more often need both the inorganic and organic PDF content to successfully complete a characterization of the phases in the sample. To meet this growing challenge the new PDF-5+ combines the former inorganic and organic files into one single database containing 1061898 entries. There are many useful database filters (Figure 3, labels 1,2 , and 3 ) to optimize search mechanisms. In other words, if a user desires, it can mimic the function of PDF-4+ or PDF-4/Organics.

III. DATA CURATION

In phase identification or related characterizations, a user’s powder pattern is compared against the database. A well-curated database is essential for such analysis to be efficient and reliable. In addition to diffraction patterns and crystallographic parameters, metadata curation plays a vital role in phase identification as one tries to associate all the peaks in a measured diffraction pattern with one or multiple entries in PDF-5+ database phase. Figure 4 depicts a general overview of the curated data in the PDF. Many of the metadata in Figure 4 are self-explanatory; the following section will briefly describe some key features in phase identification and data mining studies. All of these data fields can be searched, and multiple
Figure 1. (a) Early PDF card and (b) original Hanawalt numerical index book (courtesy Dow chemical).
Figure 2. Growth of entries in the powder diffraction file (note: for a better clarity, only selected years during the period 1941-1993 are shown to illustrate the trend).
Figure 3. PDF-5+ tool bar with descriptions listed in Table I.
searches can be combined using Boolean operators to expedite search/match and data mining studies.

A. Quality mark and database status

The ICDD PDF is a curated database with each entry evaluated using a combination of computer and human editorial
review and presented using a quality mark (QM) nomenclature (Hubbard et al., 1980; Jenkins and Smith, 1987; Bruno et al., 2017; Gates-Rector and Blanton, 2019; Kaduk, 2019) that provides the user with a systematic process for understanding data entry quality and a consistent approach in assessing the goodness-of-match (GOM) for phase identification. All of the data in the PDF has gone through a multi-tier editorial
TABLE I. PDF-5+ tool bar descriptions.
Label Description
1 All Data: Uses the entire database
2 Inorganic Emphasized: Mainly for inorganic phases with some common organics (DB code 02- and most of 05- are not included)
3 Organic Emphasized: Mainly Organic phases with some common inorganics (like excipients, pigments, etc.)
A PDF Cards: Opens a PDF card (entry) by the given PDF number. Also has a feature to open PDF entries corresponding to the collaborating database (CSD, ICSD, NIST, LPF) identifier
B Preferences: Display preferences such as desired fields and pattern simulation parameters can be customized.
C Search: Brings up the main search window. The dropdown button can be used to select recent searches.
D History: Contains previous search criteria. These searches can be combined using Boolean “and”, “or” operators
E Results: Using the dropdown button, previous search results can be repopulated
F Composition Graph: Any 2 or 3 elements combination can be graphed as a function of atomic% or weight%. For example, system
G SIeve+: Launches the search/match program SIeve+
H Microanalysis: Elemental composition from a micro-XRF analysis, microprobe analysis, or other elemental analysis
Figure 4. General overview of curated data in the powder diffraction file.
Figure 5. A schematic view of the quality mark (QM) assignment process. The top row corresponds to the breadth of checks while the second row of boxes provide an outline of the checks that are made. The assigned QM indicates high-quality ( or G ), medium-quality ( , or M ), low-quality or O , or hypothetical ( ) patterns.
process. The ICDD quality management system is certified by the International Organization for Standardization (ISO 9001:2015, Certificate Number: 110409.01). Figure 5 briefly summarizes the QM evaluation criteria that are checked by computer routines and then reviewed by one of the PDF editors before the QM is assigned.
Every entry in the PDF has an editorially assigned QM. An editorial comment will describe the reason an entry does not meet the top-quality mark. The PDF has two types of PXRD patterns, experimental and calculated from published crystal structures. QM assignment considers them separately after going through more than 100 data validation checks as shown in Figure 5. It is important to note here that the QM assignment is strictly from the phase identification point of view. For example, PXRD calculated patterns using crystal structure data with missing atom(s), disorder, improper site
occupation factor, or questionable displacement parameters can have a significant impact on phase identification and thus would have a lower QM. Experimental PXRD patterns require a different type of treatment by considering phase purity, quality of the diffraction pattern, and indexing. QMs G and M are applicable only for poorly crystalline, nano material, and amorphous patterns. In this case, QM criteria emphasizes the chemical, data quality, and other characterizations (spectroscopy, pair distribution function, and microscopy). Table II describes the QMs used in the PDF.
It is common in chemical crystallographic databases to have multiple entries for a given phase, especially in the case of widely studied structures. The PDF uses the Database Status flag to categorize multiple entries as Primary, Alternate, or Deleted. Table III describes the meaning of these notations. The combination of quality
TABLE II. Major criteria for PDF quality mark assignment.
Mark Crystallographic Information Warnings Other
S or (*) Average
– High-quality diffractometer or Guinier data
– Known unit cell
– Complete indexing
– None specific to experimentally based patterns. For ICDD-calculated patterns, there should not be any crystallographic warnings.
G
– Significant amorphous components present
– Good signal-to-noise ratio in digital diffraction pattern (PD3) provided
– Chemical analysis information provided that supports the specified composition of a material
(I.e. spectroscopy, pair distribution functions, commercial source, etc.).
I
Average
Absolute for all reflection
– Indexed pattern
– Known unit cell
– Reasonable range and uniform distribution in intensities
– No serious systematic errors
– Maximum of two unindexed, space group extinct, or impurity reflections; none of these reflections are among the strongest eight lines
– For calculated patterns, only minor structural warnings are allowed
Completeness of the pattern is sensible. Reflections with -value less than or equal to 2.000 Angstroms have at least three significant figures after the decimal point.
C
– Pattern calculated from single-crystal structural parameters for which the structural refinement R -factor was .
– |F(calc)| data have been checked against the corresponding (obs)|
– OR –
– Complete check of the bond distances and angles has been made along with density and formula checks
– Number of required significant digits is the same as for a “S” quality mark
– If calculated pattern does not meet the ” S ” quality mark parameters, it is assigned QM = B This QM refers to author’s published calculated patterns. Those with “C” should not be confused with ICDD-calculated patterns based on crystal structures from the collaborating databases. ICDD-calculated pattern will have a QM other than C/G/M.
M
– Amorphous (or poorly crystalline) as major component present
– Good signal-to-noise ratio in digital diffraction pattern (PD3) provided
No chemical analysis data to support the materials composition provided (usually commercial samples).
B
– Unit cell maybe unknown
If indexed, higher than QM “I”
– For ICDD-calculated patterns, these have significant warnings on incomplete structure, symmetry warnings, nonpositive definite displacement parameters, etc. Experimental pattern may have unindexed lines
P – Applicable only for calculated patterns – For ICDD-calculated patterns based on structure prototype. These are the cases in which author or editor assigned the structure type
0
– Poorly characterized material or the data are known (or suspected) to be of low precision.
– Number of unindexed, space group extinct, or impurity reflections
One of 3 strongest reflections is unindexed
– Poor chemical characterization
– No unit cell reported
– Usually, the editor has inserted a comment to explain why the “O” was assigned. A low-precision quality mark means that the diffraction data have been taken on questionable sample or one that contains significant impurities.
H – Applicable only for calculated patterns For ICDD-calculated patterns based on theoretical structures [e.g. Density Functional Theory (DFT) calculations]
TABLE III. Description of database status.
Database status Description
Primary (P) Editorially chosen as a representative entry for a given phase
Alternate (A) Alternate choices for a given phase. This does not necessarily mean lower quality than primary
Deleted (D) Usually duplicate entries, unresolved errors, replaced by entries with better data.
marks with database status is extremely useful as a filter in searching the database, especially in cases where several entries exist for a given phase. For example, in release 2024 of the PDF, there are 77 quartz patterns, but if one uses the primary star quality pattern as a filter, the search result set will have one pattern.

B. Raw data archival

The interest in depositing to an archive the raw data associated with the reporting in a journal article has many positive aspects. First, is then data centers can retrieve the raw data and if desired archive it in a database. The IUCr has been promoting this initiative as has ICDD for many years. The review paper aptly titled Science in the Data (Helliwell et al., 2017 and references therein) elegantly encapsulates the need for raw data in crystallography. The challenges in archiving raw powder diffraction patterns are manifold due to phase impurities, data collection strategies, diffractometer geometry, sample preparation, systematic errors, and preferred orientation. In a traditional search/ match algorithm, the user’s pairs are compared against
the database (Fawcett et al., 2017, 2020), which works well for crystalline phases due to their sharp (narrow) peaks. It is evident from Figure 6 that having raw data is essential to carry out phase identification in the case of poorly crystalline or amorphous patterns as they cannot be represented satisfactorily as a list of interplanar spacing ( values) and relative intensity ( values) due to broad peaks containing several values. Matching the raw data using a similarity index (Hofmann and Kuleshova, 2005) is one of the best methods to perform search/match, particularly for cases where diffraction peaks are broad.
As of release 2024, more than 19,000 raw powder diffraction patterns (1D) in the PDF are available for users to analyze powder diffraction data. In an extended application, the crystal structure of Trandolapril was solved (Reid et al., 2016) using deposited raw data from the PDF. There is a growing number of examples where raw data is essential in characterizing pharmaceutical samples (Fawcett et al., 2019) and polymers (Gates et al., 2014).

C. Structural classifications

Structural classifications (Figure 7) play a seminal role in validating the quality of the published structure or powder diffraction patterns. It is an excellent tool for identifying similar phases that are otherwise not easily recognizable. It is also a good editorial tool to identify outliers in a supposedly related phase in a cluster. From the application point of view, structure prototypes are extremely useful in deriving a starting model for Rietveld refinement when the database is missing the exact chemistry [i.e. element(s)]. ICDD uses several structural classification symbols to meet the requirements of scientists from various fields who use X-ray diffraction for
Figure 6. PXRD pattern of cellulose triacetate I with reported peak positions PDF entry 00-064-1453.
Figure 7. Structural classifications in the powder diffraction file.
materials characterization. Each of these has a specific usage in structural chemistry. The structural classifications currently used in the PDF are listed below.
a. Traditional structure type notation is based on standardized unit cell, axial ratios, space group, Pearson symbol code (Pearson, 1967), and chemistry (Wallace et al., 1994). These descriptors are usually assigned manually, for example, the type structure. They are helpful in comparisons of phase-diagrams of systems that are expected to be similar (for example, vs ) (Wallace et al., 1994), axial ratios and lattice parameters, which are extremely useful in controlling the quality of the database entries.
b. ANX type is based on the type of ion and site occupancy. For example, is of ABX 3 type and is of AB2X4 type.
c. Structure prototyping is based on the standardization method described by Gelato and Parthé, 1987, followed by a detailed crystallographic analysis of the atomic environment (Villars et al., 1998; Allmann and Hinek, 2007). For example, (structure type formula, Pearson symbol code, space group number). Standardization is crucial in maintaining the quality of the crystallographic data as some structures with the same space group and Pearson symbol code were erroneously considered as isotypic because their reported unit cell parameters are similar (Allmann and Hinek, 2007).
d. Zeolite classification is based on framework type (Baerlocher et al., 2007). These are usually noted by a three-capital letter code describing a network of corner-
sharing tetrahedrally coordinated framework atoms. The International Zeolite Association (IZA) publishes these codes and the codes are listed on their website (https:// america.iza-structure.org/IZA-SC/ftc_table.php)
e. Mineral classification is based on the crystal chemistry characteristics (Smith et al., 1997). The classification aims to exploit the crystal chemistry characteristics and similarity of the powder diffraction pattern among isostructural group members to enhance the quality of the mineral phases in the PDF.
f. Topology: Unlike geometrical analysis, topological analysis provides a tool to use crystallographic data and explore the topological structure and the similarities in the crystal space (Blatov et al., 2014). From the database point of view, it is advantageous to look for isostructural or isoreticular series. Topological analyses can also be used to improve the quality of the database.

D. Subfiles

In phase identification, there are possibilities of having false positives due to similarity in diffraction patterns, often the case with isostructural entries. For example, with space group and (2) , there are 577 entries in release 2024. Subfiles, a curated category based on chemistry, properties, or application, efficiently reduce the occurrence of such false positives. For example, a user interested in mineral analysis can limit their search/match to only minerals to eliminate unwanted result sets. To ensure the subfiles quality, field experts continuously review the subfiles. These experts are
usually members of a designated ICDD Subcommittee (https://www.icdd.com/technical-subcommittees/).
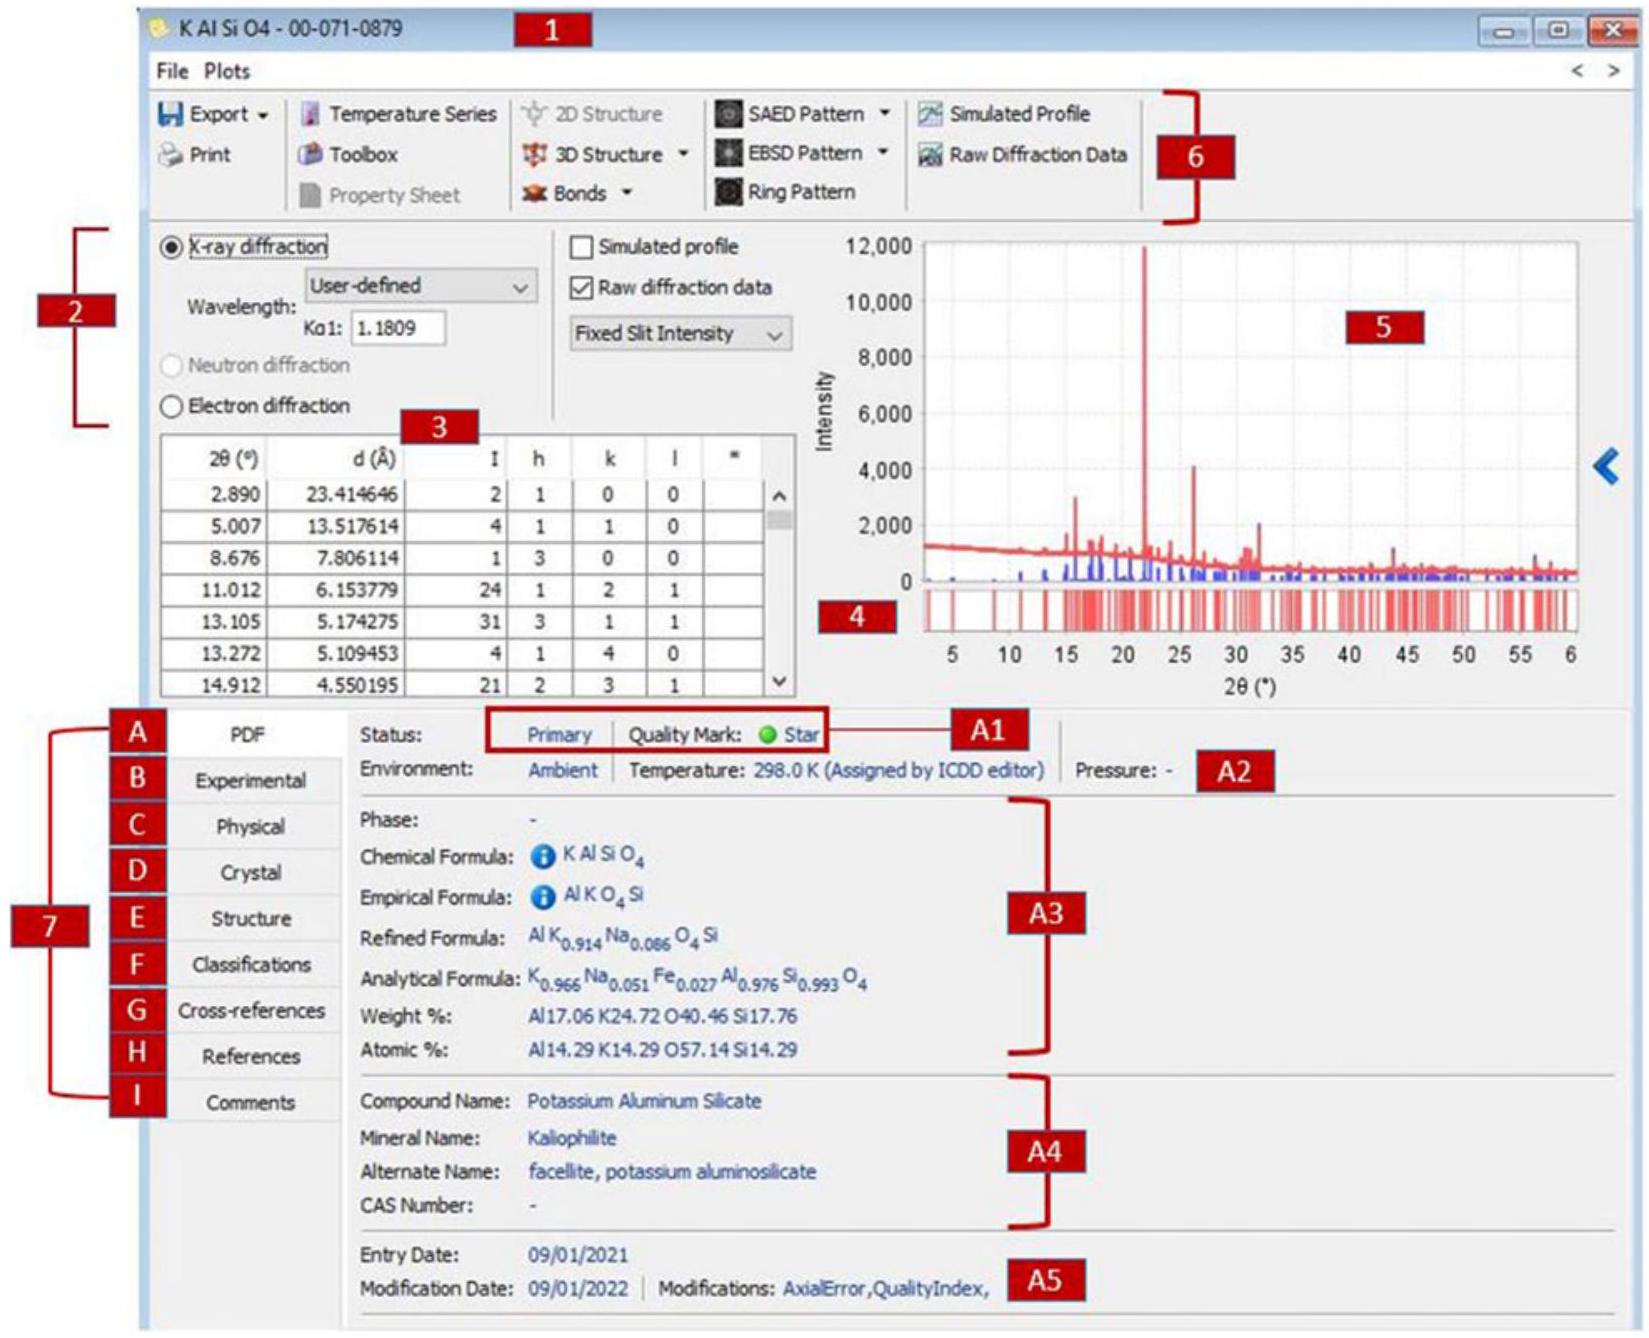
IV. THE PDF ENTRY

As shown in Figure 3, the exponential growth of PDF has long made it difficult to publish data in printed book format along with a digital version. The last printed book format was set 67 which was Release 2017. However, the historical nomenclature of cards still exists, and PDF entries are still referred to as PDF cards. These entries are identified by a numbering system implemented in the PDF in 2003. The first two digits ( ) identify the data source: ; (Inorganic Crystal Structure Database); 02 = CSD (Cambridge Structural Database); 03 = NIST (National Institute of Standards and Technology); (Linus Pauling File); and (abstracted crystal data, including modulated structures). The remaining part, , corresponds to set and pattern numbers, respectively. The mineral Kaliophilite (Entry 00-071-0879) is used as an example in Figure 8 to illustrate a PDF entry.
Within a PDF entry, there are different types of data content and simulation features to explore, and these are
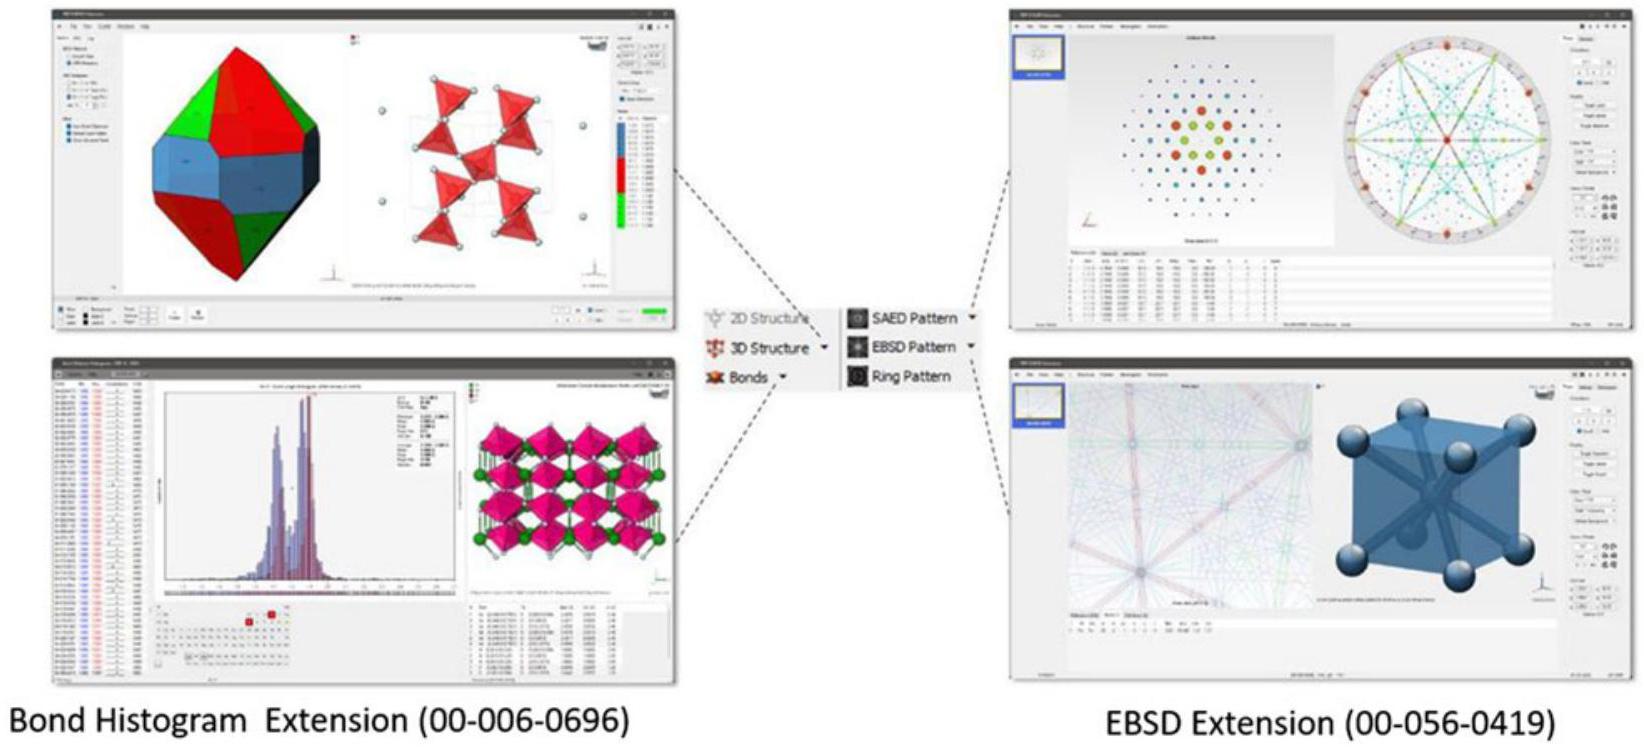
summarized in Figures 9 and 10. In addition to these features, PDF-5+ offers JADE toolkit extensions and these can be launched from a PDF entry as shown in Figure 11.

A. Bravais-Friedel-Donnay-Harker (BFDH)

This toolkit is for crystal morphology prediction. The BFDH model is based on the lattice geometry and symmetry and was proposed by Bravais, Friedel, Donnay, and Harker (Donnay and Harker, 1937). This model assumes that the energetically most stable and slowest growing faces are the ones with the highest density and largest spacing between adjacent layers and that the rate of growth of a particular surface is inversely proportional to the interplanar spacing ( . One can also choose methods for supersaturation/rapid growth with (Dowty, 1976). Users can change the value of if needed to obtain the growth rate curve ( is inversely proportional to the supersaturation). As an illustration, Figure 12 shows the correctly predicted (confirmed by the comment under “habit” on the PDF card) needle morphology using this BFDH module for a pharmaceutical PDF entry Eupatorin (PDF# 02-076-2266). The BFDH module can also be used to predict possible preferred orientations.
Figure 8. Screenshot of PDF card display. Example PDF# 00-071-0879: potassium aluminum silicate, with designators in red corresponding to descriptions in Tables IV and V. Note that the wavelength on the card was customized to the raw data collection wavelength (synchrotron).
Figure 9. Overview of PDF entry data content.
Figure 10. Simulation features on a PDF entry.
Figure 11. Launching JADE toolkit extension from a PDF entry using the dropdown arrow next to 3D structure, bonds, SAED pattern, and EBSD pattern icons. The PDF number of the entry used in each example is within parenthesis.

B. Selected aerea electron diffraction (SAED)

This module simulates SAED (Goehner and Michael, 1996) and offers a feature to import SAED images for comparison. The SAED extension feature offers kinematic simulations based on the crystal structure, SAED image import, processing, measurement tools, and grid indexing. This module offers powerful graphical features like synchronized structure viewing (Vector Graphics) and stereographic projections on a Wulff net. One of the strong features of this module is searching PDF-5+ database for 2D cells using an imported SAED image.

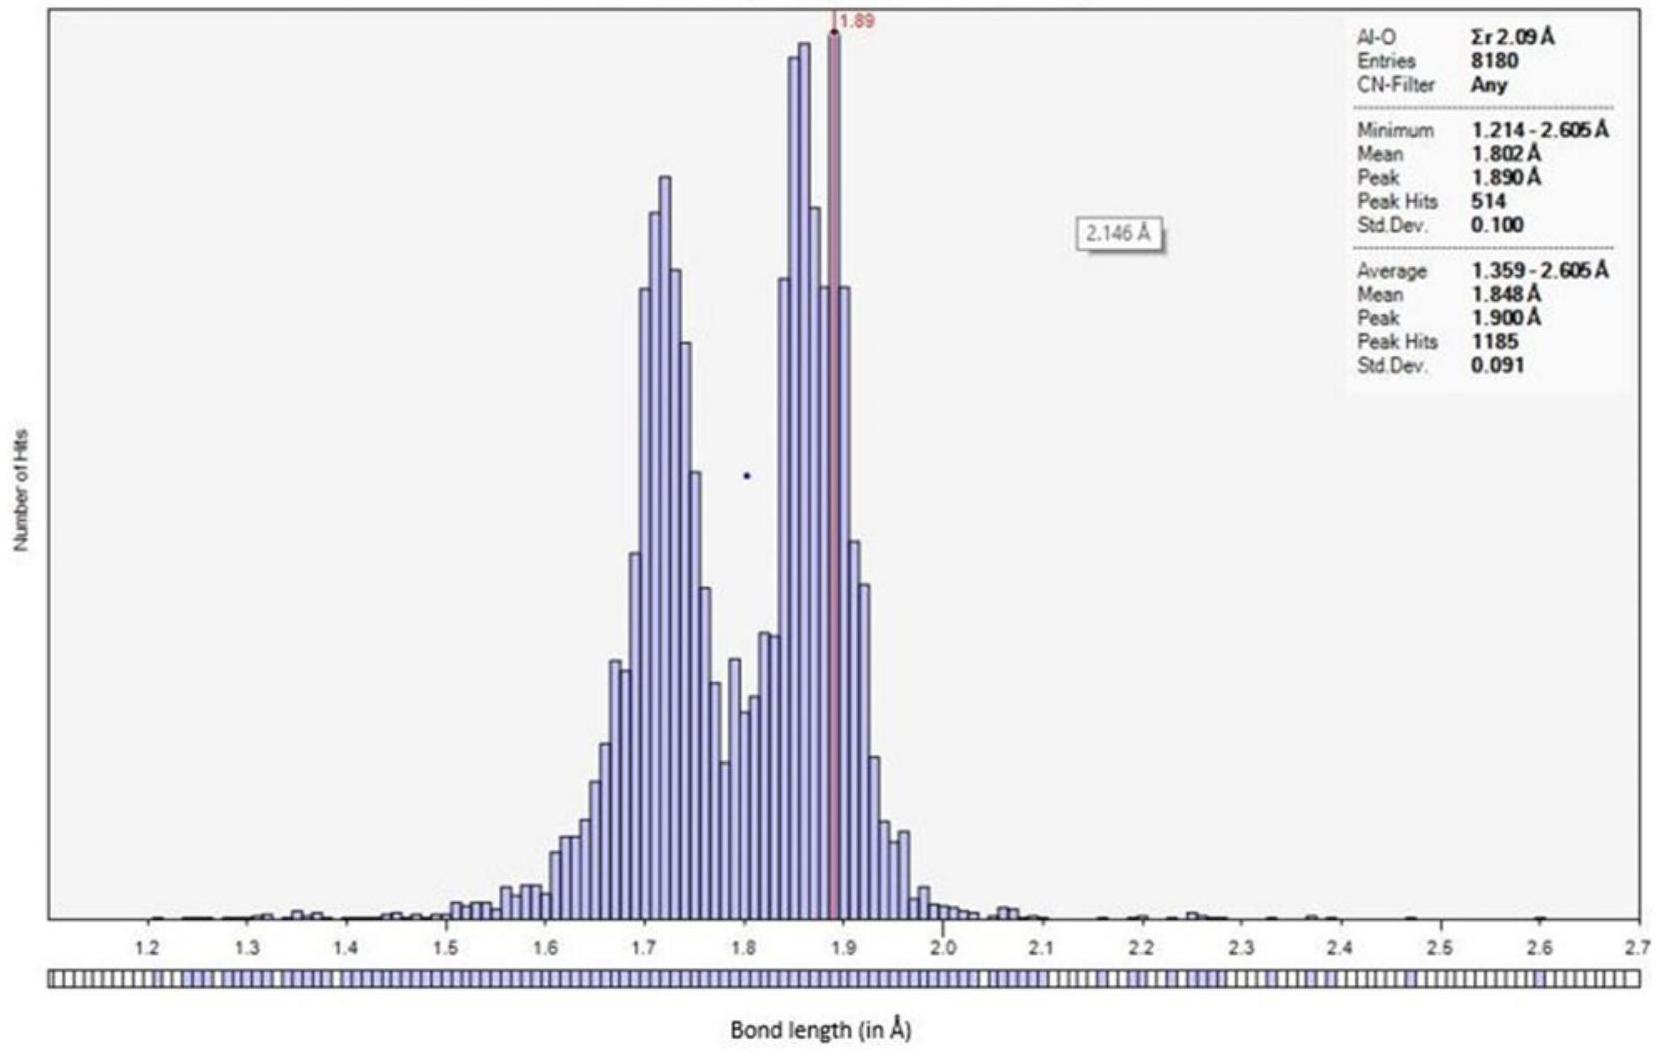
C. Electron back scattering diffraction

This simulation tool displays backscattered electron Kikuchi patterns (Goehner and Michael, 1996). The EBSD toolkit extension provides an interactive mode of displaying k-patterns (Kikuchi or Kossel) and their corresponding stereographic projections.

D. Bond histogram

The bond histogram module can be used to see the bond length distribution for a user-defined pair of atoms. Figure 13
Figure 12. Crystal morphology prediction of Eupatorin (PDF# 02-076-2266) using the BFDH extension.
Figure 13. Al-O bond length histogram generated using crystal structures in PDF-5+ with Al-O bonds.
Figure 14. Example of phase identification using 2D diffraction data.
TABLE IV. Contents of a PDF entry.
1 PDFID Entry number
2 Radiation type X-ray, electron, neutron; wavelength, and divergence of the beam, instrument apertures, etc.
3 -I list Interplanar spacings (d) & intensities (I). Miller indices are listed when available
4 Tick marks Graphical representation of peak position
5 Diffractogram(s) Experimental profile (raw diffraction data) or simulated profile diffractogram
6 Function keys Tools & simulations associated with the PDF entry. Gray icons indicate the tool or simulation is not available for this entry
7 Supplemental Information tabs
Provides additional details pertaining to:
(A) “PDF” – chemistry & general info
(B) “Experimental” – diffraction experiment
(C) “Physical” – unit cell data (from author)
(D) “Crystal” – ICDD-calculated unit cell data
(E) “Structure” – atomic structure
TABLE V. Details for fields on the “PDF” supplemental information tab (Tab A in Figure 8).
A1 Editorial designations Status – primary, alternate, or deleted
Quality mark – see TABLE II: major criteria for PDF quality mark assignment
A2 Sample Conditions Specifies the environment, temperature, and pressure of data collection.
A3 Chemistry Indicates the polymorphic designation of a given phase, as well as the formula(e), weight percent, and atomic percent associate with entry; as available.
A4 Compound Identifier(s) Names and registry numbers used to identify the compound
A5 History Specifics pertaining to the entries initial publication, and if applicable, recent modifications
shows the bond length distribution using 8180 PDF-5+ entries with bonds. It is clear from the histogram that the distribution is bimodal corresponding to tetrahedral and octahedral coordination. This module also has a feature to filter by coordination number. This information is useful in crystal structure validation as well as in setting up bond length restraints during Rietveld refinements.
The PDF-5+ database also comes with integrated data mining features and a search/match program (SIeve+) for phase identification. The recent development among many in Sever is the capability of performing phase identification using 2D diffraction images/data (supports several formats). Sleve+ can process, integrate, and perform search/match seamlessly using 2D diffraction image/data as shown in Figure 14. One of the most used features of SIeve+ is quantitative phase analysis using Reference Intensity Ratio method (Hubbard and Snyder, 1988).
PDF-5+ has an extensive data mining capability facilitated with 137 display fields coupled with 83 searches. A very important distinction of PDF-5+ 2024 is that out of 1,061,800+ entries, entries have atomic coordinates to enable quantitative phase analysis using the Rietveld method. ICDD’s PDF goes through the continuous addition of significant data and classifications each year and it is important in any research or analytical laboratory to have the most up-to-date database.

V. AVAILABILITY

ICDD offers various database products at different levels to meet user’s requirements. Product summaries, licensing info, and operating specifications for each member of the PDF product line are available on the ICDD website (www.icdd.com).
Over the years, ICDD has been closely collaborating with licensed software developers, including equipment
manufacturers and independent developers, and works diligently to cultivate commercial data analysis programs that work impeccably with our databases.

VI. CONCLUSION

Well-curated databases play a pivotal role in any successful material characterization or any data-driven studies. The exponential growth and interest in data-driven research based on machine learning (ML) and artificial intelligence (AI) make it critical to have a database one would trust. ICDD, a nonprofit scientific organization founded by scientists has responded to the growing need for database requirements in materials characterization by providing a curated, quality database, the PDF. The advances in computer speed and digital storage media size and retrieval speed have enabled combining the PDF inorganic and organic subfiles into a comprehensive database product PDF-5+ designated Release 2024.

ACKNOWLEDGEMENTS

Editing, curating, and producing a quality database and software requires a significant team effort by the ICDD staff, ICDD members and the ICDD Board of Directors. We thank hundreds of researchers and scientists who have contributed to the Powder Diffraction File and ICDD organization over the past 80+ years.

REFERENCES

Allmann, R., and R. Hinek. 2007. “The Introduction of Structure Types into the Inorganic Crystal Structure Database ICSD.” Acta Crystallographica Section A Foundations of Crystallography 63 (5): 412-17. doi:10.1107/ S0108767307038081.
Baerlocher, C. H., L. B. McCusker, D. Olson, & W. M. Meier. 2007. Atlas of Zeolite Framework Types. 6th rev. ed. Amsterdam Boston, Published on behalf of the Structure Commission of the International Zeolite Association by Elsevier.
Blatov, V. A., A. P. Shevchenko, and D. M. Proserpio. 2014. “Applied Topological Analysis of Crystal Structures with the Program Package ToposPro.” Crystal Growth & Design 14 (7): 3576-86. doi:10.1021/ cg500498k.
Bruno, I., S. Gražulis, J. R. Helliwell, S. N. Kabekkodu, B. McMahon, and J. Westbrook. 2017. “Crystallography and Databases.” Data Science Journal 16: 38. doi:10.5334/dsj-2017-038.
Donnay, J. D. H., and D. Harker. 1937. “A New Law of Crystal Morphology Extending the Law of Bravais” American Mineralogist 22: 446-67.
Dowty, E. 1976. “Crystal Structure and Crystal Growth: I. The Influence of Internal Structure on Morphology.” American Mineralogist 61: 448-59.
Faber, J., and T. Fawcett. 2002. “The Powder Diffraction File: Present and Future.” Acta Crystallographica Section B Structural Science 58 (3): 325-32. doi:10.1107/S0108768102003312.
Fawcett, T. G., S. N. Kabekkodu, J. R. Blanton, and T. N. Blanton. 2017. “Chemical Analysis by Diffraction: The Powder Diffraction File .” Powder Diffraction 32 (2): 63-71. doi:10.1017/S0885715617000288.
Fawcett, T. G., S. Gates-Rector, A. M. Gindhart, M. Rost, S. N. Kabekkodu, J. R. Blanton, and T. N. Blanton. 2019. “A Practical Guide to Pharmaceutical Analyses Using X-Ray Powder Diffraction.” Powder Diffraction 34 (2): 164-83. doi:10.1017/S088571561900023X.
Fawcett, T. G., S. Gates-Rector, A. M. Gindhart, M. Rost, S. N. Kabekkodu, J. R. Blanton, and T. N. Blanton. 2020. “Total Pattern Analyses for Non-Crystalline Materials.” Powder Diffraction 35 (2): 82-8. doi:10.1017/S0885715620000263.
Gates, S. D., T. N. Blanton, and T. G. Fawcett. 2014. “A New ‘Chain’ of Events: Polymers in the Powder Diffraction File (PDF ).” Powder Diffraction 29 (2): 102-7. doi:10.1017/S088571561400013X.
Gates-Rector, S., and T. Blanton. 2019. “The Powder Diffraction File: A Quality Materials Characterization Database.” Powder Diffraction 34 (4): 352-60. doi:10.1017/S0885715619000812.
Gelato, L. M., and E. Parthé. 1987. “STRUCTURE TIDY – A Computer Program to Standardize Crystal Structure Data.” Journal of Applied Crystallography 20 (2): 139-43. doi:10.1107/S0021889887086965.
Goehner, R. P., and J. R. Michael. 1996. “Phase Identification in a Scanning Electron Microscope Using Backscattered Electron Kikuchi Patterns.” Journal of Research of the National Institute of Standards and Technology 101 (3): 301. doi:10.6028/jres.101.031.
Groom, C. R., I. J. Bruno, M. P. Lightfoot, and S. C. Ward. 2016. “The Cambridge Structural Database.” Acta Crystallographica Section B Structural Science, Crystal Engineering and Materials 72 (2): 171-79. doi:10.1107/S2052520616003954.
Hanawalt, J. D. 1986. “Manual Search/Match Methods for Powder Diffraction in 1986.” Powder Diffraction 1 (1): 7-13.
Hanawalt, J. D., H. W. Rinn, and L. K. Frevel. 1938. “Chemical Analysis by X-ray Diffraction.” Industrial & Engineering Chemistry Analytical Edition 10 (9): 457-512.
Helliwell, J. R., B. McMahon, J. Mitchell Guss, and L. M. J. KroonBatenburg. 2017. “The Science Is in the Data.” IUCrJ 4 (6): 714-22. doi:10.1107/S2052252517013690.
Hofmann, D. W. M., and L. Kuleshova. 2005. “New Similarity Index for Crystal Structure Determination from X-Ray Powder Diagrams.” Journal of Applied Crystallography 38 (6): 861-66. doi:10.1107/S0021889805023484.
Hubbard, C. R., and R. L. Snyder. 1988. “RIR – Measurement and Use in Quantitative XRD.” Powder Diffraction 3 (2): 74-77. doi:10.1017/ S0885715600013257.
Hubbard, C. R., J. K. Stalick, and A. D. Mighell. 1980. “NBS* AIDS80: A Fortran Program to Evaluate Crystallographic Data.” Advances in X-Ray Analysis 24: 99-109.
Jenkins, R. & Smith, D. (1987). Powder Diffraction File in F. H. Allen, G. Bergerhoff, and R. Sievers (Eds.) Crystallographic Databases (pp. 159-74). Data Commission of the International Union of Crystallography.
Jenkins, R., M. Holomany, and W. Wong-Ng. 1987. “On the Need for Users of the Powder Diffraction File to Update Regularly.” Powder Diffraction 2 (2): 84-87. doi:10.1017/S0885715600012434.
Johnson, G., and V. Vand. 1967. “A Computerized Powder Diffraction Identification System.” Industrial & Engineering Chemistry 59 (8): 19-31.
Kabekkodu, S. N., J. Faber, and T. Fawcett. 2002. “New Powder Diffraction File (PDF-4) in Relational Database Format: Advantages and Data-Mining Capabilities.” Acta Crystallographica Section B Structural Science 58 (3): 333-37. doi:10.1107/S0108768102002458.
Kaduk, J. A. (2019). Crystallographic Databases and Powder Diffraction in J. A. K. C. Gilmore and H. Schenk (Eds.) International Tables for Crystallography Volume H: Powder Diffraction. 1st ed. (Chap. 3.7, pp. 304-24). New York, Wiley.
Messick, J. 2012. “The History of the International Centre for Diffraction Data.” Powder Diffraction 27 (1): 36-44. doi:10.1017/ S0885715612000085.
Pearson, W. B. 1967. Handbook of Lattice Spacings and Structures of Metals. Oxford: Pergamon Press.
Reid, J. W., J. A. Kaduk, and M. Vickers. 2016. “The Crystal Structure of Trandolapril, : An Example of the Utility of Raw Data Deposition in the Powder Diffraction File.” Powder Diffraction 31 (3): 205-10. doi:10.1017/S0885715616000294.
Smith, D. K., P. Bayliss, and A. C. Roberts. 1997. “Mineral Classification in the Mineral Powder Diffraction File.” Advances in X-Ray Analysis 41: 606-13.
Villars, P., & K. Cenzual. 2018. Pearson’s Crystal Data: Crystal Structure Database for Inorganic Compounds. Materials Park, OH, USA: ASM International.
Villars, P., N. Onodera, and S. Iwata. 1998. “The Linus Pauling File (LPF) and Its Application to Materials Design.” Journal of Alloys and Compounds 279 (1): 1-7. doi:10.1016/S0925-8388(98)00605-7.
Wallace, P. L., S. Weissmanna, M. H. Mueller, L. D. Calveit, and R. Jenkins. 1994. “The New ICDD Metals and Alloys Indexes: Usefulness and Potentialities.” Powder Diffraction 9 (4): 239-45. doi:10.1017/ S0885715600018947.
Wilkinson, M. D., M. Dumontier, I. J. Aalbersberg, G. Appleton, M. Axton, A. Baak, N. Blomberg, et al. 2016. “The FAIR Guiding Principles for Scientific Data Management and Stewardship.” Scientific Data 3 (1): 160018. doi:10.1038/sdata.2016.18.
Wong-Ng, W., H. F. McMurdie, C. R. Hubbard, and A. D. Mighell. 2001. “JCPDS-ICDD Research Associateship (Cooperative Program with NBS/NIST).” Journal of Research of the National Institute of Standards and Technology 106 (6): 1013. doi:10.6028/jres.106.052.
Zagorac, D., H. Müller, S. Ruehl, J. Zagorac, and S. Rehme. 2019. “Recent Developments in the Inorganic Crystal Structure Database: Theoretical Crystal Structure Data and Related Features.” Journal of Applied Crystallography 52 (5): 918-25. doi:10.1107/S160057671900997X.

  1. Author to whom correspondence should be addressed. Electronic mail: kabekkodu@icdd.com