TRAPT: إطار عمل عميق متعدد المراحل للتعلم المدمج لتوقع المنظمات النسخية استنادًا إلى بيانات الإبيجينوم الواسعة النطاق TRAPT: a multi-stage fused deep learning framework for predicting transcriptional regulators based on large-scale epigenomic data
من الصعب تحديد المنظمين النسخيين (TRs) الذين يتحكمون في تعبير الجينات من خلال العناصر التنظيمية والإشارات الإبيجينية، في الدراسات السياقية المتعلقة ببدء الأمراض وتقدمها. يتيح استخدام بيانات الإبيجينوم متعددة الأبعاد على نطاق واسع تمثيل الأنماط الإبيجينية المعقدة للتحكم في العناصر التنظيمية والمنظمين. هنا، نقترح أداة توقع نشاط المنظم النسخي (TRAPT)، وهي إطار عمل عميق متعدد الوسائط، يستنتج نشاط المنظم من خلال تعلم ودمج الإمكانيات التنظيمية لعناصر التنظيم الجيني المستهدفة ومواقع الربط على مستوى الجينوم. تظهر نتائج التجارب على 570 مجموعة بيانات مرتبطة بـ TR أن TRAPT تفوقت على الطرق الحديثة في توقع TRs، خاصة من حيث التنبؤ بعوامل النسخ المساعدة ومنظمي الكروماتين. علاوة على ذلك، نحدد بنجاح المنظمين الرئيسيين المرتبطين بالأمراض، والتغيرات الجينية، وقرارات مصير الخلايا، والأنسجة. توفر طريقتنا منظورًا مبتكرًا لتحديد TRs من خلال استخدام بيانات الإبيجينوم.
تتم برمجة الأنماط المعقدة لتنظيم الجينات بواسطة عدة منظمات نسخية علوية (TRs)، مثل عوامل النسخ (TFs)، وعوامل النسخ المساعدة (TcoFs)، ومنظمات الكروماتين (CRs)، التي يمكن أن تتوسط الإشارات التنظيمية بين المحفزات والمعززات البعيدة.غالبًا ما يرتبط ظهور الأمراض بأنماط شاذة من التعبير الجيني، مما يبرز أهمية تحديد عوامل النسخ التي تتحكم في البرامج الرئيسية للتعبير الجيني.
لقد مكنت التقدمات في تقنيات ChIP-seq وATAC-seq من توضيح المناظر التنظيمية السيز-وترانس بشكل واضح. تحدد affinities الربط لعوامل النسخ الجينومية، بالتزامن مع المعلومات الأبيجينية، مثل تعديلات الهيستون وانفتاح الكروماتين، الأنشطة التنظيمية الخاصة بالخلايا لعوامل النسخ.. علاوة على ذلك، أظهرت العديد من الدراسات أن عوامل النسخ ترتبط بتسلسلات تنظيمية معينة داخل الجينوم، بما في ذلك المعززات والمروجين، لتعديل
تعبير جيناتهم المستهدفةنظرًا لتعقيد تنظيم الجينات، فإن استخدام كمية كبيرة من البيانات الإبيجينية لتحديد الميزات التنظيمية التآزرية العليا للجينات أمر ضروري لتوقع TRs. تم جمع كمية هائلة من البيانات الإبيجينية، بما في ذلك ATACseq وDNase-seq وChIP-seq، بسبب التقدم السريع في تقنيات التسلسل عالية الإنتاجية. تتمثل إحدى التحديات الرئيسية في هذا السياق في جمع ومعالجة هذه المجموعات البيانية بشكل شامل من مصادر متنوعة. علاوة على ذلك، تواجه المجموعات البيانية من أصول مختلفة مشكلات كبيرة، بما في ذلك التداخل الناتج عن الضوضاء، وتأثيرات الدفعات، وتكرار البيانات. وبالتالي، لا يزال من الصعب دمج هذه المجموعات البيانية، والتقاط تمثيلات مفيدة، وتصفيه الضوضاء.
تم اقتراح عدد من الطرق لاستنتاج TRs العلوية باستخدام مجموعات الجينات الوظيفية، بما في ذلك Enrichr.تيفيا.شيبتشيا3سحرi-cisTargetبارت، وليزا . إن Enrichr و TFEA.ChIP و ChEA3 و MAGIC تستخدم مجموعات الجينات كمدخلات للتنبؤ بالعوامل التنظيمية من خلال تحليل الإثراء. تتضمن هذه الأساليب اختبارًا إحصائيًا يعتمد على التداخلات بين الجينات المستهدفة للعوامل التنظيمية والجينات المدخلة. على الرغم من قدرتها على إجراء تحليلات سريعة، إلا أنها لا تتضمن معلومات مفصلة عن العناصر التنظيمية الجينية (CREs). نظرًا لأن عوامل النسخ تعمل من خلال الارتباط بالعناصر التنظيمية، فإن المعلومات حول الملف التنظيمي الجيني ضرورية لاستنتاج المنظمين بدقة. يقوم i-cisTarget بمطابقة العناصر التنظيمية الجينية على الجينوم للتنبؤ بنشاط عوامل النسخ من خلال تحليل الإثراء. على عكس الأساليب التي تعتمد فقط على مجموعات الجينات، يستخدم i-cisTarget العناصر التنظيمية الجينية لمحاكاة ارتباط عوامل النسخ بدقة أكبر. ومع ذلك، فإن هذا الخوارزمية تستخدم فقط العناصر التنظيمية الجينية المرتبطة بمجموعة الجينات المدخلة، وهو ما يعد غير كافٍ لمحاكاة الملف التنظيمي الجيني الكامل. يقوم BART بحل مشكلة التغطية غير الكاملة للملف التنظيمي الجيني من خلال استنتاجه من كمية كبيرة من بيانات H3K27ac ChIP-seq من خلال MARGE المعتمدة على الانحدار.الخوارزمية. ليزا، المعروفة باسم “MARGE الجيل الثاني”، تعزز دقة التنبؤ من خلال دمج بيانات DNase-seq مع بيانات H3K27ac ChIP-seq لاستنتاج ملفات التنظيم الجيني المرتبطة بالسيز. على الرغم من أن BART وليزا تحلان مشكلة التغطية غير الكاملة لملف التنظيم الجيني (ICCP)، إلا أن هناك انحيازًا متأصلًا في ارتباط TR الذي نشير إليه باسم تفضيل ارتباط المنظمين النسخيين (TRBP). في الأساس، تميل TRs إلى الارتباط بمناطق الكروماتين النشط. والأهم من ذلك، أن جميع الطرق المتاحة حاليًا محدودة في استنتاج العناصر التنظيمية العليا باستخدام مجموعات الجينات، ولكن لا توجد تقنية متاحة لاستنتاج مواقع ارتباط TRs على مستوى الجينوم. هناك حاجة ملحة لتطوير أساليب تأخذ في الاعتبار العلاقات التنظيمية ثنائية الاتجاه لعناصر التنظيم الجيني.
استخدام بيانات الإبيجينوميات المتعددة الأوميات مليء بالتعقيد، بما في ذلك وجود التداخل بين النماذج والضوضاء. تستخدم الخوارزميات السائدة فقط طرق الانحدار التقليدية، مثل ليزا، وتتجاهل تأثيرات التداخل بين النماذج والضوضاء عند دمج بيانات الأوميات المتعددة. علاوة على ذلك، فإن العلاقات بين بيانات الأوميات المتعددة ليست خطية، بل تشكل شبكة معقدة. لقد حققت خوارزميات التعلم العميق نجاحًا كبيرًا في حل هذه المشكلات البيولوجية المحددة.تتمثل الخطوة الأولى في تطبيق أساليب التعلم العميق المعتمد على البيانات في الجمع والمعالجة الشاملة للبيانات الوراثية. في الأعمال السابقة، قمنا بتطوير عدة قواعد بيانات تنظيمية وراثية، بما في ذلك TcoFBase.، و ATACdb، التي يمكن أن توسع نطاق بيانات الإبيجينوم. تحتوي قواعد بيانات تنظيم النسخ TcoFBase وCRdb وTFTG على كمية كبيرة من البيانات حول منظمات النسخ، بينما تحتوي SEdb وATACdb، كقواعد بيانات إبيجينومية، على أكثر البيانات شمولاً حول المعززات والوصول إلى الكروماتين. من خلال دمج كمية كبيرة من الموارد الإبيجينومية، قمنا بإنشاء مكتبة ميزات إبيجينومية شاملة. إن دمج هذه البيانات الإبيجينومية الغنية مع تقنيات التعلم العميق المتطورة قدم فرصة غير مسبوقة لفك شفرة المناظر الطبيعية المعقدة للإبيجينوم.
في هذه الدراسة، نقترح إطار عمل للتعلم العميق مستوحى من البيانات، يسمى TRAPT، يمكنه الاستفادة من البيانات الوبائية واسعة النطاق. مجموعات البيانات لاستيعاب نماذج متقدمة من تقطير المعرفة والشبكات العصبية التلافيفية. صممنا نهج تعلم عميق قائم على دمج متعدد المراحل لدمج الإشارات من عناصر التنظيم الجيني المستهدفة داخل مجموعات الجينات ومواقع الارتباط على مستوى الجينوم لعوامل النسخ، بهدف الحصول على التمثيل الأمثل لنشاط عوامل النسخ وتوقع عوامل النسخ الرئيسية لمجموعات الجينات ذات التنظيم المحدد للسياق. لتقييم فعالية طريقتنا، توقعنا عوامل النسخ، والعوامل المساعدة، ومنظمات الكروماتين على ما يصل إلى 570 مجموعة بيانات لتقليل/إزالة عوامل النسخ من KnockTF.قاعدة البيانات. تم إجراء اختبارات معيارية ضد أدوات معروفة، مثل ليزا، BART، i-cisTarget، وChEA3، وأظهرت نتائجها أن TRAPT تفوقت عليها من حيث التنبؤ بنشاط TR. كما استخدمنا TRAPT في دراسة حول مرض الزهايمر لتحديد TRs الرئيسية ذات الصلة بنجاح، مثل REST. في النهاية، طبقنا TRAPT على مجموعات بيانات حول تطوير الخلايا البشرية والأنسجة البشرية الطبيعية. وقد تنبأت بنجاح بالعوامل التنظيمية الحاسمة التي تتحكم في قرارات مصير الخلايا وكذلك المنظمات الخاصة بالأنسجة. من السهل استخدامها، ويمكن الوصول إليها إما من خلال واجهة عبر الإنترنت (https://bio.liclab.net/TRAPT) أو من خلال التثبيت المحلي (https://github.com/TOSTRING-Z/TRAPT).
النتائج
نظرة عامة على TRAPT
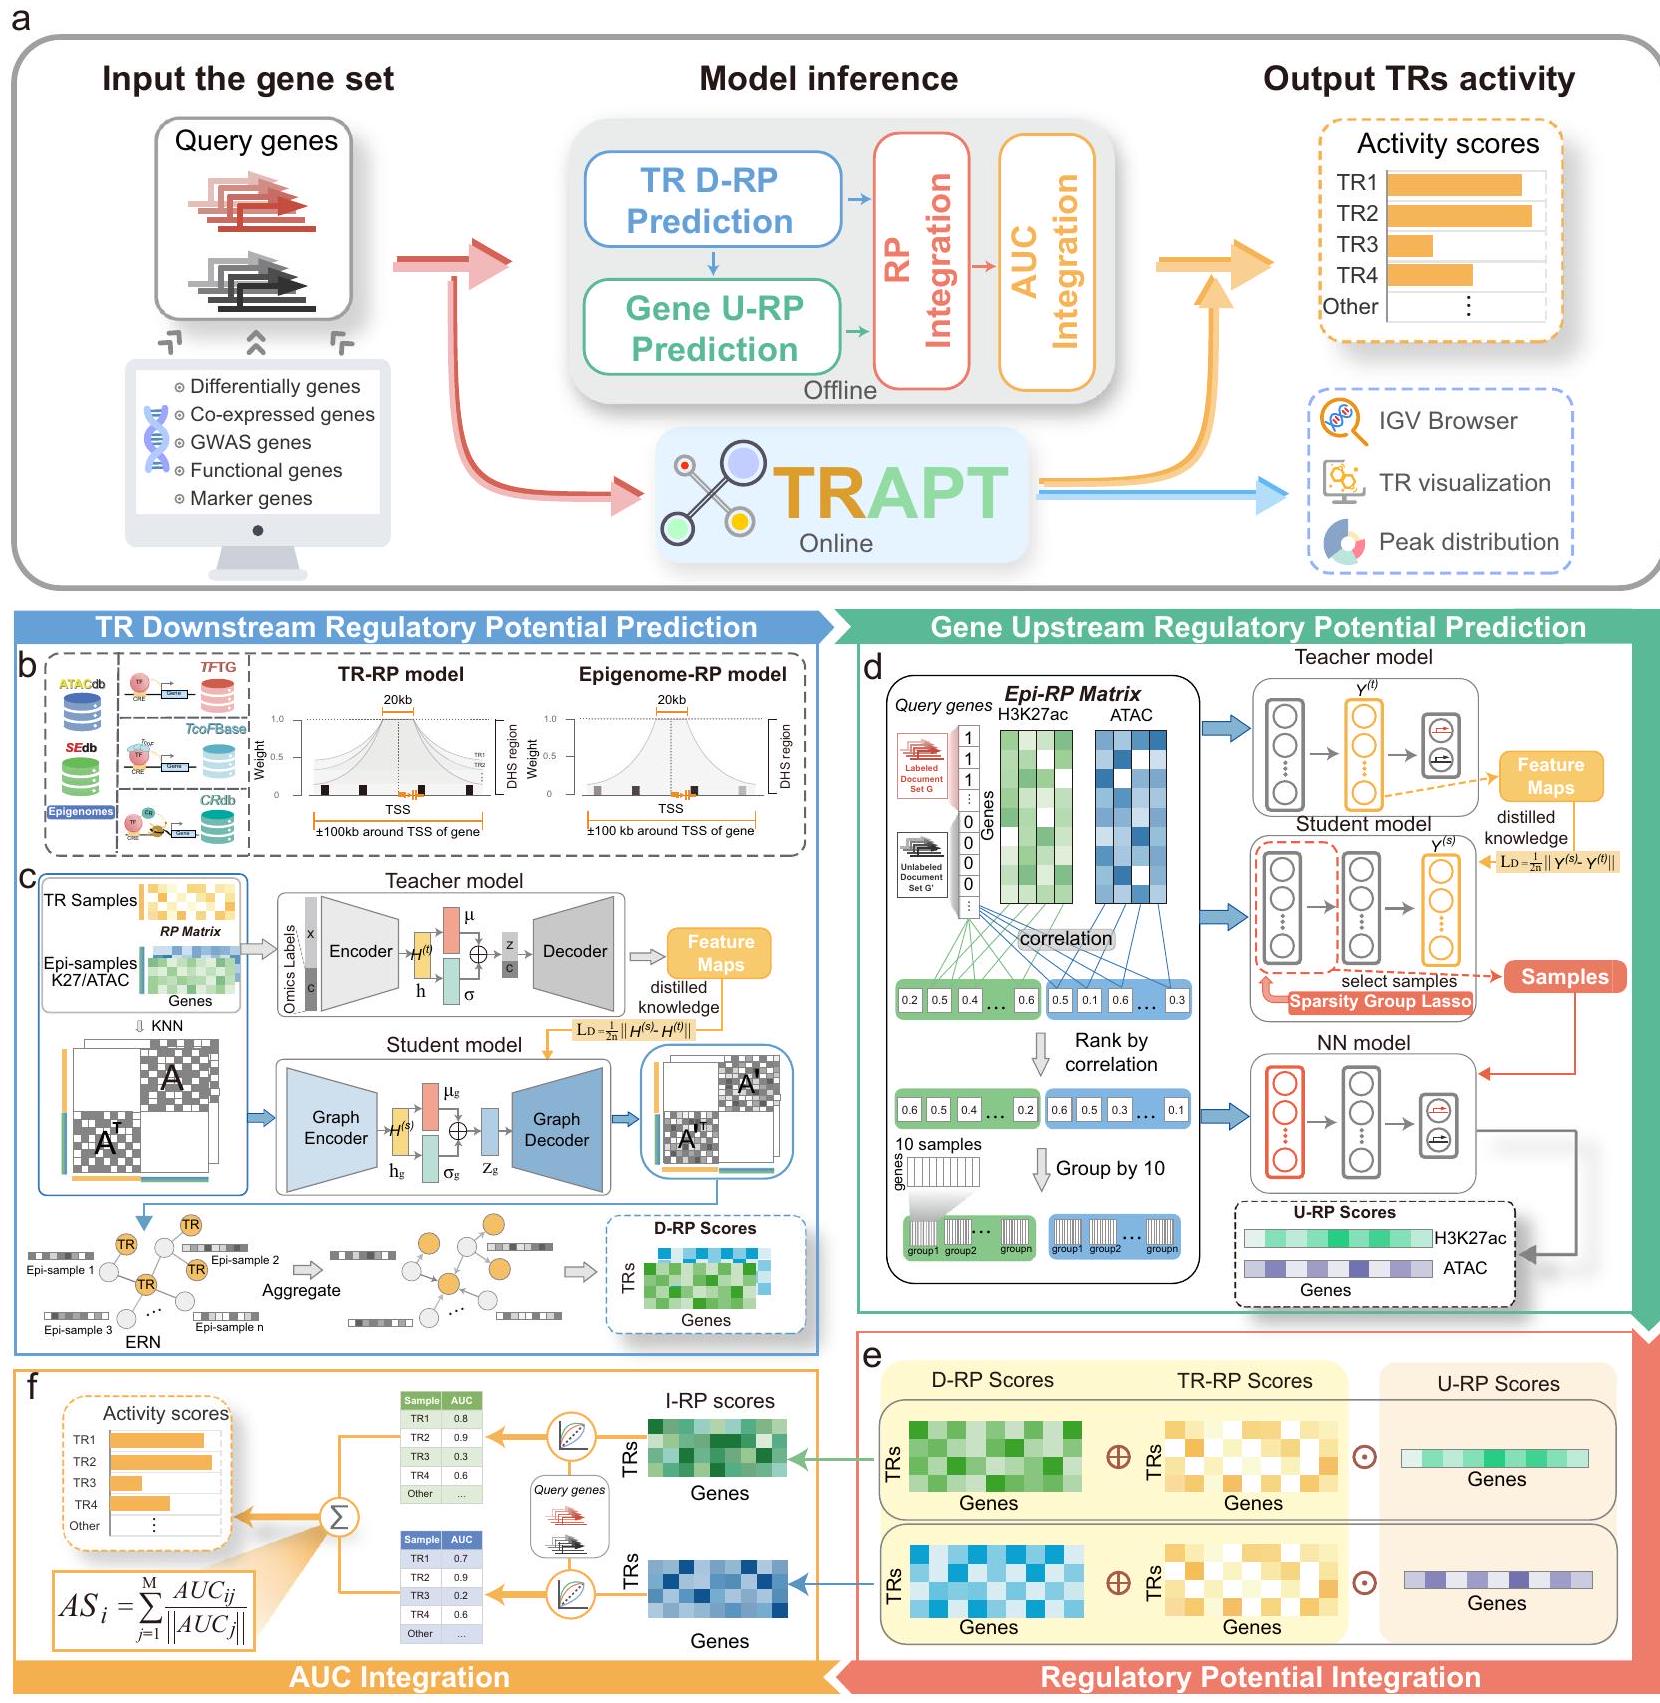
TRAPT هو إطار متعدد الأومكس للتكامل مصمم لاستنتاج نشاط TR من مجموعة من الجينات المستفسر عنها. ببساطة، يأخذ النموذج الجينات ذات الاهتمام كمدخلات ويخرج درجة النشاط لكل TR (الشكل 1a والشكل التوضيحي 1a). يستخدم TRAPT استراتيجية دمج متعددة المراحل لمعالجة قضايا TRBP و ICCP، والتي تتعلق بتوقع الإمكانات التنظيمية السفلية (D-RP) لمُنظمي النسخ (TRs) بناءً على مواقع ارتباطهم على مستوى الجينوم وإمكانات التنظيم العلوية (U-RP) للجينات المستهدفة المشتقة من عناصرها التنظيمية الجانبية (تم تقديم تعريفات التنظيم العلوي والسفلي في الملاحظة التوضيحية A.9). لذلك، نقسم النموذج إلى الخطوات الرئيسية التالية: (1) حساب الإمكانات التنظيمية الجينية (Epi-RP) وإمكانات المنظمين النسخيين (TR-RP) (الأشكال 1b)، (2) توقع D-RP لكل TR بالنسبة للجينات (الأشكال 1c)، (3) توقع U-RP المحدد للسياق لمجموعة الجينات المستفسر عنها (الأشكال 1d)، و (4) استخدام الإمكانات التنظيمية المتوقعة من الخطوتين 2 و 3 لتقدير نشاط TRs (الأشكال 1e، f). إن توقع D-RP هو مهمة تستغرق وقتًا طويلاً ولا تتضمن حسابات تتعلق بمجموعة الجينات المدخلة من المستخدم. وبالتالي، مع نهج معياري، لا يكرر TRAPT الخطوتين 1 و 2؛ بدلاً من ذلك، تعمل Epi-RP و TR-RP و D-RP المُعدة مسبقًا كمدخلات للوحدات اللاحقة (الشكل التوضيحي 1a). الآن نوضح تفاصيل كل من الخطوات المذكورة أعلاه.
في الخطوة الأولى، لحساب الإمكانات التنظيمية للجينات الجينية و TRs، جمعنا أولاً أكثر من 20,000 مجموعة بيانات من عينات الجينات الجينية، بما في ذلك 1329 ATAC-seq، 1465 H3K27ac ChIP-seq، و 17,227 مجموعة بيانات TR ChIP-seq، ثم خضعت لعمليات معالجة مسبقة صارمة. ثم قمنا بحساب الإمكانات التنظيمية (RP) لكل جين باستخدام بيانات الجينوم الجينية على نطاق واسع ومكتبة معرفة خلفية عن TRs. تم تطبيق استراتيجية تآكل وزن موحد على بيانات الجينوم الجينية، بينما تم تنفيذ نهج تآكل وزن محدد للسياق لكل TR لالتقاط أنماطها التنظيمية ونطاقاتها المميزة (انظر قسم الطرق) (الشكل 1a). قارنّا نتائجنا مع نتائج تشين وآخرين، الذين صنفوا TRs إلى فئات بعيدة المدى وقصيرة المدى (البيانات التوضيحية 7)، ووجدنا تداخلًا كبيرًا بين أنواع TRs التي تم تحديدها في تحليلنا وتلك التي اكتشفوها (الأشكال التوضيحية 1f، g). تم دمج جميع RPs في مكونين متميزين، Epi-RP و TR-RP، اللذان خدمتا كمدخلات في الخطوة 2.
تتركز الخطوة الثانية على دمج Epi-RP و TR-RP لتوقع D-RP المحدد للسياق لكل TR. التحدي الرئيسي يكمن في دمج توقعات الأومكس التفاضلية لـ TR مع العلاقات بعينات الجينوم الجينية، بالإضافة إلى تجميع
الشكل 1 | نظرة عامة على TRAPT. أ تشير مخطط التدفق المبسط لـ TRAPT إلى أن عملية استنتاج النموذج تتكون من ثلاثة مكونات: مجموعة جينات مدخلة، استنتاج بواسطة النموذج، ونشاط TR كخرج. يتطلب TRAPT فقط مجموعة جينات كمدخلات ويقدم النتائج من خلال طرق عبر الإنترنت أو غير متصلة، مع توفير الخدمة عبر الإنترنت ميزات محسّنة للتصور. ب تم استخدام نموذج الإمكانات التنظيمية TR-RP لحساب مصفوفة TR-RP، وتم استخدام نموذج الإمكانات التنظيمية Epi-RP لحساب مصفوفة Epi-RP. ج يتوقع TRAPT الإمكانات التنظيمية المرتبطة بمواقع الارتباط على مستوى الجينوم لـ TRs. تتكون مدخلات TRAPT من مصفوفات TR-RP و Epi-RP المعالجة مسبقًا، والتي يتم دمجها لتشكيل مصفوفة الإمكانات التنظيمية ورسم بياني للتجاور. استخدمنا أولاً مُشفّر تلقائي متغير شرطي كشبكة معلم لتعلم التمثيل الكامن h. بعد ذلك، تم تطبيق مُشفّر تلقائي متغير رسومي كشبكة طالب لإعادة بناء رسم بياني للتجاور بين TR والجينوم الجيني، مما يمكّنه من تعلم هيكله الشبكي الخاص وتمثيل ميزاته الكامنة من شبكة المعلم. أخيرًا، قمنا بإجراء عملية تجميع باستخدام
رسم بياني للتجاور بين TR والجينوم الجيني المعاد بناؤه ومصفوفة Epi-RP المدخلة للحصول على مصفوفة الإمكانات التنظيمية المرتبطة بمواقع الارتباط على مستوى الجينوم لـ TRs. د يتوقع TRAPT الإمكانات التنظيمية العلوية المرتبطة بالجينة المستفسر عنها. أولاً، يتم تجميع عينات الجينوم الجيني بناءً على ارتباطها مع متجه الجينة المستفسر عنها. ثم، يستخرج نموذج المعلم خرائط الميزات لتوجيه نموذج الطالب في اختيار عينات غير متكررة باستخدام قيود SGL. أخيرًا، يتم إعادة تدريب نموذج شبكة عصبية غير خطية لتوليد مصفوفة الإمكانات التنظيمية العلوية. هـ يتم دمج المصفوفات المتوقعة للإمكانات التنظيمية المرتبطة بمواقع الارتباط على مستوى الجينوم لـ TRs، وإمكانات التنظيم لعناصر الجينات المستهدفة التنظيمية الجانبية، وإمكانات TR التنظيمية من خلال عمليات المصفوفة للحصول على مصفوفة I-RP. و تم حساب درجة AUC لكل عينة TR في مصفوفة I-RP أولاً مع مجموعة الجينات المستفسر عنها. تم دمج درجات AUC لـ TR من جميع المجموعات الجينية المورثة لاشتقاق درجة النشاط النهائية لكل TR.
إشارات الإمكانات التنظيمية المرتبطة بعينات الجينوم الجينية. نظرًا للأداء الممتاز لشبكات الأعصاب التلافيفية الرسومية في تحسين الشبكات وتجميع معلومات العقد. لذلك، قمنا بإعادة صياغة مشكلة توقع الإمكانات التنظيمية إلى مهمة تحسين الشبكة. مع مدخلات مصفوفات Epi-RP و TR-RP التي تم إنشاؤها في الخطوة 1، تم تطبيق خوارزمية الجيران الأقرب (kNN) لبناء شبكة غير متجانسة بين TRs وعينات الجينوم الجينية (على سبيل المثال، عينات CD4+، CD8+ H3K27ac/ATACseq)، والتي خدمت كشبكة تنظيم جينية أولية (ERN). تمثل الحواف في هذه الشبكة التنظيم المرتبط المحتمل بنوع الأنسجة/الخلايا المحددة. ثم يتم تحسين هذه الشبكة من خلال نموذج تقطير المعرفة متعدد الأنماط، المشار إليه باسم نموذج D-RP. بناءً على الشبكة، قمنا بتطوير نموذج تقطير المعرفة الموجه بواسطة الجينوم الجيني متعدد الأنماط، المسمى نموذج D-RP، لتحسين ERN الأولية وتجميع درجة الإمكانات التنظيمية الجينية. بشكل محدد، تم إدخال مصفوفة الإمكانات التنظيمية المُنشأة في نموذج المعلم، وهو مُشفّر تلقائي متغير شرطي (CVAE)، لتعلم تمثيلات مشتركة ملساء توزيعياً لعناصر TR وعينات الجينوم الجيني من خلال دمج الميزات متعددة الأنماط. في الوقت نفسه، تم استخدام ERN المُنشأة كمدخل لنموذج الطالب. استخدم النموذج مُشفّر تلقائي رسومي متغير (VGAE) لتعلم تمثيلات موحدة عبر الأنماط ومنخفضة الضوضاء. أثناء التدريب، كانت معلمات نموذج الطالب مقيدة بمعرفة تمييز الأومكس لنموذج المعلم، مما يمكّن نموذج الطالب من تحسين تمثيلاته السطحية الملساء (الشكل التوضيحي 3d). يعزز هذا النهج التعليمي المقيد من قوة النموذج ضد الإفراط في التكيف ويقوي قدرته على التعميم. الناتج من هذه الخطوة هو مصفوفة D-RP، التي تمثل النشاط المجمع للعناصر التنظيمية بالقرب من مناطق الجينات.
مستوحاة من استراتيجية فعالة تختار عينات جينية مهمة من بيانات تحتوي على ضوضاء وتدمجها ، في الخطوة الثالثة، قمنا بتطوير نموذج U-RP، وهو نموذج تقطير المعرفة المقيد بتمثيلات جينية منخفضة الأبعاد، لاستنتاج الإمكانات التنظيمية لعناصر الجينات المستهدفة التنظيمية الجانبية. يأخذ نموذج U-RP مصفوفة Epi-RP ومجموعة الجينات المستفسر عنها كمدخلات. يقوم نموذج المعلم بتوليد تمثيلات قوية من البيانات الجينية، بينما يتعلم نموذج الطالب هذه التمثيلات بأوزان مقيدة، مما يمكّن من اختيار عينات جينية رئيسيةخلال التدريب، يقوم نموذج المعلم باستخراج ميزات تنظيمية محتملة مرتبطة بالجينات المستفسر عنها، مما يوفر تسميات ناعمة لنموذج الطالب. بعد ذلك، يقوم نموذج الطالب بتنفيذ اختيار عينات الإبيجينوم الرئيسية من خلال تعلم هذه التسميات الناعمة باستخدام بنية شبكة مزودة بـ لاسو المجموعة النادرة (SGL).من خلال تجميع مصفوفة الإمكانيات التنظيمية بناءً على SGL وفقًا لأهميتها للجينات المستفسر عنها، فرض نموذج الطالب قيودًا متعلقة بالندرة سواء داخل المجموعات أو بينها. مثلت العينات داخل المجموعة ملفات لعناصر تنظيمية متشابهة للغاية قد تحتوي على عينات متكررة بشكل كبير. على عكس معظم الطرق الخطية لاختيار عينات الإبيجينوم، استخدم نموذج U-RP استراتيجية تعلم عميق غير خطية، مع دمج قيود تشابه العينات لتقليل التكرار. وهذا مكن من اختيار دقيق لعينات إبيجينومية غير متكررة ومجمعة بشكل غير خطي. تم استخدام RP للعينات المختارة لبناء شبكة عصبية متعددة الطبقات، حيث كانت الإمكانية الملائمة تعمل كإخراج لنموذج U-RP. الناتج من هذه الخطوة هو متجه U-RP، الذي يحتوي على معلومات تعتمد على السياق حول وصول الكروماتين (ATAC) وحالات النشاط (H 3 K 27 ac) المرتبطة بالجنيات المستفسر عنها.
الخطوة النهائية تدمج مخرجات نماذج D-RP و U-RP لتقدير نشاط TR. المدخلات لهذه الخطوة تشمل مصفوفة TR-RP، مصفوفة D-RP و متجه U-RP. ثم حصلنا على الإمكانية التنظيمية المدمجة (I-RP) لكلا الطريقتين من خلال الجمع العنصري لمصفوفة TR-RP المعيارية مع مصفوفة D-RP، تليها ضربها العنصري مع متجه U-RP. بعد ذلك، قمنا بت quantifying العلاقة بين كل TR ضمن كلا طرق و مجموعة الجينات المستفسر عنها باستخدام المساحة تحت منحنى التشغيل الاستقبالي (AUC)أخيرًا، تم دمج درجات RP الخاصة بـ TRs المقابلة من كلا الطريقتين للحصول على درجة RP النهائية المجمعة. باختصار، قام TRAPT بدمج الإمكانات التنظيمية لمواقع الارتباط على مستوى الجينوم لـ TRs وإمكانات التنظيم لعناصر التنظيم الجيني المستهدفة لاستنتاج TRs الرئيسية التي تنظم مجموعة الجينات المستهدفة.
تظهر TRAPT أداءً متقدمًا على مجموعات البيانات المرجعية
تم تقييم أداء TRAPT باستخدام مقياس “ترتيب TR المستهدف”، الذي يقيم قدرة الخوارزمية على التنبؤ بترتيب المنظمات النسخية بناءً على مجموعات الجينات التي تنظمها. على سبيل المثال، عند تحليل الجينات المعبر عنها بشكل مختلف في تجربة حذف GATA6، يشير الترتيب الأعلى لـ GATA6 إلى أداء أفضل للخوارزمية. لإجراء تقييم شامل، قمنا بدمج 570 مجموعة بيانات من تجارب خفض/حذف TR من قاعدة بيانات KnockTF (الملاحظة التكميلية A. 1 والبيانات التكميلية 5). بعد إجراء مراقبة الجودة، والمعالجة، وتحليل التعبير التفاضلي، تم اختيار الجينات الأعلى ترتيبًا التي تم تنظيمها لأعلى ولأسفل من كل مجموعة بيانات RNA-seq كمدخلات لـ TRAPT. ثم تم تقييم الأداء من خلال تحليل ترتيب المنظمات النسخية المستهدفة.
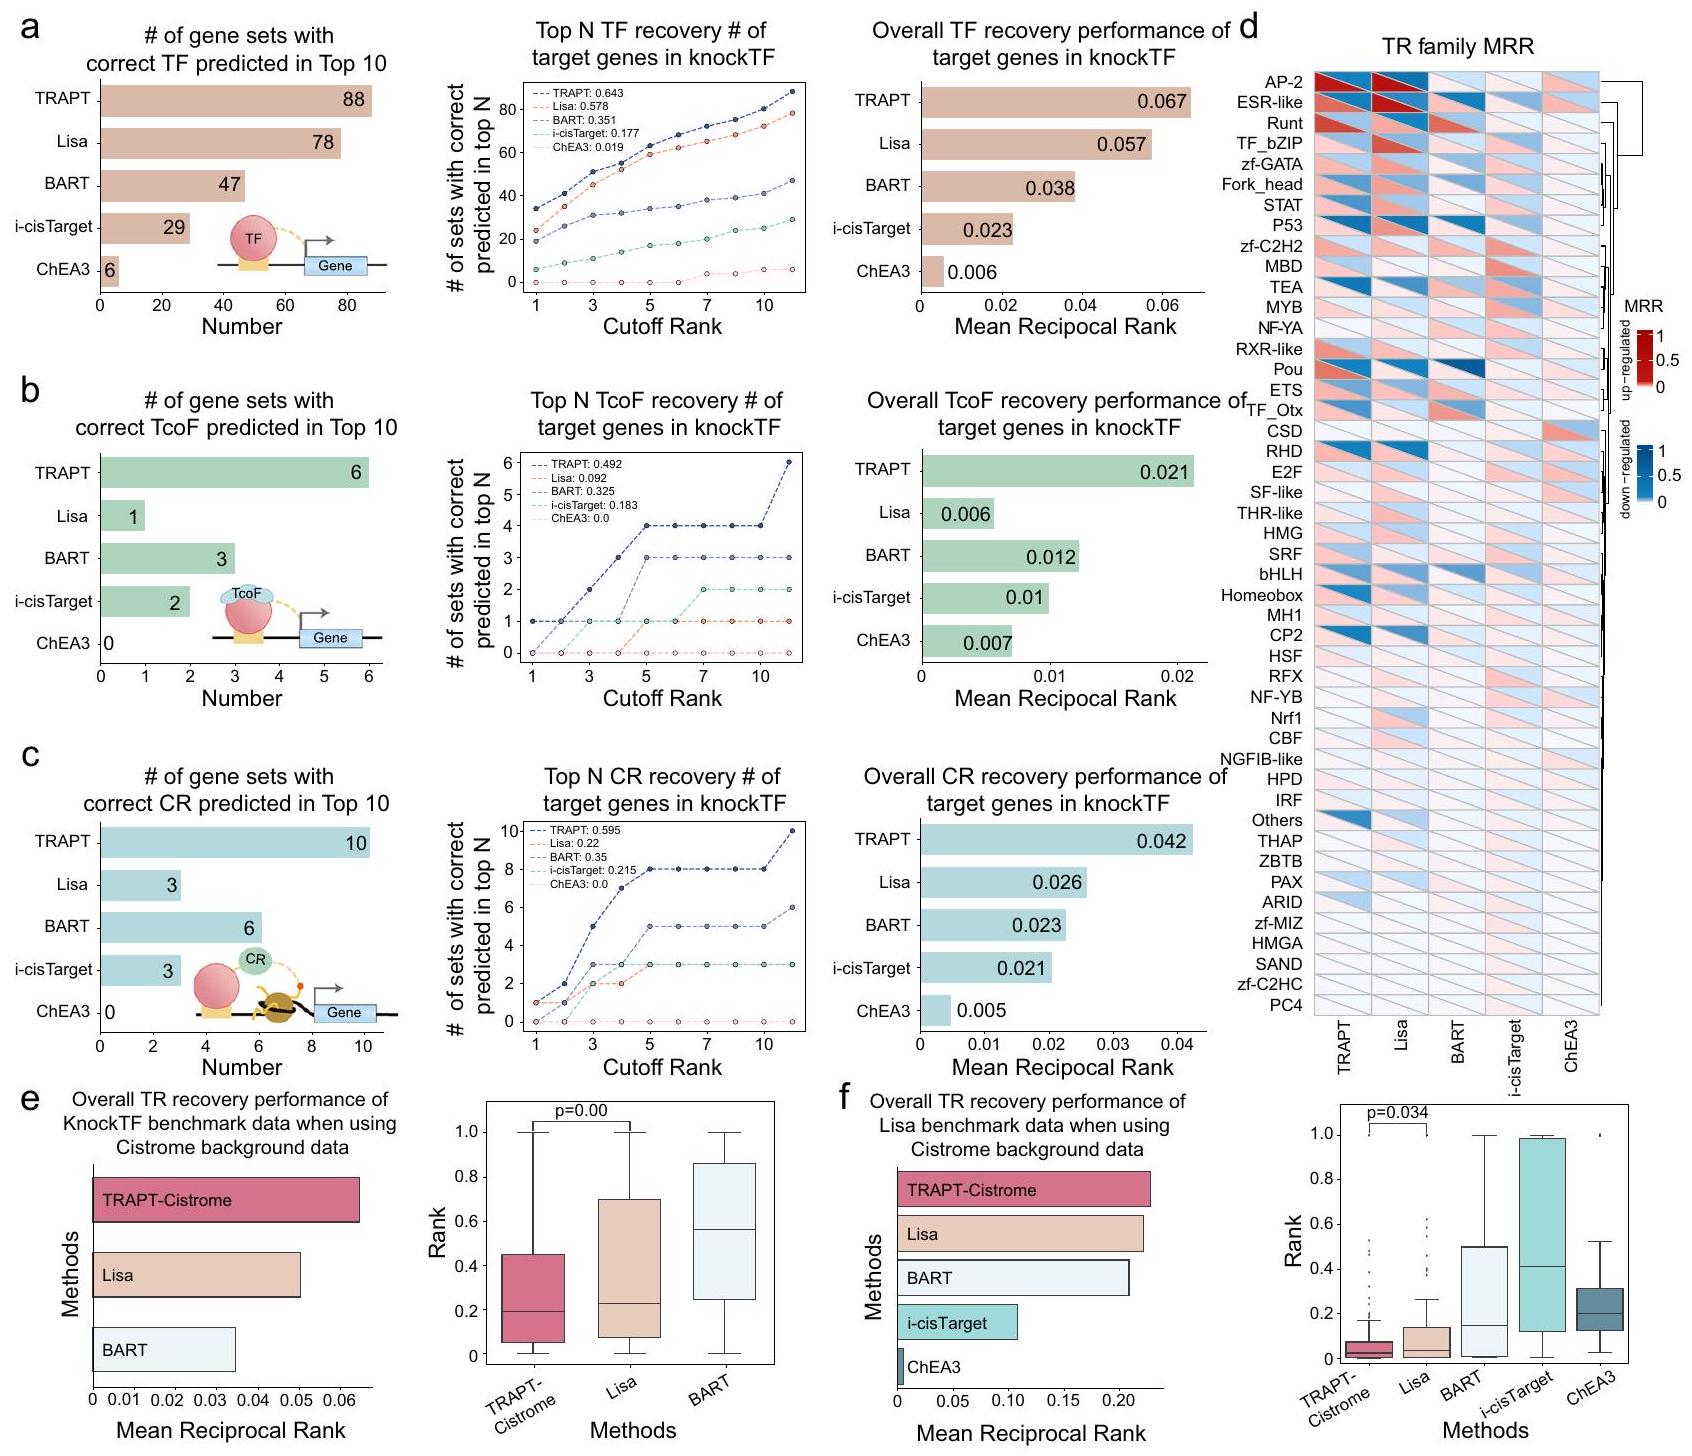
قمنا بمقارنة TRAPT مع عدة طرق تستخدم مجموعات الجينات كمدخلات، بما في ذلك ليزا، BART، وi-cisTarget، التي تستخدم بيانات TR-ChIP-seq كخلفية. علاوة على ذلك، قمنا بتقييم الطريقة التقليدية لتحليل الإثراء، ChEA3، التي تستخدم بشكل أساسي مجموعات الجينات المتعلقة بـ TR كخلفية (البيانات التكميلية 6). قمنا بتقييم شامل لأداء النماذج باستخدام معايير متنوعة، بما في ذلك أعداد أفضل 10 وأفضل N من TFs المستعادة، وأدائها العام من حيث استعادة TF. قدمت TRAPT نتائج كانت أفضل من تلك الخاصة بالطريقة الثانية الأفضل (أي، ليزا) من حيث عدد عوامل النسخ العشرة الأوائل المستعادة (الشكل 2أ). مقارنةً بطريقة i-cisTarget التقليدية، تحسنت أداؤها في التنبؤ بعوامل النسخ العشرة الأوائل بأكثر من 200%. علاوة على ذلك، كانت TRAPT متفوقة بشكل ملحوظ على الأساليب التقليدية للإثراء، مثل ChEA3، مما يبرز مزايا النماذج المعتمدة على ارتباط منظمات النسخ. بعد ذلك، قمنا بحساب عدد عوامل النسخ المتنبأ بها بشكل صحيح من الرتب القطعية من 1 إلى 10 عند عتبات مختلفة، وقيمنا أداء النماذج باستخدام AUC (الشكل 2أ). قدمت TRAPT بوضوح أفضل أداء تنبؤي (AUC، 0.643). بالإضافة إلى ذلك، كان متوسط الترتيب العكسي (MRR) أظهرت النتائج (الشكل 2أ) أن الأداء العام لـ TRAPT (MRR، 0.067) كان متفوقًا على أداء ليزا بـ (MRR، 0.057)، وإلى ذلك من BART بواسطة (MRR، 0.038). أظهرت هذه النتائج قدرة TRAPT المتفوقة على التنبؤ بعوامل النسخ.
بينما كانت الطرق السابقة تركز بشكل أساسي على التنبؤ بنشاط عوامل النسخ (TFs)، فإن الجمع المستهدف لبيانات ChIP-seq عالية الجودة لعوامل النسخ المستهدفة (TcoFs) والمنظمات الكروماتينية (CRs) في نهجنا (انظر قسم الطرق) مكن TRAPT من تقديم تنبؤ أكثر شمولاً بأنواع مختلفة من المنظمات النسخية (TRs). لإجراء مقارنة أعمق، قمنا بتقييم أداء الطرق عبر مجموعات TF وTcoF وCR. وجدنا أن TRAPT تفوق بشكل كبير على الطرق المتاحة حالياً في التنبؤ بعوامل النسخ المستهدفة والمنظمات الكروماتينية (الشكل 2ب، ج). لاحظنا تراجعاً كبيراً في أداء ليزا في التنبؤ بعوامل النسخ المستهدفة مقارنة بأدائها في التنبؤ بعوامل النسخ (حيث كانت الثانية الأفضل؛ الأشكال 2ب والبيانات التكميلية 8). وقد حدث ذلك على الأرجح لأن ليزا تحتوي على بيانات واسعة عن عوامل النسخ والمنظمات الكروماتينية، لكنها تفتقر إلى بيانات عوامل النسخ المستهدفة. علاوة على ذلك، كان أداء TRAPT في التنبؤ بالمنظمات الكروماتينية يتجاوز بكثير أداء ليزا (الشكل 2ج). وقد تم عزو مزاياها الكبيرة في التنبؤ بعوامل النسخ والمنظمات الكروماتينية وعوامل النسخ المستهدفة إلى استخدامها لاستراتيجية متعددة المراحل من الاندماج بالإضافة إلى مكتبتها الواسعة من المنظمات النسخية والخلفيات الإبيجينية.
لم يكن الأداء المتفوق لـ TRAPT ناتجًا فقط عن استخدامه لبيانات خلفية إضافية حول TRs. لتوضيح ذلك، قدمنا
الشكل 2 | تقييم TRAPT والطرق المتنافسة على مجموعات بيانات تقليل/إزالة TR وارتباط TF. أ (1) عدد TFs التي تم تحديدها بدقة بواسطة طرق مختلفة، حيث -المحور يمثل عدد عوامل النسخ المستهدفة المصنفة ضمن التوقعات لأفضل 10 بواسطة كل طريقة، و-المحور يمثل الطرق المختلفة المدروسة: TRAPT، ليزا، BART، i-cisTarget، وChEA3. (2) رسم بياني خطي يوضح التنبؤ الدقيق لعوامل النسخ في تجارب الخفض/الإزالة بواسطة نماذج حسابية مختلفة، حيث أن -المحور يمثل عدد عوامل النسخ المستهدفة المصنفة ضمن التوقعات لأعلى N بواسطة كل طريقة. الزاوية العليا اليسرى تظهر المساحة تحت المنحنى (AUC) لكل طريقة. (3) رسم بياني عمودي يظهر درجات MRR لعوامل النسخ، مع درجات أعلى تعكس أداءً متفوقًا. ب، ج الألواح اللاحقة تحافظ على تنسيقات الألواح (أ)، وتوسع التحليل ليشمل TcoFs و CRs لإظهار القدرة التنبؤية و دقة كل طريقة. د درجات MRR لعائلات البروتين من مجموعات بيانات تقليل/إزالة TR، مع الإشارة باللون الأحمر إلى المجموعة المرتفعة التعبير واللون الأزرق للدلالة على المجموعة المنخفضة التعبير. تشير شدة كل لون إلى حجم الدرجة. هـ تقييم أداء ثلاث طرق على جينات هدف TR من مجموعة بيانات معيار KnockTF ( )، من خلال استخدام مكتبة الخلفية TR المستمدة من Cistrome فقط.تقييم أداء خمس طرق على جينات الهدف TR من مجموعة بيانات معيار ليزا )، باستخدام مكتبة الخلفية TR المشتقة من Cistrome فقط. يوضح الرسم البياني الصندوقي الترتيبات المقاسة للـ TRs المستهدفة وفقًا لنماذج مختلفة. الخط الأوسط داخل كل صندوق يمثل الوسيط، بينما تمثل الحدود العليا والسفلى للصندوق الربع الثالث والربع الأول، على التوالي.-القيم يتم حسابها بواسطة اختبار T ذو الجانبين دون تعديلات.
تفوّق TRAPT على ليزا من خلال استخدام نفس بيانات الخلفية عن TRs من قاعدة بيانات Cistrome، واستخدم بيانات KnockTF كمعيار. تفوّق TRAPT على ليزا بـ و BART بواسطة من حيث الأداء العام، حتى عند استخدام نفس بيانات الخلفية (الشكل 2e). تم إجراء تحليلات تجريبية إضافية على استراتيجية TRAPT-Cistrome لتعزيز استنتاجاتنا. على وجه التحديد، قمنا بتقييم أداء TRAPT عبر ثلاث فئات: TF و CR و TcoF. تفوق TRAPT على ليزا بـ و BART بـ في تصنيف أفضل 10 من TFs بناءً على درجات AUC (الشكل التكميلي 2b). قمنا بتقييم الأداء العام لـ TRAPT لـ CR و TcoF، حيث تفوق على ليزا بـ و BART بـ على التوالي (الشكل التكميلي 2b). نحن
قمنا أيضًا بالتحقق من الطرق باستخدام مجموعة بيانات مرجعية ليزا ونفس بيانات الخلفية مثل الطرق المتنافسة. أظهرت النتائج أيضًا أن TRAPT قدم أفضل أداء (الشكل 2f).
بعد ذلك، استخدمنا الجينات المستهدفة المشتقة من التعبير التفاضلي وارتباط TFs، على التوالي، لاستكشاف أداء الطرق المختلفة عبر عائلات البروتينات المتنوعة. عند استخدام بيانات الجينات المستهدفة من TR knockout/knockdown و TR ChIP-seq، أظهرت النتائج اختلافات كبيرة لبعض عائلات البروتينات (الشكل 2d والشكل التكميلي 2a). على سبيل المثال، كان الأداء على مجموعات بيانات TR knockdown/knockout متفوقًا بشكل ملحوظ لعائلات CP2 و RXR مقارنةً بتلك الخاصة بمجموعات بيانات ارتباط TF، بينما لوحظت النتائج المعاكسة لـ
عائلات مثل zf-C2H2 و IRF و THR-like و CSD. من المحتمل أن يكون هذا الاختلاف ناتجًا عن تأثيرات نسخ ثانوية حدثت نتيجة للاضطرابات في TRs، والتي لم تكن مرتبطة مباشرة بـ TFs الأصلية . كما أشارت النتائج إلى إمكانية وجود تأثيرات كبيرة من التأثيرات الثانوية. أخيرًا، كانت هناك مشكلة محتملة قد تنشأ بسبب الكمية الكبيرة من بيانات TR وبيانات الإبيجينوم، وهي بطء سرعة الخوارزمية. قمنا بتقييم أوقات تشغيل أدوات TRAP و ليزا و BART لأخذ ذلك في الاعتبار (الشكل التكميلي 1d). تفوق TRAPT على خوارزميات ليزا و BART من حيث السرعة، خاصة في التنبؤ بنشاط TRs الفردية (الشكل التكميلي 1e).
استراتيجية الدمج متعددة المراحل تعزز التنبؤ بالمنظمين النسخيين
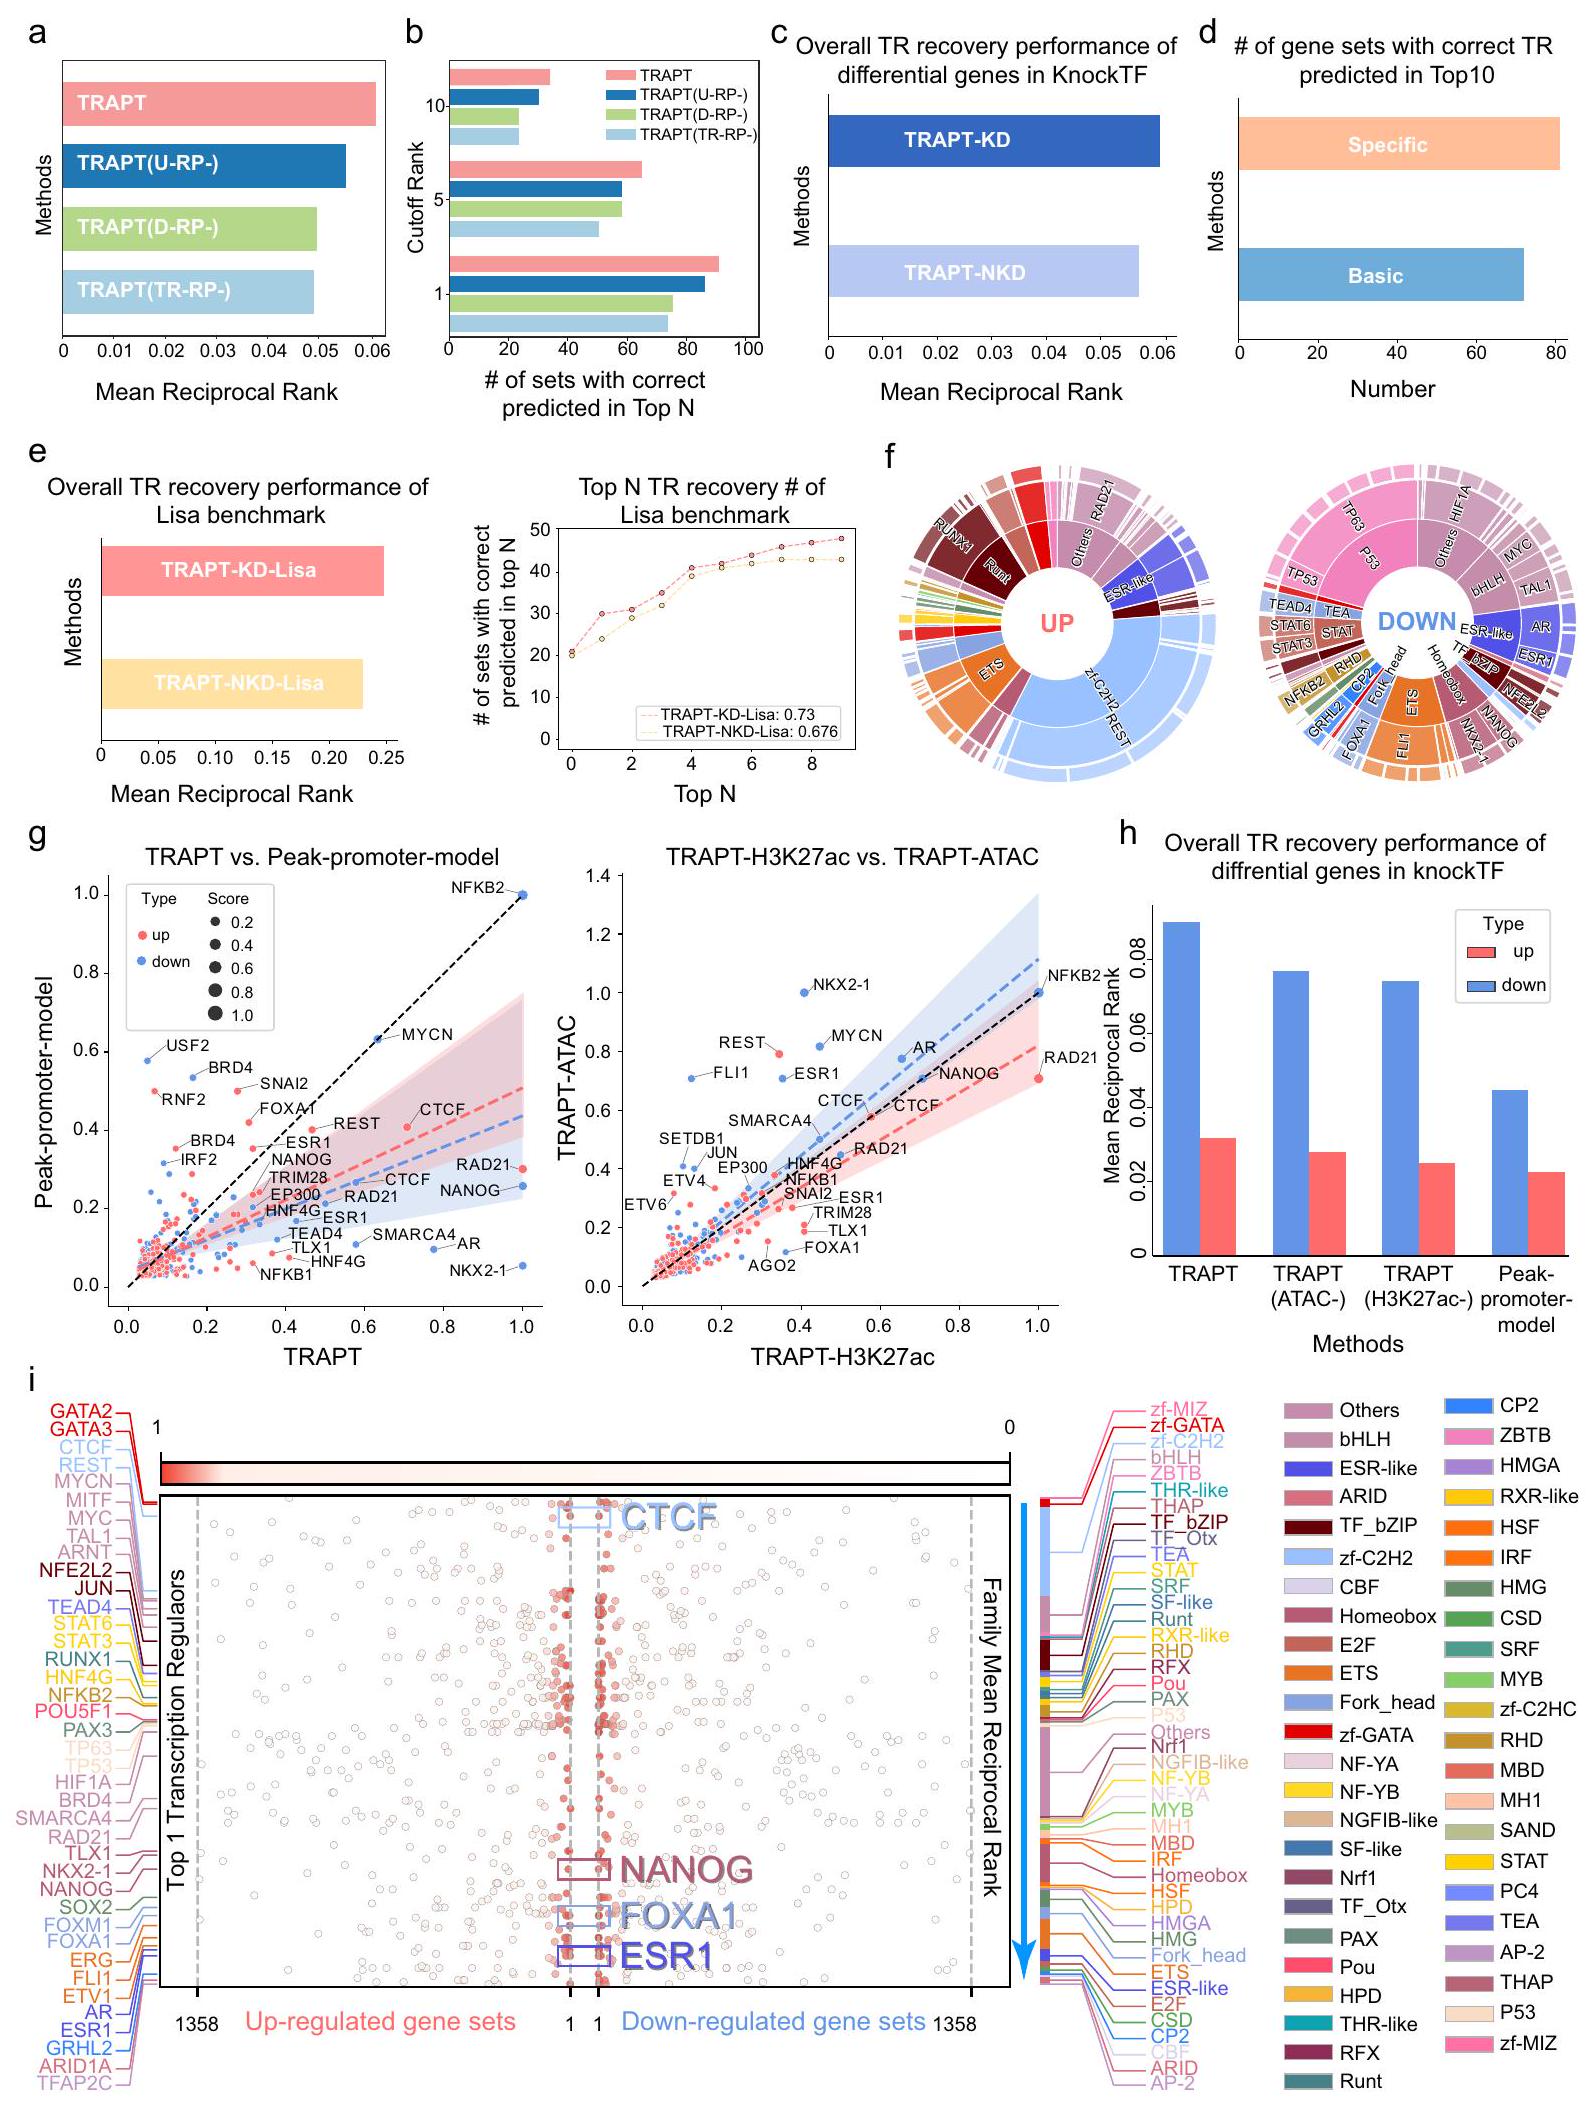
قمنا بإجراء اختبارات استئصال شاملة للتحقيق في الفوائد المحتملة لاستراتيجية قائمة على الدمج متعدد المراحل لتنبؤ TRs. نموذج U-RP محاكي الإمكانات التنظيمية لعناصر cisregulatory للجينات المستهدفة لالتقاط حالتها الإبيجينومية الخاصة بالسياق. عندما تمت إزالة نموذج U-RP من طريقتنا، كان هناك انخفاض كبير في الأداء العام للطريقة (الأشكال 3a و b والشكل التكميلي 3f). أظهر هذا أن نموذج U-RP يمثل بشكل معقول الحالة الإبيجينومية لمجموعة الجينات المدخلة. توقع نموذج D-RP الملف الإبيجينومي المقابل لـ TR، ويأخذ في الاعتبار تفضيل TR للجينوم تحت ظروف معينة. كانت طريقتنا فريدة من نوعها لأنها اعتبرت نشاط مواقع الارتباط على مستوى الجينوم المتعلقة بـ TR. من خلال دمج الإمكانات التنظيمية لـ TRs مع تلك العناصر التي ترتبط بها، قدمت طريقتنا نظرة شاملة خاصة بالسياق حول وظيفة TR. لاختبار فائدتها، قمنا بإزالة نموذج D-RP، ولاحظنا بعد ذلك انخفاضًا كبيرًا في الأداء العام للطريقة (الشكل 3a). أظهر هذا بشكل أكبر أن أخذ نشاط العناصر التنظيمية في الاعتبار في ارتباط TR كان فعالًا للغاية في تحسين الأداء التنبؤي. علاوة على ذلك، تمكنا من تمييز التفضيلات التنظيمية لكل TR من خلال حساب نسبة ارتباطه بالمُعزِزات البعيدة. وبالتالي، قمنا بتطوير نماذج إمكانات تنظيمية محددة لكل TR لوصف أنماطها التنظيمية (الملاحظة التكملية A.6). عند إزالة النموذج المحدد لـ TR من الإمكانات التنظيمية، انخفض الأداء العام للنموذج الأساسي للإمكانات التنظيمية مقارنةً بذلك للنموذج المحدد للإمكانات التنظيمية (الأشكال 3d والشكل التكميلي 2d).
يدمج TRAPT ميزات إبيجينومية متعددة للتنبؤ بالنشاط النهائي لـ TR. لفهم أعمق لقدرات كل وحدة إبيجينومية داخل TRAPT، قمنا بتقييم أدائها التنبؤي على TRs المستهدفة. أظهرت النتائج أن نماذج TRAPTH3K27ac و TRAPT-ATAC الإبيجينومية أظهرت قوة تنبؤية متفوقة لمجموعات البيانات المرتفعة والمنخفضة، على التوالي (الشكل 3g). علاوة على ذلك، لوحظ انخفاض كبير في الأداء العام عندما تمت إزالة جميع الوحدات الإبيجينومية، بحيث لم يتبق سوى نموذج الذروة في المحفز (الشكل 3g و h). علاوة على ذلك، انخفض الأداء العام للنموذج مع إزالة كل وحدة إبيجينومية تدريجيًا (الشكل 3h). تشير هذه النتائج إلى أن TRAPT دمج بفعالية ميزات من وحدات إبيجينومية مختلفة لتقديم أداء تنبؤي غير متحيز. في تجارب الاستئصال الإضافية، وجدنا أنه مقارنةً بالنتائج التي تم الحصول عليها بدون تقطير المعرفة (NKD)، أظهر النموذج الذي يستخدم تقطير المعرفة (KD) تحسينًا قدره على مجموعة بيانات KnockTF المرجعية (الشكل 3c) وتحسينًا قدره على مجموعة بيانات ليزا المرجعية (الشكل 3e). بالنسبة لمقاييس الأداء المحلية في التنبؤ بأفضل عشرة TRs، تفوقت مجموعة KD بشكل كبير على مجموعة NKD، مع درجة AUC تتجاوز تلك الخاصة بمجموعة NKD بمقدار 8 نقاط مئوية (الشكل 3e). من خلال تقسيم البيانات إلى مجموعات تدريب وتحقق لنماذج D-RP و U-RP، لوحظ انخفاض سريع في الخسائر على كلا المجموعتين (الشكل التكميلي 2c والشكل التكميلي 3a)، مع وبدون تقطير المعرفة. في الوقت نفسه، تقارب نموذج D-RP الطلابي بشكل أسرع مع تقطير المعرفة وحقق دقة نهائية أعلى
(الشكل التكميلي 3b). أظهرت هذه النتائج أن استخدام تقطير المعرفة لم يؤدي إلى زيادة في ملاءمة النموذج.
قمنا بإدخال مصفوفات TR-RP و Epi-RP لإنشاء شبكة أساسية من TRs والإبيجينومات باستخدام خوارزمية kNN. تم تصميم نموذج D-RP لتحسين الروابط بين TRs والإبيجينومات بناءً على الروابط الملاحظة، بينما يقوم أيضًا باستعادة الروابط المفقودة. وبالتالي، قمنا بتقييم نموذج D-RP بناءً على قدرته على التنبؤ بالروابط. تم تقسيم الروابط الملاحظة إلى مجموعات تدريب وتحقيق واختبار لمحاكاة الروابط المفقودة. من خلال تدريب النموذج على مجموعة التدريب ثم التحقق من استعادة الروابط المفقودة على مجموعة الاختبار، تم تقييم قدرة نموذج D-RP على استنتاج العلاقة بين TRs والإبيجينومات. لاحظنا أن الخسائر التي تكبدتها كل من الشبكات المعلمية والطلابية على مجموعة التحقق انخفضت بسرعة أثناء التدريب (الشكل التكميلي 3a)، وبلغت قيمها من المنطقة تحت منحنى التشغيل (auROC) ومنطقة تحت منحنى الدقة-الاسترجاع (auPRC) أخيرًا 0.81 و 0.84 على مجموعة الاختبار، على التوالي (الشكل التكميلي 3c). نظرًا لإمكانية وجود عدد كبير من الروابط السلبية الكاذبة في السيناريوهات التجريبية، قمنا بتغطية نسب متغيرة من الروابط لتقييم استقرار النموذج تحت ظروف مختلفة من البيانات المفقودة. أظهرت النتائج أنه مع زيادة عدد الحواف المغطاة (حتى حد أقصى من )، ظلت أداء النموذج المتعلق بالاسترداد قويًا، حيث تجاوزت قيمة auPRC 0.82 وتجاوز متوسط الدقة (AP) 0.8 (الشكل التوضيحي التكميلي 3e). وبالتالي، كان تأثير النموذج المتعلق بالاسترداد مرضيًا، وعكس استقرار نموذج D-RP في حالة وجود اضطرابات مفقودة. بعد ذلك، اختبرنا أداء نموذج U-RP. تم تصميمه للتنبؤ بالملفات التنظيمية الجينية بناءً على مجموعات الجينات المستفسر عنها ومصفوفة Epi-RP. لاحظنا انخفاضًا سريعًا في خسارة نموذج U-RP على كل من مجموعات التدريب والتحقق، بغض النظر عما إذا تم استخدام تقنيات استخراج المعرفة (الشكل التوضيحي التكميلي 2c والشكل التوضيحي التكميلي 3a). التحدي الرئيسي لنموذج U-RP هو اختيار عينات جينية مهمة من بيانات زائدة، حيث من المتوقع أن تمثل أفضل حالة جينية للإعداد الحالي المعتمد على السياق. لمعالجة هذا التحدي، قمنا بحساب أداء النموذج تحت سيناريوهات مختلفة لاختيار العينات. لاحظنا أن معدل التحسن في أدائه انخفض بشكل كبير عندما تم اختيار 10 ميزات. تتماشى هذه النتيجة مع استنتاجات الأبحاث السابقة. (الشكل التوضيحي التكميلي 3g).
أخيرًا، قمنا بمقارنة أداء TRAPT على مجموعات الجينات المرتفعة والمنخفضة التنظيم، ووجدنا أن توقعاته كانت أفضل لمجموعات الجينات المنخفضة التنظيم مقارنة بالمجموعات المرتفعة التنظيم (الشكل 3f). هذه النتيجة أثبتت بشكل غير مباشر أن المنشطات النسخية كانت أكثر شيوعًا من مثبطات النسخ. (الشكل التوضيحي التكميلي 3g). وجدنا أيضًا أن معظم عوامل النسخ إما تعمل كم Activators نسخ أو مثبطات، مع وجود عدد قليل، مثل CTCF و NANOG و FOXA1 و ESR1، التي لها وظائف مزدوجة (الشكل 3i). في الختام، تنبأت TRAPT بدقة بعوامل النسخ المفعلة والمثبطة والوظائف المزدوجة.
تتنبأ TRAPT بالعوامل التنظيمية الرئيسية للتعبير الجيني في دراسة تقليل ESR1
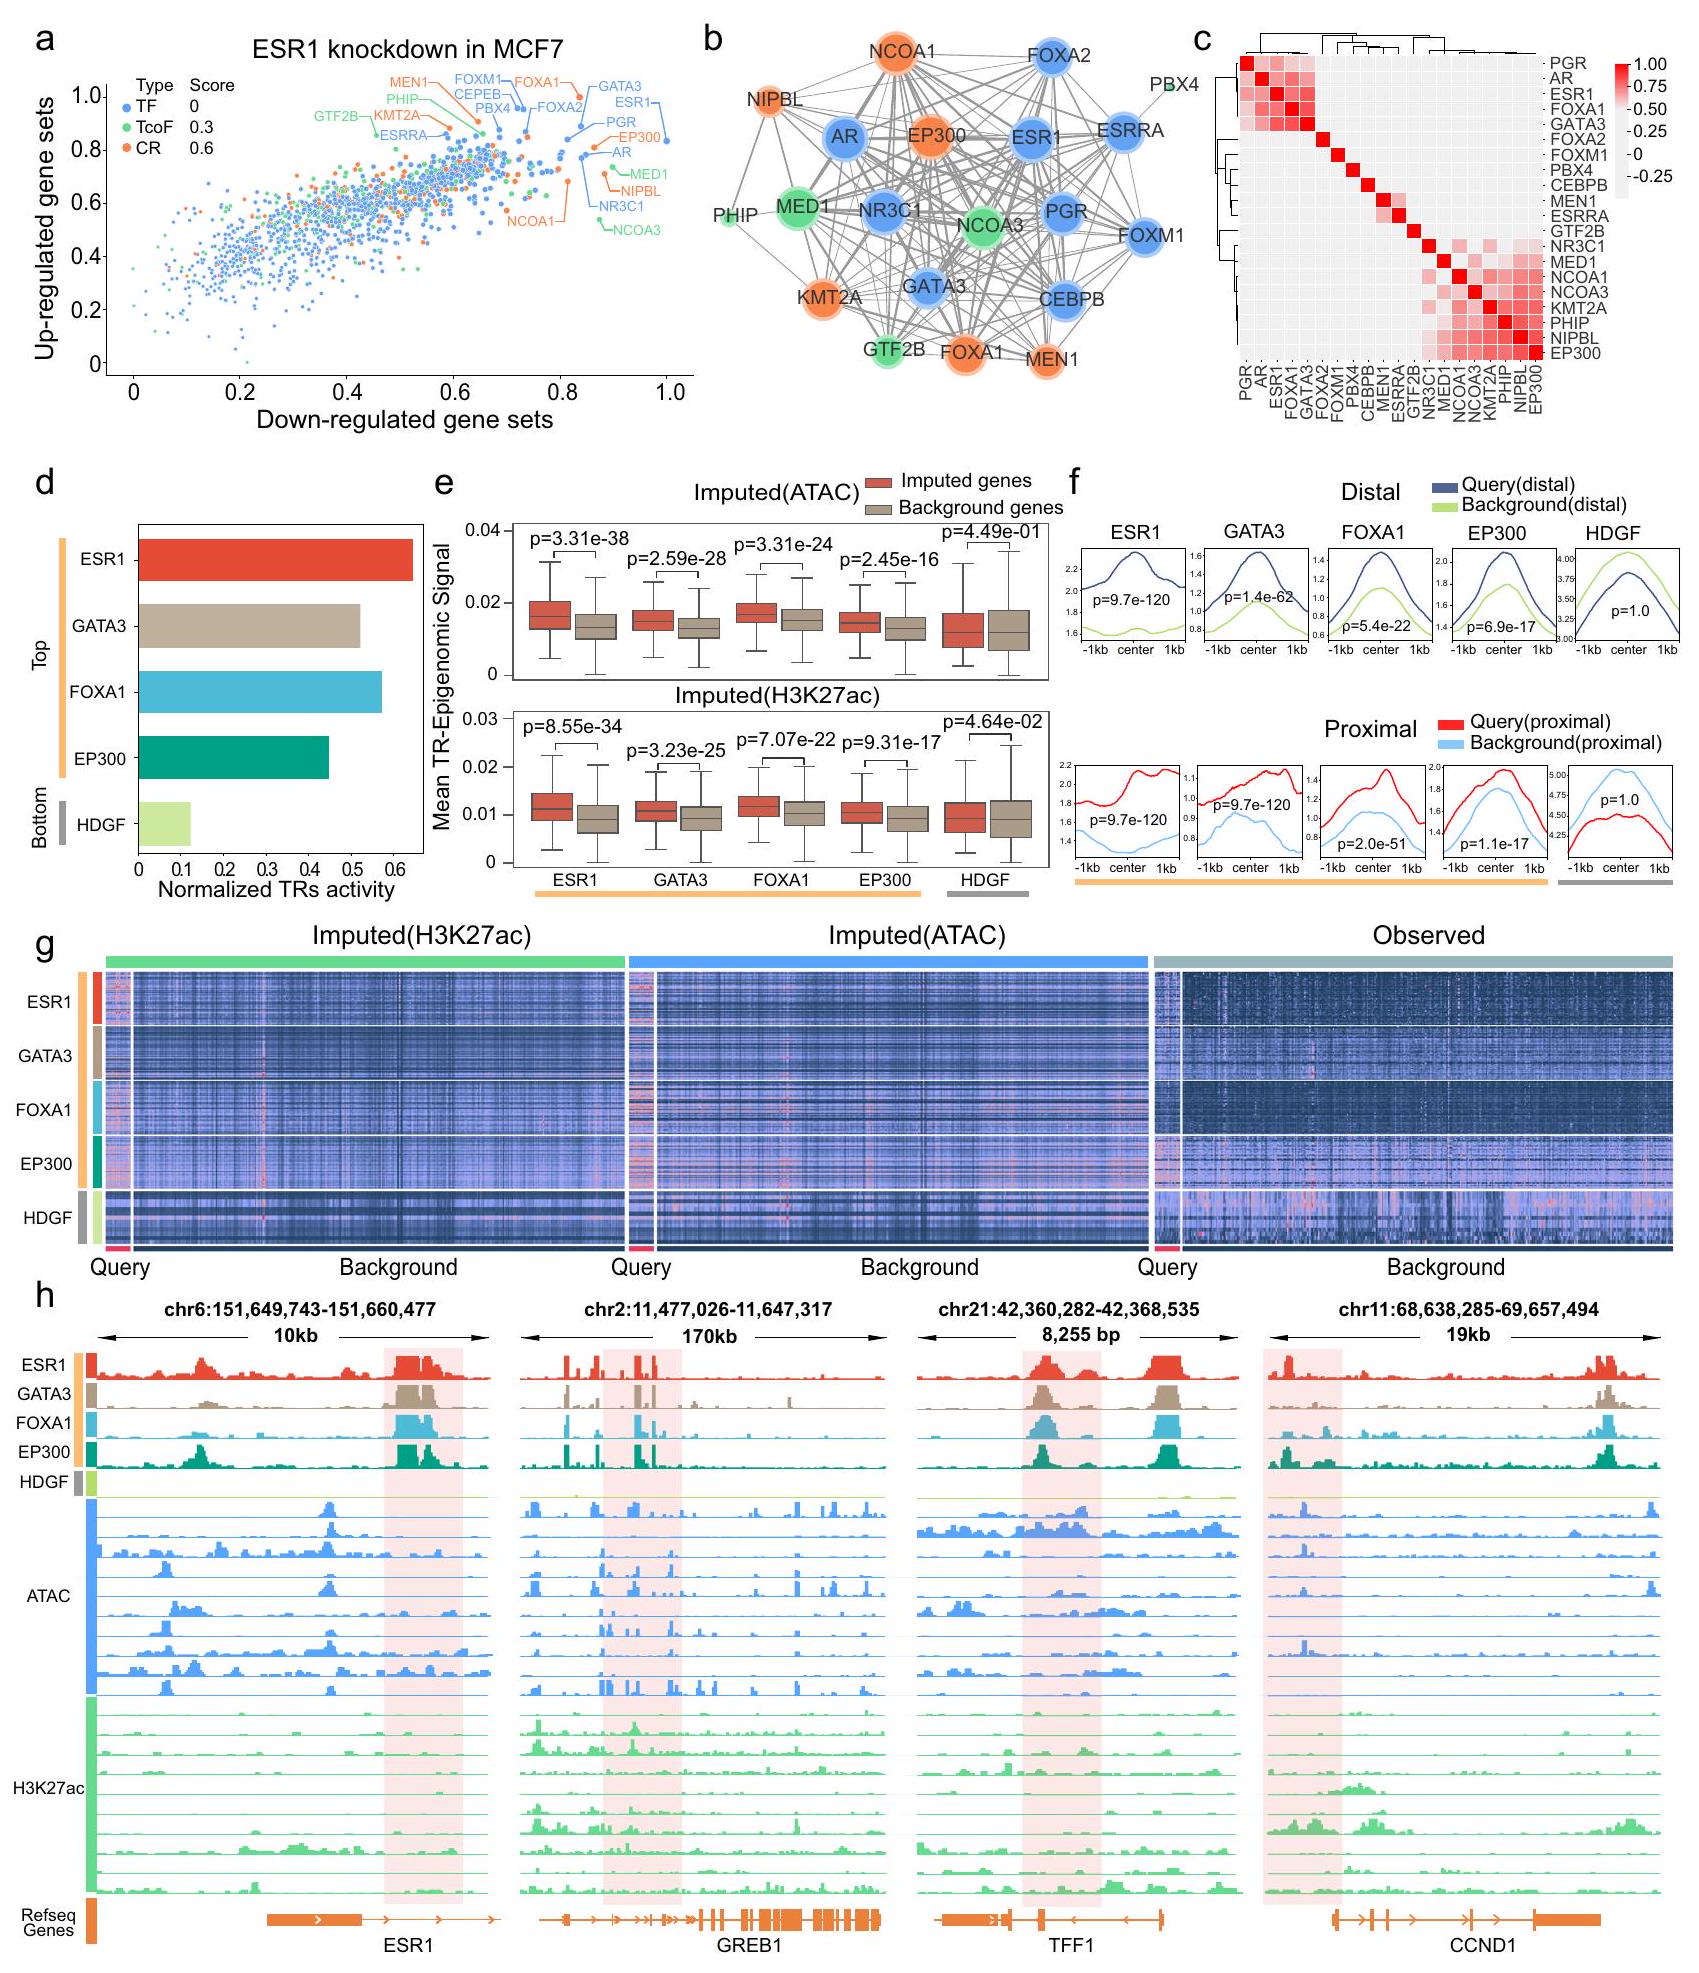
ESR1 هو عامل نسخي رئيسي مرتبط بالنمط الفرعي الإيجابي لمستقبلات هرمون الاستروجين في سرطان الثدي، ويؤثر بشكل كبير على تطوره وتقدمه من خلال التوسط في التعبير الشاذ للعديد من الجينات المرتبطة بالمخاطر. للتحقق من قدرة TRAPT على تحديد عوامل النسخ الرئيسية في المرض، قمنا بتطبيقه على مجموعة جينية مستمدة من خلايا سرطان الثدي MCF7 الإيجابية لمستقبلات هرمون الاستروجين التي خضعت لتقليل ESR1 بواسطة siRNA. عند إعطائها مجموعة الجينات التفاضلية قبل وبعد تقليل ESR1 (الشكل التوضيحي التكميلي 4a، الملاحظة التكميلية A. 2 والبيانات التكميلية 9)، توقع TRAPT بدقة أن يكون عامل النسخ ESR1 في المرتبة 1 في مجموعة الجينات المنخفضة التعبير وفي المرتبة 17 في مجموعة الجينات المرتفعة التعبير (الشكل 4a). تسلط هذه النتيجة الضوء على الدور المزدوج لـ ESR1 في تنشيط وكبح الجينات في سرطان الثدي.. علاوة على ذلك، حددت TRAPT ESR1 الأخرى ذات التصنيف الأعلى مرتبط بعوامل النسخ المتعلقة بالسرطان، وعوامل النسخ المساعدة، ومنظمات الكروماتين مثل FOXA1 و EP300 و MED1 (الأشكال 4d والشكل التكميلي 4b). على سبيل المثال، GATA3 هو عامل نسخ حاسم في مصير خلايا الثدي اللمعية.يؤثر عامل الريادة FOXA1 على بداية وتقدم سرطان الثدي من خلال تعديل الوصول الجينوميالأسيتيل ترانسفيراز الهيستون EP300 يقوم بأسيتيل ESR1، مما يعزز تعبير ESR1 الجينات المستهدفة في خلايا سرطان الثدي. علاوة على ذلك، فإن أعلى تصنيف من TRs من STRING كانت قواعد البيانات متورطة في تفاعلات عالية التردد مع بعضها البعض (الشكل 4ب). تحليل التعبير المشترك لـ TCGAكشفت مجموعة بيانات سرطان الثدي أيضًا عن علاقة قوية بين TRs (الأشكال 4c، الملاحظة التكميلية A. 3 والبيانات التكميلية 10)، وخاصة GATA3 وFOXA1 وESR1. كما اكتشفنا نفس الظاهرة في تحليل عينات أنسجة الثدي من GTEx.
الشكل 3 | تقييم أداء TRAPT في تجارب تقليل/إزالة TR على مجموعات الجينات المختلفة من قاعدة بيانات KnockTF. أ يمثل الرسم البياني العمودي درجات MRR للنموذج بعد إزالة كل وحدة. تعكس الدرجات الأعلى أداءً أفضل. ب يظهر الرسم البياني العمودي المجموعات أعلى خمسة وعشرة TRs التي تم التنبؤ بها بشكل صحيح. قمنا بإزالة UREA وD-RP ونموذج TR-RP المحدد بشكل تدريجي لتقييم تأثير كل وحدة على أداء النموذج. ج يمثل الرسم البياني العمودي درجات MRR لـ TRAPT، حيث تشير “TRAPT-KD” إلى استخدام تقنيات استخراج المعرفة و”NKD” تشير إلى النموذج بدون استخراج المعرفة. د عدد TRs المستهدفة التي تم تحديدها بدقة بين أعلى 10 باستخدام النماذج التنظيمية المحددة والأساسية. هـ تقييم أداء نموذج KD-TRAPT ونموذج NKDTRAPT باستخدام بيانات معيارية من ليزا. و رسم بياني شمساني يعرض درجات MRR لجميع TRs في مجموعات الجينات المرتفعة والمنخفضة. يتم تمييز TR الأعلى تصنيفًا.مخطط التشتت، حيث تمثل أحجام النقاط درجات MRR المعيارية للأهداف TRs. الجانب الأيمن يعرض MRR المعياري. درجات المجموعات المعززة والمخفضة في نموذج TRAPT-H3K27ac الإبيجيني ونموذج TRAPT-ATAC الإبيجيني. الجانب الأيسر من الرسم البياني يظهر درجات MRR المعدلة لنموذج TRAPT جنبًا إلى جنب مع القمم في نموذج المحفز للمجموعات المعززة والمخفضة. الخطوط المنقطة الحمراء والزرقاء تت correspond إلى المجموعات المعززة والمخفضة، على التوالي. الخط المنقط الرمادي يشير إلى مرجع الأساس، بينما النقاط التي تتداخل مع الخطوط تمثل أداءً متسقًا بين الطريقتين. h الرسم البياني العمودي الذي يمثل درجات MRR للنموذج بعد إزالة كل ميزة إبيجينية. الشريط الأخير يمثل نموذج القمة في المحفز بعد إزالة جميع الوحدات الإبيجينية من TRAPT. i الرسم البياني النقطي الذي يوضح الترتيب المتوقع لمواقع النسخ. الجانب الأيسر يمثل مجموعات الجينات المعززة بينما الجانب الأيمن يمثل مجموعات الجينات المخفضة. كانت CTCF وNANOG وFOXA1 وESR1 تحتل مراتب عالية في كل من مجموعات الجينات المعززة والمخفضة، مما يشير إلى وظائفها المحتملة المزدوجة كم Activators وRepressors للنسخ. (الشكل التوضيحي الإضافي 4c والملاحظة الإضافية A.3). بشكل عام، نجح TRAPT في تحديد ESR1 وعوامل النسخ المرتبطة بها ومنظمات الكروماتين، بالإضافة إلى التفاعلات المحتملة بين هذه البروتينات وأنماط ارتباطها الجينومية، للتحقق من فعالية TRAPT.
تعكس درجة D-RP الحالة الوراثية للـ TR. قمنا بدمجها مع الإمكانات التنظيمية للـ TR لتمثيل نشاطه بشكل أفضل. نظريًا، يجب أن تكون التمثيلات الخاصة بالـ TR التي تتضمن معلومات وراثية قادرة على التمييز بوضوح بين الجينات التي تنظمها. للتحقق من ذلك، قمنا بتصنيف درجات D-RP للـ TRs المحددة إلى الجينات المستفسر عنها ومجموعة الجينات الخلفية. كانت الـ TRs الأعلى تصنيفًا، بما في ذلك عامل النسخ ESR1 بالإضافة إلى العوامل المساعدة المرتبطة به ومنظمي الكروماتين، تسجل درجات أعلى بشكل ملحوظ على مجموعة الجينات المستفسر عنها مقارنة بمجموعة الجينات الخلفية. كان ESR1 الأكثر أهمية بين الـ TRs في كل من سياقات ATAC و H3K27ac (ATAC: H3K27ac: )، مما يشير إلى أن TRAPT قد التقط بفعالية المعلومات الوراثية غير المشفرة لـ ESR1 في السرطان. علاوة على ذلك، انخفضت أهمية TRs الأخرى ذات الترتيب الأعلى مع انخفاض الترتيب، بما في ذلك NCOA3 و NIPBL و FOXA1 (الأشكال 4e والشكل التكميلي 4d). ومن الجدير بالذكر أن HDGF كان في أسفل الترتيبات التنبؤية، مع أهمية أقل بكثير مقارنةً بـ TRs الأخرى (ATAC: -قيمةH3K27ac: -قيمةأظهرت هذه النتائج أن درجات D-RP لـ TRs يمكن استخدامها لتمييز بدقة بين الجينات التي تنظمها. وللمزيد من التحقق من القدرة التنبؤية لدرجات I-RP المستنتجة، قمنا بإنشاء ملفات تعريف النشاط لكل من TRs المستنتجة وغير المستنتجة. لاحظنا أن TRs ذات الترتيب الأعلى والتي تحمل درجات I-RP عالية أعطت إشارات أقوى لمجموعات الجينات المستفسر عنها (الشكل 4g).
ESR1 قادر على الارتباط بعناصر التعزيز التي تنظم الجينات المستهدفة البعيدة، مثل المعززات الفائقة المحتلة بواسطة ERα (ERSEs).“، وتستفيد TRAPT من المعلومات البعيدة من خلال نماذج متخصصة للإمكانات التنظيمية. للتحقيق بشكل أكبر والتنبؤ بخصائص الارتباط الجينومي لمستقبلات TR، قمنا بتصنيف المعززات القريبة من الجينات المستهدفة إلى معززات بعيدة وقريبة، ورسمنا ملف المعزز لكل TR متوقع. كانت TRs المتوقعة المرتبطة بالمناطق العليا مرتبطة بشكل أكبر في مناطق المعززات القريبة من الجينات المستهدفة مقارنة بمناطق المعززات الخلفية (الشكل 4f). على العكس، كانت HDGF المتوقعة المرتبطة بالمناطق السفلية مرتبطة بشكل أقل في مناطق المعززات القريبة من الجينات المستهدفة مقارنة بمناطق المعززات الخلفية. أظهر تحليلنا تفضيلًا قويًا لـ GATA3 (القريب)-قيمةبعيد-قيمة ) و FOXA1 (القريب-قيمةبعيد-قيمة ) لربطها بشكل قريب من الجينات، بينما لم يظهر ESR1 و EP300 تفضيلًا مشابهًا. أخيرًا، قمنا بتصوير المسارات بالقرب من عدة جينات معبر عنها بشكل مختلف ومنخفضة التعبير بشكل ملحوظ لـ ESR1 و GATA3 و FOXA1 و EP300 و HDGF (الشكل 4h). أظهرت جميع عوامل النسخ المتوقعة في الأعلى أنماطًا بارزة من الربط بالقرب من الجينات، وأبرزت مسارات أفضل 10 عينات جينية متوقعة غنىً كبيرًا في العناصر التنظيمية بالقرب من مواقع ربط ESR1.
علاوة على ذلك، كانت هناك أنماط مشابهة من الارتباط الجينومي في أفضل عوامل النسخ المتوقعة، بينما لم يكن هناك أي نمط واضح في HDGF، الذي تم التنبؤ بأنه في الأسفل (الشكل 4f). هذه النتائج عززت بشكل أكبر موثوقية TRAPT في التنبؤ بعوامل النسخ بالإضافة إلى العوامل المساعدة المرتبطة بها ومنظمات الكروماتين.
تتنبأ TRAPT بالعوامل التنظيمية الوظيفية للتعبير الجيني في تحليل ما بعد GWAS لمرض الزهايمر
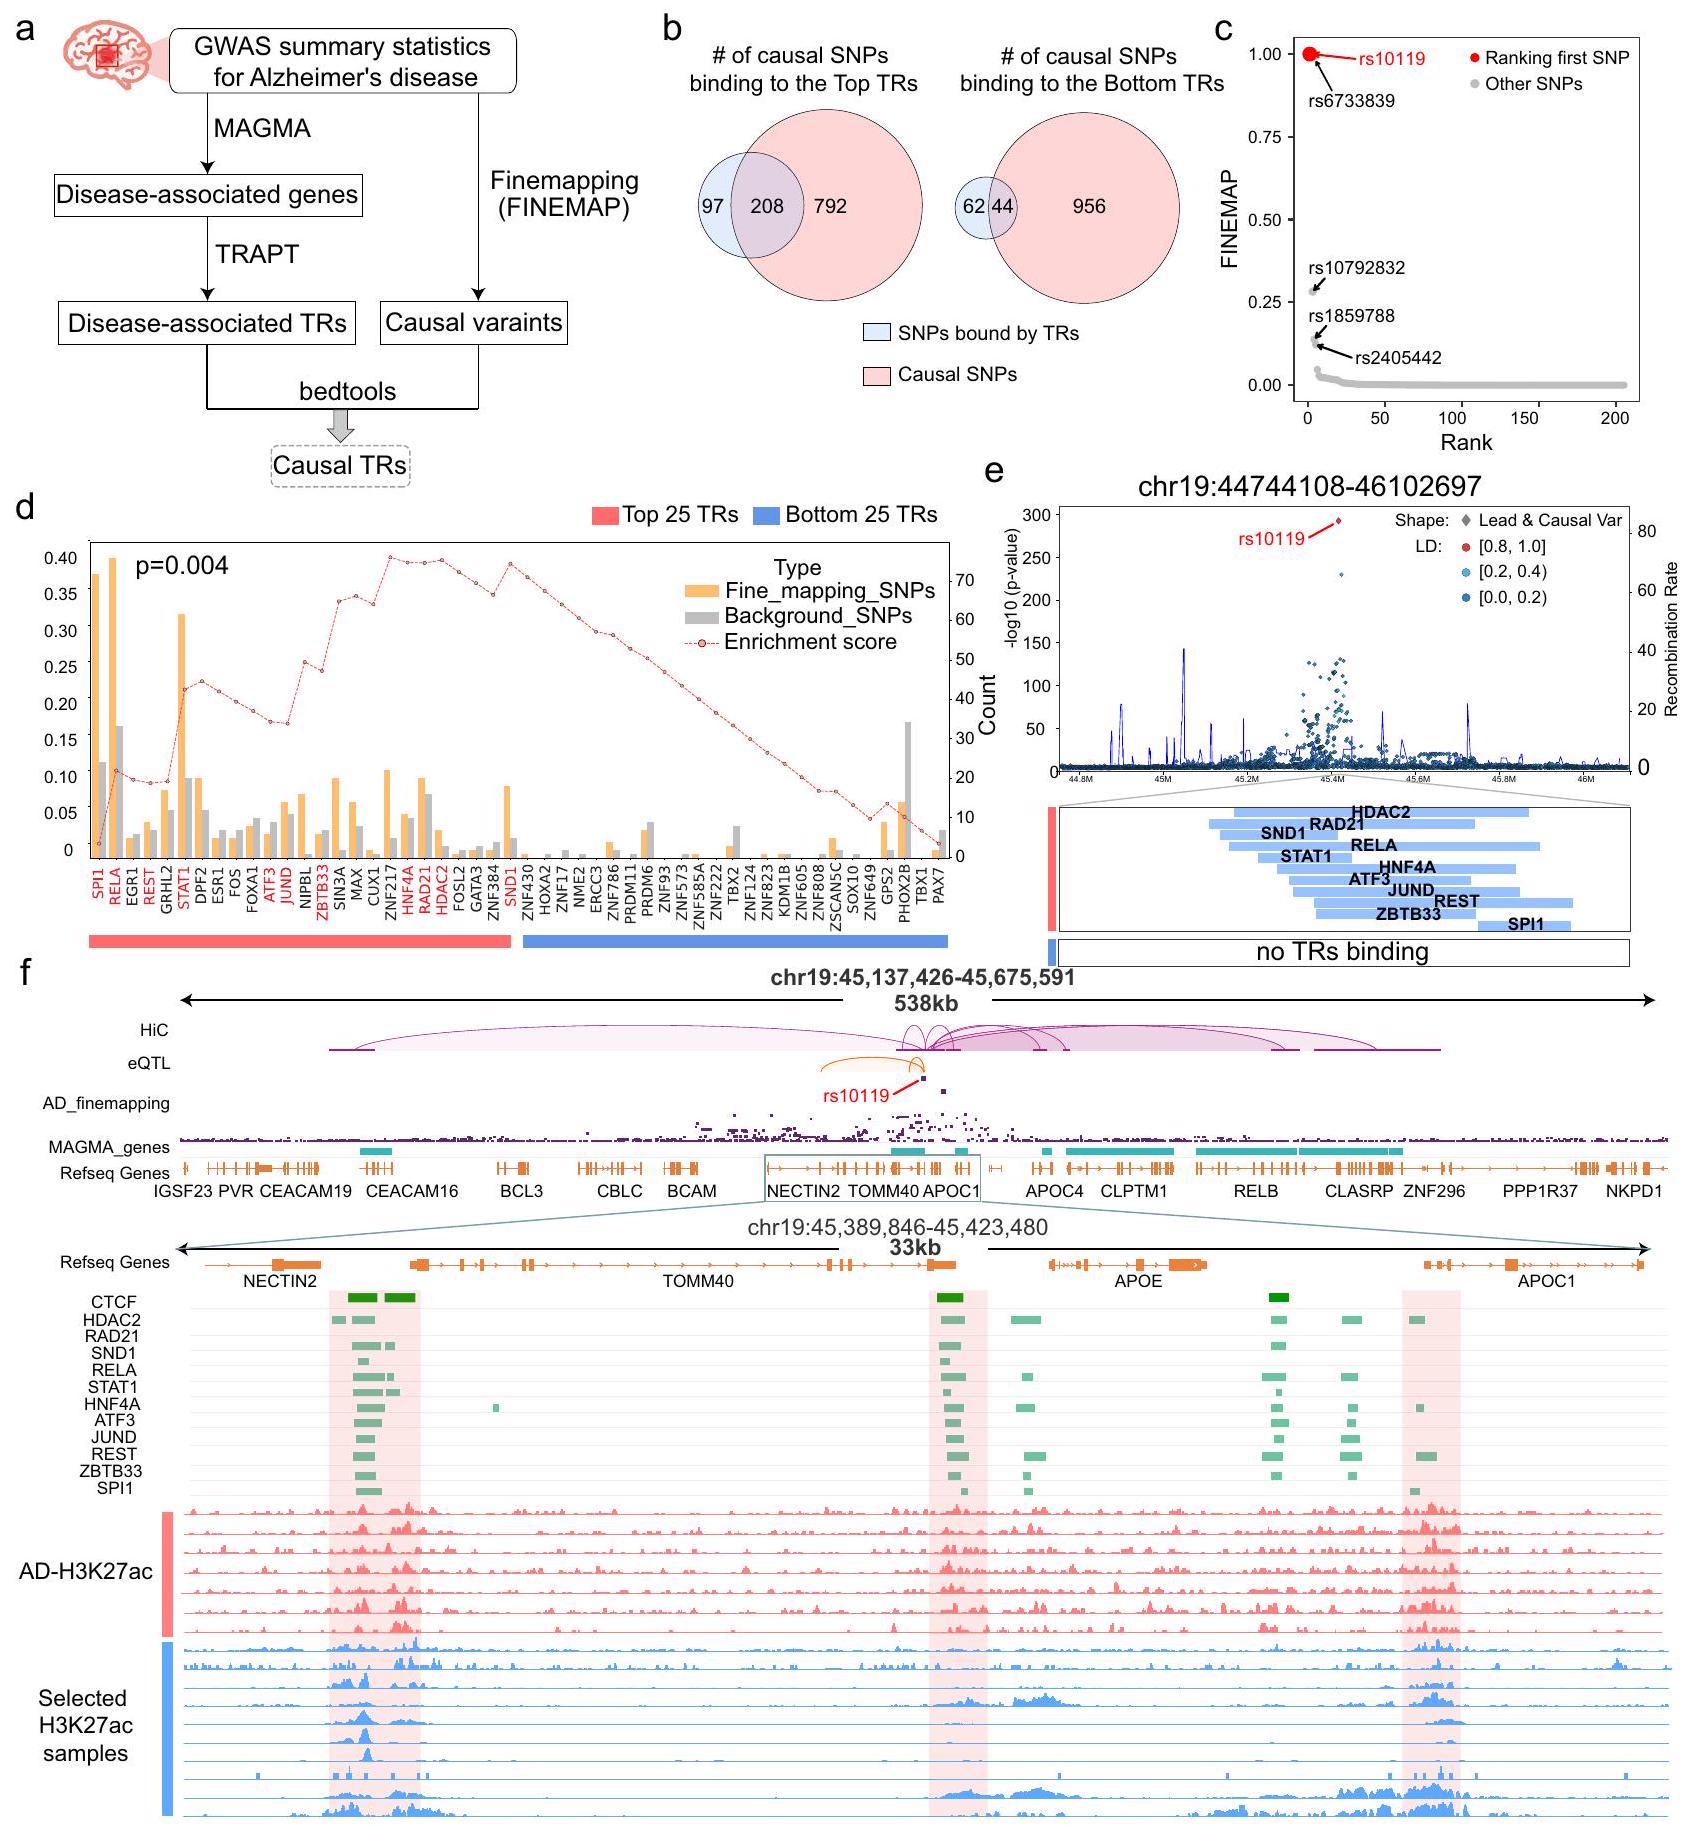
يمكن أن تؤدي التغيرات الجينية في مواقع محددة من الحمض النووي داخل مواقع ارتباط عوامل النسخ (TFs) إلى تغيير affinity الارتباط الخاصة بها، مما يؤثر على تعبير الجينات والعمليات الخلوية. في ضوء ذلك، قمنا بتطبيق TRAPT على حالات مرض الزهايمر (AD) بهدف تحديد عوامل النسخ الرئيسية المتأثرة بالمتغيرات السببية. لهذا الغرض، استخدمنا مجموعات الجينات المرتبطة بمرض الزهايمر كما تم التنبؤ بها بواسطة MAGMA.أداة مصممة لاستنتاج مجموعات جينات الأمراض من إحصائيات ملخص GWAS كمدخلات لخوارزميتنا (البيانات التكميلية 11). ثم أجرينا تحليل ارتباط للـ TRs المرتبطة بالمرض التي تم التنبؤ بها بواسطة TRAPT، مع المتغيرات السببية المهمة التي تم اكتشافها من خلال التحليل الدقيق استنادًا إلى GWAS (الشكل 5a). إن دمج بيانات GWAS مع تنبؤات TRAPT مكننا من إثبات قدرته على تحديد TRs الرئيسية المتأثرة بالمتغيرات السببية.
على وجه التحديد، استرجعنا مجموعة بيانات GWAS من causaldbيتكون من عينة من السكان الأوروبيين، كمدخل للتخطيط الدقيق. بعد ذلك، قمنا بإجراء تحليل التداخل على TRs المرتبطة بالمرض والمتغيرات المسببة المتوقعة (الأشكال 5a، الملاحظة التكميلية A. 4 والبيانات التكميلية 3). من بين 305 SNPs المرتبطة بأعلى 25 TRs المتوقعة من TRAPT،تنتمي إلى المتغيرات السببية المرتبطة بمرض الزهايمر (اختبار هايبرجومتري)-قيمة ). وعلى العكس، من بين 106 SNPs المرتبطة بأدنى 25 TRs، كان أقل من نصفها متغيرات سببية (اختبار هايبرجومتري-قيمة ) (الشكل 5ب). وهذا يشير إلى أن TRAPT’s TRs الأعلى تصنيفًا كانت مرتبطة بشكل أوثق بمرض الزهايمر. للتحقيق بشكل أعمق في العلاقة بين TRs الفردية ومرض الزهايمر، أجرينا تحليلًا أكثر تفصيلًا للتداخل بين ارتباط كل TR متعلق بمرض الزهايمر والمتغيرات السببية (الشكل 5ج). كشفت النتائج أن TRs الأعلى تصنيفًا، مثل SPI1 و RELA و REST، كانت عمومًا لديها affinity أعلى للارتباط بالمتغيرات السببية مقارنة بالمتغيرات الخلفية. على سبيل المثال، SPI1، الذي احتل المرتبة الأولى وفقًا للتوقعات التي قدمها TRAPT، تداخل مع 71 متغيرًا سببيًا و 24 متغيرًا خلفيًا فقط (اختبار هايبرجومتري-قيمة ). RELA، الذي احتل المرتبة الثانية حسب TRAPT، تقاطع مع 75 متغيرًا سببيًا و33 متغيرًا خلفيًا فقط (اختبار هايبرجومتري-قيمة“; البيانات التكميلية 2). لاحظنا أن أعلى تصنيف من TRs عمومًا أظهر ارتباطات أقوى مع المتغيرات السببية المتعلقة بمرض الزهايمر. لتقييم هذه الملاحظة، قمنا بتطوير اختبار إحصائي يعتمد على GSEAخوارزمية للتحقق من موثوقية TRs الأعلى تصنيفًا من منظور إحصائي (انظر قسم الطرق). وجدنا أن TRs الأعلى تصنيفًا كانت غنية بشكل ملحوظ (الشكل 5d؛-قيمة )، مما يدل على أن العناصر التنظيمية التي تم تصنيفها أعلى كانت أكثر احتمالاً للارتباط بالمتغيرات السببية مقارنة بتلك التي تم تصنيفها أدنى.
لتحديد المتغيرات السببية المرتبطة بالمرض المرتبطة بـ TRs التي تم التنبؤ بها بواسطة TRAPT واستكشاف ارتباطاتها المحتملة، قمنا بعد ذلك بتحليل التداخل بين المتغيرات السببية ومواقع الربط المتوقعة لـ TRs. احتفظنا بالمتغيرات السببية المتداخلة وقمنا بترتيبها بناءً على FINEMAP. الدرجات. من بين 1,000 متغير سببي تم اختياره، كان 208 مرتبطين بربط TR، حيث احتل rs10119 المرتبة الأولى كأفضل متغير (الشكل 5c). تحليل التوصيف الوظيفي باستخدام VARAdb كشفت أن rs10119 كان منظماً بواسطة عدة سوبر-معززات تغطي العديد من الجينات المهمة القريبة، بما في ذلك APOE و TOMM40 و APOC1، وكان SNP مرتبطاً بالمخاطر لمرض الزهايمر. بعد ذلك، قمنا بتحليل التوطن المشترك بين rs10119 و تم التنبؤ بـ TRs. ومن الجدير بالذكر أننا لاحظنا ارتباطًا في تسعة من أعلى 25 TR في منطقة 1 كيلوبايت upstream و downstream من rs10119، بينما لم تظهر TRs ذات الترتيب الأدنى أي ارتباط في هذه المناطق (الشكل 5e). وقد درست دراسة سابقة تأثير REST، وهو عامل نسخي، كميزة عالمية للشيخوخة الطبيعية في الخلايا العصبية القشرية والهيبوكامبية البشرية. كما يمكنه أيضًا حماية الخلايا العصبية من الإجهاد التأكسدي والأميلويد.-سمية البروتين. لاحظنا أن REST احتل مرتبة عالية في توقعات TRAPT، وقد أظهرت الدراسات السابقة دوره الحاسم في تطور مرض الزهايمر. إنه يثبط الجينات التي تعزز موت الخلايا ومرض الزهايمر، بينما يحفز التعبير عن الجينات المرتبطة باستجابة الإجهاد.. تم تحديد TRAPT كأفضل-
الشكل 4 | توضيح لإطار TRAPT باستخدام الجينات المنخفضة التنظيم من تجارب حذف ESR1 في حالات سرطان المعدة وسرطان الثدي MCF7. أ مخطط تشتت يعرض قيم الأنشطة المتوسطة المنضبطة لـ 1358 TRs لمجموعات الجينات المرتفعة والمنخفضة التنظيم. يمثل حجم كل نقطة بيانات مقدار النشاط المنظم المتوسط، بينما تمثل الألوان فئات مختلفة من TRs: TFs (أزرق)، TcoFs (أخضر)، وCRs (أصفر). ب تم اشتقاق هذا الرسم البياني الشبكي من توقعات تفاعلات البروتين-بروتين في قاعدة بيانات STRING. يمثل حجم العقد درجاتها، ويمثل سمك الحواف احتمال التفاعل.تم اشتقاق هذه الخريطة الحرارية من نتائج تحليل التعبير المشترك لسرطان الثدي في TCGA، حيث تشير عمق الألوان إلى درجة الارتباط. د مخطط عمودي يوضح درجات النشاط المعيارية لمستقبلات الهرمونات. كانت ESR1 وGATA3 وFOXA1 وEP300 من بين أفضل 10 مستقبلات هرمونية، بينما احتل HDGF المرتبة الأخيرة. كانت ESR1 هي الأعلى في الدرجات. هـ مقارنة درجات D-RP بين الاستعلامات ( ) وجينات الخلفية ( )، مما يكشف عن اختلافات كبيرة لجميع TRs باستثناء HDGF. الخط الأوسط داخل كل صندوق يمثل الوسيط، بينما تمثل الحدود العليا والسفلى للصندوق الربع الثالث والربع الأول، على التوالي.-القيم يتم حسابها بواسطة اختبار مان-ويتني U ذو الجانبين دون تعديلات.الملفات المجمعة لعلامات المعززات. باستثناء HDGF، كانت علامات جميع TRs القريبة من الجين المطلوب أعلى بشكل ملحوظ من تلك القريبة من الجين الخلفي.-القيم يتم حسابها بواسطة اختبار كولموغوروف-سميرنوف ذو الجانبين دون تعديلات. ج خرائط الحرارة لمصفوفة النشاط قبل وبعد دمج درجات REA، توضح التمايز بين مجموعات الجينات المستفسر عنها ومجموعات الجينات الخلفية. لقد اخترنا عشوائيًا 10,000 جين للتصوير.متصفح الجينوم يعرض مسارات ESR1 و GATA3 و FOXA1 و EP300 و HDGF بالقرب من الجينات ESR1 و GREB1 و TFF1 و CCND1. لقد اخترنا مسارات 10 عينات إبجينومية ذات أكبر أوزان في الشبكة المعاد بناؤها لـ ESR1، والتي تظهر كمسارات ATAC (زرقاء) و H3K27ac (خضراء).
تصنيف عوامل النسخ مثل SPI1 و STAT1 و RELA و HDAC2 و JUND و HNF4A، المرتبطة بشكل سببي بـ . وجدنا أن rs10119 كان موجودًا بالضبط في موقع حرج في هيكل حلقة الكروماتين، مع العديد من عوامل النسخ المهمة المتوقعة من قبل TRAPT المرتبطة بالمصادر العليا والسفلى. ومن الجدير بالذكر أننا لاحظنا عددًا كبيرًا من مواقع الارتباط لعوامل النسخ المتوقعة لدينا في TOMM40 و APOC1 و APOE و CEACAM16 (الشكل 5f والشكل التكميلية 5b). من المعروف أن هذه الجينات تؤثر بشكل كبير على بداية . في الوقت نفسه، قمنا بتحليل مجموعات بيانات H3K27ac ChIP-seq المتعلقة بمرض الزهايمر لإظهار أن قمم الارتباط لعوامل النسخ بالقرب من موضع rs10119 تداخلت بشكل كبير مع ملفات H3K27ac التي اختارها النموذج، وتداخلت بشكل ملحوظ مع ملفات H3K27ac المرتبطة بمرض الزهايمر. كانت العينات المختارة بواسطة النموذج ليست من مرض الزهايمر، مما يشير إلى أنه في غياب بيانات الإبيجينوم من نفس سياق المرض، يختار عينات ذات إشارات إبيجينية مشابهة كبدائل. وقد أظهر ذلك إمكانيات TRAPT للتطبيق على الأمراض التي لم يسبق له مواجهتها. علاوة على ذلك، كانت العديد من عوامل النسخ المتوقعة مرتبطة ارتباطًا وثيقًا بالإبيجينetics، بما في ذلك HDAC2 و ZBTB33 (المعروف أيضًا باسم Kaiso). أخيرًا، قمنا أيضًا بتحليل متغير سببي آخر عالي الدرجات، rs75627662، ولاحظنا ارتباطًا واسعًا لعوامل النسخ المتوقعة الأعلى مرتبة (الشكل التكميلية 5a).
TRAPT يحدد منظمات النسخ المرتبطة بمصير الخلايا وهُوية الأنسجة
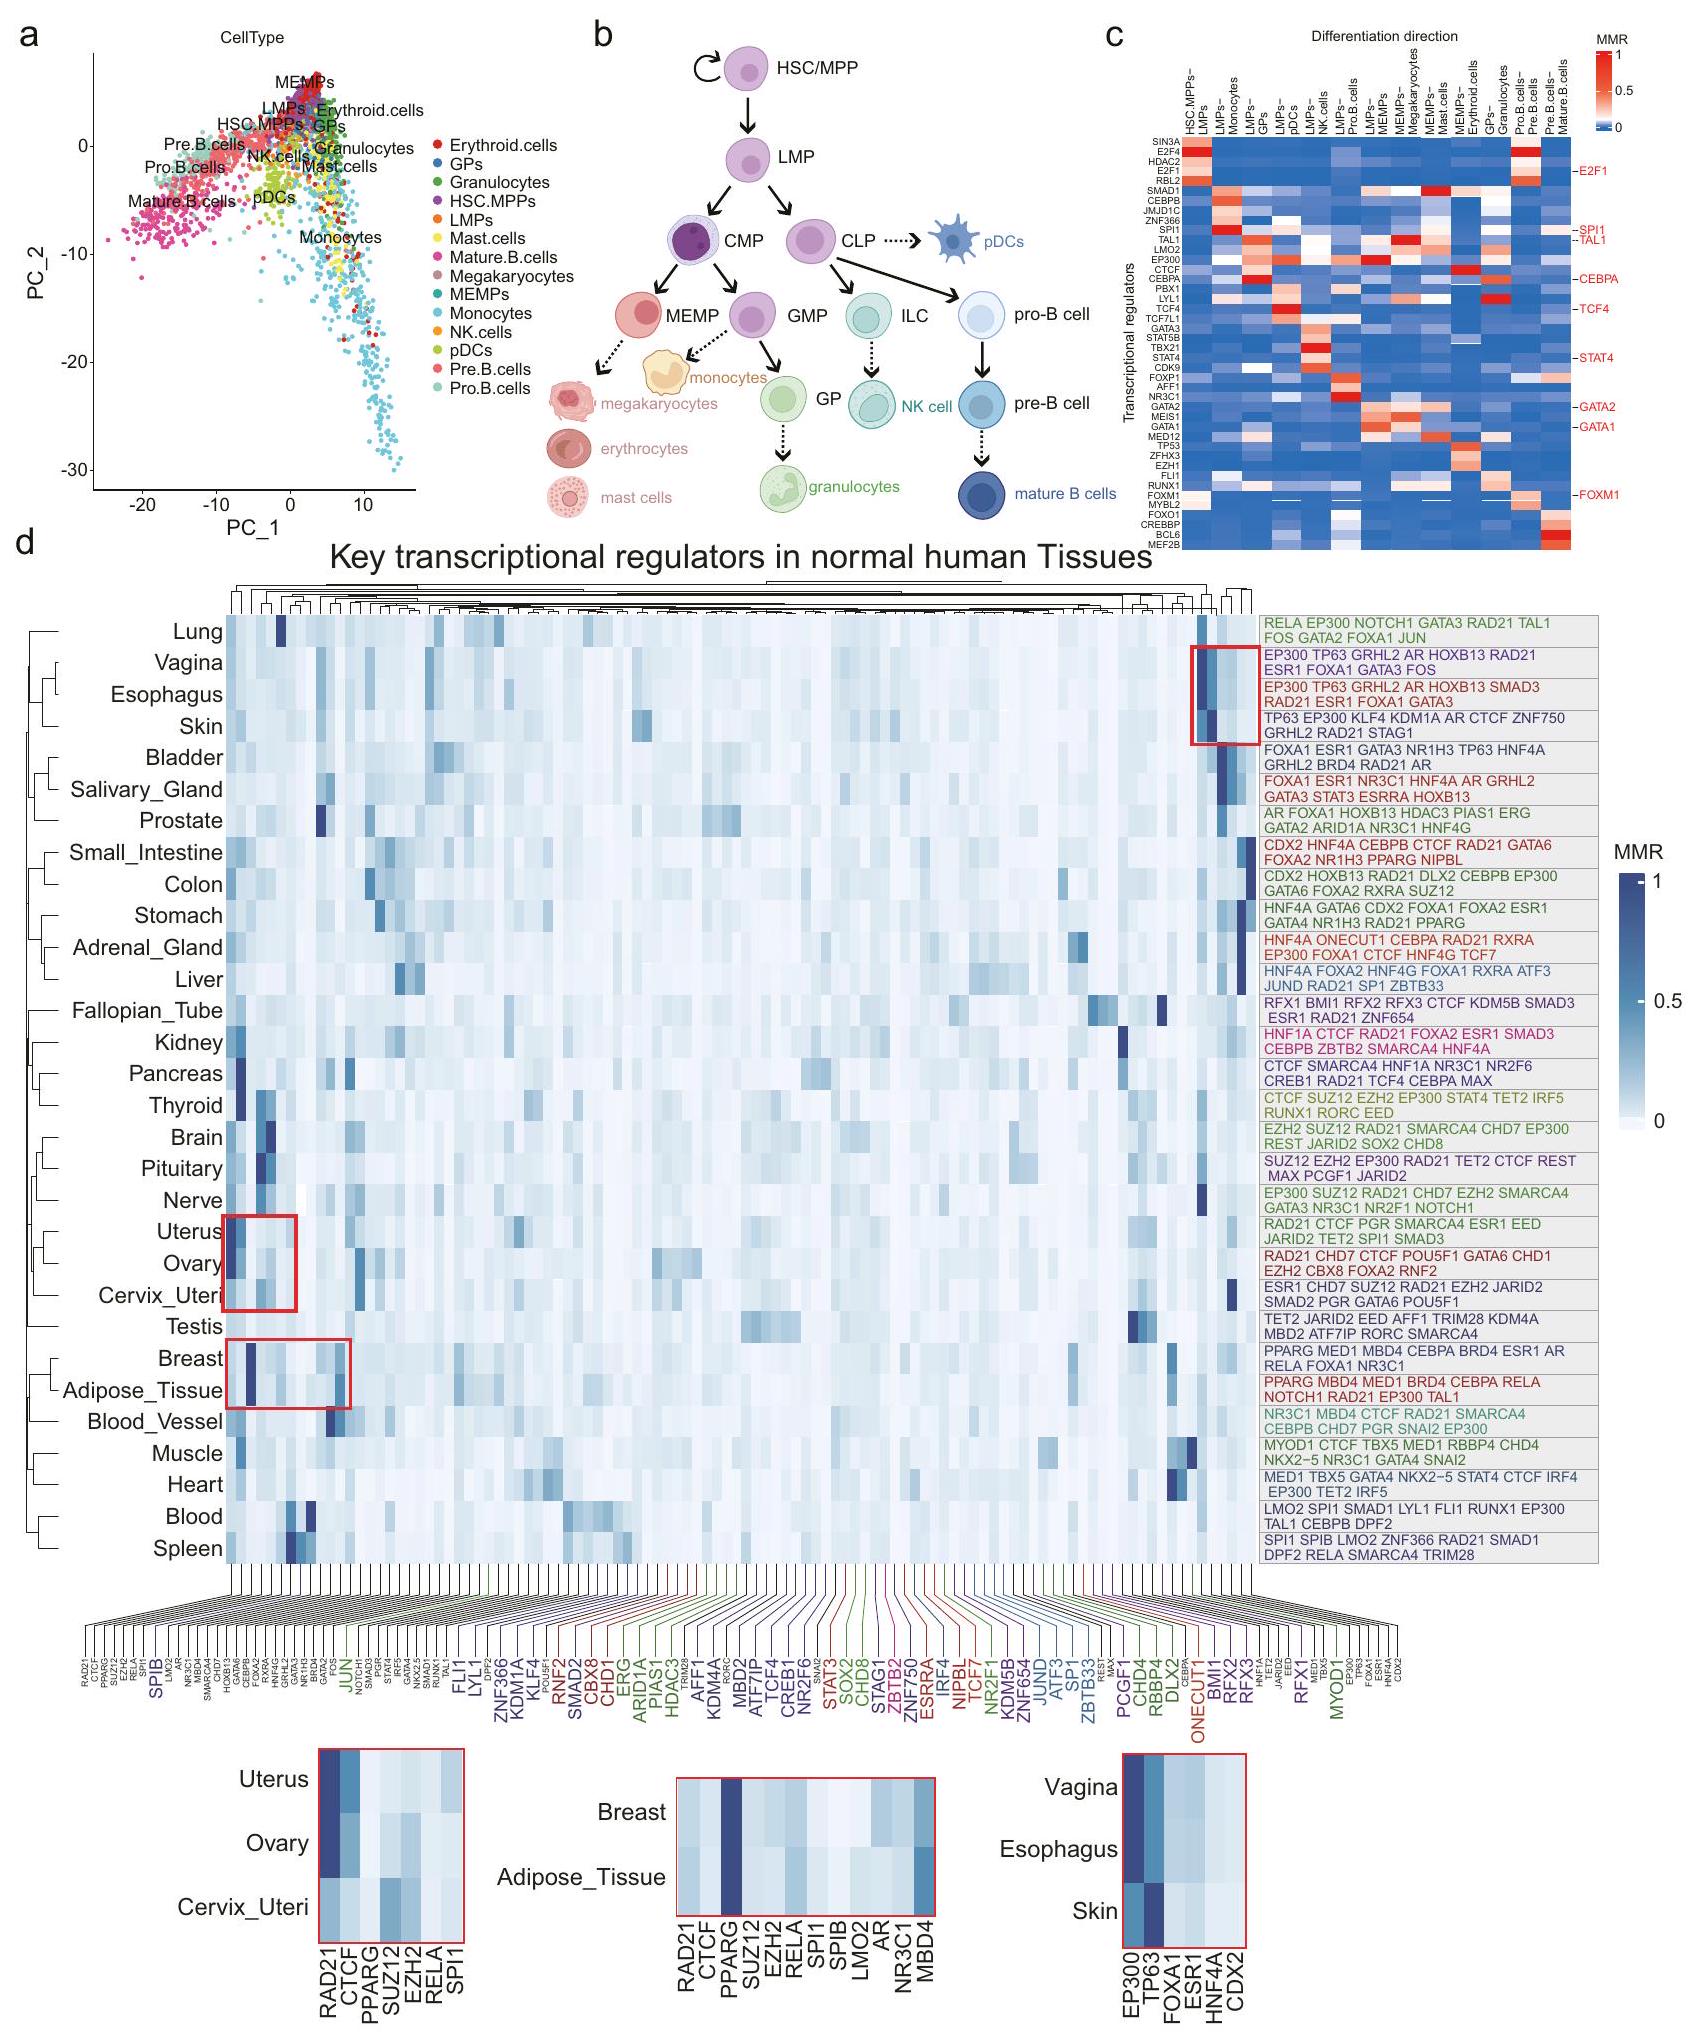
تعتبر عوامل النسخ ضرورية لتنسيق برامج التعبير الجيني، ودفع قرارات مصير الخلايا، وتنظيم العمليات البيولوجية المعقدة خلال تمايز الخلايا وتطورها. تلعب قوة ارتباط عوامل النسخ بالعناصر التنظيمية القريبة أو البعيدة للجينات المميزة السفلية دورًا حاسمًا في الحفاظ على هوية الخلايا. لتسليط الضوء على قابلية تطبيق TRAPT على تطوير الخلايا، حددنا قدرته على التقاط المنظمات الرئيسية لمجموعات الجينات المميزة لمجموعة بيانات خلية واحدة. باختصار، قمنا بإعادة معالجة بيانات scRNA-seq على خلايا جذعية دموية بشرية (ملاحظة تكميلية A.5)، ورسمنا أول مكونين رئيسيين (الشكل 6a)، وحددنا عوامل النسخ المميزة بين سلالات التمايز باستخدام النموذج الكلاسيكي للمناظر الطبيعية لتمايز الدم (الأشكال 6b والشكل التكميلية 6a). ثم استخدمنا TRAPT لتحديد أهم خمسة عوامل تنظيمية دافعة لاتجاهات مصير الخلايا المختلفة (الشكل 6c). تم تحديد ما مجموعه 42 عامل نسخ كمنظمات رئيسية محتملة لتمايز خلايا الدم. للتحقق من القدرة التنبؤية المتقدمة لأدواتنا، تم إجراء تحليل منهجي لهذه الـ 42 عامل نسخ. ومن الجدير بالذكر أن 29 منها معروفة بأنها تلعب أدوارًا تنظيمية في تطوير سلالة الدم (الجدول التكميلية 1)، مع 10 عوامل نسخ ( و FDR < 0.05) تظهر أنماط تعبير مختلفة عبر سلالات متمايزة في مجموعة بيانات scRNA-seq (الشكل 6c). بينما لم يتم تصنيف الجزء المتبقي من عوامل النسخ كعوامل نسخ معبرة بشكل مختلف، إلا أنها لا تزال تلعب دورًا حاسمًا في عملية التمايز. علاوة على ذلك، لاحظنا ظهور عدة عوامل نسخ عبر سلالات مختلفة من التمايز، بما في ذلك EP300 و SMAD1 و LYL1 و SPI1 و LMO2 و TAL1
(الشكل التكميلية 6b). بالإضافة إلى ذلك، تم العثور على بعض عوامل النسخ حصريًا في فروع سلالة واحدة. على سبيل المثال، تم تحديد STAT4 في فرع سلالة خلايا LMPs-NK كجين معروف ينظم الإشارة داخل الخلايا. يؤدي حذف STAT4 في خلايا تعبر عن NCR1 إلى ضعف التمايز النهائي لخلايا NK . TCF4 هو عامل نسخ رئيسي في فرع سلالة LMPs-pDC، وهو حاسم لتطوير pDC . كما طبقنا TRAPT على خلايا جذعية جنينية بشرية . بعد تقليل الأبعاد والتجميع، تم تصنيف الخلايا إلى ستة مجموعات فرعية رئيسية (الشكل التكميلية 6c). حددنا الجينات المميزة لكل مجموعة متمايزة ومجموعات H 1 و H 9 غير المتمايزة. باستخدام TRAPT، قمنا بتحليل هذه الجينات وحددنا عوامل النسخ الرئيسية لقرارات مصير الخلايا في كل مجموعة متمايزة. (الشكل التكميلية 6d). في تمايز H1 إلى خلايا شبيهة بالزغابات (TB cells)، أظهرت عوامل النسخ مثل GATA3 و TFAP2A و GATA2 نشاطًا أعلى. ومن الجدير بالذكر أن GATA2 و GATA3 قد أظهرا تعبيرًا انتقائيًا في خلايا سلف الزغابات خلال التطور المبكر للفئران، وينظمان مباشرة الجينات الرئيسية . أظهرت عوامل النسخ مثل GATA6 و SMAD2 و EOMES نشاطًا مرتفعًا في تمايز H 1 إلى خلايا الأندوديرم النهائية (DE cells). كشفت الدراسات السابقة أن GATA6 يعمل مع EOMES و SMAD2 لتنظيم شبكة الجينات التنظيمية المرتبطة بالأندوديرم النهائية البشرية . حدد TRAPT بدقة المنظمات الدافعة لقرارات مصير الخلايا، مع كون الغالبية منها عوامل نسخ محددة لسلالة الخلايا تم التحقق منها في الأدبيات.
بعد ذلك، قمنا بتحليل بيانات RNA-seq من 30 نسيجًا بشريًا طبيعيًا متميزًا تم استرجاعها من GTEx ، واستخدمنا limma لتحديد أعلى 500 جين معبر عنه بشكل مختلف لكل نسيج (ملاحظة تكميلية A.5)، واستخدمناها للتنبؤ بعوامل النسخ الرئيسية. تم التنبؤ بمعظم المنظمات لعلامات الأنسجة المحددة كما هو متوقع. على سبيل المثال، تم إثراء MED1 و TBX5 و GATA4 في نسيج القلب. يلعب MED1 دورًا مهمًا في تشكيل وتعزيز السوبر، بينما يشغل GATA4 بشكل واسع السوبر المعززات القلبية جنبًا إلى جنب مع TBX5 لتحديد انقباض خلايا القلب، ومعالجة الكالسيوم، والنشاط الأيضي . تم تحديد AR و FOXA1 و HOXB13 كأعلى ثلاثة عوامل نسخ في البروستاتا، وهو ما يتماشى مع دور FOXA1 و HOXB13 في تنظيم النسخ الطبيعي لـ AR خلال تطور الظهارة البروستاتية، فضلاً عن مشاركتهم في النسخ السرطاني لـ AR خلال تطور سرطان البروستاتا . علاوة على ذلك، تشارك بعض الأنسجة عوامل نسخ، مثل PPARG و CEBPA في أنسجة الثدي والدهون ، و TP63 و GRHL2 في أنسجة الجلد والمريء والمهبل ، مما يشير إلى أوجه التشابه في أنواع الخلايا السائدة عبر هذه الأنسجة. ثم دمجنا الدرجات المتوقعة لأعلى 10 عوامل نسخ من كل نسيج للتجميع الهرمي. من المثير للاهتمام، أن TRAPT حدد أوجه التشابه بين الأنسجة (الشكل 6c). على سبيل المثال، شكلت أنسجة الثدي والدهون مجموعة بسبب تكوينها السائد من الخلايا الدهنية. شكلت الأنسجة من الرحم والمبيض وعنق الرحم مجموعة لأن سطحها وداخلها كان مغطى بخلايا ظهارية. كما أنشأنا قائمة بأهم 10 عوامل نسخ متوقعة لكل نوع من الأنسجة (البيانات التكميلية 4).
الشكل 5 | التنبؤ بالمنظمات الوظيفية لعوامل النسخ لمرض الزهايمر باستخدام تحليل ما بعد GWAS. a سير العمل لتحليل البيانات المتعلقة بمرض الزهايمر. مخطط فين يوضح عدد SNPs السببية المرتبطة بالقرب من عوامل النسخ المتوقعة العليا والسفلى. c مخطط مبعثر يعرض المتغيرات السببية المرتبطة بعوامل النسخ الأعلى مرتبة، مع أحجام النقاط تمثل أحجام درجات FINEMAP الخاصة بها. d مخطط عمودي يعرض نتائج تحليل التداخل. تمثل الأعمدة الصفراء عدد عوامل النسخ المرتبطة بالمتغيرات السببية المهمة في التخطيط الدقيق، بينما تمثل الأعمدة الرمادية عوامل النسخ المرتبطة بالمتغيرات الخلفية. اخترنا أعلى وأسفل 25 عامل نسخ للعرض. يمثل مخطط الخطوط الغنية الارتباط الناتج عن الارتباط لهذه العوامل. كانت المتغيرات السببية تميل إلى التواجد مع عوامل النسخ المتوقعة بواسطة TRAPT. e مخطط مانهاتن يظهر المتغير السببي الأعلى مرتبة
rs10119 الذي تم الحصول عليه من التخطيط الدقيق. استخدمنا مجموعات الجينات المهمة التي تم تحليلها باستخدام برنامج MAGMA كمدخلات لـ TRAPT. تمثل المسارات السفلية قمم ارتباط عوامل النسخ، حيث تم التنبؤ بأن EGR1 و RELA و REST و STAT1 ستحتل المراتب العشر الأولى، بينما تم التنبؤ بأن عوامل النسخ الأخرى ستحتل المراتب الـ 25 الأولى. لم تظهر الـ 25 عامل نسخ السفلية أي ارتباط بالقرب من rs10119. -القيم يتم حسابها من خلال حساب التوزيع الذي هو أكبر من ES الملاحظ. f متصفح الجينوم يعرض تفاعلات الكروماتين، وعلاقات eQTLs، وعوامل النسخ المرتبطة الأعلى مرتبة، والمناظر الإبيجينية لـ H3K27ac و AD التي تم الحصول عليها بواسطة TRAPT. -القيم يتم حسابها بواسطة اختبار نسبة الاحتمالات ذو الجانبين مع التعديلات.
في الختام، تنبأت TRAPT بكفاءة بالعوامل التنظيمية الرئيسية في سياق مصير الخلايا وعبر 30 نسيجًا بشريًا طبيعيًا، مما يثبت قدرتها على معالجة مجموعات الجينات المستمدة من ظواهر متعددة أو بيانات شرطية، مثل البيانات المتعلقة بالمجموعات. عدد كبير من هذه لقد أظهرت التجارب أن TRs المتوقعة لها أدوار محددة في هذه الأنسجة، مما يحقق المزيد من موثوقية TRAPT. كان TRAPT أداة مفيدة لاستكشاف وفهم وظائف TRs الرئيسية في العمليات الفسيولوجية البشرية.
الشكل 6 | تحديد بواسطة TRAPT لعوامل النسخ المرتبطة بمصير الخلايا وهُوية الأنسجة. أ تصور لتحليل المكونات الرئيسية (PCA) المستمد من بيانات scRNA-seq. ب نموذج كلاسيكي لمشهد التمايز الدموية. ج خريطة حرارية تعرض درجات MRR لعوامل النسخ المحددة حسب السلالة التي تم الحصول عليها بواسطة TRAPT عبر اتجاهات تمايز الخلايا. د خريطة حرارية تظهر أعلى 100 عامل نسخ وفقًا لدرجات MRR، التي تم التنبؤ بها بواسطة TRAPT. عبر 30 نسيجًا بشريًا. يظهر الجانب الأيمن أفضل 10 TRs المتوقعة لكل من الأنسجة الثلاثين بواسطة TRAPT. يتم تصنيف TRs لكل نسيج بترتيب تنازلي حسب درجات MRR الخاصة بها، مع تمييز الأنسجة بألوان مختلفة. تمثل TRs بالألوان المتنوعة أسفل خريطة الحرارة TRs محددة للأنسجة من أفضل 10 TRs المتوقعة. تبرز الخرائط الحرارية الأصغر أدناه TRs المهمة ضمن أنسجتها المعنية.
نقاش
تعتبر المنظمات النسخية ضرورية لتعديل أنماط التعبير الجيني، حيث تنسق تفعيل وكبح الجينات للحفاظ على التوازن الخلوي وتوجيه العمليات التنموية. ومن المهم أن برامج الجينات التي تتوسطها المنظمات النسخية تتمتع بمشهد إبيجيني مميز وتعمل كمفاتيح في تغييرات حالات الخلايا وأنماط الأمراض.ومع ذلك، لا يزال من الصعب التنبؤ بدقة بالعوامل التنظيمية العليا (TRs) لمجموعة معينة من الجينات ذات المعنى البيولوجي (أي، الجينات المعبر عنها بشكل مختلف أو جينات العلامة في دراسات الخلايا المفردة) بسبب نقص البيانات الإبيجينية حول العوامل التنظيمية العليا في العديد من أنواع الخلايا. لمعالجة هذه المشكلة، اقترحنا إطار عمل للتعلم العميق، يسمى TRAPT، الذي يستفيد من تقنيات استخراج المعرفة على مرحلتين لاستخراج تمثيل نشاط العناصر التنظيمية. يمكن لـ TRAPT التنبؤ بالعوامل التنظيمية العليا الرئيسية لمجموعات الجينات المعتمدة على السياق من خلال دمج البيانات من أكثر من 20,000 جينوم إبيجيني كبير ومكتبة شاملة من المعرفة الخلفية حول العوامل التنظيمية العليا. يحسن TRAPT بشكل كبير من دقة التنبؤ بالعوامل التنظيمية العليا على مجموعات البيانات المرجعية الكبيرة ويتفوق على الطرق الشائعة مثل Lisa وBART وi-cisTarget وChEA3 في التنبؤ بالترتيب العام للعوامل التنظيمية العليا. كما استخدمناه بنجاح لتحديد العوامل التنظيمية العليا الرئيسية المرتبطة بالأمراض والتvariations الجينية وقرارات مصير الخلايا وأنواع الأنسجة المختلفة.
يمكن تصنيف الطرق الحالية لتوقع TR إلى فئتين رئيسيتين. تتكون الفئة الأولى من طرق قائمة على مجموعات الجينات، مثل Enrichr وTFEA.ChIP وChEA3 وMAGIC، التي تستخدم مجموعات الجينات المتعلقة بـ TR كبيانات خلفية وتطبق اختبارات إحصائية مثل التوزيع الفائق لحساب أهمية TR. ومع ذلك، لا يمكن لهذه الطرق محاكاة ارتباط TRs وCREs بدقة. الفئة الثانية، بما في ذلك i-cisTarget وBART وLisa، تعالج هذه المشكلة من خلال محاكاة ارتباط TR مع CREs القريبة من الجينات لتوقع نشاطها. ومع ذلك، لا تزال هذه الطرق تعاني من قيود، أساسًا إهمال تفضيلات الارتباط لـ TRs. يمثل TRAPT فئة ثالثة من التقنيات التي تدمج العناصر التنظيمية السيستمية لمجموعة الجينات مع مواقع الارتباط على مستوى الجينوم لـ TRs. استنادًا إلى 570 مجموعة بيانات مرتبطة بـ TR من تجارب الإزالة/الإسكات ومعايير تقييم متعددة، وجدنا أن TRAPT، كطريقة في الفئة الثالثة، تفوقت بشكل كبير على جميع الطرق الأخرى في توقع الترتيب العام لـ TRs. يُعزى الميزة الكبيرة لـ TRAPT في توقع عوامل النسخ، ومنظمات الكروماتين، وعوامل النسخ المساعدة إلى استراتيجيتها متعددة المراحل في الدمج ومكتبتها الشاملة من TRs. كانت لطريقتنا المزايا التالية: (1) استخدم TRAPT الدمج متعدد المراحل لمعالجة مشكلة التغطية غير الكاملة للملف التنظيمي السيستمي ومشاكل TRBP ذات الصلة في نفس الوقت. (2) لتخفيف آثار البيانات الضوضائية، طبق TRAPT إطار عمل قائم على الميزات لتقطير المعرفة.على مرحلتين. خلال توقع D-RP، قدمنا VGAE، مستخدمين خدعة إعادة التهيئة لإسقاط تمثيلات العقد إلى شكل توزيع كامن موحد. من خلال دمج CVAE كشبكة معلم، استغللنا ميزتها في تنعيم توزيع الفضاء الكامن لتقييد التضمينات الأولية لـ VGAE، مما أدى إلى تقليل الفجوات في توزيع ميزات العقد المجمعة. في خطوة التنبؤ لـ URP، استخرجت شبكة المعلم تمثيلات مضمنة منخفضة الأبعاد لمعلومات الإبيجينوم المعقدة المتعلقة بمجموعة الجينات المستفسر عنها ووجهت شبكة الطالب في اختيار مجموعة العينات الإبيجينية المثلى. كان نموذج KD قويًا ضد البيانات الضوضائية، وزاد بشكل كبير من القدرة على توقع نشاط TR. كما حافظ في الوقت نفسه على سرعة الخوارزمية حتى عندما كانت كمية بيانات TR أكثر من ضعف تلك التي تغطيها الخوارزمية الأكثر تقدمًا ذات أعلى تغطية (الأشكال التكميلية 1b، c). (3) اقترحنا الاستفادة من نظرية الرسوم البيانية لمعالجة تحدي توقع الإمكانات التنظيمية لـ TRs في مواقع ارتباطها على مستوى الجينوم، والتي كانت مناسبة بشكل خاص لمجموعات البيانات الإبيجينية الصغيرة. لاستكشاف المزايا المحتملة لاستراتيجية دمج متعددة المراحل وتقطير المعرفة لتوقع TRs، أجرينا اختبارات إبطال شاملة. لاحظنا وجود انخفاض في الأداء العام للنموذج عندما تم إزالة نماذج U-RP و D-RP. وبالمثل، انخفض الأداء العام للنموذج بشكل ملحوظ عندما تم القضاء على تقنيات استخراج المعرفة. قمنا بتقييم نموذج D-RP من منظور توقع الروابط. وقد أظهر قدرته على إعادة بناء الروابط التي لم تُرَ من قبل في مجموعات بيانات الاختبار. علاوة على ذلك، حافظ نموذج D-RP على أداء مستقر حتى عند إخفاء نسب مختلفة من الروابط. تشير هذه النتائج إلى أنه قام بتحسين الشبكة التنظيمية الجينية.
باستخدام 570 مجموعة بيانات مرتبطة بـ TR، تفوق TRAPT على الأساليب المتقدمة في استنتاج منظمات النسخ، خاصة في التنبؤ بالعوامل المساعدة للنسخ ومنظمات الكروماتين. كما تحققنا من أن TRAPT حافظ على أدائه المتفوق حتى عند تجاهل تأثير بيانات الخلفية. كشفت نتائجنا أن منظمات الكروماتين، والعوامل المساعدة للنسخ، وعوامل النسخ أظهرت اختلافات كبيرة في تفضيلات الربط الجينومي (الشكل التوضيحي 7d)، مما يبرز الحاجة إلى النظر في أنواع مختلفة من TRs في البحث. نجح TRAPT في تحديد ESR1 كأعلى تصنيف، إلى جانب العوامل المساعدة للنسخ المرتبطة ومنظمات الكروماتين مثل EP300، في تجربة حذف ESR1. وجدنا أن TRs الأعلى تصنيفًا أظهرت درجات أعلى بشكل ملحوظ على مجموعة الجينات المستفسر عنها. ومن الجدير بالذكر أن ESR1، من خلال ارتباطه بكل من المعززات البعيدة والقريبة، برز كأكثر TR بارز في كل من سياقات ATAC وH3K27ac. يبرز هذا الاكتشاف أن وحدة التمثيل في نموذج D-RP في TRAPT التقطت بفعالية المعلومات الوراثية المتعلقة بـ ESR1 في سياق السرطان. كما حدد TRAPT TRs المرتبطة سببيًا بـ AD بالقرب من rs10119، مع احتمال أكبر لوجود TRs الأعلى تصنيفًا بالقرب من SNPs السببية. في النهاية، طبقنا TRAPT على مجموعات بيانات من خلايا الجذعية الدموية البشرية، وخلايا الجذعية الجنينية البشرية، وأنسجة بشرية طبيعية. وكان قادرًا على التنبؤ بنجاح بالعوامل التنظيمية الحرجة التي تتحكم في مصير الخلايا، بما في ذلك STAT4 وTCF4 وGATA، بالإضافة إلى منظمات محددة للأنسجة مثل MED1 وTBX5 وGATA4.
قدم TRAPT منظورًا معلوماتيًا حول دمج المشهد الإبيجيني لعوامل النسخ. ومع ذلك، كانت أداؤه لا يزال مقيدًا بعدد العينات الإبيجينية. حتى الآن، يشمل TRAPT 17,227 عامل نسخ (البيانات التكميلية 1)، و1,329 عينة ATAC-seq، و1,465 عينة H3K27ac. على الرغم من أنه يستخدم مجموعة بيانات إبيجينية شاملة كخلفية، إلا أن هذا لا يضمن إمكانية ربط كل عامل نسخ بعينات إبيجينية متCorresponding. تقوم عوامل النسخ بتجنيد العوامل المساعدة لأداء وظائفها، حيث يمكن أن تعزز أو تقلل الألفة للعوامل المساعدة من تلك الخاصة بعوامل النسخ، اعتمادًا على ما إذا كانت الأولى تعمل كمنشطة أو مثبطة. كما تؤثر منظمات الكروماتين أيضًا على نشاط عوامل النسخ من خلال تعديل بنية الكروماتين. على الرغم من وجود بيانات واسعة حول العوامل المساعدة ومنظمات الكروماتين، إلا أن التأثيرات المعقدة للتفاعلات بين عوامل النسخ غير مفهومة تمامًا. في الأعمال المستقبلية، قد نفكر في دمج الشبكات التنظيمية الجينية لمحاكاة التفاعلات المعقدة داخل هذه الكائنات. نعتقد أن هذا سيوسع من قابلية تطبيق نموذجنا.
في الختام، طبق TRAPT استراتيجية ثنائية الاتجاه لدمج المشهد الإبيجيني للتنبؤ بعوامل النسخ الرئيسية، ومن المتوقع أن يوفر إرشادات عملية للبحوث المستقبلية والتحليل الحاسوبي المتعلق بتنظيم النسخ.
طرق
معالجة مسبقة لمجموعات بيانات الإبيجينية ومنظمات النسخ
تتم تنظيم برامج نسخ الجينات بشكل أساسي من خلال الأنشطة البيولوجية لمنظمات النسخ، وعلامات إبيجينية منسقة في الأعلى، مثل تعديلات الهيستون، وحالات الكروماتين المفتوحة، والتي يمكن أن تؤسس وتحافظ على المشهد النسخي لخلايا استجابة لمجموعة متنوعة من الإشارات الداخلية والخارجية. علاوة على ذلك، أظهرت الدراسات أن العلامات الإبيجينية يمكن أن تحاكي جزئيًا الأشكال التنظيمية لمنظمات النسخ لسد الفجوات في تغطيتها. ومن ثم، فإن دمج البيانات الإبيجينية على نطاق واسع يساعد
في فهم آلية النسخ الخاصة بالخلايا للجينات. في هذه الدراسة، قمنا بتجميع ومعالجة يدويًا مجموعات بيانات إبيجينية خام من مصادر متعددة، تغطي أكثر من 1000 نوع من الأنسجة والخلايا. قدمت جميع هذه المجموعات من الإبيجينية ومنظمات النسخ إشارات تنظيمية شاملة لاستنتاج أنماط التعبير الجيني. الآن نوضح الطرق المختلفة المستخدمة لمعالجة البيانات.
بيانات H3K27ac ChIP-seq. تم الحصول على مجموعات بيانات H3K27ac ChIP-seq من SEdb2.0 في الأعمال السابقة من قبل مجموعة بحثنا. باختصار، قمنا بجمع يدوي لـ 1,739 عينة، بما في ذلك مجموعات تجريبية ومجموعات تحكم، من NCBI GEO/SRA، ENCODE، Roadmap، مشروع جينوم تنظيم الجينات (GGR)، ومركز البيانات الجينومية الوطنية أرشيف تسلسل الجينوم (NGDC GSA). حصلنا على بيانات حول إشارات الذروة لـ H3K27ac باستخدام أدوات Bowtie و BEDTools multicov لمعالجة البيانات الخام.
بيانات حول وصول الكروماتين. تم الحصول على مجموعات بيانات وصول الكروماتين من ATACdb في الأعمال السابقة من قبل مجموعة بحثنا. باختصار، قمنا بجمع يدوي لـ 2,723 عينة لتغطية عدة أنواع من الأنسجة أو الخلايا من NCBI GEO/SRA، واستخدمنا أدوات Bowtie و BEDTools multicov لتحديد الإشارات التي تمثل ذروات وصول الكروماتين.
بيانات حول عوامل النسخ. تم الحصول على مجموعات بيانات ChIP-seq لعوامل النسخ من TFTG في الأعمال السابقة من قبل مجموعة بحثنا. باختصار، قمنا بجمع يدوي لـ 11,056 عينة، موثقين ما مجموعه 1,218 عامل نسخ بشري. لتوفير مزيد من معلومات مراقبة الجودة بشأن ChIP-seq، مثل توزيع المحفزات، والقطع، ونسبة مواقع UDHS، استخدمنا بعد ذلك حزمة ChIPseeker R وحزمة BEDTools لحساب توزيعات التراكيب الجينومية المختلفة وتغطية UDHS لكل عامل نسخ.
بيانات حول العوامل المساعدة للنسخ. تم الحصول على مجموعات بيانات ChIP-seq للعوامل المساعدة للنسخ من TcoFBase في الأعمال السابقة من قبل مجموعة بحثنا. باختصار، قمنا بجمع يدوي لقائمة من TcoFs في الثدييات من TcoF-DB v2 و AnimalTFDB 3.0. كما جمعنا 4246 مجموعة بيانات ChIP-seq ذات الصلة بـ TcoF من أنواع مختلفة من خلايا وأنسجة البشر من ReMap و ENCODE و Cistrome، و ChIP-Atlas. استخدمنا أداة liftOver من UCSC لتحويل جميع بيانات ذروة ChIP-seq إلى تجميع الجينوم hg38. تم استخدام حزمة ChIPseeker R و BEDTools لحساب توزيعات التراكيب الجينومية المختلفة وتغطية UDHS لكل TcoF.
بيانات حول منظمات الكروماتين. تم الحصول على مجموعات بيانات ChIP-seq لمنظمات الكروماتين من CRdb في الأعمال السابقة من قبل مجموعة بحثنا (مرجع). باختصار، قمنا بمعالجة 2,591 مجموعة بيانات ChIP-seq المرتبطة بـ CR من GEO و ENCODE. حددنا مناطق الربط لـ CRs باستخدام Bowtie و SAMtools، و MACS2، وحسبنا توزيعات التراكيب الجينومية المختلفة، وحددنا تغطية مواقع UDHS لكل TcoF باستخدام حزمة ChIPseeker R و BEDTools.
من المحتمل أن تحتوي الكمية الكبيرة من البيانات المجمعة على تكرارات ناتجة عن نفس المصادر. قمنا بحساب ارتباطات الذروة لجميع عوامل النسخ، واحتفظنا فقط بإحدى العينات في حالات قيمة الارتباط تساوي واحد. من خلال هذه العملية من التصفية، تم الاحتفاظ بـ 17,227 ملف ذروة فريد لعوامل النسخ (البيانات التكميلية 1).
باختصار، يتفوق TRAPT على الأدوات التي تم تطويرها سابقًا من خلال الاستفادة من مجموعة بيانات أكثر شمولاً وجودة أعلى. على وجه التحديد، يتكون TRAPT من 17,227 عنصر بيانات لعوامل النسخ، وهو أكبر بمقدار 2.49 مرة من مجموعة بيانات ليزا وأكبر بمقدار 2.16 مرة من مجموعة بيانات BART. بالإضافة إلى ذلك، تتجاوز بيانات وصول الكروماتين في TRAPT أكبر مجموعات البيانات المتاحة بمقدار 1.47 مرة (TRAPT: 1,329؛ ليزا: 904). وبالمثل، فإن مجموعة بيانات H3K27ac في TRAPT أكبر بمقدار 1.44 مرة من تلك الخاصة بـ
ليزا، مما يبرز مرة أخرى تغطية بياناته وجودتها الفائقة (الأشكال التكميلية 1b، c).
TR ونموذج الإمكانات التنظيمية الإبيجينية
يمكن تحديد الإمكانات التنظيمية لجين من خلال حساب نشاط العناصر التنظيمية القريبة (CREs) من. لحساب مصفوفة TR-RP، جمعنا بيانات الذروة حول 17,227 عامل نسخ من CRdb و TcoFBase و TFTG. تؤثر عوامل النسخ على التعبير الجيني من خلال الارتباط بـ CREs الموجودة في الأعلى أو الأسفل من الجين. لذلك، ركزنا فقط على CREs التي تتداخل مع مواقع ارتباط عوامل النسخ لحساب الإمكانات التنظيمية للجين (الملاحظة التكميلية A.7). استخدمنا BEDTools لتحديد مناطق التداخل للعناصر التنظيمية لكل عامل نسخ. لتوحيد المصطلحات، أطلقنا على هذه العناصر التنظيمية اسم العناصر التنظيمية المحتملة (PREs). تم تعريف قيمة الإشارة لكل PRE في عينة عامل النسخ كقيمة ثنائية:
من خلال تجميع قيم الإشارات للعناصر التنظيمية ضمن نطاق 100 كيلوبايت في الأعلى والأسفل من الجينات المستهدفة، تم حساب الإمكانات التنظيمية لكل جين في كل عينة لتوليد مصفوفة TR-RP. يمثل كل صف من هذه المصفوفة عامل نسخ، ويمثل كل عمود جين. تم تعريف الإمكانات التنظيمية للجين-th في العينة-th كما يلي:
حيث هو التأثير التنظيمي لـ-th PRE، الموجود ضمن نطاق 100 كيلوبايت من TSS للجين، و هو قيمة إشارة PRE المعطاة. يتم تعريف وزن كل PRE كما يلي:
حيث هو المسافة بين PRE الحالي و TSS للجين، مع تعيين المعامل الفائق إلى 10 كيلوبايت. يتحكم المعامل في معدل تدهور التأثير التنظيمي:
حيث تم تعيينه إلى 100 كيلوبايت، و يمثل وزن عامل النسخ. في هذه الدراسة، استخدمنا “نسبة المسافة بين الجينات” المحسوبة بواسطة ChIPseeker كنسبة من المعززات البعيدة، وأدرجناها كمعامل وزن في نموذج الإمكانات التنظيمية الخاصة لكل عامل نسخ.
لحساب مصفوفة Epi-RP (مع الصفوف تمثل عينات إبيجينية والأعمدة تمثل الجينات)، استخدمنا ملفات BAM من بيانات H3K27ac ChIP-seq و ATAC-seq التي تم الحصول عليها من SEdb و ATACdb، على التوالي. ثم طبقنا أداة BEDTools multicov لحساب عدد القراءات على العناصر التنظيمية، وأنتج ذلك إشارات قراءة لجميع العناصر التنظيمية.
تم إجراء الحسابات باستخدام نفس الطريقة المذكورة أعلاه، ولكننا قمنا بتعيين قيمة لكل عينة إبيجينومية إلى 0.01. علاوة على ذلك، استخدمنا إشارات القراءة بدلاً من إشارات الذروة لحساب الإمكانات التنظيمية للجينات.
في النهاية، قمنا بتطبيق التوحيد اللوغاريتمي في الوقت نفسه على الإمكانات التنظيمية المرتبطة بكل جين لكل من TR والإبيجينوم:
توقع الإمكانات التنظيمية عبر المنظمين النسخ العلوية
استفدنا من نموذج قائم على تقطير المعرفة (KD) في وحدتنا لتوجيه نموذج الطالب لتعلم ميزات إبيجينومية متعددة النماذج وتحسين شبكة العلاقات الإبيجينومية. تم تصميم KD لضغط وتسريع نموذج معين من خلال نقل المعرفة من نموذج معقد إلى نموذج مبسط. يحدث الإفراط في التخصيص بشكل متكرر عند إجراء استنتاجات بشأن شبكات العلاقات الإبيجينومية. ومع ذلك، أظهرت الدراسات الحديثة أن استخدام تقطير المعرفة يعزز بشكل كبير أداء نموذج الطالب ويخفف من مشاكل هلوسة النموذج.اقترحنا استخدام KD لاستنتاج مواقع الربط على مستوى الجينوم لكل TR. بسبب اختلافات التوزيع بين TRs والإبيجينومات (الأشكال التكميلية 9b-e)، لم يكن الدمج البسيط ممكنًا. لاستخراج تمثيلات مشتركة بشكل أكثر ملاءمة لتضمين TRs والإبيجينومات، استخدمنا مشفرات تلقائية متغيرة شرطية (CVAEs) كشبكة معلم. يمكن لـ CVAEs أن تتقن ليس فقط تمثيلات البيانات المعقدة، ولكن أيضًا تؤدي بشكل جيد من حيث دمج البيانات متعددة النماذج.من خلال دمج الخطأ في إعادة البناء وشروط تنظيم المتغيرات الكامنة أثناء التدريب، يمكن لـ CVAEs أن تتعلم التمييز بين تمثيلات الميزات. تم تحقيق النموذج من خلال تقليل دالة الخسارة التالية:
حيث (m هو عدد عينات TR والإبيجينوم، و n هو عدد الجينات) يمثل مصفوفة الميزات المجمعة من خلال دمج مصفوفتين TR-RP و Epi-RP. على وجه التحديد، نقوم بدمج نوعي مصفوفات Epi-RP (H3K27ac و ATAC) مع مصفوفة TR-RP حسب العينات كمدخلات للنموذج.هي مصفوفة واحدة تمثل تسميات نوعي بيانات الأوميكس. على وجه التحديد، كل نوع من البيانات الإبيجينومية يتوافق مع ظروف مختلفة. في هذا السياق، يدمج TRAPT نوعين من بيانات الأوميكس، مع تعيين تسمية 0 لعينات TR وتسمية 1 لعينات الإبيجينوم. في النهاية، نحصل على مصفوفة واحدة بأبعاد ميزات تبلغ 2.تشير إلى تباين كولباك-ليبلر بين الشبكة المعاد بناؤها والشبكة السابقة (الشرطية). عندما تم إدخال مصفوفة الميزات والمصفوفة الشرطية إلى الإطار، أنشأت تمثيلًا مشتركًا منخفض الأبعاد للتضمين (حيث هو أبعاد الطبقة المخفية) من TRs وعينات الإبيجينوم:
حيث و تمثل الأوزان والانحيازات للطبقة الأولية من المشفر، على التوالي. تم تمثيل الشبكة المعقدة من خلال العلاقة بين TR والإبيجينوم. لنمذجة هذه الشبكة، طبقنا VGAE كشبكة طالب واخترنا 10 عينات إبيجينومية الأقرب إلى كل TR لبناء مصفوفة الجوار. استخدمنا kNN، مع تشابه جيب التمام كمعيار للمسافة:
حيث يمثل تشابه جيب التمام بين -th TR و -th عينة إبيجينومية. على وجه التحديد، تشير درجة كل حافة في الشبكة إلى وزن مجموعة العناصر التنظيمية المحتملة المحددة حاليًا والتي تخص أنواع الأنسجة/الخلايا لـ TR (مع كل عينة إبيجينومية تتوافق مع مجموعة من العناصر التنظيمية). N هو عدد الجينات. قمنا بإدخال و في النموذج. مرت عبر الطبقة الأولى من مشفر GCN لتعلم تمثيلات عقدية منخفضة الأبعاد . تلتقط هذه التمثيلات كل من معلومات أحادية النمط والعلاقة
بين TRs وعينات الإبيجينوم. نظرًا لأن المدخلات كانت شبكة غير متجانسة، لم تحتوي على أي معلومات حول علاقة نمط واحد بنفسه. بعد ذلك، استخدمنا الطبقة الثانية من الالتفاف البياني لتوليد المتوسط والانحراف، وفي النهاية، استخدمنا خدعة إعادة المعلمة لاشتقاق تمثيل الميزات العقدية الجديد (حيث هو أبعاد الطبقة المخفية في وحدة GCN). يتم التعبير عن GCN كما يلي:
أخيرًا، استخدم VGAE مشفر المنتج الداخلي لإنتاج مصفوفة الجوار المعاد بناؤها:
تم تعريف دالة خسارة الانتروبيا المتقاطعة كمتوسط لتقليل التباين بين الشبكات المدخلة والمخرجة:
تم تعريف دالة خسارة التقطير كالتالي:
حيث هو المعيار الإقليدي. تم تعريف دالة الخسارة النهائية لشبكة الطالب كالتالي:
حيث هو تباين كولباك-ليبلر بين التوزيع المعاد بناؤه والتوزيع الغاوسي السابق. نتوقع D-RP المرتبطة بكل TR كما يلي:
حيث مشتقة من مصفوفة Epi-RP، مع يمثل متجه الإمكانات التنظيمية لـ -th TR المرتبطة بـ -th عينة إبيجينومية مجاورة، و تشير إلى الوزن المنظم لعلاقة الشبكة لـ -th عينة إبيجينومية من -th TR. هو عدد عينات الإبيجينوم. تمثل مصفوفة D-RP النشاط المجمع لمواقع الربط على مستوى الجينوم لـ TRs بالقرب من الجينات، مع القيم الأعلى تشير إلى مستوى أكثر كثافة من النشاط النسخي في محيط الجينات.
توقع الإمكانات التنظيمية عبر مجموعات الجينات السفلية
تم استخدام طريقتين رئيسيتين لتوقع عناصر التنظيم الجيني المستهدفة. الطريقة الأولى تستنتج العناصر التنظيمية بالقرب من الجينات بناءً على المسافة، مثل نهج i-cisTarget. الطريقة الثانية استخدمت الانحدار لاختيار عينات الإبيجينوم وتوقع مشهد العناصر التنظيمية عبر الجينوم بأكمله، مثل طريقة MARGE. ومع ذلك، تفشل هذه الطرق في معالجة تكرار بيانات الإبيجينوم والعلاقات غير الخطية المعقدة
bين العينات. مستلهمين من ذلك ومن عدة دراسات حديثة ، اقترحنا استراتيجية قائمة على KD لاختيار عينات الإبيجينوم الأكثر احتمالًا المرتبطة بمجموعة الجينات المستفسر عنها. في البداية، قمنا بحساب الارتباط بين مصفوفة Epi-RP ومجموعة الجينات المستفسر عنها. بعد ذلك، قمنا بترتيب عينات الإبيجينوم بترتيب تنازلي بناءً على مقادير ارتباطاتها. نظرًا للعدد الكبير من عينات الإبيجينوم، نشأت العديد منها من نفس النسيج، مما أدى إلى تكرار. لمعالجة ذلك، قمنا بتقسيم المصفوفة تجريبيًا إلى مجموعات من 10 عينات. كانت هذه المجموعة تهدف إلى تجميع عينات إبيجينومية مشابهة وفرض الندرة داخل وبين المجموعات لمنع التكرار والإفراط في التخصيص. تم إدخال مصفوفة Epi-RP المجمعة إلى شبكة المعلم. كانت الأخيرة شبكة عصبية تتكون من ثلاث طبقات متصلة بالكامل. توقعنا المتجه المستفسر للجينات الثنائية باستخدام المصفوفة المنقولة (حيث تشير إلى عدد الجينات و تشير إلى عدد عينات TR) من مصفوفة Epi-RP. على وجه التحديد، كل صف من مصفوفة Epi-RP يتوافق مع جين، وكل عمود يتوافق مع عينة إبيجينومية، مع القيم في المصفوفة تمثل درجات الإمكانات التنظيمية (انظر المعادلة 2 لتفاصيل الحساب). من خلال نقل المصفوفة، نضمن أن أبعاد المدخلات والمخرجات للنموذج متوافقة. في هذه العملية، تم استخدام مجموعة الجينات المستفسر عنها كمجموعة إيجابية، واخترنا عشوائيًا 6000 جين خلفي كمجموعة سلبية. للاحتفاظ بمزيد من المعلومات، قمنا بتنفيذ دالة تنشيط سيغمويد مقاسة بالحرارة (TSS) في طبقة المخرجات:
حيث تشير إلى المدخلات و تمثل درجة الحرارة. تقوم هذه الدالة بتحويل قيم المدخلات إلى قيمة مخرجة تتراوح من صفر إلى واحد. مع اقتراب قيمة درجة الحرارة نحو اللانهاية، تقترب مخرجات الدالة من مخرجات دالة سيغمويد القياسية. على العكس، عند درجات حرارة منخفضة، تتغير المخرجات بشكل أكثر تدريجياً بالقرب من الصفر والواحد. تم تمثيل نموذج المعلم النهائي كما يلي:
حيث (تشير إلى أبعاد الطبقة المخفية) تشير إلى تمثيل الميزات المستخرجة من ملفات cisregulatory الكامنة المرتبطة بمجموعة الجينات المستفسر عنها. وتكون مصفوفات الوزن والانحياز المقابلة بين كل زوج من الطبقات هي و و و على التوالي. تم تدريب نموذج المعلم عن طريق تقليل دالة الخسارة التالية:
حيث تمثل الانتروبيا المتقاطعة الثنائية، حيث يركز نموذج المعلم على بناء مساحة الميزات ويستخدم الدرجات الملائمة كعلامات ناعمة لنموذج الطالب، مما يمكّن نموذج الطالب من التركيز أكثر على مهمة اختيار الميزات. قمنا بتدريب شبكة الطالب للتنبؤ بتمثيل الميزات منخفض الأبعاد المستخرج من الطبقة المتوسطة لشبكة المعلم عن طريق تغذية نفس البيانات إليها:
يتم استخدام قيد SGL في الطبقة الأولى من شبكة الطالب لاختيار الميزات المهمة من ملف cis-regulatory عن طريق “تخفيف” مصفوفة الوزن من خلال تنظيم L2 ضمن المجموعات وتنظيم L1 بين المجموعات:
تم تعريف دالة خسارة التقطير كما يلي:
تم تعريف دالة الخسارة النهائية لشبكة الطالب كما يلي:
حيث و تمثل معلمات التنظيم، هو وزن الطبقة الأولى من المتغيرات في المجموعة هو عدد المتغيرات في المجموعة ، و هو ناتج نموذج الطالب. قمنا بتربيع وجمع أوزان الطبقة الأولى من شبكة الطالب كما يلي:
حيث تمثل أوزان جميع العينات الإبيجينية. قد يؤثر اختيار حجم العينة على نتائج التنبؤ. اخترنا عددًا متغيرًا من العينات الإبيجينية بناءً على أوزان نموذج شبكة الطالب. كان الهدف هو اختيار حجم العينة الأنسب. أجرينا عدة جلسات تدريب للنموذج من خلال اختيار أعداد مختلفة من العينات الإبيجينية وحساب auROC لتقييم أداء كل نموذج مرشح. حددنا أن 10 عينات إبيجينية قدمت خيارًا معقولًا (الشكل التوضيحي 2e). ثم قمنا بتدريب نموذج شبكة عصبية (نموذج NN) باستخدام العينات الإبيجينية المختارة، حيث تم تمثيل المدخلات بواسطة . تشير إلى عدد العينات الإبيجينية المختارة. كان الناتج هو متجه الجين :
نحدد دالة الخسارة كما يلي:
في النهاية، أدخلنا X إلى النموذج المدرب مسبقًا لاشتقاق الجين المتوقع U-RP. تحتوي متجهات U-RP على معلومات تعتمد على السياق مستمدة من مجموعة جينات معينة. تمثل التغيرات في قيم هذه المتجهات خصوصية وصول الكروماتين (ATAC) وحالات النشاط (H3K27ac) مع مواقع الجينات.
دمج الإمكانات التنظيمية وتوقع نشاط المنظم النسخي
بعد الحصول على الإمكانات التنظيمية ثنائية الاتجاه، حصلنا في الوقت نفسه على معلومات حول الملف التنظيمي المقابل لمواقع الربط على مستوى الجينوم لـ TRs والملف التنظيمي المقابل للعناصر التنظيمية cis لمجموعة الجينات المستفسر عنها. كان هدفنا هو اشتقاق النشاط التنظيمي المتكامل لـ TRs الذي يمثل أفضل حالة حالية لتنظيم نسخ الجينات (ملاحظة إضافية A.8). وفقًا لذلك، قمنا بحساب
I-RP لكل TR:
يمكن أن يمثل درجة AUC بدقة قياس إثراء عامل النسخ . من خلال تحويل مجموعة الجينات المستفسر عنها إلى شكل ثنائي وحساب AUC لكل TR بناءً على درجة I-RP الخاصة به، قمنا بدمج نشاط TRs من الإبيجينية H3K27ac وATAC. ثم تم حساب درجة النشاط الناتجة كما يلي:
حيث تشير إلى النشاط النهائي لـ -th TR sample، تشير إلى -th AUC score للإبيجينية لـ -th TR sample، و تمثل العدد الإجمالي للأنماط الإبيجينية.
حساب درجات الإثراء والأهمية في تحليل ما بعد GWAS
أهمية المنظم النسخي. (1) اختر عشوائيًا 1000 متغير سببي و1000 متغير غير سببي ليكونا كخلفية. في الوقت نفسه، اختر أعلى وأسفل 25 TRs تم التنبؤ بها بواسطة TRAPT. (2) استخدم أداة التقاطع في BEDTools لحساب عدد التداخلات بين المتغيرات المختارة ومواقع الربط لكل TR. (3) احسب -قيمة الأهمية لكل TR باستخدام اختبار هايبرجومتريك:
حيث هو عدد المتغيرات السببية المرتبطة بـ TR، هو عدد المتغيرات المرتبطة بـ TR، هو عدد المتغيرات الخلفية، و هو عدد المتغيرات السببية في الخلفية.
درجة الإثراء (ES). (1) رتب TRs بترتيب تنازلي للنشاط. (2) احسب درجات ES الخاصة بهم كما يلي:
حيث هو المنظم النسخي -th و هو عدد TRs المختارة. هذه الدرجة هي إحصائية كولموغوروف-سميرنوف القياسية.
تقدير الأهمية. (1) قم بخلط TRs عشوائيًا وأعد حساب درجة الإثراء كـ . (2) كرر الخلط 1000 مرة وأنشئ هيستوجرام مطابق لتوزيع درجات الإثراء . (3) قدر -قيمة من خلال حساب التوزيع الذي هو أكبر من ES الملاحظ.
مقارنة بين TRAPT وأدوات ترتيب TR المماثلة
جمعنا مجموعة واسعة من مجموعات بيانات TR knockdown/knockout من KnockTF، واخترنا أعلى 500 جين تم التعبير عنه بشكل مفرط وتحت التعبير لتحليلها. كما قمنا بتجميع مجموعات بيانات من ربط TF من GTRD، واحتفظنا بجميع الجينات المستهدفة و66 مجموعة بيانات معيارية لـ TF من ليزا، بما في ذلك مجموعات الجينات المفرطة التعبير وتحت التعبير (ملاحظة إضافية A. 10 والجدول الإضافي 2). عند مقارنة مجموعات بيانات ربط TF، أزلنا البيانات المأخوذة من GTRD في مكتبات TR ChIP-seq الخلفية لـ TRAPT. استخدمنا مجموعة الأدوات غير المتصلة المتاحة على موقع الويب الخاص بالمستودع الرسمي لخوارزمية BART (https://github.com/ zanglab/bart2). بالمثل، طبقنا مجموعة الأدوات غير المتصلة المتاحة على
موقع الويب الخاص بالمستودع الرسمي لخوارزمية ليزا (https:// github.com/qinqian/lisa). استخدمنا الأداة للتحليل عبر الإنترنت المقدمة على موقع i-cisTarget (https://gbiomed.kuleuven.be/ apps/lcb/i-cisTarget/)، وحصلنا على نتائج تحليل ChEA3 عبر واجهة API المتاحة على موقعه الرسمي (https:// amp.pharm.mssm.edu/ChEA3).
البارامترات الفائقة وتدريب النموذج
أثناء تدريب نموذج المعلم لنموذج D-RP، قمنا بتعيين حجم الدفعة إلى 32 ومعدل التعلم إلى 0.01، وتدربنا عليه لمدة 100 دورة. بالنسبة لنموذج الطالب، قمنا بتعيين معدل التعلم إلى 0.01 وتدربنا لمدة 1000 دورة. تم استخدام معيار موحد عند تدريب نموذج المعلم، نموذج الطالب، ونموذج NN لنموذج U-RP، مع تعيين حجم الدفعة إلى 32 ومعدل التعلم إلى 0.001. تم خلط العينات عشوائيًا وتدريبها لمدة إجمالية قدرها 16 دورة.
دراسة الإزالة
دون التدخل في التنفيذ العام للنموذج، قمنا بإزالة “نموذج U-RP” و”نموذج D-RP” و”نموذج TR-RP” بشكل منفصل. تم تطبيق نفس الاستراتيجية على “نموذج TRAPT-H3K27ac الإبيجيني” و”نموذج TRAPT-ATAC الإبيجيني” و”نموذج peak-promoter.” كما أجرينا تجارب إزالة على تقطير المعرفة. أخيرًا، قمنا بحساب درجات MRR للنموذج بعد كل تعديل لمراقبة الانخفاض في أدائه، إن وجد. كان الهدف هو التحقق من فعالية كل من مكوناته. تم حساب MRR كما يلي:
حيث تشير إلى عدد TRs المتوقعة و تشير إلى ترتيب TR المتوقع الحالي.
فحص استقرار النموذج
استخدمنا الشبكة التي تم إنشاؤها باستخدام خوارزمية kNN لتوليد مجموعات بيانات مضطربة عن طريق إخفاء و من الروابط داخل الشبكة. تم توزيع هذه الروابط المخفية عشوائيًا لمحاكاة السيناريوهات الواقعية حيث تكون التفاعلات غير معروفة. عند تدريب النموذج، اعتبرنا هذه البيانات الإيجابية المخفية سلبية. بمجرد الانتهاء من تدريب النموذج، قمنا بحساب دقته المتوسطة (AP) لتقييم أدائه التنبؤي على مجموعة الاختبار. ساعدت هذه العملية في محاكاة المعلومات غير المعروفة في البيانات، ووفرت تقييمًا شاملاً لأداء النموذج. تم حساب AP كما يلي:
حيث و تمثل الدقة والاسترجاع، على التوالي، كما تم فرزها بواسطة العتبة .
علاوة على ذلك، قمنا بتطوير خدمة ويب متCorresponding (https:// bio.liclab.net/TRAPT). تم تصميم الموقع لقبول مجموعات الجينات مدخلات من المستخدمين للتحليل وتسمح بالاسترجاع السهل للنتائج التحليلية. لقد قمنا أيضًا بتضمين ميزة إشعار عبر البريد الإلكتروني. يعرض الموقع جميع درجات نشاط TR في صفحة النتائج، بالإضافة إلى الترتيب والدرجات الفردية لكل TR. كما يوفر تفاصيل التعليقات والمعلومات ذات الصلة بمراقبة الجودة لكل TR. قدمت واجهة التحليل نتائج كل مجموعة بيانات مرجعية، بما في ذلك تحليل التعبير التفاضلي وتوقعات TRAPT. علاوة على ذلك، قدمنا أيضًا تصورًا قائمًا على مخططات البركان من خلال تطبيق Shiny.https://shiny.posit.co/“). بالمقارنة مع الأدوات غير المتصلة بالإنترنت، توفر الأدوات عبر الإنترنت للتحليل ميزات إضافية لتصفح النتائج. لقد مكنت من تصور الهيكل البروتيني ثلاثي الأبعاد المتوقع لكل TR من خلال الاستفادة من التوقعات التي قدمها AlphaFold.. علاوة على ذلك، تضمنت الأدوات عبر الإنترنت متصفح الجينوملتسهيل تفاعل المستخدم مع المسارات الجينومية المرتبطة بكل TR.
مقاييس التقييم
في التحليل المقارن لخوارزميتنا مقابل طرق أخرى، استخدمنا ثلاثة مقاييس رئيسية لتقييم الأداء: المساحة تحت المنحنى (AUC) ومتوسط الترتيب العكسي (MRR). باختصار، قمنا أولاً بحساب ورسم عدد التنبؤات الصحيحة لـ TRs عبر رتب القطع التي تتراوح من 1 إلى 10 عند عتبات مختلفة. ثم تم quantifying الأداء باستخدام AUC. MRR هو معلمة مقياس تُستخدم لقياس الأداء العام لخوارزميات الترتيب..
ملخص التقرير
معلومات إضافية حول تصميم البحث متاحة في ملخص تقارير مجموعة ناتشر المرتبط بهذه المقالة.
توفر البيانات
جميع مجموعات البيانات التي تم تحليلها في هذه الدراسة متاحة للجمهور. تم الحصول على مجموعات بيانات تقليل/إزالة الجين TR من KnockTF ومجموعات بيانات ارتباط TF من GTRD. يمكن الوصول إلى مجموعة بيانات معيار ليزا فيhttp://lisa.cistrome.org/new_gallery/new_gallery.html. علاوة على ذلك، تم استرجاع شبكات تفاعل البروتينات (PPI) من قاعدة بيانات STRING (https://string-db.org/). تتوفر ملفات تعبير RNA-seq لسرطان الثدي من TCGA (https://portal.gdc.cancer.gov/بينما تتوفر ملفات تعبير RNA-seq للثدي من GTExhttps://www.gtexportal.org/home/ ). تتوفر مجموعات بيانات تسلسل RNA الناتجة عن تقليل تعبير ESR1 في مستودع تعبير الجينات (GEO) تحت رقم الوصول GSE37820. تم استرجاع مجموعة بيانات GWAS من causaldb (http://www. mulinlab.org/causaldb)، وبيانات H3K27ac المتعلقة بمرض الزهايمر متاحة تحت GSE65159. مجموعة بيانات خلايا الدم الجذعية البشرية متاحة على GitHub (https://gitlab.com/cvejic-group/مجموعة بيانات خلايا الجذع الجنينية البشرية متاحة تحت GSE75748، وتم الحصول على ملفات التعبير عن الأنسجة البشرية الطبيعية من GTEx.https://www. gtexportal.org/home/تم توفير بيانات المصدر مع هذه الورقة.
Lee, T. I. & Young, R. A. Transcriptional regulation and its misregulation in disease. Cell 152, 1237-1251 (2013).
Heintzman, N. D. et al. Distinct and predictive chromatin signatures of transcriptional promoters and enhancers in the human genome. Nat. Genet 39, 311-318 (2007).
Lambert, S. A. et al. The human transcription factors. Cell 172, 650-665 (2018).
Vaquerizas, J. M., Kummerfeld, S. K., Teichmann, S. A. & Luscombe, N. M. A census of human transcription factors: function, expression and evolution. Nat. Rev. Genet 10, 252-263 (2009).
Chen, E. Y. et al. Enrichr: interactive and collaborative HTML5 gene list enrichment analysis tool. BMC Bioinforma. 14, 128 (2013).
Puente-Santamaria, L., Wasserman, W. W. & Del Peso, L. TFEA.ChIP: a tool kit for transcription factor binding site enrichment analysis capitalizing on ChIP-seq datasets. Bioinformatics 35, 5339-5340 (2019).
Keenan, A. B. et al. ChEA3: transcription factor enrichment analysis by orthogonal omics integration. Nucleic Acids Res 47, W212-W224 (2019).
Roopra, A. MAGIC: A tool for predicting transcription factors and cofactors driving gene sets using ENCODE data. PLoS Comput Biol. 16, e1007800 (2020).
Herrmann, C., Van de Sande, B., Potier, D. & Aerts, S. i-cisTarget: an integrative genomics method for the prediction of regulatory features and cis-regulatory modules. Nucleic Acids Res 40, e114 (2012).
Wang, Z. et al. BART: a transcription factor prediction tool with query gene sets or epigenomic profiles. Bioinformatics 34, 2867-2869 (2018).
Qin, Q. et al. Lisa: inferring transcriptional regulators through integrative modeling of public chromatin accessibility and ChIP-seq data. Genome Biol. 21, 32 (2020).
Wang, S. et al. Modeling cis -regulation with a compendium of genome-wide histone H3K27ac profiles. Genome Res 26, 1417-1429 (2016).
Lotfollahi, M. et al. Mapping single-cell data to reference atlases by transfer learning. Nat. Biotechnol. 40, 121-130 (2022).
Li, H. et al. Inferring transcription factor regulatory networks from single-cell ATAC-seq data based on graph neural networks. Nat. Mach. Intell. 4, 389-400 (2022).
Zhang, Y. et al. TcoFBase: a comprehensive database for decoding the regulatory transcription co-factors in human and mouse. Nucleic Acids Res 50, D391-D401 (2022).
Zhang, Y. et al. CRdb: a comprehensive resource for deciphering chromatin regulators in human. Nucleic Acids Res 51, D88-D100 (2023).
Zhou, X. et al. TFTG: A comprehensive database for human transcription factors and their targets. Comput Struct. Biotechnol. J. 23, 1877-1885 (2024).
Wang, Y. et al. SEdb 2.0: a comprehensive super-enhancer database of human and mouse. Nucleic Acids Res 51, D280-D290 (2023).
Wang, F. et al. ATACdb: a comprehensive human chromatin accessibility database. Nucleic Acids Res 49, D55-D64 (2021).
Feng, C. et al. KnockTF: a comprehensive human gene expression profile database with knockdown/knockout of transcription factors. Nucleic Acids Res 48, D93-D100 (2020).
Chen, C.-H. et al. Determinants of transcription factor regulatory range. Nat. Commun. 11, 2472 (2020).
Yu, F. et al. Variant to function mapping at single-cell resolution through network propagation. Nat. Biotechnol. 40, 1644-1653 (2022).
Mirzaei, A., Pourahmadi, V., Soltani, M. & Sheikhzadeh, H. Deep feature selection using a teacher-student network. Neurocomputing 383, 396-408 (2020).
Simon, N., Friedman, J., Hastie, T. & Tibshirani, R. A sparse-group lasso. J. Computational Graph. Stat. 22, 231-245 (2013).
Voorhees, E. M. The TREC-8 Question Answering Track Report. (1999).
Muhar, M. et al. SLAM-seq defines direct gene-regulatory functions of the BRD4-MYC axis. Science 360, 800-805 (2018).
Nilsson, S. et al. Mechanisms of Estrogen Action. Physiological Rev. 81, 1535-1565 (2001).
Pei, X.-H. et al. CDK inhibitor p18INK4c is a downstream target of GATA3 and restrains mammary luminal progenitor cell proliferation and tumorigenesis. Cancer Cell 15, 389-401 (2009).
Carroll, J. S. et al. Chromosome-wide mapping of estrogen receptor binding reveals long-range regulation requiring the forkhead protein FoxA1. Cell 122, 33-43 (2005).
Xu, B. et al. The LIM protein Ajuba recruits DBC1 and CBP/p300 to acetylate ERα and enhances ERα target gene expression in breast cancer cells. Nucleic Acids Res 47, 2322-2335 (2019).
von Mering, C. et al. STRING: a database of predicted functional associations between proteins. Nucleic Acids Res 31, 258-261 (2003).
Cancer Genome Atlas Research Network. et al. The cancer genome atlas pan-cancer analysis project. Nat. Genet 45, 1113-1120 (2013).
Zheng, Z.-Z. et al. Super-enhancer-controlled positive feedback loop BRD4/ERα-RET-ERα promotes ERα-positive breast cancer. Nucleic Acids Res 50, 10230-10248 (2022).
de Leeuw, C. A., Mooij, J. M., Heskes, T. & Posthuma, D. MAGMA: generalized gene-set analysis of GWAS data. PLoS Comput Biol. 11, e1004219 (2015).
Wang, J. et al. CAUSALdb: a database for disease/trait causal variants identified using summary statistics of genome-wide association studies. Nucleic Acids Res. 48, D807-D816 (2020).
Schwartzentruber, J. et al. Genome-wide meta-analysis, finemapping and integrative prioritization implicate new Alzheimer’s disease risk genes. Nat. Genet 53, 392-402 (2021).
Subramanian, A. et al. Gene set enrichment analysis: a knowledgebased approach for interpreting genome-wide expression profiles. Proc. Natl Acad. Sci. USA 102, 15545-15550 (2005).
Benner, C. et al. FINEMAP: efficient variable selection using summary data from genome-wide association studies. Bioinformatics 32, 1493-1501 (2016).
Pan, Q. et al. VARAdb: a comprehensive variation annotation database for human. Nucleic Acids Res. 49, D1431-D1444 (2021).
Lu, T. et al. REST and stress resistance in ageing and Alzheimer’s disease. Nature 507, 448-454 (2014).
Kosoy, R. et al. Genetics of the human microglia regulome refines Alzheimer’s disease risk loci. Nat. Genet 54, 1145-1154 (2022).
Rangaraju, S. et al. Identification and therapeutic modulation of a pro-inflammatory subset of disease-associated-microglia in Alzheimer’s disease. Mol. Neurodegener. 13, 24 (2018).
Liu, D. et al. Targeting the HDAC2/HNF-4A/miR-101b/AMPK pathway rescues tauopathy and dendritic abnormalities in alzheimer’s disease. Mol. Ther. 25, 752-764 (2017).
Kumar, A. et al. Chemically targeting the redox switch in AP1 transcription factor . Nucleic Acids Res. 50, 9548-9567 (2022).
Roses, A. et al. Understanding the genetics of APOE and TOMM40 and role of mitochondrial structure and function in clinical pharmacology of Alzheimer’s disease. Alzheimers Dement 12, 687-694 (2016).
Cooper, Y. A. et al. Functional regulatory variants implicate distinct transcriptional networks in dementia. Science 377, eabi8654 (2022).
Porcellini, E., Carbone, I., lanni, M. & Licastro, F. Alzheimer’s disease gene signature says: beware of brain viral infections. Immun. Ageing 7, 16 (2010).
Haney, M. S. et al. APOE4/4 is linked to damaging lipid droplets in Alzheimer’s disease microglia. Nature https://doi.org/10.1038/ s41586-024-07185-7 (2024).
Nativio, R. et al. An integrated multi-omics approach identifies epigenetic alterations associated with Alzheimer’s disease. Nat. Genet 52, 1024-1035 (2020).
Ranzoni, A. M. et al. Integrative single-cell RNA-Seq and ATAC-Seq analysis of human developmental hematopoiesis. Cell Stem Cell 28, 472-487.e7 (2021).
Scarno, G. et al. Divergent roles for STAT4 in shaping differentiation of cytotoxic ILC1 and NK cells during gut inflammation. Proc. Natl Acad. Sci. USA 120, e2306761120 (2023).
Reizis, B. Plasmacytoid dendritic cells: development, regulation, and function. Immunity 50, 37-50 (2019).
Chu, L.-F. et al. Single-cell RNA-seq reveals novel regulators of human embryonic stem cell differentiation to definitive endoderm. Genome Biol. 17, 173 (2016).
Paul, S., Home, P., Bhattacharya, B. & Ray, S. GATA factors: master regulators of gene expression in trophoblast progenitors. Placenta 60, S61-S66 (2017).
Chia, C. Y. et al. GATA6 cooperates with EOMES/SMAD2/3 to deploy the gene regulatory network governing human definitive endoderm and pancreas formation. Stem Cell Rep. 12, 57-70 (2019).
Ritchie, M. E. et al. limma powers differential expression analyses for RNA-sequencing and microarray studies. Nucleic Acids Res. 43, e47 (2015).
Ang, Y.-S. et al. Disease Model of GATA4 mutation reveals transcription factor cooperativity in human cardiogenesis. Cell 167, 1734-1749.e22 (2016).
Singh, R. et al. TRAF4-mediated nonproteolytic ubiquitination of androgen receptor promotes castration-resistant prostate cancer. Proc. Natl Acad. Sci. USA 120, e2218229120 (2023).
Rosen, E. D. et al. C/EBPalpha induces adipogenesis through PPARgamma: a unified pathway. Genes Dev. 16, 22-26 (2002).
Tontonoz, P., Hu, E. & Spiegelman, B. M. Stimulation of adipogenesis in fibroblasts by PPAR gamma 2, a lipid-activated transcription factor. Cell 79, 1147-1156 (1994).
Koster, M. I., Kim, S., Mills, A. A., DeMayo, F. J. & Roop, D. R. p63 is the molecular switch for initiation of an epithelial stratification program. Genes Dev. 18, 126-131 (2004).
Qu, J. et al. Mutant p63 affects epidermal cell identity through rewiring the enhancer landscape. Cell Rep. 25, 3490-3503.e4 (2018).
Werth, M. et al. The transcription factor grainyhead-like 2 regulates the molecular composition of the epithelial apical junctional complex. Development 137, 3835-3845 (2010).
Bonasio, R., Tu, S. & Reinberg, D. Molecular signals of epigenetic states. Science 330, 612-616 (2010).
Gou, J., Yu, B., Maybank, S. J. & Tao, D. Knowledge distillation: a survey. Int J. Comput Vis. 129, 1789-1819 (2021).
Barrett, T. et al. NCBI GEO: archive for functional genomics data sets-10 years on. Nucleic Acids Res 39, D1005-D1010 (2011).
Kodama, Y., Shumway, M. & Leinonen, R. International nucleotide sequence database collaboration. the sequence read archive: explosive growth of sequencing data. Nucleic Acids Res 40, D54-D56 (2012).
ENCODE Project Consortium. The ENCODE (ENCyclopedia Of DNA Elements) project. Science 306, 636-640 (2004).
Bernstein, B. E. et al. The NIH roadmap epigenomics mapping consortium. Nat. Biotechnol. 28, 1045-1048 (2010).
Langmead, B. & Salzberg, S. L. Fast gapped-read alignment with Bowtie 2. Nat. Methods 9, 357-359 (2012).
Quinlan, A. R. & Hall, I. M. BEDTools: a flexible suite of utilities for comparing genomic features. Bioinformatics 26, 841-842 (2010).
Yu, G., Wang, L.-G. & He, Q.-Y. ChIPseeker: an R/Bioconductor package for ChIP peak annotation, comparison and visualization. Bioinformatics 31, 2382-2383 (2015).
Schmeier, S., Alam, T., Essack, M. & Bajic, V. B. TcoF-DB v2: update of the database of human and mouse transcription co-factors and transcription factor interactions. Nucleic Acids Res 45, D145-D150 (2017).
Hu, H. et al. AnimalTFDB 3.0: a comprehensive resource for annotation and prediction of animal transcription factors. Nucleic Acids Res. 47, D33-D38 (2019).
Mei, S. et al. Cistrome data browser: a data portal for ChIP-Seq and chromatin accessibility data in human and mouse. Nucleic Acids Res 45, D658-D662 (2017).
Oki, S. et al. ChIP-Atlas: a data-mining suite powered by full integration of public ChIP-seq data. EMBO Rep. 19, e46255 (2018).
Haeussler, M. et al. The UCSC genome browser database: 2019 update. Nucleic Acids Res. 47, D853-D858 (2019).
Danecek, P. et al. Twelve years of SAMtools and BCFtools. Gigascience 10, giab008 (2021).
Zhang, Y. et al. Model-based analysis of ChIP-Seq (MACS). Genome Biol. 9, R137 (2008).
Liu, Y., Shen, S. & Lapata, M. Noisy Self-Knowledge Distillation for Text Summarization. in Proceedings of the 2021 Conference of the North American Chapter of the Association for Computational Linguistics: Human Language Technologies. 692-703 (Association for Computational Linguistics, Online, 2021).
Kipf, T. N. & Welling, M. Variational Graph Auto-Encoders. stat 1050, 21 (2016).
Yuan, L., Tay, F. E., Li, G., Wang, T. & Feng, J. Revisiting knowledge distillation via label smoothing regularization. in Proceedings of the IEEE/CVF conference on computer vision and pattern recognition. 3903-3911 (2020).
Varadi, M. et al. Alphafold protein structure database: massively expanding the structural coverage of protein-sequence space with high-accuracy models. Nucleic Acids Res. 50, D439-D444 (2022).
Robinson, J. T., Thorvaldsdottir, H., Turner, D. & Mesirov, J. P. igv.js: an embeddable JavaScript implementation of the Integrative Genomics Viewer (IGV). Bioinformatics 39, btac830 (2023).
شكر وتقدير
تم دعم هذا العمل من قبل برنامج الابتكار في العلوم والتكنولوجيا في مقاطعة هونان [2024RC1062، 2024RC3212]؛ مؤسسة العلوم الطبيعية الوطنية في الصين [62171166، 62302206، 62031003]؛ مؤسسة البحث في المستشفى الأول التابع لجامعة جنوب الصين للمواهب المتقدمة [20210002-1005 USCAT-2021-01]؛ المختبر الرئيسي الإقليمي للعلوم المتعددة والذكاء الاصطناعي لأمراض القلب والأوعية الدموية [2023TP1047]؛ مؤسسة العلوم الطبيعية في مقاطعة هونان [2023JJ40594، 2023JJ30536]؛ برنامج البحث السريري 4310 في جامعة جنوب الصين [رقم 20224310NHYCGO5].
مساهمات المؤلفين
قام كل من C.L. و M.G. بتصميم الدراسة. طور كل من G.Z. و C.S. خوارزمية TRAPT. قام G.Z. و C.S. و M.Y. بتفسير النتائج وكتابة المخطوطة. قدم كل من L.L و Y.Z. و Y.L. و J.Z. ملاحظات نقدية خلال الدراسة وساعدوا في مراجعة المخطوطة.
يجب توجيه المراسلات والطلبات للحصول على المواد إلى ماوزو قوه أو تشونكوان لي.
معلومات مراجعة الأقران تشكر مجلة Nature Communications شين غاو والمراجعين الآخرين المجهولين على مساهمتهم في مراجعة هذا العمل. يتوفر ملف مراجعة الأقران.
ملاحظة الناشر: تظل شركة سبرينجر ناتشر محايدة فيما يتعلق بالمطالبات القضائية في الخرائط المنشورة والانتماءات المؤسسية.
الوصول المفتوح هذه المقالة مرخصة بموجب رخصة المشاع الإبداعي النسبية-غير التجارية-بدون اشتقاقات 4.0 الدولية، التي تسمح بأي استخدام غير تجاري، ومشاركة، وتوزيع، واستنساخ في أي وسيلة أو صيغة، طالما أنك تعطي الائتمان المناسب للمؤلفين الأصليين والمصدر، وتوفر رابطًا لرخصة المشاع الإبداعي، وتوضح إذا قمت بتعديل المادة المرخصة. ليس لديك إذن بموجب هذه الرخصة لمشاركة المواد المعدلة المشتقة من هذه المقالة أو أجزاء منها. الصور أو المواد الأخرى من طرف ثالث في هذه المقالة مشمولة في رخصة المشاع الإبداعي الخاصة بالمقالة، ما لم يُشار إلى خلاف ذلك في سطر الائتمان للمادة. إذا لم تكن المادة مشمولة في رخصة المشاع الإبداعي الخاصة بالمقالة وكان استخدامك المقصود غير مسموح به بموجب اللوائح القانونية أو يتجاوز الاستخدام المسموح به، فستحتاج إلى الحصول على إذن مباشرة من صاحب حقوق الطبع والنشر. لعرض نسخة من هذه الرخصة، قم بزيارة http:// creativecommons.org/licenses/by-nc-nd/4.0/. (ج) المؤلف(ون) 2025
المستشفى الأول التابع ومختبر اللجنة الوطنية للصحة الرئيسي لأبحاث والوقاية من العيوب الخلقية، كلية الطب في هينغيانغ، جامعة جنوب الصين، هينغيانغ، هونان 421001، الصين.مختبر هنان الإقليمي الرئيسي للعلوم المتعددة والذكاء الاصطناعي لأمراض القلب والأوعية الدموية، جامعة جنوب الصين، هينغيانغ، هنان 421001، الصين.قسم الكيمياء الحيوية وعلم الأحياء الجزيئي، كلية العلوم الطبية الأساسية، كلية الطب في هينغيانغ، جامعة جنوب الصين، هينغيانغ، هونان 421001، الصين.مدرسة الكمبيوتر، جامعة جنوب الصين، هينغيانغ، هونان 421001، الصين.المختبر الرئيسي للأمراض النادرة لدى الأطفال، وزارة التعليم، جامعة جنوب الصين، هينغيانغ، هونان 421001، الصين.مدرسة علوم وتكنولوجيا الذكاء، جامعة بكين للهندسة المدنية والعمارة، بكين 100044، الصين.ساهم هؤلاء المؤلفون بالتساوي: قوروي تشانغ، تشاو سونغ، مينغشوي يين.هؤلاء المؤلفون أشرفوا بشكل مشترك على هذا العمل: ماوزو قوه، تشونكوان لي. البريد الإلكتروني:guomaozu@bucea.edu.cn; lcqbio@163.com
TRAPT: a multi-stage fused deep learning framework for predicting transcriptional regulators based on large-scale epigenomic data
Received: 17 June 2024
Accepted: 1 April 2025
Published online: 16 April 2025
Check for updates
Guorui Zhang , Chao Song , Mingxue Yin , Liyuan Liu , Yuexin Zhang , Ye , Jianing Zhang , Maozu Guo (1) & Chunquan
It is challenging to identify regulatory transcriptional regulators (TRs), which control gene expression via regulatory elements and epigenomic signals, in context-specific studies on the onset and progression of diseases. The use of large-scale multi-omics epigenomic data enables the representation of the complex epigenomic patterns of control of the regulatory elements and the regulators. Herein, we propose Transcription Regulator Activity Prediction Tool (TRAPT), a multi-modality deep learning framework, which infers regulator activity by learning and integrating the regulatory potentials of target gene cis-regulatory elements and genome-wide binding sites. The results of experiments on 570 TR-related datasets show that TRAPT outperformed state-of-the-art methods in predicting the TRs, especially in terms of forecasting transcription co-factors and chromatin regulators. Moreover, we successfully identify key TRs associated with diseases, genetic variations, cell-fate decisions, and tissues. Our method provides an innovative perspective on identifying TRs by using epigenomic data.
The intricate patterns of gene regulation are programmed by multiple upstream transcriptional regulators (TRs), such as transcription factors (TFs), transcription co-factors (TcoFs), and chromatin regulators (CRs), that can mediate the regulatory signals between promoters and distal enhancers . The onset of diseases is often associated with aberrant patterns of gene expression, underscoring the importance of identifying the TRs that control key programs of gene expression.
Advancements in ChIP-seq and ATAC-seq techniques have enabled the clear illustration of cis- and trans-regulatory landscapes. The binding affinities of genomic TRs in conjunction with epigenetic information, such as histone modifications and chromatin openness, determine the cell-specific regulatory activities of TRs . Moreover, numerous studies have shown that TFs bind to specific cis-regulatory sequences within the genome, including enhancers and promoters, to modulate the
expression of their target genes . Given the complexity of gene regulation, using a large amount of epigenomic data to identify the upstream synergistic regulatory features of genes is imperative for predicting TRs. A vast amount of epigenomic data, including ATACseq, DNase-seq, and ChIP-seq, have been accumulated due to rapid advances in high-throughput sequencing technologies. A major challenge in this context is to comprehensively collect and process these datasets from various sources. Furthermore, datasets from different origins encounter significant issues, including interference by noise, batch effects, and data redundancy. Consequently, it remains challenging to integrate these datasets, capture useful representations, and filter out noise.
A number of methods have been proposed to infer upstream TRs by using functional gene sets, including Enrichr , TFEA.ChIP , ChEA3 , MAGIC , i-cisTarget , BART , and Lisa . Enrichr, TFEA.ChIP, ChEA3, and MAGIC use gene sets as inputs to predict TRs through enrichment analysis. These approaches involve statistical testing based on overlaps between the target genes of TRs and the input genes. Although they are capable of quick analyzes, they do not incorporate detailed information on cis-regulatory elements (CREs). As transcription factors function by binding to regulatory elements, information on the cisregulatory profile is crucial for accurately inferring the regulators. i-cisTarget matches the CREs on the genome to predict TF activity through enrichment analysis. Unlike methods relying solely on gene sets, i -cisTarget uses CREs to more accurately simulate TF binding. However, this algorithm uses only CREs associated with the input gene set, which is inadequate for simulating the cis-regulatory profile of the entire genome. BART solves the problem of incomplete coverage of the cis-regulatory profile by inferring it from a large amount of H3K27ac ChIP-seq data through the regression-based MARGE algorithm. Lisa, known as “MARGE second generation,” enhances prediction accuracy by incorporating DNase-seq data alongside H3K27ac ChIP-seq data to infer gene-related cis-regulatory profiles. Although BART and Lisa solve the problem of incomplete coverage of the cis-regulatory profile (ICCP), there is an inherent bias in TR binding that we refer to as transcriptional regulator binding preference (TRBP). Essentially, TRs are predisposed to associate with regions of active chromatin. More importantly, all currently available methods are limited to inferring upstream regulatory elements by using gene sets, but no technique is available for deducing the genome-wide binding sites of the TRs. There is an urgent need to develop approaches that consider the bidirectional regulatory relationships of cis-regulatory elements.
The use of epigenomic multi-omics data is fraught with complexity, including the presence of cross-model talk and noise. Prevalent algorithms use only traditional regression-based methods, such as Lisa, and ignore the effects of cross-model talk and noise when integrating multi-omics data. Moreover, the relationships between multi-omics data are not linear, but form a complex network. Deep learning algorithms have achieved considerable success in solving these specific biological problems . The initial step in applying datadriven deep learning approaches involves the extensive collection and processing of epigenetic data. In past work, we have developed several epigenetic regulatory databases, including TcoFBase , , and ATACdb , that can extend the scope of epigenomic data. The transcription regulation databases TcoFBase, CRdb, and TFTG contain a large amount of data on transcription regulators, while SEdb and ATACdb, as epigenomic databases, contain the most comprehensive data on enhancers and chromatin accessibility. By integrating a large amount of epigenomic resources, we have constructed the most comprehensive epigenomic feature library available. Integrating such rich epigenomic data with cutting-edge deep learning techniques provided an unprecedented opportunity to unravel the complex landscapes of the epigenome.
In this study, we propose a data-inspired deep learning framework, called the TRAPT, that can leverage large-scale epigenomic
datasets to assimilate advanced models of knowledge distillation and graph convolutional neural networks. We designed a multi-stage fusion-based deep learning approach to simultaneously integrate signals from the target gene cis-regulatory elements within the gene sets and the genome-wide binding sites of TRs, with the aim of obtaining the optimal representation of TR activity and predicting the key TRs for gene sets with context-specific regulation. To assess the effectiveness of our method, we predicted transcription factors, co-factors, and chromatin regulators on up to 570 TR knockdown/knockout datasets from the KnockTF database. Benchmark tests were conducted against established tools, such as Lisa, BART, i-cisTarget, and ChEA3, and their results showed that TRAPT outperformed them in terms of predicting TR activity. We also leveraged TRAPT in a study on Alzheimer’s disease to successfully identify the key relevant TRs, such as REST. We ultimately applied TRAPT to datasets on human cell development and normal human tissues. It successfully predicted the critical regulatory factors controlling cell-fate decisions as well as tissue-specific regulators. It is easy to use, and can be accessed either through an online interface (https://bio.liclab.net/TRAPT) or via local installation (https://github.com/TOSTRING-Z/TRAPT).
Results
Overview of TRAPT
TRAPT is a multi-omics framework of integration that is designed for inferring TR activity from a set of queried genes. In simple terms, the model takes interest genes as input and outputs the activity score for each TR (Fig. 1a and Supplementary Fig. 1a). TRAPT applies a multistage fusion-based strategy to address the issues of TRBP and ICCP, which correspond to the prediction of downstream regulatory potential (D-RP) for transcription regulators (TRs) based on their genome-wide binding sites and upstream regulatory potential (U-RP) for target genes derived from their cis-regulatory elements (definitions of upstream and downstream are provided in Supplementary Note A.9). Therefore, we divide the model into the following key steps: (1) calculating the epigenomic regulatory potential (Epi-RP) and transcriptional regulator regulatory potential (TR-RP) (Figs. 1b), (2) predicting the D-RP of each TR with respect to the genes (Figs. 1c), (3) predicting the context-specific U-RP of the queried gene set (Figs. 1d), and (4) using the predicted regulatory potential from steps 2 and 3 to estimate the activity of TRs (Fig. 1e, f). To predicting the D-RP is a timeconsuming task that does not involve calculations related to the user’s input gene set. Thus, with a modular approach, TRAPT does not repeat steps 1 and 2; instead, the pre-constructed Epi-RP, TR-RP, and D-RP serve as inputs for the subsequent modules (Supplementary Fig. 1a). We now elaborate on the details of each of the above steps.
In the first step, to calculate the regulatory potential of the epigenomes and TRs, we first collected over 20,000 datasets of epigenomic samples, including 1329 ATAC-seq, 1465 H3K27ac ChIP-seq, and 17,227 TR ChIP-seq datasets, and then subjected them to rigorous preprocessing. We then computed regulatory potential (RP) for each gene using large-scale epigenome data and a background knowledge library of TRs. A uniform weight decay strategy was applied to the epigenomic data, while a context-specific weight decay approach was implemented for individual TRs to capture their distinct regulatory patterns and scopes (see the Methods section) (Fig. 1a). We compared our findings with those of Chen et al., who classified TRs into long- and short-range categories (Supplementary Data 7), and found a significant overlap between the types of TRs identified in our analysis and those discovered by them (Supplementary Figs. 1f, g). All the RPs were integrated into two distinct components, Epi-RP and TR-RP, which served as the input in step 2.
The second step focuses on integrating Epi-RP and TR-RP to predict the TR-context-specific D-RP of each TR. The main challenge lies in integrating the differential omics predictions of TR with the relationships to epigenomic samples, as well as aggregating the
Fig. 1 | Overview TRAPT. a The simplified flowchart of TRAPT indicates that the process of model inference comprises three components: an input gene set, an inference by the model, and TR activity as the output. TRAPT only requires a gene set as input and provides results through online or offline methods, with the online service providing enhanced features of visualization. b The TR-RP regulatory potential model was used to calculate the TR-RP matrix, and the epigenome-RP regulatory potential model was used to compute the Epi-RP matrix. c TRAPT predicts the regulatory potential associated with the genome-wide binding sites of the TRs. The inputs to TRAPT consist of preprocessed TR-RP and Epi-RP matrices, which are integrated to form a regulatory potential matrix and an adjacency graph. We first used a conditional variational autoencoder as the teacher network to learn the latent representation h. Subsequently, a graph variational autoencoder was applied as the student network to reconstruct the TR-epigenome adjacency graph, enabling it to learn its own network structure and latent feature representation from the teacher network. Finally, we performed an aggregation operation using
the reconstructed TR-epigenome adjacency graph and the input Epi-RP matrix to obtain the matrix of the regulatory potential associated with the genome-wide binding sites of the TRs. d TRAPT predicts the upstream regulatory potential associated with the query gene. First, epigenomic samples are grouped based on their correlation with the query gene vector. Then, the teacher model extracts feature maps to guide the student model in selecting non-redundant samples using SGL constraints. Finally, a nonlinear neural network model is retrained to generate an upstream regulatory potential matrix. e The predicted matrices of the regulatory potential associated with the genome-wide binding sites of the TRs, the regulatory potential of the target gene cis-regulatory elements, and the TR regulatory potential are integrated through matrix operations to obtain the I-RP matrix. f The AUC score of each TR sample in the I-RP matrix was first computed with the queried gene set. The TR AUC scores from all epigenetic groups were integrated to derive the final activity score for each TR.
regulatory potential signals corresponding to the epigenomic samples. Given the excellent performance of graph convolutional neural networks in network optimization and node information aggregation. Therefore, we reformulated the regulatory potential prediction problem into a network optimization task. With the input of the Epi-RP and TR-RP matrices generated in step 1, the k-nearest neighbors (kNN) algorithm was applied to construct a heterogeneous network between the TRs and epigenomic samples (e.g., CD4+, CD8+ H3K27ac/ATACseq samples), which served as the initial epigenomic regulatory network (ERN). The edges in this network represented the potential tissue/cell type-specific associated regulation. This network is then optimized through a multi-modal knowledge distillation model, referred to as the D-RP model. Based on the network, we developed a multi-modal epigenome guided knowledge distillation model, named the D-RP model, to optimize the initial ERN and aggregate the epigenetic regulatory potential score. Specifically, the constructed regulatory potential matrix was input into the teacher model, a conditional variational autoencoder (CVAE), to learn distributionally smoothed joint embeddings of TR and epigenome samples by integrating multi-modal features. Concurrently, the constructed ERN was used as input for the student model. The model employed a variational graph autoencoder (VGAE) to learn low-noise, cross-modal, and distributionally unified representations. During training, the student model’s parameters were constrained by the teacher model’s omics discrimination knowledge, enabling the student model to further smooth its shallow embedding representations (Supplementary Fig. 3d). This constrained learning approach enhances the model’s robustness against overfitting and strengthens its generalization ability. The output of this step is the D-RP matrix, which represents the aggregated activity of regulatory elements near gene regions.
Inspired by an effective strategy that select important epigenomic samples from data containing noise and integrating them , in the third step, we developed the U-RP model, a knowledge distillation model constrained by low-dimensional epigenomic embeddings, to infer the regulatory potential of target gene cis-regulatory elements. The U-RP model takes the Epi-RP matrix and a queried gene set as inputs. The teacher model generates robust low-order representations of epigenomic data, while the student model learns these representations with constrained weights, enabling the selection of key epigenomic samples . During training, the teacher model extracts regulatory potential features associated with the queried genes, providing soft labels for the student model. Subsequently, the student model performs key epigenomic samples selection by learning these soft labels using a network architecture equipped with sparse group lasso (SGL) . By grouping the matrix of regulatory potentials based on the SGL according to its relevance to the queried genes, the student model imposed sparsity-related constraints both within and between groups. Samples within a group represented profiles of highly similar regulatory elements that may contain highly redundant samples. Unlike most linear methods of epigenomic sample selection, the U-RP model employed a nonlinear deep learning strategy, incorporating sample similarity constraints to reduce redundancy. This enabled precise selection of non-redundant, non-linearly combined epigenomic samples. The selected samples’ RP was used to construct a multi-layer neural network, with the fitted potential serving as the U-RP model’s output. The output of this step is the U-RP vector, which contains context-dependent information about chromatin accessibility (ATAC) and activity states ( H 3 K 27 ac ) associated with the queried genes.
The final step integrates the outputs of the D-RP and U-RP models to estimate TR activity. The input for this step includes the TR-RP matrix, D-RP matrix and U-RP vector. We then obtained the integrated regulatory potential (I-RP) of both modalities through the elementwise addition of the normalized TR-RP matrix to the D-RP matrix, followed by its element-wise multiplication with the U-RP vector. We subsequently quantified the association between each TR within both
modalities and the set of queried genes by using the area under the ROC curve (AUC) . Finally, The RP scores of the corresponding TRs from both modalities were merged to obtain the final, combined RP score. In summary, TRAPT integrated the regulatory potential of genome-wide binding sites of TRs and the regulatory potential of target gene cis-regulatory elements to infer the key TRs that regulate the queried gene set.
TRAPT demonstrates state-of-the-art performance on benchmark datasets
The performance of TRAPT was assessed using the “Target TR rank” metric, which evaluates the algorithm’s ability to predict the ranking of transcriptional regulators based on their regulated gene sets. For instance, when analyzing differentially expressed genes in a GATA6 knockout experiment, a higher ranking for GATA6 indicates better algorithm performance. To conduct a comprehensive evaluation, we integrated 570 TR knockdown/knockout datasets from the KnockTF database (Supplementary Note A. 1 and Supplementary Data 5). After performing quality control, processing, and differential expression analysis, the top-ranking upregulated and downregulated genes were selected from each RNA-seq dataset as inputs to TRAPT. The performance was then evaluated by analyzing the ranking of the target transcriptional regulators.
We compared TRAPT with several methods that use gene sets as inputs, including Lisa, BART, and i-cisTarget, which uses TR-ChIP-seq data as the background. Moreover, we evaluated the conventional method of enrichment analysis, ChEA3, which primarily uses TRrelated gene sets as its background (Supplementary Data 6). We comprehensively assessed the performance of the models by using various criteria, including the numbers of the top-10 and top-N TFs recovered, and their overall performance in terms of TF recovery. TRAPT delivered results that were better than those of the secondbest method (i.e., Lisa) in terms of the number of top-10 TFs recovered (Fig. 2a). Compared with the classic i-cisTarget method, its performance in predicting the top-10 TFs improved by over 200%. Moreover, TRAPT was significantly superior to conventional approaches to enrichment, such as ChEA3, which underscores the advantages of models predicated on the binding of transcription regulators. We subsequently calculated the number of correctly predicted TFs from cutoff ranks 1 to 10 at various thresholds, and assessed the performance of the models by using the AUC (Fig. 2a). TRAPT clearly delivered the best predictive performance (AUC, 0.643). Additionally, the mean reciprocal rank (MRR) results (Fig. 2a) showed that the overall performance of TRAPT (MRR, 0.067) was superior to that of Lisa by (MRR, 0.057), and to that of BART by (MRR, 0.038). These results demonstrated TRAPT’s superior ability to predict TFs.
While previous methods have primarily focused on predicting the activity of TFs, the targeted collection of high-quality ChIP-seq data for transcription TcoFs and CRs in our approach (see the Methods section) enabled TRAPT to provide a more comprehensive prediction of various types of TRs. To conduct a deeper comparison, we evaluated the performance of the methods across TF, TcoF, and CR subsets. We found that TRAPT significantly outperformed currently available methods in predicting the TcoFs and CRs (Fig. 2b, c). We observed a significant decline in Lisa’s performance in predicting TcoFs compared with its performance in TF prediction (where it was second best; Figs. 2b and Supplementary Data 8). This occurred possibly because Lisa contains extensive data on TFs and CRs, but is lacking in TcoF data. Moreover, TRAPT’s performance in predicting chromatin regulators far surpassed that of Lisa (Fig. 2c). Its significant advantages in predicting TFs, CRs, and TcoFs was attributed to its use of a multi-stage strategy of fusion as well as its extensive library of TRs and epigenomic backgrounds.
TRAPT’s superior performance was not solely due to its use of additional background data on TRs. To illustrate this, we provided
Fig. 2 | Evaluation of TRAPT and competing methods on TR knockdown/ knockout and TF binding datasets. a (1) The number of TFs accurately identified by different methods, where the -axis represents the number of target TFs ranked within predictions of the top 10 by each method, and the -axis represents the different methods considered: TRAPT, Lisa, BART, i-cisTarget, and ChEA3. (2) Line graph depicting the accurate prediction of TFs in knockdown/knockout experiments by various computational models, where the -axis represents the number of target TFs ranked within predictions of the top N by each method. The upper-left corner shows the area under the curve (AUC) for each method. (3) Bar graph showing the MRR scores of the TFs, with higher scores reflecting superior performance. b, c Subsequent panels maintain the formats of the panels (a), and extend the analysis to TcoFs and CRs to demonstrate the predictive capability and
accuracy of each method. d The MRR scores for protein families from the TR knockdown/knockout datasets, with red indicating the upregulated set and blue denoting the downregulated set. The intensity of each color signifies the magnitude of the score. e Assessment of the performance of three methods on TR target genes from the KnockTF benchmark dataset ( ), by using only the TR background library derived from Cistrome. Assessment of the performance of five methods on TR target genes from the Lisa benchmark dataset ( ), using only the TR background library derived from Cistrome. The box plot illustrates the scaled ranks of the target TRs according to different models. Middle line inside each box represents the median, upper and lower bounds of the box represent the third and first quartiles, respectively. -values are calculated by the two-sided T-test without adjustments.
TRAPT as well as competing methods (Lisa and BART) with the same background data on TRs from the Cistrome database, and used KnockTF data as the benchmark. TRAPT outperformed Lisa by and BART by in terms of overall performance, even when using the same background data (Fig. 2e). Additional experimental analyzes were conducted on the TRAPT-Cistrome strategy to reinforce our conclusions. Specifically, we assessed the performance of TRAPT across three categories: TF, CR, and TcoF. TRAPT outperformed Lisa by and BART by in the top-10 ranking of TFs based on AUC scores (Supplementary Fig. 2b). We evaluated the overall performance of TRAPT for CR and TcoF, on which it surpassed Lisa by and BART by , respectively (Supplementary Fig. 2b). We
also validated the methods using Lisa’s benchmark dataset and the same background data as the competing methods. The results also showed that TRAPT delivered the best performance (Fig. 2f).
We subsequently used target genes derived from differential expression and the binding of TFs, respectively, to explore the performance of different methods across various protein families. When using data on the target genes from TR knockout/knockdown and TR ChIP-seq, the results showed significant discrepancies for certain protein families (Fig. 2d and Supplementary Fig. 2a). For example, the performance on the TR knockdown/knockout datasets was notably superior for CP2- and RXR-like families compared with that on the datasets of TF binding, while the opposite outcomes were observed for
families such as zf-C2H2, IRF, THR-like, and CSD. This difference was likely due to secondary transcriptional effects that occurred as a result of perturbations to the TRs, which were not directly linked to the original TFs . The results also indicated the potential for substantial impacts from secondary effects. Finally, a potential issue that may arise due to the vast amount of TR and epigenomic data was the slow speed of the algorithm. We benchmarked the runtimes of the TRAP, Lisa, and BART tools to account for this (Supplementary Fig. 1d). TRAPT surpassed the Lisa and BART algorithms in terms of speed, particularly in predicting the activity of individual TRs (Supplementary Fig. 1e).
Multi-stage fusion strategy boosts prediction of transcriptional regulators
We conducted extensive ablation tests to investigate the potential benefits of a multi-stage fusion-based strategy for predicting TRs. The U-RP model simulated the regulatory potential of target gene cisregulatory elements to capture their context-specific epigenetic state. When the U-RP model was removed from our method, there was a significant decline in the overall performance of the method (Figs. 3a, b and Supplementary Fig. 3f). This showed that the U-RP model reasonably represented the epigenetic state of the set of input genes. The D-RP model predicted the epigenomic profile corresponding to the TR, and considers the TR’s preference for the genome under specific conditions. Our approach was unique in that it considered the activity of TR-related genome-wide binding sites. By combining the regulatory potential of TRs with that of the elements to which they bind, our method provided a comprehensive context-specific insight into TR function. To test its usefulness, we removed the D-RP model, and subsequently observed a significant decline in the overall performance of the method (Fig. 3a). This further demonstrated that accounting for the activity of regulatory elements in TR binding was highly effective in improving predictive performance. Furthermore, we were able to discern the regulatory preferences of each TR by calculating the ratio of its binding to distal enhancers. We thus developed specific regulatory potential models for each TR to describe their regulatory patterns (Supplementary Note A.6). Upon removing the TR-specific model of the regulatory potential, the overall performance of the basic model of regulatory potential declined in comparison with that of the specific model of regulatory potential (Figs. 3d and Supplementary Fig. 2d).
TRAPT integrates multiple epigenomic features to predict the final TR activity. To gain a deeper understanding of the capabilities of each epigenomic module within TRAPT, we evaluated its predictive performance on target TRs. The results showed that the TRAPTH3K27ac and TRAPT-ATAC epigenetic models exhibited superior predictive power for the upregulated and downregulated sets, respectively (Fig. 3g). Moreover, a significant drop in overall performance was observed when all epigenetic modules were removed, such that only the peak-in-promoter model remained (Fig. 3g, h). Moreover, the overall performance of the model declined as each epigenetic module was gradually removed (Fig. 3h). These findings suggested that TRAPT effectively integrated features from different epigenomic modules to deliver unbiased predictive performance. In further ablation experiments, we found that compared to the results obtained without knowledge distillation (NKD), the model using knowledge distillation (KD) demonstrated an improvement of on the KnockTF benchmark dataset (Fig. 3c) and an improvement of on the Lisa benchmark dataset (Fig. 3e). For the local performance metrics in predicting the top ten TRs, the KD group significantly outperformed the NKD group, with an AUC score exceeding that of the NKD group by 8 percentage points (Fig. 3e). By dividing the data into training and validation sets for the D-RP and U-RP models, a rapid decrease in the losses on both sets was observed (Supplementary Fig. 2c and Supplementary Fig. 3a), with and without knowledge distillation. Meanwhile, the D-RP student model converged more quickly with knowledge distillation and achieved higher final accuracy
(Supplementary Fig. 3b). These results demonstrated that the use of knowledge distillation did not lead to model overfitting.
We inputted the TR-RP and Epi-RP matrices to generate a ground network of TRs and epigenomes by using the kNN algorithm. The D-RP model was designed to optimize the links between the TRs and epigenomes based on the observed links, while also restoring missing links. We thus evaluated the D-RP model based on its capacity for link prediction. The observed links were divided into training, validation, and test sets to simulate the missing links. By training the model on the training set and then checking the recovery of missing links on the test set, the ability of the D-RP model to infer the relationship between the TRs and epigenomes were evaluated. We observed that the losses incurred by both the teacher and student networks on the validation set decreased rapidly during training (Supplementary Fig. 3a), and their values of the area under the receiver operating characteristic (auROC) curve and the area under the precision-recall curve (auPRC) finally reached 0.81 and 0.84 on the test set, respectively (Supplementary Fig. 3c). Given the potential for a significant number of falsenegative connections in empirical scenarios, we masked varying proportions of links to evaluate the stability of the model under different conditions of missing data. The results demonstrated that as the number of masked edges increased (up to a maximum of ), the recovery-related performance of the model remained robust, with the auPRC exceeding 0.82 and the average precision (AP) exceeding 0.8 (Supplementary Fig. 3e). The recovery-related effect of the model was thus satisfactory, and reflected the stability of the D-RP model in case of missing disturbances. We subsequently tested the performance of the U-RP model. It is designed to predict cis-regulatory profiles based on the queried gene sets and the Epi-RP matrix. We observed a rapid decline in the loss of the U-RP model on both the training and validation sets, regardless of whether knowledge distillation was used (Supplementary Fig. 2c and Supplementary Fig. 3a). A key challenge for the U-RP model is to select important epigenomic samples from redundant data, as they are expected to best represent the epigenetic state of the current context-dependent gene set. To address this challenge, we computed the performance of the model under different scenarios of sample selection. We observed that the rate of improvement in its performance significantly decreased when 10 features were chosen. This finding aligns with the conclusions of past research (Supplementary Fig. 3g).
Finally, we compared the performance of TRAPT on upregulated and downregulated gene sets, and found that its predictions were better for downregulated than upregulated sets (Fig. 3f). This result indirectly proved that transcriptional activators were more common than transcriptional repressors (Supplementary Fig. 3g). We also found that most TRs either acted as either transcriptional activators or repressors, with a few, such as CTCF, NANOG, FOXA1, and ESR1, having dual functions (Fig. 3i). In conclusion, TRAPT accurately predicted transcriptional activators, repressors, and dual functions.
TRAPT predicts key transcriptional regulators in the ESR1 knockdown study
ESR1 is a key transcriptional factor associated with the ER-positive subtype of breast cancer, and significantly influences its development and progression by mediating the aberrant expression of numerous downstream risk-related genes. To validate TRAPT’s ability to identify key TRs in disease, we applied it to a gene set derived from human MCF7 ER+ breast cancer cells subjected to siRNA-mediated ESR1 knockdown. When given the differential gene set before and after ESR1 knockdown (Supplementary Fig. 4a, Supplementary Note A. 2 and Supplementary Data 9), TRAPT accurately predicted the transcription factor ESR1 as occupying rank 1 in the downregulated gene set and rank 17 in the upregulated gene set (Fig. 4a). This result highlights ESR1’s dual role in both activating and repressing genes in breast cancer . Moreover, TRAPT identified the other top-ranking ESR1
associated with cancer-related transcription factors, transcription cofactors, and chromatin regulators such as FOXA1, EP300, and MED1 (Figs. 4d and Supplementary Fig. 4b). For example, GATA3 is a determinant transcription factor in mammary luminal cell fate . The pioneer factor FOXA1 influences the onset and progression of breast cancer by modulating genomic accessibility . The histone acetyltransferase EP300 acetylates ESR1, enhancing the expression of ESR1
target genes in breast cancer cells . Furthermore, the top-ranking TRs from the STRING database were involved in high-frequency interactions with one another (Fig. 4b). The co-expression analysis of the TCGA breast cancer dataset also revealed a strong relationship among the TRs (Figs. 4c, Supplementary Note A. 3 and Supplementary Data 10), particularly GATA3, FOXA1, and ESR1. We also detected the same phenomenon in an analysis of GTEx breast tissue samples
Fig. 3 | Evaluation of the performance of TRAPT in TR knockdown/knockout experiments on differential gene sets from the KnockTF database. a The bar chart represents MRR scores of the model after each module was removed. Higher scores reflect better performance. b The grouped bar chart shows the first, five, and 10 highest-ranking TRs that were correctly predicted. We progressively removed UREA, D-RP, and the specific TR-RP model to assess the impact of each module on model performance. c The bar chart represents MRR scores of TRAPT, where “TRAPT-KD” refers to the use of knowledge distillation and “NKD” refers to the model without knowledge distillation. d The number of target TRs accurately identified among the top 10 using the specific and basic regulatory potential models. e Evaluation of the performance of the KD-TRAPT model and the NKDTRAPT model using Lisa benchmark data. f Sunburst chart displaying the MRR scores of all TRs in the upregulated and downregulated gene sets. The top-ranking TR is highlighted. The scatter plot, where the size of the points represents the normalized MRR scores of target TRs. The right side displays the normalized MRR
scores for the upregulated and downregulated groups in the TRAPT-H3K27ac epigenetic model and the TRAPT-ATAC epigenetic mode. The left side of the plot shows the normalized MRR scores of TRAPT along with the peaks in the promoter model for the upregulated and downregulated groups. Red and blue dashed lines correspond to the upregulated and downregulated sets, respectively. The gray dashed line indicates the baseline reference, while points overlapping with the lines represent consistent performance between the two methods. h Bar chart representing MRR scores of the model after the removal of each epigenetic feature. The last bar represents the peak-in-promoter model once all epigenetic modules of TRAPT had been removed. i Scatter plot illustrating the predicted ranking of the TRs. The left side represents upregulated gene sets while the right side represents downregulated gene sets. CTCF, NANOG, FOXA1, and ESR1 had high ranks in both the upregulated and downregulated gene sets, indicating their potential dual functions as transcriptional activators and repressors.
(Supplementary Fig. 4c and Supplementary Note A.3). Overall, TRAPT successfully identified ESR1 and associated transcription cofactors and chromatin regulators, as well as the potential interactions between these proteins and their genomic binding patterns, to validate the efficacy of TRAPT.
The D-RP score reflects the epigenetic status of the TR. We combined it with the regulatory potential of the TR to better represent its activity. In theory, representations of TRs that incorporate epigenetic information should be able to clearly distinguish between the genes that they regulate. To validate this, we categorized the D-RP scores of the identified TRs into the queried genes and a background gene set. The top-ranking TRs, including the transcription factor ESR1 as well as its associated co-factors and chromatin regulators, scored significantly higher on the queried gene set than on the background gene set. ESR1 was the most significant among the TRs in both the ATAC and H3K27ac contexts (ATAC: , H3K27ac: ), indicating that TRAPT effectively captured the epigenetic information of ESR1 in cancer. Moreover, the importance of other top-ranking TRs decreased with descending rank, including for NCOA3, NIPBL, and FOXA1 (Figs. 4e and Supplementary Fig. 4d). Notably, HDGF was at the bottom of the predictive rankings, with significantly lower importance compared to other TRs (ATAC: -value , H3K27ac: -value ). These findings showed that the D-RP scores of TRs could be used to accurately discriminate between the genes that they regulate. To further validate the predictive capability of the interpolated I-RP scores, we constructed activity profiles of both interpolated and non-interpolated TRs. We observed that the top-ranking TRs with high I-RP scores yielded stronger signals for the corresponding queried gene sets (Fig. 4g).
ESR1 is capable of binding to enhancer elements that regulate distal target genes, such as ERα-occupied super-enhancers (ERSEs) , and TRAPT leverages distal information through specialized models of regulatory potential. To further investigate and predict the characteristics of genomic binding of the TRs, we categorized the enhancers near the queried genes into distal and proximal enhancers, and plotted the profile of the enhancer of each predicted TR. The predicted TRs upstream bound significantly more often in enhancer regions near the queried genes than in the background enhancer regions (Fig. 4f). Conversely, the predicted downstream HDGF bound less often in enhancer regions near the queried genes than in the background enhancer regions. Our analysis demonstrated a strong preference for GATA3 (proximal -value distal -value ) and FOXA1 (proximal -value distal -value ) to bind proximally to the genes, while ESR1 and EP300 did not exhibit a comparable preference. Finally, we visualized the tracks near several significantly downregulated, differentially expressed genes for ESR1, GATA3, FOXA1, EP300, and HDGF (Fig. 4h). All the predicted upstream TRs exhibited conspicuous patterns of binding near the genes, and tracks of the top 10 predicted epigenomic samples highlighted a significant enrichment in regulatory elements near the ESR1 binding sites.
Moreover, similar patterns of genomic binding in the top predicted TRs, while no such pattern was evident in HDGF, which was predicted to be at the bottom (Fig. 4f). These findings further substantiated the reliability of TRAPT in predicting TFs as well as the associated transcriptional co-factors and chromatin regulators.
TRAPT predicts functional transcriptional regulators in postGWAS analysis of Alzheimer’s disease
Genetic variations at specific DNA positions within the binding sites of TFs can alter their binding affinity, influencing gene expression and cellular processes. In light of this, we applied TRAPT to cases of Alzheimer’s disease (AD) with the aim of identifying the key TRs impacted by the causal variants. To this end, we used gene sets associated with AD as predicted by MAGMA , a tool designed to infer disease gene sets from GWAS-based summary statistics as inputs to our algorithm (Supplementary Data 11). We then conducted a binding analysis of the disease-associated TRs predicted by TRAPT, with the significant causal variants detected through fine mapping based on the GWAS (Fig. 5a). Integrating GWAS data with TRAPT’s predictions enabled us to demonstrate its ability to identify key TRs impacted by causal variants.
Specifically, we retrieved a GWAS dataset from causaldb , consisting of a sample of a European population , as the input for the fine mapping. We subsequently performed colocalization analysis on the disease-associated TRs and the predicted causal variants (Figs. 5a, Supplementary Note A. 4 and Supplementary Data 3). Of the 305 SNPs bound by the top 25 predicted TRs of TRAPT, belonged to AD-related causal variants (hypergeometric test -value ). Conversely, of the 106 SNPs bound by the bottom 25 TRs, fewer than half were causal variants (hypergeometric test -value ) (Fig. 5b). This indicated that TRAPT’s higher-ranked TRs were more closely associated with AD. To further investigate the relationship between individual TRs and AD, we conducted a more detailed co-localization analysis of the binding of each AD-related TR to the causal variants (Fig. 5c). The results revealed that the topranking TRs, such as SPI1, RELA, and REST, generally had a higher binding affinity for causal variants than for background variants. For example, SPI1, ranked first according to the predictions made by TRAPT, intersected with 71 causal variants and only 24 background variants (hypergeometric test -value ). RELA, ranked second by TRAPT, intersected with 75 causal variants and only 33 background variants (hypergeometric test -value ; Supplementary Data 2). We observed that the top-ranking TRs generally exhibited stronger associations with AD-related causal variants. To assess this observation, we developed a statistical test based on the GSEA algorithm to verify the reliability of the predicted top-ranking TRs from a statistical perspective (see the Methods section). We found that the top-ranking TRs were significantly enriched (Fig. 5d; -value ), demonstrating that TRs that were ranked higher were more likely to bind to causal variants than those that were ranked lower.
To identify the disease-associated causal variants bound by TRs predicted by TRAPT and explore their potential associations, we then analyzed the co-localization between the causal variants and the predicted binding sites of the TRs. We retained the overlapping causal variants and ranked them based on FINEMAP scores. Of the 1,000 causal variants selected, 208 were associated with TR binding, with rs10119 ranking as the top variant (Fig. 5c). Functional annotation analysis using VARAdb revealed that rs10119 was regulated by multiple super-enhancers covering several important genes nearby, including APOE, TOMM40, and APOC1, and was a risk-related SNP for AD. We subsequently analyzed the co-localization between rs10119 and
the predicted TRs. Notably, we observed binding in nine of the topranking 25 TRs in the 1 kB region upstream and downstream of rs10119, whereas the lower-ranked TRs did not exhibit any binding in these regions (Fig. 5e). A previous study has thoroughly validated the effect of REST, a transcription factor, as a universal feature of normal aging in human cortical and hippocampal neurons. It can also protect neurons from oxidative stress and amyloid -protein toxicity. We observed that REST ranked high in TRAPT’s predictions, and previous studies have demonstrated its crucial role in AD development. It inhibits genes that promote cell death and AD pathology, while inducing the expression of genes associated with stress response . TRAPT identified top-
Fig. 4 | Illustration of the TRAPT framework by using downregulated genes from ESR1 knockout experiments in cases of gastric cancer and MCF7 breast cancer. a Scatter plot displaying values of the average normalized activities of 1358 TRs for the upregulated and downregulated gene sets. The size of each data point represents the magnitude of the average normalized activity, while the colors represent different categories of TRs: TFs (blue), TcoFs (green), and CRs (yellow). b This network diagram was derived from predictions of protein-protein interactions in the STRING database. The size of nodes represents their degrees, and the thickness of edges represents the probability of interaction. This heat map was derived from results of the co-expression analysis of TCGA breast cancer, with the depth of the colors indicating the degree of correlation. d Bar chart showing the normalized activity scores of the TRs. ESR1, GATA3, FOXA1, and EP300 were among the top 10 TRs, while HDGF was ranked last. ESR1 had the highest score. e Comparison of D-RP scores between the queried ( ) and background genes
( ), revealing significant differences for all TRs except HDGF. Middle line inside each box represents the median, upper and lower bounds of the box represent the third and first quartiles, respectively. -values are calculated by the two-sided Mann-Whitney U test without adjustments. Aggregated profiles of enhancer marks. Except for HDGF, the marks of all TRs near the queried gene were significantly higher than those near the background gene. -values are calculated by the two-sided Kolmogorov-Smirnov test without adjustments. g Heat maps of the activity matrix before and after integrating REA scores, demonstrating the differentiation between the queried and background gene sets. We randomly selected 10,000 genes for visualization. Genome browser displaying the tracks of ESR1, GATA3, FOXA1, EP300, and HDGF near the genes ESR1, GREB1, TFF1, and CCND1. We selected the tracks of the 10 epigenomic samples with the largest weights in the reconstructed network for ESR1, shown as ATAC (blue) and H3K27ac (green) tracks.
ranking TRs like SPI1, STAT1, RELA, HDAC2, JUND, and HNF4A, which are causally associated with . We found that rs10119 was located exactly at a critical position in the chromatin loop structure, with many important TRs predicted by TRAPT binding in the upstream and downstream. Notably, we observed a substantial number of binding sites of our predicted TRs at TOMM40, APOC1, APOE, and CEACAM16 (Fig. 5f and Supplementary Fig. 5b). These genes are known to significantly influence the onset of . Meanwhile, we analyzed ADrelated H3K27ac ChIP-seq datasets to show that the binding peaks of the TRs near the rs10119 locus significantly overlapped with the H3K27ac profiles selected by the model, and notably overlapped with the H3K27ac profiles associated with AD. The model-selected samples were not from AD , indicating that in the absence of epigenomic data from the same disease context, it chooses samples with similar epigenetic signals as substitutes. This demonstrated the potential of TRAPT for application to diseases that it has not previously encountered. Moreover, several predicted TRs were closely associated with epigenetics, including HDAC2 and ZBTB33 (also known as Kaiso). Finally, we additionally analyzed another high-scoring causal variant, rs75627662, and observed extensive binding of top-ranked predicted TRs (Supplementary Fig. 5a).
TRAPT identifies transcriptional regulators associated with cell fate and tissue identity
TRs are crucial for coordinating gene expression programs, driving cell-fate decisions, and orchestrating intricate biological processes during cell differentiation and development. The binding affinity of TRs to proximal or distal cis-regulatory elements of downstream marker genes plays a crucial role in maintaining cell identity. To highlight TRAPT’s applicability to cell development, we determined its ability to capture key regulators for marker gene sets of a single cell dataset. Briefly, we reprocessed scRNA-seq data on human hematopoietic stem cells (Supplementary Note A.5), visualized the first two principal components (Fig. 6a), and identified marker TRs between lineages of differentiation by using the classic model of landscapes of hematopoietic differentiation (Figs. 6b and Supplementary Fig. 6a). We then used TRAPT to identify the top five driving regulatory factors for different cell-fate directions of commitment (Fig. 6c). A total of 42 TRs were identified as potential key regulators of blood cell differentiation. To validate the advanced predictive ability of our tools, a systematic analysis of these 42 TRs was conducted. Notably, 29 are known to play regulatory roles in hematopoietic lineage development (Supplementary Table 1), with 10 TRs ( and FDR < 0.05) exhibiting patterns of differential expression across differentiated lineages in the scRNA-seq dataset (Fig. 6c). The remaining significant portion of the TRs, while not classified as differentially expressed TRs, still played a critical role in the process of differentiation. Furthermore, we observed multiple TRs appearing across various lineages of differentiation, including EP300, SMAD1, LYL1, SPI1, LMO2, and TAL1
(Supplementary Fig. 6b). In addition, some TRs were found exclusively in single lineage branches. For example, STAT4 was identified in the LMPs-NK cell lineage branch as a known gene-regulating intracellular signal. Deleting STAT4 in NCR1-expressing cells results in impaired terminal differentiation of NK cells . TCF4 is a key transcription factor in the LMPs-pDC lineage branch, crucial for pDC development . We also applied TRAPT to human embryonic stem cells . Following dimension reduction and clustering, the cells were categorized into six main subgroups (Supplementary Fig. 6c). We identified marker genes for each differentiated cluster and the undifferentiated H 1 and H 9 clusters. Using TRAPT, we analyzed these genes and identified the key TRs for cell-fate decisions in each differentiated cluster. (Supplementary Fig. 6d). In the differentiation of H1 into trophoblast-like cells (TB cells), such TRs as GATA3, TFAP2A, and GATA2 exhibited higher activity. Notably, GATA2 and GATA3 have been shown to be selectively expressed in trophoblast progenitor cells during early mouse development, and directly regulate key genes . TRs like GATA6, SMAD2, and EOMES showed elevated activity in the differentiation of H 1 into definitive endoderm cells (DE cells). Previous studies have revealed that GATA6 works with EOMES and SMAD2 to regulate the gene regulatory network associated with human definitive endoderm . TRAPT accurately identified driver regulators of cell-fate decisions, with a majority of these being cell-lineage-specific TRs that have been validated in the literature.
Subsequently, we analyzed RNA-seq data from 30 distinct normal human tissues retrieved from GTEx , and used limma to identify the top 500 differentially expressed genes for each tissue (Supplementary Note A.5), and used them to predict the key TRs. Most regulators of tissue-specific markers were predicted as expected. For instance, MED1, TBX5, and GATA4 were enriched in the heart tissue. MED1 plays an important role in super-enhancer formation and maintenance, while GATA4 broadly occupies cardiac super-enhancers along with TBX5 to determine cardiomyocyte contractility, calcium handling, and metabolic activity . AR, FOXA1, and HOXB13 were identified as the top three TRs in the prostate, which is consistent with the role of FOXA1 and HOXB13 in regulating normal AR transcription during prostate epithelial development, as well as their involvement in oncogenic AR transcription during prostate carcinogenesis . Furthermore, certain tissues shared TRs, such as PPARG and CEBPA in the breast and adipose tissues , and TP63 and GRHL2 in the skin, esophagus, and vagina tissues , suggesting similarities in predominant cell types across these tissues. We then integrated the predicted scores of the top 10 TRs from each tissue for hierarchical clustering. Intriguingly, TRAPT identified similarities between tissues (Fig. 6c). For instance, the breast and adipose tissues formed a cluster owing to their predominant composition of adipocytes. The tissues from the uterus, ovary, and cervix formed a cluster because their surface and interior were covered by epithelial cells. We also generated a list of the 10 most important predicted TRs for each tissue type (Supplementary Data 4).
Fig. 5 | Prediction of functional transcriptional regulators for Alzheimer’s disease by using post-GWAS analysis. a Workflow of the analysis of data on Alzheimer’s disease. Venn diagram showing the number of causal SNPs bound near the predicted top and tail TRs. c Scatter plot displaying casual variants bound by the top-ranking TRs, with the sizes of the points representing the magnitudes of their FINEMAP scores. d Bar chart displaying the results of co-localization analysis. Yellow bars represent the number of TRs bound to important causal variants in fine mapping, while gray bars represent TRs bound to background variants. We selected the top and bottom 25 TRs for demonstration. The enrichment line plot represents the binding-induced enrichment of these TRs. Causal variants tended to co-occur with TRs predicted by TRAPT. e Manhattan plot showing the top-ranking causal
variant rs10119 obtained from fine mapping. We used the important gene sets analyzed by using the MAGMA software as the input to TRAPT. The bottom tracks represent the peaks of binding of the TRs, where EGR1, RELA, REST, and STAT1 were predicted to rank in the top 10, while the other TRs were predicted to be ranked in the top 25. The bottom 25 TRs showed no binding near rs10119. -values are calculated by computing the distribution that is greater than the observed ES. f Genome browser displaying the interactions of chromatin, relationships of eQTLs, top-ranking bound TRs, and the epigenetic landscapes of H3K27ac and AD obtained by TRAPT. -values are calculated by the two-sided Likelihood Ratio test with adjustments.
In conclusion, TRAPT efficiently predicted key TRs in the context of cell fate and across 30 human normal tissues, verifying its ability to process gene sets obtained from multiple phenotypes or conditional data, such as cohort-related data. A substantial number of these
predicted TRs have been experimentally shown to have specific roles in these tissues, further verifying TRAPT’s reliability. TRAPT was a useful instrument for exploring and understanding the functions of key TRs in human physiological processes.
Fig. 6 | Identification by TRAPT of transcriptional regulators associated with cell fate and tissue identity. a Visualization of principal component analysis (PCA) derived from scRNA-seq data. b Classic model of the landscape of hematopoietic differentiation. c Heat map displaying the MRR scores of lineage-specific transcriptional regulators obtained by TRAPT across directions of cell differentiation. d Heat map showing the top 100 TRs according to MRR scores, predicted by TRAPT
across 30 human tissues. The right side shows the top 10 TRs predicted for each of the 30 tissues by TRAPT. The TRs for each tissue are ranked in descending order by their MRR scores, with different colors denoting distinct tissues. The TRs in varying colors below the heatmap represent tissue-specific TRs from the top-10 predicted TRs. The smaller heat maps below highlight important TRs within their respective tissues.
Discussion
Transcriptional regulators are essential for modulating gene expression patterns, coordinating the activation and repression of genes to maintain cellular homeostasis and guide developmental processes. Importantly, TR-mediated gene programs have a distinct epigenetic landscape and act as switches in changes of cell states and disease phenotypes . However, accurately predicting upstream TRs for any given gene set with biological meaning (i.e., differentially expressed genes or marker genes in single cell studies) remains challenging due to a lack of epigenomic data on TRs in many cell types. To address this issue, we proposed a deep learning framework, called TRAPT, that leverages two-stage knowledge distillation to extract the activity embedding of regulatory elements. TRAPT can predict the key TRs for context-dependent gene sets by integrating data from over 20,000 large-scale epigenomes and a comprehensive background knowledge library of TRs. TRAPT significantly improves the accuracy of TR predictions on large-scale benchmark datasets and outperforms prevalent methods such as Lisa, BART, i-cisTarget, and ChEA3 in predicting the overall ranking of TRs. We also used it to successfully identify key TRs associated with diseases, genetic variations, cell-fate decisions, and different types of tissues.
Current methods of TR prediction can be classified into two main categories. The first category consists of gene set-based methods, such as Enrichr, TFEA.ChIP, ChEA3, and MAGIC, which use TR-related gene sets as background data and apply statistical tests like the hypergeometric distribution to calculate TR importance. However, these methods cannot accurately simulate the binding of TRs and CREs. The second category, including i-cisTarget, BART, and Lisa, addresses this issue by simulating TR binding with CREs near genes to predict their activity. Nonetheless, these methods still have limitations, primarily their neglect of the binding preferences of TRs. TRAPT represents a third category of techniques that integrate the cis-regulatory elements of gene set with the genome-wide binding sites of TRs. Based on 570 TR-related datasets from knockout/silencing experiments and multiple criteria of evaluation, we found that TRAPT, as a method in the third category, significantly outperformed all other methods in predicting the overall ranking of the TRs. TRAPT’s significant advantage in predicting transcription factors, chromatin regulators, and transcription co-factors is attributed to its multi-stage fusion strategy and a comprehensive background library of TRs. Our method had the following advantages: (1) TRAPT used multi-stage fusion to simultaneously address the issue of incomplete coverage of the cis-regulatory profile and TRBP-related problems. (2) To mitigate the effects of noisy data, TRAPT applied a feature-based offline framework of knowledge distillation in two stages. During the prediction of D-RP, we introduced VGAE, employing a reparameterization trick to project node representations into a uniform latent distribution form. By further incorporating CVAE as a teacher network, we leveraged its advantage in smoothing the latent space distribution to constrain the initial embeddings of VGAE, effectively reducing the disparities in the distribution of aggregated node features. In the prediction step of the URP, the teacher network extracted low-dimensional embedded representations of complex epigenomic information related to the queried gene set and guided the student network in selecting the optimal epigenetic sample set. The KD model was robust to noisy data, and significantly enhanced the capability to predict TR activity. It simultaneously maintained the speed of the algorithm even when the amount of TR data was more than twice that covered by the state-of-the-art algorithm with the highest coverage (Supplementary Figs. 1b, c). (3) We proposed leveraging graph theory to address the challenge of predicting the regulatory potential of the TRs at their genome-wide binding sites, which was particularly well suited for small epigenomic datasets. To explore the potential advantages of a multistage fusion strategy and knowledge distillation for the prediction of TRs, we conducted extensive ablation tests. We observed a significant
decline in overall model performance when the U-RP and D-RP models were removed. Similarly, the overall performance of the model notably declined when knowledge distillation was eliminated. We evaluated the D-RP model from the perspective of link prediction. It demonstrated its capability to reconstruct previously unseen links on the test datasets. Moreover, the D-RP model maintained stable performance even when various proportions of links were masked. These results indicated that it optimized the epigenetic regulatory network.
Using 570 TR-related datasets, TRAPT outperformed state-of-theart methods in inferring transcription regulators, especially in predicting transcription co-factors and chromatin regulators. We also verified that TRAPT maintained its superior performance even when ignoring the influence of background data. Our results revealed that the chromatin regulators, transcription co-factors, and transcription factors exhibited significant differences in genomic binding preferences (Supplementary Fig. 7d), highlighting the need to consider different types of TRs in research. TRAPT successfully identified ESR1 as top-ranking, along with associated transcription co-factors and chromatin regulators like EP300, in the ESR1 knockout experiment. We found that the top-ranking TRs exhibited significantly higher scores on the queried gene set. Notably, ESR1, through its binding to both distal and proximal enhancers, emerged as the most prominent TR in both the ATAC and H3K27ac contexts. This finding highlights the D-RP model’s representation module in TRAPT effectively captured the epigenetic information related to ESR1 in the context of cancer. TRAPT also identified TRs causally related to AD near rs10119, with higherranked TRs more likely located near causal SNPs. We ultimately applied TRAPT to datasets of human hematopoietic stem cells, human embryonic stem cells, and normal human tissues. It was able to successfully predict the critical regulatory factors controlling cell fate, including STAT4, TCF4, and GATA, as well as tissue-specific regulators such as MED1, TBX5, and GATA4.
TRAPT provided an informative perspective on integrating the epigenetic landscape of TRs. However, its performance was still constrained by the number of epigenomic samples. To date, TRAPT encompasses 17,227 TRs (Supplementary Data 1), 1,329 ATAC-seq samples, and 1,465 H3K27ac samples. Although it uses a comprehensive epigenomic dataset as the background, this does not ensure each TR can be paired with corresponding epigenomic samples. Transcription factors recruit co-factors to perform their functions, where the affinity of the co-factors can either enhance or reduce that of the transcription factors, depending on whether the former is acting as an activator or an inhibitor. Chromatin regulators also influence transcription factor activity by modifying chromatin structure. Despite extensive data on co-factors and chromatin regulators, the complex effects of interactions between TRs are not fully understood. In future work, we may consider incorporating gene regulatory networks to simulate the complex interactions within these organisms. We believe this will further extend the applicability of our model.
In conclusion, TRAPT applied a bidirectional strategy to integrate the epigenetic landscape to predict key TRs, and is expected to provide instrumental guidance for future research on and related computational analysis of transcriptional regulation.
Methods
Preprocessing of datasets of epigenomes and transcriptional regulators
Gene transcription programs are primarily regulated by the biological activities of transcription regulators, coordinated upstream epigenetic marks, such as histone modifications, and open chromatin states, which can establish and maintain the transcriptional landscape of a cell in response to various internal and external signals. Moreover, studies have demonstrated that epigenetic marks can partially simulate the regulatory shapes of the transcription regulators to fulfill the gaps in their coverage. Hence, integrating large-scale epigenomic data helps
understand the cell-specific transcription mechanism of genes. In this study, we manually curated and processed raw epigenomic data sets from multiple sources, covering over 1000 tissue and cell types. All these datasets of epigenomes and transcriptional regulators provided comprehensive regulatory cues to infer the patterns of gene expression. We now detail the various methods used to process the data.
H3K27ac ChIP-seq data. The H3K27ac ChIP-seq datasets were obtained from SEdb2.0 in previous work by our research group. Briefly, we manually collected 1,739 samples, including experimental and control groups, from NCBI GEO/SRA , ENCODE , Roadmap , Genomics of Gene Regulation Project (GGR) , and National Genomics Data Center Genome Sequence Archive (NGDC GSA) . We obtained data on the peak signals of H3K27ac by using the Bowtie and BEDTools multicov tools to process the raw data.
Data on chromatin accessibility. The datasets of chromatin accessibility were obtained from ATACdb in previous work by our research group. Briefly, we manually collected 2,723 samples to cover several types of tissues or cells from NCBI GEO/SRA, and used the Bowtie and BEDTools multicov tools to identify signals representing the peaks of chromatin accessibility.
Data on transcription factors. The ChIP-seq datasets of the transcription factors were obtained from TFTG in previous work by our research group. Briefly, we manually collected 11,056 samples, cataloging a total of 1,218 human TFs. To provide more quality control information regarding ChIP-seq, such as the distribution of promoters, exons, and the proportion of UDHS, we then used the ChIPseeker R package and BEDTools to compute the distributions of various genomic compositions and the UDHS coverage of each TF.
Data on transcription co-factors. The ChIP-seq datasets of the transcription co-factors were obtained from the TcoFBase in previous work by our research group. Briefly, we manually collected a list of TcoFs in mammals from TcoF-DB v2 and AnimalTFDB 3.0 . We also collected 4246 TcoF-related ChIP-seq datasets of different types of human cells and tissues from ReMap, ENCODE, Cistrome , and ChIP-Atlas . We used the liftOver tool from UCSC to convert all ChIP-seq peak data into the hg38 genome assembly. The ChIPseeker R package and BEDTools were used to compute the distributions of various genomic compositions and the UDHS coverage of each TcoF.
Data on chromatin regulators. The ChIP-seq datasets of the chromatin regulators were obtained from CRdb in previous work by our research group (reference). Briefly, we processed 2,591 CR-associated ChIP-seq datasets from GEO and ENCODE. We identified the binding regions of the CRs by using Bowtie, SAMtools , and MACS2 , and calculated the distributions of various genomic compositions, and determined the coverage of union DNasel hypersensitive sites (UDHS) of each TcoF by using ChIPseeker R package and BEDTools.
The large volume of collected data likely contained redundancies originating from the same sources. We calculated the peak correlations of all TRs, and retained only one of the samples in cases of a correlation value of one. Through this process of filtering, 17,227 unique peak files of TRs were retained (Supplementary Data 1).
In summary, TRAPT outperforms previously developed tools by leveraging a more comprehensive and higher-quality dataset. Specifically, TRAPT comprises 17,227 transcription factor (TR) data items, which is 2.49 times larger than Lisa’s dataset and 2.16 times larger than BART’s. Additionally, TRAPT’s chromatin accessibility data, surpasses the largest available datasets by 1.47 times (TRAPT: 1,329; Lisa: 904). Similarly, the H3K27ac dataset in TRAPT is 1.44 times larger than that of
Lisa, further underscoring its superior data coverage and quality (Supplementary Figs. 1b, c).
TR and model of epigenomic regulatory potential
The regulatory potential of a gene can be determined by calculating the activity of cis-regulatory elements (CREs) close to . To compute the TR-RP matrix, we collected peak data on 17,227 TRs from CRdb, TcoFBase, and TFTG. TRs influence gene expression by binding to CREs located upstream or downstream of the gene. Therefore, we focused only on CREs overlapping with TR binding sites to calculate gene regulatory potential (Supplementary Note A.7). We applied BEDTools to identify regions of overlap of the CREs for each TR. To standardize the terminology, we termed these regulatory elements as potential regulatory elements (PREs). The signal value of each PRE in a TR sample was defined as a binary value:
By aggregating the values of signals of the PREs within a range of 100 kB upstream and downstream of the target genes, the regulatory potential of each gene in each sample was computed to generate the TR-RP matrix. Each row of this matrix represents a TR, and each column represents a gene. The regulatory potential of the -th gene in the -th sample was defined as follows:
where is the regulatory influence of the -th PRE, located within a range of 100 kB of the TSS of gene , and is the value of the signal of the given PRE. The weight of each PRE is defined as:
where is the distance between the current PRE and the TSS of the gene, with the hyperparameter set to 10 kB . The parameter controls the decay rate of regulatory influence:
where was set to 100 kB , and represents the weight of the TR. In this study, we used the “percentage of intergenic distance” calculated by ChIPseeker as the proportion of distal enhancers, and incorporated it as a weight parameter in the specificity regulatory potential model for each TR.
To compute the Epi-RP matrix (with rows representing epigenomic samples and columns representing genes), we utilized BAM files from H3K27ac ChIP-seq and ATAC-seq data obtained from SEdb and ATACdb, respectively. We then applied the BEDTools multicov tool to count the number of reads on the PREs, and this yielded read signals for all PREs.
The computations were performed by using the same method as above, but we set the value of of each epigenomic sample to 0.01 . Furthermore, we used read signals instead of peak signals to compute the gene regulatory potential.
Ultimately, we simultaneously applied logarithmic standardization to the regulatory potential corresponding to each gene for both TR and the epigenome:
Predicting the regulatory potential via upstream transcriptional regulators
We leveraged a knowledge distillation (KD)-based model in our module to guide the student model to learn multi-modal epigenomic features and optimize the network of epigenomic relationships. KD is designed to compress and accelerate a given model by transferring knowledge from a complex model to a simplified one. Overfitting frequently occurs when making inferences regarding networks of epigenomic relationships. However, recent studies have shown that using knowledge-based distillation significantly enhances the performance of the student model and mitigates issues of model hallucination . We proposed using KD to infer the genome-wide binding sites of each TR. Due to distribution differences between TRs and epigenomes (Supplementary Figs. 9b-e), a simple merger was not feasible. To more appropriately extract joint representations of the embeddings of the TRs and epigenomes, we used conditional variational autoencoders (CVAEs) as the teacher network. CVAEs can not only master complex data representations, but also perform well in terms of integrating multi-modal data . By incorporating the error in reconstruction and terms of regularization of the latent variables during training, CVAEs could learn to distinguish between feature representations. The model was actualized by minimizing the following loss function:
where ( m is the number of TR and epigenome samples, and n is the number of genes) represents the feature matrix assembled by integrating the TR-RP and Epi-RP matrices. Specifically, we concatenate the two types of Epi-RP matrices (H3K27ac and ATAC) with the TR-RP matrix by samples as the input for the model. is a one-hot matrix that represents the labels of the two types of omics data. Specifically, each type of epigenomic data corresponds to different conditions. In this context, TRAPT integrates two types of omics data, assigning a label of 0 to TR samples and a label of 1 to epigenome samples. Ultimately, we obtain a one-hot matrix with a feature dimension of 2. denotes the Kullback-Leibler divergence between the reconstructed network and the (conditional) prior network. When the feature matrix and conditional matrix were inputted to the framework, it generated a low-dimensional joint representation of the embedding (where is the dimensionality of the hidden layer) of the TRs and epigenomic samples:
where and represent the weights and biases of the initial layer of the encoder, respectively. The complex network was represented by the relationship between the TR and the epigenome. To model this network, we applied VGAE as the student network and selected the 10 epigenomic samples closest to each TR to construct the adjacency matrix. We used kNN, with cosine similarity serving as the distance metric:
where represents the cosine similarity between the -th TR and the -th epigenomic sample. Specifically, the score of each edge in the network indicates the weight of the currently identified set of potential regulatory elements that are specific to tissue/cell types for the TR (with each epigenomic sample corresponding to a set of regulatory elements). N is the number of genes. We fed and into the model. They passed through the first layer of the GCN encoder to learn low-dimensional nodal representations . These representations capture both single-modality information and the relationship
between TRs and epigenomic samples. Given that the input was a heterogeneous network, it did not contain any information on the relationship of a single modality with itself. Subsequently, we used the second layer of graph convolution to generate the mean and variance, and, ultimately, used a reparameterization trick to derive the new nodal feature representation (where is the dimensionality of the hidden layer in the GCN module). The GCN is expressed as follows:
Finally, the VGAE used an inner product decoder to produce a reconstructed adjacency matrix:
The cross-entropy loss function is defined as the expectation of minimizing the discrepancy between the input and output networks:
The loss function of distillation is defined as:
where is the Euclidean norm. The final loss function of the student network is defined as:
where is the Kullback-Leibler divergence between the reconstructed distribution and the prior Gaussian distribution. We predict the D-RP corresponding to each TR as follows:
where is derived from Epi-RP matrix, with represents the regulatory potential vector of the -th TR corresponding to the -th neighboring epigenomic sample, and signifies the normalized weight of the edge of the network for the -th epigenomic sample of the -th TR. is the number of epigenomic samples. The D-RP matrix represents the aggregated activity of the genome-wide binding sites of the TRs near the genes, with higher values signifying a more intense level of transcriptional activity in the vicinity of the genes.
Predicting the regulatory potential via downstream gene sets
Two primary methods were used to predict target gene cis-regulatory elements. The first method infers regulatory elements near genes based on distance, such as the i-cisTarget approach. The second method used regression to select the epigenomic samples and predict the landscape of regulatory elements across the entire genome, such as the MARGE method. However, these methods fail to address epigenomic data redundancy and complex nonlinear relationships
between samples. Inspired by this and several recent studies , we proposed a KD-based strategy to select the most probable epigenomic samples associated with the queried gene set. Initially, we calculated the correlation between the Epi-RP matrix and the queried gene set. Subsequently, we ranked the epigenomic samples in descending order based on the magnitudes of their correlations. Due to the large number of epigenomic samples, many originated from the same tissue, leading to redundancy. To address this, we empirically partitioned the matrix into groups of 10 samples. This grouping aimed to cluster similar epigenomic samples and enforce sparsity within and between groups to prevent redundancy and overfitting. The grouped Epi-RP matrix was fed to the teacher network. The latter was a neural network comprising three fully connected layers. We predicted the queried vector of binary genes by using the transposed matrix (where signifies the number of genes and denotes the number of TR samples) of the Epi-RP matrix. Specifically, each row of the Epi-RP matrix corresponds to a gene, and each column corresponds to an epigenomic sample, with the values in the matrix representing the regulatory potential scores (see Eq. 2 for calculation details). By transposing the matrix, we ensure that the input and output dimensions of the model are aligned. In this process, the queried gene set was used as the positive set, and we randomly selected 6,000 background genes as the negative set. To retain more information, we implemented temperature-scaled sigmoid (TSS) as the activation function in the output layer:
where denotes the input and represents the temperature. This function maps the input values to an output value ranging from zero to one. As the value of the temperature gravitated toward infinity, the output of the function approximated the output of a standard sigmoid function. Conversely, at low temperatures, the output changes more gradually near zero and one. The final teacher model was represented as follows:
where ( denotes the dimensionality of the hidden layer) signifies the extracted feature representation of the latent cisregulatory profiles associated with the queried gene set. The corresponding weight matrices and biases between each pair of layers are and , and and , respectively. The teacher model was trained by minimizing the following loss function:
where stands for binary cross-entropy, where the teacher model focuses on constructing the feature space and uses the fitted scores as soft labels for the student model, thereby enabling the student model to concentrate more on the feature selection task. We trained the student network to predict the low-dimensional feature representation extracted from the intermediate layer of the teacher network by feeding the same data to it:
The SGL constraint is used in the first layer of the student network to select important features of the cis-regulatory profile by “sparsifying” the weight matrix through L2 regularization within groups and L1 regularization between groups:
The distillation loss function is defined as follows:
The final loss function of the student network is defined as follows:
where and represent regularization parameters, is the first layer weight of variables in group is the number of variables in group , and is the output of the student model. We squared and summed the weights of the first layer of the student network as follows:
where represents the weights of all epigenomic samples. The choice of sample size may affect prediction results. We selected a varying number of epigenomic samples based on the weights of the student network model. The aim was to select the most appropriate sample size. We conducted multiple training sessions for the model by selecting different numbers of epigenomic samples and calculated the auROC to assess the performance of each candidate model. We determined that 10 epigenomic samples provided a reasonable choice (Supplementary Fig. 2e). We then trained a neural network model (NN model) by using the selected epigenomic samples, where the input was represented by . denotes the number of selected epigenomic samples. The output was the gene vector :
We define the loss function as:
Ultimately, we inputted X to the previously trained model to derive the predicted gene U-RP. The U-RP vectors contain contextdependent information derived from a specific gene set. The variation in the values of these vectors represented the specificity of chromatin accessibility (ATAC) and states of activity (H3K27ac) with the locations of the genes.
Integrating regulatory potential and predicting transcriptional regulator activity
Having obtained the bidirectional regulatory potentials, we concurrently acquired information on the regulatory profile corresponding to the genome-wide binding sites of the TRs and the regulatory profile corresponding to the cis-regulatory elements of the queried gene set. Our objective was to derive the integrated regulatory activity of TRs that best represents the current state of gene transcription regulation (Supplementary Note A.8). Accordingly, we computed the
I-RP for each TR:
The AUC score can accurately represent the measurement of transcription factor enrichment . By transforming the queried gene set into binary form and computing the AUC for each TR based on its I-RP score, we combined the activity of TRs from the H3K27ac and ATAC epigenomes. The resulting activity score was then computed as follows:
where signifies the final activity of the -th TR sample, denotes the -th epigenomic AUC score of the -th TR sample, and represents the total number of epigenomic modalities.
Calculation of enrichment scores and significance in post-GWAS analysis
Significance of transcriptional regulator. (1) Randomly select 1000 causal and 1000 non-causal variants to serve as the background variants. Concurrently select the top and bottom 25 TRs predicted by TRAPT. (2) Use the intersect tool in BEDTools to compute the number of overlaps between the selected variants and the binding sites of each TR. (3) Calculate the -value of significance of each TR by using the hypergeometric test:
where is the number of causal variants bound by the TR, is the number of variants bound by the TR, is the number of background variants, and is the number of causal variants in the background.
Enrichment score (ES). (1) Rank the TRs in descending order of activity. (2) Calculate their ES scores as follows:
where is the -th transcriptional regulator and is the number of selected TRs. This score is the standard Kolmogorov-Smirnov statistic.
Estimating significance. (1) Randomly shuffle the TRs and recalculate the enrichment score as . (2) Repeat the shuffle 1000 times and create a corresponding histogram of distribution of the enrichment scores . (3) Estimate the -value by calculating the distribution that is greater than the observed ES.
Comparison between TRAPT and similar TR-ranking tools
We collected an extensive array of TR knockdown/knockout datasets from KnockTF, and chose the top 500 upregulated and downregulated differentially expressed genes for analysis. We also curated datasets of TF binding from GTRD, and retained all target genes and 66 benchmark TF datasets from Lisa, including both upregulated and downregulated gene sets (Supplementary Note A. 10 and Supplementary Table 2). When comparing the datasets of TF binding, we removed data originating from the GTRD in the background TR ChIP-seq libraries of TRAPT. We used the offline toolkit available on the website of the official repository of the BART algorithm (https://github.com/ zanglab/bart2). Similarly, we applied the offline toolkit accessible on
the website of the official repository of the Lisa algorithm (https:// github.com/qinqian/lisa). We used the tool for online analysis provided on the website of i-cisTarget (https://gbiomed.kuleuven.be/ apps/lcb/i-cisTarget/), and procured the results of analysis of ChEA3 via the API online interface available on its official website (https:// amp.pharm.mssm.edu/ChEA3).
Hyperparameters and training of the model
While training the teacher model of the D-RP model, we set the batch size to 32 and the learning rate to 0.01 , and trained it for 100 epochs. For the student model, we set the learning rate to 0.01 and trained for 1000 epochs. A unified standard was used when training the teacher model, student model, and NN model of the U-RP model, with the batch size set to 32 and the learning rate to 0.001 . The samples were randomly shuffled and trained for a total of 16 epochs.
Ablation study
Without interfering with the overall execution of the model, we separately removed the “U-RP model,” “D-RP model,” and “TR-RP model.” The same strategy was applied to the “TRAPT-H3K27ac epigenetic model,” “TRAPT-ATAC epigenetic model,” and “peak-promotermodel.” We also conducted ablation experiments on knowledge distillation. Finally, we calculated the MRR scores of the model after each modification to observe the decline in its performance, if any. The objective was to verify the efficacy of each of its components. The MRR was calculated as follows:
where refers to the number of predicted TRs and denotes the rank of the current predicted TR.
Model stability examination
We used the network constructed by using the kNN algorithm to generate perturbed datasets by masking , and of the links within the network. These masked links were randomly distributed to simulate real-world scenarios where interactions are unknown. When training the model, we treated these masked positive data as negatives. Once the training of the model had been completed, we calculated its average precision (AP) to evaluate its predictive performance on the test set. This process helped simulate unknown information in the data, and provided a comprehensive evaluation of model performance. The AP was calculated as follows:
where and represent the precision and recall, respectively, as sorted by the threshold .
Software and web tool
TRAPT software was developed in Python 3.11, and has been uploaded to GitHub (https://github.com/TOSTRING-Z/TRAPT) for user download and use. The current iteration of TRAPT operates on a Linuxbased Apache web server (http://www.apache.org). We used Django v4.1.3 (https://www.djangoproject.com/) for server-side scripting. The interactive interface was designed and constructed by using Bootstrap v4.3.1 (https://getbootstrap.com/) and jQuery v3.2.1 (http://jquery. com). ECharts v5.4 (https://echarts.apache.org/) and DataTables v1.13.2 (https://datatables.net/) were implemented as the frameworks for graphical visualization, and the sqlite3 lightweight database was deployed to store the data tables.
Furthermore, we developed a corresponding web service (https:// bio.liclab.net/TRAPT). The website was designed to accept gene sets
input by users for analysis and allow for the easy retrieval of the analytical results. We have also included an email notification feature. The website displays all scores of TR activity on the results page, as well as the ranking and individual scores of each TR. It also provides details of annotations and the relevant information on quality control for each TR. The analysis interface provided the results of each benchmark dataset, including the analysis of differential expression and predictions of TRAPT. Moreover, we have also provided volcano plots-based visualization through a Shiny application (https://shiny.posit.co/). Compared with offline tools, online tools of analysis offer additional features for browsing the results. They enabled the visualization of the predicted 3D protein structure of each TR by leveraging predictions made by AlphaFold . Moreover, the online tools incorporated a genome browser to facilitate user interaction with the genomic tracks associated with each TR.
Evaluation metrics
In the comparative analysis of our algorithm against other methods, we employed three key metrics to benchmark performance: the Area Under the Curve (AUC) and the Mean Reciprocal Rank (MRR). Briefly, we firstly calculated and plotted the number of correctly predicted TRs across cutoff ranks ranging from 1 to 10 at various thresholds. The performance was then quantified using the AUC. MRR is a metric parameter used to measure the overall performance of ranking algorithms .
Reporting summary
Further information on research design is available in the Nature Portfolio Reporting Summary linked to this article.
Data availability
All datasets analyzed in this study are publicly available. The TR knockdown/knockout datasets were obtained from KnockTF and TF binding datasets from GTRD. The Lisa benchmark dataset can be accessed at http://lisa.cistrome.org/new_gallery/new_gallery.html. Moreover, the protein-protein interaction (PPI) networks were retrieved from the STRING database (https://string-db.org/). The breast cancer RNA-seq expression profiles are available from the TCGA (https://portal.gdc.cancer.gov/), while the breast RNA-seq expression profiles are available from the GTEx (https://www.gtexportal.org/home/ ). The ESR1 knockdown RNA-seq datasets are available at the Gene Expression Omnibus (GEO) repository under accession number GSE37820. The GWAS dataset was retrieved from causaldb (http://www. mulinlab.org/causaldb), and the Alzheimer’s disease-related H3K27ac data are accessible under GSE65159. The human hematopoietic stem cell dataset is available on GitHub (https://gitlab.com/cvejic-group/ integrative-scrna-scatac-human-fetal#data), the human embryonic stem cells dataset is accessible under GSE75748, and the normal human tissue expression profiles were obtained from GTEx (https://www. gtexportal.org/home/). Source data are provided with this paper.
Lee, T. I. & Young, R. A. Transcriptional regulation and its misregulation in disease. Cell 152, 1237-1251 (2013).
Heintzman, N. D. et al. Distinct and predictive chromatin signatures of transcriptional promoters and enhancers in the human genome. Nat. Genet 39, 311-318 (2007).
Lambert, S. A. et al. The human transcription factors. Cell 172, 650-665 (2018).
Vaquerizas, J. M., Kummerfeld, S. K., Teichmann, S. A. & Luscombe, N. M. A census of human transcription factors: function, expression and evolution. Nat. Rev. Genet 10, 252-263 (2009).
Chen, E. Y. et al. Enrichr: interactive and collaborative HTML5 gene list enrichment analysis tool. BMC Bioinforma. 14, 128 (2013).
Puente-Santamaria, L., Wasserman, W. W. & Del Peso, L. TFEA.ChIP: a tool kit for transcription factor binding site enrichment analysis capitalizing on ChIP-seq datasets. Bioinformatics 35, 5339-5340 (2019).
Keenan, A. B. et al. ChEA3: transcription factor enrichment analysis by orthogonal omics integration. Nucleic Acids Res 47, W212-W224 (2019).
Roopra, A. MAGIC: A tool for predicting transcription factors and cofactors driving gene sets using ENCODE data. PLoS Comput Biol. 16, e1007800 (2020).
Herrmann, C., Van de Sande, B., Potier, D. & Aerts, S. i-cisTarget: an integrative genomics method for the prediction of regulatory features and cis-regulatory modules. Nucleic Acids Res 40, e114 (2012).
Wang, Z. et al. BART: a transcription factor prediction tool with query gene sets or epigenomic profiles. Bioinformatics 34, 2867-2869 (2018).
Qin, Q. et al. Lisa: inferring transcriptional regulators through integrative modeling of public chromatin accessibility and ChIP-seq data. Genome Biol. 21, 32 (2020).
Wang, S. et al. Modeling cis -regulation with a compendium of genome-wide histone H3K27ac profiles. Genome Res 26, 1417-1429 (2016).
Lotfollahi, M. et al. Mapping single-cell data to reference atlases by transfer learning. Nat. Biotechnol. 40, 121-130 (2022).
Li, H. et al. Inferring transcription factor regulatory networks from single-cell ATAC-seq data based on graph neural networks. Nat. Mach. Intell. 4, 389-400 (2022).
Zhang, Y. et al. TcoFBase: a comprehensive database for decoding the regulatory transcription co-factors in human and mouse. Nucleic Acids Res 50, D391-D401 (2022).
Zhang, Y. et al. CRdb: a comprehensive resource for deciphering chromatin regulators in human. Nucleic Acids Res 51, D88-D100 (2023).
Zhou, X. et al. TFTG: A comprehensive database for human transcription factors and their targets. Comput Struct. Biotechnol. J. 23, 1877-1885 (2024).
Wang, Y. et al. SEdb 2.0: a comprehensive super-enhancer database of human and mouse. Nucleic Acids Res 51, D280-D290 (2023).
Wang, F. et al. ATACdb: a comprehensive human chromatin accessibility database. Nucleic Acids Res 49, D55-D64 (2021).
Feng, C. et al. KnockTF: a comprehensive human gene expression profile database with knockdown/knockout of transcription factors. Nucleic Acids Res 48, D93-D100 (2020).
Chen, C.-H. et al. Determinants of transcription factor regulatory range. Nat. Commun. 11, 2472 (2020).
Yu, F. et al. Variant to function mapping at single-cell resolution through network propagation. Nat. Biotechnol. 40, 1644-1653 (2022).
Mirzaei, A., Pourahmadi, V., Soltani, M. & Sheikhzadeh, H. Deep feature selection using a teacher-student network. Neurocomputing 383, 396-408 (2020).
Simon, N., Friedman, J., Hastie, T. & Tibshirani, R. A sparse-group lasso. J. Computational Graph. Stat. 22, 231-245 (2013).
Voorhees, E. M. The TREC-8 Question Answering Track Report. (1999).
Muhar, M. et al. SLAM-seq defines direct gene-regulatory functions of the BRD4-MYC axis. Science 360, 800-805 (2018).
Nilsson, S. et al. Mechanisms of Estrogen Action. Physiological Rev. 81, 1535-1565 (2001).
Pei, X.-H. et al. CDK inhibitor p18INK4c is a downstream target of GATA3 and restrains mammary luminal progenitor cell proliferation and tumorigenesis. Cancer Cell 15, 389-401 (2009).
Carroll, J. S. et al. Chromosome-wide mapping of estrogen receptor binding reveals long-range regulation requiring the forkhead protein FoxA1. Cell 122, 33-43 (2005).
Xu, B. et al. The LIM protein Ajuba recruits DBC1 and CBP/p300 to acetylate ERα and enhances ERα target gene expression in breast cancer cells. Nucleic Acids Res 47, 2322-2335 (2019).
von Mering, C. et al. STRING: a database of predicted functional associations between proteins. Nucleic Acids Res 31, 258-261 (2003).
Cancer Genome Atlas Research Network. et al. The cancer genome atlas pan-cancer analysis project. Nat. Genet 45, 1113-1120 (2013).
Zheng, Z.-Z. et al. Super-enhancer-controlled positive feedback loop BRD4/ERα-RET-ERα promotes ERα-positive breast cancer. Nucleic Acids Res 50, 10230-10248 (2022).
de Leeuw, C. A., Mooij, J. M., Heskes, T. & Posthuma, D. MAGMA: generalized gene-set analysis of GWAS data. PLoS Comput Biol. 11, e1004219 (2015).
Wang, J. et al. CAUSALdb: a database for disease/trait causal variants identified using summary statistics of genome-wide association studies. Nucleic Acids Res. 48, D807-D816 (2020).
Schwartzentruber, J. et al. Genome-wide meta-analysis, finemapping and integrative prioritization implicate new Alzheimer’s disease risk genes. Nat. Genet 53, 392-402 (2021).
Subramanian, A. et al. Gene set enrichment analysis: a knowledgebased approach for interpreting genome-wide expression profiles. Proc. Natl Acad. Sci. USA 102, 15545-15550 (2005).
Benner, C. et al. FINEMAP: efficient variable selection using summary data from genome-wide association studies. Bioinformatics 32, 1493-1501 (2016).
Pan, Q. et al. VARAdb: a comprehensive variation annotation database for human. Nucleic Acids Res. 49, D1431-D1444 (2021).
Lu, T. et al. REST and stress resistance in ageing and Alzheimer’s disease. Nature 507, 448-454 (2014).
Kosoy, R. et al. Genetics of the human microglia regulome refines Alzheimer’s disease risk loci. Nat. Genet 54, 1145-1154 (2022).
Rangaraju, S. et al. Identification and therapeutic modulation of a pro-inflammatory subset of disease-associated-microglia in Alzheimer’s disease. Mol. Neurodegener. 13, 24 (2018).
Liu, D. et al. Targeting the HDAC2/HNF-4A/miR-101b/AMPK pathway rescues tauopathy and dendritic abnormalities in alzheimer’s disease. Mol. Ther. 25, 752-764 (2017).
Kumar, A. et al. Chemically targeting the redox switch in AP1 transcription factor . Nucleic Acids Res. 50, 9548-9567 (2022).
Roses, A. et al. Understanding the genetics of APOE and TOMM40 and role of mitochondrial structure and function in clinical pharmacology of Alzheimer’s disease. Alzheimers Dement 12, 687-694 (2016).
Cooper, Y. A. et al. Functional regulatory variants implicate distinct transcriptional networks in dementia. Science 377, eabi8654 (2022).
Porcellini, E., Carbone, I., lanni, M. & Licastro, F. Alzheimer’s disease gene signature says: beware of brain viral infections. Immun. Ageing 7, 16 (2010).
Haney, M. S. et al. APOE4/4 is linked to damaging lipid droplets in Alzheimer’s disease microglia. Nature https://doi.org/10.1038/ s41586-024-07185-7 (2024).
Nativio, R. et al. An integrated multi-omics approach identifies epigenetic alterations associated with Alzheimer’s disease. Nat. Genet 52, 1024-1035 (2020).
Ranzoni, A. M. et al. Integrative single-cell RNA-Seq and ATAC-Seq analysis of human developmental hematopoiesis. Cell Stem Cell 28, 472-487.e7 (2021).
Scarno, G. et al. Divergent roles for STAT4 in shaping differentiation of cytotoxic ILC1 and NK cells during gut inflammation. Proc. Natl Acad. Sci. USA 120, e2306761120 (2023).
Reizis, B. Plasmacytoid dendritic cells: development, regulation, and function. Immunity 50, 37-50 (2019).
Chu, L.-F. et al. Single-cell RNA-seq reveals novel regulators of human embryonic stem cell differentiation to definitive endoderm. Genome Biol. 17, 173 (2016).
Paul, S., Home, P., Bhattacharya, B. & Ray, S. GATA factors: master regulators of gene expression in trophoblast progenitors. Placenta 60, S61-S66 (2017).
Chia, C. Y. et al. GATA6 cooperates with EOMES/SMAD2/3 to deploy the gene regulatory network governing human definitive endoderm and pancreas formation. Stem Cell Rep. 12, 57-70 (2019).
Ritchie, M. E. et al. limma powers differential expression analyses for RNA-sequencing and microarray studies. Nucleic Acids Res. 43, e47 (2015).
Ang, Y.-S. et al. Disease Model of GATA4 mutation reveals transcription factor cooperativity in human cardiogenesis. Cell 167, 1734-1749.e22 (2016).
Singh, R. et al. TRAF4-mediated nonproteolytic ubiquitination of androgen receptor promotes castration-resistant prostate cancer. Proc. Natl Acad. Sci. USA 120, e2218229120 (2023).
Rosen, E. D. et al. C/EBPalpha induces adipogenesis through PPARgamma: a unified pathway. Genes Dev. 16, 22-26 (2002).
Tontonoz, P., Hu, E. & Spiegelman, B. M. Stimulation of adipogenesis in fibroblasts by PPAR gamma 2, a lipid-activated transcription factor. Cell 79, 1147-1156 (1994).
Koster, M. I., Kim, S., Mills, A. A., DeMayo, F. J. & Roop, D. R. p63 is the molecular switch for initiation of an epithelial stratification program. Genes Dev. 18, 126-131 (2004).
Qu, J. et al. Mutant p63 affects epidermal cell identity through rewiring the enhancer landscape. Cell Rep. 25, 3490-3503.e4 (2018).
Werth, M. et al. The transcription factor grainyhead-like 2 regulates the molecular composition of the epithelial apical junctional complex. Development 137, 3835-3845 (2010).
Bonasio, R., Tu, S. & Reinberg, D. Molecular signals of epigenetic states. Science 330, 612-616 (2010).
Gou, J., Yu, B., Maybank, S. J. & Tao, D. Knowledge distillation: a survey. Int J. Comput Vis. 129, 1789-1819 (2021).
Barrett, T. et al. NCBI GEO: archive for functional genomics data sets-10 years on. Nucleic Acids Res 39, D1005-D1010 (2011).
Kodama, Y., Shumway, M. & Leinonen, R. International nucleotide sequence database collaboration. the sequence read archive: explosive growth of sequencing data. Nucleic Acids Res 40, D54-D56 (2012).
ENCODE Project Consortium. The ENCODE (ENCyclopedia Of DNA Elements) project. Science 306, 636-640 (2004).
Bernstein, B. E. et al. The NIH roadmap epigenomics mapping consortium. Nat. Biotechnol. 28, 1045-1048 (2010).
Langmead, B. & Salzberg, S. L. Fast gapped-read alignment with Bowtie 2. Nat. Methods 9, 357-359 (2012).
Quinlan, A. R. & Hall, I. M. BEDTools: a flexible suite of utilities for comparing genomic features. Bioinformatics 26, 841-842 (2010).
Yu, G., Wang, L.-G. & He, Q.-Y. ChIPseeker: an R/Bioconductor package for ChIP peak annotation, comparison and visualization. Bioinformatics 31, 2382-2383 (2015).
Schmeier, S., Alam, T., Essack, M. & Bajic, V. B. TcoF-DB v2: update of the database of human and mouse transcription co-factors and transcription factor interactions. Nucleic Acids Res 45, D145-D150 (2017).
Hu, H. et al. AnimalTFDB 3.0: a comprehensive resource for annotation and prediction of animal transcription factors. Nucleic Acids Res. 47, D33-D38 (2019).
Mei, S. et al. Cistrome data browser: a data portal for ChIP-Seq and chromatin accessibility data in human and mouse. Nucleic Acids Res 45, D658-D662 (2017).
Oki, S. et al. ChIP-Atlas: a data-mining suite powered by full integration of public ChIP-seq data. EMBO Rep. 19, e46255 (2018).
Haeussler, M. et al. The UCSC genome browser database: 2019 update. Nucleic Acids Res. 47, D853-D858 (2019).
Danecek, P. et al. Twelve years of SAMtools and BCFtools. Gigascience 10, giab008 (2021).
Zhang, Y. et al. Model-based analysis of ChIP-Seq (MACS). Genome Biol. 9, R137 (2008).
Liu, Y., Shen, S. & Lapata, M. Noisy Self-Knowledge Distillation for Text Summarization. in Proceedings of the 2021 Conference of the North American Chapter of the Association for Computational Linguistics: Human Language Technologies. 692-703 (Association for Computational Linguistics, Online, 2021).
Kipf, T. N. & Welling, M. Variational Graph Auto-Encoders. stat 1050, 21 (2016).
Yuan, L., Tay, F. E., Li, G., Wang, T. & Feng, J. Revisiting knowledge distillation via label smoothing regularization. in Proceedings of the IEEE/CVF conference on computer vision and pattern recognition. 3903-3911 (2020).
Varadi, M. et al. Alphafold protein structure database: massively expanding the structural coverage of protein-sequence space with high-accuracy models. Nucleic Acids Res. 50, D439-D444 (2022).
Robinson, J. T., Thorvaldsdottir, H., Turner, D. & Mesirov, J. P. igv.js: an embeddable JavaScript implementation of the Integrative Genomics Viewer (IGV). Bioinformatics 39, btac830 (2023).
Acknowledgements
This work was supported by the science and technology innovation Program of Hunan Province [2024RC1062, 2024RC3212]; National Natural Science Foundation of China [62171166, 62302206, 62031003]; Research Foundation of the First Affiliated Hospital of University of South China for Advanced Talents [20210002-1005 USCAT-2021-01]; Provincial Key Laboratory of Multi-omics and Artificial Intelligence of Cardiovascular Diseases [2023TP1047]; Natural Science Foundation of Hunan Province [2023JJ40594, 2023JJ30536]; Clinical Research 4310 Program of the University of South China [No. 20224310NHYCGO5].
Author contributions
C.L. and M.G. conceived and designed the study. G.Z. and C.S. developed the algorithm of TRAPT. G.Z. C.S. and M.Y. interpreted the results and wrote the manuscript. L.L, Y.Z., Y.L. and J.Z. provided critical feedback during the study and helped revise the manuscript.
Correspondence and requests for materials should be addressed to Maozu Guo or Chunquan Li.
Peer review information Nature Communications thanks Xin Gao and the other, anonymous, reviewer(s) for their contribution to the peer review of this work. A peer review file is available.
Publisher’s note Springer Nature remains neutral with regard to jurisdictional claims in published maps and institutional affiliations.
Open Access This article is licensed under a Creative Commons Attribution-NonCommercial-NoDerivatives 4.0 International License, which permits any non-commercial use, sharing, distribution and reproduction in any medium or format, as long as you give appropriate credit to the original author(s) and the source, provide a link to the Creative Commons licence, and indicate if you modified the licensed material. You do not have permission under this licence to share adapted material derived from this article or parts of it. The images or other third party material in this article are included in the article’s Creative Commons licence, unless indicated otherwise in a credit line to the material. If material is not included in the article’s Creative Commons licence and your intended use is not permitted by statutory regulation or exceeds the permitted use, you will need to obtain permission directly from the copyright holder. To view a copy of this licence, visit http:// creativecommons.org/licenses/by-nc-nd/4.0/.
(c) The Author(s) 2025
The First Affiliated Hospital & National Health Commission Key Laboratory of Birth Defect Research and Prevention, Hengyang Medical School, University of South China, Hengyang, Hunan 421001, China. Hunan Provincial Key Laboratory of Multi-omics And Artificial Intelligence of Cardiovascular Diseases, University of South China, Hengyang, Hunan 421001, China. Department of Biochemistry and Molecular Biology, School of Basic Medical Sciences, Hengyang Medical School, University of South China, Hengyang, Hunan 421001, China. School of Computer, University of South China, Hengyang, Hunan 421001, China. Key Laboratory of Rare Pediatric Diseases, Ministry of Education, University of South China, Hengyang, Hunan 421001, China. School of Intelligence Science and Technology, Beijing University of Civil Engineering and Architecture, Beijing 100044, China. These authors contributed equally: Guorui Zhang, Chao Song, Mingxue Yin. These authors jointly supervised this work: Maozu Guo, Chunquan Li. e-mail: guomaozu@bucea.edu.cn; lcqbio@163.com