DOI: https://doi.org/10.1007/s10479-025-06473-3
تاريخ النشر: 2025-02-24
أثر راجيف بانكر الدائم على تحليل كفاءة البيانات
© المؤلفون 2025
الملخص
تقدم هذه الورقة تحليلًا شاملاً للأثر الكبير للبروفيسور راجيف بانكر في مجال تحليل تطوير البيانات (DEA). من خلال مراجعة شاملة لمساهماته الأكاديمية، نستكشف ثلاث مجموعات رئيسية ضمن أبحاث DEA: (1) العوائد على المقياس (RTS) وحجم المقياس الأكثر إنتاجية (MPSS)، (2) الاستدلال الإحصائي في DEA، و(3) التحليل السياقي. لقد تقدم البحث الرائد لبانكر بشكل كبير منهجيات DEA، معالجًا التحديات الأساسية المتعلقة بكفاءة المقياس، والصلابة الإحصائية، وتأثير المتغيرات السياقية على الأداء. لقد جسر عمله بين التطورات النظرية والتطبيقات العملية، مؤثرًا في مجالات متنوعة مثل الاقتصاد، والمالية، وعلوم الإدارة. من خلال دراسة اتجاهات الاقتباس والبيانات الببليومترية، نتتبع تطور وأهمية مساهماته المستمرة، مع تسليط الضوء على الأوراق الرئيسية التي شكلت مسار أبحاث DEA. تناقش هذه الورقة أيضًا تطور نماذج وأساليب DEA، بما في ذلك دمج العناصر العشوائية والتحليلات من المرحلة الثانية. في الاعتراف بتفاني بانكر مدى الحياة في DEA، نحتفل بإرثه الدائم وتأثيره التحويلي على كل من المجتمع الأكاديمي والتطبيقات العملية لـ DEA في جميع أنحاء العالم.
1 المقدمة
2 العوائد على المقياس وحجم المقياس الأكثر إنتاجية
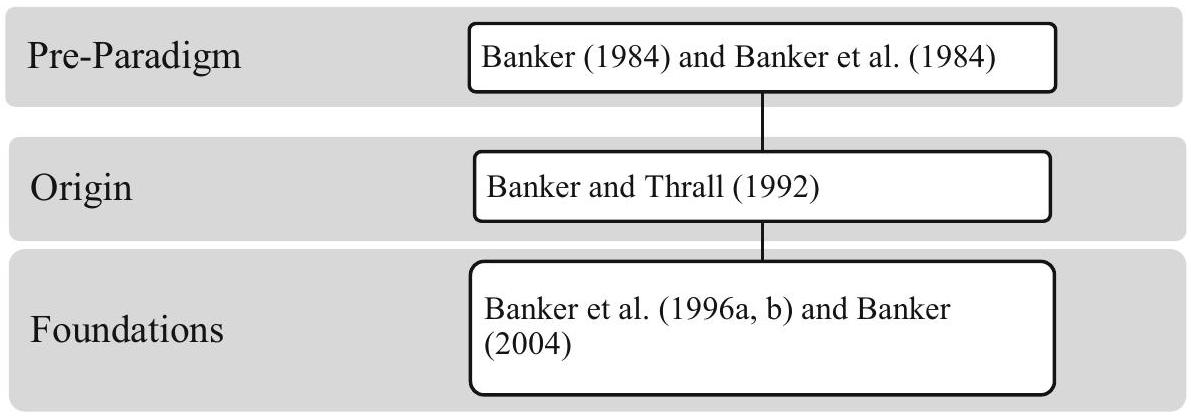
2.1 تحديد RTS وMPSS من قبل بانكر
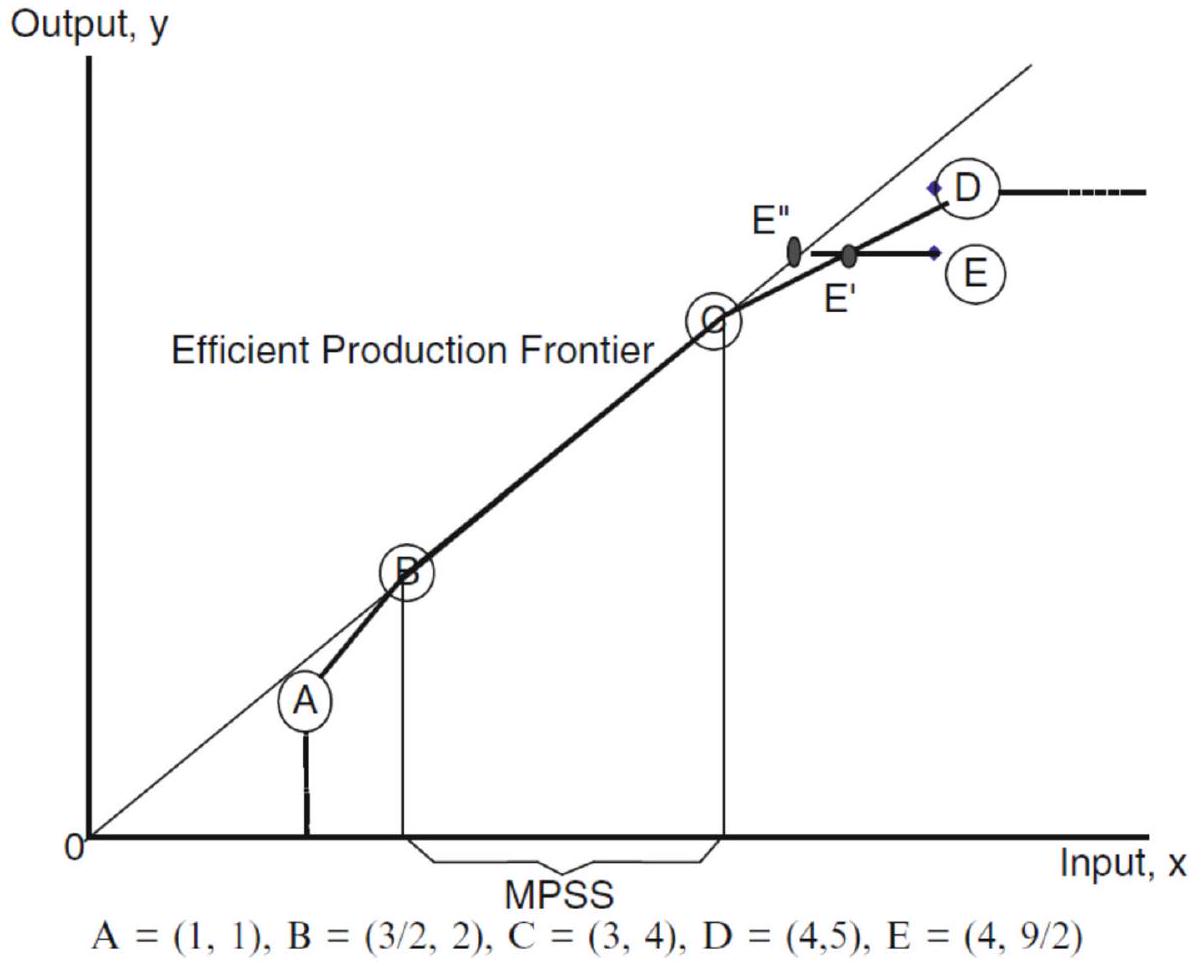
(1) مفهوم RTS محدد جيدًا فقط للنقاط الموجودة على حدود PPS. بالنسبة للنقاط الداخلية، لا يمكن التحقيق في RTS حيث أن التغيرات في الإنتاجية بسبب RTS تتداخل مع التغيرات في الإنتاجية بسبب القضاء على عدم الكفاءة.
(2) يرتبط مفهوم MPSS ارتباطًا مباشرًا بـ RTS. على وجه التحديد، الشعاع من نقطة الأصل (المعروف باسم
2.2 تطوير النظرية في تحديد RTS وMPSS من قبل بانكر
2.3 الثورة والتقدم
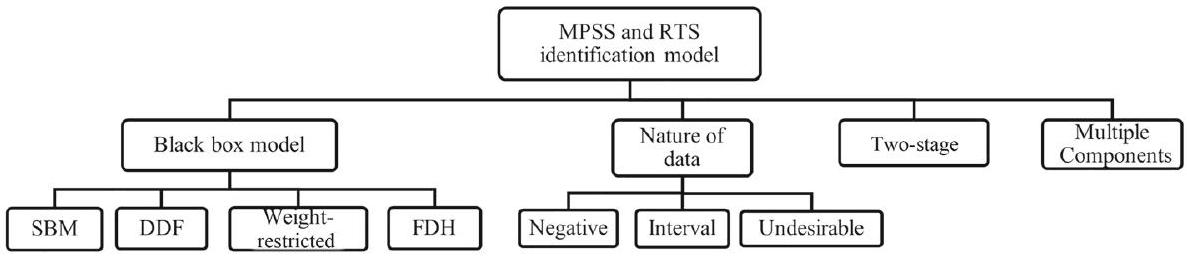
2.3.1 الثورة والتقدم في النمذجة
2.3.2 الثورة والتقدم في توصيفات المقياس
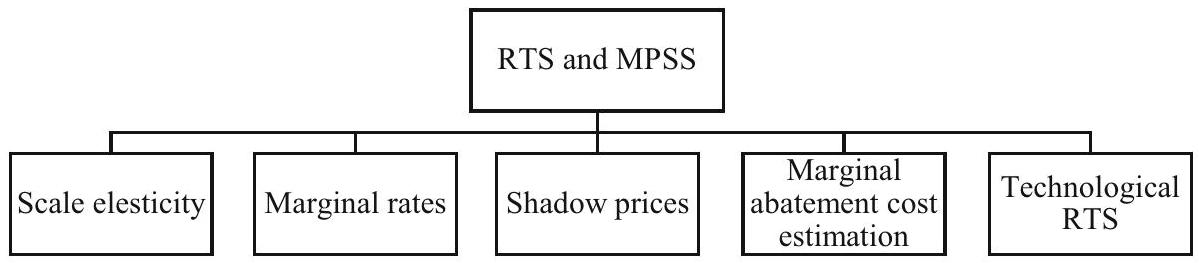
اقترح إطارًا أكثر عمومية لحساب معدلات الاستبدال الحدية في الحدود الإنتاجية غير المعلمية.
3 التقدم في الأسس الإحصائية لـ DEA: المساهمات، الأطر، والتطورات الحديثة
3.1 أصل الأسس الإحصائية لـ DEA بواسطة بانكر
3.2 تطوير نهج التمديد القائم على الإحصائيات في DEA بواسطة بانكر
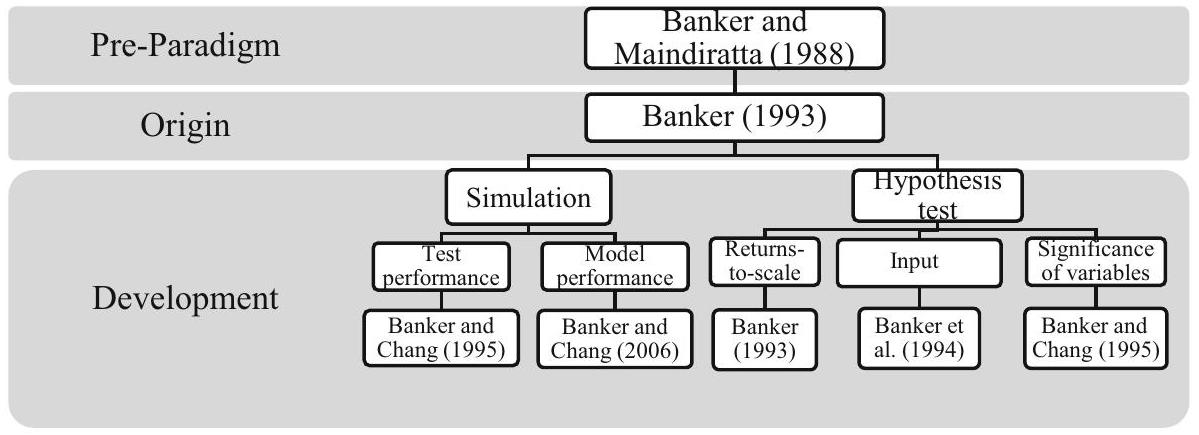
3.2.1 أسس المحاكاة في DEA بواسطة بانكر
لتكنولوجيا الإنتاج، وتوزيع عدم الكفاءة، وحجم العينة (بانكر، 1996).
3.2.2 أسس اختبار الفرضيات في تحليل الكفاءة بواسطة بانكر
3.3 التقدم في الأسس الإحصائية لتحليل الكفاءة وتوسعاته
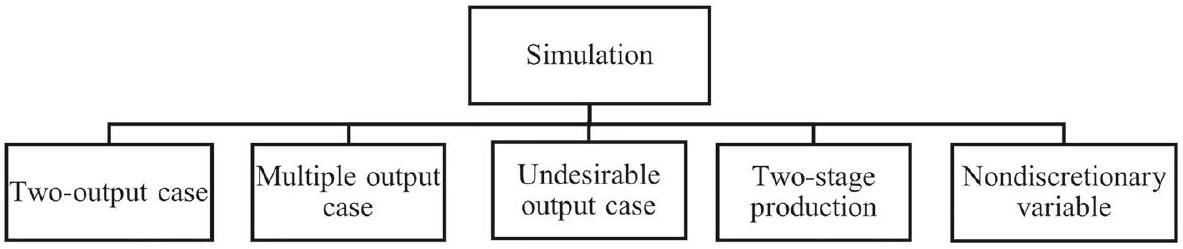
3.3.1 التقدم في تصميم المحاكاة في تحليل الكفاءة
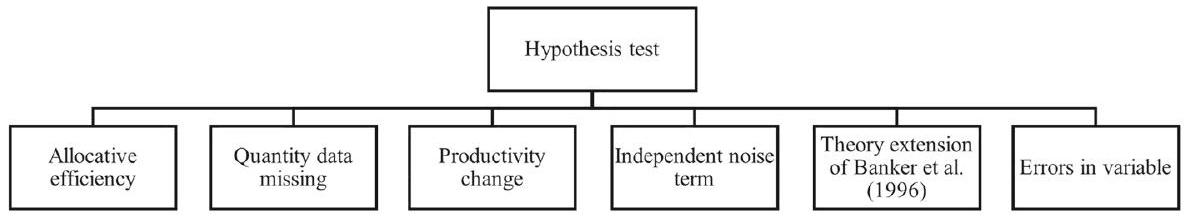
3.3.2 التقدم والثورة في اختبارات الفرضيات في DEA
3.3.3 التطورات في الاستدلال الإحصائي لـ DEA وتطبيقه
- معاملة الكفاءات المقدرة كانحرافات عشوائية.
- تطوير نماذج تأخذ في الاعتبار إما أخطاء القياس أو أخطاء التحديد.
- تطوير نماذج لتوليد مجموعات إمكانيات الإنتاج العشوائية بناءً على التغيرات العشوائية في مجموعات البيانات.
- المجموعة 1: توسع في الاتجاه الأول ويشمل نموذج DEA البوتستراب (أجيليوبولوس وجيورجوبولوس، 2017؛ بوبدي وتاناكا، 2018؛ بوبكر وآخرون، 2023؛ ديا وآخرون، 2022؛ دو وآخرون، 2018؛ كانغ وآخرون، 2024؛ ميشالي وآخرون، 2023؛ ستات، 2002؛ سيمار وويلسون، 1998، 1999، 2000أ، ب؛ مورادي-مطلغ وآخرون، 2022).
- المجموعة 2: توسع في كلا الاتجاهين الأول والثاني ويشمل نموذج DEA شبه المعلمي (عساف وجيلين، 2012؛ جونسون وماكغينيس، 2008؛ جيرادي وراجيرو، 2019؛ كوسمانين وكورتيلين، 2012؛ سيمار وويلسون، 2007).
- المجموعة 3: توسع في الاتجاهين الثاني والثالث ويشمل نماذج DEA المقيدة بالفرص (أميرتييموري وآخرون، 2023؛ كوبر وآخرون، 1996، 1998، 2002؛ لين ولو، 2023؛ ميتروبولوس وآخرون، 2015؛ شيراز وآخرون، 2020؛ تالوري وآخرون، 2006).
3.4 التقدم والتطورات في تقدير حدود الكوانتيل غير المعلمي
3.4.1 طريقة الحدود الجزئية
وشكل المضاعف. تم التحقق من الخصائص الإحصائية لهذا النموذج باستخدام محاكاة مونت كارلو وعينات nCm. تم تطبيق نهج مشابه على DEA المعتمد على السياق بواسطة سيفورد وزو (2003)، والذي يتضمن خوارزمية تحسب مستويات مختلفة من الحدود الفعالة من خلال استبعاد وحدات القرار الفعالة من مجموعة المرجع بشكل تكراري. ومع ذلك، لم يتم إثبات الاستدلال الإحصائي لـ DEA المعتمد على السياق بشكل مباشر. استكشف كارفالو وماركيز (2014) اقتصادات النطاق والمقياس لحساب اقتصادات التكامل الرأسي من خلال طريقة الحدود الجزئية.
3.4.2 نهج الانحدار الكمي
تأخذ الطريقة المقترحة في الاعتبار بشكل صريح كل من الضوضاء وعدم الكفاءة للتخفيف من المشكلات الناجمة عن الحساسية العالية لبيانات الضوضاء في تحليل الكفاءة النسبية (DEA). وبالتالي، تحسب الطريقة المقترحة تكلفة التخفيف الهامشية مع خلوها من مشكلات ضوضاء البيانات في نماذج DEA التقليدية. في أبحاث أكثر حداثة، قام داي وآخرون (2023) بتلخيص الأساليب الحالية للانحدار الكمي واقترحوا نموذجًا عامًا للدوال غير المعلمية المقيدة بالشكل. متجاوزين النماذج المحدبة المستخدمة في الانحدار الكمي الشرطي (CQR) (برمجة خطية) والانحدار المحدب المتوقع (CER) (برمجة رباعية)، قدم داي وآخرون (2023) معلمة لتمثيل الترتيب الجزئي، مما أدى إلى توليد نماذج CQR وCER غير المحدبة العامة. بالإضافة إلى ذلك، استخدم إسبانيا وآخرون (2024) نموذج DEA لتشكيل القيود وتقدير دوال الإنتاج من خلال نماذج إضافية تعتمد على انحدار الأشرطة. اقترح لياو وآخرون (2024) نهج انحدار غير معلمي محدب لمعالجة مشكلة الإفراط في التكيف والقيم الشاذة.
4 التحليل السياقي في تحليل البيانات
يؤدي بشكل مشابه أو أحيانًا أفضل من نهج سيمار وويلسون (2007). وبالتالي، يُوصى باستخدام نهج DEA+OLS لتقييم تأثير المتغيرات السياقية.
5 شبكة المؤلفين والمؤتمرات المنظمة
| سنة | الانتماء | دولة |
| 2005-2023 | جامعة تمبل/كلية فوكس للأعمال | فيلادلفيا |
| 2006 | جامعة ولاية أريزونا / كلية و. ب. كاري للأعمال | أريزونا |
| 2003-2005 | جامعة كاليفورنيا، ريفرسايد | كاليفورنيا |
| 2005 | جامعة كاليفورنيا/مدرسة أندرسون للإدارة | كاليفورنيا |
| 1992-2004 | جامعة تكساس في دالاس | تكساس |
| 1989-1997 | جامعة مينيسوتا/كلية كارلسون للإدارة | مينابوليس |
| 1984-1996 | جامعة كارنيجي ميلون | بيتسبرغ |
| 1994 | جامعة مينيسوتا/كلية كارلسون للإدارة | مينيسوتا |
| 1980 | جامعة هارفارد / كلية هارفارد للأعمال | ماساتشوستس |
| نوع | عدد المنشورات | نسبة مئوية |
| مقالة | ١٣٣ | 65.5 |
| ورقة مؤتمر | ٣٦ | 17.7 |
| مراجعة | 11 | ٥.٤ |
| كتاب محرر من وقائع المؤتمر | ٧ | 3.4 |
| فصل الكتاب | ٨ | 3.9 |
| تحرير | ٧ | 3.4 |
| ملاحظة | 1 | 0.5 |
| إجمالي | ٢٠٣ | 100 |
| المؤلف الأول | المؤلف الثاني | المؤلف الثالث | الرابع
|
إجمالي | |
| عدد المنشورات | 159 | ٢٨ | 14 | 2 | ٢٠٣ |
| نسبة مئوية | 78.3 | 13.8 | 6.9 | 1.0 | 100 |
| مؤلف مشارك | عدد المشاركات في التأليف | عنوان | الجامعة/الانتماء | مدرسة/ كلية | بلد |
| تشانغ، شيهوي | ٢٤ | أستاذ المحاسبة | جامعة دريكسل | جامعة دريكسل | الولايات المتحدة |
| ناتاراجان، راماشاندران نات | ١٣ | أستاذ إدارة | جامعة تكساس في دالاس | مدرسة نافين جيندال لإدارة الأعمال | الولايات المتحدة |
| إمرونجيد، أ | 11 | أستاذ تحليل الأعمال | جامعة ساري | كلية الأعمال في ساري | المملكة المتحدة |
| كوفمان، روبرت ج | 11 | أستاذ نظم المعلومات | جامعة سنغافورة للإدارة | جامعة سنغافورة للإدارة | سنغافورة |
| ويليام و. كوبر | 11 | أستاذ بحوث العمليات | جامعة تكساس في أوستن | مدرسة مكومبز للأعمال | الولايات المتحدة |
| داتار، سريكانت م | 10 | أستاذ الإدارة | جامعة هارفارد | مدرسة هارفارد للأعمال | الولايات المتحدة |
| أندرسون، مارك سي | 10 | أستاذ مشارك في المحاسبة | جامعة كالجاري | كلية هاسكين للأعمال | كندا |
| ريدل، رينيه | 9 | أستاذ الأعمال الرقمية والابتكار | جامعة العلوم التطبيقية العليا | كلية الإدارة | النمسا |
| باول أ. بافلو | 9 | أستاذ علوم المعلومات | جامعة هيوستن | كلية باوئر للأعمال | الولايات المتحدة |
| ديفيس، فريد د.د | 9 | أستاذ تكنولوجيا المعلومات | جامعة تكساس تك | كلية راولز للأعمال | الولايات المتحدة |
| عنوان | مجلة | مرجع |
| التقدم في تحليل كفاءة البيانات: الاحتفال بالذكرى الأربعين لتحليل كفاءة البيانات والذكرى المئوية لميلاد البروفيسور أبراهام تشارنس | المجلة الأوروبية للبحوث التشغيلية | إمرونج نيجاد وآخرون (2019) |
| التطورات الأخيرة في استخدام DEA في القطاع العام | علوم التخطيط الاجتماعي والاقتصادي | أهن وآخرون (2018) |
| إدارة أداء الأعمال في ظل بيئات غير مؤكدة – II | مجلة مركز الكاتدرائية: مجلة أبحاث الأعمال والاقتصاد | تشارلز وبانكر (2017) |
| إدارة أداء الأعمال في ظل بيئات غير مؤكدة – الجزء الأول | مجلة مركز الكاتدرائية: مجلة أبحاث الأعمال والاقتصاد | تشارلز وبانكر (2016) |
| تحليل كفاءة البيانات في القطاع العام | علوم التخطيط الاجتماعي والاقتصادي | إمرونج نيجاد وآخرون، (2014أ، ب) |
| الكفاءة والإنتاجية: النظرية والتطبيقات | سجلات بحوث العمليات | إمرونجاد وبانكر (2010) |
| عنوان | مؤتمر | المؤلفون/المحررون | رقم الكتاب الدولي الموحد |
| التطبيقات الحديثة لتحليل كفاءة البيانات | المؤتمر الدولي السادس عشر للـ DEA، يونيو 2017، جامعة الاقتصاد، براغ، جمهورية التشيك (DEA2017) | إمرونج نيجاد، بانكر وآخرون (2017) | 978185449 4337 |
| التطبيقات الحديثة لتحليل كفاءة البيانات | المؤتمر الدولي الرابع عشر للـ DEA، مايو 2016، جامعة جيانغهان، ووهان، الصين (DEA2016) | إمرونج نيجاد، بانكر وآخرون (2016) | 978185449 4139 |
| تحليل كفاءة البيانات وتطبيقاته | المؤتمر الدولي الثالث عشر للـ DEA، أغسطس 2015، براونشفايغ، ألمانيا (DEA2015) | إمرونجيد، بانكر وآخرون (2015) | 978185449 4979 |
| التنمية المستدامة وقياس الأداء | ورشة العمل الدولية لمكافحة المخدرات، 17-19 سبتمبر 2014، هيرموسيلو، سونورا، المكسيك | بانكر وآخرون (2014) | 978185449 4825 |
| نظرية وتطبيقات تحليل كفاءة البيانات | المؤتمر الدولي الثاني عشر للـ DEA، أبريل 2014، جامعة مالايا، كوالالمبور، ماليزيا (DEA2014) | إمرونجاد وآخرون (2014أ، ب) | 978185449 4870 |
| تحليل كفاءة البيانات وقياس الأداء | المؤتمر الدولي الحادي عشر للـ DEA، يونيو 2013، سامسون، تركيا (DEA2013) | بانكر، إمروزنجاد وآخرون (2013) | 978185449 4771 |
| تحليل كفاءة البيانات: النظرية والتطبيقات | المؤتمر الدولي العاشر حول تحليل البيانات، ناتال، البرازيل (DEA2012) | بانكر، إمروزنجاد وآخرون (2012) | 978185449 4375 |
| المجلة/المصدر | عدد المنشورات | % المنشورات | % التراكمي |
| المجلة الأوروبية للبحوث التشغيلية | 17 | ٨.٧ | ٨.٧ |
| علوم الإدارة | 15 | ٧.٧ | 16.3 |
| سجلات بحوث العمليات | 9 | ٤.٦ | ٢٠.٩ |
| مراجعة المحاسبة | ٧ | 3.6 | ٢٤.٥ |
| البحث المحاسبي المعاصر | ٧ | 3.6 | ٢٨.١ |
| مجلة المحاسبة والاقتصاد | ٧ | 3.6 | 31.6 |
| أبحاث نظم المعلومات | ٦ | 3.1 | ٣٤.٧ |
| ربع سنوي نظم المعلومات الإدارية | ٦ | 3.1 | 37.8 |
| ملاحظات المحاضرات في نظم المعلومات والتنظيم | ٥ | 2.6 | ٤٠.٣ |
| مجلة بحوث المحاسبة | ٤ | 2.0 | 42.3 |
| مجلة المحاسبة والتدقيق والمالية | ٤ | 2.0 | ٤٤.٤ |
| مجلة نظم إدارة المعلومات | ٤ | 2.0 | ٤٦.٤ |
| مجلة تحليل الإنتاجية | ٤ | 2.0 | ٤٨.٥ |
| أعمال المؤتمر الدولي السنوي في هاواي لعلوم الأنظمة | ٤ | 2.0 | 50.5 |
| اتصالات جمعية الحاسبات الآلية | ٣ | 1.5 | ٥٢.٠ |
| معاملات IEEE في هندسة البرمجيات | ٣ | 1.5 | 53.6 |
| مجلة أبحاث المحاسبة الإدارية | ٣ | 1.5 | ٥٥.١ |
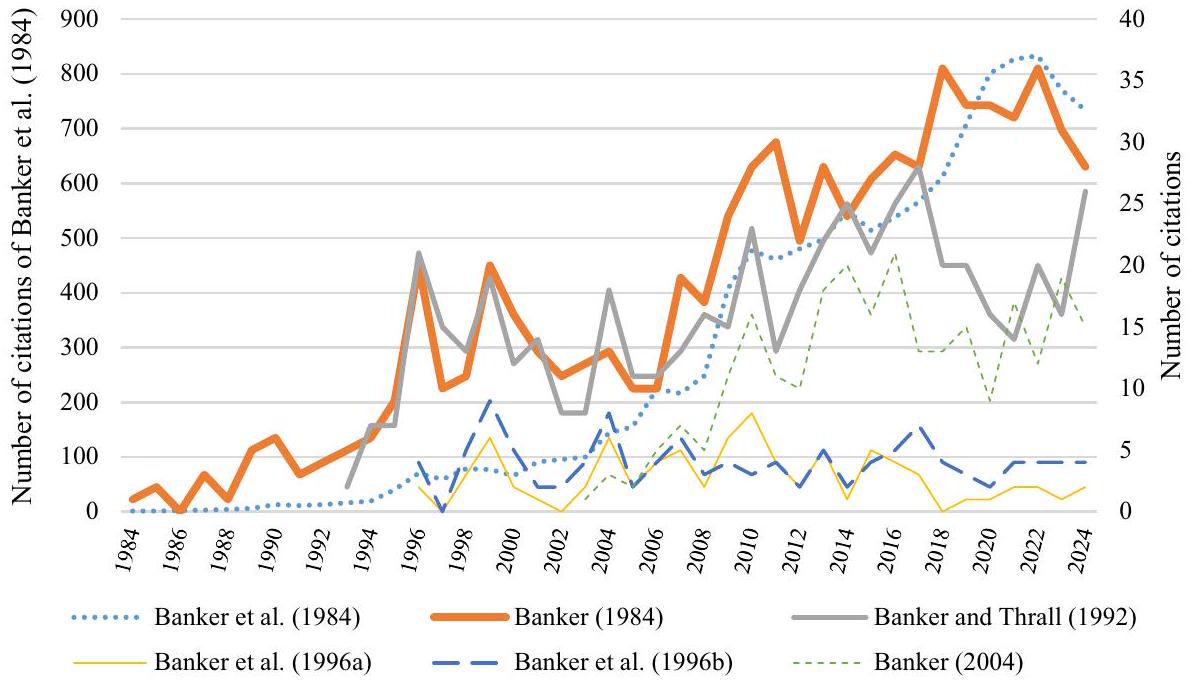
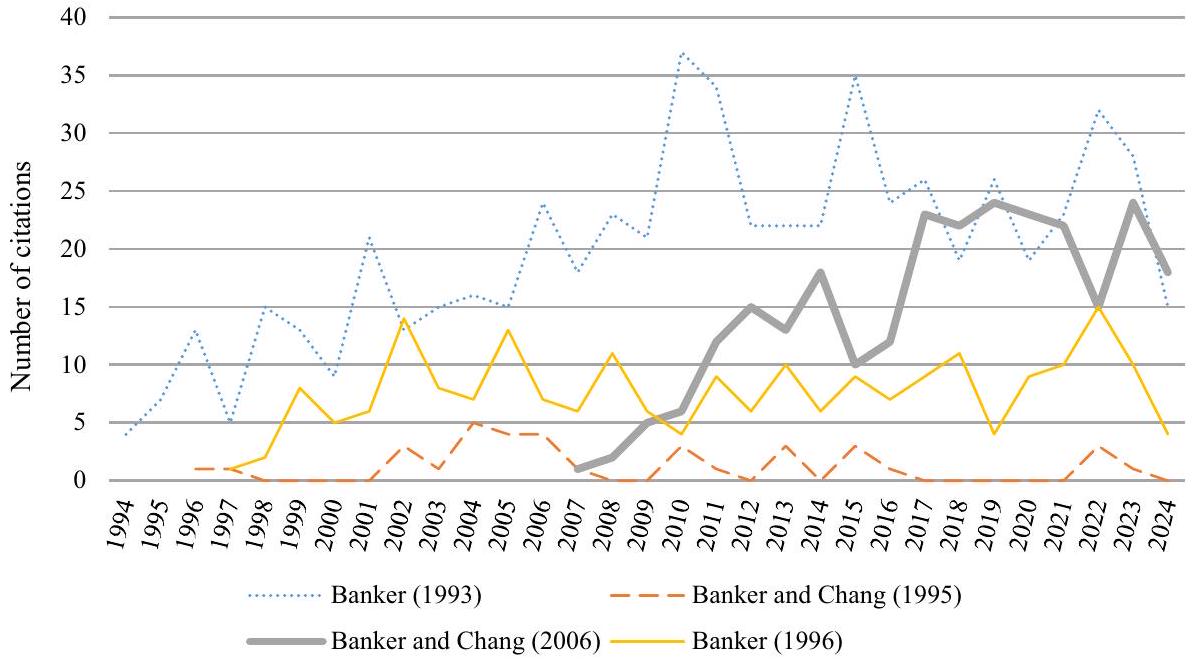
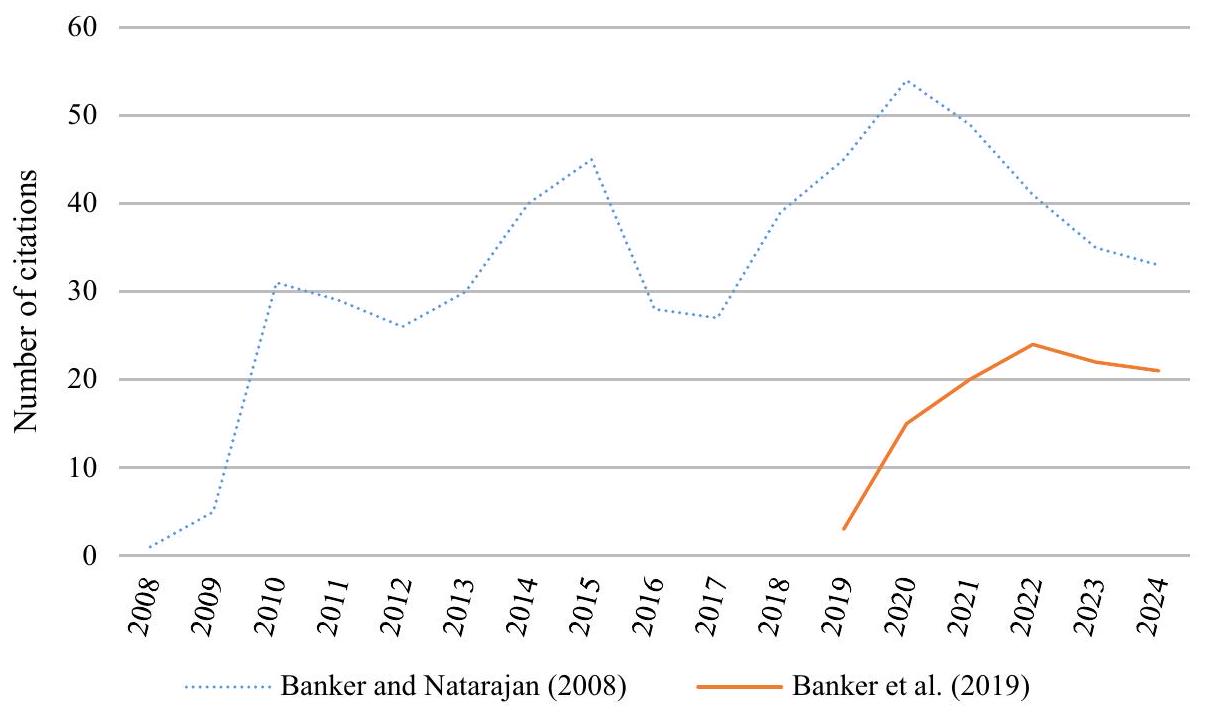
| نشر | مجلة | عدد الاقتباسات |
| بانكر وآخرون (1984) | علوم الإدارة | 11,547 |
| بانكر وموري (1986) | بحوث العمليات | 863 |
| المصرفي (1984) | المجلة الأوروبية للبحوث التشغيلية | 696 |
| أندرسون وآخرون (2003) | مجلة أبحاث المحاسبة | 639 |
| المصرفي (1993) | علوم الإدارة | ٦١٦ |
| بانكر و ناتاراجان (2008) | بحوث العمليات | ٥٥٩ |
| بانكر وثرال (1992) | المجلة الأوروبية للبحوث التشغيلية | ٥١٧ |
| بانكر وآخرون (2000) | مراجعة المحاسبة | ٤٩٠ |
| بانكر وآخرون (1998) | علوم الإدارة | ٤٥١ |
| بانكر وموري (1986) | علوم الإدارة | 418 |
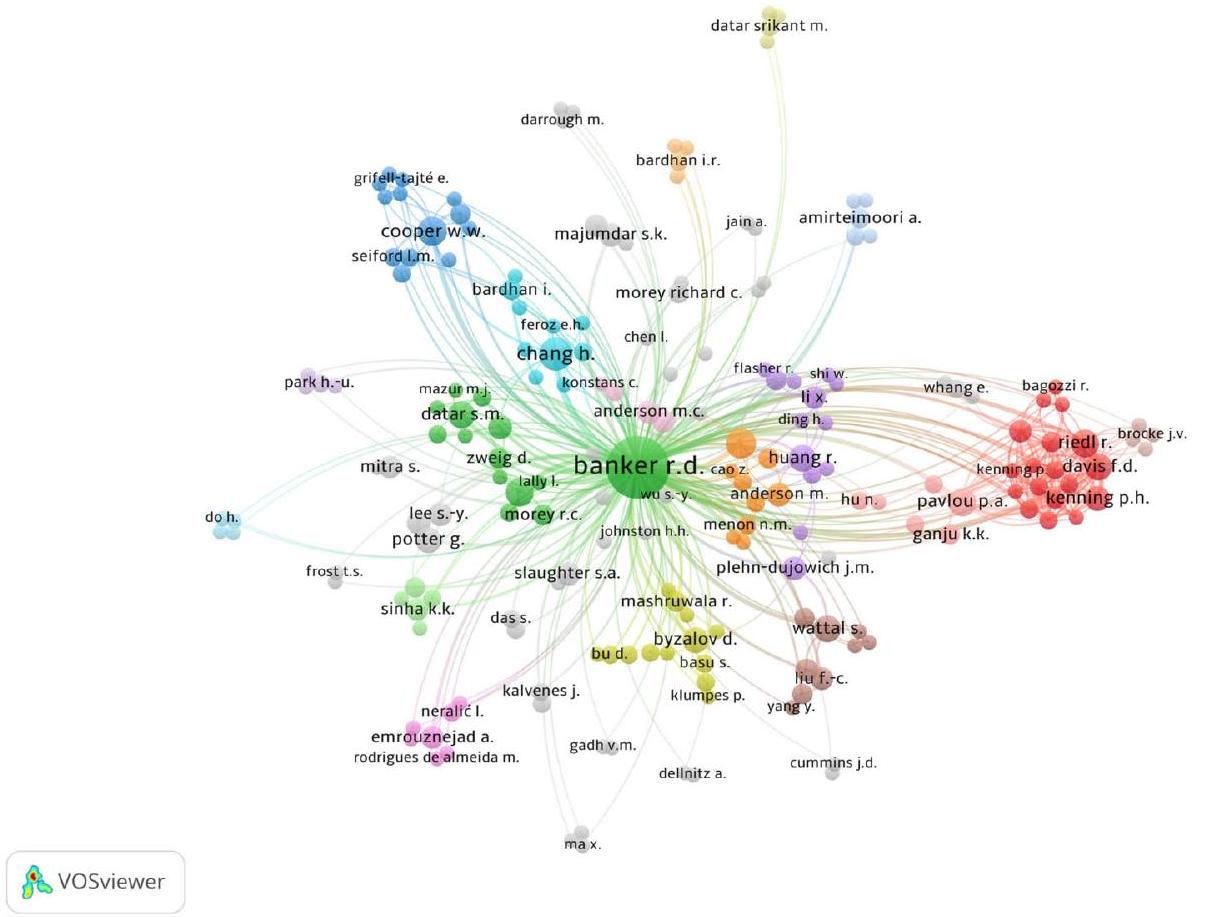
6 التحليل البيبليومتري
6.1 المستوى الكلي
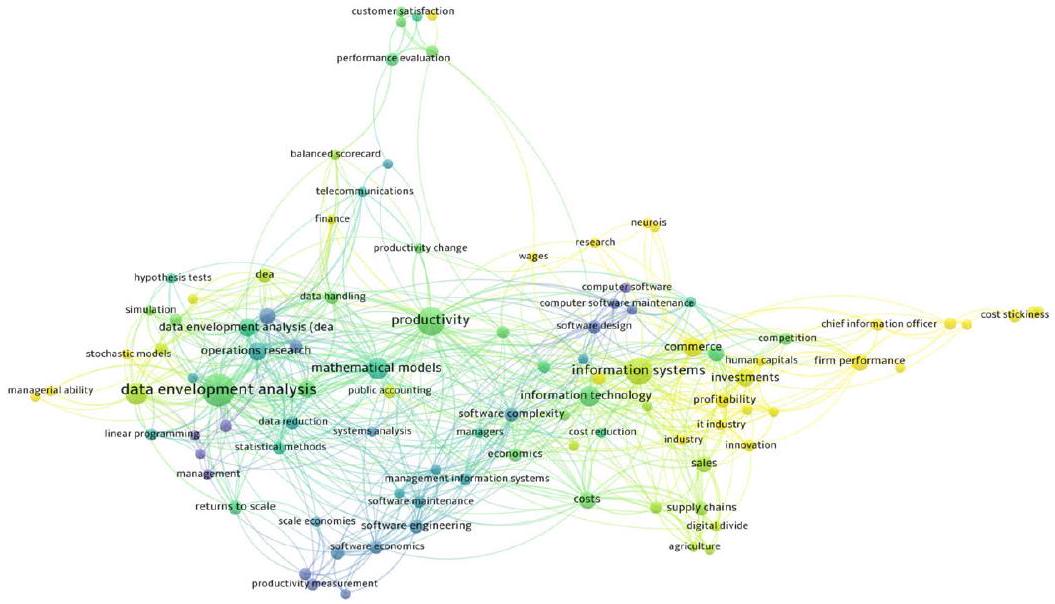
تطور تركيز أبحاثه، من المواضيع التقليدية إلى مواضيع أكثر حداثة ضمن هذا المجال.
6.2 المستوى الدقيق
6.2.1 تحليل موضوع العوائد على المقياس
6.2.2 تحليل التحليل الإحصائي في موضوع تحليل البيانات
6.2.3 تحليل موضوع التحليل السياقي
7 الخاتمة
الإعلانات
غير مشمولة في رخصة المشاع الإبداعي للمقالة واستخدامك المقصود غير مسموح به بموجب اللوائح القانونية أو يتجاوز الاستخدام المسموح به، ستحتاج إلى الحصول على إذن مباشرة من صاحب حقوق الطبع والنشر. لعرض نسخة من هذه الرخصة، قم بزيارةhttp://creativecommons.org/licenses/by/4.0/.
References
Ahn, H., Afsharian, M., Emrouznejad, A., & Banker, R. (2018). Recent developments on the use of DEA in the public sector. Socio-Economic Planning Science, 61, 1-3.
Alirezaee, M., Hajinezhad, E., & Paradi, J. C. (2018). Objective identification of technological returns to scale for data envelopment analysis models. European Journal of Operational Research, 266(2), 678-688.
Alperovych, Y., Hübner, G., & Lobet, F. (2015). How does governmental versus private venture capital backing affect a firm’s efficiency? Evidence from Belgium. Journal of Business Venturing, 30(4), 508-525.
Amirteimoori, A., Charles, V., & Mehdizadeh, S. (2023). Stochastic data envelopment analysis in the presence of undesirable outputs. Journal of the Operational Research Society, 74(12), 2619-2632.
Anderson, M. C., Banker, R. D. & Janakiraman, S. N. (2003). Are selling, general, and administrative costs “sticky”?. Journal of Accounting Research, 41(1), 47-63.
Aragon, Y., Daouia, A., & Thomas-Agnan, C. (2005). Nonparametric frontier estimation: A conditional quantile-based approach. Econometric Theory, 21(2), 358-389.
Asmild, M., Paradi, J. C., & Reese, D. N. (2006). Theoretical perspectives of trade-off analysis using DEA. Omega, 34(4), 337-343.
Assaf, A. G., & Gillen, D. (2012). Measuring the joint impact of governance form and economic regulation on airport efficiency. European Journal of Operational Research, 220(1), 187-198.
Assani, S., Jiang, J., Cao, R., & Yang, F. (2018). Most productive scale size decomposition for multi-stage systems in data envelopment analysis. Computers & Industrial Engineering, 120, 279-287.
Atwood, J., & Shaik, S. (2020). Theory and statistical properties of quantile data envelopment analysis. European Journal of Operational Research, 286(2), 649-661.
Badunenko, O., & Mozharovskyi, P. (2020). Statistical inference for the Russell measure of technical efficiency. Journal of the Operational Research Society, 71(3), 517-527.
Bandyopadhyay, S. (2011). In search of contextual variables in a stochastic DEA framework: Effect of regulation on efficiency of Indian cement industry. Journal of the Operational Research Society, 62(9), 1621-1637.
Banker, R. D. (1984). Estimating most productive scale size using data envelopment analysis. European Journal of Operational Research, 17(1), 35-44.
Banker, R. D. (1993). Maximum likelihood, consistency and data envelopment analysis: A statistical foundation. Management Science, 39(10), 1265-1273.
Banker, R. D. (1996). Hypothesis tests using data envelopment analysis. Journal of Productivity Analysis, 7, 139-159.
Banker, R. D., & Chang, H. (1995). A simulation study of hypothesis tests for differences in efficiencies. International Journal of Production Economics, 39(1-2), 37-54.
Banker, R.D ., & Chang, H. (2006). The super-efficiency procedure for outlier identification, not for ranking efficient units. European Journal of Operational Research, 175(2), 1311-1320.
Banker, R. D., & Maindiratta, A. (1986). Piecewise loglinear estimation of efficient production surfaces. Management Science, 32(1), 126-135.
Banker, R. D., & Maindiratta, A. (1988). Nonparametric analysis of technical and allocative efficiencies in production. Econometrica: Journal of the Econometric Society, 56, 1315-1332.
Banker, R. D., & Natarajan, R. (2008). Evaluating contextual variables affecting productivity using data envelopment analysis. Operations Research, 56(1), 48-58.
Banker, R. D., & Thrall, R. M. (1992). Estimation of returns to scale using data envelopment analysis. European Journal of Operational Research, 62(1), 74-84.
Banker, R. D., Potter, G., & Srinivasan, D. (2000). An empirical investigation of an incentive plan that includes nonfinancial performance measures. The Accounting Review, 75(1), 65-92.
Banker, R. D., Charnes, A., & Cooper, W. W. (1984). Some models for estimating technical and scale inefficiencies in data envelopment analysis. Management Science, 30(9), 1078-1092.
Banker, R. D., Datar, S. M., & Kemerer, C. F. (1991). A model to evaluate variables impacting the productivity of software maintenance projects. Management Science, 37, 1-18.
Banker, R. D., Bardhan, I., & Cooper, W. W. (1996a). A note on returns to scale in DEA. European Journal of Operational Research, 88(3), 583-585.
Banker, R. D., Chang, H., & Cooper, W. W. (1996b). Equivalence and implementation of alternative methods for determining returns to scale in data envelopment analysis. European Journal of Operational Research, 89(3), 473-481.
Banker, R. D., Janakiraman, S., & Natarajan, R. (2002). Evaluating the adequacy of parametric functional forms in estimating monotone and concave production functions. Journal of Productivity Analysis, 17, 111-132.
Banker, R. D., Khosla, I., & Sinha, K. K. (1998). Quality and competition. Management science, 44(9), 1179-1192.
Banker, R. D., Cooper, W. W., Seiford, L. M., Thrall, R. M., & Zhu, J. (2004a). Returns to scale in different DEA models. European Journal of Operational Research, 154(2), 345-362.
Banker, R. D., Janakiraman, S., & Natarajan, R. (2004b). Analysis of trends in technical and allocative efficiency: An application to Texas public school districts. European Journal of Operational Research, 154(2), 477-491.
Banker, R. D., Chang, H., & Natarajan, R. (2005). Productivity change, technical progress, and relative efficiency change in the public accounting industry. Management Science, 51(2), 291-304.
Banker, R. D., Chang, H., & Natarajan, R. (2007). Estimating DEA technical and allocative inefficiency using aggregate cost or revenue data. Journal of Productivity Analysis, 27, 115-121.
Banker, R. D., Chang, H., & Lee, S. Y. (2010a). Differential impact of Korean banking system reforms on bank productivity. Journal of Banking & Finance, 34(7), 1450-1460.
Banker, R. D., Zheng, Z. E., & Natarajan, R. (2010b). DEA-based hypothesis tests for comparing two groups of decision making units. European Journal of Operational Research, 206(1), 231-238.
Banker, R. D., Cooper, W. W., Seiford, L. M. & Zhu, J. (2011). Returns to scale in DEA. Handbook on data envelopment analysis, pp. 41-70.
Banker, R.D., Emrouznejad, A., Lopes, A. L. M. & de Almeida, M. R. (2012). Data envelopment analysis: Theory and applications. In Proceedings of the 10th International Conference on DEA, Natal, Brazil.
Banker, R. D., Emrouznejad, A., Bal, H., Alp, I. & Cengiz, M. A. (2013). Data envelopment analysis and performance measurement. In Proceedings of the 11th International Conference of DEA, June 2013, Samsun, Turkey.
Banker, R.D., Emrouznejad, A., Vargas, F. & Flores, P. (2014). Sustainable development and performance measurement. In Proceedings of the International DEA Workshop, 2014, Hermosillo, Sonora, Mexico.
Banker, R., Natarajan, R., & Zhang, D. (2019). Two-stage estimation of the impact of contextual variables in stochastic frontier production function models using data envelopment analysis: Second stage OLS versus bootstrap approaches. European Journal of Operational Research, 278(2), 368-384.
Bardhan, I. R., Cooper, W. W., & Kumbhakar, S. C. (1998). A simulation study of joint uses of data envelopment analysis and statistical regressions for production function estimation and efficiency evaluation. Journal of Productivity Analysis, 9, 249-278.
Bessent, A., Bessent, W., Elam, J., & Clark, T. (1988). Efficiency frontier determination by constrained facet analysis. Operations Research, 36(5), 785-796.
Bobde, S. M., & Tanaka, M. (2018). Efficiency evaluation of electricity distribution utilities in India: A twostage DEA with bootstrap estimation. Journal of the Operational Research Society, 69(9), 1423-1434.
Boubaker, S., Le, T. D., Manita, R., & Ngo, T. (2023). The trade-off frontier for ESG and Sharpe ratio: a bootstrapped double-frontier data envelopment analysis. Annals of Operations Research. https://doi.org/ 10.1007/s10479-023-05506-z
Cazals, C., Florens, J. P., & Simar, L. (2002). Nonparametric frontier estimation: A robust approach. Journal of Econometrics, 106(1), 1-25.
Chang, K. P., & Guh, Y. Y. (1991). Linear production functions and the data envelopment analysis. European Journal of Operational Research, 52(2), 215-223.
Charles, V., & Banker, R. D. (2016). Business performance management under uncertain environments-I. Editorial. Journal of Centrum Cathedra: The Business and Economics Research Journal, 9(2), 90-91. https://doi.org/10.1108/JCC-01-2017-0003
Charles, V., & Banker, R. D. (2017). Business performance management under uncertain environments-II Editorial. Journal of Centrum Cathedra: The Business and Economics Research Journal, 10(1), 2-3. https://doi.org/10.1108/JCC-07-2017-018
Charnes, A., Cooper, W. W., & Thrall, R. M. (1986). Classifying and characterizing efficiencies and inefficiencies in data development analysis. Operations Research Letters, 5(3), 105-110.
Charnes, A., Gallegos, A., & Li, H. (1996). Robustly efficient parametric frontiers via multiplicative DEA for domestic and international operations of the Latin American airline industry. European Journal of Operational Research, 88(3), 525-536.
Chen, C. M., & Delmas, M. A. (2012). Measuring eco-inefficiency: A new frontier approach. Operations Research, 60(5), 1064-1079.
Chen, K., & Zhu, J. (2019). Computational tractability of chance constrained data envelopment analysis. European Journal of Operational Research, 274(3), 1037-1046.
Cooper, W. W., & Tone, K. (1997). Measures of inefficiency in data envelopment analysis and stochastic frontier estimation. European Journal of Operational Research, 99(1), 72-88.
Cooper, W. W., Huang, Z., & Li, S. X. (1996). Chapter 13 satisficing DEA models under chance constraints. Annals of Operations Research, 66, 279-295.
Cooper, W. W., Huang, Z., Lelas, V., Li, S. X., & Olesen, O. B. (1998). Chance constrained programming formulations for stochastic characterizations of efficiency and dominance in DEA. Journal of Productivity Analysis, 9, 53-79.
Cooper, W. W., Park, D. K. S., & Ciurana, P. J. T. P. (2000). Marginal rates and elasticities of substitution with additive models in DEA. Journal of Productivity Analysis, 13, 105-123.
Cooper, W. W., Deng, H., Huang, Z., & Li, S. X. (2002). Chance constrained programming approaches to technical efficiencies and inefficiencies in stochastic data envelopment analysis. Journal of the Operational Research Society, 53, 1347-1356.
Dai, S., Kuosmanen, T. and Zhou, X. (2022) Partial frontiers are not quantiles. arXiv preprint arXiv:2205. 11885.
Daouia, A., & Gijbels, I. (2011). Robustness and inference in nonparametric partial frontier modeling. Journal of Econometrics, 161(2), 147-165.
Daouia, A., & Simar, L. (2005). Robust nonparametric estimators of monotone boundaries. Journal of Multivariate Analysis, 96(2), 311-331.
Daouia, A., & Simar, L. (2007). Nonparametric efficiency analysis: A multivariate conditional quantile approach. Journal of Econometrics, 140(2), 375-400.
Dia, M., Takouda, P.M. & Golmohammadi, A., (2022). Assessing the performance of Canadian credit unions using a three-stage network bootstrap DEA. Annals of Operations Research, 1-33.
Du, K., Worthington, A. C., & Zelenyuk, V. (2018). Data envelopment analysis, truncated regression and double-bootstrap for panel data with application to Chinese banking. European Journal of Operational Research, 265(2), 748-764.
e Souza, G. D. S., & Gomes, E. G. (2015). Management of agricultural research centers in Brazil: A DEA application using a dynamic GMM approach. European Journal of Operational Research, 240(3), 819-824.
Emrouznejad, A., & Amin, G. R. (2009). DEA models for ratio data: Convexity consideration. Applied Mathematical Modelling, 33(1), 486-498.
Emrouznejad, A., & Banker, R. D. (2010). Efficiency and productivity: theory and applications. Annals of Operations Research, 173(1), 1-10.
Emrouznejad, A., Anouze, A. L., & Thanassoulis, E. (2010). A semi-oriented radial measure for measuring the efficiency of decision making units with negative data, using DEA. European Journal of Operational Research, 200(1), 297-304.
Emrouznejad, A., Banker, R. D., Lopes, A. L. M., & de Almeida, M. R. (2014a). Data envelopment analysis in the public sector. Socio-Economic Planning Sciences, 48(1), 2-3.
Emrouznejad, A., Banker, R., Munisamy, S. & Arabi, B. (2014b). Theory and applications of data envelopment analysis. In Proceedings of the 12th International Conference of DEA, April 2014, University of Malaya, Kuala Lumpur, Malaysia.
Emrouznejad, A., Banker, R.D., Ahn, H. & Afsharian, M. (2015). Data envelopment analysis and its applications. In Proceedings of the 13th International Conference of DEA, August 2015, Braunschweig, Germany.
Emrouznejad, A., Banker, R., Ray, S. C. & Chen, L. (2016). Recent applications of data envelopment analysis. In Proceedings of the 14th International Conference of DEA, May 2016, Jianghan University, Wuhan, China.
Emrouznejad, A., Banker, R. D., & Neralic, L. (2019). Advances in data envelopment analysis: Celebrating the 40th anniversary of DEA and the 100th anniversary of Professor Abraham Charnes’ birthday. European Journal of Operational Research, 278(2), 365-367.
España, V. J., Aparicio, J., Barber, X., & Esteve, M. (2024). Estimating production functions through additive models based on regression splines. European Journal of Operational Research, 312(2), 684-699.
Esteve, M., Aparicio, J., Rabasa, A., & Rodriguez-Sala, J. J. (2020). Efficiency analysis trees: A new methodology for estimating production frontiers through decision trees. Expert Systems with Applications, 162, 113783.
Färe, R., Grosskopf, S., Lovell, C. K., & Yaisawarng, S. (1993). Derivation of shadow prices for undesirable outputs: a distance function approach. The Review of Economics and Statistics, 75, 374-380.
Färe, R., Grosskopf, S., & Lovell, C. K. (1994). Production frontiers. Cambridge University Press.
Fernandez, C., Koop, G., & Steel, M. F. J. (2002). Multiple-output production with undesirable outputs: An application to nitrogen surplus in agriculture. Journal of the American Statistical Association, 97(458), 432-442.
Førsund, F. R. (1999). The evolution of DEA-The economics perspective. University of Oslo Working paper, Oslo, Norway.
Førsund, F. R. (2018). Economic interpretations of DEA. Socio-Economic Planning Sciences, 61, 9-15.
Førsund, F. R., & Hjalmarsson, L. (2004). Calculating scale elasticity in DEA models. Journal of the Operational Research Society, 55(10), 1023-1038.
Førsund, F. R., Hjalmarsson, L., Krivonozhko, V. E., & Utkin, O. B. (2007). Calculation of scale elasticities in DEA models: Direct and indirect approaches. Journal of Productivity Analysis, 28, 45-56.
Førsund, F. R., Kittelsen, S. A., & Krivonozhko, V. E. (2009). Farrell revisited-Visualizing properties of DEA production frontiers. Journal of the Operational Research Society, 60, 1535-1545.
Frisch, R. (1964). Theory of production. Springer Science & Business Media.
Fukuyama, H. (2000). Returns to scale and scale elasticity in data envelopment analysis. European Journal of Operational Research, 125(1), 93-112.
Fukuyama, H. (2003). Scale characterizations in a DEA directional technology distance function framework. European Journal of Operational Research, 144(1), 108-127.
Giménez, V., Prior, D., Thieme, C., & Tortosa-Ausina, E. (2024). International comparisons of COVID-19 pandemic management: What can be learned from activity analysis techniques? Omega, 122, 102966.
Giraleas, D., Emrouznejad, A., & Thanassoulis, E. (2012). Productivity change using growth accounting and frontier-based approaches-Evidence from a Monte Carlo analysis. European Journal of Operational Research, 222(3), 673-683.
Golany, B., & Yu, G. (1997). Estimating returns to scale in DEA. European Journal of Operational Research, 103(1), 28-37.
Gong, B. H., & Sickles, R. C. (1992). Finite sample evidence on the performance of stochastic frontiers and data envelopment analysis using panel data. Journal of Econometrics, 51(1-2), 259-284.
Grosskopf, S. (1996). Statistical inference and nonparametric efficiency: A selective survey. Journal of Productivity Analysis, 7, 161-176.
Halická, M., & Trnovská, M. (2021). A unified approach to non-radial graph models in data envelopment analysis: Common features, geometry, and duality. European Journal of Operational Research, 289(2), 611-627.
Hatami-Marbini, A., Emrouznejad, A., & Agrell, P. J. (2014). Interval data without sign restrictions in DEA. Applied Mathematical Modelling, 38, 2028-2036.
Johnson, A. L., & Kuosmanen, T. (2012). One-stage and two-stage DEA estimation of the effects of contextual variables. European Journal of Operational Research, 220(2), 559-570.
Johnson, A. L., & McGinnis, L. F. (2008). Outlier detection in two-stage semiparametric DEA models. European Journal of Operational Research, 187(2), 629-635.
Jradi, S., & Ruggiero, J. (2019). Stochastic data envelopment analysis: A quantile regression approach to estimate the production frontier. European Journal of Operational Research, 278(2), 385-393.
Kang, H. J., Kim, C., & Choi, K. (2024). Combining bootstrap data envelopment analysis with social networks for rank discrimination and suitable potential benchmarks. European Journal of Operational Research, 312(1), 283-297.
Kao, C., & Hwang, S. N. (2011). Decomposition of technical and scale efficiencies in two-stage production systems. European Journal of Operational Research, 211(3), 515-519.
Karagiannis, R. (2015). A system-of-equations two-stage DEA approach for explaining capacity utilization and technical efficiency. Annals of Operations Research, 227, 25-43.
Kerstens, K., & Eeckaut, P. V. (1999). Estimating returns to scale using non-parametric deterministic technologies: A new method based on goodness-of-fit. European Journal of Operational Research, 113(1), 206-214.
Khezrimotlagh, D. (2022). Simulation designs for production frontiers. European Journal of Operational Research, 303(3), 1321-1334.
Khezrimotlagh, D., & Zhu, J. (2023). The role of unobserved units in two-stage network data envelopment analysis. Journal of the Operational Research Society, 74(5), 1275-1285.
Kneip, A., Park, B. U., & Simar, L. (1998). A note on the convergence of nonparametric DEA estimators for production efficiency scores. Econometric Theory, 14(6), 783-793.
Kneip, A., Simar, L., & Wilson, P. W. (2015). When bias kills the variance: Central limit theorems for DEA and FDH efficiency scores. Econometric Theory, 31(2), 394-422.
Kneip, A., Simar, L., & Wilson, P. W. (2016). Testing hypotheses in nonparametric models of production. Journal of Business & Economic Statistics, 34(3), 435-456.
Kneip, A., Simar, L., & Wilson, P. W. (2021). Inference in dynamic, nonparametric models of production: Central limit theorems for Malmquist indices. Econometric Theory, 37(3), 537-572.
Koenker, R., & Bassett, G., Jr. (1978). Regression quantiles. Journal of the Econometric Society., 23, 33-50.
Kontolaimou, A., & Tsekouras, K. (2010). Are cooperatives the weakest link in European banking? A nonparametric metafrontier approach. Journal of Banking & Finance, 34(8), 1946-1957.
Korhonen, P. J., Soleimani-Damaneh, M., & Wallenius, J. (2011). Ratio-based RTS determination in weightrestricted DEA models. European Journal of Operational Research, 215(2), 431-438.
Korostelëv, A. P., Simar, L., & Tsybakov, A. B. (1995a). Efficient estimation of monotone boundaries. The Annals of Statistics, 23, 476-489.
Korostelëv, A. P., Simar, L., & Tsybakov, A. (1995b). On estimation of monotone and convex boundaries. In Annales de l’ISUP, 39(1), 3-18.
Krivonozhko, V. E., Førsund, F. R., & Lychev, A. V. (2014). Measurement of returns to scale using non-radial DEA models. European Journal of Operational Research, 232(3), 664-670.
Krivonozhko, V. E., Utkin, O. B., Volodin, A. V., Sablin, I. A., & Patrin, M. (2004). Constructions of economic functions and calculations of marginal rates in DEA using parametric optimization methods. Journal of the Operational Research Society, 55, 1049-1058.
Kuhn, T. S. (1970). The structure of scientific revolutions (2nd ed.). The University of Chicago Press.
Kuosmanen, T. (2006). Stochastic nonparametric envelopment of data: Combining virtues of SFA and DEA in a unified framework. MTT Discussion paper no. 3/2006, MT
Kuosmanen, T. (2008). Representation theorem for convex nonparametric least squares. The Econometrics Journal, 11(2), 308-325.
Kuosmanen, T., & Johnson, A. L. (2010). Data envelopment analysis as nonparametric least-squares regression. Operations Research, 58(1), 149-160.
Kuosmanen, T., & Johnson, A. (2017). Modeling joint production of multiple outputs in StoNED: Directional distance function approach. European Journal of Operational Research, 262(2), 792-801.
Kuosmanen, T., & Kortelainen, M. (2012). Stochastic non-smooth envelopment of data: Semi-parametric frontier estimation subject to shape constraints. Journal of Productivity Analysis, 38, 11-28.
Kuosmanen, T., Post, T., & Scholtes, S. (2007). Non-parametric tests of productive efficiency with errors-invariables. Journal of Econometrics, 136(1), 131-162.
Kuosmanen, T., Johnson, A. & Saastamoinen, A. (2015). Stochastic nonparametric approach to efficiency analysis: A unified framework. InData Envelopment Analysis: A Handbook of Models and Methods, pp. 191-244
Kuosmanen, T., & Zhou, X. (2021). Shadow prices and marginal abatement costs: Convex quantile regression approach. European Journal of Operational Research, 289(2), 666-675.
Lee, C. Y., & Wang, K. (2019). Nash marginal abatement cost estimation of air pollutant emissions using the stochastic semi-nonparametric frontier. European Journal of Operational Research, 273(1), 390-400.
Leleu, H. (2013). Shadow pricing of undesirable outputs in nonparametric analysis. European Journal of Operational Research, 231(2), 474-480.
Liao, Z., Dai, S., & Kuosmanen, T. (2024). Convex support vector regression. European Journal of Operational Research, 313(3), 858-870.
Lin, S. W., & Lu, W. M. (2023). Efficiency assessment of public sector management and culture-led urban regeneration using the enhanced Russell-based directional distance function with stochastic data. Journal of the Operational Research Society, 75, 1-19.
Lozano, S. (2011). Scale and cost efficiency analysis of networks of processes. Expert Systems with Applications, 38(6), 6612-6617.
Lozano, S., & Villa, G. (2010). Gradual technical and scale efficiency improvement in DEA. Annals of Operations Research, 173, 123-136.
Mergoni, A., Emrouznejad, A., & De Witte, K. (2025). Fifty years of data envelopment analysis. European Journal of Operational Research. https://doi.org/10.1016/j.ejor.2024.12.049
Michali, M., Emrouznejad, A., Dehnokhalaji, A., & Clegg, B. (2023). Subsampling bootstrap in network DEA. European Journal of Operational Research, 305(2), 766-780.
Mitropoulos, P., Talias, MA., & Mitropoulos, I. (2015). Combining stochastic DEA with Bayesian analysis to obtain statistical properties of the efficiency scores: An application to Greek public hospitals. European Journal of Operational Research, 243(1), 302-311.
Moradi-Motlagh, A., & Emrouznejad, A. (2022). The origins and development of statistical approaches in non-parametric frontier models: A survey of the first two decades of scholarly literature (1998-2020). Annals of Operations Research, 318(1), 713-741.
Nguyen, B. H., Simar, L., & Zelenyuk, V. (2022). Data sharpening for improving central limit theorem approximations for data envelopment analysis-type efficiency estimators. European Journal of Operational Research, 303(3), 1469-1480.
Odeck, J. (2009). Statistical precision of DEA and Malmquist indices: A bootstrap application to Norwegian grain producers. Omega, 37(5), 1007-1017.
Olesen, O. B., & Petersen, N. C. (2016). Stochastic data envelopment analysis-A review. European Journal of Operational Research, 251(1), 2-21.
Olesen, O. B., Petersen, N. C., & Podinovski, V. V. (2022). Scale characteristics of variable returns-to-scale production technologies with ratio inputs and outputs. Annals of Operations Research, 318(1), 383-423.
Papaioannou, G., & Podinovski, V. V. (2023). Multicomponent production technologies with restricted allocations of shared inputs and outputs. European Journal of Operational Research, 308(1), 274-289.
Pastor, J. T., Ruiz, J. L., & Sirvent, I. (1999). A statistical test for detecting influential observations in DEA. European Journal of Operational Research, 115(3), 542-554.
Pastor, J. T., Ruiz, J. L., & Sirvent, I. (2002). A statistical test for nested radial DEA models. Operations Research, 50(4), 728-735.
Perelman, S., & Santín, D. (2009). How to generate regularly behaved production data? A Monte Carlo experimentation on DEA scale efficiency measurement. European Journal of Operational Research, 199(1), 303-310.
Pham, M., Simar, L., & Zelenyuk, V. (2024). Statistical inference for aggregation of Malmquist productivity indices. Operations Research, 72(4), 1615-1629.
Podinovski, V. V. (2004). On the linearisation of reference technologies for testing returns to scale in FDH models. European Journal of Operational Research, 152(3), 800-802.
Podinovski, V. V. (2017). Returns to scale in convex production technologies. European Journal of Operational Research, 258(3), 970-982.
Podinovski, V. V. (2019). Direct estimation of marginal characteristics of nonparametric production frontiers in the presence of undesirable outputs. European Journal of Operational Research, 279(1), 258-276.
Podinovski, V. V. (2022). Variable and constant returns-to-scale production technologies with component processes. Operations Research, 70(2), 1238-1258.
Podinovski, V. V., Førsund, F. R., & Krivonozhko, V. E. (2009). A simple derivation of scale elasticity in data envelopment analysis. European Journal of Operational Research, 197(1), 149-153.
Podinovski, V. V., & Førsund, F. R. (2010). Differential characteristics of efficient frontiers in data envelopment analysis. Operations Research, 58(6), 1743-1754.
Podinovski, V. V., Ismail, I., Bouzdine-Chameeva, T., & Zhang, W. (2014). Combining the assumptions of variable and constant returns to scale in the efficiency evaluation of secondary schools. European Journal of Operational Research, 239(2), 504-513.
Podinovski, V. V., Chambers, R. G., Atici, K. B., & Deineko, I. D. (2016). Marginal values and returns to scale for nonparametric production frontiers. Operations Research, 64(1), 236-250.
Ramalho, E. A., Ramalho, J. J., & Henriques, P. D. (2010). Fractional regression models for second stage DEA efficiency analyses. Journal of Productivity Analysis, 34, 239-255.
Resti, A. (2000). Efficiency measurement for multi-product industries: A comparison of classic and recent techniques based on simulated data. European Journal of Operational Research, 121(3), 559-578.
Rosen, D., Schaffnit, C., & Paradi, J. C. (1998). Marginal rates and two-dimensional level curves in DEA. Journal of Productivity Analysis, 9, 205-232.
Ruggiero, J. (1996). On the measurement of technical efficiency in the public sector. European Journal of Operational Research, 90(3), 553-565.
Ruggiero, J. (1998). Non-discretionary inputs in data envelopment analysis. European Journal of Operational Research, 111(3), 461-469.
Ruggiero, J., & Vitaliano, D. F. (1999). Assessing the efficiency of public schools using data envelopment analysis and frontier regression. Contemporary Economic Policy, 17(3), 321-331.
Sahoo, B. K., Khoveyni, M., Eslami, R., & Chaudhury, P. (2016). Returns to scale and most productive scale size in DEA with negative data. European Journal of Operational Research, 255(2), 545-558.
Sahoo, B. K., Zhu, J., Tone, K., & Klemen, B. M. (2014). Decomposing technical efficiency and scale elasticity in two-stage network DEA. European Journal of Operational Research, 233(3), 584-594.
Schmidt, P. (1985). Frontier production functions. Econometric Reviews, 4(2), 289-328.
Seiford, L. M., & Thrall, R. M. (1990). Recent developments in DEA: The mathematical programming approach to frontier analysis. Journal of Econometrics, 46(1-2), 7-38.
Seiford, L. M., & Zhu, J. (2003). Context-dependent data envelopment analysis-Measuring attractiveness and progress. Omega, 31(5), 397-408.
Shephard, R. W. (1970). Theory of cost and production fictions. Princeton University Press.
Shi, Y., Charles, V., & Zhu, J. (2025). Bank financial sustainability evaluation: Data envelopment analysis with random forest and Shapley additive explanations. European Journal of Operational Research, 321(2), 614-630.
Shiraz, R. K., Hatami-Marbini, A., & Emrouznejad, H. F. (2020). Chance-constrained cost efficiency in data envelopment analysis model with random inputs and outputs. Operational Research-An International Journal, 20, 1863-1898.
Simar, L. (2007). How to improve the performances of DEA/FDH estimators in the presence of noise. Journal of Productivity Analysis, 28, 183-201.
Simar, L., Vanhems, A., & Wilson, P. W. (2012). Statistical inference for DEA estimators of directional distances. European Journal of Operational Research, 220(3), 853-864.
Simar, L., & Wilson, P. W. (1998). Productivity growth in industrialized countries (No. UCL-Université Catholique de Louvain). Université Catholique de Louvain.
Simar, L., & Wilson, P. W. (1999). Estimating and bootstrapping Malmquist indices. European Journal of Operational Research, 115(3), 459-471.
Simar, L., & Wilson, P. W. (2000a). A general methodology for bootstrapping in non-parametric frontier models. Journal of Applied Statistics, 27(6), 779-802.
Simar, L., & Wilson, P. W. (2000b). Statistical inference in nonparametric frontier models: The state of the art. Journal of Productivity Analysis, 13, 49-78.
Simar, L., & Wilson, P. W. (2002). Non-parametric tests of returns to scale. European Journal of Operational Research, 139(1), 115-132.
Simar, L., & Wilson, P. W. (2007). Estimation and inference in two-stage, semi-parametric models of production processes. Journal of Econometrics, 136(1), 31-64.
Simar, L., & Wilson, P. W. (2020). Technical, allocative and overall efficiency: Estimation and inference. European Journal of Operational Research, 282(3), 1164-1176.
Simar, L., & Zelenyuk, V. (2020). Improving finite sample approximation by central limit theorems for estimates from data envelopment analysis. European Journal of Operational Research, 284(3), 1002-1015.
Simar, L., Zelenyuk, V., & Zhao, S. (2024a). Inference for aggregate efficiency: Theory and guidelines for practitioners. European Journal of Operational Research, 316(1), 240-254.
Simar, L., Zelenyuk, V. & Zhao, S., (2024b). Statistical inference for Hicks-Moorsteen productivity indices. Annals of Operations Research, 1-29
Singh, S., & Ranjan, P. (2018). Efficiency analysis of non-homogeneous parallel sub-unit systems for the performance measurement of higher education. Annals of Operations Research, 269, 641-666.
Soleimani-Damaneh, M. (2013). Another approach for estimating RTS in dynamic DEA. Journal of Productivity Analysis, 39(1), 75-81.
Soleimani-Damaneh, M., Jahanshahloo, G. R., & Reshadi, M. (2006). On the estimation of returns-to-scale in FDH models. European Journal of Operational Research, 174(2), 1055-1059.
Soleimani-Damaneh, M., & Reshadi, M. (2007). A polynomial-time algorithm to estimate returns to scale in FDH models. Computers & Operations Research, 34(7), 2168-2176.
Staat, M. (2002). Bootstrapped efficiency estimates for a model for groups and hierarchies in DEA. European Journal of Operational Research, 138(1), 1-8.
Sueyoshi, T., & Aoki, S. (2001). A use of a nonparametric statistic for DEA frontier shift: The Kruskal and Wallis rank test. Omega, 29(1), 1-18.
Sueyoshi, T., & Goto, M. (2012). Returns to scale and damages to scale on US fossil fuel power plants: Radial and non-radial approaches for DEA environmental assessment. Energy Economics, 34(6), 2240-2259.
Sueyoshi, T., & Goto, M. (2013). Returns to scale vs. damages to scale in data envelopment analysis: An impact of US clean air act on coal-fired power plants. Omega, 41(2), 164-175.
Sueyoshi, T., & Sekitani, K. (2005). Returns to scale in dynamic DEA. European Journal of Operational Research, 161(2), 536-544.
Taleb, M., Khalid, R., Ramli, R., Ghasemi, M. R., & Ignatius, J. (2022). An integrated bi-objective data envelopment analysis model for measuring returns to scale. European Journal of Operational Research, 296(3), 967-979.
Talluri, S., Narasimhan, R., & Nair, A. (2006). Vendor performance with supply risk: A chance-constrained DEA approach. International Journal of Production Economics, 100(2), 212-222.
Tan, Y., Wanke, P., Antunes, J., & Emrouznejad, A. (2021). Unveiling endogeneity between competition and efficiency in Chinese banks: A two-stage network DEA and regression analysis. Annals of Operations Research, 306(1), 131-171.
Tone, K. (2001). On returns to scale under weight restrictions in data envelopment analysis. Journal of Productivity Analysis, 16, 31-47.
Tortosa-Ausina, E., Grifell-Tatjé, E., Armero, C., & Conesa, D. (2008). Sensitivity analysis of efficiency and Malmquist productivity indices: An application to Spanish savings banks. European Journal of Operational Research, 184(3), 1062-1084.
Tsionas, M. G. (2021). Optimal combinations of stochastic frontier and data envelopment analysis models. European Journal of Operational Research, 294(2), 790-800.
Tsionas, M. G. (2022). Convex non-parametric least squares, causal structures and productivity. European Journal of Operational Research, 303(1), 370-438.
Tsionas, M. G., & Philippas, D. (2023). Measures of global sensitivity in linear programming: Applications in banking sector. Annals of Operations Research, 330(1), 585-607.
Van Eck, N., & Waltman, L. (2010). Software survey: VOSviewer, a computer program for bibliometric mapping. Scientometrics, 84(2), 523-538.
Varian, H. R. (1984). The nonparametric approach to production analysis. Econometrica: Journal of the Econometric Society, 579-597.
Varian, H. R. (1985). Non-parametric analysis of optimizing behavior with measurement error. Journal of Econometrics, 30(1-2), 445-458.
Wang, H., Pan, C., Wang, Q., & Zhou, P. (2020). Assessing sustainability performance of global supply chains: An input-output modeling approach. European Journal of Operational Research, 285(1), 393-404.
Wang, Y., Wang, S., Dang, C., & Ge, W. (2014). Nonparametric quantile frontier estimation under shape restriction. European Journal of Operational Research, 232(3), 671-678.
Wang, K., Wei, Y. M., & Huang, Z. (2016). Potential gains from carbon emissions trading in China: A DEA based estimation on abatement cost savings. Omega, 63, 48-59.
Wheelock, D. C., & Wilson, P. W. (2008). Non-parametric, unconditional quantile estimation for efficiency analysis with an application to Federal Reserve check processing operations. Journal of Econometrics, 145(1-2), 209-225.
Wu, J., & An, Q. (2013). Slacks-based measurement models for estimating returns to scale. International Journal of Information and Decision Sciences, 5(1), 25-35.
Wu, F., Wang, S. Y., & Zhou, P. (2023). Marginal abatement cost of carbon dioxide emissions: The role of abatement options. European Journal of Operational Research, 310(2), 891-901.
Yu, A., Zhang, H., Liu, H. C., Shi, Y., & Bi, W. (2024). Dynamic centralized resource allocation approach with contextual impacts: Analyzing Chinese carbon allocation plans. Annals of Operations Research, 341(1), 451-483.
Zelenyuk, V. (2013). A scale elasticity measure for directional distance function and its dual: Theory and DEA estimation. European Journal of Operational Research, 228(3), 592-600.
Zelenyuk, V. (2020). Aggregation of inputs and outputs prior to data envelopment analysis under big data. European Journal of Operational Research, 282(1), 172-187.
Zhang, Q., & Yang, Z. (2015). Returns to scale of two-stage production process. Computers & Industrial Engineering, 90, 259-268.
Zhou, P., Zhou, X., & Fan, L. W. (2014). On estimating shadow prices of undesirable outputs with efficiency models: A literature review. Applied Energy, 130, 799-806.
- Ali Emrouznejad
a.emrouznejad@surrey.ac.ukVictor Podinovski
V.Podinovski@lboro.ac.ukVincent Charles
c.vincent@qub.ac.ukChixiao Lu
c.lu@surrey.ac.ukAmir Moradi-Motlagh
amoradi@swin.edu.au
1 Surrey Business School, University of Surrey, Guildford GU2 7XH, UK
2 Loughborough Business School, Loughborough University, Leicestershire LE11 3TU, UK
3 Queen’s Business School, Queen’s University Belfast, Belfast BT9 5EE, UK
4 Swinburne University of Technology, Melbourne, Australia From a definitional perspective, the applied directional Benefit-of-the-Doubt model can be regarded as a DDF model without explicit inputs. However, from a computational perspective, it can be treated as a conventional DDF model due to the presence of undesirable outputs and the absence of inputs.
The sample size for the simulation tests in Johnson and Kuosmanen’s (2012) study is set at 100 , which is categorised as a ‘medium-sized’ sample in Banker et al. (2019). Their proposed model demonstrated better performance than the DEA + OLS approach in simulation testing.
In addition to Scopus, Google Scholar is used to extract seven conference proceedings co-edited by Banker. - *Banker also co-organised or served as an invited speaker at several other DEA conferences, including: DEA2002 (invited speaker; Moscow, Russia), DEA2004 (invited speaker; Birmingham, UK), DEA2007 (coorganiser; Hyderabad, India), DEA2009 (organiser; Philadelphia, USA), DEA2010 (invited speaker; Beirut, Lebanon), DEA2011 (invited speaker; Thessaloniki, Greece), DEA workshop 2013 (co-organiser; Hebrew University, Israel), DEA2018 (co-organiser; Wuhan, China), DEA2019 (co-organiser; Calgary, Canada)
DOI: https://doi.org/10.1007/s10479-025-06473-3
Publication Date: 2025-02-24
Rajiv Banker’s lasting impact on data envelopment analysis
© The Author(s) 2025
Abstract
This paper provides a comprehensive analysis of Professor Rajiv Banker’s significant impact on the field of Data Envelopment Analysis (DEA). Through an extensive review of his scholarly contributions, we explore three major clusters within DEA research: (1) Returns-to-Scale (RTS) and Most Productive Scale Size (MPSS), (2) Statistical Inference in DEA, and (3) Contextual Analysis. Banker’s pioneering research has significantly advanced DEA methodologies, addressing fundamental challenges related to scale efficiency, statistical robustness, and the influence of contextual variables on performance. His work has bridged theoretical developments and practical applications, influencing diverse fields such as economics, finance, and management science. By examining citation trends and bibliometric data, we trace the evolution and enduring relevance of his contributions, highlighting key papers that have shaped the trajectory of DEA research. This paper also discusses the evolution of DEA models and approaches, including the integration of stochastic elements and second-stage analyses. In recognising Banker’s lifetime dedication to DEA, we celebrate his lasting legacy and his transformative influence on both the academic community and practical implementations of DEA worldwide.
1 Introduction
2 Returns-to-scale and most productive scale size
2.1 RTS and MPSS identification by Banker
(1) The concept of RTS is well-defined only for the points located on the boundary of the PPS. For interior points, RTS cannot be investigated since productivity changes due to RTS are confounded with productivity changes due to inefficiency elimination.
(2) The concept of MPSS is directly related to RTS. Specifically, the ray from the origin point (known as
2.2 Development of theory in RTS and MPSS identification by Banker
2.3 Revolution and progress
2.3.1 Revolution and progress in modelling
2.3.2 Revolution and progress in scale characterisations
suggested a more general framework for calculating the marginal rates of substitution in non-parametric production frontiers.
3 Advancements in the statistical foundations of DEA: contributions, frameworks, and recent developments
3.1 The origin of statistical foundations of DEA by Banker
3.2 Development of statistical-based extension approaches in DEA by Banker
3.2.1 Foundations of simulation in DEA by Banker
of the production technology, the distribution of inefficiency, and the sample size (Banker, 1996).
3.2.2 Foundations of hypothesis testing in DEA by Banker
3.3 Progress in the statistical foundations of DEA and its extensions
3.3.1 Progress in simulation design in DEA
3.3.2 Progress and revolution in hypothesis tests in DEA
3.3.3 Developments in statistical inference of DEA and its application
- Treating estimated inefficiencies as random deviations.
- Developing models to account for either measurement errors or specification errors.
- Developing models to generate random Production Possibility Sets based on random variations in datasets.
- Group 1: Extends the first direction and includes the bootstrapping DEA model (Aggelopoulos and Georgopoulos, 2017; Bobde and Tanaka, 2018; Boubaker et al., 2023; Dia et al., 2022; Du et al., 2018; Kang et al., 2024; Michali et al., 2023; Staat, 2002; Simar and Wilson, 1998, 1999, 2000a, b; Moradi-Motlagh and Emrouznejad, 2022).
- Group 2: Extends both the first and second directions and includes the semi-parametric DEA model (Assaf and Gillen, 2012; Johnson and McGinnis, 2008; Jradi and Ruggiero, 2019; Kuosmanen and Kortelainen, 2012; Simar and Wilson, 2007).
- Group 3: Extends the second and third directions and includes Chance Constrained DEA models (Amirteimoori et al., 2023; Cooper et al., 1996, 1998, 2002; Lin and Lu, 2023; Mitropoulos et al., 2015; Shiraz et al., 2020; Talluri et al., 2006).
3.4 Progress and advances in nonparametric quantile frontier estimation
3.4.1 Partial frontier approach
and multiplier form. The statistical properties of this model are validated using Monto Carlo simulation and nCm subsampling. A similar approach has been applied to context-dependent DEA by Seiford and Zhu (2003), which involves an algorithm that calculates different levels of efficient frontiers by iteratively excluding efficient DMUs from the reference set. However, the statistical inference for context-dependent DEA has not been directly proven. Carvalho and Marques (2014) explored the economies of scope and scale for computing economies of vertical integration through the partial frontier approach.
3.4.2 Quantile regression approach
approach explicitly accounts for both noise and inefficiency to mitigate issues caused by high sensitivity to noise data in DEA. Consequently, the proposed approach calculates the marginal abatement cost while free from the data noise issues in conventional DEA models. In more recent research, Dai et al. (2023) summarised existing Quantile regression approaches and proposed a general model of shape-constrained nonparametric functions. Moving beyond the convex models used in CQR (linear programming) and convex expectile regression (quadric programming), Dai et al. (2023) introduced a parameter to represent partial order, generating general nonconvex CQR and CER models. In addition, España et al. (2024) used the DEA model to shape constraints and estimate production functions through additive models based on regression splines. Liao et al. (2024) proposed a nonparametric convex regression approach to address overfitting and outliers.
4 Contextual analysis in DEA
performs similarly or occasionally better than Simar and Wilson’s (2007) approach. Consequently, the DEA+OLS approach is recommended for evaluating the influence of contextual variables.
5 Authorship network and organised conferences
| Year | Affiliation | State |
| 2005-2023 | Temple University/Fox School of Business | Philadelphia |
| 2006 | Arizona State University/W. P. Carey School of Business | Arizona |
| 2003-2005 | University of California, Riverside | California |
| 2005 | University of California/Anderson School of Management | California |
| 1992-2004 | University of Texas at Dallas | Texas |
| 1989-1997 | University of Minnesota/Carlson School of Management | Minneapolis |
| 1984-1996 | Carnegie Mellon University | Pittsburgh |
| 1994 | University of Minnesota/Carlson School of Management | Minnesota |
| 1980 | Harvard University/ Harvard Business School | Massachusetts |
| Type | Number of publications | Percentage |
| Article | 133 | 65.5 |
| Conference Paper | 36 | 17.7 |
| Review | 11 | 5.4 |
| Edited Book of Conference Proceedings | 7 | 3.4 |
| Book Chapter | 8 | 3.9 |
| Editorial | 7 | 3.4 |
| Note | 1 | 0.5 |
| Total | 203 | 100 |
| First author | Second author | Third author | Fourth
|
Total | |
| Number of publications | 159 | 28 | 14 | 2 | 203 |
| Percentage | 78.3 | 13.8 | 6.9 | 1.0 | 100 |
| Co-author | No. of co-authorships | Title | University/Affiliation | School/ Faculty | Country |
| Chang, Hsihui | 24 | Professor of Accounting | Drexel University | Drexel University | United States |
| Natarajan, Ramachandran Nat | 13 | Professor of Management | University of Texas at Dallas | The Naveen Jindal School of Management | United States |
| Emrouznejad, A | 11 | Professor of Business Analytics | University of Surrey | Surrey Business School | UK |
| Kauffman, Robert J | 11 | Professor of Information Systems | Singapore Management University | Singapore Management University | Singapore |
| Cooper, William W | 11 | Professor of Operations Research | University of Texas at Austin | McCombs School of Business | United States |
| Datar, Srikant M | 10 | Professor of Administration | Harvard University | Harvard Business School | United States |
| Anderson, Mark C | 10 | Associate Professor of Accounting | University of Calgary | Haskayne School of Business | Canada |
| Riedl, René | 9 | Professor of Digital Business & Innovation | University of Applied Sciences Upper | School of Management | Austria |
| Pavlou, Paul A | 9 | Professor of Information Sciences | University of Houston | C. T. Bauer College of Business | United States |
| Davis, Fred D.D | 9 | Professor of Information Technology | Texas Tech University | Rawls College of Business | United States |
| Title | Journal | Reference |
| Advances in Data Envelopment Analysis: Celebrating the 40th anniversary of DEA and the 100th anniversary of Professor Abraham Charnes’ birthday | European Journal of Operational Research | Emrouznejad et al. (2019) |
| Recent developments on the use of DEA in the Public Sector | Socio-Economic Planning Sciences | Ahn et al. (2018) |
| Business performance management under uncertain environments- II | Journal of Centrum Cathedra: The Business and Economics Research Journal | Charles and Banker (2017) |
| Business performance management under uncertain environments – I | Journal of Centrum Cathedra: The Business and Economics Research Journal | Charles and Banker (2016) |
| Data Envelopment Analysis in the public sector | Socio-Economic Planning Sciences | Emrouznejad et al., (2014a, b) |
| Efficiency and productivity: Theory and applications | Annals of Operations Research | Emrouznejad and Banker (2010) |
| Title | Conference | Authors/Editors | ISBN |
| Recent applications of Data Envelopment Analysis | 16th International Conference of DEA, June 2017, University of Economics, Prague, Czech Republic (DEA2017) | Emrouznejad, Banker et al. (2017) | 978185449 4337 |
| Recent applications of Data Envelopment Analysis | 14th International Conference of DEA, May 2016, Jianghan University, Wuhan, China (DEA2016) | Emrouznejad, Banker et al. (2016) | 978185449 4139 |
| Data Envelopment Analysis and its applications | 13th International Conference of DEA, August 2015, Braunschweig, Germany (DEA2015) | Emrouznejad, Banker et al. (2015) | 978185449 4979 |
| Sustainable development and performance measurement | International DEA Workshop, September 17-19, 2014, Hermosillo, Sonora, Mexico | Banker et al. (2014) | 978185449 4825 |
| Theory and applications of Data Envelopment Analysis | 12th International Conference of DEA, April 2014, University of Malaya, Kuala Lumpur, Malaysia (DEA2014) | Emrouznejad et al. (2014a, b) | 978185449 4870 |
| Data Envelopment Analysis and performance measurement | 11th International Conference of DEA, June 2013, Samsun, Turkey (DEA2013) | Banker, Emrouznejad et al. (2013) | 978185449 4771 |
| Data Envelopment Analysis: theory and applications | 10th International Conference on DEA, Natal, Brazil (DEA2012) | Banker, Emrouznejad et al. (2012) | 978185449 4375 |
| Journal/Source | No. of publications | % Publications | % Cumulative |
| European Journal of Operational Research | 17 | 8.7 | 8.7 |
| Management Science | 15 | 7.7 | 16.3 |
| Annals of Operations Research | 9 | 4.6 | 20.9 |
| Accounting Review | 7 | 3.6 | 24.5 |
| Contemporary Accounting Research | 7 | 3.6 | 28.1 |
| Journal of Accounting and Economics | 7 | 3.6 | 31.6 |
| Information Systems Research | 6 | 3.1 | 34.7 |
| MIS Quarterly: Management Information Systems | 6 | 3.1 | 37.8 |
| Lecture Notes in Information Systems and Organisation | 5 | 2.6 | 40.3 |
| Journal of Accounting Research | 4 | 2.0 | 42.3 |
| Journal of Accounting, Auditing & Finance | 4 | 2.0 | 44.4 |
| Journal of Management Information Systems | 4 | 2.0 | 46.4 |
| Journal of Productivity Analysis | 4 | 2.0 | 48.5 |
| Proceedings of the Annual Hawaii International Conference on System Sciences | 4 | 2.0 | 50.5 |
| Communications of the ACM | 3 | 1.5 | 52.0 |
| IEEE Transactions on Software Engineering | 3 | 1.5 | 53.6 |
| Journal of Management Accounting Research | 3 | 1.5 | 55.1 |
| Publication | Journal | No. of Citations |
| Banker et al. (1984) | Management Science | 11,547 |
| Banker and Morey (1986) | Operations Research | 863 |
| Banker (1984) | European Journal of Operational Research | 696 |
| Anderson et al. (2003) | Journal of Accounting Research | 639 |
| Banker (1993) | Management Science | 616 |
| Banker and Natarajan (2008) | Operations Research | 559 |
| Banker and Thrall (1992) | European Journal of Operational Research | 517 |
| Banker et al. (2000) | Accounting Review | 490 |
| Banker et al. (1998) | Management Science | 451 |
| Banker and Morey (1986) | Management Science | 418 |
6 Bibliometric analysis
6.1 Macro-level
evolving focus of his research, from traditional topics to more contemporary subjects within the field.
6.2 Micro-level
6.2.1 Analysis of the returns-to-scale topic
6.2.2 Analysis of the statistical analysis in DEA topic
6.2.3 Analysis of the contextual analysis topic
7 Conclusion
Declarations
not included in the article’s Creative Commons licence and your intended use is not permitted by statutory regulation or exceeds the permitted use, you will need to obtain permission directly from the copyright holder. To view a copy of this licence, visit http://creativecommons.org/licenses/by/4.0/.
References
Ahn, H., Afsharian, M., Emrouznejad, A., & Banker, R. (2018). Recent developments on the use of DEA in the public sector. Socio-Economic Planning Science, 61, 1-3.
Alirezaee, M., Hajinezhad, E., & Paradi, J. C. (2018). Objective identification of technological returns to scale for data envelopment analysis models. European Journal of Operational Research, 266(2), 678-688.
Alperovych, Y., Hübner, G., & Lobet, F. (2015). How does governmental versus private venture capital backing affect a firm’s efficiency? Evidence from Belgium. Journal of Business Venturing, 30(4), 508-525.
Amirteimoori, A., Charles, V., & Mehdizadeh, S. (2023). Stochastic data envelopment analysis in the presence of undesirable outputs. Journal of the Operational Research Society, 74(12), 2619-2632.
Anderson, M. C., Banker, R. D. & Janakiraman, S. N. (2003). Are selling, general, and administrative costs “sticky”?. Journal of Accounting Research, 41(1), 47-63.
Aragon, Y., Daouia, A., & Thomas-Agnan, C. (2005). Nonparametric frontier estimation: A conditional quantile-based approach. Econometric Theory, 21(2), 358-389.
Asmild, M., Paradi, J. C., & Reese, D. N. (2006). Theoretical perspectives of trade-off analysis using DEA. Omega, 34(4), 337-343.
Assaf, A. G., & Gillen, D. (2012). Measuring the joint impact of governance form and economic regulation on airport efficiency. European Journal of Operational Research, 220(1), 187-198.
Assani, S., Jiang, J., Cao, R., & Yang, F. (2018). Most productive scale size decomposition for multi-stage systems in data envelopment analysis. Computers & Industrial Engineering, 120, 279-287.
Atwood, J., & Shaik, S. (2020). Theory and statistical properties of quantile data envelopment analysis. European Journal of Operational Research, 286(2), 649-661.
Badunenko, O., & Mozharovskyi, P. (2020). Statistical inference for the Russell measure of technical efficiency. Journal of the Operational Research Society, 71(3), 517-527.
Bandyopadhyay, S. (2011). In search of contextual variables in a stochastic DEA framework: Effect of regulation on efficiency of Indian cement industry. Journal of the Operational Research Society, 62(9), 1621-1637.
Banker, R. D. (1984). Estimating most productive scale size using data envelopment analysis. European Journal of Operational Research, 17(1), 35-44.
Banker, R. D. (1993). Maximum likelihood, consistency and data envelopment analysis: A statistical foundation. Management Science, 39(10), 1265-1273.
Banker, R. D. (1996). Hypothesis tests using data envelopment analysis. Journal of Productivity Analysis, 7, 139-159.
Banker, R. D., & Chang, H. (1995). A simulation study of hypothesis tests for differences in efficiencies. International Journal of Production Economics, 39(1-2), 37-54.
Banker, R.D ., & Chang, H. (2006). The super-efficiency procedure for outlier identification, not for ranking efficient units. European Journal of Operational Research, 175(2), 1311-1320.
Banker, R. D., & Maindiratta, A. (1986). Piecewise loglinear estimation of efficient production surfaces. Management Science, 32(1), 126-135.
Banker, R. D., & Maindiratta, A. (1988). Nonparametric analysis of technical and allocative efficiencies in production. Econometrica: Journal of the Econometric Society, 56, 1315-1332.
Banker, R. D., & Natarajan, R. (2008). Evaluating contextual variables affecting productivity using data envelopment analysis. Operations Research, 56(1), 48-58.
Banker, R. D., & Thrall, R. M. (1992). Estimation of returns to scale using data envelopment analysis. European Journal of Operational Research, 62(1), 74-84.
Banker, R. D., Potter, G., & Srinivasan, D. (2000). An empirical investigation of an incentive plan that includes nonfinancial performance measures. The Accounting Review, 75(1), 65-92.
Banker, R. D., Charnes, A., & Cooper, W. W. (1984). Some models for estimating technical and scale inefficiencies in data envelopment analysis. Management Science, 30(9), 1078-1092.
Banker, R. D., Datar, S. M., & Kemerer, C. F. (1991). A model to evaluate variables impacting the productivity of software maintenance projects. Management Science, 37, 1-18.
Banker, R. D., Bardhan, I., & Cooper, W. W. (1996a). A note on returns to scale in DEA. European Journal of Operational Research, 88(3), 583-585.
Banker, R. D., Chang, H., & Cooper, W. W. (1996b). Equivalence and implementation of alternative methods for determining returns to scale in data envelopment analysis. European Journal of Operational Research, 89(3), 473-481.
Banker, R. D., Janakiraman, S., & Natarajan, R. (2002). Evaluating the adequacy of parametric functional forms in estimating monotone and concave production functions. Journal of Productivity Analysis, 17, 111-132.
Banker, R. D., Khosla, I., & Sinha, K. K. (1998). Quality and competition. Management science, 44(9), 1179-1192.
Banker, R. D., Cooper, W. W., Seiford, L. M., Thrall, R. M., & Zhu, J. (2004a). Returns to scale in different DEA models. European Journal of Operational Research, 154(2), 345-362.
Banker, R. D., Janakiraman, S., & Natarajan, R. (2004b). Analysis of trends in technical and allocative efficiency: An application to Texas public school districts. European Journal of Operational Research, 154(2), 477-491.
Banker, R. D., Chang, H., & Natarajan, R. (2005). Productivity change, technical progress, and relative efficiency change in the public accounting industry. Management Science, 51(2), 291-304.
Banker, R. D., Chang, H., & Natarajan, R. (2007). Estimating DEA technical and allocative inefficiency using aggregate cost or revenue data. Journal of Productivity Analysis, 27, 115-121.
Banker, R. D., Chang, H., & Lee, S. Y. (2010a). Differential impact of Korean banking system reforms on bank productivity. Journal of Banking & Finance, 34(7), 1450-1460.
Banker, R. D., Zheng, Z. E., & Natarajan, R. (2010b). DEA-based hypothesis tests for comparing two groups of decision making units. European Journal of Operational Research, 206(1), 231-238.
Banker, R. D., Cooper, W. W., Seiford, L. M. & Zhu, J. (2011). Returns to scale in DEA. Handbook on data envelopment analysis, pp. 41-70.
Banker, R.D., Emrouznejad, A., Lopes, A. L. M. & de Almeida, M. R. (2012). Data envelopment analysis: Theory and applications. In Proceedings of the 10th International Conference on DEA, Natal, Brazil.
Banker, R. D., Emrouznejad, A., Bal, H., Alp, I. & Cengiz, M. A. (2013). Data envelopment analysis and performance measurement. In Proceedings of the 11th International Conference of DEA, June 2013, Samsun, Turkey.
Banker, R.D., Emrouznejad, A., Vargas, F. & Flores, P. (2014). Sustainable development and performance measurement. In Proceedings of the International DEA Workshop, 2014, Hermosillo, Sonora, Mexico.
Banker, R., Natarajan, R., & Zhang, D. (2019). Two-stage estimation of the impact of contextual variables in stochastic frontier production function models using data envelopment analysis: Second stage OLS versus bootstrap approaches. European Journal of Operational Research, 278(2), 368-384.
Bardhan, I. R., Cooper, W. W., & Kumbhakar, S. C. (1998). A simulation study of joint uses of data envelopment analysis and statistical regressions for production function estimation and efficiency evaluation. Journal of Productivity Analysis, 9, 249-278.
Bessent, A., Bessent, W., Elam, J., & Clark, T. (1988). Efficiency frontier determination by constrained facet analysis. Operations Research, 36(5), 785-796.
Bobde, S. M., & Tanaka, M. (2018). Efficiency evaluation of electricity distribution utilities in India: A twostage DEA with bootstrap estimation. Journal of the Operational Research Society, 69(9), 1423-1434.
Boubaker, S., Le, T. D., Manita, R., & Ngo, T. (2023). The trade-off frontier for ESG and Sharpe ratio: a bootstrapped double-frontier data envelopment analysis. Annals of Operations Research. https://doi.org/ 10.1007/s10479-023-05506-z
Cazals, C., Florens, J. P., & Simar, L. (2002). Nonparametric frontier estimation: A robust approach. Journal of Econometrics, 106(1), 1-25.
Chang, K. P., & Guh, Y. Y. (1991). Linear production functions and the data envelopment analysis. European Journal of Operational Research, 52(2), 215-223.
Charles, V., & Banker, R. D. (2016). Business performance management under uncertain environments-I. Editorial. Journal of Centrum Cathedra: The Business and Economics Research Journal, 9(2), 90-91. https://doi.org/10.1108/JCC-01-2017-0003
Charles, V., & Banker, R. D. (2017). Business performance management under uncertain environments-II Editorial. Journal of Centrum Cathedra: The Business and Economics Research Journal, 10(1), 2-3. https://doi.org/10.1108/JCC-07-2017-018
Charnes, A., Cooper, W. W., & Thrall, R. M. (1986). Classifying and characterizing efficiencies and inefficiencies in data development analysis. Operations Research Letters, 5(3), 105-110.
Charnes, A., Gallegos, A., & Li, H. (1996). Robustly efficient parametric frontiers via multiplicative DEA for domestic and international operations of the Latin American airline industry. European Journal of Operational Research, 88(3), 525-536.
Chen, C. M., & Delmas, M. A. (2012). Measuring eco-inefficiency: A new frontier approach. Operations Research, 60(5), 1064-1079.
Chen, K., & Zhu, J. (2019). Computational tractability of chance constrained data envelopment analysis. European Journal of Operational Research, 274(3), 1037-1046.
Cooper, W. W., & Tone, K. (1997). Measures of inefficiency in data envelopment analysis and stochastic frontier estimation. European Journal of Operational Research, 99(1), 72-88.
Cooper, W. W., Huang, Z., & Li, S. X. (1996). Chapter 13 satisficing DEA models under chance constraints. Annals of Operations Research, 66, 279-295.
Cooper, W. W., Huang, Z., Lelas, V., Li, S. X., & Olesen, O. B. (1998). Chance constrained programming formulations for stochastic characterizations of efficiency and dominance in DEA. Journal of Productivity Analysis, 9, 53-79.
Cooper, W. W., Park, D. K. S., & Ciurana, P. J. T. P. (2000). Marginal rates and elasticities of substitution with additive models in DEA. Journal of Productivity Analysis, 13, 105-123.
Cooper, W. W., Deng, H., Huang, Z., & Li, S. X. (2002). Chance constrained programming approaches to technical efficiencies and inefficiencies in stochastic data envelopment analysis. Journal of the Operational Research Society, 53, 1347-1356.
Dai, S., Kuosmanen, T. and Zhou, X. (2022) Partial frontiers are not quantiles. arXiv preprint arXiv:2205. 11885.
Daouia, A., & Gijbels, I. (2011). Robustness and inference in nonparametric partial frontier modeling. Journal of Econometrics, 161(2), 147-165.
Daouia, A., & Simar, L. (2005). Robust nonparametric estimators of monotone boundaries. Journal of Multivariate Analysis, 96(2), 311-331.
Daouia, A., & Simar, L. (2007). Nonparametric efficiency analysis: A multivariate conditional quantile approach. Journal of Econometrics, 140(2), 375-400.
Dia, M., Takouda, P.M. & Golmohammadi, A., (2022). Assessing the performance of Canadian credit unions using a three-stage network bootstrap DEA. Annals of Operations Research, 1-33.
Du, K., Worthington, A. C., & Zelenyuk, V. (2018). Data envelopment analysis, truncated regression and double-bootstrap for panel data with application to Chinese banking. European Journal of Operational Research, 265(2), 748-764.
e Souza, G. D. S., & Gomes, E. G. (2015). Management of agricultural research centers in Brazil: A DEA application using a dynamic GMM approach. European Journal of Operational Research, 240(3), 819-824.
Emrouznejad, A., & Amin, G. R. (2009). DEA models for ratio data: Convexity consideration. Applied Mathematical Modelling, 33(1), 486-498.
Emrouznejad, A., & Banker, R. D. (2010). Efficiency and productivity: theory and applications. Annals of Operations Research, 173(1), 1-10.
Emrouznejad, A., Anouze, A. L., & Thanassoulis, E. (2010). A semi-oriented radial measure for measuring the efficiency of decision making units with negative data, using DEA. European Journal of Operational Research, 200(1), 297-304.
Emrouznejad, A., Banker, R. D., Lopes, A. L. M., & de Almeida, M. R. (2014a). Data envelopment analysis in the public sector. Socio-Economic Planning Sciences, 48(1), 2-3.
Emrouznejad, A., Banker, R., Munisamy, S. & Arabi, B. (2014b). Theory and applications of data envelopment analysis. In Proceedings of the 12th International Conference of DEA, April 2014, University of Malaya, Kuala Lumpur, Malaysia.
Emrouznejad, A., Banker, R.D., Ahn, H. & Afsharian, M. (2015). Data envelopment analysis and its applications. In Proceedings of the 13th International Conference of DEA, August 2015, Braunschweig, Germany.
Emrouznejad, A., Banker, R., Ray, S. C. & Chen, L. (2016). Recent applications of data envelopment analysis. In Proceedings of the 14th International Conference of DEA, May 2016, Jianghan University, Wuhan, China.
Emrouznejad, A., Banker, R. D., & Neralic, L. (2019). Advances in data envelopment analysis: Celebrating the 40th anniversary of DEA and the 100th anniversary of Professor Abraham Charnes’ birthday. European Journal of Operational Research, 278(2), 365-367.
España, V. J., Aparicio, J., Barber, X., & Esteve, M. (2024). Estimating production functions through additive models based on regression splines. European Journal of Operational Research, 312(2), 684-699.
Esteve, M., Aparicio, J., Rabasa, A., & Rodriguez-Sala, J. J. (2020). Efficiency analysis trees: A new methodology for estimating production frontiers through decision trees. Expert Systems with Applications, 162, 113783.
Färe, R., Grosskopf, S., Lovell, C. K., & Yaisawarng, S. (1993). Derivation of shadow prices for undesirable outputs: a distance function approach. The Review of Economics and Statistics, 75, 374-380.
Färe, R., Grosskopf, S., & Lovell, C. K. (1994). Production frontiers. Cambridge University Press.
Fernandez, C., Koop, G., & Steel, M. F. J. (2002). Multiple-output production with undesirable outputs: An application to nitrogen surplus in agriculture. Journal of the American Statistical Association, 97(458), 432-442.
Førsund, F. R. (1999). The evolution of DEA-The economics perspective. University of Oslo Working paper, Oslo, Norway.
Førsund, F. R. (2018). Economic interpretations of DEA. Socio-Economic Planning Sciences, 61, 9-15.
Førsund, F. R., & Hjalmarsson, L. (2004). Calculating scale elasticity in DEA models. Journal of the Operational Research Society, 55(10), 1023-1038.
Førsund, F. R., Hjalmarsson, L., Krivonozhko, V. E., & Utkin, O. B. (2007). Calculation of scale elasticities in DEA models: Direct and indirect approaches. Journal of Productivity Analysis, 28, 45-56.
Førsund, F. R., Kittelsen, S. A., & Krivonozhko, V. E. (2009). Farrell revisited-Visualizing properties of DEA production frontiers. Journal of the Operational Research Society, 60, 1535-1545.
Frisch, R. (1964). Theory of production. Springer Science & Business Media.
Fukuyama, H. (2000). Returns to scale and scale elasticity in data envelopment analysis. European Journal of Operational Research, 125(1), 93-112.
Fukuyama, H. (2003). Scale characterizations in a DEA directional technology distance function framework. European Journal of Operational Research, 144(1), 108-127.
Giménez, V., Prior, D., Thieme, C., & Tortosa-Ausina, E. (2024). International comparisons of COVID-19 pandemic management: What can be learned from activity analysis techniques? Omega, 122, 102966.
Giraleas, D., Emrouznejad, A., & Thanassoulis, E. (2012). Productivity change using growth accounting and frontier-based approaches-Evidence from a Monte Carlo analysis. European Journal of Operational Research, 222(3), 673-683.
Golany, B., & Yu, G. (1997). Estimating returns to scale in DEA. European Journal of Operational Research, 103(1), 28-37.
Gong, B. H., & Sickles, R. C. (1992). Finite sample evidence on the performance of stochastic frontiers and data envelopment analysis using panel data. Journal of Econometrics, 51(1-2), 259-284.
Grosskopf, S. (1996). Statistical inference and nonparametric efficiency: A selective survey. Journal of Productivity Analysis, 7, 161-176.
Halická, M., & Trnovská, M. (2021). A unified approach to non-radial graph models in data envelopment analysis: Common features, geometry, and duality. European Journal of Operational Research, 289(2), 611-627.
Hatami-Marbini, A., Emrouznejad, A., & Agrell, P. J. (2014). Interval data without sign restrictions in DEA. Applied Mathematical Modelling, 38, 2028-2036.
Johnson, A. L., & Kuosmanen, T. (2012). One-stage and two-stage DEA estimation of the effects of contextual variables. European Journal of Operational Research, 220(2), 559-570.
Johnson, A. L., & McGinnis, L. F. (2008). Outlier detection in two-stage semiparametric DEA models. European Journal of Operational Research, 187(2), 629-635.
Jradi, S., & Ruggiero, J. (2019). Stochastic data envelopment analysis: A quantile regression approach to estimate the production frontier. European Journal of Operational Research, 278(2), 385-393.
Kang, H. J., Kim, C., & Choi, K. (2024). Combining bootstrap data envelopment analysis with social networks for rank discrimination and suitable potential benchmarks. European Journal of Operational Research, 312(1), 283-297.
Kao, C., & Hwang, S. N. (2011). Decomposition of technical and scale efficiencies in two-stage production systems. European Journal of Operational Research, 211(3), 515-519.
Karagiannis, R. (2015). A system-of-equations two-stage DEA approach for explaining capacity utilization and technical efficiency. Annals of Operations Research, 227, 25-43.
Kerstens, K., & Eeckaut, P. V. (1999). Estimating returns to scale using non-parametric deterministic technologies: A new method based on goodness-of-fit. European Journal of Operational Research, 113(1), 206-214.
Khezrimotlagh, D. (2022). Simulation designs for production frontiers. European Journal of Operational Research, 303(3), 1321-1334.
Khezrimotlagh, D., & Zhu, J. (2023). The role of unobserved units in two-stage network data envelopment analysis. Journal of the Operational Research Society, 74(5), 1275-1285.
Kneip, A., Park, B. U., & Simar, L. (1998). A note on the convergence of nonparametric DEA estimators for production efficiency scores. Econometric Theory, 14(6), 783-793.
Kneip, A., Simar, L., & Wilson, P. W. (2015). When bias kills the variance: Central limit theorems for DEA and FDH efficiency scores. Econometric Theory, 31(2), 394-422.
Kneip, A., Simar, L., & Wilson, P. W. (2016). Testing hypotheses in nonparametric models of production. Journal of Business & Economic Statistics, 34(3), 435-456.
Kneip, A., Simar, L., & Wilson, P. W. (2021). Inference in dynamic, nonparametric models of production: Central limit theorems for Malmquist indices. Econometric Theory, 37(3), 537-572.
Koenker, R., & Bassett, G., Jr. (1978). Regression quantiles. Journal of the Econometric Society., 23, 33-50.
Kontolaimou, A., & Tsekouras, K. (2010). Are cooperatives the weakest link in European banking? A nonparametric metafrontier approach. Journal of Banking & Finance, 34(8), 1946-1957.
Korhonen, P. J., Soleimani-Damaneh, M., & Wallenius, J. (2011). Ratio-based RTS determination in weightrestricted DEA models. European Journal of Operational Research, 215(2), 431-438.
Korostelëv, A. P., Simar, L., & Tsybakov, A. B. (1995a). Efficient estimation of monotone boundaries. The Annals of Statistics, 23, 476-489.
Korostelëv, A. P., Simar, L., & Tsybakov, A. (1995b). On estimation of monotone and convex boundaries. In Annales de l’ISUP, 39(1), 3-18.
Krivonozhko, V. E., Førsund, F. R., & Lychev, A. V. (2014). Measurement of returns to scale using non-radial DEA models. European Journal of Operational Research, 232(3), 664-670.
Krivonozhko, V. E., Utkin, O. B., Volodin, A. V., Sablin, I. A., & Patrin, M. (2004). Constructions of economic functions and calculations of marginal rates in DEA using parametric optimization methods. Journal of the Operational Research Society, 55, 1049-1058.
Kuhn, T. S. (1970). The structure of scientific revolutions (2nd ed.). The University of Chicago Press.
Kuosmanen, T. (2006). Stochastic nonparametric envelopment of data: Combining virtues of SFA and DEA in a unified framework. MTT Discussion paper no. 3/2006, MT
Kuosmanen, T. (2008). Representation theorem for convex nonparametric least squares. The Econometrics Journal, 11(2), 308-325.
Kuosmanen, T., & Johnson, A. L. (2010). Data envelopment analysis as nonparametric least-squares regression. Operations Research, 58(1), 149-160.
Kuosmanen, T., & Johnson, A. (2017). Modeling joint production of multiple outputs in StoNED: Directional distance function approach. European Journal of Operational Research, 262(2), 792-801.
Kuosmanen, T., & Kortelainen, M. (2012). Stochastic non-smooth envelopment of data: Semi-parametric frontier estimation subject to shape constraints. Journal of Productivity Analysis, 38, 11-28.
Kuosmanen, T., Post, T., & Scholtes, S. (2007). Non-parametric tests of productive efficiency with errors-invariables. Journal of Econometrics, 136(1), 131-162.
Kuosmanen, T., Johnson, A. & Saastamoinen, A. (2015). Stochastic nonparametric approach to efficiency analysis: A unified framework. InData Envelopment Analysis: A Handbook of Models and Methods, pp. 191-244
Kuosmanen, T., & Zhou, X. (2021). Shadow prices and marginal abatement costs: Convex quantile regression approach. European Journal of Operational Research, 289(2), 666-675.
Lee, C. Y., & Wang, K. (2019). Nash marginal abatement cost estimation of air pollutant emissions using the stochastic semi-nonparametric frontier. European Journal of Operational Research, 273(1), 390-400.
Leleu, H. (2013). Shadow pricing of undesirable outputs in nonparametric analysis. European Journal of Operational Research, 231(2), 474-480.
Liao, Z., Dai, S., & Kuosmanen, T. (2024). Convex support vector regression. European Journal of Operational Research, 313(3), 858-870.
Lin, S. W., & Lu, W. M. (2023). Efficiency assessment of public sector management and culture-led urban regeneration using the enhanced Russell-based directional distance function with stochastic data. Journal of the Operational Research Society, 75, 1-19.
Lozano, S. (2011). Scale and cost efficiency analysis of networks of processes. Expert Systems with Applications, 38(6), 6612-6617.
Lozano, S., & Villa, G. (2010). Gradual technical and scale efficiency improvement in DEA. Annals of Operations Research, 173, 123-136.
Mergoni, A., Emrouznejad, A., & De Witte, K. (2025). Fifty years of data envelopment analysis. European Journal of Operational Research. https://doi.org/10.1016/j.ejor.2024.12.049
Michali, M., Emrouznejad, A., Dehnokhalaji, A., & Clegg, B. (2023). Subsampling bootstrap in network DEA. European Journal of Operational Research, 305(2), 766-780.
Mitropoulos, P., Talias, MA., & Mitropoulos, I. (2015). Combining stochastic DEA with Bayesian analysis to obtain statistical properties of the efficiency scores: An application to Greek public hospitals. European Journal of Operational Research, 243(1), 302-311.
Moradi-Motlagh, A., & Emrouznejad, A. (2022). The origins and development of statistical approaches in non-parametric frontier models: A survey of the first two decades of scholarly literature (1998-2020). Annals of Operations Research, 318(1), 713-741.
Nguyen, B. H., Simar, L., & Zelenyuk, V. (2022). Data sharpening for improving central limit theorem approximations for data envelopment analysis-type efficiency estimators. European Journal of Operational Research, 303(3), 1469-1480.
Odeck, J. (2009). Statistical precision of DEA and Malmquist indices: A bootstrap application to Norwegian grain producers. Omega, 37(5), 1007-1017.
Olesen, O. B., & Petersen, N. C. (2016). Stochastic data envelopment analysis-A review. European Journal of Operational Research, 251(1), 2-21.
Olesen, O. B., Petersen, N. C., & Podinovski, V. V. (2022). Scale characteristics of variable returns-to-scale production technologies with ratio inputs and outputs. Annals of Operations Research, 318(1), 383-423.
Papaioannou, G., & Podinovski, V. V. (2023). Multicomponent production technologies with restricted allocations of shared inputs and outputs. European Journal of Operational Research, 308(1), 274-289.
Pastor, J. T., Ruiz, J. L., & Sirvent, I. (1999). A statistical test for detecting influential observations in DEA. European Journal of Operational Research, 115(3), 542-554.
Pastor, J. T., Ruiz, J. L., & Sirvent, I. (2002). A statistical test for nested radial DEA models. Operations Research, 50(4), 728-735.
Perelman, S., & Santín, D. (2009). How to generate regularly behaved production data? A Monte Carlo experimentation on DEA scale efficiency measurement. European Journal of Operational Research, 199(1), 303-310.
Pham, M., Simar, L., & Zelenyuk, V. (2024). Statistical inference for aggregation of Malmquist productivity indices. Operations Research, 72(4), 1615-1629.
Podinovski, V. V. (2004). On the linearisation of reference technologies for testing returns to scale in FDH models. European Journal of Operational Research, 152(3), 800-802.
Podinovski, V. V. (2017). Returns to scale in convex production technologies. European Journal of Operational Research, 258(3), 970-982.
Podinovski, V. V. (2019). Direct estimation of marginal characteristics of nonparametric production frontiers in the presence of undesirable outputs. European Journal of Operational Research, 279(1), 258-276.
Podinovski, V. V. (2022). Variable and constant returns-to-scale production technologies with component processes. Operations Research, 70(2), 1238-1258.
Podinovski, V. V., Førsund, F. R., & Krivonozhko, V. E. (2009). A simple derivation of scale elasticity in data envelopment analysis. European Journal of Operational Research, 197(1), 149-153.
Podinovski, V. V., & Førsund, F. R. (2010). Differential characteristics of efficient frontiers in data envelopment analysis. Operations Research, 58(6), 1743-1754.
Podinovski, V. V., Ismail, I., Bouzdine-Chameeva, T., & Zhang, W. (2014). Combining the assumptions of variable and constant returns to scale in the efficiency evaluation of secondary schools. European Journal of Operational Research, 239(2), 504-513.
Podinovski, V. V., Chambers, R. G., Atici, K. B., & Deineko, I. D. (2016). Marginal values and returns to scale for nonparametric production frontiers. Operations Research, 64(1), 236-250.
Ramalho, E. A., Ramalho, J. J., & Henriques, P. D. (2010). Fractional regression models for second stage DEA efficiency analyses. Journal of Productivity Analysis, 34, 239-255.
Resti, A. (2000). Efficiency measurement for multi-product industries: A comparison of classic and recent techniques based on simulated data. European Journal of Operational Research, 121(3), 559-578.
Rosen, D., Schaffnit, C., & Paradi, J. C. (1998). Marginal rates and two-dimensional level curves in DEA. Journal of Productivity Analysis, 9, 205-232.
Ruggiero, J. (1996). On the measurement of technical efficiency in the public sector. European Journal of Operational Research, 90(3), 553-565.
Ruggiero, J. (1998). Non-discretionary inputs in data envelopment analysis. European Journal of Operational Research, 111(3), 461-469.
Ruggiero, J., & Vitaliano, D. F. (1999). Assessing the efficiency of public schools using data envelopment analysis and frontier regression. Contemporary Economic Policy, 17(3), 321-331.
Sahoo, B. K., Khoveyni, M., Eslami, R., & Chaudhury, P. (2016). Returns to scale and most productive scale size in DEA with negative data. European Journal of Operational Research, 255(2), 545-558.
Sahoo, B. K., Zhu, J., Tone, K., & Klemen, B. M. (2014). Decomposing technical efficiency and scale elasticity in two-stage network DEA. European Journal of Operational Research, 233(3), 584-594.
Schmidt, P. (1985). Frontier production functions. Econometric Reviews, 4(2), 289-328.
Seiford, L. M., & Thrall, R. M. (1990). Recent developments in DEA: The mathematical programming approach to frontier analysis. Journal of Econometrics, 46(1-2), 7-38.
Seiford, L. M., & Zhu, J. (2003). Context-dependent data envelopment analysis-Measuring attractiveness and progress. Omega, 31(5), 397-408.
Shephard, R. W. (1970). Theory of cost and production fictions. Princeton University Press.
Shi, Y., Charles, V., & Zhu, J. (2025). Bank financial sustainability evaluation: Data envelopment analysis with random forest and Shapley additive explanations. European Journal of Operational Research, 321(2), 614-630.
Shiraz, R. K., Hatami-Marbini, A., & Emrouznejad, H. F. (2020). Chance-constrained cost efficiency in data envelopment analysis model with random inputs and outputs. Operational Research-An International Journal, 20, 1863-1898.
Simar, L. (2007). How to improve the performances of DEA/FDH estimators in the presence of noise. Journal of Productivity Analysis, 28, 183-201.
Simar, L., Vanhems, A., & Wilson, P. W. (2012). Statistical inference for DEA estimators of directional distances. European Journal of Operational Research, 220(3), 853-864.
Simar, L., & Wilson, P. W. (1998). Productivity growth in industrialized countries (No. UCL-Université Catholique de Louvain). Université Catholique de Louvain.
Simar, L., & Wilson, P. W. (1999). Estimating and bootstrapping Malmquist indices. European Journal of Operational Research, 115(3), 459-471.
Simar, L., & Wilson, P. W. (2000a). A general methodology for bootstrapping in non-parametric frontier models. Journal of Applied Statistics, 27(6), 779-802.
Simar, L., & Wilson, P. W. (2000b). Statistical inference in nonparametric frontier models: The state of the art. Journal of Productivity Analysis, 13, 49-78.
Simar, L., & Wilson, P. W. (2002). Non-parametric tests of returns to scale. European Journal of Operational Research, 139(1), 115-132.
Simar, L., & Wilson, P. W. (2007). Estimation and inference in two-stage, semi-parametric models of production processes. Journal of Econometrics, 136(1), 31-64.
Simar, L., & Wilson, P. W. (2020). Technical, allocative and overall efficiency: Estimation and inference. European Journal of Operational Research, 282(3), 1164-1176.
Simar, L., & Zelenyuk, V. (2020). Improving finite sample approximation by central limit theorems for estimates from data envelopment analysis. European Journal of Operational Research, 284(3), 1002-1015.
Simar, L., Zelenyuk, V., & Zhao, S. (2024a). Inference for aggregate efficiency: Theory and guidelines for practitioners. European Journal of Operational Research, 316(1), 240-254.
Simar, L., Zelenyuk, V. & Zhao, S., (2024b). Statistical inference for Hicks-Moorsteen productivity indices. Annals of Operations Research, 1-29
Singh, S., & Ranjan, P. (2018). Efficiency analysis of non-homogeneous parallel sub-unit systems for the performance measurement of higher education. Annals of Operations Research, 269, 641-666.
Soleimani-Damaneh, M. (2013). Another approach for estimating RTS in dynamic DEA. Journal of Productivity Analysis, 39(1), 75-81.
Soleimani-Damaneh, M., Jahanshahloo, G. R., & Reshadi, M. (2006). On the estimation of returns-to-scale in FDH models. European Journal of Operational Research, 174(2), 1055-1059.
Soleimani-Damaneh, M., & Reshadi, M. (2007). A polynomial-time algorithm to estimate returns to scale in FDH models. Computers & Operations Research, 34(7), 2168-2176.
Staat, M. (2002). Bootstrapped efficiency estimates for a model for groups and hierarchies in DEA. European Journal of Operational Research, 138(1), 1-8.
Sueyoshi, T., & Aoki, S. (2001). A use of a nonparametric statistic for DEA frontier shift: The Kruskal and Wallis rank test. Omega, 29(1), 1-18.
Sueyoshi, T., & Goto, M. (2012). Returns to scale and damages to scale on US fossil fuel power plants: Radial and non-radial approaches for DEA environmental assessment. Energy Economics, 34(6), 2240-2259.
Sueyoshi, T., & Goto, M. (2013). Returns to scale vs. damages to scale in data envelopment analysis: An impact of US clean air act on coal-fired power plants. Omega, 41(2), 164-175.
Sueyoshi, T., & Sekitani, K. (2005). Returns to scale in dynamic DEA. European Journal of Operational Research, 161(2), 536-544.
Taleb, M., Khalid, R., Ramli, R., Ghasemi, M. R., & Ignatius, J. (2022). An integrated bi-objective data envelopment analysis model for measuring returns to scale. European Journal of Operational Research, 296(3), 967-979.
Talluri, S., Narasimhan, R., & Nair, A. (2006). Vendor performance with supply risk: A chance-constrained DEA approach. International Journal of Production Economics, 100(2), 212-222.
Tan, Y., Wanke, P., Antunes, J., & Emrouznejad, A. (2021). Unveiling endogeneity between competition and efficiency in Chinese banks: A two-stage network DEA and regression analysis. Annals of Operations Research, 306(1), 131-171.
Tone, K. (2001). On returns to scale under weight restrictions in data envelopment analysis. Journal of Productivity Analysis, 16, 31-47.
Tortosa-Ausina, E., Grifell-Tatjé, E., Armero, C., & Conesa, D. (2008). Sensitivity analysis of efficiency and Malmquist productivity indices: An application to Spanish savings banks. European Journal of Operational Research, 184(3), 1062-1084.
Tsionas, M. G. (2021). Optimal combinations of stochastic frontier and data envelopment analysis models. European Journal of Operational Research, 294(2), 790-800.
Tsionas, M. G. (2022). Convex non-parametric least squares, causal structures and productivity. European Journal of Operational Research, 303(1), 370-438.
Tsionas, M. G., & Philippas, D. (2023). Measures of global sensitivity in linear programming: Applications in banking sector. Annals of Operations Research, 330(1), 585-607.
Van Eck, N., & Waltman, L. (2010). Software survey: VOSviewer, a computer program for bibliometric mapping. Scientometrics, 84(2), 523-538.
Varian, H. R. (1984). The nonparametric approach to production analysis. Econometrica: Journal of the Econometric Society, 579-597.
Varian, H. R. (1985). Non-parametric analysis of optimizing behavior with measurement error. Journal of Econometrics, 30(1-2), 445-458.
Wang, H., Pan, C., Wang, Q., & Zhou, P. (2020). Assessing sustainability performance of global supply chains: An input-output modeling approach. European Journal of Operational Research, 285(1), 393-404.
Wang, Y., Wang, S., Dang, C., & Ge, W. (2014). Nonparametric quantile frontier estimation under shape restriction. European Journal of Operational Research, 232(3), 671-678.
Wang, K., Wei, Y. M., & Huang, Z. (2016). Potential gains from carbon emissions trading in China: A DEA based estimation on abatement cost savings. Omega, 63, 48-59.
Wheelock, D. C., & Wilson, P. W. (2008). Non-parametric, unconditional quantile estimation for efficiency analysis with an application to Federal Reserve check processing operations. Journal of Econometrics, 145(1-2), 209-225.
Wu, J., & An, Q. (2013). Slacks-based measurement models for estimating returns to scale. International Journal of Information and Decision Sciences, 5(1), 25-35.
Wu, F., Wang, S. Y., & Zhou, P. (2023). Marginal abatement cost of carbon dioxide emissions: The role of abatement options. European Journal of Operational Research, 310(2), 891-901.
Yu, A., Zhang, H., Liu, H. C., Shi, Y., & Bi, W. (2024). Dynamic centralized resource allocation approach with contextual impacts: Analyzing Chinese carbon allocation plans. Annals of Operations Research, 341(1), 451-483.
Zelenyuk, V. (2013). A scale elasticity measure for directional distance function and its dual: Theory and DEA estimation. European Journal of Operational Research, 228(3), 592-600.
Zelenyuk, V. (2020). Aggregation of inputs and outputs prior to data envelopment analysis under big data. European Journal of Operational Research, 282(1), 172-187.
Zhang, Q., & Yang, Z. (2015). Returns to scale of two-stage production process. Computers & Industrial Engineering, 90, 259-268.
Zhou, P., Zhou, X., & Fan, L. W. (2014). On estimating shadow prices of undesirable outputs with efficiency models: A literature review. Applied Energy, 130, 799-806.
- Ali Emrouznejad
a.emrouznejad@surrey.ac.ukVictor Podinovski
V.Podinovski@lboro.ac.ukVincent Charles
c.vincent@qub.ac.ukChixiao Lu
c.lu@surrey.ac.ukAmir Moradi-Motlagh
amoradi@swin.edu.au
1 Surrey Business School, University of Surrey, Guildford GU2 7XH, UK
2 Loughborough Business School, Loughborough University, Leicestershire LE11 3TU, UK
3 Queen’s Business School, Queen’s University Belfast, Belfast BT9 5EE, UK
4 Swinburne University of Technology, Melbourne, Australia From a definitional perspective, the applied directional Benefit-of-the-Doubt model can be regarded as a DDF model without explicit inputs. However, from a computational perspective, it can be treated as a conventional DDF model due to the presence of undesirable outputs and the absence of inputs.
The sample size for the simulation tests in Johnson and Kuosmanen’s (2012) study is set at 100 , which is categorised as a ‘medium-sized’ sample in Banker et al. (2019). Their proposed model demonstrated better performance than the DEA + OLS approach in simulation testing.
In addition to Scopus, Google Scholar is used to extract seven conference proceedings co-edited by Banker. - *Banker also co-organised or served as an invited speaker at several other DEA conferences, including: DEA2002 (invited speaker; Moscow, Russia), DEA2004 (invited speaker; Birmingham, UK), DEA2007 (coorganiser; Hyderabad, India), DEA2009 (organiser; Philadelphia, USA), DEA2010 (invited speaker; Beirut, Lebanon), DEA2011 (invited speaker; Thessaloniki, Greece), DEA workshop 2013 (co-organiser; Hebrew University, Israel), DEA2018 (co-organiser; Wuhan, China), DEA2019 (co-organiser; Calgary, Canada)