أثر سياسة التمويل الأخضر على أداء الابتكار الأخضر: دليل من الشركات الصينية الملوثة بشدة The impact of green finance policy on green innovation performance: Evidence from Chinese heavily polluting enterprises

المجلة: Journal of Environmental Management، المجلد: 352
DOI: https://doi.org/10.1016/j.jenvman.2023.119961
PMID: https://pubmed.ncbi.nlm.nih.gov/38219663
تاريخ النشر: 2024-01-13

جامعة إدنبرة

مستكشف أبحاث إدنبرة

أثر سياسة التمويل الأخضر على أداء الابتكار الأخضر

أدلة من الشركات الصينية الملوثة بشدة

اقتباس للإصدار المنشور:

تشانغ، ك، ليو، د، دونغ، ي & شيونغ، ج 2024، ‘أثر سياسة التمويل الأخضر على أداء الابتكار الأخضر: دليل من الشركات الصينية الملوثة بشدة’، مجلة إدارة البيئة، المجلد 352، 119961.https://doi.org/10.1016/j.jenvman.2023.119961

معرف الكائن الرقمي (DOI):

10.1016/j.jenvman.2023.119961

رابط:

رابط إلى سجل النشر في مستكشف أبحاث إدنبرة

نسخة الوثيقة:

نسخة الناشر بصيغة PDF، والمعروفة أيضًا باسم النسخة المسجلة

نُشر في:

مجلة إدارة البيئة

الحقوق العامة

حقوق الطبع والنشر للمنشورات المتاحة عبر مستكشف أبحاث إدنبرة يحتفظ بها المؤلف (المؤلفون) و/أو مالكو حقوق الطبع والنشر الآخرين، ومن شروط الوصول إلى هذه المنشورات أن يعترف المستخدمون ويلتزموا بالمتطلبات القانونية المرتبطة بهذه الحقوق.

سياسة الإزالة

لقد بذلت جامعة إدنبرة كل جهد معقول لضمان أن محتوى مستكشف أبحاث إدنبرة يتوافق مع التشريعات البريطانية. إذا كنت تعتقد أن العرض العام لهذا الملف ينتهك حقوق الطبع والنشر، يرجى الاتصال بـopenaccess@ed.ac.ukتوفير التفاصيل، وسنقوم بإزالة الوصول إلى العمل على الفور والتحقيق في ادعائك.

أثر سياسة التمويل الأخضر على أداء الابتكار الأخضر: دليل من الشركات الصينية الملوثة بشدة

كايوان تشانغ دان لو ييزهي دونغ تشو شياو كلية علوم الإدارة والهندسة، جامعة نانجينغ لعلوم المعلومات والتكنولوجيا مدرسة هينلي للأعمال، جامعة ريدينغ، ريدينغ، RG6 6UD، المملكة المتحدة كلية إدارة الأعمال بجامعة إدنبرة، جامعة إدنبرة، إدنبرة، EH8 9JS، المملكة المتحدة المختبر الوطني الرئيسي لمعدات نقل الطاقة وأمن النظام والتكنولوجيا الجديدة، جامعة تشونغتشينغ، تشونغتشينغ، 400044، الصين

معلومات المقال

المحرر المعالج: ليشياو تشانغ

الكلمات المفتاحية:

سياسة التمويل الأخضر
الابتكار الأخضر
التنظيم البيئي
حماية البيئة
الصين

الملخص

تُعترف الابتكارات الخضراء (GI) بشكل متزايد كاستراتيجية فعالة لمواجهة تغير المناخ، والتخفيف من القضايا البيئية، وتعزيز التنمية المستدامة. باستخدام بيانات بانل للشركات المدرجة في الصين من 2007 إلى 2019، تعتمد هذه الدراسة على نهج الفرق في الفروق لتقييم تأثير سياسة التمويل الأخضر (GFP) التي أطلقتها الحكومة الصينية في عام 2012 على أداء الابتكار الأخضر للشركات. تكشف النتائج أن سياسة التمويل الأخضر تعزز بشكل كبير أداء الابتكار الأخضر للمؤسسات الملوثة بشدة (HPEs). ومن الجدير بالذكر أن هذا التأثير يكون أكثر وضوحًا في الشركات المملوكة للدولة والشركات التي تعتمد بشكل كبير على التمويل الخارجي. بالمقارنة مع اللوائح القائمة على العقوبات، تُظهر اللوائح البيئية القائمة على الحوافز والطوعية تأثيرات معتدلة أكثر أهمية على العلاقة بين سياسة التمويل الأخضر وأداء الابتكار الأخضر للمؤسسات الملوثة بشدة. كما نحدد تحسين الكفاءة في استخدام الاستثمارات الخضراء كآلية محتملة من خلالها تعزز سياسة التمويل الأخضر أداء الابتكار الأخضر للمؤسسات الملوثة بشدة. تُظهر التحليلات المقارنة الإضافية أن الشركات الخضراء يمكن أن تحقق تحسينًا متزامنًا في كل من جودة وكمية الابتكار الأخضر، بينما تُظهر المؤسسات الملوثة بشدة بشكل أساسي تحسينات في كمية الابتكار. لتعظيم الآثار الإيجابية لسياسة التمويل الأخضر، يُوصى بتسهيل المزيد من الإقراض المستهدف من البنوك نحو المؤسسات الملوثة بشدة لدعم تحولها الهيكلي. بالإضافة إلى ذلك، يُنصح بالتوزيع المنسق لمجموعة متنوعة من أدوات السياسة البيئية لاستغلال تأثيراتها التآزرية.

1. المقدمة

على مدى العقود الماضية، أثارت القضايا المتعلقة بالاحترار العالمي الناجم عن التلوث البيئي نقاشًا واسعًا (Francey et al., 2013; Balsalobre-Lorente et al., 2018; Mealy and Teytelboym, 2022; Fan et al., 2023). على مدى العقود القليلة الماضية، شهدت الصين نموًا اقتصاديًا سريعًا مع تص industrialization سريع. ومع ذلك، أدى هذا النمو إلى استهلاك مفرط للطاقة وتلوث بيئي شديد (Zhang et al., 2021b). في عام 2005، أصبحت الصين أكبر المصدر (وانغ وآخرون، 2017). تأثير الاحتباس الحراري، الذي تفاقم بسبب الإفراط في الانبعاثات تشكل تهديدًا كبيرًا لبقاء الإنسان وأنشطة الإنتاج (Xu et al., 2021). وبالتالي، أصبح الحفاظ على هذا النمو المفرط غير مستدام بشكل متزايد بالنسبة للصين (Yang et al., 2023; Wei
تسعى الحكومة الصينية، بهدف تحقيق التنمية المستدامة، إلى تحقيق أهداف مثل الوصول إلى ذروة الكربون بحلول عام 2030 والحياد الكربوني بحلول عام 2060. وبشكل خاص، هناك تركيز متزايد على التحول الأخضر للمؤسسات الملوثة بشدة.
لتلبية هذه الأهداف، نفذت الحكومة الصينية تدابير تنظيمية متنوعة، بما في ذلك التدابير القائمة على الأوامر، والسوق، والتدابير الطوعية. من الجدير بالذكر أن تنظيم البيئة القائم على السوق (MER) يكتسب أهمية متزايدة بسبب مرونته واستقلاليته وكفاءته الاقتصادية (تيان وفينغ، 2022؛ تشانغ وآخرون، 2023). على وجه التحديد، يشجع MER، الذي يتمثل في سياسة التمويل الأخضر (GFP)، الشركات على اعتماد تدابير لحماية البيئة. من خلال تنفيذ سلسلة من الآليات المالية، يهدف إلى تحقيق الهدفين المزدوجين من
حماية البيئة والتنمية الاقتصادية (Sun et al., 2019; Wu and Liu, 2023). يوفر برنامج التمويل الأخضر حوافز قروض للمبادرات الخضراء بينما يفرض قيودًا على الشركات الملوثة بشدة (Wu and Liu, 2023). تستخدم السياسات المالية مثل برنامج التمويل الأخضر بشكل فعال قوة السوق المالية لتعزيز المسؤولية البيئية للشركات، مما يمنح الشركات الاستقلالية لتخصيص الأموال بشكل مثالي للانتقال الأخضر وجهود حماية البيئة. لذلك، كأداة تنظيم بيئي قائمة على السوق، يمكن أن يوجه برنامج التمويل الأخضر الشركات نحو الابتكار الأخضر (GI)، ويساهم في إعادة هيكلة اقتصادية أوسع والانتقال الأخضر للبلد (Lu et al., 2022; Tan et al., 2022). على الرغم من الأبحاث الواسعة حول تأثيرات اللوائح البيئية على أداء الشركات وكثافة الطاقة (Hamamoto, 2006; Lin and Xu, 2023; Testa et al., 2011; Wang et al., 2021, 2023)، هناك دراسات محدودة تقيم تأثيرات برنامج التمويل الأخضر على الابتكار على مستوى الشركات المتنوعة. تهدف هذه الورقة إلى سد هذه الفجوة من خلال تحليل تأثير برنامج التمويل الأخضر في الصين على الابتكار الأخضر للشركات، مع التركيز بشكل خاص على الشركات عالية الأداء البيئي. هذا أمر حاسم لفهم الانتقال الاقتصادي الأخضر في الصين وقد يوفر رؤى للاقتصادات الأخرى التي تهدف إلى الحياد الكربوني والتنمية الخضراء (Tian and Feng, 2022; Su et al., 2022).
تعتبر الوقود الأحفوري، على الرغم من كونها محورية للنمو الصناعي والاقتصادي (أوادا وماستري، 2023)، تحديات بيئية كبيرة. وبالتالي، فإن أداء الابتكار البيئي في الشركات، الذي يشمل التقدم التكنولوجي المستدام أو المنتجات أو الخدمات، يكتسب اهتمامًا متزايدًا (ليو ووانغ، 2023؛ تشينغ وآخرون، 2021؛ ما وآخرون، 2021؛ فاسيليو وآخرون، 2022). يُعتبر ذلك وسيلة فعالة لتحقيق التوازن بين التنمية الاقتصادية وإدارة البيئة (رينينغز، 2000؛ ووكر وآخرون، 2015؛ شهباز وآخرون، 2018؛ تشين وآخرون، 2023). على وجه الخصوص، يساعد الابتكار البيئي في تقليل استهلاك الطاقة والانبعاثات، مما يقلل من تكاليف الإنتاج ويخفف من الآثار البيئية السلبية، وبالتالي يعزز زيادة حصة السوق للمنتجات الصديقة للبيئة ويدفع التحول الأخضر الأوسع في الصناعة (هوانغ وآخرون، 2019؛ لي وآخرون، 2023). بالإضافة إلى ذلك، نفذت الحكومة الصينية العديد من السياسات البيئية لتسريع التحول الأخضر، مع التركيز بشكل خاص على الشركات عالية الأداء (وانغ ولي، 2022). لذلك، يُقال إن الابتكار البيئي يوفر للشركات مزايا تنافسية من خلال فوائد التبني المبكر، ودعم الحكومة، والريادة التكنولوجية (غوبتا وباروا، 2018). نتيجة لذلك، فإن اللوائح البيئية التي تفرضها الحكومة ضرورية لتعزيز الابتكار الأخضر في الشركات (ستيرن وفاليرو، 2021)، حيث يتعزز هذا التأثير من خلال الدور الإشرافي لوسائل الإعلام الرقمية (لي وآخرون، 2023؛ ليو وآخرون، 2023).
فيما يتعلق بالعلاقة بين اللوائح البيئية والابتكار الأخضر، تفترض فرضية بورتر (PH) أن اللوائح البيئية المرنة يمكن أن تعزز المزايا البيئية للابتكار (بورتر، 1991). وبالتالي، تقدم هذه الدراسة أدلة تجريبية تدعم فرضية بورتر، مستندة إلى عينات من أكبر اقتصاد نامٍ في العالم. في الصين، أصبحت خطة الحكومة الخضراء (GFP) تنظيمًا بيئيًا رئيسيًا (ياو وآخرون، 2021). عندما تواجه الشركات ذات الأداء العالي (HPEs) خطة الحكومة الخضراء، تتأثر بشكل كبير بسبب القيود المالية وحاجتها لتحقيق أرباح كبيرة (هو وآخرون، 2021ب). أيضًا، تستجيب الشركات الخضراء لخطة الحكومة الخضراء من خلال الاستثمار في الابتكار الأخضر للحفاظ على الميزة التنافسية. علاوة على ذلك، تركز الدراسات الحالية بشكل أساسي على آثار سياسة واحدة على ابتكار الشركات (تانغ وآخرون، 2020؛ شو ولي، 2020؛ سو وآخرون، 2022)، متجاهلة التأثير التآزري لمختلف اللوائح البيئية. ومع ذلك، فإن هذا التأثير التآزري هو عنصر حاسم في فرضية بورتر، وستكون النتائج مهمة للصين وغيرها من الاقتصادات ذات الخصائص الاقتصادية المماثلة في تشكيل سياسات بيئية فعالة.
نظرًا لأهمية أهداف البحث، تدرس هذه الدراسة العلاقة بين GFP و GI باستخدام بيانات بانل عن الشركات الصينية المدرجة من 2007 إلى 2019، مع التركيز بشكل خاص على ما إذا كان GFP يعزز GI بين HPEs في ظل ظروف غير متجانسة. علاوة على ذلك،
لقد نفذت الصين أنواعًا مختلفة من اللوائح البيئية وقد تكون لهذه السياسات تأثيرات تآزرية. لذلك، قد يكون من المفيد فهم كيف تؤثر هذه اللوائح على العلاقة بين GFP و GI. نستكشف أيضًا: ما هي تأثيرات GFP على الشركات الخضراء؟ هل هذه التأثيرات متسقة مع تلك التي على HPEs؟
تساهم هذه الدراسة في الأدبيات من الجوانب التالية. أولاً، بينما تدرس بعض الدراسات التأثير الذي يحدثه GFP على أداء HPEs (Cui et al.، 2022؛ Peng et al.، 2022)، لم يتم القيام بالكثير لاستكشاف العلاقة بين GFP و GI لـ HPEs ونظرائهم الأكثر خضرة. على الرغم من كونها أقل تلوثًا، يمكن أن يعزز GFP أيضًا GI للشركات الخضراء لتعزيز التنافسية. ومع ذلك، تختلف استجابات الشركات الخضراء وفقًا للمبادرات التنظيمية المفروضة واستراتيجيات GI التي تختارها. تقدم هذه البحث رؤى قيمة من خلال مقارنة القنوات الاستجابة المتنوعة التي اختارتها هذين النوعين من المؤسسات من أجل الانتقال الأخضر المستقبلي لـ HPEs.
ثانيًا، درست الدراسات السابقة مؤشر الابتكار العام ومؤشر الابتكار الأخضر ولكنها فشلت في تحديد الآليات الداخلية (وانغ وآخرون، 2022ج؛ تشانغ وآخرون، 2023). تتناول هذه الدراسة تفاصيل مؤشر الابتكار العام، م differentiating بين جودته وزياداته الكمية، وتحقق أيضًا في تفضيلات الشركات والأسباب وراءها. الأهم من ذلك، تضيف الدراسة إلى هذا المجال من خلال تحديد عدة آليات محتملة من خلالها يحسن برنامج التمويل الأخضر أداء الابتكار في الشركات، مثل هيكل الملكية والاعتماد على التمويل الخارجي.
ثالثًا، بينما يُعتبر GFP أداة تنظيمية مهمة ضمن إطار تنظيم البيئة في الصين، تشير الدراسات إلى أن الأدوات التنظيمية المختلفة يمكن أن تؤثر بشكل متكامل على قدرات الابتكار لدى الشركات وجهود تقليل الانبعاثات (Fabrizi et al., 2018; Yuan, 2019). تكشف هذه الدراسة أن كل من الأدوات التنظيمية القائمة على الأوامر والأدوات الطوعية تعدل بشكل كبير العلاقة بين GFP و GI. وقد أدت هذه الملاحظات إلى استنتاجات سياسية قيمة، مما يبرز أهمية نهج متكامل في التنظيمات البيئية لتحفيز GI بشكل فعال.
رابعًا، أثناء تقييم تأثير GFP على GI، يجب أيضًا أخذ التغيرات في عوامل القناة (مثل كفاءة استخدام رأس المال الأخضر) في الاعتبار. ومع ذلك، فشلت الدراسات الحالية في تحديد مثل هذه القنوات (Zhu، 2022؛ Wang et al.، 2022c). تملأ هذه الدراسة هذه الفجوة من خلال الكشف عن أن كفاءة استخدام رأس المال الأخضر هي إحدى القنوات التي يتم من خلالها توليد المزيد من GI بنفس مقدار الاستثمار الرأسمالي.
خامسًا، تعتمد الدراسة نموذجًا جديدًا لتضمين الكلمات لتحسين دقة قياس المتغيرات وموثوقية النتائج. قد تؤدي الطرق التقليدية، مثل تحديد المرادفات يدويًا (لوغرن وماكدونالد، 2011)، إلى إدخال تحيز بسبب طبيعتها الذاتية. بالمقابل، فإن استخدام نموذج تضمين الكلمات، وهو تقنية قائمة على التعلم الآلي، يعالج هذه القيود (لي وآخرون، 2021). تتيح هذه الطريقة قياسًا أكثر دقة للمتغيرات مثل التنظيم البيئي القائم على الحوافز والاستثمار الأخضر.
بقية هذه الدراسة منظمة على النحو التالي. القسم 2 يقدم نظرة عامة على الأدبيات ويطور الفرضيات. القسم 3 يصف المتغيرات والمنهجية. القسم 4 يناقش النتائج التجريبية. أخيرًا، القسم 5 يقدم استنتاجات هذه الدراسة.

2. مراجعة الأدبيات وتطوير الفرضيات

2.1. فرضية بورتر

تفترض فرضية بورتر (PH) أن القوانين الصارمة ولكن المناسبة
يمكن أن تحفز اللوائح البيئية المصممة الابتكار المؤسسي، وخاصة الابتكار الأخضر (بورتر وليند، 1995). للامتثال لمتطلبات اللوائح أثناء بناء مزايا تنافسية مستدامة على المدى الطويل، يمكن أن تتعرض الشركات للضغط أو التحفيز للاستثمار في التقنيات الخضراء وتعديل استراتيجياتها التنافسية وفقًا لذلك (فاروق وآخرون، 2021). لضمان الوظيفة المناسبة لنظام اللوائح البيئية، يجب أن تتوفر فيه الخصائص التالية: تغطية واسعة: يجب أن يوفر أكبر مساحة محتملة للابتكار المؤسسي؛ الاستمرارية: يجب أن يحفز الابتكار المستمر؛ المرونة: يجب أن يسمح للشركات بتنفيذ السياسات على مراحل مع مستوى معين من السلطة التقديرية؛ وقابلية التنفيذ: يجب أن يكون قادرًا على التحكم في سلوكيات الشركات وإنفاذها بفعالية من خلال آلية تقييم مصممة جيدًا وتشجيع التعاون بين الحكومة والشركات (بورتر وليند، 1995).
لقد أظهرت العديد من الدراسات صحة PH (Zhao et al., 2015; Ouyang et al., 2020). على سبيل المثال، يمكن للشركات خلق فرص سوقية جديدة من خلال تطوير منتجات أكثر صداقة للبيئة (Ouyang et al., 2020)، مما يمكن أن يحفز الشركات على الاستثمار أكثر في الابتكار الأخضر. على المدى الطويل، قد يتم تعويض الاستثمارات في التكنولوجيا الخضراء بالكامل من خلال المكاسب المحتملة الناتجة عن تقليل تكاليف التحكم في التلوث، وزيادة الإنتاجية، والدعاية الإيجابية. يمكن أن يكون هذا صحيحًا بشكل خاص عندما تواجه الشركات زيادة في شدة التنظيم البيئي، مما يمكن أن يسرع من عمليات الابتكار الأخضر ويؤدي إلى تطوير صناعة صديقة للبيئة (تشاو وآخرون، 2015). ومع ذلك، تتطلب الاستثمارات الخضراء أيضًا دعمًا ماليًا كبيرًا. وبالتالي، يمكن أن يساعد صندوق التمويل الأخضر في هذا الصدد من خلال تخفيف قيود التمويل، مما يكمل اللوائح البيئية ويعزز أنشطة الابتكار الأخضر.
بدأت الأبحاث الحديثة في الاستفادة من السياسات البيئية كتجارب شبه طبيعية للتحقيق في PH والتخفيف من القضايا المحتملة المتعلقة بالداخلية، مثل إدخال نظام تداول انبعاثات الكربون (Hu et al.، 2020). على سبيل المثال، اكتشف Hu et al. (2020) أن سوق تداول انبعاثات الكربون كان له تأثير إيجابي كبير على كل من حجم وجودة الابتكار بين الشركات الصينية. كأداة مهمة في التنظيم البيئي، حصل دور GFP في الحوكمة البيئية على اهتمام متزايد في السنوات الأخيرة (Yao et al.، 2021). وجدت دراسات معينة أن سن GFP أدى إلى تقليص القروض البنكية وحجم الاستثمارات في HPEs، مما أدى في النهاية إلى انخفاض في الأداء التشغيلي لهذه الشركات وإنتاجية العوامل الكلية (Liu et al.، 2019). استخدم Liu et al. (2019) إعلان إرشادات الائتمان الأخضر لعام 2012 كتجربة شبه طبيعية، وأظهروا أن قدرة تمويل الديون لـ HPEs قد انخفضت بشكل كبير. علاوة على ذلك، فإن التأثير الصافي السلبي لتمويل الديون أكثر وضوحًا في الشركات المملوكة للدولة وتلك الموجودة في مناطق ذات أنظمة مالية أضعف.
ومع ذلك، وفقًا لـ PH، فإن فعالية سياسة تنظيم البيئة في التأثير على الابتكار تعتبر مقياسًا حاسمًا لنجاح الانتقال الأخضر (Pizer و Popp، 2008). من الواضح أن الهدف الرئيسي من GFP هو التخفيف من تلوث البيئة، وليس تقويض تنافسية الشركات. مؤخرًا، قام Li et al. (2018) ببناء نظرية القرض الأخضر باستخدام نماذج كمية لدعم دور GFP في تعزيز الابتكار في الإنتاج النظيف. ومع ذلك، لا يزال التأثير الدقيق لـ GFP في الصين على الابتكار الأخضر غامضًا، خاصة فيما يتعلق بتأثيره على الشركات المتنوعة في السيناريوهات العملية. هذه الأسئلة مهمة في التحقق من قابلية تطبيق PH في الصين. علاوة على ذلك، فإن الأبحاث الحالية التي تستكشف التأثير التآزري للأنظمة البيئية الأخرى بالتزامن مع GFP محدودة. قد يؤدي تجاهل هذا الجانب إلى تقدير غير مكتمل لصلاحية PH (Zefeng et al.، 2018). لذلك، تتناول هذه الدراسة
فجوة البحث وتوسع في PH من خلال النظر في التأثير التآزري لمختلف الأنظمة البيئية.

2.2. سياسة التمويل الأخضر وأداء الابتكار الأخضر

من بين مختلف GFPs، أحدثت إرشادات الائتمان الأخضر (GCG) التي تم تنفيذها في عام 2012 تأثيرات عميقة، مما أدى إلى زيادة كبيرة في رصيد الائتمان الأخضر في الصين على مر السنين (الشكل 1). وفقًا لـ GCG، يجب على جميع البنوك التجارية تعزيز إدارة الأداء البيئي للمؤسسات وإنشاء آلية لمشاركة المعلومات لتطوير الائتمان الأخضر (Zhang et al.، 2021a؛ Yao et al.، 2021). ثم يتم استخدام الائتمان لتعزيز أداء الابتكار الأخضر من خلال تطوير تقنيات أو أساليب تساهم في توفير الطاقة، وتقليل الانبعاثات، وحماية البيئة، من بين أمور أخرى (Chen et al.، 2006). على غرار أنواع الابتكار العامة الأخرى، يمكن أن يساعد الابتكار الأخضر في التقدم التكنولوجي للمؤسسات، مما يمكنها من تطوير خدمات ومنتجات أكثر ابتكارًا (Aldieri et al.، 2020). كما أن الخصائص الخضراء لمثل هذا الابتكار تفيد البيئة أيضًا (Huang و Li، 2017). لذلك، قد يساعد الابتكار الأخضر في تحقيق الأهداف المزدوجة لحماية البيئة والتنمية الاقتصادية في نفس الوقت (Ganda، 2019؛ Shao et al.، 2021). وبالتالي، يتناسب الابتكار الأخضر جيدًا ضمن نطاق GFP.
على مدى العقود الماضية، كانت العديد من HPEs حريصة على التحول الهيكلي للاستمرار في الوصول إلى وجذب تدفقات رأس المال المستقرة من المؤسسات المالية. لذلك، أصبح تحقيق أداء بيئي وصرف صحي مؤهل أمرًا مهمًا بشكل خاص لهذه HPEs (Berrone et al.، 2013). على الرغم من الإصلاحات الواسعة في سوق رأس المال، تظل القروض المصدر الرئيسي للتمويل للشركات الصينية، خاصة بالنسبة لـ HPEs (Xing et al.، 2020). بسبب GFP، قد يتم تحفيز HPEs التي ترغب في
الشكل 1. رصيد الائتمان الأخضر في الصين، حسب السنة ملاحظة: رصيد الائتمان الأخضر في الصين من 2013 إلى 2019. يتم عرض حجم ( ) من الائتمان الأخضر على المحور الأيسر.
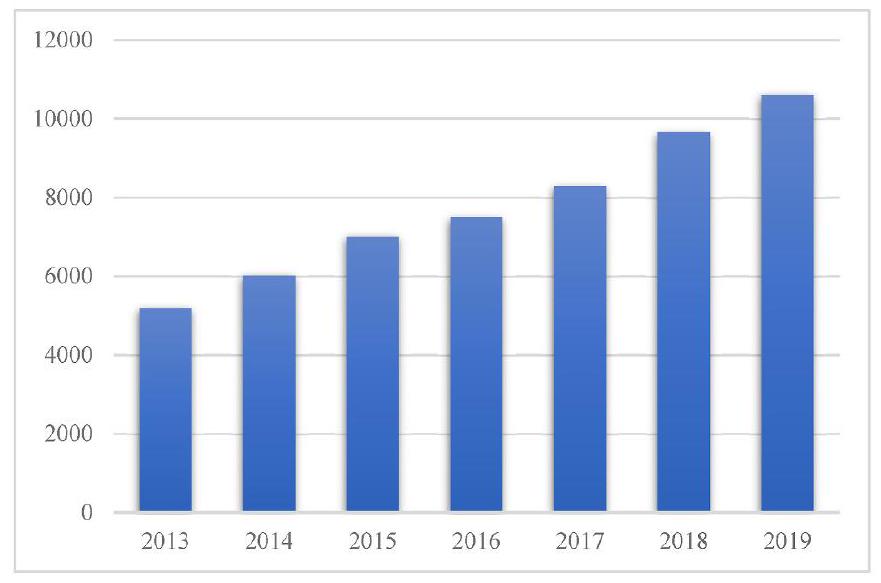
مصدر البيانات: CSMAR.
تأمين الدعم المالي قد يدفعها إلى تقليل الانبعاثات، بما في ذلك من خلال الابتكار الأخضر، حيث يجب عليها الوفاء بمتطلبات GFP للوصول إلى القروض من المؤسسات المالية (Shi et al.، 2022). يساعد هذا أيضًا HPEs في بناء علاقات جيدة مع الحكومة المحلية لأنها يمكن أن تظهر التزامها بالاستدامة البيئية (Hu et al.، 2021b). بناءً على المناقشة أعلاه، يتم اقتراح الفرضية الأولى كما يلي:
الفرضية 1. GFP يحسن أداء الابتكار الأخضر لـ HPEs.

2.3. التأثير المعتدل للأنظمة البيئية

قد تغير الأنظمة البيئية سلوك الشركات من خلال قنوات مختلفة، مثل تشجيعها على الاستثمار أكثر في الأنشطة الخضراء أو زراعة ثقافة خضراء في الشركة (Kesidou و Demirel، 2012؛ Dong et al.، 2023). بشكل عام، بخلاف MER، تتكون ERs أيضًا من فئتين: الأنظمة البيئية القائمة على الأوامر والتحكم (CER) والأنظمة البيئية الطوعية (VER). الأولى تعتمد بشكل أساسي على أوامر الحكومة (Tang et al.، 2020) وتتضمن تنفيذ قوانين البيئة، والعقوبات الإدارية، ودعم الحكومة (Carrión-Flores et al.، 2013). تشير VER إلى الإفصاح الطوعي عن المعلومات البيئية من قبل الشركات (Jiang et al.، 2020). يمكن أن تقلل هذه الإفصاحات بشكل فعال من عدم التماثل في المعلومات بين المؤسسات المالية والشركات، مما يزيد من إمكانية وصول الشركات إلى التمويل الأخضر.

2.3.1. تنظيم البيئة القائم على الأوامر والتحكم

نظرًا لقوة إنفاذها القوية نسبيًا، تظل CER، وخاصة CER القائمة على العقوبات، تنظيمًا بيئيًا مهمًا في البلدان النامية. من خلال إدخال عقوبات مالية إضافية وعقوبات احتجاز إدارية على الشركات، زادت CER_Penalty بشكل كبير من تكلفة الانتهاكات البيئية للشركات، مما أجبرها على الانخراط أكثر في ممارسات الابتكار الأخضر (Wang et al.، 2022b). ظهرت صورة مماثلة في الصين حيث تم دفع الشركات ذات الاستهلاك العالي للطاقة والكفاءة المنخفضة للخروج من السوق بسبب الرقابة في الوقت المناسب والسيطرة على الانبعاثات التي تمارسها سياسات CER_Penalty (Zhu et al.، 2021). ومع ذلك، تم انتقاد CER_Penalty أيضًا بسبب تكاليفها العالية، وكفاءتها التشغيلية المنخفضة، وانحرافها عن الأهداف الأصلية المتمثلة في تعزيز الابتكار التكنولوجي بين الشركات (Joshi et al.، 2001). علاوة على ذلك، يشير Hotte و Winer (2012) إلى أنه نظرًا لأن CER_Penalty غالبًا ما تفشل في مراعاة الفروق الكبيرة في التكاليف بين الشركات، فقد تعيق في الواقع معدل اعتماد التكنولوجيا، خاصة بين الشركات الصغيرة. نظرًا لأن العقوبات يمكن تطبيقها فقط على أهداف قابلة للقياس، فقد لا تمنع الأنظمة المنظمة بناءً عليها جميع أنواع أنشطة التلوث بشكل فعال (Shevchenko، 2021). عندما تمتلك الشركات معلومات أكثر من المنظمين، يمكن أن تصبح هذه الحالة أسوأ.
لذلك، فإن القيود الجوهرية لـ CER_Penalty جعلتها بديلًا أقل كفاءة من الأنظمة القائمة على الحوافز في الصين (Lin و Xie، 2023). بدلاً من تحفيز زيادة الابتكار الأخضر الممول من GFP المواتي، قد تفرض CER_Penalty عبئًا ماليًا إضافيًا على HPEs، مما يزيد من تفاقم وضعها المالي بينما ترسل إشارات سيئة إلى السوق (Requate و Unold، 2003). وبالتالي، قد تكون جهود الابتكار الأخضر أقل تمويلًا. علاوة على ذلك، قد يتم تقييد القدرة على التمويل على المدى الطويل للشركات بشكل أكبر. بناءً على هذه المناقشة، تقترح هذه الدراسة الفرضية التالية:
الفرضية 2a. CER_Penalty لا تعزز بشكل إيجابي العلاقة بين GFP وأداء الابتكار الأخضر بين HPEs.
من بين أنواع مختلفة من CERs، تشارك الإعانات الحكومية في بعض الخصائص المعتمدة على الحوافز (CER_Incentive)، على الرغم من بعض أوجه القصور في التصميم. كما لوحظ من قبل شلايفر وفيشني (1994)، يمكن أن تتأثر الإعانات الحكومية بسلوكيات البحث عن الإيجارات والرشوة المتبادلة بين الشركات والمسؤولين الحكوميين المحليين. هذا
يرفع بدوره التكاليف غير الإنتاجية للشركات، مما يضعف قدرتها التنافسية ويفكك تأثير تحفيز الابتكار للإعانات. علاوة على ذلك، قد تسعى بعض إدارات الشركات إلى الحصول على الإعانات الخضراء بهدف إرضاء الحكومة من أجل مكاسب قصيرة الأجل. وقد أدى ذلك مرة أخرى إلى تشويه الغرض الحقيقي من الإعانات الخضراء (Li et al., 2023). ومع ذلك، نظرًا لتدابير مكافحة الفساد القوية في الصين وآليات المراجعة الصارمة لـ GFP، تفترض العديد من الدراسات أنه من الصعب على HPEs الاعتماد فقط على البحث عن الإيجارات قصيرة الأجل للتنقل في تعقيدات السياسات البيئية طويلة الأجل (Bai et al., 2019). وهذا يشير إلى أن HPEs قد تنظر بشكل أساسي إلى الإعانات الخضراء كمعونات مالية لتعزيز أداء الابتكار الأخضر (Horbach et al., 2012).
أما بالنسبة لـ CER_Incentive، فإنه يشير إلى النقل المجاني للأموال من الحكومات المحلية إلى الشركات (Huang et al., 2019)، مع تقييد استخدام الأموال لأغراض معينة مثل الاستثمارات الخضراء (Zhang, 2022). إنه يعمل كبديل مباشر لتمويل الديون، مما يوفر بديلاً قابلاً للتطبيق لـ HPEs لتحولاتها الخضراء المبتكرة (Horbach et al., 2012). علاوة على ذلك، تشير CER_Incentive أيضًا إلى دعم الحكومة للشركة، مما يمكنها من تجاوز القيود المفروضة من قبل تمويل الديون (Zhang, 2022). بعبارة أخرى، يمكن أن تساعد CER_Incentive الشركات في تنويع المخاطر المرتبطة بالابتكار الأخضر إلى حد ما، مما يزيد من استعدادها للاستثمار في مثل هذه الأنشطة (Bai et al., 2019). علاوة على ذلك، لتعزيز علاقة طويلة الأمد مع الحكومة، تميل HPEs إلى أن تكون أكثر تحفيزًا لتحسين أدائها البيئي من خلال الابتكار الأخضر. لذلك، تقترح هذه الدراسة الفرضية التالية:
الفرضية 2ب. يمكن أن تعزز CER_Incentive بشكل إيجابي العلاقة بين GFP وأداء الابتكار الأخضر لـ HPEs.

2.3.2. التنظيم البيئي الطوعي

مقارنةً بـ CER و MER، يُعتبر VER ‘الجيل الثالث’ من الأدوات للتحكم في التلوث (Tietenberg, 1998). إن الكشف عن انبعاثات الملوثات، مثل الكشف عن المعلومات البيئية للشركات المدرجة في الصين، هو مثال جيد على ذلك (Jiang et al., 2020). ومع ذلك، يُقال إنه نظرًا لأن شدة VER الحالية في الصين لا تزال منخفضة نسبيًا، وأن زراعة الوعي البيئي هي جهد طويل الأمد، فإن VER غير قادر على تحقيق أي تأثيرات مادية على تحسين GI للشركات (Wang et al., 2022b). على العكس من ذلك، لتجنب التدقيق البيئي من قبل الجمهور أو وسائل الإعلام، قد تلجأ الشركات إلى استراتيجيات إدارة قصيرة الأجل، مثل الحوكمة النهائية. مثل هذه الأساليب لا تهدر فقط موارد الشركات ولكنها أيضًا تحول الأموال عن الاستثمارات في البحث والتطوير الأخضر، مما يعيق تحسين GI للشركات أكثر (Wang et al., 2022b). ومع ذلك، مع تزايد توفر بيانات الكشف عن المعلومات البيئية في الصين، يبرز عدد متزايد من الأبحاث مزايا VER (Lundqvist, 2001; Huang and Chen, 2015; Bu et al., 2020). من خلال تقليل التكاليف وتحسين كفاءة الوقت في تقديم ومعالجة ونشر المعلومات ذات الصلة، يقلل VER من عدم التماثل في المعلومات بين الشركات والمؤسسات المالية (Lundqvist, 2001; Bu et al., 2020). يمكن أن يساعد ذلك في إنشاء علاقة موثوقة طويلة الأمد بين الطرفين، مما يمكن أن يساعد في تحسين الأداء التنظيمي العام (Huang and Chen, 2015). لذلك، نظرًا للتأثير الإيجابي لـ VER على أداء الشركات وتأثيره الإشاري، تقترح هذه الدراسة الفرضية التالية:
الفرضية 3. يمكن أن تعزز VER بشكل إيجابي العلاقة بين GFP وأداء الابتكار الأخضر لـ HPEs.

3. المنهجية والمتغيرات

3.1. بيانات واختيار العينة

تشمل العينة بيانات عن الشركات المدرجة في A-share في الصين من 2007 إلى 2019. 2007 هو سنة بدء العينة لأن معايير المحاسبة الجديدة تم تنفيذها في الصين في هذا العام. في الوقت نفسه، تم تحديد 2019 كسنة انتهاء لتخفيف تأثير جائحة COVID-19.
يتم تعريف HPEs وفقًا لـ ‘إرشادات تصنيف الصناعة للشركات المدرجة’ التي تم تعديلها من قبل لجنة تنظيم الأوراق المالية الصينية في 2012 و’إرشادات الكشف عن المعلومات البيئية للشركات المدرجة (مسودة لطلب الآراء)’ التي نشرتها إدارة حماية البيئة الصينية في 2010 (المشار إليها فيما بعد، المسودة) (Shi et al., 2022). يتم تصفية العينة على النحو التالي: (1) استبعاد الشركات المالية و ST؛ (2) إزالة الشركات التي تفتقر إلى المتغيرات الرئيسية؛ (3) تطبيق طريقة وينزور على جميع المتغيرات المستمرة عند و المستويات لتخفيف تأثير القيم الشاذة؛ و (4) إزالة الشركات التي تغير وضعها بين الصناعات الملوثة بشدة وغير الملوثة بشدة خلال فترة العينة. تم جمع جميع البيانات من قاعدة بيانات سوق الأسهم الصينية وأبحاث المحاسبة (CSMAR)، وقاعدة بيانات خدمات بيانات البحث الصينية (CNRDS)، والتقارير السنوية، وتقارير المسؤولية الاجتماعية للشركات (CSR) للشركات المدرجة المعنية. 3.2. النماذج

اتباعًا لـ Zhang et al. (2021a) و Shi et al. (2022)، تقوم هذه الدراسة ببناء نموذج الفرق في الفروق (DID) لاستكشاف تأثير GFP على الابتكار الأخضر وتخفيف مشكلة الاندماج.

يقيس الابتكار الأخضر للشركات.


هو التفاعل بين Treat Post ويعكس تأثير DID. تمثل CER و VER. تمثل مجموعة المتغيرات الضابطة. ، و ، و تشير إلى تأثيرات ثابتة للشركة والصناعة والسنة والمنطقة، على التوالي. لا يتم تضمين المتغيرات الزمنية الخام الأصلية و treat نظرًا لأن تأثيرات الشركة والسنة الثابتة تؤخذ في الاعتبار. يمكن أن يخفف ذلك بشكل فعال من مشاكل الاندماج، مثل تحيز المتغيرات المفقودة، إلى حد ما (Meyer, 1995; Shi et al., 2022).

3.3. المتغيرات

3.3.1. المتغيرات التابعة

اتباعًا لـ Hu et al. (2021b) و Yuan و Pan (2023)، تستخدم هذه الدراسة اللوغاريتم الطبيعي لمجموع 1 وعدد طلبات براءات الاختراع الخضراء الإجمالية للشركة في السنة لتمثيل الابتكار الأخضر (GI). تم جمع بيانات براءات الاختراع الخضراء من قاعدة بيانات CNRDS.

3.3.2. المتغيرات المستقلة

المتغيرات المستقلة هي المجموعة المعالجة (Treat) وتنفيذ السياسة (Post). Treat هو متغير وهمي يساوي واحدًا إذا كانت الشركة HPE وصفرًا بخلاف ذلك. Post هو متغير وهمي يساوي واحدًا إذا تم تنفيذ GFP، أو خلال الفترة من 2012-2019. وفقًا لبناء النموذج، فإن التفاعل Treat Post (DID) هو المتغير الرئيسي ويجب أن يكون له دلالة إذا كان تأثير DID موجودًا (Wang و Li, 2022).

3.3.3. المتغيرات المعدلة

ينقسم CER بشكل رئيسي إلى نوعين: CER_Penalty و CER_Incentive. تشير CER_Penalty إلى العقوبات المفروضة من قبل الحكومة على الشركات المدرجة التي لديها قضايا بيئية (Ma et al., 2022). يتم تمثيلها من خلال ما إذا كانت الشركة قد تعرضت لانتهاك بيئي تم الإشارة إليه في السنة. تتعلق CER_Incentive بشكل رئيسي بالإعانات الخضراء الممنوحة من قبل الحكومة. لالتقاط أنواع مختلفة من الرعاية التي بدأت بها الحكومة، تستخدم هذه الدراسة نموذج Word Embedding من التعلم الآلي لبناء قاموس الإعانات الخضراء ثم تحصل على بيانات الإعانات الخضراء من خلال فحص الملاحظات في التقارير السنوية للشركات باستخدام هذا القاموس. بعد التصفية، يتم استخدام اللوغاريتم لمجموع مبلغ عناصر الإعانات الخضراء المكتشفة لبناء مؤشر CER_Incentive.
غالبًا ما تعتمد طرق تحليل النص التقليدية على التعرف اليدوي على المرادفات لتوسيع مجموعة الكلمات (لوغرن وماكدونالد، 2011). ومع ذلك، فإن هذه الطريقة تتضمن درجة عالية من الذاتية وقد تُدخل تحيزًا في مجموعة الكلمات. وبالتالي، تستخدم هذه الدراسة نموذج تضمين الكلمات لبناء مؤشر CER_Incentive. يستخدم النموذج شبكة عصبية لتحليل كمية كبيرة من النصوص المالية بعمق، مما يؤدي إلى بناء نموذج تشابه الكلمات الذي يتم تدريب الكلمات المماثلة منه. يتيح القاموس الشبيه، الذي تم إنشاؤه بواسطة هذا النموذج، قياسًا متغيرًا شاملًا وموضوعيًا، مما يعزز دقة قياس المتغيرات وقوة النتائج التجريبية (لي وآخرون، 2021).
يتم قياس VER من خلال مستوى الإفصاح عن انبعاثات الملوثات لشركة ما. في الصين، يعتبر الإفصاح عن الالتزامات البيئية طوعياً، وبالتالي يمكن أن تعكس شدته الضغط الناتج عن اللوائح البيئية التي تواجهها الشركة ورغبتها في الإفصاح عن المعلومات البيئية طوعياً (هوانغ وتشين، 2015). بشكل محدد، إذا اختارت الشركة الإفصاح عن معلومات انبعاثات الملوثات، المقاسة هنا من خلال ستة مؤشرات، طوعياً، يتم تعيين قيمة 1 لذلك المؤشر، و0 خلاف ذلك. ثم يتم تجميع قيم المؤشرات المختلفة للحصول على VER.

3.3.4. متغيرات التحكم

تُعتبر المتغيرات الضابطة التالية للتحكم في تأثير الخصائص الخاصة بالشركة.
3.3.4.1. الربحية. يتم قياس ربحية الشركة من خلال نسبة الأرباح الصافية إلى إجمالي الأصول، أو العائد على الأصول (ROA) (Zhang et al., 2022b). يجب أن يعزز ذلك قدرة الشركات على الابتكار حيث أن هامش الربح الأعلى يسمح للشركات بتراكم المزيد من الأرباح المحتجزة للاستثمار في البحث والتطوير (Hu et al., 2021b). بينما يجادل آخرون بأنه نظرًا لأن الابتكار يمكن أن يكون مكلفًا، قد يكون مدراء تلك الشركات ذات العائد على الأصول المرتفع مترددين في استثمار الموارد المالية في الابتكار الأخضر. قد يكون هذا قد أدى إلى علاقة غير متسقة بين الربحية والابتكار (Zhang et al., 2022b).
3.3.4.2. حجم الشركة (الحجم). يتم استخدام اللوغاريتم الطبيعي لإجمالي أصول الشركة لقياس حجم الشركة (الحجم) (Hu et al., 2021b; Ma et al., 2021; Xie et al., 2023; Zhang et al., 2022b). لقد كان حجم الشركة دائمًا أحد أهم العوامل التي تؤثر على قدراتها في الابتكار التكنولوجي. قد يسهل توسيع النطاق، مثل من خلال الاندماج والاستحواذ، مشاركة موارد الابتكار، وبالتالي، تعزيز قدرة الشركة.
قدرة الابتكار (وانغ ولي، 2022). تجد الشركات الكبيرة أيضًا أنه من الأسهل الحصول على دعم مالي إضافي من مصادر خارجية، مما يسمح لها بالاستثمار أكثر في البحث والتطوير. لذلك، تتوقع هذه الدراسة وجود علاقة إيجابية بين حجم الشركة والابتكار الأخضر.
3.3.4.3. الرفع المالي. يتم قياس الرفع المالي من خلال نسبة الالتزامات إلى إجمالي الأصول (Zhang et al., 2022b; Wang and Li, 2022). قد يؤدي الرفع المالي الأعلى إلى زيادة المخاطر المالية على الشركات. استجابةً لذلك، قد تقوم الشركات بتقليص استثمارات البحث والتطوير لتقليل عدم اليقين و/أو استخدام الموارد الحالية بشكل أكثر كفاءة لتحقيق مخرجات أكثر ابتكارًا. وبالتالي، فإن التأثير الناتج من الصعب التنبؤ به ويختلف تحت سيناريوهات مختلفة (Zhang et al., 2022b; Lu et al., 2022). لذلك، تعتبر هذه الدراسة تأثير الرفع المالي على الابتكار الأخضر غير مؤكد.
3.3.4.4. سنوات الإدراج (العمر). اللوغاريتم الطبيعي لعدد السنوات التي تم فيها إدراج الشركة زائد واحد لقياس نضج المؤسسة (Hu et al., 2021b). بينما قد يسمح إدراج الأسهم للشركات بالوصول إلى مجموعة تمويل أكبر وتعزيز صورتها العامة، قد تكون الشركات التي تم إدراجها لفترة أطول أكثر ابتكارًا. ومع ذلك، يجادل آخرون بأن إدراج الأسهم ليس شرطًا ضروريًا لزيادة الابتكار الأخضر، حيث قد تسعى الشركات لتحقيق أهداف تجارية أخرى بعد الإدراج (Zhang et al., 2022b). لذلك، تعتبر هذه الدراسة العلاقة بين العمر والابتكار الأخضر غير مؤكدة.
3.3.4.5. تدابير الحوكمة المؤسسية (INST و Inden). تعتبر هذه الدراسة متغيرين مهمين في الحوكمة المؤسسية: نسبة ملكية المستثمرين المؤسسيين (INST) ونسبة المديرين المستقلين في مجلس الإدارة (Inden) (Hu et al., 2021b; Zhang et al., 2022b; Wang and Li, 2022). كأعضاء مهمين في المجلس، قد يلعب المستثمرون المؤسسيون دورًا رئيسيًا في التأثير على تخصيص رأس المال في الشركة.
ومع ذلك، بسبب ضعف الوعي العام وعدم كفاية الإشراف تجاه المشكلات البيئية على مدى العقود الماضية، قد يفشل المستثمرون المؤسسيون في التقاط قضايا الانتقال الأخضر بسبب سلوكيات انتهازية وقصيرة النظر (وانغ ولي، 2022). وبالتالي، من المتوقع أن تكون هناك علاقة سلبية بين INST والابتكار الأخضر. بينما تلعب المديرون المستقلون دورًا مهمًا في حوكمة الشركات، تظل قدرتهم على التأثير في اتخاذ القرارات المؤسسية محل شك (تشانغ وآخرون، 2022ب). لذلك، من المتوقع أن تكون العلاقة بين Inden والابتكار الأخضر غير مؤكدة.
3.3.4.6. المسؤولية الاجتماعية للشركات. يتم تمثيل المسؤولية الاجتماعية للشركات بواسطة متغير وهمي يساوي واحد إذا كانت الشركات تكشف عن تقارير المسؤولية الاجتماعية الخاصة بها، وصفر خلاف ذلك (هو وآخرون، 2021ب). قد تتبنى الشركات التي تهتم بتأثيرها الاجتماعي موقفًا أكثر نشاطًا تجاه الابتكار في التكنولوجيا الخضراء (بيكر وآخرون، 2021). لذلك، يُفترض وجود علاقة إيجابية بين الكشف عن تقارير المسؤولية الاجتماعية والابتكار الأخضر.
بعد بناء المتغير، في القسم التالي، تفحص هذه الدراسة أولاً تأثير GFP على الابتكار الأخضر بين الشركات عالية الأداء باستخدام نموذج DID. بعد ذلك، يتم إجراء سلسلة من الاختبارات، مثل تحليل الاتجاه المتوازي ومطابقة درجات الميل-DID (PSM-DID)، لضمان قوة النتائج الأساسية. ثم تقوم الدراسة بإجراء تحليل التباين، مع تضمين عوامل مثل أنواع الابتكار الأخضر، وهيكل ملكية الشركات، ودرجة الاعتماد على التمويل الخارجي، لاستكشاف العلاقات في سيناريوهات مختلفة. علاوة على ذلك، لتحديد استجابة الشركات لأنواع مختلفة من اللوائح البيئية، تحقق هذه الدراسة في التأثير التعديلي لـ CERs وVERs على العلاقة بين GFP والابتكار الأخضر في الشركات عالية الأداء. أخيرًا، لفهم شامل لتأثيرات GFP، تستكشف هذه الدراسة العلاقة بين GFP والابتكار الأخضر للمؤسسات الخضراء.

4. النتائج التجريبية

4.1. الإحصائيات الوصفية وتحليل الارتباط

تقدم الجدول 1 الإحصائيات الوصفية لجميع المتغيرات المستخدمة في الانحدار الأساسي. من بين 14,789 عينة من 2007 إلى 2019، كانت القيم الدنيا والقصوى لمؤشر الابتكار الأخضر 0 و3.829 على التوالي، مما يشير إلى وجود تباينات كبيرة في مستويات الابتكار الأخضر بين الشركات العينة. القيمة المتوسطة لمؤشر DID هي 0.152، مما يشير إلى أن حوالي تتأثر الشركات العينة بـ GFP. النتائج بالنسبة للمتغيرات الأخرى تتماشى مع الأدبيات وتقع ضمن نطاق معقول. الجدول 2 يعرض مصفوفة الارتباط بين المتغيرات. العلاقة الملحوظة بين DID و GI تظهر ارتباطًا إيجابيًا كبيرًا، مع معامل قدره 0.097. وهذا يشير إلى أن تنفيذ GFP في الصين يمكن أن يعزز بشكل كبير أداء الابتكار الأخضر للشركات عالية الأداء. علاوة على ذلك، توفر نتائج تحليل الارتباط دليلًا أوليًا يدعم قابلية تطبيق فرضية بورتر في سياق الصين. في الوقت نفسه، تم العثور أيضًا على أن المتغيرات الأخرى ترتبط بقوة بأداء الابتكار الأخضر، مما يشير إلى ملاءمة المتغير المختار (Zhang et al.، 2020).

4.2. نتائج الخط الأساسي

أولاً، استنادًا إلى المعادلة (1)، تفحص هذه الدراسة تأثير GFP على الابتكار الأخضر في HPEs. النتائج مدرجة في الجدول 3. تُظهر الأعمدة 1 و 2 النتائج لجميع الشركات الم sampled، بينما تُظهر الأعمدة 3-4 النتائج عند استبعاد الشركات الخضراء (أي بالنسبة لـ HPEs) بشكل رئيسي بسبب المخاوف بشأن انحياز التقدير (Zhang et al.، 2022b). تشمل الأعمدة 1 و 3 متغير DID فقط، بينما تشمل الأعمدة 2 و 4 أيضًا متغيرات تحكم إضافية. كانت معاملات DID إيجابية بشكل كبير بغض النظر عن تضمين متغيرات التحكم الأخرى والشركات الخضراء. تدعم هذه النتائج التجريبية الفرضية 1، وهي أن GFP يعزز الابتكار الأخضر في HPEs الصينية بشكل كبير. استنادًا إلى فرضية بورتر، يمكن أن تعزز السياسات البيئية المصاغة بشكل جيد ابتكار الشركات، مما يحقق تقليل التلوث وزيادة التنافسية في آن واحد. لتأمين المزيد من رأس المال من المالية
الجدول 1
الإحصائيات الوصفية. .
متغير ملاحظات معنى الانحراف المعياري من ماكس
جي آي 14,789 0.425 0.839 0.000 ٣.٨٢٩
هل 14,789 0.152 0.359 0.000 1.000
العائد على الأصول 14,789 0.044 0.050 -0.165 0.192
حجم 14,789 ٢٢.٢٣٠ 1.308 19.890 ٢٦.٠٦٩
الرافعة 14,789 0.421 0.201 0.048 0.845
عمر 14,789 ٢.١٤٥ 0.785 0.000 ٣.٢٥٨
INST 14,789 0.466 0.241 0.003 0.910
إندين 14,789 0.372 0.053 0.308 0.571
المسؤولية الاجتماعية للشركات 14,789 0.295 0.456 0.000 1.000
ملاحظات: المصطلحات الكاملة للاختصارات المتغيرة: GI: الابتكار الأخضر؛ DID: الفرق في الفروق؛ ROA: الربحية؛ الحجم: حجم الشركة؛ الرفع المالي: الرفع المالي؛ العمر: سنوات الإدراج؛ INST: نسبة ملكية المستثمرين المؤسسيين؛ Inden: نسبة المديرين المستقلين؛ CSR: المسؤولية الاجتماعية للشركات.
تم حذف ملاحظة واحدة في الانحدار الأساسي، مما يؤدي إلى اختلاف طفيف في إجمالي الملاحظات بين النموذج الأساسي والإحصائيات الوصفية لأن هذه الدراسة تتحكم في تأثيرات الشركات الثابتة على المستوى وتستخدم الأمر ‘reghdfe’ في Stata لإجراء انحدارات خطية. يمكن أن يؤدي الحفاظ على مجموعات فردية في الانحدارات الخطية حيث تكون التأثيرات الثابتة متداخلة ضمن المجموعات إلى المبالغة في دلالة الإحصائيات ونتائج استنتاجات غير صحيحة. لذلك، يقوم حزمة ‘reghdfe’ الآن تلقائيًا بحذف الأفراد (Correia، 2015).
الجدول 2
معاملات الارتباط بيرسون.
جي آي فعل العائد على الأصول حجم الرافعة عمر INST إندين المسؤولية الاجتماعية للشركات
جي آي 1
هل 0.097*** 1
العائد على الأصول 0.020** -0.105*** 1
حجم 0.270*** 0.092*** -0.041*** 1
الرافعة 0.107*** 0.015* -0.367*** 0.533*** 1
عمر 0.060*** 0.084*** -0.176*** 0.418*** 0.388*** 1
INST 0.061*** -0.061*** 0.146*** 0.433*** 0.247*** 0.183*** 1
إندين 0.030*** -0.005 -0.047*** 0.059*** -0.001 -0.016** -0.065*** 1
المسؤولية الاجتماعية للشركات 0.203*** 0.081*** 0.061*** 0.454*** 0.150*** 0.228*** 0.218*** 0.019** 1
ملاحظة: * و ** و *** تشير إلى الدلالة الإحصائية عند ، و المستويات، على التوالي. المصطلحات الكاملة للاختصارات الخاصة بالمتغيرات: GI: الابتكار الأخضر؛ DID: الفرق في الفروقات؛ ROA: الربحية؛ الحجم: حجم الشركة؛ الرفع المالي: الرفع المالي؛ العمر: سنوات الإدراج؛ INST: نسبة ملكية المستثمرين المؤسسيين؛ Inden: نسبة المديرين المستقلين؛ CSR: المسؤولية الاجتماعية للشركات.
الجدول 3
الانحدار الأساسي.
المتغيرات (1) (2) (3) (4)
جي آي جي آي جي آي جي آي
هل 0.090** 0.108*** 0.107** 0.123***
(2.08) (3.22) (2.42) (3.58)
العائد على الأصول 0.128 0.136
(1.03) (0.78)
حجم 0.138*** 0.140***
(5.20) (6.60)
الرافعة -0.060 -0.062
(-1.03) (-0.83)
عمر 0.028 0.023
(0.57) (0.43)
INST -0.181*** -0.215***
(-3.20) (-3.94)
إندين -0.120 -0.082
(-0.98) (-0.95)
المسؤولية الاجتماعية للشركات 0.095** 0.093**
(2.71) (2.86)
ثابت 0.461*** -2.555*** 0.409*** -2.643***
(79.66) (-5.11) (60.83) (-6.44)
شركة ف.إي. نعم نعم نعم نعم
صناعة F.E. نعم نعم نعم نعم
سنة م.ف. نعم نعم نعم نعم
المنطقة F.E. نعم نعم نعم نعم
ملاحظات 16,814 16,814 ١٤٧٨٨ ١٤٧٨٨
R-squared 0.689 0.692 0.677 0.682
ملاحظة: * و ** و *** تشير إلى الأهمية الإحصائية عند ، و المستويات، على التوالي. جميع الانحدارات مجمعة بشكل قوي حسب الصناعات. يتم تضمين إحصائيات t القوية بين قوسين. المصطلحات الكاملة للاختصارات الخاصة بالمتغيرات: GI: الابتكار الأخضر؛ DID: الفرق في الفروق؛ ROA: الربحية؛ الحجم: حجم الشركة؛ الرفع: الرفع المالي؛ العمر: سنوات الإدراج؛ INST: نسبة ملكية المستثمرين المؤسسيين؛ Inden: نسبة المديرين المستقلين؛ CSR: المسؤولية الاجتماعية للشركات.
للحفاظ على مؤسساتها وتعزيز ميزتها التنافسية، تحفز الشركات عالية الأداء على تعظيم مخرجات الابتكار الأخضر باستخدام الأموال المتاحة. وجد هو وآخرون (2021ب) نتيجة مشابهة لفعالية فرضية بورتر في الصين.
فيما يتعلق بمتغيرات التحكم، فإن الحجم، والمستثمرين المؤسسيين، والمسؤولية الاجتماعية للشركات تؤثر بشكل كبير على الابتكار الأخضر، بما يتماشى مع الدراسات السابقة (هو وآخرون، 2021ب؛ وانغ ولي، 2022). بالمقارنة مع الشركات الصغيرة، قد تكون الشركات الكبيرة فقط لديها رأس المال المالي الكافي والخبرة في أنشطة البحث والتطوير. وهذا يترجم إلى زيادة في مخرجات الابتكار الأخضر. في الوقت نفسه، للحفاظ على ريادتها في صناعاتها المعنية، تواجه الشركات الكبيرة أيضًا ضغوطًا لتحقيق تقدم تكنولوجي مستمر (وانغ ولي، 2022). بعد ذلك، فإن نسبة ملكية المستثمرين المؤسسيين لها علاقة سلبية كبيرة مع مخرجات الابتكار الأخضر للشركات، وهو ما يتماشى مع التوقعات. يميل المستثمرون المؤسسيون إلى أن يكونوا متحفظين نسبيًا. ومع ذلك، نظرًا لأن استثمارات البحث والتطوير تحمل مخاطر عالية، قد تجد الشركات التي لديها المزيد من المستثمرين المؤسسيين صعوبة في الحصول على موافقة/دعم مجلس الإدارة لمثل هذه الاستثمارات (وانغ ولي،
أخيرًا، قد تهتم الشركات التي تكشف عن تقارير المسؤولية الاجتماعية أكثر بتصورها الاجتماعي ومن المرجح أن تشارك بنشاط في الابتكار الأخضر.
من بين المتغيرات الأخرى التي لم تظهر نتائج ذات دلالة، فإن تحقيق ربحية أعلى وفترة إدراج أطول لا يضمن بالضرورة المزيد من مخرجات الابتكار الأخضر، حيث قد تتأثر قرارات البحث والتطوير في الشركات بسلسلة من العوامل المعقدة. علاوة على ذلك، على الرغم من أن الشركات ذات مستويات الرفع المالي الأعلى قد تخضع لقيود إقراض أكثر صرامة وزيادة في المخاطر المالية، إلا أن ذلك لا يعيق بالضرورة ابتكارها الأخضر. (Zhang et al., 2022b). أخيرًا، قد يكون تأثير المديرين المستقلين على اتخاذ القرارات في الشركات محدودًا.

4.3. اختبارات المتانة

افتراض مهم في نموذج الفرق في الفرق هو أن اتجاهات المجموعات المعالجة والمراقبة متشابهة قبل تنفيذ السياسة. تستخدم هذه الدراسة طريقة دراسة الأحداث لاختبار هذا الافتراض (Zhang et al., 2021a). بناءً على Lu et al. (2022)، تم إنشاء متغيرات وهمية سنوية لتتبع تأثير GFP في عام 2012. Post_4 إلى Post_1 هي متغيرات وهمية تساوي واحدًا إذا كانت سنة الملاحظة هي 2008-2011، على التوالي، وصفر بخلاف ذلك. Post_0 إلى Post_7 هي متغيرات وهمية تساوي واحدًا إذا كانت سنة الملاحظة هي 2012-2019، على التوالي، وصفر بخلاف ذلك. يتم ضرب Post_4 إلى Post_7 على التوالي مع Treat للحصول على 12 متغيرًا وهميًا (DID_4 إلى DID_7). ثم يتم إعادة تقدير المعادلة (1) باستخدام DID_4 إلى DID_7 لفحص افتراض الاتجاهات المتوازية. يتم تقديم معاملات DID_4 إلى DID_7 في الشكل 2، والتي تتوافق مع النقاط -4 إلى 7. جميع المعاملات غير دالة (جميع فترات الثقة تشمل الصفر)، مما يشير إلى أن جميع التفاعلات قبل عام 2012 غير دالة. لذلك، يتم دعم افتراض الاتجاه المتوازي ويمكن استخدام نموذج DID.
لتقليل المشكلات المحتملة الناتجة عن التحيز الناتج عن الاختيار الذاتي، تستخدم هذه الدراسة طريقة PSM لمطابقة مجموعات العلاج والضبط، وتعرض النتائج في الجدول 4. وفقًا لـ Cui et al. (2022)، تختار هذه الدراسة المتغيرات الضابطة ROA، الحجم، الرفع المالي، العمر، INST، Inden، وCSR كمتغيرات مشتركة لإجراء تحليل لوجستي للحصول على درجة الميل للمؤسسات في مجموعة العلاج، ثم تطابق المؤسسات في مجموعات الضبط ذات الخصائص المماثلة باستخدام طريقة المطابقة الجوارية. يمكن أن تحل هذه الطريقة بشكل فعال الفرق الأولي بين مجموعات العلاج والضبط، مما يجعل نتائج التقدير أكثر دقة (Zhang وJiang، 2022). بعد إجراء PSM، يتم حذف الملاحظات غير المتطابقة وتكرار التقديرات. النتائج المعروضة في العمود 1 تتماشى مع النتائج الرئيسية للنموذج الأساسي.
لقد بدأت الحكومة الصينية سلسلة من السياسات لحماية البيئة على مدى العقدين الماضيين. مع تضمين طويل
الشكل 2. تحليل الاتجاهات المتوازية.
الجدول 4
اختبارات أخرى للنموذج الأساسي.
المتغيرات (1) (2) (3) (4)
بي إس إم – دي آي دي 2008-2015 احذف 2008 و 2009 حذف المقاطعات
فعل 0.123*** (3.56) 0.101*** (3.10) 0.101*** (3.17) 0.132** (2.66)
ثابت -2.650*** (-6.47) -2.974*** (-5.66) -2.392*** (-6.08) -2.924*** (-6.49)
متغيرات التحكم نعم نعم نعم نعم
شركة ف.إي. نعم نعم نعم نعم
صناعة F.E. نعم نعم نعم نعم
سنة م.ف. نعم نعم نعم نعم
المنطقة F.E. نعم نعم نعم نعم
ملاحظات 14,778 9010 ١٣١٨٢ 12,385
R-squared 0.682 0.728 0.700 0.660
ملاحظة: * و ** و *** تشير إلى الأهمية الإحصائية عند ، و المستويات، على التوالي. جميع الانحدارات مجمعة بشكل قوي حسب الصناعات. يتم تضمين إحصائيات t القوية بين قوسين. المصطلحات الكاملة للاختصارات الخاصة بالمتغيرات: DID: الفرق في الفروق.
قد يؤدي فترة العينة بعد تنفيذ GFP إلى تقديرات متحيزة، لذا تم تقصير فترة العينة إلى 2008-2015 (Wang et al., 2022a). يبقى معامل DID إيجابيًا بشكل ملحوظ في العمود 2. ومع ذلك، قد تؤثر أحداث أخرى خلال فترة العينة، مثل الأزمة المالية الكبرى (2008-2009) ودورة الألعاب الأولمبية في بكين (2008)، على نتائج التقدير حيث قد تكون هذه الأحداث قد عطلت الأنشطة التجارية العادية (Zhang et al., 2022b). لإزالة التأثيرات المحتملة للأزمة المالية الكبرى، تتجاهل هذه الدراسة الملاحظات خلال عامي 2008 و2009، وتعيد تشغيل الانحدار. النتائج في العمود 3 تتماشى مع النتائج الأساسية. فيما يتعلق بتأثير دورة الألعاب الأولمبية في بكين، تم تقديم بعض المبادرات الجديدة خلال هذه الفترة، بما في ذلك مفهوم “الألعاب الأولمبية الخضراء”، ومشاريع “السماء الزرقاء والمياه الخضراء” في بكين والمناطق المحيطة بها. بالإضافة إلى ذلك، في عام 2015، مع تقديم خطة تنمية بكين-تيانجين-خبى المنسقة، تصاعدت القضايا المتعلقة بحماية البيئة إلى مستوى تاريخي مرتفع. لذلك، وفقًا لـ Tang et al. (2020)، تتجاهل هذه الدراسة بيانات المناطق ذات الصلة في الصين وتعيد تشغيل النموذج الأساسي. تظل النتائج في العمود 4 قوية. تستخدم الدراسة أيضًا اختبار الدواء الوهمي عن طريق العشوائية
توليد مجموعة من HPEs وتكرار عملية العينة 500 مرة. تظل النتائج قوية (انظر الملحق 4).
لذا، فإن نموذج DID المستخدم هنا يتناسب جيدًا مع العينة، ومع كل من الشركات الملوثة بشدة والشركات الخضراء. بشكل عام، يظهر GFP كعامل مهم يؤثر على مخرجات الابتكار لدى الشركات. في تحليل التباين التالي، على الرغم من أن تضمين الشركات الخضراء لم يؤثر على النتائج المقدرة في النموذج الأساسي، إلا أنه تم تضمين الشركات الملوثة بشدة فقط لتقليل انحياز التقدير.

4.4. تحليل التباين

4.4.1. تحليل التباين حسب أنواع الابتكار الأخضر

يُقترح أن اللوائح قد تحفز أنواعًا مختلفة من الابتكار الأخضر بشكل مختلف بسبب الاستثمارات المطلوبة، والمخاطر المعنية، وشدة التنظيم (جافي وبالمر، 1997). للتحقيق بشكل شامل في تأثير GFP على أنواع مختلفة من الابتكار الأخضر، تقسم هذه الدراسة الابتكار الأخضر إلى أداء جودة الابتكار الأخضر (GI_qua) وأداء زيادة الابتكار الأخضر (GI_inc). كما يشير وانغ ولي (2022)، فإن GI_qua مرتبط أكثر بالاختراعات الجديدة، بينما يميل GI_inc إلى البناء على التقنيات أو المنتجات الموجودة. وبالتالي، مقارنةً بـ GI_inc، يتطلب GI_qua المزيد من مدخلات الموارد ويواجه عدم يقين أعلى. لذلك، يجب أن يتأثر أكثر بـ GFP.
يتم قياس GI_qua بواسطة اللوغاريتم الطبيعي لواحد زائد عدد طلبات براءات الاختراع الخضراء المقدمة من الشركة. في السنة (Zhang et al., 2023). يتم قياس GI_inc بواسطة اللوغاريتم الطبيعي لواحد زائد عدد طلبات براءات الاختراع الخضراء لشركة i في السنة t (Wang and Li, 2022). في الوقت نفسه، تشير فئات الملكية المتنوعة للمؤسسات إلى أن براءات الاختراع الخضراء ليست مجرد نشاط بحث داخلي، بل هي نشاط تعاوني بين الشركات (Liu and Wang, 2023). يمكن تقسيم طلبات البراءات إلى ابتكار أخضر مستقل ومشترك. بالنظر إلى تباين المتغير التابع GI، تأخذ هذه الدراسة أيضًا في الاعتبار مؤشرات براءات الاختراع الخضراء المختلفة. لذلك، بالنظر إلى أن كل من GI_qua و GI_inc تشمل الابتكار الأخضر المستقل والمشترك، لدينا GI_qua_ind و GI_qua_joi و GI_inc_ind و GI_incjoi (ليو ووانغ، 2023). تم الإبلاغ عن النتائج في الجدول 5.
العنصر التفاعلي، DID، يحفز بشكل كبير جميع أنواع الابتكار الأخضر، بغض النظر عن المتغيرات المستخدمة. ومن الجدير بالذكر أن معامل GI_inc أكثر أهمية من GI_qua (GI_qua: 0.069، ذو دلالة عند المستوى و GI_inc: 0.124، ذو دلالة عند في الجدول 5)، بما يتماشى مع التوقعات والأبحاث السابقة (وانغ ولي، 2022). لجذب التمويل الخارجي، تسعى الشركات ذات الأداء البيئي العالي إلى تعزيز أدائها في الابتكار الأخضر لتلبية متطلبات القرض بموجب إطار العمل الصيني للابتكار الأخضر. زيادة عدد براءات الاختراع أسهل من تحسين جودتها (تشانغ وآخرون، 2022ب). قد يكون هذا صحيحًا بشكل خاص بالنسبة للشركات التي لديها خبرات محدودة في الابتكار الأخضر وتعمل في صناعات ملوثة بشدة. تستمر الاستنتاجات المماثلة سواء للابتكار الأخضر المستقل أو المشترك، كما هو موضح في الأعمدة 3-6. تشير هذه النتائج إلى أن الابتكار الأخضر لا يحفز فقط الشركات ذات الأداء البيئي العالي على تحسين قدراتها في الابتكار الأخضر، بل يمكنها أيضًا من تقدير التعاون مع شركات أخرى.

4.4.2. تحليل التباين حسب هيكل ملكية الشركات

بعد ذلك، تستكشف هذه الدراسة تأثير هيكل ملكية الشركات على العلاقة بين الأداء الابتكاري الأخضر للمنشآت العامة (GFP) وأداء الابتكار الأخضر للمنشآت الخاصة (HPEs) من خلال تقسيم العينة إلى شركات مملوكة للدولة (SOEs) وغير مملوكة للدولة (non-SOEs) (ياو وآخرون، 2021). يتم تقديم النتائج في الجدول 6.
معاملات DID في الأعمدة 1-3 إيجابية بشكل كبير و
الجدول 5
تحليل التباين للابتكار الأخضر.
المتغيرات (1) (2) (3) (4) (5) (6)
جي_كوا جي_إنك جي_كوا_إند GI_inc_ind جي_كوا_جوي جي_إنك_جوي
هل 0.069** (2.25) 0.124*** (5.08) 0.048* (2.09) 0.096*** (5.71) 0.032* (2.04) 0.029** (2.23)
ثابت -2.408*** (-6.14) -1.379*** (-3.83) -2.005*** (-5.12) -1.185*** (-4.50) -0.736** (-2.97) -0.415 (-1.69)
متغيرات التحكم نعم نعم نعم نعم نعم نعم
شركة ف.إي. نعم نعم نعم نعم نعم نعم
صناعة F.E. نعم نعم نعم نعم نعم نعم
سنة م.ف. نعم نعم نعم نعم نعم نعم
المنطقة F.E. نعم نعم نعم نعم نعم نعم
ملاحظات ١٤٧٨٨ ١٤٧٨٨ ١٤٧٨٨ ١٤٧٨٨ ١٤٧٨٨ 14,788
R-squared 0.656 0.637 0.624 0.619 0.525 0.503
ملاحظة: * و ** و *** تشير إلى الأهمية الإحصائية عند ، و المستويات، على التوالي. جميع الانحدارات مجمعة بشكل قوي حسب الصناعات. يتم تضمين إحصائيات t القوية بين قوسين. المصطلحات الكاملة للاختصارات الخاصة بالمتغيرات: GI_qua: جودة الابتكار الأخضر؛ GI_inc: زيادة الابتكار الأخضر؛ GI_qua_ind: جودة الابتكار الأخضر المستقل؛ GI_inc_ind: زيادة الابتكار الأخضر المستقل؛ GI_qua_joi: جودة الابتكار الأخضر المشترك؛ GI_inc_joi: زيادة الابتكار الأخضر المشترك؛ DID: الفرق في الفروق.
أكبر من تلك الموجودة في الأعمدة 4-6. يعزز GFP كل من جودة وكمية الابتكار الأخضر للمؤسسات المملوكة للدولة (GI_qua: 0.117، دالة عند مستوى 10% و GI_inc: 0.161، دالة عند في الجدول 5)، ولكن فقط الكمية الخاصة بالشركات غير المملوكة للدولة. وهذا ليس مفاجئًا، حيث تميل الشركات المملوكة للدولة إلى أن تكون مفضلة من قبل الائتمان المصرفي مقارنة بالشركات غير المملوكة للدولة، مما يمكنها من المشاركة في الابتكار الأخضر عالي الجودة (أويانغ وآخرون، 2020). بدورها، فإن العلاقة الوثيقة بين الشركات المملوكة للدولة والحكومة الصينية قد عرضت الأولى أيضًا لضغوط متزايدة للامتثال لأهداف خفض الانبعاثات التي تفرضها الدولة (وانغ وآخرون، 2022أ). ومع ذلك، بالنسبة لكل من الشركات المملوكة للدولة وغير المملوكة للدولة، يظل الابتكار الأخضر التدريجي هو التركيز الرئيسي، وذلك أساسًا لأن العينة تتكون من ملوثين كبار فقط. على سبيل المثال، قد تساعد أي تعديلات/تغييرات طفيفة على التقنيات الخضراء الحالية في تحقيق تخفيضات كبيرة في الانبعاثات. ومع ذلك، فإنهم ليسوا قادرين ولا يحظون بالتحفيز الكافي للانخراط في المزيد من الابتكار الأخضر عالي الجودة.

4.4.3. تحليل التباين حسب الاعتماد على التمويل الخارجي

جوهر تصميم GFP هو ربط توفر الائتمان المصرفي مع الأداء البيئي للشركات. لذلك، فإن الشركات التي تعتمد بشكل كبير على التمويل الخارجي من المرجح أن تتأثر بـ GFP (Sun et al., 2019). لقياس مدى اعتماد الشركات على رأس المال الخارجي، وبناءً على Rajan و Zingales (1998) و Sun et al. (2019)، تقوم هذه الدراسة بإنشاء مؤشر اعتماد التمويل الخارجي (EFD) ثم تصنف الشركات إلى فئتين: عالية الاعتماد على التمويل الخارجي ومنخفضة الاعتماد على التمويل الخارجي وفقًا لاعتمادها. تُعرض النتائج في الجدول 7.
تتوافق النتائج لكل من الشركات ذات الكفاءة البيئية العالية والمنخفضة في الأعمدة 1-6 مع النتائج السابقة. ومع ذلك، كما هو موضح في الأعمدة 1-3، فإن أداء الابتكار الأخضر يتأثر بشكل أكبر من قبل GFP في الشركات ذات الكفاءة البيئية العالية، وهو ما يتماشى مع الدراسات السابقة (سون وآخرون، 2019). عندما تدعو الحكومة الصينية إلى التنمية الخضراء، قد تقوم أيضًا بتعديل سياسات الائتمان للحد من تدفق القروض البنكية إلى الأنشطة الملوثة بشدة وفقًا لذلك (وانغ ولي، 2022). وهذا يجبر الشركات ذات الكفاءة البيئية العالية على تعزيز أدائها في الابتكار الأخضر، مما يدل على عزمها على تحقيق نمو مستدام لتأمين الائتمان البنكي. ومن الجدير بالذكر أن GFP يحسن بشكل كبير كل من جودة وكمية الابتكار الأخضر في مجموعة الكفاءة البيئية العالية، ولكن فقط الكمية في مجموعة الكفاءة البيئية المنخفضة. يمكن أن يُعزى ذلك إلى أن الشركات ذات الكفاءة البيئية العالية تميل أكثر إلى تعزيز أداء الابتكار الأخضر المتقدم لضمان توفر الائتمان الأخضر من البنوك في المستقبل. ومع ذلك، نظرًا لأنها تعتمد أقل على التمويل الخارجي، قد تكون الشركات ذات الكفاءة البيئية المنخفضة مترددة في تحمل المخاطر الأعلى المرتبطة بالابتكار الأخضر المتقدم.
في المقابل، تميل الشركات ذات الانبعاثات المنخفضة إلى تعزيز مؤشر الابتكار لديها بشكل أساسي للامتثال لمتطلبات حماية البيئة الواردة في اللوائح ذات الصلة.

4.5. تحليل تأثيرات الاعتدال

تلعب شهادات الانبعاثات المعتمدة (CERs) والشهادات الطوعية (VERs) دورًا رئيسيًا في عملية التحول الأخضر للوائح البيئية الصينية، مما يؤدي إلى تطوير تأثير تآزري في تعزيز الابتكار الأخضر. هنا، يتم إجراء اختبارات إضافية للتحقق من تأثير تنظيمات بيئية أخرى على العلاقة بين الأداء البيئي الأخضر (GFP) والابتكار الأخضر بين الشركات عالية الأداء (HPEs). في التحليل، تستخدم الدراسة الانتهاكات البيئية التي تفرضها الحكومة لقياس تأثير تنظيمات البيئة المعتمدة على العقوبات، وال subsidies البيئية التي تمنحها الحكومة كبديل لتنظيمات البيئة المعتمدة على الحوافز، وكشف انبعاثات الملوثات للتأثير الذي تمارسه التنظيمات البيئية الطوعية. تقوم الدراسة بإجراء التحليل التعديلي بشكل منفصل لهذه الأنواع الثلاثة من التنظيمات البيئية. يتم الإبلاغ عن النتائج في الجدول 8.
كأداة تنظيمية قائمة على الأوامر، فإن CER_Penalty لها علاقة سلبية مع GI و GI_qua (الأعمدة 1-3). وهذا ليس مفاجئًا حيث أن CER_Penalty التي تنفذها الحكومة الصينية تمثل تكاليف بيئية إضافية على الشركات عالية الأداء، مما يقلل من رأس المال المتاح لأنشطة البحث والتطوير الخاصة بها. في بعض الحالات القصوى، يمكن تعليق الشركات للتصحيح بسبب انتهاكات بيئية (ما وآخرون، 2022). من حيث تأثير التعديل، فإن CER_Penalty ليس لها تأثير كبير على العلاقة بين GFP والابتكار الأخضر. وبالتالي، فإن الفرضية 2a مدعومة. قد يكون ذلك لأن GFP هو أكثر من آلية سوقية بينما CER_Penalty هو أكثر من أداة سياسة. إنهما يميلان إلى العمل على سلوكيات الابتكار في الشركات بشكل مختلف. ومن الجدير بالذكر أنه يوجد فقط 47 شركة، أو تم فرض غرامات على عدد من الملاحظات خلال فترة العينة. وبالتالي، يتم استخدام CER_Penalty كآلية توضيحية لإظهار نية الحكومة.
CER_Incentive له تأثير تعديل إيجابي كبير (على سبيل المثال، معامل DID في العمود 4 من الجدول 8 (0.031) ذو دلالة عند مستوى 5%)، مما يدعم الفرضية 2b. ومع ذلك، فإنه غير قادر على التأثير بشكل كبير على الابتكار الأخضر للشركات بمفرده. يتماشى ذلك مع ما ذكره هوانغ وآخرون (2019)، إذا كان بإمكان HPE الوصول إلى الدعم الحكومي، فإنه يمكن أن يضع نفسه بشكل ملائم لتأمين ائتمان أخضر إضافي من البنوك. مع توفر التمويل الكافي، من المرجح أن يتم تقديم ابتكار أخضر عالي الجودة. في الوقت نفسه، لجذب التمويل الحكومي المستقبلي بشكل مستمر، بدلاً من الاعتماد على السعي لتحقيق مكاسب قصيرة الأجل، يتم تحفيز الشركات أيضًا للوفاء بمتطلبات الحكومة الصينية والمؤسسات المالية بأعلى جودة ممكنة. قد يعزز ذلك كفاءة ابتكارهم الأخضر. قد يكون هذا هو السبب في أن تأثير تعديل CER_Incentive أكثر أهمية في حالة جودة الابتكار الأخضر.
الجدول 6
تحليل التباين لهيكل حقوق الملكية.
المتغيرات SOE غير مملوك للدولة
(1) (2) (3) (4) (5) (6)
جي آي جي_كوا جي_إنك جي آي جي_كوا جي_إنك
هل 0.181** (2.96) 0.117* (2.00) 0.161 *** (5.20) 0.037* (1.88) -0.008 (-0.41) 0.074*** (5.26)
ثابت -2.337*** (-5.00) -2.142*** (-3.69) -1.055*** (-5.12) -3.027*** (-6.30) -2.658*** (-6.18) (-3.81)
متغيرات التحكم نعم نعم نعم نعم نعم نعم
شركة ف.إي. نعم نعم نعم نعم نعم نعم
صناعة F.E. نعم نعم نعم نعم نعم نعم
سنة م.ف. نعم نعم نعم نعم نعم نعم
المنطقة F.E. نعم نعم نعم نعم نعم نعم
ملاحظات 6674 6674 6674 7870 7870 7870
R-squared 0.734 0.710 0.684 0.630 0.598 0.586
ملاحظة: * و ** و *** تشير إلى الأهمية الإحصائية عند ، و المستويات، على التوالي. جميع الانحدارات مجمعة بشكل قوي حسب الصناعات. يتم تضمين إحصائيات t القوية بين قوسين. المصطلحات الكاملة للاختصارات الخاصة بالمتغيرات: GI: الابتكار الأخضر؛ GI_qua: جودة الابتكار الأخضر؛ GI_inc: زيادة الابتكار الأخضر؛ DID: الفرق في الفروق؛ SOE: المؤسسة المملوكة للدولة.
الجدول 7
تحليل التباين لاعتماد التمويل الخارجي.
المتغيرات عالي-إف دي منخفض-إف دي
(1) (2) (3) (4) (5) (6)
جي آي جي_كوا جي_إنك جي آي جي_كوا جي_إنك
فعل 0.127*** (3.76) 0.080** (2.86) 0.122*** (6.38) 0.111** (2.69) 0.049 (0.96) 0.114*** (8.04)
ثابت -2.808*** (-4.57) -2.317*** (-3.68) -1.817*** (-4.31) -3.026*** (-4.24) (-4.82) -2.121*** (-3.28)
متغيرات التحكم نعم نعم نعم نعم نعم نعم
شركة ف.إي. نعم نعم نعم نعم نعم نعم
صناعة F.E. نعم نعم نعم نعم نعم نعم
سنة م.ف. نعم نعم نعم نعم نعم نعم
المنطقة F.E. نعم نعم نعم نعم نعم نعم
ملاحظات ٤٧٤٨ ٤٧٤٨ ٤٧٤٨ 4723 4723 4723
R-squared 0.716 0.682 0.682 0.769 0.750 0.738
ملاحظة: * و ** و *** تشير إلى الدلالة الإحصائية عند ، و المستويات، على التوالي. جميع الانحدارات مجمعة بشكل قوي حسب الصناعات. يتم تضمين إحصائيات t القوية بين قوسين. المصطلحات الكاملة للاختصارات الخاصة بالمتغيرات: GI: الابتكار الأخضر؛ GI_qua: جودة الابتكار الأخضر؛ GI_inc: زيادة الابتكار الأخضر؛ DID: الفرق في الفروق؛ EFD: الاعتماد على التمويل الخارجي.
بدلاً من الابتكار الأخضر التدريجي الأبسط.
تأثير الاعتدال لـ VER إيجابي بشكل كبير لجميع أنواع تدابير الابتكار الأخضر (الأعمدة 7-9) (على سبيل المثال، معامل DID في العمود 7 من الجدول 8 (0.023) ذو دلالة إحصائية عند المستوى). وبالتالي، فإن الفرضية 3 مدعومة. لقد أدى نضوج الإفصاح عن المعلومات البيئية في السوق الصينية إلى تقليل عدم التماثل في المعلومات. تشير كثافة VER الأعلى إلى عزم الشركات عالية الأداء على الانتقال الأخضر ودافعها للمشاركة بشكل أكبر في أنشطة الابتكار الأخضر في الصين (هوانغ وتشين، 2015). علاوة على ذلك، فإن هذا التأثير الإيجابي أكثر وضوحًا بالنسبة لجودة الابتكار الأخضر مقارنة بالزيادة (الأعمدة 8-9). لتحقيق تحول أخضر أكثر شمولاً، تحاول الشركات عالية الأداء إنتاج ابتكار أخضر عالي الجودة (بو وآخرون، 2020). ومع ذلك، بسبب نقص التقنيات الخضراء الأساسية ورأس المال الأخضر، تستثمر الشركات عالية الأداء أيضًا جزءًا من مواردها المالية في زيادة الابتكار الأخضر لتلبية متطلبات الامتثال للمؤسسات المالية والحكومة.
وبالتالي، يمكن أن يعمل كل من CER_Incentive وVER على تعزيز العلاقة بين GFP وأداء الابتكار الأخضر بشكل إيجابي في معظم الحالات، مما يشير إلى استمرار تعزيز نظام تنظيم البيئة في الصين وقابلية تطبيق فرضية بورتر في السوق الصينية. ومع ذلك، فإن CER_Penalty يميل إلى أن يكون غير فعال. في الوقت نفسه، يتم تعزيز الابتكار في الجودة الخضراء بشكل أكبر بواسطة CER_Incentive وVER مقارنةً بالابتكار التدريجي، حيث تكون الشركات أكثر تحفيزًا لبناء مزايا تنافسية طويلة الأجل في انتقالها الأخضر. يتم توضيح هذه النتيجة بشكل أكبر من خلال رسومات تأثير التعديل في الملحق 5.

4.6. تحليل القنوات للاستثمارات الخضراء للشركات

تستكشف هذه الدراسة كيف يؤثر GFP على أداء الابتكار الأخضر في الشركات. بشكل محدد، تركز هذه الدراسة على كفاءة استخدام رأس المال الأخضر (GreenInv) في الشركات عالية الأداء (HPEs). تم جمع بيانات GreenInv يدويًا من ملاحظات ‘المشاريع قيد الإنشاء’ في التقرير السنوي للمؤسسات (Lu، 2021). بشكل محدد، تستخدم هذه الدراسة نموذج Word Embedding لبناء قاموس استثمار أخضر ثم تستخرج بيانات GreenInv بناءً على هذا القاموس. بعد تنظيف البيانات، يتم تجميع كمية العناصر المختلفة للاستثمار الأخضر لإنشاء متغير GreenInv. يتم الإبلاغ عن النتائج في الجدول 9.
تتمتع GFP و GreenInv بعلاقة غير مهمة، بينما ترتبط GreenInv والابتكار الأخضر بشكل كبير. وبالتالي، بينما لا تؤثر GFP على الاستثمار الأخضر الذي تقوم به الشركات الصغيرة والمتوسطة (العمود 1)، يمكن أن تعزز بشكل كبير أداء الابتكار الأخضر لديها (العمود 3). تم العثور على نتائج مماثلة لجودة الابتكار الأخضر وزيادته (العمودان 5 و 7). قد يكون ذلك لأن تنفيذ GFP قد يقيد تدفق رأس المال إلى الشركات الصغيرة والمتوسطة، مما قد يحفزها على تحسين كفاءة الابتكار لديها نظرًا للتمويل المحدود. قد تكون هذه هي الطريقة الوحيدة القابلة للتطبيق بالنسبة لهذه الشركات التي تعاني من نقص السيولة لتحويل نفسها نحو تطوير مستدام على المدى الطويل. وجد يان وآخرون (2022) نتائج مماثلة في دراستهم للتمويل الأخضر وكفاءة الاستثمار المؤسسي في السوق الصينية. وبالتالي، تفرض GFP التزامات امتثال إضافية وتزيد من الضغط الاجتماعي على الشركات الصغيرة والمتوسطة، مما يجبر هذه الشركات على زيادة مخرجاتها من الابتكار الأخضر. نظرًا لزيادة الوعي بحماية البيئة في الصين، فإن GFP أيضًا تلتقط
الجدول 8
تحليل تأثير الاعتدال.
المتغيرات (1) (2) (3) (4) (5) (6) (7) (8) (9)
جي آي جي_كوا جي_إنك جي آي جي_كوا جي_إنك جي آي جي_كوا جي_إنك
فعل 0.112*** (3.39) 0.067** (2.25) 0.110*** (5.57) 0.129* (2.06) 0.083 (1.43) 0.095*** (3.58) 0.085** (2.91) 0.038 (1.52) 0.101*** (5.31)
عقوبة_CER فعل 0.050 (0.25) 0.079 (0.89) 0.084 (0.40)
عقوبة_CER -0.121*** (-3.14) -0.193*** (-3.22) 0.018 (0.66)
تحفيز_CER فعل 0.031** (2.74) 0.022*** (9.87) 0.027* (2.12)
تحفيز_CER -0.001 (-0.36) -0.002 (-0.80) -0.001 (-0.41)
رؤية فعل 0.023*** (4.72) 0.026*** (8.86) 0.008** (2.19)
0.005 (1.28) -0.000 (-0.01) 0.005* (1.95)
ثابت -2.500*** (-6.01) -2.337*** (-5.66) -1.280*** (-4.23) -3.109*** (-8.75) -2.931*** (-10.21) -1.954*** (-13.31) -2.573*** (-6.16) -2.417*** (-5.87) -1.299*** (-4.33)
متغيرات التحكم نعم نعم نعم نعم نعم نعم نعم نعم نعم
شركة ف.إي. نعم نعم نعم نعم نعم نعم نعم نعم نعم
صناعة F.E. نعم نعم نعم نعم نعم نعم نعم نعم نعم
سنة م.ف. نعم نعم نعم نعم نعم نعم نعم نعم نعم
المنطقة F.E. نعم نعم نعم نعم نعم نعم نعم نعم نعم
ملاحظات 14,064 ١٤٠٦٤ 14,064 ٤٧٧٩ ٤٧٧٩ ٤٧٧٩ 14,064 14,064 14,064
R-squared 0.693 0.670 0.650 0.696 0.666 0.669 0.694 0.670 0.651
ملاحظة: * و ** و *** تشير إلى الدلالة الإحصائية عند ، و المستويات، على التوالي. جميع الانحدارات مجمعة بشكل قوي حسب الصناعات. يتم تضمين إحصائيات t القوية بين قوسين. المصطلحات الكاملة للاختصارات الخاصة بالمتغيرات: GI: الابتكار الأخضر؛ GI_qua: جودة الابتكار الأخضر؛ GI_inc: زيادة الابتكار الأخضر؛ DID: الفرق في الفروق؛ CER_Penalty: تنظيم بيئي قائم على العقوبات؛ CER_Incentive: تنظيم بيئي قائم على الحوافز؛ VER: تنظيم بيئي طوعي.
الجدول 9
تحليل قنوات الاستثمار الأخضر للشركات.
المتغيرات (1) (2) (3) (4) (5) (6) (7)
جرين إنف جي آي جي آي جي_كوا جي_كوا جي_إنك جي_إنك
جرين إنف 0.010*** (4.22) 0.005*** (3.59) 0.007** (2.78)
فعل 0.080 0.160*** 0.160*** 0.102*** 0.102*** 0.174*** 0.173***
ثابت -2.443 -1.063*** (-3.27) (-6.38) -1.154*** -0.312 -0.294
متغيرات التحكم نعم نعم نعم نعم نعم نعم نعم
شركة ف.إي. نعم نعم نعم نعم نعم نعم نعم
صناعة F.E. نعم نعم نعم نعم نعم نعم نعم
سنة م.ف. نعم نعم نعم نعم نعم نعم نعم
المنطقة F.E. نعم نعم نعم نعم نعم نعم نعم
ملاحظات 3045 3045 3045 3045 3045 3045 3045
R-squared 0.651 0.729 0.729 0.719 0.719 0.702 0.702
ملاحظة: * و ** و *** تشير إلى الدلالة الإحصائية عند ، و المستويات، على التوالي. جميع الانحدارات مجمعة بشكل قوي حسب الصناعات. يتم تضمين إحصائيات t القوية بين قوسين. المصطلحات الكاملة للاختصارات الخاصة بالمتغيرات: GI: الابتكار الأخضر؛ GI_qua: جودة الابتكار الأخضر؛ GI_inc: زيادة الابتكار الأخضر؛ DID: الفرق في الفروق؛ GreenInv: الاستثمار الأخضر.
القلق المجتمعي، مما يضغط على الشركات لتعزيز كفاءة الابتكار لديها لضمان رأس المال الأخضر في المستقبل أو لمنعها من التخلف.

4.7. تأثير GFP على الشركات الخضراء

نظرًا لأن برنامج الشهادات الخضراء يؤثر على كل من الشركات الملوثة بشدة والشركات الخضراء في الوقت نفسه، يتم إجراء دراسة مقارنة هنا لاختبار قوة النتائج. وفقًا لـ Al-Tuwaijri وآخرين (2004) و Wang وآخرين (2020)، تشير الشركات الخضراء إلى الشركات التي تتعلق أعمالها الرئيسية بمنتجات صديقة للبيئة. استنادًا إلى التقارير السنوية وتصنيف الصناعة للشركات المدرجة التي وضعتها Tonghuashun Finance and Economic، تقوم هذه الدراسة بتحليل يدوي للأعمال الرئيسية لكل شركة لتحديد ما إذا كان يمكن تصنيفها كشركة خضراء. علاوة على ذلك، هذه الدراسة تتحقق من نتائج الاختيار
للمؤسسات الخضراء مع هيكسون، واحدة من أشهر المنصات المالية والاقتصادية، لضمان دقة النتائج. ثم نستبدل المجموعة المعالجة بالمؤسسات الخضراء. على وجه التحديد، Treat هو متغير وهمي يساوي واحدًا إذا كانت الشركة مؤسسة خضراء. Post هو متغير وهمي آخر يساوي واحدًا إذا تم تنفيذ GFP، أو إذا كانت العينات ضمن فترة 2012-2019. التفاعل Treat يجب أن يكون النشر (DID) ذا دلالة إذا كان تأثير DID موجودًا (وانغ ولي، 2022). يتم الإبلاغ عن النتائج في الجدول 10.
مماثل لـ HPEs، يمكن أن يعزز GFP بشكل كبير الابتكار الأخضر بين الشركات الخضراء (العمود 1). للحفاظ على تنافسية السوق، تواجه الشركات الخضراء أيضًا ضغوطًا لتعزيز قدرتها على الابتكار لتقديم منتجات وخدمات خضراء أفضل (شو ولي، 2020). علاوة على ذلك، يعزز GFP جودة الابتكار الأخضر وزيادة الشركات الخضراء (الأعمدة 2-7). ومن الجدير بالذكر أن تأثير GFP الترويجي على جودة الابتكار الأخضر أكبر بالنسبة للشركات الخضراء مقارنةً بالشركات ذات الأداء العالي. هذا متوقع حيث تميل الشركات الخضراء إلى أن تكون لديها قاعدة أفضل في الابتكار الأخضر. لذلك، من المرجح أن يركزوا أكثر على الابتكار الأخضر عالي الجودة لبناء مزاياهم التنافسية على المدى الطويل في السوق الصينية.
تطبق هذه الدراسة اختبارات مماثلة لالتقاط تأثير هيكل الملكية، والاعتماد على التمويل الخارجي، وتأثير تنظيمات الحكومة بين الشركات الخضراء. النتائج متاحة عند الطلب. بشكل عام، تبقى الاستنتاجات بالنسبة للشركات ذات الأداء العالي صحيحة. يتمتع صندوق التمويل الأخضر بتأثير أكبر على الابتكار الأخضر بين الشركات المملوكة للدولة، خاصة فيما يتعلق بأداء جودة الابتكار الأخضر. ومع ذلك، ليس لصندوق التمويل الأخضر أي تأثير على الشركات الخضراء غير المملوكة للدولة. هذه النتيجة تختلف عن تلك الخاصة بالشركات ذات الأداء العالي غير المملوكة للدولة. توصل هو وآخرون (2021ب) إلى استنتاجات مماثلة. على عكس الشركات ذات الأداء العالي، فإن الشركات الخضراء ليست مضغوطة مالياً إلى هذا الحد. علاوة على ذلك، فإن الشركات الخضراء غير المملوكة للدولة ليست متأثرة بشكل كبير بسياسات الحكومة، بل من المرجح أن تتبع وتيرتها الخاصة في التنمية الخضراء. بالإضافة إلى ذلك، فإن الشركات الخضراء التي تعتمد بشكل كبير على التمويل الخارجي تكون أكثر استعداداً لتحسين أداء الابتكار الأخضر لتأمين التمويل المستقبلي، في حين أن تلك التي لديها اعتماد منخفض على التمويل الخارجي تميل إلى عدم الاكتراث كثيراً بمخرجات الابتكار الأخضر المستمر. هذا يتماشى مع سون وآخرون (2019). مقارنةً بالشركات ذات الأداء العالي، تميل الشركات الخضراء إلى أن تكون لديها بالفعل مستوى جيد من الابتكار الأخضر. لذلك، قد لا تواجه صعوبات كبيرة في الوصول إلى التمويل مباشرة من البنوك والمؤسسات المالية الأخرى (بينغ وآخرون، 2022).
فيما يتعلق بتأثير تنظيمات البيئة الأخرى، لا يزال CER_Penalty يفشل في تعزيز تأثير GFP على الابتكار الأخضر للمؤسسات الخضراء. وهذا ليس مفاجئًا حيث تميل المؤسسات الخضراء إلى تحقيق أداء بيئي أفضل وارتكاب انتهاكات بيئية أقل مقارنةً بالمؤسسات عالية الأداء في السوق الصينية. فيما يتعلق بـ CER_Incentive، فإن التأثير المعتدل الكبير موجود فقط في حالة أداء جودة الابتكار الأخضر. نظرًا لأن الشركات الخضراء تميل إلى امتلاك قدرات أقوى في الابتكار الأخضر، قد يشجع الدعم المالي الإضافي من الحكومة الصينية هذه الشركات على السعي نحو ابتكار أكثر تقدمًا، مما يدفع نحو ترقية الهيكل الصناعي بشكل عام. أخيرًا، فإن VER يعزز فقط العلاقة الإيجابية بين GFP و GI أو GI-qua بشكل ملحوظ. هذا يتماشى مع النتائج السابقة. الالتزام بـ VER غالبًا ما يتطلب تخصيصًا كبيرًا من الموارد، بما في ذلك الوقت والمال. وبالتالي، قد تختار الشركات الخضراء توجيه هذه الموارد نحو الابتكار الأخضر المتقدم بدلاً من توزيعها عبر مشاريع متعددة (هوانغ وتشين، 2015).
أخيرًا، تتوافق نتائج تحليل القنوات للمؤسسات الخضراء مع تلك الخاصة بالمؤسسات عالية الأداء. بشكل عام، تلعب منصة التمويل الأخضر دورًا أكثر نشاطًا في تحفيز كفاءة الابتكار الأخضر بين المؤسسات الخضراء المدرجة في الصين (شو ولي، 2020).

5. الخاتمة وآثار السياسات

5.1. الخاتمة

أفاد خطة الصين الخمسية الثانية عشرة (2011-2015) للمرة الأولى أن البلاد تواجه تدهورًا بيئيًا شديدًا، مما يظهر اهتمام الحكومة بالنظر في هذه القضايا. في الواقع، تم إطلاق مبادرات سياسية متنوعة، بما في ذلك GFP، لإعادة توازن الاقتصاد من أجل حماية البيئة والتنمية المستدامة. يمكن اعتبار GFP أداة تنظيمية بيئية قيمة قائمة على السوق مصممة للتخفيف من التلوث البيئي وتوفير المزيد من التمويل للأنشطة الخضراء (Lu et al.، 2022). تبحث هذه الدراسة بشكل تجريبي في تأثير GFP على الابتكار الأخضر باستخدام بيانات بانل عن الشركات الصينية المدرجة من 2007 إلى 2019. يتم استخدام نموذج DID للاختبار الأساسي، ثم يتم إجراء سلسلة من الاختبارات، مثل تحليل الاتجاه المتوازي و PSM-DID، لضمان قوة النتائج. بعد ذلك، تستكشف هذه الدراسة التأثيرات غير المتجانسة لعوامل مختلفة، بما في ذلك أنواع الابتكار الأخضر (ابتكار الجودة الخضراء والابتكار الأخضر التدريجي)، وهيكل ملكية الشركات (الشركات المملوكة للدولة وغير المملوكة للدولة)، ودرجة الاعتماد على التمويل الخارجي.
بشكل عام، تظهر النتائج أن GFP يمكن أن يعزز أداء الابتكار الأخضر لكل من الصناعات الملوثة بشدة (على سبيل المثال، معامل DID في العمود 4 من الجدول 3 (0.123) له دلالة إحصائية عند المستوى) والشركات الخضراء (على سبيل المثال، معامل DID في العمود 1 من الجدول 10 (0.104) ذو دلالة عند مستوى). بالمقارنة مع الشركات الخضراء، تميل الملوثات الثقيلة إلى إيلاء المزيد من الاهتمام لزيادة الابتكار الأخضر بسبب خبراتها المحدودة في الابتكار الأخضر والموارد المالية (GI_qua: 0.069، دالة عند المستوى و GI_inc: 0.124، ذو دلالة عند في الجدول 5). الابتكار الأخضر التدريجي أسهل وأكثر قابلية للتطبيق بالنسبة لهم لتلبية متطلبات الحكومة التنظيمية مع تحقيق درجة معينة من التحول الأخضر. في الوقت نفسه، مقارنةً بالمؤسسات عالية الأداء، وبفضل دعم برنامج الابتكار الأخضر، تتمتع الشركات الخضراء بقدرة أقوى على تقديم ابتكار جودة خضراء، وقد يساعدها ذلك في بناء مزايا تنافسية طويلة الأمد. كما أن الشركات المملوكة للدولة مدفوعة بشكل أفضل من قبل برنامج الابتكار الأخضر لتقديم ابتكار أخضر عالي الجودة، نظرًا لعلاقتها الأقرب مع الحكومة. مقارنةً بالشركات غير المملوكة للدولة، تميل الشركات المملوكة للدولة إلى أن تكون مفضلة من قبل الائتمان المصرفي ولكنها أيضًا تحت ضغط أكبر لتلبية متطلبات خفض الانبعاثات التي تفرضها الدولة (وانغ وآخرون، 2022أ). أخيرًا، من المرجح أن تتأثر الشركات التي تحتاج إلى مزيد من الدعم المالي الخارجي ببرنامج الابتكار الأخضر حيث يتم إجبارها على تقديم أداء متفوق لتلبية شروط الاقتراض.
نظرًا للصلة الوثيقة بين اللوائح البيئية الأخرى، وGFP، وابتكار الشركات، فإن هذه الدراسة تحقق أيضًا في تأثيرات التعديل لأنواع مختلفة من اللوائح البيئية، بما في ذلك CERs وVERs. لا يوجد تأثير تعديل كبير للتنظيم القائم على العقوبات، CER_Penalty، بينما يمكن أن يعزز التنظيم القائم على الحوافز (CER_Incentive) العلاقة بين GFP والابتكار الأخضر للشركات عالية الأداء بشكل كبير (على سبيل المثال، معامل DID في العمود 4 من الجدول 8 (0.031) ذو دلالة إحصائية عند مستوى). يتم التوصل إلى استنتاج مشابه أيضًا بالنسبة لـ VER (على سبيل المثال، معامل DID في العمود 7 من الجدول 8 (0.023) ذو دلالة إحصائية عند علاوة على ذلك، فإن تأثيرات التحفيز CER وVER تكون أكثر أهمية في تعزيز الابتكار الأخضر عالي الجودة، خاصة بالنسبة للمؤسسات الخضراء. تشير كثافة VER الأعلى إلى عزم الشركات على الانتقال الأخضر، مما يدل على دافعها للمشاركة بشكل أكبر في أنشطة الابتكار الأخضر عالي الجودة (هوانغ وتشين، 2015). أخيرًا، تُظهر تحليل القنوات أن GFP يمكن أن يعزز أداء الابتكار الأخضر من خلال تحسين كفاءة استخدام الاستثمارات الخضراء.

5.2. الآثار السياسية

أولاً، يمكن تنفيذ برامج التمويل الأخضر المستهدفة بشكل أكبر لتشجيع البنوك على تقديم قروض أكبر للمؤسسات عالية الأداء من أجل زيادة الابتكار الأخضر. يمكن أن يساعد ذلك في تسريع التحول الصناعي العام. بعد ذلك، مدفوعين ببرامج التمويل الأخضر، على الرغم من أن المؤسسات عالية الأداء مستعدة للابتكار، إلا أنها تميل إلى التركيز أكثر على
الجدول 10
المتغيرات (1) (2) (3) (4) (5) (6) (7)
جي آي جي_كوا جي_إنك جي_كوا_إند GI_inc_ind جي_كوا_جوي جي_إنك_جوي
هل 0.104*** 0.098*** 0.107*** 0.045* 0.040** 0.077*** 0.080***
(3.25) (4.19) (4.84) (1.81) (2.43) (13.60) (5.09)
ثابت -2.626*** -2.247*** -1.529** -1.863*** -1.198** -0.782* -0.579*
(-٤.٤٧) (-4.45) (-2.74) (-4.31) (-2.77) (-2.12) (-2.03)
متغيرات التحكم نعم نعم نعم نعم نعم نعم نعم
شركة ف.إي. نعم نعم نعم نعم نعم نعم نعم
صناعة F.E. نعم نعم نعم نعم نعم نعم نعم
سنة م.ف. نعم نعم نعم نعم نعم نعم نعم
المنطقة F.E. نعم نعم نعم نعم نعم نعم نعم
ملاحظات ١٣٤٩٦ ١٣٤٩٦ ١٣٤٩٦ ١٣٤٩٦ ١٣,٤٩٦ ١٣٤٩٦ ١٣٤٩٦
R-squared 0.698 0.672 0.648 0.654 0.637 0.481 0.480
ملاحظة: * و ** و *** تشير إلى الأهمية الإحصائية عند ، و المستويات، على التوالي. جميع الانحدارات مجمعة بشكل قوي حسب الصناعات. يتم تضمين إحصائيات t القوية بين قوسين. المصطلحات الكاملة للاختصارات الخاصة بالمتغيرات: GI: الابتكار الأخضر؛ GI_qua: جودة الابتكار الأخضر؛ GI_inc: زيادة الابتكار الأخضر؛ GI_qua_ind: جودة الابتكار الأخضر المستقل؛ GI_inc_ind: زيادة الابتكار الأخضر المستقل؛ GI_qua_joi: جودة الابتكار الأخضر المشترك؛ GI_inc_joi: زيادة الابتكار الأخضر المشترك؛ DID: الفرق في الفروق.
الجدول 11
وصف المتغيرات.
نوع متغير مختصر اسم المتغير تعريفات المتغيرات مصدر البيانات
المتغير التابع جي آي الابتكار الأخضر اللوغاريتم الطبيعي لمجموع 1 وعدد طلبات براءات الاختراع الخضراء. CNRDS
جي_إنك زيادة الابتكار الأخضر اللوغاريتم الطبيعي لمجموع 1 وعدد طلبات براءات الاختراع الخضراء. CNRDS
GI_inc_ind زيادة الابتكار الأخضر المستقل اللوغاريتم الطبيعي لمجموع 1 وعدد طلبات براءات الاختراع الخضراء المستقلة. CNRDS
جي_إنك_جوي زيادة الابتكار الأخضر المشترك اللوغاريتم الطبيعي لمجموع 1 وعدد طلبات براءات الاختراع الخضراء المشتركة. CNRDS
جي_كوا جودة الابتكار الأخضر اللوغاريتم الطبيعي لمجموع 1 وعدد طلبات براءات الاختراع للاختراعات الخضراء. CNRDS
جي_كوا_إند جودة الابتكار الأخضر المستقل اللوغاريتم الطبيعي لمجموع 1 وعدد طلبات براءات الاختراع الخضراء المستقلة. CNRDS
جي_كوا_جوي جودة الابتكار الأخضر المشترك اللوغاريتم الطبيعي لمجموع 1 وعدد طلبات براءات الاختراع المشتركة للاختراعات الخضراء. CNRDS
المتغير المستقل متغيرات التعديل هل حد التفاعل للعلاج منشور اعتبر المعاملة تساوي 1 لـ HPEs، و0 بخلاف ذلك؛ واعتبر ما بعد يساوي 1 للفترة من 2012-2019، و0 للفترة من 2007-2011. مسودة
غرامة_CER تنظيم بيئي قائم على العقوبات يتم تمثيله من خلال ما إذا كانت الشركة قد تعرضت لانتهاك بيئي تم الإشارة إليه في السنة. CNRDS
تحفيز_CER تنظيم بيئي قائم على الحوافز اللوغاريتم الطبيعي لمجموع قيمة العناصر المدعومة باللون الأخضر التي تلقتها شركة في سنة. CSMAR
فير التنظيم البيئي الطوعي تكشف معلومات انبعاثات ستة ملوثات، وتتراوح من 0 إلى 6. CSMAR
متغير الوساطة جرين إنف الاستثمار الأخضر اللوغاريتم الطبيعي لمجموع مقدار الاستثمار الأخضر لشركة في سنة. CSMAR
متغيرات التحكم العائد على الأصول الربحية نسبة صافي الأرباح إلى إجمالي الأصول. CSMAR
حجم حجم الشركة اللوغاريتم الطبيعي لإجمالي أصول الشركة. CSMAR
الرافعة الرافعة نسبة الالتزامات إلى إجمالي الأصول. CSMAR
عمر سنوات الإدراج اللوغاريتم الطبيعي لعدد السنوات التي تم فيها إدراج الشركة زائد واحد. CSMAR
INST نسبة ملكية المستثمرين المؤسسيين نسبة الأسهم التي تحتفظ بها المستثمرون المؤسسيون. CSMAR
إندين نسبة المديرين المستقلين عدد المديرين المستقلين/عدد المديرين. CSMAR
المسؤولية الاجتماعية للشركات المسؤولية الاجتماعية للشركات متغير وهمي يساوي 1 إذا كانت الشركات تكشف عن تقارير المسؤولية الاجتماعية الخاصة بها، و0 خلاف ذلك. تقارير المسؤولية الاجتماعية
الابتكار التدريجي بسبب نقص الخبرة والموارد. لذلك، يجب أن تشجع جهود السياسات على تبادل المعلومات/المعرفة بين الشركات في نفس الصناعة. يمكن أن يساعد ذلك في تحسين كفاءة استخدام الموارد. في الوقت نفسه، يجب تصميم مقاييس أداء فعالة لتقييم الأداء البيئي الطويل الأجل للشركات الصغيرة والمتوسطة. قد يشجع ذلك إدارتها على تخصيص موارد مالية قيمة نحو ابتكار أخضر عالي الجودة، والذي يتطلب المزيد من الاستثمارات ودورة تطوير أطول. أخيرًا، يجب على الحكومة الصينية استخدام أدوات سياسة بيئية مختلفة للاستفادة من آثارها التآزرية بشكل فعال. يجب أن تتعرض الشركات للضغط والتحفيز للمشاركة بشكل أكبر في الابتكار الأخضر عالي الجودة. يتطلب ذلك تحسينًا إضافيًا للتمويل الأخضر الحالي.
كنظام. بصفتها لاعبًا رئيسيًا، تحتاج البنوك إلى اتخاذ دور أكثر نشاطًا في هذه العملية. يجب عليها وضع إجراءات شاملة لتشجيع الابتكار الأخضر الواعد في مرحلة مبكرة. يجب على البنوك أيضًا توفير إشراف كافٍ طوال العملية لتشجيع الشركات، وخاصة الملوثين الكبار، على المشاركة في المزيد من الابتكار الأخضر والسلوكيات المسؤولة اجتماعيًا.

5.3. القيود واتجاهات البحث المستقبلية

تظهر الدراسة أن تنفيذ التمويل الأخضر يعزز بشكل فعال أداء الابتكار الأخضر للشركات. ومع ذلك، من الضروري تسليط الضوء على أن هدفًا مهمًا من أهداف كل من التمويل الأخضر
السياسات والابتكار الأخضر هو تقليل الشركات لـ الانبعاثات. إن التحقيق في هذه القضية له قيمة بحثية كبيرة حيث يمكن استخدام الرؤى المستخلصة للتحقق مما إذا كانت الشركات ملتزمة حقًا بالتحول الأخضر، مما يخفف من مخاوف الغسل الأخضر المحتملة. ومع ذلك، بسبب توفر البيانات (التقارير المتقطعة وغير الموحدة)، فإن البحث الحالي غير قادر على الحصول على معلومات كافية على مستوى الشركات. بيانات الانبعاثات في السوق الصينية من أجل تحليل أعمق على مستوى الشركات. مع التطور الإضافي لنظام الإبلاغ عن المعلومات وإطار التحكم التنظيمي، يمكن إجراء دراسات إضافية لاستكشاف العلاقة بين سياسات التمويل الأخضر، وتقليل انبعاثات الشركات، واستراتيجيات الابتكار الأخضر. يمكن استخدام النتائج التي تم الحصول عليها لتعميق الإصلاح الأخضر في الصين وتقديم إرشادات قيمة للاقتصادات النامية الأخرى في عملية انتقالها الأخضر.
التحليل الرسمي، التصور. دان لو: الكتابة – المراجعة والتحرير، المنهجية، التحليل الرسمي، التصور. يي زهي دونغ: الكتابة – المراجعة والتحرير، الموارد. تشو شيونغ: البرمجيات، الموارد.

إعلان عن تضارب المصالح

يرغب الدكتور دان لو في الإقرار بالتقرير المالي المقدم من المؤسسة الوطنية للعلوم الطبيعية في الصين (71972010).
يعلن المؤلفون المتبقون أنهم ليس لديهم أي تضارب في المصالح للإفصاح عنه.

توفر البيانات

ستكون البيانات متاحة عند الطلب.

بيان مساهمة مؤلفي CRediT

كايوان تشانغ: الكتابة – المسودة الأصلية، البرمجيات، المنهجية،

الملحق

الملحق 1
نتائج الانحدار لـ CER_Incentive1
المتغيرات HPEs المؤسسات الخضراء
(1) (2) (3) (4) (5) (6)
جي آي جي_كوا جي_إنك جي آي جي_كوا جي_إنك
فعل
0.084**
(2.71)
0.033
(1.34)
0.100***
(4.40)
0.065*
(1.90)
0.061**
(2.67)
0.083***
(3.24)
CER_حافز1 فعل
0.045***
(4.72)
0.047***
(9.45)
0.032***
(7.94)
0.067***
(3.56)
0.060***
(6.27)
0.048**
(2.70)
CER_حافز1
0.019***
(5.86)
0.013***
(4.81)
0.016***
(5.46)
0.017***
(4.27)
0.013***
(3.76)
0.012***
(4.35)
ثابت
-2.679***
(-6.71)
-2.487***
(-6.52)
-1.366***
(-4.63)
-2.656***
(-4.56)
-2.292***
(-٤.٤٦)
-1.547**
(-2.72)
متغيرات التحكم نعم نعم نعم نعم نعم نعم
شركة ف.إي. نعم نعم نعم نعم نعم نعم
صناعة F.E. نعم نعم نعم نعم نعم نعم
سنة م.ف. نعم نعم نعم نعم نعم نعم
المنطقة F.E. نعم نعم نعم نعم نعم نعم
ملاحظات ١٤١٦٩ ١٤١٦٩ ١٤١٦٩ ١٢,٨٩٣ 12,893 12,893
R-squared 0.681 0.655 0.637 0.700 0.674 0.650
ملاحظة: * و ** و *** تشير إلى الأهمية الإحصائية عند ، و المستويات، على التوالي. جميع الانحدارات مجمعة بشكل قوي حسب الصناعات. يتم تضمين إحصائيات t القوية بين قوسين. المصطلحات الكاملة للاختصارات الخاصة بالمتغيرات: GI: الابتكار الأخضر؛ GI_qua: جودة الابتكار الأخضر؛ GI_inc: زيادة الابتكار الأخضر؛ DID: الفرق في الفروق؛ CER_Incentive1: دعم حكومي؛ HPEs: الشركات الملوثة بشدة.
الأعمدة 1-3 و4-6 للمؤسسات عالية الأداء والمشاريع الخضراء، على التوالي.
الملحق 2
مقارنة أداء الابتكار الأخضر للمؤسسات عالية الأداء والمشاريع الخضراء
متغير ملاحظات معنى الانحراف المعياري من ماكس
HPEs
جي آي ٣٣١٦ 0.544 0.899 0.000 ٣.٨٢٩
جي_كوا ٣٣١٦ 0.343 0.٦٩٩ 0.000 ٣.٣٦٧
جي_إنك ٣٣١٦ 0.364 0.٦٩٩ 0.000 ٣.٠٤٥
المؤسسات الخضراء
جي آي ٢٠٢٦ 0.822 1.127 0.000 ٣.٨٢٩
جي_كوا ٢٠٢٦ 0.565 0.913 0.000 ٣.٣٦٧
جي_إنك ٢٠٢٦ 0.548 0.851 0.000 ٣.٠٤٥
الملحق 3
اختصارات
اختصار الاسم الكامل
عمر سنوات الإدراج
شهادة المطابقة تنظيم البيئة القائم على الأوامر والسيطرة
تحفيز_CER تنظيم بيئي قائم على الحوافز
CER_حافز1 دعم حكومي
عقوبة_CER تنظيم بيئي قائم على العقوبات
CNRDS خدمات بيانات البحث الصينية
CSMAR سوق الأسهم الصينية وبحوث المحاسبة
المسؤولية الاجتماعية للشركات المسؤولية الاجتماعية للشركات
فعل فرق في الفروق
إي إف دي اعتماد التمويل الخارجي
HPEs المؤسسات الملوثة بشدة
إندين نسبة المديرين المستقلين
INST نسبة ملكية المستثمرين المؤسسيين
جي سي جي إرشادات الائتمان الأخضر 2012
بروتين الفلورسنت الأخضر سياسة التمويل الأخضر
جي آي الابتكار الأخضر
جي_إنك زيادة الابتكار الأخضر
GI_inc_ind زيادة الابتكار الأخضر المستقل
جي_إنك_جوي زيادة الابتكار الأخضر المشترك
جي_كوا جودة الابتكار الأخضر
جي_كوا_إند جودة الابتكار الأخضر المستقل
جي_كوا_جوي جودة الابتكار الأخضر المشترك
جرين إنف الاستثمار الأخضر
الرافعة الرافعة
مير التنظيم البيئي القائم على السوق
PH فرضية بورتر
منشور تنفيذ السياسة
العائد على الأصول الربحية
حجم حجم الشركة
الشركات المملوكة للدولة المؤسسات المملوكة للدولة
علاج المجموعة المعالجة
فير التنظيم البيئي الطوعي

الملحق 4 اختبارات الدواء الوهمي

الملحق 5 رسم تأثير التعديل
رسم تأثير الاعتدال لـ CER_Penalty

رسم تأثير الاعتدال لـ VER

References

Aldieri, L., Kotsemir, M., Vinci, C.P., 2020. The role of environmental innovation through the technological proximity in the implementation of the sustainable development. Bus. Strat. Environ. 29, 493-502. https://doi.org/10.1002/bse.2382.
Al-Tuwaijri, S.A., Christensen, T.E., Hughes Ii, K.E., 2004. The relations among environmental disclosure, environmental performance, and economic performance: a simultaneous equations approach. Account. Org. Soc. 29, 447-471. https://doi. org/10.1016/S0361-3682(03)00032-1.
Awada, M., Mestre, R., 2023. Revisiting the Energy-Growth nexus with debt channel. A wavelet time-frequency analysis for a panel of Eurozone-OECD countries. Data Sci. Financ. Econ. 3, 1-19. https://doi.org/10.3934/DSFE. 2023008.
Bai, Y., Song, S., Jiao, J., Yang, R., 2019. The impacts of government R&D subsidies on green innovation: evidence from Chinese energy-intensive firms. J. Clean. Prod. 233, 819-829. https://doi.org/10.1016/j.jclepro.2019.06.107.
Baker, E.D., Boulton, T.J., Braga-Alves, M.V., Morey, M.R., 2021. ESG government risk and international IPO underpricing. J. Corp. Finance 67, 1-22. https://doi.org/ 10.1016/j.jcorpfin.2021.101913.
Balsalobre-Lorente, D., Shahbaz, M., Roubaud, D., Farhani, S., 2018. How economic growth, renewable electricity and natural resources contribute to emissions. Energy Pol. 113, 356-367. https://doi.org/10.1016/j.enpol.2017.10.050.
Berrone, P., Fosfuri, A., Gelabert, L., Gomez-Mejia, L.R., 2013. Necessity as the mother of ‘green’inventions: institutional pressures and environmental innovations. Strat. Manag. J. 34, 891-909. https://doi.org/10.1002/smj.2041.
Bu, M., Qiao, Z., Liu, B., 2020. Voluntary environmental regulation and firm innovation in China. Econ. Modell. 89, 10-18. https://doi.org/10.1016/j. econmod.2019.12.020.
Carrión-Flores, C.E., Innes, R., Sam, A.G., 2013. Do voluntary pollution reduction programs (VPRs) spur or deter environmental innovation? Evidence from 33/50. J. Environ. Econ. Manag. 66, 444-459. https://doi.org/10.1016/j. jeem.2013.05.002.
Chang, K.W., Liu, L.L., Luo, D., Xing, K., 2023. The impact of green technology innovation on carbon dioxide emissions: the role of local environmental regulations. J. Environ. Manag. 340, 1-15. https://doi.org/10.1016/j.jenvman.2023.117990.
Cheng, C., Ren, X., Dong, K., Dong, X., Wang, Z., 2021. How does technological innovation mitigate CO2 emissions in OECD countries? Heterogeneous analysis using panel quantile regression. J. Environ. Manag. 280, 1-11. https://doi.org/ 10.1016/j.jenvman.2020.111818.
Chen, X.H., Tee, K., Elnahass, M., Ahmed, R., 2023. Assessing the environmental impacts of renewable energy sources: a case study on air pollution and carbon emissions in China. J. Environ. Manag. 345, 1-13. https://doi.org/10.1016/j. jenvman.2023.118525.
Chen, Y.S., Lai, S.B., Wen, C.T., 2006. The influence of green innovation performance on corporate advantage in Taiwan. J. Bus. Ethics 67, 331-339. https://doi.org/ 10.1007/s10551-006-9025-5.
Correia, S., 2015. Singletons, cluster-robust standard errors and fixed effects: a bad mix. Technical Note. Duke University, pp. 1-7. http://scorreia.com/research/singletons. pdf.
Cui, X., Wang, P., Sensoy, A., Nguyen, D.K., Pan, Y., 2022. Green credit policy and corporate productivity: evidence from a quasi-natural experiment in China. Technol. Forecast. Soc. Change 177, 1-19. https://doi.org/10.1016/j.techfore.2022.121516.
Dong, K., Zhao, J., Ren, X., Shi, Y., 2023. Environmental regulation, human capital, and pollutant emissions: the case of SO2 emissions for China. J. Chin. Econ. Bus. Stud. 21, 111-135. https://doi.org/10.1080/14765284.2022.2106539.
Fabrizi, A., Guarini, G., Meliciani, V., 2018. Green patents, regulatory policies and research network policies. Res. Pol. 47, 1018-1031. https://doi.org/10.1016/j. respol.2018.03.005.
Fan, J.L., Ding, Z., Li, K., Wang, Q., Zhang, X., 2023. Research on carbon neutrality from the past to the future: a bibliometric analysis. J. Chin. Econ. Bus. Stud. 21, 27-48. https://doi.org/10.1080/14765284.2022.2116203.
Farooq, U., Ahmed, J., Tabash, M.I., Anagreh, S., Subhani, B.H., 2021. Nexus between government green environmental concerns and corporate real investment: empirical evidence from selected Asian economies. J. Clean. Prod. 314, 1-9. https://doi.org/ 10.1016/j.jclepro.2021.128089.
Francey, R.J., Trudinger, C.M., Van Der Schoot, M., Law, R.M., Krummel, P.B., Langenfelds, R.L., Paul Steele, L., Allison, C.E., Stavert, A.R., Andres, R.J., Rödenbeck, C., 2013. Atmospheric verification of anthropogenic CO2 emission trends. Nat. Clim. Change 3, 520-524. https://www.nature.com/articles/nclimat e1817.
Ganda, F., 2019. The impact of innovation and technology investments on carbon emissions in selected organisation for economic Co-operation and development countries. J. Clean. Prod. 217, 469-483. https://doi.org/10.1016/j. jclepro.2019.01.235.
Gupta, H., Barua, M.K., 2018. A framework to overcome barriers to green innovation in SMEs using BWM and Fuzzy TOPSIS. Sci. Total Environ. 633, 122-139. https://doi. org/10.1016/j.scitotenv.2018.03.173.
Hamamoto, M., 2006. Environmental regulation and the productivity of Japanese manufacturing industries. Resour. Energy Econ. 28, 299-312. https://doi.org/ 10.1016/j.reseneeco.2005.11.001.
Horbach, J., Rammer, C., Rennings, K., 2012. Determinants of eco-innovations by type of environmental impact-the role of regulatory push/pull, technology push and market pull. Ecol. Econ. 78, 112-122. https://doi.org/10.1016/j. ecolecon.2012.04.005.
Hotte, L., Winer, S.L., 2012. Environmental regulation and trade openness in the presence of private mitigation. J. Dev. Econ. 97, 46-57. https://doi.org/10.1016/j. jdeveco.2011.01.004.
Huang, J.W., Li, Y.H., 2017. Green innovation and performance: the view of organizational capability and social reciprocity. J. Bus. Ethics 145, 309-324. https:// doi.org/10.1007/s10551-015-2903-y.
Huang, R., Chen, D., 2015. Does environmental information disclosure benefit waste discharge reduction? Evidence from China. J. Bus. Ethics 129, 535-552. https:// www.jstor.org/stable/24702958.
Huang, Z., Liao, G., Li, Z., 2019. Loaning scale and government subsidy for promoting green innovation. Technol. Forecast. Soc. Change 144, 148-156. https://doi.org/ 10.1016/j.techfore.2019.04.023.
Hu, C., Mao, J., Tian, M., Wei, Y., Guo, L., Wang, Z., 2021a. Distance matters: investigating how geographic proximity to ENGOs triggers green innovation of heavy-polluting firms in China. J. Environ. Manag. 279, 1-13. https://doi.org/ 10.1016/j.jenvman.2020.111542.
Hu, G., Wang, X., Wang, Y., 2021b. Can the green credit policy stimulate green innovation in heavily polluting enterprises? Evidence from a quasi-natural experiment in China. Energy Econ. 98, 1-13. https://doi.org/10.1016/j. eneco.2021.105134.
Hu, J., Pan, X., Huang, Q., 2020. Quantity or quality? The impacts of environmental regulation on firms’ innovation-Quasi-natural experiment based on China’s carbon emissions trading pilot. Technol. Forecast. Soc. Change 158, 1-12. https://doi.org/ 10.1016/j.techfore.2020.120122.
Jaffe, A.B., Palmer, K., 1997. Environmental regulation and innovation: a panel data study. Rev. Econ. Stat. 79, 610-619. https://doi.org/10.1162/003465397557196.
Jiang, Z., Wang, Z., Zeng, Y., 2020. Can voluntary environmental regulation promote corporate technological innovation? Bus. Strat. Environ. 29, 390-406. https://doi. org/10.1002/bse.2372.
Joshi, S., Krishnan, R., Lave, L., 2001. Estimating the hidden costs of environmental regulation. Account. Rev. 76, 171-198. https://doi.org/10.2308/ accr.2001.76.2.171.
Kesidou, E., Demirel, P., 2012. On the drivers of eco-innovations: empirical evidence from the UK. Res. Pol. 41, 862-870. https://doi.org/10.1016/j.respol.2012.01.005.
Li, K., Mai, F., Shen, R., Yan, X., 2021. Measuring corporate culture using machine learning. Rev. Financ. Stud. 34, 3265-3315. https://doi.org/10.1093/rfs/hhaa079.
Lin, B., Xie, J., 2023. Does environmental regulation promote industrial structure optimization in China? A perspective of technical and capital barriers. Environ. Impact Assess. Rev. 98, 1-14. https://doi.org/10.1016/j.eiar.2022.106971.
Lin, B., Xu, C., 2023. The effects of capital-biased tax incentives on firm energy intensity: environmental dividend or consequence? J. Environ. Manag. 345, 1-12. https://doi. org/10.1016/j.jenvman.2023.118507.
Liu, G., Yi, H., Liang, H., 2023. Measuring provincial digital finance development efficiency based on stochastic frontier model. Quan. Finance Econ. 7, 420-439. https://doi.org/10.3934/QFE. 2023021.
Liu, S., Wang, Y., 2023. Green innovation effect of pilot zones for green finance reform: evidence of quasi natural experiment. Technol. Forecast. Soc. Change 186, 1-10. https://doi.org/10.1016/j.techfore.2022.122079.
Liu, X., Wang, E., Cai, D., 2019. Green credit policy, property rights and debt financing: quasi-natural experimental evidence from China. Finance Res. Lett. 29, 129-135. https://doi.org/10.1016/j.frl.2019.03.014.
Liu, X., Zhang, L., Hao, Y., Yin, X., Shi, Z., 2022. Increasing disparities in the embedded carbon emissions of provincial urban households in China. J. Environ. Manag. 302, 1-10. https://doi.org/10.1016/j.jenvman.2021.113974.
Li, Z., Huang, Z., Su, Y., 2023. New media environment, environmental regulation and corporate green technology innovation: evidence from China. Energy Econ. 119, 1-16. https://doi.org/10.1016/j.eneco.2023.106545.
Li, Z., Liao, G., Wang, Z., Huang, Z., 2018. Green loan and subsidy for promoting clean production innovation. J. Clean. Prod. 187, 421-431. https://doi.org/10.1016/j. jclepro.2018.03.066.
Loughran, T., McDonald, B., 2011. When is a liability not a liability? Textual analysis, dictionaries, and 10-Ks. J. Finance 66, 35-65. https://doi.org/10.1111/j.15406261.2010.01625.x.
Lu, J., 2021. Can the green merger and acquisition strategy improve the environmental protection investment of listed company? Environ. Impact Assess. Rev. 86, 1-12. https://doi.org/10.1016/j.eiar.2020.106470.
Lundqvist, L.J., 2001. Implementation from above: the ecology of power in Sweden’s environmental governance. Governance 14, 319-337. https://doi.org/10.1111/ 0952-1895.00163.
Lu, Y., Gao, Y., Zhang, Y., Wang, J., 2022. Can the green finance policy force the green transformation of high-polluting enterprises? A quasi-natural experiment based on “Green Credit Guidelines”. Energy Econ. 114, 1-15. https://doi.org/10.1016/j. eneco.2022.106265.
Ma, R., Ji, Q., Zhai, P., Yang, R., 2022. Environmental violations, refinancing risk, and the corporate bond cost in China. J. Int. Financ. Manag. Account. 33, 480-504. https://doi.org/10.1111/jifm.12154.
Ma, Y., Zhang, Q., Yin, Q., 2021. Top management team faultlines, green technology innovation and firm financial performance. J. Environ. Manag. 285, 1-9. https://doi. org/10.1016/j.jenvman.2021.112095.
Mealy, P., Teytelboym, A., 2022. Economic complexity and the green economy. Res. Pol. 51, 1-24. https://doi.org/10.1016/j.respol.2020.103948.
Meyer, B.D., 1995. Natural and quasi-experiments in economics. J. Bus. Econ. Stat. 13, 151-161. https://doi.org/10.1080/07350015.1995.10524589.
Ouyang, X., Li, Q., Du, K., 2020. How does environmental regulation promote technological innovations in the industrial sector? Evidence from Chinese provincial panel data. Energy Pol. 139, 1-10. https://doi.org/10.1016/j.enpol.2020.111310.
Peng, B., Yan, W., Elahi, E., Wan, A., 2022. Does the green credit policy affect the scale of corporate debt financing? Evidence from listed companies in heavy pollution industries in China. Environ. Sci. Pollut. Res. 29, 755-767. https://doi.org/10.1007/ s11356-021-15587-7.
Pizer, W.A., Popp, D., 2008. Endogenizing technological change: matching empirical evidence to modeling needs. Energy Econ. 30, 2754-2770. https://doi.org/10.1016/ j.eneco.2008.02.006.
Porter, M.E., 1991. America’s green strategy. Sci. Am. 264, 193-246. https://doi.org/ 10.1038/scientificamerican0491-168.
Porter, M.E., Linde, C.V.D., 1995. Toward a new conception of the environmentcompetitiveness competitiveness relationship. J. Econ. Perspect. 9, 97-118. https:// doi.org/10.1257/jep.9.4.97.
Rajan, R.G., Zingales, L., 1998. Financial dependence and growth. Am. Econ. Rev. 88, 559-586. https://www.jstor.org/stable/116849.
Rennings, K., 2000. Redefining innovation-eco-innovation research and the contribution from ecological economics. Ecol. Econ. 32, 319-332. https://doi.org/ 10.1016/S0921-8009(99)00112-3.
Requate, T., Unold, W., 2003. Environmental policy incentives to adopt advanced abatement technology: will the true ranking please stand up? Eur. Econ. Rev. 47, 125-146. https://doi.org/10.1016/S0014-2921(02)00188-5.
Shahbaz, M., Nasir, M.A., Roubaud, D., 2018. Environmental degradation in France: the effects of FDI, financial development, and energy innovations. Energy Econ. 74, 843-857. https://doi.org/10.1016/j.eneco.2018.07.020.
Shao, X., Zhong, Y., Liu, W., Li, R.Y.M., 2021. Modeling the effect of green technology innovation and renewable energy on carbon neutrality in N-11 countries? Evidence from advance panel estimations. J. Environ. Manag. 296, 1-9. https://doi.org/ 10.1016/j.jenvman.2021.113189.
Shevchenko, A., 2021. Do financial penalties for environmental violations facilitate improvements in corporate environmental performance? An empirical investigation. Bus. Strat. Environ. 30, 1723-1734. https://doi.org/10.1002/bse.2711.
Shi, J., Yu, C., Li, Y., Wang, T., 2022. Does green financial policy affect debt-financing cost of heavy-polluting enterprises? An empirical evidence based on Chinese pilot zones for green finance reform and innovations. Technol. Forecast. Soc. Change 179, 1-12. https://doi.org/10.1016/j.techfore.2022.121678.
Shleifer, A., Vishny, R.W., 1994. Politicians and firms. Q. J. Econ. 109, 995-1025. https://doi.org/10.2307/2118354.
Stern, N., Valero, A., 2021. Innovation, growth and the transition to net-zero emissions. Res. Pol. 50, 1-12. https://doi.org/10.1016/j.respol.2021.104293.
Stern, N., Xie, C., 2023. China’s new growth story: linking the 14th Five-Year Plan with the 2060 carbon neutrality pledge. J. Chin. Econ. Bus. Stud. 21, 5-25. https://doi. org/10.1080/14765284.2022.2073172.
Sun, J., Wang, F., Yin, H., Zhang, B., 2019. Money talks: the environmental impact of China’s green credit policy. J. Pol. Anal. Manag. 38, 653-680. https://doi.org/ 10.1002/pam. 22137.
Su, Z., Guo, Q., Lee, H.T., 2022. Green finance policy and enterprise energy consumption intensity: evidence from a quasi-natural experiment in China. Energy Econ. 115, 1-14. https://doi.org/10.1016/j.eneco.2022.106374.
Tang, K., Qiu, Y., Zhou, D., 2020. Does command-and-control regulation promote green innovation performance? Evidence from China’s industrial enterprises. Sci. Total Environ. 712, 1-10. https://doi.org/10.1016/j.scitotenv.2019.136362.
Tan, X., Xiao, Z., Liu, Y., Taghizadeh-Hesary, F., Wang, B., Dong, H., 2022. The effect of green credit policy on energy efficiency: evidence from China. Technol. Forecast. Soc. Change 183, 1-9. https://doi.org/10.1016/j.techfore.2022.121924.
Testa, F., Iraldo, F., Frey, M., 2011. The effect of environmental regulation on firms’ competitive performance: the case of the building & construction sector in some EU regions. J. Environ. Manag. 92, 2136-2144. https://doi.org/10.1016/j. jenvman.2011.03.039.
Tian, Y., Feng, C., 2022. The internal-structural effects of different types of environmental regulations on China’s green total-factor productivity. Energy Econ. 113, 1-12. https://doi.org/10.1016/j.eneco.2022.106246.
Tietenberg, T., 1998. Disclosure strategies for pollution control. Environ. Resour. Econ. 11, 587-602. https://link.springer.com/article/10.1023/A:1008291411492.
Vasileiou, E., Georgantzis, N., Attanasi, G., Llerena, P., 2022. Green innovation and financial performance: a study on Italian firms. Res. Pol. 51, 1-11. https://doi.org/ 10.1016/j.respol.2022.104530.
Walker, R.M., Chen, J., Aravind, D., 2015. Management innovation and firm performance: an integration of research findings. Eur. Manag. J. 33, 407-422. https://doi.org/10.1016/j.emj.2015.07.001.
Wang, R., Wang, R., He, X., 2020. Technical efficiency estimation of China’s environmental protection enterprises and its heterogeneity. Environ. Sci. Pollut. Res. 27, 33161-33180. https://doi.org/10.1007/s11356-020-09455-z.
Wang, H., Qi, S., Zhou, C., Zhou, J., Huang, X., 2022a. Green credit policy, government behavior and green innovation quality of enterprises. J. Clean. Prod. 331, 1-13. https://doi.org/10.1016/j.jclepro.2021.129834.
Wang, K., Che, L., Ma, C., Wei, Y.M., 2017. The shadow price of CO2 emissions in China’s iron and steel industry. Sci. Total Environ. 598, 272-281. https://doi.org/10.1016/j. scitotenv.2017.04.089.
Wang, L., Long, Y., Li, C., 2022b. Research on the impact mechanism of heterogeneous environmental regulation on enterprise green technology innovation. J. Environ. Manag. 322, 1-16. https://doi.org/10.1016/j.jenvman.2022.116127.
Wang, Q.J., Wang, H.J., Chang, C.P., 2022c. Environmental performance, green finance and green innovation: what’s the long-run relationships among variables? Energy Econ. 110, 1-12. https://doi.org/10.1016/j.eneco.2022.106004.
Wang, Q., Xu, X., Liang, K., 2021. The impact of environmental regulation on firm performance: evidence from the Chinese cement industry. J. Environ. Manag. 299, 1-11. https://doi.org/10.1016/j.jenvman.2021.113596.
Wang, X., Chen, Y., Dong, Y., Zhang, T., Shi, B., 2023. How does environmental regulation impact low-carbon transition? Evidence from China’s iron and steel industry. Ann. Oper. Res. 1-27 https://doi.org/10.1007/s10479-023-05480-6.
Wang, X., Zhang, C., Zhang, Z., 2019. Pollution haven or porter? The impact of environmental regulation on location choices of pollution-intensive firms in China. J. Environ. Manag. 248, 1-14. https://doi.org/10.1016/j.jenvman.2019.07.019.
Wang, Y., Li, M., 2022. Credit policy and its heterogeneous effects on green innovations. J. Financ. Stabil. 58, 1-14. https://doi.org/10.1016/j.jfs.2021.100961.
Wei, Y., Zhu, R., Tan, L., 2022. Emission trading scheme, technological innovation, and competitiveness: evidence from China’s thermal power enterprises. J. Environ. Manag. 320, 1-13. https://doi.org/10.1016/j.jenvman.2022.115874.
Wu, R., Liu, B.Y., 2023. Do climate policy uncertainty and investor sentiment drive the dynamic spillovers among green finance markets? J. Environ. Manag. 347, 1-13. https://doi.org/10.1016/j.jenvman.2023.119008.
Xie, X., Lu, J., Li, M., Dai, J., . Does carbon neutrality commitment enhance firm value? J. Chin. Econ. Bus. Stud. 21, 49-83. https://doi.org/10.1080/ 14765284.2022.2161171.
Xing, C., Zhang, Y., Wang, Y., 2020. Do banks value green management in China? The perspective of the green credit policy. Finance Res. Lett. 35, 1-9. https://doi.org/ 10.1016/j.frl.2020.101601.
Xiong, X., Zhang, L., Hao, Y., Zhang, P., Shi, Z., Zhang, T., 2022. How urbanization and ecological conditions affect urban diet-linked GHG emissions: new evidence from
China. Resour. Conserv. Recycl. 176, 1-9. https://doi.org/10.1016/j. resconrec.2021.105903.
Xu, X., Huang, S., An, H., Vigne, S., Lucey, B., 2021. The influence pathways of financial development on environmental quality: new evidence from smooth transition regression models. Renew. Sustain. Energy Rev. 151, 1-14. https://doi.org/ 10.1016/j.rser.2021.111576.
Xu, X., Li, J., 2020. Asymmetric impacts of the policy and development of green credit on the debt financing cost and maturity of different types of enterprises in China. J. Clean. Prod. 264, 1-13. https://doi.org/10.1016/j.jclepro.2020.121574.
Yan, C., Mao, Z., Ho, K.C., 2022. Effect of green financial reform and innovation pilot zones on corporate investment efficiency. Energy Econ. 113, 1-11. https://doi.org/ 10.1016/j.eneco.2022.106185.
Yang, N., Yang, J., Pang, M., Zhang, P., Chang, Y., Zhang, L., Hao, Y., Chen, Y., 2023. Decarbonization of the wind power sector in China: evolving trend and driving factors. Environ. Impact Assess. Rev. 103, 1-8. https://doi.org/10.1016/j. eiar.2023.107292.
Yao, S., Pan, Y., Sensoy, A., Uddin, G.S., Cheng, F., 2021. Green credit policy and firm performance: what we learn from China. Energy Econ. 101, 1-16. https://doi.org/ 10.1016/j.eneco.2021.105415.
Yuan, B., 2019. Effectiveness-based innovation or efficiency-based innovation? Trade-off and antecedents under the goal of ecological total-factor energy efficiency in China. Environ. Sci. Pollut. Res. 26, 17333-17350. https://doi.org/10.1007/s11356-019-05082-5.
Yuan, S., Pan, X., 2023. Inherent mechanism of digital technology application empowered corporate green innovation: based on resource allocation perspective. J. Environ. Manag. 345, 1-15. https://doi.org/10.1016/j.jenvman.2023.118841.
Zefeng, M., Gang, Z., Xiaorui, X., Yongmin, S., Junjiao, H., 2018. The extension of the Porter hypothesis: can the role of environmental regulation on economic development be affected by other dimensional regulations? J. Clean. Prod. 203, 933-942. https://doi.org/10.1016/j.jclepro.2018.08.332.
Zhang, D., 2022. Do heterogenous subsides work differently on environmental innovation? A mechanism exploration approach. Energy Econ. 114, 1-9. https://doi. org/10.1016/j.eneco.2022.106233.
Zhang, J., Liang, G., Feng, T., Yuan, C., Jiang, W., 2020. Green innovation to respond to environmental regulation: how external knowledge adoption and green absorptive capacity matter? Bus. Strat. Environ. 29, 39-53. https://doi.org/10.1002/bse.2349.
Zhang, K., Li, Y., Qi, Y., Shao, S., 2021a. Can green credit policy improve environmental quality? Evidence from China. J. Environ. Manag. 298, 1-11. https://doi.org/ 10.1016/j.jenvman.2021.113445.
Zhang, N., You, D., Tang, L., Wen, K., 2023. Knowledge path dependence, external connection, and radical inventions: evidence from Chinese Academy of Sciences. Res. Pol. 52, 1-18. https://doi.org/10.1016/j.respol.2023.104738.
Zhang, S., Wu, Z., Wang, Y., Hao, Y., 2021b. Fostering green development with green finance: an empirical study on the environmental effect of green credit policy in China. J. Environ. Manag. 296, 1-12. https://doi.org/10.1016/j. jenvman.2021.113159.
Zhang, W., Liu, X., Wang, D., Zhou, J., 2022a. Digital economy and carbon emission performance: evidence at China’s city level. Energy Pol. 165, 1-22. https://doi.org/ 10.1016/j.enpol.2022.112927.
Zhang, Y., Li, X., Xing, C., 2022b. How does China’s green credit policy affect the green innovation of high polluting enterprises? The perspective of radical and incremental innovations. J. Clean. Prod. 336, 1-14. https://doi.org/10.1016/j. jclepro.2022.130387.
Zhang, Z., Jiang, Y., 2022. Can green public procurement change energy efficiency? Evidence from a quasi-natural experiment in China. Energy Econ. 113, 1-12. https:// doi.org/10.1016/j.eneco.2022.106244.
Zhao, X., Zhao, Y., Zeng, S., Zhang, S., 2015. Corporate behavior and competitiveness: impact of environmental regulation on Chinese firms. J. Clean. Prod. 86, 311-322. https://doi.org/10.1016/j.jclepro.2014.08.074.
Zhou, Q., Zhang, X., Shao, Q., Wang, X., 2019. The non-linear effect of environmental regulation on haze pollution: empirical evidence for 277 Chinese cities during 2002-2010. J. Environ. Manag. 248, 1-12. https://doi.org/10.1016/j. jenvman.2019.109274.
Zhu, X., 2022. Does green credit promote industrial upgrading?-analysis of mediating effects based on technological innovation. Environ. Sci. Pollut. Res. 29, 41577-41589. https://doi.org/10.1007/s11356-021-17248-1.
Zhu, X., Zuo, X., Li, H., 2021. The dual effects of heterogeneous environmental regulation on the technological innovation of Chinese steel enterprises-based on a highdimensional fixed effects model. Ecol. Econ. 188, 1-13. https://doi.org/10.1016/j. ecolecon.2021.107113.

    • Corresponding author. Henley Business School, University of Reading, Reading, RG6 6UD, UK.
    E-mail address: dan.luo@henley.ac.uk (D. Luo).
    Currently, China mainly has command- (e.g. Atmospheric Pollution Prevention and Control Law (2015 Revision)), market- (e.g. Emission Trading Markets Pilots Policy (2007) and Guidelines for Green Credit issued by the China Banking Regulatory Commission (2012)), and voluntary-based environmental regulation.
  1. For example, when an enterprise achieves technological innovation that meets the requirements of environmental regulations, it can apply for patent protection. In the context of strict environmental regulations, this behaviour can encourage other enterprises to purchase its innovation, which can bring high profits to the enterprise (Porter, 1991).
  2. Green innovation quality focuses more on the quality of green innovation and is more related to newly created inventions (Zhang et al., 2023). While green innovation increment focuses more on the quantity of green innovation and tends to build on existing technologies or products (Wang and Li, 2022).
    Here, the variables Incentive-based Environmental Regulation (CER_Incentive) and Green Investment (GreenInv) are constructed using the Word Embedding model.
  3. The innovation compensation effect of PH posits that during the dynamic process of economic development, environmental regulations can stimulate enterprises to innovate their production modes, improve economic efficiency, and offset the effect of circular cost (Ouyang et al., 2020).
  4. The main points of the 2012 GCG are as follows. First, a strict access mechanism requires credit-granting financial institutions to consider not only the economic performance and risks of enterprises but also their environmental performance and potential environmental risks. Credit to enterprises with poor environmental performance is curtailed. Second, information communication and dynamic tracking mechanisms must be established for enterprises that have obtained loans after thorough examination and approval, and their credit should be terminated if environmental problems occur. Third, stronger coordination and cooperation must be established with government and environmental protection departments. Information sharing must be improved to link environmental protection and financial credit (Yao et al., 2021; Zhang et al., 2021b).
  5. Firstly, the pandemic exerted a substantial shock to the global economy, including China. Including the post-2020 data might introduce biases into the empirical results due to these unprecedented external influences. Secondly, in response to the pandemic, China, along with many other countries, implemented restrictive lockdown measures and fiscal stimulus policies. These interventions substantially altered the economic behaviours of firms and individuals. Consequently, it becomes challenging to disentangle the actual effects attributable to the Green Finance Policy from those stemming from the pandemic’s repercussions. Therefore, the study considers the selection of the year 2019 as the cut-off point for the sample period to be appropriate.
  6. To avoid potential bias caused by the decrease in total observations, this study also uses the logarithm of government subsidy (CER_Incentive1) to conduct a robustness test. The results are reported in Appendix 1.
    The model and data source of the Word Embedding model are from www. wingodata.com.
    The environmental liabilities database of CSMAR constructs an index of voluntary disclosure of corporate environmental pollutants, which include wastewater emissions, COD emissions, emissions, emissions, soot and dust emissions, and industrial solid waste emissions. The index can appropriately reflect the VER level of firms (Huang and Chen, 2015).
  7. Since the listed age is zero when a company goes public in its first year, taking the natural logarithm of 0 (Ln0) has no mathematical meaning.
  8. 12 The description of variables can be found in Table 11.
  9. If a significant difference is observed in the green innovation between HPEs and other enterprises before the implementation of the GFP, then the results may not be caused by GFP (Yao et al., 2021).
  10. For example, the regression results may be influenced by other policies (Wang et al., 2022a).
    Regions include Beijing, Tianjin, Hebei, Shanxi, Inner Mongolia, and Liaoning.
  11. Joint green innovation refers to an application with green invention and/or green utility patents by two or more legal entities, whereas there is only one entity for independent green innovation.
    These are independent green innovation quality performance (GI_qua_ind), joint green innovation quality performance (GI_qua_joi), independent green innovation increment performance (GI_inc_ind), and joint green innovation increment performance (GI_inc_joi).
  12. EFD Capital expenditures – Cash flow from operations Capital expenditures. Firms are classified as high-EFD if the index value is above the median (0.216), and low-EFD otherwise.
  13. https://www.hexun.com/?from=rongshuxia; Specifically, this study uses Python to crawl the main business content of listed companies from Tonghuashun Finance and Economic, and Hexun, and then manually judges related information.
    Furthermore, this study drops HPEs from the regression sample to avoid potential research bias.
  14. The parallel trend analysis also shows that the adoption of the DID model is rational. The results of this analysis are available upon request.
    The coefficient of DID on GI_qua is 0.098 for green enterprises at the level, whereas it is 0.069 for HPEs at the level.
    The average green innovation performance of green enterprises is higher than that of HPE, see Appendix 2.
    The mean value of environmental violation for HPEs is 0.0079 , which is nearly twice higher than that for green enterprises at 0.0041 .
  15. Notes: The full terms for variables’ abbreviations: GI: Green Innovation; GI_qua: Green Innovation Quality; GI_inc: Green Innovation Increment; HPEs: Heavily Polluting Enterprises.
  16. According to Tan et al. (2022), the study randomly generates a selection of HPEs. Then the DID model is applied to Equation (1) and the sampling process is repeated 500 times for the placebo test, ensuring the robustness of the regression results. The coefficients from the DID term post-randomisation largely cluster around 0 , with most p -values exceeding 0.1 . Notably, the baseline estimation result ( 0.123 ) is located at the edge of the whole distribution. Such an observation indicates a significant dilution of the policy effect post-randomisation, both in terms of significance and magnitude. This indirectly affirms the robustness of the findings in the study, suggesting that the enhancement in enterprises’ green innovation performance is genuinely attributable to the GFP, rather than being randomly instigated or influenced by other policies
  17. These plots show that the impact of GFP on GI performance strengthens with increased intensity of CER_Incentive and VER. However, a rise in CER_Penalty does not produce a comparable shift. Thus, while CER_Incentive and VER both play a significant and positive role in moderating the relationship between GFP and green innovation performance, CER_Penalty does not exhibit a pronounced moderation effect

Journal: Journal of Environmental Management, Volume: 352
DOI: https://doi.org/10.1016/j.jenvman.2023.119961
PMID: https://pubmed.ncbi.nlm.nih.gov/38219663
Publication Date: 2024-01-13

THE UNIVERSITY of EDINBURGH

Edinburgh Research Explorer

The impact of green finance policy on green innovation performance

Evidence from Chinese heavily polluting enterprises

Citation for published version:

Chang, K, Luo, D, Dong, Y & Xiong, C 2024, ‘The impact of green finance policy on green innovation performance: Evidence from Chinese heavily polluting enterprises’, Journal of Environmental Management, vol. 352, 119961. https://doi.org/10.1016/j.jenvman.2023.119961

Digital Object Identifier (DOI):

10.1016/j.jenvman.2023.119961

Link:

Link to publication record in Edinburgh Research Explorer

Document Version:

Publisher’s PDF, also known as Version of record

Published In:

Journal of Environmental Management

General rights

Copyright for the publications made accessible via the Edinburgh Research Explorer is retained by the author(s) and / or other copyright owners and it is a condition of accessing these publications that users recognise and abide by the legal requirements associated with these rights.

Take down policy

The University of Edinburgh has made every reasonable effort to ensure that Edinburgh Research Explorer content complies with UK legislation. If you believe that the public display of this file breaches copyright please contact openaccess@ed.ac.uk providing details, and we will remove access to the work immediately and investigate your claim.

The impact of green finance policy on green innovation performance: Evidence from Chinese heavily polluting enterprises

Kaiwen Chang , Dan Luo , Yizhe Dong , Chu Xiong School of Management Science and Engineering, Nanjing University of Information Science and Technology Henley Business School, University of Reading, Reading, RG6 6UD, UK University of Edinburgh Business School, University of Edinburgh, Edinburgh, EH8 9JS, UK State Key Laboratory of Power Transmission Equipment & System Security and New Technology, Chongqing University, Chongqing, 400044, China

A R T I C L E I N F O

Handling editor: Lixiao Zhang

Keywords:

Green finance policy
Green innovation
Environmental regulation
Environmental protection
China

Abstract

Green innovation (GI) is increasingly recognised as an effective strategy for tackling climate change, mitigating environmental issues, and promoting sustainable development. Using panel data of the Chinese listed firms from 2007 to 2019, this study adopts the difference-in-differences approach to assess the impact of the green finance policy (GFP) initiated by the Chinese government in 2012 on the green innovation performance of firms. The findings reveal that the GFP significantly boosts the green innovation performance of heavily polluting enterprises (HPEs). Notably, this effect is more pronounced in state-owned enterprises and firms with high dependence on external finance. Compared with penalty-based regulations, incentive-based and voluntary environmental regulations demonstrate more significant moderating effects on the relationship between the GFP and green innovation performance for HPEs. We also identify improved efficiency in the usage of green investments as a potential mechanism through which the GFP enhances the green innovation performance of HPEs. Further comparative analysis shows that green enterprises can achieve simultaneous improvement in both the quality and quantity of green innovation, whereas HPEs predominantly exhibit enhancements in innovation quantity. To maximise the GFP’s positive effects, it is recommended to facilitate more targeted bank lending towards HPEs to support their structural transformation. Additionally, the coordinated deployment of diverse environmental policy instruments is advised to exploit their synergistic effects.

1. Introduction

Over the past decades, issues related to global warming caused by environmental pollution have triggered wide debate (Francey et al., 2013; Balsalobre-Lorente et al., 2018; Mealy and Teytelboym, 2022; Fan et al., 2023). Over the past few decades, China has experienced high-speed economic growth with rapid industrialisation. However, this growth has resulted in excessive energy consumption and severe environmental pollution (Zhang et al., 2021b). In 2005, China had become the world’s largest emitter (Wang et al., 2017). The greenhouse effect, exacerbated by excessive emissions, presents a significant threat to human survival and production activities (Xu et al., 2021). Consequently, maintaining such an extravagant growth model has become increasingly unsustainable for China (Yang et al., 2023; Wei
et al., 2022). The Chinese government, aiming for sustainable development, has set targets like reaching the carbon peak by 2030 and carbon neutrality by 2060 (Liu et al., 2022; Xiong et al., 2022; Zhang et al., 2022a; Stern and Xie, 2023). In particular, there is a growing emphasis on the green transition of heavily polluting enterprises (HPEs) (Wang et al., 2019; Zhou et al., 2019; Hu et al., 2021a).
To meet these targets, the Chinese government implemented various regulatory measures, including command-, market- and voluntary-based measures. Notably, market-based environmental regulation (MER) is gaining prominence due to its flexibility, autonomy, and economic efficiency (Tian and Feng, 2022; Chang et al., 2023). Specifically, MER, exemplified by the green finance policy (GFP), incentivises companies to adopt environmental protection measures. Through the implementation of a series of financial mechanisms, it aims to achieve the dual targets of
environmental protection and economic development (Sun et al., 2019; Wu and Liu, 2023). The GFP provides loan incentives for green initiatives while imposing constraints on heavily polluting businesses (Wu and Liu, 2023). Financial policies like the GFP effectively use financial market power to foster corporate environmental responsibility, granting firms the autonomy to optimally allocate funds for green transition and environmental protection efforts. Therefore, as a market-based environmental regulation tool, the GFP could gear firms towards green innovation (GI), and contribute to broader economic restructuring and the green transition of the country (Lu et al., 2022; Tan et al., 2022). Despite extensive research on environmental regulations’ effects on firms’ performance and energy intensity (Hamamoto, 2006; Lin and Xu, 2023; Testa et al., 2011; Wang et al., 2021, 2023), there are limited studies evaluating impacts of GFP on diverse firm-level innovation. This paper aims to fill this gap by analysing the impact of China’s GFP on firms’ GI, especially focusing on HPEs. This is crucial for understanding China’s green economic transition and could provide insights for other economies aiming for carbon neutrality and green development (Tian and Feng, 2022; Su et al., 2022).
Fossil fuels, despite being pivotal for industrial and economic growth (Awada and Mestre, 2023), present significant environmental challenges. Consequently, enterprises’ GI performance, encompassing sustainable technological, product or service advancements, is gaining focus (Liu and Wang, 2023; Cheng et al., 2021; Ma et al., 2021; Vasileiou et al., 2022). It is considered an effective way to balance economic development and environmental governance (Rennings, 2000; Walker et al., 2015; Shahbaz et al., 2018; Chen et al., 2023). In particular, GI helps reduce energy use and emissions, cutting production costs and mitigating adverse environmental impacts, thus fostering an increase in eco-friendly product market share and propelling the industry’s broader green transformation (Huang et al., 2019; Li et al., 2023). Additionally, the Chinese government has implemented many environmental policies to accelerate green transformation, particularly targeting HPEs (Wang and Li, 2022). It is therefore argued that GI offers firms competitive edges through early adoption benefits, government support, and technological leadership (Gupta and Barua, 2018). As a result, government-enacted environmental regulations are crucial for enhancing firms’ GI (Stern and Valero, 2021), with this effect intensified by digital media’s supervisory role (Li et al., 2023; Liu et al., 2023).
Regarding the connection between environmental regulations and GI, the Porter Hypothesis (PH) posits that flexible environmental regulations can enhance innovation’s environmental advantages (Porter, 1991). Consequently, this study offers empirical evidence supporting the PH, drawing from samples in the world’s largest developing economy. In China, the GFP has become a key environmental regulation (Yao et al., 2021). When faced with GFP, HPEs are significantly affected due to financial constraints and their need for substantial profit gains (Hu et al., 2021b). Also, green enterprises respond to GFP by investing in GI to retain the competitive advantage. Furthermore, existing studies primarily focus on the effects of a single policy on firms’ innovation (Tang et al., 2020; Xu and Li, 2020; Su et al., 2022), neglecting the synergistic impact of different environmental regulations. However, this synergistic effect is a crucial component of the PH, and the findings will be significant for China and other economies with similar economic characteristics in shaping effective environmental policies.
Given the significance of research objectives, this study examines the relationship between GFP and GI using panel data on Chinese listed companies from 2007 to 2019, particularly focusing on whether GFP promotes GI among HPEs under heterogeneous conditions. Further,
China has implemented different types of environmental regulations and these policies may have synergistic effects. Then, understanding how these regulations affect the relationship between GFP and GI may be worthwhile. We also explore: what are the impacts of GFP on green enterprises? Are these impacts consistent with those on HPEs?
This study contributes to the literature in the following aspects. First, while some studies examine the impact generated by GFP on HPEs’ performance (Cui et al., 2022; Peng et al., 2022), little has been done to explore the relationship between GFP and GI of HPEs and their greener peers. Despite being less polluting, GFP could still promote green firms’ GI to strengthen competitiveness. However, responses from green firms vary according to the regulatory initiatives imposed and their chosen GI strategies. This research offers valuable insights by comparing the diversified responsive channels chosen by these two types of enterprises for the future green transition of HPEs.
Second, previous studies have explored the GI and GFP but failed to identify internal mechanisms (Wang et al., 2022c; Chang et al., 2023). This study delves into the nuances of GI, differentiating between its quality and quantitative increments, and further investigates firms’ preferences and the rationale behind them. More critically, the study adds to the field by identifying several possible mechanisms through which the GFP improves firms’ innovation performance, such as the ownership structure and external financing dependence.
Third, while GFP is an important MER within China’s environmental regulation framework, studies suggest that different regulatory tools can synergistically impact firms’ innovation capabilities and emissions reduction efforts (Fabrizi et al., 2018; Yuan, 2019). This study reveals that both the command- and voluntary-based regulatory tools significantly moderate the relationship between the GFP and GI. These observations have led to valuable policy implications, underscoring the importance of an integrated approach in environmental regulations to stimulate GI effectively.
Fourth, while assessing the impact of GFP on GI, changes in channel factors (e.g. efficiency of green capital utilisation) should also be considered. However, existing studies failed to identify such channels (Zhu, 2022; Wang et al., 2022c). This study fills this gap by revealing that the efficiency of green capital utilisation is one such channel through which more GI is generated with the same amount of capital investment.
Fifth, the study adopts a novel Word Embedding model to improve variable measurement accuracy and the robustness of results. Traditional methods, like manually identifying synonyms (Loughran and McDonald, 2011), may introduce bias due to subjective nature. In contrast, employing the Word Embedding model, a technique grounded in machine learning, addresses this limitation (Li et al., 2021). The approach allows for a more precise measurement of variables like incentive-based environmental regulation and green investment.
The rest of this study is organised as follows. Section 2 provides an overview of the literature and develops the hypotheses. Section 3 describes the variables and methodology. Section 4 discusses the empirical results. Finally, section 5 presents the conclusions of this study.

2. Literature review and hypothesis development

2.1. The Porter Hypothesis

The Porter Hypothesis (PH) suggests that stringent but properly
designed environmental regulations can stimulate corporate innovation, especially green innovation (Porter and Linde, 1995). To comply with the regulatory requirements while building up sustained competitive advantages over the longer term, firms can be pressurised/incentivised to invest in green technologies and adjust their competitive strategies accordingly (Farooq et al., 2021). To ensure the appropriate functioning of the environmental regulation system, it should have the following characteristics: broad coverage: it should provide the largest potential space for corporate innovation; continuity: it should stimulate continuous innovation; flexibility: it should allow firms to implement the policies in stages with certain level of discretionary power; and enforceability: it should be able to control and enforce firm behaviours effectively with a well-designed appraisal mechanism and encourage government-firm collaboration (Porter and Linde, 1995).
Many studies have demonstrated the validity of PH (Zhao et al., 2015; Ouyang et al., 2020). For instance, firms can create new market opportunities by developing greener products (Ouyang et al., 2020), which can motivate firms to invest more in green innovation. Over the longer term, investments in green technology may be fully compensated by the potential gain from reduced costs in pollution control, increased productivity, and positive publicity. This can be especially true when firms face greater environmental regulation intensity, which can accelerate green innovation processes and lead to the development of an environmentally friendly industry (Zhao et al., 2015). However, green investments also require substantial financial support. As such, the GFP can help in this respect by easing financing constraints, thereby complementing environmental regulations and promoting green innovation activities.
Recent research has started to leverage environmental policies as quasi-natural experiments to investigate the PH and mitigate potential endogeneity issues, such as the introduction of the carbon emissions trading system (Hu et al., 2020). For instance, Hu et al. (2020) discover that the carbon emissions trading market has had a significant positive impact on both the volume and quality of innovation amongst Chinese enterprises. As a significant tool in environmental regulation, the role of the GFP in environmental governance has received increased attention in recent years (Yao et al., 2021). Certain studies have found that the enactment of the GFP resulted in reductions in bank loans and the scale of investments in HPEs, leading ultimately to a decrease in these enterprises’ operational performance and total factor productivity (Liu et al., 2019). Liu et al. (2019), using the announcement of the 2012 Green Credit Guideline as a quasi-natural experiment, demonstrate that the debt financing capacity of HPEs has decreased significantly. Moreover, the negative net effect of debt financing is more pronounced in state-owned enterprises and those located in regions with weaker financial ecosystems.
However, according to the PH, the effectiveness of an environmental regulation policy in influencing innovation serves as a crucial measure of a successful green transition (Pizer and Popp, 2008). It is evident that the primary goal of the GFP is to mitigate environmental pollution, not to undermine corporate competitiveness. Recently, Li et al. (2018) build a green loan theory using quantitative models to support the GFP’s role in promoting clean production innovation. Nevertheless, the exact influence of China’s GFP on green innovation remains ambiguous, especially regarding its impact on diverse enterprises in practical scenarios. These questions are significant in verifying the applicability of the PH in China. Furthermore, existing research exploring the synergistic effect of other environmental regulations in conjunction with the GFP is limited. Neglecting this facet may lead to an incomplete estimation of the PH’s validity (Zefeng et al., 2018). Therefore, this study addresses this
research gap and expands upon the PH by considering the synergistic effect of various environmental regulations.

2.2. Green finance policy and green innovation performance

Among various GFPs, the Green Credit Guideline (GCG) implemented in 2012 has generated profound impacts, leading to a significant increase in green credit balance in China over years (Fig. 1). According to the GCG, all commercial banks must strengthen the management of enterprise environmental performance and establish an informationsharing mechanism to develop green credit (Zhang et al., 2021a; Yao et al., 2021). The credit is then used to promote green innovation performance via the development of technologies or approaches that contribute to energy savings, emissions reduction, and environmental protection, among others (Chen et al., 2006). Similar to other types of general innovation, green innovation can help the technological advancement of enterprises, empowering them to develop more innovative services and products (Aldieri et al., 2020). The green characteristics of such innovation also benefit the environment (Huang and Li, 2017). Therefore, green innovation may help achieve the dual targets of environmental protection and economic development simultaneously (Ganda, 2019; Shao et al., 2021). Thus, green innovation fits well within the scope of GFP.
Over the past decades, many HPEs have been keen to structurally transform themselves to continue to access and attract stable capital inflow from financial institutions. Therefore, achieving qualified environmental and sewage performance has become particularly important for these HPEs (Berrone et al., 2013). Despite extensive capital market reforms, loans remain the primary financing resource for Chinese firms, especially for HPEs (Xing et al., 2020). Due to the GFP, HPEs that want to
Fig. 1. The green credit balance of China, by year Note: The green credit balance of China from 2013 to 2019. The volume ( ) of green credit is show on the left axis.
Data source: CSMAR.
secure financial support may be motivated to cut emissions, including via green innovation, as they must fulfil GFP requirements to access loans from financial institutions (Shi et al., 2022). This also helps HPEs build good relationships with the local government because they can demonstrate commitment to environmental sustainability (Hu et al., 2021b). Based on the above discussion, the first hypothesis is proposed as follows:
Hypothesis 1. GFP improves the green innovation performance of HPEs.

2.3. The moderating effect of environmental regulations

Environmental regulations may change the behaviour of firms through various channels, such as encouraging them to invest more in green activities or cultivating a green culture in the firm (Kesidou and Demirel, 2012; Dong et al., 2023). In general, apart from MER, ERs also consist of two categories: command-and-control (CER) and voluntary environmental regulations (VER). The former is mainly based on government command (Tang et al., 2020) and comprises environmental law enforcement, administrative penalties, and government subsidies (Car-rión-Flores et al., 2013). VER refers to firms’ voluntary environmental information disclosure (Jiang et al., 2020). These disclosures can effectively reduce information asymmetry between financial institutions and firms, increasing firms’ accessibility to green finance.

2.3.1. Command-and-control environmental regulation

Due to its relatively strong enforcement power, CER, especially the penalty-based CER, remains an important environmental regulation in developing countries. Through the introduction of additional financial punishment and administrative detention penalties to firms, CER_Penalty has significantly elevated the cost of environmental violations for firms, forcing them to engage more in green innovation practices (Wang et al., 2022b). A similar picture emerged in China as firms with high energy consumption and low efficiency are driven out of the market due to the timely oversight and emissions control exerted by CER_Penalty policies (Zhu et al., 2021). However, CER_Penalty has also been criticised for its high costs, low operational efficiency, and deviation from the original targets of promoting technological innovation among enterprises (Joshi et al., 2001). Further, Hotte and Winer (2012) point out that as CER_Penalty often fails to consider the substantial cost differences among firms, it may actually impede the adoption rate of technology, especially among small firms. Since penalties can only be applied to specific measurable targets, regulations structured based on them may not prevent all types of pollution activities effectively (Shevchenko, 2021). When firms possess more information than the regulators, this situation can become even worse.
Therefore, the inherent limitations of CER_Penalty have made it a less efficient alternative than the incentive-based regulations in China (Lin and Xie, 2023). Instead of stimulating increased green innovation funded by favourable GFP, CER_Penalty may impose an additional financial burden on HPEs, worsening their financing situation while sending bad signals to the market (Requate and Unold, 2003). Consequently, green innovation efforts may have less funding. Moreover, the long-term financing capacity of firms may be further restrained. Based on this discussion, this study proposes the following hypothesis:
Hypothesis 2a. CER_Penalty does not positively moderate the relationship between GFP and green innovation performance among HPEs.
Among various types of CERs, government subsidy actually shares some incentive-based characteristics (CER_Incentive), despite some design deficiencies. As observed by Shleifer and Vishny (1994), government subsidies can be influenced by rent-seeking behaviours and mutual bribery between enterprises and local government officials. This
in turn elevates the non-production costs of firms, eroding their competitiveness and disentangling the innovation stimulus effect of the subsidies. Further, some enterprise managements might pursue green subsidies with the aim of appeasing the government for short-term gains. This has again distorted the genuine purpose of green subsidies (Li et al., 2023). Nevertheless, given China’s robust anti-corruption measures and the stringent review mechanisms of GFP, many studies posit that it is challenging for HPEs to rely solely on short-term rent-seeking to navigate the complexities of long-term environmental policies (Bai et al., 2019). This suggests that HPEs might predominantly view green subsidies as financial aids to bolster green innovation performance (Horbach et al., 2012).
As for CER_Incentive, it refers to the free transfer of funds from local governments to enterprises (Huang et al., 2019), while restraining the use of funds for certain purposes like green investments (Zhang, 2022). It acts as a direct substitute for debt financing, providing a viable alternative to HPEs for their innovative green transformations (Horbach et al., 2012). Furthermore, CER_Incentive also signifies the government’s support for the company, enabling it to bypass the restrictions imposed by debt financing (Zhang, 2022). In other words, CER_Incentive can assist firms in diversifying the risks involved in green innovation to some extent, thereby increasing their willingness to invest in such activities (Bai et al., 2019). Moreover, to nurture a long-term relationship with the government, HPEs tend to be more strongly motivated to improve their environmental performance via green innovation. Therefore, this study proposes the following hypothesis:
Hypothesis 2b. CER_Incentive can positively moderate the relationship between GFP and the green innovation performance of HPEs.

2.3.2. Voluntary environmental regulation

Compared with CER and MER, VER is considered the ‘third generation’ of tools for controlling pollution (Tietenberg, 1998). The disclosure of pollutant emissions, such as the environmental information disclosure of listed companies in China, is a good example of this (Jiang et al., 2020). Nevertheless, it is argued that as the existing intensity of VER in China remains relatively low, and the cultivation of environmental awareness is a protracted endeavour, VER is unable to generate any material impacts on firms’ GI improvement (Wang et al., 2022b). Conversely, to avoid environmental scrutiny by the public or media, enterprises might resort to short-term management strategies, like terminal governance. Such approaches not only waste the resources of firms but also divert funds from green R&D investments, impeding the firms’ GI enhancement further (Wang et al., 2022b). However, as environmental information disclosure data becomes more readily accessible in China, a growing body of research highlights the advantages of VER (Lundqvist, 2001; Huang and Chen, 2015; Bu et al., 2020). By reducing costs and improving the time efficiency in providing, processing, and disseminating related information, VER reduces the information asymmetry between firms and financial institutions (Lundqvist, 2001; Bu et al., 2020). This can help establish a long-term trusted relationship between the two, which can help improve overall organisational performance (Huang and Chen, 2015). Therefore, considering the positive impact of VER on firm performance and its signalling effect, this study proposes the following hypothesis:
Hypothesis 3. VER can positively moderate the relationship between GFP and the green innovation performance of HPEs.

3. Methodology and variables

3.1. Data and sample selection

The sample includes data on China’s A-share listed companies from 2007 to 2019.2007 is the sample’s starting year because new accounting
standards were implemented in China this year. Meanwhile, 2019 is set as the ending year to mitigate the impact of the COVID-19 pandemic. HPEs are defined according to the ‘Guidelines for the Industry Classification of Listed Companies’ revised by the China Securities Regulatory Commission in 2012 and ‘Guidelines for Environmental Information Disclosure of Listed Firms (Draft for Soliciting Opinions)’ published by the China Environmental Protection Administration in 2010 (hereafter, Draft) (Shi et al., 2022). The sample is filtered as follows: (1) excluding financial and ST firms; (2) removing firms with missing key variables; (3) winsorising all continuous variables at the and levels to mitigate the effect of outliers; and (4) removing firms which change their status between heavily and non-heavily polluting industries over the sample period. All data are collected from the China Stock Market and Accounting Research (CSMAR) database, Chinese Research Data Services (CNRDS) database, annual reports, and corporate social responsibility (CSR) reports of respective listed companies.

3.2. Models

Following Zhang et al. (2021a) and Shi et al. (2022), this study constructs the difference-in-differences (DID) model to explore the effect of GFP on green innovation and mitigate the endogeneity issue.


measures corporate green innovation. is the interaction between Treat Post and it captures the DID effect. represent CER and VER. represents the set of control variables. , and denote the firm, industry, year, and region fixed effects, respectively. The original rough time and treat variables are not included since the firm and year fixed effects are considered. This can effectively alleviate endogeneity problems, such as omitted variable bias, to a certain extent (Meyer, 1995; Shi et al., 2022).

3.3. Variables

3.3.1. Dependent variables

Following Hu et al. (2021b) and Yuan and Pan (2023), this study uses the natural logarithm of the sum of 1 and the number of overall green patent applications of firm in year to proxy green innovation (GI). The green patent data are collected from the CNRDS database.

3.3.2. Independent variables

The independent variables are the treated group (Treat) and policy implementation (Post). Treat is a dummy variable equalling one if the firm is an HPE and zero otherwise. Post is a dummy variable that equals one if the GFP has been implemented, or within the period of 2012-2019. According to the model construction, the interaction Treat Post (DID) is the key variable and should be significant if the DID effect exists (Wang and Li, 2022).

3.3.3. Moderating variables

CER is mainly divided into two types: CER_Penalty and CER_Incentive. CER_Penalty refers to the penalties imposed by the government on listed firms with environmental issues (Ma et al., 2022). It is proxied by whether the company has had the environmental violation noted in the year. CER_Incentive is mainly related to the green subsidies granted by the government. To capture various types of sponsorships initiated by the government, this study uses the Word Embedding model from machine learning to construct the green subsidy dictionary and then obtains the green subsidy data by examining the notes to the annual reports of companies using this dictionary. After filtering, the logarithm of the sum of the amount of green subsidy items detected is used to construct the CER_Incentive indicator.
Traditional text analysis methods often rely on the manual identification of synonyms to expand the word set (Loughran and McDonald, 2011). However, this method entails high subjectivity and may introduce bias into the word set. Consequently, this study employs the Word Embedding model to construct the CER_Incentive indicator. The model utilises a neural network to deeply parse a substantial volume of financial texts, thereby building a word similarity model from which similar words are trained. The similarity dictionary, crafted by this model, enables a comprehensive and objective variable measurement, thus enhancing the accuracy of variable measurement and the robustness of empirical results (Li et al., 2021).
VER is measured by the pollutant emissions disclosure level of a company. In China, the disclosure of environmental liabilities is voluntary, and thus, its intensity can be reflected by the environmental regulation pressure faced by the company and its willingness to disclose environmental information voluntarily (Huang and Chen, 2015). Specifically, if a company chooses to disclose the pollutant emissions information, measured here by six indicators, voluntarily, that indicator is assigned a value of 1 , and 0 otherwise. Then, the values of different indicators are aggregated to obtain the VER.

3.3.4. Control variables

The following control variables are considered to control for the influence of firm-specific characteristics.
3.3.4.1. Profitability. Firm profitability is measured by the ratio of net profits to total assets, or the return on assets (ROA) (Zhang et al., 2022b). This should enhance firms’ innovation capacity as a higher profit margin allows firms to accumulate more retained earnings for R&D investments (Hu et al., 2021b). While others argue that as innovation can be costly, managers of those companies with high ROA may be reluctant to invest financial resources in green innovation. This may have led to an inconsistent relationship between profitability and innovation (Zhang et al., 2022b).
3.3.4.2. Firm size (size). The natural logarithm of the company’s total assets is used to measure firm size (Size) (Hu et al., 2021b; Ma et al., 2021; Xie et al., 2023; Zhang et al., 2022b). A firm’s size has always been one of the most important factors affecting its technological innovation capabilities. A scale expansion, such as through merger and acquisition, may facilitate innovation resource sharing, and hence, enhance a firm’s
innovation capacity (Wang and Li, 2022). Larger firms also find it easier to get additional financial support from external sources, allowing them to invest more in R&D. Therefore, this study expects a positive relationship between firm size and green innovation.
3.3.4.3. Leverage. Leverage is measured by the ratio of liabilities to total assets (Zhang et al., 2022b; Wang and Li, 2022). A higher leverage may increase the financial risks for firms. In response, firms may cut R&D investments to reduce uncertainties and/or use the current resources more efficiently for more innovative outputs. Hence, the resulting impact is hard to predict and varies under different scenarios (Zhang et al., 2022b; Lu et al., 2022). Therefore, this study considers the effect of Leverage on green innovation to be uncertain.
3.3.4.4. Listing Years (age). The natural logarithm of the number of years the company has been listed plus one to measure enterprise maturity (Hu et al., 2021b). As stock listing may allow firms to access a larger funding pool and enhance their public image, firms that have been listed for a longer period may be more innovative. However, others argue that stock listing is not a necessary condition for increased green innovation as firms may pursue other business objectives after listing (Zhang et al., 2022b). Therefore, this study considers the relationship between age and green innovation to be uncertain.
3.3.4.5. Corporate governance measures (INST and inden). This study considers two important corporate governance variables: the shareholding ratio of institutional investors (INST) and proportion of independent directors on the board (Inden) (Hu et al., 2021b; Zhang et al., 2022b; Wang and Li, 2022). As important board members, institutional investors may play a key role in influencing a firm’s capital allocation.
However, due to weak public awareness and insufficient supervision towards environmental problems over the past decades, institutional investors may fail to capture green transition issues due to opportunistic and short-sighted behaviours (Wang and Li, 2022). Consequently, a negative relationship is expected between INST and green innovation. While independent directors play an important role in corporate governance, their ability to influence corporate decision-making remains doubtful (Zhang et al., 2022b). Thus, the relationship between Inden and green innovation is expected to be uncertain.
3.3.4.6. Corporate social responsibility. CSR is proxied by a dummy variable which equals one if enterprises disclose their CSR reports, and zero otherwise (Hu et al., 2021b). Firms that care about their social impact may take a more active attitude towards green technology innovation (Baker et al., 2021). Therefore, a positive relationship is assumed between disclosing CSR reports and green innovation.
After the variable construction, in the next section, this study first examines the effect of GFP on green innovation among HPEs using a DID model. Next, a series of tests, such as parallel trend analysis and propensity score matching-DID (PSM-DID), are conducted to ensure the robustness of the baseline results. The study then conducts the heterogeneity analysis, incorporating factors including types of green innovation, ownership structure of firms, and degree of external finance dependence, to explore the relationships under different scenarios. Further, to identify firms’ responses to different types of environmental regulations, this study investigates the moderating effect of CERs and VERs on the relationship between GFP and green innovation in HPEs. Finally, to comprehensively understand the effects of GFP, this study explores the relationship between GFP and green innovation for green enterprises.

4. Empirical results

4.1. Descriptive statistics and correlation analysis

Table 1 presents the descriptive statistics for all variables used in the baseline regression. Among the 14,789 samples from 2007 to 2019, the minimum and maximum values of GI are 0 and 3.829, respectively, indicating substantial variations in green innovation levels among the sample firms. DID’s mean value is 0.152 , suggesting that approximately of the sample firms are affected by the GFP. The results for other variables are consistent with the literature and fall within a reasonable range. Table 2 reports the correlation matrix between variables. The observed relationship between DID and GI demonstrates a significant positive correlation, with a coefficient of 0.097 . This suggests that the implementation of China’s GFP can significantly enhance the green innovation performance of HPEs. Further, the results of the correlation analysis provide preliminary evidence supporting the applicability of the Porter hypothesis in the context of China. Meanwhile, other variables have also been found to strongly correlate with green innovation performance, indicating the appropriateness of the chosen variable (Zhang et al., 2020).

4.2. Baseline results

First, based on Eq. (1), this study examines the effect of GFP on HPEs’ green innovation. The results are listed in Table 3. Columns 1 and 2 show the results for all sampled firms, while columns 3-4 show the results when green enterprises are excluded (i.e. for HPEs) mainly due to concerns about estimation bias (Zhang et al., 2022b). Columns 1 and 3 only include the DID variable, while columns 2 and 4 also include additional control variables. The coefficients of DID are significantly positive regardless of the inclusion of other control variables and green enterprises. Such empirical results support hypothesis 1, that is, the GFP bolsters the green innovation of Chinese HPEs significantly. Drawing on the Porter hypothesis, well-formulated environmental policies can foster enterprises’ innovation, achieving simultaneous pollution reduction and competitiveness enhancement. To secure more capital from financial
Table 1
Descriptive statistics. .
Variable Obs. Mean Std. Dev. Min Max
GI 14,789 0.425 0.839 0.000 3.829
DID 14,789 0.152 0.359 0.000 1.000
ROA 14,789 0.044 0.050 -0.165 0.192
Size 14,789 22.230 1.308 19.890 26.069
Leverage 14,789 0.421 0.201 0.048 0.845
Age 14,789 2.145 0.785 0.000 3.258
INST 14,789 0.466 0.241 0.003 0.910
Inden 14,789 0.372 0.053 0.308 0.571
CSR 14,789 0.295 0.456 0.000 1.000
Notes: The full terms for variables’ abbreviations: GI: Green Innovation; DID: Difference-in-Differences; ROA: Profitability; Size: Firm Size; Leverage: Leverage; Age: Listing Years; INST: Shareholding Ratio of Institutional Investors; Inden: Proportion of Independent Directors; CSR: Corporate Social Responsibility.
One observation is dropped in the baseline regression, which leads to a minor difference in the total observations between the baseline model and descriptive statistics because this study controls firm-level fixed effect and uses the command ‘reghdfe’ in Stata to regress linear models. Maintaining singleton groups in linear regressions where fixed effects are nested within clusters can overstate statistical significance and lead to incorrect inference. Hence, the ‘reghdfe’ package now automatically drops singletons (Correia, 2015).
Table 2
Pearson correlation coefficients.
GI DID ROA Size Leverage Age INST Inden CSR
GI 1
DID 0.097*** 1
ROA 0.020** -0.105*** 1
Size 0.270*** 0.092*** -0.041*** 1
Leverage 0.107*** 0.015* -0.367*** 0.533*** 1
Age 0.060*** 0.084*** -0.176*** 0.418*** 0.388*** 1
INST 0.061*** -0.061*** 0.146*** 0.433*** 0.247*** 0.183*** 1
Inden 0.030*** -0.005 -0.047*** 0.059*** -0.001 -0.016** -0.065*** 1
CSR 0.203*** 0.081*** 0.061*** 0.454*** 0.150*** 0.228*** 0.218*** 0.019** 1
Note: *, **, and *** indicate statistical significance at the , and levels, respectively. The full terms for variables’ abbreviations: GI: Green Innovation; DID: Difference-in-Differences; ROA: Profitability; Size: Firm Size; Leverage: Leverage; Age: Listing Years; INST: Shareholding Ratio of Institutional Investors; Inden: Proportion of Independent Directors; CSR: Corporate Social Responsibility.
Table 3
Baseline regression.
Variables (1) (2) (3) (4)
GI GI GI GI
DID 0.090** 0.108*** 0.107** 0.123***
(2.08) (3.22) (2.42) (3.58)
ROA 0.128 0.136
(1.03) (0.78)
Size 0.138*** 0.140***
(5.20) (6.60)
Leverage -0.060 -0.062
(-1.03) (-0.83)
Age 0.028 0.023
(0.57) (0.43)
INST -0.181*** -0.215***
(-3.20) (-3.94)
Inden -0.120 -0.082
(-0.98) (-0.95)
CSR 0.095** 0.093**
(2.71) (2.86)
Constant 0.461*** -2.555*** 0.409*** -2.643***
(79.66) (-5.11) (60.83) (-6.44)
Firm F.E. Yes Yes Yes Yes
Industry F.E. Yes Yes Yes Yes
Year F.E. Yes Yes Yes Yes
Region F.E. Yes Yes Yes Yes
Observations 16,814 16,814 14,788 14,788
R-squared 0.689 0.692 0.677 0.682
Note: *, **, and *** indicate statistical significance at the , and levels, respectively. All regressions are robustly clustered to industries. Robust tstatistics are enclosed in parentheses. The full terms for variables’ abbreviations: GI: Green Innovation; DID: Difference-in-Differences; ROA: Profitability; Size: Firm Size; Leverage: Leverage; Age: Listing Years; INST: Shareholding Ratio of Institutional Investors; Inden: Proportion of Independent Directors; CSR: Corporate Social Responsibility.
institutions and sustain their competitive edge, HPEs are motivated to maximise the green innovation outputs with funds available. Hu et al. (2021b) find a similar result for the effectiveness of the Porter hypothesis in China.
Regarding control variables, only Size, INST, and CSR significantly impact green innovation, in line with prior studies (Hu et al., 2021b; Wang and Li, 2022). Compared with smaller firms, only large firms may have sufficient financial capital and experience in R&D activities. This translates into increased green innovation outputs. Meanwhile, to maintain their leadership in their respective industries, large firms are also under pressure to achieve continuous technological advancements (Wang and Li, 2022). Next, the shareholding ratio of institutional investors has a significant negative relationship with firms’ green innovation outputs, which is consistent with expectations. Institutional investors tend to be relatively risk-averse. However, as R&D investments are highly risky, firms with more institutional investors may find it hard to gain the board’s approval/support for such investments (Wang and Li ,
2022). Lastly, firms disclosing CSR reports may care more about their social perception and are more likely to engage actively in green innovation.
Among other control variables with insignificant results, having higher profitability and a longer listing period does not necessarily guarantee more green innovation outputs as firms’ R&D decisions may be affected by a series of complicated factors. Further, although firms with higher leverage levels may be subject to stricter lending restrictions and increased financial risks, this does not necessarily restrain their green innovation. (Zhang et al., 2022b). Finally, independent directors’ influence on corporate decision-making may be limited.

4.3. Robustness tests

An important assumption of the DID model is that the trends of the treated and controlled groups are similar before policy implementation. This study uses an event study method to test this assumption (Zhang et al., 2021a). Following Lu et al. (2022), year dummies are constructed to track the effect of GFP in 2012. Post_4 to Post_1 are dummy variables that equal one if the observation year is 2008-2011, respectively, and zero otherwise. Post_0 to Post_7 are dummy variables that equal one if the observation year is 2012-2019, respectively, and 0 otherwise. Post_4 to Post_7 are respectively multiplied with Treat to obtain 12 dummy variables (DID_4 to DID_7). Then, Eq. (1) is re-estimated with DID_4 to DID_7 to examine the parallel trends assumption. The coefficients of DID_4 to DID_7 are presented in Fig. 2, corresponding to points -4 to 7 . All coefficients are insignificant (all confidence intervals include zero), suggesting that all interactions before 2012 are insignificant. Therefore, the parallel trend assumption is supported and the DID model can be used.
To reduce the potential endogeneity problems caused by selfselection bias, this study employs the PSM method to match the treatment and control groups, and reports the results in Table 4. Following Cui et al. (2022), this study selects the control variables ROA, Size, Leverage, Age, INST, Inden, and CSR as the covariates to run a logit regression to obtain the propensity score of enterprises in the treatment group and then matches enterprises in the control groups with similar characteristics using the neighbour match method. This method can effectively solve the initial difference between the treatment and control groups, thus making the estimation results more accurate (Zhang and Jiang, 2022). After performing the PSM, the unmatched observations are deleted and the estimations are repeated. The results shown in column 1 are consistent with the main findings of the baseline model.
The Chinese government has initiated a series of environmental protection policies over the past two decades. As the inclusion of a long
Fig. 2. Parallel trend analysis.
Table 4
Other tests for the baseline model.
Variables (1) (2) (3) (4)
PSM-DID 2008-2015 Delete2008&2009 Delete Provinces
DID 0.123*** (3.56) 0.101*** (3.10) 0.101*** (3.17) 0.132** (2.66)
Constant -2.650*** (-6.47) -2.974*** (-5.66) -2.392*** (-6.08) -2.924*** (-6.49)
Control Variables Yes Yes Yes Yes
Firm F.E. Yes Yes Yes Yes
Industry F.E. Yes Yes Yes Yes
Year F.E. Yes Yes Yes Yes
Region F.E. Yes Yes Yes Yes
Observations 14,778 9010 13,182 12,385
R-squared 0.682 0.728 0.700 0.660
Note: *, **, and *** indicate statistical significance at the , and levels, respectively. All regressions are robustly clustered to industries. Robust tstatistics are enclosed in parentheses. The full terms for variables’ abbreviations: DID: Difference-in-Differences.
sample period after the implementation of GFP may lead to biased estimations, the sample period is shortened to 2008-2015 (Wang et al., 2022a). The coefficient of DID remains significantly positive in column 2. However, other events during the sample period, such as the Great Financial Crisis (2008-2009) and the Beijing Olympics (2008), may also affect the estimation results as these events may have disrupted normal business activities (Zhang et al., 2022b). To remove the potential effects of the great financial crisis, this study drops the observations during 2008 and 2009, and reruns the regression. The results in column 3 are consistent with the baseline results. As for the impact of the Beijing Olympics, a few new initiatives were introduced during this period, including the ‘Green Olympics’ concept, and the “blue-sky and green-water projects” in Beijing and surrounding regions. In addition, in 2015, with the introduction of the Outline of the Plan for the Coordinated Development of Beijing-Tianjin-Hebei, issues related to environmental protection escalated to a historically high level. Therefore, following Tang et al. (2020), this study drops the data of related regions in China and reruns the baseline model. The findings in column 4 remain robust. The study also employs the placebo test by randomly
generating a selection of HPEs and repeating the sampling process 500 times. The results remain robust (see Appendix 4).
Thus, the DID model employed here is a good fit for the sample, and for both heavily polluting and green enterprises. Overall, GFP emerges as an important factor which affects firms’ innovation outputs. In the following heterogeneity analysis, although the inclusion of green enterprises did not affect the estimated results in the baseline model, only HPEs are included to minimise the estimation bias.

4.4. Heterogeneity analysis

4.4.1. Heterogeneity analysis by the types of green innovation

It is suggested that regulations may stimulate different types of green innovation differently due to the investments needed, risks involved, and regulatory intensity (Jaffe and Palmer, 1997). To comprehensively investigate GFP’s impact on different types of green innovation, this study divides green innovation into green innovation quality performance (GI_qua), and green innovation increment performance (GI_inc). As Wang and Li (2022) note, GI_qua is more related to newly created inventions, while GI_inc tends to build on existing technologies or products. Consequently, compared with GI_inc, GI_qua requires more resource inputs and faces higher uncertainties. Hence, it should be affected more by the GFP.
GI_qua is measured by the natural logarithm of one plus the number of green invent patent applications of firm in year (Zhang et al., 2023). GI_inc is measured by the natural logarithm of one plus the number of green utility patent applications of firm i in year t (Wang and Li, 2022). Meanwhile, diversified ownership categories of enterprises indicate that green patents are not only an internal research activity but an inter-firm cooperative activity (Liu and Wang, 2023). Patent applications can be divided into independent and joint green innovation. Considering the variation of the dependent variable GI, this study also considers different green patent indicators. Therefore, considering that both GI_qua and GI_inc comprise independent and joint green innovation, we have GI_qua_ind, GI_qua_joi, GI_inc_ind, and GI_incjoi (Liu and Wang, 2023). The results are reported in Table 5.
The interaction item, DID, significantly stimulates all types of green innovation, regardless of the variables used. Notably, the coefficient of GI_inc is more significant than that of GI_qua (GI_qua: 0.069, significant at level and GI_inc: 0.124 , significant at in Table 5), in line with expectations and prior research (Wang and Li, 2022). To attract external funding, HPEs are keen to advance their green innovation performance to meet the loan requirements under the Chinese GFP framework. Increasing the number of patents is easier than improving their quality (Zhang et al., 2022b). This may be particularly true for firms with limited green innovation experiences and operating in heavily polluting industries. Similar conclusions hold for either independent or joint green innovation, as shown in columns 3-6. These results indicate that GFP not only motivates HPEs to improve their own green innovation capabilities, but also enables them to value cooperation with other companies.

4.4.2. Heterogeneity analysis by ownership structure of firms

Next, this study explores the influence of the ownership structure of firms on the relationship between GFP and HPEs’ green innovation performance by dividing the sample into state-owned enterprises (SOEs) and non-SOEs (Yao et al., 2021). The results are presented in Table 6.
The coefficients of DID in columns 1-3 are significantly positive and
Table 5
Heterogeneity analysis for green innovation.
Variables (1) (2) (3) (4) (5) (6)
GI_qua GI_inc GI_qua_ind GI_inc_ind GI_qua_joi GI_inc_joi
DID 0.069** (2.25) 0.124*** (5.08) 0.048* (2.09) 0.096*** (5.71) 0.032* (2.04) 0.029** (2.23)
Constant -2.408*** (-6.14) -1.379*** (-3.83) -2.005*** (-5.12) -1.185*** (-4.50) -0.736** (-2.97) -0.415 (-1.69)
Control Variables Yes Yes Yes Yes Yes Yes
Firm F.E. Yes Yes Yes Yes Yes Yes
Industry F.E. Yes Yes Yes Yes Yes Yes
Year F.E. Yes Yes Yes Yes Yes Yes
Region F.E. Yes Yes Yes Yes Yes Yes
Observations 14,788 14,788 14,788 14,788 14,788 14,788
R-squared 0.656 0.637 0.624 0.619 0.525 0.503
Note: *, **, and *** indicate statistical significance at the , and levels, respectively. All regressions are robustly clustered to industries. Robust t -statistics are enclosed in parentheses. The full terms for variables’ abbreviations: GI_qua: Green Innovation Quality; GI_inc: Green Innovation Increment; GI_qua_ind: Independent Green Innovation Quality; GI_inc_ind: Independent Green Innovation Increment; GI_qua_joi: Joint Green Innovation Quality; GI_inc_joi: Joint Green innovation Increment; DID: Difference-in-Differences.
greater than those in columns 4-6. GFP promotes both the quality and quantity of green innovation for SOEs (GI_qua: 0.117, significant at 10% level and GI_inc: 0.161 , significant at in Table 5), but only the quantity for non-SOEs. This is unsurprising as compared with non-SOEs, SOEs tend to be favoured by bank credit, enabling them to participate in high-quality green innovation (Ouyang et al., 2020). In turn, the close connection between the SOEs and the Chinese government has also exposed the former to increased pressure in complying with state-mandated emissions reduction targets (Wang et al., 2022a). Nevertheless, for both SOEs and non-SOEs, incremental green innovation remains the key focus mainly because the sample is comprised of heavy polluters only. For instance, any adjustments/minor amendments to existing green technologies may help them achieve significant emissions reductions. However, they are neither capable nor incentivised enough to engage in more high-quality green innovation.

4.4.3. Heterogeneity analysis by external finance dependence

The essence of GFP’s design is linking the availability of bank credit with the environmental performance of firms. Therefore, firms that rely heavily on external financing are more likely to be affected by the GFP (Sun et al., 2019). To measure the extent of firms’ reliance on external capital, following Rajan and Zingales (1998) and Sun et al. (2019), this study constructs an external finance dependence (EFD) index and then classifies firms into two categories high-EFD and low-EFD according to their reliance. The results are reported in Table 7.
The results for both high- and low-EFD firms in columns 1-6 are consistent with earlier findings. However, as shown in columns 1-3, GFP has a larger effect on the green innovation performance of high-EFD HPEs, which is consistent with prior studies (Sun et al., 2019). When the Chinese government advocates green development, it may also adjust credit policies to restrict the inflow of bank loans to heavily polluting activities accordingly (Wang and Li, 2022). This forces the HPEs with high-EFD to enhance their green innovation performance, signifying their determination to achieve sustainable growth to secure banking credit. Notably, GFP significantly improves both the quality and quantity of green innovation in the high-EFD group, but only the quantity in the low-EFD group. This could be attributed to the fact that high-EFD firms are more inclined to boost advanced green innovation performance to ensure future green credit availability from banks. However, as they rely less on external finance, low-EFD firms might be reluctant to assume higher risks associated with advanced green
innovation. In contrast, low-EFD firms tend to enhance their GI_inc primarily to comply with the environmental protection mandates of relevant regulations.

4.5. Moderation effects analysis

The CERs and VERs play a key role in the green transformation process of Chinese environmental regulations, leading to the development of a synergistic effect in green innovation promotion. Here, additional tests are conducted to investigate the moderating effect of other environmental regulations on the relationship between the GFP and green innovation among HPEs. In the analysis, the study uses the environmental violation imposed by the government to measure the impact of the penalty-based environmental regulation, the green subsidies granted by the government to proxy for the incentive-based environmental regulation and the pollutant emissions disclosure for influence exerted by voluntary environmental regulation. The study conducts the moderating analysis separately for these three types of environmental regulations. The results are reported in Table 8.
As a commend-based regulatory instrument, CER_Penalty has a negative relationship with GI and GI_qua (Columns 1-3). This is unsurprising as CER_Penalty implemented by the Chinese government represents additional environmental costs to the HPEs, reducing the capital available for their R&D activities. In some extreme cases, firms could be suspended for rectification due to environmental violations (Ma et al., 2022). In terms of the moderation effect, CER_Penalty has no significant impact on the relationship between GFP and green innovation. Thus, hypothesis 2a is supported. This may be because GFP is more of a market mechanism but CER_Penalty is more of a policy instrument. They tend to function on firms’ innovation behaviours differently. Notably, as only 47 firms, or of observations, are fined over the sample period. Thus, the CER_Penalty is used more like a demonstrating mechanism to showcase the government’s intention.
CER_Incentive has a significantly positive moderation effect (e.g. the coefficient of DID in column 4 of Table 8 (0.031) is significant at 5% level), in support of hypothesis 2b. However, it is unable to significantly affect firms’ green innovation on its own. Consistent with Huang et al. (2019), if the HPE can access state subsidies, it can favourably position itself to secure additional green credit from banks. With sufficient funding, high-quality green innovation is more likely to be delivered. Meanwhile, to continuously attract future government funding, instead of relying on short-term rent-seeking, firms are also motivated to fulfil the requirements of the Chinese government and financial institutions with the highest possible quality. This may enhance their green innovation efficiency. This may be why the moderation effect of CER_Incentive is more significant in the case of green innovation quality
Table 6
Heterogeneity analysis for the property rights structure.
Variables SOE Non-SOE
(1) (2) (3) (4) (5) (6)
GI GI_qua GI_inc GI GI_qua GI_inc
DID 0.181** (2.96) 0.117* (2.00) 0.161 *** (5.20) 0.037* (1.88) -0.008 (-0.41) 0.074*** (5.26)
Constant -2.337*** (-5.00) -2.142*** (-3.69) -1.055*** (-5.12) -3.027*** (-6.30) -2.658*** (-6.18) (-3.81)
Control Variables Yes Yes Yes Yes Yes Yes
Firm F.E. Yes Yes Yes Yes Yes Yes
Industry F.E. Yes Yes Yes Yes Yes Yes
Year F.E. Yes Yes Yes Yes Yes Yes
Region F.E. Yes Yes Yes Yes Yes Yes
Observations 6674 6674 6674 7870 7870 7870
R-squared 0.734 0.710 0.684 0.630 0.598 0.586
Note: *, **, and *** indicate statistical significance at the , and levels, respectively. All regressions are robustly clustered to industries. Robust t -statistics are enclosed in parentheses. The full terms for variables’ abbreviations: GI: Green Innovation; GI_qua: Green Innovation Quality; GI_inc: Green Innovation Increment; DID: Difference-in-Differences; SOE: State-owned Enterprise.
Table 7
Heterogeneity analysis for external finance dependence.
Variables High-EFD Low-EFD
(1) (2) (3) (4) (5) (6)
GI GI_qua GI_inc GI GI_qua GI_inc
DID 0.127*** (3.76) 0.080** (2.86) 0.122*** (6.38) 0.111** (2.69) 0.049 (0.96) 0.114*** (8.04)
Constant -2.808*** (-4.57) -2.317*** (-3.68) -1.817*** (-4.31) -3.026*** (-4.24) (-4.82) -2.121*** (-3.28)
Control Variables Yes Yes Yes Yes Yes Yes
Firm F.E. Yes Yes Yes Yes Yes Yes
Industry F.E. Yes Yes Yes Yes Yes Yes
Year F.E. Yes Yes Yes Yes Yes Yes
Region F.E. Yes Yes Yes Yes Yes Yes
Observations 4748 4748 4748 4723 4723 4723
R-squared 0.716 0.682 0.682 0.769 0.750 0.738
Note: *, **, and *** indicate statistical significance at the , and levels, respectively. All regressions are robustly clustered to industries. Robust t -statistics are enclosed in parentheses. The full terms for variables’ abbreviations: GI: Green Innovation; GI_qua: Green Innovation Quality; GI_inc: Green Innovation Increment; DID: Difference-in-Differences; EFD: External Finance Dependence.
rather than the simpler incremental green innovation.
The moderation effect of VER is significantly positive for all types of green innovation measures (Columns 7-9) (e.g. the coefficient of DID in column 7 of Table 8 (0.023) is significant at level). Thus, hypothesis 3 is supported. The maturing environmental information disclosure in the Chinese market has reduced information asymmetry. The higher VER intensity signifies the green transition determination of HPEs and their motivation to engage more in green innovation activities in China (Huang and Chen, 2015). Furthermore, this positive impact is more prominent for green innovation quality than increment (Columns 8-9). To achieve a more thorough green transformation, HPEs try to produce high-quality green innovation (Bu et al., 2020). However, due to the lack of core green technologies and green capital, HPEs also invest part of their financial resources in green innovation increment to meet the compliance requirements of financial institutions and the government.
Thus, CER_Incentive and VER can positively moderate the relationship between GFP and green innovation performance in most cases, indicating the continued enhancement of China’s environment regulation system and the applicability of the Porter hypothesis in the Chinese market. However, CER_Penalty tends to be ineffective. Meanwhile, green quality innovation is more significantly promoted by the CER_Incentive and VER than incremental innovation, as firms are more motivated to build long-term competitive advantages in their green transition. The finding is further illustrated with the moderation effect plots in Appendix 5.

4.6. Channel analysis for corporate green investments

This study explores how GFP influences firms’ green innovation performance. Specifically, this study focuses on the efficiency of green capital utilisation (GreenInv) in HPEs. The data of GreenInv is collected manually from the notes of ‘projects under construction’ in the annual report of enterprises (Lu, 2021). Specifically, this study uses the Word Embedding model to construct a green investment dictionary and then extracts the GreenInv data based on this dictionary. After data cleaning, the amount of different green investment items is aggregated to create the GreenInv variable. The results are reported in Table 9.
GFP and GreenInv have an insignificant relationship, while GreenInv and green innovation are significantly related. Thus, while GFP does not affect the green investment made by HPEs (Column 1), it can significantly enhance their green innovation performance (Column 3). Similar results are found for green innovation quality and increment (Columns 5 and 7). This may be because the implementation of GFP may further constrain the capital inflow to HPEs, they may be motivated to improve their innovation efficiency given the limited funding. This may be the only viable way for such cash-strapped firms to transform themselves for long-term sustained development. Yan et al. (2022) find similar results in their study of green finance and corporate investment efficiency in the Chinese market. Consequently, GFP imposes added compliance obligations and elevates social reputational pressure on HPEs, compelling these firms to augment their green innovation outputs. Given the rising awareness of environmental protection in China, GFP also captures
Table 8
Moderation effect analysis.
Variables (1) (2) (3) (4) (5) (6) (7) (8) (9)
GI GI_qua GI_inc GI GI_qua GI_inc GI GI_qua GI_inc
DID 0.112*** (3.39) 0.067** (2.25) 0.110*** (5.57) 0.129* (2.06) 0.083 (1.43) 0.095*** (3.58) 0.085** (2.91) 0.038 (1.52) 0.101*** (5.31)
CER_Penalty DID 0.050 (0.25) 0.079 (0.89) 0.084 (0.40)
CER_Penalty -0.121*** (-3.14) -0.193*** (-3.22) 0.018 (0.66)
CER_Incentive DID 0.031** (2.74) 0.022*** (9.87) 0.027* (2.12)
CER_Incentive -0.001 (-0.36) -0.002 (-0.80) -0.001 (-0.41)
VER DID 0.023*** (4.72) 0.026*** (8.86) 0.008** (2.19)
0.005 (1.28) -0.000 (-0.01) 0.005* (1.95)
Constant -2.500*** (-6.01) -2.337*** (-5.66) -1.280*** (-4.23) -3.109*** (-8.75) -2.931*** (-10.21) -1.954*** (-13.31) -2.573*** (-6.16) -2.417*** (-5.87) -1.299*** (-4.33)
Control Variables Yes Yes Yes Yes Yes Yes Yes Yes Yes
Firm F.E. Yes Yes Yes Yes Yes Yes Yes Yes Yes
Industry F.E. Yes Yes Yes Yes Yes Yes Yes Yes Yes
Year F.E. Yes Yes Yes Yes Yes Yes Yes Yes Yes
Region F.E. Yes Yes Yes Yes Yes Yes Yes Yes Yes
Observations 14,064 14,064 14,064 4779 4779 4779 14,064 14,064 14,064
R-squared 0.693 0.670 0.650 0.696 0.666 0.669 0.694 0.670 0.651
Note: *, **, and *** indicate statistical significance at the , and levels, respectively. All regressions are robustly clustered to industries. Robust t -statistics are enclosed in parentheses. The full terms for variables’ abbreviations: GI: Green Innovation; GI_qua: Green Innovation Quality; GI_inc: Green Innovation Increment; DID: Difference-in-Differences; CER_Penalty: Penalty-based Environmental Regulation; CER_Incentive: Incentive-based Environmental Regulation; VER: Voluntary Environmental Regulation.
Table 9
Channel analysis of corporate green investment.
Variables (1) (2) (3) (4) (5) (6) (7)
GreenInv GI GI GI_qua GI_qua GI_inc GI_inc
GreenInv 0.010*** (4.22) 0.005*** (3.59) 0.007** (2.78)
DID 0.080 0.160*** 0.160*** 0.102*** 0.102*** 0.174*** 0.173***
Constant -2.443 -1.063*** (-3.27) (-6.38) -1.154*** -0.312 -0.294
Control Variables Yes Yes Yes Yes Yes Yes Yes
Firm F.E. Yes Yes Yes Yes Yes Yes Yes
Industry F.E. Yes Yes Yes Yes Yes Yes Yes
Year F.E. Yes Yes Yes Yes Yes Yes Yes
Region F.E. Yes Yes Yes Yes Yes Yes Yes
Observations 3045 3045 3045 3045 3045 3045 3045
R-squared 0.651 0.729 0.729 0.719 0.719 0.702 0.702
Note: *, **, and *** indicate statistical significance at the , and levels, respectively. All regressions are robustly clustered to industries. Robust t -statistics are enclosed in parentheses. The full terms for variables’ abbreviations: GI: Green Innovation; GI_qua: Green Innovation Quality; GI_inc: Green Innovation Increment; DID: Difference-in-Differences; GreenInv: Green Investment.
societal concern, pressing firms to boost their innovation efficiency to secure future green capital or to prevent it from being left behind.

4.7. The impact of GFP on green enterprises

Since the GFP affects both highly polluting and green enterprises simultaneously, a comparative study is conducted here to test the robustness of the findings. According to Al-Tuwaijri et al. (2004) and Wang et al. (2020), green enterprises refer to firms whose main business involves environmental-friendly products. Based on annual reports and the industry classification of the listed companies developed by Tonghuashun Finance and Economic, this study manually analyses the main business of every firm to determine whether it can be classified as a green enterprise. Furthermore, this study checks the selection results
of green enterprises with the Hexun, one of the most famous financial and economic platforms, to ensure the accuracy of the results. Then, we replace the treated group with green enterprises. Specifically, Treat is a dummy variable equalling one if the firm is a green enterprise. Post is another dummy variable that equals one if the GFP has been implemented, or the samples are within the 2012-2019 period. The interaction Treat Post (DID) should be significant if the DID effect exists (Wang and Li, 2022). The results are reported in Table 10.
Similar to HPEs, GFP can significantly promote green innovation among green enterprises (Column 1). To maintain market competitiveness, green enterprises are also under pressure to enhance their innovation capacity to deliver better green products and services (Xu and Li, 2020). Further, GFP promotes the green innovation quality and increment of green enterprises (Columns 2-7). Notably, the promotional effect of GFP on green innovation quality is greater for green enterprises than that in HPEs. This is expected as green enterprises tend to have a better foundation in green innovation. Therefore, they are more likely to concentrate more on high-quality green innovation to build their long-term competitive advantages in the Chinese market.
This study then applies similar tests to capture the impact of ownership structure, external finance dependence, and the moderating effect of government regulations among green enterprises. The results are available upon request. In general, the conclusions for HPEs hold. The GFP has a greater effect on green innovation among SOEs, especially for the green innovation quality performance. However, GFP has no effect on non-SOE green enterprises. This finding is different from that for non-SOE HPEs. Hu et al. (2021b) reach similar conclusions. Unlike HPEs, green enterprises are not that cash-strapped. Further, the non-SOE green enterprises are not largely influenced by government policies but are more likely to follow their own green development pace. In addition, green enterprises that depend heavily on external finance are more willing to improve green innovation performance to secure future funding, whereas those with low-EFD tend to care little about continuous green innovation outputs. This is in line with Sun et al. (2019). Compared with HPEs, green enterprises tend to already have a sound level of green innovation. Therefore, they may not experience serious difficulties in accessing funding directly from banks and other financial institutions (Peng et al., 2022).
Regarding the moderating effect of other environmental regulations, CER_Penalty still fails to positively moderate the effect of the GFP on green innovation for green enterprises. This is unsurprising as green enterprises tend to have better environmental performance and fewer environmental violations than the HPEs in the Chinese market. Regarding CER_Incentive, the significant moderating effect is only present in the case of green innovation quality performance. Given green enterprises tend to possess stronger green innovation capabilities, additional financial support from the Chinese government may encourage them to pursue more advanced innovation, driving the overall industrial structural upgrading. Finally, VER only significantly promotes the positive relationship between GFP and GI or GI-qua. This is consistent with earlier findings. Adhering to VER often demands a substantial allocation of resources, including time and finances. Consequently, GEs might opt to channel these resources into advanced green innovation instead of dispersing them across multiple projects (Huang and Chen, 2015).
Lastly, the channel analysis results for green enterprises are consistent with those for HPEs. Overall, the GFP is playing a more active role in stimulating green innovation efficiency among listed green enterprises in China (Xu and Li, 2020).

5. Conclusion and policy implications

5.1. Conclusion

China’s 12th Five-Year-Plan (2011-15) reported for the first time that the country was facing severe environmental degradation, showing the government’s interest in considering these issues. Indeed, various policy initiatives, including the GFP, were initiated to rebalance the economy for environmental protection and sustained development. The GFP can be regarded as a valuable market-based environmental regulatory instrument designed to mitigate environmental pollution and provide more funding for green activities (Lu et al., 2022). This study empirically investigates the influence of GFP on green innovation using panel data on Chinese listed companies from 2007 to 2019. A DID model is employed for the baseline test, and then a series of tests, such as the parallel trend analysis and PSM-DID, are conducted to ensure the robustness of the results. Next, this study explores the heterogeneous impacts of various factors, including types of green innovation (green quality innovation and green incremental innovation), the ownership structure of firms (SOEs and non-SOEs), and the degree of external finance dependence.
Overall, the results show that GFP can enhance the green innovation performance of both heavily polluting (e.g. the coefficient of DID in column 4 of Table 3 (0.123) is significant at level) and green enterprises (e.g. the coefficient of DID in column 1 of Table 10 (0.104) is significant at level). Compared with green enterprises, heavy polluters tend to pay more attention to the green innovation increment due to their limited green innovation experiences and financial resources (GI_qua: 0.069 , significant at level and GI_inc: 0.124 , significant at in Table 5). Incremental green innovation is easier and more feasible for them to meet government regulatory requirements while achieving a certain degree of green transformation. Meanwhile, compared to HPEs, with the support of GFP, green enterprises have a stronger capability to deliver green quality innovation and this may help them build up longterm competitive advantages. SOEs are also better motivated by the GFP to deliver high-quality green innovation, given their closer relationship with the government. Compared with non-SOEs, SOEs tend to be favoured by banking credit but are also under more pressure to meet statemandated emissions reduction requirements (Wang et al., 2022a). Lastly, firms that need more external financial support are more likely to be affected by the GFP as they are forced to deliver superior performance to meet the borrowing conditions.
Given the close connection between other environmental regulations, the GFP, and firm innovation, this study further investigates the moderation effects of different types of environmental regulations, including CERs and VERs. The penalty-based regulation, CER_Penalty, has no significant moderation effect, while the incentive-based regulation (CER_Incentive) can promote the relationship between the GFP and green innovation for HPEs significantly (e.g. the coefficient of DID in column 4 of Table 8 (0.031) is significant at level). A similar conclusion is also reached for the VER (e.g. the coefficient of DID in column 7 of Table 8 (0.023) is significant at level). Moreover, the CER_Incentive and VER have more significant positive moderation effects for higher-quality green innovation, especially for green enterprises. A higher intensity of VER signifies the green transition determination of firms, signifying their motivation to engage more in high-quality green innovation activities (Huang and Chen, 2015). Lastly, the channel analysis shows that the GFP can enhance green innovation performance by improving the efficiency of green investment use.

5.2. Policy implications

First, more targeted GFPs can be implemented to encourage greater bank lending to HPEs for increased green innovation. This can help accelerate overall industrial transformation. Next, stimulated by GFP, although HPEs are willing to innovate, they tend to focus more on
Table 10
Variables (1) (2) (3) (4) (5) (6) (7)
GI GI_qua GI_inc GI_qua_ind GI_inc_ind GI_qua_joi GI_inc_joi
DID 0.104*** 0.098*** 0.107*** 0.045* 0.040** 0.077*** 0.080***
(3.25) (4.19) (4.84) (1.81) (2.43) (13.60) (5.09)
Constant -2.626*** -2.247*** -1.529** -1.863*** -1.198** -0.782* -0.579*
(-4.47) (-4.45) (-2.74) (-4.31) (-2.77) (-2.12) (-2.03)
Control Variables Yes Yes Yes Yes Yes Yes Yes
Firm F.E. Yes Yes Yes Yes Yes Yes Yes
Industry F.E. Yes Yes Yes Yes Yes Yes Yes
Year F.E. Yes Yes Yes Yes Yes Yes Yes
Region F.E. Yes Yes Yes Yes Yes Yes Yes
Observations 13,496 13,496 13,496 13,496 13,496 13,496 13,496
R-squared 0.698 0.672 0.648 0.654 0.637 0.481 0.480
Note: *, **, and *** indicate statistical significance at the , and levels, respectively. All regressions are robustly clustered to industries. Robust t -statistics are enclosed in parentheses. The full terms for variables’ abbreviations: GI: Green Innovation; GI_qua: Green Innovation Quality; GI_inc: Green Innovation Increment; GI_qua_ind: Independent Green Innovation Quality; GI_inc_ind: Independent Green Innovation Increment; GI_qua_joi: Joint Green Innovation Quality; GI_inc_joi: Joint Green innovation Increment; DID: Difference-in-Differences.
Table 11
Description of variables.
Type Abbreviated Variable Variable Name Variable Definitions Data Source
Dependent Variable GI Green innovation Natural logarithm of the sum of 1 and the number of green patent applications. CNRDS
GI_inc Green Innovation Increment Natural logarithm of the sum of 1 and the number of green utility patent applications. CNRDS
GI_inc_ind Independent Green Innovation Increment Natural logarithm of the sum of 1 and the number of independent green utility patent applications. CNRDS
GI_inc_joi Joint Green innovation Increment Natural logarithm of the sum of 1 and the number of joint green utility patent applications. CNRDS
GI_qua Green Innovation Quality Natural logarithm of the sum of 1 and the number of green invention patent applications. CNRDS
GI_qua_ind Independent Green Innovation Quality Natural logarithm of the sum of 1 and the number of independent green invention patent applications. CNRDS
GI_qua_joi Joint Green Innovation Quality Natural logarithm of the sum of 1 and the number of joint green invention patent applications. CNRDS
Independent Variable Moderation Variables DID The interaction term of Treat Post Treat equals to 1 for HPEs, and 0 otherwise; Post equals to 1 for 2012-2019, and 0 for 2007-2011. Draft
CER_Penalty Penalty-based Environmental Regulation It is proxied by whether the company has had the environmental violation noted in the year. CNRDS
CER_Incentive Incentive-based Environmental Regulation Natural logarithm of the sum of the amount of green subsidy items received for a firm in a year. CSMAR
VER Voluntary Environmental Regulation The disclosure of six pollutant emissions information, it ranges from 0 to 6. CSMAR
Mediation Variable GreenInv Green investment Natural logarithm of the sum of the amount of green investment for a firm in a year. CSMAR
Control Variables ROA Profitability The ratio of net profits to total assets. CSMAR
Size Firm size Natural logarithm of the company’s total assets. CSMAR
Leverage Leverage The ratio of liabilities to total assets. CSMAR
Age Listing years Natural logarithm of numbers of years the company has been listed plus one. CSMAR
INST Shareholding ratio of institutional investors The proportion of shares held by institutional investors. CSMAR
Inden The proportion of independent directors Number of independent directors/Number of directors. CSMAR
CSR Corporate social responsibility A dummy variable which equals to 1 if enterprises disclose their CSR reports, and 0 otherwise. CSR reports
incremental innovation due to their lack of experience and resources. Therefore, policy efforts should encourage information/knowledge sharing among firms in the same industry. This can help improve resource use efficiency. Meanwhile, effective performance measures should be designed to evaluate the long-term green performance of HPEs. This may encourage their management to commit valuable financial resources towards higher quality green innovation, which requires more investments and a longer development cycle. Lastly, the Chinese government should use different environmental policy tools to leverage their synergistic effects effectively. Firms should be both pressured and motivated to engage more in high-quality green innovation. This requires the further improvement of the current green finance
system. As a key player, banks need to take a more proactive role in this process. They should establish comprehensive procedures to encourage promising green innovation at an early stage. Banks should also provide sufficient supervision throughout the process to encourage firms, especially the heavy polluters, to participate in more green innovation and socially responsible behaviours.

5.3. Limitations and future research directions

The study demonstrates that the implementation of GFP effectively bolsters the firms’ green innovation performance. Nonetheless, it is essential to highlight that an important objective of both green finance
policies and green innovation is the reduction of firms’ emissions. Investigating this issue is of significant research value as insights obtained can be used to verify whether firms are genuinely dedicated to the green transition, alleviating the potential greenwashing concerns. However, due to data availability (sporadic and non-uniform reporting), the current research is unable to obtain adequate firm-level emissions data in the Chinese market for more in-depth analysis at the firm level. Along with the further evolution of the information reporting system and the regulatory control framework, further studies could be conducted to explore the nexus among green finance policies, firms’ emissions reduction and green innovation strategies. The findings obtained could be used to deepen China’s green reform and provide valuable guidance to other developing economies in their green transition process.
Formal analysis, Conceptualization. Dan Luo: Writing – review & editing, Methodology, Formal analysis, Conceptualization. Yizhe Dong: Writing – review & editing, Resources. Chu Xiong: Software, Resources.

Declaration of competing interest

Dr. Dan Luo would like to acknowledge the financial report provided by the National Natural Science Foundation of China (71972010).
The remaining authors declare that they have no conflicts of interest to declare.

Data availability

Data will be made available on request.

CRediT authorship contribution statement

Kaiwen Chang: Writing – original draft, Software, Methodology,

Appendix

Appendix 1
Regression results of CER_Incentive1
Variables HPEs Green enterprises
(1) (2) (3) (4) (5) (6)
GI GI_qua GI_inc GI GI_qua GI_inc
DID
0.084**
(2.71)
0.033
(1.34)
0.100***
(4.40)
0.065*
(1.90)
0.061**
(2.67)
0.083***
(3.24)
CER_Incentive1 DID
0.045***
(4.72)
0.047***
(9.45)
0.032***
(7.94)
0.067***
(3.56)
0.060***
(6.27)
0.048**
(2.70)
CER_Incentive1
0.019***
(5.86)
0.013***
(4.81)
0.016***
(5.46)
0.017***
(4.27)
0.013***
(3.76)
0.012***
(4.35)
Constant
-2.679***
(-6.71)
-2.487***
(-6.52)
-1.366***
(-4.63)
-2.656***
(-4.56)
-2.292***
(-4.46)
-1.547**
(-2.72)
Control Variables Yes Yes Yes Yes Yes Yes
Firm F.E. Yes Yes Yes Yes Yes Yes
Industry F.E. Yes Yes Yes Yes Yes Yes
Year F.E. Yes Yes Yes Yes Yes Yes
Region F.E. Yes Yes Yes Yes Yes Yes
Observations 14,169 14,169 14,169 12,893 12,893 12,893
R-squared 0.681 0.655 0.637 0.700 0.674 0.650
Note: *, **, and *** indicate statistical significance at the , and levels, respectively. All regressions are robustly clustered to industries. Robust t-statistics are enclosed in parentheses. The full terms for variables’ abbreviations: GI: Green Innovation; GI_qua: Green Innovation Quality; GI_inc: Green Innovation Increment; DID: Difference-in-Differences; CER_Incentive1: Government Subsidy; HPEs: Heavily Polluting Enterprises.
Columns 1-3 and 4-6 for HPEs and green enterprises, respectively.
Appendix 2
The comparison of green innovation performance for HPEs and green enterprises
Variable Obs. Mean Std. Dev. Min Max
HPEs
GI 3316 0.544 0.899 0.000 3.829
GI_qua 3316 0.343 0.699 0.000 3.367
GI_inc 3316 0.364 0.699 0.000 3.045
Green enterprises
GI 2026 0.822 1.127 0.000 3.829
GI_qua 2026 0.565 0.913 0.000 3.367
GI_inc 2026 0.548 0.851 0.000 3.045
Appendix 3
Acronyms
Acronym Full name
Age Listing Years
CER Command-and-control Environmental Regulation
CER_Incentive Incentive-based Environmental Regulation
CER_Incentive1 Government Subsidy
CER_Penalty Penalty-based Environmental Regulation
CNRDS Chinese Research Data Services
CSMAR China Stock Market and Accounting Research
CSR Corporate Social Responsibility
DID Difference-in-Differences
EFD External Finance Dependence
HPEs Heavily Polluting Enterprises
Inden Proportion of Independent Directors
INST Shareholding Ratio of Institutional Investors
GCG Green Credit Guideline 2012
GFP Green Finance Policy
GI Green Innovation
GI_inc Green Innovation Increment
GI_inc_ind Independent Green Innovation Increment
GI_inc_joi Joint Green innovation Increment
GI_qua Green Innovation Quality
GI_qua_ind Independent Green Innovation Quality
GI_qua_joi Joint Green Innovation Quality
GreenInv Green Investment
Leverage Leverage
MER Market-based Environmental Regulation
PH Porter Hypothesis
Post Policy Implementation
ROA Profitability
Size Firm Size
SOEs State-owned Enterprises
Treat Treated Group
VER Voluntary Environmental Regulation

Appendix 4 Placebo tests

Appendix 5 Moderation effect plot
Moderation effect plot for CER_Penalty

Moderation effect plot for VER

References

Aldieri, L., Kotsemir, M., Vinci, C.P., 2020. The role of environmental innovation through the technological proximity in the implementation of the sustainable development. Bus. Strat. Environ. 29, 493-502. https://doi.org/10.1002/bse.2382.
Al-Tuwaijri, S.A., Christensen, T.E., Hughes Ii, K.E., 2004. The relations among environmental disclosure, environmental performance, and economic performance: a simultaneous equations approach. Account. Org. Soc. 29, 447-471. https://doi. org/10.1016/S0361-3682(03)00032-1.
Awada, M., Mestre, R., 2023. Revisiting the Energy-Growth nexus with debt channel. A wavelet time-frequency analysis for a panel of Eurozone-OECD countries. Data Sci. Financ. Econ. 3, 1-19. https://doi.org/10.3934/DSFE. 2023008.
Bai, Y., Song, S., Jiao, J., Yang, R., 2019. The impacts of government R&D subsidies on green innovation: evidence from Chinese energy-intensive firms. J. Clean. Prod. 233, 819-829. https://doi.org/10.1016/j.jclepro.2019.06.107.
Baker, E.D., Boulton, T.J., Braga-Alves, M.V., Morey, M.R., 2021. ESG government risk and international IPO underpricing. J. Corp. Finance 67, 1-22. https://doi.org/ 10.1016/j.jcorpfin.2021.101913.
Balsalobre-Lorente, D., Shahbaz, M., Roubaud, D., Farhani, S., 2018. How economic growth, renewable electricity and natural resources contribute to emissions. Energy Pol. 113, 356-367. https://doi.org/10.1016/j.enpol.2017.10.050.
Berrone, P., Fosfuri, A., Gelabert, L., Gomez-Mejia, L.R., 2013. Necessity as the mother of ‘green’inventions: institutional pressures and environmental innovations. Strat. Manag. J. 34, 891-909. https://doi.org/10.1002/smj.2041.
Bu, M., Qiao, Z., Liu, B., 2020. Voluntary environmental regulation and firm innovation in China. Econ. Modell. 89, 10-18. https://doi.org/10.1016/j. econmod.2019.12.020.
Carrión-Flores, C.E., Innes, R., Sam, A.G., 2013. Do voluntary pollution reduction programs (VPRs) spur or deter environmental innovation? Evidence from 33/50. J. Environ. Econ. Manag. 66, 444-459. https://doi.org/10.1016/j. jeem.2013.05.002.
Chang, K.W., Liu, L.L., Luo, D., Xing, K., 2023. The impact of green technology innovation on carbon dioxide emissions: the role of local environmental regulations. J. Environ. Manag. 340, 1-15. https://doi.org/10.1016/j.jenvman.2023.117990.
Cheng, C., Ren, X., Dong, K., Dong, X., Wang, Z., 2021. How does technological innovation mitigate CO2 emissions in OECD countries? Heterogeneous analysis using panel quantile regression. J. Environ. Manag. 280, 1-11. https://doi.org/ 10.1016/j.jenvman.2020.111818.
Chen, X.H., Tee, K., Elnahass, M., Ahmed, R., 2023. Assessing the environmental impacts of renewable energy sources: a case study on air pollution and carbon emissions in China. J. Environ. Manag. 345, 1-13. https://doi.org/10.1016/j. jenvman.2023.118525.
Chen, Y.S., Lai, S.B., Wen, C.T., 2006. The influence of green innovation performance on corporate advantage in Taiwan. J. Bus. Ethics 67, 331-339. https://doi.org/ 10.1007/s10551-006-9025-5.
Correia, S., 2015. Singletons, cluster-robust standard errors and fixed effects: a bad mix. Technical Note. Duke University, pp. 1-7. http://scorreia.com/research/singletons. pdf.
Cui, X., Wang, P., Sensoy, A., Nguyen, D.K., Pan, Y., 2022. Green credit policy and corporate productivity: evidence from a quasi-natural experiment in China. Technol. Forecast. Soc. Change 177, 1-19. https://doi.org/10.1016/j.techfore.2022.121516.
Dong, K., Zhao, J., Ren, X., Shi, Y., 2023. Environmental regulation, human capital, and pollutant emissions: the case of SO2 emissions for China. J. Chin. Econ. Bus. Stud. 21, 111-135. https://doi.org/10.1080/14765284.2022.2106539.
Fabrizi, A., Guarini, G., Meliciani, V., 2018. Green patents, regulatory policies and research network policies. Res. Pol. 47, 1018-1031. https://doi.org/10.1016/j. respol.2018.03.005.
Fan, J.L., Ding, Z., Li, K., Wang, Q., Zhang, X., 2023. Research on carbon neutrality from the past to the future: a bibliometric analysis. J. Chin. Econ. Bus. Stud. 21, 27-48. https://doi.org/10.1080/14765284.2022.2116203.
Farooq, U., Ahmed, J., Tabash, M.I., Anagreh, S., Subhani, B.H., 2021. Nexus between government green environmental concerns and corporate real investment: empirical evidence from selected Asian economies. J. Clean. Prod. 314, 1-9. https://doi.org/ 10.1016/j.jclepro.2021.128089.
Francey, R.J., Trudinger, C.M., Van Der Schoot, M., Law, R.M., Krummel, P.B., Langenfelds, R.L., Paul Steele, L., Allison, C.E., Stavert, A.R., Andres, R.J., Rödenbeck, C., 2013. Atmospheric verification of anthropogenic CO2 emission trends. Nat. Clim. Change 3, 520-524. https://www.nature.com/articles/nclimat e1817.
Ganda, F., 2019. The impact of innovation and technology investments on carbon emissions in selected organisation for economic Co-operation and development countries. J. Clean. Prod. 217, 469-483. https://doi.org/10.1016/j. jclepro.2019.01.235.
Gupta, H., Barua, M.K., 2018. A framework to overcome barriers to green innovation in SMEs using BWM and Fuzzy TOPSIS. Sci. Total Environ. 633, 122-139. https://doi. org/10.1016/j.scitotenv.2018.03.173.
Hamamoto, M., 2006. Environmental regulation and the productivity of Japanese manufacturing industries. Resour. Energy Econ. 28, 299-312. https://doi.org/ 10.1016/j.reseneeco.2005.11.001.
Horbach, J., Rammer, C., Rennings, K., 2012. Determinants of eco-innovations by type of environmental impact-the role of regulatory push/pull, technology push and market pull. Ecol. Econ. 78, 112-122. https://doi.org/10.1016/j. ecolecon.2012.04.005.
Hotte, L., Winer, S.L., 2012. Environmental regulation and trade openness in the presence of private mitigation. J. Dev. Econ. 97, 46-57. https://doi.org/10.1016/j. jdeveco.2011.01.004.
Huang, J.W., Li, Y.H., 2017. Green innovation and performance: the view of organizational capability and social reciprocity. J. Bus. Ethics 145, 309-324. https:// doi.org/10.1007/s10551-015-2903-y.
Huang, R., Chen, D., 2015. Does environmental information disclosure benefit waste discharge reduction? Evidence from China. J. Bus. Ethics 129, 535-552. https:// www.jstor.org/stable/24702958.
Huang, Z., Liao, G., Li, Z., 2019. Loaning scale and government subsidy for promoting green innovation. Technol. Forecast. Soc. Change 144, 148-156. https://doi.org/ 10.1016/j.techfore.2019.04.023.
Hu, C., Mao, J., Tian, M., Wei, Y., Guo, L., Wang, Z., 2021a. Distance matters: investigating how geographic proximity to ENGOs triggers green innovation of heavy-polluting firms in China. J. Environ. Manag. 279, 1-13. https://doi.org/ 10.1016/j.jenvman.2020.111542.
Hu, G., Wang, X., Wang, Y., 2021b. Can the green credit policy stimulate green innovation in heavily polluting enterprises? Evidence from a quasi-natural experiment in China. Energy Econ. 98, 1-13. https://doi.org/10.1016/j. eneco.2021.105134.
Hu, J., Pan, X., Huang, Q., 2020. Quantity or quality? The impacts of environmental regulation on firms’ innovation-Quasi-natural experiment based on China’s carbon emissions trading pilot. Technol. Forecast. Soc. Change 158, 1-12. https://doi.org/ 10.1016/j.techfore.2020.120122.
Jaffe, A.B., Palmer, K., 1997. Environmental regulation and innovation: a panel data study. Rev. Econ. Stat. 79, 610-619. https://doi.org/10.1162/003465397557196.
Jiang, Z., Wang, Z., Zeng, Y., 2020. Can voluntary environmental regulation promote corporate technological innovation? Bus. Strat. Environ. 29, 390-406. https://doi. org/10.1002/bse.2372.
Joshi, S., Krishnan, R., Lave, L., 2001. Estimating the hidden costs of environmental regulation. Account. Rev. 76, 171-198. https://doi.org/10.2308/ accr.2001.76.2.171.
Kesidou, E., Demirel, P., 2012. On the drivers of eco-innovations: empirical evidence from the UK. Res. Pol. 41, 862-870. https://doi.org/10.1016/j.respol.2012.01.005.
Li, K., Mai, F., Shen, R., Yan, X., 2021. Measuring corporate culture using machine learning. Rev. Financ. Stud. 34, 3265-3315. https://doi.org/10.1093/rfs/hhaa079.
Lin, B., Xie, J., 2023. Does environmental regulation promote industrial structure optimization in China? A perspective of technical and capital barriers. Environ. Impact Assess. Rev. 98, 1-14. https://doi.org/10.1016/j.eiar.2022.106971.
Lin, B., Xu, C., 2023. The effects of capital-biased tax incentives on firm energy intensity: environmental dividend or consequence? J. Environ. Manag. 345, 1-12. https://doi. org/10.1016/j.jenvman.2023.118507.
Liu, G., Yi, H., Liang, H., 2023. Measuring provincial digital finance development efficiency based on stochastic frontier model. Quan. Finance Econ. 7, 420-439. https://doi.org/10.3934/QFE. 2023021.
Liu, S., Wang, Y., 2023. Green innovation effect of pilot zones for green finance reform: evidence of quasi natural experiment. Technol. Forecast. Soc. Change 186, 1-10. https://doi.org/10.1016/j.techfore.2022.122079.
Liu, X., Wang, E., Cai, D., 2019. Green credit policy, property rights and debt financing: quasi-natural experimental evidence from China. Finance Res. Lett. 29, 129-135. https://doi.org/10.1016/j.frl.2019.03.014.
Liu, X., Zhang, L., Hao, Y., Yin, X., Shi, Z., 2022. Increasing disparities in the embedded carbon emissions of provincial urban households in China. J. Environ. Manag. 302, 1-10. https://doi.org/10.1016/j.jenvman.2021.113974.
Li, Z., Huang, Z., Su, Y., 2023. New media environment, environmental regulation and corporate green technology innovation: evidence from China. Energy Econ. 119, 1-16. https://doi.org/10.1016/j.eneco.2023.106545.
Li, Z., Liao, G., Wang, Z., Huang, Z., 2018. Green loan and subsidy for promoting clean production innovation. J. Clean. Prod. 187, 421-431. https://doi.org/10.1016/j. jclepro.2018.03.066.
Loughran, T., McDonald, B., 2011. When is a liability not a liability? Textual analysis, dictionaries, and 10-Ks. J. Finance 66, 35-65. https://doi.org/10.1111/j.15406261.2010.01625.x.
Lu, J., 2021. Can the green merger and acquisition strategy improve the environmental protection investment of listed company? Environ. Impact Assess. Rev. 86, 1-12. https://doi.org/10.1016/j.eiar.2020.106470.
Lundqvist, L.J., 2001. Implementation from above: the ecology of power in Sweden’s environmental governance. Governance 14, 319-337. https://doi.org/10.1111/ 0952-1895.00163.
Lu, Y., Gao, Y., Zhang, Y., Wang, J., 2022. Can the green finance policy force the green transformation of high-polluting enterprises? A quasi-natural experiment based on “Green Credit Guidelines”. Energy Econ. 114, 1-15. https://doi.org/10.1016/j. eneco.2022.106265.
Ma, R., Ji, Q., Zhai, P., Yang, R., 2022. Environmental violations, refinancing risk, and the corporate bond cost in China. J. Int. Financ. Manag. Account. 33, 480-504. https://doi.org/10.1111/jifm.12154.
Ma, Y., Zhang, Q., Yin, Q., 2021. Top management team faultlines, green technology innovation and firm financial performance. J. Environ. Manag. 285, 1-9. https://doi. org/10.1016/j.jenvman.2021.112095.
Mealy, P., Teytelboym, A., 2022. Economic complexity and the green economy. Res. Pol. 51, 1-24. https://doi.org/10.1016/j.respol.2020.103948.
Meyer, B.D., 1995. Natural and quasi-experiments in economics. J. Bus. Econ. Stat. 13, 151-161. https://doi.org/10.1080/07350015.1995.10524589.
Ouyang, X., Li, Q., Du, K., 2020. How does environmental regulation promote technological innovations in the industrial sector? Evidence from Chinese provincial panel data. Energy Pol. 139, 1-10. https://doi.org/10.1016/j.enpol.2020.111310.
Peng, B., Yan, W., Elahi, E., Wan, A., 2022. Does the green credit policy affect the scale of corporate debt financing? Evidence from listed companies in heavy pollution industries in China. Environ. Sci. Pollut. Res. 29, 755-767. https://doi.org/10.1007/ s11356-021-15587-7.
Pizer, W.A., Popp, D., 2008. Endogenizing technological change: matching empirical evidence to modeling needs. Energy Econ. 30, 2754-2770. https://doi.org/10.1016/ j.eneco.2008.02.006.
Porter, M.E., 1991. America’s green strategy. Sci. Am. 264, 193-246. https://doi.org/ 10.1038/scientificamerican0491-168.
Porter, M.E., Linde, C.V.D., 1995. Toward a new conception of the environmentcompetitiveness competitiveness relationship. J. Econ. Perspect. 9, 97-118. https:// doi.org/10.1257/jep.9.4.97.
Rajan, R.G., Zingales, L., 1998. Financial dependence and growth. Am. Econ. Rev. 88, 559-586. https://www.jstor.org/stable/116849.
Rennings, K., 2000. Redefining innovation-eco-innovation research and the contribution from ecological economics. Ecol. Econ. 32, 319-332. https://doi.org/ 10.1016/S0921-8009(99)00112-3.
Requate, T., Unold, W., 2003. Environmental policy incentives to adopt advanced abatement technology: will the true ranking please stand up? Eur. Econ. Rev. 47, 125-146. https://doi.org/10.1016/S0014-2921(02)00188-5.
Shahbaz, M., Nasir, M.A., Roubaud, D., 2018. Environmental degradation in France: the effects of FDI, financial development, and energy innovations. Energy Econ. 74, 843-857. https://doi.org/10.1016/j.eneco.2018.07.020.
Shao, X., Zhong, Y., Liu, W., Li, R.Y.M., 2021. Modeling the effect of green technology innovation and renewable energy on carbon neutrality in N-11 countries? Evidence from advance panel estimations. J. Environ. Manag. 296, 1-9. https://doi.org/ 10.1016/j.jenvman.2021.113189.
Shevchenko, A., 2021. Do financial penalties for environmental violations facilitate improvements in corporate environmental performance? An empirical investigation. Bus. Strat. Environ. 30, 1723-1734. https://doi.org/10.1002/bse.2711.
Shi, J., Yu, C., Li, Y., Wang, T., 2022. Does green financial policy affect debt-financing cost of heavy-polluting enterprises? An empirical evidence based on Chinese pilot zones for green finance reform and innovations. Technol. Forecast. Soc. Change 179, 1-12. https://doi.org/10.1016/j.techfore.2022.121678.
Shleifer, A., Vishny, R.W., 1994. Politicians and firms. Q. J. Econ. 109, 995-1025. https://doi.org/10.2307/2118354.
Stern, N., Valero, A., 2021. Innovation, growth and the transition to net-zero emissions. Res. Pol. 50, 1-12. https://doi.org/10.1016/j.respol.2021.104293.
Stern, N., Xie, C., 2023. China’s new growth story: linking the 14th Five-Year Plan with the 2060 carbon neutrality pledge. J. Chin. Econ. Bus. Stud. 21, 5-25. https://doi. org/10.1080/14765284.2022.2073172.
Sun, J., Wang, F., Yin, H., Zhang, B., 2019. Money talks: the environmental impact of China’s green credit policy. J. Pol. Anal. Manag. 38, 653-680. https://doi.org/ 10.1002/pam. 22137.
Su, Z., Guo, Q., Lee, H.T., 2022. Green finance policy and enterprise energy consumption intensity: evidence from a quasi-natural experiment in China. Energy Econ. 115, 1-14. https://doi.org/10.1016/j.eneco.2022.106374.
Tang, K., Qiu, Y., Zhou, D., 2020. Does command-and-control regulation promote green innovation performance? Evidence from China’s industrial enterprises. Sci. Total Environ. 712, 1-10. https://doi.org/10.1016/j.scitotenv.2019.136362.
Tan, X., Xiao, Z., Liu, Y., Taghizadeh-Hesary, F., Wang, B., Dong, H., 2022. The effect of green credit policy on energy efficiency: evidence from China. Technol. Forecast. Soc. Change 183, 1-9. https://doi.org/10.1016/j.techfore.2022.121924.
Testa, F., Iraldo, F., Frey, M., 2011. The effect of environmental regulation on firms’ competitive performance: the case of the building & construction sector in some EU regions. J. Environ. Manag. 92, 2136-2144. https://doi.org/10.1016/j. jenvman.2011.03.039.
Tian, Y., Feng, C., 2022. The internal-structural effects of different types of environmental regulations on China’s green total-factor productivity. Energy Econ. 113, 1-12. https://doi.org/10.1016/j.eneco.2022.106246.
Tietenberg, T., 1998. Disclosure strategies for pollution control. Environ. Resour. Econ. 11, 587-602. https://link.springer.com/article/10.1023/A:1008291411492.
Vasileiou, E., Georgantzis, N., Attanasi, G., Llerena, P., 2022. Green innovation and financial performance: a study on Italian firms. Res. Pol. 51, 1-11. https://doi.org/ 10.1016/j.respol.2022.104530.
Walker, R.M., Chen, J., Aravind, D., 2015. Management innovation and firm performance: an integration of research findings. Eur. Manag. J. 33, 407-422. https://doi.org/10.1016/j.emj.2015.07.001.
Wang, R., Wang, R., He, X., 2020. Technical efficiency estimation of China’s environmental protection enterprises and its heterogeneity. Environ. Sci. Pollut. Res. 27, 33161-33180. https://doi.org/10.1007/s11356-020-09455-z.
Wang, H., Qi, S., Zhou, C., Zhou, J., Huang, X., 2022a. Green credit policy, government behavior and green innovation quality of enterprises. J. Clean. Prod. 331, 1-13. https://doi.org/10.1016/j.jclepro.2021.129834.
Wang, K., Che, L., Ma, C., Wei, Y.M., 2017. The shadow price of CO2 emissions in China’s iron and steel industry. Sci. Total Environ. 598, 272-281. https://doi.org/10.1016/j. scitotenv.2017.04.089.
Wang, L., Long, Y., Li, C., 2022b. Research on the impact mechanism of heterogeneous environmental regulation on enterprise green technology innovation. J. Environ. Manag. 322, 1-16. https://doi.org/10.1016/j.jenvman.2022.116127.
Wang, Q.J., Wang, H.J., Chang, C.P., 2022c. Environmental performance, green finance and green innovation: what’s the long-run relationships among variables? Energy Econ. 110, 1-12. https://doi.org/10.1016/j.eneco.2022.106004.
Wang, Q., Xu, X., Liang, K., 2021. The impact of environmental regulation on firm performance: evidence from the Chinese cement industry. J. Environ. Manag. 299, 1-11. https://doi.org/10.1016/j.jenvman.2021.113596.
Wang, X., Chen, Y., Dong, Y., Zhang, T., Shi, B., 2023. How does environmental regulation impact low-carbon transition? Evidence from China’s iron and steel industry. Ann. Oper. Res. 1-27 https://doi.org/10.1007/s10479-023-05480-6.
Wang, X., Zhang, C., Zhang, Z., 2019. Pollution haven or porter? The impact of environmental regulation on location choices of pollution-intensive firms in China. J. Environ. Manag. 248, 1-14. https://doi.org/10.1016/j.jenvman.2019.07.019.
Wang, Y., Li, M., 2022. Credit policy and its heterogeneous effects on green innovations. J. Financ. Stabil. 58, 1-14. https://doi.org/10.1016/j.jfs.2021.100961.
Wei, Y., Zhu, R., Tan, L., 2022. Emission trading scheme, technological innovation, and competitiveness: evidence from China’s thermal power enterprises. J. Environ. Manag. 320, 1-13. https://doi.org/10.1016/j.jenvman.2022.115874.
Wu, R., Liu, B.Y., 2023. Do climate policy uncertainty and investor sentiment drive the dynamic spillovers among green finance markets? J. Environ. Manag. 347, 1-13. https://doi.org/10.1016/j.jenvman.2023.119008.
Xie, X., Lu, J., Li, M., Dai, J., . Does carbon neutrality commitment enhance firm value? J. Chin. Econ. Bus. Stud. 21, 49-83. https://doi.org/10.1080/ 14765284.2022.2161171.
Xing, C., Zhang, Y., Wang, Y., 2020. Do banks value green management in China? The perspective of the green credit policy. Finance Res. Lett. 35, 1-9. https://doi.org/ 10.1016/j.frl.2020.101601.
Xiong, X., Zhang, L., Hao, Y., Zhang, P., Shi, Z., Zhang, T., 2022. How urbanization and ecological conditions affect urban diet-linked GHG emissions: new evidence from
China. Resour. Conserv. Recycl. 176, 1-9. https://doi.org/10.1016/j. resconrec.2021.105903.
Xu, X., Huang, S., An, H., Vigne, S., Lucey, B., 2021. The influence pathways of financial development on environmental quality: new evidence from smooth transition regression models. Renew. Sustain. Energy Rev. 151, 1-14. https://doi.org/ 10.1016/j.rser.2021.111576.
Xu, X., Li, J., 2020. Asymmetric impacts of the policy and development of green credit on the debt financing cost and maturity of different types of enterprises in China. J. Clean. Prod. 264, 1-13. https://doi.org/10.1016/j.jclepro.2020.121574.
Yan, C., Mao, Z., Ho, K.C., 2022. Effect of green financial reform and innovation pilot zones on corporate investment efficiency. Energy Econ. 113, 1-11. https://doi.org/ 10.1016/j.eneco.2022.106185.
Yang, N., Yang, J., Pang, M., Zhang, P., Chang, Y., Zhang, L., Hao, Y., Chen, Y., 2023. Decarbonization of the wind power sector in China: evolving trend and driving factors. Environ. Impact Assess. Rev. 103, 1-8. https://doi.org/10.1016/j. eiar.2023.107292.
Yao, S., Pan, Y., Sensoy, A., Uddin, G.S., Cheng, F., 2021. Green credit policy and firm performance: what we learn from China. Energy Econ. 101, 1-16. https://doi.org/ 10.1016/j.eneco.2021.105415.
Yuan, B., 2019. Effectiveness-based innovation or efficiency-based innovation? Trade-off and antecedents under the goal of ecological total-factor energy efficiency in China. Environ. Sci. Pollut. Res. 26, 17333-17350. https://doi.org/10.1007/s11356-019-05082-5.
Yuan, S., Pan, X., 2023. Inherent mechanism of digital technology application empowered corporate green innovation: based on resource allocation perspective. J. Environ. Manag. 345, 1-15. https://doi.org/10.1016/j.jenvman.2023.118841.
Zefeng, M., Gang, Z., Xiaorui, X., Yongmin, S., Junjiao, H., 2018. The extension of the Porter hypothesis: can the role of environmental regulation on economic development be affected by other dimensional regulations? J. Clean. Prod. 203, 933-942. https://doi.org/10.1016/j.jclepro.2018.08.332.
Zhang, D., 2022. Do heterogenous subsides work differently on environmental innovation? A mechanism exploration approach. Energy Econ. 114, 1-9. https://doi. org/10.1016/j.eneco.2022.106233.
Zhang, J., Liang, G., Feng, T., Yuan, C., Jiang, W., 2020. Green innovation to respond to environmental regulation: how external knowledge adoption and green absorptive capacity matter? Bus. Strat. Environ. 29, 39-53. https://doi.org/10.1002/bse.2349.
Zhang, K., Li, Y., Qi, Y., Shao, S., 2021a. Can green credit policy improve environmental quality? Evidence from China. J. Environ. Manag. 298, 1-11. https://doi.org/ 10.1016/j.jenvman.2021.113445.
Zhang, N., You, D., Tang, L., Wen, K., 2023. Knowledge path dependence, external connection, and radical inventions: evidence from Chinese Academy of Sciences. Res. Pol. 52, 1-18. https://doi.org/10.1016/j.respol.2023.104738.
Zhang, S., Wu, Z., Wang, Y., Hao, Y., 2021b. Fostering green development with green finance: an empirical study on the environmental effect of green credit policy in China. J. Environ. Manag. 296, 1-12. https://doi.org/10.1016/j. jenvman.2021.113159.
Zhang, W., Liu, X., Wang, D., Zhou, J., 2022a. Digital economy and carbon emission performance: evidence at China’s city level. Energy Pol. 165, 1-22. https://doi.org/ 10.1016/j.enpol.2022.112927.
Zhang, Y., Li, X., Xing, C., 2022b. How does China’s green credit policy affect the green innovation of high polluting enterprises? The perspective of radical and incremental innovations. J. Clean. Prod. 336, 1-14. https://doi.org/10.1016/j. jclepro.2022.130387.
Zhang, Z., Jiang, Y., 2022. Can green public procurement change energy efficiency? Evidence from a quasi-natural experiment in China. Energy Econ. 113, 1-12. https:// doi.org/10.1016/j.eneco.2022.106244.
Zhao, X., Zhao, Y., Zeng, S., Zhang, S., 2015. Corporate behavior and competitiveness: impact of environmental regulation on Chinese firms. J. Clean. Prod. 86, 311-322. https://doi.org/10.1016/j.jclepro.2014.08.074.
Zhou, Q., Zhang, X., Shao, Q., Wang, X., 2019. The non-linear effect of environmental regulation on haze pollution: empirical evidence for 277 Chinese cities during 2002-2010. J. Environ. Manag. 248, 1-12. https://doi.org/10.1016/j. jenvman.2019.109274.
Zhu, X., 2022. Does green credit promote industrial upgrading?-analysis of mediating effects based on technological innovation. Environ. Sci. Pollut. Res. 29, 41577-41589. https://doi.org/10.1007/s11356-021-17248-1.
Zhu, X., Zuo, X., Li, H., 2021. The dual effects of heterogeneous environmental regulation on the technological innovation of Chinese steel enterprises-based on a highdimensional fixed effects model. Ecol. Econ. 188, 1-13. https://doi.org/10.1016/j. ecolecon.2021.107113.

    • Corresponding author. Henley Business School, University of Reading, Reading, RG6 6UD, UK.
    E-mail address: dan.luo@henley.ac.uk (D. Luo).
    Currently, China mainly has command- (e.g. Atmospheric Pollution Prevention and Control Law (2015 Revision)), market- (e.g. Emission Trading Markets Pilots Policy (2007) and Guidelines for Green Credit issued by the China Banking Regulatory Commission (2012)), and voluntary-based environmental regulation.
  1. For example, when an enterprise achieves technological innovation that meets the requirements of environmental regulations, it can apply for patent protection. In the context of strict environmental regulations, this behaviour can encourage other enterprises to purchase its innovation, which can bring high profits to the enterprise (Porter, 1991).
  2. Green innovation quality focuses more on the quality of green innovation and is more related to newly created inventions (Zhang et al., 2023). While green innovation increment focuses more on the quantity of green innovation and tends to build on existing technologies or products (Wang and Li, 2022).
    Here, the variables Incentive-based Environmental Regulation (CER_Incentive) and Green Investment (GreenInv) are constructed using the Word Embedding model.
  3. The innovation compensation effect of PH posits that during the dynamic process of economic development, environmental regulations can stimulate enterprises to innovate their production modes, improve economic efficiency, and offset the effect of circular cost (Ouyang et al., 2020).
  4. The main points of the 2012 GCG are as follows. First, a strict access mechanism requires credit-granting financial institutions to consider not only the economic performance and risks of enterprises but also their environmental performance and potential environmental risks. Credit to enterprises with poor environmental performance is curtailed. Second, information communication and dynamic tracking mechanisms must be established for enterprises that have obtained loans after thorough examination and approval, and their credit should be terminated if environmental problems occur. Third, stronger coordination and cooperation must be established with government and environmental protection departments. Information sharing must be improved to link environmental protection and financial credit (Yao et al., 2021; Zhang et al., 2021b).
  5. Firstly, the pandemic exerted a substantial shock to the global economy, including China. Including the post-2020 data might introduce biases into the empirical results due to these unprecedented external influences. Secondly, in response to the pandemic, China, along with many other countries, implemented restrictive lockdown measures and fiscal stimulus policies. These interventions substantially altered the economic behaviours of firms and individuals. Consequently, it becomes challenging to disentangle the actual effects attributable to the Green Finance Policy from those stemming from the pandemic’s repercussions. Therefore, the study considers the selection of the year 2019 as the cut-off point for the sample period to be appropriate.
  6. To avoid potential bias caused by the decrease in total observations, this study also uses the logarithm of government subsidy (CER_Incentive1) to conduct a robustness test. The results are reported in Appendix 1.
    The model and data source of the Word Embedding model are from www. wingodata.com.
    The environmental liabilities database of CSMAR constructs an index of voluntary disclosure of corporate environmental pollutants, which include wastewater emissions, COD emissions, emissions, emissions, soot and dust emissions, and industrial solid waste emissions. The index can appropriately reflect the VER level of firms (Huang and Chen, 2015).
  7. Since the listed age is zero when a company goes public in its first year, taking the natural logarithm of 0 (Ln0) has no mathematical meaning.
  8. 12 The description of variables can be found in Table 11.
  9. If a significant difference is observed in the green innovation between HPEs and other enterprises before the implementation of the GFP, then the results may not be caused by GFP (Yao et al., 2021).
  10. For example, the regression results may be influenced by other policies (Wang et al., 2022a).
    Regions include Beijing, Tianjin, Hebei, Shanxi, Inner Mongolia, and Liaoning.
  11. Joint green innovation refers to an application with green invention and/or green utility patents by two or more legal entities, whereas there is only one entity for independent green innovation.
    These are independent green innovation quality performance (GI_qua_ind), joint green innovation quality performance (GI_qua_joi), independent green innovation increment performance (GI_inc_ind), and joint green innovation increment performance (GI_inc_joi).
  12. EFD Capital expenditures – Cash flow from operations Capital expenditures. Firms are classified as high-EFD if the index value is above the median (0.216), and low-EFD otherwise.
  13. https://www.hexun.com/?from=rongshuxia; Specifically, this study uses Python to crawl the main business content of listed companies from Tonghuashun Finance and Economic, and Hexun, and then manually judges related information.
    Furthermore, this study drops HPEs from the regression sample to avoid potential research bias.
  14. The parallel trend analysis also shows that the adoption of the DID model is rational. The results of this analysis are available upon request.
    The coefficient of DID on GI_qua is 0.098 for green enterprises at the level, whereas it is 0.069 for HPEs at the level.
    The average green innovation performance of green enterprises is higher than that of HPE, see Appendix 2.
    The mean value of environmental violation for HPEs is 0.0079 , which is nearly twice higher than that for green enterprises at 0.0041 .
  15. Notes: The full terms for variables’ abbreviations: GI: Green Innovation; GI_qua: Green Innovation Quality; GI_inc: Green Innovation Increment; HPEs: Heavily Polluting Enterprises.
  16. According to Tan et al. (2022), the study randomly generates a selection of HPEs. Then the DID model is applied to Equation (1) and the sampling process is repeated 500 times for the placebo test, ensuring the robustness of the regression results. The coefficients from the DID term post-randomisation largely cluster around 0 , with most p -values exceeding 0.1 . Notably, the baseline estimation result ( 0.123 ) is located at the edge of the whole distribution. Such an observation indicates a significant dilution of the policy effect post-randomisation, both in terms of significance and magnitude. This indirectly affirms the robustness of the findings in the study, suggesting that the enhancement in enterprises’ green innovation performance is genuinely attributable to the GFP, rather than being randomly instigated or influenced by other policies
  17. These plots show that the impact of GFP on GI performance strengthens with increased intensity of CER_Incentive and VER. However, a rise in CER_Penalty does not produce a comparable shift. Thus, while CER_Incentive and VER both play a significant and positive role in moderating the relationship between GFP and green innovation performance, CER_Penalty does not exhibit a pronounced moderation effect