المجلة: Nature Communications، المجلد: 15، العدد: 1
DOI: https://doi.org/10.1038/s41467-024-45922-8
PMID: https://pubmed.ncbi.nlm.nih.gov/38374047
تاريخ النشر: 2024-02-19
DOI: https://doi.org/10.1038/s41467-024-45922-8
PMID: https://pubmed.ncbi.nlm.nih.gov/38374047
تاريخ النشر: 2024-02-19
أساس عصبي فسيولوجي لتخطيط الدماغ الكهربائي غير الدوري والاتجاه الطيفي الخلفي
تاريخ الاستلام: 6 سبتمبر 2023
تم القبول: 6 فبراير 2024
نُشر على الإنترنت: 19 فبراير 2024
(د) التحقق من التحديثات
تم القبول: 6 فبراير 2024
نُشر على الإنترنت: 19 فبراير 2024
(د) التحقق من التحديثات
تظهر تخطيط الدماغ الكهربائي (EEGs) مزيجًا من التذبذبات الإيقاعية والعريضة النطاق، حيث تظهر الأخيرة كـ
تظهر تخطيط الدماغ الكهربائي (EEGs) مزيجًا من التذبذبات الدورية وغير الدورية. لقد أثبتت أبحاث تقارب القرن من الزمن أن إشارات EEG الدورية تتولد عن تذبذبات عصبية متزامنة.
توجد فرضيتان رئيسيتان حول كيفية توليد الاتجاه الطيفي لتخطيط الدماغ الكهربائي (EEG) بواسطة الدماغ. تتنبأ فرضية مقياس الزمن المشبكي بأن الاتجاه الطيفي لتخطيط الدماغ الكهربائي هو نتيجة طبيعية للتيارات المشبكية المتناقصة بشكل أسي، وبالتالي فإن النشاط الشبكي غير المتزامن سينتج طيفًا بـ
على الرغم من هذه الفرضيات، فإن مفهوم تخطيط الدماغ غير الدوري نفسه لا يزال مثيرًا للجدل. يجادل البعض بأن الاتجاه الظاهر في طيف تخطيط الدماغ هو ظاهرة ثانوية ناتجة عن إيقاعات الدماغ الأبطأ التي تستقطب مجموعات أكبر من الخلايا العصبية.
لذا تبقى ثلاثة أسئلة مفتوحة: (1) هل يمكن أن تعكس إشارات تخطيط الدماغ الكهربائي النشاط العصبي غير المنتظم؟ (2) إذا كان الأمر كذلك، كيف تشكل هذه الإشارات طيف تخطيط الدماغ الكهربائي؟ (3) هل تحتاج أطياف تخطيط الدماغ الكهربائي إلى إزالة الاتجاه، وإذا كان الأمر كذلك، ما هي الطريقة الأكثر دلالة من الناحية الفسيولوجية لإزالة الاتجاه؟ للتحقيق في هذه الأسئلة، قمنا بدمج النمذجة العددية للأمكانيات السطحية مع الحسابات الفيزيائية الحيوية للثنائيات العصبية الفردية.
النتائج
لا يمكن لتخطيط الدماغ الكهربائي أن يعكس النشاط العصبي غير المتزامن
لفهم علم الأعصاب الفيزيولوجي الذي يكمن وراء اتجاه طيف EEG، بدأنا بالتحقيق في خصائص توليد EEG على مستوى الخلية العصبية الفردية. هذه الخصائص مفيدة لأنها تشكل EEG الجماعي بغض النظر عن التماسك أو التزامن العصبي.
(انظر التعريفات والإطار النظري في الطرق). لفحص هذه الخصائص، قمنا بإجراء محاكاة لنماذج الخلايا العصبية المفصلة من الناحية البيوفيزيائية والشكلية (الشكل 1أ). في البداية، لم نفترض أي ديناميات للخلايا العصبية السابقة المشبكية، وبالتالي قمنا بنمذجة المدخلات المشبكية باستخدام سلاسل نبضات بواسون المستقلة (الشكل 1أ)، وهو افتراض سنقوم بتخفيفه لاحقًا. من هذه التيارات، تم حساب ثنائي القطب لخلايا عصبية مفردة.
(انظر التعريفات والإطار النظري في الطرق). لفحص هذه الخصائص، قمنا بإجراء محاكاة لنماذج الخلايا العصبية المفصلة من الناحية البيوفيزيائية والشكلية (الشكل 1أ). في البداية، لم نفترض أي ديناميات للخلايا العصبية السابقة المشبكية، وبالتالي قمنا بنمذجة المدخلات المشبكية باستخدام سلاسل نبضات بواسون المستقلة (الشكل 1أ)، وهو افتراض سنقوم بتخفيفه لاحقًا. من هذه التيارات، تم حساب ثنائي القطب لخلايا عصبية مفردة.
عرض الطيف الوحدوي ميزتين هامتين. أولاً، حتى مع المدخلات المشبكية العشوائية، أظهر الطيف الوحدوي اتجاهًا. يمكن وصف هذا الاتجاه بأنه مجموع دالتين لورنتزيتين.
كما تنبأت النماذج الخطية البسيطة لتوليد EEG
ثانيًا، يعكس الطيف الموحد السعة التي يساهم بها متوسط الخلايا العصبية في إشارة EEG. للتحقيق في هذه الفكرة بمزيد من التفصيل، قمنا بدراسة تأثير تغيير جميع معلمات النموذج ضمن نطاقات فسيولوجية معقولة (الشكل 1g). أظهر قياس القدرة المتوسطة لإشارات EEG الناتجة من خلية عصبية واحدة
الشكل 1 | لا يمكن لتخطيط الدماغ الكهربائي أن يعكس النشاط العصبي غير المتزامن. أ مثال على شكل طبقة
ديناميات إلغاء تنشيط GABARs (
الشكل 2 | تتطلب إشارات EEG القابلة للاكتشاف فقط ثنائيات قطبية ضعيفة ومتزامنة محليًا. أ. مخطط يعرض نواة الربط المستخدمة لربط ثنائيات قطبية لخلية عصبية واحدة. النواة هي دالة غاوسية بحد أقصى من
مجموعة من السعات الممكنة لمساهمة الخلايا العصبية الفردية في إشارة EEG (الشكل 1h). تظهر هذه المحاكاة أنه لا يمكن لأي معاملات فسيولوجية معقولة أن تسمح لـ 16 مليار خلية عصبية غير مترابطة بتوليد إشارات EEG قابلة للاكتشاف (الشكل 1i). والأهم من ذلك، أن هذه الحسابات تحدد مدى بعد قشرة غير متزامنة تمامًا عن توليد إشارات EEG قابلة للاكتشاف. تأخذ هذه الحسابات في الاعتبار قوة EEG التي تساهم بها سعات التيار المشبكي، هندسة الخلايا العصبية، معدل إطلاق النار المتوسط للخلايا العصبية، عدد الخلايا العصبية، توصيل الأنسجة المختلفة، وهندسة القشرة. لذلك، تشير هذه النتيجة إلى أن الديناميات العصبية مسؤولة عن الفرق التقريبي بأربعة أوامر من حيث الحجم بين الطيف غير المتزامن المحاكى وسجلات EEG الحقيقية.
تتطلب EEG القابلة للاكتشاف فقط ثنائيات قطبية ضعيفة ومتزامنة محليًا
إذا كانت سعة إشارات EEG تمنع النشاط غير المتزامن من تشكيل أطياف EEG، فما أنواع النشاط غير الإيقاعي التي يمكن أن تؤثر على إشارات EEG؟ للبدء في معالجة هذا السؤال، قمنا أولاً بتحديد بشكل عام مقدار ارتباط الثنائيات القطبية المطلوب لتوليد إشارات EEG قابلة للاكتشاف. للقيام بذلك، فرضنا تنظيمًا مكانيًا مبسطًا على نموذج قشري حيث تنتج الخلايا العصبية المجاورة ثنائيات قطبية مرتبطة. على وجه التحديد، كانت ثنائيات قطبية للخلايا العصبية المفصولة بمقدار
التزامن، لا يزال يتعين تحديد ما إذا كان وكيف يمكن تحقيق مثل هذا الدرجة من تماسك الثنائيات القطبية بواسطة النشاط العصبي غير الإيقاعي.
التزامن، لا يزال يتعين تحديد ما إذا كان وكيف يمكن تحقيق مثل هذا الدرجة من تماسك الثنائيات القطبية بواسطة النشاط العصبي غير الإيقاعي.
توبولوجيا المشبك كافية لارتباطات الثنائيات القطبية
للتحقيق في قدرة النشاط العصبي على توليد ثنائيات قطبية متماسكة، قمنا بمحاكاة أزواج من الخلايا العصبية وحققنا في مستوى الارتباط القابل للتحقيق بين ثنائيات قطبية لخلية عصبية واحدة. في محاكاة لدينا، لاحظنا أنه إذا تم تنشيط مشبك واحد، يمكن التنبؤ بدقة بتوجه الثنائي القطب الناتج من توجه المشبك بالنسبة للجسم الخلوي (الشكل 3أ، ب). كانت هذه النتيجة صحيحة عبر جميع أشكال الخلايا العصبية التي تم التحقيق فيها (الشكل S1). من هذه الملاحظة، وضعنا نموذجًا بسيطًا لتماسك الثنائي القطب. لتوليد الإدخال المشبكي، قمنا بإسقاط مشابك خليتين عصبيتين على كرة وارتبطنا مدخلات المشابك ذات المسافات الزاوية القريبة (الشكل 3ج). من خلال تغيير أقصى ارتباط بين المشابك، يمكن ضبط ارتباط الثنائي القطب بين خلايا عصبية بأشكال مختلفة بشكل مستمر بين 0 و
يمكن للشبكات تحت الحرجة توليد إشارات EEG غير دورية
بعد ذلك، تحققنا من نماذج الشبكات التي يمكن أن تولد إشارات EEG قابلة للاكتشاف وغير دورية. لتحديد ما إذا كان يمكن للنشاط الشبكي إنتاج ثنائيات قطبية متماسكة، استخدمنا النتائج من القسم السابق (الشكل 3). بعد محاكاة مجموعة من الخلايا العصبية السابقة، استخدمنا خوارزمية UMAP
لفهم آليات توليد تخطيط الدماغ غير الدوري، حاولنا بناء أبسط شبكة يمكن أن تولد تماسك ثنائي القطب. تظهر نتائجنا السابقة أن الشبكات المتصلة عشوائيًا لا يمكنها توليد أقطاب متماسكة، لأنها لا تستطيع إنتاج نشاط مكاني مترابط. لذلك، استمررنا في استخدام أبسط شبكة عصبية تظهر طوبولوجيا مكانية، وهي شبكة مكانية. لبناء الشبكة، تم تضمين كل خلية عصبية في مستوى وتم ربطها بشكل تفضيلي بالخلايا العصبية القريبة (الشكل 4ب). من أجل البساطة، قمنا بنمذجة الخلايا العصبية الفردية كعقد ثنائية، أي أن كل خلية عصبية كانت إما تنفجر أو هادئة. انتشرت النبضات على طول اتصالات الشبكة، مما تسبب في إطلاق الخلايا العصبية التالية مع بعض الاحتمالية (الشكل 4ب). يقع هذا النموذج البسيط ضمن فئة الشبكة المتفرعة، لأن الديناميات تحكمها معلمة واحدة تُسمى عدد التفرع، والذي يُشار إليه بـ
كشفت محاكياتنا أن أقصى ارتباط ثنائي القطب يمكن تحقيقه زاد مع عدد تفرعات الشبكة (الشكل 4c، d). شبكة غير متزامنة بالكامل (
الشكل 3 | نموذج بسيط لارتباط ثنائي القطب يلتقط سعة EEG واسعة النطاق ولكن ليس القدرة الترددية المنخفضة. أ تم تنشيط مشبك واحد في الموقع المحدد بالسهم الأزرق، مما أدى إلى توليد استجابة في ثنائي القطب لخلية عصبية واحدة،
بحيث تكون المشابك العصبية مفصولة بزاوية
توليد ثنائيات كانت مرتبطة بـ
توليد ثنائيات كانت مرتبطة بـ
من الجدير بالذكر أن الارتباطات القوية للثنائيات تزامنت مع الارتباطات الزمنية الأطول في نشاط الشبكة (الشكل 4f)، وهو ظاهرة ناتجة مباشرة عن سببية انتشار النبضات (الشكل 4b). وهذا يعني أن إشارات EEG الناتجة عن انتشار النبضات القشرية يجب أن تكون لها طاقة أعلى عند الترددات المنخفضة إذا كانت الإشارات لتكون ذات سعات قابلة للاكتشاف. توضح هذه النتيجة قيدًا أساسيًا قد يفسر جزئيًا
تظهر هذه النتائج بشكل أوسع آلية بيولوجية فيزيائية قابلة للتطبيق تسمح للنشاط العصبي غير المنتظم بتوليد إشارات EEG، وبالتالي التأثير على الميزات العريضة لطيف EEG.
تظهر هذه النتائج بشكل أوسع آلية بيولوجية فيزيائية قابلة للتطبيق تسمح للنشاط العصبي غير المنتظم بتوليد إشارات EEG، وبالتالي التأثير على الميزات العريضة لطيف EEG.
يمكن أن تؤدي التغيرات في تخطيط الدماغ الكهربائي ذو النطاق الضيق إلى نشاط غير منتظم. تُظهر الحسابات أعلاه أن النشاط العصبي غير المنتظم يمكن أن يولد نظريًا إشارات تخطيط دماغ كهربائي عريضة النطاق، مما يعني أن قوة تخطيط الدماغ الكهربائي ذو النطاق الضيق لا تحتاج بالضرورة إلى أن تعكس إيقاعات الدماغ. لذلك، تساءلنا عما إذا كانت إشارات تخطيط الدماغ الكهربائي التي تنتج عن النشاط غير المنتظم يمكن أن تخلط بين التفسير التقليدي لتخطيط الدماغ الكهربائي، وهو أن التغيرات في قوة النطاق تعكس اختلافات في التذبذبات العصبية. لمعالجة هذا السؤال، اعتبرنا سيناريو حيث يتم توليد إشارة تخطيط الدماغ الكهربائي بواسطة مجموعتين فرعيتين من الخلايا العصبية: مجموعة تظهر تذبذبات متزامنة، ومجموعة ثانية تظهر ديناميات دون الحرجة.
الشكل 4 | يمكن أن تفسر ديناميات الشبكة تحت الحرجة سعة وقوة التردد المنخفض لتخطيط الدماغ الكهربائي العريض النطاق. توضيح للخوارزمية المستخدمة لتحسين تماسك القطب. Nrn. = خلية عصبية. تم تعديل شكل الخلية العصبية اليسرى من Budd، J. M. L. وآخرون. تتاجر أشجار المحاور القشرية الجديدة بالحفاظ على المواد وتأخير التوصيل. PLoS Comput. Biol. 6، e1000711 (2010). تم تعديل توضيح الخلية العصبية اليمنى، بإذن من SNCSC، من Mainen، Z. F. و Sejnowski، T. J. تأثير الهيكل الشجيري على نمط الإطلاق في خلايا عصبية قشرية نموذجية. Nature 382، 363-366 (1996)، Springer Nature. ب توضيح للقواعد المستخدمة لإنتاج التزامن الزماني المكاني في شبكة قبل المشبك. القاعدة رقم 1: يتم فرض طوبولوجيا الشبكة من خلال جعل احتمال الاتصالات الثنائية،
أظهرت ظاهرة مختلطة (الشكل 5ب). أدى زيادة قوة المدخلات المتذبذبة و/أو غير الدورية إلى تغيير سعة الذروة الطيفية و/أو الاتجاه الطيفي (الشكل 5ج-هـ). ومع ذلك، لم تؤدي التغييرات في الاتجاه الطيفي إلى تغيير مضاعف في سعة ذروة التذبذب. ونتيجة لذلك، فإن قياس سعة ذروات التذبذب بالنسبة للاتجاه الطيفي أنتج تفسيرات غير صحيحة (الشكل 5و-ز): حيث أن قسمة سعة الذروة على الاتجاه الخلفي اقترحت بشكل خاطئ أن الإيقاع العصبي انخفض عندما أصبحت النشاطات غير الدورية أقوى (الشكل 5د، ز)، وقد قدرت بشكل كبير زيادة الإيقاع العصبي عندما زادت النشاطات غير الدورية في الوقت نفسه (الشكل 5هـ، ح). لذلك، استنتجنا أنه إذا كانت الذروة الطيفية واضحة، فإن النشاط العصبي غير الإيقاعي له تأثير مضلل ضئيل وأن إزالة الاتجاه غير ضرورية. ومع ذلك، من المهم أنه إذا لم تكن هناك ذروة طيفية واضحة، فلا يوجد ضمان بأن التغييرات في القوة ناتجة عن اختلافات في التذبذبات العصبية.
ميل الطيف هو مقياس غير متسق لتوازن EI
ركزت النتائج المذكورة أعلاه على دور الديناميات العصبية في تشكيل طيف EEG. ومع ذلك، تُظهر الشكل 1d-f أن حركيات الاستجابات ما بعد المشبكية تؤثر أيضًا على الخصائص العريضة لطيف EEG. للتحقيق بشكل أعمق في هذه الآلية التي تشكل طيف EEG، قمنا بإجراء تحليل حساسية كامل لحد الميل الطيفي بالنسبة للمعلمات البيوفيزيائية في نماذج الخلايا العصبية الفردية. تم محاكاة طيف EEG الوحدوي مع العديد من قيم المعلمات المختلفة (الشكل 6a) وتم حساب الحد العام لميل الطيف.
تحكم مباشرة في مساهمات التيارات المشبكية المثبطة والمثيرة، على التوالي. جهد الانعكاس،
تحكم مباشرة في مساهمات التيارات المشبكية المثبطة والمثيرة، على التوالي. جهد الانعكاس،
من المدهش أن تحليل ميل الطيف كشف عن تفاعل قوي بين
تغيرات في الاستجابات المشبكية تعقد قياس إيقاعات الدماغ
تغيرات في الاستجابات ما بعد المشبكية تغير طيف EEG بطريقة مختلفة جوهريًا عن النشاط العصبي غير الإيقاعي. ما بعد المشبكية
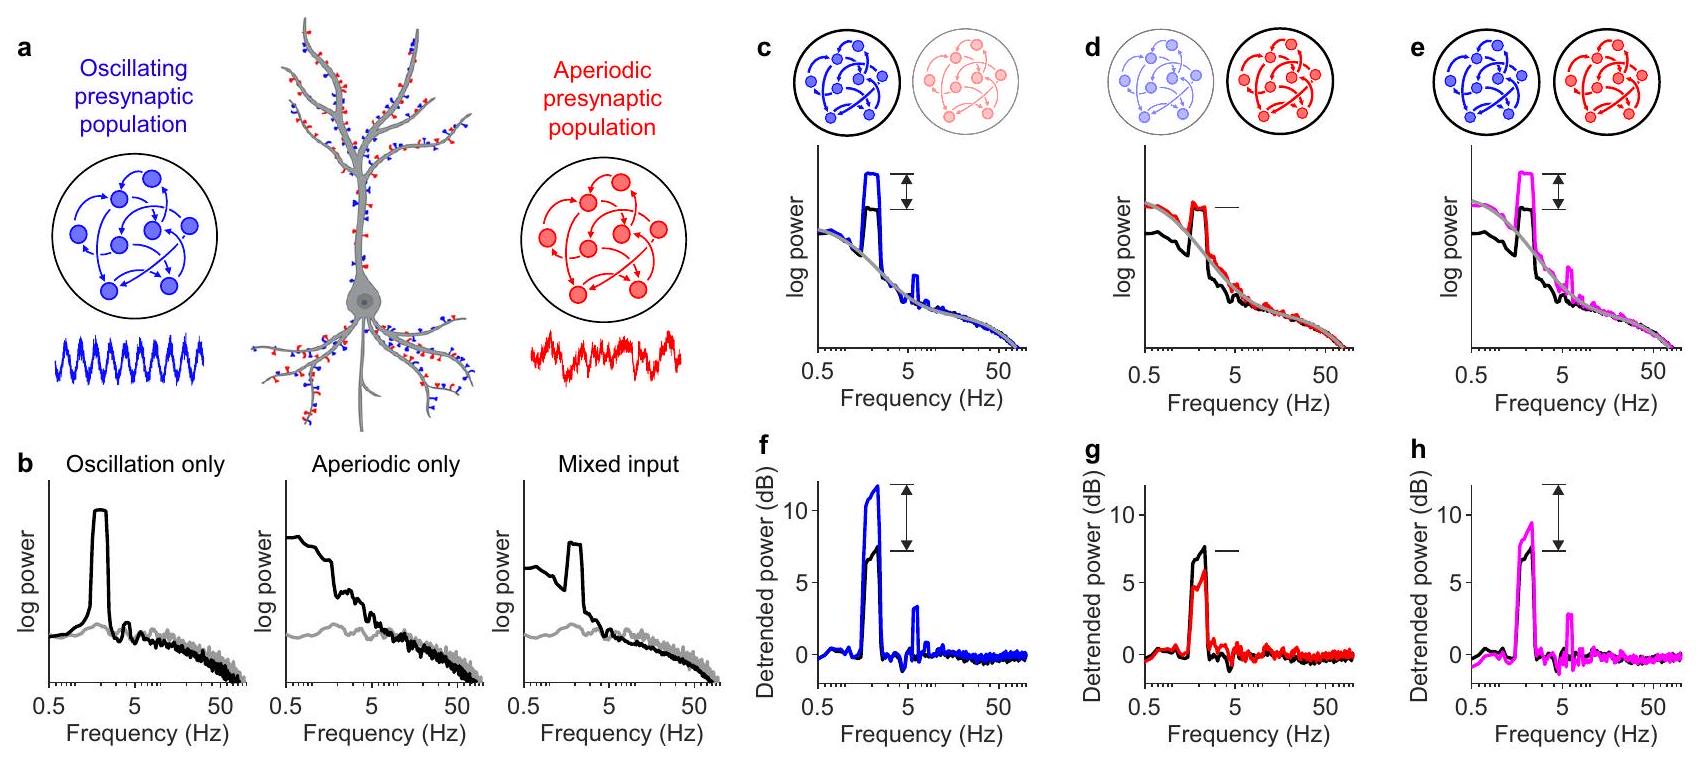
الشكل 5 | قياس قوة الذروة التذبذبية بالنسبة للاتجاه الطيفي قد ينتج عنه نتائج مضللة. أ توضيح لنموذج الإدخال المختلط. نصف مشابك العصبون تلقت إدخالاً تذبذبيًا إيقاعيًا (أزرق) والنصف الآخر تلقى إدخالًا من شبكة تحت حرجة (أحمر). تم ضبط قوى الديناميات التذبذبية وتحت الحرجة عن طريق ضبط معلمين،
الشكل 6 | حساسية الميل الطيفي للمعلمات البيوفيزيائية الحاكمة
استجابات ما بعد المشبك. أ توزيع العينات لبارامترات النموذج، نفس تلك المستخدمة في الشكل 1g. ب مثال لطيف من طيف EEG لخلية عصبية واحدة، تم ملاءمته بالمعادلة
استجابات ما بعد المشبك. أ توزيع العينات لبارامترات النموذج، نفس تلك المستخدمة في الشكل 1g. ب مثال لطيف من طيف EEG لخلية عصبية واحدة، تم ملاءمته بالمعادلة
طيف محاكى. تم حساب متوسط الطيف المحاكى بناءً على النسبة بين
الشكل 7 | التغيرات في الآليات ما بعد المشبكية تعقد قياس إيقاعات الدماغ. أ الطيف الوحدوي للخلايا العصبية التي تتلقى مدخلات دون العتبة تمامًا (
الشكل S3، نعرض أمثلة على أنواع مختلفة من المدخلات الإيقاعية. ج مثال على الاتجاه الطيفي الملائم. هنا، يتم عرض الطيف الأحادي للمدخلات الجيبية قبل وبعد الزيادة.
تتفاعل الديناميات بشكل فعال كالتفاف مع المدخلات المشبكية، وبالتالي يجب أن تتفاعل مع القمم التذبذبية بطريقة مضاعفة. علاوة على ذلك، يجب أن تؤثر الآليات ما بعد المشبكية على الطاقة الناتجة عن جميع أنواع الديناميات العصبية بشكل متساوٍ. لاختبار ذلك، قمنا بتغيير منهجي للمعلمات الفيزيائية الحيوية التي تحكم التيارات ما بعد المشبكية وحللنا الطيف الوحدوي الناتج عن أنواع مختلفة من المدخلات المشبكية، بما في ذلك الضوضاء البيضاء (الشكل S3)، والديناميات دون الحرجة (الشكل 7a)، بالإضافة إلى ثلاثة أنواع من الديناميات التي تظهر قمم طيفية: نموذج إيسينغ المتكرر المقترح حديثًا الذي يظهر التعايش بين التذبذبات والانهيارات.
تتفاعل الديناميات بشكل فعال كالتفاف مع المدخلات المشبكية، وبالتالي يجب أن تتفاعل مع القمم التذبذبية بطريقة مضاعفة. علاوة على ذلك، يجب أن تؤثر الآليات ما بعد المشبكية على الطاقة الناتجة عن جميع أنواع الديناميات العصبية بشكل متساوٍ. لاختبار ذلك، قمنا بتغيير منهجي للمعلمات الفيزيائية الحيوية التي تحكم التيارات ما بعد المشبكية وحللنا الطيف الوحدوي الناتج عن أنواع مختلفة من المدخلات المشبكية، بما في ذلك الضوضاء البيضاء (الشكل S3)، والديناميات دون الحرجة (الشكل 7a)، بالإضافة إلى ثلاثة أنواع من الديناميات التي تظهر قمم طيفية: نموذج إيسينغ المتكرر المقترح حديثًا الذي يظهر التعايش بين التذبذبات والانهيارات.
التغيرات الطيفية الناتجة عن تغيير المعايير البيوفيزيائية لا تعكس اختلافات في الديناميات العصبية وبالتالي تمثل عوامل مشوشة لتحليل EEG. لتصحيح تأثيرات هذه التغيرات في المعايير، نقوم بتناسب الجزء من الاتجاه الطيفي الناتج عن أوقات التوصيل المشبكي باستخدام خوارزمية مشابهة لـ FOOOF.
في الختام، تشير نتائج نمذجة لدينا إلى وجود آليتين متميزتين للتفاعل بين القمة والاتجاه في طيف EEG. في حالة واحدة، هناك تغييرات في المساهمة النسبية للنشاط العصبي الإيقاعي وغير الإيقاعي في إشارة EEG. في هذه الحالة، تتغير القمم والاتجاه الطيفي بشكل مستقل نسبيًا عن بعضها البعض، وبالتالي فإن إزالة الاتجاه غير ضرورية لت quantifying سعة القمم الطيفية (انظر المناقشة). في الحالة الأخرى، تؤدي التغييرات في المعلمات الفيزيائية الحيوية إلى تغيير آلية توليد EEG نفسها. في هذه الحالة، تكون الفروقات في EEG غير مرتبطة بالديناميات العصبية؛ يمكن أن تؤدي هذه التغييرات إلى تشويش إشارات EEG من جميع المصادر العصبية، وبالتالي يمكن أن تتعرض حتى سعات القمم الطيفية للتلف المحتمل.
الشكل 8 | النموذج يتنبأ وي quantifies تأثيرات إدارة البروبوفل على طيف EEG. أ إشارة EEG تمثيلية، موقع تسجيل Cz، لموضوع يتلقى تسريبًا من البروبوفل حتى فقدان الوعي (LOC). يتم رسم التركيز المقدر لموقع التأثير للبروبوفل أدناه. ب متوسط طيف الترددات المتزامن مع LOC لـ 14 موضوعًا. ج متوسط طيف الطاقة في الحالة الأساسية (أسود)، متوسط بين 0 و 10 ثوانٍ قبل تسريب البروبوفل، وبعد تسريب البروبوفل (أحمر)، متوسط بين 0 و 10 ثوانٍ قبل LOC. الظل يعكس
خط متقطع.
النموذج يتنبأ ويquantifies تأثيرات البروبوفل على طيف EEG. تشير النتائج أعلاه إلى أن إزالة الاتجاه الطيفي قد تكون مهمة في التجارب الدوائية حيث تستهدف العديد من الأدوية قنوات الأيونات وتغير الاستجابات بعد المشبكية. لاختبار هذا التنبؤ النموذجي، قمنا بالتحقيق في توقيعات EEG للمخدر العام البروبوفل،
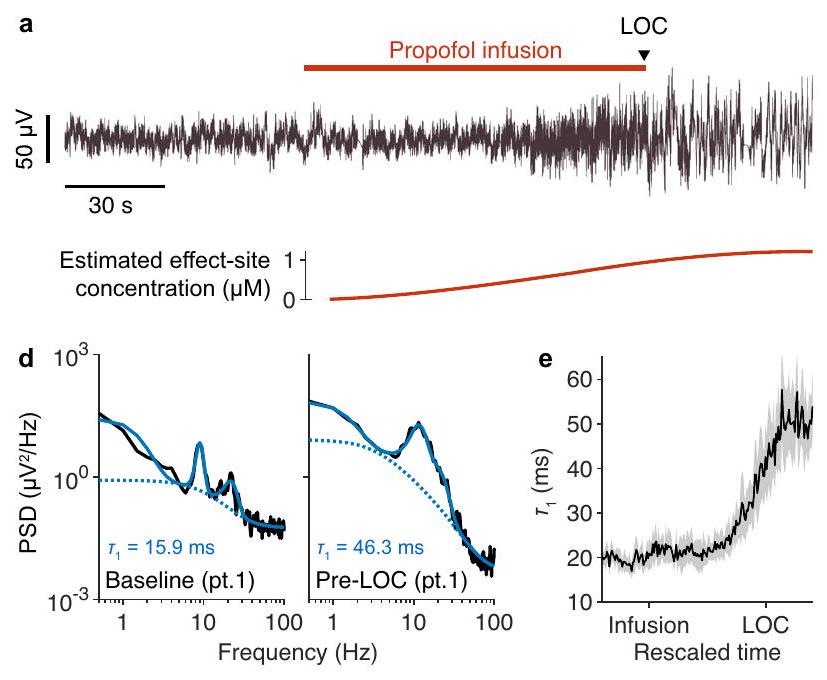
تشير نتائج نمذجة لدينا إلى أن البروبوفول يزيد من قوة الترددات المنخفضة من خلال زيادة المقياس الزمني البطيء،
0-10 ثانية قبل فقدان الوعي (الشكل 8e). لوحظت تغييرات مماثلة في مواقع أقطاب كهربائية أخرى (الشكل S6). من خلال رسم القيمة المقدرة لـ
تصحيح أوقات المشابك يكشف عن توقيع فريد لـ LOC
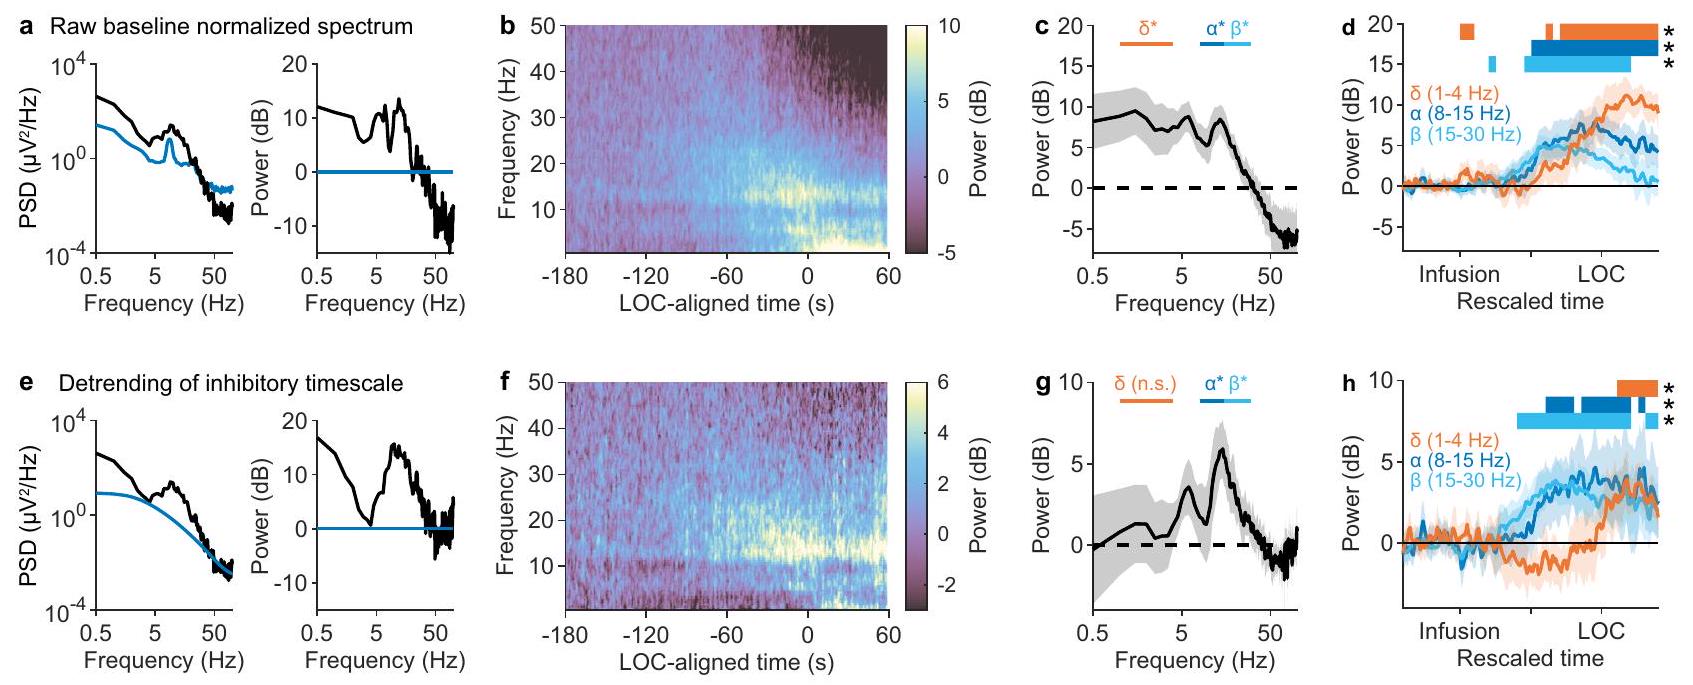
تنبأت نتائج نمذجة لدينا بأن تأثير البروبوفول على أوقات التوصيل المشبكي سيؤدي إلى أخطاء في التقديرات التقليدية لإيقاعات الدماغ. وقد اقترحت الدراسات السابقة أن فقدان الوعي الناتج عن البروبوفول مرتبط بتغيرات في دلتا (
الشكل 9 | تصحيح مقاييس الزمن المشبكي يكشف عن توقيع فريد لفقدان الوعي. أ اليسار: طيف طاقة EEG التمثيلي بعد فقدان الوعي (أسود) لموضوع واحد، متراكب على طيف الطاقة عند الخط الأساسي (أزرق). اليمين: طيف الطاقة بعد فقدان الوعي (أسود) معدل إلى الخط الأساسي. ب متوسط طيف الطاقة المعدل عند الخط الأساسي (
ملحوظة (
مما أدى إلى طاقة بيتا ليست مختلفة إحصائيًا عن الخط الأساسي بعد فقدان الوعي (الشكل 9د).
مما أدى إلى طاقة بيتا ليست مختلفة إحصائيًا عن الخط الأساسي بعد فقدان الوعي (الشكل 9د).
لتصحيح التأثيرات المربكة للبروبوفل، قسمنا طاقة EEG عند كل نقطة زمنية بواسطة مقاييس الزمن المشبكي المقدرة الملائمة من القسم السابق (الشكل 9هـ). ثم قمنا بتعديل الطاقة المعدلة بواسطة الطاقة المعدلة عند الخط الأساسي (الشكل 9و)، بحيث تعكس التغيرات في طاقة النطاق التغيرات الطيفية غير المفسرة بزيادة في
نقاش
في هذه الدراسة، استكشفنا الأساس العصبي لاتجاه طيف EEG وفحصنا تداعياته على تفسير وتحليل EEG. خرجت عدة استنتاجات مهمة من هذه التحقيقات. أولاً، قدم هذا العمل دليلًا حيويًا على أن النشاط العصبي غير الإيقاعي قادر على توليد إشارات EEG قابلة للاكتشاف. ثانيًا، عززت نمذجاتنا توقعات النماذج الحسابية الأبسط
أ amplitudes الذروة الطيفية تتأثر بشكل ضئيل بتقلبات النشاط العصبي غير الإيقاعي. من ناحية أخرى، وجدنا أن التغيرات النظامية في خصائص تيار المشبك تتطلب تعديلًا لتفسير التغيرات الطيفية بدقة كاختلافات في النشاط العصبي. اقترحت نتائجنا أن هذا السيناريو الأخير مهم بشكل خاص لتسجيلات EEG المستخدمة بالتزامن مع التدخلات الدوائية.
أ amplitudes الذروة الطيفية تتأثر بشكل ضئيل بتقلبات النشاط العصبي غير الإيقاعي. من ناحية أخرى، وجدنا أن التغيرات النظامية في خصائص تيار المشبك تتطلب تعديلًا لتفسير التغيرات الطيفية بدقة كاختلافات في النشاط العصبي. اقترحت نتائجنا أن هذا السيناريو الأخير مهم بشكل خاص لتسجيلات EEG المستخدمة بالتزامن مع التدخلات الدوائية.
يفترض التحليل الطيفي التقليدي أن طاقة EEG ضمن نطاقات التردد الكانونية تعكس إيقاعات دماغية متنوعة. تتحدى نتائج نمذجاتنا بشكل جدي هذا الافتراض. على وجه التحديد، إذا لم يكن هناك ذروة طيفية واضحة ضمن نطاق تردد معين، فإن عملنا يبرر فرضية بديلة معقولة فسيولوجيًا وواقعية حيويًا، وهي أن طاقة النطاق تعكس النشاط العصبي العريض النطاق. وبالتالي، تتحقق نتائجنا من الافتراض الرئيسي لطرق تعديل الطيف، مثل خوارزمية FOOOF
من المهم أن نتائجنا لا تدعم بالضرورة نهجًا قائمًا على البيانات فقط لتعديل أطياف EEG. بينما تؤثر التغيرات في النشاط غير الإيقاعي على الذروات الطيفية بطريقة إضافية (الشكل 5)، فإن التغيرات في التيارات المشبكية تقوم بتعديل الذروات الطيفية بشكل مضاعف (الشكل 7)؛ وبالتالي تتطلب هذان الآليتان طريقتين متميزتين للتعديل، أي، تعديل طرح مقابل تعديل قسمة، على التوالي. بدون معرفة مسبقة، من غير الواضح أي طريقة مطلوبة. علاوة على ذلك، نظرًا لارتفاع الذروات فوق الاتجاه الخلفي النموذجي في أطياف EEG، فإن التغيرات الإضافية الصغيرة في الاتجاه ستغير الذروة بشكل ضئيل مقارنة بالأخطاء الناتجة عن تعديل غير صحيح (الشكل 5). بشكل عام، نستنتج أنه يجب عدم إجراء تعديل طيفي ما لم يكن هناك مبرر واضح فسيولوجيًا وحيويًا.
في التحليل المقدم هنا، كانت هناك معرفة مسبقة بعمل البروبوفل الموثق جيدًا على حركيات GABAR
إلى ضرورة تعديل القسمة. لتقليل فرص الإفراط في التكيف، قمنا بتقييد قيم المعلمات إلى نطاقات معقولة فسيولوجيًا، وتحققنا من أن التغيرات الطيفية الملائمة و
إلى ضرورة تعديل القسمة. لتقليل فرص الإفراط في التكيف، قمنا بتقييد قيم المعلمات إلى نطاقات معقولة فسيولوجيًا، وتحققنا من أن التغيرات الطيفية الملائمة و
أشارت النمذجات السابقة إلى أن الأس exponent الطيفي لـ EEG يعكس نسبة E:I، والتي تعتمد على الافتراض بأن طاقة التردد المنخفض تهيمن عليها التيارات المثبطة
بينما اقترحت عدة دراسات أن الحرج الانهياري قد يكون مسؤولاً عن النطاق الترددي
تعتبر إيقاعات دلتا سمة شائعة للتخدير العام، حيث يمكن تحفيزها بسهولة في البشر بواسطة البروبوفل، والسيفوفلوران، والثيوبنتال، والزينون.
تظهر التغيرات في الديناميات العصبية بعد الزيادة التي يسببها البروبوفول في قوة ألفا وبيتا (الشكل 9). وفقًا لمحاكياتنا، من الممكن أن الزيادة الملحوظة في قوة التردد المنخفض تعود إلى اقتراب الدماغ من حالة حرجة الانهيار (الأشكال 4 و5). تتعارض مع هذا التفسير نماذج الشبكات المثيرة/المثبطة، التي تقترح أن زيادة المثبطات تعزز الحالة غير المتزامنة.
تظهر التغيرات في الديناميات العصبية بعد الزيادة التي يسببها البروبوفول في قوة ألفا وبيتا (الشكل 9). وفقًا لمحاكياتنا، من الممكن أن الزيادة الملحوظة في قوة التردد المنخفض تعود إلى اقتراب الدماغ من حالة حرجة الانهيار (الأشكال 4 و5). تتعارض مع هذا التفسير نماذج الشبكات المثيرة/المثبطة، التي تقترح أن زيادة المثبطات تعزز الحالة غير المتزامنة.
باختصار، نستنتج أن النشاط العصبي غير الدوري يمكن أن يساهم في إشارات تخطيط الدماغ (EEG)، وأن الاتجاه الطيفي يتشكل أيضًا من خلال العديد من الآليات الفسيولوجية، مثل توازن الإثارة/التثبيط وأوقات المشابك. نستنتج أن الأس exponent الطيفي ليس مجرد مقياس مختلط لإيقاعات الدماغ وبالتالي يوفر علامة حيوية مكملة لحالة الدماغ. ومع ذلك، نستنتج أيضًا أن الأس exponent الطيفي ليس له تفسير فسيولوجي وحيد. أخيرًا، نستنتج أن طيف تخطيط الدماغ يحتاج إلى إزالة الاتجاه عند قياس إيقاعات الدماغ، ولكن فقط إذا تم تغيير خصائص التيار بعد المشبكي بشكل منهجي. خلاف ذلك، من المحتمل أن يؤدي إزالة الاتجاه إلى إدخال أخطاء كبيرة في قياس إيقاعات الدماغ، وبالتالي يجب تجنبها.
طرق
تعريفات وإطار نظري
يمكن وصف إشارة تخطيط الدماغ الكهربائي (EEG) على أنها التركيب الخطي للحقول الكهربائية الناتجة عن جميع الخلايا العصبية في الدماغ.
هنا،
محاكاة الخلايا العصبية ما بعد المشبك
كانت أشكال الخلايا العصبية بالإضافة إلى وفرتها النسبية هي نفسها التي استخدمها هاجن وآخرون.
تم التحقيق فيه في نطاق من 0.01 إلى
تم التحقيق فيه في نطاق من 0.01 إلى
تقدير سعة EEG الجماعية
نظرًا لأن ثنائيات القطب تتجمع بشكل خطي، يمكن تحليل إشارة EEG الناتجة عن N من الخلايا العصبية على أنها تراكب لإشارات EEG لخلايا عصبية فردية N. وبالتالي، سيكون لدى EEG الجماعي متوسط طاقة قدره
قالب الدماغ هو شبكة مثلثية بأوجه ذات مساحات
أين
يتبع ذلك أن القدرة المتوقعة للإشارة من إشارة EEG الجماعية هي
الكمية التجريبية لـ
غير مترابط بين الخلايا العصبية
غير مترابط بين الخلايا العصبية
نموذج الشبكة دون الحرجة
تم ربط الخلايا العصبية السابقة المشبكية بـ
تضمين المشابك العصبية على الشجيرات ما بعد المشبكية
تم نمذجة التزامن ثنائي القطب سابقًا إما عن طريق فصل المدخلات المثبطة والمثيرة إلى أقسام جسدية وقمية، على التوالي.
لنمذجة وضع المشابك غير المثالي، قمنا بتشويش التضمين الكروي عشوائيًا قبل رسم المشابك. تم تشويش كل نقطة في التضمين بمسافة
يمكن اعتبار هذه العملية نموذجًا لارتباط ثنائي القطب يتجاوز المدخلات الثنائية. بدلاً من ذلك، يمكن اعتبار هذه العملية من حيث الملاحظات من الآونة الأخيرة.
الدراسات التي أفادت بأن المدخلات المشبكية المرتبطة وظيفيًا تتجمع ضمن فروع دندريتية فردية، وأن المدخلات من مجموعات مسبقة التشابك مشابهة تستهدف أقسام دندريتية مشابهة في المجموعة ما بعد المشبكية.
الدراسات التي أفادت بأن المدخلات المشبكية المرتبطة وظيفيًا تتجمع ضمن فروع دندريتية فردية، وأن المدخلات من مجموعات مسبقة التشابك مشابهة تستهدف أقسام دندريتية مشابهة في المجموعة ما بعد المشبكية.
مدخلات مشبكية مختلطة
لتمثيل المدخلات الاهتزازية، استخدمنا صيغة منشورة لتوليد الإيقاع، حيث تم تطبيق مدخلات جيبية متعاكسة على الشجيرات القمية والقاعدية.
تصميم التجربة والإجراء
بعد موافقة مجلس أخلاقيات MNH، قمنا بتجنيد 16 مريضًا من فئة الجمعية الأمريكية لطب التخدير (ASA) من الفئة I أو II (تتراوح أعمارهم بين 18-65 عامًا) الذين قدموا لإجراء جراحة القرص القطني كمواضيع للدراسة. قدم جميع المشاركين موافقة خطية مستنيرة للمشاركة في الدراسة. تم تطبيق معايير الرعاية الخاصة بجمعية أطباء التخدير الكندية فيما يتعلق بالمراقبة والمعدات ومقدمي الرعاية بشكل صارم. تم استخدام أقطاب كهربائية على شكل كوب ذهبي (Fz، Cz، Pz، C3، C4، CP3، CP4، M2 كمرجع؛ FC1 كأرضية؛ مقاومة
تحليل البيانات
تم استبعاد مشاركين اثنين بسبب عدم الامتثال للتعليمات خلال مرحلة الإدخال. كان أحدهما يتحدث باستمرار، والآخر كان يتحرك بذراعه المهيمنة. وبالتالي، كانت مجموعة البيانات النهائية مبنية على 14 شخصًا (10 ذكور؛ 12 يميني اليد). تم إزالة الشوائب في البيانات بعد الفحوصات البصرية لسلاسل الزمن. تم حساب طيف الترددات باستخدام طريقة متعددة الأشرطة، مع استخدام ثلاثة أشرطة على نوافذ مدتها 2 ثانية، مع تداخل قدره 1.9 ثانية. تم حساب متوسطات المجموعة إما كمتوسط كثافة الطاقة الطيفية عبر المشاركين مع الوقت المتماشي مع LOC، أو مع إعادة قياس الوقت بحيث يتم محاذاة كل من بداية التسريب وLOC عبر الأفراد. لإعادة قياس الوقت، تم تعديل الوقت المتماشي مع LOC لكل مشارك بناءً على فترة الانتظار من التسريب إلى LOC.
وبالتالي، فإن قيمة الوقت المعاد قياسها -1 تعادل لحظة بدء تسريب البروبوفل، وقيمة الوقت المعاد قياسها 0 تعادل لحظة فقدان الوعي.
تركيز البروبوofول المقدر
لتقدير تركيز الموقع الفعال للبروبوفول لكل موضوع، استخدمنا نموذج مارش، وهو نموذج حركية دوائية متعددة الحجرات.
إزالة الاتجاه من طيف EEG
لإزالة الاتجاه من طيف EEG، استخدمنا نسخة معدلة من خوارزمية FOOOF
لتحليل البيانات التجريبية، قمنا بتعديل المعادلة 1 لتوفير ملاءمات أفضل للبيانات وتقليل فرص الإفراط في التكيف. على عكس محاكياتنا، وجدنا أن الطاقة عالية التردد استقرت في بياناتنا حول النقطة التي كنا نتوقع أن يؤثر فيها مقياس الزمن المشبكي المثير (الشكل 1d، f). لذلك، استبدلنا الحد الثاني في المعادلة بحد ثابت،
هذا الحد الثابت،
كانت هذه المعادلة المعدلة تناسب طيف EEG في ظروف القاعدة بشكل جيد، ولكن بعد حقن البروبوبول، لم تتدهور المعادلة بسرعة كافية لالتقاط طيف EEG (الشكل S7). وكان ذلك على ما يبدو لأن المعادلات الأصلية قد بسّطت بشكل مفرط حركيات المشابك المثبطة. ومن الجدير بالذكر أن المعادلة 1 هي حل تحليلي للاستجابات المشبكية المتدهورة بشكل أسي، في حين أن الاستجابات المشبكية الحقيقية تتميز بوقت ارتفاع ووقت تدهور:
حيث يكون الحد الأول هو الحل التحليلي لطيف الطاقة لفارق الأسية.
ملخص التقرير
معلومات إضافية حول تصميم البحث متاحة في ملخص تقارير مجموعة ناتشر المرتبط بهذه المقالة.
توفر البيانات
تم رفع مخططات EEG المحسوبة لجميع المشاركين إلى Figshare
توفر الشيفرة
الكود المستخدم لتشغيل المحاكيات، تحليل البيانات، وإنشاء أشكال المخطوطات
References
- Berger, H. Über das elektrenkephalogramm des menschen. Arch. Psychiatr. Nervenkr. 87, 527-570 (1929).
- Steriade, M. Cellular substrates of brain rhythms. Electroencephalogr. Basic Princ. Clin. Appl. Relat. fields 5, 31-83 (2005).
- Nunez, P. L. & Srinivasan, R. Electric Fields of the Brain (Oxford Univ. Press, Oxford, 2006). https://doi.org/10.1093/acprof:oso/ 9780195050387.001.0001.
- Buzsáki, G., Anastassiou, C. A. & Koch, C. The origin of extracellular fields and currents – EEG, ECoG, LFP and spikes. Nat. Rev. Neurosci. 13, 407-420 (2012).
- Pritchard, W. S. The brain in fractal time:
f-like power spectrum scaling of the human electroencephalogram. Int. J. Neurosci. 66, 119-129 (1992). - Manning, J. R., Jacobs, J., Fried, I. & Kahana, M. J. Broadband shifts in local field potential power spectra are correlated with singleneuron spiking in humans. J. Neurosci. 29, 13613-13620 (2009).
- Miller, K. J., Sorensen, L. B., Ojemann, J. G. & Den Nijs, M. Power-law scaling in the brain surface electric potential. PLoS Comput. Biol. 5, e1000609 (2009).
- He, B. J. Scale-free brain activity: past, present, and future. Trends Cogn. Sci. 18, 480-487 (2014).
- Voytek, B. et al. Age-related changes in
neural electrophysiological noise. J. Neurosci. 35, 13257-13265 (2015). - Roche, K. J. et al. Electroencephalographic spectral power as a marker of cortical function and disease severity in girls with rett syndrome. J. Neurodev. Disord. 11, 15 (2019).
- Colombo, M. A. et al. The spectral exponent of the resting EEG indexes the presence of consciousness during unresponsiveness induced by propofol, xenon, and ketamine. Neuroimage 189, 631-644 (2019).
- Ouyang, G., Hildebrandt, A., Schmitz, F. & Herrmann, C. S. Decomposing alpha and
brain activities reveals their differential associations with cognitive processing speed. Neuroimage 205, 116304 (2020). - Lendner, J. D. et al. An electrophysiological marker of arousal level in humans. Elife 9, 1-29 (2020).
- Donoghue, T. et al. Parameterizing neural power spectra into periodic and aperiodic components. Nat. Neurosci. 23, 1655-1665 (2020).
- Bédard, C., Kröger, H. & Destexhe, A. Does the
frequency scaling of brain signals reflect self-organized critical states? Phys. Rev. Lett. 97, 118102 (2006). - Gao, R., Peterson, E. J. & Voytek, B. Inferring synaptic excitation/ inhibition balance from field potentials. Neuroimage 158, 70-78 (2017).
- Bak, P., Tang, C. & Wiesenfeld, K. Self-organized criticality: an explanation of the
noise. Phys. Rev. Lett. 59, 381-384 (1987). - Beggs, J. M. & Plenz, D. Neuronal avalanches in neocortical circuits. J. Neurosci. 23, 11167-11177 (2003).
- Priesemann, V. Spike avalanches in vivo suggest a driven, slightly subcritical brain state. Front. Syst. Neurosci. 8, 108 (2014).
- Chaudhuri, R., He, B. J. & Wang, X. J. Random recurrent networks near criticality capture the broadband power distribution of human ECoG dynamics. Cereb. Cortex 28, 3610-3622 (2018).
- Lombardi, F., Herrmann, H. J. & de Arcangelis, L. Balance of excitation and inhibition determines
power spectrum in neuronal networks. Chaos Interdiscip. J. Nonlinear Sci. 27, 047402 (2017). - Buzsáki, G. & Draguhn, A. Neuronal olscillations in cortical networks. Science 304, 1926-1929 (2004).
- Buzsáki, G. & Vöröslakos, M. Brain rhythms have come of age. Neuron 111, 922-926 (2023).
- Huang, Y., Parra, L. C. & Haufe, S. The New York head-a precise standardized volume conductor model for EEG source localization and tES targeting. Neuroimage 140, 150-162 (2016).
- Hagen, E. et al. Hybrid scheme for modeling local field potentials from point-neuron networks. Cereb. Cortex 26, 4461-4496 (2016).
- Næss, S. et al. Biophysically detailed forward modeling of the neural origin of eeg and meg signals. Neuroimage 225, 117467 (2021).
- Orser, B. A., Wang, L. Y., Pennefather, P. S. & MacDonald, J. F. Propofol modulates activation and desensitization of
receptors in cultured murine hippocampal neurons. J. Neurosci. 14, 7747-7760 (1994). - Kitamura, A., Marszalec, W., Yeh, J. Z. & Narahashi, T. Effects of halothane and propofol on excitatory and inhibitory synaptic transmission in rat cortical neurons. J. Pharmacol. Exp. Ther. 304, 162-171 (2003).
- Whittington, M. A., Jefferys, J. G. R. & Traub, R. D. Effects of intravenous anaesthetic agents on fast inhibitory oscillations in the rat hippocampus in vitro. Br. J. Pharmacol. 118, 1977-1986 (1996).
- Franks, N. P. General anaesthesia: from molecular targets to neuronal pathways of sleep and arousal. Nat. Rev. Neurosci. 9, 370-386 (2008).
- McInnes, L., Healy, J. & Melville, J. UMAP: uniform manifold approximation and projection for dimension reduction. Preprint at https://arxiv.org/abs/1802.03426 (2020).
- Wilting, J. & Priesemann, V. Between perfectly critical and fully irregular: a reverberating model captures and predicts cortical spike propagation. Cereb. Cortex 29, 2759-2770 (2019).
- Suryadi, Cheng, R.-K., Birkett, E., Jesuthasan, S. & Chew, L. Y. Dynamics and potential significance of spontaneous activity in the habenula. eneuro 9, ENEURO.0287-21.2022 (2022).
- Lombardi, F., Pepić, S., Shriki, O., Tkačik, G. & De Martino, D. Statistical modeling of adaptive neural networks explains co-existence of avalanches and oscillations in resting human brain. Nat. Comput. Sci. 3, 254-263 (2023).
- Guay, C. S. & Plourde, G. Handgrip dynamometry for continuous assessment of volitional control during induction of anesthesia: a prospective observational study. Can. J. Anesth. Can. d’Anesth.ésie 66, 48-56 (2019).
- Cummings, G. C. et al. Dose requirements of
(Propofol, ‘Diprivan’) in a new formulation for induction of anaesthesia. Anaesthesia 39, 1168-1171 (1984). - Marsh, B., White, M., Morton, N. & Kenny, G. N. C. Pharmacokinetic model driven infusion of propofol in children. Br. J. Anaesth. 67, 41-48 (1991).
- Purdon, P. L. et al. Electroencephalogram signatures of loss and recovery of consciousness from propofol. Proc. Natl Acad. Sci. USA 110, E1142-E1151 (2013).
- Li, J. & Shew, W. L. Tuning network dynamics from criticality to an asynchronous state. PLOS Comput. Biol. 16, e1008268 (2020).
- Zeraati, R., Engel, T. A. & Levina, A. A flexible bayesian framework for unbiased estimation of timescales. Nat. Comput. Sci. 2, 193-204 (2022).
- Gao, R., van den Brink, R. L., Pfeffer, T. & Voytek, B. Neuronal timescales are functionally dynamic and shaped by cortical microarchitecture. Elife 9, e61277 (2020).
- Reimann, M. W. et al. A biophysically detailed model of neocortical local field potentials predicts the critical role of active membrane currents. Neuron 79, 375-390 (2013).
- Suzuki, M. & Larkum, M. E. Dendritic calcium spikes are clearly detectable at the cortical surface. Nat. Commun. 8, 276 (2017).
- Petermann, T. et al. Spontaneous cortical activity in awake monkeys composed of neuronal avalanches. Proc. Natl Acad. Sci. USA 106, 15921-15926 (2009).
- Iacaruso, M. F., Gasler, I. T. & Hofer, S. B. Synaptic organization of visual space in primary visual cortex. Nature 547, 449-452 (2017).
- Scholl, B., Wilson, D. E. & Fitzpatrick, D. Local order within global disorder: synaptic architecture of visual space. Neuron 96, 1127-1138.e4 (2017).
- Kerlin, A. et al. Functional clustering of dendritic activity during decision-making. Elife 8, e46966 (2019).
- Ju, N. et al. Spatiotemporal functional organization of excitatory synaptic inputs onto macaque v1 neurons. Nat. Commun. 11, 697 (2020).
- Lafourcade, M. et al. Differential dendritic integration of long-range inputs in association cortex via subcellular changes in synaptic ampa-to-nmda receptor ratio. Neuron 110, 1532-1546.e4 (2022).
- Gugino, L. D. et al. Quantitative eeg changes associated with loss and return of consciousness in healthy adult volunteers anaesthetized with propofol or sevoflurane. Br. J. Anaesth. 87, 421-428 (2001).
- Murphy, M. et al. Propofol anesthesia and sleep: a high-density EEG study. Sleep 34, 283-291 (2011).
- Lewis, L. D. et al. Rapid fragmentation of neuronal networks at the onset of propofol-induced unconsciousness. Proc. Natl Acad. Sci. USA 109, E3377-E3386 (2012).
- Huupponen, E. et al. Electroencephalogram spindle activity during dexmedetomidine sedation and physiological sleep. Acta Anaesthesiol. Scand. 52, 289-294 (2008).
- Ma, J. & Leung, L. S. Limbic system participates in mediating the effects of general anesthetics. Neuropsychopharmacology 31, 1177-1192 (2006).
- Johnson, B. W., Sleigh, J. W., Kirk, I. J. & Williams, M. L. High-density EEG mapping during general anaesthesia with xenon and propofol: a pilot study. Anaesth. Intensive Care 31, 155-163 (2003).
- Amzica, F. & Steriade, M. Electrophysiological correlates of sleep delta waves. Electroencephalogr. Clin. Neurophysiol. 107, 69-83 (1998).
- Steriade, M. Corticothalamic resonance, states of vigilance and mentation. Neuroscience 101, 243-276 (2000).
- Le Masson, G., Renaud-Le Masson, S., Debay, D. & Bal, T. Feedback inhibition controls spike transfer in hybrid thalamic circuits. Nature 417, 854-858 (2002).
- Tagliazucchi, E. et al. Increased global functional connectivity correlates with LSD-induced ego dissolution. Curr. Biol. 26, 1043-1050 (2016).
- Toker, D. et al. Consciousness is supported by near-critical slow cortical electrodynamics. Proc. Natl Acad. Sci. USA 119, 1-12 (2022).
- Malmivuo, J. & Plonsey, R. Bioelectromagnetism (Oxford Univ. Press, Oxford, 1995).
- Palmer, L., Murayama, M. & Larkum, M. Inhibitory regulation of dendritic activity in vivo. Front. Neural Circuits 6, 26 (2012).
- lascone, D. M. et al. Whole-neuron synaptic mapping reveals spatially precise excitatory/inhibitory balance limiting dendritic and somatic spiking. Neuron 106, 566-578.e8 (2020).
- Karimi, A., Odenthal, J., Drawitsch, F., Boergens, K. M. & Helmstaedter, M. Cell-type specific innervation of cortical pyramidal cells at their apical dendrites. Elife 9, 1-23 (2020).
- Hagen, E., Næss, S., Ness, T. V. & Einevoll, G. T. Multimodal modeling of neural network activity: computing lfp, ecog, eeg, and meg signals with lfpy 2.0. Front. Neuroinform. 12, 92 (2018).
- Carnevale, N. T. & Hines, M. L. The NEURON Book (Cambridge University Press, 2006). https://doi.org/10.1017/ CBO9780511541612.
- Fonov, V., Evans, A., McKinstry, R., Almli, C. & Collins, D. Unbiased nonlinear average age-appropriate brain templates from birth to adulthood. Neuroimage 47, S102 (2009).
- Fonov, V. et al. Unbiased average age-appropriate atlases for pediatric studies. Neuroimage 54, 313-327 (2011).
- Carlo, C. N. & Stevens, C. F. Structural uniformity of neocortex, revisited. Proc. Natl Acad. Sci. USA 110, 1488-1493 (2013).
- Volgushev, M., Chauvette, S. & Timofeev, I. Long-range correlation of the membrane potential in neocortical neurons during slow oscillation. in Progress in Brain Research 181-199 (2011). https://doi. org/10.1016/B978-0-444-53839-0.00012-0.
- Einevoll, G. T., Kayser, C., Logothetis, N. K. & Panzeri, S. Modelling and analysis of local field potentials for studying the function of cortical circuits. Nat. Rev. Neurosci. 14, 770-785 (2013).
- Jones, S. R. et al. Quantitative analysis and biophysically realistic neural modeling of the MEG mu rhythm: rhythmogenesis and modulation of sensory-evoked responses. J. Neurophysiol. 102, 3554-3572 (2009).
- Studenova, A. A., Villringer, A. & Nikulin, V. V. Non-zero mean alpha oscillations revealed with computational model and empirical data. PLoS Comput. Biol. 18, e1010272 (2022).
- Cutts, C. S. & Eglen, S. J. Detecting pairwise correlations in spike trains: an objective comparison of methods and application to the study of retinal waves. J. Neurosci. 34, 14288-14303 (2014).
- Struys, M. M. R. F. et al. Comparison of plasma compartment versus two methods for effect compartment-controlled target-controlled infusion for propofol. Anesthesiology 92, 399-399 (2000).
- Muthukumaraswamy, S. D. High-frequency brain activity and muscle artifacts in MEG/EEG: a review and recommendations. Front. Hum. Neurosci. 7, 138 (2013).
- Sceniak, M. P. & Maclver, M. B. Slow
mediated synaptic transmission in rat visual cortex. BMC Neurosci. 9, 8 (2008). - Brake, N. et al. EEG data during propofol anesthesia and a biophysical model of the EEG spectral trend. figshare. https://doi.org/10. 6084/m9.figshare. 24777990 (2023).
- Brake, N. niklasbrake/EEG_modelling: Manuscript revisions (v1.0.0). Zenodo. https://zenodo.org/doi/10.5281/zenodo. 10359817 (2023).
شكر وتقدير
تم دعم هذا العمل من قبل مجلس أبحاث العلوم الطبيعية والهندسة في كندا (NSERC) منحة الاكتشاف (RGPIN-2019O4520) إلى A.K. تم دعم N.B. من قبل منحة الدراسات العليا NSERC-CREATE في الديناميات المعقدة وصندوق أبحاث كيبيك.
- منحة تدريب الدكتوراه في الطبيعة والتكنولوجيا (FRQNT). لم يكن للممولين أي دور في تصميم الدراسة، جمع البيانات وتحليلها، اتخاذ قرار النشر، أو إعداد المخطوطة.
مساهمات المؤلفين
تصور: ن.ب.، ج.ب. و أ.ك. تنسيق البيانات: ن.ب. و ج.ب. التحليل الرسمي: ن.ب. الحصول على التمويل: أ.ك. و ج.ب. التحقيق: ن.ب.، ف.د.، أ.ر.، ف.أ.، س.س. و ج.ب. المنهجية: ن.ب. إدارة المشروع: أ.ك. و ج.ب. البرمجيات: ن.ب. الإشراف: أ.ك. و ج.ب. التصور: ن.ب. كتابة المسودة الأصلية: ن.ب. الكتابة – المراجعة والتحرير: ن.ب.، أ.ك. و ج.ب.
المصالح المتنافسة
يعلن المؤلفون عدم وجود مصالح متنافسة.
معلومات إضافية
معلومات إضافية النسخة الإلكترونية تحتوي على
المواد التكميلية متاحة على
https://doi.org/10.1038/s41467-024-45922-8.
المواد التكميلية متاحة على
https://doi.org/10.1038/s41467-024-45922-8.
يجب توجيه المراسلات والطلبات للحصول على المواد إلى أنمار خضر أو جيل بلورد.
معلومات مراجعة الأقران تشكر مجلة Nature Communications ريتشارد قاو وبالاز هانغيا على مساهمتهما في مراجعة هذا العمل. يتوفر ملف مراجعة الأقران.
معلومات إعادة الطباعة والتصاريح متاحة على
http://www.nature.com/reprints
http://www.nature.com/reprints
ملاحظة الناشر: تظل شركة سبرينجر ناتشر محايدة فيما يتعلق بالمطالبات القضائية في الخرائط المنشورة والانتماءات المؤسسية.
الوصول المفتوح. هذه المقالة مرخصة بموجب رخصة المشاع الإبداعي النسب 4.0 الدولية، التي تسمح بالاستخدام والمشاركة والتكيف والتوزيع وإعادة الإنتاج بأي وسيلة أو صيغة، طالما أنك تعطي الائتمان المناسب للمؤلفين الأصليين والمصدر، وتوفر رابطًا لرخصة المشاع الإبداعي، وتوضح ما إذا تم إجراء تغييرات. الصور أو المواد الأخرى من طرف ثالث في هذه المقالة مشمولة في رخصة المشاع الإبداعي الخاصة بالمقالة، ما لم يُشار إلى خلاف ذلك في سطر الائتمان للمواد. إذا لم تكن المادة مشمولة في رخصة المشاع الإبداعي الخاصة بالمقالة وكان استخدامك المقصود غير مسموح به بموجب اللوائح القانونية أو يتجاوز الاستخدام المسموح به، ستحتاج إلى الحصول على إذن مباشرة من صاحب حقوق الطبع والنشر. لعرض نسخة من هذه الرخصة، قم بزيارة http://creativecommons.org/licenses/by/4.0/.
© المؤلفون 2024
© المؤلفون 2024
- ¹برنامج الدكتوراه في علوم الحياة الكمية، جامعة مكغيل، مونتريال، كندا.
قسم الفسيولوجيا، جامعة مكغيل، مونتريال، كندا.
قسم التخدير، جامعة مكغيل، مونتريال، كندا. كلية التمريض، جامعة مكغيل، مونتريال، كندا.
البريد الإلكتروني: anmar.khadra@mcgill.ca; gilles.plourde@mcgill.ca
Journal: Nature Communications, Volume: 15, Issue: 1
DOI: https://doi.org/10.1038/s41467-024-45922-8
PMID: https://pubmed.ncbi.nlm.nih.gov/38374047
Publication Date: 2024-02-19
DOI: https://doi.org/10.1038/s41467-024-45922-8
PMID: https://pubmed.ncbi.nlm.nih.gov/38374047
Publication Date: 2024-02-19
A neurophysiological basis for aperiodic EEG and the background spectral trend
Received: 6 September 2023
Accepted: 6 February 2024
Published online: 19 February 2024
(D) Check for updates
Accepted: 6 February 2024
Published online: 19 February 2024
(D) Check for updates
Electroencephalograms (EEGs) display a mixture of rhythmic and broadband fluctuations, the latter manifesting as an apparent
Electroencephalograms (EEGs) display a mixture of periodic and aperiodic fluctuations. Almost a century of research has established that periodic EEG signals are generated by synchronous neural oscillations
There exist two main hypotheses for how the EEG spectral trend is generated by the brain. The synaptic timescale hypothesis predicts that the EEG spectral trend is a natural consequence of exponentially decaying synaptic currents, and that consequently asynchronous network activity will produce a spectrum with a
Despite these hypotheses, the concept of aperiodic EEG itself remains controversial. Some argue that the apparent trend in EEG spectra is an epiphenomenon caused by slower brain rhythms recruiting larger populations of neurons
Three questions therefore remain open: (1) can EEG signals reflect arrhythmic neural activity? (2) if so, how do these signals shape EEG spectra? (3) do EEG spectra need to be detrended, and if so, what is the most physiologically meaningful method of detrending? To investigate these questions, we combined numerical forward modelling of scalp potentials with biophysical calculations of single-neuron dipoles
Results
EEG cannot reflect asynchronous neural activity
To understand the neurophysiology that underlies the EEG spectral trend, we began by investigating the properties of EEG generation at the single-neuron level. These properties are informative because they shape the ensemble EEG regardless of coherence or neural synchrony
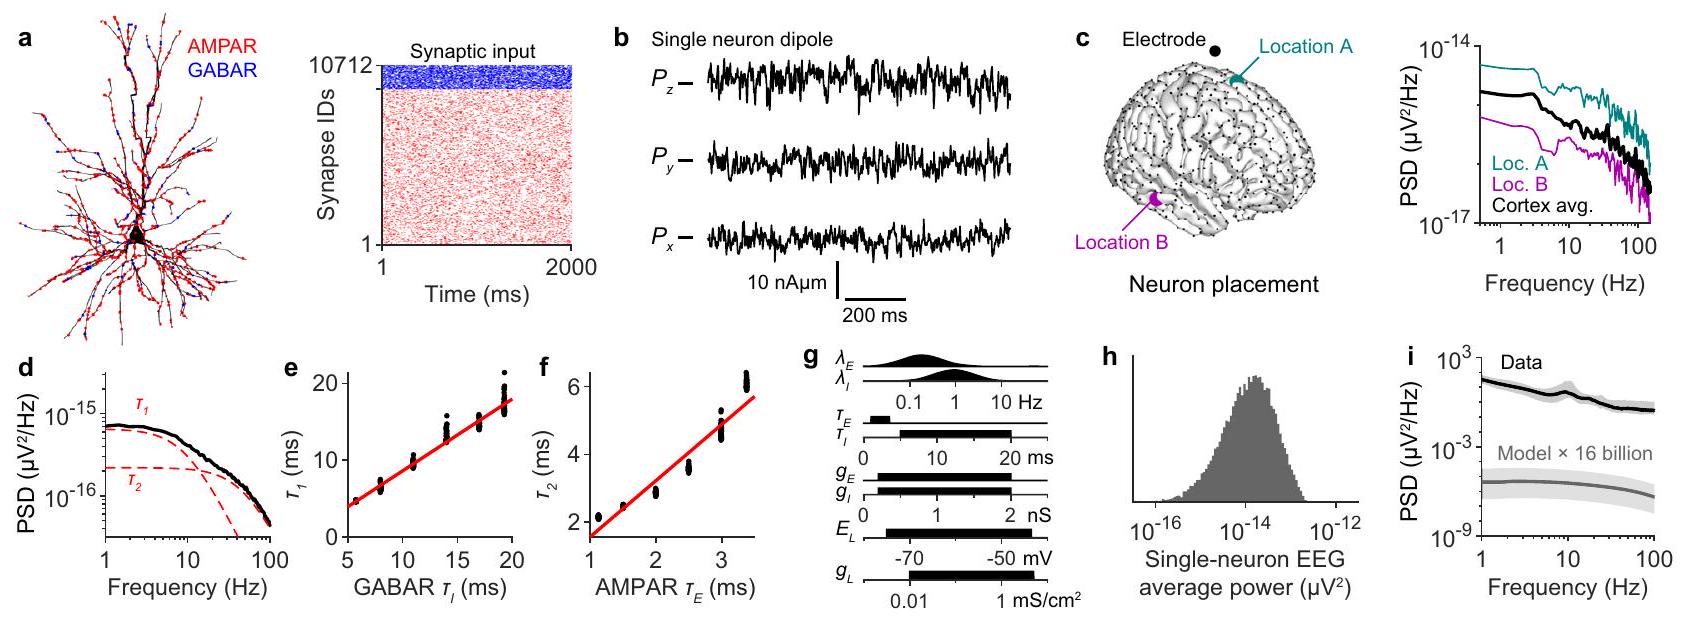
(See Definitions and theoretical framework in Methods). To examine these properties, we performed simulations of biophysically and morphologically detailed neuron models (Fig. 1a). To start, we did not assume any dynamics of presynaptic neurons and therefore modelled synaptic input with independent Poisson spike trains (Fig. 1a), an assumption that we relax later. From these currents, a single-neuron dipole was computed
(See Definitions and theoretical framework in Methods). To examine these properties, we performed simulations of biophysically and morphologically detailed neuron models (Fig. 1a). To start, we did not assume any dynamics of presynaptic neurons and therefore modelled synaptic input with independent Poisson spike trains (Fig. 1a), an assumption that we relax later. From these currents, a single-neuron dipole was computed
The unitary spectrum exhibited two important features. First, even with random synaptic input, the unitary spectrum displayed a trend. This trend could be described as the sum of two Lorentzian functions
as predicted by simple linear models of EEG generation
Second, the unitary spectrum reflects the amplitude with which an average neuron contributes to the EEG signal. To investigate this idea in more detail, we examined the effect of varying all the model parameters within physiologically reasonable ranges (Fig. 1g). Measuring the average power of the resulting single-neuron EEGs revealed
Fig. 1 | EEG cannot reflect asynchronous neural activity. a Example morphology of a layer
deactivation kinetics of GABARs (
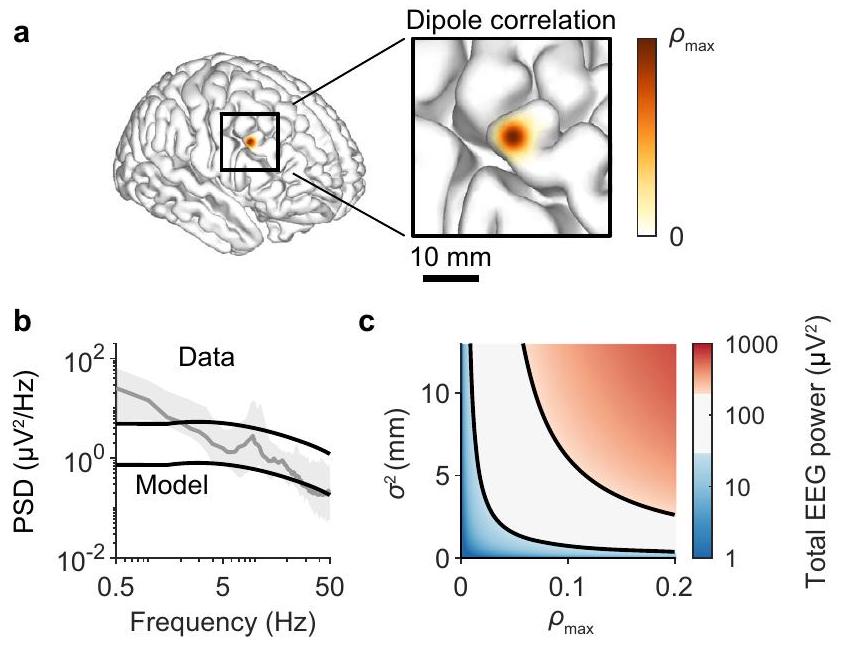
Fig. 2 | Detectable EEG signals require only weak, locally synchronized dipoles. a Schematic displaying the coupling kernel used to correlate single-neuron dipoles. The kernel is a Gaussian function with peak of
a range of possible amplitudes for the contribution of individual neurons to the EEG signal (Fig. 1h). These simulations show that no physiologically plausible parameters could allow 16 billion uncorrelated neurons to generate detectable EEG signals (Fig. 1i). More importantly, these calculations quantify how far off a completely asynchronous cortex is from generating detectable EEG signals. These calculations account for the EEG strength contributed by synaptic current amplitudes, neuron geometry, average firing rate of neurons, the number of neurons, the conductivity of various tissues, and the geometry of the cortex. Therefore, this result indicates that neural dynamics are responsible for the approximate four orders of magnitude difference between the simulated asynchronous spectrum and real EEG recordings.
Detectable EEG requires only weak, locally synchronized dipoles
If the amplitude of EEG signals precludes asynchronous activity from shaping EEG spectra, what types of arrhythmic activity could influence EEG signals? To begin addressing this question, we first quantified in general how much dipole correlation is required to generate detectable EEG signals. To do so, we imposed a simplified spatial organization on a cortical template whereby neighbouring neurons produced correlated dipoles. Specifically, the dipoles of neurons separated by
synchrony, it remains to be determined if and how such a degree of dipole coherence may be achieved by arrhythmic neural activity.
synchrony, it remains to be determined if and how such a degree of dipole coherence may be achieved by arrhythmic neural activity.
Synapse topology is sufficient for dipole correlations
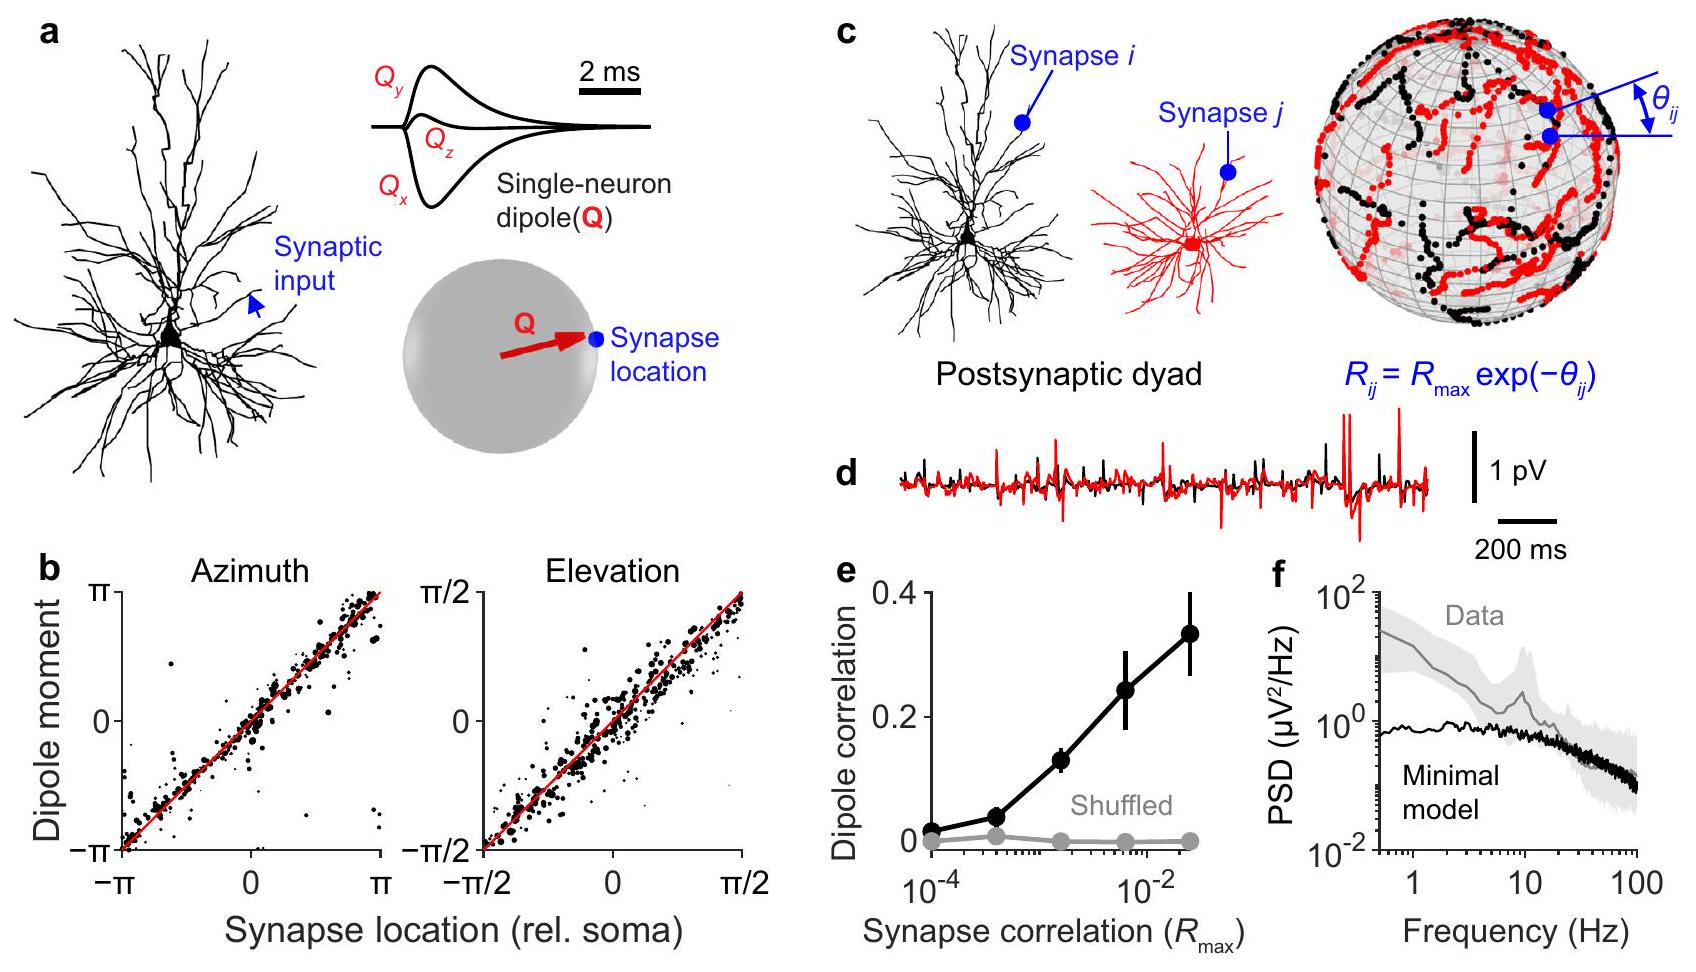
To investigate the ability of neural activity to generate coherent dipoles, we simulated dyads of neurons and investigated the level of correlation achievable between the two single-neuron dipoles. In our simulations, we noticed that if a single synapse was activated, the orientation of the resulting dipole could be accurately predicted by the orientation of the synapse relative to the soma (Fig. 3a, b). This result held across all neuron morphologies investigated (Fig. S1). From this observation, we devised a minimal model of dipole coherence. To generate synaptic input, we projected the synapses of two neurons onto a sphere and correlated the inputs of synapses with close angular distances (Fig. 3c). By changing the maximal correlation between synapses, dipole correlation between neurons of various morphologies could be tuned continuously between 0 and
Subcritical networks can generate aperiodic EEG signals
We next investigated network models that could generate detectable, aperiodic EEG signals. To determine whether network activity could produce coherent dipoles, we utilized the results from the previous section (Fig. 3). After simulating a presynaptic neuron population, we used the UMAP algorithm
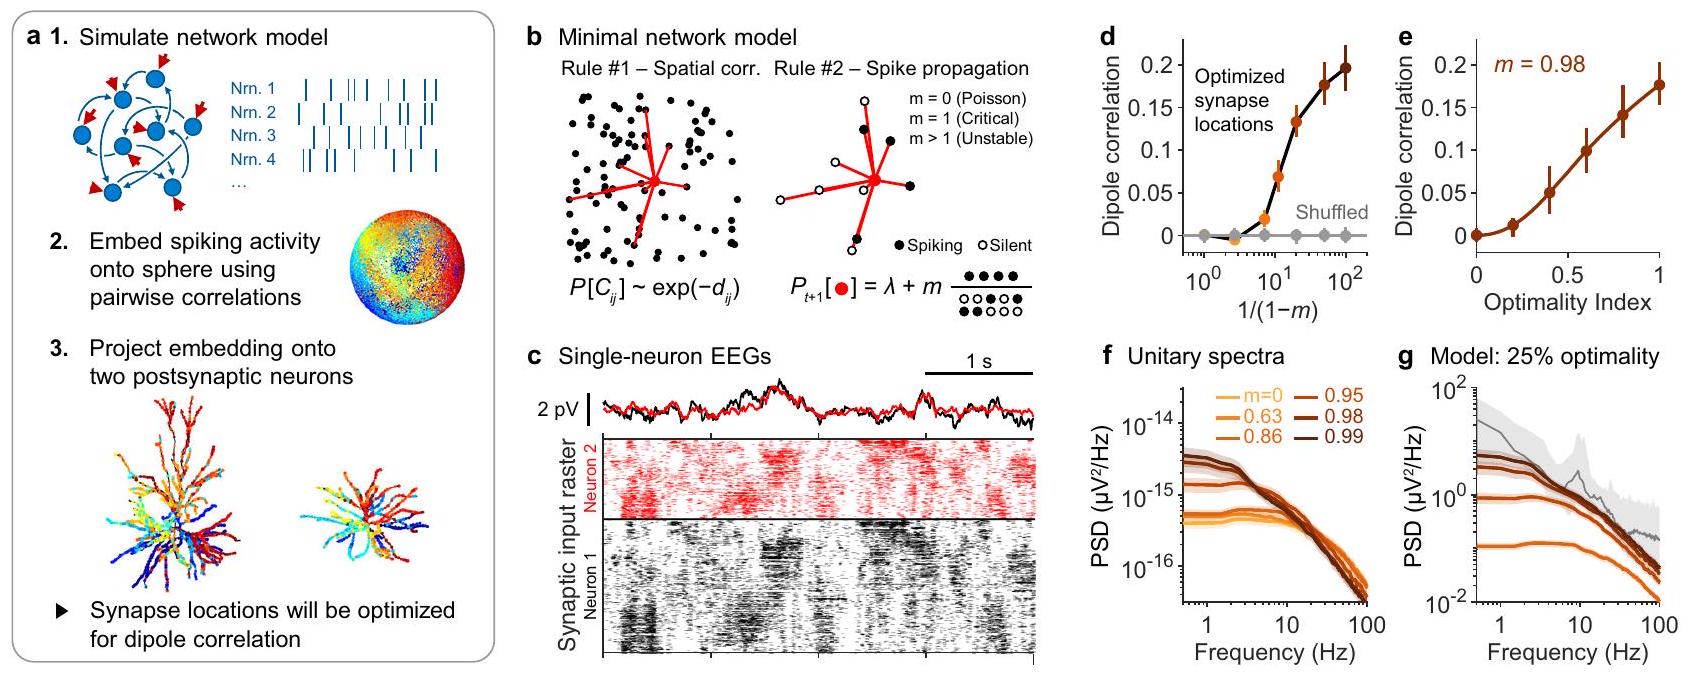
To understand the mechanisms of aperiodic EEG generation, we attempted to construct the simplest network that could generate dipole coherence. Our previous results demonstrate that randomly connected networks cannot generate coherent dipoles, because they cannot produce spatially correlated activity. We therefore continued on to use the simplest neural network that exhibits spatial topology, namely, a spatial network. To construct the network, each neuron was embedded in a plane and connected preferentially to nearby neurons (Fig. 4b). For simplicity, we modelled individual neurons as binary nodes, i.e., each neuron was either spiking or quiescent. Spikes propagated along network connections, causing subsequent neurons to fire with some probability (Fig. 4b). This simple model falls within the category of a branching network, because the dynamics are governed by a single parameter called the branching number, denoted by
Our simulations revealed that the maximal achievable dipole correlation increased with the network’s branching number (Fig. 4c,d). A purely asynchronous network (
Fig. 3 | A minimal model of dipole correlation captures broadband EEG amplitude but not low frequency power. a A single synapse was activated at the location specified by the blue arrow, generating a response in the single-neuron dipole,
such that synapses separated by an angle
generating dipoles that were correlated by
generating dipoles that were correlated by
Notably, stronger dipole correlations coincided with longer temporal autocorrelations in network activity (Fig. 4f), a phenomenon directly resulting from the causality of spike propagation (Fig. 4b). This means that EEG signals produced by propagating cortical spikes must have higher power at low frequencies if the signals are to be of detectable amplitudes. This result illustrates a fundamental constraint that may in part explain the
frequencies (Fig. 4g). More broadly, these results demonstrate a biophysically feasible mechanisms that allows arrhythmic neural activity to generate EEG signals, and to consequently influence the broadband features of EEG spectra.
frequencies (Fig. 4g). More broadly, these results demonstrate a biophysically feasible mechanisms that allows arrhythmic neural activity to generate EEG signals, and to consequently influence the broadband features of EEG spectra.
Narrowband EEG changes could result from arrhythmic activity The above calculations show that arrhythmic neural activity can in theory generate broadband EEG signals, meaning that narrowband EEG power need not reflect brain rhythms. We therefore asked whether EEG signals that are produced by arrhythmic activity can confound traditional EEG interpretation, namely, that changes in bandpower reflect differences in neural oscillations. To address this question, we considered a scenario where the EEG signal is generated by two subpopulations of neurons: a population exhibiting synchronous oscillations, and a second population exhibiting subcritical dynamics (
Fig. 4 | Subcritical network dynamics can explain the amplitude and low frequency power of broadband EEG. a llustration of the algorithm for optimizing dipole coherence. Nrn. = neuron. The left neuron morphology is adapted from Budd, J. M. L. et al. Neocortical axon arbors trade-off material and conduction delay conservation. PLoS Comput. Biol. 6, e1000711 (2010). The illustration of the right neuron is adapted, with permission from SNCSC, from Mainen, Z. F. & Sejnowski, T. J. Influence of dendritic structure on firing pattern in model neocortical neurons. Nature 382, 363-366 (1996), Springer Nature. b Illustration of the rules used to produce spatiotemporal synchrony in a presynaptic network. Rule #1: network topology is enforced by making the probability of pairwise connections,
exhibited a mixed phenotype (Fig. 5b). Increasing the strength of the oscillatory and/or aperiodic input altered the amplitude of the spectral peak and/or spectral trend (Fig. 5c-e). However, changes to the spectral trend did not multiplicatively scale the oscillatory peak amplitude. As a result, quantifying the amplitude of oscillatory peaks relative to the spectral trend produced incorrect interpretations (Fig. 5f-h): dividing the peak amplitude by the background trend erroneously suggested that the neural rhythm decreased when aperiodic activity became stronger (Fig. 5d, g), and severely underestimated the neural rhythm increase when aperiodic activity increased concomitantly (Fig. 5e, h). We therefore concluded that if a spectral peak is clearly discernible, then arrhythmic neural activity has a minimal confounding influence and detrending is unnecessary. Importantly, however, if no spectral peak is obvious, then there is no guarantee that changes in power result from differences in neural oscillations.
Spectral slope is an inconsistent measure of EI balance
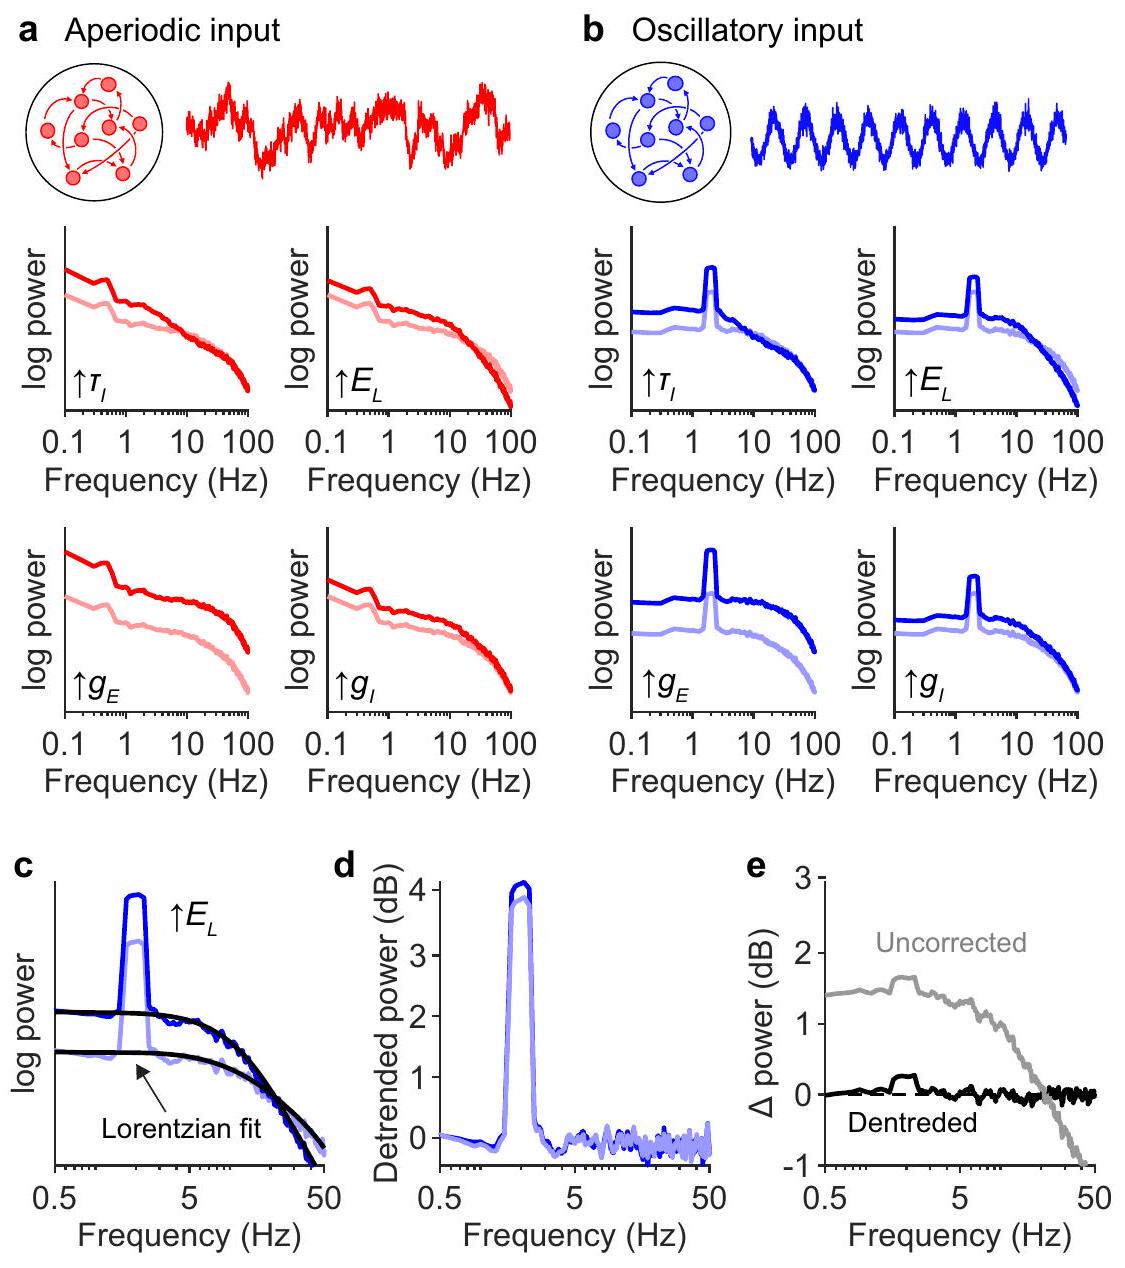
The above results focused on the role of neural dynamics in shaping the EEG spectrum. However, Fig. 1d-f shows that the kinetics of postsynaptic responses also impact the broadband properties of EEG spectra. To further investigate this mechanism shaping EEG spectra, we performed a full sensitivity analysis of the spectral slope with respect to the biophysical parameters in the single-neuron models. The unitary EEG spectrum was simulated with many different parameter values (Fig. 6a) and the overall slope of the spectrum was calculated
directly govern the contributions of inhibitory and excitatory synaptic currents, respectively. The reversal potential,
directly govern the contributions of inhibitory and excitatory synaptic currents, respectively. The reversal potential,
Surprisingly, the analysis of the spectral slope revealed a strong interaction between
Changes to synaptic responses confound brain rhythm quantification
Differences in postsynaptic responses alter EEG spectra in a fundamentally different way to arrhythmic neural activity. Postsynaptic
Fig. 5 | Measuring oscillatory peak power relative to spectral trend may produce misleading results. a Illustration of mixed input model. Half of the neuron’s synapses received oscillatory rhythmic input (blue) and the other half received input from a subcritical network (red). The strengths of oscillatory and subcritical dynamics were adjusted by tuning two parameters,
Fig. 6 | Sensitivity of spectral slope to biophysical parameters governing
postsynaptic responses. a Sampling distributions for model parameters, the same as the ones used in Fig. 1g. b Example single-neuron EEG spectrum, fitted with the equation
postsynaptic responses. a Sampling distributions for model parameters, the same as the ones used in Fig. 1g. b Example single-neuron EEG spectrum, fitted with the equation
simulated spectra. d Simulated spectra were averaged depending on the ratio between
Fig. 7 | Changes in postsynaptic mechanisms confound brain rhythm quantification. a Unitary spectra for neurons receiving entirely subcritical input (
Fig. S3, we show examples of different types of rhythmic input. c Example of fitted spectral trend. Here, the unitary spectrum of sinusoidal input is shown before and after increasing
kinetics effectively interact as a convolution with synaptic input and should therefore interact with oscillatory peaks in a multiplicative manner. Moreover, postsynaptic mechanisms should affect power generated by all types of neural dynamics equally. To test this, we systematically altered the biophysical parameters that govern postsynaptic currents and analyzed the unitary spectra generated by various types of synaptic inputs, including white noise (Fig. S3), subcritical dynamics (Fig. 7a), as well as three types of dynamics that exhibit spectral peaks: a recently proposed recurrent Ising model that exhibits co-existence of oscillations and avalanches
kinetics effectively interact as a convolution with synaptic input and should therefore interact with oscillatory peaks in a multiplicative manner. Moreover, postsynaptic mechanisms should affect power generated by all types of neural dynamics equally. To test this, we systematically altered the biophysical parameters that govern postsynaptic currents and analyzed the unitary spectra generated by various types of synaptic inputs, including white noise (Fig. S3), subcritical dynamics (Fig. 7a), as well as three types of dynamics that exhibit spectral peaks: a recently proposed recurrent Ising model that exhibits co-existence of oscillations and avalanches
The spectral changes caused by altering biophysical parameters do not reflect differences in neural dynamics and therefore represent confounds for EEG analysis. To correct for the effects of these parameter changes, we fit the part of the spectral trend produced by synaptic timescales using a FOOOF-like algorithm
In conclusion, our modelling results indicate that there are two distinct mechanisms of peak-trend interaction in EEG spectra. In one case, there are changes in the relative contribution of rhythmic and arrhythmic neural activity to the EEG signal. In this case, the peaks and spectral trend change relatively independently from one another, and thus detrending is unnecessary for quantifying spectral peak amplitudes (see Discussion). In the other case, changes in biophysical parameters alter the mechanism of EEG generation itself. In this case, EEG differences are unrelated to neural dynamics; these changes can confound EEG signals from all neural sources, and thus even spectral peak amplitudes can be potentially corrupted.
Fig. 8 | Model predicts and quantifies effects of propofol administration on EEG spectra. a Representative EEG signal, Cz recording site, of a subject receiving an infusion of propofol until loss of consciousness (LOC). The estimated effect-site concentration of propofol is plotted below. b Mean LOC-aligned spectrogram of 14 subjects. c Average power spectrum at baseline (black), averaged between 0 and 10 s prior to propofol infusion, and after propofol infusion (red), averaged between 0 and 10 s prior to LOC. Shading reflects
dashed line.
Model predicts and quantifies effects of propofol on EEG spectra The above results suggest that spectral detrending may be important in pharmacological experiments since many drugs target ion channels and alter postsynaptic responses. To test this model prediction, we investigated the EEG signatures of the general anesthetic propofol, a
Our modelling results suggest that propofol inflates low frequency power by increasing the slow timescale,
0-10 s prior to LOC (Fig. 8e). Similar changes were observed at other electrode sites (Fig. S6). By plotting the estimated value of
Correcting for synaptic timescales reveals a unique signature of LOC
Our modelling results predicted that propofol’s effect on synaptic timescales will produce errors in conventional quantifications of brain rhythms. Past studies have suggested that LOC from propofol is associated with changes in the delta (
Fig. 9 | Correcting for synaptic timescales reveals a unique signature of losing consciousness. a Left: representative EEG power spectrum following LOC (black) of a single subject, superimposed on the power spectrum at baseline (blue). Right: power spectrum following LOC (black) normalized to baseline. b Mean baseline normalized spectrogram (
significant increase (
producing a beta power not statistically different from baseline postLOC (Fig. 9d).
producing a beta power not statistically different from baseline postLOC (Fig. 9d).
To correct for the confounding effects of propofol, we divided EEG power at each timepoint by the estimated synaptic timescales fitted from the previous section (Fig. 9e). We then normalized detrended power by the detrended power at baseline (Fig. 9f), such that changes in bandpower reflected the spectral changes unexplained by the increase in
Discussion
In this study, we explored the neural basis of the EEG spectral trend and examined its implications for EEG interpretation and analysis. Several important conclusions came out of this investigation. First, this work provided biophysical evidence that arrhythmic neural activity is capable of generating detectable EEG signals. Second, our modelling consolidated the predictions of simpler computational models
spectral peak amplitudes are minimally affected by fluctuations in arrhythmic neural activity. On the other hand, we found that systemic changes in synaptic current properties do necessitate detrending to accurately interpret spectral changes as variations in neural activity. Our results suggested that this latter scenario is particularly important for EEG recordings used in tandem with pharmacological interventions.
spectral peak amplitudes are minimally affected by fluctuations in arrhythmic neural activity. On the other hand, we found that systemic changes in synaptic current properties do necessitate detrending to accurately interpret spectral changes as variations in neural activity. Our results suggested that this latter scenario is particularly important for EEG recordings used in tandem with pharmacological interventions.
Traditional spectral analysis assumes that EEG power within canonical frequency bands reflect various brain rhythms. Our modelling results seriously challenge this assumption. Specifically, if a spectral peak is not evident within a given frequency band, our work justifies a physiologically plausible and biophysically realistic alternative hypothesis, namely, that the bandpower reflects broadband neural activity. Our results thus validate the principle assumption of spectral detrending methods, such as the FOOOF algorithm
Importantly, our results do not necessarily support a purely datadriven approach to detrending EEG spectra. While changes in arrhythmic activity affect spectral peaks in an additive manner (Fig. 5), changes in synaptic currents multiplicatively scale spectral peaks (Fig. 7); these two mechanisms thus require two distinct methods of detrending, i.e., subtractive versus divisive detrending, respectively. Without prior knowledge, it is unclear which method is required. Moreover, given the amplitude of peaks above the background trend typical in EEG spectra, small additive changes in the trend would alter the peak amplitudes minimally compared to the errors introduced by incorrectly detrending (Fig. 5). Overall, we conclude that spectral detrending should not be performed unless there is clear physiological and biophysical justification and validation.
In the analysis presented here, there was prior knowledge of the well-documented action of propofol on GABAR kinetics
indicating the necessity for divisive detrending. To mitigate the chances of overfitting, we constrained parameter values to physiologically reasonable ranges, and validated that the fitted spectral changes and
indicating the necessity for divisive detrending. To mitigate the chances of overfitting, we constrained parameter values to physiologically reasonable ranges, and validated that the fitted spectral changes and
Past modelling has suggested that the EEG spectral exponent reflects the E:I ratio, which relies on the assumption that low frequency power is dominated by inhibitory currents
While several studies have suggested that avalanche criticality may be responsible for broadband
Delta rhythms are a ubiquitous feature of general anesthesia, being readily induced in humans by propofol, sevoflurane, thiopental, and xenon
changes in neural dynamics appears after the propofol-induced increase in alpha and beta power (Fig. 9). According to our simulations, it is possible that the observed increase in low frequency power is due to the brain moving closer to avalanche criticality (Figs. 4 and 5). Opposing this interpretation are models of excitatory/inhibitory networks, which suggest that increasing inhibition promotes the asynchronous state
changes in neural dynamics appears after the propofol-induced increase in alpha and beta power (Fig. 9). According to our simulations, it is possible that the observed increase in low frequency power is due to the brain moving closer to avalanche criticality (Figs. 4 and 5). Opposing this interpretation are models of excitatory/inhibitory networks, which suggest that increasing inhibition promotes the asynchronous state
In summary, we conclude that aperiodic neural activity can contribute to EEG signals, and that the spectral trend is further shaped by many physiological mechanisms, such as excitatory/inhibitory balance and synaptic timescales. We conclude that the spectral exponent is not merely a conflated measure of brain rhythms and thus provides a complementary biomarker of brain state. However, we also conclude that the spectral exponent does not have a singular physiological interpretation. Finally, we conclude that EEG spectra do need to be detrended when quantifying brain rhythms, but only if postsynaptic current properties are systematically altered. Otherwise, detrending likely introduces significant errors to brain rhythm quantification and should therefore be avoided.
Methods
Definitions and theoretical framework
The EEG signal can be described as the linear superposition of electric fields generated by all neurons in the brain
Here,
Postsynaptic neuron simulations
Neuron morphologies as well as their relative abundance were the same as those used by Hagen et al.
investigated in a range from 0.01 to
investigated in a range from 0.01 to
Ensemble EEG amplitude estimation
Because dipoles sum linearly, the EEG signal generated by N neurons can be decomposed as a superposition of N single-neuron EEG signals. It follows that the ensemble EEG will have an average power of
The brain template is a triangular mesh with faces of areas
where
It follows that the expected signal power of the ensemble EEG signal is
Experimental quantification of
uncorrelated between neurons
uncorrelated between neurons
Subcritical network model
Presynaptic neurons were connected to
Embedding synapses onto postsynaptic dendrites
Dipole synchrony has been previously modelled either by separating inhibitory and excitatory input into somatic and apical compartments, respectively
To model suboptimal synapse placement, we randomly perturbed the spherical embedding before mapping the synapses. Each point in the embedding was perturbed by a distance
This procedure can be thought of as a model of dipole correlation that generalizes beyond dichotomous input. Alternatively, this procedure can be considered in terms of observations from recent
studies, which have reported that functionally related synaptic inputs cluster within individual dendritic branches, and that input from similar presynaptic populations target similar dendritic compartments in the postsynaptic population
studies, which have reported that functionally related synaptic inputs cluster within individual dendritic branches, and that input from similar presynaptic populations target similar dendritic compartments in the postsynaptic population
Mixed synaptic input
For modelling oscillatory input, we used a published formalism of rhythmogenesis, where counterphase sinusoidal inputs were applied on the apical and basal dendrites
Experimental design and procedure
Following MNH Ethics Board approval, we recruited 16 American Society of Anesthesiologists (ASA) class I or II patients (18-65 years old) presenting for lumbar disk surgery as subjects for the study. All subjects gave written informed consent to participate in the study. The standards of care of the Canadian Anesthesiologists’ Society in regard to monitoring, equipment and care provider were rigorously applied. Gold cup electrodes (Fz, Cz, Pz, C3, C4, CP3, CP4, M2 as reference; FC1 as ground; impedance
Data analysis
Two participants were excluded because of failure to comply with the instructions during induction. One kept talking, the other kept moving their dominant arm. The final data set was therefore based on 14 subjects ( 10 males; 12 right-handed). Artifacts in the data were removed following visual inspections of the time series. Spectrograms were computed with the multitaper method, using three tapers over 2 s windows, with 1.9 s overlap. Group averages were either computed as the average power spectral density across subjects with time aligned to LOC, or with time rescaled so that both the infusion onset and LOC were aligned across individuals. To rescale time, LOC-aligned time for each subject was scale by the latency from infusion to LOC.
Consequently, a rescaled time value of -1 is equivalent to the moment of propofol infusion onset and a rescaled time value of 0 is equivalent to the moment of LOC.
Estimated propofol concentration
For estimating the effect-site concentration of propofol for each subject, we used the Marsh model, a multicompartment pharmacokinetics model
Detrending EEG spectra
To detrend EEG spectra, we used a modified version of the FOOOF algorithm
For analyzing experimental data, we modified Eq. 1 to provide better fits to the data and reduce the chances of overfitting. In contrast to our simulations, we found that high frequency power plateaued in our data around where we would expect the influence of excitatory synaptic time scales to be exerted (Fig. 1d, f). We therefore replaced the second term in the equation with a constant term,
This constant term,
This modified equation fit the EEG spectra at baseline conditions well, but following propofol infusion, the equation did not decay fast enough to capture the EEG spectra (Fig. S7). This was seemingly because the original equations oversimplified the kinetics of inhibitory synapses. Notably, Eq. 1 is an analytical solution for exponentially decaying synaptic responses, whereas real synaptic responses are characterized by a rise time and decay time:
where the first term is the analytical solution to the power spectrum of the difference of exponentials.
Reporting summary
Further information on research design is available in the Nature Portfolio Reporting Summary linked to this article.
Data availability
Computed EEG spectrograms for all subjects have been uploaded to Figshare
Code availability
Code used to run simulations, analyze data, and generate manuscript figures
References
- Berger, H. Über das elektrenkephalogramm des menschen. Arch. Psychiatr. Nervenkr. 87, 527-570 (1929).
- Steriade, M. Cellular substrates of brain rhythms. Electroencephalogr. Basic Princ. Clin. Appl. Relat. fields 5, 31-83 (2005).
- Nunez, P. L. & Srinivasan, R. Electric Fields of the Brain (Oxford Univ. Press, Oxford, 2006). https://doi.org/10.1093/acprof:oso/ 9780195050387.001.0001.
- Buzsáki, G., Anastassiou, C. A. & Koch, C. The origin of extracellular fields and currents – EEG, ECoG, LFP and spikes. Nat. Rev. Neurosci. 13, 407-420 (2012).
- Pritchard, W. S. The brain in fractal time:
f-like power spectrum scaling of the human electroencephalogram. Int. J. Neurosci. 66, 119-129 (1992). - Manning, J. R., Jacobs, J., Fried, I. & Kahana, M. J. Broadband shifts in local field potential power spectra are correlated with singleneuron spiking in humans. J. Neurosci. 29, 13613-13620 (2009).
- Miller, K. J., Sorensen, L. B., Ojemann, J. G. & Den Nijs, M. Power-law scaling in the brain surface electric potential. PLoS Comput. Biol. 5, e1000609 (2009).
- He, B. J. Scale-free brain activity: past, present, and future. Trends Cogn. Sci. 18, 480-487 (2014).
- Voytek, B. et al. Age-related changes in
neural electrophysiological noise. J. Neurosci. 35, 13257-13265 (2015). - Roche, K. J. et al. Electroencephalographic spectral power as a marker of cortical function and disease severity in girls with rett syndrome. J. Neurodev. Disord. 11, 15 (2019).
- Colombo, M. A. et al. The spectral exponent of the resting EEG indexes the presence of consciousness during unresponsiveness induced by propofol, xenon, and ketamine. Neuroimage 189, 631-644 (2019).
- Ouyang, G., Hildebrandt, A., Schmitz, F. & Herrmann, C. S. Decomposing alpha and
brain activities reveals their differential associations with cognitive processing speed. Neuroimage 205, 116304 (2020). - Lendner, J. D. et al. An electrophysiological marker of arousal level in humans. Elife 9, 1-29 (2020).
- Donoghue, T. et al. Parameterizing neural power spectra into periodic and aperiodic components. Nat. Neurosci. 23, 1655-1665 (2020).
- Bédard, C., Kröger, H. & Destexhe, A. Does the
frequency scaling of brain signals reflect self-organized critical states? Phys. Rev. Lett. 97, 118102 (2006). - Gao, R., Peterson, E. J. & Voytek, B. Inferring synaptic excitation/ inhibition balance from field potentials. Neuroimage 158, 70-78 (2017).
- Bak, P., Tang, C. & Wiesenfeld, K. Self-organized criticality: an explanation of the
noise. Phys. Rev. Lett. 59, 381-384 (1987). - Beggs, J. M. & Plenz, D. Neuronal avalanches in neocortical circuits. J. Neurosci. 23, 11167-11177 (2003).
- Priesemann, V. Spike avalanches in vivo suggest a driven, slightly subcritical brain state. Front. Syst. Neurosci. 8, 108 (2014).
- Chaudhuri, R., He, B. J. & Wang, X. J. Random recurrent networks near criticality capture the broadband power distribution of human ECoG dynamics. Cereb. Cortex 28, 3610-3622 (2018).
- Lombardi, F., Herrmann, H. J. & de Arcangelis, L. Balance of excitation and inhibition determines
power spectrum in neuronal networks. Chaos Interdiscip. J. Nonlinear Sci. 27, 047402 (2017). - Buzsáki, G. & Draguhn, A. Neuronal olscillations in cortical networks. Science 304, 1926-1929 (2004).
- Buzsáki, G. & Vöröslakos, M. Brain rhythms have come of age. Neuron 111, 922-926 (2023).
- Huang, Y., Parra, L. C. & Haufe, S. The New York head-a precise standardized volume conductor model for EEG source localization and tES targeting. Neuroimage 140, 150-162 (2016).
- Hagen, E. et al. Hybrid scheme for modeling local field potentials from point-neuron networks. Cereb. Cortex 26, 4461-4496 (2016).
- Næss, S. et al. Biophysically detailed forward modeling of the neural origin of eeg and meg signals. Neuroimage 225, 117467 (2021).
- Orser, B. A., Wang, L. Y., Pennefather, P. S. & MacDonald, J. F. Propofol modulates activation and desensitization of
receptors in cultured murine hippocampal neurons. J. Neurosci. 14, 7747-7760 (1994). - Kitamura, A., Marszalec, W., Yeh, J. Z. & Narahashi, T. Effects of halothane and propofol on excitatory and inhibitory synaptic transmission in rat cortical neurons. J. Pharmacol. Exp. Ther. 304, 162-171 (2003).
- Whittington, M. A., Jefferys, J. G. R. & Traub, R. D. Effects of intravenous anaesthetic agents on fast inhibitory oscillations in the rat hippocampus in vitro. Br. J. Pharmacol. 118, 1977-1986 (1996).
- Franks, N. P. General anaesthesia: from molecular targets to neuronal pathways of sleep and arousal. Nat. Rev. Neurosci. 9, 370-386 (2008).
- McInnes, L., Healy, J. & Melville, J. UMAP: uniform manifold approximation and projection for dimension reduction. Preprint at https://arxiv.org/abs/1802.03426 (2020).
- Wilting, J. & Priesemann, V. Between perfectly critical and fully irregular: a reverberating model captures and predicts cortical spike propagation. Cereb. Cortex 29, 2759-2770 (2019).
- Suryadi, Cheng, R.-K., Birkett, E., Jesuthasan, S. & Chew, L. Y. Dynamics and potential significance of spontaneous activity in the habenula. eneuro 9, ENEURO.0287-21.2022 (2022).
- Lombardi, F., Pepić, S., Shriki, O., Tkačik, G. & De Martino, D. Statistical modeling of adaptive neural networks explains co-existence of avalanches and oscillations in resting human brain. Nat. Comput. Sci. 3, 254-263 (2023).
- Guay, C. S. & Plourde, G. Handgrip dynamometry for continuous assessment of volitional control during induction of anesthesia: a prospective observational study. Can. J. Anesth. Can. d’Anesth.ésie 66, 48-56 (2019).
- Cummings, G. C. et al. Dose requirements of
(Propofol, ‘Diprivan’) in a new formulation for induction of anaesthesia. Anaesthesia 39, 1168-1171 (1984). - Marsh, B., White, M., Morton, N. & Kenny, G. N. C. Pharmacokinetic model driven infusion of propofol in children. Br. J. Anaesth. 67, 41-48 (1991).
- Purdon, P. L. et al. Electroencephalogram signatures of loss and recovery of consciousness from propofol. Proc. Natl Acad. Sci. USA 110, E1142-E1151 (2013).
- Li, J. & Shew, W. L. Tuning network dynamics from criticality to an asynchronous state. PLOS Comput. Biol. 16, e1008268 (2020).
- Zeraati, R., Engel, T. A. & Levina, A. A flexible bayesian framework for unbiased estimation of timescales. Nat. Comput. Sci. 2, 193-204 (2022).
- Gao, R., van den Brink, R. L., Pfeffer, T. & Voytek, B. Neuronal timescales are functionally dynamic and shaped by cortical microarchitecture. Elife 9, e61277 (2020).
- Reimann, M. W. et al. A biophysically detailed model of neocortical local field potentials predicts the critical role of active membrane currents. Neuron 79, 375-390 (2013).
- Suzuki, M. & Larkum, M. E. Dendritic calcium spikes are clearly detectable at the cortical surface. Nat. Commun. 8, 276 (2017).
- Petermann, T. et al. Spontaneous cortical activity in awake monkeys composed of neuronal avalanches. Proc. Natl Acad. Sci. USA 106, 15921-15926 (2009).
- Iacaruso, M. F., Gasler, I. T. & Hofer, S. B. Synaptic organization of visual space in primary visual cortex. Nature 547, 449-452 (2017).
- Scholl, B., Wilson, D. E. & Fitzpatrick, D. Local order within global disorder: synaptic architecture of visual space. Neuron 96, 1127-1138.e4 (2017).
- Kerlin, A. et al. Functional clustering of dendritic activity during decision-making. Elife 8, e46966 (2019).
- Ju, N. et al. Spatiotemporal functional organization of excitatory synaptic inputs onto macaque v1 neurons. Nat. Commun. 11, 697 (2020).
- Lafourcade, M. et al. Differential dendritic integration of long-range inputs in association cortex via subcellular changes in synaptic ampa-to-nmda receptor ratio. Neuron 110, 1532-1546.e4 (2022).
- Gugino, L. D. et al. Quantitative eeg changes associated with loss and return of consciousness in healthy adult volunteers anaesthetized with propofol or sevoflurane. Br. J. Anaesth. 87, 421-428 (2001).
- Murphy, M. et al. Propofol anesthesia and sleep: a high-density EEG study. Sleep 34, 283-291 (2011).
- Lewis, L. D. et al. Rapid fragmentation of neuronal networks at the onset of propofol-induced unconsciousness. Proc. Natl Acad. Sci. USA 109, E3377-E3386 (2012).
- Huupponen, E. et al. Electroencephalogram spindle activity during dexmedetomidine sedation and physiological sleep. Acta Anaesthesiol. Scand. 52, 289-294 (2008).
- Ma, J. & Leung, L. S. Limbic system participates in mediating the effects of general anesthetics. Neuropsychopharmacology 31, 1177-1192 (2006).
- Johnson, B. W., Sleigh, J. W., Kirk, I. J. & Williams, M. L. High-density EEG mapping during general anaesthesia with xenon and propofol: a pilot study. Anaesth. Intensive Care 31, 155-163 (2003).
- Amzica, F. & Steriade, M. Electrophysiological correlates of sleep delta waves. Electroencephalogr. Clin. Neurophysiol. 107, 69-83 (1998).
- Steriade, M. Corticothalamic resonance, states of vigilance and mentation. Neuroscience 101, 243-276 (2000).
- Le Masson, G., Renaud-Le Masson, S., Debay, D. & Bal, T. Feedback inhibition controls spike transfer in hybrid thalamic circuits. Nature 417, 854-858 (2002).
- Tagliazucchi, E. et al. Increased global functional connectivity correlates with LSD-induced ego dissolution. Curr. Biol. 26, 1043-1050 (2016).
- Toker, D. et al. Consciousness is supported by near-critical slow cortical electrodynamics. Proc. Natl Acad. Sci. USA 119, 1-12 (2022).
- Malmivuo, J. & Plonsey, R. Bioelectromagnetism (Oxford Univ. Press, Oxford, 1995).
- Palmer, L., Murayama, M. & Larkum, M. Inhibitory regulation of dendritic activity in vivo. Front. Neural Circuits 6, 26 (2012).
- lascone, D. M. et al. Whole-neuron synaptic mapping reveals spatially precise excitatory/inhibitory balance limiting dendritic and somatic spiking. Neuron 106, 566-578.e8 (2020).
- Karimi, A., Odenthal, J., Drawitsch, F., Boergens, K. M. & Helmstaedter, M. Cell-type specific innervation of cortical pyramidal cells at their apical dendrites. Elife 9, 1-23 (2020).
- Hagen, E., Næss, S., Ness, T. V. & Einevoll, G. T. Multimodal modeling of neural network activity: computing lfp, ecog, eeg, and meg signals with lfpy 2.0. Front. Neuroinform. 12, 92 (2018).
- Carnevale, N. T. & Hines, M. L. The NEURON Book (Cambridge University Press, 2006). https://doi.org/10.1017/ CBO9780511541612.
- Fonov, V., Evans, A., McKinstry, R., Almli, C. & Collins, D. Unbiased nonlinear average age-appropriate brain templates from birth to adulthood. Neuroimage 47, S102 (2009).
- Fonov, V. et al. Unbiased average age-appropriate atlases for pediatric studies. Neuroimage 54, 313-327 (2011).
- Carlo, C. N. & Stevens, C. F. Structural uniformity of neocortex, revisited. Proc. Natl Acad. Sci. USA 110, 1488-1493 (2013).
- Volgushev, M., Chauvette, S. & Timofeev, I. Long-range correlation of the membrane potential in neocortical neurons during slow oscillation. in Progress in Brain Research 181-199 (2011). https://doi. org/10.1016/B978-0-444-53839-0.00012-0.
- Einevoll, G. T., Kayser, C., Logothetis, N. K. & Panzeri, S. Modelling and analysis of local field potentials for studying the function of cortical circuits. Nat. Rev. Neurosci. 14, 770-785 (2013).
- Jones, S. R. et al. Quantitative analysis and biophysically realistic neural modeling of the MEG mu rhythm: rhythmogenesis and modulation of sensory-evoked responses. J. Neurophysiol. 102, 3554-3572 (2009).
- Studenova, A. A., Villringer, A. & Nikulin, V. V. Non-zero mean alpha oscillations revealed with computational model and empirical data. PLoS Comput. Biol. 18, e1010272 (2022).
- Cutts, C. S. & Eglen, S. J. Detecting pairwise correlations in spike trains: an objective comparison of methods and application to the study of retinal waves. J. Neurosci. 34, 14288-14303 (2014).
- Struys, M. M. R. F. et al. Comparison of plasma compartment versus two methods for effect compartment-controlled target-controlled infusion for propofol. Anesthesiology 92, 399-399 (2000).
- Muthukumaraswamy, S. D. High-frequency brain activity and muscle artifacts in MEG/EEG: a review and recommendations. Front. Hum. Neurosci. 7, 138 (2013).
- Sceniak, M. P. & Maclver, M. B. Slow
mediated synaptic transmission in rat visual cortex. BMC Neurosci. 9, 8 (2008). - Brake, N. et al. EEG data during propofol anesthesia and a biophysical model of the EEG spectral trend. figshare. https://doi.org/10. 6084/m9.figshare. 24777990 (2023).
- Brake, N. niklasbrake/EEG_modelling: Manuscript revisions (v1.0.0). Zenodo. https://zenodo.org/doi/10.5281/zenodo. 10359817 (2023).
Acknowledgements
This work was supported by the Natural Sciences and Engineering Research Council of Canada (NSERC) discovery grant (RGPIN-2019O4520) to A.K. N.B. was supported by the NSERC-CREATE in Complex Dynamics Graduate Scholarship and the Fonds de recherche du Québec
- Nature et technologies (FRQNT) doctoral training scholarship. The funders had no role in study design, data collection and analysis, decision to publish, or preparation of the manuscript.
Author contributions
Conceptualization: N.B., G.P. and A.K. Data curation: N.B. and G.P. Formal analysis: N.B. Funding acquisition: A.K. and G.P. Investigation: N.B., F.D., A.R., F.A., S.S. and G.P. Methodology: N.B. Project administration: A.K. and G.P. Software: N.B. Supervision: A.K. and G.P. Visualization: N.B. Writingoriginal draft: N.B. Writing—review and editing: N.B., A.K. and G.P.
Competing interests
The authors declare no competing interests.
Additional information
Supplementary information The online version contains
supplementary material available at
https://doi.org/10.1038/s41467-024-45922-8.
supplementary material available at
https://doi.org/10.1038/s41467-024-45922-8.
Correspondence and requests for materials should be addressed to Anmar Khadra or Gilles Plourde.
Peer review information Nature Communications thanks Richard Gao and Balazs Hangya for their contribution to the peer review of this work. A peer review file is available.
Reprints and permissions information is available at
http://www.nature.com/reprints
http://www.nature.com/reprints
Publisher’s note Springer Nature remains neutral with regard to jurisdictional claims in published maps and institutional affiliations.
Open Access This article is licensed under a Creative Commons Attribution 4.0 International License, which permits use, sharing, adaptation, distribution and reproduction in any medium or format, as long as you give appropriate credit to the original author(s) and the source, provide a link to the Creative Commons licence, and indicate if changes were made. The images or other third party material in this article are included in the article’s Creative Commons licence, unless indicated otherwise in a credit line to the material. If material is not included in the article’s Creative Commons licence and your intended use is not permitted by statutory regulation or exceeds the permitted use, you will need to obtain permission directly from the copyright holder. To view a copy of this licence, visit http://creativecommons.org/ licenses/by/4.0/.
© The Author(s) 2024
© The Author(s) 2024
- ¹Quantiative Life Sciences PhD Program, McGill University, Montreal, Canada.
Department of Physiology, McGill University, Montreal, Canada.
Department of Anesthesia, McGill University, Montreal, Canada. School of Nursing, McGill University, Montreal, Canada.
-e-mail: anmar.khadra@mcgill.ca; gilles.plourde@mcgill.ca