أصول مستقلة وتوقيعات اختيار غير متوازية لمقاومة التريكلا بندازول في فاسيولا هيباتيكا Independent origins and non-parallel selection signatures of triclabendazole resistance in Fasciola hepatica

المجلة: Nature Communications، المجلد: 16، العدد: 1
DOI: https://doi.org/10.1038/s41467-025-57796-5
PMID: https://pubmed.ncbi.nlm.nih.gov/40148292
تاريخ النشر: 2025-03-27

مقالة

أصول مستقلة وتوقيعات اختيار غير متوازية لمقاومة التريكلا بندازول في فاسيولا هيباتيكا

تاريخ الاستلام: 14 مايو 2024

تم القبول: 4 مارس 2025

نُشر على الإنترنت: 27 مارس 2025

يونغ-جون تشوي بروس أ. روزا مارثا ف. فرنانديز-باكا رودريغو أ. أوري (1) جون مارتن بيدرو أورتيز (1) كريستيان هوبيان ميغيل م. كابادا وميتريفا ماكدونكا

الملخص

تريكلابندازول (TCBZ) هو العلاج الرئيسي للفاسيولاز، وهو مرض حيواني غذائي عالمي تسببه فاسيولا هيباتيكا. المقاومة الواسعة لـ TCBZ (TCBZ-R) في الماشية والزيادة السريعة في الإصابات البشرية المقاومة تمثل مخاوف كبيرة. لفهم الأساس الجيني لـ TCBZ-R، قمنا بتسلسل جينومات 99 دودة فلوكية حساسة لـ TCBZ (TCBZ-S) و210 دودة فلوكية مقاومة لـ TCBZ من 146 كبد بقر في كوسكو، بيرو. نحن نحدد مناطق جينومية ذات تمايز عالٍ ( القيم الشاذة فوق النسبة المئوية 99.9) التي تشفر الجينات المعنية في مسار EGFR-PI3K-mTOR-S6K ووظيفة الأنابيب الدقيقة. يتم ملاحظة اختلافات في تعبير النسخ في الجينات المتعلقة بالأنابيب الدقيقة بين الديدان TCBZ-S و-R، سواء بدون علاج دوائي أو استجابة للعلاج. باستخدام 30 SNP فقط، من الممكن التمييز بين الطفيليات TCBZ-S و-R. الدقة. إن مواقعنا الشاذة تختلف عن المواقع المرتبطة بـ TCBZ-R التي تم الإبلاغ عنها سابقًا في المملكة المتحدة، مما يشير إلى تطور مستقل لأليلات المقاومة. يجب أن تأخذ المراقبة الفعالة المستندة إلى علم الوراثة لـ TCBZ-R في الاعتبار تباين المواقع تحت الانتقاء عبر السكان الجغرافيين المتنوعين.

الفاسيوليازيس هي أكثر الأمراض الطفيلية المنقولة عبر الغذاء انتشارًا وتعتبر مرضًا استوائيًا مهملًا من قبل منظمة الصحة العالمية. وهي تشكل أكبر عبء في البلدان عبر أمريكا الجنوبية والشرق الأوسط وجنوب/جنوب شرق آسيا. أعلى انتشار في البشر يُلاحظ في المناطق الأنديزية في أمريكا الجنوبية، حيث يمكن أن يصل الانتشار في الأطفال إلى فاسيولا هيباتيكا، الطفيلي المسؤول عن الفاسيولياز، لديه دورة حياة معقدة تتطلب وجود حلزونات كعائل وسيط وعوائل ثانوية من الثدييات. تعتبر الماشية أكثر العوائل النهائية شيوعًا للفاسيولياز، على الرغم من أن البشر يساهمون أيضًا في الدورة في المناطق ذات الانتشار العالي. يسبب فاسيولياز الماشية تأثيرًا اقتصاديًا كبيرًا، مع تقديرات للخسائر السنوية تبلغ مليون في 18 دولة أوروبية . هذا العبء الاقتصادي مرتبط بتقليل إنتاج الحليب واللحم،
والصوف، وانخفاض الخصوبة، وإدانة الكبد في البلدان النامية، غالبًا ما تستند تقديرات العبء الاقتصادي إلى بيانات إقليمية محدودة وسجلات المسالخ، والتي قد لا تعكس تمامًا مدى الخسائر. تؤدي هذه الآثار الاقتصادية إلى تفاقم دورات الفقر وانعدام الأمن الغذائي في المناطق المتأثرة. تؤدي عدوى F. hepatica في البشر إلى مرض ثنائي الطور يعتمد على مرحلة دورة حياة الطفيل. تظهر الفاسيولياز الحادة، الناتجة عن هجرة الطفيليات اليافعة عبر الكبد، على شكل حمى مضعفة، وألم بطني، وفقدان الوزن. بينما تظهر الفاسيولياز المزمنة، الناتجة عن الطفيليات البالغة المقيمة في الشجرة الصفراوية، بأعراض غير محددة وقد تؤدي إلى انسداد في القناة الصفراوية. يؤثر هذا المرض بشكل غير متناسب على الأطفال، مما يساهم في عبء فقر الدم وسوء التغذية في فئة سكانية ضعيفة بالفعل. على الرغم من أنها أقل تحديدًا، فإن الفاسيوليازيس
يساهم أيضًا في أمراض الكبد وشجرة القنوات الصفراوية، مما يسبب انسداد القنوات الصفراوية، والتهاب الأقنية الصفراوية الصاعد، وربما تليف الكبد/القنوات الصفراوية. .
عدد الأدوية لعلاج داء الفاسيولiasis في الماشية والبشر محدود من حيث الفعالية، والنشاط على المراحل اليافعة، والسمية، وفترات الانسحاب في الماشية. كلورسلون، كلوسانتيل، ونيتروكسيليل هي أدوية بيطرية ذات فعالية محدودة ضد المراحل اليافعة المبكرة. تم إيقاف استخدام البيثيونول والديهيدروإيميتين، اللذان كانا يستخدمان سابقًا في العلاجات البشرية، بسبب السمية وتفاعلات الأدوية. يظل التريكلا بندازول الدواء الوحيد الذي يعتبر فعالاً للغاية ضد كل من المراحل اليافعة والبالغة من الفاسيولا في الماشية والبشر. . لقد اعتمدت معالجة والسيطرة على داء الفاسيوليات في هذه المجموعات بشكل كبير على التريكلا بندازول وإدارة الأدوية الجماعية. ومع ذلك، أصبحت المقاومة شائعة في الماشية. وقد وثقت سلسلة حالات صغيرة فشل العلاج لدى البشر المصابين بعدوى حادة ومزمنة بعد دورات متكررة من التريكلا بندازول. . على سبيل المثال، في مجموعة من 146 طفلًا يعانون من الفاسيولياز المزمن في كوسكو، بيرو، فقط حقق الشفاء الطفيلي بعد الجولة الأولى من علاج التريكلا بندازول ، مقارنة بـ معدل الفعالية بجرعة واحدة في . علاوة على ذلك، من الأطفال في هذه المجموعة لم يحققوا الشفاء الطفيلي على الرغم من خضوعهم لأكثر من أربع جولات علاجية بجرعات عالية من المحتمل أن تساهم ضعف مراقبة جودة تركيبات الأدوية والجرعات الناقصة في تراجع الفعالية وظهور المقاومة. .
الآليات الكامنة وراء مقاومة TCBZ في فاسيولا هيباتيكا ليست مفهومة جيدًا. تشمل الآليات المقترحة زيادة نشاط مضخة طرد الأدوية P-glycoprotein (P-gp) وزيادة تحويل المستقلب النشط السلفوكسيد إلى السلفون الأقل نشاطًا. . بالإضافة إلى ذلك، تم ملاحظة مستويات أعلى من التعبير لإنزيم إزالة السموم غلوتاثيون S-ترانسفيراز (GST) في فاسيولا المقاومة . ومع ذلك، فإن التقييمات اللاحقة لهذه المسارات قد أسفرت عن نتائج غير متسقة. تم ربط تعدد أشكال النوكليوتيد المفرد (SNP) المحدد، T687G، الذي يؤدي إلى استبدال حمض أميني في P-gp، بـ TCBZ-R في دراسة واحدة. لكن الأبحاث اللاحقة في أستراليا وأمريكا اللاتينية لم تؤكد هذه العلاقة كشفت التحليلات النسخية لعزلات المختبر في أمريكا اللاتينية عن انخفاض تنظيم نسخ إنزيم الأدينيلات سيكلاز وزيادة تنظيم نظائر GST mu في الطفيليات المقاومة للألبندازول والتريكلابندازول. ومع ذلك، كان من الصعب التمييز بين إشارات مقاومة الألبندازول والتريكلابندازول بسبب حجم العينة الصغيرة والظروف التجريبية. تؤكد هذه النتائج على تعقيد آليات مقاومة TCBZ والقيود الموجودة في الدراسات التي تركز على نطاق ضيق من المسارات الأيضية، وتستخدم عددًا قليلاً من الطفيليات، أو تعتمد على عزلات تم تربيتها في المختبر. في دراسة حديثة عام 2023، استخدم بيزلي وزملاؤه تحليل الفصائل المجمعة لمقارنة ترددات الأليلات قبل وبعد علاج TCBZ في تجمعات رسم الخرائط F2 من تقاطعات جينية تجريبية وعينات بيض من عدوى طبيعية في كمبريا، المملكة المتحدة. لقد حددوا موضعًا بحجم -3.2 ميغاباز مرتبطًا بـ TCBZ-R، يتميز بالوراثة السائدة، على الرغم من أنه لم يكن من الممكن تحديد الجين (الجينات) المسببة المحددة بسبب الارتباط غير المتوازن الواسع. .
في هذه الدراسة، قمنا بتحليل عدد كبير من العزلات الميدانية من كوسكو، بيرو، لإجراء تحليل لتوقيع الانتقاء على مستوى الجينوم، مع تحديد المواقع المرشحة المرتبطة بمقاومة TCBZ، وإظهار إمكانيات تصنيف النمط الظاهري المعتمد على SNP. بالإضافة إلى ذلك، قدم التحليل النسخي رؤى أعمق حول آليات عمل الدواء والمقاومة. أظهر مقارنة المواقع المرتبطة بالمقاومة من تجمعات F. hepatica المتنوعة جغرافياً في بيرو والمملكة المتحدة توقيعات انتقاء مميزة، مما يشير إلى أصول جينية مستقلة لمقاومة TCBZ في كل تجمع.

النتائج

تسلسل جينوم سكان الكبد البالغ لفاسيولا هيفاتيكا مع اختلاف في قابلية التريكلابندازول

استعدادًا لهذه الدراسة، جمعنا البالغين عينات من . hepatica من الماشية المصابة طبيعياً في بيرو وحددت الحساسية
من العزلات إلى تراكلابندازول سلفوكسيد في المختبر، الأكثر نشاطًا من ناتج التحلل لتراكلابندازول لتحديد الأفراد في طرفي توزيع النمط الظاهري، قمنا بتعديل تركيز الدواء ومدة التعرض في اختبار الحركة لدينا. وهذا سمح لنا بتصنيف الطفيليات تقريبًا في الربعين العلوي والسفلي من توزيع القابلية على أنها حساسة (TCBZ-S) ومقاومة (TCBZ-R) على التوالي. من بين 3348 طفيليًا تعرضوا لل triclabendazole، قمنا بتسلسل الجينوم الكامل لـ 99 طفيلي TCBZ-S و210 طفيلي TCBZ-R تم جمعهم من 146 كبد بقر (البيانات التكميلية 1). لتجنب أخذ عينات مفرطة من الأفراد المرتبطين عن كثب أو الطفيليات المتطابقة جينيًا الناتجة عن انتقال متجمع للنسخ الناتجة عن التكاثر اللاجنسي في العائل الوسيط الرخوي، قمنا بتحديد عدد الطفيليات التي تم تسلسلها لكل كبد بحد أقصى 5، بمتوسط 2.1 (الشكل 1a). في المتوسط، قمنا بتوليد 17 جيجابايت من بيانات التسلسل لكل عينة ( متوسط تغطية الجينوم المرجعي 1.2 جيجا بايت)، مما أدى إلى تحديد 42.5 مليون متغير أحادي النوكليوتيد (SNPs) عبر جميع العينات. قمنا بتحديد واستبعاد 17 فردًا مرتبطًا ارتباطًا وثيقًا، بما في ذلك الأفراد المتطابقين (معامل القرابة ; الجدول التكميلية 1)، عينتان بمستويات عالية من نقص الجينوتيب ( ؛ الشكل التوضيحي التكميلي 1a)، و5 عينات تظهر تغايرية مفرطة تشير إلى احتمال تلوث العينات (الشكل التوضيحي التكميلي 1b)، مما يترك 91 طفيلي TCBZ-S و194 طفيلي TCBZ-R و42.1 مليون متغير (1 SNP كل 29 قاعدة على المتوسط) للتحليلات اللاحقة.

لا تظهر تجمعات الفاسيولا في منطقة كوسكو في بيرو هيكلًا جينيًا كبيرًا فيما يتعلق بظاهرة حساسية TCBZ الخاصة بها.

قمنا بمقارنة عيناتنا البيروفية مع بيانات تسلسل الجينوم الفردي المنشورة سابقًا من المملكة المتحدة والولايات المتحدة وأوروغواي. ) لوضع التنوع الجيني في سياقه بين المناطق الجغرافية المتنوعة مجموعات .hepatica أشارت أنماط مشاركة الأليلات على مستوى الجينوم إلى أن تتميز مجموعة . hepatica في بيرو عن العينات المجمعة في المملكة المتحدة وأوروغواي، وهو ما يتماشى مع تدفق الجينات المحدود المتوقع بين هذه المواقع (الشكل 1ب). لوحظ مستوى أقل من التمايز الجيني بين العينات من بيرو وعينة من أوريغون، الولايات المتحدة الأمريكية، كما تم الإشارة إليه سابقًا. . من بين العينات البيروفية، كان هناك القليل من الهيكلة الجينية بين الديدان ذات الفينوتيب الحساس لتأثير TCBZ المتباين (الشكل 1c). من خلال مقارنة المسافات بين المجموعات وداخل المجموعة بناءً على الهوية حسب الحالة (IBS) SNPs المقطوعة بواسطة LD مع تردد أليل ثانوي )، سألنا عما إذا كانت، في المتوسط، الأزواج عبر المجموعتين أقل تشابهًا من الأزواج داخل مجموعة الظاهرة مما يمكن توقعه بالصدفة. تم الحصول على نتيجة اختبار غير دالة ( ; 91 عينة TCBZS و194 عينة TCBZ-R، المتوسط والانحراف المعياري لـ ، و ، لمجموعة IBS بين المجموعات، و IBS داخل المجموعة (TCBZ-S)، و IBS داخل المجموعة (TCBZ-R) على التوالي؛ اختبار التبديل الذي يقوم بتغيير تسميات الظاهرة، التباديل)، مما يشير إلى أن عيناتنا تم أخذها من مجموعة تزاوج محلية دون وجود تباين سكاني قوي بين ديدان TCBZ-S و -R. كان من الممكن أن يؤدي التباين إلى تشويش تحليل توقيعات الانتقاء. تقديرات التنوع النوكليوتيدي على مستوى الجينوم ( كانت تقديرات Tajima’s D المتوسطة على مستوى الجينوم إيجابية (>0.6) في كل من مجموعات TCBZ-S و -R، مما يشير إلى احتمال حدوث انكماش سكاني حديث في المنطقة.
F. hepatica هو خنثى بنظام تزاوج مختلط يتضمن كل من التزاوج الداخلي والتزاوج الخارجي. في الأنواع التي تتزاوج داخليًا، غالبًا ما تظهر المواقع المرتبطة ارتباطًا وثيقًا هيكلًا من الأنماط الوراثية يمكن اكتشافه كاختلال ارتباط مرتفع. في مجموعة الدراسة لدينا، تدهور الاختلال إلى قيمة بالنسبة لـ SNPs المفصولة بمقدار 20 كيلوبايت واقتربت من مستويات الخلفية عند مسافات أكبر من 250 كيلوبايت (الشكل 1f)، فإن النمط مشابه لتلك الموجودة في أنواع أخرى من التزاوج الذاتي ذات أنظمة تزاوج مختلطة. يغير التزاوج الداخلي ترددات الجينات من خلال زيادة التماثل الجيني، بشكل كبير في شكل سلاسل من التماثل الجيني (ROH)، مما يقلل من الفعالية
الشكل 1 | تسلسل جينوم السكان للبالغين من فاسيولا هيباتيكا مع حساسية متباينة للثلاثيكلابندازول. أ توزيع تكرار عدد الطفيليات المتسلسلة لكل كبد مضيف. تشير الخطوط المنقطة إلى المتوسط (بالأسود) والوسيط (بالأحمر). ب، ج تحليل القياس المتعدد للأبعاد للعلاقة الجينية بناءً على الهوية بحالة مليون SNPs ثنائية الأليل مقطوعة بواسطة LD. ب عينات تم جمعها من دول مختلفة، بما في ذلك عينات من دراسات سابقة. ج عينات من بيرو ذات حساسية متباينة تجاه التريكلا بندازول. د تقديرات شاملة للتنوع النوكليوتيدي. هـ تقديرات شاملة لـ Tajima’s D. و نمط تدهور الارتباط الجيني (LD).
في بيرو، السكان بناءً على متوسط LD المحسوب في أطول 10 سقالات (النطاق: . مناطق التماثل الوراثي (ROH) في 194 عينة مقاومة للتركلابندازول و91 عينة حساسة للتركلابندازول من بيرو. مناطق ROH في 285 عينة من بيرو و5 من المملكة المتحدة و5 من أوروغواي. تعرض الرسوم البيانية الصندوقية الوسيط (الخط المركزي) والرباعيات العليا والسفلى (حدود الصندوق). نطاق الربيع الداخلي (الشعيرات) والنقاط الشاذة (النقاط). تم حساب القيم باستخدام اختبار ويلكوكسون للرتب المجمعة ذو الجانبين دون تعديلات لمقارنات متعددة.
تردد إعادة التركيب في جميع أنحاء الجينوم استنتجنا متوسط 265.4 ميغابايت و268.1 ميغابايت من إجمالي مناطق ROH لكل دودة في طفيليات TCBZ-S وTCBZ-R، على التوالي (الشكل 1g). كانت هذه التقديرات أقل من تلك التي لوحظت في المملكة المتحدة (المتوسط والانحراف المعياري لـ و في بيرو والمملكة المتحدة، على التوالي؛ و في بيرو والمملكة المتحدة، على التوالي؛ إحصائية ويلوكسون للرتب المجمعة ذات الجانبين W فترة الثقة حجم التأثير ) وأوروغواي ( في أوروغواي؛ إحصائية ويلوكسون للرتب المجمعة ذات الجانبين W فترة الثقة حجم التأثير ) عينات (الشكل 1h)، مما يشير إلى مستوى أعلى نسبيًا من التهجين في مجموعة بيرو.

تشمل المواقع المرشحة تحت اختيار TCBZ EGFR/PI3K-mTOR-

جينات مسار S6K والجينات المشاركة في وظيفة الأنابيب الدقيقة. لتحديد المواقع تحت اختيار TCBZ، قمنا بإجراء مؤشر تثبيت على مستوى الجينوم. التحليل. بينما من المتوقع أن تكون الغالبية العظمى من التنوع الجينومي محايدة بالنسبة للصفة المحورية (أي، حساسية TCBZ)، من المحتمل أن تكون الأليلات التكيفية التي تختلف في تاريخ اختيارها مرتبطة بمناطق متمايزة جينياً بين تجمعات TCBZS و TCBZ-R. قمنا بمسح الـ ج genome الكبدية لـ المواقع الشاذة باستخدام نهج النافذة المنزلقة، حيث تم تحديد حدود النافذة بناءً على نقاط الانعطاف لخط انسيابي ملائم للبيانات الخام القيم المقدرة للفرد (الشكل التوضيحي الإضافي 2). لمقارنة النوافذ الجينومية بأحجام مختلفة، استخدمنا -اختبار مثل الإحصاء تم تصنيف النوافذ الجينومية بناءً على القيم (البيانات التكميلية 2)، مما أدى إلى تحديد المناطق الجينومية الشاذة فوق النسبة المئوية 99.9 ، والتي تشمل ما مجموعه تسعة جينات مشفرة للبروتين تقع عبر تسعة سقالات (الشكل 2أ، الشكل التوضيحي 3 والجدول 1). تم تحديد كل جين مرشح في مناطق جينومية متميزة في سقالات منفصلة. نظرًا للترتيب المحدود لجينوم مرجع F. hepatica (رقم الوصول في GenBank: GCA_900302435; N50: 1.9 ميغابايت; N90: 519 كيلوبايت)، تحديد التوزيع المكاني على المدى الطويل لـ لم يكن من الممكن تحديد المواقع الشاذة. ومع ذلك، تم إجراء تحليل تتابع الجينات، استنادًا إلى الأنواع الشقيقة المرتبطة بشكل وثيق F. gigantica (المكمل
البيانات 3) ، اقترحت أن هذه المواقع الشاذة من المحتمل أن تكون موزعة عبر عدة كروموسومات (مجموعات ربط) بدلاً من أن تكون في موقع واحد. علاوة على ذلك، لوحظ أن الارتباط الوراثي بين الجينات الشاذة كان منخفضًا. ) في كل من مجموعات TCBZ-S و -R (الشكل 2ب، ج).
أفضل 9 جينات شاذة من يمكن تصنيف مسح الجينوم إلى تلك المرتبطة بمسار PI3K/AKT-mTOR-S6K (CYPA، EGFR، SIK3، S6K، وGALNT) وتلك المتورطة في وظيفة الأنابيب الدقيقة، إما كشركاء ارتباط فعليين (DNAH) أو كإنزيمات تعديل (KTNA1). من بين هذه، احتوت خمسة جينات على واحد أو أكثر من المتغيرات غير المتطابقة التي تظهر فرقًا كبيرًا في التردد بين سكان TCBZ-S و-R. في جميع المقارنات، اختبار فيشر الدقيق؛ انظر البيانات التكميلية 4 للحصول على التفاصيل الدقيقة قيم لكل متغير). لم نلاحظ إشارة اختيار في الجينات المرشحة وعائلات الجينات التي تم الإبلاغ عنها سابقًا، مثل T687G في P-gp و T143S في جينات GST مو (البيانات التكميلية 5). علاوة على ذلك، لم تتداخل مواقع المرشحين لدينا مع مناطق QTL المرتبطة بـ TCBZ-R التي تم تحديدها من تحليل الانقسام المجمع لفاسيولا في كمبريا، المملكة المتحدة (منطقة 0.3 ميغابايت من السقالة 1853 ومنطقة 2.9 ميغابايت من السقالة 157) (الشكل 2د-و). بحثنا عن تزامن إشارات الاختيار من الدراستين على نفس الهيكل من خلال مقارنة القيم القصوى للإحصائية (أي، وقيم LRT المتوسطة) التي لوحظت لكل هيكل في كل دراسة. كانت المواقع المرشحة من كل دراسة تقع على مجموعات حصرية من الهياكل، دون وجود أي تداخل.
لفهم الفروقات الأساسية في التعبير الجيني بين الديدان TCBZ-S و -R وللتحقيق في كيفية اختلاف استجابة الأدوية بين الديدان ذات الأنماط الظاهرية المختلفة، قمنا بتوصيف ملفات التعبير الجيني للطفيليات البالغة المستمدة من الديدان الأبوية ذات الحساسية المعروفة للأدوية (الشكل التوضيحي 4 والبيانات التكميلية 6). تم إجراء تسلسل RNA على عينات الديدان الكاملة المعالجة وغير المعالجة بالأدوية، مع التركيز على (1) الفروقات في التعبير بين الديدان TCBZ-S و -R بدون علاج و (2) تأثيرات علاج TCBZ داخل كل مجموعة نمط ظاهري. لضمان نتائج إحصائية قوية، أخذنا في الاعتبار التباين المرتبط بالوقت و
الشكل 2 | مسح شامل للجينوم لمؤشر الثبات بين تجمعات فاسيولا هيباتيكا الحساسة والمقاومة للتركلابندازول. تم تحديد الفترات الجينومية الشاذة (النسبة المئوية 99.9، الخط المنقط) بناءً على الموصوف في المرجع 42. الهياكل على تم ترتيب المحاور حسب المعرف ولا يعني القرب الجسدي. تم الإشارة إلى الجينات المرشحة التي تتداخل مع المناطق الشاذة باستخدام رمز الجين الخاص بها. ب، ج مصفوفة التوافق الوراثي (LD) بين الجينات التسعة التي تتداخل المناطق الشاذة. تم اختيار 10 SNPs من كل موضع جيني
عشوائيًا لحساب LD الثنائي لكل مقابل لكل SNPs). الحدود الحمراء تشير إلى أزواج SNP داخل الجين. ب LD في الديدان الحساسة لـ TCBZ. ج LD في الديدان المقاومة لـ TCBZ. الحد الأقصى للإحصائية الاختبارية الملاحظة على كل سقالة في الدراسة الحالية ( -المحور) وفي بيزلي وآخرون ( -المحور؛ د: تجربة التهجين الجيني 1، هـ: تجربة التهجين الجيني 2، و : حقل معزول 1) تم تلوين الهياكل التي تحتوي على جينات المرشحين الشاذين باللون الأزرق (الدراسة الحالية) والأحمر (بيزلي وآخرون).
الجدول 1 | الجينات المرشحة التي تتداخل مع النسبة المئوية 99.9 المناطق الشاذة مقارنة بين تجمعات فاسيولا هيباتيكا الحساسة والمقاومة للتريكلا بندازول في بيرو
معرّف الجين رمز الجين وصف ترتيب قيمة
صانع-سقالة10x_1006_عمود-أغسطس-جين-0.3 S6K كيناز بروتين الريبوسوم S6 ١١٢.٥
صانع-سقالة10x_790_عمود-لقطة-جين-0.11 EGFR بروتين كيناز التيروزين المستقبل ١١٠.٨
صانع-سقالة10x_1058_عمود-لقطة-جين-0.8 غالنت بوليببتيد N-أسيتيلغالكتوزامينيلترانسفيراز 96.5
صانع-سقالة10x_259_عمود-لقطة-جين-0.103 MPDZ بروتين متعدد نطاقات PDZ 94.1
سناب_ماسكد-سقالة10x_1433_بيلون-معالج-جين-0.1 كاسك كالسيكويستين 91.5
صانع-سقالة10x_293_عمود-لقطة-جين-0.143 سيبا إيزوميراز البيبتيديل-بروتين من نوع سيكلوفيلي 89.5
صانع-سقالة10x_922_عمود-لقطة-جين-0.56 KTNA1 الوحدة A1 المحتوية على ATPase كاتانين p60 ٨٧.٧
سناب_ماسكد-سكافولد10x_1189_بيلون-معالج-جين-0.81 SIK3 كيناز البروتين سيرين/ثريونين SIK3 87.3
صانع-سقالة10x_82_عمود-لقطة-جين-0.73 دي إن إيه سلسلة ثقيلة من الداينين الأكسونيمال 85.2
تم حساب القيم باستخدام اختبار التبديل أحادي الجانب، مع عشوائية تسميات النمط الظاهري (20,000 تبديل).
تركيزات العلاج (انظر الطرق للحصول على تفاصيل حول النهج التجريبي، بما في ذلك إصابات الحلزونات والأرانب). تم حساب الأهمية الإحصائية للتعبيرات التفاضلية الزوجية بواسطة خوارزمية تعتمد على اختبار التوزيع الثنائي السالب. ، وضبط FDR القيم لكل مقارنة موضحة في البيانات التكميلية 7.
في غياب العلاج، حددنا 562 جينًا مفرط التعبير و142 جينًا ناقص التعبير في الديدان الطفيلية المقاومة لـ TCBZ مقارنة بالديدان الطفيلية الحساسة لـ TCBZ. و تغير الطي؛ الشكل 3أ). من بين الجينات ذات التعبير المنخفض، لم نلاحظ فئات وظيفية غنية بشكل ملحوظ ( اختبارات هايبرجيوما الشرطية المعدلة بواسطة FDR ; الشكل 3e). الفئات الوظيفية الغنية بين الجينات المفرطة التعبير شملت العمليات المعتمدة على الأنابيب الدقيقة (GO:0007017، الحركة المعتمدة على الأنابيب الدقيقة (GO:0007018، ) وحركة الخلايا المعتمدة على السليوم أو السوط (GO:0001539، ) (الشكل 3e). بشكل خاص، تم العثور على عدة جينات للتوبولين (9 ألفا و1 بيتا-توبولين)، والبروتينات الهيكلية والحركية الموجودة في الأهداب والأسواط، مثل الكينيسين، والدينين المحوري، والتكتين، وأعضاء مختلفين من عائلة البروتينات المرتبطة بالأهداب والأسواط، حيث أظهرت مستويات أعلى من النسخ في الديدان المقاومة لـ TCBZ (البيانات التكميلية 7). بالإضافة إلى ذلك، لوحظت وفرة أعلى من النسخ في الجينات المشاركة في تنظيم الأنابيب الدقيقة والهيكل الخلوي (الجدول 2)، مثل الفازوهبين الذي له نشاط إزالة التيروزين من التوبولين. بروتين EB1
تعديل ديناميات الأنابيب الدقيقة وإنزيم جليكيل التوبولين الذي يعدل الأنابيب الدقيقة الخارجية في الأهداب والأسواط تم التعبير عن إنزيمات بوليغلوتاميلات التوبولين وإنزيم إزالة الغلوتاميل من التوبولين (بروتين شبيه الكاربوكسي ببتيداز السيتوزول 5)، والتي تشارك في غلوتاميلات الأنابيب الدقيقة وتكون وفيرة في الخلايا العصبية والأهداب، بمستويات أعلى في الديدان المقاومة لـ TCBZ. ومن الجدير بالذكر أن الجين الأكثر تعبيرًا بشكل ملحوظ كان بروتين مُنشط GTP يحتوي على حافز IQ (IQGAP). بروتين سقالة يدمج إشارات EGFR مع إشارات PI3K/AKT-mTOR تشمل الجينات الزائدة التعبير عنها الأخرى المثيرة للاهتمام ثلاثة بروتينات تحتوي على نطاقات شبيهة بـ EGF. تم تحديد اثنين من هذه البروتينات كمرشحين مرتبطين بـ TCBZ-R بواسطة المرجع 34.
في الديدان الطفيلية TCBZ-S، أظهرت 62 جينًا زيادة ملحوظة، وأظهرت 131 جينًا انخفاضًا ملحوظًا استجابةً لعلاج TCBZ؛ ومع ذلك، لم يتم الكشف عن أي جينات معبرة بشكل مختلف بشكل ملحوظ في الديدان الطفيلية TCBZ-R. و تغير الطي؛ الشكل 3ب، ج). كان الجين الأكثر زيادة بشكل ملحوظ هو كيناز البروتين المنشط بالميتوجين (المماثل للبشر MAPK11) ( )، التي تنتمي إلى فئة من الكينازات (p38 MAPKs) التي تستجيب لمحفزات الإجهاد وتشارك في تمايز الخلايا، وموت الخلايا المبرمج، والالتهام الذاتي (الجدول 2). لم نلاحظ أي فئات وظيفية غنية بشكل ملحوظ ( ) من بين 62 جينًا مرتفع التعبير (الشكل 3e). الـ 131
الشكل 3 | تحليل تعبير النسخ لديدان الفاسيولا هيفاتيكا الحساسة والمقاومة للتركلابندازول، سواء بدون علاج أو استجابة لعلاج التركلابندازول. أ التعبير التفاضلي بين الديدان الحساسة والمقاومة بدون علاج. ب التعبير التفاضلي بين الديدان الحساسة المعالجة وغير المعالجة. ج التعبير التفاضلي بين الديدان المقاومة المعالجة وغير المعالجة. الجينات مع تعديل FDR قيمة لـ وتغير في الطي كانوا
يُعتبر أنه قد زاد (بالأحمر) أو انخفض (بالأزرق) التعبير بشكل كبير وتم تجميعه بناءً على أنماط التعبير (المجموعة 1 إلى 6، مع عدد الجينات بين قوسين). د توزيع الجينات المعبر عنها بشكل مختلف عبر المجموعات 1 إلى 4. هـ مصطلحات عملية بيولوجية مفرطة التمثيل من علم الأحياء الجيني (GO) للجينات المعبر عنها بشكل مختلف. مصطلحات GO مع تعديل FDR قيمة لـ اعتُبرت ذات دلالة (حدود سوداء).
تم إثراء الجينات المنخفضة التنظيم بشكل كبير لعمليات قائمة على الأنابيب الدقيقة (GO: 0007017، الحركة المعتمدة على الأنابيب الدقيقة (GO:0007018، ) وتجميع إسقاط الخلايا (GO:0030031، ) (الشكل 3e). من الجدير بالذكر أن 87 من 131 جينًا تم تقليل تعبيرها تداخلت مع 562 جينًا أظهرت مستويات أعلى من وفرة النسخ في الديدان المقاومة لـ TCBZ مقارنة بالديدان الحساسة لـ TCBZ ( )، مما أدى إلى نتائج مماثلة في إثراء الفئات الوظيفية (الشكل 3d، e). من بين الجينات المستجيبة لعلاج TCBZ في الديدان TCBZ-S كانت هناك عدة جينات أنابيب (3 ألفا- وأنابيب دلتا واحدة) (الجدول 2). كان هذا التثبيط المنسق لنسخ الأنابيب يذكر بتوقيعات النسخ الناتجة عن زعزعة استقرار الأنابيب الناتجة عن الأدوية والتي تتضمن التنظيم الذاتي للأنابيب، وهو تدهور مشترك للترجمة للأنابيب. لتوصيف الجينات المعبر عنها بشكل مختلف، قمنا بإجراء تحليل ارتباط نوع الخلية القائم على التشابه باستخدام بيانات تسلسل RNA أحادي الخلية من Schistosoma mansoni. لقد لاحظنا ارتباطًا كبيرًا بأنواع خلايا معينة بما في ذلك خلايا اللهب ( ) وخلايا الجراثيم الذكرية المتأخرة التي تحتوي على هيكل الأكسونيم بالإضافة إلى عدة أنواع من الخلايا العصبية، من بين الجينات المعبر عنها بشكل مختلف التي أظهرت زيادة في وفرة النسخ في الديدان المقاومة لـ TCBZ و/أو انخفاض في مستويات النسخ في الديدان المعالجة بالأدوية TCBZ-S (البيانات التكميلية 8).

يمكن تمييز طفيليات TCBZ-S و -R باستخدام عدد محدود من SNPs المعلوماتية

تحديد العلامات الجينية التي يمكن أن تتنبأ بالفشل السريري لـ TCBZ بين الأفراد المصابين هو شرط أساسي لتطوير أساليب تحديد الجينات المستهدفة ذات التكلفة الفعالة التي يمكن نشرها في الميدان. قمنا بالتحقيق فيما إذا كان عدد محدود من علامات SNP يمكن أن يوفر قوة تمييز لتصنيف الديدان الطفيلية إلى TCBZ-S أو TCBZ-R. لتحديد المواقع المعلوماتية، قمنا بمقارنة ترددات الأليلات في مجموعات TCBZ-S و TCBZ-R باستخدام اختبار فيشر الدقيق واستخدمنا نهج التجميع لاختيار أفضل 300 SNP رائد/مؤشر بأدنى قيم p التي لم تكن في ارتباط قوي مع بعضها البعض.
آخر ( ) (البيانات التكميلية 9). باستخدام هذه المواقع، قمنا بإجراء تحليل تمييزي للمكونات الرئيسية (DAPC) الذي يمكنه بشكل احتمالي تخصيص عينات فردية إلى مجموعات TCBZ-S أو TCBZ-R (الشكل 4a). على الرغم من أن دقة التصنيف انخفضت عندما تم استخدام مجموعة أصغر تدريجياً من SNPs لنمذجة DAPC، إلا أن النتائج أشارت إلى أنه قد يكون من الممكن تمييز الطفيليات TCBZ-S و TCBZ-R مع الدقة باستخدام SNPs. لمعالجة مشكلة الإفراط في التخصيص، الذي يؤدي إلى أداء متفائل بشكل مفرط يفشل في التعميم على عينات جديدة، قمنا بتقييم تصنيف DPAC باستخدام مجموعة مستقلة من 152 عينة من الديدان الكبدية البالغة (78 TCBZ-S و74 TCBZ-R) تم تحديد جينومها باستخدام لوحة مضاعفات مخصصة. كان من الممكن تصميم بادئات لـ 293 من 300 SNP رائد/مؤشر، وبعد إزالة أربعة أزواج من البادئات التي أنتجت مستويات أعلى من المنتجات غير المستهدفة، شمل التصميم النهائي (IDT xGen custom amplicon panel cp727) مجموعات بادئات تستهدف ما مجموعه 289 موضعًا. لتقييم دقة تحديد الجينوم، قمنا بتسلسل 10 عينات إضافية باستخدام هذه اللوحة، والتي كانت تكرارات تقنية لنفس عينات الحمض النووي التي تم تسلسلها بالكامل (WGS) من أجلنا تحليل. أسفر تسلسل الأمبليكون عن متوسط تغطية الهدف (الحد الأدنى ) و توحيد التغطية (عدد SNPs المستهدفة مع التغطية من المتوسط) (البيانات التكميلية 10). المواقع متعددة الأليلات ( ) والمواقع مع استدعاءات الجينوتيب المفقودة ( ) تم استبعادها من التحليل الإضافي. تم مقارنة استدعاءات النمط الجيني من 10 عينات تسلسل الأمبليكون المطابقة لـ 10 عينات تسلسل الجينوم الكامل لتقييم دقة النمط الجيني لتسلسل الأمبليكون في المواقع المستهدفة الفردية. تم الاحتفاظ فقط بالمواقع التي كانت لديها استدعاءات نمط جيني متطابقة في 9 من أصل 10 أزواج العينات على الأقل للتحليل اللاحق ( ثم تم إجراء اختيار الميزات باستخدام طريقة التعلم الآلي غابة عشوائية لإعطاء الأولوية لـ SNPs المعلوماتية )، مرتبة حسب قيم انخفاض الدقة المتوسطة (MDA) (البيانات التكميلية 10). تم بناء دالة تمييز DAPC باستخدام هذه الـ 30 SNP الأكثر معلوماتية للتصنيف الثنائي لـ 152 عينة من تسلسل الأمبليكون. تم تقييم الأداء من خلال تحليل منحنى التشغيل الاستقبالي (ROC)، مقارنةً بمعدل الإيجابيات الحقيقية (الحساسية) مقابل الإيجابيات الكاذبة.
الجدول 2 | الجينات ذات الاهتمام التي تعبر بشكل مختلف بين فاسيولا هيباتيكا الحساسة والمقاومة للتريكلابندازول دون استجابة وعند الاستجابة لعلاج التريكلابندازول
معرّف الجين وصف غير معالج لوغاريتم 2 للفرق تم تعديل FDR قيمة TCBZ-S تم تعديل FDR قيمة
أعلى في TCBZ-R أقل في TCBZ-R أعلى مع علاج TCBZ خفض مع علاج TCBZ
صانع-سقالة10x_1074_بيلون-سناب-جين-0.107 ألفا-توبولين ي ٢.٣٠ -1.11 0.049
صانع-سقالة10x_13_عمود-سناب-جين-2.125 ألفا-توبولين ي 2.14 ي -2.47
صانع-سقالة10x_13_عمود-لقطة-جين-2.129 ألفا-توبولين ي 1.94 ي -2.08
صانع-سقالة10x_1444_عمود-لقطة-جين-0.40 ألفا-توبولين ي 1.17 -1.42 0.017
صانع-سقالة10x_45_عمود-انقر-جين-0.45 ألفا-توبولين ي 1.74 ي -2.31
صانع-سقالة10x_592_عمود-لقطة-جين-0.21 ألفا-توبولين ي 1.87 -1.51
صانع-سقالة10x_680_عمود-لقطة-جين-0.21 ألفا-توبولين ي 1.30 -0.99 0.12
صانع-سقالة10x_809_عمود-لقطة-جين-0.10 ألفا-توبولين ي 1.69 -1.78
صانع-سقالة10x_944_عمود-لقطة-جين-0.44 ألفا-توبولين ي 2.40 -1.28 0.036
سناب_ماسكد-سكافولد10x_1189_بيلون-معالج-جين-0.77 ألفا-توبولين ي 2.36 -3.25
صانع-سقالة10x_1708_عمود-لقطة-جين-0.5 بروتين 5 الشبيه بكاربوكسي ببتيداز × 10 في السيتوسول ي 1.26 -0.86 0.13
صانع-سقالة10x_1084_عمود-لقطة-جين-0.149 دلتا-توبولين 0.24 0.79 ي -2.90
صانع-سقالة10x_486_عمود-لقطة-جين-0.86 بروتين يحتوي على مجال C-terminal من EB1 ي 2.77 ي -1.94
صانع-سقالة10x_44_عمود-انقر-جين-0.4 بروتين يحتوي على مجال مشابه لـ EGF ي 2.77 -1.53 0.16
صانع-سقالة10x_157_عمود-لقطة-جين-0.185 بروتين يحتوي على مجال مشابه لـ EGF ي 2.37 -1.74 0.046
صانع-سقالة10x_157_عمود-لقطة-جين-0.196 بروتين يحتوي على مجال مشابه لـ EGF ي 1.94 -2.04 0.035
صانع-سقالة10x_206_عمود-لقطة-جين-0.64 نمط IQ، موقع ارتباط EF-hand ي ٣.٥٠ -0.99 0.13
صانع-سقالة10x_1309_بيلون-سناب-جين-0.85 كيناز البروتين المنشط بواسطة الميتوجين 0.51 0.24 ي 1.20
صانع-سقالة10x_559_عمود-لقطة-جين-0.27 مونوجلايسيل التوبولين ي 1.63 0.16 0.87
صانع-سقالة10x_61_عمود-انقر-جين-0.52 بوليجليتاميلاز التوبولين ي 1.76 -1.30
صانع-سقالة10x_234_عمود-أغسطس-جين-0.64 بوليجليتاميلاز التوبولين ي 1.22 0.37 0.57
صانع-سقالة10x_242_عمود-لقطة-جين-0.27 بوليجليتاميلاز التوبولين ي 1.44 -0.86 0.23
ماكر-سقالة10x_383_بيلون-سناب-جين-1.0 بوليجليتاميلاز التوبولين ي 1.65 -0.92 0.19
صانع-سقالة10x_483_عمود-لقطة-جين-0.117 بوليجليتاميلاز التوبولين ي 1.51 -0.22 0.69
صانع-سقالة10x_908_بيلون-سناب-جين-1.169 بوليجليتاميلاز التوبولين ي 1.60 -0.87 0.18
صانع-سقالة10x_1306_بيلون-سناب-جين-0.14 بوليجليتاميلاز التوبولين ي 1.74 -2.06 0.065
صانع-سقالة10x_2067_عمود-أغسطس-جين-0.6 بوليجليتاميلاز التوبولين ي 1.57 -1.11 0.032
صانع-سقالة10x_66_عمود-لقطة-جين-0.15 هيدروكسيلاز كربوكسيلي نهائي يوبكويتين ي 1.07 ي 1.56
صانع-سقالة10x_73_عمود-انقر-جين-0.14 بروتين شبيه بالفازوهبين ي 2.07 ي -2.70
الشكل 4 | تمييز فاسيولا الحساسة والمقاومة للتركلابندازول
مستندة إلى ملفات SNP. تصنيف المجموعات بواسطة تحليل التمييز للمكونات الرئيسية (DAPC). تم استخدام أفضل 300 SNP، التي تظهر اختلافات ملحوظة في تردد الأليلات بين المجموعات وليست في توازن ربط قوي مع بعضها البعض، لتصنيف 91 عينة WGS من TCBZ-S و194 عينة من TCBZ-R.

b

تم تقييم دقة التصنيف بشكل تدريجي من خلال تقليل عدد SNPs في التحليل. ب. منحنى خصائص التشغيل المستقبلية (ROC) لمصنف DAPC باستخدام 30 SNPs معلوماتية ومجموعة عينة مستقلة من 78 دودة TCBZ-S و74 دودة TCBZ-R تم تحديدها بواسطة تسلسل الأمبليكون. يتم تقديم منحنى ROC كخط عريض، مع فترات الثقة كمنطقة زرقاء فاتحة.
معدل (1-الخصوصية) عند عتبات تصنيف مختلفة (الشكل 4ب). كانت المساحة تحت منحنى ROC (AUC)، التي توفر مقياسًا مجمعًا للأداء عبر جميع عتبات التصنيف الممكنة، 0.86 (إعادة أخذ عينات غير معلمية مقسمة). فترة الثقة ). كانت دقة التصنيف (ثنائي محدد فترة الثقة )، مع اختبار ثنائي الحدين قيم من كانت حساسية التصنيف وخصوصيته (ثنائي محدد فترة الثقة ) و (ثنائي محدد فترة الثقة )، على التوالي. أخيرًا، قمنا بإجراء التحقق المتقاطع باستخدام طريقة ترك الزوج (مع 1000 إعادة أخذ مصنفة) لتقدير دقة التصنيف عند استخدام النموذج لإجراء التنبؤات على بيانات غير مدرجة في مجموعة التدريب. كانت دقة التنبؤ المقدرة باستخدام التحقق المتقاطع .

نقاش

تريكلابندازول هو العلاج الأول المستخدم لمكافحة الديدان لعلاج عدوى F. hepatica، وذلك لفعاليته ضد كل من الطفيليات البالغة والطفيلية المبكرة. على الرغم من ظهور مقاومة واسعة النطاق في الماشية وزيادة حالات العدوى المقاومة لدى البشر، لا يزال فهمنا لوراثيات مقاومة تريكلابندازول محدودًا. لقد أدت الجهود السابقة لتحديد العلامات الجينية المرتبطة بالمقاومة إلى نتائج غير متسقة عبر سلالات وعزلات مختلفة، مما يبرز أهمية أخذ عينات واسعة من العينات الموصوفة بشكل جيد من الناحية الظاهرية. قمنا بتحديد حساسية التريكلا بندازول لعدد كبير من الديدان البالغة الفردية من الإصابات الطبيعية في الماشية في منطقة كوسكو في بيرو باستخدام اختبار حركة قياسي في المختبر. . بناءً على هذه المجموعة من العزلات الميدانية، قمنا بإجراء تحليلات لتوقيع الانتقاء على مستوى الجينوم وتحليل تعبير النسخ لفهم الأساس الوراثي لمقاومة TCBZ-R في . هيباتيكا وحددت علامات وراثية مرتبطة بالمقاومة لتسهيل تطوير أدوات المراقبة الجزيئية من أجل تحسين التدخلات والسيطرة المستدامة.
مقارنات الجينوتيب والظاهرة بين من المحتمل أن تعاني عزلات . hepatica من تأثيرات مشوشة بسبب هيكل السكان. أظهرت عينات الديدان من منطقة كوسكو هيكلًا سكانيًا محدودًا، مما يجعلها مناسبة لتحليل مسح الاختيار على مستوى الجينوم. علاوة على ذلك، كان الطول الإجمالي لمناطق ROH لكل دودة أقصر من تلك الموجودة في العينات التي تم تسلسلها سابقًا من المملكة المتحدة وأوروغواي، مما يتماشى مع وجود سكان يتزاوجون بشكل متكرر بمعدلات أعلى من التهجين. لوحظت قيم إيجابية لـ Tajima’s D، والتي قد تشير إلى انكماشات سكانية حديثة أو مستمرة.
حددنا مناطق جينومية ذات تباين عالٍ (فوق النسبة المئوية 99.9) بين السكان ذوي حساسية مختلفة لـ TCBZ، باستخدام 210 دودة بالغة مقاومة لـ TCBZ و99 دودة بالغة حساسة لـ TCBZ، حيث تمثل كل مجموعة تقريبًا الربع الأعلى والربع الأدنى من التوزيع. تحتوي هذه المواقع المرشحة تحت الاختيار على إجمالي 9 جينات مشفرة للبروتين، بما في ذلك تلك الموجودة في مسار EGFR/PI3K/AKT-mTOR-S6K والجينات المشاركة في وظيفة الأنابيب الدقيقة. نقترح نموذجًا حيث تساهم التعديلات في إشارة EGFR/PI3K/AKT-mTOR-S6K في مقاومة TCBZ عن طريق تغيير استقرار الأنابيب الدقيقة وتعزيز البقاء. أظهرت الدراسات أن مسار S6K يعزز بقاء الخلايا في ظل ظروف الضغط ويعزز أسيتيل أنابيب التوبولين التي يمكن أن تحمي الأنابيب الدقيقة من العلاجات بالأدوية المذوبة، مثل الكولشيسين والنوكودازول. في الخلايا المقاومة لعقار يستهدف التوبولين (باكليتاكسيل)، أظهر أسيتيل التوبولين أنه يعزز الظاهرة المضادة للاستماتة من خلال تثبيت Mcl-1 وحمايته من التحلل بواسطة نظام يوبكويتين-بروتيازوم. في Caenorhabditis elegans، ينظم S6K ديناميات حبيبات الإجهاد، وفقدان وظيفته يجعل الدودة الخيطية أكثر حساسية للموت الناتج عن الإجهاد. .
لا يمكن تحديد، استنادًا فقط إلى تحليل مسح الاختيار لدينا، ما إذا كانت أي من الجينات الشاذة تساهم مباشرة في ظاهرة المقاومة. ومع ذلك، من المهم أن العديد من الجينات الشاذة تلاقت في نفس المسار. من الممكن أن يساهم جين شاذ في ظاهرة المقاومة أو يلعب دورًا تعويضيًا في إعادة توازن الاستقرار والديناميات للأنابيب الدقيقة في الطفيليات المقاومة. نظرًا لأن التغيرات في نشاط مسار الإشارات الخلوية غالبًا ما تؤثر على عمليات بيولوجية متعددة، بما في ذلك تلك التي تحمل تكاليف لياقة، قد تعكس بعض مواقعنا المرشحة آليات تعويضية تستعيد اللياقة. في الأقسام التالية، نناقش الجينات المرشحة الفردية بمزيد من التفصيل في سياق نموذجنا المقترح.
حددنا خمسة جينات مرشحة متورطة في مسار الإشارات EGFR/PI3K/AKT-mTOR-S6K: السيكلوفيليين (CYPA)، بروتين كيناز مستقبلات التيروزين (المماثل لـ C. elegans let-23 وEGFR وERBB4 البشريين)، S6K، SIK3 (منظم إيجابي لإشارات المTOR). )، و GALNT (المعنية بتنشيط مسار PI3K/AKT من خلال O-glycosylation لمستقبل EGFR ). السيكلوفيليين، وهو جزيء شابيرون/إشارات له نشاط إيزوميراز ببتيديل-بروتين، يعزز تكاثر الخلايا ونمط ظاهري مضاد للاستماتة في أنواع مختلفة من خلايا السرطان ترتبط التأثيرات المضادة للاستماتة بتنشيط مسار الإشارة PI3K/AKT-mTOR، وتعديل عائلة Bcl-2، و inhibiting cascades الكاسبيز. . في F. hepatica، لوحظ زيادة ملحوظة في مستوى بروتين سيكلوفيليين A بعد
التعرض لتركيزات عالية من TCBZ ( ) في كل من عزلات سليغو (TCBZ-R) وكولومبتون (TCBZ-S). ومع ذلك، كانت التغيرات في مستوى تعبير البروتين أكبر بكثير في سليغو TCBZ-R مقارنةً بديدان كولومبتون TCBZ-S (زيادة بمقدار 32.7 و 6.5 مرة بالنسبة للسيطرة، على التوالي) مستقبل عامل نمو البشرة هو كيناز تيروسين مستقبل ينشط PI3K عند ارتباطه بالليغاند وتكوين الثنائي وينظم مجموعة واسعة من العمليات البيولوجية، بما في ذلك تكاثر الخلايا وتمايزها. لقد حددت التحليلات النسخية والبروتينية أن إشارة PI3K-AKT هي مسار رئيسي مرتبط بالنمو والتطور في مرحلة الكبد غير الناضجة. . الكبدية من المثير للاهتمام أنه تم ملاحظة أن ديدان TCBZ-R تصل إلى حالة الانفتاح بشكل أسرع من ديدان TCBZ-S في كل من الجرذان (عزلات أوبيرون مقابل عزلات فيرهيرست). وفي الأغنام (عزلات سليغو مقابل كولومبتون) لا يزال يتعين تحديد ما إذا كانت هناك مسار مشترك يساهم في مقاومة TCBZ في هذه العزلات وإذا كانت التغيرات في نشاط PI3K-AKT تؤثر على كل من تطور الطفيليات وحساسية TCBZ (التأثير المتعدد).
حدد تحليلنا الجينات المرشحة المعنية بوظيفة الأنابيب الدقيقة والهيكل الخلوي، مثل الداينين الأكسوني (DNAH) والكيتانين (KTNA1). تعمل الداينينات كمحركات لتوليد الانزلاق بين الأنابيب الدقيقة المزدوجة في الأهداب. الكيتانين هو إنزيم يقوم بتقطيع الأنابيب الدقيقة ويمكنه تعديل استقرار الأنابيب الدقيقة بشكل إيجابي وسلبي. بينما يمكن أن يؤدي القطع إلى عدم استقرار الأنابيب الدقيقة، يمكن أن يعمل الكاتانين أيضًا على استقرار نهايات الأنابيب الدقيقة التي تم توليدها حديثًا، مما يساهم في تضخيم الأنابيب الدقيقة.
بينما نفترض أن التنظيم المختلف لمسار PI3K/AKT-mTOR-S6K مرتبط بمقاومة TCBZ، سيكون من الضروري إجراء مزيد من الدراسات لتحديد الطبيعة الدقيقة وتأثيرات التعديلات الفردية على المسار تحت اختيار TCBZ ولتحديد الأليل (الأليلات) السببي (السببية) الضرورية والكافية للظاهرة المقاومة. على الرغم من أنه لا يزال يتعين تحديد ما إذا كانت مقاومة TCBZ في . الهيباتيكا هي سمة متعددة الجينات تتحكم فيها عدة جينات، ويبدو أن TCBZ-R في مجموعة دراستنا يتم التوسط فيه بواسطة عدد محدود من آليات التأثير التي يمكن أن تتأثر بعمليات تنظيمية متعددة (عليا). لم نلاحظ ارتباطًا جينيًا قويًا بين الجينات الشاذة (الموجودة على سقالات مختلفة)، مما يشير إلى أن تركيبات مختلفة من الأليلات التكيفية قد تمنح ظاهرة المقاومة في ديدان الفلوكس الفردية المختلفة (أي، التكرار الجيني).
قمنا بتحليل النسخ الجينية للديدان TCBZ-S و -R لفهم تأثير الدواء بشكل أفضل وتطوير رؤى حول آلية المقاومة. TCBZ هو أحد أعضاء عائلة البنزيميدازول من الأدوية المضادة للديدان التي ترتبط بالبيتا-توبولين، مما يمنع تفاعل البوليمر للميكروتوبولات. تشكل الألفا- والبيتا-توبولينات ثنائيات غير متجانسة إلزامية تتجمع لتكوين الأنابيب الدقيقة، ويُعتقد أن TCBZ يتداخل مع تشكيل الثنائيات غير المتجانسة عن طريق قفل أجزاء البيتا-توبولين في الشكل المفتوح. يرتبط TCBZ ويمنع ارتباط الكولشيسين ببروتين الميكروتوبول النقي المستخرج من البالغين . هيباتيكا، مما يشير إلى موقع ارتباط مشترك . على الرغم من الفهم الآلي لتفاعل TCBZ مع تفتقر أنابيب بيتا-توبولين في الكبد، والتغيرات الشكلية والنسجية الملحوظة في الديدان الطفيلية TCBZ-S بعد العلاج بالعقار تتماشى مع تعطيل الأنابيب الدقيقة، مما يشير بقوة إلى تورط بيتا-توبولين. .
حددنا وجود تمثيل مفرط لجينات مرتبطة بالميكروتوبول، بما في ذلك عدة جينات توبولين، بين تلك التي أظهرت اختلافًا في وفرة النسخ (i) بعد علاج TCBZ في الديدان الحساسة للعلاج و (ii) بين الديدان TCBZ-S و -R في غياب العلاج. على وجه الخصوص، أشار تحليل فئة الوظيفة وغنى نوع الخلية إلى اختلافات في وفرة النسخ في الجينات المشاركة في وظيفة الميكروتوبول الإكسونيمالي في الأهداب والأسواط بين الديدان TCBZ-S و -R. نظرًا لاستخدام تسلسل RNA الكلي للديدان، لم نتمكن من تحديد ما إذا كانت هذه الاختلافات في وفرة النسخ ناتجة عن تغييرات في تعبير الجينات و/أو تكوين نوع الخلية بين الديدان TCBZ-S و -R. بالنظر إلى أن الميكروتوبولات الإكسونيمالية توجد في الحيوانات المنوية وخلايا اللهب الإخراجية. ، يمكن أن تكون الفروق في النسخ التي لاحظناها
تشير إلى الفروق في تطور الأعضاء أو الوظائف بين الديدان TCBZ-S و -R. يمكن أن توفر الدراسات النسيجية الإضافية أو تحليل تسلسل RNA أحادي الخلية معلومات إضافية لدعم هذا التفسير. اعتبار آخر حاسم عند مقارنة النسخ الجينية للديدان TCBZ-S و TCBZ-R غير المعالجة هو التأثير المحتمل لتنوع الخلفية الجينية. يمكن أن تؤدي الفروق في الخلفية الجينية، غير المرتبطة بظاهرة المقاومة، إلى تشويش الفروق النسخية الملحوظة بين الديدان TCBZ-S و TCBZ-R. لمعالجة ذلك، سيكون من الضروري إجراء تجارب مع ديدان إضافية من مجموعة من الخلفيات الجينية لتحديد الفروق النسخية المرتبطة بشكل خاص بظاهرة المقاومة.
تمت ملاحظة فرق كبير بين ديدان TCBZ-S و -R في عدد الجينات المعبر عنها بشكل مختلف استجابةً لعلاج الدواء (190 جينًا في ديدان TCBZ-S و 0 في ديدان TCBZ-R). وهذا يعكس التأثيرات المختلفة لـ TCBZ على ديدان TCBZ-S و TCBZ-R التي تم الإبلاغ عنها في دراسات هيستولوجية سابقة. ويشير إلى أن اختبار حساسية TCBZ لدينا قد التقط بشكل فعال التباين في نمط المقاومة بين الديدان الطفيلية المجمعة من السكان المتناظرين. كانت ميزة ملحوظة في ملف استجابة الدواء في الديدان الطفيلية TCBZ-S هي القمع المتزامن لنسخ التوبولين. لقد لوحظ هذا النمط خلال زعزعة استقرار الأنابيب الدقيقة التي تسببها الكومبريتاستين A-4 (CA4)، والذي يرتبط بالتوبولين في موقع الكولشيسين. تم إظهار أن التغيرات في وفرة نسخ التوبولين التي تسببها CA4 كانت متوسطة بواسطة التنظيم الذاتي للتوبولين (الذي يحدث على مستوى استقرار mRNA)، والذي تم تنظيمه بواسطة نشاط PI3K من خلال التغيرات في استقرار الأنابيب الدقيقة وتركيز ثنائي التوبولين القابل للذوبان. . بالإضافة إلى ذلك، كان الجين الأكثر تعبيرًا بشكل مفرط في الديدان الطفيلية المقاومة لـ TCBZ مقارنة بالديدان الطفيلية الحساسة لـ TCBZ هو IQGAP الذي يدمج إشارات EGFR ويربط EGFR بإشارات PI3K/AKT-mTOR. ، مما يشير إلى أن TCBZ-R من المحتمل أن يكون مرتبطًا بالاختلافات في نشاط مسار EGFR-PI3K. لقد أظهرت الدراسات أن التغيرات في نشاط PI3K يمكن أن تؤثر على ديناميات التوبولين وتمنح مقاومة للأدوية المستهدفة للميكروتوبولات. .
قمنا بمقارنة مواقع المرشحين لدينا بتلك التي تم تحديدها في دراسة سكانية حديثة في المملكة المتحدة لـ F. hepatica بواسطة بيزلي وزملائه. كانت التوقيعات الجينية لاختيار TCBZ مميزة في كل مجموعة سكانية دون تداخل في هدف الاختيار، مما يشير إلى أن TCBZ-R تطورت بشكل مستقل في هذه المجموعات السكانية باستخدام مجموعات مختلفة من الأليلات التكيفية. عندما تكون هناك نوع ذو نطاق واسع من التوزيع، مثل . الهيباتيكا، تواجه ضغط اختيار جديد شائع، قد يتطلب التكيف عبر النطاق الكامل أصولًا مستقلة للأليل التكيفي في مناطق جغرافية مختلفة إذا لم يكن من المتوقع حدوث تبادل جيني بينها. . منذ التقرير الأول عن TCBZ-R في F. hepatica في أستراليا تم الآن إثبات TCBZ-R في ما لا يقل عن 30 عقارًا في 11 دولة أو منطقة حول العالم لقد فشلت التقارير السابقة عن التمايز الجيني بين الديدان الطفيلية القابلة للإصابة والمقاومة في أن تتكرر في الدراسات اللاحقة على سلالات جغرافية أو جينية متنوعة. على الرغم من أن هذه التناقضات قد تكون ناتجة عن قيود كل دراسة فردية (مثل حجم العينة المحدود، نقص في تصنيف الظواهر بشكل قوي، إلخ)، تشير بياناتنا إلى أن مقاومة TCBZ-R يمكن أن تنشأ بشكل مستقل في مجموعات مختلفة باستخدام أليلات تكيفية مختلفة، مما يجعل من الصعب تحديد العلامات الجينية المرتبطة بـ TCBZ-R التي تعمل بشكل متسق عبر المجموعات. كما تم وصف أصول مستقلة متعددة لمقاومة الأدوية المضادة للطفيليات من نوع البنزيميدازول في الديدان الطفيلية، على الرغم من أنها تتميز بحدوث طفرات متكررة في مجموعة محدودة من الأليلات المقاومة في بيتا-توبولين. .
تشير بياناتنا إلى أن جينات وأليلات مختلفة من المحتمل أن تساهم في مقاومة TCBZ-R في بيرو والمملكة المتحدة من ف. هيباتيكا. ومع ذلك، هناك احتمال أن يكون هناك مسار مشترك يدعم نمط المقاومة في كلا السكان. أشار Beesley وآخرون إلى جينات في عائلة Ras الفائقة، بروتين Ras المرتبط 1 (RAP1؛ maker-scaffold10x_157_pilon-snap-gene-0.182)، وعامل ADP-ribosylation من الفئة II (ARF4/5؛ maker-scaffold10x_157_pilon-snap-gene-0.197) كمرشحين رئيسيين تحت الاختيار، على الرغم من أنه لم يكن بالإمكان تحديد الجين الرئيسي ذو التأثير الكبير.
تم تحديده بسبب LD الممتد بين الجينات الموجودة على الموقع. لقد أظهر ARF4 أنه يتفاعل مع EGFR، مما يؤدي إلى تنشيط الفوسفوليباز D2. لتنظيم التعديلات ما بعد الترجمة للميكروتوبولات (أسيتيل كولاجين التوبولين وإزالة التيروزين) والاستقرار وكذلك لقمع الاستماتة يمكن لجزيء GTPase الصغير Rap1 الارتباط والتحكم في نشاط PI3K و TORC2 وتفعيل مسار AKT-mTOR . هذا يشير إلى أن التعديلات في مسار EGFR-PI3K/AKT-mTOR قد تلعب دورًا في نمط المقاومة في كل من المملكة المتحدة وبيرو تجمعات F. hepatica، على الرغم من التباين بين المواقع المختارة؛ وهو ملاحظة تستدعي مزيدًا من التحقيق. ستساعد الدراسات الآلية التي تستخدم عينة أوسع من الطفيليات عبر نطاق مكاني أكبر، سواء داخل الدولتين أو خارجها، في توضيح ما إذا كان هناك آلية على مستوى المسار المشترك تدفع مقاومة TCBZ في F. hepatica. علاوة على ذلك، ستكون هذه الدراسات المتابعة قيمة في تعزيز استنتاجاتنا وإظهار أن الاختلافات الملحوظة في توقيعات اختيار TCBZ ليست مجرد آثار ناتجة عن الأساليب التجريبية المختلفة المستخدمة في كل دراسة، والتي تختلف بشكل كبير في قوتها وقيودها. حدد Beesley وآخرون موقعًا مرتبطًا بمقاومة TCBZ باستخدام تحليل الفصائل المجمعة لعينات الحمض النووي المجمعة التي تم جمعها قبل وبعد العلاج. بينما مكنت هذه الطريقة واستفادت من التوصيف الظاهري في الجسم الحي (على عكس الاختبار في المختبر المستخدم في دراستنا)، فقد قيدت اكتشاف الأليلات المساهمة في مقاومة TCBZ لتلك الموجودة في دودة واحدة مقاومة، تم اختيارها كخط أبوي لمجموعة رسم F2، ولثلاثة تجمعات مكررة من البيض. كل واحد) من مزرعة واحدة.
باستخدام مجموعة من علامات SNP المعلوماتية التي تظهر ترددات أليلات مختلفة بين الديدان TCBZ-S و TCBZ-R، اختبرنا ما إذا كان من الممكن التنبؤ بظاهرة حساسية TCBZ بناءً على جينوم الطفيل. باستخدام DAPC مع بيانات WGS، كانت دقة التصنيف تزيد عن تم الحصول عليه مع SNPs، مما يشير إلى أنه سيكون من الممكن التمييز بين الطفيليات TCBZ-S و -R باستخدام لوحة SNP تعتمد على أساليب تحديد الجينات المستهدفة، مثل تسلسل الأمبليكون أو طرق أخرى فعالة من حيث التكلفة. لاختبار جدوى تصنيف النمط الظاهري القائم على SNP، قمنا بإنشاء نموذج DAPC باستخدام مجموعة عينات مستقلة من 152 عينة من الديدان الكبدية البالغة (78 TCBZ-S و74 TCBZ-R) تم تحديد جيناتها بواسطة تسلسل الأمبليكون. باستخدام 30 SNP الأكثر معلوماتية (التي تم تحديدها بشكل مستقل بواسطة تعلم الآلة Random Forest)، كان من الممكن تحقيق دقة توقع على الرغم من أن مجموعة علامات SNP ستستفيد من مزيد من التحسين لتحقيق أقصى قدر من المعلوماتية وتحتاج إلى التحقق من صحتها من خلال الاختبار على مجموعات عينات مستقلة إضافية، بما في ذلك تلك التي تحتوي على مستويات متوسطة من TCBZ-R لتأكيد قدرتها التنبؤية، فإن عملنا يظهر الإمكانية لتطوير أداة مراقبة قائمة على الجينات لـ TCBZ-R. ومع ذلك، بالنظر إلى أن المواقع تحت اختيار TCBZ قد تختلف بين السكان، كما لوحظ بين سكان بيرو والمملكة المتحدة، قد تحتاج لوحات SNP الخاصة بالسكان إلى التطوير لتحقيق توقع دقيق. ومع ذلك، ستوفر أدوات التشخيص الجزيئي لـ TCBZ-R رؤى قيمة حول العوامل التي تدفع ظهور وانتشار المقاومة، مما يدعم إنشاء استراتيجيات فعالة لإدارة TCBZ وتمكين اتخاذ قرارات سياسة دوائية أكثر استنارة.
في الختام، تحليلنا الشامل للجينوم في الحقل توفر بيانات تجمعات . hepatica دليلًا على أن TCBZ-R له أصول مستقلة في تجمعات جغرافية مختلفة، ويدعم الجهود المبذولة لتطوير أدوات مراقبة قائمة على علم الوراثة، ويضع الأساس للدراسات المستقبلية للتحقيق في العلاقة السببية بين نشاط مسار EGFR/PI3K/AKT-mTOR-S6K، والتعديلات ما بعد الترجمة/استقرار الأنابيب الدقيقة، وبقاء الطفيل بعد التعرض لـ TCBZ.

طرق

الحصول على الطفيليات وتسلسل الجينوم الكامل

تمت الموافقة على جميع الأعمال المتعلقة بالحيوانات من قبل لجنة الأخلاقيات المؤسسية لاستخدام الحيوانات في جامعة بيرو كايتانو هيريديا (CIEA).
بروتوكول 104472) ولجنة رعاية واستخدام الحيوانات المؤسسية في فرع جامعة تكساس الطبية (بروتوكول IACUC 1907062). تم جمع طفيليات F. hepatica البالغة من الماشية المصابة بشكل طبيعي في المسالخ في منطقة كوسكو في بيرو (الارتفاع تم تعريض الطفيليات لمادة تريكلابندازول سلفوكسيد (TCBZ-SO) (سيغما-ألدريتش، سانت لويس، ميزوري) لتحديد حساسيتها للدواء كما تم وصفه سابقًا. باختصار، الطفيليات التي تقيس تم جمعها من شجرة القناة الصفراوية لأكباد الماشية التي تم إدانتها في المسالخ. تم نقل الطفيليات في وسط RPMI 1640 الدافئ (سيغما-ألدريتش، سانت لويس، ميزوري) معززة بالمضادات الحيوية – مضادات الفطريات (100 وحدة من البنسلين، من الستربتوميسين، و أمفوتيريسين ب، جيبكو، كارلسباد، كاليفورنيا)، وغسل 5 مرات بمحلول ملحي عادي في عند الوصول إلى المختبر. تم اختيار ما يصل إلى 24 طفيليًا متحركًا بالكامل من نفس الكبد بشكل عشوائي لـ الحضانة في أطباق 12 بئرًا، كل منها يحتوي على 3 مل من RPMI 1640 المضاف إليه مضاد حيوي ومضاد للفطريات مصل الجنين البقري (بيوويست، ريفرسايد، ميزوري) عند تم جمع البيض الذي تنتجه هذه الطفيليات خلال فترة الحضانة وتخزينه بشكل فردي لتجارب إصابة الحلزونات. بعد فترة الحضانة، تم اختيار اثني عشر دودة من كل كبد تعتبر قابلة للحياة بالكامل باستخدام درجة الحركة بشكل عشوائي للتعرض لـ TCBZ-SO. تم تعريض أربعة من هذه الطفيليات لظروف قابلة للإصابة، وتم تعريض أربعة لظروف مقاومة، واستخدم أربعة كضوابط دون تعرض. لتعريف النمط الظاهري القابل للإصابة، تم تعريض الطفيليات لـ TCBZ-SO عند لمدة 12 ساعة وتمت مراقبتها لمدة 48 ساعة لتقييم حركتها. أولئك الذين حصلوا على درجة حركة 0 أو خلال فترة المراقبة اعتُبروا عرضة لتعريف النمط الظاهري المقاوم، تم حضن الطفيليات في TCBZ-SO عند لمدة 24 ساعة وتمت ملاحظتها لمدة 72 ساعة لتقييم حركتها. تم اعتبار تلك التي حصلت على درجة حركة 2 أو 3 بعد فترة الملاحظة مقاومة. تم غسل الطفيليات الموصوفة ظاهريًا ثلاث مرات وتجميدها عند حتى يتم المعالجة الإضافية. تم اعتبار جميع الطفيليات الأخرى ذات قابلية غير محددة لـ TCBZ-SO وتم التخلص منها. تم الحصول على الحمض النووي الجيني من العينات المجمدة تم عزل طفيليات . hepatica باستخدام طريقة الفينول-كلوروفورم تم تكسير الأنسجة الطفيلية بالكامل يدويًا وخلطها في محلول التحلل (10 مللي مول من تريس-هيدروكلوريد pH 7.5، 10 مللي مول من EDTA) ) ، -ميركابتوإيثانول (ميلليبور-سيغما، برلنغتون، ماساتشوستس)، و بروتياز K بحجم نهائي من تم تحضين المستحلب في بين عشية وضحاها. بعد الحضانة، تم إضافة محلول الفينول-فينول-كلوروفورم-كحول الإيزوأميل (25:24:1) (ميلليبور-سيغما، برلنغتون، ماساتشوستس) إلى المستحلب وتم الطرد المركزي عند لمدة 5 دقائق. تم نقل الطور المائي إلى أنبوب جديد، تم إضافة الإيزوبروبانول، ثم خلطه، وبعد ذلك تم الطرد المركزي عند لمدة 15 دقيقة لترسيب الحمض النووي. تم غسل راسب الحمض النووي ثلاث مرات بـ إيثانول بدرجة جزيئية ثم أعيد تعليقها بـ من ماء خالٍ من DNAase. تم تقييم جودة وتركيز الحمض النووي باستخدام الطيف الضوئي بواسطة جهاز NanoDrop 2000 (ويلمنجتون، ديلاوير، الولايات المتحدة)، وتم تخزين العينات في تم ترسيب الحمض النووي في أسيتات الصوديوم والكحول المطلق، وتجفيفه في الهواء، وشحنه إلى معهد ماكدونيل لجينوم جامعة واشنطن في سانت لويس لتسلسل الجينوم. لإزالة الملح، تم إعادة تعليق راسب الحمض النووي في من الإيثانول، ثم تم الطرد المركزي عند في لمدة 5 دقائق على الأقل. بعد إزالة الطور العلوي، تم تجفيف راسب الحمض النووي في الهواء وإعادة تعليقه في محلول EB. تم إنشاء مكتبة Kapa Hyper خالية من PCR من عينات الحمض النووي وتم تسلسلها على منصة NovaSeq من إلومينا باستخدام قراءات مزدوجة النهاية.

تحليلات مسح المتغيرات والاختيار على مستوى الجينوم

تم تقليم قراءات التسلسل باستخدام أداة تريموماتيك لإزالة المحولات/الجودة. وتم محاذاته ضد التجميع المرجعي المشترك لـ جينومات الهيباتيكا النووية، الميتوكوندريا، والنيروكيتسيا (رقم الوصول في GenBank: GCA_900302435، NC_002546 و NZ_LNGI01000001) باستخدام BWA v0.7.17 تمت إزالة القراءات المكررة، وقراءة النوكليوتيد المفرد
تم استدعاء المتغيرات (SNPs) باستخدام GATK v4.2.2 تم تطبيق مجموعة الفلاتر الخاصة بالجودة التالية للحصول على استدعاءات جينية عالية الثقة في GATK: ; ; -12.5; ReadPosRankSum <-8; DP > ( عمق الوسيط تمت توضيح المتغيرات وفقًا لمواقعها الجينومية والتأثيرات المشفرة المتوقعة باستخدام SnpEff v5.0c تمت مراجعة نماذج الجينات للجينات المرشحة يدويًا لضمان دقة توضيح المتغيرات والتأثيرات المشفرة المتوقعة (الملاحظة التكميلية 1). تم تحديد المناطق الجينومية التي تظهر تغييرات في عدد النسخ (CNVs) باستخدام CNVcaller. ، وتم استبعاد SNPs التي تتداخل مع مناطق CNV المكررة التي تحتوي على عدد نسخ >2 من التحليل اللاحق. ولإزالة الاستدعاءات الإيجابية الكاذبة بشكل أكبر، تم تطبيق تصفية تعتمد على اختبار هاردي-واينبرغ الدقيق مع حد القيمة لـ . مواقع مع الأنماط الجينية المفقودة أو تمت إزالة تردد الأليل الثانوي قبل تحليل التحجيم متعدد الأبعاد (MDS) وتحليل الارتباط. تم إجراء MDS باستخدام مجموعة فرعية من SNPs بعد التنظيف بناءً على LD باستخدام PLINK v1.9 مع المعلمات التالية: حجم نافذة 100 متغير، حجم خطوة 5، وعامل تضخم التباين من تم إجراء تحليل القرابة لتحديد العينات المرتبطة ارتباطًا وثيقًا، بما في ذلك الأقران المتطابقين، باستخدام طريقة KING. تم تنفيذها في AKT v0.3.3 معاملات التزاوج الداخلي ) تم حسابها في PLINK v1.9 لتحديد العينات ذات التغايرية المفرطة، والتي من المحتمل أن تشير إلى تلوث العينات أو الكروموسومات غير ثنائية الصيغة الصبغية. تم إجراء تحليل تدهور الارتباط باستخدام PopLDdecay v3.42 مؤشر التركيز لرايت تم تقدير ) بين مجموعات TCBZ-S و TCBZ-R لكل SNP فردي في PLINK v1.9 ، وتم تطبيق طريقة النافذة المنزلقة لتحديد المناطق الجينومية ذات مستويات مرتفعة من التمايز باستخدام حزمة GenWin الإصدار 0.1 في تم تحديد حدود النافذة بناءً على نقاط الانعطاف لخط انسيابي مكعب تم ملاءمته لـ تقديرات للمتغيرات الفردية. تم إجراء التحليل باستخدام معامل التنعيم 1000، الذي يتحكم في مدى قوة دمج المعلومات عبر نوافذ العلامات المجاورة. تم حساب قيمة كل نافذة جينومية بناءً على كل من حجم الـ التقديرات وعدد المتغيرات المرتبطة (أي طول كتلة الهبلاي) وتم استخدامه لتحديد المناطق الجينومية الشاذة. التوزيع الصفري لـ تم تقديره عن طريق تبديل تسميات النمط الظاهري 20,000 مرة، وبيانات تجريبية تم اشتقاق القيم لكل نافذة جينومية لتوفير دعم إحصائي (الملاحظة التكميلية 2). لمساعدة في تفسير النتائج، تم توضيح الجينات المشفرة للبروتين باستخدام نتائج من InterProScan v5.59. لتحديد علم الوراثة الجيني تصنيفات ومجالات الوظائف InterPro , وBlastKOALA v2.3 لتعيين KEGG التعليقات التوضيحية. تم إجراء تعليق إضافي باستخدام PANNZER2 , Sma3s v2 , eggNOG6.0 , وقاعدة بيانات STRING v12.0 .

توليد TCBZ-S و -R ميتا سيركاريا

تم جمع بيض الفاسيولا الذي أنتجته الطفيليات البالغة خلال 48 ساعة من الحضانة قبل التعرض للعلاج وتصنيفه كـ TCBZ-S أو TCBZ-R وفقًا لنتائج تجارب التعرض للعلاج على الآباء البالغين. تم غسل مجموعات البيض من نفس الطفيلي في محلول ملحي عادي، وإعادة تعليقها في ماء مقطر، وحضانتها معًا في ظلام كامل عند لمدة أسبوعين كما هو موصوف سابقًا . بعد الحضانة، تم تعريض البيض لمصدر ضوء مباشر لمدة ساعة واحدة لتحفيز الفقس. تم استخدام الميراسيديا التي ظهرت من نفس مجموعة البيض لإصابة مستعمرات الحلزونات من الجيل الثاني المحتفظ بها في المختبر لهذه التجارب. تم وضع ميراسيدين يخرجان من نفس المجموعة الموصوفة ظاهريًا من البيض في بئر من لوحة 96 بئرًا بحضور حلزون واحد. تم تأكيد إصابات الحلزونات بواسطة المجهر، وتم إنشاء مجموعات من الحلزونات المصابة بميراسيديا تخرج من نفس مجموعة البيض. تم الاحتفاظ بكل مجموعة من الحلزونات في نفس الحاوية في المختبر، وتم إطعامها بحرية، وتم تعريضها لدورات ضوء وظلام لمدة 12 ساعة. بعد 55 يومًا، تم وضع مجموعات من 10 حلزونات من نفس المجموعة داخل كيس بلاستيكي يحتوي على ماء مبرد وتم تعريضها لمصدر ضوء مباشر لمدة إجمالية قدرها 60 دقيقة لتحفيز إطلاق السيركاريا. تم جمع الميتا سيركاريا الملتصقة
داخل الكيس البلاستيكي من نفس مجموعة الحلزونات المعروفة بحساسيتها لـ TCBZ وتم الاحتفاظ بها في الماء عند حتى يتم استخدامها.

توليد طفيليات TCBZ-S و -R البالغة . هيفاتيكا

استخدمنا نموذج الأرنب للإصابة بالفاسيولا للحصول على طفيليات بالغة من الجيل الأول من الديدان الكبدية الأبوية ذات النمط الظاهري المعروف لحساسية TCBZ . اشترينا أرنبًا كاليفورنيًا يزن من بائع محلي في منطقة غير متوطنة في بيرو. تم إحضار الأرانب إلى منشأة رعاية الحيوانات في جامعة بيرو كاييتانو هيريديا وتم الاحتفاظ بها في أقفاص فردية مع ماء مُصفى وعلف جاف بحرية. عند الوصول، كانت جميع الحيوانات قد اختبرت سلبية للإصابة بالفاسيولا ثلاث مرات باستخدام المجهر على عينات البراز المجمعة في أيام متتالية وتم علاجها بـ toltrazuril/fenbendazole/praziquantel للقضاء على أي إصابات ديدان أخرى محتملة . بعد أسبوعين، تم إصابة الأرانب عن طريق الفم بمجموعات من 40 ميتا سيركاريا TCBZ-S أو TCBZ-R. تم تشكيل كل مجموعة من الميتا سيركاريا عن طريق جمع 20 ميتا سيركاريا من مجموعتين مختلفتين من الحلزونات بنفس ملف حساسية TCBZ. في هذه الدراسة، تم إصابة أرنب ذكر واحد بمجموعة من ميتا سيركاريا TCBZ-S، وتم إصابة أرنب ذكر واحد بمجموعة من ميتا سيركاريا TCBZ-R التي تم إنتاجها من البيض والحلزونات المجمعة في منطقة كوسكو. قمنا باختبار عينات براز الأرانب الفردية يوميًا للبيض الفاسيولا باستخدام المجهر بدءًا من اليوم 15 بعد الإصابة واستمرينا في الاختبار حتى بدأ كلا الأرنبين في إخراج البيض وبلغ متوسط عدد البيض على مدى ثلاثة أيام حالة مستقرة. بعد أسبوعين من الوصول إلى متوسط عدد البيض المستقر (اليوم 84 بعد الإصابة)، قمنا بقتل الأرانب وتشريح كبدها على الفور للحصول على طفيليات بالغة . هيفاتيكا من قنوات الصفراء. تم غسل الطفيليات على الفور في محلول ملحي دافئ وتم وضعها بشكل فردي في بئر من لوحة 12 بئر تحتوي على RPMI 1640 مُكمل بمضاد حيوي ومضاد للفطريات و مصل جنيني من العجول وتم حضانتها لمدة 48 ساعة عند . تم تجميع الديدان الكبدية البالغة التي تم الحصول عليها حديثًا وفقًا لحساسية TCBZ لأسلافها الموصوفة ظاهريًا واستخدامها في تجارب التعرض لـ TCBZ في أوقات وتركيزات مختلفة.

تجارب التعرض لـ Triclabendazole وتحليل التعبير الجيني باستخدام RNA-seq

تم فصل الطفيليات البالغة المتحركة تمامًا التي تم الحصول عليها من إصابات الأرانب إلى مجموعتين وفقًا لـ TCBZ-S ( ) أو TCBZ الخصائص (الشكل التكميلي 4). تم تعريض الطفيليات لتركيزات دون قاتلة من TCBZ-SO لفترات زمنية مختلفة لتقييم الاستجابات التعبيرية المرتبطة بالتعرض للعلاج. تم تعريض الطفيليات في كل مجموعة لتركيزات TCBZ-SO من أو لمدة 2 أو 6 ساعات. تم تضمين اثنين (TCBZ-S) أو ثلاثة (TCBZ-R) من الضوابط التي لم تتعرض لـ TCBZ-SO اعتمادًا على توفر الطفيليات مع كل وقت تعرض وتم جمعها في الأوقات صفر (قبل التعرض)، 2، و6 ساعات. عندما سمح عدد الطفيليات بذلك، تم تكرار كل حالة تجريبية ثلاث مرات. تم جمع الطفيليات بشكل منفصل في كل نقطة زمنية، وغسلها في PBS (Corning، Manassas، VA)، وحفظها في RNAlater (Invitrogen، Carlsbad، CA)، وتجميدها عند . تم إجراء استخراج RNA من أنسجة الطفيليات باستخدام بروتوكول يجمع بين TRIzol (Invitrogen، Carlsbad، CA) وHiBind أعمدة RNA Spin (Omega Bio-Tek، Norcross، GA) كما هو موصوف سابقًا مع التعديلات التالية . تم وضع كل طفيلي في أنبوب Falcon سعة 50 مل يحتوي على 7.5 مل من TRIzol و1 مل من -ميركابتوإيثانول، وتم تدميره ميكانيكيًا، وتم حضانته لمدة 5 دقائق في درجة حرارة الغرفة. في نهاية الحضانة، تمت إضافة 1.5 مل من الكلوروفورم من الدرجة الجزيئية (Sigma-Aldrich، St. Louis، MO)، وتم هز الأنبوب بقوة لمدة 15 ثانية، وتم الطرد المركزي عند عند لمدة 15 دقيقة. تم نقل الطور المائي المتكون في الأنبوب إلى أنبوب سعة 5 مل خالي من RNAse، وتم إضافة 2.5 مل من الإيثانول البارد 70% إلى العينة وهزها بقوة لمدة 15 ثانية. تم نقل سبعمائة ميكرولتر من هذا المحلول، بما في ذلك أي راسب، إلى أعمدة HiBind RNA Spin
وتم الطرد المركزي عند لمدة 5 دقائق. تم تكرار هذه الخطوة حتى تم تمرير كل المحلول عبر العمود. ثم، تم غسل RNA بإضافة من الإيثانول البارد إلى العمود وطردها مركزيًا عند لمدة 5 دقائق لمجموع ثلاث دورات. تم تجفيف الأعمدة السيليكا بالطرد المركزي عند لمدة دقيقة واحدة، وتم استرداد RNA في من الماء الخالي من النوكلياز وتم تخزينه عند . قبل الشحن إلى معهد جينوم ماكدونيل بجامعة واشنطن في سانت لويس للتسلسل RNA، تم نقل عينات RNA إلى أنابيب GenTegra-RNA Screw Cap (GenTegra، Pleasanton، CA) وفقًا لتعليمات الشركة المصنعة. تم إعادة تكوين RNA في الماء الخالي من النوكلياز، وتم تقييم الجودة باستخدام Bioanalyzer. تم بناء مكتبة RNA منخفضة الإدخال العالمية SMARTer من Clontech وتم تسلسلها على منصة NovaSeq من Illumina باستخدام قراءات مزدوجة النهاية. تم تقليم قراءات التسلسل باستخدام trimmomatic v0.39 ثم تم تعيينها إلى جينوم F. hepatica (رقم الوصول GenBank: GCA_900302435) باستخدام HISAT2 v2.2.1 . تم تقدير الكميات المجمعة (أزواج القراءة) باستخدام featureCounts v2.0.3 ، وتم حساب قيم التعبير الجيني النسبية (القطع لكل كيلوباز لكل مليون قراءة تم تعيينها للجينات، FPKM). تم استخدام DESeq2 v1.38.3 لإجراء تحليل التعبير الجيني التفاضلي باستخدام عدد القطع الخام لكل جين لكل عينة، مع عتبة قيمة FDR المعدلة 0.001 وحد أدنى من التغير في الطي 2. تم مقارنة الديدان الكبدية غير المعالجة TCBZ-S و -R مع بعضها البعض لتحديد الفروق التعبيرية الأساسية. بالإضافة إلى ذلك، تم مقارنة الديدان الكبدية المعالجة بـ TCBZ مع الضوابط غير المعالجة، بشكل مستقل للديدان الكبدية TCBZ-S و -R للتحقيق في استجابة العلاج. تم التعامل مع وقت التعرض وتركيز الدواء كآثار دفعة. تم إجراء تحليل إثراء مجموعة الجينات باستخدام أداة التحليل الإحصائي Over-Representation Analysis (ORA) المقدمة في WebGestalt v2019 ، باستخدام (i) KEGG التعليقات التوضيحية، (ii) تعليقات مجالات InterPro ، و(iii) تعيينات الأنسجة بناءً على . نتائج أفضل ضربة متبادلة لـ mansoni (BLAST 2.12.0+) وتحليل scRNA-seq السابق . تم استخدام GOstats v2.64.0 لإجراء تحليل إثراء وظيفي بناءً على تعليقات Gene Ontology . تم تصحيح جميع النتائج المهمة لـ FDR لعدد الاختبارات التي تم إجراؤها وطلبت حدًا أدنى من 3 جينات تمثل فئة/مسار. تم استخدام REVIGO لتلخيص قوائم مصطلحات Gene Ontology للتصور.

تصميم لوحة الأمبليكون والتسلسل المستهدف (amplicon-seq)

تم تطوير لوحة الأمبليكون المخصصة xGen (IDT، كورالفيل، آيوا) بناءً على أفضل 300 متغير فهرسي (تم تحديدها كما هو موضح في القسم التالي) (البيانات التكميلية 9). عندما لم يكن من الممكن تصميم بادئات لمتغير فهرسي SNP، تم تصميم بادئات لاستهداف متغير SNP بديل مرتبط بالمتغير الفهرسي. تم استخدام مجموعة xGen Amplicon Core Kit (IDT، كورالفيل، آيوا) لإعداد مكتبات الأمبليكون لتسلسل إيلومينا، وفقًا لبروتوكول الشركة المصنعة. تم تسلسل المكتبات على منصة NovaSeq الخاصة بإيلومينا باستخدام قراءات نهاية مزدوجة. باستخدام ثمانية عينات من الحمض النووي الجيني لفاسيولا، تم تقييم أداء لوحة الأمبليكون، وتمت إزالة أزواج البرايمر التي أدت إلى كميات أكبر من المنتجات غير المستهدفة من اللوحة (البيانات التكميلية 10). تم استخدام لوحة الأمبليكون النهائية المعدلة (IDT xGen custom amplicon panel cp727)، التي تستهدف 289 موقع SNP، في تجارب التوصيف الجيني اللاحقة مع مجموعة مستقلة من 80 عينة TCBZ-S و80 عينة TCBZ-R. تم تنفيذ تقليم الموصل، ومحاذاة المرجع، واستدعاء المتغيرات كما هو موصوف لعينات تسلسل الجينوم الكامل، باستثناء أن GATK v4.2.2 تم تشغيله فقط على الفترات الجينومية التي تتوافق مع مواقع الهدف للأمبليكون، ولم يتم تطبيق فلتر عمق الحد الأقصى (DP) خلال خطوة تصفية المتغيرات. تم حساب إحصائيات التغطية لكل عينة باستخدام Picard v2.26.2 (CollectTargetedPcrMetrics). تم تقييم دقة تحديد النمط الجيني لتسلسل الأمبليكون لكل موضع مستهدف من خلال مقارنة استدعاءات النمط الجيني مع تلك المستمدة من بيانات تسلسل الجينوم الكامل باستخدام 10 عينات تكرارية (أي، نفس عينات الحمض النووي التي تم تحديد نمطها الجيني باستخدام كل من تسلسل الجينوم الكامل وتتابع الأمبليكون). المواضع التي تحتوي على توافق النمط الجيني و معدلات المكالمات المفقودة ( ) تم استخدامها لتحليل التمييز. لتحديد و
استبعاد الأفراد المتشابهين في النسخ والأفراد المرتبطين ارتباطًا وثيقًا من عينات تسلسل الأمبليكون، PLINK v1.9 تم استخدام (–rel-cutoff) للتقليم القائم على العلاقات مع قيمة قطع قصوى تبلغ 0.7، مما أسفر عن مجموعة نهائية من 152 عينة من الديدان (78 TCBZ-S و74 TCBZ-R)، مع إزالة 8 عينات.

تمييز نمط حساسية TCBZ باستخدام مجموعة من علامات SNP

تحليل التمييز للمكونات الرئيسية (DAPC; adegenet v2.1.10) تم استخدامه لاختبار ما إذا كان من الممكن تصنيف الظواهر باستخدام مجموعة من علامات SNP. لتحديد العلامات المفيدة، تم إجراء تحليل ارتباط الأليل النمط الظاهري (اختبار فيشر الدقيق مع تعديل منتصف لانكستر) والتجميع القائم على LD باستخدام PLINK v1.9. . نهج التجميع جمع المتغيرات المرتبطة بالنمط الظاهري بحيث تم تجميع المواقع المهمة ( القيمة < 0.0001) ضمن 250 كيلوبايت من متغير الفهرس التمثيلي (الأكثر أهمية) تم تعيينها إلى مجموعة هذا المتغير الفهرسي، نظرًا لأنهم كان المؤشر أكبر من 0.5 (البيانات التكميلية 9). تم استخدام قائمة مرتبة من أفضل 300 متغير مؤشر لتحليل DAPC لعينات WGS، وتم تقييم دقة التصنيف (إعادة تعيين الأفراد بنجاح إلى مجموعة فينوتيب الخاصة بهم) كدالة لعدد SNPs الأعلى المستخدمة. تصنيف DAPC لعينات ampliconseq تم تنفيذ ذلك باستخدام 30 من أكثر SNPs معلوماتية، تم اختيارها بناءً على قيم متوسط انخفاض الدقة (MDA) من طريقة التعلم الآلي Random Forest. تم تنفيذها في حزمة randomForest الإصدار 4.7-1.1 ، مع 10,000 شجرة وتقييم خارج الحقيبة (OOB) (البيانات التكميلية 10). تم إجراء تحليل التحقق المتقاطع لتقدير دقة التصنيف عند استخدام نموذج DAPC لإجراء التنبؤات على البيانات غير المدرجة في مجموعة التدريب. باستخدام دالة xvalDapc من حزمة adegenet الإصدار 2.1.10 قمنا بتنفيذ تقنية التحقق المتقاطع بإزالة أزواج العطلات مع 1000 إعادة أخذ عينة مصنفة، مما يضمن أن كل مجموعة اختبار تتضمن عينات من TCBZ-S و -R. هذه التقنية للتحقق المتقاطع بإزالة p من العطلات ( ) فعّالة بشكل خاص لمجموعات البيانات الصغيرة وتوفر تقديرًا شبه غير متحيز لأداء النموذج تم حساب دقة التصنيف وأهميتها الإحصائية بناءً على اختبار ثنائي باستخدام حزمة caret الإصدار 6.0-94. . الـ تم تقدير فترات الثقة للحساسية والخصوصية باستخدام حزمة epiR الإصدار 2.0.74 تم إجراء تحليلات ROC ومنطقة تحت المنحنى (AUC) باستخدام حزمة pROC الإصدار 1.18.5 .

ملخص التقرير

معلومات إضافية حول تصميم البحث متاحة في ملخص تقارير مجموعة نيتشر المرتبط بهذه المقالة.

توفر البيانات

تم إيداع بيانات تسلسل الجينوم الكامل وبيانات تسلسل RNA وبيانات تسلسل الأمبليكون التي تم إنشاؤها في هذه الدراسة في أرشيف تسلسل NCBI تحت مشروع البيولوجيا PRJNA916254، مع إدراج عينات الوصول في البيانات التكميلية 1 و6 و10.

توفر الشيفرة

تم توفير وسائط سطر الأوامر المستخدمة في التحليل في الملاحظة التكميلية 2.

References

  1. Furst, T., Duthaler, U., Sripa, B., Utzinger, J. & Keiser, J. Trematode infections: liver and lung flukes. Infect. Dis. Clin. North Am. 26, 399-419 (2012).
  2. Caravedo, M. A. & Cabada, M. M. Human fascioliasis: current epidemiological status and strategies for diagnosis, treatment, and control. Res. Rep. Trop. Med. 11, 149-158 (2020).
  3. Charlier, J. et al. Initial assessment of the economic burden of major parasitic helminth infections to the ruminant livestock industry in Europe. Prev. Vet. Med. 182, 105103 (2020).
  4. Mehmood, K. et al. A review on epidemiology, global prevalence and economical losses of fasciolosis in ruminants. Micro. Pathog. 109, 253-262 (2017).
  5. Sanchez-Vazquez, M. J. & Lewis, F. I. Investigating the impact of fasciolosis on cattle carcase performance. Vet. Parasitol. 193, 307-311 (2013).
  6. Arenal, A. et al. Risk factors for the presence of Fasciola hepatica antibodies in bulk-milk samples and their association with milk production decreases, in Cuban dairy cattle. BMC Vet. Res. 14, 336 (2018).
  7. Schweizer, G., Braun, U., Deplazes, P. & Torgerson, P. R. Estimating the financial losses due to bovine fasciolosis in Switzerland. Vet. Rec. 157, 188-193 (2005).
  8. Lopez, M., White, A. C. Jr. & Cabada, M. M. Burden of Fasciola hepatica Infection among children from Paucartambo in Cusco, Peru. Am. J. Trop. Med. Hyg. 86, 481-485 (2012).
  9. Marcos, L. A. et al. Report of cases of human fascioliosis in the Specialized Children’s Health Institute, Lima, Peru (1988′-2003). Rev. Gastroenterol. Peru. 25, 198-205 (2005).
  10. Yentur Doni, N., Yildiz Zeyrek, F., Simsek, Z., Gurses, G. & Sahin, I. Risk factors and relationship between intestinal parasites and the growth retardation and psychomotor development delays of children in Sanliurfa, Turkey. Turkiye Parazitol. Derg. 39, 270-276 (2015).
  11. Chang Wong, M. R., Pinto Elera, J. O., Guzman Rojas, P., Terashima Iwashita, A. & Samalvides Cuba, F. Demographic and clinical aspects of hepatic fascioliasis between 2013-2010 in National Hospital Cayetano Heredia, Lima, Peru. Rev. Gastroenterol. Peru. 36, 23-28 (2016).
  12. Machicado, C., Machicado, J. D., Maco, V., Terashima, A. & Marcos, L. A. Association of fasciola hepatica infection with liver fibrosis, cirrhosis, and cancer: a systematic review. PLoS Negl. Trop. Dis 10, e0004962 (2016).
  13. Castro-Hermida, J. A., Gonzalez-Warleta, M., Martinez-Sernandez, V., Ubeira, F. M. & Mezo, M. Current challenges for fasciolicide treatment in ruminant livestock. Trends Parasitol. 37, 430-444 (2021).
  14. Kelley, J. M. et al. Current threat of triclabendazole resistance in Fasciola hepatica. Trends Parasitol. 32, 458-469 (2016).
  15. Gandhi, P. et al. Triclabendazole in the treatment of human fascioliasis: a review. Trans. R. Soc. Trop. Med. Hyg. 113, 797-804 (2019).
  16. Kamaludeen, J. et al. Lack of efficacy of triclabendazole against Fasciola hepatica is present on sheep farms in three regions of England, and Wales. Vet. Rec. 184, 502 (2019).
  17. Rose Vineer, H. et al. Increasing importance of anthelmintic resistance in European livestock: creation and meta-analysis of an open database. Parasite 27, 69 (2020).
  18. Olaechea, F., Lovera, V., Larroza, M., Raffo, F. & Cabrera, R. Resistance of Fasciola hepatica against triclabendazole in cattle in Patagonia (Argentina). Vet. Parasitol. 178, 364-366 (2011).
  19. Winkelhagen, A. J., Mank, T., de Vries, P. J. & Soetekouw, R. Apparent triclabendazole-resistant human Fasciola hepatica infection, the Netherlands. Emerg. Infect. Dis. 18, 1028-1029 (2012).
  20. Gil, L. C. et al. Resistant human fasciolasis: report of four patients. Rev. Med. Chil. 142, 1330-1333 (2014).
  21. Belgin, G. et al. Partial Hepatectomy for the Resistant Fasciola hepatica Infection in a Child. APSP J. Case Rep. 6, 27 (2015).
  22. Cabada, M. M. et al. Treatment failure after multiple courses of triclabendazole among patients with fascioliasis in cusco, peru: a case series. PLoS Negl. Trop. Dis. 10, e0004361 (2016).
  23. Branco, E. A., Ruas, R., Nuak, J. & Sarmento, A. Treatment failure after multiple courses of triclabendazole in a Portuguese patient
    with fascioliasis. BMJ Case Rep. 13, https://doi.org/10.1136/bcr-2019-232299 (2020).
  24. Morales, M. L. et al. Triclabendazole treatment failure for Fasciola hepatica Infection among preschool and school-age children, cusco, peru(1). Emerg. Infect. Dis. 27, 1850-1857 (2021).
  25. Maco, V. et al. Efficacy and tolerability of two single-day regimens of triclabendazole for fascioliasis in Peruvian children. Rev. Soc. Bras. Med. Trop. 48, 445-453 (2015).
  26. Meaney, M. et al. Increased susceptibility of a triclabendazole (TCBZ)-resistant isolate of Fasciola hepatica to TCBZ following coincubation in vitro with the P-glycoprotein inhibitor, R(+)-verapamil. Parasitology 140, 1287-1303 (2013).
  27. Robinson, M. W., Lawson, J., Trudgett, A., Hoey, E. M. & Fairweather, I. The comparative metabolism of triclabendazole sulphoxide by triclabendazole-susceptible and triclabendazoleresistant Fasciola hepatica. Parasitol. Res. 92, 205-210 (2004).
  28. Alvarez, L. I. et al. Altered drug influx/efflux and enhanced metabolic activity in triclabendazole-resistant liver flukes. Parasitology 131, 501-510 (2005).
  29. Scarcella, S., Lamenza, P., Virkel, G. & Solana, H. Expression differential of microsomal and cytosolic glutathione-S-transferases in Fasciola hepatica resistant at triclabendazole. Mol. Biochem. Parasitol. 181, 37-39 (2012).
  30. Wilkinson, R. et al. An amino acid substitution in Fasciola hepatica P-glycoprotein from triclabendazole-resistant and triclabendazole-susceptible populations. Mol. Biochem. Parasitol. 186, 69-72 (2012).
  31. Elliott, T. P. & Spithill, T. W. The T687G SNP in a P-glycoprotein gene of Fasciola hepatica is not associated with resistance to triclabendazole in two resistant Australian populations. Mol. Biochem. Parasitol. 198, 45-47 (2014).
  32. Solana, M. V. et al. Different SNPs in Fasciola hepatica P-glycoprotein from diverse Latin American populations are not associated with Triclabendazole resistance. Mol. Biochem. Parasitol. 224, 57-60 (2018).
  33. Radio, S. et al. Pleiotropic alterations in gene expression in Latin American Fasciola hepatica isolates with different susceptibility to drugs. Parasit. Vectors 11, 56 (2018).
  34. Beesley, N. J. et al. A major locus confers triclabendazole resistance in Fasciola hepatica and shows dominant inheritance. PLoS Pathog. 19, e1011081 (2023).
  35. Fernandez-Baca, M. V. et al. The differences in the susceptibility patterns to triclabendazole sulfoxide in field isolates of Fasciola hepatica are associated with geographic, seasonal, and morphometric variations. Pathogens 11, https://doi.org/10.3390/ pathogens11060625 (2022).
  36. Choi, Y. J. et al. Adaptive radiation of the flukes of the family fasciolidae inferred from genome-wide comparisons of key species. Mol. Biol. Evol. 37, 84-99 (2020).
  37. Cwiklinski, K. et al. The Fasciola hepatica genome: gene duplication and polymorphism reveals adaptation to the host environment and the capacity for rapid evolution. Genome Biol. 16, 71 (2015).
  38. McNulty, S. N. et al. Genomes of Fasciola hepatica from the Americas reveal colonization with neorickettsia endobacteria related to the agents of Potomac horse and human sennetsu fevers. PLoS Genet 13, e1006537 (2017).
  39. Morris, G. P. et al. Population genomic and genome-wide association studies of agroclimatic traits in sorghum. Proc. Natl. Acad. Sci. USA 110, 453-458 (2013).
  40. Mather, K. A. et al. The extent of linkage disequilibrium in rice (Oryza sativa L.). Genetics 177, 2223-2232 (2007).
  41. Charlesworth, D. Effects of inbreeding on the genetic diversity of populations. Philos. Trans. R Soc. Lond. B Biol. Sci. 358, 1051-1070 (2003).
  42. Beissinger, T. M., Rosa, G. J., Kaeppler, S. M., Gianola, D. & de Leon, N. Defining window-boundaries for genomic analyses using smoothing spline techniques. Genet Sel. Evol. 47, 30 (2015).
  43. Fernandez, V. et al. A single amino acid substitution in isozyme GST mu in Triclabendazole resistant Fasciola hepatica (Sligo strain) can substantially influence the manifestation of anthelmintic resistance. Exp. Parasitol. 159, 274-279 (2015).
  44. Anders, S. & Huber, W. Differential expression analysis for sequence count data. Genome Biol. 11, R106 (2010).
  45. Falcon, S. & Gentleman, R. Using GOstats to test gene lists for GO term association. Bioinformatics 23, 257-258 (2007).
  46. Nieuwenhuis, J. et al. Vasohibins encode tubulin detyrosinating activity. Science 358, 1453-1456 (2017).
  47. Vitre, B. et al. EB1 regulates microtubule dynamics and tubulin sheet closure in vitro. Nat. Cell Biol. 10, 415-421 (2008).
  48. Redeker, V. et al. Polyglycylation of tubulin: a posttranslational modification in axonemal microtubules. Science 266, 1688-1691 (1994).
  49. Thines, L., Roushar, F. J., Hedman, A. C. & Sacks, D. B. The IQGAP scaffolds: critical nodes bridging receptor activation to cellular signaling. J. Cell Biol. 222, https://doi.org/10.1083/jcb. 202205062 (2023).
  50. Canovas, B. & Nebreda, A. R. Diversity and versatility of p38 kinase signalling in health and disease. Nat. Rev. Mol. Cell Biol. 22, 346-366 (2021).
  51. Gasic, I., Boswell, S. A. & Mitchison, T. J. Tubulin mRNA stability is sensitive to change in microtubule dynamics caused by multiple physiological and toxic cues. PLoS Biol. 17, e3000225 (2019).
  52. Wendt, G. et al. A single-cell RNA-seq atlas of Schistosoma mansoni identifies a key regulator of blood feeding. Science 369, 1644-1649 (2020).
  53. Ndiaye, P. I., Miquel, J., Fons, R. A. & Marchand, B. Spermiogenesis and sperm ultrastructure of the liver fluke Fasciola hepatica L., 1758 (Digenea, Fasciolidae): transmission and scanning electron microscopy, and tubulin immunocytochemistry. Acta Parasitol. 48, 182-194 (2003).
  54. Pantelouris, E. M. & Threadgold, L. T. The excretory system of the adult Fasciola hepatica L. Cellule 64, 61-67 (1963).
  55. Jombart, T., Devillard, S. & Balloux, F. Discriminant analysis of principal components: a new method for the analysis of genetically structured populations. BMC Genet. 11, 94 (2010).
  56. Liaw, A. & Wiener, M. Classification and regression by randomForest. R. N. 2, 18-22 (2002).
  57. Fairweather, I., Brennan, G. P., Hanna, R. E. B., Robinson, M. W. & Skuce, P. J. Drug resistance in liver flukes. Int J. Parasitol. Drugs Drug Resist 12, 39-59 (2020).
  58. Hac, A., Pierzynowska, K. & Herman-Antosiewicz, A. S6K1 is indispensible for stress-induced microtubule acetylation and autophagic flux. Cells 10, https://doi.org/10.3390/ cells10040929 (2021).
  59. Eshun-Wilson, L. et al. Effects of alpha-tubulin acetylation on microtubule structure and stability. Proc. Natl. Acad. Sci. USA 116, 10366-10371 (2019).
  60. LeDizet, M. & Piperno, G. Cytoplasmic microtubules containing acetylated alpha-tubulin in Chlamydomonas reinhardtii: spatial arrangement and properties. J. Cell Biol. 103, 13-22 (1986).
  61. Wattanathamsan, O. et al. Tubulin acetylation enhances lung cancer resistance to paclitaxel-induced cell death through Mcl-1 stabilization. Cell Death Discov. 7, 67 (2021).
  62. Sfakianos, A. P. et al. The mTOR-S6 kinase pathway promotes stress granule assembly. Cell Death Differ. 25, 1766-1780 (2018).
  63. Csukasi, F. et al. The PTH/PTHrP-SIK3 pathway affects skeletogenesis through altered mTOR signaling. Sci. Transl. Med. 10, https://doi.org/10.1126/scitranslmed.aat9356 (2018).
  64. Beaman, E. M., Carter, D. R. F. & Brooks, S. A. GALNTs: master regulators of metastasis-associated epithelial-mesenchymal transition (EMT)? Glycobiology 32, 556-579 (2022).
  65. Han, J. M. & Jung, H. J. Cyclophilin A/CD147 interaction: a promising target for anticancer therapy. Int. J. Mol. Sci. 23, https:// doi.org/10.3390/ijms23169341 (2022).
  66. Ma, Z. et al. Cyclophilin A inhibits A549 cell oxidative stress and apoptosis by modulating the PI3K/Akt/mTOR signaling pathway. Biosci. Rep. 41, https://doi.org/10.1042/BSR20203219 (2021).
  67. Franke, T. F., Hornik, C. P., Segev, L., Shostak, G. A. & Sugimoto, C. PI3K/Akt and apoptosis: size matters. Oncogene 22, 8983-8998 (2003).
  68. Chemale, G. et al. Comparative proteomic analysis of triclabendazole response in the liver fluke Fasciola hepatica. J. Proteome Res. 9, 4940-4951 (2010).
  69. Lemmon, M. A. & Schlessinger, J. Cell signaling by receptor tyrosine kinases. Cell 141, 1117-1134 (2010).
  70. Cwiklinski, K., Robinson, M. W., Donnelly, S. & Dalton, J. P. Complementary transcriptomic and proteomic analyses reveal the cellular and molecular processes that drive growth and development of Fasciola hepatica in the host liver. BMC Genomics 22, 46 (2021).
  71. Walker, S. M. et al. Stage-specific differences in fecundity over the life-cycle of two characterized isolates of the liver fluke, Fasciola hepatica. Parasitology 133, 209-216 (2006).
  72. Brennan, G. P. et al. Understanding triclabendazole resistance. Exp. Mol. Pathol. 82, 104-109 (2007).
  73. Kuo, Y. W. & Howard, J. Cutting, amplifying, and aligning microtubules with severing enzymes. Trends Cell Biol. 31, 50-61 (2021).
  74. Olivares-Ferretti, P., Beltran, J. F., Salazar, L. A. & Fonseca-Salamanca, F. Protein modelling and molecular docking analysis of Fasciola hepatica beta-tubulin’s interaction sites, with triclabendazole, triclabendazole sulphoxide and triclabendazole sulphone. Acta Parasitol. 68, 535-547 (2023).
  75. Robinson, M. W., McFerran, N., Trudgett, A., Hoey, L. & Fairweather, I. A possible model of benzimidazole binding to betatubulin disclosed by invoking an inter-domain movement. J. Mol. Graph Model 23, 275-284 (2004).
  76. Bennett, J. L. & Kohler, P. Fasciola hepatica: action in vitro of triclabendazole on immature and adult stages. Exp. Parasitol. 63, 49-57 (1987).
  77. Hanna, R. Fasciola hepatica: histology of the reproductive organs and differential effects of triclabendazole on drug-sensitive and drug-resistant fluke isolates and on flukes from selected field cases. Pathogens 4, 431-456 (2015).
  78. Akhmanova, A. et al. Clasps are CLIP-115 and -170 associating proteins involved in the regional regulation of microtubule dynamics in motile fibroblasts. Cell 104, 923-935 (2001).
  79. Isakoff, S. J. et al. Breast cancer-associated PIK3CA mutations are oncogenic in mammary epithelial cells. Cancer Res. 65, 10992-11000 (2005).
  80. Ralph, P. & Coop, G. Parallel adaptation: one or many waves of advance of an advantageous allele? Genetics 186, 647-668 (2010).
  81. Overend, D. J. & Bowen, F. L. Resistance of Fasciola hepatica to triclabendazole. Aust. Vet. J. 72, 275-276 (1995).
  82. Redman, E. et al. The emergence of resistance to the benzimidazole anthlemintics in parasitic nematodes of livestock is characterised by multiple independent hard and soft selective sweeps. PLoS Negl. Trop. Dis. 9, e0003494 (2015).
  83. Kim, S. W. et al. ADP-ribosylation factor 4 small GTPase mediates epidermal growth factor receptor-dependent phospholipase D2 activation. J. Biol. Chem. 278, 2661-2668 (2003).
  84. Wesolowski, J. et al. Chlamydia Hijacks ARF GTPases to coordinate microtubule posttranslational modifications and golgi complex positioning. mBio 8, e02280-16 (2017).
  85. Woo, I. S. et al. Identification of ADP-ribosylation factor 4 as a suppressor of N-(4-hydroxyphenyl)retinamide-induced cell death. Cancer Lett. 276, 53-60 (2009).
  86. Khanna, A. et al. The small GTPases Ras and Rap1 bind to and control TORC2 activity. Sci. Rep. 6, 25823 (2016).
  87. Kortholt, A. et al. A Rap/phosphatidylinositol 3-kinase pathway controls pseudopod formation. Mol. Biol. Cell 21, 936-945 (2010).
  88. Cahill, M. E. et al. Bidirectional synaptic structural plasticity after chronic cocaine administration occurs through Rap1 Small GTPase signaling. Neuron 89, 566-582 (2016).
  89. Brecht, K. et al. Exogenous iron increases fasciocidal activity and hepatocellular toxicity of the synthetic endoperoxides OZ78 and MT04. Int. J. Mol. Sci. 20, https://doi.org/10.3390/ ijms20194880 (2019).
  90. Duthaler, U., Smith, T. A. & Keiser, J. In vivo and in vitro sensitivity of Fasciola hepatica to triclabendazole combined with artesunate, artemether, or OZ78. Antimicrob. Agents Chemother. 54, 4596-4604 (2010).
  91. Sambrook, J. & Russell, D. W. Purification of nucleic acids by extraction with phenol:chloroform. CSH Protoc. 2006, pdb.prot4455 (2006).
  92. Tran, L., Toet, H. & Beddoe, T. Environmental detection of Fasciola hepatica by loop-mediated isothermal amplification. PeerJ 10, e13778 (2022).
  93. Bolger, A. M., Lohse, M. & Usadel, B. Trimmomatic: a flexible trimmer for Illumina sequence data. Bioinformatics 30, 2114-2120 (2014).
  94. Li, H. & Durbin, R. Fast and accurate short read alignment with Burrows-Wheeler transform. Bioinformatics 25, 1754-1760 (2009).
  95. McKenna, A. et al. The genome analysis toolkit: a MapReduce framework for analyzing next-generation DNA sequencing data. Genome Res. 20, 1297-1303 (2010).
  96. Van der Auwera, G. A. et al. From FastQ data to high confidence variant calls: the Genome Analysis Toolkit best practices pipeline. Curr. Protoc. Bioinforma. 43, 11.10.1-11.10.33 (2013).
  97. Cingolani, P. et al. A program for annotating and predicting the effects of single nucleotide polymorphisms, SnpEff: SNPs in the genome of Drosophila melanogaster strain w1118; iso-2; iso-3. Fly 6, 80-92 (2012).
  98. Wang, X. et al. CNVcaller: highly efficient and widely applicable software for detecting copy number variations in large populations. Gigascience 6, 1-12 (2017).
  99. Purcell, S. et al. PLINK: a tool set for whole-genome association and population-based linkage analyses. Am. J. Hum. Genet 81, 559-575 (2007).
  100. Manichaikul, A. et al. Robust relationship inference in genomewide association studies. Bioinformatics 26, 2867-2873 (2010).
  101. Arthur, R., Schulz-Trieglaff, O., Cox, A. J. & O’Connell, J. AKT: ancestry and kinship toolkit. Bioinformatics 33, 142-144 (2017).
  102. Zhang, C., Dong, S. S., Xu, J. Y., He, W. M. & Yang, T. L. PopLDdecay: a fast and effective tool for linkage disequilibrium decay analysis based on variant call format files. Bioinformatics 35, 1786-1788 (2019).
  103. Jones, P. et al. InterProScan 5: genome-scale protein function classification. Bioinformatics 30, 1236-1240 (2014).
  104. Gene Ontology, C. The gene ontology resource: enriching a GOId mine. Nucleic Acids Res. 49, D325-D334 (2021).
  105. Blum, M. et al. The InterPro protein families and domains database: 20 years on. Nucleic Acids Res. 49, D344-D354 (2021).
  106. Kanehisa, M., Sato, Y. & Morishima, K. BlastKOALA and GhostKOALA: KEGG tools for functional characterization of genome and metagenome sequences. J. Mol. Biol. 428, 726-731 (2016).
  107. Kanehisa, M., Furumichi, M., Sato, Y., Ishiguro-Watanabe, M. & Tanabe, M. KEGG: integrating viruses and cellular organisms. Nucleic Acids Res. 49, D545-D551 (2021).
  108. Toronen, P. & Holm, L. PANNZER-A practical tool for protein function prediction. Protein Sci. 31, 118-128 (2022).
  109. Casimiro-Soriguer, C. S., Munoz-Merida, A. & Perez-Pulido, A. J. Sma3s: A universal tool for easy functional annotation of proteomes and transcriptomes. Proteomics 17, https://doi.org/10. 1002/pmic. 201700071 (2017).
  110. Hernandez-Plaza, A. et al. eggNOG 6.0: enabling comparative genomics across 12535 organisms. Nucleic Acids Res. 51, D389-D394 (2023).
  111. Szklarczyk, D. et al. The STRING database in 2023: protein-protein association networks and functional enrichment analyses for any sequenced genome of interest. Nucleic Acids Res. 51, D638-D646 (2023).
  112. Fairweather, I. et al. Development of an egg hatch assay for the diagnosis of triclabendazole resistance in Fasciola hepatica: proof of concept. Vet. Parasitol. 183, 249-259 (2012).
  113. Robles-Perez, D., Martinez-Perez, J. M., Rojo-Vazquez, F. A. & Martinez-Valladares, M. Screening anthelmintic resistance to triclabendazole in Fasciola hepatica isolated from sheep by means of an egg hatch assay. BMC Vet. Res. 11, 226 (2015).
  114. Jarujareet, W., Taira, K. & Ooi, H. K. Dynamics of liver enzymes in rabbits experimentally infected with Fasciola sp. (Intermediate form from Japan). J. Vet. Med. Sci. 80, 36-40 (2018).
  115. Kandil, O. M. et al. Anthelmintic efficacy of Moringa oleifera seed methanolic extract against Fasciola hepatica. J. Parasit. Dis. 42, 391-401 (2018).
  116. Maggioli, G. et al. A recombinant thioredoxin-glutathione reductase from Fasciola hepatica induces a protective response in rabbits. Exp. Parasitol. 129, 323-330 (2011).
  117. Mooney, L., Good, B., Hanrahan, J. P., Mulcahy, G. & de Waal, T. The comparative efficacy of four anthelmintics against a natural acquired Fasciola hepatica infection in hill sheep flock in the west of Ireland. Vet. Parasitol. 164, 201-205 (2009).
  118. White, P. RNA extraction from mammalian tissues. Methods Mol. Biol. 362, 315-327 (2007).
  119. Kim, D., Paggi, J. M., Park, C., Bennett, C. & Salzberg, S. L. Graphbased genome alignment and genotyping with HISAT2 and HISAT-genotype. Nat. Biotechnol. 37, 907-915 (2019).
  120. Liao, Y., Smyth, G. K. & Shi, W. FeatureCounts: an efficient general purpose program for assigning sequence reads to genomic features. Bioinformatics 30, 923-930 (2014).
  121. Liao, Y., Wang, J., Jaehnig, E. J., Shi, Z. & Zhang, B. WebGestalt 2019: gene set analysis toolkit with revamped UIs and APIs. Nucleic Acids Res. 47, W199-W205 (2019).
  122. Supek, F., Bosnjak, M., Skunca, N. & Smuc, T. REVIGO summarizes and visualizes long lists of gene ontology terms. PLoS ONE 6, e21800 (2011).
  123. Smith, G. C., Seaman, S. R., Wood, A. M., Royston, P. & White, I. R. Correcting for optimistic prediction in small data sets. Am. J. Epidemiol. 180, 318-324 (2014).
  124. Kuhn, M. Building predictive models in R using the caret package. J. Stat. Softw. 28, 1-26 (2008).
  125. Stevenson, M. et al. EpiR: an R package for the analysis of epidemiological data. 1, 9-43 (2013).
  126. Robin, X. et al. pROC: an open-source package for R and S+ to analyze and compare ROC curves. BMC Bioinforma. 12, 77 (2011).

شكر وتقدير

تم دعم هذا العمل من قبل المعهد الوطني للحساسية والأمراض المعدية التابع للمعاهد الوطنية للصحة بموجب رقم المنحة 1RO1Al146353، الممنوحة لـ م.م.ج. و م.م.

مساهمات المؤلفين

تم تصور وتصميم الدراسة: م.م.ج. و م.م. جمع العينات: م.ف.م، ر.أ.ع، ب.أ، و ج.هـ. صيانة قاعدة بيانات البيانات البيولوجية والتسلسل: ي.س، ب.أ.ر، ج.م. إعداد العينات واستخراج الحمض النووي: م.ف.م، ر.أ.ع، و ج.هـ. إجراء تحليل البيانات: ي.س، ب.أ.ر، ج.م. تفسير البيانات: ي.س، ب.أ.ر، م.م.ج. و م.م. كتابة الورقة: ي.س، ب.أ.ر، م.م.ج. و م.م. جميع المؤلفين يوافقون على المخطوطة للنشر.

المصالح المتنافسة

يعلن المؤلفون عدم وجود مصالح متنافسة.

معلومات إضافية

معلومات إضافية النسخة الإلكترونية تحتوي على

المواد التكميلية متاحة على
https://doi.org/10.1038/s41467-025-57796-5.
يجب توجيه المراسلات والطلبات للحصول على المواد إلى ميغيل م. كابادا أو ماكيدونكا ميتريفا.
معلومات مراجعة الأقران تشكر مجلة Nature Communications ستيفن دويل والمراجعين المجهولين الآخرين على مساهمتهم في مراجعة هذا العمل. يتوفر ملف مراجعة الأقران.
معلومات إعادة الطباعة والتصاريح متاحة علىhttp://www.nature.com/reprints
ملاحظة الناشر: تظل شركة سبرينجر ناتشر محايدة فيما يتعلق بالمطالبات القضائية في الخرائط المنشورة والانتماءات المؤسسية.
الوصول المفتوح هذه المقالة مرخصة بموجب رخصة المشاع الإبداعي النسب-غير التجارية-بدون اشتقاقات 4.0 الدولية، التي تسمح بأي استخدام غير تجاري، ومشاركة، وتوزيع، واستنساخ في أي وسيلة أو صيغة، طالما أنك تعطي الائتمان المناسب للمؤلفين الأصليين والمصدر، وتوفر رابطًا لرخصة المشاع الإبداعي، وتوضح إذا قمت بتعديل المادة المرخصة. ليس لديك إذن بموجب هذه الرخصة لمشاركة المواد المعدلة المشتقة من هذه المقالة أو أجزاء منها. الصور أو المواد الأخرى من طرف ثالث في هذه المقالة مشمولة في رخصة المشاع الإبداعي الخاصة بالمقالة، ما لم يُشار إلى خلاف ذلك في سطر الائتمان للمادة. إذا لم تكن المادة مشمولة في رخصة المشاع الإبداعي الخاصة بالمقالة وكان استخدامك المقصود غير مسموح به بموجب اللوائح القانونية أو يتجاوز الاستخدام المسموح به، فستحتاج إلى الحصول على إذن مباشرة من صاحب حقوق الطبع والنشر. لعرض نسخة من هذه الرخصة، قم بزيارة http:// creativecommons.org/licenses/by-nc-nd/4.0/.
(ج) المؤلف(ون) 2025

  1. ¹قسم الأمراض المعدية، كلية الطب، جامعة واشنطن، سانت لويس، ميزوري، الولايات المتحدة الأمريكية. ²مقر كوسكو، معهد الطب الاستوائي “ألكسندر فون هومبولت”، جامعة بيرو كايتانو هيريديا، كوسكو، بيرو. مختبر المناعة، كلية العلوم البيطرية، الجامعة الوطنية في كاخاماركا، كاخاماركا، بيرو. قسم الأمراض المعدية، قسم الطب الباطني، فرع جامعة تكساس الطبية، غالفستون، تكساس، الولايات المتحدة الأمريكية. البريد الإلكتروني: ميكابادا@يوتي.إم.بي.إي.دي.يو; mmitreva@wustl.edu

Journal: Nature Communications, Volume: 16, Issue: 1
DOI: https://doi.org/10.1038/s41467-025-57796-5
PMID: https://pubmed.ncbi.nlm.nih.gov/40148292
Publication Date: 2025-03-27

Article

Independent origins and non-parallel selection signatures of triclabendazole resistance in Fasciola hepatica

Received: 14 May 2024

Accepted: 4 March 2025

Published online: 27 March 2025

Young-Jun Choi , Bruce A. Rosa , Martha V. Fernandez-Baca , Rodrigo A. Ore (1) , John Martin , Pedro Ortiz (1) , Cristian Hoban , Miguel M. Cabada & Makedonka Mitreva

Abstract

Triclabendazole (TCBZ) is the primary treatment for fascioliasis, a global foodborne zoonosis caused by Fasciola hepatica. Widespread resistance to TCBZ (TCBZ-R) in livestock and a rapid rise in resistant human infections are significant concerns. To understand the genetic basis of TCBZ-R, we sequenced the genomes of 99 TCBZ-sensitive (TCBZ-S) and 210 TCBZ-R adult flukes from 146 bovine livers in Cusco, Peru. We identify genomic regions of high differentiation ( outliers above the 99.9th percentile) that encod genes involved in the EGFR-PI3K-mTOR-S6K pathway and microtubule function. Transcript expression differences are observed in microtubule-related genes between TCBZ-S and -R flukes, both without drug treatment and in response to treatment. Using only 30 SNPs, it is possible to differentiate between TCBZ-S and -R parasites with accuracy. Our outlier loci are distinct from the previously reported TCBZ-R-associated QTLs in the UK, suggesting an independent evolution of resistance alleles. Effective genetics-based TCBZ-R surveillance must consider the heterogeneity of loci under selection across diverse geographical populations.

Fascioliasis is the most widespread foodborne parasitic zoonosis and is recognized as a neglected tropical disease by the World Health Organization. It poses the greatest burden in countries across South America, the Middle East, and South/Southeast Asia . The highest prevalence in humans is observed in the Andean regions of South America, where prevalence in children can reach . Fasciola hepatica, the parasite responsible for fascioliasis, has a complex lifecycle that requires snail intermediate hosts and mammalian definitive hosts. Livestock are the most common definitive hosts for fascioliasis, though humans also contribute to the cycle in areas of high prevalence. Livestock fascioliasis causes significant economic impact, with estimated annual losses of million in 18 European countries . This economic burden is associated with reduced production of milk, meat,
and wool, decreased fertility, and liver condemnation . In developing countries, economic burden estimates are often based on limited regional data and abattoir registries, which may not fully capture the extent of losses. These economic impacts exacerbate cycles of poverty and food insecurity in affected regions. F. hepatica infection in humans leads to a biphasic illness depending on the parasite’s lifecycle stage. Acute fascioliasis, resulting from the migration of juvenile parasites through the liver, manifests as debilitating fever, abdominal pain, and weight loss. Chronic fascioliasis, caused by adult parasites residing in the biliary tree, presents with nonspecific symptoms and may lead to bile duct obstruction. This disease disproportionately affects children, contributing to the burden of anemia and malnutrition in an already vulnerable population . Although less well-characterized, fascioliasis
also contributes to liver and biliary tree disease, causing biliary obstruction, ascending cholangitis, and possibly liver/biliary fibrosis .
The number of drugs to treat livestock and human fascioliasis is limited by effectiveness, activity on juvenile stages, toxicity, and withdrawal periods in livestock . Clorsulon, closantel, and nitroxynil are veterinary drugs with limited efficacy against early juvenile stages . Bithionol and dehydroemetine, previously used in human treatments, were discontinued due to toxicity and drug interactions . Triclabendazole remains the only drug considered highly effective against both juvenile and adult stages of Fasciola in livestock and humans . The treatment and control of fascioliasis in these groups have heavily relied on triclabendazole and mass drug administration. However, resistance has become widespread in livestock , and small case series have documented treatment failure in humans with acute and chronic infection after repeated courses of triclabendazole . For instance, in a cohort of 146 children with chronic fascioliasis in Cusco, Peru, only achieved parasitological cure after the first round of triclabendazole treatment , compared to a efficacy rate with a single dose in . Furthermore, of children in this cohort did not achieve parasitological cure despite undergoing more than four treatment rounds with high doses . Poor quality control of drug formulations and underdosing are likely contributing to the diminishing effectiveness and the emergence of resistance .
The mechanisms underlying TCBZ-R in Fasciola hepatica are not well understood . Proposed mechanisms include enhanced activity of the P-glycoprotein (P-gp) drug efflux pump and increased conversion of the active sulfoxide metabolite to the less active sulfone . Additionally, higher expression levels of the detoxifying enzyme glutathione S-transferase (GST) have been observed in resistant Fasciola . However, subsequent evaluations of these pathways have produced inconsistent results. A specific single nucleotide polymorphism (SNP), T687G, which results in an amino acid substitution in P-gp, was linked to TCBZ-R in one study , but follow-up research in Australia and Latin America did not corroborate this association . Transcriptomic analyses of Latin American laboratory isolates revealed downregulation of adenylate cyclase transcription and upregulation of GST mu isoforms in parasites resistant to albendazole and triclabendazole . Nevertheless, distinguishing between the signals of albendazole and triclabendazole resistance was challenging due to the small sample size and experimental conditions. These findings underscore the complexity of TCBZ-R mechanisms and the limitations inherent in studies that focus on a narrow range of metabolic pathways, utilize few parasites, or rely on laboratory-bred isolates. In a recent 2023 study, Beesley and colleagues utilized bulked segregant analysis to compare allele frequencies before and after TCBZ treatment in F2 mapping populations from experimental genetic crosses and egg samples from natural infections in Cumbria, UK . They identified a -3.2 Mb locus associated with TCBZ-R, characterized by dominant inheritance, although the specific causal gene(s) could not be pinpointed due to extensive linkage disequilibrium .
In this study, we analyzed a large number of field isolates from Cusco, Peru, to perform a genome-wide selection signature analysis, identifying candidate loci associated with TCBZ-R and demonstrating the potential of SNP-based phenotype classification. Additionally, transcriptomic analysis provided deeper insights into the mechanisms of drug action and resistance. A comparison of resistance-associated loci from geographically diverse F. hepatica populations in Peru and the UK revealed distinct selection signatures, suggesting independent genetic origins of TCBZ resistance in each population.

Results

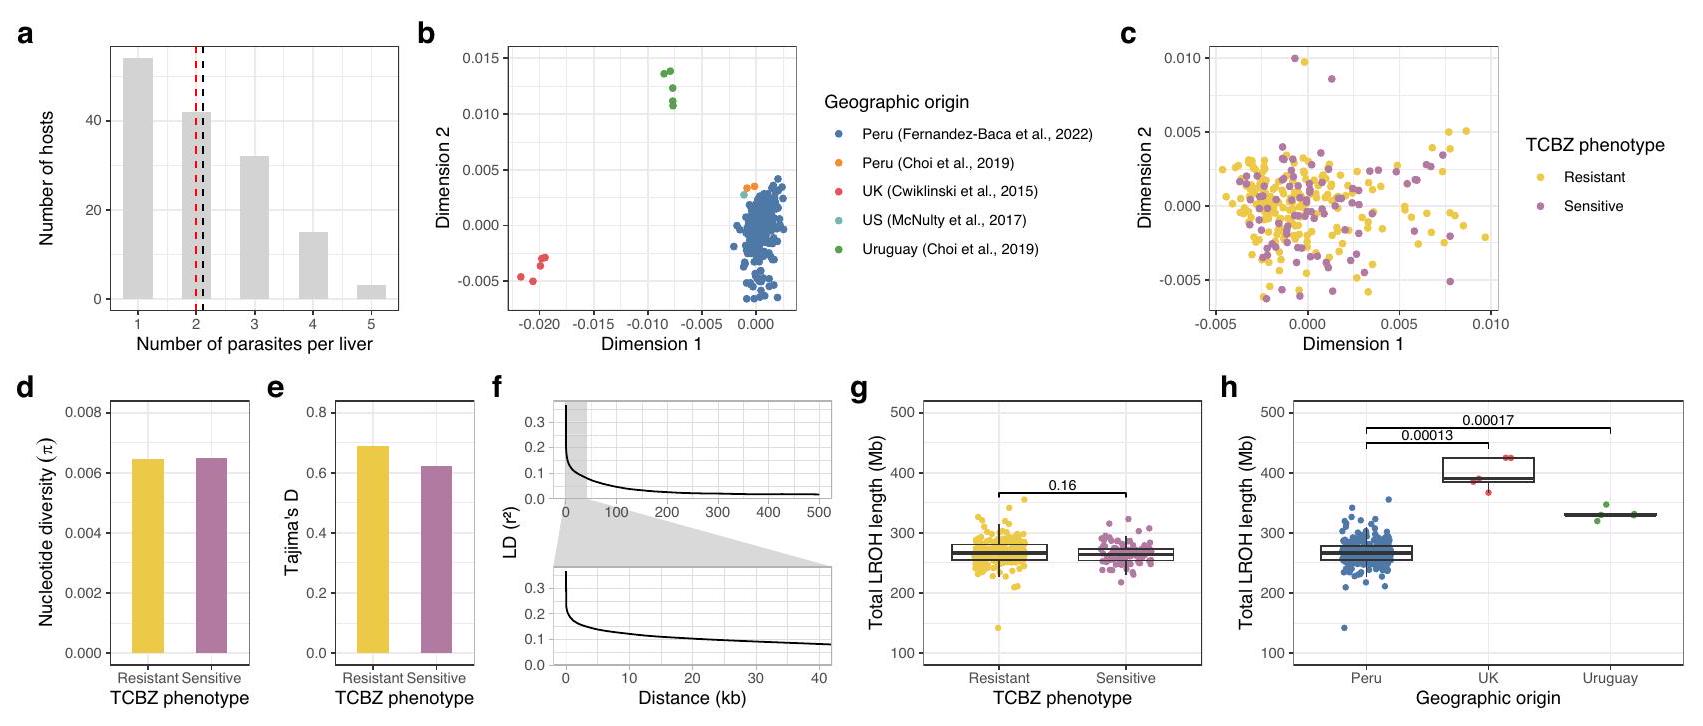
Population sequencing of adult Fasciola hepatica with divergent triclabendazole susceptibility

In preparation for this study, we collected adult . hepatica specimens from naturally infected livestock in Peru and determined the sensitivity
of the isolates to triclabendazole sulfoxide in vitro, the most active metabolite of TCBZ . To identify individuals at opposite ends of the phenotype distribution, we titrated the drug concentration and exposure time in our motility assay. This allowed us to classify parasites approximately in the upper and lower quartiles of the susceptibility distribution as sensitive (TCBZ-S) and resistant (TCBZ-R), respectively . Out of the 3348 parasites exposed to triclabendazole, we whole-genome sequenced 99 TCBZ-S and 210 TCBZ-R parasites collected from 146 bovid livers (Supplementary Data 1). To avoid oversampling of closely related individuals or genetically identical parasites resulting from clumped transmission of clonemates arising from asexual reproduction in the molluscan intermediate host, we limited the number of parasites sequenced per liver to a maximum of 5, with an average of 2.1 (Fig. 1a). On average, we generated 17 Gb of sequence data per sample ( mean coverage of the 1.2 Gb reference genome), resulting in the identification of 42.5 million single nucleotide variants (SNPs) across all samples. We identified and excluded 17 closely related individuals, including clonemates (kinship coefficient ; Supplementary Table 1), 2 samples with high levels of genotype missingness ( ; Supplementary Fig. 1a), and 5 samples displaying excessive heterozygosity indicative of possible sample contamination (Supplementary Fig. 1b), leaving 91 TCBZ-S and 194 TCBZ-R parasites and 42.1 million variants (1 SNP every 29 bp on average) for subsequent analyses.

Fasciola populations in the Cusco region of Peru do not exhibit significant genetic structuring with respect to their TCBZ sensitivity phenotype

We compared our Peruvian samples to previously published individual genome sequencing data from the UK, US, and Uruguay ( ) to contextualize genetic variation among geographically diverse . hepatica populations . Genome-wide allele sharing patterns indicated that the . hepatica population in Peru is distinct from specimens collected in the UK and Uruguay, consistent with the expected limited gene flow between these locations (Fig. 1b). A lower level of genetic differentiation was observed between samples from Peru and an isolate from Oregon, USA, as previously noted . Among the Peruvian samples, there was little genetic structuring between flukes with divergent TCBZ sensitivity phenotype (Fig. 1c). By comparing betweengroup and in-group pairwise identity-by-state (IBS) distances (based on LD-pruned SNPs with a minor allele frequency ), we asked whether, on average, pairs across the two groups are less similar than pairs within a phenotype group than would be expected by chance. A non-significant test result was obtained ( ; 91 TCBZS and 194 TCBZ-R samples, mean and standard deviation of , and , for betweengroup IBS, in-group (TCBZ-S) IBS, and in-group (TCBZ-R) IBS, respectively; permutation test randomizing phenotype labels, permutations), suggesting that our specimens were sampled from a local interbreeding population without strong population stratification between TCBZ-S and -R flukes. Stratification could have confounded the analysis of selection signatures. Genome-wide estimates of nucleotide diversity ( ) were 0.0065 regardless of TCBZ sensitivity (Fig. 1d). Genome-wide mean Tajima’s D estimates were positive (>0.6) in both TCBZ-S and -R populations (Fig. 1e), suggesting a possible recent population contraction in the region.
F. hepatica is a hermaphrodite with a mixed mating system involving both inbreeding and outcrossing. In inbreeders, closely linked sites often show haplotype structure detectable as high linkage disequilibrium (LD). In our study population, LD decayed to a value of for SNPs separated by 20 kb and approached background levels at distances greater than 250 kb (Fig. 1f), a pattern comparable to those in other selfing species with mixed mating systems . Inbreeding changes genotype frequencies by increasing homozygosity, largely in the form of runs of homozygosity (ROH), thereby reducing effective
Fig. 1 | Population sequencing of adult Fasciola hepatica with divergent triclabendazole sensitivity. a Frequency distribution of the number of parasites sequenced per host liver. Dotted lines indicate mean (black) and median (red). b, c Multidimensional scaling analysis of genetic relationship based on identity-bystate of million LD-pruned biallelic SNPs. b Specimens collected from various countries, including samples from previous studies. c Peru samples with divergent triclabendazole sensitivity. d Genome-wide estimates of nucleotide diversity. e Genome-wide estimates of Tajima’s D. f Linkage disequilibrium (LD) decay pattern
in Peru population based on mean LD calculated in 10 longest scaffolds (range: . Runs of homozygosity (ROH) regions in 194 triclabendazole-resistant and 91 triclabendazole-sensitive Peru samples. h ROH regions in 285 Peru, 5 UK, and 5 Uruguay samples. Box plots display the median (center line), upper and lower quartiles (box limits), interquartile range (whiskers), and outliers (points). values were calculated using a two-sided Wilcoxon rank-sum test without adjustments for multiple comparisons.
recombination frequency throughout the genome . We inferred an average of 265.4 Mb and 268.1 Mb of total ROH regions per fluke in TCBZ-S and TCBZ-R parasites, respectively (Fig. 1g). These estimates were lower than those observed in the UK (mean and standard deviation of and in Peru and the UK, respectively; and in Peru and the UK, respectively; ; two-sided Wilcoxon rank-sum test W statistic confidence interval , effect size ) and Uruguay ( in Uruguay; ; two-sided Wilcoxon rank-sum test W statistic confidence interval , effect size ) specimens (Fig. 1h), suggesting a comparatively higher level of outcrossing in the Peru population.

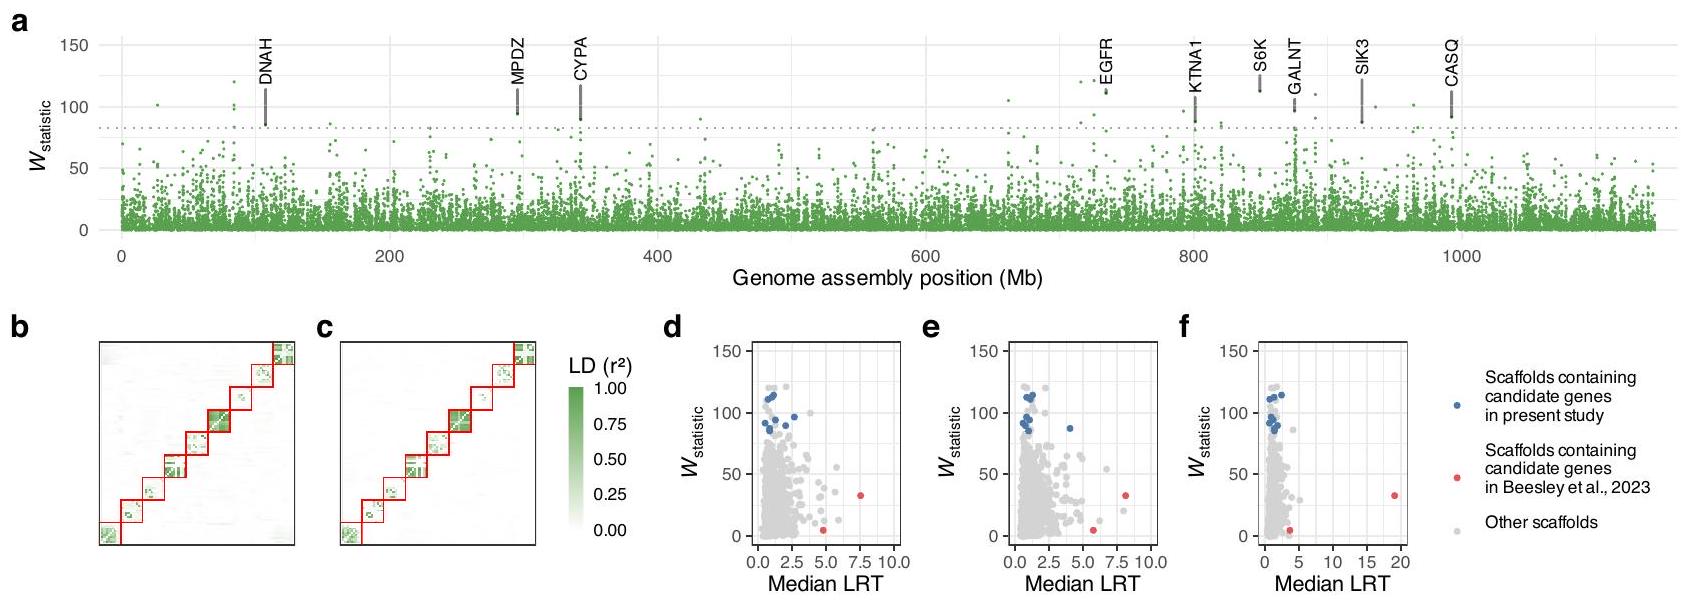
Candidate loci under TCBZ selection include EGFR/PI3K-mTOR-
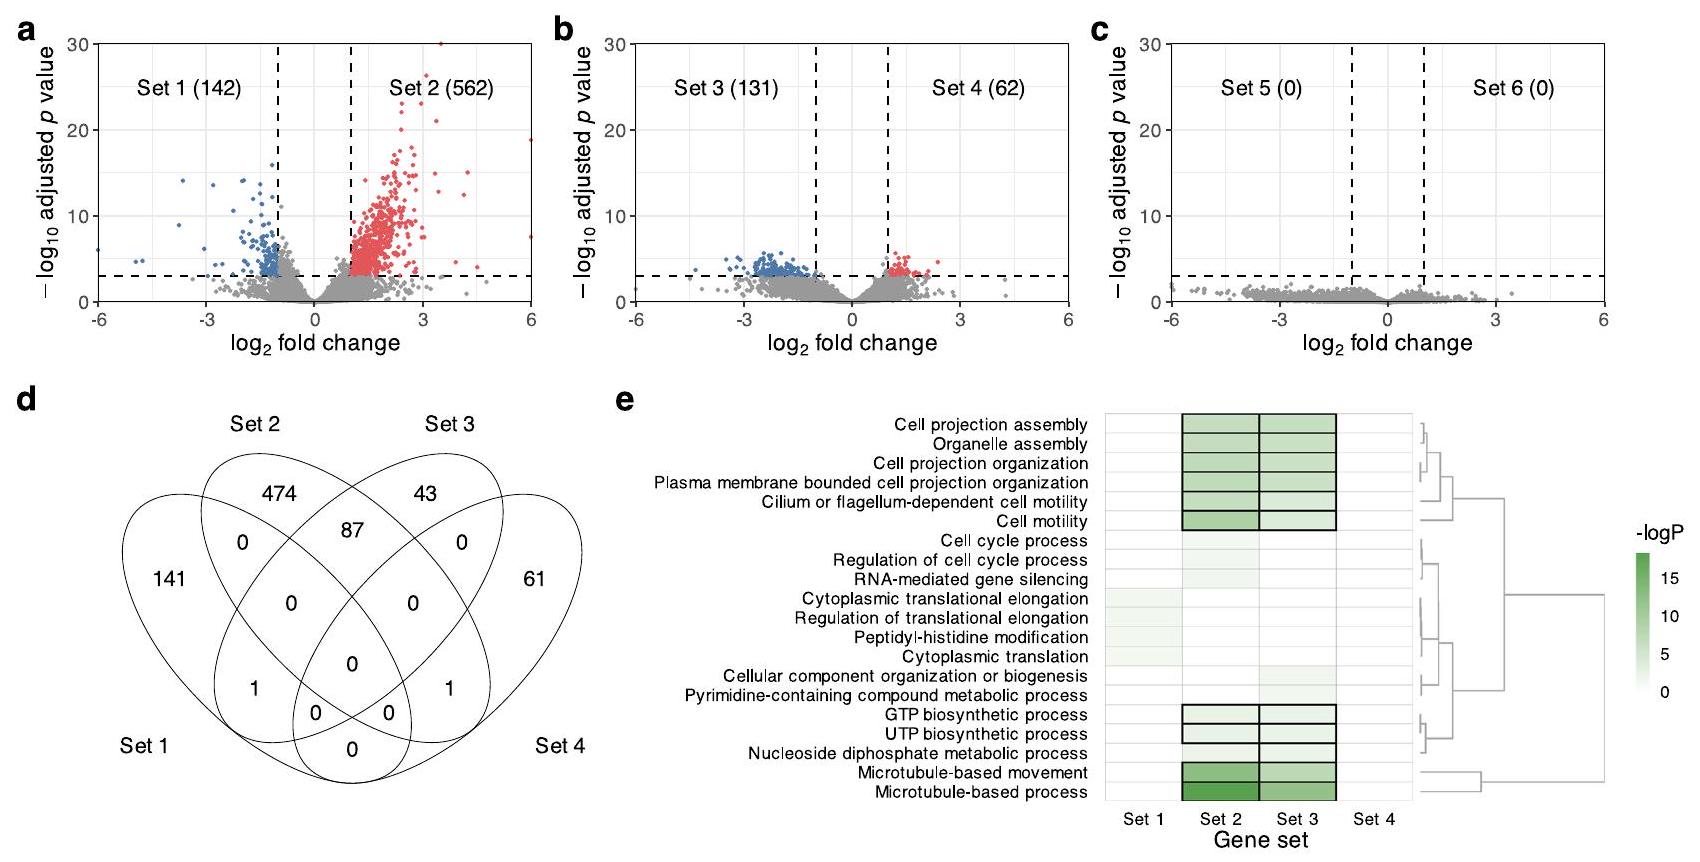
S6K pathway genes and genes involved in microtubule function To identify loci under TCBZ selection, we performed a genome-wide fixation index analysis. While the majority of genomic diversity is expected to be neutral with respect to the focal trait (i.e., TCBZ sensitivity), adaptive alleles that differ in their selection history are likely to be associated with regions genetically differentiated between TCBZS and TCBZ-R populations. We scanned the . hepatica genome for outlier loci using a sliding window approach, where window boundaries were determined based on the inflection points of a smoothing spline fitted to raw values estimated for individual (Supplementary Fig. 2). To compare genomic windows of varying sizes, we used the -test like statistic . Genomic windows were ranked based on their values (Supplementary Data 2), leading to the identification of outlier genomic regions above the 99.9th percentile , encompassing a total of nine protein-coding genes located across nine scaffolds (Fig. 2a, Supplementary Fig. 3 and Table 1). Each candidate gene was located in distinct genomic regions in separate scaffolds. Due to the limited contiguity of the F. hepatica reference genome assembly (GenBank Accession: GCA_900302435; N50: 1.9 Mb ; N90: 519 kb ), determining the long-range spatial distribution of our outlier loci was not possible. However, gene synteny analysis, based on the closely-related sister species F. gigantica (Supplementary
Data 3), suggested that these outlier loci are likely distributed across multiple chromosomes (linkage groups) rather than in a single locus. Furthermore, LD among the outlier genes was observed to be low ( ) in both TCBZ-S and -R populations (Fig. 2b, c).
The top 9 outlier genes from the genome scan can be grouped into those linked to the PI3K/AKT-mTOR-S6K pathway (CYPA, EGFR, SIK3, S6K, and GALNT) and those implicated in microtubule function, either as physical binding partners (DNAH) or as modification enzymes (KTNA1). Of these, five genes contained one or more non-synonymous variants showing a significant difference in frequency between TCBZ-S and -R populations ( in all comparisons, Fisher’s exact test; see Supplementary Data 4 for the exact values for each variant). We did not observe a selection signal in previously reported candidate genes and gene families, such as T687G in P-gp and T143S in GST mu genes (Supplementary Data 5). Furthermore, our candidate loci did not overlap with the TCBZ-R associated QTL regions identified from the bulked segregant analysis of Fasciola in Cumbria, UK (a 0.3 Mb region of scaffold 1853 and a 2.9 Mb region of scaffold 157) (Fig. 2d-f). We searched for the co-occurrence of selection signals from the two studies on the same scaffold by comparing the maximum values of the statistic (i.e., and median LRT values) observed for each scaffold in each study. The candidate loci from each study were located on mutually exclusive sets of scaffolds, with no overlap found.
To understand the baseline transcriptional differences between TCBZS and -R flukes and to investigate how drug response differs between the flukes with different phenotypes, we characterized the transcriptional profiles of adult parasites derived from parental flukes with known drug sensitivity (Supplementary Fig. 4 and Supplementary Data 6). RNA-seq was performed on drug-treated and untreated whole fluke samples, focusing on (i) the expression differences between TCBZ-S and -R flukes without treatment and (ii) the TCBZ treatment effects within each phenotypic group . To ensure statistically robust results, we accounted for variability associated with time and
Fig. 2 | Genome-wide scan of fixation index between triclabendazolesensitive and -resistant Fasciola hepatica populations. a Outlier genomic intervals (99.9th percentile, dotted line) were determined based on described in ref. 42 . Scaffolds on the -axis were ordered by ID and does not imply physical proximity. Candidate genes overlapping the outlier regions were indicated using their gene symbol. b, c Linkage disequilibrium (LD) matrix among the 9 genes that overlap outlier regions. From each gene locus, 10 SNPs were selected
randomly for all-vs-all pairwise LD calculation ( SNPs). Red borders indicate within-gene SNP pairs. b LD in TCBZ sensitive flukes. c LD in TCBZ resistant flukes. Maximum test statistic observed on each scaffold in the present study ( -axis) and in Beesley et al. ( -axis; d: genetic cross experiment 1, e: genetic cross experiment 2, and : field isolate 1) . Scaffolds containing the outlier candidate genes were colored blue (present study) and red (Beesley et al.).
Table 1 | Candidate genes overlapping the 99.9th percentile outlier regions comparing triclabendazole-sensitive and -resistant Fasciola hepatica populations in Peru
Gene ID Gene symbol Description Permutation value
Maker-scaffold10x_1006_pilon-augustus-gene-0.3 S6K Ribosomal protein S6 kinase 112.5
Maker-scaffold10x_790_pilon-snap-gene-0.11 EGFR Receptor protein-tyrosine kinase 110.8
Maker-scaffold10x_1058_pilon-snap-gene-0.8 GALNT Polypeptide N-acetylgalactosaminyltransferase 96.5
Maker-scaffold10x_259_pilon-snap-gene-0.103 MPDZ Multiple PDZ domain protein 94.1
Snap_masked-scaffold10x_1433_pilon-processed-gene-0.1 CASQ Calsequestrin 91.5
Maker-scaffold10x_293_pilon-snap-gene-0.143 CYPA Cyclophilin type peptidyl-prolyl cis-trans isomerase 89.5
Maker-scaffold10x_922_pilon-snap-gene-0.56 KTNA1 Katanin p60 ATPase-containing subunit A1 87.7
Snap_masked-scaffold10x_1189_pilon-processed-gene-0.81 SIK3 Serine/threonine-protein kinase SIK3 87.3
Maker-scaffold10x_82_pilon-snap-gene-0.73 DNAH Dynein axonemal heavy chain 85.2
values were calculated using a one-sided permutation test, randomizing phenotype labels ( 20,000 permutations).
treatment concentrations (see Methods for details on the experimental approach, including snail and rabbit infections). The statistical significance of the pairwise differential expressions was calculated by the negative binomial test-based algorithm , and the FDR-adjusted values for each comparison are provided in Supplementary Data 7.
In the absence of treatment, we identified 562 overexpressed and 142 underexpressed genes in TCBZ-R flukes compared to TCBZ-S flukes ( and fold-change; Fig. 3a). Among the underexpressed genes, we did not observe significantly enriched functional categories ( ; FDR-adjusted conditional hypergeometric tests ; Fig. 3e). The functional categories enriched among the overexpressed genes included microtubule-based processes (GO:0007017, ), microtubule-based movement (GO:0007018, ) and cilium or flagellum-dependent cell motility (GO:0001539, ) (Fig. 3e). Particularly, multiple tubulin genes ( 9 alpha- and 1 beta-tubulins), structural and motor proteins found in cilia and flagella, such as kinesin, axonemal dynein, tektin, and various members of the cilia- and flagella-associated protein family displayed higher transcript levels in TCBZ-R flukes (Supplementary Data 7). Additionally, higher transcript abundance was observed in genes involved in regulating microtubules and cytoskeleton (Table 2), such as vasohibin with tubulin detyrosination activity , EB1 protein
modulating microtubule dynamics , and tubulin glycylase modifying exonemal microtubules in cilia and flagella . Tubulin polyglutamylases and tubulin deglutamylase (Cytosolic carboxypeptidaselike protein 5), which are involved in microtubule glutamylation and abundant in neurons and cilia, were also expressed at higher levels in TCBZ-R flukes. Notably, the most significantly overexpressed gene was an IQ motif-containing GTPase-activating protein (IQGAP) ( ), a scaffolding protein integrating EGFR signaling to PI3K/AKT-mTOR signaling . Additional overexpressed genes of interest included three EGF-like domain-containing proteins. Two of these proteins were identified as TCBZ-R associated candidate genes by ref. 34.
In TCBZ-S flukes, 62 genes showed a significant increase, and 131 genes showed a significant decrease in response to TCBZ treatment; however, no significantly differentially expressed genes were detected in TCBZ-R flukes ( and fold-change; Fig. 3b, c). The most significantly upregulated gene was a mitogen-activated protein kinase (ortholog of human MAPK11) ( ), which belongs to a class of kinases (p38 MAPKs) that are responsive to stress stimuli and are involved in cell differentiation, apoptosis, and autophagy (Table 2). We did not observe any significantly enriched functional categories ( ) among the 62 upregulated genes (Fig. 3e). The 131
Fig. 3 | Transcript expression analysis of triclabendazole-sensitive and -resistant Fasciola hepatica, both without and in response to triclabendazole treatment. a Differential expression between sensitive and resistant flukes without treatment. b Differential expression between drug-treated and untreated sensitive flukes. c Differential expression between drug-treated and untreated resistant flukes. Genes with an FDR-adjusted value of and a fold-change of were
deemed to have significantly increased (red) or decreased (blue) expression and were grouped based on expression patterns (Set 1 through 6, with gene counts in parentheses). d Distribution of differentially expressed genes across Sets 1 through 4. e Overrepresented biological process Gene Ontology (GO) terms of the differentially expressed genes. GO terms with an FDR-adjusted value of were deemed significant (black border).
downregulated genes were significantly enriched for microtubulebased processes (GO: 0007017, ), microtubule-based movement (GO:0007018, ), and cell projection assembly (GO:0030031, ) (Fig. 3e). Notably, 87 of the 131 downregulated genes overlapped with the 562 genes that exhibited higher transcript abundance levels in TCBZ-R flukes relative to TCBZ-S flukes ( ), resulting in similar functional category enrichment results (Fig. 3d, e). Among the TCBZ treatment-responsive genes in TCBZ-S flukes were multiple tubulin genes ( 3 alpha- and 1 delta-tubulins) (Table 2). This coordinated suppression of tubulin transcripts was reminiscent of the transcriptional signatures of drug-induced microtubule destabilization involving tubulin autoregulation, a cotranslational degradation of tubulin . To further characterize the differentially expressed genes, we performed a homology-based cell-type association analysis using Schistosoma mansoni single-cell RNA-seq data . We observed a significant association of specific cell types including flame cells ( ) and late male germ cells that contain axonemal structure , as well as several neuron types, among the differentially expressed genes that showed increased transcript abundance in TCBZ-R flukes and/or decreased transcript levels in drug-treated TCBZ-S flukes (Supplementary Data 8).

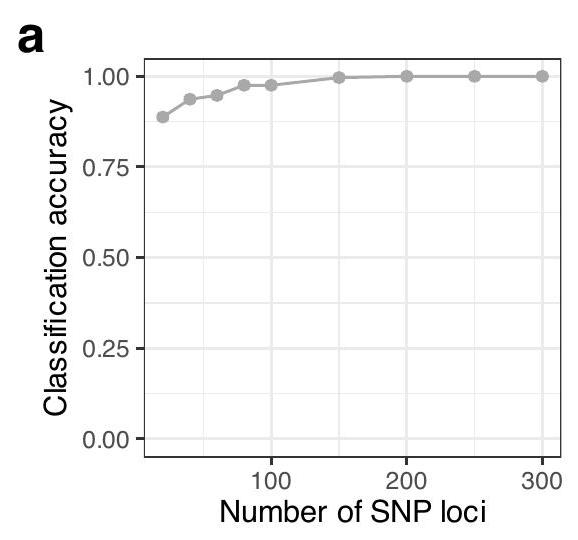
Differentiating TCBZ-S and -R parasites is possible using a limited number of informative SNPs

The identification of genetic markers that can predict clinical failure of TCBZ among infected individuals is a prerequisite for the development of cost-effective targeted genotyping approaches that can be deployed in the field. We investigated whether a limited number of SNP markers could provide discriminatory power to classify flukes as TCBZ-S or TCBZ-R. To identify informative loci, we compared allele frequencies in TCBZ-S and TCBZ-R populations using Fisher’s exact test and used a clumping approach to select the top 300 lead/index SNPs with the lowest p -values that were not in strong LD with each
other ( ) (Supplementary Data 9). Using these loci, we performed a discriminant analysis of principal components (DAPC) that can probabilistically assign individual samples to TCBZ-S or TCBZ-R groups (Fig. 4a). Although the classification accuracy decreased when an incrementally smaller set of SNPs was used for DAPC modeling, results indicated that it could be possible to differentiate TCBZ-S and TCBZ-R parasites with accuracy using SNPs. To address the issue of overfitting, which leads to overly optimistic performance that fails to generalize to new samples, we evaluated the DPAC classification using an independent set of 152 adult fluke samples ( 78 TCBZ-S and 74 TCBZ-R) genotyped with a custom multiplex amplicon panel. It was possible to design primers for 293 of the 300 lead/index SNPs, and after removing four primer pairs that produced higher levels of off-target products, the final design (IDT xGen custom amplicon panel cp727) included primer sets targeting a total of 289 loci. To assess genotyping accuracy, we sequenced an additional 10 samples using this panel, which were technical repeats of the same DNA samples that were whole-genome sequenced (WGS) for our analysis. The amplicon-seq resulted in a mean target coverage (minimum ) and a coverage uniformity (number of target SNPs with coverage of mean) (Supplementary Data 10). Multiallelic loci ( ) and loci with missing genotype calls ( ) were excluded from further analysis. Genotype calls from the 10 amplicon-seq samples matched to 10 WGS samples were compared to assess the genotyping accuracy of amplicon-seq at individual target loci. Only loci with identical genotype calls in at least 9 out of 10 sample pairs were retained for downstream analysis ( ). Feature selection was then performed using the Random Forest machine learning method to prioritize informative SNPs ( ), ranked by mean decrease accuracy (MDA) values (Supplementary Data 10). A DAPC discriminant function was constructed using these 30 most informative SNPs for binary classification of the 152 amplicon-seq samples. Performance was assessed through receiver operating characteristic (ROC) analysis, comparing the true positive rate (sensitivity) versus the false positive
Table 2 | Genes of interest that are differentially expressed between triclabendazole-sensitive and -resistant Fasciola hepatica without and in response to triclabendazole treatment
Gene ID Description Untreated Log2 FC FDRadjusted value TCBZ-S FDRadjusted value
Higher in TCBZ-R Lower in TCBZ-R Higher with TCBZ treatment Lower with TCBZ treatment
Maker-scaffold10x_1074_pilon-snap-gene-0.107 Alpha-tubulin Y 2.30 -1.11 0.049
Maker-scaffold10x_13_pilon-snap-gene-2.125 Alpha-tubulin Y 2.14 Y -2.47
Maker-scaffold10x_13_pilon-snap-gene-2.129 Alpha-tubulin Y 1.94 Y -2.08
Maker-scaffold10x_1444_pilon-snap-gene-0.40 Alpha-tubulin Y 1.17 -1.42 0.017
Maker-scaffold10x_45_pilon-snap-gene-0.45 Alpha-tubulin Y 1.74 Y -2.31
Maker-scaffold10x_592_pilon-snap-gene-0.21 Alpha-tubulin Y 1.87 -1.51
Maker-scaffold10x_680_pilon-snap-gene-0.21 Alpha-tubulin Y 1.30 -0.99 0.12
Maker-scaffold10x_809_pilon-snap-gene-0.10 Alpha-tubulin Y 1.69 -1.78
Maker-scaffold10x_944_pilon-snap-gene-0.44 Alpha-tubulin Y 2.40 -1.28 0.036
Snap_masked-scaffold10x_1189_pilon-processed-gene-0.77 Alpha-tubulin Y 2.36 -3.25
Maker-scaffold10x_1708_pilon-snap-gene-0.5 Cytosolic carboxypeptidas × 10-like protein 5 Y 1.26 -0.86 0.13
Maker-scaffold10x_1084_pilon-snap-gene-0.149 Delta-tubulin 0.24 0.79 Y -2.90
Maker-scaffold10x_486_pilon-snap-gene-0.86 EB1 C-terminal domain-containing protein Y 2.77 Y -1.94
Maker-scaffold10x_44_pilon-snap-gene-0.4 EGF-like domain-containing protein Y 2.77 -1.53 0.16
Maker-scaffold10x_157_pilon-snap-gene-0.185 EGF-like domain-containing protein Y 2.37 -1.74 0.046
Maker-scaffold10x_157_pilon-snap-gene-0.196 EGF-like domain-containing protein Y 1.94 -2.04 0.035
Maker-scaffold10x_206_pilon-snap-gene-0.64 IQ motif, EF-hand binding site Y 3.50 -0.99 0.13
Maker-scaffold10x_1309_pilon-snap-gene-0.85 Mitogen-activated protein kinase 0.51 0.24 Y 1.20
Maker-scaffold10x_559_pilon-snap-gene-0.27 Tubulin monoglycylase Y 1.63 0.16 0.87
Maker-scaffold10x_61_pilon-snap-gene-0.52 Tubulin polyglutamylase Y 1.76 -1.30
Maker-scaffold10x_234_pilon-augustus-gene-0.64 Tubulin polyglutamylase Y 1.22 0.37 0.57
Maker-scaffold10x_242_pilon-snap-gene-0.27 Tubulin polyglutamylase Y 1.44 -0.86 0.23
Maker-scaffold10x_383_pilon-snap-gene-1.0 Tubulin polyglutamylase Y 1.65 -0.92 0.19
Maker-scaffold10x_483_pilon-snap-gene-0.117 Tubulin polyglutamylase Y 1.51 -0.22 0.69
Maker-scaffold10x_908_pilon-snap-gene-1.169 Tubulin polyglutamylase Y 1.60 -0.87 0.18
Maker-scaffold10x_1306_pilon-snap-gene-0.14 Tubulin polyglutamylase Y 1.74 -2.06 0.065
Maker-scaffold10x_2067_pilon-augustus-gene-0.6 Tubulin polyglutamylase Y 1.57 -1.11 0.032
Maker-scaffold10x_66_pilon-snap-gene-0.15 Ubiquitin carboxyl-terminal hydrolase Y 1.07 Y 1.56
Maker-scaffold10x_73_pilon-snap-gene-0.14 Vasohibin-like protein Y 2.07 Y -2.70
Fig. 4 | Differentiation of triclabendazole-sensitive and -resistant Fasciola
hepatica based on SNP profiles. Group classification by Discriminant Analysis of Principal Components (DAPC). a The top 300 SNPs, exhibiting significant betweengroup allele frequency differences and not in strong linkage disequilibrium with each other, were used to classify 91 TCBZ-S and 194 TCBZ-R WGS samples.

b

Classification accuracy was evaluated incrementally by reducing the number of SNPs in the analysis. b Receiver operating characteristic (ROC) curve of the DAPC classifier using 30 informative SNPs and an independent sample set of 78 TCBZ-S and 74 TCBZ-R flukes genotyped by amplicon sequencing. The ROC curve is presented as a bold line, with the confidence intervals as a light blue area.
rate (1-specificity) at different classification thresholds (Fig. 4b). The area under the ROC curve (AUC), which provides an aggregate measure of performance across all possible classification thresholds, was 0.86 (non-parametric stratified bootstrapping confidence interval ). The classification accuracy was (exact binomial confidence interval ), with a binomial test values of . The classification sensitivity and specificity were (exact binomial confidence interval ) and (exact binomial confidence interval ), respectively. Finally, we performed leave-pair-out cross-validation (with 1000 stratified resamplings) to estimate the classification accuracy when the model is used to make predictions on data not included in the training set. The estimated prediction accuracy using cross-validation was .

Discussion

Triclabendazole is the first line anthelmintic used to treat F. hepatica infections, due to its effectiveness against both adult and early immature parasites. Despite the emergence of widespread resistance in livestock and the rise in human cases with resistant infections, our understanding of the genetics of triclabendazole resistance remains limited . Previous efforts to identify genetic markers associated with resistance have resulted in inconsistent results across different strains and isolates, highlighting the importance of broad sampling of phenotypically well-characterized specimens . We determined the triclabendazole sensitivity of a large number of individual adult flukes from natural infections in cattle in the Cusco region of Peru using a standardized in vitro motility assay . Building on this collection of field isolates, we undertook genome-wide selection signature and transcript expression analyses to understand the genetic basis of TCBZ-R in . hepatica and identified resistance-associated genetic markers to facilitate development of molecular surveillance tools for improved interventions and sustainable control.
Genotype-phenotype comparisons between . hepatica isolates from ancestrally diverse populations are likely to suffer from the confounding effects of population structure. The fluke samples from the Cusco region showed limited population structure, making them suitable for genome-wide selection scan analysis. Moreover, the total length of ROH regions per worm was shorter than in previously sequenced UK and Uruguay specimens, consistent with an interbreeding population with higher outcrossing rates. Positive Tajima’s D values were observed, which might indicate recent or ongoing population contractions.
We identified genomic regions of high differentiation (above the 99.9th percentile) between populations with divergent TCBZ sensitivity, using 210 TCBZ-R and 99 TCBZ-S adult flukes, each group approximately representing the upper and lower quartiles of the distribution. These candidate loci under selection contained a total of 9 protein-coding genes, including those in the EGFR/PI3K/AKT-mTORS6K pathway and genes involved in microtubule function. We propose a model in which modifications in the EGFR/PI3K/AKT-mTOR-S6K signaling contribute to TCBZ-R by altering the stability of microtubule and promoting survival. Studies have shown that S6K pathway enhances cell survival under stressed conditions and promotes tubulin acetylation that can protect microtubules from treatments with depolymerizing drugs, such as colchicine and nocodazole . In cells resistant to a tubulin-targeting drug (paclitaxel), tubulin acetylation was shown to enhance the anti-apoptotic phenotype by stabilizing Mcl-1 and protecting it from ubiquitin-proteasome-mediated degradation . In Caenorhabditis elegans, S6K regulates stress granule dynamics, and its loss of function sensitizes the nematode to stressinduced death .
It is not possible to determine, based solely on our selection scan analysis, whether any of the outlier genes directly contribute to the resistance phenotype. However, it is significant that multiple outlier genes converged on the same pathway. It is possible that an outlier gene may contribute to the resistance phenotype or play a compensatory role in rebalancing the stability and dynamics of microtubule in resistant parasites. Considering that alternations in cellular signaling pathway activity often impact multiple biological processes, including those with fitness costs, some of our candidate loci may reflect compensatory mechanisms that restore fitness. In the following sections, we discuss the individual candidate genes in greater detail within the context of our proposed model.
We identified five candidate genes implicated in the EGFR/PI3K/ AKT-mTOR-S6K signaling pathway: cyclophilin (CYPA), a receptor protein-tyrosine kinase (orthologous to C. elegans let-23 and human EGFR and ERBB4), S6K, SIK3 (a positive regulator of mTOR signaling ), and GALNT (involved in the activation of PI3K/AKT pathway through the O-glycosylation of EGFR ). Cyclophilin, a chaperone/signaling molecule with peptidyl-prolyl isomerase activity, promotes cell proliferation and an anti-apoptotic phenotype in various cancer cell types . The anti-apoptotic effects are associated with the activation of the PI3K/AKT-mTOR signaling pathway, modulation of the Bcl-2 family, and inhibition of caspase cascades . In F. hepatica, a significant increase in the level of cyclophilin A protein was observed following
exposure to high-concentration TCBZ ( ) in both Sligo (TCBZ-R) and Cullompton (TCBZ-S) isolates. However, the change in protein expression level was substantially greater in the TCBZ-R Sligo compared to TCBZ-S Cullompton flukes (a 32.7- and 6.5-fold increase relative to the control, respectively) . The epidermal growth factor receptor is a receptor tyrosine kinase that activates PI3K upon ligand binding and dimerization and regulates a wide range of biological processes, including cell proliferation and differentiation . Transcriptomic and proteomic analyses have identified PI3K-AKT signaling as a key pathway associated with growth and development in the immature liver-stage . hepatica . Interestingly, it has been noted that TCBZ-R flukes reach patency faster than TCBZ-S flukes both in rats (Oberon vs. Fairhurst isolates) and in sheep (Sligo vs. Cullompton isolates) . It remains to be determined whether a common pathway contributes to TCBZ-R in these isolates and if variation in PI3K-AKT activity impacts both parasite development and TCBZ sensitivity (pleiotropy).
Our analysis identified candidate genes involved in microtubule and cytoskeletal function, such as axonemal dynein (DNAH) and katanin (KTNA1). Dyneins function as motors to generate sliding between ciliary doublet microtubules. Katanin is a microtubulesevering enzyme that can modulate microtubule stability both positively and negatively . While severing can destabilize the microtubule, katanin can also stabilize newly generated microtubule ends, contributing to microtubule amplification.
While we hypothesize that differential regulation of the PI3K/AKT-mTOR-S6K pathway is associated with TCBZ-R, further study will be required to determine the exact nature and effects of individual pathway modifications under TCBZ selection and to ascertain the causal allele(s) that are necessary and sufficient for the resistant phenotype. Although it remains to be determined whether TCBZ-R in . hepatica is a polygenic trait controlled by multiple genes, it appears that TCBZ-R in our study population is mediated by a limited number of effector mechanisms that can be affected by multiple (upstream) regulatory processes. We did not observe strong genetic linkage between the outlier genes (located on different scaffolds), suggesting that different combinations of adaptive alleles may confer the resistance phenotype in different individual flukes (i.e., genetic redundancy).
We profiled the transcriptomes of TCBZ-S and -R flukes to better understand the drug action and develop insights into the resistance mechanism. TCBZ is a member of the benzimidazole family of anthelmintics that bind to beta-tubulin, thereby inhibiting the polymerization of microtubules . Alpha- and beta-tubulins form obligate heterodimers that polymerize into microtubules, and TCBZ is thought to interfere with the formation of heterodimers by locking the betatubulin moieties in the open conformation . TCBZ binding inhibits colchicine binding to microtubular protein purified from adult . hepatica, suggesting a common binding site . Although a mechanistic understanding of TCBZ interaction with . hepatica beta-tubulins is lacking, morphological and histological changes observed in TCBZ-S flukes following drug treatment are consistent with microtubule disruption, strongly suggesting involvement of beta-tubulin .
We identified an overrepresentation of microtubule-related genes, including multiple tubulin genes, among those that exhibited differential transcript abundance (i) following TCBZ treatment in the drug-sensitive flukes and (ii) between TCBZ-S and -R flukes in the absence of treatment. In particular, the functional category and cell type enrichment analysis indicated differences in transcript abundance in genes involved in exonemal microtubule function in cilia and flagella between TCBZ-S and -R flukes. Because whole-worm bulk RNA sequencing was used, we could not determine if these transcript abundance differences are due to changes in gene expression and/or cell type composition between TCBZ-S and -R flukes. Considering that axonemal microtubules are found in spermatozoon and excretory flame cells , the transcriptional differences we observed could be
indicative of differences in organ development or function between TCBZ-S and -R flukes. Further histological studies or single-cell RNA sequencing analysis could provide additional information to support this interpretation. Another critical consideration when comparing the transcriptomes of untreated TCBZ-S and TCBZ-R flukes is the potential influence of genetic background variation. Differences in genetic background, unrelated to the resistance phenotype, could confound the transcriptional differences observed between TCBZ-S and TCBZ-R flukes. To address this, conducting experiments with additional flukes from a range of genetic backgrounds will be essential for pinpointing transcriptional differences that are specifically associated with the resistance phenotype.
A substantial difference was observed between TCBZ-S and -R flukes in the number of differentially expressed genes in response to drug treatment ( 190 genes in TCBZ-S and 0 in TCBZ-R flukes). This mirrors the differential effects of TCBZ on TCBZ-S and TCBZ-R flukes reported in previous histological studies and indicates that our TCBZ sensitivity assay effectively captured the variation in resistance phenotype among flukes collected from the sympatric population. A notable feature of the drug response profile in TCBZ-S flukes was the concerted suppression of tubulin transcripts. This pattern has been observed during microtubule destabilization induced by combretastatin A-4 (CA4), which binds tubulin at the colchicine site . The changes in tubulin transcript abundance induced by CA4 were shown to be mediated by tubulin autoregulation (occurring at the level of mRNA stability), which was regulated by PI3K activity via changes in microtubule stability and concentration of soluble tubulin dimer . In addition, the most significantly overexpressed gene in TCBZ-R flukes compared to TCBZ-S flukes was an IQGAP that integrates EGFR signaling and links EGFR to PI3K/AKT-mTOR signaling , suggesting that TCBZ-R is likely associated with differences in EGFR-PI3K pathway activity. It has been shown that changes in PI3K activity can affect tubulin dynamics and confer drug resistance to microtubule-targeting agents .
We compared our candidate loci to those identified in a recent UK population study of F. hepatica by Beesley and colleagues . Genetic signatures of TCBZ selection were distinct in each population with no overlap in the selection target, suggesting that TCBZ-R evolved independently in these populations using different sets of adaptive alleles. When a species with wide range of distribution, such as . hepatica, experiences a common novel selection pressure, adaptation across the whole range may require independent origins of the adaptive allele in different geographic regions if genetic exchange between them is not expected . Since the first report of TCBZ-R in F. hepatica in Australia , TCBZ-R has now been demonstrated on at least 30 properties in 11 countries or regions worldwide . Previous reports of genetic differentiation between susceptible and resistant flukes have failed to be replicated in subsequent studies in geographically or genetically diverse strains. Although these inconsistencies may have been due to the limitations of each individual study (e.g., limited sample size, lack of robust phenotyping, etc.), our data suggest that TCBZ-R can arise indecently in different populations using different adaptive alleles, thereby making it more difficult to identify TCBZ-R associated genetic markers that perform consistently across populations. Multiple independent origins of benzimidazole anthelmintic resistance have also been described in parasitic nematodes, although they are characterized by recurrent mutations in a limited set of resistance alleles in beta-tubulin .
Our data suggest that different genes and alleles likely contribute to TCBZ-R in Peru and the UK F. hepatica populations. However, there is a possibility that a common pathway underpins the resistance phenotype in both populations. Beesley et al. highlighted genes in the Ras superfamily, Ras-related protein 1 (RAP1; maker-scaffold10x_157_pilon-snap-gene-0.182), and a class II ADP-ribosylation factor (ARF4/5; maker-scaffold10x_157_pilon-snap-gene-0.197) as prime candidates under selection, although the primary large-effect causal gene could not be
determined due to an extended LD among the genes located on the locus. ARF4 has been shown to interact with EGFR, mediating the activation of phospholipase D2 , to regulate microtubule posttranslational modifications (tubulin acetylation and detyrosination) and stability , as well as to suppress apoptosis . The small GTPase Rap1 can bind and control PI3K and TORC2 activity , and activate the AKT-mTOR pathway . This suggests that modifications in the EGFR-PI3K/AKT-mTOR pathway may play a role in the resistance phenotype in both the UK and Peru . hepatica populations, despite the heterogeneity among selected loci; which is an observation that warrants further investigation. Mechanistic studies using broader sampling of parasites across a larger spatial range, both within and beyond the two countries, will help clarify whether a common pathway-level mechanism is driving TCBZ-R in F. hepatica. Furthermore, these followup studies will be valuable in strengthening our conclusions and demonstrating that the observed differences in TCBZ selection signatures are not merely artifacts of the differing experimental approaches used in each study, which vary significantly in their strengths and limitations. Beesley et al. identified a TCBZ-R-associated locus using bulked segregant analysis of pooled DNA samples collected before and after treatment. While this approach enabled and benefitted from in vivo phenotyping (in contrast to the in vitro assay used in our study), it restricted the detection of alleles contributing to TCBZ-R to those present in a single resistant fluke, selected as the parental line for the F2 mapping population, and to three replicate pools of eggs ( each) from a single farm.
Using a panel of informative SNP markers that show different allele frequencies between TCBZ-S and TCBZ-R flukes, we tested whether it would be possible to predict the TCBZ sensitivity phenotype based on the parasite’s genotype. Using DAPC with the WGS data, a classification accuracy of over was obtained with SNPs, indicating that it would be possible to differentiate between TCBZ-S and -R parasites using an SNP panel based on targeted genotyping approaches, such as amplicon-seq or other cost-effective methods. To further test the feasibility of SNP-based phenotype classification, we constructed a DAPC model using an independent sample set of 152 adult fluke samples ( 78 TCBZ-S and 74 TCBZ-R) genotyped by amplicon-seq. Using the 30 most informative SNPs (identified independently by Random Forest machine learning), it was possible to achieve a prediction accuracy of . Although the panel of SNP markers would benefit from further optimization for maximum informativeness and needs to be validated by testing on additional independent sample sets, including those with intermediate levels of TCBZ-R to confirm its predictive power, our work demonstrates the potential to develop a genetics-based surveillance tool for TCBZ-R. However, considering that the loci under TCBZ selection may vary between populations, as has been observed between the Peru and UK populations, population-specific SNP panels may need to be developed for accurate prediction. Nonetheless, molecular diagnostic tools for TCBZ-R would provide valuable insights into the factors driving the emergence and spread of resistance, supporting the creation of effective TCBZ stewardship strategies and enabling more informed drug policy decisions.
In conclusion, our genome-wide analysis of field . hepatica populations provides evidence that TCBZ-R has independent origins in different geographic populations, supports efforts to develop geneticsbased surveillance tools, and lays the foundation for future studies to investigate the causal relationship between EGFR/PI3K/AKT-mTOR-S6K pathway activity, posttranslational modifications/stability of microtubules, and the survival of the parasite following TCBZ exposure.

Methods

Parasite procurement and whole-genome sequencing

All animal work was approved by the Institutional Ethics Committee for Animal Use at Universidad Peruana Cayetano Heredia (CIEA
Protocol 104472) and the Institutional Animal Care and Use Committee at the University of Texas Medical Branch (IACUC protocol 1907062). Adult F. hepatica parasites were collected from naturally infected cattle at slaughterhouses in the Cusco region of Peru (elevation ). Parasites were exposed to triclabendazole sulfoxide (TCBZ-SO) (Sigma-Aldrich, St. Louis, MO) to characterize their susceptibility to the drug as previously described . Briefly, parasites measuring were collected from the biliary tree of cattle livers condemned at slaughterhouses. Parasites were transported in warm RPMI 1640 (Sigma-Aldrich, St. Louis, MO) supplemented with antibiotic – antimycotic ( 100 units of penicillin, of streptomycin, and of amphotericin B, Gibco, Carlsbad, CA), and washed 5 times with normal saline at upon arrival to the laboratory. Up to 24 fully motile parasites from the same liver were randomly selected for a incubation in 12 well plates, each containing 3 ml of RPMI 1640 supplemented with antibiotic-antimycotic and fetal bovine serum (Biowest, Riverside, MO) at . The eggs produced by these parasites during the incubation period were collected and stored individually for snail infection experiments. After the incubation period, twelve flukes from each liver deemed fully viable using a motility score were selected randomly for TCBZ-SO exposure . Four of these flukes were exposed to susceptible conditions, four were exposed to resistant conditions, and four were used as controls without exposure. To define the susceptible phenotype, parasites were exposed to TCBZ-SO at for 12 h and observed for 48 h to evaluate their motility. Those that developed a motility score of 0 or within the observation period were considered susceptible . To define the resistant phenotype, parasites were incubated in TCBZ-SO at for 24 h and observed for 72 h to evaluate their motility. Those with a motility score of 2 or 3 after the observation period were considered resistant. Phenotypically characterized parasites were washed three times and frozen at until further processing. All other parasites were considered to have an indeterminate susceptibility to TCBZ-SO and were discarded. Genomic DNA from frozen . hepatica parasites was isolated using the phenolchloroform method . Whole parasite tissue was manually disrupted and homogenized in lysis buffer ( 10 mM Tris-HCl pH 7.5, 10 mM EDTA ), -mercaptoethanol (Millipore-Sigma, Burlington, MA), and proteinase K at a final volume of . The homogenate was incubated at overnight. After incubation, phenol-phenol-chloroform-isoamyl alcohol (25:24:1) (Millipore-Sigma, Burlington, MA) solution was added to the homogenate and centrifuged at for 5 min . The aqueous phase was transferred to a new tube, of isopropanol was added, mixed, and then centrifuged at for 15 min to precipitate the DNA. The DNA pellet was washed three times with molecular-grade ethanol and then resuspended with of DNAase-free water. DNA quality and concentration were assessed by spectrophotometry using NanoDrop 2000 (Wilmington, DE, US), and specimens stored at . DNA was precipitated in sodium acetate and absolute alcohol, air dried, and shipped to the Washington University in St. Louis McDonnell Genome Institute for genome sequencing . To remove salt, the DNA pellet was resuspended in of ethanol, then centrifuged at at for at least 5 min . After the supernatant was removed, the DNA pellet was air-dried and resuspended in Buffer EB. A Kapa Hyper PCR-free library was generated from the DNA samples and sequenced on Illumina’s NovaSeq platform using paired-end reads.

Genome-wide variant and selection scan analyses

Sequencing reads were adapter/quality trimmed using trimmomatic and aligned against the combined reference assembly of the . hepatica nuclear, mitochondria, and neorickettsia genomes (GenBank accession: GCA_900302435, NC_002546 and NZ_LNGI01000001) using BWA v0.7.17 . Duplicate reads were removed, and single-nucleotide
variants (SNPs) were called using GATK v4.2.2 . The following set of quality filters were applied to obtain high-confidence genotype calls in GATK: ; ; -12.5; ReadPosRankSum <-8; DP > ( median depth) . Variants were annotated according to their genomic locations and predicted coding effects using SnpEff v5.0c . The gene models of candidate genes were manually curated to ensure accurate variant annotation and predicted coding effects (Supplementary Note 1). Genomic regions exhibiting copy number variations (CNVs) were identified using CNVcaller , and SNPs overlapping duplicated CNV regions with copy number >2 were excluded from downstream analysis. To further remove false positive calls, Hardy-Weinberg exact test-based filtering was applied with value cutoff of . Sites with missing genotypes or minor allele frequency were removed prior to multidimensional scaling (MDS) and association analysis. MDS was performed using a subset of SNPs after pruning based on LD using PLINK v1.9 with the following parameters: a window size of 100 variants, step size of 5 , and a variance inflation factor of . Kinship analysis was performed to identify closely related samples, including clonemates, using the KING method implemented in AKT v0.3.3 . Inbreeding coefficients ( ) were calculated in PLINK v1.9 to identify samples with excessive heterozygosity, likely indicative of sample contamination or non-diploid karyotypes. Linkage disequilibrium decay analysis was performed using PopLDdecay v3.42 . Wright’s fixation index ( ) between TCBZ-S and TCBZ-R populations was estimated for each individual SNP in PLINK v1.9 , and a slidingwindow method was applied to identify genomic regions with elevated levels of differentiation using GenWin package v0.1 in . Window boundaries were determined based on the inflection points of a cubic smoothing spline that were fitted to the estimates for individual variants. Analysis was run with a smoothing parameter of 1000, which controls how aggressively information is combined over windows of adjacent markers. value for each genomic window was calculated based on both the magnitude of the estimates and the number of linked variants (i.e., haplotype block length) and was used to identify outlier genomic regions. The null distribution of the was estimated by permuting the phenotype labels 20,000 times, and empirical values were derived for each genomic window to provide statistical support (Supplementary Note 2). To help interpret the results, proteincoding genes were annotated using results from InterProScan v5.59 to identify Gene Ontology classifications and InterPro functional domains , and BlastKOALA v2.3 to assign KEGG annotations. Additional annotation was performed using PANNZER2 , Sma3s v2 , eggNOG6.0 , and the STRING database v12.0 .

Generation of TCBZ-S and -R metacercariae

Fasciola eggs produced by adult parasites during the 48 h of incubation before drug exposure were collected and classified as TCBZ-S or TCBZ-R according to the results of the drug exposure experiments on the adult parents. Groups of eggs from the same parasite were washed in normal saline, resuspended in distilled water, and incubated together in complete darkness at for 2 weeks as described previously . After incubation, the eggs were exposed to a direct light source for one hour to induce hatching. Miracidia that emerged from the same group of eggs were used to infect secondgeneration snail colonies kept in the laboratory for these experiments. Two miracidia emerging from the same phenotypically characterized group of eggs were placed in a well of a 96 well plate in the presence of a single snail. Snail infections were confirmed by microscopy, and snail cohorts infected with miracidia emerging from the same group of eggs were created. Each snail cohort was kept in the same container in the laboratory, fed at libitum, and exposed to 12 h cycles of light and darkness. After 55 days, groups of 10 snails from the same cohort were placed inside a plastic bag containing chilled water and exposed to a direct light source for a total of 60 min to induce the release of cercariae. Metacercariae adhered to
the inside of the plastic bag from the same snail cohort and known TCBZ susceptibility were collected and kept in water at until used.

Generation of TCBZ-S and -R adult . hepatica parasites

We used the rabbit model of Fasciola infection to obtain F1 adult parasites from parental flukes with a well-characterized TCBZ susceptibility phenotype . We purchased Californian rabbits weighing from a local vendor in a non-endemic area of Peru. Rabbits were brought to the animal care facility at Universidad Peruana Cayetano Heredia and kept in individual collector cages with filtered water and dry feed at libitum. On arrival, all animals tested negative for Fasciola infection three times using microscopy of stool samples collected in consecutive days and were treated with toltrazuril/fenbendazole/praziquantel to eliminate other potential helminth infections . Two weeks later, rabbits were infected orally with groups of 40 TCBZ-S or TCBZ-R metacercariae. Each group of metacercariae was formed by collecting 20 metacercariae from two different snail cohorts with the same TCBZ susceptibility profile. For this study, one male rabbit was infected with one group of TCBZ-S metacercaria, and one male rabbit was infected with one group of TCBZ-R metacercariae generated from eggs and snails collected in the Cusco region. We tested daily individual rabbit stool samples for Fasciola eggs using microscopy starting at day 15 post-infection and continued testing until both rabbits were passing eggs and the three-day mean egg count reached a steady state. Two weeks after steady state mean egg counts were reached (day 84 post infection), we euthanized the rabbits and immediately dissected their livers to obtain adult . hepatica parasites from the bile ducts. Parasites were immediately washed in warm normal saline and individually placed in a well of a 12 well plate containing RPMI 1640 supplemented with antibiotic-antimycotic and fetal bovine serum and incubated for 48 h at . The newly obtained adult flukes were grouped according to the TCBZ susceptibility of their phenotypically characterized progenitors and used for TCBZ exposure experiments at varying times and concentrations.

Triclabendazole exposure experiments and RNA-seq transcriptional profiling

Fully motile adult parasites obtained from the rabbit infections were separated into two groups according to their TCBZ-S ( ) or TCBZ characteristics (Supplementary Fig. 4). Parasites were exposed to sublethal concentrations of TCBZ-SO for different periods of time to evaluate transcriptional responses associated with drug exposure. Parasites in each group were exposed to TCBZ-SO concentrations of or for 2 or 6 h . Two (TCBZ-S) or three (TCBZ-R) controls with no TCBZ-SO exposure depending on parasite availability were included with each exposure time and collected at times zero (pre-exposure), 2 , and 6 h . When the number of parasites allowed it, each experimental condition was replicated three times. Parasites were collected separately at each time point, washed in PBS (Corning, Manassas, VA), preserved in RNAlater (Invitrogen, Carlsbad, CA), and frozen at . RNA extraction from parasite tissue was performed using a protocol combining TRIzol (Invitrogen, Carlsbad, CA) and HiBind RNA Spin Columns (Omega Bio-Tek, Norcross, GA) as described previously with the following modifications . Each parasite was placed in a 50 ml Falcon tube containing 7.5 ml TRIzol and 1 ml of molecular grade -mercaptoethanol, mechanically disrupted, and incubated for 5 min at room temperature. At the end of incubation, 1.5 ml of molecular grade chloroform (Sigma-Aldrich, St. Louis, MO) was added, the tube was shaken vigorously for 15 s , and centrifuged at at for 15 min . The aqueous phase formed in the tube was transferred into a 5 ml RNAsefree tube, 2.5 ml of chilled 70% ethanol was added to the sample and shaken vigorously for 15 s . Seven hundred microliters of this solution, including any precipitate, were transferred into the HiBind RNA Spin
Columns and centrifuged at for 5 min . This step was repeated until all the solution was passed through the column. Then, the RNA was washed by adding of chilled ethanol to the column and centrifuging it at for 5 min for a total of three cycles. The silica columns were dried by centrifugation at for 1 min , and RNA was eluted in of nuclease-free water and stored at . Before shipment to the Washington University in St. Louis McDonnell Genome Institute for RNA sequencing, RNA specimens were transferred to GenTegra-RNA Screw Cap Tubes (GenTegra, Pleasanton, CA) following the manufacturer’s instructions. RNA was reconstituted in nucleasefree water, and quality was assessed using a Bioanalyzer. A Clontech SMARTer universal low-input RNA library was constructed and sequenced on Illumina’s NovaSeq platform using paired-end reads. Sequencing reads were adapter/quality trimmed using trimmomatic v0.39 and then mapped to the F. hepatica genome (GenBank accession: GCA_900302435) using HISAT2 v2.2.1 . Mapped fragments (read pairs) were quantified using featureCounts v2.0.3 , and relative gene expression values (fragments per kilobase per million reads mapped to genes, FPKM) were calculated. DESeq2 v1.38.3 was used to perform differential gene expression analysis using the raw fragment counts per gene per sample, with an FDR-adjusted value threshold of 0.001 and a minimum fold-change of 2. Untreated TCBZ-S and -R flukes were compared to each other to ascertain baseline transcriptional differences. In addition, TCBZ-treated flukes were compared to untreated controls, independently for TCBZ-S and -R flukes to investigate the treatment response. Exposure time and drug concentration were treated as batch effects. Gene set enrichment analysis was performed using the Over-Representation Analysis (ORA) statistical tool provided in WebGestalt v2019 , using (i) KEGG annotations, (ii) InterPro domain annotations, and (iii) tissue assignments based on . mansoni reciprocal best hit results (BLAST 2.12.0+) and previous scRNA-seq analysis . GOstats v2.64.0 was also used to perform functional enrichment analysis based on Gene Ontology annotations . All significant results were FDR-corrected for the number of tests run and required a minimum of 3 genes representing a category/pathway. REVIGO was used to summarize the lists of Gene Ontology terms for visualization.

Amplicon panel design and targeted sequencing (amplicon-seq)

The xGen Custom Amplicon Panel (IDT, Coralville, IA) was developed based on the top 300 index variants (identified as described in the next section) (Supplementary Data 9). When it was not possible to design primers for an index SNP, primers were designed to target a proxy SNP that is in LD with the index SNP. The xGen Amplicon Core Kit (IDT, Coralville, IA) was used to prepare amplicon libraries for Illumina sequencing, following the manufacturer’s protocol. The libraries were sequenced on Illumina’s NovaSeq platform using paired-end reads. Using eight Fasciola genomic DNA samples, the performance of the amplicon panel was assessed, and primer pairs that resulted in higher amounts of off-target products were removed from the panel (Supplementary Data 10). The final revised amplicon panel (IDT xGen custom amplicon panel cp727), targeting 289 SNP loci, was used for subsequent genotyping experiments with an independent set of 80 TCBZ-S and 80 TCBZ-R samples. Adaptor trimming, reference alignment, and variant calling were performed as described for wholegenome sequencing samples, except that GATK v4.2.2 was run only over the genomic intervals corresponding to the amplicon target loci, and no maximum depth filter (DP) was applied during the variant filtration step. Coverage statistics were calculated for each sample using Picard v2.26.2 (CollectTargetedPcrMetrics) . Genotyping accuracy of amplicon-seq was assessed for each target loci by comparing the genotype calls to those from WGS data using 10 replication samples (i.e., the same DNA samples genotyped using both WGS and ampliconseq). Loci with genotype concordance and missing call rates ( ) were used for discriminant analysis. To identify and
exclude clonemates and closely related individuals among the amplicon-seq samples, PLINK v1.9 (–rel-cutoff) was used for relationship-based pruning with a maximum cutoff value of 0.7 , resulting in a final set of 152 fluke samples ( 78 TCBZ-S and 74 TCBZ-R), with 8 samples removed.

Discriminating TCBZ sensitivity phenotype using a panel of SNP markers

Discriminant analysis of principal components (DAPC; adegenet v2.1.10) was used to test if phenotypic classification is possible using a set of SNP markers. To identify informative markers, genotype-phenotype allelic association analysis (Fisher’s exact test with Lancaster’s mid-p adjustment) and LD-based clumping were conducted using PLINK v1.9 . The clumping approach grouped phenotype-associated variants such that significant sites ( value< 0.0001 ) within 250 kb of a representative (most significant) index variant were assigned to that index variant’s clump, given that their to the index was larger than 0.5 (Supplementary Data 9). A ranked list of top 300 index variants was used for the DAPC analysis of the WGS samples, and the classification accuracy (successful re-assignment of individuals to their phenotype group) was assessed as a function of the number of top SNPs used. DAPC classification of the ampliconseq samples was performed using the 30 most informative SNPs, selected based on the Mean Decrease Accuracy (MDA) values from a Random Forest machine learning method implemented in randomForest package v4.7-1.1 , with 10,000 trees and Out-Of-Bag (OOB) evaluation (Supplementary Data 10). A cross-validation analysis was conducted to estimate the classification accuracy when the DAPC model was used to make predictions on data not included in the training set. Using the xvalDapc function of the adegenet package v2.1.10 , we performed leave-pair-out cross-validation with 1000 stratified resamplings, ensuring that each test set included both TCBZ-S and -R samples. This leave-p-out cross-validation technique ( ) is particularly effective for small datasets and provides a nearly unbiased estimate of model performance . Classification accuracy and its statistical significance based on a binomial test were calculated using the caret package v6.0-94 . The confidence intervals for sensitivity and specificity were estimated using the epiR package v2.0.74 . ROC and area under curve (AUC) analyses were performed using the pROC package v1.18.5 .

Reporting summary

Further information on research design is available in the Nature Portfolio Reporting Summary linked to this article.

Data availability

Whole-genome, RNA, and amplicon sequencing data generated in this study have been deposited in the NCBI Sequence Read Archive under BioProject PRJNA916254, with sample accessions listed in Supplementary Data 1, 6, and 10.

Code availability

The command-line arguments used in the analysis are provided in Supplementary Note 2.

References

  1. Furst, T., Duthaler, U., Sripa, B., Utzinger, J. & Keiser, J. Trematode infections: liver and lung flukes. Infect. Dis. Clin. North Am. 26, 399-419 (2012).
  2. Caravedo, M. A. & Cabada, M. M. Human fascioliasis: current epidemiological status and strategies for diagnosis, treatment, and control. Res. Rep. Trop. Med. 11, 149-158 (2020).
  3. Charlier, J. et al. Initial assessment of the economic burden of major parasitic helminth infections to the ruminant livestock industry in Europe. Prev. Vet. Med. 182, 105103 (2020).
  4. Mehmood, K. et al. A review on epidemiology, global prevalence and economical losses of fasciolosis in ruminants. Micro. Pathog. 109, 253-262 (2017).
  5. Sanchez-Vazquez, M. J. & Lewis, F. I. Investigating the impact of fasciolosis on cattle carcase performance. Vet. Parasitol. 193, 307-311 (2013).
  6. Arenal, A. et al. Risk factors for the presence of Fasciola hepatica antibodies in bulk-milk samples and their association with milk production decreases, in Cuban dairy cattle. BMC Vet. Res. 14, 336 (2018).
  7. Schweizer, G., Braun, U., Deplazes, P. & Torgerson, P. R. Estimating the financial losses due to bovine fasciolosis in Switzerland. Vet. Rec. 157, 188-193 (2005).
  8. Lopez, M., White, A. C. Jr. & Cabada, M. M. Burden of Fasciola hepatica Infection among children from Paucartambo in Cusco, Peru. Am. J. Trop. Med. Hyg. 86, 481-485 (2012).
  9. Marcos, L. A. et al. Report of cases of human fascioliosis in the Specialized Children’s Health Institute, Lima, Peru (1988′-2003). Rev. Gastroenterol. Peru. 25, 198-205 (2005).
  10. Yentur Doni, N., Yildiz Zeyrek, F., Simsek, Z., Gurses, G. & Sahin, I. Risk factors and relationship between intestinal parasites and the growth retardation and psychomotor development delays of children in Sanliurfa, Turkey. Turkiye Parazitol. Derg. 39, 270-276 (2015).
  11. Chang Wong, M. R., Pinto Elera, J. O., Guzman Rojas, P., Terashima Iwashita, A. & Samalvides Cuba, F. Demographic and clinical aspects of hepatic fascioliasis between 2013-2010 in National Hospital Cayetano Heredia, Lima, Peru. Rev. Gastroenterol. Peru. 36, 23-28 (2016).
  12. Machicado, C., Machicado, J. D., Maco, V., Terashima, A. & Marcos, L. A. Association of fasciola hepatica infection with liver fibrosis, cirrhosis, and cancer: a systematic review. PLoS Negl. Trop. Dis 10, e0004962 (2016).
  13. Castro-Hermida, J. A., Gonzalez-Warleta, M., Martinez-Sernandez, V., Ubeira, F. M. & Mezo, M. Current challenges for fasciolicide treatment in ruminant livestock. Trends Parasitol. 37, 430-444 (2021).
  14. Kelley, J. M. et al. Current threat of triclabendazole resistance in Fasciola hepatica. Trends Parasitol. 32, 458-469 (2016).
  15. Gandhi, P. et al. Triclabendazole in the treatment of human fascioliasis: a review. Trans. R. Soc. Trop. Med. Hyg. 113, 797-804 (2019).
  16. Kamaludeen, J. et al. Lack of efficacy of triclabendazole against Fasciola hepatica is present on sheep farms in three regions of England, and Wales. Vet. Rec. 184, 502 (2019).
  17. Rose Vineer, H. et al. Increasing importance of anthelmintic resistance in European livestock: creation and meta-analysis of an open database. Parasite 27, 69 (2020).
  18. Olaechea, F., Lovera, V., Larroza, M., Raffo, F. & Cabrera, R. Resistance of Fasciola hepatica against triclabendazole in cattle in Patagonia (Argentina). Vet. Parasitol. 178, 364-366 (2011).
  19. Winkelhagen, A. J., Mank, T., de Vries, P. J. & Soetekouw, R. Apparent triclabendazole-resistant human Fasciola hepatica infection, the Netherlands. Emerg. Infect. Dis. 18, 1028-1029 (2012).
  20. Gil, L. C. et al. Resistant human fasciolasis: report of four patients. Rev. Med. Chil. 142, 1330-1333 (2014).
  21. Belgin, G. et al. Partial Hepatectomy for the Resistant Fasciola hepatica Infection in a Child. APSP J. Case Rep. 6, 27 (2015).
  22. Cabada, M. M. et al. Treatment failure after multiple courses of triclabendazole among patients with fascioliasis in cusco, peru: a case series. PLoS Negl. Trop. Dis. 10, e0004361 (2016).
  23. Branco, E. A., Ruas, R., Nuak, J. & Sarmento, A. Treatment failure after multiple courses of triclabendazole in a Portuguese patient
    with fascioliasis. BMJ Case Rep. 13, https://doi.org/10.1136/bcr-2019-232299 (2020).
  24. Morales, M. L. et al. Triclabendazole treatment failure for Fasciola hepatica Infection among preschool and school-age children, cusco, peru(1). Emerg. Infect. Dis. 27, 1850-1857 (2021).
  25. Maco, V. et al. Efficacy and tolerability of two single-day regimens of triclabendazole for fascioliasis in Peruvian children. Rev. Soc. Bras. Med. Trop. 48, 445-453 (2015).
  26. Meaney, M. et al. Increased susceptibility of a triclabendazole (TCBZ)-resistant isolate of Fasciola hepatica to TCBZ following coincubation in vitro with the P-glycoprotein inhibitor, R(+)-verapamil. Parasitology 140, 1287-1303 (2013).
  27. Robinson, M. W., Lawson, J., Trudgett, A., Hoey, E. M. & Fairweather, I. The comparative metabolism of triclabendazole sulphoxide by triclabendazole-susceptible and triclabendazoleresistant Fasciola hepatica. Parasitol. Res. 92, 205-210 (2004).
  28. Alvarez, L. I. et al. Altered drug influx/efflux and enhanced metabolic activity in triclabendazole-resistant liver flukes. Parasitology 131, 501-510 (2005).
  29. Scarcella, S., Lamenza, P., Virkel, G. & Solana, H. Expression differential of microsomal and cytosolic glutathione-S-transferases in Fasciola hepatica resistant at triclabendazole. Mol. Biochem. Parasitol. 181, 37-39 (2012).
  30. Wilkinson, R. et al. An amino acid substitution in Fasciola hepatica P-glycoprotein from triclabendazole-resistant and triclabendazole-susceptible populations. Mol. Biochem. Parasitol. 186, 69-72 (2012).
  31. Elliott, T. P. & Spithill, T. W. The T687G SNP in a P-glycoprotein gene of Fasciola hepatica is not associated with resistance to triclabendazole in two resistant Australian populations. Mol. Biochem. Parasitol. 198, 45-47 (2014).
  32. Solana, M. V. et al. Different SNPs in Fasciola hepatica P-glycoprotein from diverse Latin American populations are not associated with Triclabendazole resistance. Mol. Biochem. Parasitol. 224, 57-60 (2018).
  33. Radio, S. et al. Pleiotropic alterations in gene expression in Latin American Fasciola hepatica isolates with different susceptibility to drugs. Parasit. Vectors 11, 56 (2018).
  34. Beesley, N. J. et al. A major locus confers triclabendazole resistance in Fasciola hepatica and shows dominant inheritance. PLoS Pathog. 19, e1011081 (2023).
  35. Fernandez-Baca, M. V. et al. The differences in the susceptibility patterns to triclabendazole sulfoxide in field isolates of Fasciola hepatica are associated with geographic, seasonal, and morphometric variations. Pathogens 11, https://doi.org/10.3390/ pathogens11060625 (2022).
  36. Choi, Y. J. et al. Adaptive radiation of the flukes of the family fasciolidae inferred from genome-wide comparisons of key species. Mol. Biol. Evol. 37, 84-99 (2020).
  37. Cwiklinski, K. et al. The Fasciola hepatica genome: gene duplication and polymorphism reveals adaptation to the host environment and the capacity for rapid evolution. Genome Biol. 16, 71 (2015).
  38. McNulty, S. N. et al. Genomes of Fasciola hepatica from the Americas reveal colonization with neorickettsia endobacteria related to the agents of Potomac horse and human sennetsu fevers. PLoS Genet 13, e1006537 (2017).
  39. Morris, G. P. et al. Population genomic and genome-wide association studies of agroclimatic traits in sorghum. Proc. Natl. Acad. Sci. USA 110, 453-458 (2013).
  40. Mather, K. A. et al. The extent of linkage disequilibrium in rice (Oryza sativa L.). Genetics 177, 2223-2232 (2007).
  41. Charlesworth, D. Effects of inbreeding on the genetic diversity of populations. Philos. Trans. R Soc. Lond. B Biol. Sci. 358, 1051-1070 (2003).
  42. Beissinger, T. M., Rosa, G. J., Kaeppler, S. M., Gianola, D. & de Leon, N. Defining window-boundaries for genomic analyses using smoothing spline techniques. Genet Sel. Evol. 47, 30 (2015).
  43. Fernandez, V. et al. A single amino acid substitution in isozyme GST mu in Triclabendazole resistant Fasciola hepatica (Sligo strain) can substantially influence the manifestation of anthelmintic resistance. Exp. Parasitol. 159, 274-279 (2015).
  44. Anders, S. & Huber, W. Differential expression analysis for sequence count data. Genome Biol. 11, R106 (2010).
  45. Falcon, S. & Gentleman, R. Using GOstats to test gene lists for GO term association. Bioinformatics 23, 257-258 (2007).
  46. Nieuwenhuis, J. et al. Vasohibins encode tubulin detyrosinating activity. Science 358, 1453-1456 (2017).
  47. Vitre, B. et al. EB1 regulates microtubule dynamics and tubulin sheet closure in vitro. Nat. Cell Biol. 10, 415-421 (2008).
  48. Redeker, V. et al. Polyglycylation of tubulin: a posttranslational modification in axonemal microtubules. Science 266, 1688-1691 (1994).
  49. Thines, L., Roushar, F. J., Hedman, A. C. & Sacks, D. B. The IQGAP scaffolds: critical nodes bridging receptor activation to cellular signaling. J. Cell Biol. 222, https://doi.org/10.1083/jcb. 202205062 (2023).
  50. Canovas, B. & Nebreda, A. R. Diversity and versatility of p38 kinase signalling in health and disease. Nat. Rev. Mol. Cell Biol. 22, 346-366 (2021).
  51. Gasic, I., Boswell, S. A. & Mitchison, T. J. Tubulin mRNA stability is sensitive to change in microtubule dynamics caused by multiple physiological and toxic cues. PLoS Biol. 17, e3000225 (2019).
  52. Wendt, G. et al. A single-cell RNA-seq atlas of Schistosoma mansoni identifies a key regulator of blood feeding. Science 369, 1644-1649 (2020).
  53. Ndiaye, P. I., Miquel, J., Fons, R. A. & Marchand, B. Spermiogenesis and sperm ultrastructure of the liver fluke Fasciola hepatica L., 1758 (Digenea, Fasciolidae): transmission and scanning electron microscopy, and tubulin immunocytochemistry. Acta Parasitol. 48, 182-194 (2003).
  54. Pantelouris, E. M. & Threadgold, L. T. The excretory system of the adult Fasciola hepatica L. Cellule 64, 61-67 (1963).
  55. Jombart, T., Devillard, S. & Balloux, F. Discriminant analysis of principal components: a new method for the analysis of genetically structured populations. BMC Genet. 11, 94 (2010).
  56. Liaw, A. & Wiener, M. Classification and regression by randomForest. R. N. 2, 18-22 (2002).
  57. Fairweather, I., Brennan, G. P., Hanna, R. E. B., Robinson, M. W. & Skuce, P. J. Drug resistance in liver flukes. Int J. Parasitol. Drugs Drug Resist 12, 39-59 (2020).
  58. Hac, A., Pierzynowska, K. & Herman-Antosiewicz, A. S6K1 is indispensible for stress-induced microtubule acetylation and autophagic flux. Cells 10, https://doi.org/10.3390/ cells10040929 (2021).
  59. Eshun-Wilson, L. et al. Effects of alpha-tubulin acetylation on microtubule structure and stability. Proc. Natl. Acad. Sci. USA 116, 10366-10371 (2019).
  60. LeDizet, M. & Piperno, G. Cytoplasmic microtubules containing acetylated alpha-tubulin in Chlamydomonas reinhardtii: spatial arrangement and properties. J. Cell Biol. 103, 13-22 (1986).
  61. Wattanathamsan, O. et al. Tubulin acetylation enhances lung cancer resistance to paclitaxel-induced cell death through Mcl-1 stabilization. Cell Death Discov. 7, 67 (2021).
  62. Sfakianos, A. P. et al. The mTOR-S6 kinase pathway promotes stress granule assembly. Cell Death Differ. 25, 1766-1780 (2018).
  63. Csukasi, F. et al. The PTH/PTHrP-SIK3 pathway affects skeletogenesis through altered mTOR signaling. Sci. Transl. Med. 10, https://doi.org/10.1126/scitranslmed.aat9356 (2018).
  64. Beaman, E. M., Carter, D. R. F. & Brooks, S. A. GALNTs: master regulators of metastasis-associated epithelial-mesenchymal transition (EMT)? Glycobiology 32, 556-579 (2022).
  65. Han, J. M. & Jung, H. J. Cyclophilin A/CD147 interaction: a promising target for anticancer therapy. Int. J. Mol. Sci. 23, https:// doi.org/10.3390/ijms23169341 (2022).
  66. Ma, Z. et al. Cyclophilin A inhibits A549 cell oxidative stress and apoptosis by modulating the PI3K/Akt/mTOR signaling pathway. Biosci. Rep. 41, https://doi.org/10.1042/BSR20203219 (2021).
  67. Franke, T. F., Hornik, C. P., Segev, L., Shostak, G. A. & Sugimoto, C. PI3K/Akt and apoptosis: size matters. Oncogene 22, 8983-8998 (2003).
  68. Chemale, G. et al. Comparative proteomic analysis of triclabendazole response in the liver fluke Fasciola hepatica. J. Proteome Res. 9, 4940-4951 (2010).
  69. Lemmon, M. A. & Schlessinger, J. Cell signaling by receptor tyrosine kinases. Cell 141, 1117-1134 (2010).
  70. Cwiklinski, K., Robinson, M. W., Donnelly, S. & Dalton, J. P. Complementary transcriptomic and proteomic analyses reveal the cellular and molecular processes that drive growth and development of Fasciola hepatica in the host liver. BMC Genomics 22, 46 (2021).
  71. Walker, S. M. et al. Stage-specific differences in fecundity over the life-cycle of two characterized isolates of the liver fluke, Fasciola hepatica. Parasitology 133, 209-216 (2006).
  72. Brennan, G. P. et al. Understanding triclabendazole resistance. Exp. Mol. Pathol. 82, 104-109 (2007).
  73. Kuo, Y. W. & Howard, J. Cutting, amplifying, and aligning microtubules with severing enzymes. Trends Cell Biol. 31, 50-61 (2021).
  74. Olivares-Ferretti, P., Beltran, J. F., Salazar, L. A. & Fonseca-Salamanca, F. Protein modelling and molecular docking analysis of Fasciola hepatica beta-tubulin’s interaction sites, with triclabendazole, triclabendazole sulphoxide and triclabendazole sulphone. Acta Parasitol. 68, 535-547 (2023).
  75. Robinson, M. W., McFerran, N., Trudgett, A., Hoey, L. & Fairweather, I. A possible model of benzimidazole binding to betatubulin disclosed by invoking an inter-domain movement. J. Mol. Graph Model 23, 275-284 (2004).
  76. Bennett, J. L. & Kohler, P. Fasciola hepatica: action in vitro of triclabendazole on immature and adult stages. Exp. Parasitol. 63, 49-57 (1987).
  77. Hanna, R. Fasciola hepatica: histology of the reproductive organs and differential effects of triclabendazole on drug-sensitive and drug-resistant fluke isolates and on flukes from selected field cases. Pathogens 4, 431-456 (2015).
  78. Akhmanova, A. et al. Clasps are CLIP-115 and -170 associating proteins involved in the regional regulation of microtubule dynamics in motile fibroblasts. Cell 104, 923-935 (2001).
  79. Isakoff, S. J. et al. Breast cancer-associated PIK3CA mutations are oncogenic in mammary epithelial cells. Cancer Res. 65, 10992-11000 (2005).
  80. Ralph, P. & Coop, G. Parallel adaptation: one or many waves of advance of an advantageous allele? Genetics 186, 647-668 (2010).
  81. Overend, D. J. & Bowen, F. L. Resistance of Fasciola hepatica to triclabendazole. Aust. Vet. J. 72, 275-276 (1995).
  82. Redman, E. et al. The emergence of resistance to the benzimidazole anthlemintics in parasitic nematodes of livestock is characterised by multiple independent hard and soft selective sweeps. PLoS Negl. Trop. Dis. 9, e0003494 (2015).
  83. Kim, S. W. et al. ADP-ribosylation factor 4 small GTPase mediates epidermal growth factor receptor-dependent phospholipase D2 activation. J. Biol. Chem. 278, 2661-2668 (2003).
  84. Wesolowski, J. et al. Chlamydia Hijacks ARF GTPases to coordinate microtubule posttranslational modifications and golgi complex positioning. mBio 8, e02280-16 (2017).
  85. Woo, I. S. et al. Identification of ADP-ribosylation factor 4 as a suppressor of N-(4-hydroxyphenyl)retinamide-induced cell death. Cancer Lett. 276, 53-60 (2009).
  86. Khanna, A. et al. The small GTPases Ras and Rap1 bind to and control TORC2 activity. Sci. Rep. 6, 25823 (2016).
  87. Kortholt, A. et al. A Rap/phosphatidylinositol 3-kinase pathway controls pseudopod formation. Mol. Biol. Cell 21, 936-945 (2010).
  88. Cahill, M. E. et al. Bidirectional synaptic structural plasticity after chronic cocaine administration occurs through Rap1 Small GTPase signaling. Neuron 89, 566-582 (2016).
  89. Brecht, K. et al. Exogenous iron increases fasciocidal activity and hepatocellular toxicity of the synthetic endoperoxides OZ78 and MT04. Int. J. Mol. Sci. 20, https://doi.org/10.3390/ ijms20194880 (2019).
  90. Duthaler, U., Smith, T. A. & Keiser, J. In vivo and in vitro sensitivity of Fasciola hepatica to triclabendazole combined with artesunate, artemether, or OZ78. Antimicrob. Agents Chemother. 54, 4596-4604 (2010).
  91. Sambrook, J. & Russell, D. W. Purification of nucleic acids by extraction with phenol:chloroform. CSH Protoc. 2006, pdb.prot4455 (2006).
  92. Tran, L., Toet, H. & Beddoe, T. Environmental detection of Fasciola hepatica by loop-mediated isothermal amplification. PeerJ 10, e13778 (2022).
  93. Bolger, A. M., Lohse, M. & Usadel, B. Trimmomatic: a flexible trimmer for Illumina sequence data. Bioinformatics 30, 2114-2120 (2014).
  94. Li, H. & Durbin, R. Fast and accurate short read alignment with Burrows-Wheeler transform. Bioinformatics 25, 1754-1760 (2009).
  95. McKenna, A. et al. The genome analysis toolkit: a MapReduce framework for analyzing next-generation DNA sequencing data. Genome Res. 20, 1297-1303 (2010).
  96. Van der Auwera, G. A. et al. From FastQ data to high confidence variant calls: the Genome Analysis Toolkit best practices pipeline. Curr. Protoc. Bioinforma. 43, 11.10.1-11.10.33 (2013).
  97. Cingolani, P. et al. A program for annotating and predicting the effects of single nucleotide polymorphisms, SnpEff: SNPs in the genome of Drosophila melanogaster strain w1118; iso-2; iso-3. Fly 6, 80-92 (2012).
  98. Wang, X. et al. CNVcaller: highly efficient and widely applicable software for detecting copy number variations in large populations. Gigascience 6, 1-12 (2017).
  99. Purcell, S. et al. PLINK: a tool set for whole-genome association and population-based linkage analyses. Am. J. Hum. Genet 81, 559-575 (2007).
  100. Manichaikul, A. et al. Robust relationship inference in genomewide association studies. Bioinformatics 26, 2867-2873 (2010).
  101. Arthur, R., Schulz-Trieglaff, O., Cox, A. J. & O’Connell, J. AKT: ancestry and kinship toolkit. Bioinformatics 33, 142-144 (2017).
  102. Zhang, C., Dong, S. S., Xu, J. Y., He, W. M. & Yang, T. L. PopLDdecay: a fast and effective tool for linkage disequilibrium decay analysis based on variant call format files. Bioinformatics 35, 1786-1788 (2019).
  103. Jones, P. et al. InterProScan 5: genome-scale protein function classification. Bioinformatics 30, 1236-1240 (2014).
  104. Gene Ontology, C. The gene ontology resource: enriching a GOId mine. Nucleic Acids Res. 49, D325-D334 (2021).
  105. Blum, M. et al. The InterPro protein families and domains database: 20 years on. Nucleic Acids Res. 49, D344-D354 (2021).
  106. Kanehisa, M., Sato, Y. & Morishima, K. BlastKOALA and GhostKOALA: KEGG tools for functional characterization of genome and metagenome sequences. J. Mol. Biol. 428, 726-731 (2016).
  107. Kanehisa, M., Furumichi, M., Sato, Y., Ishiguro-Watanabe, M. & Tanabe, M. KEGG: integrating viruses and cellular organisms. Nucleic Acids Res. 49, D545-D551 (2021).
  108. Toronen, P. & Holm, L. PANNZER-A practical tool for protein function prediction. Protein Sci. 31, 118-128 (2022).
  109. Casimiro-Soriguer, C. S., Munoz-Merida, A. & Perez-Pulido, A. J. Sma3s: A universal tool for easy functional annotation of proteomes and transcriptomes. Proteomics 17, https://doi.org/10. 1002/pmic. 201700071 (2017).
  110. Hernandez-Plaza, A. et al. eggNOG 6.0: enabling comparative genomics across 12535 organisms. Nucleic Acids Res. 51, D389-D394 (2023).
  111. Szklarczyk, D. et al. The STRING database in 2023: protein-protein association networks and functional enrichment analyses for any sequenced genome of interest. Nucleic Acids Res. 51, D638-D646 (2023).
  112. Fairweather, I. et al. Development of an egg hatch assay for the diagnosis of triclabendazole resistance in Fasciola hepatica: proof of concept. Vet. Parasitol. 183, 249-259 (2012).
  113. Robles-Perez, D., Martinez-Perez, J. M., Rojo-Vazquez, F. A. & Martinez-Valladares, M. Screening anthelmintic resistance to triclabendazole in Fasciola hepatica isolated from sheep by means of an egg hatch assay. BMC Vet. Res. 11, 226 (2015).
  114. Jarujareet, W., Taira, K. & Ooi, H. K. Dynamics of liver enzymes in rabbits experimentally infected with Fasciola sp. (Intermediate form from Japan). J. Vet. Med. Sci. 80, 36-40 (2018).
  115. Kandil, O. M. et al. Anthelmintic efficacy of Moringa oleifera seed methanolic extract against Fasciola hepatica. J. Parasit. Dis. 42, 391-401 (2018).
  116. Maggioli, G. et al. A recombinant thioredoxin-glutathione reductase from Fasciola hepatica induces a protective response in rabbits. Exp. Parasitol. 129, 323-330 (2011).
  117. Mooney, L., Good, B., Hanrahan, J. P., Mulcahy, G. & de Waal, T. The comparative efficacy of four anthelmintics against a natural acquired Fasciola hepatica infection in hill sheep flock in the west of Ireland. Vet. Parasitol. 164, 201-205 (2009).
  118. White, P. RNA extraction from mammalian tissues. Methods Mol. Biol. 362, 315-327 (2007).
  119. Kim, D., Paggi, J. M., Park, C., Bennett, C. & Salzberg, S. L. Graphbased genome alignment and genotyping with HISAT2 and HISAT-genotype. Nat. Biotechnol. 37, 907-915 (2019).
  120. Liao, Y., Smyth, G. K. & Shi, W. FeatureCounts: an efficient general purpose program for assigning sequence reads to genomic features. Bioinformatics 30, 923-930 (2014).
  121. Liao, Y., Wang, J., Jaehnig, E. J., Shi, Z. & Zhang, B. WebGestalt 2019: gene set analysis toolkit with revamped UIs and APIs. Nucleic Acids Res. 47, W199-W205 (2019).
  122. Supek, F., Bosnjak, M., Skunca, N. & Smuc, T. REVIGO summarizes and visualizes long lists of gene ontology terms. PLoS ONE 6, e21800 (2011).
  123. Smith, G. C., Seaman, S. R., Wood, A. M., Royston, P. & White, I. R. Correcting for optimistic prediction in small data sets. Am. J. Epidemiol. 180, 318-324 (2014).
  124. Kuhn, M. Building predictive models in R using the caret package. J. Stat. Softw. 28, 1-26 (2008).
  125. Stevenson, M. et al. EpiR: an R package for the analysis of epidemiological data. 1, 9-43 (2013).
  126. Robin, X. et al. pROC: an open-source package for R and S+ to analyze and compare ROC curves. BMC Bioinforma. 12, 77 (2011).

Acknowledgements

This work was supported by the National Institute of Allergy and Infectious Diseases of the National Institutes of Health under Grant Number 1RO1Al146353, awarded to M.M.C. and M.M.

Author contributions

Conceived and designed the study: M.M.C. and M.M. Collected specimens: M.V.F., R.A.O., P.O., and C.H. Biological and sequence data database maintenance: Y.C., B.A.R., J.M. Sample preparation and extraction of DNA: M.V.F., R.A.O., and C.H. Performed data analysis: Y.C., B.A.R., J.M. Interpreted the data: Y.C., B.A.R., M.M.C. and M.M. Wrote the paper: Y.C., B.A.R., M.M.C. and M.M. All authors approve the manuscript for publication.

Competing interests

The authors declare no competing interests.

Additional information

Supplementary information The online version contains

supplementary material available at
https://doi.org/10.1038/s41467-025-57796-5.
Correspondence and requests for materials should be addressed to Miguel M. Cabada or Makedonka Mitreva.
Peer review information Nature Communications thanks Stephen Doyle and the other anonymous reviewer(s) for their contribution to the peer review of this work. A peer review file is available.
Reprints and permissions information is available at http://www.nature.com/reprints
Publisher’s note Springer Nature remains neutral with regard to jurisdictional claims in published maps and institutional affiliations.
Open Access This article is licensed under a Creative Commons Attribution-NonCommercial-NoDerivatives 4.0 International License, which permits any non-commercial use, sharing, distribution and reproduction in any medium or format, as long as you give appropriate credit to the original author(s) and the source, provide a link to the Creative Commons licence, and indicate if you modified the licensed material. You do not have permission under this licence to share adapted material derived from this article or parts of it. The images or other third party material in this article are included in the article’s Creative Commons licence, unless indicated otherwise in a credit line to the material. If material is not included in the article’s Creative Commons licence and your intended use is not permitted by statutory regulation or exceeds the permitted use, you will need to obtain permission directly from the copyright holder. To view a copy of this licence, visit http:// creativecommons.org/licenses/by-nc-nd/4.0/.
(c) The Author(s) 2025

  1. ¹Division of Infectious Diseases, Department of Medicine, Washington University School of Medicine, St. Louis, MO, USA. ²Sede Cusco, Instituto de Medicina Tropical “Alexander von Humboldt”, Universidad Peruana Cayetano Heredia, Cusco, Peru. Laboratorio de Inmunología, Facultad de Ciencias Veterinarias, Universidad Nacional de Cajamarca, Cajamarca, Peru. Division of Infectious Diseases, Department of Internal Medicine, University of Texas Medical Branch, Galveston, TX, USA. e-mail: micabada@utmb.edu; mmitreva@wustl.edu