DOI: https://doi.org/10.1016/j.jretconser.2024.103723
تاريخ النشر: 2024-01-23
جامعة جنوب الدنمارك SDÚ
الأهمية والأداء في PLS-SEM و NCA
تقديم تحليل خريطة الأهمية والأداء المدمجة (cIPMA)
نُشر في:
DOI:
تاريخ النشر:
نسخة الوثيقة:
ترخيص الوثيقة:
الاستشهاد بالنسخة المنشورة (APA):
شروط الاستخدام
ما لم يُذكر خلاف ذلك، فقد تم مشاركته وفقًا للشروط الخاصة بالأرشفة الذاتية.
إذا لم يتم ذكر ترخيص آخر، تنطبق هذه الشروط:
- يمكنك تنزيل هذا العمل للاستخدام الشخصي فقط.
- لا يمكنك توزيع المادة بشكل إضافي أو استخدامها لأي نشاط يهدف إلى الربح أو الكسب التجاري
- يمكنك توزيع عنوان URL الذي يحدد هذه النسخة المفتوحة الوصول بحرية
أهمية وأداء في PLS-SEM وNCA: تقديم تحليل خريطة الأهمية والأداء المدمجة (cIPMA)
معلومات المقال
الكلمات المفتاحية:
تحليل الشرط الضروري
NCA
المربعات الصغرى الجزئية
PLS
PLS-SEM
نمذجة المعادلات الهيكلية
SEM
تحليل خريطة الأهمية والأداء
IPMA
الملخص
يقدم هذا البحث نهجًا جديدًا يوسع تطبيق تحليل خريطة الأهمية والأداء (IPMA) في نمذجة المعادلات الهيكلية باستخدام المربعات الصغرى الجزئية (PLS-SEM) من خلال دمج النتائج من تحليل الشرط الضروري (NCA). يتضمن IPMA تقييم أهمية وأداء المتغيرات الكامنة ومؤشراتها، بينما يقدم NCA بعدًا إضافيًا من خلال تحديد العوامل التي تعتبر حاسمة لتحقيق النتائج المرغوبة. يستخدم NCA منطق الضرورة لتحديد العوامل الأساسية المطلوبة لتحقيق نتيجة، بينما يتبع PLS-SEM منطق الكفاية الإضافية لتحديد العوامل التي يجب أن تكون موجودة والتي تساهم في مستويات الأداء العالية. إن دمج هذين المنطقين في بعد الأداء ذو قيمة خاصة لتحديد أولويات الإجراءات التي يمكن أن تحسن النتائج المستهدفة، مثل رضا العملاء والتزام الموظفين. على الرغم من أن الاستخدام المشترك لـ PLS-SEM و NCA هو اقتراح حديث، فإن هذه الدراسة هي الأولى التي تجمع بينهما مع IPMA (أي، في IPMA المدمجة؛ cIPMA). توضح دراسة حالة الاستخدام المشترك لـ PLS-SEM و NCA لإجراء cIPMA. يعزز هذا النهج المبتكر اتخاذ القرارات للباحثين والممارسين، مما يمكنهم من تحديد أولويات جهودهم بشكل فعال.
1. المقدمة
تعريف مستويات العتبة (انظر، على سبيل المثال، أوه، 2001).
تم استخدام IPMA أيضًا في سياق نمذجة المعادلات الهيكلية باستخدام المربعات الصغرى الجزئية (PLS-SEM)، وهي طريقة متعددة المتغيرات لتقدير العلاقات المعقدة بين البنى ومؤشراتها (هاير وآخرون، 2022، الفصل 1؛ لوهمولر، 1989، الفصل 2؛ وولد، 1982). في العقود الماضية، تطور استخدام PLS-SEM في أبحاث التسويق (غوينتر وآخرون، 2023؛ هاير وآخرون، 2012؛ سارستيدت وآخرون، 2022)، بما في ذلك البيع بالتجزئة وخدمات المستهلك (على سبيل المثال، كاي وآخرون، 2023؛ هيو-تي-الكوسر وهيرنانديز-روخاس، 2022؛ رودريغيز وآخرون، 2020). يسهل PLS-SEM إجراء IPMA، بسبب الطريقة التي تقدر بها الطريقة معلمات النموذج. على وجه التحديد، يقوم PLS-SEM بحساب مركبات المتغيرات المؤشرية لتمثيل البنى في نموذج إحصائي. استخدم الباحثون هذه الدرجات المركبة كتمثيلات لأداء البنى وقارنوها مع التأثيرات الكلية التي تمارسها البنى على هدف معين (على سبيل المثال، كريستنسن وآخرون، 2000؛ رينجل وسارستيدت، 2016؛ ستروكينز وآخرون، 2017). يستند IPMA الأساسي إلى متوسط درجات الأداء والأهمية ومن ثم
استخدمت العديد من الدراسات IPMA في سياق PLS-SEM. على سبيل المثال، في سياق البيع بالتجزئة وخدمات المستهلك، يستند زانغ وآخرون (2023) إلى IPMA للتحقيق في أهمية وأداء المحفزات البيئية لنوايا الشراء داخل المتجر لدى المستهلكين عبر اثنين من بنى الموقف الاستهلاكي. في نموذج قبول التكنولوجيا (TAM)، الذي يتميز أيضًا بشكل بارز في البيع بالتجزئة وخدمات المستهلك (على سبيل المثال، إنغ وآخرون، 2022؛ بيريز-أراندا وآخرون، 2023؛ شهيدي وآخرون، 2022)، يمكن استخدام IPMA لمقارنة التأثير الكلي لسهولة استخدام التكنولوجيا من حيث استخدامها المقصود (أهميتها للبنية المستهدفة) مع متوسط سهولة الاستخدام المدركة من قبل مستخدميها المحتملين (أدائها). وبالتالي، تسمح نتائج IPMA بتحديد العوامل السابقة ذات الأهمية العالية للبنية المستهدفة، والتي، مع ذلك، تظهر أداءً منخفضًا نسبيًا. هذه المعلومات حاسمة، حيث تشير إلى كيفية تحديد أولويات الإجراءات لتحسين هذه البنى السابقة، مما سيزيد بشكل كبير من البنية المستهدفة. على سبيل المثال، تشير الأهمية العالية لسهولة الاستخدام، جنبًا إلى جنب مع تقييم سهولة الاستخدام الضعيف للتكنولوجيا (أي، أداء ضعيف)، إلى حاجة محددة لتحسين سهولة استخدام هذه التكنولوجيا لزيادة استخدامها في النهاية.
نحن نؤكد أنه يمكن أن يثري تحديد الشروط الضرورية أيضًا تحليل الأهمية النسبية (IPMA) من خلال توفير معلومات حول ضرورة البنى السابقة. توفر هذه المعلومات للباحثين والممارسين صورة أكثر اكتمالاً عن البنى السابقة المهمة والضرورية، بينما تساعد أيضًا في تكملة نتائج تحليل الأهمية النسبية. من خلال اتباع نتائج نموذج المسار لفائدة التكنولوجيا المدركة، قد يجد الباحثون الذين يقيمون قبول المستهلك للتقنيات الجديدة، على سبيل المثال، أن هذه الفائدة ليست ذات أهمية كبيرة، على الرغم من أنها شرط ضروري لاستخدام التكنولوجيا. بعبارة أخرى، لن يتم استخدام التكنولوجيا ما لم يتم إدراكها على أنها مفيدة. بينما قد يتلقى بناء سابق ذو أهمية قليلة وفقًا لنتائج تحليل الأهمية النسبية (PLS-SEM) اهتمامًا ضئيلًا من تحليل الأهمية النسبية الكلاسيكي، إلا أنه قد يمثل شرطًا ضروريًا، مما يجعله مرة أخرى محور اتخاذ القرار عندما يتم دمج تحليل الأهمية النسبية مع تحليل الشروط الضرورية (NCA).
2. الأهمية والأداء في PLS-SEM
مهم للبناء المستهدف، على الرغم من أنهم يؤدون بشكل ضعيف نسبيًا في الوقت نفسه.
لذا، فإن التأثير غير المباشر الإجمالي لـ
حيث
الأهمية المتوسطة
الأداء المتوسط
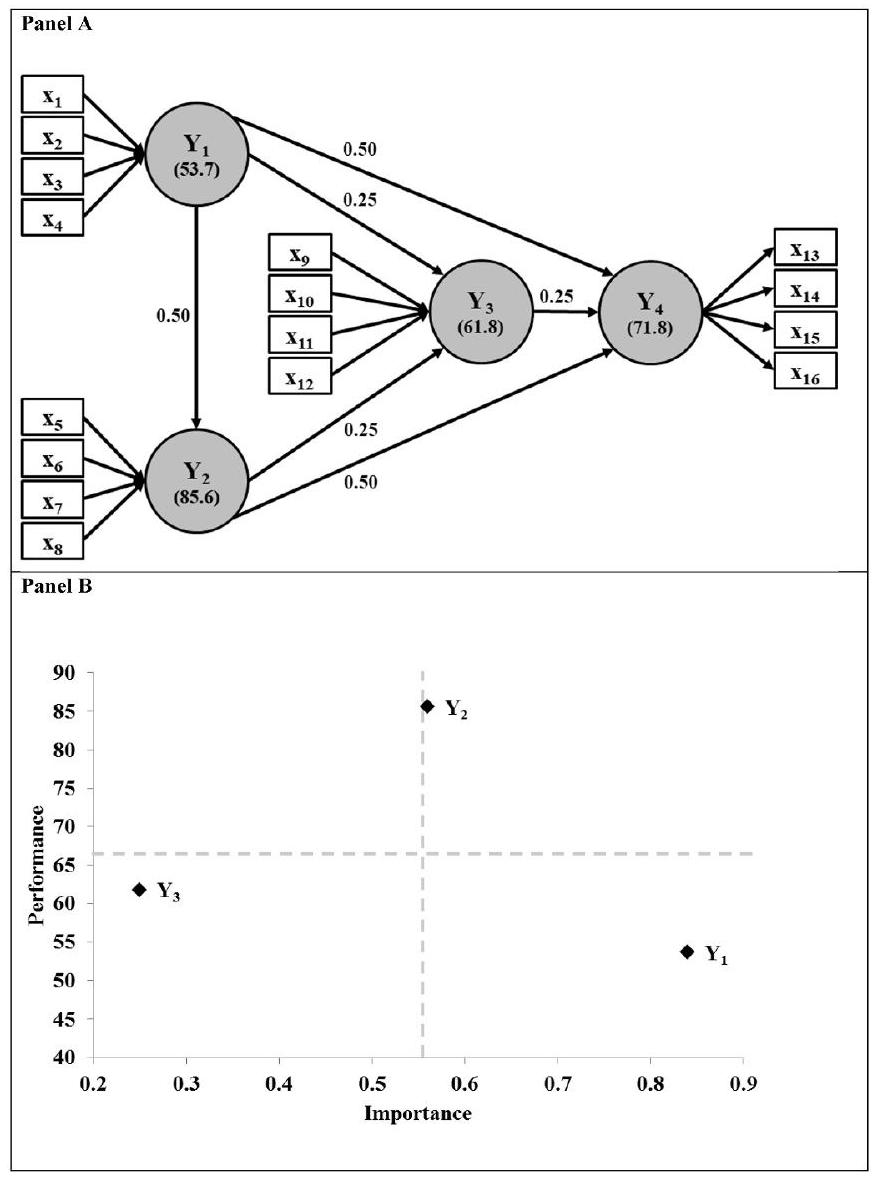
يمكن للباحثين الذين يستخدمون IPMA استخدام هذه الدرجات المتوسطة ورسمها على خريطة الأهمية والأداء إلى أربعة أرباع منفصلة. ومع ذلك، قد يعتمد الباحثون على منطق مختلف عند تقسيم الأرباع الأربعة، مثل المعرفة السابقة أو تقييم الخبراء. يؤدي الجمع بين الأهمية العالية/المنخفضة والأداء العالي/المنخفض إلى توصيات محددة، تستهدفها البنى السابقة من خلال الأنشطة الإدارية (Ringle و Sarstedt، 2016).
3. الأهمية والأداء في NCA
المناطق في الرسوم البيانية المبعثرة بدون ملاحظات عن تلك التي تحتوي على ملاحظات. من خلال تقسيم المساحة ‘الفارغة’ (المعروفة أيضًا باسم منطقة السقف) على المساحة الكاملة التي تشمل الملاحظات (المعروفة أيضًا باسم النطاق)، يحسب NCA حجم تأثير الضرورة
4. إرشادات لتحليل خريطة الأهمية والأداء المدمجة
4.1. مقاييس قياس المؤشرات (الخطوة 2)
4.2. التحقق من المتطلبات الإضافية عند تقييم نماذج القياس (الخطوة 4)
4.3. قم بتشغيل IPMA ونقل درجات المتغيرات الكامنة (الخطوة 5)
4.4. قم بتشغيل NCA (الخطوة 6)
درجات المؤشر إذا كانت هناك نماذج قياس تكوينية (كما أوضح ريشتر وآخرون، 2020؛ ريشتر وآخرون، 2023ب؛ هير وآخرون، 2024، الفصل 4). يمكن أن تشير NCA إلى النطاق التجريبي أو النظري لبيانات المدخلات. في سياق NCA، التوصية العامة هي استخدام النطاق التجريبي، حيث إنه ينتج تقديرًا أكثر تحفظًا لحجم التأثير (دول، 2020، الفصل 4) – نحن نتفق مع هذه التوصية. أي أننا نستخدم درجات المتغير الكامن المعاد قياسها من IPMA في PLS-SEM كبيانات مدخلات ونشير إلى نطاقها التجريبي (الذي قد لا يكون بالضرورة من 0 إلى 100).
حدد الفرضيات وفقًا لمنطق الكفاية والضرورة (للحالة الأخيرة، انظر بوكرا نتز ودول، 2023؛ ريشتر وهاوف، 2022).*
حجم العينة: اتبع الإرشادات المتعلقة بحجم العينة كما هو موضح في سياق PLS-SEM، على سبيل المثال، من خلال الرجوع إلى جداول القوة المنشورة (Hair et al.، 2022، الفصل 1).
توزيع البيانات: تقرير المعلومات حول توزيع البيانات (Hair وآخرون، 2012).
القيم الشاذة: قم بإجراء تحليل للقيم الشاذة من خلال اتباع الإرشادات الشائعة، مثل فحص الملاحظات التي تظهر قيمة zscore > 3 (سارستيد وموي، 2019، الفصل 5).*
استخدم PLS-SEM لتقدير درجات المتغيرات الكامنة، وعلاقات النموذج الهيكلي، وأهميتها (هار وآخرون، 2022، الفصل 6).
استخدم إرشادات التقييم في سياق PLS-SEM لتقييم جودة نماذج القياس (مثل، غونتر وآخرون، 2023؛ هير وآخرون، 2022، الفصول 4 و5؛ سارستيد وآخرون 2021). فيما يتعلق بالبناءات الانعكاسية، قم بتقييم تحميلاتها، وكرونباخ.
قم بتشغيل IPMA في PLS-SEM باستخدام القيم النظرية الدنيا والقصوى لمقاييس المؤشرات كمدخلات (رينجل وسارستيد، 2016).
قم بتشغيل تحليل NCA في SmartPLS (انظر أيضًا Richter et al.، 2023b) أو R (الإعدادات الافتراضية؛ أي، استخدم النطاق التجريبي لبيانات الإدخال؛ 10,000 تكرار) (Dul، 2020، الفصل 4). قم بتشغيل التحليل للعلاقات المفترضة أو جميع العلاقات: المعتمد = درجات المتغيرات الكامنة المستجيبة، المستقل = درجات المتغيرات الكامنة السابقة. اختر خط السقف بناءً على النظرية أو نمط البيانات (Dul، 2020، الفصل 4).* راجع النطاق التجريبي لبيانات الإدخال.
بعد تقييم قيم VIF للنموذج الداخلي، قم بتقييم نموذج PLS-SEM وفقًا لمعايير التقييم القياسية، وخاصة معامل التحديد (
الخطوة 8: تفسير النتائج
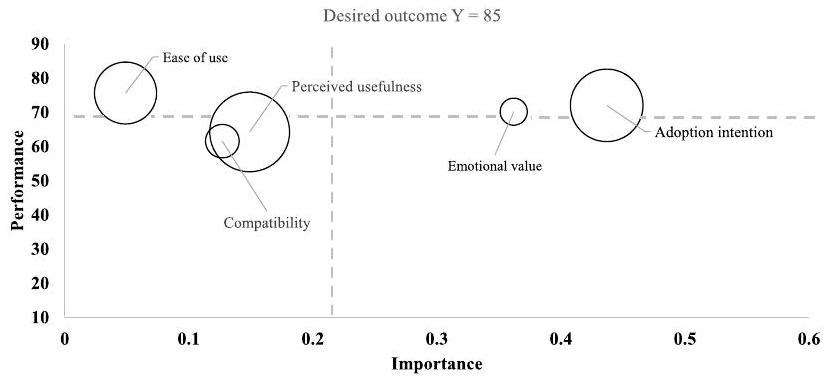
قم بإنتاج مخطط IPMA موسع: ضع البنى بناءً على التأثيرات الإجمالية المعيارية على
الشكل 3. دليل موسع خطوة بخطوة في سياق IPMA المدمجة (cIPMA).
ملاحظة: *تشير إلى أن الخطوات تم تحديثها مقارنةً بـ ريشتر وآخرون (2020).
دراسات الرضا، قد يكون هذا هو درجة رضا الموظفين عن العمل بمعدل 70 (على مقياس من 0 إلى 100) (كما في هاف وآخرون، 2015)، بينما في مشروع تسويقي حول رضا العملاء قد يكون هذا مستوى مرجعي يبلغ 75 أو أكثر، اعتمادًا على الصناعة (على مقياس من 0 إلى 100) (مؤشر رضا العملاء الأمريكي، 2022؛ ريجدون وآخرون، 2010). اعتمادًا على هذه المستويات، قد يحتاج الباحثون إلى تغيير عرض الخطوات في جداول الاختناق الخاصة بهم لإظهار مستوى الأداء المحدد للبناء المستهدف (على سبيل المثال، زيادة عدد الخطوات من 10 إلى 20 ستوفر معلومات حول
4.5. تفسير النتائج (الخطوة 8)
ملاحظة: توسيع المثال المعطى في الشكل 1، اللوحة ب. بالنسبة للمستوى المطلوب من النتيجة: – البناء غير ضروري؛
5. مثال توضيحي لتحليل خريطة الأهمية والأداء المدمجة
5.1. النموذج المفاهيمي، البيانات، وتحليلات PLS-SEM (الخطوات 1 إلى 3)
نموذج.
5.2. تقييم موثوقية وصلاحية نماذج القياس (الخطوة 4)
5.3. قم بتشغيل IPMA ونقل درجات المتغيرات الكامنة (الخطوة 5)
5.4. قم بتشغيل NCA (الخطوة 6)
القيم الفعلية، التي توفر المستويات اللازمة للبنى السابقة التي تحتاج مستويات استخدام التكنولوجيا المختلفة لتحقيقها، وواحدة مع النسب المئوية للظروف، التي تخبرنا عن عدد ونسبة الحالات التي لم تحقق المستويات المطلوبة للبنى السابقة للمستويات المقابلة لاستخدام التكنولوجيا (انظر الخطوة التالية).
5.5. تقييم النموذج الهيكلي (الخطوة 7)
إجمالي التأثيرات من تحليل PLS-SEM.
| بناء | استخدام التكنولوجيا | ذو دلالة إحصائية
|
|
| التأثيرات الكلية | فترات الثقة بوساطة 95% | ||
| القيمة العاطفية | 0.362 | [0.200; 0.521] | نعم |
| سهولة الاستخدام | 0.049 | [-0.110; 0.215] | لا |
| الفائدة المدركة | 0.149 | [-0.075; 0.357] | لا |
| التوافق | 0.127 | [-0.108; 0.365] | لا |
| نية التبني | 0.437 | [0.268; 0.609] | نعم |
قيم الأداء للمتغيرات الكامنة (معاد ضبطها).
| بناء | قيمة الأداء، متوسط | قيمة الأداء، الحد الأدنى | قيمة الأداء، القصوى |
| استخدام التكنولوجيا | ٤٩.٧١٣ | 0.000 | ١٠٠.٠٠٠ |
| نية التبني | 72.041 | 0.000 | ١٠٠.٠٠٠ |
| القيمة العاطفية | 70.171 | 0.000 | ١٠٠.٠٠٠ |
| سهولة الاستخدام | 75.640 | 16.871 | ١٠٠.٠٠٠ |
| الفائدة المدركة | 64.248 | 0.000 | ١٠٠.٠٠٠ |
| التوافق | ٦١.٥٥٧ | 0.000 | ١٠٠٫٠٠٠ |
أحجام تأثير الضرورة (خط سقف CE-FDH).
| بناء | استخدام التكنولوجيا | |
| حجم التأثير d |
|
|
| القيمة العاطفية | 0.33 | 0.000 |
| سهولة الاستخدام | 0.24 | 0.016 |
| الفائدة المدركة | 0.24 | 0.001 |
| التوافق | 0.21 | 0.000 |
| نية التبني | 0.29 | 0.000 |
استخدام تقنية جدول الاختناق، القيم الفعلية (استنادًا إلى درجات المتغيرات الكامنة في PLS-SEM المعاد قياسها من 0 إلى 100).
| استخدام التكنولوجيا | نية التبني | القيمة العاطفية | سهولة الاستخدام | الفائدة المدركة | التوافق |
| القيم الفعلية (معادلة من 0 إلى 100) | |||||
| 0 | NN | NN | NN | NN | NN |
| ٥ | NN | NN | 25.373 | NN | NN |
| 10 | NN | NN | 25.373 | NN | NN |
| 15 | NN | NN | 25.373 | NN | NN |
| 20 | NN | NN | 25.373 | NN | NN |
| ٢٥ | NN | NN | 25.373 | NN | NN |
| 30 | NN | NN | 25.373 | NN | NN |
| ٣٥ | ٣٣.٨٣٣ | ٤٩.٦٥٠ | ٣٣.٤٦٩ | 15.702 | 25.518 |
| 40 | ٣٣.٨٣٣ | ٤٩.٦٥٠ | ٣٣.٤٦٩ | 15.702 | 25.518 |
| ٤٥ | ٣٣.٨٣٣ | ٤٩.٦٥٠ | ٣٣.٤٦٩ | 15.702 | 25.518 |
| 50 | ٣٣.٨٣٣ | ٤٩.٦٥٠ | ٣٣.٤٦٩ | 15.702 | 25.518 |
| ٥٥ | ٣٣.٨٣٣ | ٤٩.٦٥٠ | ٣٣.٤٦٩ | 15.702 | ٣٣.٦٩٦ |
| 60 | ٣٣.٨٣٣ | ٤٩.٦٥٠ | ٣٣.٤٦٩ | 15.702 | ٣٣.٦٩٦ |
| 65 | ٣٣.٨٣٣ | ٤٩.٦٥٠ | ٣٣٫٤٦٩ | 15.702 | ٣٣.٦٩٦ |
| 70 | ٣٣.٨٣٣ | ٤٩.٦٥٠ | ٣٣.٨٧٥ | ٤٨.١٢٧ | ٣٣.٦٩٦ |
| 75 | ٣٣.٨٣٣ | ٤٩.٦٥٠ | ٣٣.٨٧٥ | ٤٨.١٢٧ | ٣٣.٦٩٦ |
| ٨٠ | ٣٣.٨٣٣ | ٤٩.٦٥٠ | ٣٣.٨٧٥ | ٤٨.١٢٧ | ٣٣.٦٩٦ |
| 85 | 75.000 | ٤٩.٦٥٠ | 66.904 | 66.212 | ٣٣.٦٩٦ |
| 90 | 75.000 | ٤٩.٦٥٠ | 66.904 | 66.212 | ٣٣.٦٩٦ |
| 95 | 75.000 | ٤٩.٦٥٠ | 66.904 | 66.212 | ٣٣.٦٩٦ |
| 100 | 75.000 | ٤٩.٦٥٠ | 66.904 | 66.212 | ٣٣.٦٩٦ |
القيمة العاطفية
5.6. تفسير النتائج (الخطوة 8)
6. الخاتمة
استخدام تقنية جدول الاختناق: القيم الفعلية لاستخدام التقنية (استنادًا إلى درجات المتغيرات الكامنة في PLS-SEM المعاد قياسها من 0 إلى 100) والنسب المئوية للبنى السابقة.
| استخدام التكنولوجيا | نية التبني | القيمة العاطفية | سهولة الاستخدام | الفائدة المدركة | التوافق | |||||
| القيم الفعلية (معادلة من 0 إلى 100) | نسبة (ورقم) الحالات التي لا تحقق المستويات اللازمة | |||||||||
| 0 | 0 | (0) | 0 | (0) | 0 | (0) | 0 | (0) | 0 | (0) |
| ٥ | 0 | (0) | 0 | (0) | 0.6 | (1) | 0 | (0) | 0 | (0) |
| 10 | 0 | (0) | 0 | (0) | 0.6 | (1) | 0 | (0) | 0 | (0) |
| 15 | 0 | (0) | 0 | (0) | 0.6 | (1) | 0 | (0) | 0 | (0) |
| 20 | 0 | (0) | 0 | (0) | 0.6 | (1) | 0 | (0) | 0 | (0) |
| ٢٥ | 0 | (0) | 0 | (0) | 0.6 | (1) | 0 | (0) | 0 | (0) |
| 30 | 0 | (0) | 0 | (0) | 0.6 | (1) | 0 | (0) | 0 | (0) |
| ٣٥ | ٤.٦ | (8) | ٥.٧ | (10) | 1.1 | (2) | 1.7 | (3) | ٥.٧ | (10) |
| 40 | ٤.٦ | (8) | ٥.٧ | (10) | 1.1 | (2) | 1.7 | (3) | 5.7 | (10) |
| ٤٥ | ٤.٦ | (8) | 5.7 | (10) | 1.1 | (2) | 1.7 | (3) | 5.7 | (10) |
| 50 | ٤.٦ | (8) | 5.7 | (10) | 1.1 | (2) | 1.7 | (3) | ٥.٧ | (10) |
| ٥٥ | ٤.٦ | (8) | 5.7 | (10) | 1.1 | (2) | 1.7 | (3) | ٨.٦ | (15) |
| 60 | ٤.٦ | (8) | 5.7 | (10) | 1.1 | (2) | 1.7 | (3) | ٨.٦ | (15) |
| 65 | ٤.٦ | (8) | 5.7 | (10) | 1.1 | (2) | 1.7 | (3) | ٨.٦ | (15) |
| 70 | ٤.٦ | (8) | ٥.٧ | (10) | 2.9 | (5) | 17.2 | (30) | ٨.٦ | (15) |
| 75 | ٤.٦ | (8) | 5.7 | (10) | 2.9 | (5) | 17.2 | (30) | ٨.٦ | (15) |
| ٨٠ | ٤.٦ | (8) | 5.7 | (10) | 2.9 | (5) | 17.2 | (30) | ٨.٦ | (15) |
| 85 | ٣٩.١ | (68) | 5.7 | (10) | ٢٨.٧ | (50) | ٤٧.١ | (82) | ٨.٦ | (15) |
| 90 | ٣٩.١ | (68) | 5.7 | (10) | ٢٨.٧ | (50) | ٤٧.١ | (82) | ٨.٦ | (15) |
| 95 | ٣٩.١ | (68) | 5.7 | (10) | ٢٨.٧ | (50) | ٤٧.١ | (82) | ٨.٦ | (15) |
| 100 | ٣٩.١ | (68) | 5.7 | (10) | ٢٨.٧ | (50) | ٤٧.١ | (82) | 8.6 | (15) |
من منظور، يمكن أن يمثل هذا في النهاية زيادة في الإمكانيات المستقبلية للبناء السابق في IPMA. ثانياً، استناداً إلى نتائج PLS-SEM، تشير أهمية IPMA إلى التأثيرات الكلية لجميع البنى المعنية. بعبارة أخرى، تشمل هذه التأثيرات كل من الروابط المباشرة وغير المباشرة. هذه التأثيرات غير المباشرة أو التأثيرات الوسيطة لا تؤخذ حالياً بعين الاعتبار بشكل صريح في CIPMA المقترح. لذلك، نشجع الأبحاث المستقبلية على تطوير أفكار لتحليل علاقات الوساطة في سياق NCA، والتي يمكن استخدامها في النهاية في cIPMA.
بيان مساهمة مؤلفي CRediT
إعلان عن تضارب المصالح
توفر البيانات
الملحق
وصف البيانات
| متغير كامن (القياس مأخوذ من) | مؤشر | معنى | النطاق [الحد الأدنى; الحد الأقصى] | س.د. | الكورتوز الزائد | الانحراف | |
| القيمة العاطفية، التأملية (سوينى وسوتار، 2001) | EMV_01 | استمتاع | ٣.٩٠٢ | [1; 5] | 0.842 | 1.942 | -1.036 |
| EMV_02 | متعة | ٣.٧٢٤ | [1; 5] | 0.887 | 0.940 | -0.675 | |
| EMV_03 | استرخاء | ٣.٧٩٩ | [1; 5] | 0.877 | 1.465 | -0.675 | |
| سهولة الاستخدام، عاكسة (مور وبن باسات، 1991) | EOU_01 | مدة التعلم | ٤.٠١١ | [1; 5] | 0.988 | 0.800 | -0.996 |
| EOU_02 | عملية | ٤.٠٩٢ | [1; 5] | 0.811 | 0.798 | -0.822 | |
| EOU_03 | تنقل القائمة | 3.971 | [1; 5] | 0.867 | 1.201 | -0.904 | |
| الفائدة المدركة، التأملية (أنتون وآخرون، 2013؛ مور و | PU_01 | الميزة العامة | ٣.٣٩٧ | [1; 5] | 0.970 | -0.176 | -0.296 |
| بن باسات، 1991 | PU_02 | تطبيق عملي | ٣.٥٩٨ | [1; 5] | 1.055 | -0.106 | -0.585 |
| PU_03 | تحسين القراءة | 3.293 | [1; 5] | 1.109 | -0.534 | -0.474 | |
| التوافق، الانعكاسي (هوانغ وهسيه، 2012؛ مور وبن باسات، 1991) | CO_01 | سلوك القراءة | ٣.٢٩٩ | [1; 5] | 0.996 | -0.238 | -0.419 |
| CO_02 | نمط الاستهلاك | ٣.٤٢٧ | [1; 5] | 0.991 | 0.259 | -0.646 | |
| CO_03 | احتياجات القراءة | ٣.٦٥٥ | [1; 5] | 0.992 | 0.430 | -0.829 | |
| نية التبني، التأملية (فينكاتيش وآخرون، 2012) | إعلان_01 | الاستخدام المستقبلي | ٤.٠٢٣ | [1; 5] | 0.928 | 1.210 | -1.046 |
| AD_02 | الاستخدام اليومي | ٣.٧٧٦ | [1; 5] | 0.972 | 0.360 | -0.712 | |
| AD_03 | الاستخدام المتكرر | ٣.٨٤٥ | [1; 5] | 0.925 | 0.869 | -0.785 | |
| استخدام التكنولوجيا، عنصر واحد (فينكاتيش وآخرون، 2012) | استخدم_01 | الكتب الإلكترونية | ٣.٩٨٣ | [1; 7] | 1.610 | -0.894 | -0.063 |
ملخص نتائج نماذج القياس (الانعكاسية)
| المتغيرات الكامنة | مؤشرات | أوزان | الأحمال | تشارك المؤشر (الأحمال المربعة) | AVE | موثوقية مركبة | كرونباخ
|
|
فترة الثقة بتقنية Bootstrap بنسبة 95% لـ HTMT لا تشمل 1 |
| القيمة العاطفية | EMV_01 | 0.338 | 0.891 | 0.794 | 0.853 | 0.946 | 0.914 | 0.917 | نعم |
| EMV_02 | 0.375 | 0.950 | 0.903 | ||||||
| EMV_03 | 0.368 | 0.929 | 0.863 | ||||||
| سهولة الاستخدام | EOU_01 | 0.453 | 0.784 | 0.615 | 0.697 | 0.873 | 0.783 | 0.873 | نعم |
| EOU_02 | 0.371 | 0.878 | 0.771 | ||||||
| EOU_03 | 0.380 | 0.840 | 0.706 | ||||||
| الفائدة المدركة | PU_01 | 0.319 | 0.722 | 0.521 | 0.642 | 0.842 | 0.723 | 0.753 | نعم |
| PU_02 | 0.426 | 0.819 | 0.671 | ||||||
| PU_03 | 0.491 | 0.856 | 0.737 | ||||||
| التوافق | CO_01 | 0.396 | 0.901 | 0.812 | 0.779 | 0.914 | 0.858 | 0.859 | نعم |
| CO_02 | 0.357 | 0.906 | 0.821 | ||||||
| CO_03 | 0.381 | 0.840 | 0.706 | ||||||
| نية التبني | إعلان_01 | 0.345 | 0.933 | 0.870 | 0.889 | 0.960 | 0.938 | 0.939 | |
| AD_02 | 0.347 | 0.935 | 0.874 | ||||||
| AD_03 | 0.368 | 0.960 | 0.922 |
جدول عنق الزجاجة بصيغ مختلفة
| استخدام تكنولوجيا عنق الزجاجة، نطاقات النسب المئوية لدرجات المتغيرات الكامنة الموحدة (كما في ريشتر وآخرون، 2020) | |||||
| نية التبني | القيمة العاطفية | سهولة الاستخدام* | الفائدة المدركة | التوافق | |
| 0 | NN | NN | NN | NN | NN |
| 10 | NN | NN | 10.2 | NN | NN |
| 20 | NN | NN | 10.2 | NN | NN |
| 30 | NN | NN | 10.2 | NN | NN |
| 40 | ٣٣.٨ | ٤٩.٦ | ٢٠.٠ | 15.7 | ٢٥.٥ |
| 50 | ٣٣.٨ | ٤٩.٦ | ٢٠.٠ | 15.7 | ٢٥.٥ |
| 60 | ٣٣.٨ | ٤٩.٦ | ٢٠.٠ | 15.7 | ٣٣.٧ |
| 70 | ٣٣.٨ | ٤٩.٦ | ٢٠.٥ | ٤٨.١ | ٣٣.٧ |
| ٨٠ | ٣٣.٨ | ٤٩.٦ | ٢٠.٥ | ٤٨.١ | ٣٣.٧ |
| 90 | 75.0 | ٤٩.٦ | 60.2 | 66.2 | ٣٣.٧ |
| 100 | 75.0 | ٤٩.٦ | 60.2 | 66.2 | ٣٣.٧ |
| استخدام تكنولوجيا عنق الزجاجة، درجات المتغيرات الكامنة المعاد قياسها، نطاقات النسب المئوية | |||||
| 0 | NN | NN | NN | NN | NN |
| 10 | NN | NN | 10.2 | NN | NN |
| 20 | NN | NN | 10.2 | NN | NN |
| 30 | NN | NN | 10.2 | NN | NN |
| 40 | ٣٣.٨ | ٤٩.٦ | ٢٠.٠ | 15.7 | ٢٥.٥ |
| 50 | ٣٣.٨ | ٤٩.٦ | ٢٠.٠ | 15.7 | 25.5 |
| 60 | ٣٣.٨ | ٤٩.٦ | ٢٠.٠ | 15.7 | ٣٣.٧ |
| 70 | ٣٣.٨ | ٤٩.٦ | ٢٠.٥ | ٤٨.١ | ٣٣.٧ |
| ٨٠ | ٣٣.٨ | ٤٩.٦ | ٢٠.٥ | ٤٨.١ | ٣٣.٧ |
| 90 | 75.0 | ٤٩.٦ | 60.2 | 66.2 | ٣٣.٧ |
| 100 | 75.0 | ٤٩.٦ | 60.2 | 66.2 | ٣٣.٧ |
| استخدام تكنولوجيا عنق الزجاجة، درجات المتغيرات الكامنة المعاد قياسها، الدرجات الفعلية | |||||
| 0 | NN | NN | NN | NN | NN |
| 10 | NN | NN | ٢٥.٤ | NN | NN |
| 20 | NN | NN | ٢٥.٤ | NN | NN |
| 30 | NN | NN | 25.4 | NN | NN |
| 40 | ٣٣.٨ | ٤٩.٦ | ٣٣.٥ | 15.7 | ٢٥.٥ |
| 50 | ٣٣.٨ | ٤٩.٦ | ٣٣.٥ | 15.7 | ٢٥.٥ |
| 60 | ٣٣.٨ | ٤٩.٦ | ٣٣.٥ | 15.7 | ٣٣.٧ |
| 70 | ٣٣.٨ | ٤٩.٦ | ٣٣.٩ | ٤٨.١ | ٣٣.٧ |
| ٨٠ | ٣٣.٨ | ٤٩.٦ | ٣٣.٩ | ٤٨.١ | ٣٣.٧ |
| 90 | 75.0 | ٤٩.٦ | 66.9 | 66.2 | ٣٣.٧ |
| 100 | 75.0 | ٤٩.٦ | 66.9 | 66.2 | ٣٣.٧ |
References
Alyahya, M., Agag, G., Aliedan, M., Abdelmoety, Z.H., Daher, M.M., 2023. A sustainable step forward: understanding factors affecting customers’ behaviour to purchase remanufactured products. J. Retailing Consum. Serv. 70, 103172.
American Customer Satisfaction Index, 2022. Unparalleled Customer Intelligence. Retrieved from. https://www.theacsi.org/our-industries/.
Anderson, E.W., Mittal, V., 2000. Strengthening the satisfaction-profit chain. J. Serv. Res. 3 (2), 107-186.
Antón, C., Camarero, C., Rodríguez, J., 2013. Usefulness, enjoyment, and self-image congruence: the adoption of e-book readers. Psychol. Market. 30 (4), 372-384.
Bergh, D.D., Boyd, B.K., Byron, K., Gove, S., Ketchen, D.J., 2022. What constitutes a methodological contribution? J. Manag. 48 (7), 1835-1848.
Bolívar, L.M., Roldán, J.L., Castro-Abancéns, I., Casanueva, C., 2022. Speed of international expansion: the mediating role of network resources mobilisation. Manag. Int. Rev. 62, 541-568.
Cheah, J.-H., Magno, F., Cassia, F., 2023. Reviewing the smartPLS 4 software: the latest features and enhancements. Journal of Marketing Analytics. Advance online publication.
Davis, F.D., 1989. Perceived usefulness, perceived ease of use, and user acceptance of information technology. MIS Quarterly 13 (3), 319-340.
Davis, F.D., Bagozzi, R.P., Warshaw, P.R., 1989. User acceptance of computer technology: a comparison of two theoretical models. Manag. Sci. 35 (8), 982-1003.
Dul, J., 2016. Necessary condition analysis (NCA): logic and methodology of “necessary but not sufficient” causality. Organ. Res. Methods 19 (1), 10-52.
Dul, J., 2020. Conducting Necessary Condition Analysis. Sage, London.
Dul, J., 2021a. Advances in Necessary Condition Analysis. Online book retrieved from:, Version 0.1. https://bookdown.org/ncabook/advanced_nca2/.
Dul, J., 2021b. Necessary Condition Analysis (NCA) with R. A Quick Start Guide: 2 March 2021. Online document retreived from:, Version 3.1.0. https://www.erim.eur.nl
/fileadmin/user_upload/_generated/download/Quick_Start_Guide_NCA_3.1.0_Ma rch_2_2021.pdf.
Dul, J., 2022. R Package NCA: Necessary Condition Analysis. Version:, 3.2.0. https://cr an.r-project.org/web/packages/NCA/index.html.
Dul, J., Hauff, S., Bouncken, R.B., 2023. Necessary condition analysis (NCA): review of research topics and guidelines for good practice. Rev. Manag. Sci. 17 (2), 683-714.
Dul, J., Hauff, S., Tóth, Z., 2021. Necessary condition analysis in marketing research. In: Nunkoo, R., Teeroovengadum, V., Ringle, C.M. (Eds.), Handbook of Research Methods for Marketing Management. Edward Elgar, pp. 51-72.
Fornell, C., 1992. A national customer satisfaction barometer: the Swedish experience. J. Market. 56 (1), 6-21.
Guenther, P., Guenther, M., Ringle, C.M., Zaefarian, G., Cartwright, S., 2023. Improving PLS-SEM use for business marketing research. Ind. Market. Manag. 111, 127-142.
Hair, J.F., Hult, G.T.M., Ringle, C.M., Sarstedt, M., 2022. A Primer on Partial Least Squares Structural Equation Modeling (PLS-SEM), 3 ed. Sage, Thousand Oaks, CA.
Hair, J.F., Hult, G.T.M., Ringle, C.M., Sarstedt, M., Thiele, K.O., 2017. Mirror, mirror on the wall: a comparative evaluation of composite-based structural equation modeling methods. J. Acad. Market. Sci. 45 (5), 616-632.
Hair, J.F., Risher, J.J., Sarstedt, M., Ringle, C.M., 2019. When to use and how to report the results of PLS-SEM. Eur. Bus. Rev. 31 (1), 2-24.
Hair, J.F., Sarstedt, M., Ringle, C.M., Gudergan, S.P., 2024. Advanced Issues in Partial Least Squares Structural Equation Modeling (PLS-SEM), 2 ed. Sage, Thousand Oaks, CA.
Hair, J.F., Sarstedt, M., Ringle, C.M., Mena, J.A., 2012. An assessment of the use of partial least squares structural equation modeling in marketing research. J. Acad. Market. Sci. 40 (3), 414-433.
Hauff, S., Guerci, M., Dul, J., van Rhee, H., 2021. Exploring necessary conditions in HRM research: fundamental issues and methodological implications. Hum. Resour. Manag. J. 31 (1), 18-36.
Hauff, S., Richter, N.F., Tressin, T., 2015. Situational job characteristics and job satisfaction: the moderating role of culture. Int. Bus. Rev. 24 (4), 710-723.
Huang, L.-Y., Hsieh, Y.-J., 2012. Consumer electronics acceptance based on innovation attributes and switching costs: the case of e-book readers. Electron. Commer. Res. Appl. 11 (3), 218-228.
Huete-Alcocer, N., Hernandez-Rojas, R.D., 2022. Do SARS-CoV-2 safety measures affect visitors experience of traditional gastronomy, destination image and loyalty to a world heritage city? J. Retailing Consum. Serv. 69, 103095.
Kristensen, K., Martensen, A., Grønholdt, L., 2000. Customer satisfaction measurement at post Denmark: results of application of the European customer satisfaction index methodology. Total Qual. Manag. 11 (7), S1007-S1015.
Le, H.T.P.M., Kim, D., Park, J., 2024. The way to generate customer citizenship behavior with customer experience. J. Retailing Consum. Serv. 76, 103608.
Lohmöller, J.-B., 1989. Latent Variable Path Modeling with Partial Least Squares. Physica, Heidelberg.
Martilla, J.A., James, J.C., 1977. Importance-performance analysis. J. Market. 41 (1), 77-79.
Moore, G.C., Benbasat, I., 1991. Development of an instrument to measure the perceptions of adopting an information technology innovation. Inf. Syst. Res. 2 (3), 192-222.
Ng, F.Z.-X., Yap, H.-Y., Tan, G.W.-H., Lo, P.-S., Ooi, K.-B., 2022. Fashion shopping on the go: a dual-stage predictive-analytics SEM-ANN analysis on usage behaviour, experience response and cross-category usage. J. Retailing Consum. Serv. 65, 102851.
Pappas, N., 2023. Came and gone? A longitudinal study of the effects of COVID-19 on tourism purchasing intentions. J. Retailing Consum. Serv. 72, 103269.
Perez-Aranda, J., Gonzáles Robles, E.M., Alarcón Urbistondo, P., 2023. Understanding antecedents of continuance and revisit intentions: the case of sport apps. J. Retailing Consum. Serv. 72, 103288.
Richter, N.F., Hauff, S., 2022. Necessary conditions in international business research: advancing the field with a new perspective on causality and data analysis. J. World Bus. 57 (5), 101310.
Richter, N.F., Hauff, S., Gudergan, S.P., Ringle, C.M., 2022. The use of partial least squares structural equation modeling and complementary methods in international management research. Manag. Int. Rev. 62 (4), 449-470.
Richter, N.F., Hauff, S., Kolev, A.E., Schubring, S., 2023a. Dataset on an extended technology acceptance model: a combined application of PLS-SEM and NCA. Data Brief 48, 109190.
Richter, N.F., Hauff, S., Ringle, C.M., Sarstedt, M., Kolev, A.E., Schubring, S., 2023b. How to apply necessary condition analysis in PLS-SEM. In: Latan, H., Hair, J.F., Noonan, R. (Eds.), Partial Least Squares Path Modeling: Basic Concepts, Methodological Issues and Applications. Springer, pp. 267-297.
Richter, N.F., Schubring, S., Hauff, S., Ringle, C.M., Sarstedt, M., 2020. When predictors of outcomes are necessary: guidelines for the combined use of PLS-SEM and NCA. Ind. Manag. Data Syst. 120 (12), 2243-2267.
Rigdon, E.E., Ringle, C.M., Sarstedt, M., 2010. Structural modeling of heterogeneous data with partial least squares. In: Malhotra, N.K. (Ed.), Review of Marketing Research, vol. 7. Sharpe, Armonk, NY, pp. 255-296.
Ringle, C.M., Sarstedt, M., 2016. Gain more insight from your PLS-SEM results: the importance-performance map analysis. Ind. Manag. Data Syst. 116 (9), 1865-1886.
Ringle, C.M., Wende, S., Becker, J.-M., 2022. SmartPLS 4. Oststeinbek: SmartPLS. Retrieved from. https://www.smartpls.com/.
Rodríguez, P.G., Villarreal, R., Valiño, P.C., Blozis, S., 2020. A PLS-SEM approach to understanding e-SQ, e-satisfaction and e-loyalty for fashion e-retailers in Spain. J. Retailing Consum. Serv. 57, 102201.
Sarstedt, M., Hair, J.F., Ringle, C.M., Thiele, K.O., Gudergan, S.P., 2016. Estimation issues with PLS and CBSEM: where the bias lies. J. Bus. Res. 69 (10), 3998-4010.
Sever, I., 2015. Importance-performance analysis: a valid management tool? Tourism Manag. 48, 43-53.
Shahidi, N., Tossan, V., Bourliataux-Lajoinie, S., Cacho-Elizondo, S., 2022. Behavioral intention to use a contact tracing application: the case of StopCovid in France. J. Retailing Consum. Serv. 68, 102998.
Sheth, J.N., Newman, B.I., Gross, B.L., 1991. Why we buy what we buy: theory of consumption values. J. Bus. Res. 22 (2), 159-170.
Siyal, A.W., Chen, H., Jamal Shah, S., Shahzad, F., Bano, S., 2024. Customization at a glance: investigating consumer experiences in mobile commerce applications. J. Retailing Consum. Serv. 76, 103602.
Slack, N., 1994. The importance-performance matrix as a determinant of improvement Priority. Int. J. Oper. Prod. Manag. 44 (5), 59-75.
Streukens, S., Leroi-Erelds, S., Willems, K., 2017. Dealing with nonlinearity in importance-performance map analysis (IPMA): an integrative framework in a PLSSEM context. In: Latan, H., Noonan, R. (Eds.), Partial Least Squares Path Modeling. Springer, Cham, pp. 367-403.
Sukhov, A., Olsson, L.E., Friman, M., 2022. Necessary and sufficient conditions for attractive public transport: combined use of PLS-SEM and NCA. Transport. Res. Pol. Pract. 158, 239-250.
Sweeney, J.C., Soutar, G.N., 2001. Consumer perceived value: the development of a multiple item scale. J. Retailing 77 (2), 203-220.
Tiwari, P., Kaurav, R.P.S., Koay, K.Y., 2023. Understanding travel apps usage intention: findings from PLS and NCA. Journal of Marketing Analytics. advance online publication.
Turner, M., Kitchenham, B., Brereton, P., Charters, S., Budgen, D., 2010. Does the technology acceptance model predict actual use? A systematic literature review. Inf. Software Technol. 52 (5), 463-479.
Venkatesh, V., Thong, J.Y.L., Xu, X., 2012. Consumer acceptance and use of information technology: extending the unified theory of acceptance and use of technology. MIS Quarterly 36 (1), 157-178.
Wold, H., 1982. Soft modeling: the basic design and some extensions. In: Jöreskog, K.G., Wold, H. (Eds.), Systems under Indirect Observations: Part II. North-Holland, Amsterdam, pp. 1-54.
Zhang, P., Chao, C.-W., Chiong, R., Hasan, N., Aljaroodi, H.M., Tian, F., 2023. Effects of in-store live stream on consumers’ offline purchase intention. J. Retailing Consum. Serv. 72, 103262.
Bokrantz, J., Dul, J., 2023. Building and testing necessity theories in supply chain management. J. Supply Chain Manag. 59 (1), 48-65.
Sarstedt, M., Mooi, E.A., 2019. A Concise Guide to Market Research: The Process, Data, and Methods Using IBM SPSS Statistics. 3, ed. Springer, Berlin, Heidelberg.
Sharma, P.N., Liengaard, B.D., Hair, J.F., Sarstedt, M., Ringle, C.M., 2023. Predictive model assessment and selection in composite-based modeling using PLS-SEM: extensions and guidelines for using CVPAT. Eur. J. Market. 57 (6), 1662-1677.
Shmueli, G., Sarstedt, M., Hair, J.F., Cheah, J., Ting, H., Vaithilingam, S., Ringle, C.M., 2019. Predictive model assessment in PLS-SEM: guidelines for using PLSpredict. Eur. J. Market. 53 (11), 2322-2347.
- Corresponding author. Ludwig-Maximilians-University Munich, LMU Munich School of Management, Ludwigstraße 28 RG/III, 80539, Munich, Germany.
E-mail addresses: hauff@hsu-hh.de (S. Hauff), nicole@sam.sdu.dk (N.F. Richter), sarstedt@lmu.de (M. Sarstedt), c.ringle@tuhh.de (C.M. Ringle).We refer to a trichotomous illustration here to facilitate interpretation; however, the NCA is not limited to specific measurement levels. For more information, see Dul (2020, Chapter 3). Also note that the symbols used in the NCA context have a different meaning than in the PLS-SEM context. While the latter usually uses to denote latent constructs and to denote indicators, the former uses Y for outcomes and X for conditions. Note that the bottleneck levels differ due to the different scales involved. Also note that this statement refers to the standardized, unstandardized or rescaled scores calculated in the IPMA context on the basis of a linear transformation. Other forms of transformation, particularly non-linear transformations, should be carefully considered, since they could affect the NCA’s results. Under https://www.pls-sem.net/downloads, we provide a Microsoft Excel template for downloading in order to produce this kind of indication. In the Appendix, we offer a comparison of bottleneck tables for the standardized latent variable scores based on percentage ranges, the rescaled latent variable scores based on percentage ranges, and the bottleneck table for rescaled latent variable scores based on the actual values. We also comment on the differences (see Table A3 in the Appendix).
DOI: https://doi.org/10.1016/j.jretconser.2024.103723
Publication Date: 2024-01-23
SDÚ University of Southern Denmark
Importance and performance in PLS-SEM and NCA
introducing the Combined Importance-Performance Map Analysis (cIPMA)
Published in:
DOI:
Publication date:
Document version:
Document license:
Citation for pulished version (APA):
Terms of use
Unless otherwise specified it has been shared according to the terms for self-archiving.
If no other license is stated, these terms apply:
- You may download this work for personal use only.
- You may not further distribute the material or use it for any profit-making activity or commercial gain
- You may freely distribute the URL identifying this open access version
Importance and performance in PLS-SEM and NCA: Introducing the combined importance-performance map analysis (cIPMA)
A R T I C L E I N F O
Keywords:
Necessary condition analysis
NCA
Partial least squares
PLS
PLS-SEM
Structural equation modeling
SEM
Importance-performance map analysis
IPMA
Abstract
This research offers a novel approach that extends the application of importance-performance map analysis (IPMA) in partial least squares structural equation modeling (PLS-SEM) by incorporating findings from a necessary condition analysis (NCA). The IPMA comprises assessing latent variables and their indicators’ importance and performance, while an NCA introduces an additional dimension by identifying factors that are crucial for achieving the desired outcomes. An NCA employs necessity logic to identify the must-have factors required for an outcome, while PLS-SEM follows an additive sufficiency logic to identify the should-have factors that contribute to high performance levels. Integrating these two logics into the performance dimension is particularly valuable for prioritizing actions that could improve the target outcomes, such as customer satisfaction and employee commitment. Although the combined use of PLS-SEM and NCA is a recent suggestion, this study is the first to combine them with an IPMA (i.e., in a combined IPMA; cIPMA). A case study illustrates the combined use of PLS-SEM and an NCA to undertake a cIPMA. This innovative approach enhances researchers’ and practitioners’ decision making, enabling them to prioritize their efforts effectively.
1. Introduction
threshold levels’ definition (see, for instance, Oh, 2001).
The IPMA has also been used in the context of partial least squares structural equation modeling (PLS-SEM), a multivariate method for estimating complex interrelationships between constructs and their indicators (Hair et al., 2022, Chapter 1; Lohmöller, 1989, Chapter 2; Wold, 1982). In the past decades, the use of PLS-SEM evolved in marketing research (Guenther et al., 2023; Hair et al., 2012; Sarstedt et al., 2022), including retailing and consumer services (e.g., Cai et al., 2023; Hue-te-Alcocer and Hernandez-Rojas, 2022; Rodríguez et al., 2020). PLS-SEM facilitates an IPMA, due to the way the method estimates model parameters. Specifically, PLS-SEM calculates indicator variables’ composites to represent the constructs in a statistical model. Researchers have used these composite scores as representations of the constructs’ performance and compared them with the total effects that the constructs exert on a specific target (e.g., Kristensen et al., 2000; Ringle and Sarstedt, 2016; Streukens et al., 2017). The underlying IPMA draws on the average performance and importance scores and subsequently
Numerous studies have used the IPMA in a PLS-SEM context. For example, in the context of retailing and consumer services, Zhang et al. (2023) draw on the IPMA to investigate environmental stimuli’s importance and performance for consumers’ in-store purchase intentions via two consumer attitude constructs. In a technology acceptance model (TAM), whose use also features prominently in retailing and consumer services (e.g., Ng et al., 2022; Perez-Aranda et al., 2023; Shahidi et al., 2022), the IPMA can be used to compare the total effect of a technology’s ease of use in terms of its intended usage (its importance for the target construct) with its potential users’ average perceived ease of use (its performance). An IPMA’s results therefore allow the identification of a target construct’s highly important antecedents, that, however, exhibit relatively low performance. This information is crucial, since it indicates how action should be prioritized to improve these antecedent constructs, which will increase the target construct substantially. For instance, ease of use’s high importance, combined with a technology’s poor ease of use rating (i.e., a poor performance), indicates a specific need to improve this technology’s ease of use to ultimately increase its usage.
g., Bolívar et al., 2022; Richter et al., 2021; Sukhov et al., 2022; Tiwari et al., 2023), we argue that identifying necessary conditions could also enrich an IPMA by providing information about the antecedent constructs’ necessity. This information provides researchers and practitioners with a more complete picture of the important and necessary antecedents, while also helping to complement an IPMA’s results. By following the path model results of a technology’s perceived usefulness, researchers assessing consumer acceptance of novel technologies might, for instance, find that these are of little importance, although they are a necessary condition for the technology’s usage. In other words, the technology will not be used unless it is perceived as useful. While an antecedent construct with little importance according to its PLS-SEM results might receive little attention from a classic IPMA, it might represent a necessary condition, which would once again make it the focus of decision making when PLS-SEM is combined with an NCA.
2. Importance and performance in PLS-SEM
important for the target construct, although they simultaneously perform relatively poorly.
Hence, the total indirect effect of
where
mean importance
mean performance
Researchers using the IPMA could use these average scores and plot them on an importance-performance map into four separate quadrants. However, researchers might rely on a different logic when dividing the four quadrants, such as previous knowledge or expert assessment. The combination of high/low importance and high/low performance induces specific recommendations, which antecedent constructs target through managerial activities (Ringle and Sarstedt, 2016).
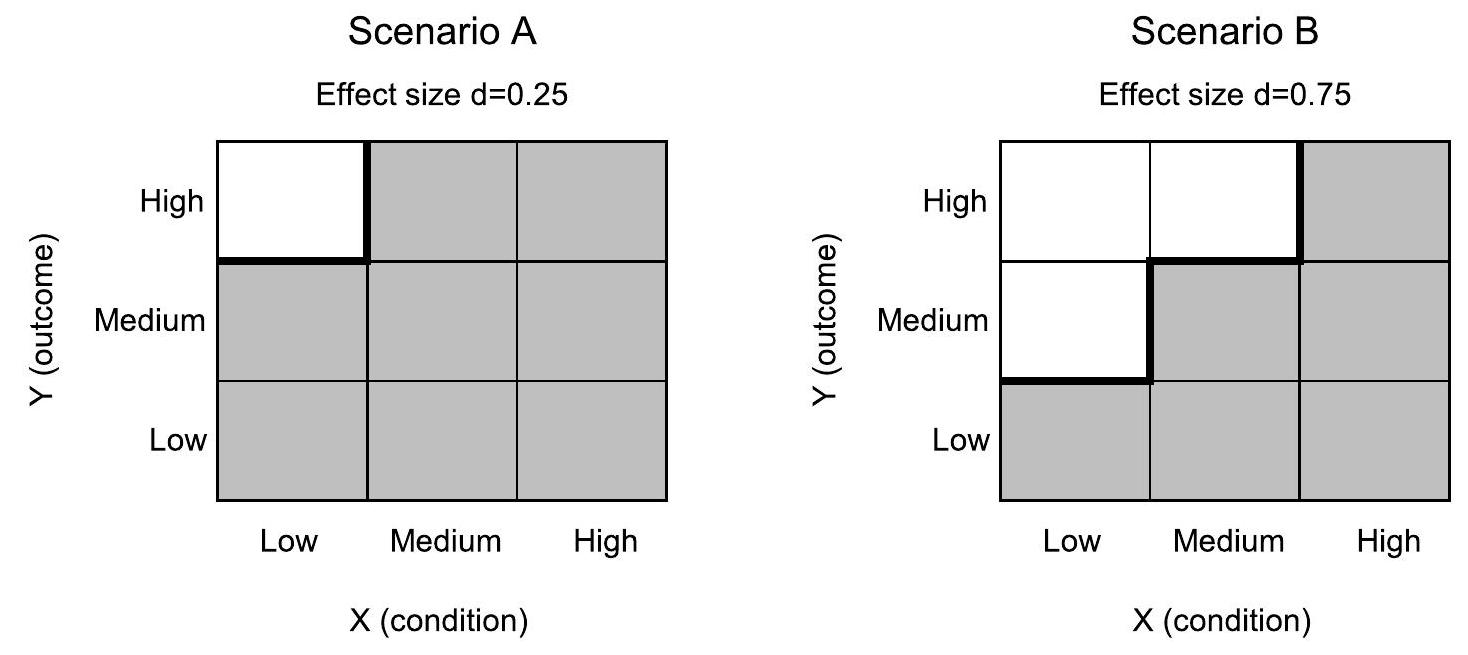
3. Importance and performance in NCA
areas in scatter plots without observations from those with observations. By dividing the ’empty’ space (also called the ceiling zone) by the entire area that includes observations (also called the scope), NCA calculates the necessity effect size
4. Guidelines for a combined importance-performance map analysis
4.1. Measurement scales of indicators (step 2)
4.2. Additional requirements check when evaluating measurement models (step 4)
4.3. Run the IPMA and transfer the latent variable scores (step 5)
4.4. Run the NCA (step 6)
indicator scores if there are formative measurement models (as explained by Richter et al., 2020; Richter et al., 2023b; Hair et al., 2024, Chapter 4). The NCA could refer to the input data’s empirical or theoretical scope. In the NCA context, the general recommendation is to use the empirical scope, as it produces a more conservative estimation of the effect size (Dul, 2020, Chapter 4) – we concur with this recommendation. That is, we use the rescaled latent variable scores from the IPMA in PLS-SEM as input data and refer to their empirical scope (which may not necessarily be from 0 to 100).
Outline hypotheses along the sufficiency and the necessity logic (for the latter, see Bokrantz & Dul, 2023; Richter & Hauff, 2022).*
Sample size: Follow the guidelines on sample size as outlined in a PLS-SEM context by, for instance, referring to published power tables (Hair et al., 2022, Chapter 1).
Data distribution: Report information on the data distribution (Hair et al., 2012).
Outliers: Perform an outlier analysis by following common guidelines, such as examining observations that show a zscore > 3 (Sarstedt & Mooi, 2019, Chapter 5).*
Use PLS-SEM to estimate the latent variable scores, the structural model relationships, and their significance (Hair et al., 2022, Chapter 6).
Make use of the assessment guidelines in the PLS-SEM context to evaluate the measurement models’ quality (e.g., Guenther et al., 2023; Hair et al., 2022, Chapters 4 and 5; Sarstedt et al. 2021). In respect of reflective constructs, evaluate their loadings, Cronbach’s
Run the IPMA in PLS-SEM using the theoretical minimum and maximum values of the indicator scales as input (Ringle & Sarstedt, 2016).
Run the NCA in SmartPLS (see also Richter et al., 2023b) or R (default settings; i.e., use the empirical scope of the input data; 10,000 permutations) (Dul, 2020, Chapter 4). Run the analysis for the hypothesized relations or all the relations: Dependent = endogenous latent variable score(s), independent = preceding latent variable scores. Select the ceiling line based on theory or data pattern (Dul, 2020, Chapter 4).* Refer to the input data’s empirical scope.
After evaluating the VIFs of the inner model, evaluate the PLS-SEM model along the standard assessment criteria, especially the coefficient of determination (
Step 8: Interpret the findings
Produce an extended IPMA chart: Position constructs on the basis of the standardized total effects on the
Fig. 3. An extended step-by-step guide in the context of a combined IPMA (cIPMA).
Note: *indicates that steps are updated compared to Richter et al. (2020).
satisfaction studies, this could be employees’ job satisfaction score of 70 (on a scale from 0 to 100) (as in Hauff et al., 2015), while in a marketing project on customer satisfaction this could be a benchmark level of 75 or more, depending on the industry (on a scale from 0 to 100) (American Customer Satisfaction Index, 2022; Rigdon et al., 2010). Depending on these levels, researchers might need to change the presentation of the steps in their bottleneck tables to show the target constructs’ selected performance level (e.g., increasing the number of steps from 10 to 20 will provide information on the
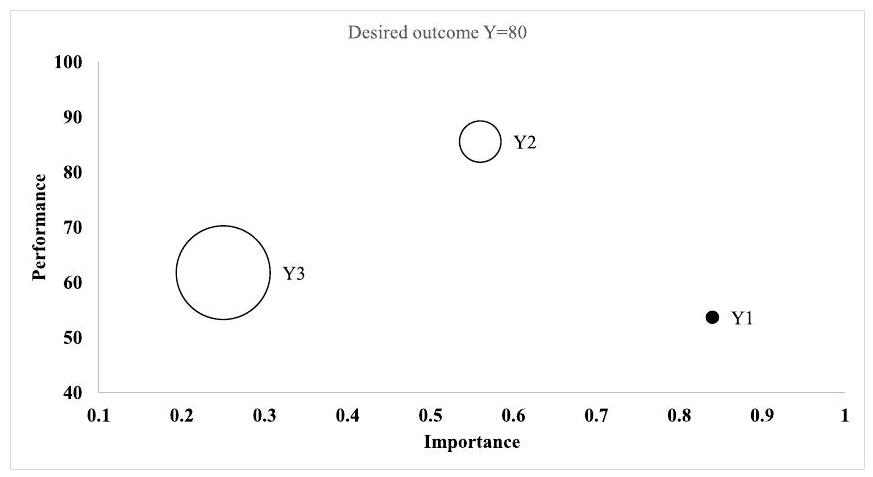
4.5. Interpret the findings (step 8)
Note: Extension of the example given in Fig. 1, Panel B. For the desired level of the outcome: – construct is not necessary;
5. Illustrative example of a combined importance-performance map analysis
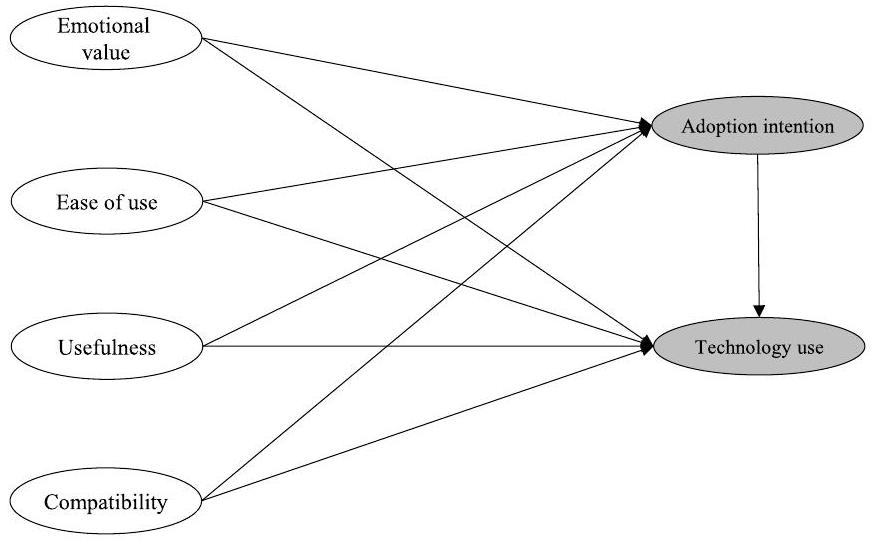
5.1. The conceptual model, data, and PLS-SEM analyses (steps 1 to 3)
model.
5.2. Evaluate the reliability and validity of the measurement models (step 4)
5.3. Run the IPMA and transfer the latent variable scores (step 5)
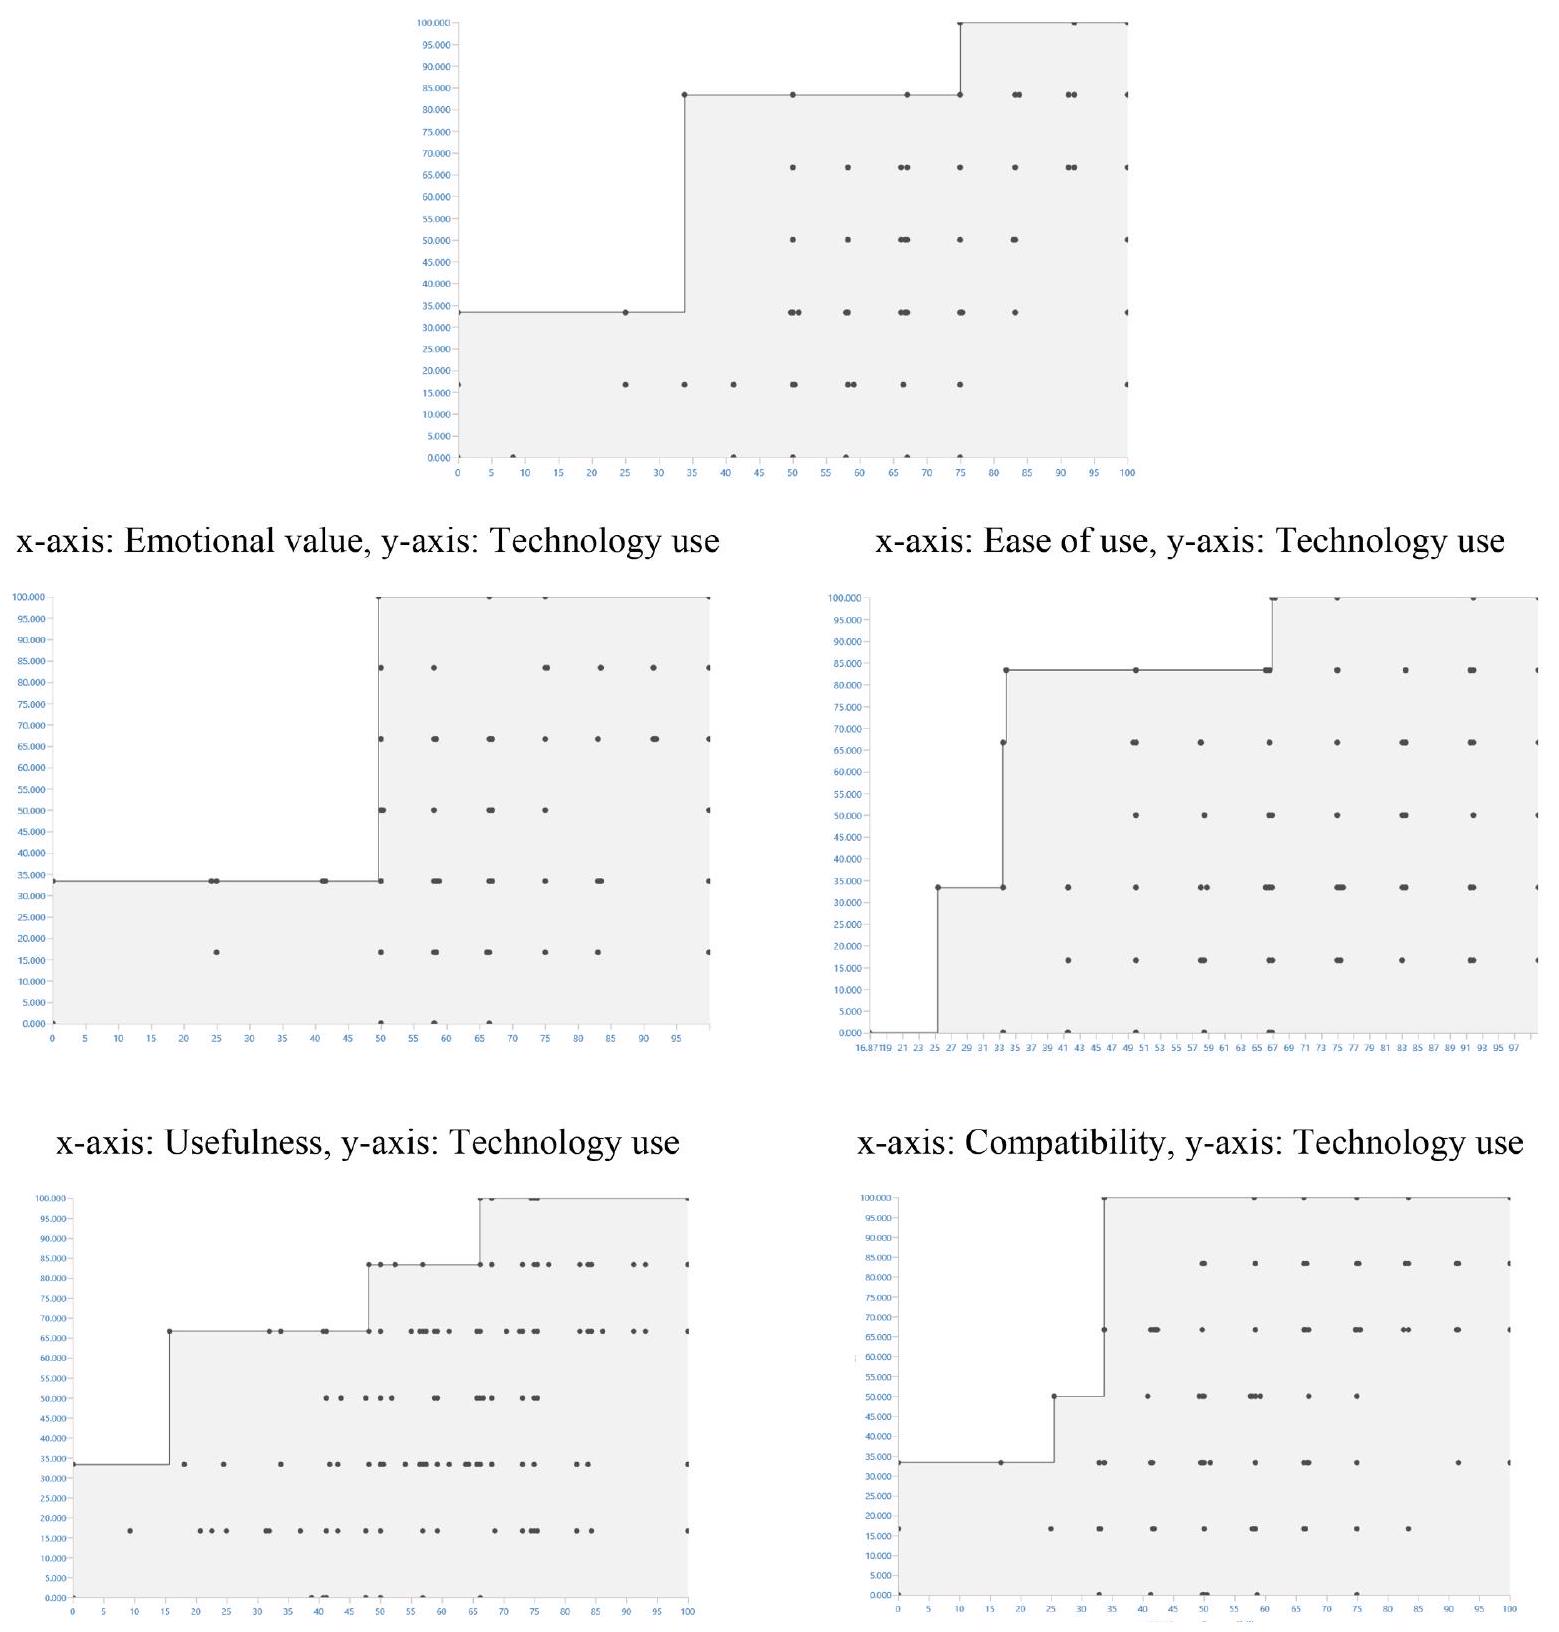
5.4. Run the NCA (step 6)
actual values, which provides the antecedent constructs’ necessary levels that the different levels of technology use need to achieve, and one with percentiles for the conditions, which informs us about the number and percentage of cases that have not achieved the required antecedent construct levels for the corresponding levels of technology use (see next step).
5.5. Evaluate the structural model (step 7)
Total effects from the PLS-SEM analysis.
| Construct | Technology use | Statistically significant (
|
|
| Total effects | 95% bootstrap confidence intervals | ||
| Emotional value | 0.362 | [0.200; 0.521] | Yes |
| Ease of use | 0.049 | [-0.110; 0.215] | No |
| Perceived usefulness | 0.149 | [-0.075; 0.357] | No |
| Compatibility | 0.127 | [-0.108; 0.365] | No |
| Adoption intention | 0.437 | [0.268; 0.609] | Yes |
Performance values of latent variables (rescaled).
| Construct | Performance value, average | Performance value, minimum | Performance value, maximum |
| Technology use | 49.713 | 0.000 | 100.000 |
| Adoption intention | 72.041 | 0.000 | 100.000 |
| Emotional value | 70.171 | 0.000 | 100.000 |
| Ease of use | 75.640 | 16.871 | 100.000 |
| Perceived usefulness | 64.248 | 0.000 | 100.000 |
| Compatibility | 61.557 | 0.000 | 100.000 |
Necessity effect sizes (CE-FDH ceiling line).
| Construct | Technology use | |
| Effect size d |
|
|
| Emotional value | 0.33 | 0.000 |
| Ease of use | 0.24 | 0.016 |
| Perceived usefulness | 0.24 | 0.001 |
| Compatibility | 0.21 | 0.000 |
| Adoption intention | 0.29 | 0.000 |
Bottleneck table technology use, actual values (based on the rescaled PLS-SEM latent variable scores from 0 to 100).
| Technology use | Adoption intention | Emotional value | Ease of use | Perceived usefulness | Compatibility |
| Actual values (rescaled 0-100) | |||||
| 0 | NN | NN | NN | NN | NN |
| 5 | NN | NN | 25.373 | NN | NN |
| 10 | NN | NN | 25.373 | NN | NN |
| 15 | NN | NN | 25.373 | NN | NN |
| 20 | NN | NN | 25.373 | NN | NN |
| 25 | NN | NN | 25.373 | NN | NN |
| 30 | NN | NN | 25.373 | NN | NN |
| 35 | 33.833 | 49.650 | 33.469 | 15.702 | 25.518 |
| 40 | 33.833 | 49.650 | 33.469 | 15.702 | 25.518 |
| 45 | 33.833 | 49.650 | 33.469 | 15.702 | 25.518 |
| 50 | 33.833 | 49.650 | 33.469 | 15.702 | 25.518 |
| 55 | 33.833 | 49.650 | 33.469 | 15.702 | 33.696 |
| 60 | 33.833 | 49.650 | 33.469 | 15.702 | 33.696 |
| 65 | 33.833 | 49.650 | 33.469 | 15.702 | 33.696 |
| 70 | 33.833 | 49.650 | 33.875 | 48.127 | 33.696 |
| 75 | 33.833 | 49.650 | 33.875 | 48.127 | 33.696 |
| 80 | 33.833 | 49.650 | 33.875 | 48.127 | 33.696 |
| 85 | 75.000 | 49.650 | 66.904 | 66.212 | 33.696 |
| 90 | 75.000 | 49.650 | 66.904 | 66.212 | 33.696 |
| 95 | 75.000 | 49.650 | 66.904 | 66.212 | 33.696 |
| 100 | 75.000 | 49.650 | 66.904 | 66.212 | 33.696 |
emotional value,
5.6. Interpret the findings (step 8)
6. Conclusion
Bottleneck table technology use: actual values for technology use (based on the rescaled PLS-SEM latent variable scores from 0 to 100) and the percentiles of antecedent constructs.
| Technology use | Adoption intention | Emotional value | Ease of use | Perceived usefulness | Compatibility | |||||
| Actual values (rescaled 0-100) | Percentage (and number) of cases that do not achieve the necessary levels | |||||||||
| 0 | 0 | (0) | 0 | (0) | 0 | (0) | 0 | (0) | 0 | (0) |
| 5 | 0 | (0) | 0 | (0) | 0.6 | (1) | 0 | (0) | 0 | (0) |
| 10 | 0 | (0) | 0 | (0) | 0.6 | (1) | 0 | (0) | 0 | (0) |
| 15 | 0 | (0) | 0 | (0) | 0.6 | (1) | 0 | (0) | 0 | (0) |
| 20 | 0 | (0) | 0 | (0) | 0.6 | (1) | 0 | (0) | 0 | (0) |
| 25 | 0 | (0) | 0 | (0) | 0.6 | (1) | 0 | (0) | 0 | (0) |
| 30 | 0 | (0) | 0 | (0) | 0.6 | (1) | 0 | (0) | 0 | (0) |
| 35 | 4.6 | (8) | 5.7 | (10) | 1.1 | (2) | 1.7 | (3) | 5.7 | (10) |
| 40 | 4.6 | (8) | 5.7 | (10) | 1.1 | (2) | 1.7 | (3) | 5.7 | (10) |
| 45 | 4.6 | (8) | 5.7 | (10) | 1.1 | (2) | 1.7 | (3) | 5.7 | (10) |
| 50 | 4.6 | (8) | 5.7 | (10) | 1.1 | (2) | 1.7 | (3) | 5.7 | (10) |
| 55 | 4.6 | (8) | 5.7 | (10) | 1.1 | (2) | 1.7 | (3) | 8.6 | (15) |
| 60 | 4.6 | (8) | 5.7 | (10) | 1.1 | (2) | 1.7 | (3) | 8.6 | (15) |
| 65 | 4.6 | (8) | 5.7 | (10) | 1.1 | (2) | 1.7 | (3) | 8.6 | (15) |
| 70 | 4.6 | (8) | 5.7 | (10) | 2.9 | (5) | 17.2 | (30) | 8.6 | (15) |
| 75 | 4.6 | (8) | 5.7 | (10) | 2.9 | (5) | 17.2 | (30) | 8.6 | (15) |
| 80 | 4.6 | (8) | 5.7 | (10) | 2.9 | (5) | 17.2 | (30) | 8.6 | (15) |
| 85 | 39.1 | (68) | 5.7 | (10) | 28.7 | (50) | 47.1 | (82) | 8.6 | (15) |
| 90 | 39.1 | (68) | 5.7 | (10) | 28.7 | (50) | 47.1 | (82) | 8.6 | (15) |
| 95 | 39.1 | (68) | 5.7 | (10) | 28.7 | (50) | 47.1 | (82) | 8.6 | (15) |
| 100 | 39.1 | (68) | 5.7 | (10) | 28.7 | (50) | 47.1 | (82) | 8.6 | (15) |
perspective, this could ultimately represent an increase in the antecedent construct’s further potential in the IPMA. Second, based on the PLS-SEM findings, the IPMA’s importance refers to all of the involved constructs’ total effects. In other words, they involve both the direct and indirect associations. These indirect or mediation effects are currently not explicitly considered in the proposed CIPMA. We therefore encourage future research to develop ideas for mediation relationships’ analysis in the NCA context, which could ultimately be used in a cIPMA.
CRediT authorship contribution statement
Declaration of competing interest
Data availability
Appendix
Data description
| Latent variable (measurement adapted from) | Indicator | Mean | Range [Min; Max] | S.D. | Excess kurtosis | Skewness | |
| Emotional value, reflective (Sweeney and Soutar, 2001) | EMV_01 | Enjoyment | 3.902 | [1; 5] | 0.842 | 1.942 | -1.036 |
| EMV_02 | Pleasure | 3.724 | [1; 5] | 0.887 | 0.940 | -0.675 | |
| EMV_03 | Relaxation | 3.799 | [1; 5] | 0.877 | 1.465 | -0.675 | |
| Ease of use, reflective (Moore and Benbasat, 1991) | EOU_01 | Learning duration | 4.011 | [1; 5] | 0.988 | 0.800 | -0.996 |
| EOU_02 | Operation | 4.092 | [1; 5] | 0.811 | 0.798 | -0.822 | |
| EOU_03 | Menu navigation | 3.971 | [1; 5] | 0.867 | 1.201 | -0.904 | |
| Perceived usefulness, reflective (Antón et al., 2013; Moore and | PU_01 | General advantage | 3.397 | [1; 5] | 0.970 | -0.176 | -0.296 |
| Benbasat, 1991) | PU_02 | Practical application | 3.598 | [1; 5] | 1.055 | -0.106 | -0.585 |
| PU_03 | Improvement of reading | 3.293 | [1; 5] | 1.109 | -0.534 | -0.474 | |
| Compatibility, reflective (Huang and Hsieh, 2012; Moore and Benbasat, 1991) | CO_01 | Reading behavior | 3.299 | [1; 5] | 0.996 | -0.238 | -0.419 |
| CO_02 | Consumption pattern | 3.427 | [1; 5] | 0.991 | 0.259 | -0.646 | |
| CO_03 | Reading needs | 3.655 | [1; 5] | 0.992 | 0.430 | -0.829 | |
| Adoption intention, reflective (Venkatesh et al., 2012) | AD_01 | Future usage | 4.023 | [1; 5] | 0.928 | 1.210 | -1.046 |
| AD_02 | Daily usage | 3.776 | [1; 5] | 0.972 | 0.360 | -0.712 | |
| AD_03 | Frequent usage | 3.845 | [1; 5] | 0.925 | 0.869 | -0.785 | |
| Technology use, single item (Venkatesh et al., 2012) | USE_01 | e-books | 3.983 | [1; 7] | 1.610 | -0.894 | -0.063 |
Results summary of (reflective) measurement models
| Latent variables | Indicators | Weights | Loadings | Indicator communality (squared loadings) | AVE | Composite reliability | Cronbach’s
|
|
HTMT 95% bootstrap confidence interval does not include 1 |
| Emotional value | EMV_01 | 0.338 | 0.891 | 0.794 | 0.853 | 0.946 | 0.914 | 0.917 | Yes |
| EMV_02 | 0.375 | 0.950 | 0.903 | ||||||
| EMV_03 | 0.368 | 0.929 | 0.863 | ||||||
| Ease of use | EOU_01 | 0.453 | 0.784 | 0.615 | 0.697 | 0.873 | 0.783 | 0.873 | Yes |
| EOU_02 | 0.371 | 0.878 | 0.771 | ||||||
| EOU_03 | 0.380 | 0.840 | 0.706 | ||||||
| Perceived usefulness | PU_01 | 0.319 | 0.722 | 0.521 | 0.642 | 0.842 | 0.723 | 0.753 | Yes |
| PU_02 | 0.426 | 0.819 | 0.671 | ||||||
| PU_03 | 0.491 | 0.856 | 0.737 | ||||||
| Compatibility | CO_01 | 0.396 | 0.901 | 0.812 | 0.779 | 0.914 | 0.858 | 0.859 | Yes |
| CO_02 | 0.357 | 0.906 | 0.821 | ||||||
| CO_03 | 0.381 | 0.840 | 0.706 | ||||||
| Adoption intention | AD_01 | 0.345 | 0.933 | 0.870 | 0.889 | 0.960 | 0.938 | 0.939 | |
| AD_02 | 0.347 | 0.935 | 0.874 | ||||||
| AD_03 | 0.368 | 0.960 | 0.922 |
Bottleneck table in different formats
| Bottleneck technology use, standardized latent variable scores percentage ranges (as in Richter et al., 2020) | |||||
| Adoption intention | Emotional value | Ease of use* | Perceived usefulness | Compatibility | |
| 0 | NN | NN | NN | NN | NN |
| 10 | NN | NN | 10.2 | NN | NN |
| 20 | NN | NN | 10.2 | NN | NN |
| 30 | NN | NN | 10.2 | NN | NN |
| 40 | 33.8 | 49.6 | 20.0 | 15.7 | 25.5 |
| 50 | 33.8 | 49.6 | 20.0 | 15.7 | 25.5 |
| 60 | 33.8 | 49.6 | 20.0 | 15.7 | 33.7 |
| 70 | 33.8 | 49.6 | 20.5 | 48.1 | 33.7 |
| 80 | 33.8 | 49.6 | 20.5 | 48.1 | 33.7 |
| 90 | 75.0 | 49.6 | 60.2 | 66.2 | 33.7 |
| 100 | 75.0 | 49.6 | 60.2 | 66.2 | 33.7 |
| Bottleneck technology use, rescaled latent variable scores, percentage ranges | |||||
| 0 | NN | NN | NN | NN | NN |
| 10 | NN | NN | 10.2 | NN | NN |
| 20 | NN | NN | 10.2 | NN | NN |
| 30 | NN | NN | 10.2 | NN | NN |
| 40 | 33.8 | 49.6 | 20.0 | 15.7 | 25.5 |
| 50 | 33.8 | 49.6 | 20.0 | 15.7 | 25.5 |
| 60 | 33.8 | 49.6 | 20.0 | 15.7 | 33.7 |
| 70 | 33.8 | 49.6 | 20.5 | 48.1 | 33.7 |
| 80 | 33.8 | 49.6 | 20.5 | 48.1 | 33.7 |
| 90 | 75.0 | 49.6 | 60.2 | 66.2 | 33.7 |
| 100 | 75.0 | 49.6 | 60.2 | 66.2 | 33.7 |
| Bottleneck technology use, rescaled latent variable scores, actual scores | |||||
| 0 | NN | NN | NN | NN | NN |
| 10 | NN | NN | 25.4 | NN | NN |
| 20 | NN | NN | 25.4 | NN | NN |
| 30 | NN | NN | 25.4 | NN | NN |
| 40 | 33.8 | 49.6 | 33.5 | 15.7 | 25.5 |
| 50 | 33.8 | 49.6 | 33.5 | 15.7 | 25.5 |
| 60 | 33.8 | 49.6 | 33.5 | 15.7 | 33.7 |
| 70 | 33.8 | 49.6 | 33.9 | 48.1 | 33.7 |
| 80 | 33.8 | 49.6 | 33.9 | 48.1 | 33.7 |
| 90 | 75.0 | 49.6 | 66.9 | 66.2 | 33.7 |
| 100 | 75.0 | 49.6 | 66.9 | 66.2 | 33.7 |
References
Alyahya, M., Agag, G., Aliedan, M., Abdelmoety, Z.H., Daher, M.M., 2023. A sustainable step forward: understanding factors affecting customers’ behaviour to purchase remanufactured products. J. Retailing Consum. Serv. 70, 103172.
American Customer Satisfaction Index, 2022. Unparalleled Customer Intelligence. Retrieved from. https://www.theacsi.org/our-industries/.
Anderson, E.W., Mittal, V., 2000. Strengthening the satisfaction-profit chain. J. Serv. Res. 3 (2), 107-186.
Antón, C., Camarero, C., Rodríguez, J., 2013. Usefulness, enjoyment, and self-image congruence: the adoption of e-book readers. Psychol. Market. 30 (4), 372-384.
Bergh, D.D., Boyd, B.K., Byron, K., Gove, S., Ketchen, D.J., 2022. What constitutes a methodological contribution? J. Manag. 48 (7), 1835-1848.
Bolívar, L.M., Roldán, J.L., Castro-Abancéns, I., Casanueva, C., 2022. Speed of international expansion: the mediating role of network resources mobilisation. Manag. Int. Rev. 62, 541-568.
Cheah, J.-H., Magno, F., Cassia, F., 2023. Reviewing the smartPLS 4 software: the latest features and enhancements. Journal of Marketing Analytics. Advance online publication.
Davis, F.D., 1989. Perceived usefulness, perceived ease of use, and user acceptance of information technology. MIS Quarterly 13 (3), 319-340.
Davis, F.D., Bagozzi, R.P., Warshaw, P.R., 1989. User acceptance of computer technology: a comparison of two theoretical models. Manag. Sci. 35 (8), 982-1003.
Dul, J., 2016. Necessary condition analysis (NCA): logic and methodology of “necessary but not sufficient” causality. Organ. Res. Methods 19 (1), 10-52.
Dul, J., 2020. Conducting Necessary Condition Analysis. Sage, London.
Dul, J., 2021a. Advances in Necessary Condition Analysis. Online book retrieved from:, Version 0.1. https://bookdown.org/ncabook/advanced_nca2/.
Dul, J., 2021b. Necessary Condition Analysis (NCA) with R. A Quick Start Guide: 2 March 2021. Online document retreived from:, Version 3.1.0. https://www.erim.eur.nl
/fileadmin/user_upload/_generated/download/Quick_Start_Guide_NCA_3.1.0_Ma rch_2_2021.pdf.
Dul, J., 2022. R Package NCA: Necessary Condition Analysis. Version:, 3.2.0. https://cr an.r-project.org/web/packages/NCA/index.html.
Dul, J., Hauff, S., Bouncken, R.B., 2023. Necessary condition analysis (NCA): review of research topics and guidelines for good practice. Rev. Manag. Sci. 17 (2), 683-714.
Dul, J., Hauff, S., Tóth, Z., 2021. Necessary condition analysis in marketing research. In: Nunkoo, R., Teeroovengadum, V., Ringle, C.M. (Eds.), Handbook of Research Methods for Marketing Management. Edward Elgar, pp. 51-72.
Fornell, C., 1992. A national customer satisfaction barometer: the Swedish experience. J. Market. 56 (1), 6-21.
Guenther, P., Guenther, M., Ringle, C.M., Zaefarian, G., Cartwright, S., 2023. Improving PLS-SEM use for business marketing research. Ind. Market. Manag. 111, 127-142.
Hair, J.F., Hult, G.T.M., Ringle, C.M., Sarstedt, M., 2022. A Primer on Partial Least Squares Structural Equation Modeling (PLS-SEM), 3 ed. Sage, Thousand Oaks, CA.
Hair, J.F., Hult, G.T.M., Ringle, C.M., Sarstedt, M., Thiele, K.O., 2017. Mirror, mirror on the wall: a comparative evaluation of composite-based structural equation modeling methods. J. Acad. Market. Sci. 45 (5), 616-632.
Hair, J.F., Risher, J.J., Sarstedt, M., Ringle, C.M., 2019. When to use and how to report the results of PLS-SEM. Eur. Bus. Rev. 31 (1), 2-24.
Hair, J.F., Sarstedt, M., Ringle, C.M., Gudergan, S.P., 2024. Advanced Issues in Partial Least Squares Structural Equation Modeling (PLS-SEM), 2 ed. Sage, Thousand Oaks, CA.
Hair, J.F., Sarstedt, M., Ringle, C.M., Mena, J.A., 2012. An assessment of the use of partial least squares structural equation modeling in marketing research. J. Acad. Market. Sci. 40 (3), 414-433.
Hauff, S., Guerci, M., Dul, J., van Rhee, H., 2021. Exploring necessary conditions in HRM research: fundamental issues and methodological implications. Hum. Resour. Manag. J. 31 (1), 18-36.
Hauff, S., Richter, N.F., Tressin, T., 2015. Situational job characteristics and job satisfaction: the moderating role of culture. Int. Bus. Rev. 24 (4), 710-723.
Huang, L.-Y., Hsieh, Y.-J., 2012. Consumer electronics acceptance based on innovation attributes and switching costs: the case of e-book readers. Electron. Commer. Res. Appl. 11 (3), 218-228.
Huete-Alcocer, N., Hernandez-Rojas, R.D., 2022. Do SARS-CoV-2 safety measures affect visitors experience of traditional gastronomy, destination image and loyalty to a world heritage city? J. Retailing Consum. Serv. 69, 103095.
Kristensen, K., Martensen, A., Grønholdt, L., 2000. Customer satisfaction measurement at post Denmark: results of application of the European customer satisfaction index methodology. Total Qual. Manag. 11 (7), S1007-S1015.
Le, H.T.P.M., Kim, D., Park, J., 2024. The way to generate customer citizenship behavior with customer experience. J. Retailing Consum. Serv. 76, 103608.
Lohmöller, J.-B., 1989. Latent Variable Path Modeling with Partial Least Squares. Physica, Heidelberg.
Martilla, J.A., James, J.C., 1977. Importance-performance analysis. J. Market. 41 (1), 77-79.
Moore, G.C., Benbasat, I., 1991. Development of an instrument to measure the perceptions of adopting an information technology innovation. Inf. Syst. Res. 2 (3), 192-222.
Ng, F.Z.-X., Yap, H.-Y., Tan, G.W.-H., Lo, P.-S., Ooi, K.-B., 2022. Fashion shopping on the go: a dual-stage predictive-analytics SEM-ANN analysis on usage behaviour, experience response and cross-category usage. J. Retailing Consum. Serv. 65, 102851.
Pappas, N., 2023. Came and gone? A longitudinal study of the effects of COVID-19 on tourism purchasing intentions. J. Retailing Consum. Serv. 72, 103269.
Perez-Aranda, J., Gonzáles Robles, E.M., Alarcón Urbistondo, P., 2023. Understanding antecedents of continuance and revisit intentions: the case of sport apps. J. Retailing Consum. Serv. 72, 103288.
Richter, N.F., Hauff, S., 2022. Necessary conditions in international business research: advancing the field with a new perspective on causality and data analysis. J. World Bus. 57 (5), 101310.
Richter, N.F., Hauff, S., Gudergan, S.P., Ringle, C.M., 2022. The use of partial least squares structural equation modeling and complementary methods in international management research. Manag. Int. Rev. 62 (4), 449-470.
Richter, N.F., Hauff, S., Kolev, A.E., Schubring, S., 2023a. Dataset on an extended technology acceptance model: a combined application of PLS-SEM and NCA. Data Brief 48, 109190.
Richter, N.F., Hauff, S., Ringle, C.M., Sarstedt, M., Kolev, A.E., Schubring, S., 2023b. How to apply necessary condition analysis in PLS-SEM. In: Latan, H., Hair, J.F., Noonan, R. (Eds.), Partial Least Squares Path Modeling: Basic Concepts, Methodological Issues and Applications. Springer, pp. 267-297.
Richter, N.F., Schubring, S., Hauff, S., Ringle, C.M., Sarstedt, M., 2020. When predictors of outcomes are necessary: guidelines for the combined use of PLS-SEM and NCA. Ind. Manag. Data Syst. 120 (12), 2243-2267.
Rigdon, E.E., Ringle, C.M., Sarstedt, M., 2010. Structural modeling of heterogeneous data with partial least squares. In: Malhotra, N.K. (Ed.), Review of Marketing Research, vol. 7. Sharpe, Armonk, NY, pp. 255-296.
Ringle, C.M., Sarstedt, M., 2016. Gain more insight from your PLS-SEM results: the importance-performance map analysis. Ind. Manag. Data Syst. 116 (9), 1865-1886.
Ringle, C.M., Wende, S., Becker, J.-M., 2022. SmartPLS 4. Oststeinbek: SmartPLS. Retrieved from. https://www.smartpls.com/.
Rodríguez, P.G., Villarreal, R., Valiño, P.C., Blozis, S., 2020. A PLS-SEM approach to understanding e-SQ, e-satisfaction and e-loyalty for fashion e-retailers in Spain. J. Retailing Consum. Serv. 57, 102201.
Sarstedt, M., Hair, J.F., Ringle, C.M., Thiele, K.O., Gudergan, S.P., 2016. Estimation issues with PLS and CBSEM: where the bias lies. J. Bus. Res. 69 (10), 3998-4010.
Sever, I., 2015. Importance-performance analysis: a valid management tool? Tourism Manag. 48, 43-53.
Shahidi, N., Tossan, V., Bourliataux-Lajoinie, S., Cacho-Elizondo, S., 2022. Behavioral intention to use a contact tracing application: the case of StopCovid in France. J. Retailing Consum. Serv. 68, 102998.
Sheth, J.N., Newman, B.I., Gross, B.L., 1991. Why we buy what we buy: theory of consumption values. J. Bus. Res. 22 (2), 159-170.
Siyal, A.W., Chen, H., Jamal Shah, S., Shahzad, F., Bano, S., 2024. Customization at a glance: investigating consumer experiences in mobile commerce applications. J. Retailing Consum. Serv. 76, 103602.
Slack, N., 1994. The importance-performance matrix as a determinant of improvement Priority. Int. J. Oper. Prod. Manag. 44 (5), 59-75.
Streukens, S., Leroi-Erelds, S., Willems, K., 2017. Dealing with nonlinearity in importance-performance map analysis (IPMA): an integrative framework in a PLSSEM context. In: Latan, H., Noonan, R. (Eds.), Partial Least Squares Path Modeling. Springer, Cham, pp. 367-403.
Sukhov, A., Olsson, L.E., Friman, M., 2022. Necessary and sufficient conditions for attractive public transport: combined use of PLS-SEM and NCA. Transport. Res. Pol. Pract. 158, 239-250.
Sweeney, J.C., Soutar, G.N., 2001. Consumer perceived value: the development of a multiple item scale. J. Retailing 77 (2), 203-220.
Tiwari, P., Kaurav, R.P.S., Koay, K.Y., 2023. Understanding travel apps usage intention: findings from PLS and NCA. Journal of Marketing Analytics. advance online publication.
Turner, M., Kitchenham, B., Brereton, P., Charters, S., Budgen, D., 2010. Does the technology acceptance model predict actual use? A systematic literature review. Inf. Software Technol. 52 (5), 463-479.
Venkatesh, V., Thong, J.Y.L., Xu, X., 2012. Consumer acceptance and use of information technology: extending the unified theory of acceptance and use of technology. MIS Quarterly 36 (1), 157-178.
Wold, H., 1982. Soft modeling: the basic design and some extensions. In: Jöreskog, K.G., Wold, H. (Eds.), Systems under Indirect Observations: Part II. North-Holland, Amsterdam, pp. 1-54.
Zhang, P., Chao, C.-W., Chiong, R., Hasan, N., Aljaroodi, H.M., Tian, F., 2023. Effects of in-store live stream on consumers’ offline purchase intention. J. Retailing Consum. Serv. 72, 103262.
Bokrantz, J., Dul, J., 2023. Building and testing necessity theories in supply chain management. J. Supply Chain Manag. 59 (1), 48-65.
Sarstedt, M., Mooi, E.A., 2019. A Concise Guide to Market Research: The Process, Data, and Methods Using IBM SPSS Statistics. 3, ed. Springer, Berlin, Heidelberg.
Sharma, P.N., Liengaard, B.D., Hair, J.F., Sarstedt, M., Ringle, C.M., 2023. Predictive model assessment and selection in composite-based modeling using PLS-SEM: extensions and guidelines for using CVPAT. Eur. J. Market. 57 (6), 1662-1677.
Shmueli, G., Sarstedt, M., Hair, J.F., Cheah, J., Ting, H., Vaithilingam, S., Ringle, C.M., 2019. Predictive model assessment in PLS-SEM: guidelines for using PLSpredict. Eur. J. Market. 53 (11), 2322-2347.
- Corresponding author. Ludwig-Maximilians-University Munich, LMU Munich School of Management, Ludwigstraße 28 RG/III, 80539, Munich, Germany.
E-mail addresses: hauff@hsu-hh.de (S. Hauff), nicole@sam.sdu.dk (N.F. Richter), sarstedt@lmu.de (M. Sarstedt), c.ringle@tuhh.de (C.M. Ringle).We refer to a trichotomous illustration here to facilitate interpretation; however, the NCA is not limited to specific measurement levels. For more information, see Dul (2020, Chapter 3). Also note that the symbols used in the NCA context have a different meaning than in the PLS-SEM context. While the latter usually uses to denote latent constructs and to denote indicators, the former uses Y for outcomes and X for conditions. Note that the bottleneck levels differ due to the different scales involved. Also note that this statement refers to the standardized, unstandardized or rescaled scores calculated in the IPMA context on the basis of a linear transformation. Other forms of transformation, particularly non-linear transformations, should be carefully considered, since they could affect the NCA’s results. Under https://www.pls-sem.net/downloads, we provide a Microsoft Excel template for downloading in order to produce this kind of indication. In the Appendix, we offer a comparison of bottleneck tables for the standardized latent variable scores based on percentage ranges, the rescaled latent variable scores based on percentage ranges, and the bottleneck table for rescaled latent variable scores based on the actual values. We also comment on the differences (see Table A3 in the Appendix).