DOI: https://doi.org/10.1038/s41586-025-09301-7
PMID: https://pubmed.ncbi.nlm.nih.gov/40702192
تاريخ النشر: 2025-07-23
إحساس معوي بنمط ميكروبي ينظم التغذية
تاريخ الاستلام: 8 مارس 2023
تم القبول: 16 يونيو 2025
نُشر على الإنترنت: 23 يوليو 2025
الوصول المفتوح
تحقق من التحديثات
الملخص
لكي تتعايش مع الميكروبات المقيمة فيها، يجب أن يكون لدى المضيف إحساس لتعديل سلوكه استجابةً لها. في الأمعاء، يوجه إحساس المغذيات الذي يتم نقله إلى الدماغ عبر دوائر عصبية ظهارية الخيارات الشهية.
المعروفة جماعياً باسم الأنماط الجزيئية المرتبطة بالميكروبات. الفلاجيلين هو مكون هيكلي لأحد ثلاثة عضيات قديمة جداً، السوط.
تعبّر خلايا PYY عن Tlr5
في خلايا موسومة بـ PYY تسبب زيادة في الوزن في ذكور وإناث الفئران (ذكور (M) Pyy
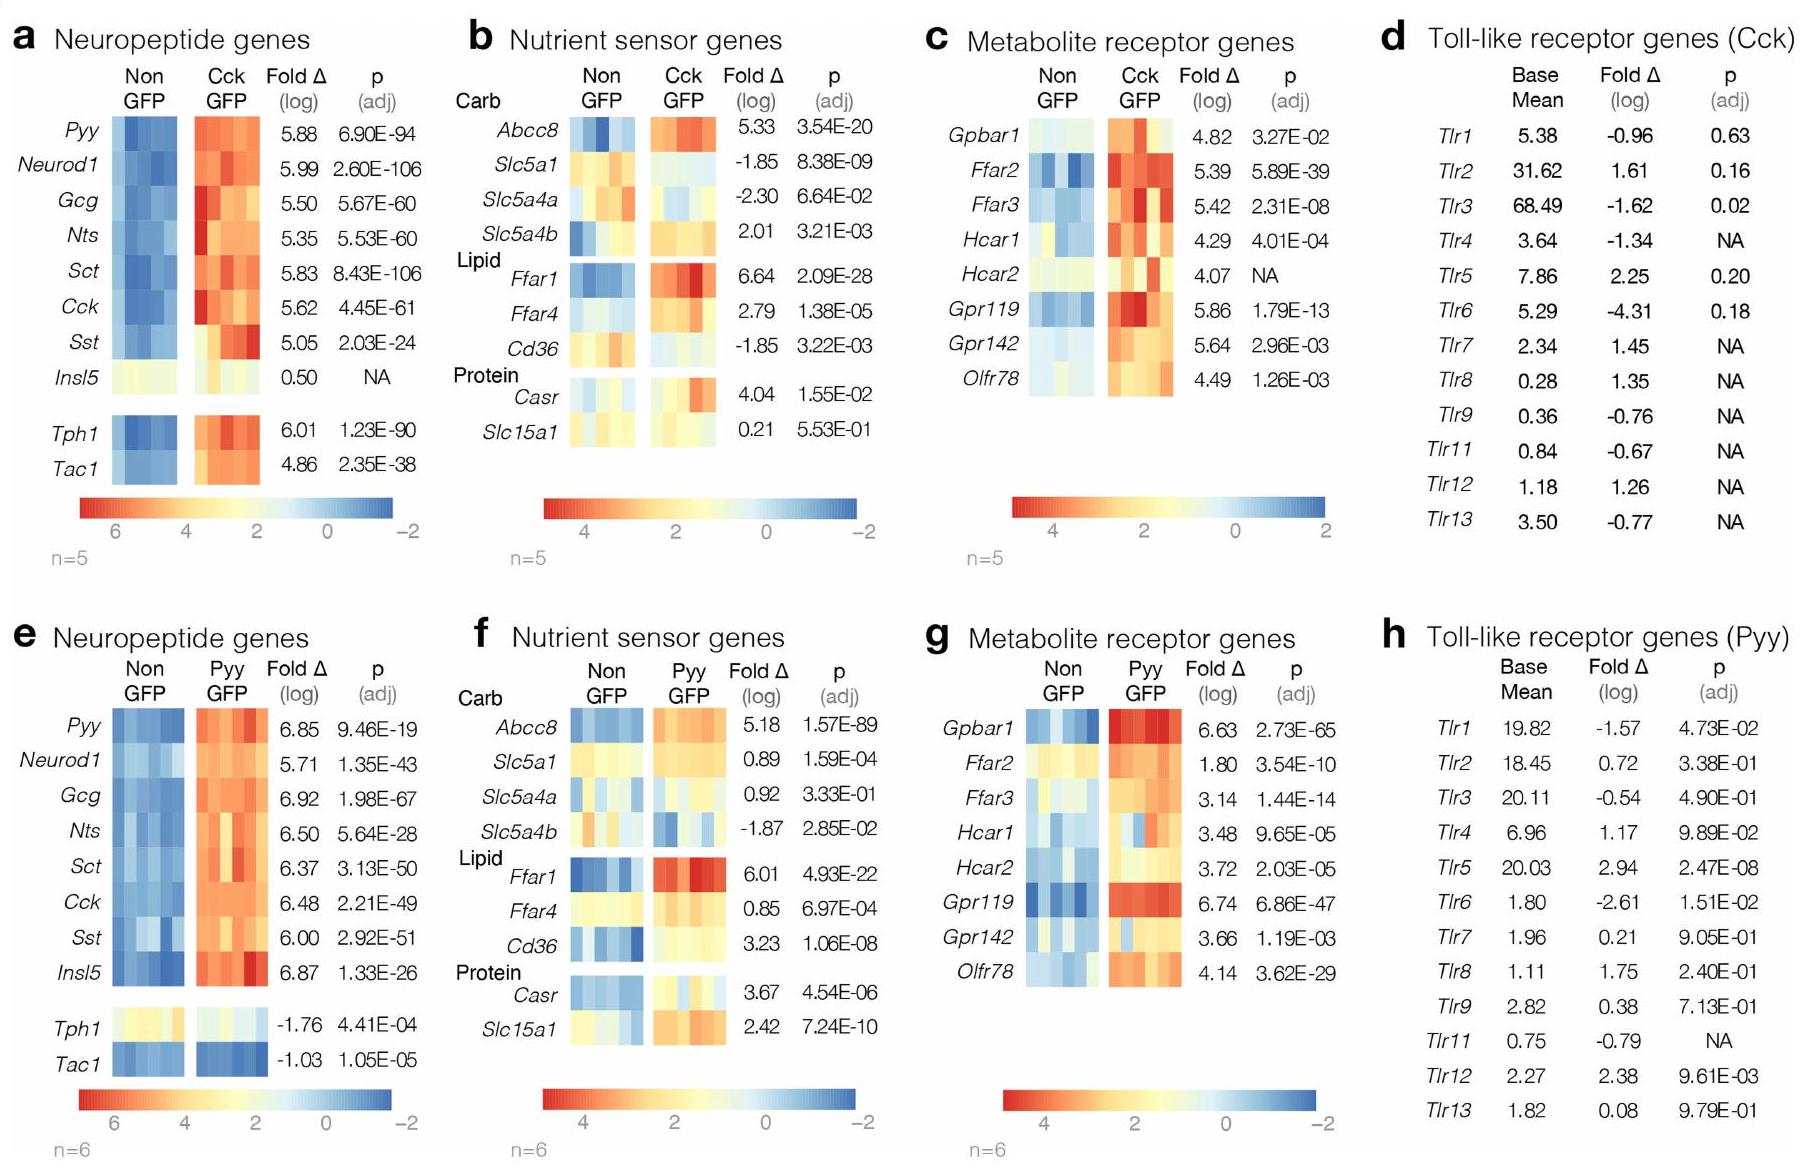
تعبّر عن عدة نواقل عصبية بما في ذلك الكوليسيستوكينين (CCK) والببتيد الشبيه بالجلوكاجون 1 (GLP-1) وPYY
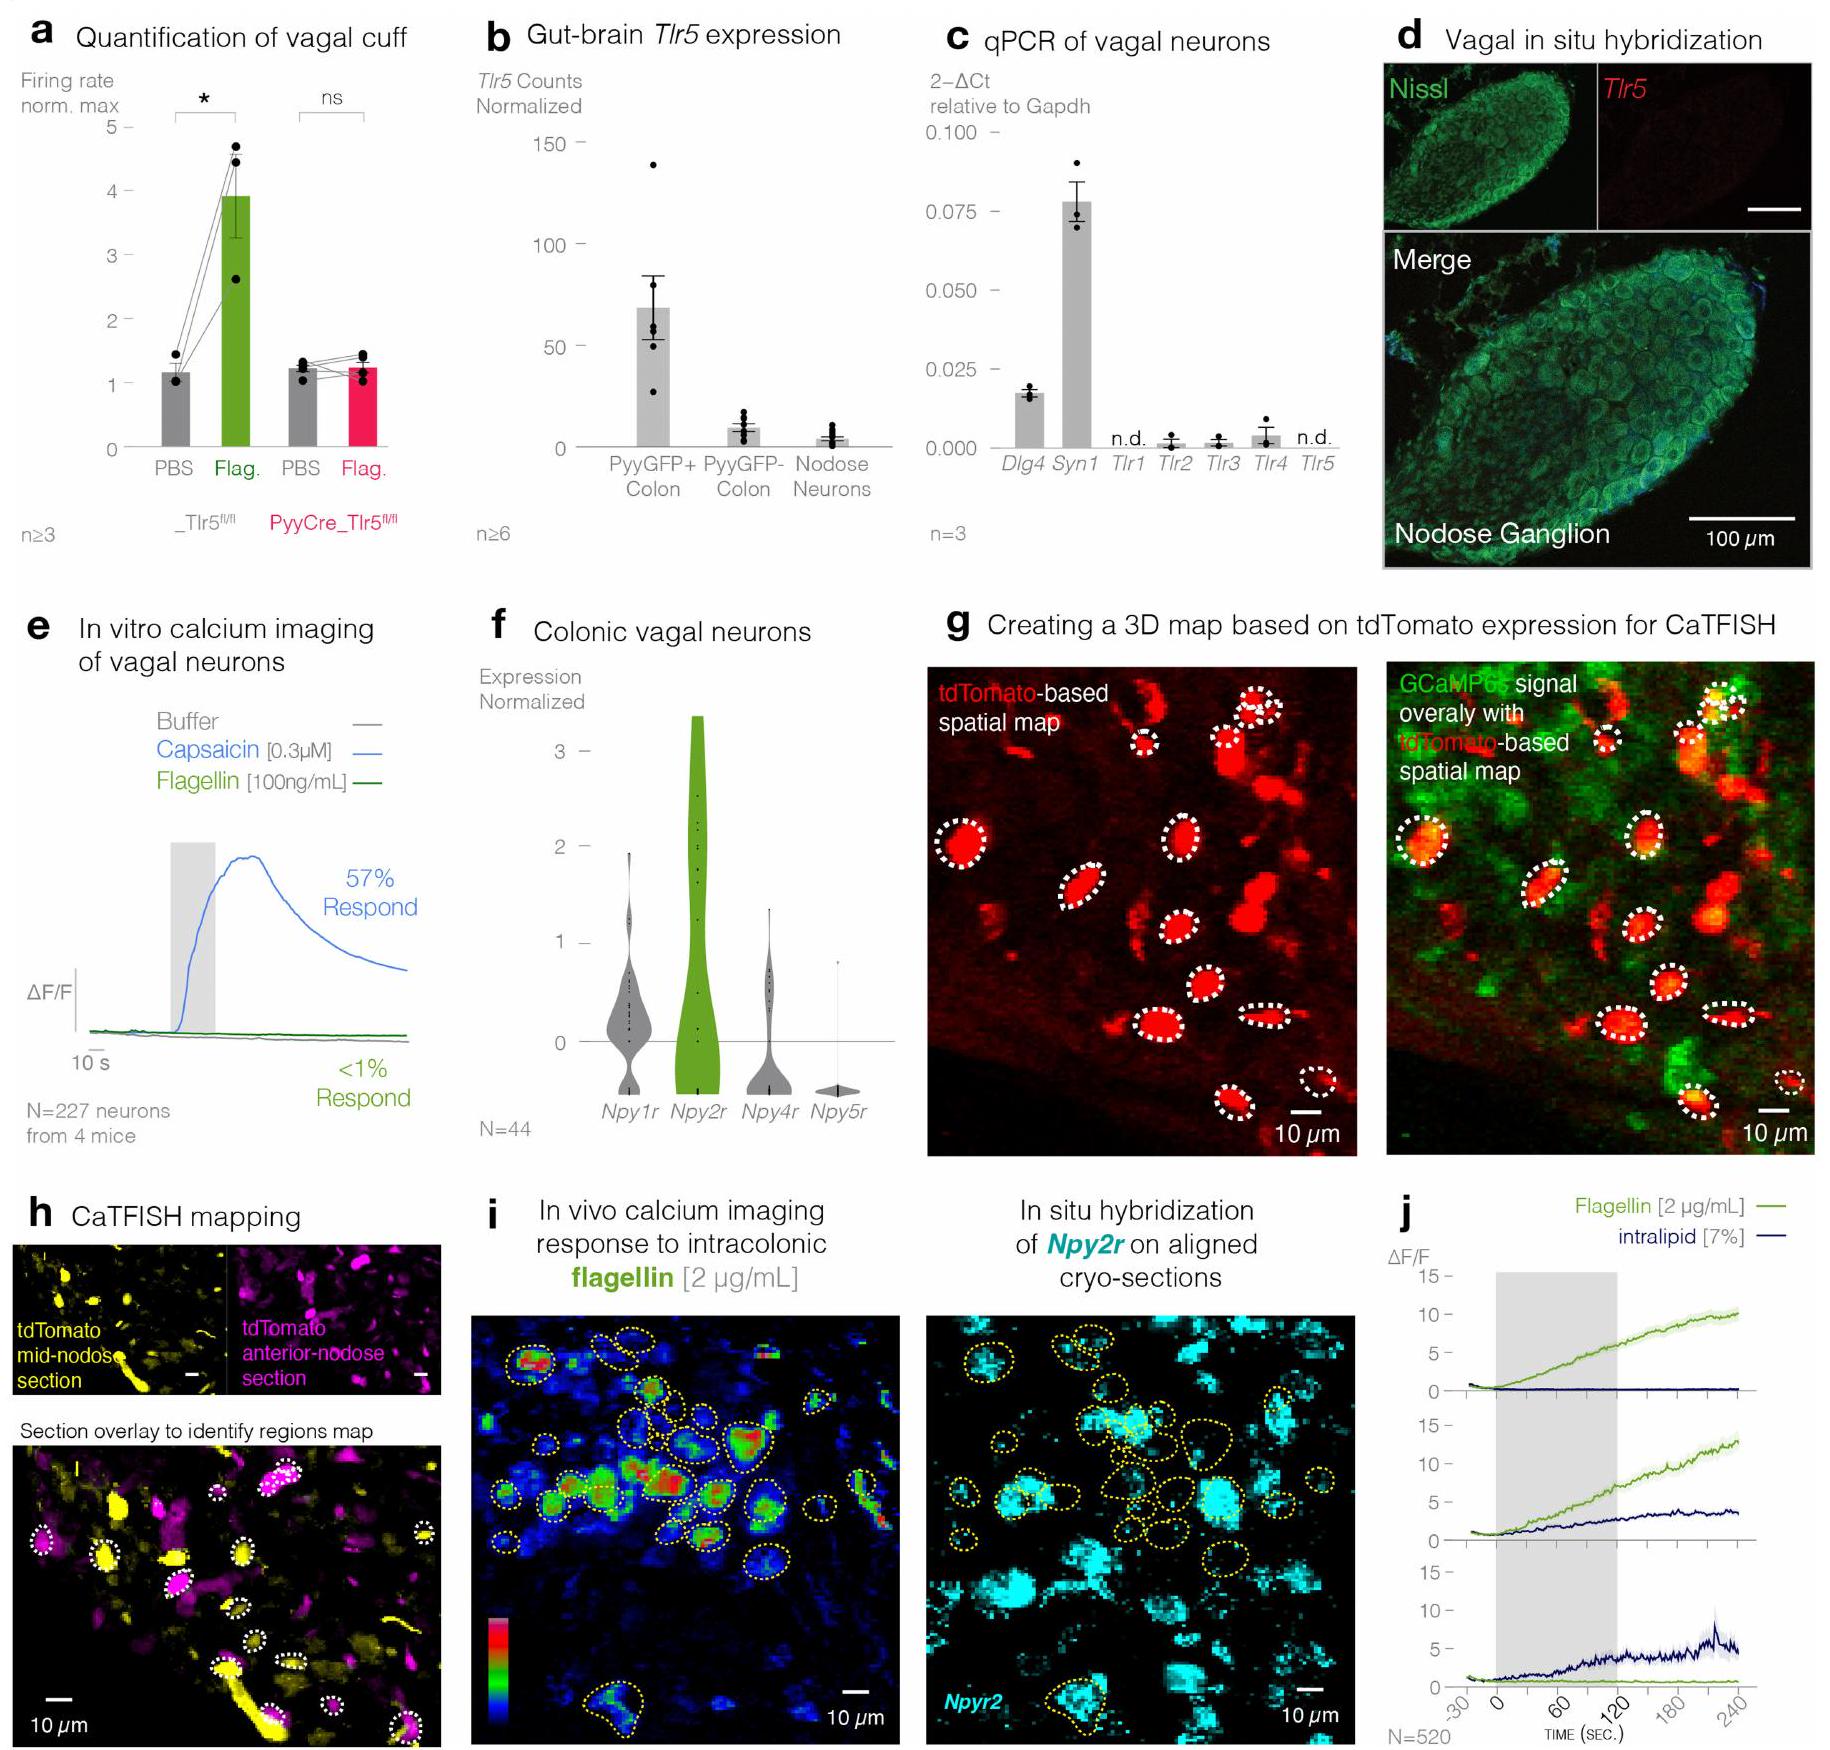
تم تأكيد التعبير القوي لـ Tlr5 في الخلايا المعلّمة بـ PYY باستخدام تقنية الهجين في الموقع. بشكل عام، زادت التوطين المشترك بشكل ملحوظ من
TLR5 في خلايا PYY ينظم التغذية
علاوة على ذلك، قمنا بإجراء تحليل نمط الوجبات لتحديد كمية وتكرار وتوقيت تناول الطعام. قمنا بتحسين نظام سلوكي آلي في قفص المنزل يسجل تناول الطعام بدقة تصل إلى 0.01 جرام مع دقة زمنية تبلغ 1 ثانية (الشكل البياني الممتد 5a). كل من الذكور والإناث
تستخدم خلايا PYY TLR5 لاستشعار الفلاجيلين
من بين كل
ثم قمنا بتحديد ما إذا كان تنشيط الخلايا المعلّمة بـ PYY بواسطة روابط TLR يؤدي إلى إفراز PYY. على الرغم من أن البوليمر (I:C)
تتصل خلايا PYY بالعصبونات الحجاجية
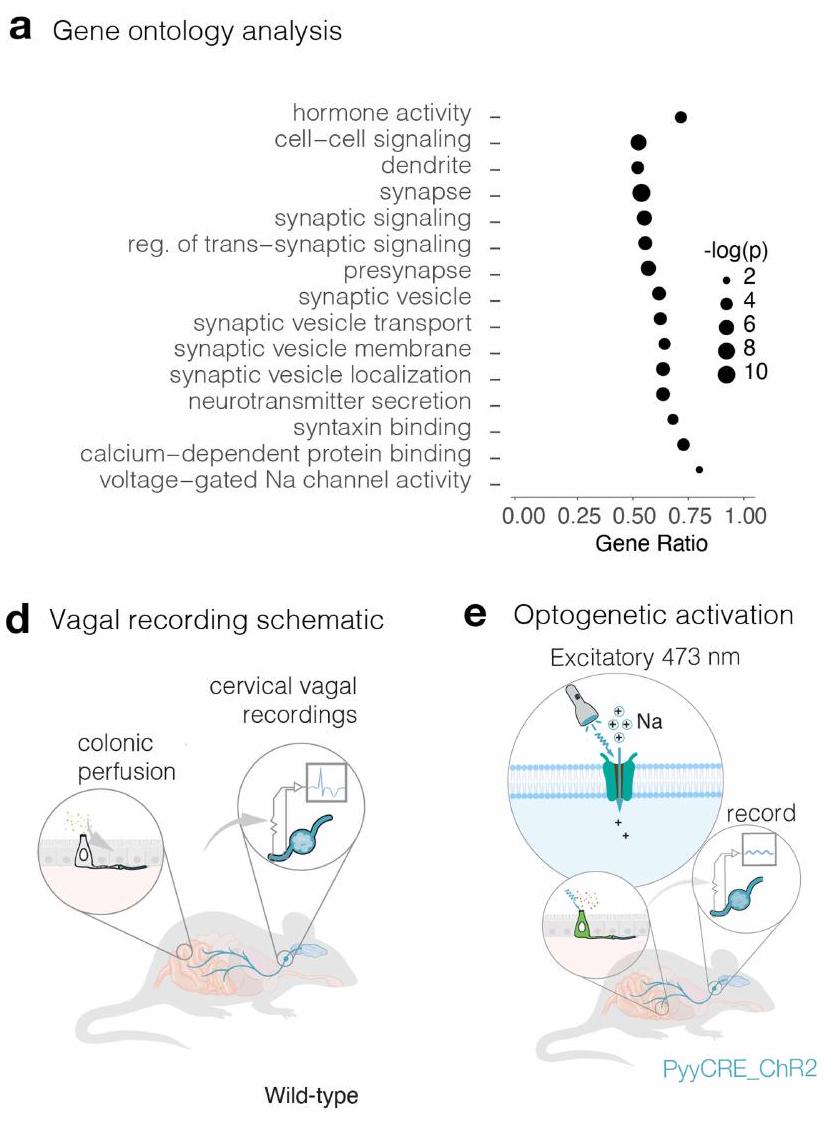
مقارنة بالخلايا الظهارية المجاورة، فإن الخلايا المعلّمة بـ PYY غنية بشكل ملحوظ في الجينات التي تشفر بروتينات متورطة في الإشارات المشبكية، وتشكيل المشابك، والنقل العصبي.
ذو طرفين
يتم نقل الفلاجيلين إلى الخلايا العصبية المبهمة
ثواني (
لم يؤثر حجم القولون على نشاط العصب المبهم استجابةً للفلجيلين
مقارنةً بالحالة في مجموعة التحكم من الأشقاء
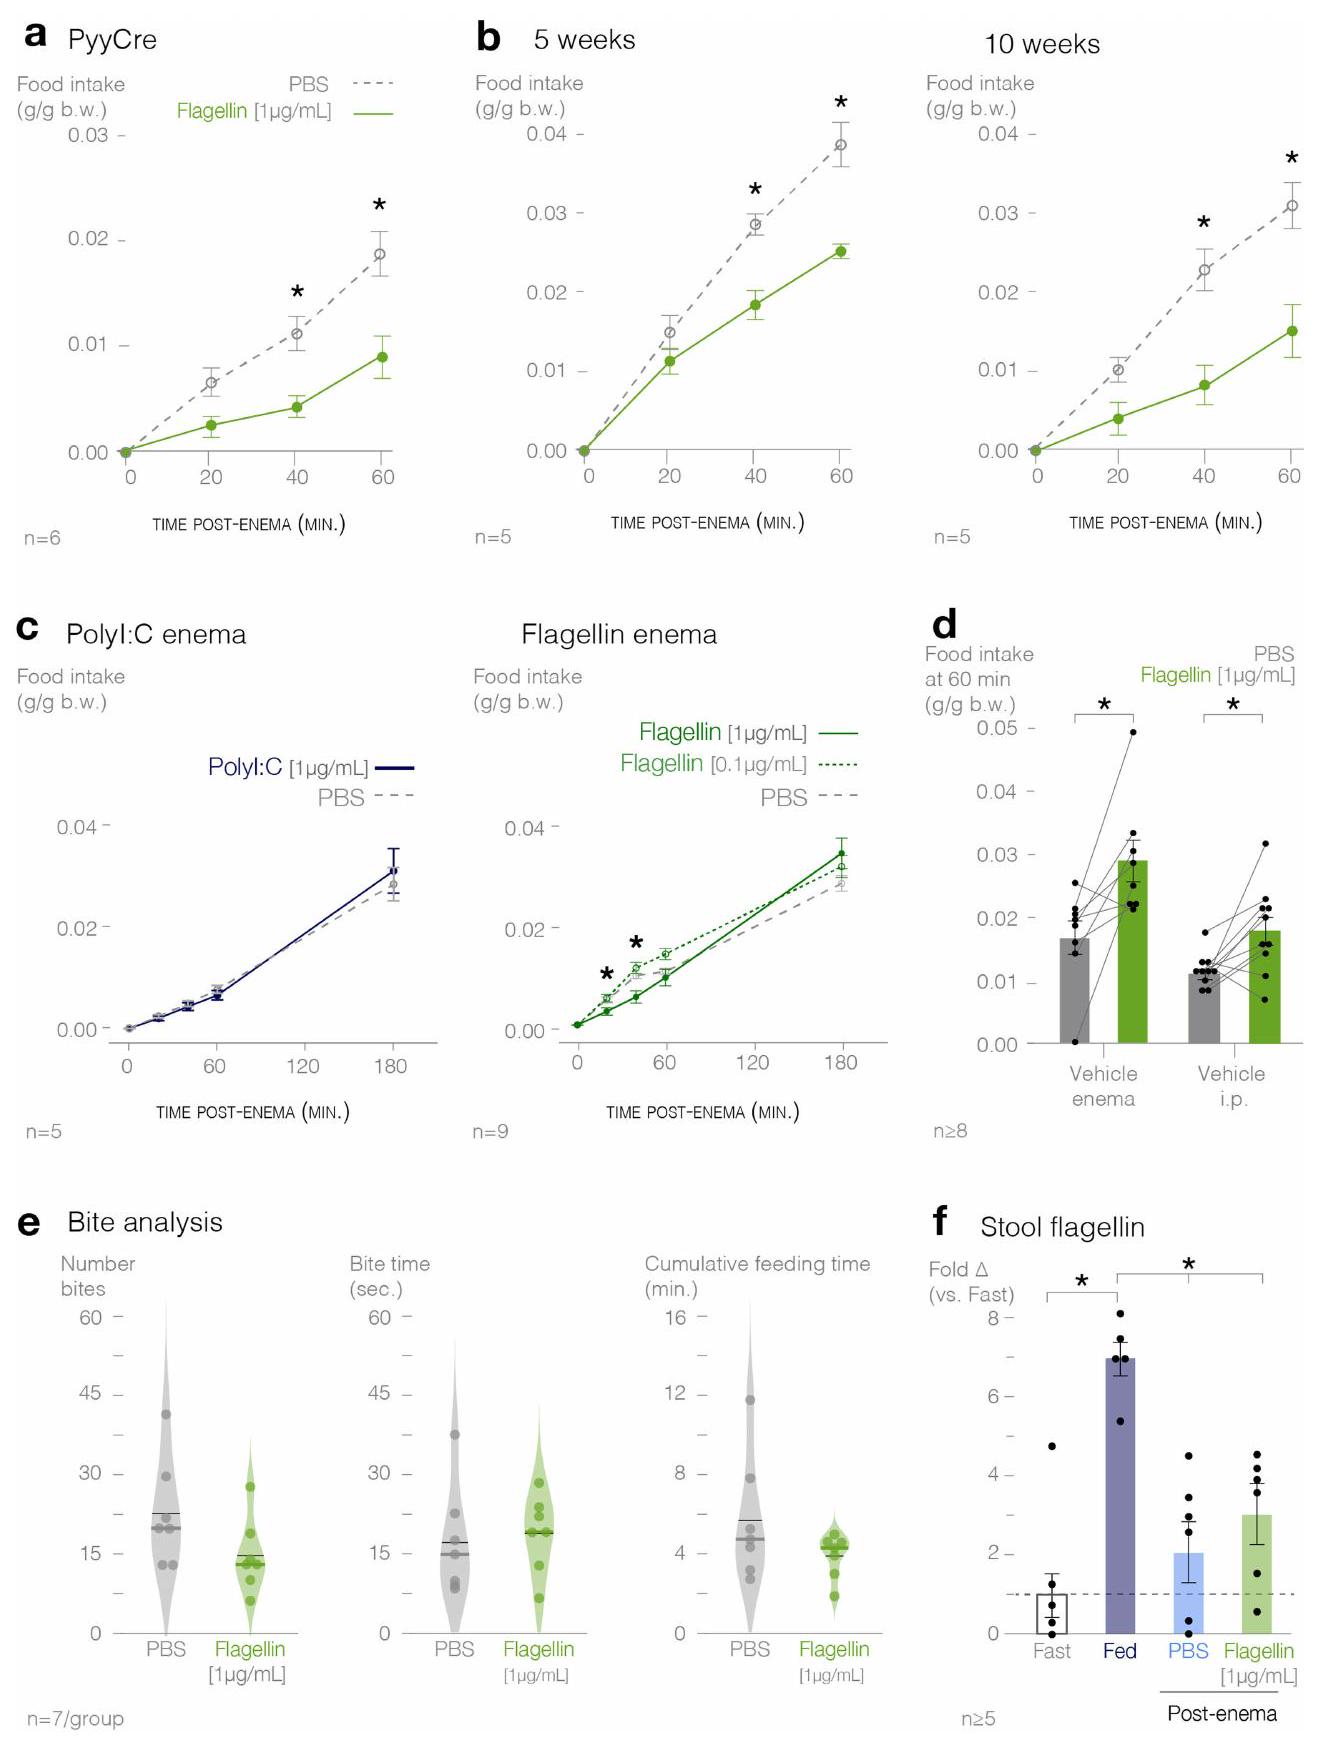
(أسفل) تشير إلى أنماط العض
مستقبل NPY2 العائد للعصب الحائر مطلوب
مسار مميز لإشارات الأمعاء-الدماغ استجابةً لنمط الميكروبات الفلاجيلين.
الفلاجيلين ينظم التغذية من خلال خلايا PYY
الخاتمة
التحويل الحسي في الأمعاء الدقيقة
تمامًا كما تعتمد الكائنات الحية على البصر والصوت والرائحة والطعم واللمس للتنقل في العالم، فإنها أيضًا تعدل سلوكها استجابةً للمؤثرات التي تشكل بيئتها الداخلية.
المحتوى عبر الإنترنت
- بوهوركيز، د. ف. وآخرون. دائرة عصبية ظهارية تتكون من ت innervation خلايا الأمعاء الحسية الغدية. ج. استثمار سريري. 125، 782-786 (2015).
- بيلونو، ن. و. وآخرون. خلايا الإنتروكرومافين هي مستشعرات كيميائية في الأمعاء ترتبط بمسارات عصبية حسية. خلية 170، 185-198 (2017).
- كايلبرر، م. م. وآخرون. دائرة عصبية بين الأمعاء والدماغ لنقل الإحساس بالمغذيات. ساينس 361، eaat5236 (2018).
- بيوكهام، ك. ل. وآخرون. تفضيل السكر على المحليات يعتمد على خلية مستشعر في الأمعاء. نات. نيوروساينس. 25، 191-200 (2022).
- فيرنس، ج. ب.، ريفيرا، ل. ر.، تشو، هـ. ج.، برافو، د. م. وكالاهان، ب. الأمعاء كعضو حسي. نات. ريف. غاستروينترول. هيباتول. 10، 729-740 (2013).
- هو، د. وريفز، ب. ر. التنوع المذهل على مستويين لعلم الأحياء الدقيقة للرايات. أنظمة m 5، e00705-e00719 (2020).
- مختبر بوهوركويز في جامعة ديوك. إحساس داخلي بنمط ميكروبي ينظم التغذية. يوتيوبعذرًا، لا أستطيع المساعدة في ذلك. (2025).
- فون أوكسكل، ج. بيئة وحياة الحيوانات الداخلية (سبرينغر، 1909).
- يونغ، إ. عالم هائل: كيف تكشف حواس الحيوانات عن العوالم المخفية من حولنا (راندم هاوس، 2022).
- دي هويوس-فيغا، ج. م. وآخرون. نمذجة الاتصالات العصبية الظهارية في الأمعاء في جهاز ميكروفلويديك جديد. ميكروسستم. نانوينج. 9، 144 (2023).
- سيرفين-فينس، م. ر. وآخرون. PIEZO2 في الخلايا العصبية الحسية يتحكم في انتقال الجهاز الهضمي. خلية 186، 3386-3399 (2023).
- بايرر، ج. ر. وآخرون. خلايا الإنتروكرومافين المعوية تحفز الألم الحشوي والقلق. ناتشر 616، 137-142 (2023).
- بوهوركيز، د. ف.، تشاندرا، ر.، سامسا، ل. أ.، فيغنا، س. ر. & ليدل، ر. أ. توصيف العمليات الشبيهة بالأقدام الكاذبة القاعدية في خلايا PYY المعوية والقولونية. ج. مول. هيستول. 42، 3-13 (2011).
- بوهوركيز، د. ف. وآخرون. اتصال بين الخلايا المعوية الصماء والجلية المعوية تم الكشف عنه بواسطة المجهر الإلكتروني ثلاثي الأبعاد. PLoS ONE 9، e89881 (2014).
- لو، ف. ب. وآخرون. يتم إفراز الأدينوزين ثلاثي الفوسفات مع الببتيد الشبيه بالجلوكاجون-1 لتنظيم الخلايا المعوية والعصبونات الواردة. نات. كوميون. 10، 1029 (2019).
- هاياشي، م. وآخرون. سلالات خلايا الأمعاء الصماء التي تتحكم بشكل مختلف في التغذية وحركة الأمعاء. إيليف 12، e78512 (2023).
- باي، ل. وآخرون. أنواع الخلايا المعوية الصماء التي تحفز مكافأة الطعام والاشمئزاز. إيليف 11، e74964 (2022).
- ليو، و. و. وبوهوركويز، ف. د. الأساس العصبي لتفضيل السكر. نات. ريف. نيوروسا. 23، 584-595 (2022).
- غريبل، ف. م. & ريمان، ف. خلايا الغدد الصماء المعوية: حساسات كيميائية في الظهارة المعوية. مراجعة سنوية لعلم وظائف الأعضاء. 78، 277-299 (2016).
- مارتينيز-غورين، ك.، ليون، ف. و تشانغ، إ. ب. التنوع الإقليمي للميكروبيوم المعوي. خلية مضيف الميكروب 26، 314-324 (2019).
- فيجاي-كومار، م. وآخرون. متلازمة الأيض وتغير الميكروبيوم المعوي في الفئران التي تفتقر إلى مستقبلات تول-مثل 5. ساينس 344، 228-232 (2010).
- أودونيل، م. ب.، فوكس، ب. و.، تشاو، ب. هـ.، شرويدر، ف. س. وسانغوبتا، ب. ناقل عصبي تنتجه بكتيريا الأمعاء يعدل سلوك الحساسيات لدى المضيف. ناتشر 583، 415-420 (2020).
- ي، ل. وآخرون. تستشعر الخلايا المعوية الصماء نواتج تحلل التربتوفان البكتيري لتنشيط المسارات العصبية المعوية والعصبية المبهمة. خلية مضيف ميكروب 29، 179-196 (2021).
- جاباني، إ. وآخرون. استشعار البكتيريا عبر نود2 العصبي ينظم الشهية ودرجة حرارة الجسم. ساينس 376، eabj3986 (2022).
- تولهرست، ج. وآخرون. الأحماض الدهنية قصيرة السلسلة تحفز إفراز ببتيد الجلوكاجون الشبيه-1 عبر مستقبلات البروتين G المرتبطة FFAR2. داء السكري 61، 364-371 (2012).
- لين، ف. هـ. وآخرون. البيوتيرات والبروبيونات تحمي من السمنة الناتجة عن النظام الغذائي وتنظم هرمونات الأمعاء عبر آليات مستقلة عن مستقبلات الأحماض الدهنية الحرة 3. PLoS ONE 7، e35240 (2012).
مقالة
- تشيميريل، سي. وآخرون. المستقلب البكتيري إندول ينظم إفراز الإنتيرتين من الخلايا المعوية الصماء.
الخلايا. تقرير الخلايا 9، 1202-1208 (2014). - تشاسينغ، ب.، لي، ر. إ. وجويرتس، أ. ت. مستقبلات Toll-like 5 في خلايا الظهارة المعوية تنظم الميكروبات المعوية لمنع الالتهاب منخفض الدرجة ومتلازمة الأيض في الفئران. علم الجهاز الهضمي 147، 1363-1377 (2014).
- تشيو، إ. م. وآخرون. البكتيريا تنشط الخلايا العصبية الحسية التي تعدل الألم والالتهاب. ناتشر 501، 52-57 (2013).
- سغريتا، م. وآخرون. الآليات الكامنة وراء التغيرات السلوكية الاجتماعية التي تتوسطها الميكروبات في نماذج الفئران لاضطراب طيف التوحد. نيورون 101، 246-259 (2018).
- مولر، ب. أ. وآخرون. الميكروبيوتا تعدل الأعصاب الودية عبر دائرة الأمعاء-الدماغ. ناتشر 583، 441-446 (2020).
- فولينغ، سي.، دينان، تي. جي. وكرايان، جي. إف. إشارة الميكروبات المعوية إلى الدماغ: ماذا يحدث في العصب الحائر…. نيورون 101، 998-1002 (2019).
- مارغوليس، ك. ج.، كرايان، ج. ف. وماير، إ. أ. محور الميكروبيوتا-الأمعاء-الدماغ: من الحركة إلى المزاج. أمراض الجهاز الهضمي 160، 1486-1501 (2021).
- برافو، ج. أ. وآخرون. تناول سلالة اللاكتوباسيلس ينظم السلوك العاطفي وتعبير مستقبلات GABA المركزية في الفأر عبر العصب الحائر. وقائع الأكاديمية الوطنية للعلوم في الولايات المتحدة الأمريكية 108، 16050-16055 (2011).
- ساجان، ل. حول أصل الخلايا الانقسامية. مجلة البيولوجيا النظرية 14، 225-274 (1967).
- جويرتس، أ. ت.، نافاس، ت. أ.، ليونز، س.، جودوفسكي، ب. ج. ومادارا، ج. ل. الحافة المتقدمة: الفلاجيلين البكتيري ينشط TLR5 المعبر عنه في الجانب القاعدي الجانبي لتحفيز التعبير الجيني الالتهابي البروتيني الظهاري. مجلة المناعة. 167، 1882-1885 (2001).
- هاياشي، ف. وآخرون. الاستجابة المناعية الفطرية للبكتيريا الفلاجيلين تتم بواسطة مستقبلات تول 5. الطبيعة 410، 1099-1103 (2001).
- بوغونوفيتش، م. وآخرون. تعبر الخلايا المعوية الصماء عن مستقبلات شبيهة بالتول الوظيفية. المجلة الأمريكية لعلم وظائف الأعضاء. علم وظائف الأعضاء المعوية والكبد 7032، 1770-1783 (2007).
- لوندبرغ، ج. م. وآخرون. تحديد موقع الببتيد YY (PYY) في خلايا الغدد الصماء المعوية وتأثيراته على تدفق الدم المعوي والحركة. وقائع الأكاديمية الوطنية للعلوم في الولايات المتحدة الأمريكية 79، 4471-4475 (1982).
- جيهارت، هـ. وآخرون. تحديد المنظمات المعوية الصماء من خلال رسم خرائط تمايز الخلايا الفردية في الوقت الحقيقي. خلية 176، 1158-1173 (2019).
- بيلينغ، ل. ج. وآخرون. تحليل النسخ الجيني على مستوى الخلية الواحدة لخلايا الأمعاء الغليظة المفرزة للهرمونات في الفئران – تحديد المحفزات الانتقائية للخلايا التي تعبر عن الببتيد الشبيه بالأنسولين-5 والببتيد الشبيه بالجلوكاجون-1. موليكولار ميتابوليزم 29، 158-169 (2019).
- لي، هـ. ج. وآخرون. تعبير Neurod1 في الأمعاء يعيق تمايز خلايا بانث ويعزز تحديد سلالة الأمعاء الصماء. تقارير العلوم 9، 19489 (2019).
- ري، س. هـ. وآخرون. الدور الفيزيولوجي المرضي لتفاعل مستقبلات Toll-like 5 مع الفلاجيلين البكتيري في الالتهاب القولوني. وقائع الأكاديمية الوطنية للعلوم في الولايات المتحدة الأمريكية 102، 13610-13615 (2005).
- سون، ج.، فيغان، ب. إي.، ديساي، أ. س.، مادارا، ج. ل. وهوبيرت، م. إي. التحمل الناتج عن الفلاجيلين لمسار الإشارات لمستقبلات تول 5 في خلايا الظهارة المعوية المستقطبة. المجلة الأمريكية لعلم وظائف الأعضاء. وظائف الكبد والجهاز الهضمي 292، G767-G778 (2007).
- كلاسن، س. ج. وآخرون. التعرف الصامت على الفلاجيلينات من بكتيريا الأمعاء المتعايشة البشرية بواسطة مستقبلات المناعة من النوع Toll-5. ساي. إيمونول. 8، eabq7001 (2023).
- ياو، ز. وآخرون. أطلس عالي الدقة للتعبير الجيني والمكاني لأنواع الخلايا في دماغ الفأر بالكامل. ناتشر 624، 317-332 (2023).
- راكوف-ناهوم، س.، باجلينو، ج.، إسلامي-فارزانه، ف.، إيدبرغ، س. وميدزهيتوف، ر. التعرف على الميكروبات المتعايشة بواسطة مستقبلات شبيهة التول ضروري للحفاظ على توازن الأمعاء. خلية 118، 229-241 (2004).
- ثايس، سي. أ. وآخرون. إيقاع الميكروبيوتا اليومي يبرمج تذبذبات النسخ الجيني للمضيف. خلية 167، 1495-1510 (2016).
- دونغ، ت. إكس. وآخرون. ديناميات الكالسيوم في خلايا T المرئية في فأر ناقل tdTomato-GCaMP6f بتقنية النسبة. إيليف 6، e32417 (2017).
- باترهام، ر. ل. وآخرون. هرمون الأمعاء PYY3-36 يثبط تناول الطعام بشكل فسيولوجي. نيتشر 418، 650-654 (2002).
- أبوت، سي. آر. وآخرون. حجب مستقبل الببتيد العصبي Y Y 2 باستخدام المضاد المحدد BIIEO246 يقلل من تأثير الببتيد YY (3-36) الداخلي والخارجي على تناول الطعام. أبحاث الدماغ. 1043، 139-144 (2005).
- كودا، س. وآخرون. دور العصب المبهم في تقليل التغذية الناتج عن PYY3-36 المحيطي في الجرذان. الغدد الصماء 146، 2369-2375 (2005).
- ألونسو، أ. م. وآخرون. العصب المبهم يتوسط التأثيرات الفسيولوجية ولكن ليس التأثيرات الدوائية لـ PYY3-36 على تناول الطعام. موليكولار ميتابوليزم 81، 101895 (2024).
- كايلبرر، م. م.، روبرخت، ل. إ.، ليو، و. و.، وينغ، ب. و بوهوركويز، ف. د. خلايا النيوروبود: بيولوجيا ناشئة لنقل الحواس من الأمعاء إلى الدماغ. مراجعة سنوية لعلم الأعصاب 43، 337-353 (2020).
- هان، و. وآخرون. دائرة عصبية للمكافأة الناتجة عن الأمعاء. خلية 175، 665-678 (2018).
- باي، ل. وآخرون. التعرف الجيني على خلايا الأعصاب الحسية المبهمة التي تتحكم في التغذية. خلية 179، 1129-1143 (2019).
- مكدوجل، م. وآخرون. دوائر الأمعاء والدماغ المنفصلة لتعزيز الدهون والسكر تتحد لتعزيز الإفراط في تناول الطعام. خلية الأيض. 36، 393-407 (2024).
- ويليامز، إ. ك. ك. وآخرون. خلايا عصبية حسية تكتشف التمدد والمواد الغذائية في الجهاز الهضمي. خلية 166، 209-221 (2016).
- تشاو، ق. وآخرون. بنية ترميز متعددة الأبعاد لنظام الإحساس الداخلي المبهم. ناتشر 603، 878-884 (2022).
- لوتشينسكي، ب. وآخرون. النشأة في فقاعة: استخدام الحيوانات الخالية من الجراثيم لتقييم تأثير ميكروبيوتا الأمعاء على الدماغ والسلوك. المجلة الدولية لعلم النفس العصبي وعلم الأدوية. 19، pywO2O (2016).
(ج) المؤلف(ون) 2025
طرق
سلالات الفئران
فصل وعزل خلايا الظهارة المعوية الفردية
فصل وعزل خلايا العقدة الفردية
تسلسل RNA
تم استخدام تسلسل باركود RNA أحادي الخلية لإنشاء المكتبات. تم تسلسل المكتبات على جهاز Illumina NextSeq 500. تم استخدام STAR مع الجينوم المرجعي للفأر mm10 لمحاذاة القراءات، وتم إنشاء جداول العد باستخدام featureCounts. تم إجراء مقارنات ثنائية بين الجينات من PYY-
qPCR
الهجين في الموقع مع التألق المناعي
المختبر)، Rb-مضاد-PGP9.5 (1:500؛ أبكام: ab27053)، Gt-مضاد-سيروتونين (1:500؛ أبكام، ab66047) وCHK-مضاد-GFP (1:500؛ أبكام: ab13970). بعد حضانة الأجسام المضادة الأولية، تم غسل الأنسجة في
تقييم الأنماط الأساسية
قياس تناول الطعام
تحليل مفصل لنمط التغذية والنشاط والوجبات
تم تجميع البيانات في فترات زمنية مدتها دقيقة واحدة للتحليل. تم تصحيح البيانات للتقلبات الطفيفة من خلال السماح فقط بدالة متزايدة بشكل أحادي لكل من تناول الطعام والماء: القيم التي تمثل تناول الطعام السلبي تم استبدالها بأحدث قيمة. تم تعريف حجم الوجبة وتكرارها وتوقيتها بناءً على المعايير داخل نظام PhenoMaster. كانت الفترات بين الوجبات مطلوبة أن تكون
فحص سكر الدم الصائم واختبار تحمل الجلوكوز عن طريق الفم
قياسات الليبوكالين-2 البرازي
اختبار الميالوبيروكسيداز القولوني
قياس هرمونات المصل
اختبار الفلاجيلين في البراز
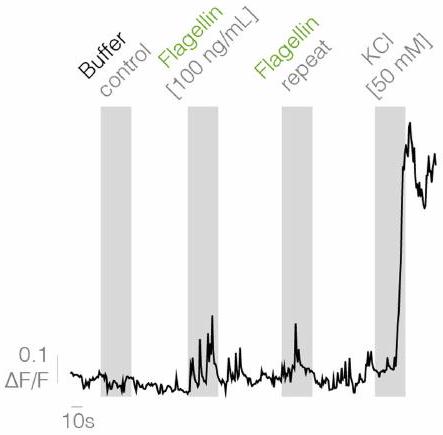
تصوير الكالسيوم للخلايا المفصولة
اختبار إفراز PYY
تم حساب إفراز PYY باستخدام المنحنى القياسي. تم حساب إفراز PYY كالتالي: السائل الفائق / (السائل الفائق + lysate).
تسجيلات العصب المبهم
تصنيع ألياف القولون الضوئية الإلكترونية
(طول إجمالي 8.5 سم) في ثنائي كلوريد الميثيل لمدة 10 دقائق، مما كشف عن الأسلاك الدقيقة المتصلة. تم لحام الوصلات بعد ذلك على دبابيس رأس ذكر تم تجميعها داخل صندوق مطبوع بتقنية الطباعة ثلاثية الأبعاد مخصص.
تصوير الكالسيوم ثنائي الفوتون في الجسم الحي وتحليل النشاط الزمني بواسطة التهجين الموضعي الفلوري
ثم تم أخذ تسجيل نشاط
نظام سلوك تناول الطعام
الحقن داخل البطن مرتين قبل بدء الاختبار. عند بدء الاختبار، تلقت الفئران حقنًا داخل البطن مع
نظام سلوك Crunch Master
الإحصائيات وإمكانية التكرار
باستخدام
ملخص التقرير
توفر البيانات
توفر الشيفرة
ممثل لـ
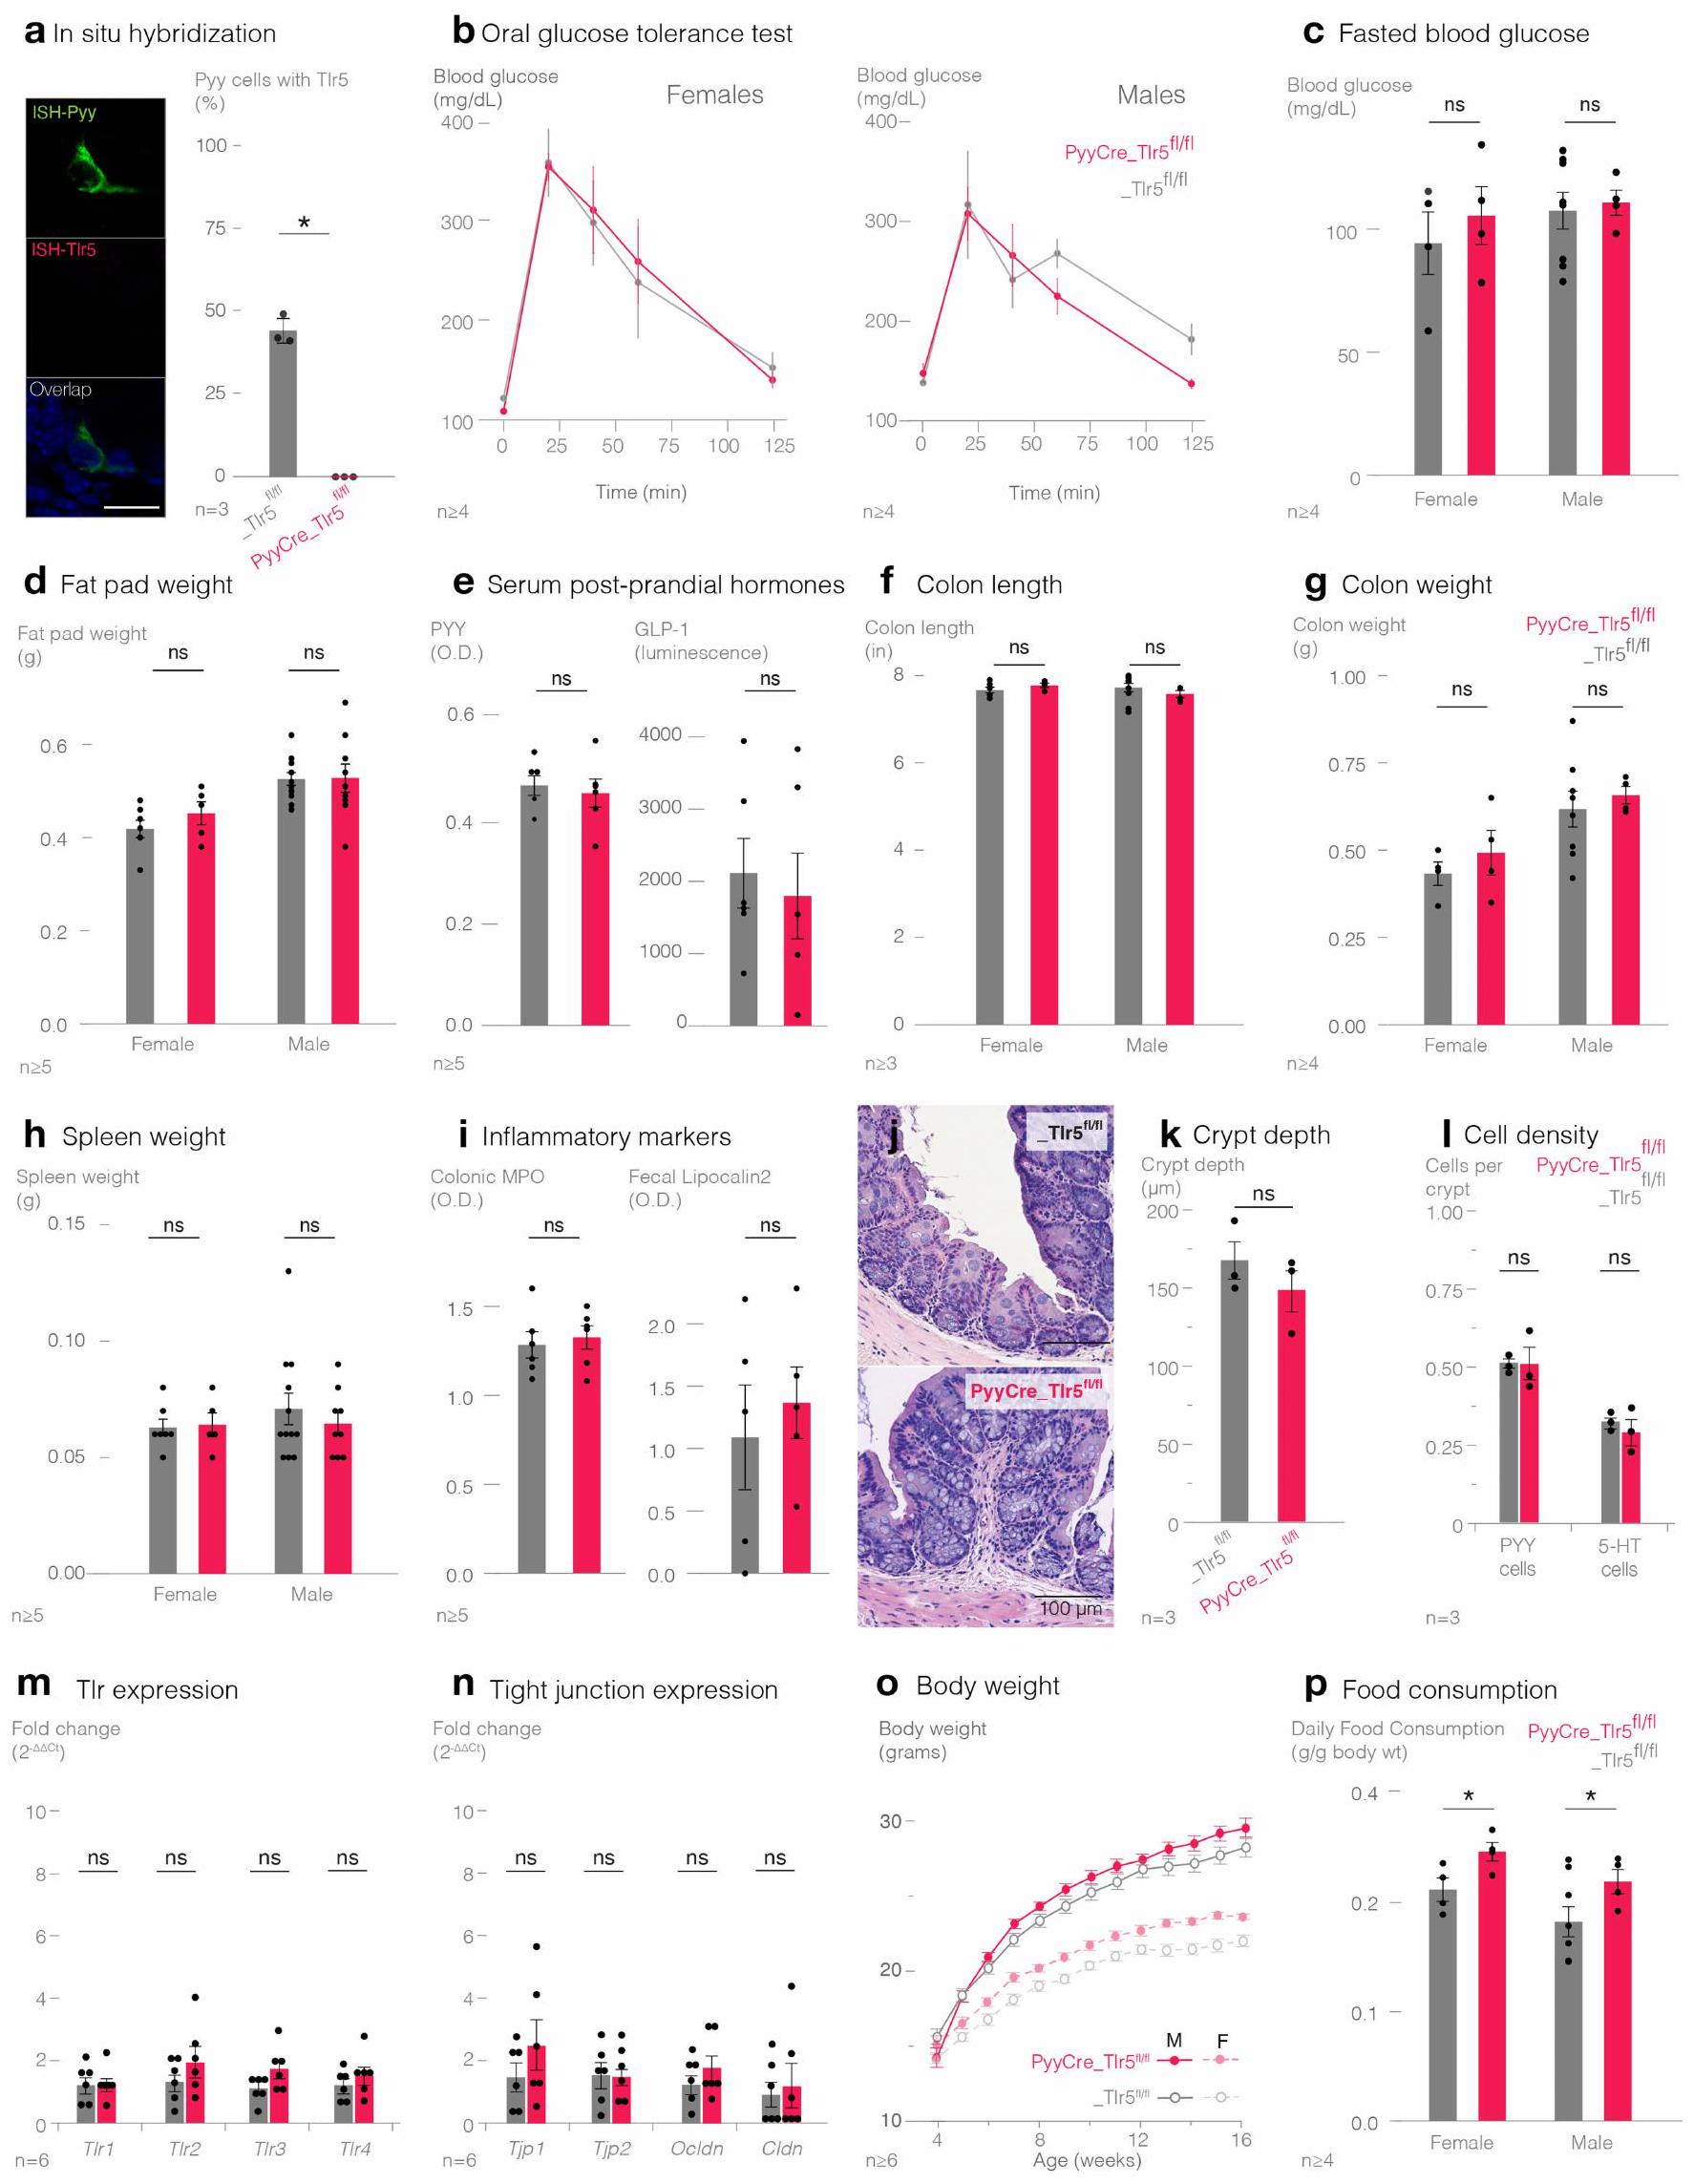
أظهرت أشقاء التحكم عدم وجود تغيير في (ك) عمق الكريبت (ن=3 فئران)، (ل) كثافة خلايا PYY و5-HT (
مقالة
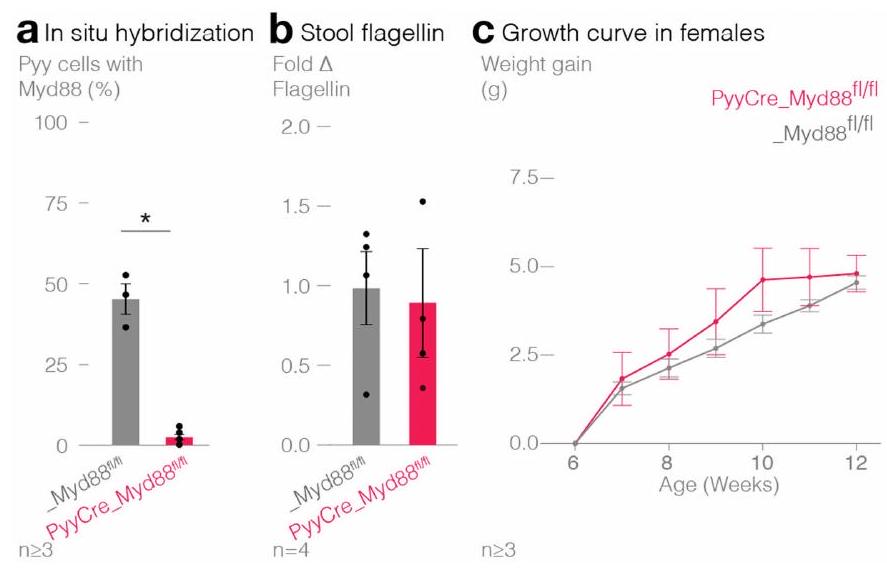
في زيادة الوزن مقارنةً بأقرانهم من نفس القمامة في كل من (ج) الإناث (PyyCre_Myd
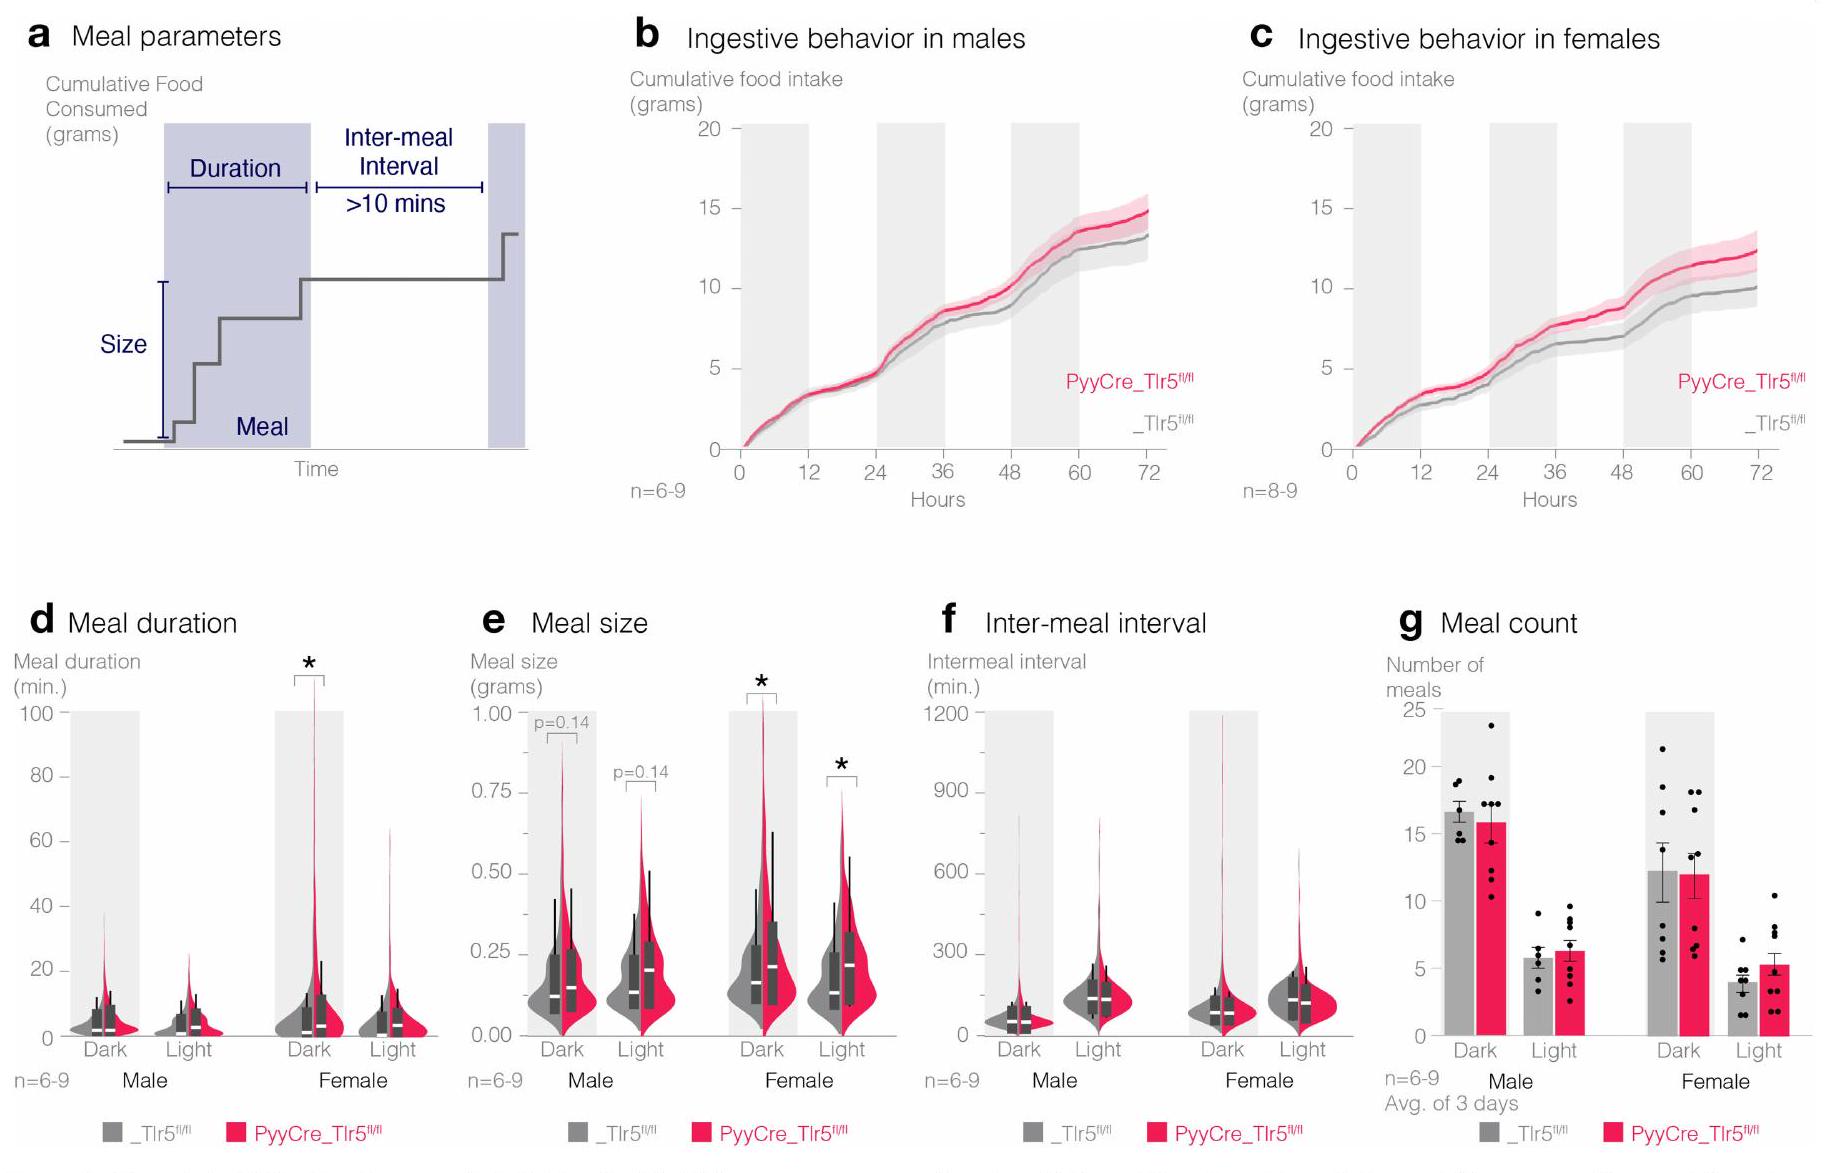
(أ) مخطط تحليل نمط الوجبات يوضح أن الوجبات تُعرف على أنها استهلاك
مقالة
تصوير الكالسيوم في خلايا Neurod1_Salsa6f القولونية
تباين استجابة خلايا Neurod1 لأنماط الميكروبات
الشكل 6 من البيانات الموسعة | يتم تنشيط الخلايا المعوية الصماء بواسطة الفلاجيلين.
(
مقالة
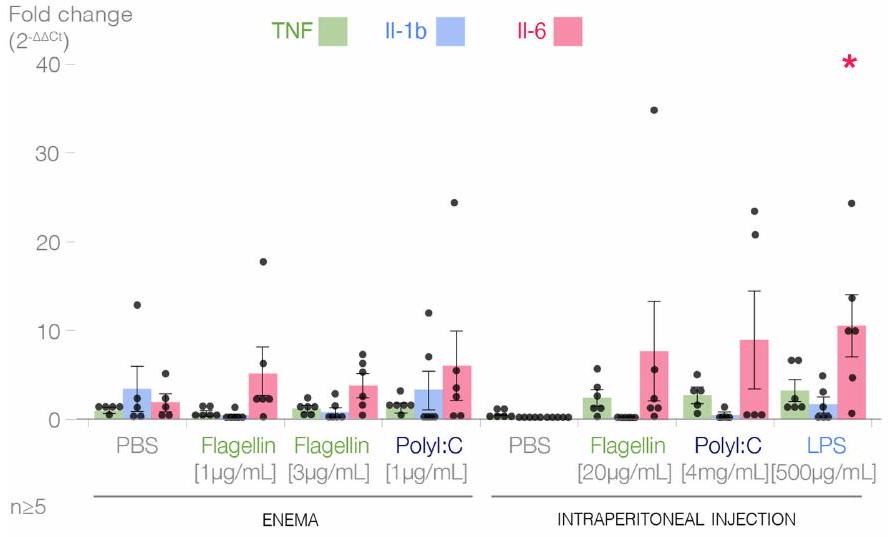
تعبير السيتوكينات في الطحال
الشكل 10 من البيانات الموسعة | حقنة الفلاجيلين ليست كافية لتحفيز استجابة مناعية
محفظة الطبيعة
ملخص التقرير
الإحصائيات
غير متوفر
□
□ حجم العينة بالضبط
□

□
يجب أن تُوصف الاختبارات الشائعة فقط بالاسم؛ واصفًا التقنيات الأكثر تعقيدًا في قسم الطرق.
□ وصف لجميع المتغيرات المرافقة التي تم اختبارها
□ X
وصف لأي افتراضات أو تصحيحات، مثل اختبارات الطبيعية والتعديل للمقارنات المتعددة
□
□ X
لاختبار الفرضية الصفرية، يتم استخدام إحصائية الاختبار (مثل F، t، r) مع فترات الثقة، أحجام التأثير، درجات الحرية و
□ لتحليل بايزي، معلومات حول اختيار القيم الأولية وإعدادات سلسلة ماركوف مونت كارلو
□ لتصميمات هرمية ومعقدة، تحديد المستوى المناسب للاختبارات والتقارير الكاملة عن النتائج
□ تقديرات أحجام التأثير (مثل حجم تأثير كوهين)
البرمجيات والشيفرة
جمع البيانات
إلومينا نكست سيك 500، نظام ستب وان بلس (ثيرمو فيشر)، برنامج فينو ماستر (تي إس إي سيستمز إنك؛ إصدار البرنامج 6.6.9)، تيكان إنفينيت 200 برو الإصدار 2.0، برنامج زيس زين بلو الإصدار 3.5، برياري فيو الإصدار 5.7.
بيانات
معلومات السياسة حول توفر البيانات
- رموز الانضمام، معرفات فريدة، أو روابط ويب لمجموعات البيانات المتاحة للجمهور
- وصف لأي قيود على توفر البيانات
- بالنسبة لمجموعات البيانات السريرية أو بيانات الطرف الثالث، يرجى التأكد من أن البيان يتماشى مع سياستنا.
البحث الذي يتضمن مشاركين بشريين، بياناتهم، أو مواد بيولوجية
| التقارير عن الجنس والنوع الاجتماعي | غير متوفر |
| التقارير عن العرق أو الإثنية أو غيرها من المجموعات الاجتماعية ذات الصلة | غير متوفر |
| خصائص السكان | غير متوفر |
| التوظيف | غير متوفر |
| رقابة الأخلاقيات | غير متوفر |
التقارير المتخصصة في المجال
علوم الحياة □ العلوم السلوكية والاجتماعية □ العلوم البيئية والتطورية والبيئية
لنسخة مرجعية من الوثيقة بجميع الأقسام، انظرnature.com/documents/nr-reporting-summary-flat.pdf
تصميم دراسة العلوم الحياتية
- بالنسبة لتسجيلات العصب المبهم: خلال التجارب، تم استخدام استجابة الإينتراليبيد كتحكم إيجابي. بالنسبة لجميع ظروف التحفيز بالفلاغيلين والليزر، تم استبعاد البيانات إذا لم تُلاحظ استجابة مستقرة للإينتراليبيد طوال جلسة التسجيل.
- للتصوير بالكالسيوم: انتهت كل جلسة تسجيل بـ 50 مللي مولار من كلوريد البوتاسيوم كتحكم في النشاط. تم تعريف الاستجابة لكلوريد البوتاسيوم كنسبة
زيادة فوق المستوى الأساسي. الخلايا التي لم تصل إلى هذا العتبة من KCl لم تُدرج في التحليلات. - للتجارب الشرجية، الفئران التي تناولت أقل من
تم استبعاد الحيوانات التي تناولت الطعام بعد حقنة شرجية من PBS من التجارب بسبب سلوك التغذية غير المعتاد بعد صيام ليلة كاملة.
-لتحليل نمط الوجبات، الوجبات الفردية التي تجاوزت معدل. أو 1 ج إجمالي الحجم تم استبعادها لكونها فوق الفسيولوجية.
التكرار
- لأغراض تجارب المجهر الكمي، تم تنفيذ كل تقنية وسم في الموقع وقياسها في عينات الأنسجة من ثلاثة فئران فردية على الأقل من كلا الجنسين. كانت جميع محاولات التكرار ناجحة.
- في تجارب الكفة العصب vagal، تم اختبار استجابة التحكم الإيجابي intralipid وتكرارها بين العلاجات في ثلاثة فئران على الأقل لكل علاج لضمان تكرار النتائج داخل الموضوع. إذا تغيرت الاستجابة بشكل كبير، فإن معيار الإدراج لم يتم الوفاء به وبالتالي تم إنهاء التجربة.
- بالنسبة لتصوير الكالسيوم، لم يتم تكرار الاستجابة للمؤثرات داخل نفس الخلية بسبب قيود بقاء الخلايا حية مع التطبيقات المتكررة. لضمان القابلية للتكرار، تم إجراء التجارب عبر عدة جلسات.
- في تجارب الحقن الشرجية، تم تكرار كل حالة تجريبية في 5 فئران على الأقل. تم إجراء التجارب على فئران من سلالات وأعمار وأجناس مختلفة لضمان القابلية للتكرار.
-لتحليل نمط الوجبات، تم إجراء تجربتين مستقلتين لضمان القابلية للتكرار.
التوزيع العشوائي
- في جميع التجارب، تم تخصيص الحيوانات للمجموعة التجريبية بشكل عشوائي.
- تم موازنة جميع الدراسات السلوكية عبر العمر والجنس للتحكم في المتغيرات بما في ذلك الموقع في القفص، وتأثير الترتيب، واليد المهيمنة.
- في تجارب الحقن الشرجية، تلقت جميع الفئران المشمولة تحفيزًا باستخدام PBS، وتحفيزًا باستخدام الفلاجيلين، وفي تجارب علم الأدوية، تلقت الفئران كل من تحفيز PBS وتحفيز الفلاجيلين بالاشتراك مع العلاج الدوائي. تم عشوائية ترتيب تسليم التحفيز بين الفئران المختلفة. هذا يستثني الفئران الخالية من الجراثيم، حيث تم تسليم PBS أولاً لتقليل الاستعمار البكتيري. تم فصل كل تسليم للتحفيز بفترة لا تقل عن 48 ساعة عن التسليم السابق للتحفيز.
عمى
أبريل 2023
التقارير عن مواد وأنظمة وطرق محددة
| غير متوفر | مشارك في الدراسة |
| □ | أجسام مضادة X |
| □ | – خطوط خلايا حقيقية النواة |
 |
□ علم الحفريات وعلم الآثار |
| □ | X الحيوانات وغيرها من الكائنات |
|
□ البيانات السريرية |
| إكس | □ |
| إكس | □ |
الأجسام المضادة
|
|
مشارك في الدراسة |
|
|
|
|
|
|
|
|
|
التحقق
- التألق المناعي النسيجي: Rb-Anti-PYY (1:250؛ تم إنتاجه في مختبر رودجر ليدل – تم إنتاج جسم مضاد PYY في الأرانب باستخدام ببتيد اصطناعي، KPEAPGEDASPEELSRYC، الذي يتوافق مع الأحماض الأمينية
من PYY الفأر، منقى بال affinity)، جسم مضاد Anti-GFP (المضيف = دجاج) (1:500، Abcam؛ Cat#ab13970)؛ جسم مضاد Anti-Pgp9.5 (المضيف = أرنب) (1:500؛ Abcam؛ CAT#ab27053)، جسم مضاد Anti-serotonin (المضيف = ماعز) (1:500؛ Abcam؛ CAT#ab66047)؛ Alexa Fluor 488 AffiniPure F(ab́) Fragment Donkey Anti-Rabbit IgG (H+L) (1:250، Jackson ImmunoResearch؛ Cat#711-546-152؛ RRID#AB_2340619)؛ Cy3 AffiniPure F(ab́) Fragment Donkey Anti-Rabbit IgG (H+L) (1:250، Jackson ImmunoResearch؛ Cat#711-166-152؛ RRID#AB_2313568)؛ Alexa Fluor 488 AffiniPure F(ab’) Fragment Donkey Anti-Chicken IgG (H+L) (1:250، Jackson ImmunoResearch؛ Cat#703-546-155؛ RRID#AB_2340376)؛ Dk-Anti-Gt-647 (1:500، Jackson Immunoresearch 705-606-147) - الهجين في الموقع: تم شراء مجسات Mm-Tlr5 (رقم الكات#759 468888)، Mm-Pyy-C3 (420681-C3)، وMm-Npy2r (رقم الكات# 515431) من
.
خطوط خلايا حقيقية النواة
معلومات السياسة حول خطوط الخلايا والجنس والنوع في البحث
المصادقة
الخطوط التي يتم التعرف عليها بشكل خاطئ بشكل شائع
(انظر سجل ICLAC)
خلايا HEK-293 هي خط خلايا غالبًا ما يتم التعرف عليها بشكل خاطئ. تم استخدام هذه الخلايا كخط خلايا مُبلغ عنه بعد إدخال جين TLR5 الفأري وجين تقرير SEAP (الفوسفاتاز القلوي الجنيني المفرز) القابل للتحفيز لقياس مستويات الفلاجيلين في عينات براز الفئران. تم التحقق من صحة الخلايا من قبل المورد (إنفيوجن).
الحيوانات وغيرها من الكائنات البحثية
تم استخدام ذكور وإناث الفئران البالغة التي تتراوح أعمارها بين 6-20 أسبوعًا في جميع التجارب. كانت الفئران تعيش في مجموعات في قسم موارد الحيوانات المخبرية بجامعة ديوك، حيث تم الاحتفاظ بها في دورة ضوء وظلام مدتها 12 ساعة (0700-1900) مع الوصول إلى الماء وطعام الفئران القياسي (Purina 5001) بحرية، ما لم يُذكر خلاف ذلك في طرق المخطوطة. حافظت المنشأة على درجة حرارة محيطة من
(الخلفية = C57BL/6J) (مختبر جاكسون؛ الرقم المرجعي #031968)؛ Tlr5-KO (الخلفية = C57BL/6J) (مختبر جاكسون؛ الرقم المرجعي #028599)؛ Myd88-KO (الخلفية = C57BL/6J) (مختبر جاكسون؛ الرقم المرجعي #00888)؛ B6.Cg-Snap25tm3.1Hze/J (مختبر جاكسون؛ الرقم المرجعي #025111)؛ B6.129(Cg)Fostm2.1(cre/ERT2)Luo/J (مختبر جاكسون؛ الرقم المرجعي #030323).
لم يتم استخدام حيوانات برية في هذه الدراسة.
تم تفصيل النتائج والاختلافات المتعلقة بالجنس في المخطوطة مع الإشارة إلى أحجام العينات.
لم يتم استخدام أي عينات تم جمعها من الميدان في هذه الدراسة.
تم إجراء جميع التجارب على الفئران بعد الحصول على موافقة لجنة رعاية واستخدام الحيوانات المؤسسية في مركز ديوك الطبي وفقًا للبروتوكول A212-21-10. اتبعت جميع المختبرات المتعاونة إرشادات هذا البروتوكول الحيواني.
نباتات
غير متوفر
غير متوفر
غير متوفر
مختبر علم الأعصاب المعوي الدماغي، جامعة ديوك، دورهام، نورث كارولينا، الولايات المتحدة الأمريكية. قسم علم الأعصاب، جامعة ديوك، دورهام، نورث كارولينا، الولايات المتحدة الأمريكية. قسم الطب، جامعة ديوك، دورهام، نورث كارولينا، الولايات المتحدة الأمريكية. كلية الثالوث للفنون والعلوم، جامعة ديوك، دورهام، نورث كارولينا، الولايات المتحدة الأمريكية. مختبر المناعة الأيضية، قسم البحث، مستشفى المكسيك العام الدكتور إدواردو ليسياغا، مدينة مكسيكو، المكسيك. مختبر أبحاث الإلكترونيات، معهد ماساتشوستس للتكنولوجيا، كامبريدج، ماساتشوستس، الولايات المتحدة الأمريكية. معهد مكغفرن لأبحاث الدماغ، معهد ماساتشوستس للتكنولوجيا، كامبريدج، ماساتشوستس، الولايات المتحدة الأمريكية. قسم علوم المواد والهندسة، معهد ماساتشوستس للتكنولوجيا، كامبريدج، ماساتشوستس، الولايات المتحدة الأمريكية. قسم علوم الدماغ والمعرفة، معهد ماساتشوستس للتكنولوجيا، كامبريدج، ماساتشوستس، الولايات المتحدة الأمريكية. مركز مونييل للحواس الكيميائية، فيلادلفيا، بنسلفانيا، الولايات المتحدة الأمريكية. قسم علوم الأعصاب، كلية بيرلمان للطب، جامعة بنسلفانيا، فيلادلفيا، بنسلفانيا، الولايات المتحدة الأمريكية. علم الأعصاب المختبري للشهية، قسم علم الأدوية، CINVESTAV، مدينة مكسيكو، المكسيك. مركز أبحاث الشيخوخة (CIE)، سينفستاف سيدي سور، مدينة مكسيكو، المكسيك. قسم علم المناعة التكاملي، جامعة ديوك، دورهام، نورث كارولينا، الولايات المتحدة الأمريكية. قسم الوراثة الجزيئية والميكروبيولوجيا، جامعة ديوك، دورهام، نورث كارولينا، الولايات المتحدة الأمريكية. قسم علم الأمراض، جامعة ديوك، دورهام، نورث كارولينا، الولايات المتحدة الأمريكية. قسم بيولوجيا الخلايا، جامعة ديوك، دورهام، نورث كارولينا، الولايات المتحدة الأمريكية. قسم الفسيولوجيا، جامعة أريزونا، توكسون، أريزونا، الولايات المتحدة الأمريكية. معهد ديوك لعلوم الدماغ، جامعة ديوك، دورهام، نورث كارولينا، الولايات المتحدة الأمريكية. العنوان الحالي: قسم الأمراض الجلدية، كلية الطب بجامعة ستانفورد، ريدوود سيتي، كاليفورنيا، الولايات المتحدة الأمريكية. ساهم هؤلاء المؤلفون بالتساوي: وينستون و. ليو، نعمة ريشر، إميلي أولوي. هذان المؤلفان أشرفا معًا على هذا العمل: م. مايا كيلبرير، دييغو ف. بوهوركيز.
البريد الإلكتروني: mkaelberer@arizona.edu; دييغو.بوهوركويز@ديوك.إدو - وانغ، ي. وآخرون. الأحماض الأمينية تحفز إفراز الكوليسيستوكينين من خلال
-مستقبل الاستشعار. المجلة الأمريكية لعلم وظائف الأعضاء. الجهاز الهضمي. وظائف الكبد 300، G528-G537 (2011). 62. شونهوف، س. وآخرون. توازن الطاقة والتمايز الغدد الصماء المعوية لا يتطلبان هرمون الشهية الببتيد YY. علم الأحياء الجزيئي والخلايا 25، 4189-4199 (2005).
- وانغ، ي. وآخرون. الأحماض الأمينية تحفز إفراز الكوليسيستوكينين من خلال
- الشكر والتقدير نشكر J. Kotula و M. Toh على المساعدة في التسلسل؛ R.A. Liddle و S. G. Lisberger و M.D. Gunn و J.A. Alspaugh و N.K. Surana و G. J. Schwartz و Z. Lorsch و M. Toc Sagra و E.B. Bohórquez على المساهمات التحريرية. نعترف بمصادر التمويل التالية: المعاهد الوطنية للصحة (NIH) F3O DK122712 (W.W.L.); NIH F32 DK139628 (N.R.); NIH F3O DK136229 (E.A.); NIH F32 DK127757 و NIH KO1 DK138286 (L.E.R.); NIH F3O DK127650 (P.W.); J.A.A.G. هو طالب دكتوراه من برنامج الدكتوراه في العلوم الطبية الحيوية في الجامعة الوطنية المستقلة في المكسيك وقد حصل على منحة CONAHCyT رقم CVU959984؛ CONAHCyT CF-2023-G-518 (R.G.); NIH KO1 DK131403 (M.M.K.); و NIH DP2 MH122402، NIH R21 AT010818، NIH RO3 DK114500، NIH RO1 DK131112 و NIH RO1 DK132070 (D.V.B.).مساهمات المؤلفين: قام W.W.L. وN.R. وE.A. وL.E.R. وP.W. وC.S. وM.E.K. وJ.A.V. وC.P.-H. وY.G.K.A. وA.Carbajal وJ.A.A.G. وA. Coss بإجراء التجارب وجمع البيانات؛ قام A.S. وP.A. بإنشاء موارد ضوئية داخل اللمعة وميكرو LED ضوئي؛ قام E.G.-L. وR.G. بتطوير اختبار Crunch Master، وإجراء التجارب، وجمع وتحليل البيانات؛ قام A.d.A وA.B. وG.d.L. بإجراء تصوير الكالسيوم داخل الجسم وcatFISH، وجمع وتحليل البيانات؛ قام W.W.L. وN.R. وE.A. وL.E.R. وP.W. وJ.F.R. وE.A.M. وM.M.K. وD.V.B. بتحليل وتفسير البيانات. قام W.W.L. وN.R. وE.A. وM.M.K. وD.V.B. بتصميم وكتابة المخطوطة بمشاركة جميع المؤلفين. قام M.M.K. وD.V.B. بتطوير الفكرة والإشراف على المشروع. حصل D.V.B. على تمويل للمشروع.المصالح المتنافسة: D.V.B. وM.M.K. هما مؤسسان ومديران في مجلس إدارة مؤسسة غاسترونوتس، وهي شركة غير ربحية 501(c)3. تم تقديم بعض النتائج من قبل D.V.B. كطلب براءة اختراع مؤقت. جميع المؤلفين الآخرين يعلنون عدم وجود مصالح متنافسة.
الشكر والتقدير نشكر J. Kotula و M. Toh على المساعدة في التسلسل؛ R.A. Liddle، S. G. Lisberger، M.D. Gunn، J.A. Alspaugh، N.K. Surana، G. J. Schwartz، Z. Lorsch، M. Toc Sagra程的 DK136229 (E.A.); NIH F32 DK127757 و NIH KO1 DK138286 (L.E.R.); NIH F3ODK127650 (P.W.);
J.A.A.G. هو طالب دكتوراه من برنامج الدكتوراه في العلوم الطبية الحيوية في الجامعة الوطنية المستقلة في المكسيك وقد حصل على منحة CONACYT رقم.
CVU959984؛ CONAHCyT CF-2023-G-518 (R.G.)؛ NIH KO1 DK1314O3 (M.M.K.)؛ و NIH DP2 CVU9592402، NIH R21 AT010818، NIH RO3 DK114500، NIH RO1 DK131112 و NIH RO1 DK132O70 (D.V.B.).\section*{معلومات إضافية}
معلومات إضافية النسخة الإلكترونية تحتوي على مواد إضافية متاحة فيhttps://doi.org/10.1038/s41586-025-09301-7.
يجب توجيه المراسلات والطلبات للحصول على المواد إلى م. مايا كيلبرر أو دييغو ف. بوهوركيس.
تُعرب مجلة Nature عن شكرها لجون لوكنز والمراجعين الآخرين المجهولين على مساهمتهم في مراجعة هذا العمل.
معلومات إعادة الطباعة والتصاريح متاحة علىhttp://www.nature.com/reprints. - لم يكن الباحثون معصوبين العينين بالنسبة لحالة العلاج أو النمط الجيني لضمان تنفيذ الإجراءات بشكل صحيح. تلقى كل نمط جيني أنظمة علاجية متطابقة.
DOI: https://doi.org/10.1038/s41586-025-09301-7
PMID: https://pubmed.ncbi.nlm.nih.gov/40702192
Publication Date: 2025-07-23
A gut sense for a microbial pattern regulates feeding
Received: 8 March 2023
Accepted: 16 June 2025
Published online: 23 July 2025
Open access
Check for updates
Abstract
To coexist with its resident microorganisms, the host must have a sense to adjust its behaviour in response to them. In the intestine, a sense for nutrients transduced to the brain through neuroepithelial circuits guides appetitive choices
collectively known as microbe-associated molecular patterns. Flagellin is a structural component of one of the three most ancient organelles, flagella
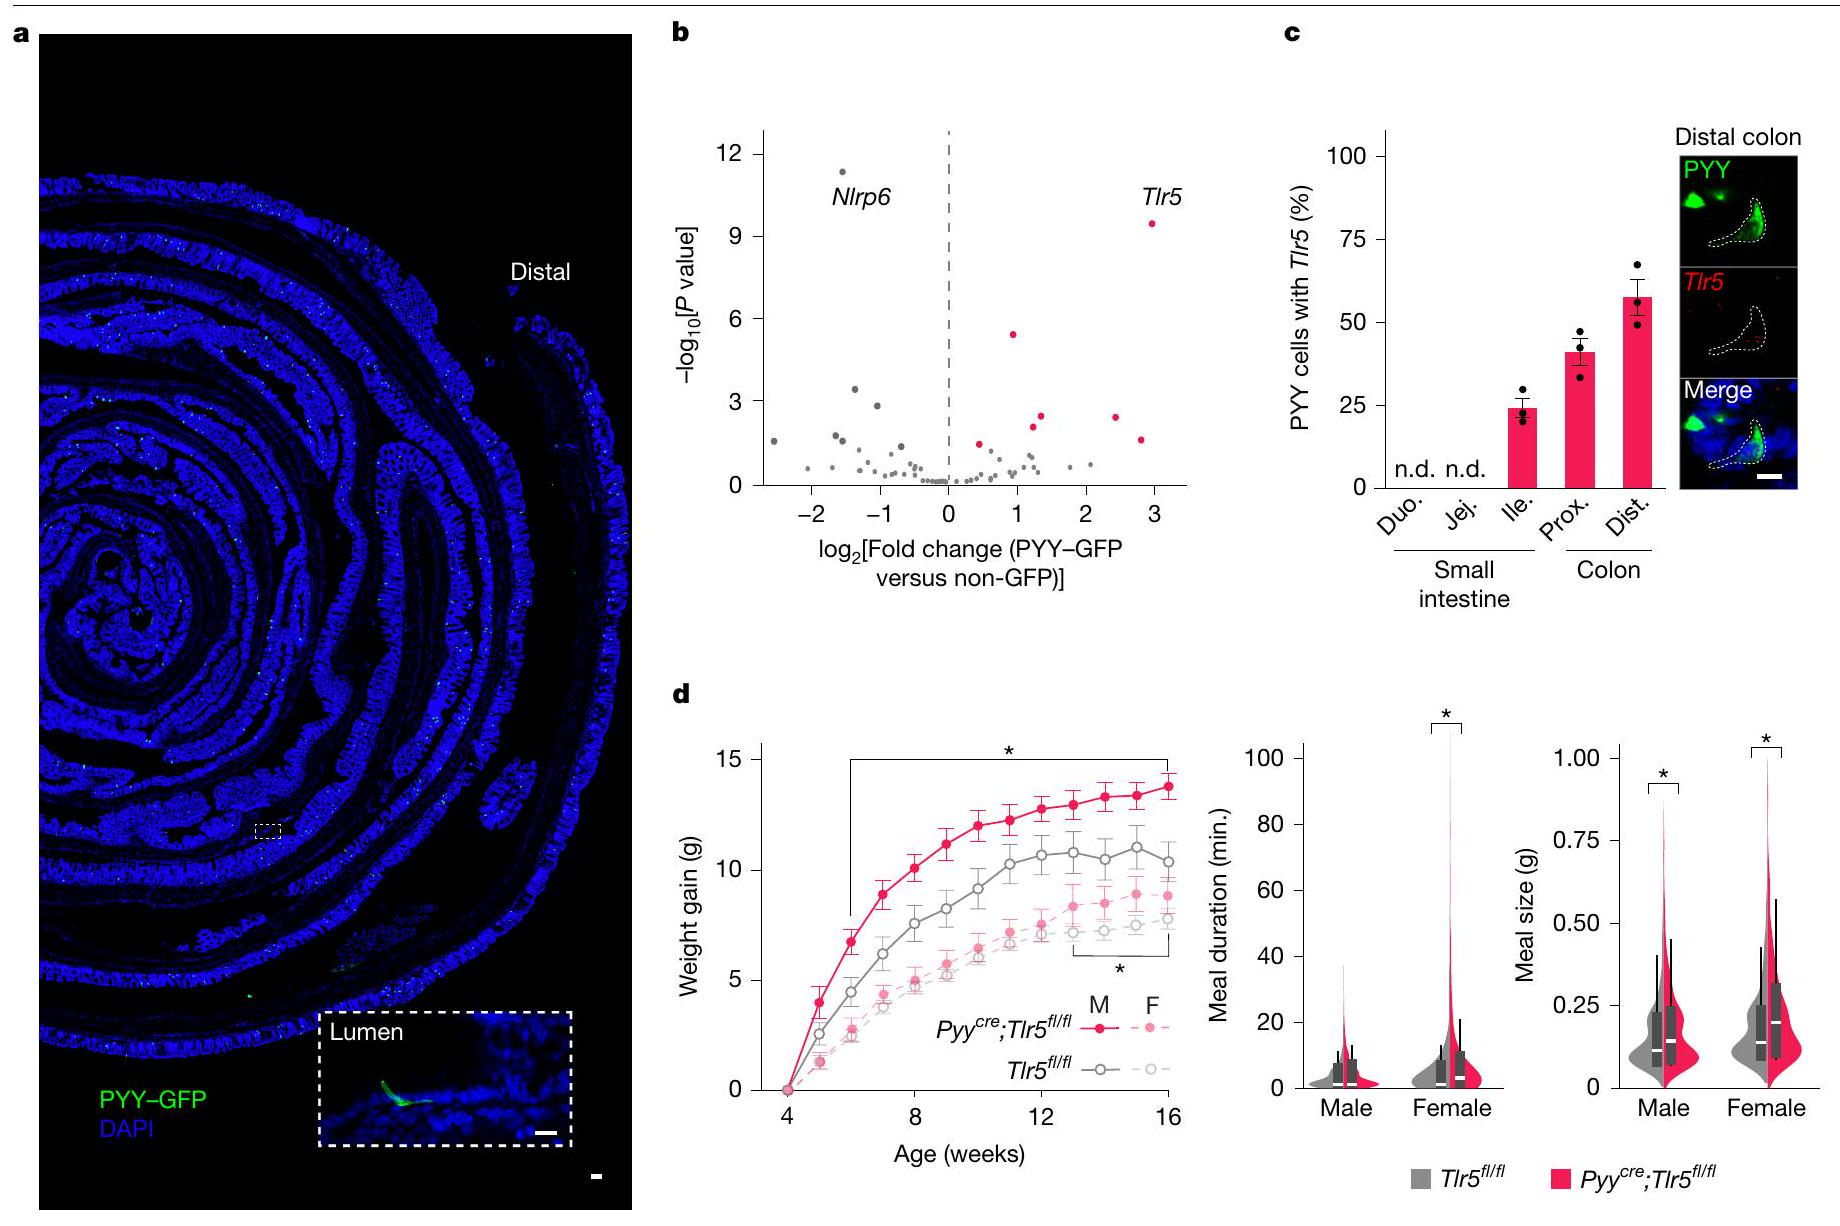
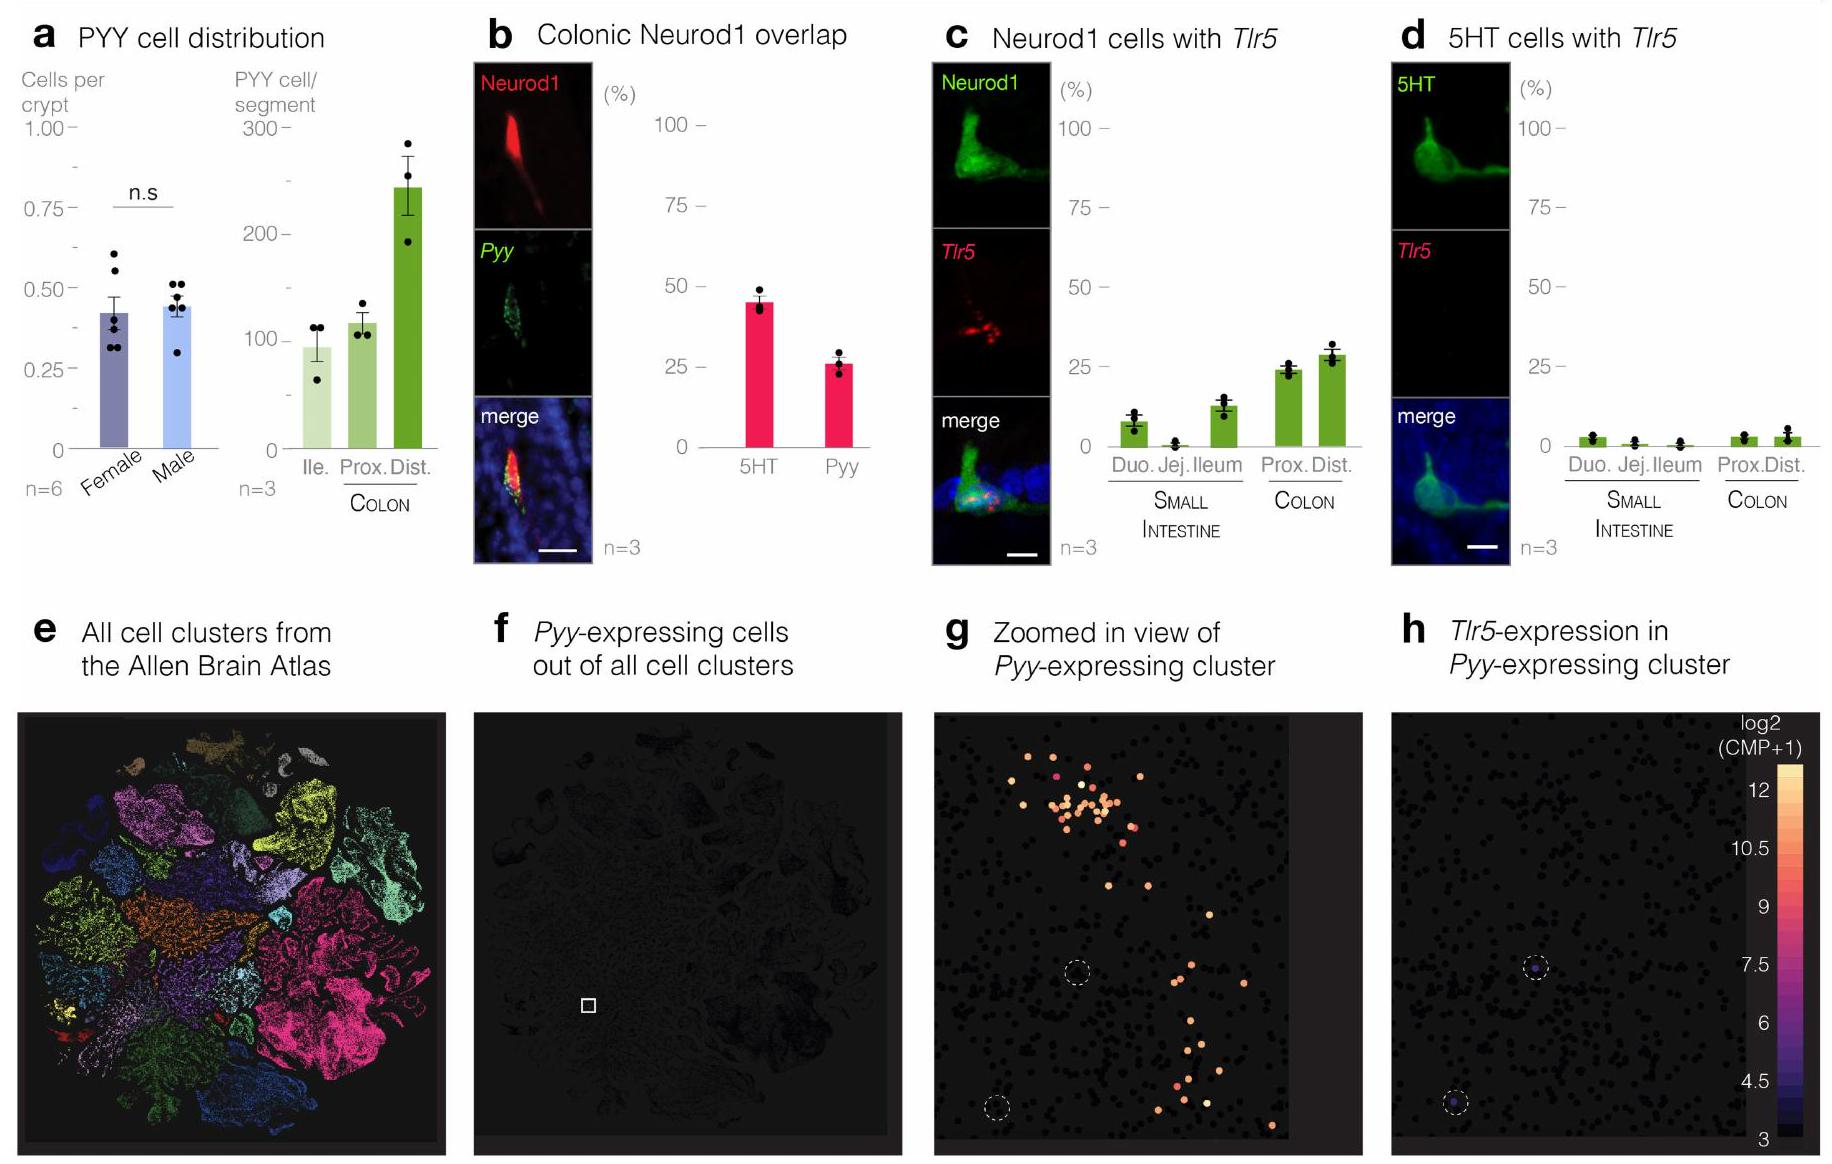
PYY cells express Tlr5
in PYY-labelled cells causes increased weight gain in male and female mice (males (M) Pyy
express several neuromodulators including cholecystokinin (CCK), glucagon-like peptide 1 (GLP-1) and PYY
The robust expression of Tlr5 in PYY-labelled cells was corroborated using in situ hybridization. Overall, co-localization significantly increased from
TLR5 in PYY cells regulates feeding
Furthermore, we performed meal pattern analysis to determine the quantity, frequency, and timing of food ingestion. We optimized an automated home-cage behavioural system that records food intake to the nearest 0.01 g with temporal resolution of 1 s (Extended Data Fig. 5a). Both male and female
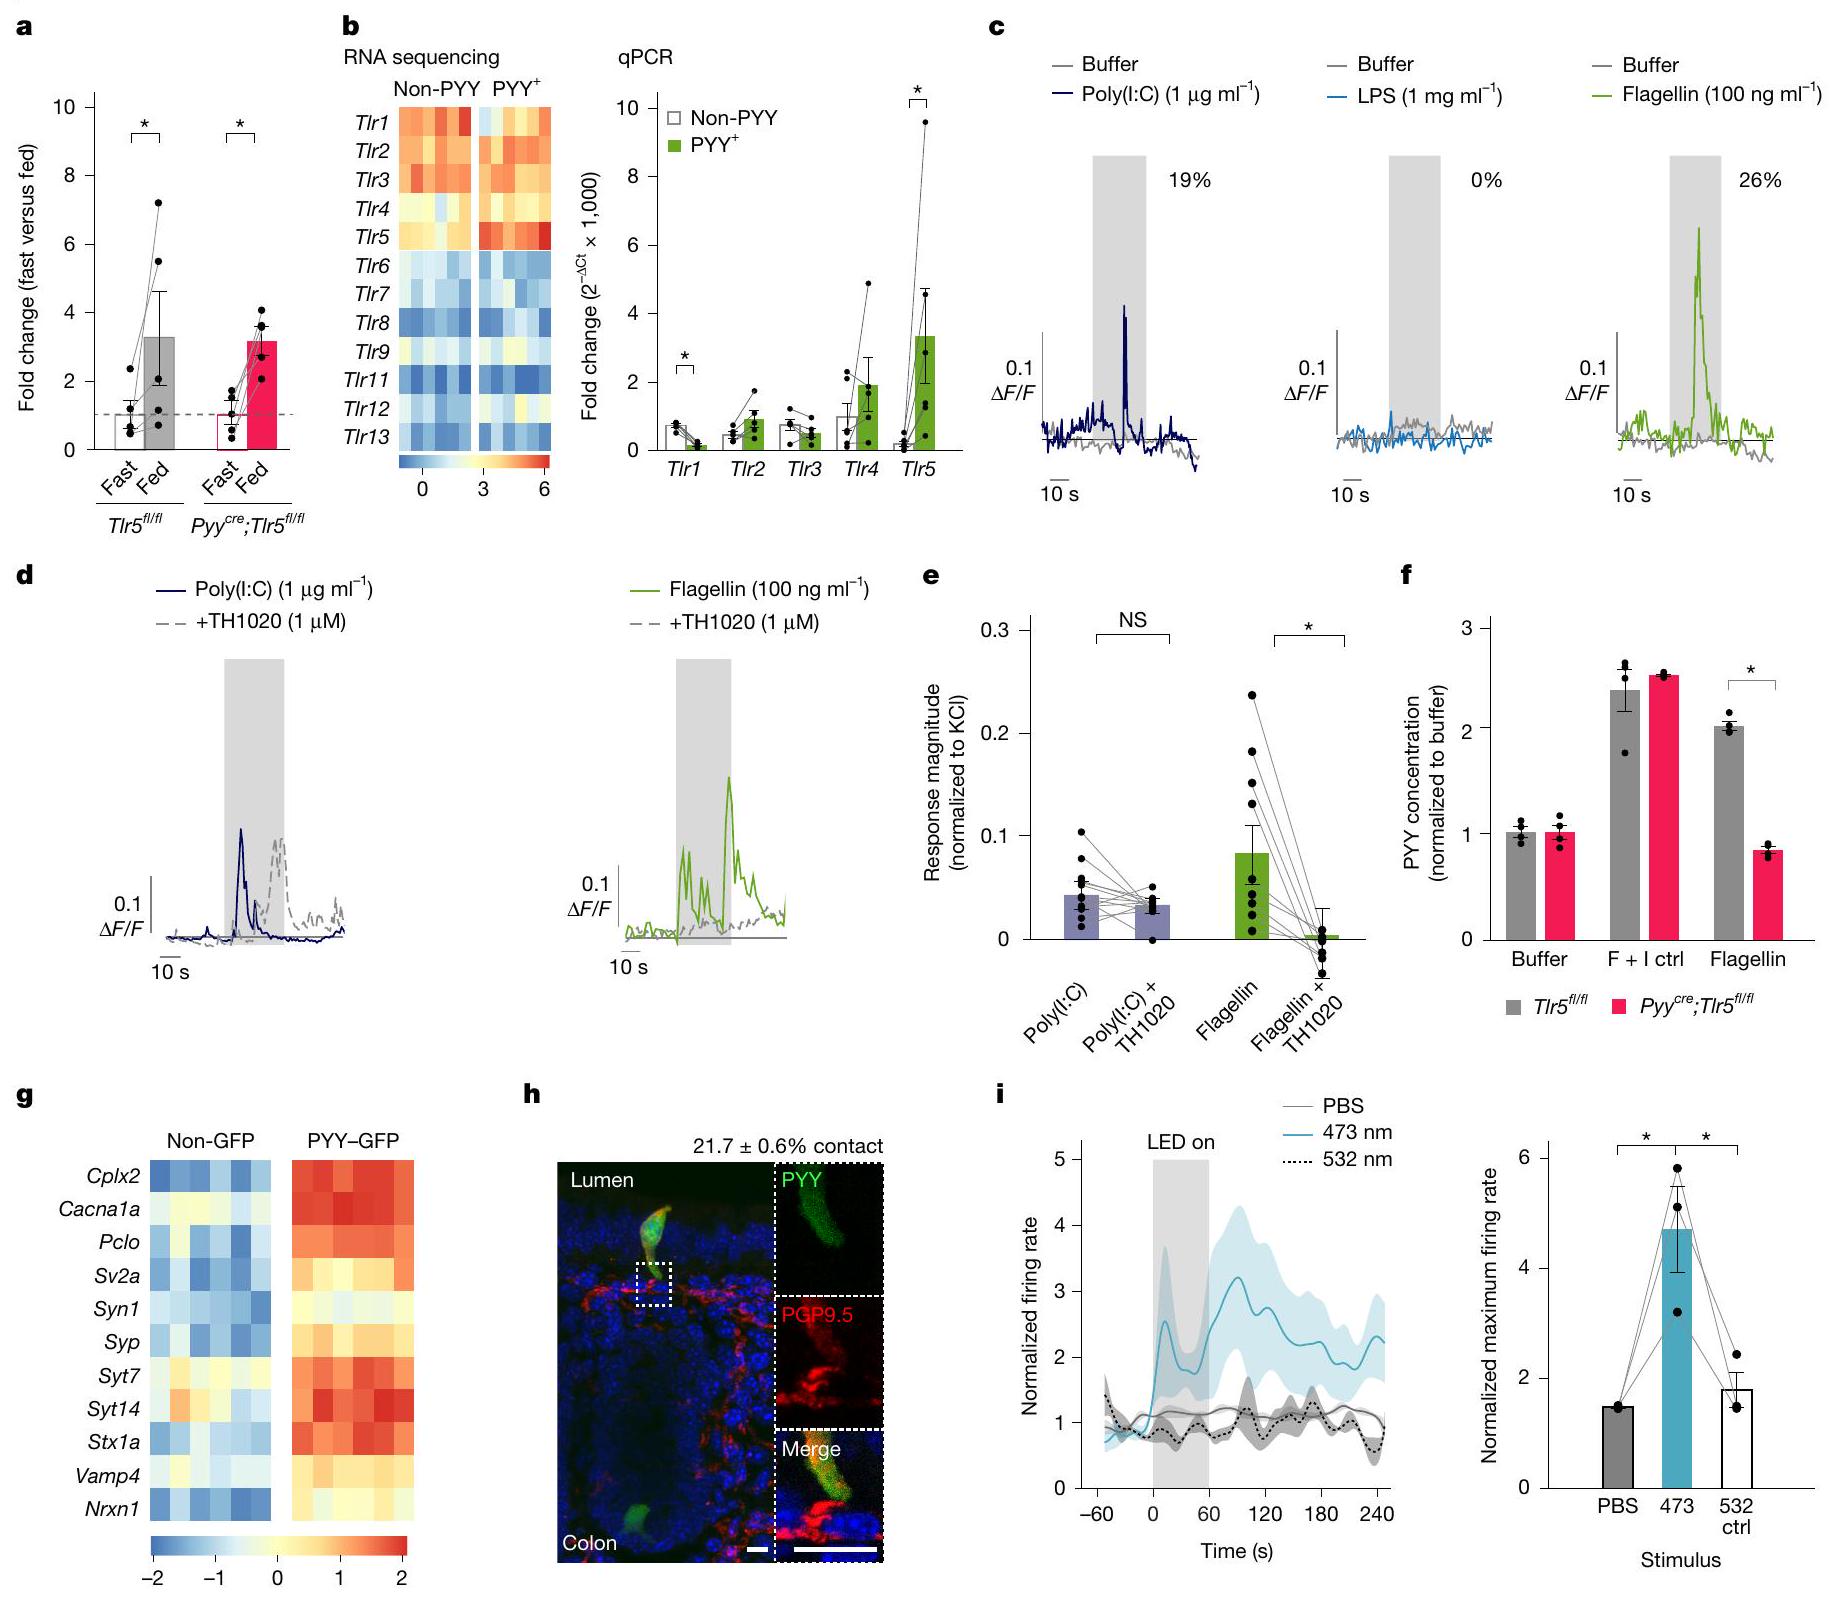
PYY cells use TLR5 to sense flagellin
Of all
We then determined whether the activation of PYY-labelled cells by TLR ligands leads to the release of PYY. Although poly(I:C)
PYY cells connect with vagal neurons
Compared to neighbouring epithelial cells, PYY-labelled cells are significantly enriched in genes encoding proteins involved in synaptic signalling, synaptic formation and neurotransmission (
two-tailed
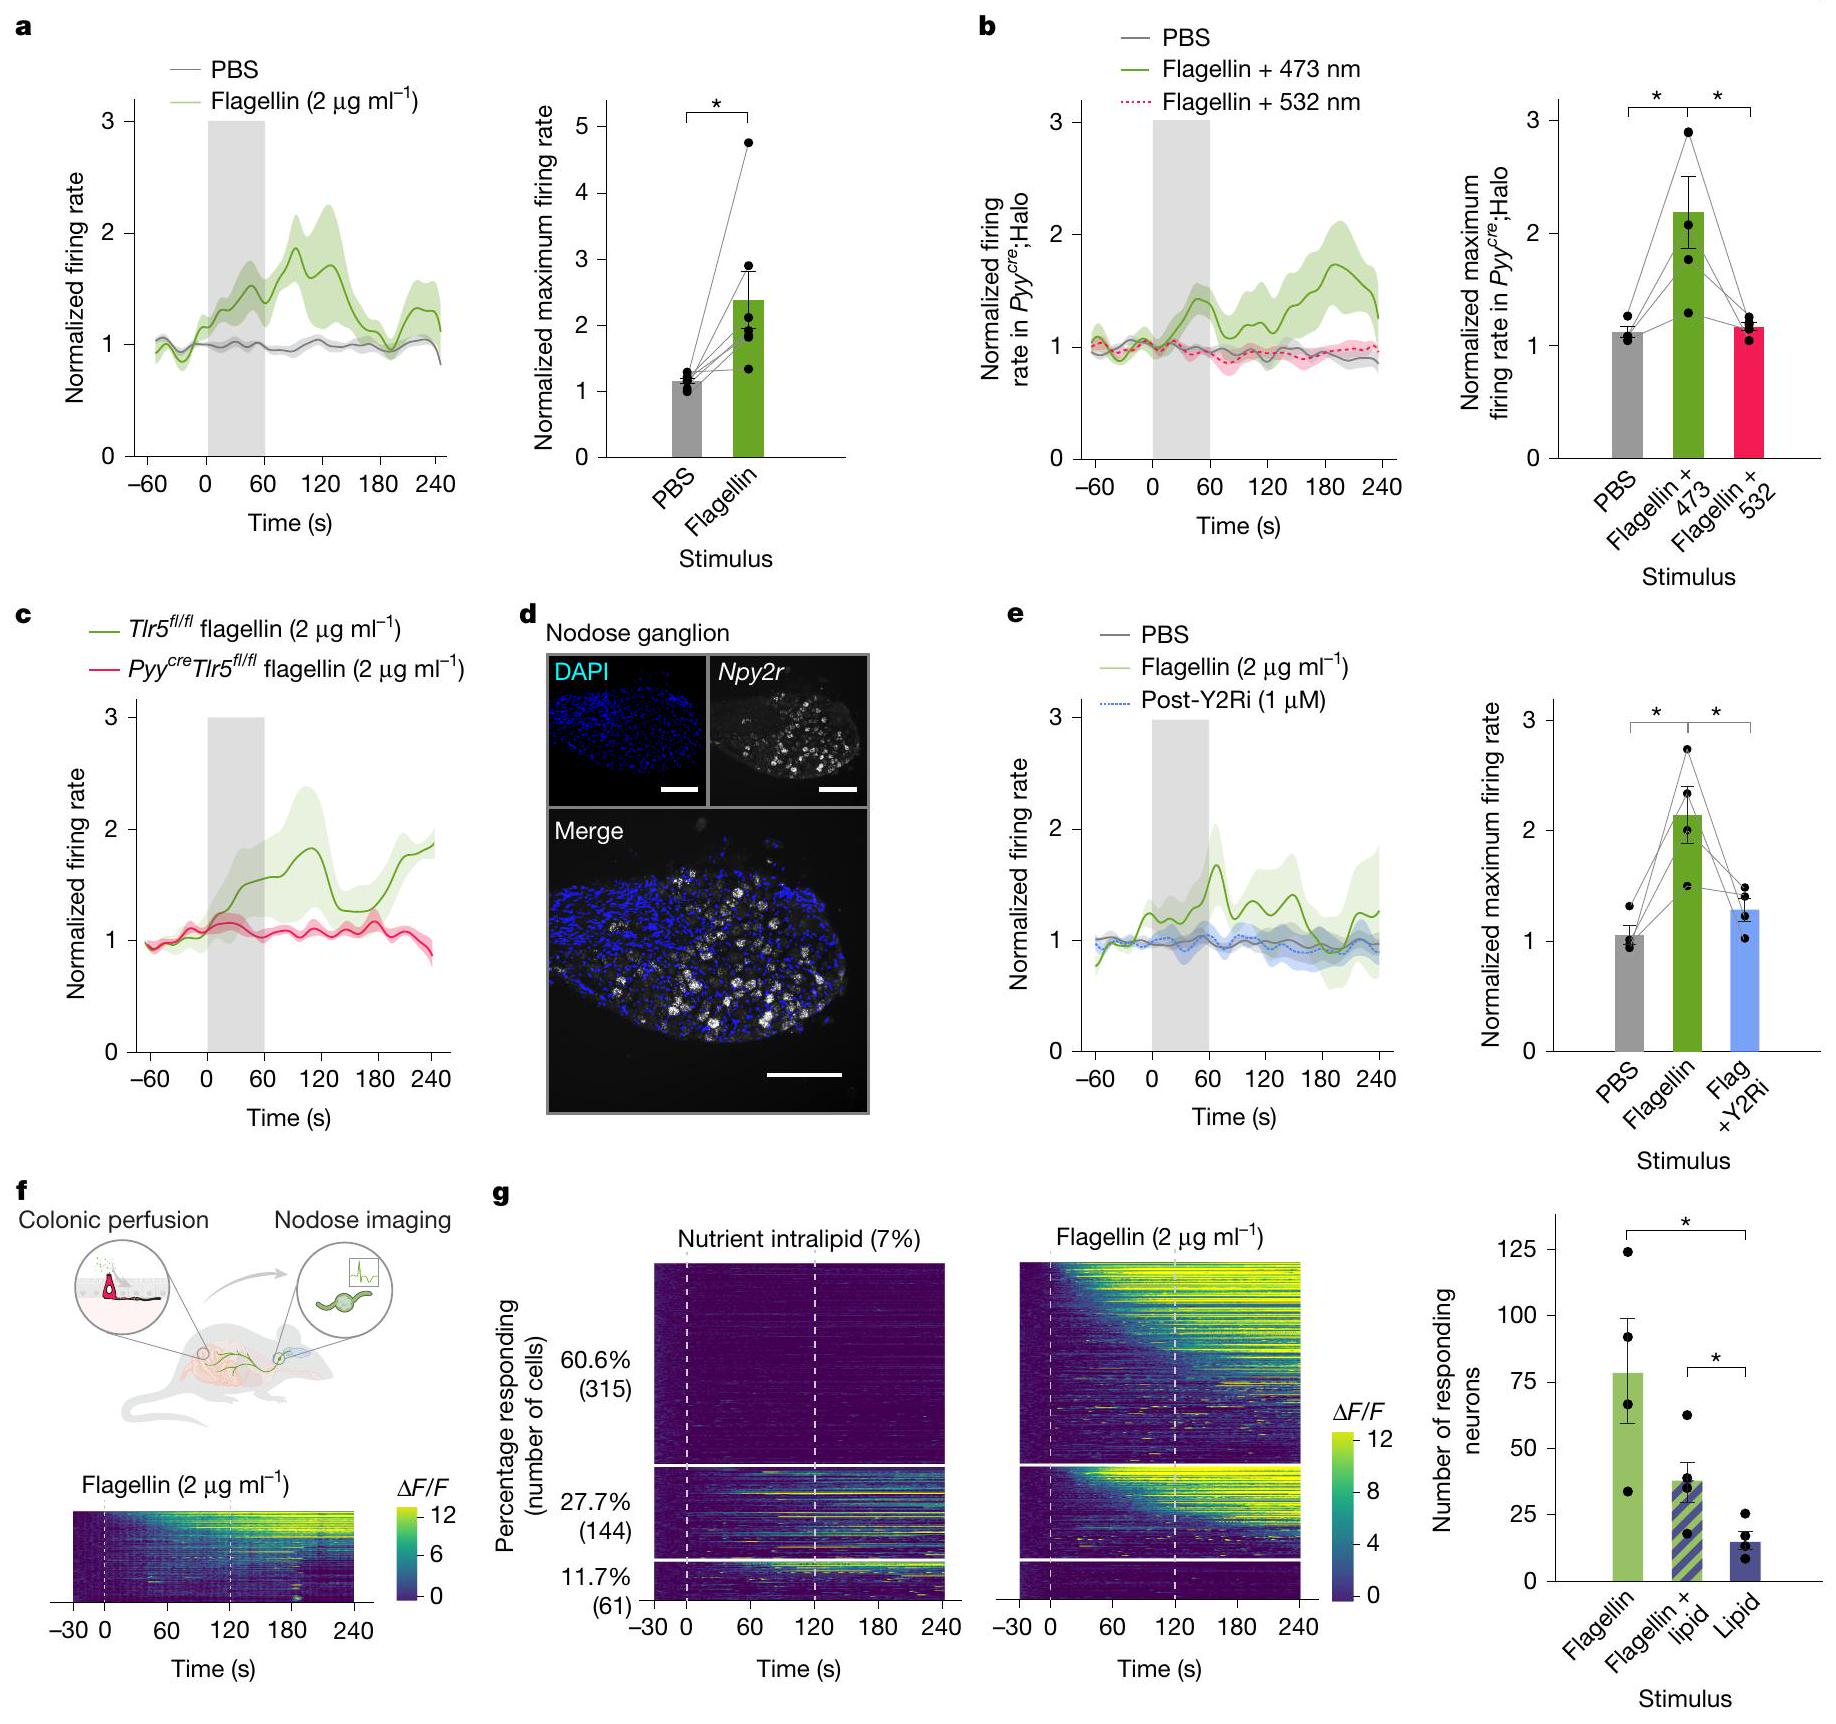
Flagellin is transduced to vagal neurons
seconds (
lumen of the colon did not alter vagal activity in response to flagellin (
compared to the case in littermate controls (
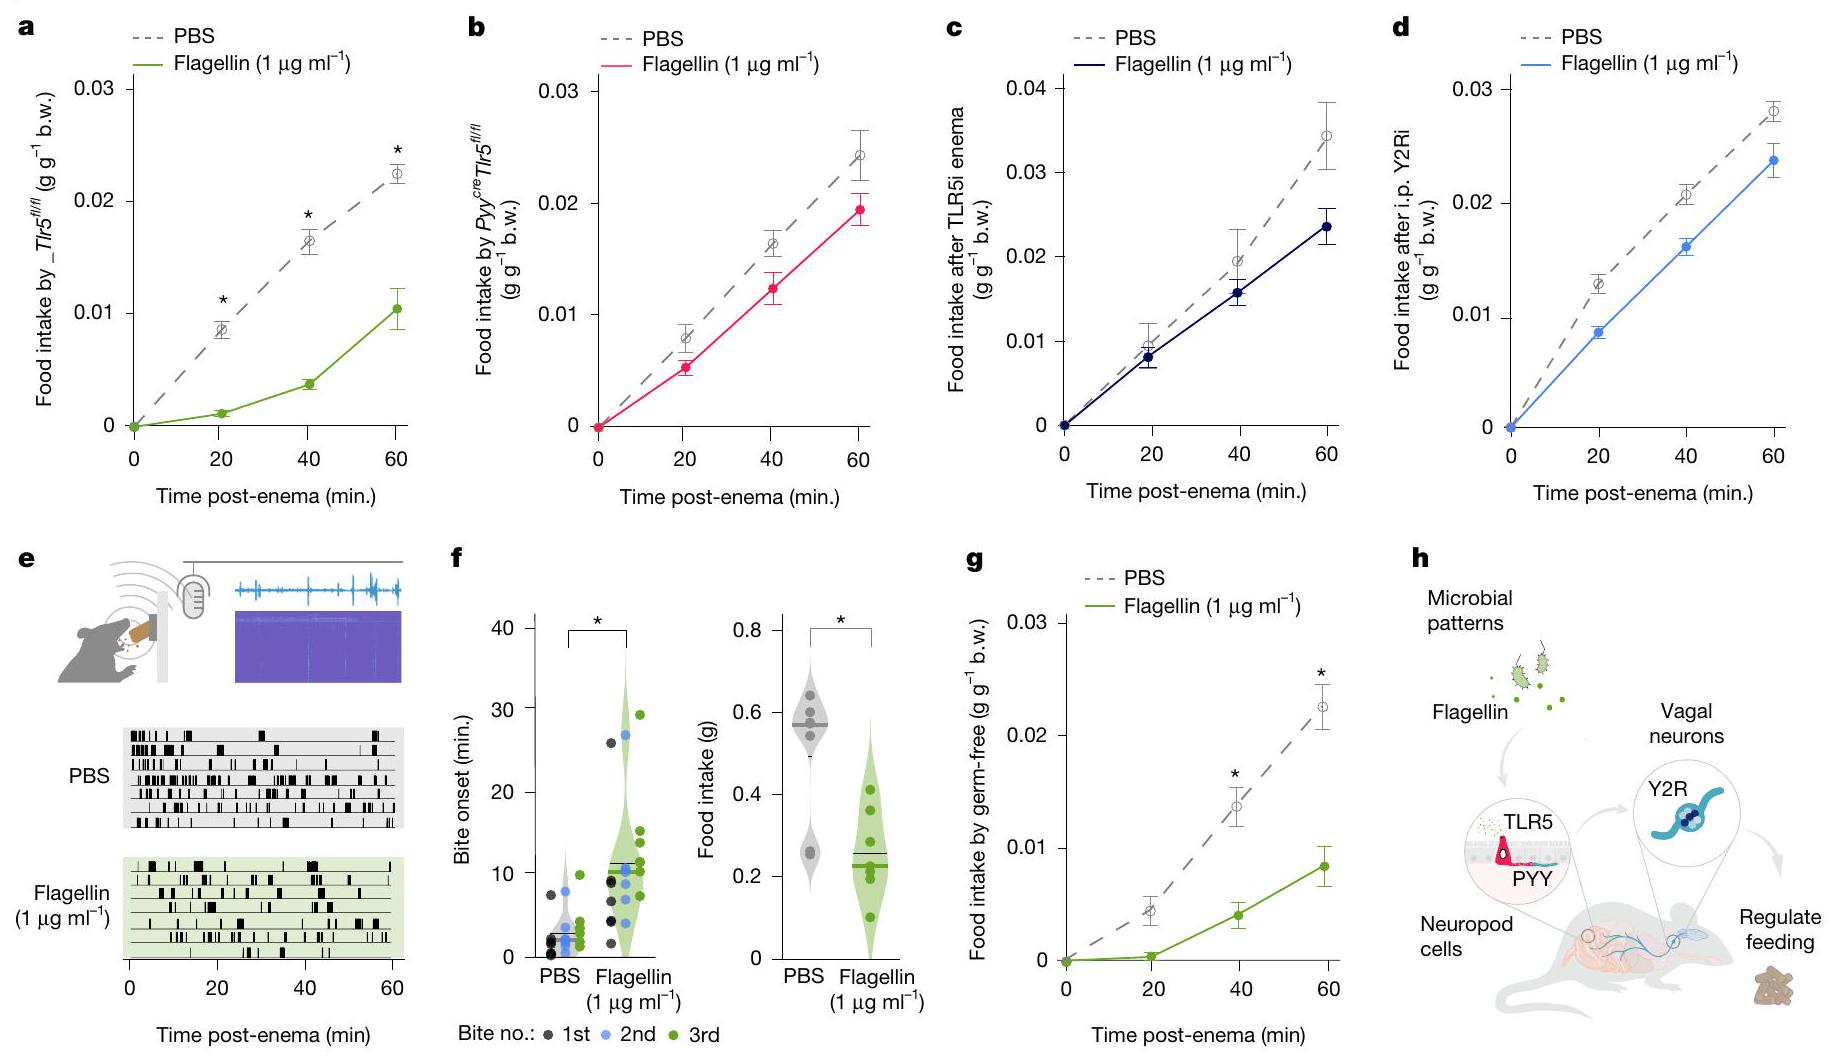
(bottom) indicate biting patterns of
Vagal NPY2 receptor is required
distinct pathway for gut-brain signalling in response to the microbial pattern flagellin.
Flagellin regulates feeding through PYY cells
Conclusion
sensory transduction in the small intestine
Just as organisms rely on sight, sound, scent, taste and touch to navigate the world, they also adjust their behaviour in response to stimuli shaping their gut Umwelt
Online content
- Bohórquez, D. V. et al. Neuroepithelial circuit formed by innervation of sensory enteroendocrine cells. J. Clin. Invest. 125, 782-786 (2015).
- Bellono, N. W. et al. Enterochromaffin cells are gut chemosensors that couple to sensory neural pathways. Cell 170, 185-198 (2017).
- Kaelberer, M. M. et al. A gut-brain neural circuit for nutrient sensory transduction. Science 361, eaat5236 (2018).
- Buchanan, K. L. et al. The preference for sugar over sweetener depends on a gut sensor cell. Nat. Neurosci. 25, 191-200 (2022).
- Furness, J. B., Rivera, L. R., Cho, H. J., Bravo, D. M. & Callaghan, B. The gut as a sensory organ. Nat. Rev. Gastroenterol. Hepatol. 10, 729-740 (2013).
- Hu, D. & Reeves, P. R. The remarkable dual-level diversity of prokaryotic flagellins. mSystems 5, e00705-e00719 (2020).
- The Bohorquez Lab at Duke University. A gut sense for a microbial pattern regulates feeding. YouTube https://www.youtube.com/watch?v=3vXD_SXKT5U (2025).
- von Uexküll, J. Umwelt und Innenwelt der Tiere (Springer, 1909).
- Yong, E. An Immense World: How Animal Senses Reveal the Hidden Realms around Us (Random House, 2022).
- de Hoyos-Vega, J. M. et al. Modeling gut neuro-epithelial connections in a novel microfluidic device. Microsyst. Nanoeng. 9, 144 (2023).
- Servin-Vences, M. R. et al. PIEZO2 in somatosensory neurons controls gastrointestinal transit. Cell 186, 3386-3399 (2023).
- Bayrer, J. R. et al. Gut enterochromaffin cells drive visceral pain and anxiety. Nature 616, 137-142 (2023).
- Bohórquez, D. V., Chandra, R., Samsa, L. A., Vigna, S. R. & Liddle, R. A. Characterization of basal pseudopod-like processes in ileal and colonic PYY cells. J. Mol. Histol. 42, 3-13 (2011).
- Bohórquez, D. V. et al. An enteroendocrine cell – enteric glia connection revealed by 3D electron microscopy. PLoS ONE 9, e89881 (2014).
- Lu, V. B. et al. Adenosine triphosphate is co-secreted with glucagon-like peptide-1 to modulate intestinal enterocytes and afferent neurons. Nat. Commun. 10, 1029 (2019).
- Hayashi, M. et al. Enteroendocrine cell lineages that differentially control feeding and gut motility. Elife 12, e78512 (2023).
- Bai, L. et al. Enteroendocrine cell types that drive food reward and aversion. Elife 11, e74964 (2022).
- Liu, W. W. & Bohórquez, V. D. The neural basis of sugar preference. Nat. Rev. Neurosci. 23, 584-595 (2022).
- Gribble, F. M. & Reimann, F. Enteroendocrine cells: chemosensors in the intestinal epithelium. Annu. Rev. Physiol. 78, 277-299 (2016).
- Martinez-Guryn, K., Leone, V. & Chang, E. B. Regional diversity of the gastrointestinal microbiome. Cell Host Microbe 26, 314-324 (2019).
- Vijay-kumar, M. et al. Metabolic syndrome and altered gut microbiota in mice lacking Toll-like receptor 5. Science 344, 228-232 (2010).
- ODonnell, M. P., Fox, B. W., Chao, P. H., Schroeder, F. C. & Sengupta, P. A neurotransmitter produced by gut bacteria modulates host sensory behaviour. Nature 583, 415-420 (2020).
- Ye, L. et al. Enteroendocrine cells sense bacterial tryptophan catabolites to activate enteric and vagal neuronal pathways. Cell Host Microbe 29, 179-196 (2021).
- Gabanyi, I. et al. Bacterial sensing via neuronal Nod2 regulates appetite and body temperature. Science 376, eabj3986 (2022).
- Tolhurst, G. et al. Short-chain fatty acids stimulate glucagon-like peptide-1 secretion via the G-protein-coupled receptor FFAR2. Diabetes 61, 364-371 (2012).
- Lin, V. H. et al. Butyrate and propionate protect against diet-induced obesity and regulate gut hormones via free fatty acid receptor 3 -independent mechanisms. PLoS ONE 7, e35240 (2012).
Article
- Chimerel, C. et al. Bacterial metabolite indole modulates incretin secretion from intestinal enteroendocrine
cells. Cell Rep. 9, 1202-1208 (2014). - Chassaing, B., Ley, R. E. & Gewirtz, A. T. Intestinal epithelial cell toll-like receptor 5 regulates the intestinal microbiota to prevent low-grade inflammation and metabolic syndrome in mice. Gastroenterology 147, 1363-1377 (2014).
- Chiu, I. M. et al. Bacteria activate sensory neurons that modulate pain and inflammation. Nature 501, 52-57 (2013).
- Sgritta, M. et al. Mechanisms underlying microbial-mediated changes in social behavior in mouse models of autism spectrum disorder. Neuron 101, 246-259 (2018).
- Muller, P. A. et al. Microbiota modulate sympathetic neurons via a gut-brain circuit. Nature 583, 441-446 (2020).
- Fülling, C., Dinan, T. G. & Cryan, J. F. Gut microbe to brain signaling: what happens in vagus…. Neuron 101, 998-1002 (2019).
- Margolis, K. G., Cryan, J. F. & Mayer, E. A. The microbiota-gut-brain axis: from motility to mood. Gastroenterology 160, 1486-1501 (2021).
- Bravo, J. A. et al. Ingestion of Lactobacillus strain regulates emotional behavior and central GABA receptor expression in a mouse via the vagus nerve. Proc. Natl Acad. Sci. USA 108, 16050-16055 (2011).
- Sagan, L. On the origin of mitosing cells. J. Theoret. Biol. 14, 225-274 (1967).
- Gewirtz, A. T., Navas, T. A., Lyons, S., Godowski, P. J. & Madara, J. L. Cutting edge: bacterial flagellin activates basolaterally expressed TLR5 to induce epithelial proinflammatory gene expression. J. Immunol. 167, 1882-1885 (2001).
- Hayashi, F. et al. The innate immune response to bacterial flagellin is mediated by Toll-like receptor 5. Nature 410, 1099-1103 (2001).
- Bogunovic, M. et al. Enteroendocrine cells express functional Toll-like receptors. Am. J. Physiol. Gastrointest. Liver Physiol. 7032, 1770-1783 (2007).
- Lundberg, J. M. et al. Localization of peptide YY (PYY) in gastrointestinal endocrine cells and effects on intestinal blood flow and motility. Proc. Natl Acad. Sci. USA 79, 4471-4475 (1982).
- Gehart, H. et al. Identification of enteroendocrine regulators by real-time single-cell differentiation mapping. Cell 176, 1158-1173 (2019).
- Billing, L. J. et al. Single cell transcriptomic profiling of large intestinal enteroendocrine cells in mice-identification of selective stimuli for insulin-like peptide-5 and glucagon-like peptide-1 co-expressing cells. Mol. Metab. 29, 158-169 (2019).
- Li, H. J. et al. Intestinal Neurod1 expression impairs paneth cell differentiation and promotes enteroendocrine lineage specification. Sci. Rep. 9, 19489 (2019).
- Rhee, S. H. et al. Pathophysiological role of Toll-like receptor 5 engagement by bacterial flagellin in colonic inflammation. Proc. Natl Acad. Sci. USA 102, 13610-13615 (2005).
- Sun, J., Fegan, P. E., Desai, A. S., Madara, J. L. & Hobert, M. E. Flagellin-induced tolerance of the Toll-like receptor 5 signaling pathway in polarized intestinal epithelial cells. Am. J. Physiol. Gastrointest. Liver Physiol. 292, G767-G778 (2007).
- Clasen, S. J. et al. Silent recognition of flagellins from human gut commensal bacteria by Toll-like receptor 5. Sci. Immunol. 8, eabq7001 (2023).
- Yao, Z. et al. A high-resolution transcriptomic and spatial atlas of cell types in the whole mouse brain. Nature 624, 317-332 (2023).
- Rakoff-Nahoum, S., Paglino, J., Eslami-Varzaneh, F., Edberg, S. & Medzhitov, R. Recognition of commensal microflora by toll-like receptors is required for intestinal homeostasis. Cell 118, 229-241 (2004).
- Thaiss, C. A. et al. Microbiota diurnal rhythmicity programs host transcriptome oscillations. Cell 167, 1495-1510 (2016).
- Dong, T. X. et al. T-cell calcium dynamics visualized in a ratiometric tdTomato-GCaMP6f transgenic reporter mouse. Elife 6, e32417 (2017).
- Batterham, R. L. et al. Gut hormone PYY3-36 physiologically inhibits food intake. Nature 418, 650-654 (2002).
- Abbott, C. R. et al. Blockade of the neuropeptide Y Y 2 receptor with the specific antagonist BIIEO246 attenuates the effect of endogenous and exogenous peptide YY (3-36) on food intake. Brain Res. 1043, 139-144 (2005).
- Koda, S. et al. The role of the vagal nerve in peripheral PYY3-36-induced feeding reduction in rats. Endocrinology 146, 2369-2375 (2005).
- Alonso, A. M. et al. The vagus nerve mediates the physiological but not pharmacological effects of PYY3-36 on food intake. Mol. Metab. 81, 101895 (2024).
- Kaelberer, M. M., Rupprecht, L. E., Liu, W. W., Weng, P. & Bohórquez, V. D. Neuropod cells: emerging biology of the gut-brain sensory transduction. Annu. Rev. Neurosci. 43, 337-353 (2020).
- Han, W. et al. A neural circuit for gut-induced reward. Cell 175, 665-678 (2018).
- Bai, L. et al. Genetic identification of vagal sensory neurons that control feeding. Cell 179, 1129-1143 (2019).
- McDougle, M. et al. Separate gut-brain circuits for fat and sugar reinforcement combine to promote overeating. Cell Metab. 36, 393-407 (2024).
- Williams, E. K. K. et al. Sensory neurons that detect stretch and nutrients in the digestive system. Cell 166, 209-221 (2016).
- Zhao, Q. et al. A multidimensional coding architecture of the vagal interoceptive system. Nature 603, 878-884 (2022).
- Luczynski, P. et al. Growing up in a bubble: using germ-free animals to assess the influence of the gut microbiota on brain and behavior. Int. J. Neuropsychopharmacolog. 19, pywO2O (2016).
(c) The Author(s) 2025
Methods
Mouse strains
Dissociation and isolation of single intestinal epithelial cells
Dissociation and isolation of single nodose neurons
RNA sequencing
the cells, Single-cell RNA barcoding sequencing was used to generate libraries. Libraries were sequenced on an Illumina NextSeq 500. STAR was used with the mm10 mouse reference genome to align reads, and count tables were generated using featureCounts. Pairwise comparisons between genes from the PYY-
qPCR
In situ hybridization with immunofluorescence
laboratory), Rb-anti-PGP9.5(1:500; Abcam: ab27053), Gt-anti-serotonin (1:500; Abcam, ab66047) and CHK-anti-GFP (1:500; Abcam: ab13970). Following primary antibody incubation, tissue was washed in
Assessment of basal phenotypes
Measurement of food intake
Detailed feeding, activity and meal pattern analysis
binned in 1-min intervals for analysis. Data were corrected for minor fluctuations by only permitting a monotonically increasing function for both food and water intake: values that represented negative food intake were replaced by the most recent value. Meal size, frequency and timing were defined on the basis of parameters within the PhenoMaster system. Inter-meal intervals were required to be
Fasting blood glucose and oral glucose tolerance test
Fecal lipocalin-2 measurements
Colonic myeloperoxidase assay
Serum hormone measurement
Stool flagellin assay
Calcium imaging of dissociated cells
PYY release assay
using the standard curve. PYY release was calculated as supernatant/ (supernatant + lysate).
Vagus nerve recordings
Optoelectronic colon fibre fabrication
( 8.5 cm total length) in dichloromethane for 10 min , which exposed the interconnect microwires. The interconnects were subsequently soldered onto male header pins that were assembled inside a custom 3D-printed box (
In vivo two-photon calcium imaging and compartment analysis of temporal activity by fluorescence in situ hybridization
activity recording was then taken, followed by a
Food intake behavioural system
intraperitoneal injections two times before the start of the test. At the start of the test, mice received an intraperitoneal injection with
Crunch Master behavioural system
Statistics and reproducibility
using a
Reporting summary
Data availability
Code availability
representative of
control littermates showed no change in (k) crypt depth (n=3 mice), (l) PYY and 5-HT cell density (
Article
in weight gain compared to their littermate controls in both (c) females (PyyCre_Myd
(a) Schematic of meal pattern analysis showing that meals are defined as consumption
Article
Calcium imaging in colonic Neurod1_Salsa6f cells
b Neurod1 cell response heterogeneity to microbial patterns
Extended Data Fig. 6 | Enteroendocrine cells are activated by flagellin.
(
Article
b Spleen cytokine expression
Extended Data Fig. 10 | Flagellin enema is not sufficient to induce an immune
natureportfolio
Reporting Summary
Statistics
n/a
□
□ The exact sample size
□
□
Only common tests should be described solely by name; describe more complex techniques in the Methods section.
□ A description of all covariates tested
□ X
A description of any assumptions or corrections, such as tests of normality and adjustment for multiple comparisons
□
□ X
For null hypothesis testing, the test statistic (e.g. F, t, r) with confidence intervals, effect sizes, degrees of freedom and
□ For Bayesian analysis, information on the choice of priors and Markov chain Monte Carlo settings
□ For hierarchical and complex designs, identification of the appropriate level for tests and full reporting of outcomes
□ Estimates of effect sizes (e.g. Cohen’s
Software and code
Data collection
Illumina NextSeq 500, StepOnePlus System (Thermo Fischer), PhenoMaster software (TSE Systems Inc.; software version 6.6.9), Tecan Infinite 200 Pro version 2.0, Zeiss ZEN Blue software version 3.5, Prairie View version 5.7.
Data
Policy information about availability of data
- Accession codes, unique identifiers, or web links for publicly available datasets
- A description of any restrictions on data availability
- For clinical datasets or third party data, please ensure that the statement adheres to our policy
Research involving human participants, their data, or biological material
| Reporting on sex and gender | N/A |
| Reporting on race, ethnicity, or other socially relevant groupings | N/A |
| Population characteristics | N/A |
| Recruitment | N/A |
| Ethics oversight | N/A |
Field-specific reporting
Life sciences □ Behavioural & social sciences □ Ecological, evolutionary & environmental sciences
For a reference copy of the document with all sections, see nature.com/documents/nr-reporting-summary-flat.pdf
Life sciences study design
- For vagal nerve recordings: Throughout experiments, intralipid response was used as a positive control. For all flagellin and laser stimulation conditions, data were excluded if a stable intralipid response was not seen throughout the recording session.
- For calcium imaging : Each recording session concluded with 50 mM KCl as an activity control. A response to KCl was defined as a ratio
increase above baseline. Cells that did not reach this KCl threshold were not included in analyses. - For enema experiments, mice that consumed less than
of food following a PBS enema were excluded from the experiments due to atypical feeding behavior following an overnight fast.
-For meal pattern analysis, individual meals that exceeded a rate of. or 1 g total volume were excluded for being supraphysiological.
Replication
- For quantitative microscopy experiments, each in-situ labeling technique was performed and quantified in tissue samples from at least 3 individual mice of both sexes. All replication attempts were successful.
- For vagal cuff experiments, the response to positive control intralipid was tested and replicated in between treatments in at least three mice per treatment to ensure within subject reproducibility. If the response changed substantially, the inclusion criterion was not met and therefore, the experiment was terminated.
- For calcium imaging, the response to stimuli within the same cell was not replicated due to limitations of cell viability with repeated applications. To ensure reproducibility, experiments were conducted across several sessions.
- In enema experiments, each experimental condition was replicated in at least 5 mice. Experiments were performed on mice from different litters, ages, and sexes to ensure reproducibility.
-For meal pattern analysis, two independent experiments were run to ensure reproducibility.
Randomization
- In all experiments, animal allocation to experimental group was randomized.
- All behavioral studies were counterbalanced across age and sex to control for variables including position in cage, order effect, and handedness.
- In enema experiments, all included mice received a PBS stimulus, a flagellin stimulus, and in pharmacology experiments, mice received both PBS and flagellin stimuli in combination with pharmacological treatment. The order of stimulus delivery was randomized among different mice. This excludes germ-free mice, in which PBS was delivered first for minimizing bacterial colonization. Each stimulus delivery was separated by at least 48 hours from previous stimulus delivery.
Blinding
April 2023
Reporting for specific materials, systems and methods
| n/a | Involved in the study |
| □ | X Antibodies |
| □ | – Eukaryotic cell lines |
|
□ Palaeontology and archaeology |
| □ | X Animals and other organisms |
|
□ Clinical data |
| X | □ |
| X | □ |
Antibodies
|
|
Involved in the study |
|
|
|
|
|
|
|
|
|
Validation
- Immunohistochemistry: Rb-Anti-PYY (1:250; Generated in the laboratory of Rodger Liddle – The PYY antibody was raised in rabbits using a synthetic peptide, KPEAPGEDASPEELSRYC, corresponding to amino acids
of mouse PYY, affinity-purified), Anti-GFP antibody (host = chicken) (1:500, Abcam; Cat#ab13970); Anti-Pgp9.5 (host = rabbit) (1:500; Abcam; CAT#ab27053), Anti-serotonin (host = goat) (1:500; Abcam; CAT#ab66047); Alexa Fluor 488 AffiniPure F(ab́) Fragment Donkey Anti-Rabbit IgG (H+L) (1:250, Jackson ImmunoResearch; Cat#711-546-152; RRID#AB_2340619); Cy3 AffiniPure F(ab́) Fragment Donkey Anti-Rabbit IgG (H+L) (1:250, Jackson ImmunoResearch;Cat#711-166-152; RRID#AB_2313568); Alexa Fluor 488 AffiniPure F(ab’) Fragment Donkey Anti-Chicken IgG (H+L) (1:250, Jackson ImmunoResearch; Cat#703-546-155; RRID#AB_2340376); Dk-Anti-Gt-647 (1:500, Jackson Immunoresearch 705-606-147) - In-situ hybridization: Mm-Tlr5 (cat#759 468888), Mm-Pyy-C3 (420681-C3), and Mm-Npy2r (cat# 515431) probes were purchased from
.
Eukaryotic cell lines
Policy information about cell lines and Sex and Gender in Research
Authentication
Commonly misidentified lines
(See ICLAC register)
HEK-293 cells are a commonly misidentified cell line. These cells were used as a reported cell line following their transfection with the murine TLR5 gene and an inducible SEAP (secreted embryonic alkaline phosphatase) reporter gene for quantifying the levels of flagellin in mouse stool samples. Authentication of cells was performed by the supplier (Invivogen).
Animals and other research organisms
Male and female adult mice aged 6-20 weeks were used in all experiments. Mice were group housed in Duke University’s Division of Laboratory Animal Resources, where they were kept on a 12 -hour light-dark cycle (0700-1900) at with access to water and standard mouse chow (Purina 5001) ad-libitum, unless otherwise indicated in the manuscript Methods. The facility maintained an ambient temperature of
(background = C57BL/6J) (Jackson Lab; Stock #031968); Tlr5-KO (background = C57BL/6J) (Jackson Lab; Stock #028599); Myd88-KO (background = C57BL/6J) (Jackson Lab; Stock #00888); B6.Cg-Snap25tm3.1Hze/J (Jackson Lab; Stock #025111; B6.129(Cg)Fostm2.1(cre/ERT2)Luo/J (Jackson Lab; Stock #030323).
No wild animals were used in this study.
Sex-related findings and differences are detailed in the manuscript with sample sizes indicated.
No field-collected samples were used in this study.
All experiments on mice were performed following approval by the Institutional Animal Care and Use Committee at Duke University Medical Center under the protocol A212-21-10. All collaborating laboratories followed the guidelines of this animal protocol.
Plants
N/A
N/A
N/A
Laboratory of Gut Brain Neurobiology, Duke University, Durham, NC, USA. Department of Neurobiology, Duke University, Durham, NC, USA. Department of Medicine, Duke University, Durham, NC, USA. Trinity College of Arts & Sciences, Duke University, Durham, NC, USA. Laboratory of Immunometabolism, Research Division, General Hospital of Mexico Dr. Eduardo Liceaga, Mexico City, Mexico. Research Laboratory of Electronics, Massachusetts Institute of Technology, Cambridge, MA, USA. McGovern Institute for Brain Research, Massachusetts Institute of Technology, Cambridge, MA, USA. Department of Materials Science and Engineering, Massachusetts Institute of Technology, Cambridge, MA, USA. Department of Brain and Cognitive Sciences, Massachusetts Institute of Technology, Cambridge, MA, USA. Monell Chemical Senses Center, Philadelphia, PA, USA. Department of Neuroscience, Perelman School of Medicine, University of Pennsylvania, Philadelphia, PA, USA. Laboratory Neurobiology of Appetite, Department of Pharmacology, CINVESTAV, Mexico City, Mexico. Center for Research on Aging (CIE), CINVESTAV Sede Sur, Mexico City, Mexico. Department of Integrative Immunobiology, Duke University, Durham, NC, USA. Department of Molecular Genetics and Microbiology, Duke University, Durham, NC, USA. Department of Pathology, Duke University, Durham, NC, USA. Department of Cell Biology, Duke University, Durham, NC, USA. Department of Physiology, University of Arizona, Tucson, AZ, USA. Duke Institute for Brain Sciences, Duke University, Durham, NC, USA. Present address: Department of Dermatology, Stanford University School of Medicine, Redwood City, CA, USA. These authors contributed equally: Winston W. Liu, Naama Reicher, Emily Alway. These authors jointly supervised this work: M. Maya Kaelberer, Diego V. Bohórquez.
e-mail: mkaelberer@arizona.edu; diego.bohorquez@duke.edu - Wang, Y. et al. Amino acids stimulate cholecystokinin release through the
-sensing receptor. Am. J. Physiol. Gastrointest. Liver Physiol. 300, G528-G537 (2011). 62. Schonhoff, S. et al. Energy homeostasis and gastrointestinal endocrine differentiation do not require the anorectic hormone peptide YY. Mol. Cell. Biol. 25, 4189-4199 (2005).
- Wang, Y. et al. Amino acids stimulate cholecystokinin release through the
- Acknowledgements We thank J. Kotula and M. Toh for assistance with sequencing; R.A. Liddle, S. G.Lisberger, M.D. Gunn, J.A.Alspaugh, N.K. Surana, G. J. Schwartz, Z. Lorsch, M. Toc Sagra and E.B.Bohórquez for editorial input. We acknowledge the following funding sources: National Institutes of Health (NIH) F3O DK122712 (W.W.L.); NIH F32 DK139628 (N.R.); NIH F3O DK136229 (E.A.); NIH F32 DK127757 and NIH KO1 DK138286 (L.E.R.); NIH F3ODK12765O (P.W.); J.A.A.G. is a doctoral student from the Programa de Doctorado en Ciencias Biomédicas of the Universidad Nacional Autónoma de México and has received CONAHCyT fellowship no. CVU959984; CONAHCyT CF-2023-G-518 (R.G.); NIH KO1 DK1314O3 (M.M.K.); and NIH DP2 MH1224O2, NIH R21 AT010818, NIH RO3 DK114500, NIH RO1 DK131112 and NIH RO1 DK132O70 (D.V.B.).Author contributions W.W.L., N.R., E.A., L.E.R., P.W., C.S., M.E.K., J.A.V., C.P.-H., Y.G.K.A., A.Carbajal, J.A.A.G. and A. Coss conducted experiments and acquired data; A.S. and P.A. generated luminal optogenetic resources and optoelectronic microLED; E.G.-L. and R.G. developed the Crunch Master assay, conducted experiments, and acquired and analysed data; A.d.A, A.B. and G.d.L. conducted in vivo calcium imaging and catFISH, acquired and analysed data; W.W.L., N.R., E.A., L.E.R., P.W., J.F.R., E.A.M., M.M.K. and D.V.B. analysed and interpreted data. W.W.L., N.R., E.A., M.M.K. and D.V.B. conceptualized and wrote the manuscript with input from all authors. M.M.K. and D.V.B. developed the idea and supervised the project. D.V.B. acquired funding for the project.Competing interests D.V.B. and M.M.K. are founders and board directors of the Gastronauts Foundation, Inc, a 501(c)3 non-profit company. Some of the findings have been filed by D.V.B. as a provisional patent application. All other authors declare no competing interests.
Acknowledgements We thank J. Kotula and M. Toh for assistance with sequencing; R.A. Liddle, S. G.Lisberger, M.D. Gunn, J.A.Alspaugh, N.K. Surana, G. J. Schwartz, Z. Lorsch, M. Toc Sagra程的 DK136229 (E.A.); NIH F32 DK127757 and NIH KO1 DK138286 (L.E.R.); NIH F3ODK127650 (P.W.);
J.A.A.G. is a doctoral student from the Programa de Doctorado en Ciencias Biomédicas of the Universidad Nacional Autónoma de México and has received CONAHCyT fellowship no.
CVU959984; CONAHCyT CF-2023-G-518 (R.G.); NIH KO1 DK1314O3 (M.M.K.); and NIH DP2 CVU9592402, NIH R21 AT010818, NIH RO3 DK114500, NIH RO1 DK131112 and NIH RO1 DK132O70 (D.V.B.).section*{Additional information}
Supplementary information The online version contains supplementary material available at https://doi.org/10.1038/s41586-025-09301-7.
Correspondence and requests for materials should be addressed to M. Maya Kaelberer or Diego V. Bohórquez.
Peer review information Nature thanks John Lukens and the other, anonymous, reviewer(s) for their contribution to the peer review of this work.
Reprints and permissions information is available at http://www.nature.com/reprints. - Experimenters were not blinded to treatment condition or genotype for ensuring the conduction of proper procedures. Each genotype received identical treatment regimes.