DOI: https://doi.org/10.1016/j.esr.2024.101307
تاريخ النشر: 2024-01-01
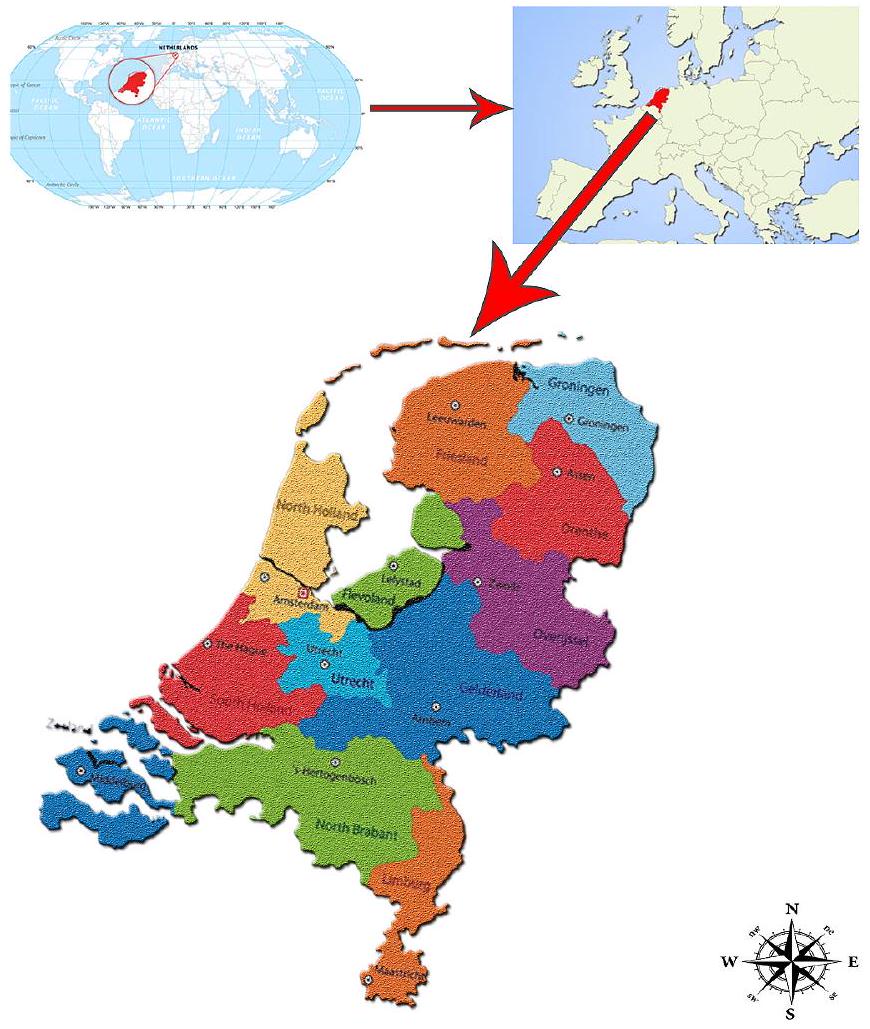
اتخاذ القرار متعدد المعايير لاختيار موقع محطة الطاقة الشمسية – طاقة الرياح باستخدام نهج قائم على GIS والفuzzy الحدسي مع تطبيق في هولندا
معلومات المقال
الكلمات المفتاحية:
نظم المعلومات الجغرافية (GIS)
ضبابية حدسية
صنع القرار متعدد المعايير
خريطة موقع محطة الطاقة الشمسية
خريطة مواقع محطات طاقة الرياح
خريطة الموقع الأمثل لطاقة الرياح الشمسية
الملخص
لا يمكن تحقيق تنمية بلد ما فقط من خلال كمية الطاقة التي ينتجها وتصنيعها. في بلد يُترك فيه شعبه بلا مأوى وفقير، وتُدمر ثرواته الثقافية والطبيعية، فإن الكهرباء المنتجة ليست مقياسًا للتنمية بمفردها. يجب أن تُعتبر التنمية والتقدم من منظور شامل يتضمن الهيكل الجغرافي للبلد، وجميع مخلوقاته الحية، وثقافته، وهيكله الحضري والاجتماعي ككل. في هذا الصدد، فإن الانتقال إلى الطاقة المتجددة أمر ضروري. واحدة من أكثر مصادر الطاقة المتجددة استخدامًا في هولندا هي الطاقة الشمسية وطاقة الرياح. بالنسبة لهذه المحطات، فإن اختيار الموقع هو عامل مهم في تقليل تكلفة تركيب محطة الطاقة الشمسية وطاقة الرياح وتحقيق أقصى كفاءة أثناء التشغيل. وهذا يمهد الطريق لدراسة مشكلة اختيار الموقع. في هذه الدراسة، نحقق أولاً في المواقع الممكنة لتركيب محطة الطاقة الشمسية والرياح لـ 12 منطقة في هولندا، وهي شمال هولندا، غيلدرلاند، فريزلاند، شمال برابانت، درينثي، غرونينغن، زيلاند (ميدلبورغ)، أوترخت، جنوب هولندا، ليمبورغ، أوفر آيسل وفليفولاند، باستخدام نظم المعلومات الجغرافية كطريقة رسم خرائط، ثم نطبق نهجًا قائمًا على الضبابية الحدسية للمشكلة للحصول على المواقع المثلى لكل من الطاقة الشمسية وطاقة الرياح. علاوة على ذلك، تتم مقارنة نتائج طريقتين (نظم المعلومات الجغرافية والنهج القائم على الضبابية الحدسية) للحصول على نتائج أكثر دقة. تظهر النتائج أن
1. المقدمة
زيادة بنسبة
[8] بحث في ملاءمة جزيرة أوليونغ في كوريا لمزارع الطاقة الشمسية باستخدام نظم المعلومات الجغرافية بالاشتراك مع المجموعات الضبابية. وهذا يسمح بدعم وتحليل عمليات اتخاذ القرار [9]. ذكر أنه بينما يتم نمذجة الأنظمة في الهندسة وفروع العلوم الأخرى وفقًا لمبادئ الطرق الرياضية الدقيقة، يتم البحث عن طريقة جديدة لحل المشكلات بسبب عدم اليقين في عمليات اتخاذ القرار. يتم تعريفها على أنها إنشاء أنظمة اتخاذ القرار التي يمكن أن تستخدم وتختار وفقًا للموقف [10]. يصف مفاهيم المنطق الضبابي، مثل أن التعريفات التي تحتوي على “قليل”، ليست مفهومة تمامًا بين الناس. يتم تعريفها على أنها ضمان أن تتم معالجة العمليات المنطقية بنجاح أكبر من أنظمة الكمبيوتر [11]. عرّف مفهوم مجموعة الضبابية الحدسية (IFS) كعمومية لمفهوم المجموعة الضبابية في دراسته. تم تقديم أول معلومات حول مفهوم الضبابية ومبادئها من قبل لوتفي [12]. [13] اقترحوا أول تطبيق في الانحدار الضبابي من خلال دراستهم في عام 1982. تم إجراء التحليل باستخدام تقنية البرمجة الخطية [14]. ذكروا في دراستهم أن نموذج الانحدار الضبابي الخطي هو طريقة أكثر ملاءمة [15]. في دراسته، شرح نموذج الانحدار الضبابي الذي تم تطويره بواسطة المنطق الضبابي [16]. اقترحوا طريقة انحدار ضبابية تشرح الضبابية التي قد تحدث عندما لا تؤخذ الضبابية الناتجة عن الحكم البشري في الاعتبار في الطرق المستخدمة لتقييم جودة الصورة الذاتية (IQA) [17]. اقترحوا مشغل FPC المستخدم للقيود في مشكلة برمجة رياضية لصياغة نماذج الانحدار الضبابي الخطي مع معلمات ضبابية باستخدام ملاحظات ضبابية [18]. درسوا عناصر المجموعات الضبابية الحدسية التي لها درجة عضوية ودرجة عدم عضوية مجموعها هو
2. الخلفية
2.1. تقنية الرسم، نظم المعلومات الجغرافية
2.2. المجموعة الضبابية
2.2.1. المجموعات الضبابية الحدسية
لإجراءين؛
(2) موجودة:
الخطوة 2. حساب أوزان المعايير
الخطوة 3. بناء القيم المتوسطة الموزونة لكل بديل
الخطوة 4. تصنيف البدائل
3. المنهجية
3.1. معايير اتخاذ القرار
(C1) الميل: تعتبر خصائص الميل في التضاريس عاملاً مهماً لتركيب أنظمة الطاقة المتجددة (انظر الشكل 1). في اختيار الموقع المناسب لمحطة طاقة الرياح، يجب ألا يتجاوز الميل
(C2) الاتجاه: الاتجاه هو موقع أي مكان بالنسبة للشمس، ويشار إليه أيضًا بالتوجه. يشير إلى موقع منحدرات الجبال بالنسبة للشمس. في هولندا لا توجد جبال، ولكن يمكن العثور على بعض المناطق التلّية. مع هذه الميزات التي توفرها، فإنه مهم من حيث الطاقة المتجددة [43] أوزجانم.إت وآخرون، 2017 [38]؛ ترك وآخرون 2020؛ ترك وآخرون، 2021، [44]. بالنسبة لهولندا، يوضح الشكل 3 خريطة الجوانب.
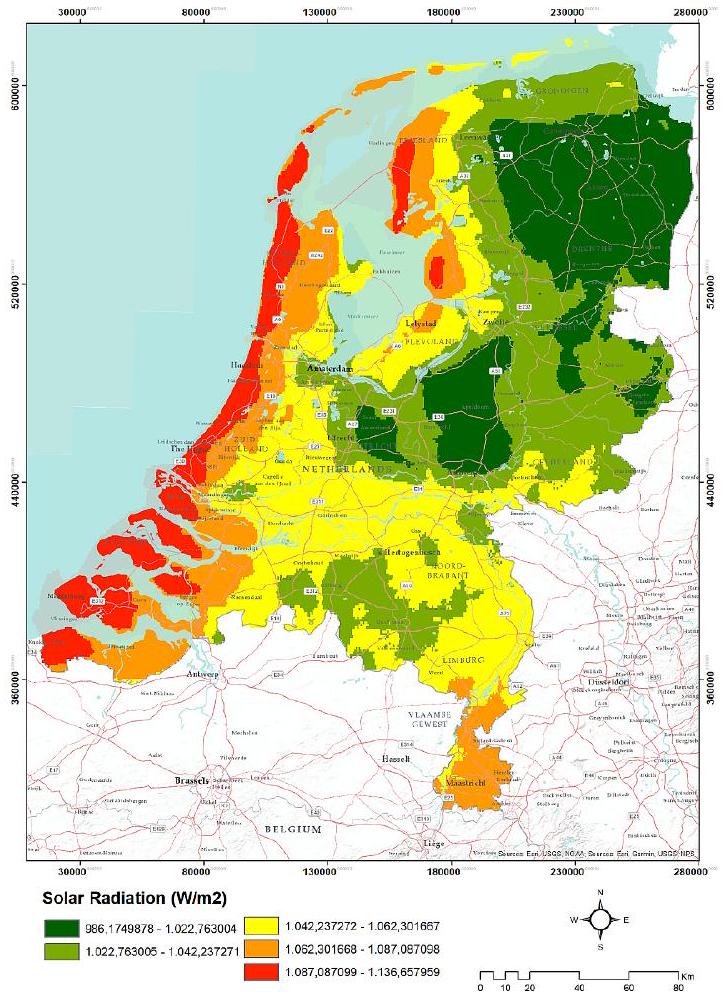
(C3) الإشعاع الشمسي: الإشعاع الشمسي هو أحد أهم المعايير للطاقة الشمسية وطاقة الرياح. الإشعاع الشمسي هو الطاقة المشعة التي تُ emitted عادةً إلى البيئة خلال فترة زمنية معينة. وحدة الطاقة المشعة الساقطة على وحدة المساحة هي (جول/متر مربع،
(C4) استخدام الأراضي: استخدام الأراضي هو تنظيم كيفية استخدام الأرض في بلد أو منطقة معينة، وحمايتها وإدارتها. يهدف استخدام الأراضي إلى حماية المصالح الاقتصادية والاجتماعية والبيئية للأرض بطريقة متوازنة. يشمل استخدام الأراضي حماية الموارد الطبيعية.
من الأرض، تخطيط استخدام الأراضي، الزراعة، الغابات، السياحة، إنتاج الطاقة، النقل، تحديد مناطق الطاقة المتجددة وغيرها من الأنشطة الاقتصادية وفقًا لاستخدام الأراضي [43] أوزجانم.إتال، 2017 [38]؛ ترك et al. 2020؛ ترك et al.، 2021، [44]. الشكل 5 يوضح خريطة هولندا من حيث استخدام الأراضي.
(C5) سرعة الرياح: تُسمى الحركات الهوائية الأفقية المتجهة من مناطق الضغط العالي إلى مناطق الضغط المنخفض بالرياح. بعبارة أخرى، تتشكل الرياح بسبب فرق الضغط بين نقطتين وتستمر الرياح في الهبوب حتى ينخفض هذا الفرق في الضغط. الجهاز الذي يقيس سرعة الرياح يُسمى مقياس سرعة الرياح [43] أوزجانم.إتالمتوسط السنوي لسرعة الرياح في هولندا موضح في الشكل 6.
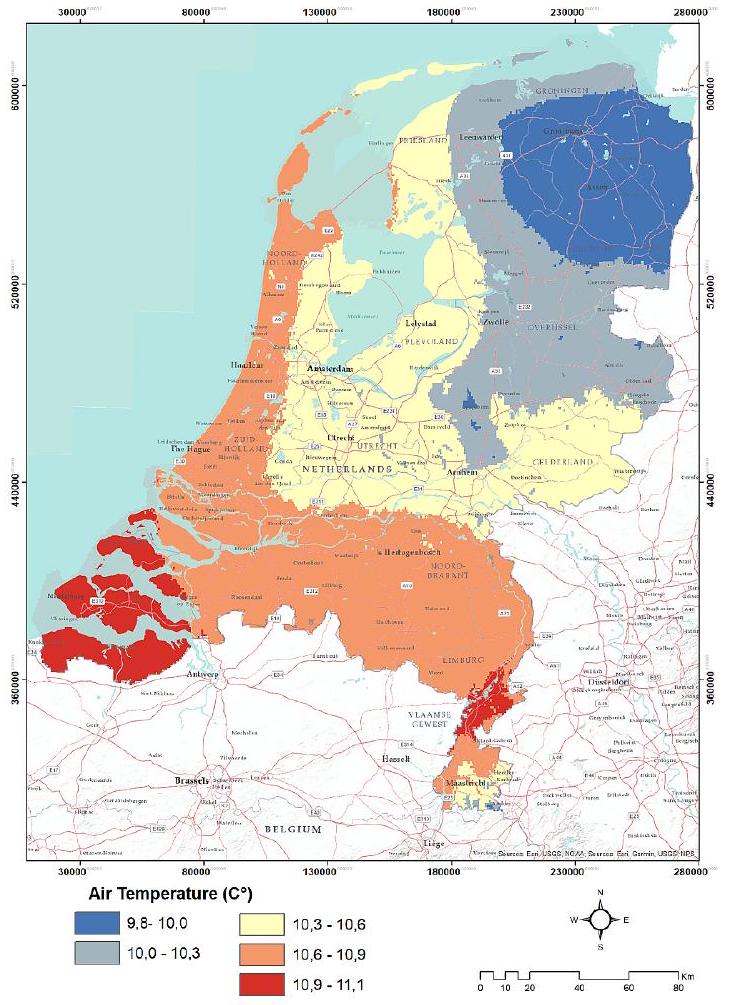
(C6) درجة حرارة الهواء: يُطلق على متوسط (الطاقة الحركية لجزيء) الطاقات الحركية للجزيئات التي تشكل مادة ما اسم درجة الحرارة. نظرًا لأن الجزيئات التي تشكل المادة تنقل طاقاتها الحركية نتيجة التصادم مع بعضها البعض، فإن الطاقة الحركية لكل جزيء تختلف وعندما تصطدم ببعضها، تتغير طاقاتها الحركية باستمرار. نظرًا لأن الطاقات الحركية لجزيئات المادة عند نفس درجة الحرارة تختلف، فإن درجة الحرارة هي متوسط الطاقات الحركية لجميع الجزيئات، وليس لجزيء واحد. تؤدي الدورة الهوائية في الأماكن الحارة المشمسة إلى انخفاض درجة حرارة اللوحة مما يؤدي إلى زيادة إنتاج الطاقة والكفاءة، وقد تم تحديد أن كفاءة إنتاج الطاقة من الدورة الهوائية قد انخفضت (هومادي، 2016). بعد الحصول على خرائط درجة حرارة الهواء لمنطقة الدراسة من “الأطلس العالمي” رقميًا، تم استخدامها في برنامج Arc-GIS 10.2 لتشكيل هيكل متوافق مع مقياس العمل من خلال إعادة التصنيف على زر إعادة التصنيف في وحدة أداة التحليل المكاني [43] أوزكان.م.إتال، 2017 [38]؛ ترك et al. 2020؛
قيم تسجيل الموقع المناسب لمحطة الطاقة الشمسية التي أنشأها الخبراء لكل طبقة [61]؛ أوزدمير س. وآخرون، 2018؛ أ. تونج وآخرون، 2019 [38].
| أنواع الطاقة | عامل التقييم | الوحدات الفرعية المختارة | رقم الصلة |
| شمسي | ارتفاع |
|
٤ |
| طاقة |
|
1 | |
|
|
1 | ||
|
|
1 | ||
| منحدر | مسطح | ٤ | |
| يميل قليلاً | ٤ | ||
| مائل | ٣ | ||
| منحدر جداً | 1 | ||
| غطاء الأرض | الصناعات التجارية والنقل | 1 | |
| مجالات التعدين والبناء | 1 | ||
| غير زراعي | ٢ | ||
| مجالات مناسبة لـ | 1 | ||
| المنتجات المستمرة | 1 | ||
| منطقة المراعي | ٣ | ||
| متغاير | 1 | ||
| المناطق الزراعية | |||
| الغابات | 1 | ||
| مناطق الشجيرات | 2 | ||
| مناطق بدون نباتات | ٣ | ||
| المناطق الرطبة الداخلية | 1 | ||
| المناطق الرطبة بالقرب من الساحل | 1 | ||
| المياه الداخلية | 1 | ||
| أسطح الماء | 1 | ||
| المراعي | ٤ | ||
| الأراضي الزراعية | 1 | ||
| المروج الطبيعية | ٤ | ||
| بنية تحتية للمدن | 1 | ||
| جانب | شمال | 1 | |
| شمال شرق | 1 | ||
| شرق | 2 | ||
| جنوب شرق | ٢ | ||
| جنوب | ٤ | ||
| جنوب غرب | ٣ | ||
| غرب | 1 | ||
| شمال غرب | 1 | ||
| ميل | ثابت (0-2%) | 1 | |
| مائل قليلاً (2-6%) | 1 | ||
| متوسط (6-12 %) | 1 | ||
| منحدر (12-20 %) | 1 | ||
| شديد الانحدار (20-30 %) | 1 | ||
| مائل 30+%) | 1 | ||
| الإشعاع الشمسي
|
إشعاع زائد >1100 | ٤ | |
| كيلووات ساعة/متر مربع | |||
| الإشعاع أيضًا | ٣ | ||
| إشعاع طبيعي | 2 | ||
|
|
|||
| إشعاع منخفض <950 | 1 | ||
| كيلووات ساعة/متر مربع | |||
| درجة حرارة الهواء | ساخن | 2 | |
| حار قليلاً | ٤ | ||
| عادي | ٤ | ||
| رائع | ٢ | ||
| (المسافة إلى) |
|
٤ | |
|
|
٣ | ||
|
|
٢ | ||
|
|
1 | ||
|
|
1 | ||
| رياح قوية (10-12) | ٣ | ||
| عاصف (8-10) | ٤ | ||
| ضوء الرياح (5-8) | ٤ | ||
| لا ريح أو منخفض (0-5) | 1 | ||
| ضغط الهواء | عالي | ٤ | |
| عادي | ٣ | ||
| منخفض | 2 | ||
| منخفض جداً | 1 | ||
| رطوبة الهواء | عالي | 1 | |
| عادي | 2 | ||
| أنواع الطاقة | عامل التقييم | الوحدات الفرعية المختارة | رقم الصلة |
| منخفض | ٣ | ||
| منخفض جداً | ٤ | ||
| سطح الأرض | حار جداً | 1 | |
| درجة الحرارة (LST) | ساخن | 2 | |
| عادي | ٣ | ||
| رائع | ٤ | ||
| النقل |
|
٤ | |
| شبكة |
|
٤ | |
|
|
٣ | ||
|
|
2 | ||
|
|
1 |
(C7) ضغط الهواء: يُطلق على بخار الماء الذي تحمله الهواء اسم الرطوبة. تختلف كمية الرطوبة، أي بخار الماء، التي يمكن أن يحملها الهواء باختلاف درجة الحرارة والضغط. زيادة درجة الحرارة تزيد من كمية الرطوبة التي يمكن نقلها. تم الحصول على خرائط الرطوبة لمنطقة الدراسة من خلال رقمنة بيانات النقاط التي تم الحصول عليها من محطات في 12 موقعًا مختلفًا في برنامج Arc-GIS 10.2 واستخدام طريقة “Kriging” في وحدة التحليل الجيستاتيستيكي (Sahin F et al., 2020). الشكل 8 يُظهر النتيجة.
(C8) رطوبة الهواء: للغازات المحيطة بالأرض وزن. القوة التي تمارسها الغازات المكونة للغلاف الجوي على الأرض تحت تأثير الجاذبية تُسمى ضغط الهواء. تم رقمنة خريطة ضغط الهواء في برنامج Arc-GIS 10.2 وتم الحصول عليها باستخدام طريقة “Kriging” في وحدة التحليل الجيستاتيكي [45،46]، انظر الشكل 9.
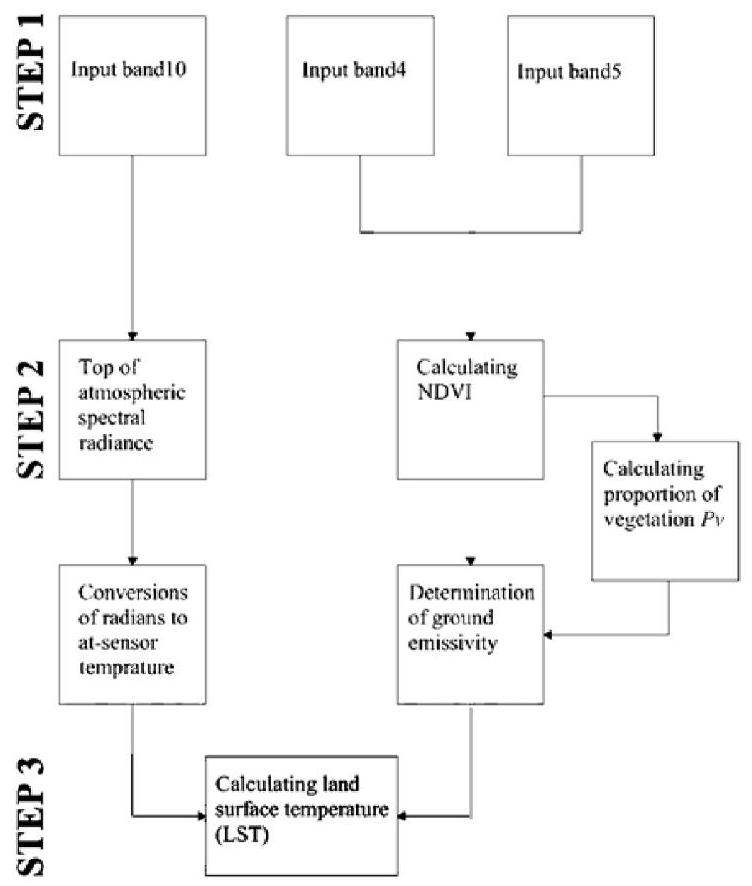
(C9) درجة حرارة سطح الأرض: تعتبر درجات حرارة سطح الأرض من المعلمات المهمة من حيث المناخ وتستخدم في نماذج المناخ. يتم استخدامها بنجاح لتحديد قيم و تغييرات درجة حرارة سطح الأرض (LST) والتحقيق في آثارها [34،47،48]. تختلف درجة حرارة سطح الأرض وفقًا لتغطية الأرض واستخدامها وغالبًا ما تستخدم في تحديد التغيرات في الأرض [49]. جزيرة الحرارة الحضرية [50]، المناخ [51]، الزراعة (أوزلكان، 2014)، الجفاف، الغابات، البحرية وفي العديد من الدراسات الأخرى، تعتبر بيانات LST مصدر بيانات مهم وفعال [52-55]. من أجل حساب قيمة LST بنجاح، هناك حاجة إلى بيانات مثل قيم التأثيرات الجوية، معلمات المستشعر، والانبعاثية السطحية للأرض للمساعدة في حساب LMS [56]. تُستخدم طرق القناة الواحدة، وزاوية متعددة، وقنوات متعددة، ونافذة مقسمة في حساب LST [57]. في طريقة القناة الواحدة، يتناسب التغير في الإشعاع على الأرض المنبعث من الغلاف الجوي بشكل مباشر مع البيانات المكتشفة في قناتين مختلفتين. بهذه الطريقة، يمكن الوصول إلى قيم التأثير الجوي وإشعاع السطح [58]. تُستخدم قيم درجة الحرارة الجوية، والرطوبة، وبخار الماء، ودرجة حرارة السطوع المستمدة من صور الأقمار الصناعية الحرارية [59، 60]. تتراوح درجات حرارة سطح الأرض من
القيم المخصصة لموقع محطة الطاقة الريحية التي أنشأها الخبراء لكل طبقة [61]؛ أوزدمير س. وآخرون، 2018؛ أ. تونج وآخرون، 2019 [38].
| أنواع الطاقة | عامل التقييم | الوحدات الفرعية المختارة | رقم الصلة |
| رياح | ارتفاع |
|
٢ |
| طاقة |
|
٣ | |
|
|
٤ | ||
|
|
٤ | ||
| منحدر | مسطح | ٤ | |
| يميل قليلاً | ٤ | ||
| مائل | ٣ | ||
| منحدر جداً | 1 | ||
| غطاء الأرض | التجاري الصناعي و | 1 | |
| التعدين والبناء | 1 | ||
| اصطناعي غير زراعي | 2 | ||
| مجالات مناسبة لـ | 1 | ||
| المنتجات المستمرة | 1 | ||
| منطقة المراعي | ٣ | ||
| غير متجانس | 1 | ||
| المناطق الزراعية | |||
| الغابات | 1 | ||
| مناطق الشجيرات | 2 | ||
| المناطق الخالية من الغطاء النباتي | ٣ | ||
| المناطق الرطبة الداخلية | 1 | ||
| المناطق الرطبة بالقرب من الساحل | 1 | ||
| المياه الداخلية | 1 | ||
| أسطح الماء | 1 | ||
| المراعي | ٤ | ||
| الأراضي الزراعية | 1 | ||
| المروج الطبيعية | ٤ | ||
| بنية تحتية للمدن | 1 | ||
| جانب | شمال | 1 | |
| شمال شرق | 2 | ||
| شرق | ٤ | ||
| جنوب شرق | 2 | ||
| جنوب | 1 | ||
| جنوب غرب | 1 | ||
| غرب | ٤ | ||
| شمال غرب | 2 | ||
| ميل | ثابت (%0-2) | ٤ | |
| مائل قليلاً (%2-6) | ٤ | ||
| الوسط (%6-12) | ٤ | ||
| منحدر (%12-20) | ٤ | ||
| شديد الانحدار (%20-30) | ٤ | ||
| مُتَسَاقِط (%30+) | ٤ | ||
| الإشعاع الشمسي | زيادة الإشعاع | ٤ | |
| الإشعاع أيضًا 42000000 – | ٣ | ||
| إشعاع | ٣ | ||
| عادي 3000000-1000 واط/م 2000 | |||
| الإشعاع منخفض <100000 | 1 | ||
| واط/م² | |||
| درجة حرارة الهواء | ساخن | 2 | |
| حار قليلاً | ٤ | ||
| عادي | ٤ | ||
| رائع | ٢ | ||
| خط النقل |
|
٤ | |
|
|
٣ | ||
|
|
2 | ||
|
|
1 | ||
|
|
1 | ||
| متوسط سرعة الرياح | رياح قوية (10-12) | ٤ | |
| رياحي (8-10) | ٤ | ||
| ضوء الرياح (5-8) | ٤ | ||
| لا ريح أو منخفض (0-5) | 1 | ||
| عالي | ٤ | ||
| عادي | ٣ | ||
| منخفض | 2 | ||
| منخفض جداً | 1 | ||
| عالي | 1 | ||
| طاقة | عامل التقييم | الوحدات الفرعية المختارة | الملاءمة |
| أنواع | رقم | ||
| عادي | 2 | ||
| منخفض | ٣ | ||
| منخفض جداً | ٤ | ||
| سطح الأرض | حار جداً | 1 | |
| درجة الحرارة (LST) | ساخن | 1 | |
| عادي | 1 | ||
| رائع | 1 | ||
| النقل |
|
٤ | |
| شبكة |
|
٤ | |
|
|
٣ | ||
|
|
2 | ||
|
|
1 |
في الخطوة الثانية، تم استخدام معادلة أخرى لتحويل قيمة الإشعاع الجوي إلى درجة حرارة المستشعر (تشاندير وماركهم، 2003).
NDVI = خرائط مؤشر كثافة النباتات المعيارية.
في الجزء الآخر من الدراسة، تم حساب نسبة الغطاء النباتي. تم استخدام المعادلة التالية لحساب نسبة الغطاء النباتي (لاندسات؛ زانتر، 2016).
في المرحلة الأخيرة من الدراسة، تم إنشاء خرائط لدرجة حرارة السطح (LST) بهامش خطأ أدنى.
(C10) خط النقل: اليوم، لا شك أن أكثر أنواع الطاقة فائدة واقتصادية هي الطاقة الكهربائية. الطلب على الطاقة الكهربائية، الذي بدأ استخدامه لأغراض الإضاءة نحو نهاية القرن التاسع عشر، وصل إلى أبعاد هائلة في السنوات التالية. وقد جعلت هذه الحالة الحاجة إلى نقل الطاقة أمرًا ضروريًا، وبالتالي تم استخدام خطوط نقل الطاقة. هذه هي الخطوط التي تنقل الطاقة الكهربائية التي تم الحصول عليها بطريقة منظمة ومخططة من محطات الطاقة إلى خطوط التوزيع. لا يمكن إنشاء المراكز التي تنتج الطاقة الكهربائية (محطات الطاقة الكهرومائية، محطات الطاقة الحرارية، محطات الطاقة بالدورة الغازية، محطات الطاقة الشمسية، إلخ) بالقرب من مراكز الاستهلاك. من بين أهم الأسباب لذلك هي صعوبات نقل المواد الخام، التلوث البيئي، السلامة، إلخ. سيتم نقل الطاقة الكهربائية المنتجة على مسافات تصل إلى عدة كيلومترات. في هذه النقطة، تتضح أهمية خطوط نقل الطاقة حيث يجب أن تكون هناك حدائق شمسية ورياح جديدة.
المتغيرات اللغوية لتقييم كل معيار (موندال وبرامانيك، 2004؛ [62]).
| المتغيرات اللغوية | إنترفيرونات
|
| مهم جداً (VI) |
|
| مهم (أنا) |
|
| متوسط (م) |
|
| غير مهم (U) |
|
| غير مهم جداً (VU) |
|
أهمية المعايير وفقًا لصانع القرار لمحطة الطاقة الشمسية.
| C1 | C2 | C3 | C4 | C5 | C6 | C7 | سي8 | سي9 | C10 | سي11 | C12 | |
| صانع القرار | أنا | أنا | أنا | السادس | أنا | السادس | أنا | السادس | السادس | السادس | أنا | أنا |
المتغيرات اللغوية لتقييم كل بديل (موندال وبرامانيك، 2004؛ [62].
| المتغيرات اللغوية | إنترفيرونات (IFNs)
|
| مرتفع للغاية (EH) | (0.95, 0.05, 0.00) |
| مرتفع جداً (VH) | (0.85, 0.10, 0.05) |
| عالي (H) | (0.75, 0.15, 0.10) |
| متوسط عالي (MH) | (0.65, 0.25, 0.10) |
| متوسط (م) | (0.50, 0.40, 0.10) |
| متوسط منخفض (ML) | (0.35, 0.55, 0.10) |
| منخفض (L) | (0.25, 0.65, 0.10) |
| منخفض جداً (VL) | (0.15, 0.80, 0.05) |
| منخفض للغاية (EL) | (0.05, 0.95, 0.00) |
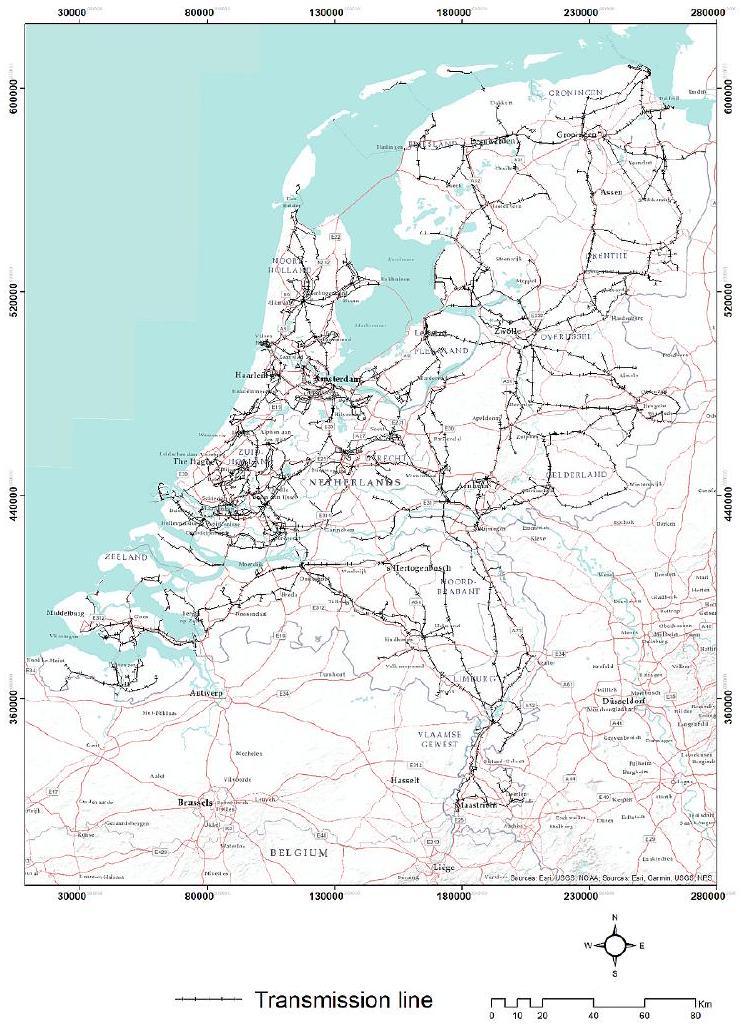
(C11) شبكة النقل: شريط طويل من السطح الصلب يستخدم في النقل البري. يمكن أن يتكون من أسباب طبيعية أو من صنع الإنسان. يساعد حركة البشر والحيوانات والمركبات على التقدم بسرعة وسهولة وأمان. تختلف الطرق بشكل كبير، من المسارات التي أنشأتها آثار الأقدام على التضاريس الوعرة إلى الطرق السريعة متعددة الحارات. الشكل 13 يظهر بنية الطرق الهولندية.
(C12) الارتفاع: الارتفاع مرتبط بسرعة الرياح. المسافة الرأسية لنقطة من الأرض عن مستوى سطح البحر تُسمى الارتفاع أو العلو. يؤثر الارتفاع على أداء طاقة الرياح نتيجة لزيادة سرعة الرياح (عبد الرحمن، 2016). خرائط ارتفاع هولندا
4. النتائج والمناقشة
4.1. تطبيق نظم المعلومات الجغرافية
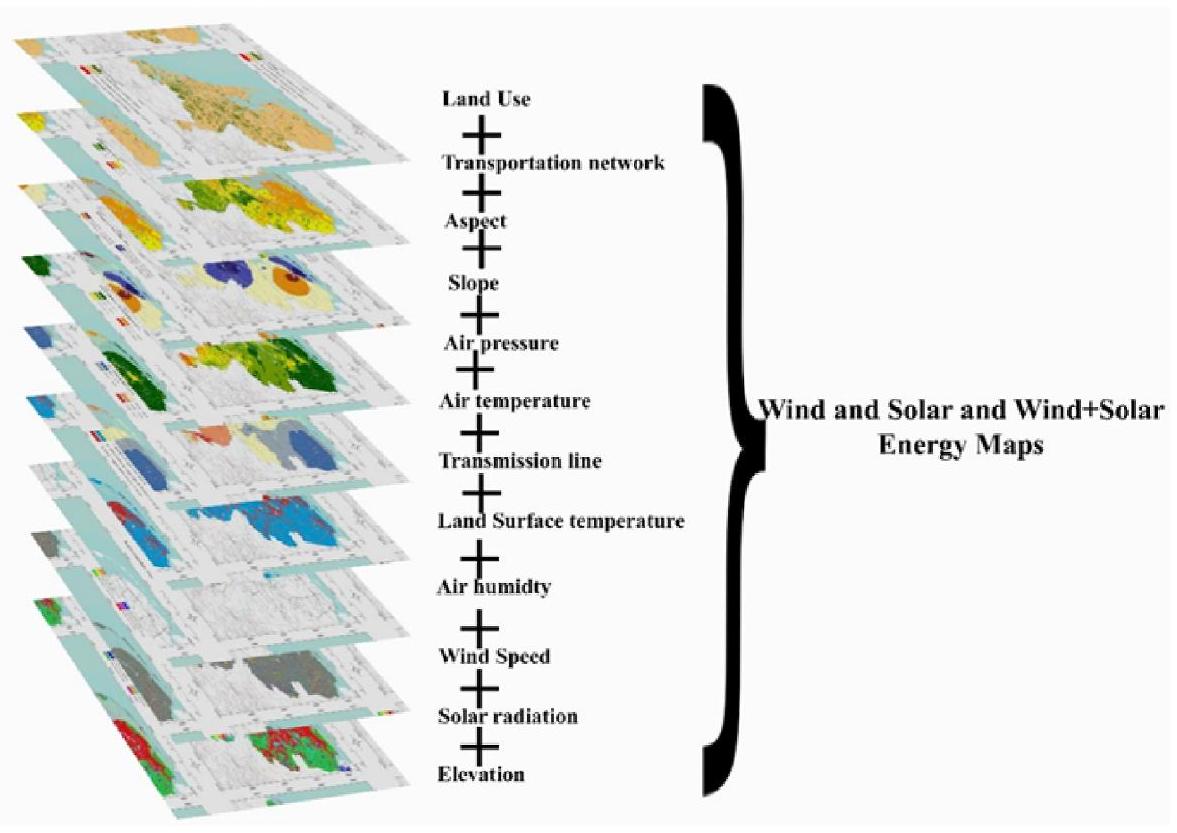
تم إعطاء درجات بين 1 و 4 للمناطق، وتم تراكب البيانات للحصول على خريطة للمناطق المناسبة وغير المناسبة لـ WPP و SPP (خريطة القناع). ثم، بمساعدة آراء الخبراء، تم تصنيف المعايير وفقًا لأهميتها وتحديد أوزانها من خلال نهج GIS-الفuzzy-intuitionistic. تم إخضاع جميع البيانات لعملية إعادة التصنيف وتراكبها مع الأوزان المحددة كما هو موضح في الشكل 15 من أجل تصنيف المناطق المناسبة ضمن نفسها. تم تكرار هذه العملية مرة أخرى مع وزن متساوي للمعايير من منظور مختلف للمقارنة. أخيرًا، تم تراكب خرائط التداخل الموزونة مع خريطة القناع للحصول على خرائط الملاءمة النهائية، الأشكال 16-18. يتم تقديم خرائط الملاءمة النهائية بطريقتين مختلفتين، أولاً وفقًا للأوزان المحددة من خلال نهج GIS-الفuzzy-intuitionistic، وثانيًا من خلال اعتبار المعايير موزونة بالتساوي، ويتم تفسير النتائج.
4.2. تطبيق المنطق الضبابي الحدسي على المواقع المحتملة
وظائف العضوية الضبابية.
أداء البدائل وفقًا لصانع القرار لمحطة الطاقة الشمسية.
| بدائل | C1 | C2 | C3 | C4 | C5 | C6 | C7 | C8 | سي9 | C10 | سي11 | سي12 |
| أ1 | EH | EH | EH | M | ل | MH | M | H | H | VH | MH | M |
| A2 | EH | EH | H | M | M | H | M | M | MH | VH | MH | VH |
| A3 | تعلم الآلة | M | MH | H | MH | إل | إل | M | H | MH | H | MH |
| A4 | تعلم الآلة | M | H | VH | H | M | ل | M | إل | H | إل | H |
| A5 | EH | EH | VH | تعلم الآلة | ل | VH | M | تعلم الآلة | H | H | H | H |
| A6 | VL | ل | EH | إل | VH | EH | VH | إل | H | MH | H | MH |
| أ7 | ل | MH | M | M | M | ل | ل | M | VH | M | VH | M |
| أ8 | ل | ل | M | M | VH | ل | إل | M | H | M | H | M |
| أ9 | EH | ل | H | إل | ل | MH | M | MH | M | H | M | H |
| A10 | H | M | VH | M | ل | H | VH | ل | VL | H | VL | H |
| أ11 | تعلم الآلة | MH | VH | M | ل | H | VH | ل | ل | MH | ل | MH |
| أ12 | تعلم الآلة | MH | تعلم الآلة | تعلم الآلة | ل | MH | VH | ل | ل | M | ل | M |
| أ13 | EH | VH | H | MH | VH | ل | تعلم الآلة | VH | MH | ل | MH | ل |
أهمية المعايير وفقًا لصانع القرار لمحطة طاقة الرياح.
| C1 | C2 | C3 | C4 | C5 | C6 | سي 7 | C8 | سي9 | C10 | سي11 | C12 | |
| صانع القرار | أنا | أنا | أنا | السادس | السادس | السادس | السادس | أنا | أنا | السادس | السادس | السادس |
أداء البدائل وفقًا لصانع القرار لمحطة طاقة الرياح.
| بدائل | C1 | C2 | C3 | C4 | C5 | C6 | C7 | C8 | سي9 | C10 | سي11 | C12 |
| أ1 | EH | تعلم الآلة | H | EH | EH | EH | EH | MH | M | تعلم الآلة | VH | EH |
| A2 | EH | EH | H | M | M | H | M | M | MH | VH | MH | VH |
| A3 | تعلم الآلة | M | MH | H | MH | إل | إل | M | H | MH | H | MH |
| A4 | تعلم الآلة | M | H | VH | H | M | ل | M | إل | H | إل | H |
| A5 | EH | EH | VH | تعلم الآلة | ل | VH | M | تعلم الآلة | H | H | H | H |
| A6 | VL | ل | EH | إل | VH | EH | VH | إل | H | MH | H | MH |
| أ7 | ل | MH | M | M | M | ل | ل | M | VH | M | VH | M |
| أ8 | ل | ل | M | M | VH | ل | إل | M | H | M | H | M |
| أ9 | EH | ل | H | إل | ل | MH | M | MH | M | H | M | H |
| A10 | H | M | VH | M | ل | H | VH | ل | VL | H | VL | H |
| أ11 | تعلم الآلة | MH | VH | M | ل | H | VH | ل | ل | MH | ل | MH |
| أ12 | تعلم الآلة | MH | تعلم الآلة | تعلم الآلة | ل | MH | VH | ل | ل | M | ل | M |
| أ13 | EH | VH | H | MH | VH | ل | تعلم الآلة | VH | MH | ل | MH | ل |
للنبات الريحي المسافات الإيجابية والسلبية، ومعاملات القرب وترتيب البدائل.
| بدائل | المثالي الإيجابي | المثالي السلبي | معاملات القرب | رتبة |
| أ1 | 0.2350 | 0.5986 | 0.7181 | ٧ |
| A2 | 0.2239 | 0.6133 | 0.7325 | ٥ |
| A4 | 0.2866 | 0.5533 | 0.6588 | 11 |
| A5 | 0.2202 | 0.6136 | 0.7360 | ٤ |
| A6 | 0.1832 | 0.6409 | 0.7777 | 2 |
| أ9 | 0.2647 | 0.5627 | 0.6504 | 10 |
| A10 | 0.3030 | 0.5254 | 0.6186 | 12 |
| أ12 | 0.2317 | 0.6047 | 0.7230 | ٦ |
| أ11 | 0.2072 | 0.6281 | 0.7520 | ٣ |
| أ8 | 0.2550 | 0.5803 | 0.6847 | ٨ |
| أ7 | 0.2572 | 0.5770 | 0.6817 | 9 |
| A3 | 0.1275 | 0.5770 | 0.8476 | 1 |
للمحطة الشمسية الكهروضوئية، المسافات الإيجابية والسلبية، معاملات القرب وترتيب البدائل.
| بدائل | المثالي الإيجابي | المثالي السلبي | معاملات القرب | رتبة |
| أ11 | 0.3519 | 0.4874 | 0.5807 | 9 |
| A10 | 0.2866 | 0.5533 | 0.6588 | ٤ |
| A5 | 0.4031 | 0.4342 | 0.5186 | 12 |
| A2 | 0.3828 | 0.4530 | 0.5420 | 11 |
| أ8 | 0.3356 | 0.5020 | 0.5993 | ٨ |
| A1 | 0.2767 | 0.5627 | 0.6704 | ٣ |
| A3 | 0.2550 | 0.5803 | 0.6947 | 1 |
| A7 | 0.3030 | 0.5354 | 0.6386 | ٥ |
| أ12 | 0.3015 | 0.5257 | 0.6356 | ٦ |
| أ9 | 0.2572 | 0.5770 | 0.6917 | 2 |
| A4 | 0.3326 | 0.5090 | 0.6048 | ٧ |
| A6 | 0.3646 | 0.4764 | 0.5665 | 10 |
4.3. النتائج التجريبية
نتائج ضبابية حدسية للطاقة الشمسية وطاقة الرياح.
| المواقع | طاقة الرياح | الطاقة الشمسية | متوسط | |||
| نتيجة | رتبة | نتيجة | رتبة | متوسط | رتبة | |
| A1 | 0,7181 | ٧ | 0,6704 | ٣ | 0,69425 | 2 |
| A2 | 0,7325 | 5 | 0.542 | 11 | 0.63725 | 10 |
| A3 | 0.8476 | 1 | 0.6947 | 1 | 0.7431 | 1 |
| A4 | 0.6588 | 11 | 0.6048 | 7 | 0.6318 | 11 |
| A5 | 0.736 | 4 | 0.5186 | 12 | 0.6273 | 12 |
| A6 | 0.7777 | 2 | 0.5665 | 10 | 0.6721 | 5 |
| A7 | 0.6817 | 9 | 0.6386 | 5 | 0.6882 | 3 |
| A8 | 0.6847 | 8 | 0.5993 | 8 | 0.642 | 8 |
| A9 | 0.6504 | 10 | 0.6917 | 2 | 0.67105 | 6 |
| A10 | 0.6186 | 12 | 0.6588 | 4 | 0.6387 | 9 |
| A11 | 0.752 | 3 | 0.5807 | 9 | 0.66635 | 7 |
| A12 | 0.723 | 6 | 0.6356 | 6 | 0.6793 | 4 |
تظهر الخرائط، أن ملاءمة تركيب محطة الطاقة الشمسية-الرياح المثلى لها قيمة مساحة تبلغ 34875.8 كم2. وهذا يؤدي إلى حوالي
5. المناقشة
6. الاستنتاج
تقنية الرسم البياني التي تم الحصول عليها في GIS. أيضًا، وفقًا للأشكال المقدمة في هذه الدراسة (الأشكال 16-18)، من الواضح أننا قدمنا خرائط ملائمة ومثلى للطاقة الشمسية والرياح. تختلف منطقة فريزلاند كأكثر المناطق ملاءمة لتركيب محطات الطاقة الشمسية-الرياح المثلى. حسب علم المؤلفين، هذه واحدة من أولى الدراسات الشاملة في السياق الهولندي. مع تضمين أدبيات هذا الكتاب، يتم تحقيق فوائد أكثر أهمية في تركيب محطات الطاقة الشمسية (SPP) ومحطات الطاقة الريحية (WPP). يتم تقييم توسيع مرحلة تركيب SPP وWPP، والنموذج، والحجم، والعلاقة مع البيئة الطبيعية لـ SPP وWPP المخطط لها بالتفصيل. بالإضافة إلى ذلك، يجب أيضًا تسجيل حريات قطع الأراضي على أرض SPPs في المناطق المسجلة كمناسبة لتركيب SPPs وWPPs. تؤكد هذه الدراسة أيضًا على أن طرق GIS وخيارات النظام قوية جدًا في وظائف خرائط الأرض. أولاً، يمكن توسيع منطقة التطبيق من خلال تحليل المناطق الحالية في أوروبا. ثانيًا، في نهج GIS وفازي الحدسي، يمكن تحليل البيانات غير الدقيقة بشكل مرضي، وتحليلها بشكل أفضل وفصلها للحصول على نتائج أكثر موثوقية. أخيرًا، يمكن تحويل المشكلة إلى مشكلة تغيير متعددة الأهداف، حيث يمكن معالجة هدفين في وقت واحد.
جميع التصريحات
الموافقة الأخلاقية والإذن بالمشاركة
إذن الإصدار
التمويل
بيان مساهمة مؤلف CRediT
إعلان عن تضارب المصالح
توفر البيانات
References
[2] CBS, Renewable electricity share up by 20 percent in 2022, https://www.cbs.nl/en -gb/news/2023/10/renewable-electricity-share-up-by-20-percent-in-2022, 2023.
[3] Q. Hang, Z. Jun, Y. Xiao, C. Junkui, Prospect of concentrating solar power in China-the sustainable future, Renew. Sustain. Energy Rev. 12 (2008) 2505-2514.
[4] J.M. Sánchez-Lozano, J. Teruel-Solano, P. Soto-Elvira, M.S. García-Cascales, Geographical information systems (GIS) and multi-criteria decision making (MCDM) methods for the evaluation of solar farms locations: case study in southeastern Spain, Renew. Sustain. Energy Rev. 24 (2013) 544-556.
[5] H.A. Effat, Selection of potential sites for solar energy farms in Ismailia Governorate, Egypt using SRTM and Multicriteria Analysis, International Journal of Advanced Remote Sensing and GIS 2 (1) (2013) 205-220.
[6] N.S. Nortier, K. Lowenthal, S.L. Luxembourg, A. van der Neut, A.A. Mewe, W.G.J. H.M. van Sark, Spatially resolved generation profiles for onshore and offshore wind turbines: a case study of four Dutch energy transition scenarios, Renewable and Sustainable Energy Transition 2 (2022) 10037.
[7] N.S. Nortier, M. Paardekooper, C. Lucas, A. Blankert, A. van der Neut, S. L. Luxembourg, A.A. Mewe, W.G.J.H.M. van Sark, Spatially resolved generation profiles for building, land and water-bound PV: a case study of four Dutch energy transition scenarios, ADGEO 58 (2023) 199-216.
[8] J. Suh, J.R.S. Brownson, Solar farm suitability using geographic information system fuzzy sets and analytic hierarchy processes:Case study of Ulleung Island, Korea Energies 9 (2016) 648.
[9] H.Z. Al Garni, A. Awasthi, Solar PV power plant site selection using a GIS-AHP based approach with application in Saudi Arabia, Appl. Energy 206 (2017) 1225-1240.
[10] B. Yuan, J.G. Kor, Fuzzy Sets and Fuzzy Logic Theory and Aplications, 1994. New York.
[11] K. Atanassov, Intuitionistic fuzzy sets, Fuzzy Set Syst. (20) (1986) 87-96.
[12] L.A. Zadeh, Fuzzy sets, Inf. Control 8 (1965) (1965) 338-353.
[13] H. Tanaka, S. Uejima, K. Asai, Linear regression analysis with fuzzy model, IEEE Systems, Trans. Systems Man Cybernet. SMC- 2 (1982) 903-907.
[14] J. Nowaková, M. Pokorný, Mathematics, computer science. 12th IFAC Conference on programmable devices and embedded systems the international federation of automatic control September 25-27, Fuzzy Linear Regression Analysis, in: 2013. Velke Karlovice, Czech Republic, 2013.
[15] T. Kaya, Bulanık Regresyon ve Ekonometrik Bir Uygulama (fuzzy regression and an Econometric application). Çukurova Üniversitesi, Sosyal Bilimler Enstitüsü, Yayımlanmamış Yüksek Lisans Tezi (2014).
[16] K. Chan, U. Engelke, Fuzzy Regression for Perceptual İmage Quality Assessment. Engineering Applications of Artificial Intelligence, 2015, p. 43.
[17] L. Chen, S. Nien, A new approach to formulate fuzzy regression models, Appl. Soft Comput. 86 (2020).
[18] J. Li, W. Zeng, J. Xie, Q. Yin, A New Fuzzy Regression Model Based on Least Absolute Deviation, vol. 52, Engineering Applications of Artificial Intelligence, 2016, pp. 54-64.
[19] K.A. Wiguna, R. Sarno, N.F. Ariyani, Optimization Solar Farm Site Selection Using Multi-Criteria Decision Making Fuzzy AHP and PROMETHEE: Case Study in Bali, 2016 International Conference on Information & Communication Technology and Systems (ICTS), Surabaya, 2016, pp. 237-243.
[20] A. Asakereh, M. Soleymani, M.J. Sheikhdavoodi, A GIS-based Fuzzy-AHP method for the evaluation of solar farms locations: case study in Khuzestan province, Iran, Sol. Energy 155 (2017) 342-353.
[21] Y. Lin, Z. Ma, K. Zhao, W. Hu, J. Wei, The impact of population migration on urban housing prices: evidence from China’s major cities, Sustainability 10 (3169) (2018) 1-14.
[22] H. Yousefi, H. Hamed, Y.S. Amin, Spatial site selection for solar power plants using a GIS-based Boolean-fuzzy logic model: a case study of Markazi province, Iran, Energies 11 (2018) 1648, https://doi.org/10.3390/en11071648.
[23] Y.A. Solangi, S.A.A. Shah, H. Zameer, et al., Assessing the solar PV power project site selection in Pakistan: based on AHP-fuzzy VIKOR approach, Environ. Sci. Pollut. Res. 26 (2019) 30286-30302.
[24] A.P. Vavatsikos, A. Arvanitidou, D. Petsas, Wind farm investments portfolio formation using GIS-based suitability analysis and simulation procedures, J. Environ. Manag. (2019).
[25] H. Garg, Novel intuitionistic fuzzy decision making method based on an improved operation laws and its application, Eng. Appl. Artif. Intell. 60 (2017) 164-174. ISSN 0952-1976.
[26] C. Kahraman, I. Otay, Solar PV power plant location selection using a z-fuzzy number based AHP, International Journal of the Analytic Hierarchy Process 10 (3) (2018).
[27] L. De Santoli, F. Mancini, D.A. Garcia, A GIS-Based Model to Assess Electric Energy Consumptions and Useable Renewable Energy Potential in Lazio Region at Municipality Scale, Sustainable Cities and Society46, 2019.
[28] S. Geng, L. Lin, L. Zhang, X. Liu, Z. Huang, Site selection framework of fishing photovoltaic hybrid project under interval-valued intuitionistic fuzzy environment, J. Clean. Prod. 252 (2020).
[29] H.D. Parker, The Unique Qualities of geographic information system: a commentary, Photgrammetric Engeneering And Remote Sensing 54 (11) (1988) 1547-1549.
[30] K. Dueker, Land resource information systems: a review of fifteen years experience, Geo Process. 1 (1979) 105-128.
[31] P.A. Burrough, Principles of Geographic Systems for Land Resources Assessment, Clarendon, Oxford, 1986.
[32] I. Heywood, S. Cornelius, S. Carver, An Introduction to Geographical Information Systems, Longman, New York, 1998, pp. 11-12.
[33] C. Fitzpatrick, D.J. Magu1re, GIS in Schools: Infrastructure, Methodology and Role, 2000.
[34] T. Yomralıoğlu, Coğrafi Bilgi Sistemleri Temel Kavramlar Ve Uygulamalar (Geographic Information Systems Basic Concepts and Applications), vol. 2, Akademi Kitabevi, 2000. Baskı.
[35] M. Kawabata, Multidisciplinary cooperation in GIS education: a case study of Us Colleges and universities”, J. Geogr. High Educ. 34 (4) (2010) 493-509.
[36] F. Tuna, Ortaöğretim Coğrafya Derslerinde Proje Tabanlı Öğrenimi Desteklemek Amacı İle Cografi Bilgi Sistemlerinden (CBS) Yararlanma (Utilizing geographic information systems (GIS) to support project-based Learning in secondary education geography lessons). Yayımlanmamış PHD Thesis, Marmara Üniversitesi Eğitim Bilimleri Enstitüsü, 2008. İstanbul.
[37] D. Messaoudi, N. Settou, B. Negrou, B. Settou, GIS based multi-criteria decision making for solar hydrogen production sites selection in Algeria, Int. J. Hydrogen Energy (60) (2019) 31808-31831.
[38] A. Koc, S. Turk, G. Sahin, Multi-criteria of wind-solar site selection problem using a GIS-AHP-based approach with an application in Igdir Province/Turkey, Environ. Sci. Pollut. Control Ser. (31) (2019) 32298-32310.
[39] A.A. Merrouni, F.E. Elalaoui, A. Mezrhab, A. Mezrhab, A. Ghennioui, Large scale PV sites selection by combining GIS and Analytical Hierarchy Process. Case study: eastern Morocco, Renew. Energy 119 (2018) 863-873.
[40] L. Castro-Santos, G.P. Garcia, T. Simões, A. Estanqueiro, Planning of the Installation of Offshore Renewable Energies: A GIS Approach of the Portuguese Roadmap, Renewable Energy132, 2019, pp. 1251-1262.
[41] H.E. Colak, T. Memisoglu, Y. Gercek, Optimal Site Selection for Solar Photovoltaic (PV) Power Plants Using GIS and AHP: A Case Study of Malatya Province, Turkey, Renewable Energy149, 2020, pp. 565-576.
[42] Z. Xu, Intuitionistic fuzzy aggregation operators, IEEE Trans. Fuzzy Syst. 15 (6) (2007) 1179-1187.
[43] A. Garni, Z. Hassan, Anjali Awasthi, Solar PV power plant site selection using a GISAHP based approach with application in Saudi Arabia, in: Applied Energy, vol. 206, Elsevier, 2017, pp. 1225-1240. C.
[44] F. Kaya, G. Gökhan Şahin, M.H. Alma, Investigation effects of environmental and operating factors on PV panel efficiency using by multivariate linear regression, Int. J. Energy Res. 45 (2021) 554-567.
[45] F (b) Sahin, G. Işik, G. Şahin, M.K. Karaa, Estimation of PM10 levels using feed forward neural networks in Igdir, Turkey, Urban Clim. 34 (2020) 100721.
[46] F(a) Sahin, M.K. Kara, A. Koc, G. Sahin, Multi-criteria decision-making using GISAHP for air pollution problem in Igdir Province/Turkey, Environ. Sci. Pollut. Control Ser. 27 (2020) 36215-36230.
[47] D. Arca, Afet Yönetiminde Coğrafi Bilgi Sistemleri ve Uzaktan Algılama, Karaelmas Fen ve Mühendislik Dergisi 2 (ss) (2012) 53-61.
[48] H. Liu, D. Sun, Y. Yu, H. Wang, Y. Liu, Q. Liu, Y. Du, H. Wang, B. Cao, Evalution of the VIIRS and MODIS LST products in an arid area of northwest China, Remote Sens. Environ. 142 (2014) 111-121.
[49] R. Bayar, K. ve Karabacak, Ankara İli Arazi Örtüsü Değişimi (2000-2012)(Ankara province land cover change (2000-2012)), Cografi Bilimler Dergisi 15 (1) (2017) 59-76.
[50] Ü.D. Yüksel, O. ve Yılmaz, Ankara Kentinde Kentsel Isi Adasi Etkisinin Yaz Aylarinda Uzaktan Algilama Ve Meteorolojik Gözlemlere Dayali Olarak Saptanmasi Ve Değerlendirilmesi, Gazi Üniv, Müh. Mim. Fak. Der. Cilt 23 (No 4) (2008) 937-952, 2008.
[51] E. Özelkan, S. Bagis, E.C. Ozelkan, B.B. Üstündağ, M. Yücel, C. ve Ormeci, Spatial Interpolation of climatic, Avrupa Bilim ve Teknoloji Dergisi e-ISSN: 2148-2683948 variables using land surface temperature and Modified inverse distance weighting, Int. J. Rem. Sens. 36 (2015) 1000-1025.
[52] Q. Weng, Thermal infrared remote sensing for urban climate and environmental studies: methods applicaitons, and trends, ISPRS J. Photogramm 64 (2009) 335-344.
[53] R. Hamdi, Estimating urban heat island effects on the temperature series of Uccle (Brussels, Belgium) using remote sensing data and a land surface scheme, Remote Sens 2 (2010) 2773-2784.
[54] L. Liu, Y. ve Zhang, Urban heat island analysis using the Landsat TM data and Aster data: a case study in Hong Kong, Remote Sens 3 (2011) 1535-1552.
[55] J. Zhou, Y. Chen, J. Wang, W. Zhan, Maximum nighttime urban heat island (UHI) intensity simulation by integrating remotely sensed data and meteorological observations, IEEE J. Sel. Top. Appl. Earth Obs. Rem. Sens. 4 (2011) 138-146.
[56] A. Sekertekin, S. ve Bonafoni, Land surface temperature retrieval from Landsat 5, 7, and 8 over rural areas: assessment of different retrieval algorithms and emissivity models and toolbox implementation, Rem. Sens. (2020).
[57] A. Sekertekin, Ş.H. Kutluoglu, S. Kaya, A.M. Marangoz, Uydu Verileri Ile Arazi Örtüsündeki Yer Yüzey Sıcaklığı Değişimlerinin Analizi: Zonguldak Örneği, Türkiye, TMMOB Harita Ve Kadastro Mühendisleri Odası (Analysis of Ground Surface Temperature Changes in the Land Cover with Satellite Data: the Case of Zonguldak, Turkey, TMMOB Chamber of Surveying and Cadastre Engineers), 15, Türkiye Harita Bilimsel ve Teknik Kurultayı, Ankara, 2015, p. 25. -28 Mart 2015.
[58] B. Çelik, Yeryüzü Sıcaklıklarının Uzaktan Algılama Tekniği Ile Belirlenmesi: TekKanal Yöntemleri (Determination of Earth Temperatures by Remote Sensing Technique: Single-Channel Methods), İstanbul Teknik Üniversitesi Yüksek Lisans Tezi, 2013.
[59] J.C. Price, The Contribution of Thermal Data in Landsat Multispectral Classifacition, Photo, English Remote Sensing, 1981.
[60] A. Chedin, N.A. Scott, C. Whacihe, P. ve Moulinier, The improved initialisation inversion method: a high resolution physical method for temperature retrievals from the TIROS-N series, J. Clim. Appl. Meteorol. (1985).
[61] M. Ozcan, A.K. Caliskan, Engineering management program EM 599 – TERM PROJECT, fina report. Site Selection for Wind-Solar Hybrit Power Plant in Turkey, Middle East Technical University industrial department, 2017.
[62] S. Turk, A. Koc, G. Sahin, Multi-criteria of PV solar site selection problem using GIS-intuitionistic fuzzy based approach in Erzurum province/Turkey, Scientifc Reports 11 (2021) 5034.
- Corresponding author.
E-mail address: g.sahin@uu.nl (G. Şahin).
DOI: https://doi.org/10.1016/j.esr.2024.101307
Publication Date: 2024-01-01
Multi-criteria decision making for solar power – Wind power plant site selection using a GIS-intuitionistic fuzzy-based approach with an application in the Netherlands
A R T I C L E I N F O
Keywords:
Geographical information systems (GIS)
Intuitionistic fuzzy
Multi-criteria decision-making
Solar power plant siting map
Wind power plant siting map
Solar-wind optimal siting map
Abstract
The development of a country cannot be realized only through the amount of energy it produces and its industrialization. In a country where its people are left homeless and poor, and its cultural and natural riches are destroyed, the electricity produced is not a measure of development on its own. Development and progress must be considered from a holistic perspective that includes the country’s geographical structure, all its living creatures, culture, urban and social structure as a whole. In this respect, the transition to renewable energy is imperative. One of the most widely used renewable energies in the Netherlands is solar and wind energy. For these power plants, site selection is an important factor in reducing the installation cost of the wind and solar power plant and achieving maximum efficiency during operation. This paves the way for the study of a site selection problem. In this study, we first investigate possible locations for solar-wind power plant installation for 12 regions of the Netherlands, namely Noord Holland, Gelderland, Friesland, North Brabant, Drenthe, Groningen, Zeeland (Middelburg), Utrecht, Zuid Holland, Limburg, Over Ijssel and Flevoland, using GIS as a mapping method, and then apply a Intuitionistic fuzzy-based approach to the problem to obtain the optimal locations for both solar and wind energy. Furthermore, the results of two methods (GIS and Intuitionistic fuzzy-based approach) are compared to obtain more accurate results. The results show that
1. Introduction
increased by
[8] investigated the suitability of Korea’s Ulleung Island for solar farms using GIS in combination with fuzzy sets. This allows to support and analyse decision-making processes [9]. stated that while systems in engineering and other branches of science are modeled according to the principles of precise mathematical methods, a new way is sought for solving problems due to the uncertainty of decision-making processes. It is defined as creating decision systems that can use and make choices according to the situation [10]. describes the concepts of fuzzy logic, such as that the definitions containing “a little”, are not fully understood among people. It is defined as ensuring that logic processes are executed more successfully than computer systems [11]. defined the concept of Intuitive Fuzzy Set (IFS) as a generalization of the concept of fuzzy set in his study. The first information about the concept of fuzzy and its principles was put forward by Lütfi [12]. [13] proposed the first application in fuzzy regression with their study in 1982. The analysis was performed using linear programming technique [14]. stated in their study that the linear fuzzy regression model is a more appropriate method [15]. in his study explained the fuzzy regression model developed by fuzzy logic and fuzzy logic [16]. proposed a fuzzy regression method that explains the blurring that may occur when blurring due to human judgment is not taken into consideration in the methods for subjective image quality assessment (IQA) [17]. proposed the FPC operator used for constraints in a mathematical programming problem to formulate fuzzy linear regression models with fuzzy parameters using fuzzy observations [18]. studied the elements of heuristic fuzzy sets that have a membership degree and a non-membership degree whose sum is
2. Background
2.1. Mapping technique, GIS
2.2. Fuzzy set
2.2.1. Intuitionistic fuzzy sets
for two functions;
(2) exists:
Step 2. Calculating Criterion Weights
Step 3. Build Weighted Average Values for Each Alternative
Step 4. Ranking the Alternatives
3. Methodology
3.1. Criteria for decision making
(C1) Slope: The slope characteristics of the topography are an important factor for RES installation (see Fig. 1). In wind power plant (WPP) suitable location selection, the slope should not exceed
(C2) Aspect: Aspect is the position of any place relative to the sun, also denoted to as orientation. It refers to the position of the slopes of the mountains relative to the sun. In the Netherlands no mountains exist, but some hilly regions can be found. With these features it provides, it is important in terms of renewable energy [43] Ozcan M.et al., 2017 [38]; Türket al. 2020; Turk et al., 2021, [44]. For the Netherlands, Fig. 3 shows the aspect map.
(C3) Solar irradiation: Solar radiation is one of the most important parameters for solar and wind energy. Solar radiation is the radiant energy that is generally emitted to the environment within a certain period of time. The unit of radiant energy falling on the unit surface is (joule/square meter,
(C4) Land use: Land use is the regulation of how the land in a country or region is to be used, protected and managed. Land use aims to protect the economic, social and environmental interests of the land in a balanced way. Land use includes the protection of the natural resources
of the land, the planning of land use, agriculture, forestry, tourism, energy production, transportation, determination of renewable energy areas and other economic activities in accordance with land use [43] Ozcan M.et al., 2017 [38]; Türket al. 2020; Turk et al., 2021, [44]. Fig. 5 shows the map of the Netherlands in terms of land use.
(C5) Wind speed: Horizontal directional air movements moving from areas of high pressure to areas of low pressure are called winds. In other words, the wind is formed due to the pressure difference between two points and the wind continues to blow until this pressure difference decreases. The device that measures wind speed is called anemometer [43] Ozcan M.et al., 2017; Koç A et al., 2019; Türket al. 2020; Turk et al., 2021, [44]. The annual average wind speed map of the Netherlands is demonstrated in Fig. 6.
(C6) Air Temperature: The average (kinetic energy of a particle) of the kinetic energies of the particles that make up a substance is called temperature. Since the particles that make up matter transfer their kinetic energies as a result of collision with each other, the kinetic energy of each particle is different and when they hit each other, their kinetic energies change constantly. Since the kinetic energies of the particles of the substance at the same temperature are different, the temperature is the average of the kinetic energies of all of the particles, not a single particle. Air circulation in hot places with sun result when the panel temperature decreases energy production and efficiency increase, air circulation energy production and it was determined that the efficiency decreased (Homadi, 2016). After the air temperature maps of the study area were obtained from “Global Atlas” numerically, they were used in Arc-GIS 10.2 package program to form a structure compatible with the working scale by reclassification on the Reclass button in the Spatial Analyst Tool module [43] Ozcan M.et al., 2017 [38]; Türket al. 2020;
Suitable location for Solar Power Plant Scoring values created by experts for each layer [61]; Ozdemir S. et al., 2018; A. Tunc et al., 2019 [38].
| Energy Types | Evaluation factor | Selected sub-units | Relevance Number |
| Solar | Elevation |
|
4 |
| Energy |
|
1 | |
|
|
1 | ||
|
|
1 | ||
| Slope | Flat | 4 | |
| Slightly sloping | 4 | ||
| Sloping | 3 | ||
| Very Sloping | 1 | ||
| Land cover | Industrial Commercial and Transports | 1 | |
| Mine and Construction Areas | 1 | ||
| Non-Agricultural | 2 | ||
| Fields Suitable for | 1 | ||
| Continuous Products | 1 | ||
| Pasture Area | 3 | ||
| Heterogeneous | 1 | ||
| Agricultural areas | |||
| Forests | 1 | ||
| Shrubbery Areas | 2 | ||
| Areas Without Vegetation | 3 | ||
| Interior Wet Areas | 1 | ||
| Wet Areas Near the Shore | 1 | ||
| Inland Waters | 1 | ||
| Water surfaces | 1 | ||
| Grassland | 4 | ||
| Farmland | 1 | ||
| Natural meadows | 4 | ||
| Infrastructure of cities | 1 | ||
| Aspect | North | 1 | |
| Northeast | 1 | ||
| East | 2 | ||
| Suoutheast | 2 | ||
| South | 4 | ||
| Southwest | 3 | ||
| West | 1 | ||
| Northwest | 1 | ||
| Inclination | Flat (0-2%) | 1 | |
| Slightly inclined (2-6%) | 1 | ||
| Middle (6-12 %) | 1 | ||
| Steep (12-20 %) | 1 | ||
| Very Steep (20-30 %) | 1 | ||
| scarped 30+%) | 1 | ||
| Solar irradiation
|
Irradiation Excess >1100 | 4 | |
| kWh/m2 | |||
| Irradiation Too | 3 | ||
| Irradiation Normal | 2 | ||
|
|
|||
| Irradiation Low <950 | 1 | ||
| kWh/m2 | |||
| Air Temperature | Hot | 2 | |
| A Bit Hot | 4 | ||
| Normal | 4 | ||
| Cool | 2 | ||
| (distance to) |
|
4 | |
|
|
3 | ||
|
|
2 | ||
|
|
1 | ||
|
|
1 | ||
| Hard Wind (10-12) | 3 | ||
| Windy (8-10) | 4 | ||
| Wind Light (5-8) | 4 | ||
| No Wind or Low (0-5) | 1 | ||
| Air Pressure | High | 4 | |
| Normal | 3 | ||
| Low | 2 | ||
| Very Low | 1 | ||
| Air Humidity | High | 1 | |
| Normal | 2 | ||
| Energy Types | Evaluation factor | Selected sub-units | Relevance Number |
| Low | 3 | ||
| Very Low | 4 | ||
| Land Surface | Very Hot | 1 | |
| Temperature (LST) | Hot | 2 | |
| Normal | 3 | ||
| Cool | 4 | ||
| Transportation |
|
4 | |
| Network |
|
4 | |
|
|
3 | ||
|
|
2 | ||
|
|
1 |
(C7) Air Pressure: The water vapor carried by the air is called humidity. The amount of moisture, that is, water vapor, that the air can carry varies with temperature and pressure. An increase in temperature increases the amount of moisture that can be transported. Moisture maps of the study area were obtained by digitizing the point data obtained from stations in 12 different locations in the Arc-GIS 10.2 package program and using the “Kriging” method in the Geostatistical Analyst module (Sahin F et al., 2020). Fig. 8 shows the result.
(C8) Air Humidity: The gases surrounding the earth have a weight. The force exerted by the gases forming the atmosphere on the earth under the influence of gravity is called air pressure. The Air Pressure map was digitized in the Arc-GIS 10.2 package program and obtained using the “Kriging” method in the Geostatistical Analyst module [45,46], see Fig. 9.
(C9) Land Surface Temperature: Land surface temperatures are an important parameter in terms of climate and are used in climate models. It is successfully used to determine the land surface temperature (LST) values and changes and to investigate their effects [34,47,48]. Land Surface Temperature differs according to land cover and usage and is frequently used in determining the changes in the land [49]. Urban heat island [50], climate [51], agriculture (Özelkan, 2014), drought, forestry, maritime and in many other studies, LST data is an important and effective data source [52-55]. In order to calculate the LST value successfully, data such as atmospheric effects values, sensor parameters, and ground surface emissivity are needed to assist in the calculation of LMS [56]. Single-channel, Multi-angle, Multi-channel, Split Window methods are used in the calculation of LST [57]. In the single channel method, the radiation change on the earth emitted from the atmosphere is directly proportional to the data detected in two different channels. In this way, atmospheric effect and surface radiation values can be reached [58]. Atmospheric temperature, humidity, water vapor and brightness temperature values obtained from thermal satellite images are used [59, 60]. Land surface temperatures ranging from
Suitable location for Wind Power Plant Scoring values created by experts for each layer [61]; Ozdemir S. et al., 2018; A. Tunc et al., 2019 [38].
| Energy Types | Evaluation factor | Selected sub-units | Relevance Number |
| Wind | Elevation |
|
2 |
| Energy |
|
3 | |
|
|
4 | ||
|
|
4 | ||
| Slope | Flat | 4 | |
| Slightly sloping | 4 | ||
| Sloping | 3 | ||
| Very Sloping | 1 | ||
| Land cover | Industrial Commercial and | 1 | |
| Mine and Construction | 1 | ||
| Non-Agricultural Artificial | 2 | ||
| Fields Suitable for | 1 | ||
| Continuous Products | 1 | ||
| Pasture Area | 3 | ||
| Heterogeneous | 1 | ||
| Agricultural areas | |||
| Forests | 1 | ||
| Shrubbery Areas | 2 | ||
| Areas Without Vegetation | 3 | ||
| Interior Wet Areas | 1 | ||
| Wet Areas Near the Shore | 1 | ||
| Inland Waters | 1 | ||
| Water surfaces | 1 | ||
| Grassland | 4 | ||
| Farmland | 1 | ||
| Natural meadows | 4 | ||
| Infrastructure of cities | 1 | ||
| Aspect | North | 1 | |
| Northeast | 2 | ||
| East | 4 | ||
| Suoutheast | 2 | ||
| South | 1 | ||
| Southwest | 1 | ||
| West | 4 | ||
| Northwest | 2 | ||
| Inclination | Flat (%0-2) | 4 | |
| Slightly inclined (%2-6) | 4 | ||
| Middle (%6-12) | 4 | ||
| Steep (%12-20) | 4 | ||
| Very Steep (%20-30) | 4 | ||
| scarped (%30+) | 4 | ||
| Solar irradiation | Irradiation Excess | 4 | |
| Irradiation Too 42000000 – | 3 | ||
| Irradiation | 3 | ||
| Normal3000000-1000W/ m2000 | |||
| Irradiation Low <100000 | 1 | ||
| W/m2 | |||
| Air Temperature | Hot | 2 | |
| A Bit Hot | 4 | ||
| Normal | 4 | ||
| Cool | 2 | ||
| Transmission Line |
|
4 | |
|
|
3 | ||
|
|
2 | ||
|
|
1 | ||
|
|
1 | ||
| Avarage of wind speed | Hard Wind (10-12) | 4 | |
| Windly (8-10) | 4 | ||
| Wind Light (5-8) | 4 | ||
| No Wind or Low (0-5) | 1 | ||
| High | 4 | ||
| Normal | 3 | ||
| Low | 2 | ||
| Very Low | 1 | ||
| High | 1 | ||
| Energy | Evaluation factor | Selected sub-units | Relevance |
| Types | Number | ||
| Normal | 2 | ||
| Low | 3 | ||
| Very Low | 4 | ||
| Land Surface | So Hot | 1 | |
| Temperature (LST) | Hot | 1 | |
| Normal | 1 | ||
| Cool | 1 | ||
| Transportation |
|
4 | |
| Network |
|
4 | |
|
|
3 | ||
|
|
2 | ||
|
|
1 |
In the second step, another equation was used to convert the atmospheric irradiance value to the sensor temperature (Chander and Markham, 2003).
NDVI= Normalized plant density index maps.
In the other part of the study, the calculation of the vegetation ratio was made. The following equation was used to calculate the vegetation ratio (Landsat; Zanter, 2016).
In the last stage of the study, maps of surface temperature (LST) were created with a minimum margin of error.
(C10) Transmission line: Today, the most useful and economical type of energy is undoubtedly electrical energy. The demand for electrical energy, which started to be used for lighting purposes towards the end of the 19th century, reached enormous dimensions in the following years. This situation has made the need to transport energy mandatory and therefore energy transmission lines have been used. These are the lines that transmit the electrical energy obtained in a controlled and planned manner from the power plants to the distribution lines. The centers producing electrical energy (hydroelectric power plants, thermal power plants, natural gas cycle power plants, wind power plants, etc.) cannot be established near the consumption centers. Among the most important reasons for this are difficulties in raw material transportation, environmental pollution, safety, etc. The electrical energy produced will be transported many kilometers away. At this point, the importance of energy transmission lines is evident as new solar and wind parks should
Linguistic variables for evaluating each criterion (Mondal&Pramanik, 2004; [62].
| Linguistic variables | IFNs
|
| Very important (VI) |
|
| Important (I) |
|
| Medium (M) |
|
| Unimportant (U) |
|
| Very unimportant (VU) |
|
Importance of criteria according to the decision-maker for Solar power plant.
| C1 | C2 | C3 | C4 | C5 | C6 | C7 | C8 | C9 | C10 | C11 | C12 | |
| Decision Maker | I | I | I | VI | I | VI | I | VI | VI | VI | I | I |
Linguistic variables for evaluating each alternative (Mondal&Pramanik, 2004; [62].
| Linguistic variables | IFNs (
|
| Extreme high(EH) | (0.95,0.05,0.00) |
| Very high(VH) | (0.85,0.10,0.05) |
| High(H) | (0.75,0.15,0.10) |
| Medium high(MH) | (0.65,0.25,0.10) |
| Medium(M) | (0.50,0.40,0.10) |
| Medium low(ML) | (0.35,0.55,0.10) |
| Low(L) | (0.25,0.65,0.10) |
| Very low(VL) | (0.15,0.80,0.05) |
| Extreme low(EL) | (0.05,0.95,0.00) |
(C11) Transportation Network: A long strip of hard surface used in road transportation. It may be formed by natural causes or man-made. It helps human, animal and vehicular traffic to progress quickly, easily and safely. Roads vary greatly, from footpaths created by footprints on rough terrain to multi-lane highways. Fig. 13 shows Dutch road infrastructure.
(C12) Elevation: Elevation is related to the wind speed. The vertical distance of a point of the earth from the sea level is called altitude or elevation. The elevation influences the performance of wind power as a result of an increase in wind speed (Abdulrahman,2016). Netherlands Elevation maps
4. Result and discussion
4.1. Applying GIS
areas) by giving a score between 1 and 4, the data were overlaid and a map of suitable and unsuitable areas for WPP and SPP (masking map) was obtained. Then, with the help of expert opinions, the criteria were ranked according to their importance and their weights were determined by GIS-intuitionistic fuzzy-based approach. All data were subjected to reclassification process and overlapped with the determined weights as shown in Fig. 15 in order to classify the suitable areas within themselves. This process was repeated once more with equal weighting of the criteria for a different perspective and comparison. Finally, the weighted overlap maps were overlaid with the masking map to obtain the final suitability maps, Figs. 16-18. The final suitability maps are presented in two different ways, firstly according to the weights determined by the GIS- intuitionistic fuzzy-based approach, and secondly by considering the criteria as equally weighted, and the results are interpreted.
4.2. Applying intuitionistic fuzzy to potential locations
*Fuzzy membership functions.
Performance of alternatives according to the decision-maker for Solar power plant.
| Alternatives | C1 | C2 | C3 | C4 | C5 | C6 | C7 | C8 | C9 | C10 | C11 | C12 |
| A1 | EH | EH | EH | M | L | MH | M | H | H | VH | MH | M |
| A2 | EH | EH | H | M | M | H | M | M | MH | VH | MH | VH |
| A3 | ML | M | MH | H | MH | EL | EL | M | H | MH | H | MH |
| A4 | ML | M | H | VH | H | M | L | M | EL | H | EL | H |
| A5 | EH | EH | VH | ML | L | VH | M | ML | H | H | H | H |
| A6 | VL | L | EH | EL | VH | EH | VH | EL | H | MH | H | MH |
| A7 | L | MH | M | M | M | L | L | M | VH | M | VH | M |
| A8 | L | L | M | M | VH | L | EL | M | H | M | H | M |
| A9 | EH | L | H | EL | L | MH | M | MH | M | H | M | H |
| A10 | H | M | VH | M | L | H | VH | L | VL | H | VL | H |
| A11 | ML | MH | VH | M | L | H | VH | L | L | MH | L | MH |
| A12 | ML | MH | ML | ML | L | MH | VH | L | L | M | L | M |
| A13 | EH | VH | H | MH | VH | L | ML | VH | MH | L | MH | L |
Importance of criteria according to the decision-maker for Wind power plant.
| C1 | C2 | C3 | C4 | C5 | C6 | C7 | C8 | C9 | C10 | C11 | C12 | |
| Decision Maker | I | I | I | VI | VI | VI | VI | I | I | VI | VI | VI |
Performance of alternatives according to the decision-maker for Wind power plant.
| Alternatives | C1 | C2 | C3 | C4 | C5 | C6 | C7 | C8 | C9 | C10 | C11 | C12 |
| A1 | EH | ML | H | EH | EH | EH | EH | MH | M | ML | VH | EH |
| A2 | EH | EH | H | M | M | H | M | M | MH | VH | MH | VH |
| A3 | ML | M | MH | H | MH | EL | EL | M | H | MH | H | MH |
| A4 | ML | M | H | VH | H | M | L | M | EL | H | EL | H |
| A5 | EH | EH | VH | ML | L | VH | M | ML | H | H | H | H |
| A6 | VL | L | EH | EL | VH | EH | VH | EL | H | MH | H | MH |
| A7 | L | MH | M | M | M | L | L | M | VH | M | VH | M |
| A8 | L | L | M | M | VH | L | EL | M | H | M | H | M |
| A9 | EH | L | H | EL | L | MH | M | MH | M | H | M | H |
| A10 | H | M | VH | M | L | H | VH | L | VL | H | VL | H |
| A11 | ML | MH | VH | M | L | H | VH | L | L | MH | L | MH |
| A12 | ML | MH | ML | ML | L | MH | VH | L | L | M | L | M |
| A13 | EH | VH | H | MH | VH | L | ML | VH | MH | L | MH | L |
For Wind Plant Positive and negative distances, closeness coefficients and the rank of alternatives.
| Alternatives | Positive-ideal | Negative-ideal | Closeness Coefficients | Rank |
| A1 | 0.2350 | 0.5986 | 0.7181 | 7 |
| A2 | 0.2239 | 0.6133 | 0.7325 | 5 |
| A4 | 0.2866 | 0.5533 | 0.6588 | 11 |
| A5 | 0.2202 | 0.6136 | 0.7360 | 4 |
| A6 | 0.1832 | 0.6409 | 0.7777 | 2 |
| A9 | 0.2647 | 0.5627 | 0.6504 | 10 |
| A10 | 0.3030 | 0.5254 | 0.6186 | 12 |
| A12 | 0.2317 | 0.6047 | 0.7230 | 6 |
| A11 | 0.2072 | 0.6281 | 0.7520 | 3 |
| A8 | 0.2550 | 0.5803 | 0.6847 | 8 |
| A7 | 0.2572 | 0.5770 | 0.6817 | 9 |
| A3 | 0.1275 | 0.5770 | 0.8476 | 1 |
For Solar PV Power Plant Positive and negative distances, closeness coefficients and the rank of alternatives.
| Alternatives | Positive-ideal | Negative-ideal | Closeness Coefficients | Rank |
| A11 | 0.3519 | 0.4874 | 0.5807 | 9 |
| A10 | 0.2866 | 0.5533 | 0.6588 | 4 |
| A5 | 0.4031 | 0.4342 | 0.5186 | 12 |
| A2 | 0.3828 | 0.4530 | 0.5420 | 11 |
| A8 | 0.3356 | 0.5020 | 0.5993 | 8 |
| A1 | 0.2767 | 0.5627 | 0.6704 | 3 |
| A3 | 0.2550 | 0.5803 | 0.6947 | 1 |
| A7 | 0.3030 | 0.5354 | 0.6386 | 5 |
| A12 | 0.3015 | 0.5257 | 0.6356 | 6 |
| A9 | 0.2572 | 0.5770 | 0.6917 | 2 |
| A4 | 0.3326 | 0.5090 | 0.6048 | 7 |
| A6 | 0.3646 | 0.4764 | 0.5665 | 10 |
4.3. Experimental results
Intuitionistic Fuzzy results for solar and wind energy.
| Locations | Wind Energy | Solar Energy | Average | |||
| Score | Rank | Score | Rank | Average | Rank | |
| A1 | 0,7181 | 7 | 0,6704 | 3 | 0,69425 | 2 |
| A2 | 0,7325 | 5 | 0,542 | 11 | 0,63725 | 10 |
| A3 | 0,8476 | 1 | 0.6947 | 1 | 0,7431 | 1 |
| A4 | 0,6588 | 11 | 0,6048 | 7 | 0,6318 | 11 |
| A5 | 0,736 | 4 | 0,5186 | 12 | 0,6273 | 12 |
| A6 | 0,7777 | 2 | 0,5665 | 10 | 0,6721 | 5 |
| A7 | 0,6817 | 9 | 0,6386 | 5 | 0,6882 | 3 |
| A8 | 0,6847 | 8 | 0,5993 | 8 | 0,642 | 8 |
| A9 | 0,6504 | 10 | 0,6917 | 2 | 0,67105 | 6 |
| A10 | 0,6186 | 12 | 0,6588 | 4 | 0,6387 | 9 |
| A11 | 0,752 | 3 | 0,5807 | 9 | 0,66635 | 7 |
| A12 | 0,723 | 6 | 0,6356 | 6 | 0,6793 | 4 |
maps, the optimal solar-wind power plant installation suitability has an area value of 34875.8 km 2 . This results in approximately
5. Discussion
6. Conclusion
mapping technique obtained in GIS. Also, according to the figures presented in this study (Figs. 16-18), it is clear that we have provided optimal and suitability maps for solar, wind and energy. The Friesland region varies as the most suitable region for the installation of optimal solar-wind power plants. To the best of the authors’ knowledge, this is one of the first comprehensive studies in the Dutch context. With the inclusion of the literature of this book, more critical profits are gained in the installation of Solar Power Plants (SPP) and Wind Power Plants (WPP). The expansion of the SPP and WPP installation phase, the model, size and relationship with the natural environment of the planned SPP and WPP are evaluated in detail. In addition, the freedoms of the land parcels on the ground of the SPPs in the areas recorded as suitable for the installation of SPPs and WPPs should also be recorded. This study also emphasizes that GIS and regime options methods are very powerful in the functions of ground maps. Firstly, the application area can be extended by analyzing existing areas in Europe. Secondly, in the GIS and Intuitionistic Fuzzy-Based approach, imprecise data can be pathologically analyzed, better analyzed and separated for more reliable results. Finally, the problem can be transformed into a multi-objective change problem, where two objectives can be addressed simultaneously.
All declarations
Ethical approval and permission to participate
Release permission
Financing
CRediT authorship contribution statement
Declaration of competing interest
Data availability
References
[2] CBS, Renewable electricity share up by 20 percent in 2022, https://www.cbs.nl/en -gb/news/2023/10/renewable-electricity-share-up-by-20-percent-in-2022, 2023.
[3] Q. Hang, Z. Jun, Y. Xiao, C. Junkui, Prospect of concentrating solar power in China-the sustainable future, Renew. Sustain. Energy Rev. 12 (2008) 2505-2514.
[4] J.M. Sánchez-Lozano, J. Teruel-Solano, P. Soto-Elvira, M.S. García-Cascales, Geographical information systems (GIS) and multi-criteria decision making (MCDM) methods for the evaluation of solar farms locations: case study in southeastern Spain, Renew. Sustain. Energy Rev. 24 (2013) 544-556.
[5] H.A. Effat, Selection of potential sites for solar energy farms in Ismailia Governorate, Egypt using SRTM and Multicriteria Analysis, International Journal of Advanced Remote Sensing and GIS 2 (1) (2013) 205-220.
[6] N.S. Nortier, K. Lowenthal, S.L. Luxembourg, A. van der Neut, A.A. Mewe, W.G.J. H.M. van Sark, Spatially resolved generation profiles for onshore and offshore wind turbines: a case study of four Dutch energy transition scenarios, Renewable and Sustainable Energy Transition 2 (2022) 10037.
[7] N.S. Nortier, M. Paardekooper, C. Lucas, A. Blankert, A. van der Neut, S. L. Luxembourg, A.A. Mewe, W.G.J.H.M. van Sark, Spatially resolved generation profiles for building, land and water-bound PV: a case study of four Dutch energy transition scenarios, ADGEO 58 (2023) 199-216.
[8] J. Suh, J.R.S. Brownson, Solar farm suitability using geographic information system fuzzy sets and analytic hierarchy processes:Case study of Ulleung Island, Korea Energies 9 (2016) 648.
[9] H.Z. Al Garni, A. Awasthi, Solar PV power plant site selection using a GIS-AHP based approach with application in Saudi Arabia, Appl. Energy 206 (2017) 1225-1240.
[10] B. Yuan, J.G. Kor, Fuzzy Sets and Fuzzy Logic Theory and Aplications, 1994. New York.
[11] K. Atanassov, Intuitionistic fuzzy sets, Fuzzy Set Syst. (20) (1986) 87-96.
[12] L.A. Zadeh, Fuzzy sets, Inf. Control 8 (1965) (1965) 338-353.
[13] H. Tanaka, S. Uejima, K. Asai, Linear regression analysis with fuzzy model, IEEE Systems, Trans. Systems Man Cybernet. SMC- 2 (1982) 903-907.
[14] J. Nowaková, M. Pokorný, Mathematics, computer science. 12th IFAC Conference on programmable devices and embedded systems the international federation of automatic control September 25-27, Fuzzy Linear Regression Analysis, in: 2013. Velke Karlovice, Czech Republic, 2013.
[15] T. Kaya, Bulanık Regresyon ve Ekonometrik Bir Uygulama (fuzzy regression and an Econometric application). Çukurova Üniversitesi, Sosyal Bilimler Enstitüsü, Yayımlanmamış Yüksek Lisans Tezi (2014).
[16] K. Chan, U. Engelke, Fuzzy Regression for Perceptual İmage Quality Assessment. Engineering Applications of Artificial Intelligence, 2015, p. 43.
[17] L. Chen, S. Nien, A new approach to formulate fuzzy regression models, Appl. Soft Comput. 86 (2020).
[18] J. Li, W. Zeng, J. Xie, Q. Yin, A New Fuzzy Regression Model Based on Least Absolute Deviation, vol. 52, Engineering Applications of Artificial Intelligence, 2016, pp. 54-64.
[19] K.A. Wiguna, R. Sarno, N.F. Ariyani, Optimization Solar Farm Site Selection Using Multi-Criteria Decision Making Fuzzy AHP and PROMETHEE: Case Study in Bali, 2016 International Conference on Information & Communication Technology and Systems (ICTS), Surabaya, 2016, pp. 237-243.
[20] A. Asakereh, M. Soleymani, M.J. Sheikhdavoodi, A GIS-based Fuzzy-AHP method for the evaluation of solar farms locations: case study in Khuzestan province, Iran, Sol. Energy 155 (2017) 342-353.
[21] Y. Lin, Z. Ma, K. Zhao, W. Hu, J. Wei, The impact of population migration on urban housing prices: evidence from China’s major cities, Sustainability 10 (3169) (2018) 1-14.
[22] H. Yousefi, H. Hamed, Y.S. Amin, Spatial site selection for solar power plants using a GIS-based Boolean-fuzzy logic model: a case study of Markazi province, Iran, Energies 11 (2018) 1648, https://doi.org/10.3390/en11071648.
[23] Y.A. Solangi, S.A.A. Shah, H. Zameer, et al., Assessing the solar PV power project site selection in Pakistan: based on AHP-fuzzy VIKOR approach, Environ. Sci. Pollut. Res. 26 (2019) 30286-30302.
[24] A.P. Vavatsikos, A. Arvanitidou, D. Petsas, Wind farm investments portfolio formation using GIS-based suitability analysis and simulation procedures, J. Environ. Manag. (2019).
[25] H. Garg, Novel intuitionistic fuzzy decision making method based on an improved operation laws and its application, Eng. Appl. Artif. Intell. 60 (2017) 164-174. ISSN 0952-1976.
[26] C. Kahraman, I. Otay, Solar PV power plant location selection using a z-fuzzy number based AHP, International Journal of the Analytic Hierarchy Process 10 (3) (2018).
[27] L. De Santoli, F. Mancini, D.A. Garcia, A GIS-Based Model to Assess Electric Energy Consumptions and Useable Renewable Energy Potential in Lazio Region at Municipality Scale, Sustainable Cities and Society46, 2019.
[28] S. Geng, L. Lin, L. Zhang, X. Liu, Z. Huang, Site selection framework of fishing photovoltaic hybrid project under interval-valued intuitionistic fuzzy environment, J. Clean. Prod. 252 (2020).
[29] H.D. Parker, The Unique Qualities of geographic information system: a commentary, Photgrammetric Engeneering And Remote Sensing 54 (11) (1988) 1547-1549.
[30] K. Dueker, Land resource information systems: a review of fifteen years experience, Geo Process. 1 (1979) 105-128.
[31] P.A. Burrough, Principles of Geographic Systems for Land Resources Assessment, Clarendon, Oxford, 1986.
[32] I. Heywood, S. Cornelius, S. Carver, An Introduction to Geographical Information Systems, Longman, New York, 1998, pp. 11-12.
[33] C. Fitzpatrick, D.J. Magu1re, GIS in Schools: Infrastructure, Methodology and Role, 2000.
[34] T. Yomralıoğlu, Coğrafi Bilgi Sistemleri Temel Kavramlar Ve Uygulamalar (Geographic Information Systems Basic Concepts and Applications), vol. 2, Akademi Kitabevi, 2000. Baskı.
[35] M. Kawabata, Multidisciplinary cooperation in GIS education: a case study of Us Colleges and universities”, J. Geogr. High Educ. 34 (4) (2010) 493-509.
[36] F. Tuna, Ortaöğretim Coğrafya Derslerinde Proje Tabanlı Öğrenimi Desteklemek Amacı İle Cografi Bilgi Sistemlerinden (CBS) Yararlanma (Utilizing geographic information systems (GIS) to support project-based Learning in secondary education geography lessons). Yayımlanmamış PHD Thesis, Marmara Üniversitesi Eğitim Bilimleri Enstitüsü, 2008. İstanbul.
[37] D. Messaoudi, N. Settou, B. Negrou, B. Settou, GIS based multi-criteria decision making for solar hydrogen production sites selection in Algeria, Int. J. Hydrogen Energy (60) (2019) 31808-31831.
[38] A. Koc, S. Turk, G. Sahin, Multi-criteria of wind-solar site selection problem using a GIS-AHP-based approach with an application in Igdir Province/Turkey, Environ. Sci. Pollut. Control Ser. (31) (2019) 32298-32310.
[39] A.A. Merrouni, F.E. Elalaoui, A. Mezrhab, A. Mezrhab, A. Ghennioui, Large scale PV sites selection by combining GIS and Analytical Hierarchy Process. Case study: eastern Morocco, Renew. Energy 119 (2018) 863-873.
[40] L. Castro-Santos, G.P. Garcia, T. Simões, A. Estanqueiro, Planning of the Installation of Offshore Renewable Energies: A GIS Approach of the Portuguese Roadmap, Renewable Energy132, 2019, pp. 1251-1262.
[41] H.E. Colak, T. Memisoglu, Y. Gercek, Optimal Site Selection for Solar Photovoltaic (PV) Power Plants Using GIS and AHP: A Case Study of Malatya Province, Turkey, Renewable Energy149, 2020, pp. 565-576.
[42] Z. Xu, Intuitionistic fuzzy aggregation operators, IEEE Trans. Fuzzy Syst. 15 (6) (2007) 1179-1187.
[43] A. Garni, Z. Hassan, Anjali Awasthi, Solar PV power plant site selection using a GISAHP based approach with application in Saudi Arabia, in: Applied Energy, vol. 206, Elsevier, 2017, pp. 1225-1240. C.
[44] F. Kaya, G. Gökhan Şahin, M.H. Alma, Investigation effects of environmental and operating factors on PV panel efficiency using by multivariate linear regression, Int. J. Energy Res. 45 (2021) 554-567.
[45] F (b) Sahin, G. Işik, G. Şahin, M.K. Karaa, Estimation of PM10 levels using feed forward neural networks in Igdir, Turkey, Urban Clim. 34 (2020) 100721.
[46] F(a) Sahin, M.K. Kara, A. Koc, G. Sahin, Multi-criteria decision-making using GISAHP for air pollution problem in Igdir Province/Turkey, Environ. Sci. Pollut. Control Ser. 27 (2020) 36215-36230.
[47] D. Arca, Afet Yönetiminde Coğrafi Bilgi Sistemleri ve Uzaktan Algılama, Karaelmas Fen ve Mühendislik Dergisi 2 (ss) (2012) 53-61.
[48] H. Liu, D. Sun, Y. Yu, H. Wang, Y. Liu, Q. Liu, Y. Du, H. Wang, B. Cao, Evalution of the VIIRS and MODIS LST products in an arid area of northwest China, Remote Sens. Environ. 142 (2014) 111-121.
[49] R. Bayar, K. ve Karabacak, Ankara İli Arazi Örtüsü Değişimi (2000-2012)(Ankara province land cover change (2000-2012)), Cografi Bilimler Dergisi 15 (1) (2017) 59-76.
[50] Ü.D. Yüksel, O. ve Yılmaz, Ankara Kentinde Kentsel Isi Adasi Etkisinin Yaz Aylarinda Uzaktan Algilama Ve Meteorolojik Gözlemlere Dayali Olarak Saptanmasi Ve Değerlendirilmesi, Gazi Üniv, Müh. Mim. Fak. Der. Cilt 23 (No 4) (2008) 937-952, 2008.
[51] E. Özelkan, S. Bagis, E.C. Ozelkan, B.B. Üstündağ, M. Yücel, C. ve Ormeci, Spatial Interpolation of climatic, Avrupa Bilim ve Teknoloji Dergisi e-ISSN: 2148-2683948 variables using land surface temperature and Modified inverse distance weighting, Int. J. Rem. Sens. 36 (2015) 1000-1025.
[52] Q. Weng, Thermal infrared remote sensing for urban climate and environmental studies: methods applicaitons, and trends, ISPRS J. Photogramm 64 (2009) 335-344.
[53] R. Hamdi, Estimating urban heat island effects on the temperature series of Uccle (Brussels, Belgium) using remote sensing data and a land surface scheme, Remote Sens 2 (2010) 2773-2784.
[54] L. Liu, Y. ve Zhang, Urban heat island analysis using the Landsat TM data and Aster data: a case study in Hong Kong, Remote Sens 3 (2011) 1535-1552.
[55] J. Zhou, Y. Chen, J. Wang, W. Zhan, Maximum nighttime urban heat island (UHI) intensity simulation by integrating remotely sensed data and meteorological observations, IEEE J. Sel. Top. Appl. Earth Obs. Rem. Sens. 4 (2011) 138-146.
[56] A. Sekertekin, S. ve Bonafoni, Land surface temperature retrieval from Landsat 5, 7, and 8 over rural areas: assessment of different retrieval algorithms and emissivity models and toolbox implementation, Rem. Sens. (2020).
[57] A. Sekertekin, Ş.H. Kutluoglu, S. Kaya, A.M. Marangoz, Uydu Verileri Ile Arazi Örtüsündeki Yer Yüzey Sıcaklığı Değişimlerinin Analizi: Zonguldak Örneği, Türkiye, TMMOB Harita Ve Kadastro Mühendisleri Odası (Analysis of Ground Surface Temperature Changes in the Land Cover with Satellite Data: the Case of Zonguldak, Turkey, TMMOB Chamber of Surveying and Cadastre Engineers), 15, Türkiye Harita Bilimsel ve Teknik Kurultayı, Ankara, 2015, p. 25. -28 Mart 2015.
[58] B. Çelik, Yeryüzü Sıcaklıklarının Uzaktan Algılama Tekniği Ile Belirlenmesi: TekKanal Yöntemleri (Determination of Earth Temperatures by Remote Sensing Technique: Single-Channel Methods), İstanbul Teknik Üniversitesi Yüksek Lisans Tezi, 2013.
[59] J.C. Price, The Contribution of Thermal Data in Landsat Multispectral Classifacition, Photo, English Remote Sensing, 1981.
[60] A. Chedin, N.A. Scott, C. Whacihe, P. ve Moulinier, The improved initialisation inversion method: a high resolution physical method for temperature retrievals from the TIROS-N series, J. Clim. Appl. Meteorol. (1985).
[61] M. Ozcan, A.K. Caliskan, Engineering management program EM 599 – TERM PROJECT, fina report. Site Selection for Wind-Solar Hybrit Power Plant in Turkey, Middle East Technical University industrial department, 2017.
[62] S. Turk, A. Koc, G. Sahin, Multi-criteria of PV solar site selection problem using GIS-intuitionistic fuzzy based approach in Erzurum province/Turkey, Scientifc Reports 11 (2021) 5034.
- Corresponding author.
E-mail address: g.sahin@uu.nl (G. Şahin).