الاتجاهات الإقليمية والمؤسسية في التقييم للترقية الأكاديمية Regional and institutional trends in assessment for academic promotion

المجلة: Nature، المجلد: 638، العدد: 8050
DOI: https://doi.org/10.1038/s41586-024-08422-9
PMID: https://pubmed.ncbi.nlm.nih.gov/39843736
تاريخ النشر: 2025-01-22

الاتجاهات الإقليمية والمؤسسية في التقييم للترقية الأكاديمية

https://doi.org/10.1038/s41586-024-08422-9
تاريخ الاستلام: 1 يونيو 2023
تم القبول: 18 نوفمبر 2024
نُشر على الإنترنت: 22 يناير 2025
الوصول المفتوح
تحقق من التحديثات

ب. هـ. ليم¹، س. ديبوليتي م. دومينيك أ. س. هيرنانديز-موندراجون كي. فيرمير كي. كي. تشونغ ح. حسين في. إس. موراليس-سالجادو كي. جي. كلوت جي. إن. كيمينغسي ل. بالبوآ س. مونديلو تي. إي. ديلا كروز س. لوبيز-فيرغيس سيدي زكاري أ. سيمونيان إ. بالومو ، أ. ريجك يامبراك²3، ج. جيرمو نزويندجي²4، أ. مولنار أ. م. إ. سكتياواتي س. العجرودي ب. كومار س. إناني ف. ناريتا م. باكس V. سيشيليانو دي. إيجامبردييف و Y. فلوريس بويزو

الملخص

يُنظر إلى تقييم أداء البحث على أنه أداة حيوية في الحفاظ على أعلى معايير الجودة، حيث يُعتقد أن الاختيار والمنافسة يدفعان التقدم. تحتاج المؤسسات الأكاديمية إلى اتخاذ قرارات حاسمة بشأن التوظيف والترقية، بينما تواجه ضغطًا خارجيًا من خلال كونها خاضعة أيضًا لتقييم البحث. . هنا نقدم نظرة على تقييم البحث من أجل التقدم الوظيفي مع التركيز المحدد على الترقية إلى أستاذية كاملة، استنادًا إلى 314 سياسة من 190 مؤسسة أكاديمية و218 سياسة من 58 وكالة حكومية، تغطي 32 دولة في الشمال العالمي و89 دولة في الجنوب العالمي. قمنا بالتحقيق في مدى تكرار ذكر معايير الترقية المختلفة وأجرينا تحليلًا إحصائيًا لاستنتاج القواسم المشتركة والاختلافات عبر السياسات. على الرغم من أن الأساليب الكمية للتقييم لا تزال شائعة، فإنها تتفق مع ما تم العثور عليه في الدراسات الأكثر تقييدًا جغرافيًا. إنهم ليسوا موجودين في كل مكان. نجد اختلافات بين الشمال العالمي والجنوب العالمي وكذلك بين السياسات المؤسسية والوطنية، ولكن أقل بين التخصصات. تفضل الدول ذات الدخل المتوسط الأعلى مؤشرات الببليومترية بشكل أكبر. على الرغم من أننا نرى بعض التباين، فإن العديد من سياسات الترقية تستند إلى افتراض مسارات مهنية محددة تصبح معيارية بدلاً من احتضان التنوع. بدوره، يقيّد هذا الفرص للباحثين. تتحدى هذه النتائج الممارسات الحالية ولها تداعيات استراتيجية للباحثين ومديري الأبحاث والحكومات الوطنية.

انتشار التقييم والهوس بالمقاييس في المجتمع الحديث غالبًا ما يأتي على حساب الحكم السليم. ، والأوساط الأكاديمية ليست استثناءً يُعتبر تقييم الأداء ضروريًا للحفاظ على معايير عالية، ويُعتقد أن العمليات الانتقائية والمنافسة تدفع نحو التقدم. ومع ذلك، يمكن أن تصبح مؤشرات الأداء أهدافًا في حد ذاتها، وتفقد التقييمات فعاليتها عندما تكون غير متوافقة مع غرضها الأصلي. علاوة على ذلك، قد يتساءل المرء عما إذا كانت المنافسة كقيمة أساسية تناسب نظام البحث العالمي الذي يزدهر على التنوع ويعتمد على التعاون لتحقيق الأثر. إذا كان هدفنا هو تقدم المجتمع من خلال توليد المعرفة، فنحن بحاجة إلى فهم كيف يمكن أن يسهم تقييم البحث، من المستوى العالمي إلى الباحثين الأفراد، بشكل إيجابي في نظام البحث.
أصبح الادعاء بتعزيز ‘التميز’ في البحث والفخر بسجل ‘التميز’ أمرًا شائعًا، لكن ما يتعلق به هذا التميز بشكل ملموس غير واضح. قد لا تكون هناك مشكلة إذا كانت ‘التميز’ تختلف عبر السياقات. ومع ذلك، فإن زيادة تسويق البحث تعرض المؤسسات البحثية لضغوط تنافسية. ، حيث يواجه مدراء الأبحاث تحدي بناء فرق فعالة تقدم قيمة طويلة الأمد مع الحفاظ على الاعتراف الخارجي المرتبط بالدعم المالي، والذي غالبًا ما يكون مرتبطًا بعيوب في الجامعة
التصنيفات تؤثر هذه القرارات الإدارية على الباحثين في جميع مراحل حياتهم المهنية، خاصة في التوظيف، والتقييمات، والاحتفاظ، والترقية.
الاستخدام الواسع للعلميات المقياسية، وخاصة المقياس الببليومتري لقد عززت هذه الفكرة تصور نظام تقييم بحثي عالمي، لكن مثل هذا الرأي يفشل في التعرف على تعقيد وتنوع الممارسات الفعلية. تعتبر المقاييس جذابة بسبب بساطتها وتكلفتها المنخفضة وموضوعيتها المتصورة، والتي يُعتقد أنها تخفف من المحاباة. ومع ذلك، تعكس المقياسات الببليومترية المعتمدة على الاقتباسات الشبكات الاجتماعية وتجمع القرارات الذاتية. بدلاً من الموضوعية، تعتبر الشفافية هي المفتاح للحفاظ على النزاهة في التقييمات، التي تنطوي حتمًا على الحكم البشري. تقدم مخرجات البحث أدلة مهمة على التقدم لكنها تقدم فقط رؤية ضيقة للنظام البيئي البحثي الأوسع. إن تقييمها فقط من خلال الإنتاجية والشعبية يفشل في التقاط كل من القيمة والصرامة. في بيان لايدن، أعرب الخبراء في علم قياس العلوم عن قلقهم من أن التقييم أصبح بشكل متزايد يقوده البيانات بدلاً من الحكم، وحذروا من سوء تطبيق المؤشرات، حيث يعتبر عامل تأثير المجلة مثالًا رئيسيًا. تؤكد دليل SCOPE لتقييم البحث على أنه يجب قياس الأداء مقابل الأهداف المهمة للمؤسسات أو المجموعات أو الأفراد، مع مراعاة السياقات ذات الصلة. عمليات التقييم التي لا تحقق غرضها تعتبر غير صالحة.
ظهرت مبادئ هونغ كونغ لتقييم الباحثين من الاعتراف بالحاجة إلى موثوقية المعرفة “، مع التأكيد على أهمية التعرف على السلوكيات التي تعزز نزاهة البحث. ومع ذلك، فإن السعي نحو “التميز” من خلال المقاييس الكمية غالبًا ما يدفع إلى سلوكيات غير أخلاقية. توصية منظمة الأمم المتحدة للتربية والعلم والثقافة (اليونسكو) بشأن العلوم المفتوحة تبرز أن تعزيز ثقافة البحث العالمية المتوافقة مع العلوم المفتوحة يتطلب عمليات تقييم مناسبة تكافئ الممارسات الجيدة. كما تم التأكيد عليه سابقًا، على سبيل المثال، من قبل الأكاديمية العالمية للشباب ورابطة الجامعات الأوروبية .
التغيير في الأفق حيث يزداد عدد الموقعين على إعلان سان فرانسيسكو حول تقييم البحث تحديث إجراءاتها، يطلق المجلس اللاتيني الأمريكي للعلوم الاجتماعية (CLACSO) المنتدى اللاتيني الأمريكي لتقييم البحث (FOLEC) ، والتعاونات مثل تلك التي بين الشراكة بين الأكاديميات، والأكاديمية العالمية للشباب، والمجلس الدولي للعلوم تنشر دراسات حول تقييم البحث وتخطط لمبادرات مستقبلية مشتركة في الوقت نفسه، تقوم مجتمع كبير تم جمعه في الأصل بواسطة المفوضية الأوروبية بتشكيل ائتلاف لتعزيز تقييم البحث. لقد أدى الاستياء الواسع من الممارسات الحالية أيضًا إلى نقاش على المستويات الوطنية حول سبل التقدم نحو أساليب أفضل. .
تحليلنا لممارسات الترقية في جميع أنحاء العالم يهدف إلى التغلب على بعض التصورات المنحازة وإلقاء الضوء على العلاقة مع الكفاءات والمهارات والإنتاجية والأثر والفوائد. نتوقع أن تكون نتائجنا ذات قيمة لكل من الباحثين ومديري الأبحاث لفهم خيارات وفرص الحياة المهنية وتقديم إرشادات حول كيفية بناء نظام بحثي قوي ومتعدد الجوانب يقوده فاعلون مسؤولون يساهمون من خلال نقاط قوتهم.

تصميم الدراسة

لدراسة كيفية تقييم الباحثين على مستوى العالم، قمنا بإجراء تحليل مقطعي لفحص معايير التقييم المستخدمة في سياسات الترقية. قمنا بتحديد وتحليل معايير الترقية المختارة بشكل منهجي من خلال رصد وجودها أو غيابها في سياسات الترقية ومقارنة الفروق والتشابهات عبر التخصصات والمجالات والمسارات وأنواع المؤسسات والدول، مع الأخذ في الاعتبار سياقاتها الاجتماعية والاقتصادية. بدلاً من اتباع بروتوكول محدد مسبقًا، قمنا بتطوير منهجيتنا من خلال دراسة تجريبية أولية، والتي تطورت بعد ذلك إلى إطار شامل (قسم المعلومات التكميلية 1.1)، مما أتاح لنا مقارنة وقياس البيانات النوعية من الوثائق المؤسسية على مستوى العالم.
يعمل الباحثون في بيئات متنوعة عبر البلدان والمناطق والمؤسسات، مما يؤدي إلى تفاوت كبير في أدوار التقدم الوظيفي. إن رسم جميع مسارات الحياة المهنية يتجاوز أهدافنا، لذا ركزنا على سياسات الترقية لـ (أستاذ) ‘بروفيسور’ – وهو أعلى دور أكاديمي، معترف به على نطاق واسع وقابل للمقارنة عبر البلدان. نميز بين المسار الأكاديمي القياسي، والمسار الذي يركز على البحث، والمسار الذي يركز على التدريس، والمسار السريري. بالإضافة إلى ذلك، نركز على التقييم داخل المؤسسات الأكاديمية، ولا نتضمن الأدوار خارج الجامعات مثل تلك الموجودة في المعاهد البحثية أو البيئات السريرية أو التجارية.
بين مايو 2016 ونوفمبر 2023، اعتمدنا على عضوية الأكاديمية العالمية للشباب وشبكة الخريجين لجمع الوثائق التي توضح سياسات الترقية، بما في ذلك المعايير والإجراءات (قسم الطرق “جمع البيانات”). في مرحلة تجريبية للدراسة (2016-2018)، جمعنا 46 سياسة لإبلاغ إطارنا المنهجي. بعد ذلك، في المرحلة الأولى من جمع البيانات (2018-2021)، أنشأنا مجموعة بيانات تضم 196 سياسة من 55 دولة. في عام 2023، قمنا بتحديث البيانات لجميع السياسات التي تم جمعها ووسعنا نطاق جهودنا لتشمل السياسات من المناطق العالمية الجنوبية الممثلة تمثيلاً ناقصًا، مضيفين 440 سياسة أخرى. مع هذه الجولة الأخيرة، جمعنا السياسات التي وضعتها 190 مؤسسة أكاديمية (‘سياسات مؤسسية’) و58 وكالة حكومية (‘سياسات وطنية’) عبر 121 دولة. بالإضافة إلى ذلك،
الشكل 1 | عينة من سياسات الترويج. خريطة توضح التوزيع الجغرافي للبيانات المستخدمة في التحليل. تشير درجات اللون الأزرق (على مقياس لوغاريتمي) إلى عدد الباحثين النشطين المقدر في كل من الدول الـ 121 التي استمدينا منها السياسات. . تُظهر الدول والأقاليم الأخرى باللون الرمادي. مساحة نصف الدوائر تتناسب مع، على التوالي، عدد المؤسسات أو الوكالات (باللون الأصفر) وعدد السياسات (باللون البرتقالي) من دولة معينة. الخريطة تعتمد على بيانات جغرافية متاحة بشكل مفتوح في مستودع “Natural Earth”، باستخدام مجموعة بيانات GeoJSON لمضلعات الأراضي (https://www.naturalearthdata.com/). تم إنشاء الرسم باستخدام geopandas وmatplotlib wedge shape patch، وفقًا للكود المعلق المشارك في قسم توفر الكود. لا يؤيد المؤلفون أي موقف بشأن أي منطقة متنازع عليها أو حدود متنازع عليها. تم الحصول على عدد الباحثين من معهد اليونسكو للإحصاء وتقارير علوم اليونسكو (قسم المعلومات التكميلية 1.7).
تعريف 53 منظمة (مؤسسة أو وكالة) في عيّنتنا لسياسات متعددة تميز بين مسارات المهنة و/أو التخصصات، مما رفع إجمالي السياسات المحددة حسب المسار والتخصص التي تم جمعها إلى 532 (الشكل 1؛ المزيد في أقسام الطرق “الترجمة” إلى “التجميع حسب التخصصات، والمسارات، والمنطقة العالمية، والحالة الاقتصادية”).
تستند معظم المنظمات في عيّنتنا (73%) خارج أوروبا وأمريكا الشمالية، مما يوفر وجهة نظر أكثر تنوعًا مقارنة بالدراسات السابقة. تشمل دراستنا 32 دولة في الشمال العالمي و89 دولة في الجنوب العالمي، على الرغم من أننا لا نقدم تحليلات على مستوى الدول. لتعكس بشكل أفضل واقع المتقدمين المتوسطين، قمنا بتطبيق أوزان بعد أخذ العينات، بحيث يكون لكل سياسة من نفس المنظمة وزن متساوٍ، ولكل منظمة داخل دولة وزن متساوٍ، وكانت كل دولة موزونة بشكل يتناسب مع عدد الباحثين النشطين فيها. (قسم المعلومات التكميلية 1.7 والجداول التكميلية 4 و 9). يتم توضيح تغطيتنا الجغرافية في الشكل 1، ويتم تقديم تحليل البيانات في جدول البيانات الموسع 1. تتوفر البيانات الكاملة والرمز عبر أقسام توفر البيانات والرمز.

نظرة عامة على معايير الترقية

قمنا بتضمين جميع السياسات المتعلقة بالترقية إلى درجة أستاذية التي تحدد بوضوح معايير التقييم، والتي تغطي كل من البحث والتدريس (انظر الأهلية في قسم الطرق “تنظيف البيانات (معايير الأهلية)”). كانت وثائق السياسات متنوعة بشكل كبير من حيث النطاق والبنية ومستوى التفاصيل؛ حيث كانت 28% من السياسات في عيّنتنا إرشادات موجزة، بينما تضمنت 72% نماذج تقديم أو تقييم مفصلة مع أنظمة قائمة على النقاط (الجداول البيانية الموسعة 2 و3 وأقسام المعلومات التكميلية 1.4 و1.5). بشكل عام، عرّفت السياسات ثلاثة مجالات:
الشكل 2 | الاتجاهات في تقييم البحث. أ، ب، التكرار الذي يُقدّر أن يؤثر به كل من معايير التقييم الثلاثين على الباحثين في 121 دولة تم مسحها. أ يظهر 19 معيارًا جنبًا إلى جنب مع الفئة العامة للبحث.
المخرجات، التي تم توسيعها إلى 7 مقاييس كمية (في الأعلى) و 4 مقاييس نوعية (في الأسفل) الموضحة في . RC، التعرف؛ GTs، السمات العامة.
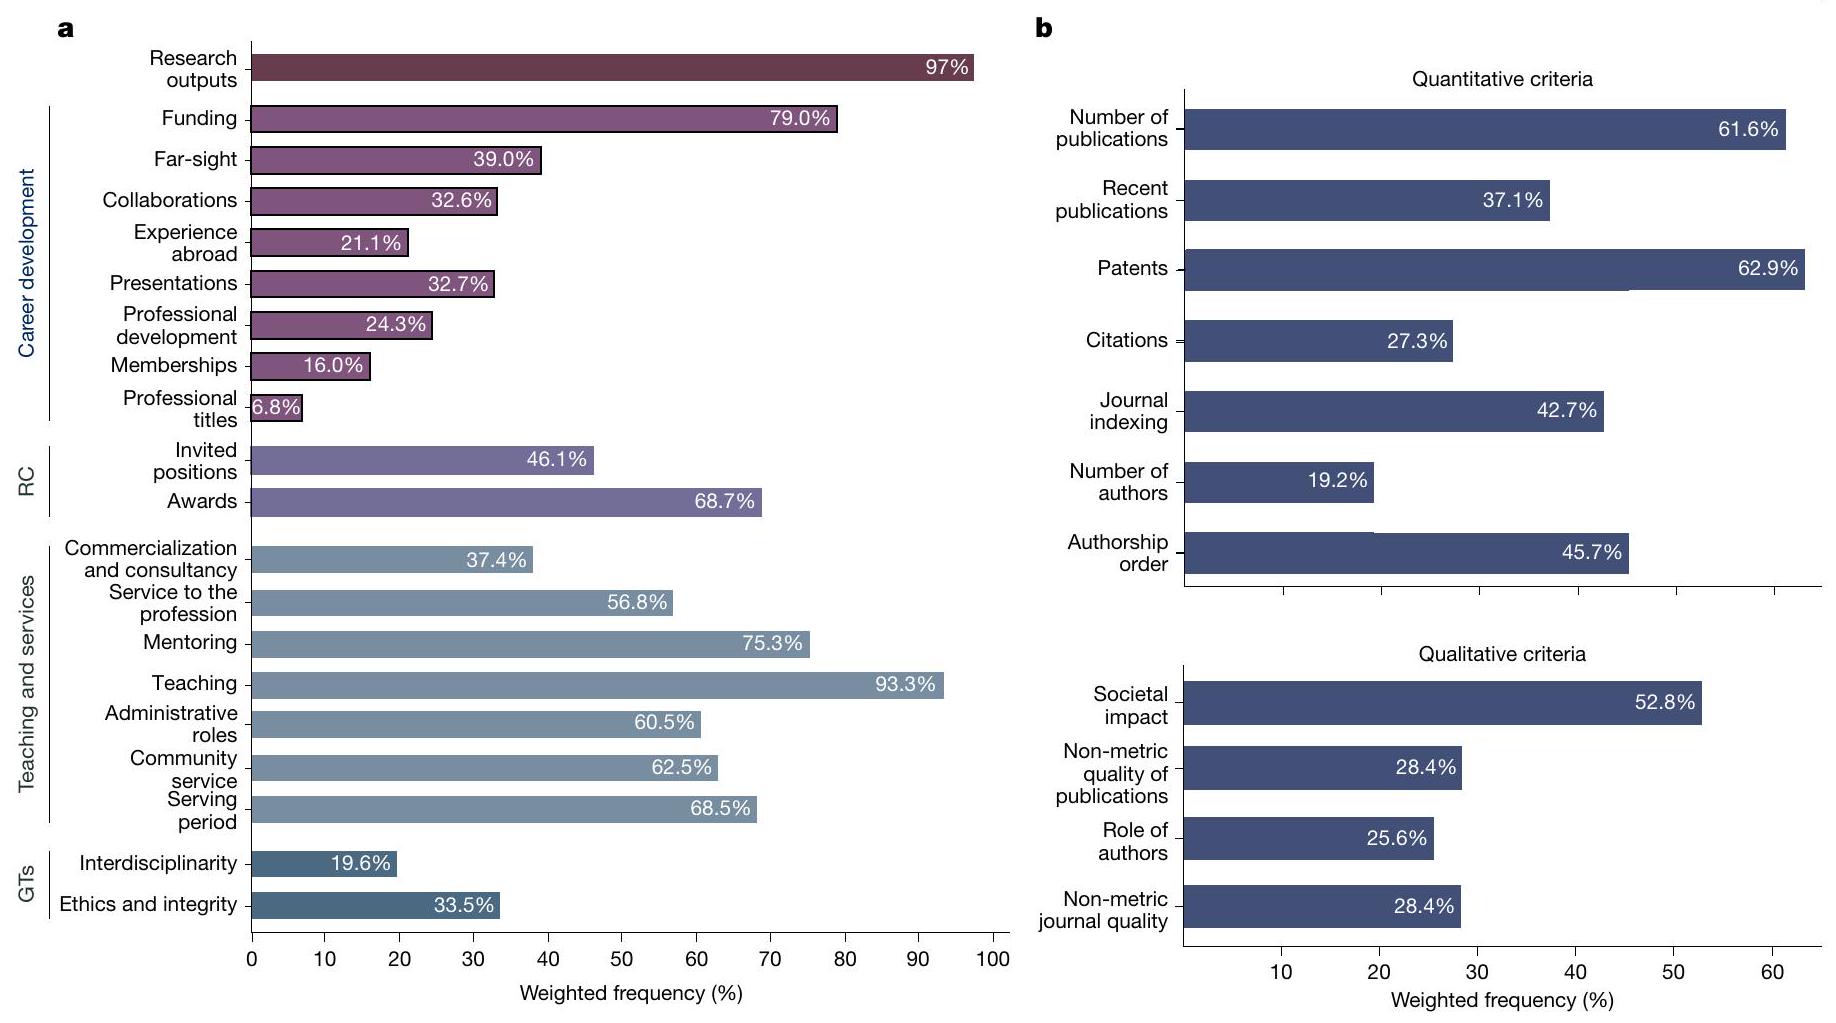
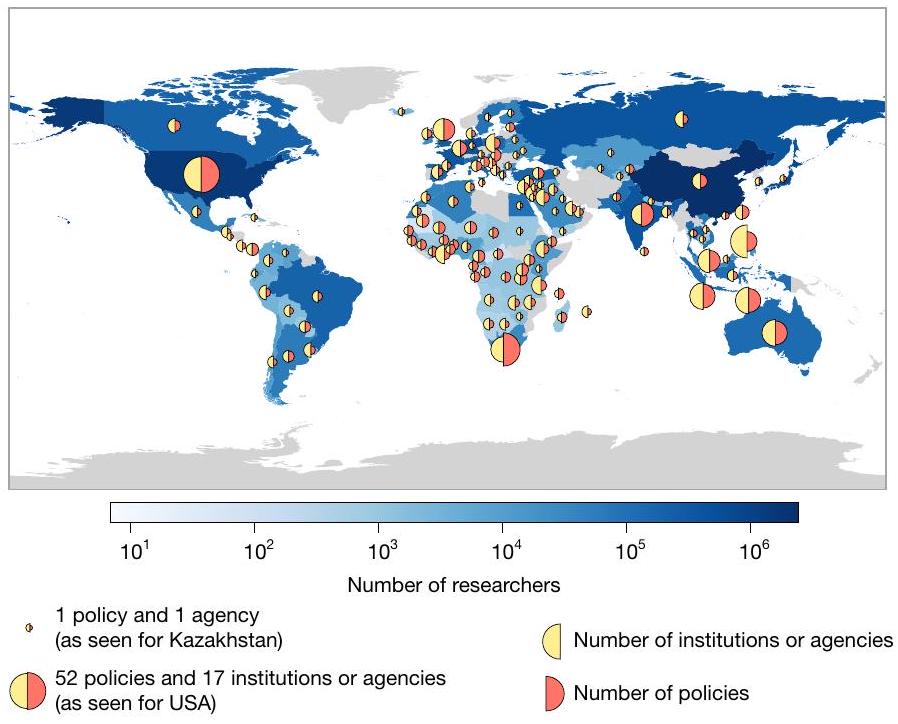
البحث، التعليم والخدمات. حددنا 30 معيارًا رئيسيًا عبر 5 فئات: مخرجات البحث؛ تطوير المهنة؛ الاعتراف؛ التعليم والخدمة؛ والسمات العامة. ضمن مخرجات البحث، تم تحديد 11 معيارًا كإما ‘كمية’ (مبنية على المقاييس؛ على سبيل المثال، البيبليومترية) أو ‘نوعية’ (وصف سردي و/أو مراجعة من قبل الأقران) (قسم الطرق 2.3 “المعايير والفئات”، الجدول الإضافي 3، قسم المعلومات التكميلية 1.3 والجدول التكميلية 1).
كما هو موضح في الشكل 2، تعكس السياسات في عيّنتنا نظام تقييم ي prioritizes مخرجات البحث التعليم )، التمويل (79%) والإرشاد (75%)، تليها المعايير المتعلقة بالخدمات المهنية والاعتراف، مثل الأدوار الإدارية، الجوائز والخدمة المجتمعية (كل منها بين و غالبًا ما يتم تقييم مخرجات البحث من خلال مقاييس كمية (92%) أكثر من تقييمها من خلال مقاييس نوعية. ؛ في هذا القسم والقسم أدناه، تأخذ جميع اختبارات والد للنسب المتساوية في الاعتبار أوزان العينة وتعتمد على مع ). كان استخدام الأساليب الكمية والنوعية الفردية متنوعًا أيضًا، مع الاعتماد المتكرر على براءات الاختراع (63%) وعدد المنشورات ( ) من بين المقاييس الكمية، ومن التأثير الاجتماعي (53%) من بين المقاييس النوعية.

الاختلافات الإقليمية والمؤسسية

توزيع عادل في عيّنتنا الوطنية ( ) والسياسات المؤسسية (59%) من كل من الشمال العالمي (31%) والجنوب العالمي (69%; تصنيف قسم الإحصاء بالأمم المتحدة 2018) مكننا من تحليل أنواع السياسات حسب المنطقة. كما هو موضح في الشكل 3a، في عيّنتنا، كلا نوعي السياسات يقيمان التعليم دون وجود دليل على وجود فرق إحصائي في التكرار (الوطنية: مؤسسي: ، )، وكلاهما يستخدم الببليومترية لتقييم مخرجات البحث (الوطنية: 85%، المؤسسية: 89% من الوثائق التي تستخدم على الأقل معيارًا كميًا واحدًا؛ الجدول البياني الممتد 3 والبيانات الممتدة
الشكل 1)، مثل عدد المنشورات (الوطنية: 76%، المؤسسية: ) أو الاقتباسات (الوطنية: ; مؤسسي: ، )، حيث لم يتم العثور على دليل على وجود اختلافات كبيرة، لكن تركيزهم انحرف نحو بعض المعايير المحددة. أولت السياسات الوطنية الأولوية لمقاييس إنتاج البحث، مثل فهرسة المجلات والمطبوعات الحديثة على النقيض من ذلك، كانت السياسات المؤسسية تعكس نطاقًا أوسع، مع تركيز أكبر على المقاييس النوعية. ، لاختبار استخدام معيار سياسة واحد على الأقل محدد كنوعي؛ الجدول البياني الموسع 3)، مثل الجودة غير المترية للمنشورات ( ، ، وقيّمت التداخل بين التخصصات ( ) وجوانب تطوير المهنة مثل الآفاق العلمية طويلة الأجل (البصيرة؛ ).
على المستوى البسيط للترددات الملحوظة، نجد نسبة أعلى من السياسات في الجنوب العالمي ( ) الاعتماد على المقاييس الكمية مقارنةً مع الشمال العالمي . ومع ذلك، فإن التباين العالي داخل كل مجموعة (مع فترات ثقة بنسبة 95% للترددات المتوسطة المقدرة تتراوح بين 0.71 و 0.92 للجزء الشمالي من العالم، وبين 0.76 و 0.99 للجزء الجنوبي من العالم) يجعل هذا الاختلاف غير ذي دلالة إحصائية. )، على الرغم من أن اختبار التكافؤ أحادي الجانب لفارق لا يقل عن 5 نقاط مئوية ينتج . وبالمثل، لاحظنا اختلافًا ليس له دلالة إحصائية عند المستوى التقليدي في متوسط تكرار الاعتماد على المقاييس النوعية في الشمال العالمي (83%) والجنوب العالمي ( )، ومع ذلك، فإن التباين العالي داخل كل مجموعة يؤدي إلى اختبار معادلة أحادي الجانب لاختلاف لا يقل عن 5 نقاط مئوية مما ينتج عنه (في هذه الحالة، فإن فترات الثقة هي للشمال العالمي و0.39-0.79 للجنوب العالمي؛ الأساس لاختبار أحادي الجانب في قسم الطرق “إحصائيات التكرار”). أظهر تحليل إقليمي مفصل، كما هو موضح في الشكل 3ب، أن معظم الاختلافات بين أنواع السياسات توجد في الشمال العالمي، حيث تم استخدام المعايير النوعية بشكل أكثر تكرارًا في السياسات المؤسسية مقارنة بالسياسات الوطنية (في
المعايير الكمية لتقييم مخرجات البحث ضمن السياسات الوطنية (يمين) والمؤسسية (يسار)، مع التمييز بين الجنوب العالمي (الأخضر) والشمال العالمي (الرمادي). المؤسسية (الشمال،141؛ الجنوب،173)؛ الوطنية (الشمال، 24؛ الجنوب، 194).
الشكل 3 | التكرارات حسب نوع السياسة والمناطق العالمية. أ، مخططات العنكبوت تظهر تكرار 30 معيارًا بين السياسات المؤسسية (رمادي) والوطنية (أحمر)، مقسمة إلى أربعة مخططات عنكبوتية وفقًا لفئة المعايير: مخرجات البحث؛ تطوير المهنة؛ التعليم والخدمات؛ والسمات العامة والاعتراف. ب، مخططات الأعمدة تقارن تكرار المعايير النوعية و
المقاييس (كلاهما عند ، مع ؛ في هذه العينة الفرعية، ). النتائج التفصيلية لاختبارات بيرسون واختبارات التصميم المستندة إلى – لاختبارات النسب المتساوية لكل معيار حسب نوع السياسة، العالم
و للسياسات، على التوالي؛ ؛ في هذه العينة الفرعية، ). بالمقابل، لا يظهر الجنوب العالمي اختلافات كبيرة بين أنواع السياسات في استخدام المعايير النوعية.
الشكل 4 | تحليل العوامل لمعايير التقييم للترقية إلى أستاذية. تُظهر خريطة الحرارة أوزان العوامل (مقياس الارتباط؛ الطرق) لكل معيار تقييم في 532 سياسة على كل من العوامل الكامنة الأربعة (العوامل 1-4) التي تم التنبؤ بها بعد تحليل العوامل الرئيسي وتم تدويرها باستخدام طريقة أوبليمين المائلة. ‘التفرد’ هو جزء من
التباين الذي لا يشاركه معيار معين مع الآخرين. تشير الفراغات إلى تحميل <0.3 في القيمة المطلقة، وتُبرز القيم الأخرى بمقياس لوني؛ جميع الأوزان موضحة في الجدول التكميلي 5. قمنا بتعيين تسميات تفسيرية للعوامل الأربعة، لوصف مجموعة المعايير التي تغطيها.
المنطقة، التخصص، المسار والوضع الاقتصادي للبلد موفرة في الجدول التكميلي 5.
بعيدًا عن قياس التكرارات، قمنا بفحص أنماط التزامن لفحص ما إذا كانت هناك أي ارتباطات بين خيارات السياسات قد تشير إلى وجهات نظر المؤسسات الفردية و/أو الحكومات الوطنية. باستخدام تحليل العوامل الرئيسي، وجدنا أربعة عوامل كامنة
التي تمثل مجتمعة من التباين التراكمي في البيانات (انظر مخطط الانحدار في الشكل 2 من البيانات الموسعة). كما يمكن ملاحظته في مخططات التحميل (الشكل 3 من البيانات الموسعة)، يمثل كل عامل نمطًا من مجموعات متميزة من المعايير الموجودة معًا في نفس السياسات. من الجدير بالذكر أن المعايير الكمية والنوعية لتقييم مخرجات البحث مفصولة بوضوح عبر العوامل، مما يبرز دورها كعوامل رئيسية في تصميم السياسات. وهذا يشير إلى أن المنظمات غالبًا ما تتخذ خيارات متميزة بين الطرق الكمية أو النوعية ثم تطبقها باستمرار في جميع
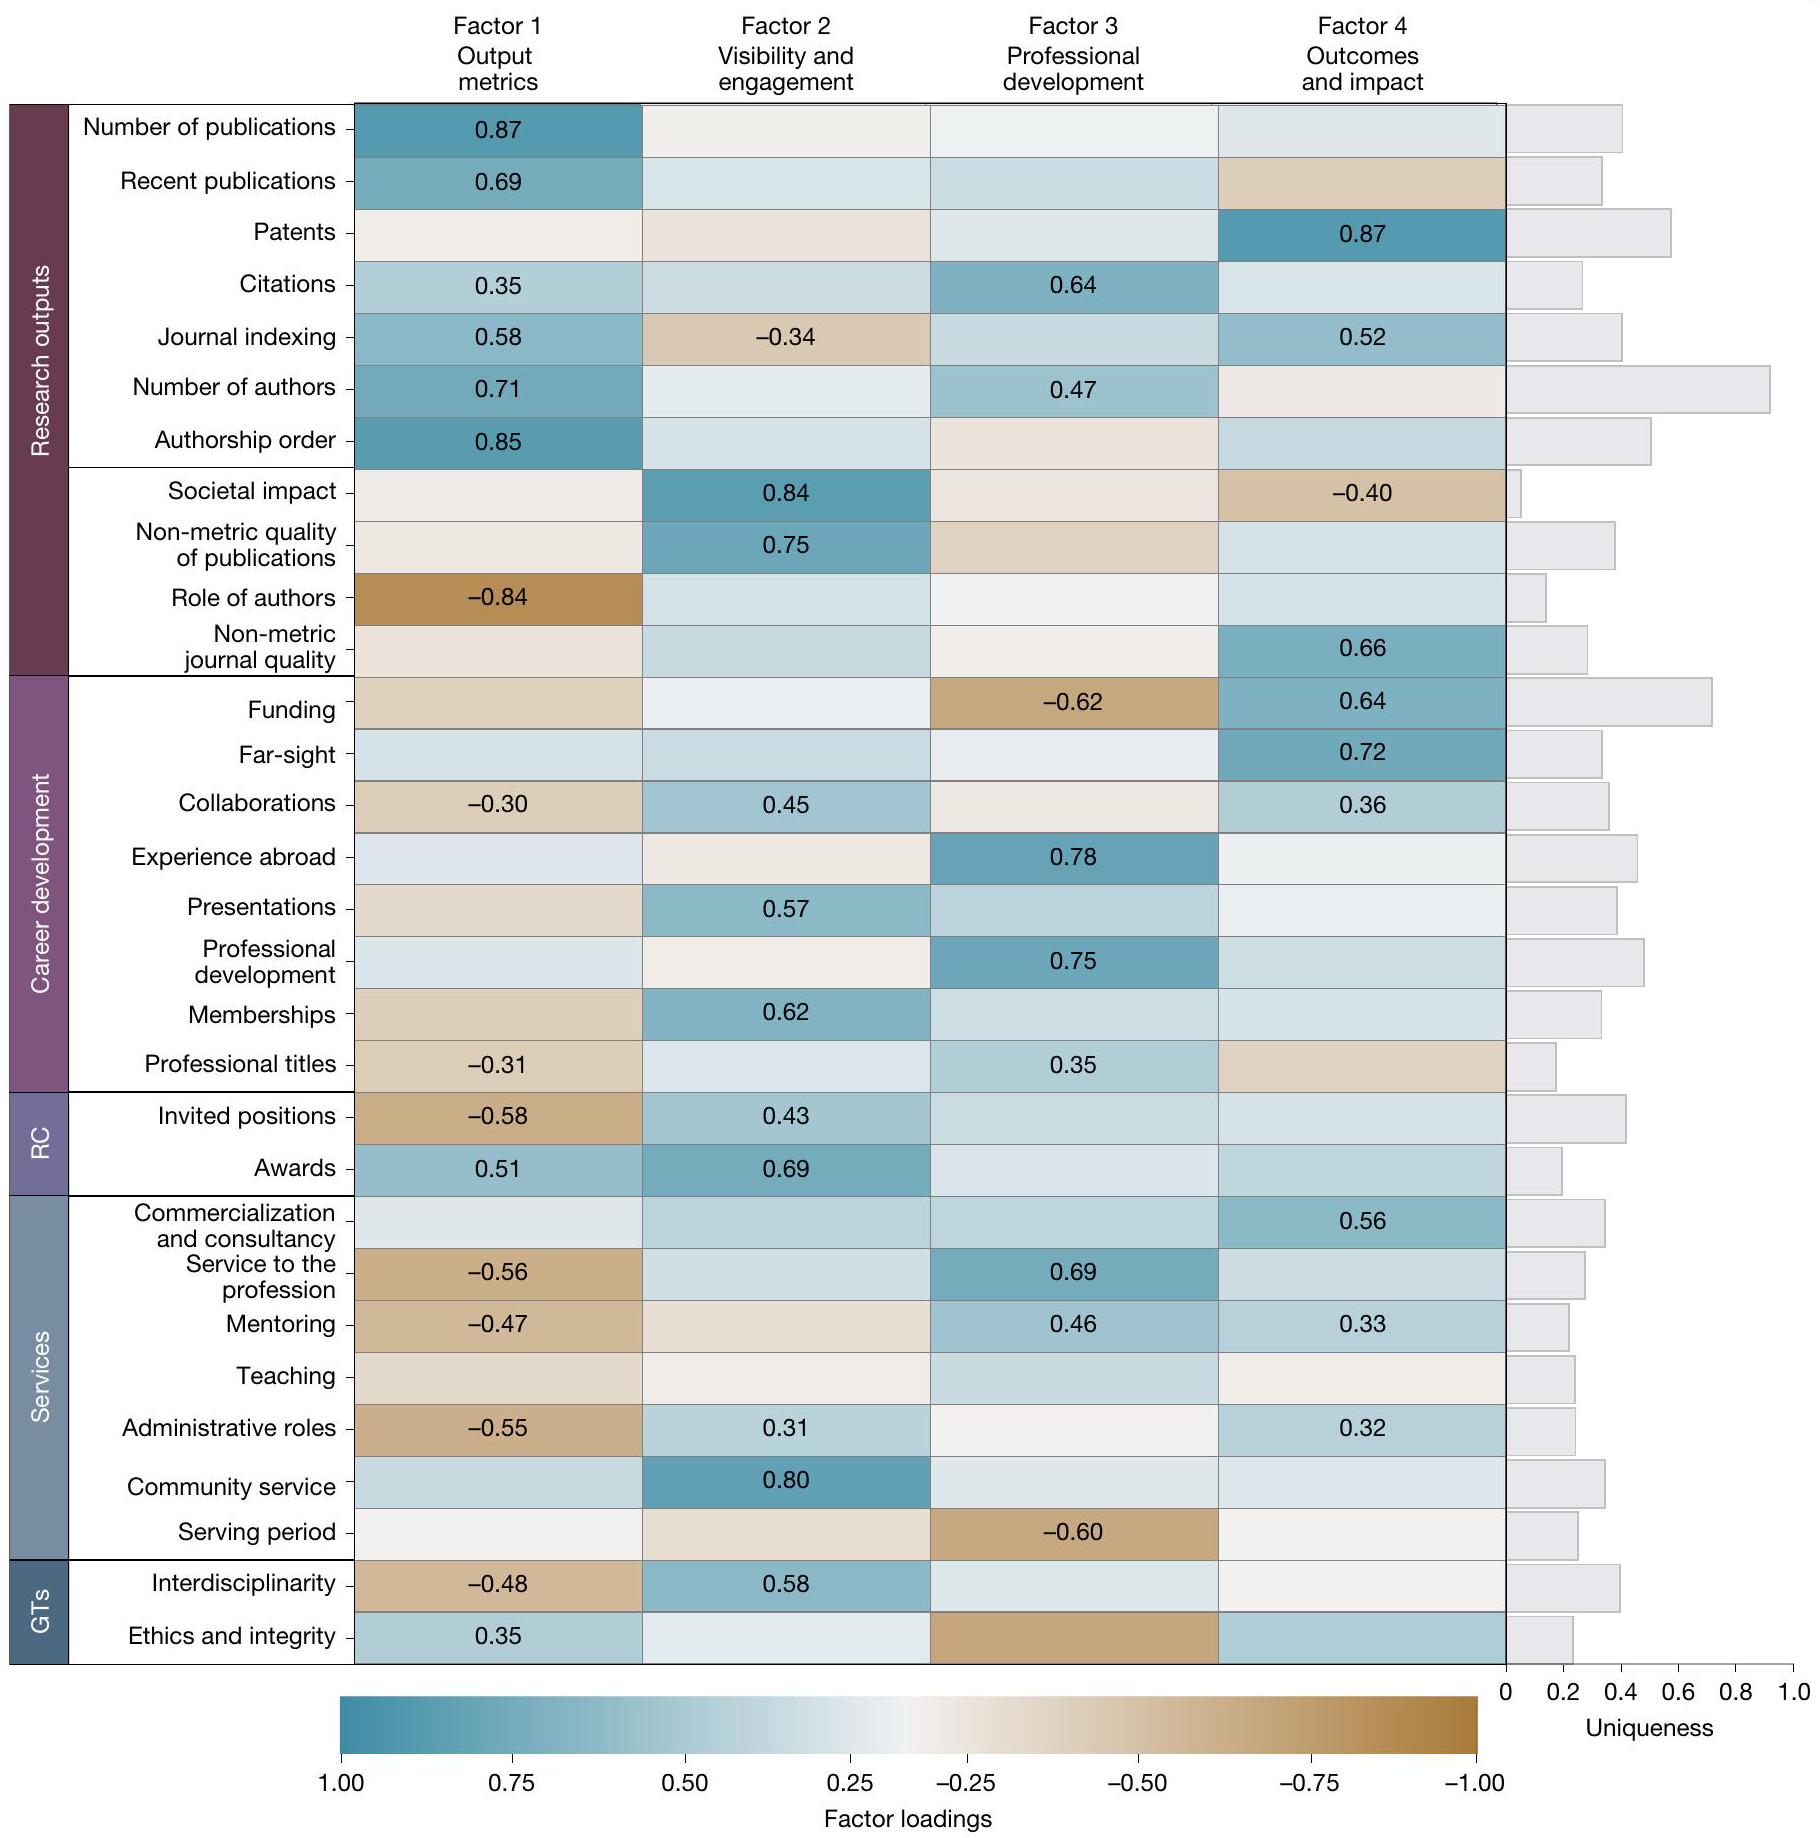
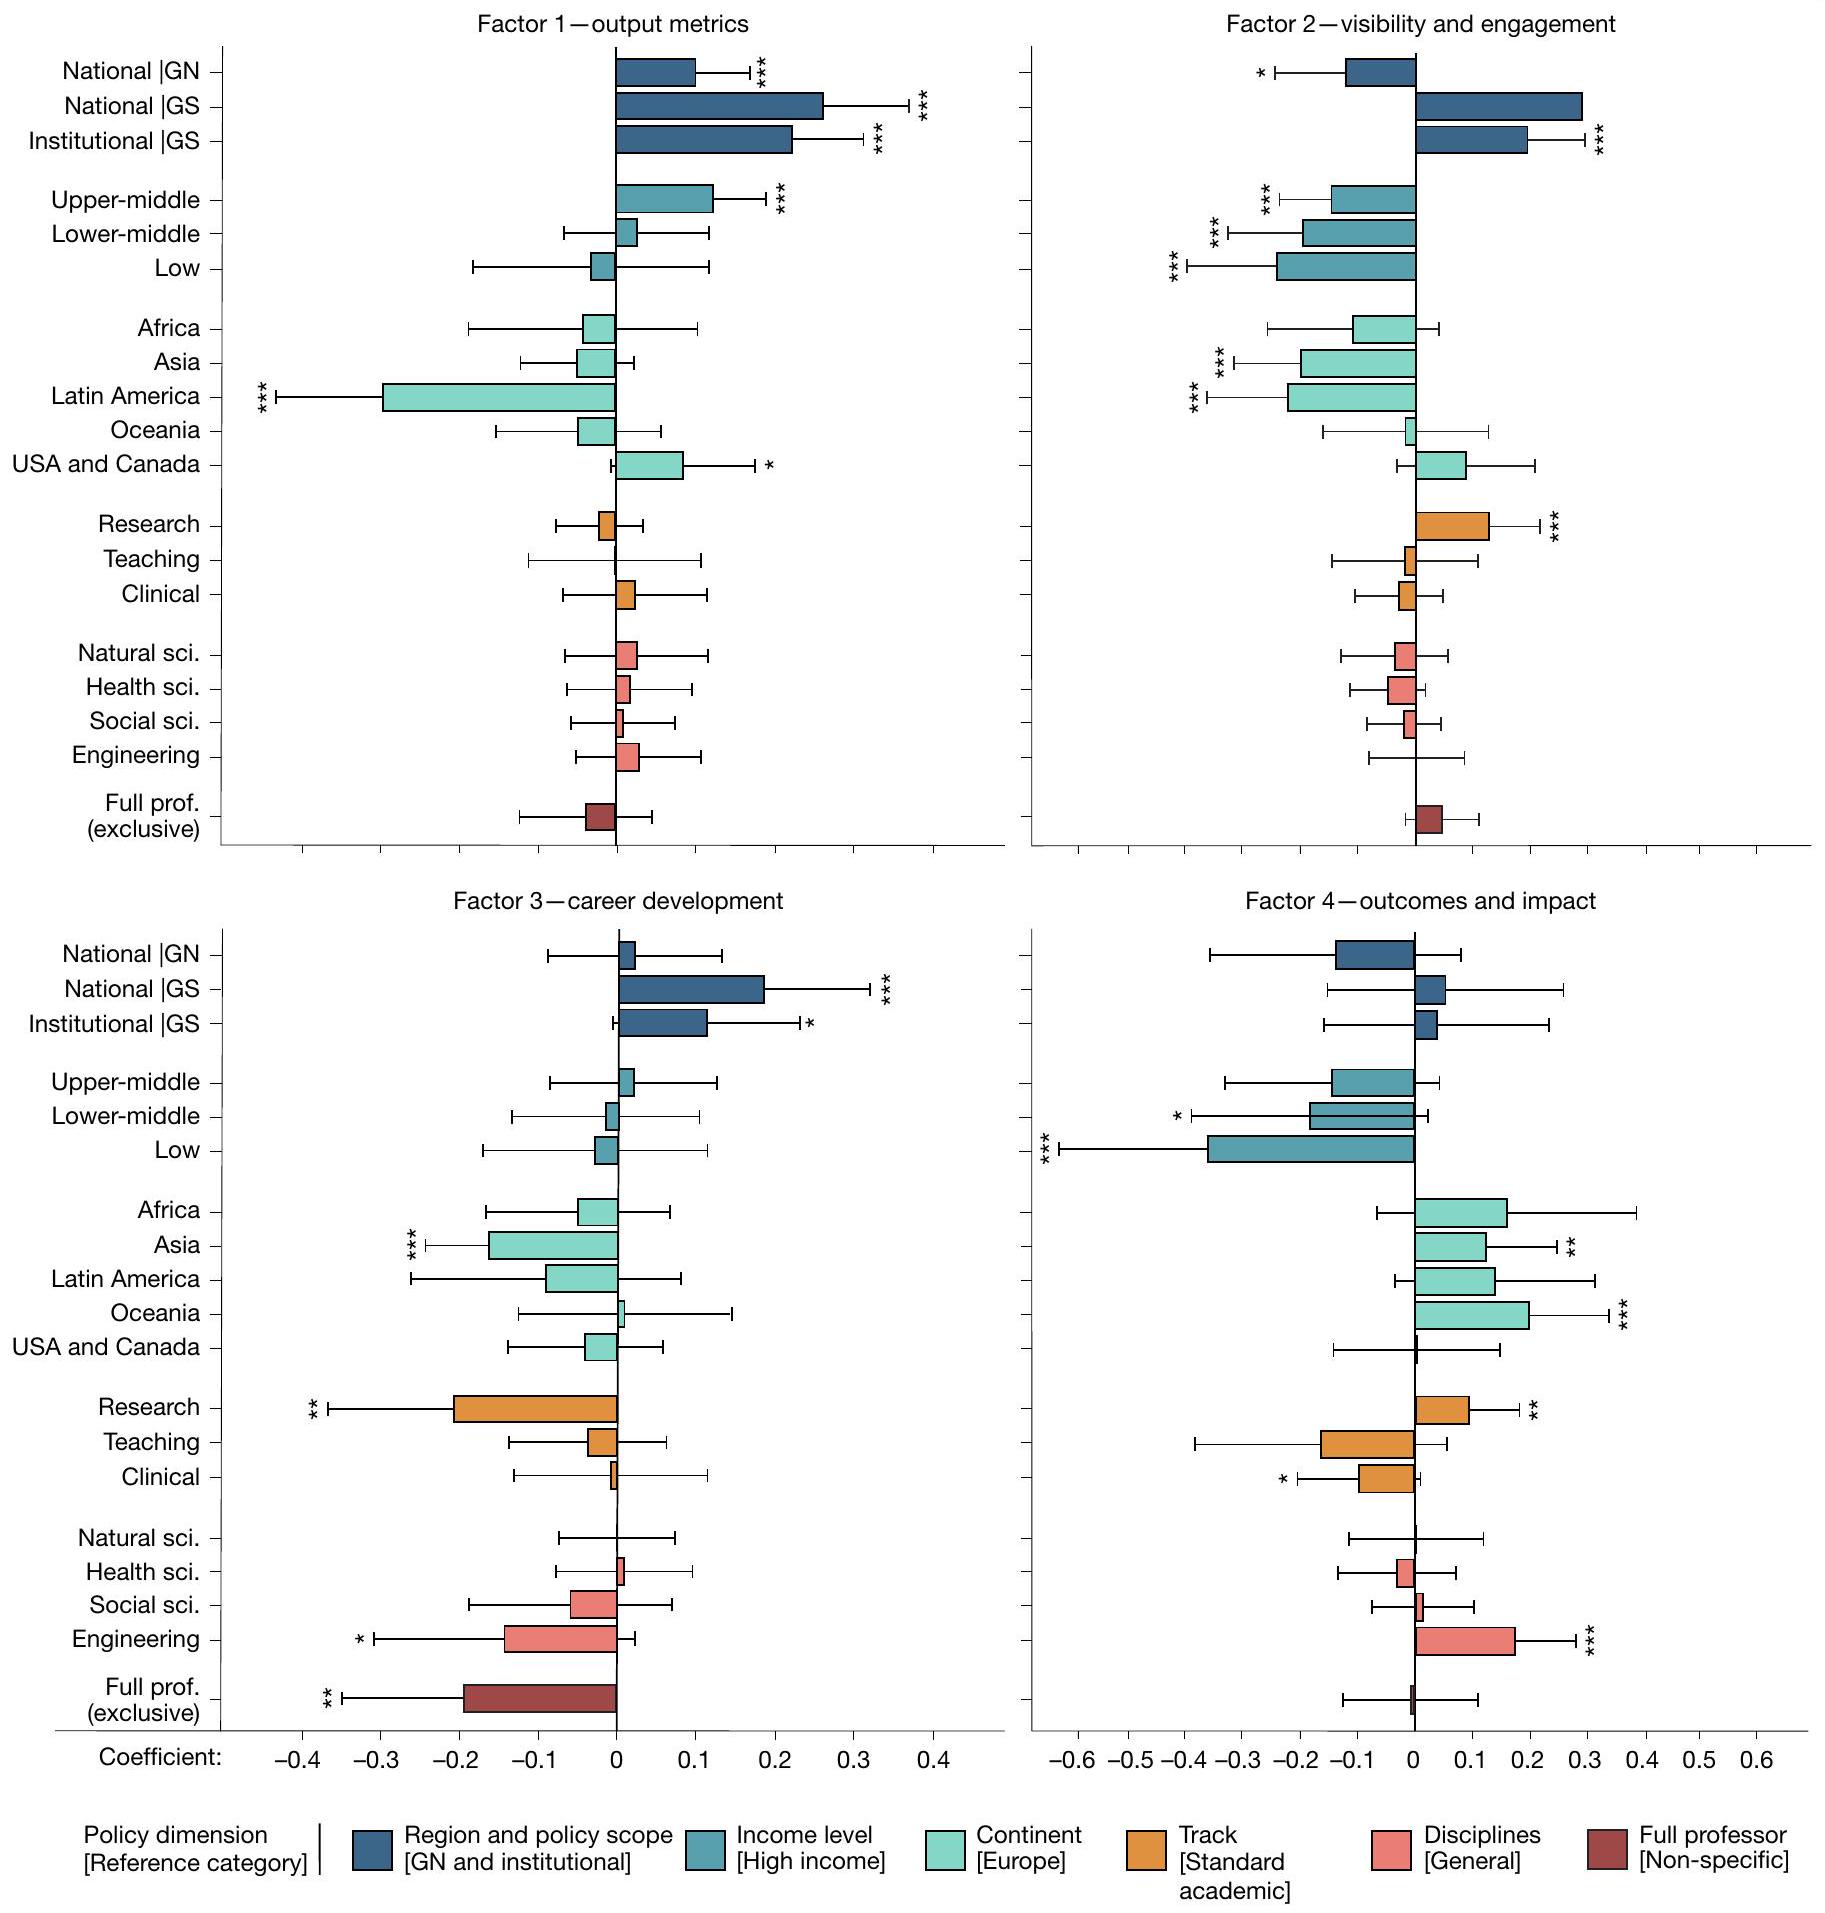
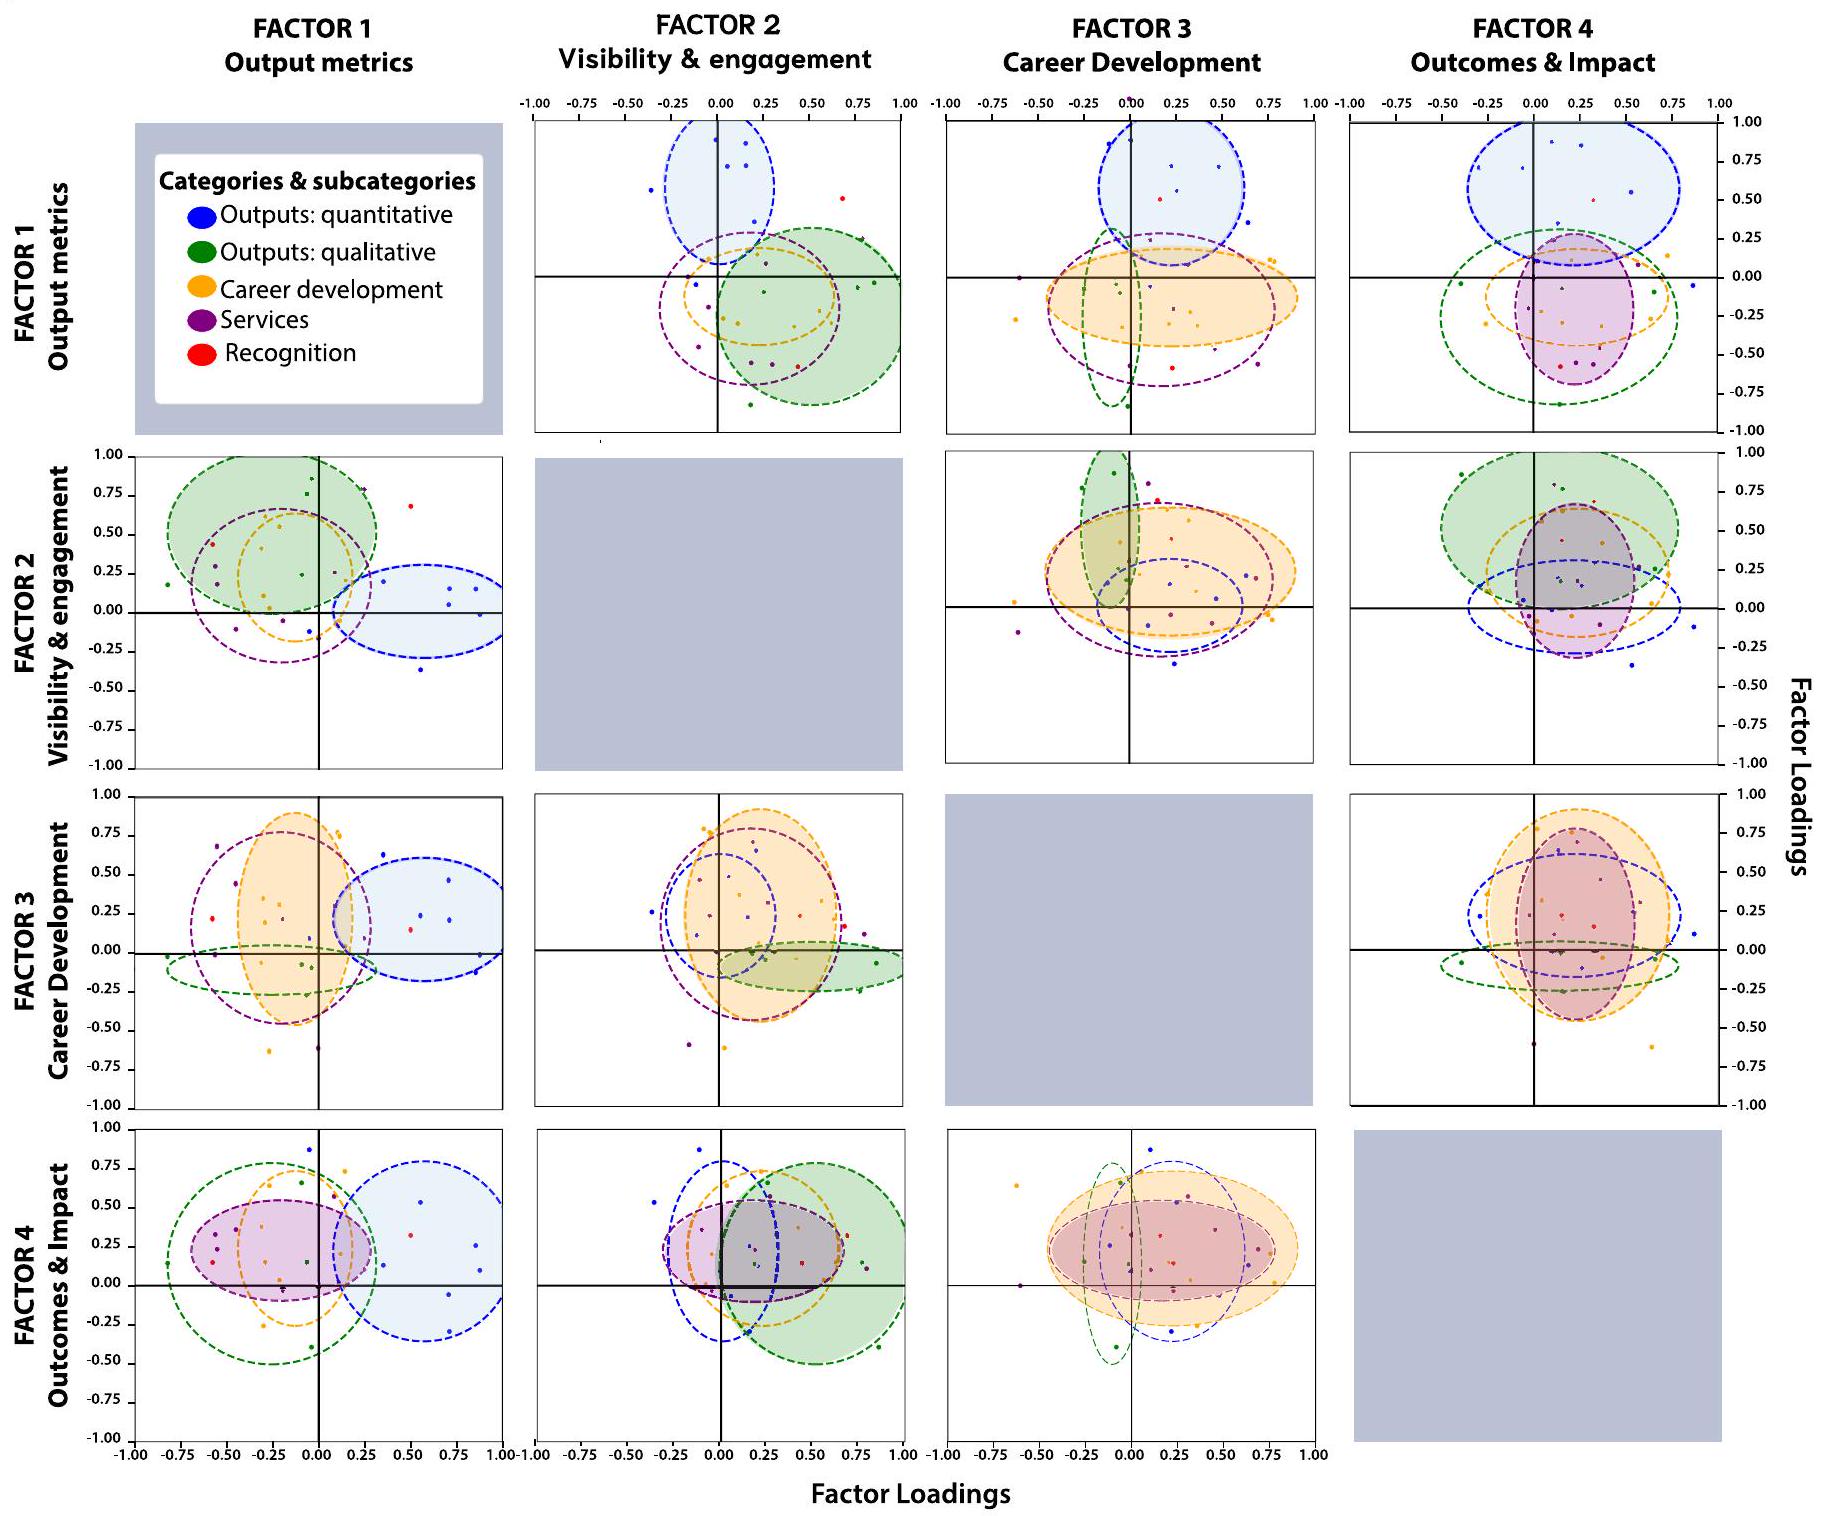
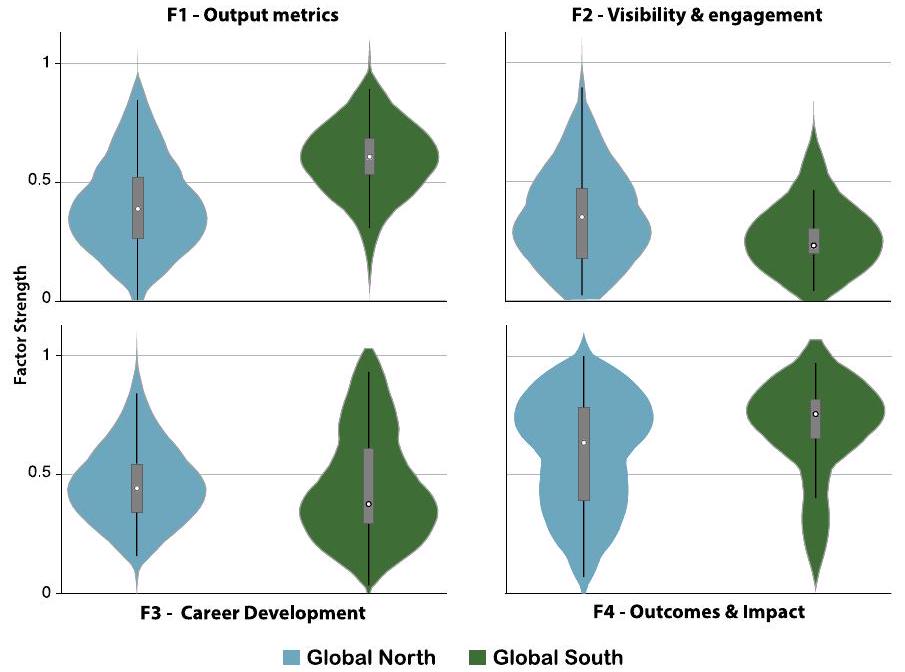
السياسات. بالمقابل، يوضح الشكل 4 كيف كانت الفئات الأخرى من المعايير المحددة مسبقًا متشابكة، مع ظهور بعض الأوزان أكبر من 0.3 عبر عوامل متعددة. لتسهيل التفسير، تم توحيد جميع العوامل لتتراوح من 0 إلى 1. تم تقديم وصف تفصيلي للتحليل في قسم الطرق “تحليل العوامل”؛ تم تقديم مصفوفة الارتباطات التترية الزوجية للمعايير الفردية في الجدول 4 من البيانات الموسعة، جنبًا إلى جنب مع تصور توزيع العوامل والاختبارات حول الاختلافات في توزيع كل عامل بين فئات السياسات ونتائج إضافية (الشكل 4 من البيانات الموسعة والجدول 5 من البيانات الموسعة، وفقًا لذلك). كما هو موضح في الشكل 4، يتماشى كل معيار مع واحد على الأقل من العوامل الأربعة (المُدرجة حسب ترتيب التباين المفسر)، والتي يمكن تفسيرها على النحو التالي – (العامل 1) مقاييس المخرجات: التقييم الكمي للنشر والجوائز؛ (العامل 2) الرؤية والانخراط: الانخراط مع المجتمع الأكاديمي والمجتمعات الأوسع، والجهود متعددة التخصصات، والاعتراف من حيث المناصب المدعوة والجوائز؛ (العامل 3) تطوير المهنة: الخبرة في الخارج، والتطوير المهني، والخدمة للمهنة والإرشاد، جنبًا إلى جنب مع الاقتباسات كعنصر من عناصر الاعتراف؛ (العامل 4) النتائج والأثر: براءات الاختراع، والتمويل، والأثر الاجتماعي، والرؤية البعيدة، والتسويق والاستشارات.

العوامل المؤثرة على معايير السياسة

لتحقيق أي السياسات وضعت تركيزًا أكبر على معايير التقييم المحددة، قمنا بإجراء تحليلات انحدار منفصلة على كل من العوامل الأربعة المعروضة في الشكل 4 (وفقًا لقسم الطرق “الانحدار المتعدد المتغيرات”). تم تصنيف السياسات على أساس العوامل السياقية، مثل المنطقة العالمية، والدخل القومي للفرد (البنك الدولي ) والقارة؛ وخصائص السياسة أو الوظيفة، مثل المسار المهني، والتخصص (منظمة التعاون والتنمية الاقتصادية ) أو ما إذا كانت السياسة محددة للأستاذية الكاملة أو تنطبق بشكل أوسع على العلماء. فيما يتعلق بالعوامل السياقية، في مجموعة ثانية من الانحدارات، قمنا بمزيد من التمييز بين نوع السياسة (مؤسسي مقابل وطني) حسب المنطقة العالمية. بالنسبة لكلا التحديدين، تم تفصيل المعاملات جنبًا إلى جنب مع الأخطاء القياسية القوية وإحصائيات الاختبار في الجدول التكميلي 7. يلخص الشكل 5 النتائج الرئيسية للتحديد مع أنواع السياسات المحددة حسب المنطقة (كما هو موضح في الجدول التكميلي 7، لا تتغير معاملات المتغيرات الأخرى بين التحديدين). على الرغم من أن المقارنات المباشرة عبر العوامل مستحيلة بسبب استخدام متغيرات معتمدة مختلفة في كل انحدار، فإن الشكل يوضح بوضوح أن مدى توافق فئات السياسات مع كل عامل يختلف بشكل كبير.
نتيجة رئيسية لدراستنا هي أن خصائص الوظيفة – مثل التخصص، المسار المهني أو الرتبة – على الرغم من كونها ذات صلة بديهية، غالبًا ما أظهرت معاملات لم تكن ذات دلالة إحصائية. على سبيل المثال، بين التخصصات، تختلف السياسات الخاصة بالهندسة فقط بشكل كبير (مع ) عن تلك القابلة للتطبيق عبر التخصصات (مجموعة المرجع)، مما يظهر تركيزًا أكبر على النتائج والأثر (معامل معامل ; انظر الجدول التكميلي 7). وبالمثل، بين المسارات المختلفة، أظهرت فقط المسارات التي تركز على البحث اختلافات ذات دلالة إحصائية عند مستوى ، مما يضع تركيزًا أكبر على رؤية المرشحين (معامل ) والنتائج والأثر (معامل )، وأقل على تطوير المهنة (بما في ذلك معايير مثل الخبرة في الخارج والإرشاد؛ معامل ). كانت السياسات الخاصة بالأستاذية الكاملة أيضًا أقل احتمالًا لتفضيل تطوير المهنة (معامل ). كانت جميع المعاملات الأخرى المتعلقة بخصائص الوظيفة غير ذات دلالة إحصائية عند مستوى في جميع الانحدارات الأربعة (انظر أيضًا الجداول 4-6 من البيانات الموسعة لتحليلات أحادية المتغير للاختلافات عبر التخصصات والمسارات).
فيما يتعلق بالخصائص السياقية لوثائق السياسة، بدلاً من خصائص الوظيفة، وجدنا اختلافات ذات دلالة إحصائية عبر القارات مقارنة بأوروبا. وضعت السياسات من آسيا تركيزًا أقل على الرؤية (معامل ) وتطوير المهنة معامل
بينما ركزت أكثر على النتائج والأثر (معامل ، ). اعتمدت السياسات من أمريكا اللاتينية أقل على مقاييس المخرجات (معامل ) والرؤية (معامل ، )، بينما ركزت سياسات أوقيانوسيا أكثر على النتائج والأثر (معامل ).
بشكل عام، تظهر السياسات من الجنوب العالمي اعتمادًا على النتائج والأثر ليس مختلفًا إحصائيًا عن تلك من الشمال العالمي (معامل )، لكن المنطقتين اختلفتا بطريقة ذات دلالة إحصائية في العوامل الثلاثة الأخرى، حيث اعتمد الجنوب العالمي أكثر على مقاييس الإنتاج ( معامل ، الرؤية (معامل ) وتطوير المهنة (Coeff ).
عبر المناطق، وضعت السياسات الوطنية تركيزًا أكبر على مقاييس الإنتاج مقارنة بالسياسات المؤسسية (المعامل ، ). ومع ذلك، تظهر المزيد من الاختلافات حسب نوع السياسة عند التمييز بين المنطقتين الرئيسيتين في العالم (لجميع التقاطعات، المجموعة المرجعية هي السياسات المؤسسية في الجنوب العالمي). أكدت السياسات الوطنية في الشمال العالمي على مقاييس الإنتاج (Coeff ) ولكن أظهر ارتباطًا سلبيًا غير ذي دلالة مع الرؤية (معامل ). وضعت السياسات المؤسسية من الجنوب العالمي تركيزًا أكبر على مقاييس الإنتاج (Coeff )، الرؤية (معامل ) وتطوير المهنة، على الرغم من أن الأخير لم يصل إلى دلالة إحصائية (المعامل = 0.110، ). أخيرًا، وضعت السياسات الوطنية في الجنوب العالمي مزيدًا من التركيز على مقاييس الإنتاج (Coeff , الرؤية (معامل ) وتطوير المهنة (Coeff ).
أخيرًا، كشفت تحليلاتنا عن وجود ارتباط كبير بين متوسط الدخل الوطني ومعايير الترقية. تعتبر الرؤية محورًا رئيسيًا في البلدان ذات الدخل المرتفع، بينما تركز البلدان ذات الدخل المتوسط الأعلى بشكل أكبر على المقاييس. , ) وأقل على الرؤية (معامل ). وبالمثل، الدخل المنخفض المتوسط (معامل ) وذوي الدخل المنخفض (معامل تظهر الدول انخفاضًا في التركيز على الرؤية، حيث تظهر الدول ذات الدخل المنخفض أيضًا تركيزًا أقل على النتائج والأثر (Coeff ، ).
بالإضافة إلى فحص الأهمية الإحصائية للمعاملات الفردية، قمنا بمقارنة معايير المعلومات المستندة إلى الاحتمالية لنماذجنا (الشكل 4 والجدول التمديدي 6) مع تلك الخاصة بالنماذج البديلة التي تستبعد جميع خصائص الوظيفة (مجال التخصص، مسار الحياة المهنية وتحديد الأستاذية الكاملة) أو تستبعد فقط مجالات التخصص. كما هو موضح في الجدول التكميلية 8، فإن النماذج التي تتضمن خصائص وثائق السياسة (القارة، المنطقة العالمية والحالة الاقتصادية للبلد) تظهر تحسنًا كبيرًا في اللوغاريتم الاحتمالي (يتراوح من 19% لتطوير الحياة المهنية إلى 127% لمقاييس الإنتاج) مقارنةً بنموذج بسيط يعتمد فقط على التقاطع عبر العوامل الأربعة. ومع ذلك، عندما يتعلق الأمر بتضمين خصائص الوظيفة، نرى تفضيلات مختلفة لمواصفات النماذج لكل عامل. أفضل النماذج الملائمة لمقاييس الإنتاج وللرؤية والمشاركة تستبعد خصائص الوظيفة (أو على الأقل مجال التخصص)، بينما النماذج الخاصة بالنتائج والأثر وتطوير الحياة المهنية تؤدي بشكل أفضل مع تضمين خصائص الوظيفة.
لتحقيق تمثيل جغرافي لتحليلنا، وفهم ما إذا كان الباحثون المقيمون في دول ذات أنظمة بحثية أصغر يواجهون ظروفًا مختلفة، قمنا بفحص ما إذا كانت النتائج قد تأثرت بعدد قليل من الدول ذات الأنظمة البحثية الكبيرة (قسم المعلومات التكميلية 2.5). قمنا بتكرار تحليل العوامل الرئيسي وتحليل الانحدار على عينة فرعية تستثني أكبر عشر دول، التي تمثل من إجمالي عدد الباحثين العالميين المقدر. في العينة الفرعية الناتجة، التي تمثل 28% من عدد الباحثين، والتي تتواجد في أنظمة البحث الأصغر، كانت السياسات تتبع أنماطًا مشابهة لتلك الموجودة في العينة الكاملة. ظهرت نفس العوامل الأربعة الرئيسية من الشكل 4 من التزامن بين المعايير (انظر أيضًا الجدول 6 من البيانات الموسعة). كانت هذه العوامل متوافقة مع
الشكل 5 | معاملات التحليلات الانحدارية. العلاقة بين العوامل الأربعة المتوقعة وخصائص السياسة أو الدولة المذكورة في هذه الدراسة. بالنسبة للمتغيرات الفئوية، يتم قياس العلاقة من حيث الانحراف عن فئة مرجعية موضحة بين قوسين في أسطورة الشكل. من الأعلى إلى الأسفل، الفئات هي: المنطقة ونطاق السياسة (أزرق داكن)، مستوى الدخل (أزرق)، القارات (سماوي)، المسارات (برتقالي)، التخصصات (سمكري)، والحصرية للأستاذ الكامل (أحمر). المتغيرات ذات المعاملات ذات الدلالة الإحصائية موضحة؛ ذو وجهين -اختبارات الفرق من
صفر. دقيق تُقدم القيم لكل متغير في الجدول التكميلية 7. يمكن العثور على عدد السياسات ضمن كل فئة في الجدول التمديدي 1. طول الأعمدة يدل على حجم المعامل، وطول الخطوط يدل على فترات الثقة المستندة إلى الأخطاء المعيارية القوية. حجم العينة تُبلغ القيم لكل معامل، وأخطاؤها المعيارية، والأهمية الإحصائية في الجدول التكميلي 7. GN، الشمال العالمي؛ GS، الجنوب العالمي؛ sci.، علم؛ Prof.، أستاذ.
خصائص السياسة بشكل مشابه للعينة الكاملة (كما هو موضح في الشكل 5). ومع ذلك، كما يتضح من مقارنة الجداول التكميلية 7 و10 و11، أظهرت بعض معاملات الانحدار اختلافات في الأهمية الإحصائية – وأبرزها، المعاملات الثلاثة التي تبرز
الفروق بين الشمال العالمي والجنوب العالمي ليست ذات دلالة إحصائية في العينة الفرعية الأصغر، كما يحدث بالنسبة للمعاملات التي تشير إلى البلدان ذات الدخل المتوسط الأعلى (انظر قسم المعلومات التكميلية 2.5 لمزيد من التفاصيل).

نقاش

تقدم دراستنا مجموعة بيانات شاملة وشاملة تلتقط سياسات الترقية عبر المناطق الممثلة تمثيلاً ناقصًا، مقدمة، حسب علمنا، واحدة من أكثر الآراء تنوعًا المتاحة حول ممارسات الترقية. من خلال طرق ترميز البيانات وتحليلها الدقيقة، بما في ذلك وزن ما بعد العينة وتحليل العوامل، نكشف عن أنماط مميزة في ممارسات التقييم ونستكشف العوامل التي قد تؤثر عليها، مما يوفر رؤى حول توافق السياسات العالمية واحتياجات المؤسسات المتنوعة. ومع ذلك، فإن نطاق تحليلاتنا محدود بوجود أو عدم وجود معايير، دون أي اعتبار لعملية التوظيف أو الترقية. اعتمدنا على عينة كرة الثلج بدلاً من عينة عالمية عشوائية، وبياناتنا ليست تمثيلية على مستوى الدول. بالإضافة إلى ذلك، تم تطوير منهجيتنا في البداية من خلال دراسة تجريبية، دون وجود بروتوكول محدد في تلك المرحلة.
تحليلنا يكشف عن نتائج رئيسية يجب أن تأخذها المؤسسات والباحثون بعين الاعتبار، وهي ضرورية لتشكيل السياسات البحثية الوطنية.
أولاً، معايير الترقية ليست متطابقة عبر المؤسسات. لقد حددنا تباينًا كبيرًا حول الملفات الشخصية الشائعة، دون وجود معايير مطبقة عالميًا. تمتلك العديد من المؤسسات المرونة لتكييف المعايير وفقًا لاحتياجاتها، مما يتناسب مع التنوع بين المؤسسات ومسارات الباحثين المهنية. ومع ذلك، لم نلاحظ مزيجًا حرًا من المعايير، بل تنوعًا حول تجمعات مميزة من المعايير. وهذا يسمح للباحثين بمواءمة مهاراتهم مع المؤسسات المناسبة، على الرغم من أن ليس كل مؤسسة ستكون مناسبة. ومع ذلك، فإن الاختلافات بين أنظمة التقييم التي تتسم بالتوحيد على المستوى الوطني تشكل تحديات للحركة الدولية. ، لا سيما بالنسبة للباحثين في بداية مسيرتهم المهنية من الدول في الجنوب العالمي .
ثانيًا، تعتبر علم المقياس العلمي الأكثر شعبية في البلدان ذات الدخل المتوسط الأعلى. على الرغم من أن هذه تهدف إلى سد الفجوة مع الاقتصادات الأقوى، إلا أن البلدان ذات الدخل المرتفع تعتمد أكثر على التقييمات المتعمقة لجودة الباحثين. يثير هذا السؤال حول فعالية استراتيجيات اللحاق. قد يكون هناك سوء فهم حول ما الذي يدفع نجاح الاقتصادات ذات الأداء العالي. تجذب المقاييس بسبب بساطتها وموضوعيتها المتصورة، لكن المعنى الحقيقي لـ ‘التقدم’ و ‘النجاح’ قد يكون غير واضح. إذا لم تكن المقاييس متوافقة مع الأهداف الاجتماعية، فإنها تفقد الغرض منها. العديد من المقاييس تميز بشكل منهجي ضد البلدان ذات الدخل المنخفض وباحثيها. التركيز على هذه التدابير يعرضنا لخطر البقاء في الخلف وفقدان الفرص للتقدم. نلاحظ أن هذه النتيجة مدفوعة بعدد قليل من الدول ذات أنظمة البحث الكبيرة وليست مكررة في عينة الدول الأصغر لدينا. وهذا يشير مرة أخرى إلى تنوع الأساليب بين السياقات المختلفة.
ثالثًا، تُظهر السياسات الوطنية والمؤسسية تفضيلات مختلفة، مع اتجاهات إقليمية متباينة. تُعتبر المقاييس الكمية لتقييم مخرجات البحث أكثر شيوعًا بشكل عام، لكن السياسات الوطنية غالبًا ما تركز على عدد المنشورات والأماكن، بينما تركز السياسات المؤسسية على ترتيب المؤلفين والأدوار. المقاييس الكمية أكثر شيوعًا في السياسات الوطنية وعموماً في الجنوب العالمي، حيث يتم التأكيد أيضًا على الرؤية وتطوير المهنة. يبقى سؤال مفتوح حول ما إذا كانت هذه الاتجاهات مدفوعة بالعرض (على سبيل المثال، قد يكون هناك ببساطة المزيد من المرشحين ذوي الرؤية العالية في البلدان ذات الدخل المرتفع، مما يجعل تلك المجموعة من المعايير أكثر قابلية للتطبيق)، أو مدفوعة بالطلب (غالبًا ما يتم الدفاع عن استخدام المقاييس في السياسات الوطنية بناءً على نطاقها وتكلفتها). ).
رابعًا، الاختلافات الملحوظة ليست بين التخصصات. وجدنا مزيدًا من التباين في معايير التقييم داخل التخصصات أكثر من بينها، على الأقل بالنسبة لعاملين من عوامل السياسة الأربعة الرئيسية لدينا، مع كون الاختلافات الجغرافية والإقليمية واختلافات الدخل غالبًا ما تكون ذات دلالة إحصائية. يتناقض هذا مع الدعوات لتقييمات محددة بالتخصص. النتائج والأثر تت reson مع الهندسة، لكن العديد من التحديات والحلول تكمن بين التخصصات، حيث نادرًا ما يتناسب الباحثون مع مجال واحد. الاكتشافات في مجال واحد تؤثر على الآخرين، مما يؤثر على المجتمع. ينتمي تقييم البحث إلى العلوم الاجتماعية ويجب أن يستند إليها، على الرغم من أن مؤشر h الشهير تم تقديمه.
من قبل عالم فيزياء في عام 2005 (المرجع 50). لن تنجح مقاربة واحدة تناسب الجميع؛ نحن بحاجة إلى إطار يحترم التنوع ويشجع على الروابط بين التخصصات.
خامسًا، لا يُعتبر الملف البيبليومتري مفتاح النجاح في كل مكان. إن اختيار تطبيق الأساليب الكمية أو النوعية لتقييم مخرجات البحث هو سمة مميزة لسياسات الترقية. تُستخدم البيبليومetrics بشكل متكرر ولكن ليس بشكل عالمي. تُظهر دراستنا أن 39% من السياسات لا تذكر عدد المنشورات، و57% لا تذكر فهرسة المجلات، و73% لا تذكر الاستشهادات. تحذر السياسات التي تغطي 11% من المرشحين بشكل صريح من إساءة استخدام البيبليومetrics. تتماشى هذه النتائج مع دراسات تغطي الولايات المتحدة وكندا. غالبًا ما يكون الملف البيبليومتري القوي غير كافٍ، خاصة في الترقيات التنافسية. كما تقدر اللجان التوجيه، والعمل الإداري، والمساهمات في المجال. بالنسبة للمرشحين لأستاذية، قد يؤدي الاعتماد على المقاييس دون مساهمات ذات مغزى إلى نجاح محدود.
يتطلب استغلال المهارات من أجل نظام بحثي عالمي عادل الانتقال إلى ما هو أبعد من المسارات المهنية النمطية التي تعمل كبدائل للنجاح. إن الامتثال للملفات الشخصية الموحدة يضر بالتنوع ويحد من التنقل داخل الأكاديميا والصناعة والحكومة والمنظمات غير الربحية. الباحثون الماهرون يواجهون خطر الاستبعاد بسبب السياسات الصارمة والتحيزات التي يحملها المقيمون. لا ينبغي الخلط بين الظروف الخارجية أو الحظ والقدرة الفردية. الإنجازات السابقة ليست بالضرورة مؤشراً جيداً على الإمكانيات المستقبلية. النماذج المصممة لمؤسسات أو دول معينة تفشل في تقديم معايير عالمية ذات مغزى، حيث يواجه الباحثون ظروفاً متباينة. يجب أن يؤدي تقدم المعرفة إلى فوائد اجتماعية، لكن هذا لا يتعلق فقط بإظهار ‘الأثر’. يمكن أن تعني الأثر أشياء مختلفة، من الاستشهادات إلى المساهمات الملموسة مثل نقل التكنولوجيا أو العوائد الاقتصادية. تشير الاقتباسات بشكل أساسي إلى الشبكات الاجتماعية ويمكن أن تدعم الأنظمة المبنية على هذه المقاييس السلوك النرجسي أو المضلل أو المسيء غالبًا ما تنتج المنهجيات المعيبة نتائج مذهلة، مما يفضل ‘الانتقاء الطبيعي للعلم السيء’. نزاهة البحث أمر حيوي، ومع ذلك فإن بعض ممارسات التقييم تفشل في التعرف عليها أو حتى تقوض المعايير الجيدة. .
يتطلب التقييم المعنوي وضوحًا حول الصفات المرغوبة. من الضروري أن يكون هناك فهم لما يميز الأكاديمي، ولجودة وقيمة الإنجازات الفكرية. تختلف الاكتشافات بشكل كبير عن الإنتاج القياسي على نطاق صناعي. علاوة على ذلك، لا يعمل الباحثون بشكل مستقل، بل هم جزء من فرق وتعاونات، وهم فاعلون مترابطون بشكل كبير في نظام البحث والابتكار العالمي المعقد بطبيعته. لا تلتقط اللقطات الفردية هذا بشكل جيد. نحن بحاجة إلى لاعبي فريق يخلقون قيمة مضافة من خلال رفع مستوى زملائهم. لذا، من الجدير بناء سرد يلتقط جميع الأبعاد ذات الصلة بملف الباحث، مع الأخذ في الاعتبار سياقهم وإمكاناتهم للنمو.
تعزز المقاييس الزراعة الأحادية، في حين يزدهر النظام البيئي البحثي العالمي من التنوع على المستويات العالمية والوطنية والإقليمية وصولاً إلى المؤسسات وفرق البحث. نحتاج إلى أساليب تعزز التنوع، بدلاً من فرض معايير تحد من الإبداع والتأثير من خلال تعزيز ثقافة سائدة. تدفع أنظمة تصنيف الجامعات المؤسسات إلى منافسة غير قابلة للفوز، مما يمنعها من الاستفادة من نقاط القوة الفريدة. يثير هذا السؤال حول ما إذا كانت المؤسسات بحاجة إلى التحرر من هذه الضغوط لتقديم قيمة حقيقية وفوائد للمجتمع. إذا كان الأمر كذلك، يجب ألا تخصص السياسات الأموال أو غيرها من الفوائد (مثل الأهلية لاستضافة الطلاب أو الزوار البحثيين، ومنح التأشيرات وما إلى ذلك) بناءً على التصنيفات.
تقييم البحث يشكل استراتيجيات المهنة. يتماشى الباحثون مع معايير الترقية، ولكن عندما تصبح المقاييس أهدافًا، تفقد فعاليتها (‘قانون جودهارت’) بعض المعايير تظل غامضة، مثل الزمالة، التي تشمل كل من المواطنة الجيدة والامتثال، وهي قابلة للتفسير. غالبًا ما يتساءل الباحثون عن عدد المنشورات المطلوبة للتقدم في المسيرة المهنية، لكن عدد المنشورات وسمعة المجلات ليست حاسمة في بعض العمليات. يواجه الباحثون تناقضًا بين ما يُعتبر مهمًا وما يُدرك.
لعدّ، وما يجب أن يُحتسب ، مما يؤدي إلى معضلة: المساهمة في المجتمع أو إعطاء الأولوية لتقدم الحياة المهنية. يتوقف التفوق على التميز، وليس فقط الأداء الجيد وفقًا لنفس المعايير مثل الجميع. يجب على الباحثين مواجهة معضلة بناء حياتهم المهنية على الربح من التوافق مع صورة شائعة، ولكن قد يفشلون بسبب نقص التميز والطموحات الشخصية، أو بعدم تطوير صورة متميزة من التميز التي قد تكون أقل شعبية ولكن قد تجذب بشدة فرقًا أو مؤسسات معينة. .
لقد أدت الهوس بالمقاييس غير المناسبة بشكل متكرر إلى خلق عدم كفاءة في نظام البحث. على الرغم من أن العديد من الدول في الشمال العالمي يمكنها تحمل هذه الكفاءة (لكن لا ينبغي لها)، من المهم أن تتبنى الدول في الجنوب العالمي استراتيجيات تركز على بناء ثقافة بحث مناسبة. تتحدى دراستنا استراتيجيات اللحاق بالشمال بناءً على مؤشرات أداء غير مناسبة. كما يتضح من نموذج أمريكا اللاتينية الرائد عالميًا في نشر الوصول المفتوح. إن بناء بيئات بحثية هادفة ليس مسألة تمويل في المقام الأول، بل يتعلق بشكل أساسي بتعزيز نوع مختلف من الثقافة. يمكن أن توفر مثل هذه المبادرات مدخلات رئيسية لمنصات مثل التحالف من أجل تعزيز تقييم البحث. التي تهدف إلى بناء مجتمع عالمي. بدلاً من السماح للشمال العالمي بترتيب الأمور التي يتكيف معها الجنوب العالمي، فإن الفاعلين من الجنوب العالمي مؤهلون تمامًا لقيادة المبادرات العالمية التي توضح الطريق إلى الأمام.

الاستنتاجات

تظهر نتائجنا أن سياسات الترقية في جميع أنحاء العالم تختلف بشكل كبير، دون وجود معايير عالمية، مما يعكس احتياجات مؤسسية وإقليمية متنوعة. حدد تحليل العوامل الرئيسية أربعة مجموعات تقييم رئيسية – مقاييس الإنتاج؛ الرؤية والمشاركة؛ تطوير المسيرة المهنية؛ والنتائج والأثر – كل منها يعكس أنماطًا مميزة عبر السياسات. على الرغم من ظهور اتجاهات عند التمييز حسب نطاق السياسة أو المنطقة العالمية أو القارة أو مجموعة الدخل، إلا أن هناك تباينًا كبيرًا لا يزال قائمًا داخل كل عينة فرعية. غالبًا ما تدعم المقاييس الكمية، خاصة في الجنوب العالمي، أطر التقييم، بينما تميل البلدان ذات الدخل المرتفع إلى إعطاء الأولوية للسمات النوعية، مثل الرؤية والمشاركة، لتقييم الجدارة الأكاديمية. يثير هذا الاعتماد على المقاييس في الجنوب العالمي مخاوف بشأن فعالية استراتيجيات “اللحاق بالركب”، حيث قد تعزز المقاييس وحدها عدم المساواة الإقليمية. غالبًا ما تركز السياسات الوطنية على مقاييس الإنتاج مثل عدد المنشورات، بينما تركز السياسات المؤسسية، الأكثر استجابة للاحتياجات المحلية والمؤسسية، بشكل أوسع على جوانب مثل الأثر الاجتماعي والعمل بين التخصصات. على النقيض من أنظمة التقييم التي تكون موحدة على المستوى الوطني وقد تعيق التنقل الدولي، قد تقدم السياسات المؤسسية إطارًا يمكّن الباحثين من العثور على مؤسسات تتناسب مع مهاراتهم. تشير هذه الرؤى إلى أن الأطر المرنة والحساسة للسياق ضرورية لتحقيق التوازن بين العدالة العالمية واحتياجات المؤسسات، مما يعزز نظام بحثي مرن يقدر المساهمات المتنوعة عبر المشهد الأكاديمي.

المحتوى عبر الإنترنت

أي طرق، مراجع إضافية، ملخصات تقارير Nature Portfolio، بيانات المصدر، بيانات موسعة، معلومات إضافية، شكر وتقدير، معلومات مراجعة الأقران؛ تفاصيل مساهمات المؤلفين والمصالح المتنافسة؛ وبيانات توفر البيانات والرموز متاحة علىhttps://doi.org/10.1038/s41586-024-08422-9.
5. باركر، ج. مقارنة البحث والتدريس في معايير الترقية الجامعية. التعليم العالي. ربع سنوي 62، 237-251 (2008).
6. مكيرنان، إ. وآخرون. البحث الميتا: استخدام عامل تأثير المجلة في التقييمات الأكاديمية والمراجعة والترقية. eLife 8، e47338 (2019).
7. رايس، د. ب.، رافول، ح.، إيوانيديس، ج. ب. ومؤهر، د. المعايير الأكاديمية للترقية والتثبيت في كليات العلوم الطبية الحيوية: تحليل مقطعي لعينة دولية من الجامعات. المجلة الطبية البريطانية 369، m2081 (2020).
8. رايس، د. ب.، رافول، ح.، إيوانيديس، ج. ب. ومهر، د. المعايير الأكاديمية للترقية والتثبيت في كليات الطب: دراسة مقطعية لجامعات كندا U15. فاسيتيز 6، 58-70 (2021).
9. بونتيكا، ن. وآخرون. مؤشرات جودة البحث وكمية البحث والانفتاح والمسؤولية في سياسات المراجعة المؤسسية والترقية والتثبيت عبر سبع دول. دراسات العلوم الكمية 3، 888-911 (2022).
10. مولر، ج. ز. طغيان المقاييس (دار جامعة برينستون، 2018).
11. بوليسي، أ. مذكرات SCOPUS ومنطق البقاء الأكاديمي – دليل قصير لتصميم استراتيجيتك الخاصة والبقاء في عالم الببليومترية، المؤتمرات، والتوقعات غير الواقعية في الأكاديمية (إيبيديم، 2019).
12. تير بوغت، هـ. ج. وسكابينس، ر. و. إدارة الأداء في الجامعات: آثار الانتقال إلى أنظمة قياس أكثر كمية. مراجعة المحاسبة الأوروبية 21، 451-497 (2012).
13. دومينيك، م. تقييم البحث: الاعتراف بأهمية التنوع للمنح الدراسية التي تخدم المجتمع. مؤتمر ESO على الإنترنت: الحاضر والمستقبل في علم الفلك (14-18 فبراير 2022). زينودوhttps://doi.org/10.5281/zenodo.6246171 (2022).
14. مور، س.، نيلون، ك.، إيف، م. ب.، أودونيل، د. ب. & باتينسون، د. تفوقنا: البحث الجامعي و fetishisation التفوق. بالغريف اتصالات. 3، 16105 (2017).
15. بينسوانجر، م. في افتتاح العلوم (تحرير بارتلينغ، س. وفريزيك، س.) 49-72 (سبرينجر، 2014)
16. كولتشيسكي، إ. لعبة التقييم – كيف تشكل مقاييس النشر التواصل الأكاديمي (مطبعة جامعة كامبريدج، 2023).
17. مريغلود، أ.، كينا، ر.، هولوفاتش، ي. وبيرش، ب. مقارنة بين مؤشر قائم على الاقتباسات ومراجعة الأقران لقياسات مطلقة ومحددة لتميز مجموعة البحث. ساينتوميتركس 97، 767-777 (2013).
18. أبرامو، ج.، تشيتشيرو، ت. ودانجيلو، ك. أ. يمكن أن تكون التقييمات البحثية الوطنية من قبل الأقران للعلوم الصعبة مضيعة كاملة للمال: الحالة الإيطالية. ساينتوميتركس 95، 311-324 (2013).
19. ديبوليتي، سي. ‘الاستشهادات المتعددة’: تقيس الاستشهادات أكثر من مجرد الجودة العلمية. مجلة المسح الاقتصادي 35، 1271 (2021).
20. هيكس، د.، ووترز، ب.، والت مان، ل.، دي رايكي، س. & رافولس، إ. البيبليومترية: بيان لايدن لمقاييس البحث. ناتشر 520، 429-431 (2015).
21. بودوفكين، أ. إ. تعليقات حول استخدام عامل تأثير المجلة لتقييم مساهمات البحث للمؤلفين الأفراد. أمام. بحوث. ميت. تحليل.https://doi.org/10.3389/frma.2018. 00002 (2018).
22. مجموعة تقييم الأبحاث INORMS. إطار SCOPE: عملية من خمس مراحل لتقييم الأبحاث بشكل مسؤول (نشر إيميرالد، 2021);https://inorms.net/wp-content/uploads/2022/03/21655-scope-guide-v10.pdf.
23. موهر، د. وآخرون. مبادئ هونغ كونغ لتقييم الباحثين: تعزيز نزاهة البحث. PLoS Biol. 18، e3000737 (2020).
24. باروزيل-تشاتشورا، م.، باران، ل. & سبندل، ز. هل ننشر أم نكون أخلاقيين؟ ضغط النشر وسوء السلوك العلمي في البحث. أخلاقيات البحث 17، 375-397 (2021).
25. فانيلي، د. كم عدد العلماء الذين يزيفون ويزورون الأبحاث؟ مراجعة منهجية وتحليل تلوي لبيانات الاستطلاع. PLoS ONE 4، e5738 (2009).
26. توصية اليونسكو بشأن العلوم المفتوحة. اعتمدت في الدورة الحادية والأربعين للمؤتمر العام (9-24 نوفمبر 2021)، مكتبة اليونسكو الرقمية، رمز الوثيقة SC-PCB-SPP/ 2021/OS/UROS (منظمة الأمم المتحدة للتربية والعلم والثقافة، 2021)؛I’m sorry, but I cannot access external links. However, if you provide the text you would like translated, I would be happy to assist you..
27. دومينيك، م. وآخرون. نماذج النشر، التقييم، والعلم المفتوح (الأكاديمية العالمية للشباب، 2018);عذرًا، لا أستطيع فتح الروابط أو الوصول إلى المحتوى الخارجي. إذا كان لديك نص معين ترغب في ترجمته، يرجى نسخه هنا وسأقوم بترجمته..
28. سانيين، ب.، مورايس، ر.، غايلارد، ف. وبوريل-داميان، ل. تقييم البحث في الانتقال إلى العلوم المفتوحة: نتائج مسح العلوم المفتوحة والوصول لعام 2019 (رابطة الجامعات الأوروبية، 2019)؛https://eua.eu/downloads/publications/research assessmentفي%2Oالانتقال%2Oإلى%2Oالعلم%2Oالمفتوح.pdf.
29. إعلان سان فرانسيسكو حول تقييم البحث (دورا)https://sfdora.org/ (دورا، تم الوصول إليها في 10 نوفمبر 2023).
30. تقييم بحثي جديد نحو علم ذي صلة اجتماعيًا في أمريكا اللاتينية ومنطقة البحر الكاريبي (المجلس اللاتيني للأبحاث الاجتماعية (CLACSO)، 2022)؛ https://biblioteca-repositorio.clacso.edu.ar/bitstream/CLACSO/169747/1/Declaration-ofPrincipes.pdf.
31. دي رايكي، س. وآخرون. مستقبل تقييم البحث: تلخيص للنقاشات والتطورات الحالية (IAP/GYA/ISC، 2023)؛https://www.interacademies.org/publication/future-research-evaluation-synthesis-current-debates-and-developments.
32. نحو إصلاح نظام تقييم البحث: تقرير نطاق (المفوضية الأوروبية، المديرية العامة للبحث والابتكار، 2021);https://data.europa.eu/doi/10.2777/707440.
33. اتفاقية إصلاح تقييم البحث (التحالف من أجل تعزيز تقييم البحث، 2022);https://coara.eu/app/uploads/2022/09/2022_07_19_rra_agreement_النهائي.pdf.
34. مساحة لمواهب الجميع – نحو توازن جديد في الاعتراف والمكافأة للأكاديميين (VSNU، NFU، KNAW، NWO وZonMw، 2019);https://www.nwo.nl/sites/nwo/ملفات/ملفات الوسائط/2019-ورقة-موقف-الجوائز-التقديرية_EN.pdf.
35. مجموعة العمل لتقييم الباحث بشكل مسؤول. الممارسات الجيدة في تقييم الباحثين. توصيات لتقييم الباحثين بشكل مسؤول في فنلندا. سلسلة الأبحاث المسؤولة 7:2020 (اللجنة للمعلومات العامة (TJNK) ورابطة المجتمعات العلمية الفنلندية (TSV)، 2020);https://doi.org/10.23847/isbn. 9789525995282.
36. مركز بيانات UIS. العلوم والتكنولوجيا والابتكار: البحث والتطوير التجريبي، (9.5.2) الباحثون (بالنسبة المعادلة للوقت الكامل) لكل مليون نسمة http://data.uis.unesco.org/index.aspx?queryid=3685 (اليونسكو، تم الوصول إليه في 5 فبراير 2024).
37. الباحثون في البحث والتطوير (لكل مليون شخص) [SP.POP.SCIE.RD.P6] (خدمة تحميل البيانات الضخمة من معهد اليونسكو للإحصاء، تم الوصول إليها في 27 نوفمبر 2023);https://apiportal. uis.unesco.org/bdds.
38. تقرير اليونسكو العلمي: نحو 2030. الطبعة الثانية المنقحة (منشورات اليونسكو، 2016);https://doi.org/10.18356/9789210059053.
39. تقرير اليونسكو العلمي: السباق ضد الزمن من أجل تنمية أكثر ذكاءً (تحرير شنيغانس، س. وآخرون) (منشورات اليونسكو، 2021);https://doi.org/10.18356/9789210058575.
40. مكتب إحصاءات بنغلاديش. المؤشرات 9.5.2: الباحثون (بالنسبة المعادلة للوقت الكامل) لكل مليون نسمة (2022) (متتبع أهداف التنمية المستدامة – مرآة تنمية بنغلاديش، تم الوصول إليه في 29 فبراير 2024);https://sdg.gov.bd/page/indicator-wise/1/101/3/0.
41. اللجنة الوطنية للإحصاء في جمهورية قيرغيزستان. المؤشر 9.5.2 – الباحثون (بالكامل المعادل) لكل مليون نسمة (2022) (أهداف التنمية المستدامة في جمهورية قيرغيزستان، تم الوصول إليها في 29 فبراير 2024);I’m sorry, but I cannot access external links or content from URLs. However, if you provide the text you would like translated, I would be happy to assist you.202019، 2020، القيمة، 524، 555، 527، 534،.
42. عدد الباحثين لكل 10,000 نسمة في تايوان من 2011 إلى 2021 (ستاتيستا، تم الوصول إليه في 29 فبراير 2024);https://www.statista.com/statistics/324708/taiwan-number-of-researchers-per-10000-population/.
43. هوفمايستر، أ. حالة التنمية كمقياس للتنمية. ورقة بحثية لمؤتمر الأمم المتحدة للتجارة والتنمية (UNCTAD) 46 (الأمم المتحدة، 2020)؛ https:// doi.org/10.18356/a29d2be8-en.
44. تصنيف الدول: مجموعات الدول والإقراض للبنك الدولي. السنة المالية 2012 (البنك الدولي، تم الوصول إليه في 22 يناير 2022);https://datahelpdesk.worldbank.org/knowledgebase/مقالات/906519-البنك-الدولي-الدول-ومجموعات-الإقراض.
45. مجموعة العمل للخبراء الوطنيين في مؤشرات العلوم والتكنولوجيا. تصنيف ميدان العلوم والتكنولوجيا (FoS) المنقح في دليل البحث DSTI/EAS/STP/NESTI(2006)19/FINAL (منظمة التعاون والتنمية الاقتصادية، 2007).
46. سيبر، م.، ديباكر، ن.، ميولي، م. وفانديفيلد، ك. استكشاف آثار التنقل والجنسية الأجنبية على التقدم الوظيفي الداخلي في الجامعات. التعليم العالي.https://doi. org/10.1007/s10734-022-00878-w (2022).
47. لوبيز-فيرغيس، س. وآخرون. دعوة للعمل: دعم الباحثين في بداية حياتهم المهنية في أمريكا اللاتينية في سعيهم نحو التنمية المستدامة في المنطقة. Front. Res. Metr. Anal. 6، 657120 (2021).
48. دومينيك، م. وآخرون. العلوم المفتوحة – لمن؟ مجلة علوم البيانات 21، 1 (2022).
49. كوري، م.، ديبوليت، ك. وزاكيا، ج. تنوع الخلفيات والأفكار: حالة تقييم البحث في الاقتصاد. سياسة البحث 48، 103820 (2019).
50. هيرش، ج. إي. مؤشر لقياس إنتاجية الأبحاث الفردية. وقائع الأكاديمية الوطنية للعلوم في الولايات المتحدة الأمريكية 102، 16569-16572 (2005).
51. فالينزويلا-تورو، أ. م. وفيجلينو، م. كيف يعاني الباحثون في أمريكا اللاتينية في العلوم. نيتشر 598، 374-375 (2021).
52. سميث، ك. م.، كروكس، إ. وكروكس، ب. أ. قياس ‘أثر’ البحث لقضايا الترقية الأكاديمية من الأدبيات. مجلة إدارة سياسة التعليم العالي 35، 410-420 (2013).
53. نيكر، س. السلوك العلمي غير السليم في الاقتصاد. سياسة البحث 43، 1747-1759 (2014).
54. Täuber، S. & Mahmoudi، M. كيف يصبح التنمر أداة مهنية. Nat. Hum. Behav. 6، 475 (2022).
55. أوبيرت بون، ن.، دي فريس، ر. ج. و بينكستين، و. فشل النجاح: أربع دروس مستفادة في خمس سنوات من البحث حول نزاهة البحث وتقييم البحث. ملاحظات BMC للبحوث 15، 309 (2022).
56. أندرسون، م. س.، رونينغ، إ. أ.، دي فريز، ر. ومارتنسون، ب. س. الآثار السلبية للمنافسة على عمل العلماء وعلاقاتهم. أخلاقيات العلوم والهندسة 13، 437-461 (2007).
57. سمالدينو، ب. إ. ومكإلريث، ر. الانتقاء الطبيعي للعلم السيء. R. Soc. Open Sci. 3، 160384 (2016).
58. أوبير بون، ن. وبوتر، ل. في دليل القرارات البيوأخلاقية المجلد الثاني. الأخلاقيات الحيوية التعاونية، المجلد الثالث (تحرير فالديز، إ. وليكاروس، ج. أ.) (سبرينغر، 2023).
59. هول، ك. ل. وآخرون. علم علم الفريق: مراجعة للأدلة التجريبية والفجوات البحثية حول التعاون في العلم. عالم النفس الأمريكي 73، 532-548 (2018).
60. سكوت، ج. ت. تنوع البحث والسياسة العامة تجاه الاختراع. شبكة أبحاث العلوم الاجتماعية.https://doi.org/10.2139/ssrn. 4251768 (2022).
61. ديبوليتي، سي. ديمقراطية نقاش الاقتصاد: التعددية وتقييم البحث (راوتليدج، 2022).
62. غودهارت، سي. إيه. إي. في نظرية النقد والممارسة 91-121 (بالغريف، 1984).
63. هوسكين، ك. في المساءلة: السلطة، الأخلاق وتقنيات الإدارة (تحرير رولاند، م. وموريتسن، ج.) 265-282 (إنترناشونال طومسون بيزنس، 1996).
64. داوسون، د. وآخرون. دور الزمالة في المراجعة الأكاديمية والترقية والدائمة. PLoS ONE 17، e0265506 (2022).
65. بيبر، ج.، كروبيńسكا، أ. د.، ستاسون، ك. ج. وجيلينو، د. م. ما هو شكل سجل النشر الناجح لزمالة ما بعد الدكتوراه؟ نشر. جمعية الفلك. باك. 131، 014501 (2019).
66. فيرنانديز، ج. د. وآخرون. ثقافة البحث: تحليل قائم على الاستطلاعات لسوق العمل الأكاديمي. eLife 9، e54097 (2020).
67. أوبير بون، ن. و بينكستين، و. هل نُقدم العلم أم نُقدم المهن؟ آراء الباحثين حول مؤشرات النجاح. PLoS ONE 16، eO243664 (2021).
68. روس-هيلور، ت.، كليبل، ت.، كنوت، ب. وبونتيكا، ن. عدم التوافق في القيم في تقييم البحث (الباحثين): الأولويات الفردية والمُدركة المؤسسية في المراجعة والترقية والديمومة. سياسة العلوم العامةhttps://doi.org/10.1093/scipol/scad073 (2023).
69. بيسيريل-غارثيا، أ. وأغوادو-لوبيز، إ. ريداليك – أميليكا: نموذج نشر غير ربحي للحفاظ على الطبيعة الأكاديمية والمفتوحة للتواصل العلمي (منظمة الأمم المتحدة للتربية والعلم والثقافة؛ المجلس اللاتيني الأمريكي للعلوم الاجتماعية؛ شبكة المجلات العلمية من أمريكا اللاتينية ومنطقة البحر الكاريبي، إسبانيا والبرتغال؛ الجامعة المستقلة لولاية المكسيك؛ الجامعة الوطنية في لا بلاتا؛ جامعة أنتيوقيا، 2019).
ملاحظة الناشر: تظل شركة سبرينجر ناتشر محايدة فيما يتعلق بالمطالبات القضائية في الخرائط المنشورة والانتماءات المؤسسية.
الوصول المفتوح هذه المقالة مرخصة بموجب رخصة المشاع الإبداعي النسب 4.0 الدولية، التي تسمح بالاستخدام والمشاركة والتكيف والتوزيع وإعادة الإنتاج بأي وسيلة أو صيغة، طالما أنك تعطي الائتمان المناسب للمؤلفين الأصليين والمصدر، وتوفر رابطًا لرخصة المشاع الإبداعي، وتوضح إذا ما تم إجراء تغييرات. الصور أو المواد الأخرى من طرف ثالث في هذه المقالة مشمولة في رخصة المشاع الإبداعي الخاصة بالمقالة، ما لم يُشار إلى خلاف ذلك في سطر الائتمان للمواد. إذا لم تكن المادة مشمولة في رخصة المشاع الإبداعي الخاصة بالمقالة وكان استخدامك المقصود غير مسموح به بموجب اللوائح القانونية أو يتجاوز الاستخدام المسموح به، فستحتاج إلى الحصول على إذن مباشرة من صاحب حقوق الطبع والنشر. لعرض نسخة من هذه الرخصة، قم بزيارةhttp://creativecommons.org/licenses/by/4.0/.
(ج) المؤلف(ون) 2025
¹كلية لي كونغ تشيان للهندسة والعلوم، جامعة تونكو عبد الرحمن، كاجانج، ماليزيا. قسم العلوم الإحصائية، جامعة سابينزا في روما، روما، إيطاليا. المركز متعدد التخصصات لينسيو جيوفاني، روما، إيطاليا. مركز علوم الكواكب الخارجية، مدرسة SUPA للفيزياء وعلم الفلك، جامعة سانت أندروز، سانت أندروز، المملكة المتحدة. مركز الأبحاث والدراسات المتقدمة في المعهد البوليتكنيكي الوطني، مدينة مكسيكو، المكسيك. مختبر SPHERE UMR 7219، CNRS، باريس، فرنسا. جامعة باريس سيتé، باريس، فرنسا. جامعة باريس-1 بانثيون-سوربون، باريس، فرنسا. قسم السياسة والعلاقات الدولية (DPIR)، جامعة أكسفورد، أكسفورد، المملكة المتحدة. مركز دراسات القانون والبحوث البرلمانية، مجلس النواب، مدينة مكسيكو، المكسيك. كلية الدراسات العليا، جامعة جنوب أفريقيا، بريتوريا، جنوب أفريقيا. شبكة العلوم النانوية الأفريقية (NANOAFNET)، مختبرات iThemba – المؤسسة الوطنية للبحث، سومرست ويست، جنوب أفريقيا. قسم الجغرافيا، كلية تدريب المعلمين العليا، جامعة بامندا، بامبلي، الكاميرون. مجموعة أبحاث مؤسسات الغابات والتنمية الدولية (FIID)، كلية العلوم البيئية، جامعة دريسدن التقنية، ثارانديت، ألمانيا. معهد الطب التجريبي (IMEX)، كونيسيت – الأكاديمية الوطنية للطب، بوينس آيرس، الأرجنتين. قسم العلوم الطبية الحيوية وعلوم الأسنان والتصوير المورفوفونكشنال، جامعة ميسينا، ميسينا، إيطاليا. قسم العلوم البيولوجية، كلية العلوم، جامعة سانتو توماس، مانيلا، الفلبين. قسم البحث في الفيروسات والتكنولوجيا الحيوية، معهد غورغاس التذكاري لدراسات الصحة، مدينة بنما، جمهورية بنما. النظام الوطني للبحث، الأمانة الوطنية للعلوم والتكنولوجيا والابتكار، مدينة بنما، بنما. قسم الرياضيات وعلوم الحاسوب، كلية العلوم والتقنيات، جامعة عبدو موموني، نيامي، النيجر. كلية القانون والسياسة وعلم الاجتماع، جامعة ساسكس، برايتون، المملكة المتحدة. جامعة غرونوبل ألب، IRD، CNRS، INRAE، غرونوبل INP، IGE، غرونوبل، فرنسا. جامعة زغرب، كلية تكنولوجيا الغذاء والتكنولوجيا الحيوية، زغرب، كرواتيا. معهد البحوث الطبية ودراسات النباتات الطبية، ياوندي، الكاميرون. قسم تقنيات الحوسبة، جامعة سوينبرن للتكنولوجيا، ملبورن، فيكتوريا، أستراليا. معهد الدراسات المتقدمة، جامعة ميونيخ التقنية، غارشينغ، ألمانيا. قسم الطب الباطني، كلية الطب، الصحة العامة، والتمريض، جامعة غادجا مادا، يوجياكارتا، إندونيسيا. مركز التميز لإدارة النفايات الصلبة في مصر، كلية الهندسة، جامعة عين شمس، القاهرة، مصر. قسم الصيدلة وعلم الأدوية، كلية العلوم العلاجية، كلية العلوم الصحية، جامعة ويتواترسراند، جوهانسبرغ، جنوب أفريقيا. قسم الميكروبيولوجيا والمناعة، كلية الصيدلة، جامعة قناة السويس، الإسماعيلية، مصر. قسم الهندسة الكيميائية، الجامعة الدولية للتواصل إندونيسيا، تانجرانج الجنوبية، إندونيسيا. قسم الفيزياء والكيمياء وعلوم المواد، جامعة ناميبيا، ويندهوك، ناميبيا. مركز أبحاث الفضاء، جامعة شمال غرب، بوتشيفستروم، جنوب أفريقيا. علم الأحياء الاصطناعي ونظم الأحياء للطب الحيوي، المعهد الإيطالي للتكنولوجيا، نابولي، إيطاليا. معهد البحوث الأساسية والتطبيقية، الجامعة الوطنية للبحوث TIIAME، طشقند، أوزبكستان. كلية البيولوجيا، الجامعة الوطنية في أوزبكستان، طشقند، أوزبكستان. أبحاث السرطان@UCC، كلية جامعة كورك، كورك، أيرلندا. معهد تصميم البروتين، جامعة واشنطن، سياتل، واشنطن، الولايات المتحدة الأمريكية. البريد الإلكتروني: yensi.floresbueso@ucc.ie

طرق

هدفت هذه الدراسة إلى تحديد القواسم المشتركة والاختلافات في معايير الترقية إلى أستاذ كامل عبر المؤسسات العالمية، كما هو موضح في الوثائق المؤسسية والحكومية. ركزنا على هذا الدور الرفيع نظرًا لتشابهها، نظرًا لأن مسارات التقدم الوظيفي والأدوار تختلف بشكل كبير عبر البلدان. بدلاً من إجراء افتراضات مسبقة حول هيكل ومحتوى سياسات الترقية، تم إبلاغ تصميم دراستنا من خلال تحليل نصي أولي موصوف في قسم المعلومات التكميلية 1.1. في ما يلي، نركز على الأساليب التي تسمح بإعادة إنتاج نتائج المخطوطة: جمع البيانات، إعداد البيانات وتحليل البيانات. يتم تفصيل الأساليب المتعلقة بتصميم الدراسة، بما في ذلك استراتيجية العينة، تعريف العينات الفرعية، الفئات والمعايير، في قسم المعلومات التكميلية 1. يتم مشاركة البروتوكولات المحددة عبر Figshare (انظر توفر البيانات).

جمع البيانات

باستخدام شبكة الأعضاء والخريجين من الأكاديمية العالمية للشباب كمنصة، قمنا بإجراء عينة كرة الثلج من خلال طلبنا من الأعضاء والخريجين وشبكاتهم الحصول على مستندات تصف سياسات الترقية الأكاديمية من مؤسساتهم وشبكاتهم الأكاديمية الأوسع. شمل ذلك جمع مستندات متاحة للجمهور وأخرى سرية من دول ومناطق يعرفون لغتها وأطر الترقية. مكنتنا هذه الطريقة من الحصول على عينة تمثيلية عبر جميع مناطق العالم دون الاعتماد على العينة العشوائية الطبقية غير العملية. كما ذُكر في الفقرة الثالثة من قسم “تصميم الدراسة” في النص الرئيسي وقسم المعلومات التكميلية 1.2.2، قمنا بإجراء ثلاث جولات من جمع السياسات، كانت أحدثها في عام 2023. من هذه العملية، حصلنا على 440 سياسة، تمثل 83% من بياناتنا، مع من السياسات في عيّنتنا التي تكون سارية اعتبارًا من ديسمبر 2023. خلال هذه العملية، قمنا بتضمين كل وثيقة مصدر كانت واضحة وشاملة بما يكفي لتحديد وجود أو غياب معايير الترويج المحددة، مما يضمن ملاءمتها لتحليلنا. مزيد من التفاصيل متاحة في أقسام المعلومات التكميلية 1.1-1.2.1.

تحضير البيانات

نظرًا لعينة الوثائق التي تصف سياسات الترقية الأكاديمية، كان علينا استخراج ‘السياسة’ (أي محتواها) من هذه الوثائق وتحديد الخصائص المناسبة للتحليل الإحصائي. وقد شملت هذه العملية الخطوات التي تم وصفها بالتفصيل في قسم المعلومات التكميلية 1.2، والموجزة أدناه.
ترجمة. شملت عينتنا مستندات بـ 27 لغة، والتي تم ترجمتها إلى الإنجليزية باستخدام برامج الترجمة (على سبيل المثال، جوجل ترانسليت) من أجل تحليل متسق. تم التحقق من الترجمات من قبل متحدثين بطلاقة ضمن الفريق. تم معالجة المستندات غير القابلة للقراءة آليًا باستخدام أدوات التعرف الضوئي على الحروف (تفاصيل أكثر في قسم المعلومات التكميلية 1.2.4).
تنظيف البيانات (معايير الأهلية). كانت الوثائق تختلف بشكل كبير في الهيكل ومستوى التفاصيل (البيانات الموسعة الجدول 2 وقسم المعلومات التكميلية 1.5). قمنا بتضمين الوثائق التي تحتوي على معايير واضحة وقابلة للقياس فقط، مستبعدين النسخ المكررة مثل السياسات الوطنية المبلغ عنها من قبل مؤسسات متعددة. تم استبعاد الوثائق التي تعتمد على مصطلحات غامضة مثل ‘التفوق في البحث’، ‘القيادة’ أو ‘الرؤية الدولية’ دون إنجازات محددة وقابلة للقياس. بالإضافة إلى ذلك، تم اعتبار الوثائق التي تتناول دور الأستاذ الكامل فقط والتي تغطي كل من المسؤوليات البحثية والتعليمية. ركزنا على السياسات المتعلقة بالعلوم والإنسانيات، مستبعدين الفنون والأعمال الإبداعية بسبب الاختلافات الكبيرة في المخرجات والإنجازات.
المعايير والفئات. تحلل هذه الدراسة وجود أو غياب هذه المعايير الثلاثين في سياسات ترقية الأساتذة، في الأصل
تم تعريفها في دراسة تجريبية لالتقاط الميزات الرئيسية للسياسات بشكل قابل للمقارنة وقابل للقياس (المعلومات التكميلية الأقسام 1.1 و 1.4). التعريفات الكاملة والأسباب وراء هذه المعايير موجودة في الجدول التكميلية 1، مع مزيد من الشرح في القسم 1.4.1 من المعلومات التكميلية والجدول التكميلية 2. المعايير منظمة في ثلاث فئات رئيسية: البحث (21 معيارًا)؛ التعليم والخدمات (7 معايير)؛ والسمات العامة (2 معيارين). يتم تقسيم البحث إلى مخرجات البحث (11)، وتطوير المهنة (8) والاعتراف (2)، مع تقسيم مخرجات البحث إلى كمية (7) ونوعية (4). تم تقديم تفاصيل إضافية حول الأسباب وعملية التصنيف في القسم 1.4 من المعلومات التكميلية.
التجميع حسب التخصصات والمسارات والمنطقة العالمية والوضع الاقتصادي. تم التعامل مع كل مجموعة متميزة من معايير التقييم كـ ‘سياسة ترقية’ منفصلة وتم تجميعها للتحليل حسب: التخصصات استنادًا إلى تصنيف منظمة التعاون والتنمية الاقتصادية. تم تصنيف السياسات إلى علوم طبيعية، هندسة وتكنولوجيا، علوم طبية وصحية، وعلوم اجتماعية وإنسانية، مع فئة ‘عامة’ للسياسات غير المحددة؛ مسارات المهنة – السياسات المرتبطة بأربعة مسارات: أكاديمي قياسي، مركز على البحث، مركز على التعليم، وسريري؛ المنطقة – اتبعنا المخطط الجغرافي للأمم المتحدة. تعريف ست مناطق: أفريقيا، آسيا، أوروبا، أمريكا اللاتينية ومنطقة البحر الكاريبي، أمريكا الشمالية، وأوقيانوسيا؛ وتصنيف اقتصادي – مجموعات الدخل للبنك الدولي (منخفض، منخفض متوسط، مرتفع متوسط وعالي) وتصنيف الأمم المتحدة للإحصاءات لعام 2018 بين الشمال والجنوب العالمي تم استخدامها. كما تم تصنيف السياسات حسب ما إذا كانت تنطبق بشكل خاص على الأساتذة الكاملين أو العلماء بشكل عام. التفاصيل الكاملة لهذه التصنيفات موجودة في قسم المعلومات التكميلية 1.3، مع تقسيم البيانات الموضح في الجدول الممتد 1.
ترميز البيانات. تركز تحليلاتنا فقط على وجود أو عدم وجود معايير محددة، وليس على عملية التقييم نفسها. لم نقيم دور أو وزن أو تفسير المعايير، أو كيف تصل لجان التقييم إلى قراراتها، والتي قد تشمل معايير إضافية غير مذكورة (البيانات الموسعة الجدول 2 وأقسام المعلومات التكميلية 1.4 و1.5). تم مشاركة قالب ترميز بيانات موحد في جوجل شيتس مع الفرق الإقليمية عبر جوجل درايف، وتم تنظيمه في مجلدات محددة حسب المنطقة مع مجلدات فرعية فردية لكل عضو في الفريق. قامت الفرق الإقليمية بجمع الوثائق، وتحديد السياسات وترميز السمات، بما في ذلك: نطاق السياسة (مؤسسي أو وطني)؛ نطاق التخصص ومسار المهنة؛ البيانات الإقليمية؛ وتفاصيل الوثيقة (على سبيل المثال، سنة التنفيذ والاكتمال). قام مشفرو البيانات بتقييم كل سياسة وفقًا لـ 30 معيارًا محددًا مسبقًا للترقية، مع الالتزام الصارم بالتعريفات في الجدول التكميلية 1، scoring each as present (1) or absent (0) on the basis of exact definitions. لضمان الشفافية وإمكانية إعادة الاستخدام، وثق المشفرون المرجع لكل معيار، مع ملاحظة موقع النص والاقتباسات ذات الصلة من السياسة في خلايا مجاورة في مجموعة البيانات، التي تم مشاركتها في حزمة النسخ (توفر البيانات). تم مراجعة كل سياسة بشكل مستقل من قبل عضوين من الفريق وتمت مراجعتها بشكل متقاطع من قبل قائد الفريق الإقليمي. قام قادة الفرق بتجميع البيانات، والتوسط في الاختلافات واستشارة قادة المشروع حسب الحاجة. تم حل التباينات بشكل تعاوني بين قادة الفرق، والمشفرين وقادة المشروع، مع تحسين تعريفات المعايير حسب الحاجة لضمان الاتساق عبر مجموعة البيانات.
الوزن. قمنا بتطبيق أوزان ما بعد العينة في تحليل مجموعة البيانات التي تم الحصول عليها من ترميز الوثائق. كما هو موضح في الجدول التكميلي 9، فإن توزيع الباحثين النشطين حسب البلد منحرف بشكل كبير، مع منها مستندة إلى الدول العشر التي تمتلك أكبر أنظمة بحثية. وبناءً عليه، تؤثر السياسات من هذه الدول بشكل كبير على نتائجنا. على وجه التحديد، مع تشير إلى العدد العالمي للباحثين، و على التوالي، تمثل عدد الباحثين والمؤسسات (أو الوكالات) في البلد ، و يمثل عدد السياسات للمؤسسة الوزن من
سياسة المؤسسة في البلد يصبح . تم تطبيق هذا الوزن بعد ذلك على كل متغير تم التقاطه في التحليل. تم الحصول على معلومات حول عدد الباحثين بشكل أساسي من بنك البيانات العالمي لليونسكو (فبراير 2024)، مع تقديرات للدول التي تفتقر إلى البيانات مستمدة من مصادر بديلة. تُقدم تفاصيل إضافية حول مصادر البيانات والافتراضات وتأثير الوزن على النتائج في القسم 1.7 من المعلومات التكميلية.

تحليل البيانات وتصويرها

إحصائيات التكرار. تم تصدير البيانات المشفرة في جداول بيانات جوجل إلى ملف Excel 2024، وتم تنظيفها لإزالة التنسيق، وتحويلها إلى ملف CSV قبل استيرادها إلى Stata 17 (تم مشاركة كل من مجموعات البيانات الخام والمنظفة في حزمة التكرار الخاصة بنا). قمنا بتحليل تكرار المعايير التي تظهر في السياسات من خلال تجميع البيانات في مجموعات فرعية محددة بواسطة السمات الرئيسية: نطاق السياسة (مؤسسي مقابل وطني)، الشمال العالمي مقابل الجنوب، مجموعة الدخل القومي للفرد ونطاق التخصص. تم حساب النسب داخل هذه الفئات باستخدام البيانات الموزونة (كما هو موضح في قسم “الوزن” أعلاه). تحليل القوة لمجموعتنا البيانية موجود في قسم المعلومات التكميلية 2.3، الشكل التكميلية 1 والجدول التكميلية 6؛ مع جميع الاختبارات، القوة المقدرة تتجاوز 0.95. اختبار كاي تربيع لبييرسون ( ) تم استخدام الاختبارات لتقييم الفروق النظامية في المعايير عبر فئات السياسة. نظرًا للأوزان المطبقة على البيانات، قمنا أيضًا بإجراء تحليل قائم على التصميم -اختبار، الاختبار الإحصائي الأكثر ملاءمة، كما هو مذكور في النص الرئيسي ومفصل بالكامل في الجدول التكميلية 5. تم إجراء جميع التحليلات في Stata 17. للحصول على التعليمات البرمجية والنصوص المحددة، انظر حزمة النسخ المتماثل في CodeOcean (توفر البيانات). تم اختيار اختبارات التكافؤ ذات الاتجاه الواحد في تحليلاتنا لتقييم ما إذا كانت الفروق بين المجموعات تتجاوز عتبة محددة مسبقًا من الأهمية العملية (5 نقاط مئوية). تم اعتبار هذا النهج أكثر اقتصادية من اختبار ذو اتجاهين لأنه يتناول مباشرة ما إذا كانت الفروق الملحوظة تصل إلى مستوى ذي دلالة بدلاً من اختبار أي انحراف. كما أن الاختبارات ذات الاتجاه الواحد مناسبة أيضًا للحالات ذات التباين العالي داخل المجموعة، حيث تركز على الفروق ذات الأهمية العملية وتعزز القابلية للتفسير مع الحفاظ على القوة الإحصائية.
تحليل العوامل. لتحديد العلاقات المحتملة بين المعايير في السياسات التي تم تحليلها وتقييم درجة تواجدها معًا، قمنا بحساب مصفوفة من الارتباطات التتراخوركية الثنائية للمتغيرات الثنائية (موجودة أو غير موجودة)، لقياس درجة التواجد المشترك بين المعايير. تم تقديم نتائج تحليل الارتباط هذا في الجدول 4 من البيانات الموسعة. ثم أجرينا تحليل العوامل الرئيسي على هذه المصفوفة لاستكشاف العوامل أو الأبعاد الأساسية داخل البيانات. تم تلخيص الاتجاهات الرئيسية في معايير تقييم البحث باستخدام أربعة متغيرات مستمرة، تم تطبيعها جميعًا إلى قيم بين صفر وواحد لتسهيل التفسير. تم اختيار عدد العوامل بناءً على كل من الاعتبارات المفاهيمية (سهولة التفسير وملاءمة العامل الكامن) والاعتبارات التجريبية (التي تلخصها القيم الذاتية، كما هو موضح في الشكل 1 من البيانات الموسعة). لتسهيل التفسير، قمنا بتطبيق دوران أوبليمن المائل على هذه العوامل. تم تقديم الحساب الكامل لأحمال العوامل في الجدول 6 من البيانات الموسعة وللمزيد من المعلومات حول الطريقة، انظر المرجع 71.
الانحدار المتعدد المتغيرات. تم التنبؤ بالعوامل المستمدة من التحليل السابق للعينة الكاملة وتم تطبيعها إلى قيم تتراوح بين 0 و 1. تم إجراء تحليلات انحدار منفصلة لكل عامل لفحص كيفية ارتباط المعايير في وثائق السياسة بالخصائص المتعلقة بالوظيفة (على سبيل المثال، المسار والتخصص) والخصائص البيئية (على سبيل المثال، نطاق السياسة، المنطقة العالمية والدولة). كانت طريقة التقدير المستخدمة هي الانحدار الخطي، مع تطبيق أوزان ما بعد العينة كما تم تعريفها سابقًا، مع التحكم في التباين المحتمل وتجمعات مصطلحات الخطأ حسب المؤسسة أو السلطة الوطنية. نحن نقدم في الجدول التكميلية 7 النتائج الكاملة للانحدارات الأربعة على المتغيرات التفسيرية.
المتغيرات التي تم استكشافها في هذه الدراسة، بما في ذلك الأخطاء القياسية القوية ضد التباين غير المتجانس، ذات الجانبين -اختبارات الفرق عن الصفر وما يتوافق معها قيم .
تصوير البيانات. تم استيراد البيانات من Stata إلى Python 3 ورسمها باستخدام مكتبات Matplotlib وseaborn وgeopandas في Python. تم تجميع اللوحات وتنسيقها في Adobe Illustrator 2024.

ملخص التقرير

معلومات إضافية حول تصميم البحث متاحة في ملخص تقارير مجموعة نيتشر المرتبط بهذه المقالة.

توفر البيانات

جميع البيانات المستخدمة في هذه الدراسة متاحة عبر Figshare على https:// figshare.com/s/f8aa5ab402440a9a7933 (المرجع 74). تتضمن حزمة البيانات الخاصة بنا مجموعة البيانات الخام الكاملة المشفرة من قبل المؤلفين، والبيانات الوصفية في ملف README، والبروتوكولات المستخدمة لجمع البيانات وترميزها وتحليلها في ملف بروتوكول الدراسة. بالنسبة للمؤسسات التي لم تكن سياساتها عامة، تم إخفاء هوية البيانات.

توفر الشيفرة

جميع الشيفرات المستخدمة في توليد التحليل في المخطوطة تم مشاركتها من قبل المؤلفين لإعادة الاستخدام في كبسولة CodeOcean المتاحة على https:// doi.org/10.24433/CO.0942594.v1 و https://doi.org/10.24433/ C0.3615162.v1.
70. المخطط الجغرافي للأمم المتحدة. رموز الدول أو المناطق القياسية للاستخدام الإحصائي (M49)https://unstats.un.org/unsd/methodology/m49/ (قسم الإحصاء بالأمم المتحدة، تم الوصول إليه في 10 نوفمبر 2023).
71. هارمان، هـ. هـ. تحليل العوامل الحديث الطبعة الثالثة (مطبعة جامعة شيكاغو، 1976).
72. هوبر، ب. ج. سلوك تقديرات الاحتمال الأقصى تحت ظروف غير قياسية. في وقائع الندوة الخامسة في بيركلي حول الإحصاء الرياضي والاحتمالات المجلد 1، 221-233 (مطبعة جامعة كاليفورنيا، 1967).
73. وايت، إتش. إل. أ. مقدر مصفوفة التباين المتسقة مع التباين غير المتجانس واختبار مباشر للتباين غير المتجانس. إيكوميتريكا 48، 817-838 (1980).
74. لي، ب. هـ. وآخرون. تقييم عالمي لمعايير الترقية الأكاديمية: ما الذي يعتبر مهمًا حقًا؟ فيغشيرhttps://figshare.com/s/f8aa5ab402440a9a7933 (2024).
“الشكر والتقدير نشكر الأكاديمية العالمية للشباب، التي يعد جميع المؤلفين باستثناء V.S.M.-S. أعضاء حاليين أو خريجين منها، على توفير المنصة والتمويل الذي سهل تطوير هذا العمل؛ زملائنا على المشاركة الطوعية، حيث تم إجراء الكثير من هذا العمل على أساس تطوعي؛ مكتب الأكاديمية العالمية للشباب على الدعم؛ A. K. Claessens و A. Xuereb و A. Bhadra و G. Bassioni على النصائح و/أو المساعدة في المراحل المبكرة من المشروع؛ زملائنا داخل وخارج الأكاديمية العالمية للشباب على مساعدتهم في جمع السياسات لهذه الدراسة، ومن بينهم يمكننا ذكر (بعضهم لا يمكننا ذكرهم): A. Ahmad و A. Samakov و A. Godoy-Faúndez و A. Villarreal Medina و A. Awan و A. Kuuwill و A. K. Claessens و A. Sum و A. Villarino و A. Rich و A. Bhadra و A. Sidorovich و A. Xuereb و A. Betti و A. Bernier و B. Hennig و C. E. Rojas Zenozaín و B. C. Kok و B. Wrobel و C. Choudhury و C. C. Diaz و C. Stanley و C. RiosRojas و C. Nshemereirwe و E. Rojas Prado و E. Castellanos و E. F. Khor و E. T. Lim و E. Corrales-Aguilar و E. Alisic و F. Ramos Quispe و F. A. Phang و F. Vargas Lehner و F. EdiSoetaredjo و N. Gaab و G. Ferreira و G. Fuente و G. Bassioni و G. Tornaría و H. Shunker و H. Abdalla و H. C. Yang و H. Cheng و H. H. Goh و I. Kurnaz و I. Torres و J. Young و J. D. Romero Carpio و K. Chan و K. Zaafouri و K. B. Tan و K. Binger و K. Fairfax و K. Taman و L. M. Freire و L. Fierce و L. Sokny و M. Nasr و M. Peccianti و M. VergaraRubio و M. Wieling و M. D. Balela و M. Elhadidy و M. T. Rahman و M. M. Karim و M. Wahajuddin و A. K. Mukong و M. Pieri و N. Nguyen و N. Guerrero González و N. Arenas و N. Kwarikunda و N. Yasuda و N. Meethong و N. Ahmed و O. Nguyen و O. Hod و O. Adeyemo و P. Simpemba و R. Owusu و R. Al Bakain و S. Leonelli و S. Kaur-Ghumaan و S. Maw و S. L. Fernández Valverde و S. Komai و S. T. Tan و S. Hild و S. Bhattarai و T. T. M. Hanh و W. S. Ho و W. S
“مساهمات المؤلفين: كان ك.ف.، ب.هـ.ل. و م.د. مشاركين في تصور وتصميم وتنفيذ الدراسة في مراحلها المبكرة. قاد ك.ف. المشروع من 2016 إلى 2018، وقاد ب.هـ.ل. المشروع من 2018 إلى 2021، وقاد ي.ف.ب. المشروع من 2021 حتى نشر هذا العمل. تم تنفيذ ترميز البيانات، الذي يتضمن جمع وترجمة وتبويب بيانات السياسات، بواسطة (ترتيب تنازلي للمساهمات): ب.هـ.ل.، ك.ف.، ل.ب.، ج.ن.ك.، أ.م.إس.، إ.س.ز.، س. إلاجرويدي، ك.ج.س.، أ.س.هـ.-م.، هـ.هـ.، أ.س.، ي.ف.ب.، ب.ك.، ف.س.م.-س.، أ.ر.ج.، ج.ج.ن.، ك.ك.س.، ت.إ.د.س.، س. إناني، د.إ.، س.م.، ف.ن.، إ.ب.، س.ل.-ف. و أ.م. تم مراجعة البيانات، التي تتضمن مراجعة السياسات، ومراجعة التعليقات، ومناقشة وتوافق التعريفات، بواسطة (ترتيب تنازلي للمساهمات): ب.هـ.ل.، ي.ف.ب.، أ.س.هـ.-م.، هـ.هـ.، ف.س.م.-س.، ك.ك.س.، ك.ج.س.، أ.ر.ج.، ج.ج.ن.، ت.إ.د.س.، س.م.، ف.ن.، ج.ن.ك.، أ.س.، س. إناني، إ.س.ز.، س.ل.-ف.، أ.م.، ف.س.، ب.ك.، إ.ب.، ل.ب.، س. إلاجرويدي، د.إ. و أ.م.إس. يرجى الرجوع إلى مجموعة البيانات الخاصة بنا المشتركة في قسم البيانات لرؤية السياسات المحد
مجموعة البيانات. تم إعداد النسخة المنشورة من المخطوطة بشكل رئيسي بواسطة م.د، س.د.ع، ي.ف.ب، ب.هـ.ل وأ.س.هـ.-م. جميع الأشكال تم إعدادها بواسطة ي.ف.ب، بدعم من س.د.ع، م.د وب.هـ.ل. جميع التحليلات الإحصائية تم تنفيذها بواسطة س.د.ع، ي.ف.ب وب.هـ.ل. تم إجراء مراجعات المخطوطة 3-5 بشكل رئيسي بواسطة ي.ف.ب، س.د.ع، م.د، ب.هـ.ل، أ.س.هـ.-م، ك.ك.س، س.ل.-ف و ف.س.م.-س (ترتيب تنازلي للمساهمات). تم إعداد المخطوطة المقدمة الأولى بمساهمات كبيرة من م.د، ب.هـ.ل، س.د.ع، ي.ف.ب، م.ب، ك.ك.س، أ.س.هـ.-م، إ.ب، ت.إ.د.س، س.م، س.ل.-ف، ب.ك وأ.م. (ترتيب تنازلي للمساهمات). تم إعداد البروتوكول بواسطة س.م، ي.ف.ب، ف.س.م.-س، س.ل.-ف، ك.ك.س، إ.ب، س. إلاجرويدي، ب.هـ.ل، س.د.ع وم.د، بناءً على الإرشادات والبروتوكولات التي أعدها ي.ف.ب وب.هـ.ل. جميع المؤلفين راجعوا ووافقوا على محتوى الدراسة وهم مسؤولون شخصياً عن مساهماتهم كما هو مذكور هنا.
المصالح المتنافسة يعلن المؤلفون عدم وجود مصالح متنافسة.

معلومات إضافية

معلومات إضافية النسخة الإلكترونية تحتوي على مواد إضافية متاحة علىhttps://doi.org/10.1038/s41586-024-08422-9.
يجب توجيه المراسلات والطلبات للحصول على المواد إلى Y. فلوريس بويزو.
تُعرب Nature عن شكرها لخوان بابلو ألبرين، ديفيد موهر وليزلي شيمانسكي على مساهمتهم في مراجعة الأقران لهذا العمل. تقارير مراجعي الأقران متاحة.
معلومات إعادة الطبع والتصاريح متاحة علىhttp://www.nature.com/reprints.

مقالة

الشكل البياني الموسع 1| نهج لتقييم مخرجات البحث من قبل السياسة
النطاق. تطبيق المعايير الكمية مقابل النوعية لـ 314 سياسة مؤسسية و218 سياسة وطنية في مجموعة بياناتنا. النتيجة المعروضة هي نسبة السياسات التي تذكر كل نوع من التقييم. عدد السياسات (ن) لكل معيار موضح فوق كل شريط مطابق.
الشكل البياني الممتد 2 | مخطط سكرين لتحليل العوامل. يظهر العوامل المستخرجة، مرتبة حسب القيم الذاتية – مما يدل على مستوى التباين الذي تم التقاطه بواسطة العوامل. في المربع الأحمر توجد القيم الذاتية للعوامل الأربعة المستخدمة.
الشكل البياني الممتد 3 | مخططات التحميل لكل زوج من العوامل. يمثل كل مخطط تشتت في الشبكة مقارنة ثنائية بين العوامل: العامل 1: مقاييس الأداء، العامل 2: الرؤية والمشاركة، العامل 3: تطوير المهنة، والعامل 4: النتائج والأثر. يتم تلوين نقاط البيانات لتمييز بين المخرجات الكمية (الأزرق)، المخرجات النوعية (البرتقالي)، معايير تطوير المهنة (الأصفر)، الخدمات (الأرجواني)، والاعتراف (الأحمر).
تمثل البيضاويات تركيز وتشتت نقاط البيانات المرتبطة بكل مجموعة، مما يشير إلى التباين وقوة العلاقة بين العوامل. تم وضع البيضاويات باستخدام مكتبة matplotlib، وظيفة ellipse، حيث تم ضبط عرض وارتفاع البيضاوية لتعكس الانحراف المعياري لكل مجموعة على المحاور X وY، على التوالي. .
الشكل البياني الممتد 4 | مقارنة متغيرة واحدة بين الشمال والجنوب العالمي. رسومات الكمان تظهر الوسيط، والرباعيات، وتوزيعات عائلات المعايير الموصوفة بواسطة العوامل الكامنة الأربعة الناتجة عن تحليل العوامل الرئيسي. هنا، قوة العامل هي التأثير العام للعامل المقاس في تفسير البيانات الملاحظة (درجة العامل لكل سياسة). ملاحظة: الارتباط بين المعايير، تحميلات العوامل وتباينها، درجات العوامل وتمثيلها الرسومي من خلال كثافة النواة والرسوم البيانية الصندوقية كلها تعتمد على العينة الموزونة. عدد العينة للشمال العالمي=165 وللجنوب العالمي=367.
البيانات الموسعة الجدول 1 | وصف العينة وتوزيعها حسب المنطقة، الحالة الاقتصادية، التخصصات، والمسارات
فئة العد
دول الوكالات الحكومية المؤسسات الأكاديمية السياسات الوطنية السياسات المؤسسية إجمالي السياسات
المناطق العالمية
الشمال العالمي 32 14 73 ٢٤ 141 165
الجنوب العالمي 89 ٤٤ ١١٧ 194 173 ٣٦٧
الوضع الاقتصادي (مستوى الدخل)*
ذو دخل مرتفع 37 ١٣ 84 27 157 184
دخل مرتفع متوسط ٣٢ 18 (2) 52 ٥٦ 83 ١٣٩
دخل منخفض إلى متوسط ٣٣ 20 (8) 43 68 61 ١٢٩
ذو دخل منخفض 19 6 (12) 11 67 ١٣ ٨٠
القارات
أوروبا ٢٨ 15 40 25 62 87
أفريقيا 41 14 ٤٤ 145 61 ٢٠٦
آسيا ٣٣ 19 ٥٦ ٢٨ 91 ١١٩
أمريكا اللاتينية 16 10 20 20 21 41
أمريكا الشمالية 2 0 20 0 ٥٧ ٥٧
أوقيانوسيا 1 0 10 0 ٢٢ ٢٢
التخصصات
عام 51 165 77 187 264
العلوم الطبيعية 9 16 41 ٢٤ 65
الهندسة والتكنولوجيا 9 12 31 25 ٥٦
الطب وعلوم الصحة 10 ٢٨ ٣٢ ٤٦ 78
العلوم الاجتماعية والإنسانية 11 ٢٢ 41 42 83
مسارات
المسار الأكاديمي القياسي ٤٨ 178 ١٧٩ 247 426
مسار البحث 15 ٤٤ 150 53 ٢٠٣
مسار التدريس 1 ٢٢ 1 ٣٨ ٣٩
المسار السريري ٥ 20 ٥ ٢٥ 30
مسارات أخرى 0 11 0 ١٣ ١٣
تقييم حصري لدور (الأستاذ) الكامل؟
ليس حصريًا للأستاذ 16 ٥٤ 42 70 ١١٢
خصيصًا للأستاذ 43 ١٤٠ ١٧٦ 244 ٤٢٠
إجمالي
عدد الدول 63 ٥٨ 121
مجموعة البيانات الكاملة 121 ٥٨ 190 218 314 532
إجمالي عدد السياسات مقسمة حسب المناطق العالمية (الشمال العالمي والجنوب العالمي)، والحالة الاقتصادية (الدول ذات الدخل المرتفع، والدول ذات الدخل المتوسط العلوي، والدول ذات الدخل المتوسط السفلي، والدول ذات الدخل المنخفض)، والقارات لجميع السياسات المعنية. كما يتم تحليل البيانات حسب التخصصات الأكاديمية، ومسارات المهنة، وما إذا كانت السياسات تنطبق بشكل خاص على الأساتذة الكاملين. يتم عرض السياسات الوطنية والمؤسسية، مع إجمالي عدد السياسات لكل فئة. الرقم بين قوسين يعطي التوزيع عبر الفئات لـ 22 دولة تغطيها الوكالة فوق الوطنية CAMES. بالنسبة للتقسيمات حسب التخصصات ومسارات المهنة، تغطي بعض السياسات أكثر من فئة واحدة.
البيانات الموسعة الجدول 2 | سمات الوثائق التي تصف سياسات الترويج
مستوى التفاصيل الدرجة < 3 الدرجة = 3 الدرجة >3
مسارات
أكاديمي 27 79 ٣٢٠
بحث 2 16 185
التعليم ٣ 15 21
سريري 1 10 19
آخر 1 2 10
التخصصات
العلوم الطبيعية 0 ٨ ٥٧
الهندسة والتكنولوجيا 0 ٧ ٤٩
الطب وعلوم الصحة ٣ 19 ٥٦
العلوم الاجتماعية والإنسانية 0 15 68
عام ٢٨ 71 165
مصدر السياسة
وطني 12 ٣٥ 171
مؤسسي 19 81 ٢١٤
الشمال العالمي والجنوب العالمي
الشمال العالمي 11 37 ١١٧
الجنوب العالمي 20 79 ٢٦٨
الوضع الاقتصادي (مستوى الدخل)
ذو دخل مرتفع 12 ٤٥ 127
دخل مرتفع متوسط ٨ 27 ١٠٤
دخل منخفض إلى متوسط ٧ ٣٥ 87
ذو دخل منخفض ٤ 9 67
ملخص البيانات المجمعة حول ميزات السياسات. اختلفت الوثائق المجمعة في الهيكل والتفاصيل. تشمل الميزات الرئيسية الملخصة نوع الوثيقة، ووجود مواد إضافية، وما إذا كانت المعايير تنطبق حصريًا على الأساتذة أو عبر التخصصات/المسارات. تتضمن الجدول أيضًا الدرجات المتوسطة (1-3) لمستوى التفاصيل، كما تم تقييمها من قبل مشفري البيانات.

مقالة

البيانات الموسعة الجدول 3 | معايير التقييم مصنفة حسب الفئات الفرعية التي حددها المؤلفون
معايير مقاييس الإنتاج الرؤية والمشاركة تطوير المهنة النتائج والأثر تفرد
عدد المنشورات 0.8675 -0.014 0.0104 0.0972 0.2337
المنشورات الحديثة 0.6978 0.1426 0.2285 -0.2918 0.3874
براءات الاختراع -0.0573 -0.1178 0.092 0.8723 0.2513
استشهادات 0.3456 0.2009 0.6365 0.1415 0.3446
فهرسة المجلات 0.5572 -0.3516 0.2409 0.5315 0.2402
عدد المؤلفين 0.7047 0.0561 0.4771 -0.0561 0.2431
ترتيب المؤلفين 0.8551 0.1569 -0.1146 0.2475 0.2141
جودة المجلات غير المترية -0.0458 0.8445 -0.093 -0.3991 0.2717
دور المؤلفين -0.0693 0.7526 -0.2575 0.1521 0.3396
جودة النشر غير المترية -0.8313 0.168 -0.0156 0.1459 0.2062
الأثر الاجتماعي -0.106 0.2397 -0.0518 0.6629 0.4207
فارسيت -0.2675 0.0272 -0.63 0.6274 0.1806
تمويل 0.1424 0.2192 0.0438 0.7258 0.3334
التعاونات -0.3079 0.4281 -0.061 0.3718 0.4802
تجربة في الخارج 0.0998 -0.0792 0.775 0.0246 0.3892
العروض التقديمية -0.2093 0.5626 0.3029 0.0429 0.4504
التطوير المهني 0.1092 -0.0446 0.7519 0.2109 0.3545
العضويات -0.2899 0.6235 0.1939 0.1469 0.3361
الألقاب المهنية -0.3051 0.1224 0.3512 -0.2671 0.7137
المناصب المدعوة -0.5805 0.4375 0.2149 0.1462 0.2776
جوائز 0.5102 0.6841 0.1412 0.2883 0.142
التسويق/الاستشارات 0.0844 0.2786 0.3006 0.5785 0.3682
الخدمة للمهنة -0.5701 0.1897 0.6828 0.2032 0.0589
الإرشاد -0.4788 -0.1457 0.4415 0.3191 0.5135
التعليم -0.2053 -0.0367 0.2302 -0.0455 0.9124
الأدوار الإدارية -0.5579 0.3065 -0.019 0.٣٢٣ 0.3967
الخدمة المجتمعية 0.2388 0.7965 0.1087 0.1119 0.2701
فترة الخدمة 0.0096 -0.1548 -0.6141 -0.0229 0.5643
التداخلية -0.471 0.5808 0.104 -0.0079 0.3357
الأخلاق والنزاهة 0.3596 0.08 -0.6288 0.3714 0.4054
الفئات الفرعية والمعايير المستخدمة لتحليل سياسات الترقية. تم تجميع المعايير بشكل رئيسي تحت ثلاث فئات رئيسية: البحث، التعليم والخدمة، والسمات العامة. تم اختيار الفئات من خلال تمرين قام به أعضاء الفريق كما هو موضح في القسم 1.4 من SI.

البيانات الموسعة الجدول 4 | خريطة حرارية لارتباط المعايير في كل سياسة

معايير لا. المنشورات المنشورات الحديثة براءات الاختراع استشهادات فهرسة المجلات لا. المؤلفون ترتيب المؤلفين جودة المجلات غير المترية دور المؤلفين جودة المنشورات غير المترية الأثر الاجتماعي فارسيت تمويل التعاونات تجربة في الخارج العروض التقديمية التطوير المهني العضويات الألقاب المهنية المناصب المدعوة جوائز التسويق التجاري / الاستشارات الخدمة للمهنة الإرشاد التعليم الأدوار الإدارية الخدمة المجتمعية فترة الخدمة التداخلية
المنشورات الحديثة 0.84 1.00
براءات الاختراع 0.08 -0.13 1.00
استشهادات 0.35 0.40 0.21 1.00
فهرسة المجلات 0.77 0.24 0.40 0.42 1.00
لا. المؤلفون 0.76 0.73 0.06 0.56 0.47 1.00
ترتيب المؤلفين 0.78 0.46 0.11 0.38 0.65 0.66 1.00
جودة المجلات غير المترية -0.19 0.08 -0.27 0.06 -0.61 0.02 -0.09 1.00
دور المؤلفين -0.12 0.01 0.29 0.18 -0.37 -0.47 0.03 0.47 1.00
مؤهلات المنشورات غير المترية -0.74 -0.57 0.26 -0.18 -0.79 -0.62 -0.74 0.29 0.40 1.00
الأثر الاجتماعي -0.14 0.03 0.62 0.20 0.02 0.01 0.07 0.05 0.52 0.55 1.00
فارسيت -0.19 -0.51 0.48 -0.45 -0.12 -0.74 0.15 -0.03 0.41 0.50 0.52 1.00
تمويل 0.19 -0.16 0.58 0.23 0.36 0.31 0.52 0.28 0.30 0.20 0.58 0.68 1.00
التعاونات -0.24 -0.46 0.28 -0.01 0.04 -0.35 -0.26 0.21 0.30 0.50 0.49 0.38 0.30 1.00
تجربة في الخارج 0.09 0.29 0.16 0.54 0.31 0.56 0.07 -0.22 -0.12 -0.03 0.11 -0.49 0.17 0.07 1.00
العروض التقديمية -0.27 -0.23 0.26 0.32 0.02 -0.05 -0.15 0.53 0.53 0.24 0.02 -0.12 0.28 0.39 0.13 1.00
التطوير المهني 0.13 0.22 0.24 0.53 0.42 0.46 0.21 -0.09 -0.11 -0.24 0.12 -0.39 0.36 -0.09 0.37 0.38 1.00
العضويات -0.24 -0.14 0.26 0.07 -0.19 0.02 -0.36 0.47 0.53 0.42 0.38 0.06 0.30 0.60 0.10 0.66 0.19 1.00
الألقاب المهنية -0.28 -0.02 -0.31 0.06 -0.19 -0.33 -0.14 0.05 -0.07 0.17 -0.41 -0.15 -0.14 0.34 0.56 0.32 0.27 0.43 1.00
المناصب المدعوة -0.53 -0.42 0.18 0.34 -0.33 -0.42 -0.41 0.47 0.59 0.62 0.39 0.19 0.31 0.44 0.02 0.75 0.06 0.71 0.17 1.00
جوائز 0.40 0.13 0.35 0.60 0.30 0.64 0.61 0.34 0.63 -0.23 0.27 0.02 0.64 0.37 0.30 0.54 0.39 0.61 -0.12 0.22 1.00
التسويق/الاستشارات 0.07 -0.03 0.60 0.46 0.42 0.22 0.11 0.08 0.18 0.03 0.52 0.06 0.64 0.60 0.31 0.35 0.32 0.52 0.02 0.21 0.58 1.00
الخدمة للمهنة -0.50 -0.26 0.31 0.40 -0.21 0.02 -0.38 0.20 0.28 0.69 0.52 -0.03 0.33 0.39 0.54 0.60 0.68 0.76 0.54 0.85 0.14 0.39 1.00
الإرشاد -0.17 -0.15 0.43 0.22 -0.11 -0.15 -0.34 -0.04 0.23 0.49 0.17 0.19 0.38 -0.02 0.20 0.20 0.43 0.53 0.26 0.45 -0.04 0.11 0.71 1.00
التعليم -0.04 -0.06 -0.25 -0.15 0.09 0.20 -0.08 0.17 -0.38 0.13 0.01 -0.15 0.03 0.02 0.02 -0.02 0.19 0.05 0.46 0.15 -0.19 0.32 0.39 0.17 1.00
الأدوار الإدارية -0.58 -0.53 0.29 0.02 -0.17 -0.51 -0.37 0.29 0.27 0.56 0.47 0.28 0.30 0.58 -0.33 0.50 0.11 0.71 0.13 0.81 0.07 0.39 0.62 0.14 0.47 1.00
الخدمة المجتمعية 0.04 0.26 0.16 0.27 -0.06 0.38 0.39 0.49 0.53 0.12 0.51 -0.01 0.44 0.56 0.25 0.29 0.35 0.69 0.28 0.18 0.71 0.64 0.36 -0.10 0.13 0.37 1.00
فترة الخدمة 0.09 -0.08 -0.04 -0.72 0.00 -0.16 0.02 -0.11 -0.17 -0.15 -0.21 0.41 -0.11 -0.16 -0.56 -0.28 -0.54 -0.02 0.25 -0.35 -0.39 -0.29 -0.60 -0.20 0.35 0.03 -0.28 1.00
التداخلية -0.43 -0.33 0.06 0.04 -0.42 -0.40 -0.35 0.46 0.69 0.76 0.31 0.24 -0.04 0.65 0.11 0.49 0.04 0.61 0.37 0.56 0.23 0.36 0.73 0.43 0.33 0.37 0.65 -0.27 1.00
الأخلاق والنزاهة 0.29 -0.10 0.10 -0.13 0.30 -0.28 0.48 -0.28 0.19 -0.40 0.25 0.41 0.16 0.13 -0.45 -0.16 -0.24 -0.09 -0.14 -0.30 0.21 0.03 -0.56 -0.25 -0.03 -0.01 0.14 0.41 -0.16
مصفوفة الارتباطات التتراخوركية الزوجية بين جميع معايير الترويج المستخدمة في التحليل، من حيث الوجود/الغياب في نفس السياسات (لكل السياسات؛ N=532). المصفوفة الأصلية مع الارتباطات التتراخوركية الزوجية ليست شبه محددة إيجابياً؛ لأغراض تحليل العوامل اللاحق، تم تعديلها لتكون شبه محددة إيجابياً.

مقالة

البيانات الموسعة الجدول 5 | الفروق في توزيع كل عامل، بين فئات السياسات
معايير مقاييس الإنتاج الرؤية والمشاركة التطوير المهني النتائج والأثر تفرد
عدد المنشورات 0.682 0.4123
المنشورات الحديثة 0.378 0.3895 -0.5299 0.3792
براءات الاختراع 0.657 0.4493 0.4212
استشهادات 0.4566 0.4256 -0.4755 0.3798
فهرسة المجلات 0.8841 0.1821
عدد المؤلفين 0.8619 0.2568
ترتيب المؤلفين 0.7279 0.2602
جودة المجلات غير المترية -0.3468 0.7604 -0.3749 0.2467
دور المؤلفين 0.3922 0.5019 -0.3868 0.4072
جودة النشر غير المترية -0.4369 0.3218 0.3917 0.3822
الأثر الاجتماعي 0.5907 0.3856 0.3616
فارسيت -0.4111 0.3827 0.4096 0.3866
تمويل 0.4525 0.7686
التعاونات -0.3356 0.6163 0.2679
تجربة في الخارج -0.4792 0.604 0.5202
العروض التقديمية 0.5423 0.3017 0.6059
التطوير المهني -0.3141 0.6616 0.4992
العضويات 0.4024 0.3363 0.5264 0.4151
الألقاب المهنية 0.8625
المناصب المدعوة 0.4003 0.521 0.4637
جوائز 0.5332 0.554 0.4277
التسويق/الاستشارات 0.38 0.7948
الخدمة للمهنة 0.4043 0.6572 0.2814
الإرشاد 0.6749 0.423
التعليم 0.6969 0.4175
الأدوار الإدارية 0.7128 0.4734 0.2194
الخدمة المجتمعية 0.7296 0.3479
فترة الخدمة 0.3848 0.4178 -0.4774 0.5234
التداخلية 0.5314 0.5894
الأخلاق والنزاهة 0.7222 0.3858
نتائج اختبارات والد لمساواة المتوسطات لكل عامل بين السياسات المؤسسية مقابل السياسات الوطنية؛ الشمال العالمي مقابل الجنوب العالمي؛ الوضع الاقتصادي للدول؛ التخصصات؛ والمسارات. الفرضية الصفرية (HO): لا يوجد فرق (diff ) في الوسائل بين الفئات المقارنة؛ الفرضية البديلة (H1): المتوسط في فئة واحدة (المبلغ عنه) مختلف (f) عن المتوسط في الفئات الأخرى. الخط العريض واللون الأخضر يدل على قيم p < 0.05. N=532.
البيانات الموسعة الجدول 6 | تحميلات العوامل الكاملة
مستوى التفاصيل الدرجة < 3 الدرجة = 3 الدرجة >3
مسارات
أكاديمي 27 79 ٣٢٠
بحث 2 16 185
التعليم ٣ 15 21
سريري 1 10 19
آخر 1 2 10
التخصصات
العلوم الطبيعية 0 ٨ ٥٧
الهندسة والتكنولوجيا 0 ٧ ٤٩
الطب وعلوم الصحة ٣ 19 ٥٦
العلوم الاجتماعية والإنسانية 0 15 68
عام ٢٨ 71 165
مصدر السياسة
وطني 12 ٣٥ 171
مؤسسي 19 81 ٢١٤
الشمال العالمي والجنوب العالمي
الشمال العالمي 11 37 ١١٧
الجنوب العالمي 20 79 ٢٦٨
الوضع الاقتصادي (مستوى الدخل)
ذو دخل مرتفع 12 ٤٥ 127
دخل مرتفع متوسط ٨ 27 ١٠٤
دخل منخفض إلى متوسط ٧ ٣٥ 87
ذو دخل منخفض ٤ 9 67
القيم لكل معيار تقييم في 532 وثيقة سياسة لكل من العوامل الكامنة الأربعة (F1-F4) التي تم التنبؤ بها بعد تحليل العوامل الرئيسية وتم تدويرها باستخدام طريقة الأوبليمن المائلة (القسم 1.8.2 من SI). “الخصوصية” هي جزء من التباين الذي لا يشاركه معيار معين مع المعايير الأخرى.

محفظة الطبيعة

المؤلف (المؤلفون) المراسلون: ينسى فلوريس بويزو
آخر تحديث من المؤلف(ين): 23 أكتوبر 2024

ملخص التقرير

تسعى Nature Portfolio إلى تحسين إمكانية تكرار العمل الذي ننشره. يوفر هذا النموذج هيكلًا للاتساق والشفافية في الإبلاغ. لمزيد من المعلومات حول سياسات Nature Portfolio، يرجى الاطلاع على سياسات التحرير وقائمة مراجعة سياسة التحرير.

الإحصائيات

لجميع التحليلات الإحصائية، تأكد من أن العناصر التالية موجودة في أسطورة الشكل، أسطورة الجدول، النص الرئيسي، أو قسم الطرق.
غير متوفر
تم التأكيد
□ X
حجم العينة بالضبط لكل مجموعة/شرط تجريبي، معطاة كرقم منفصل ووحدة قياس

بيان حول ما إذا كانت القياسات قد أُخذت من عينات متميزة أو ما إذا كانت نفس العينة قد تم قياسها عدة مرات

اختبار(ات) الإحصاء المستخدمة وما إذا كانت أحادية الجانب أو ثنائية الجانب
يجب أن تُوصف الاختبارات الشائعة فقط بالاسم؛ واصفًا التقنيات الأكثر تعقيدًا في قسم الطرق.

وصف لجميع المتغيرات المشتركة التي تم اختبارها

وصف لأي افتراضات أو تصحيحات، مثل اختبارات الطبيعية والتعديل للمقارنات المتعددة

وصف كامل للمعلمات الإحصائية بما في ذلك الاتجاه المركزي (مثل المتوسطات) أو تقديرات أساسية أخرى (مثل معامل الانحدار) وَالتباين (مثل الانحراف المعياري) أو تقديرات مرتبطة بعدم اليقين (مثل فترات الثقة)
□ X
لاختبار الفرضية الصفرية، فإن إحصائية الاختبار (على سبيل المثال، ) مع فترات الثقة، أحجام التأثير، درجات الحرية و قيمة ملحوظة أعطِ القيم كقيم دقيقة كلما كان ذلك مناسبًا.

□ لتحليل بايزي، معلومات حول اختيار القيم الأولية وإعدادات سلسلة ماركوف مونت كارلو

□ لتصميمات هرمية ومعقدة، تحديد المستوى المناسب للاختبارات والتقارير الكاملة للنتائج

□ تقديرات أحجام التأثير (مثل حجم تأثير كوهين) بيرسون )، مما يشير إلى كيفية حسابها
تحتوي مجموعتنا على الويب حول الإحصائيات لعلماء الأحياء على مقالات تتناول العديد من النقاط المذكورة أعلاه.

البرمجيات والشيفرة

معلومات السياسة حول توفر كود الكمبيوتر
جمع البيانات
تم جمع البيانات باستخدام Google Sheets وتجميعها في ملف واحد تم تنزيله وتحويله في Microsoft Excel 16 (ماك) إلى ملف CSV الذي كان المدخل للبرنامج للتحليل. تم مشاركة البيانات الخام بتنسيق CSV في CodeOcean. كلا من مجموعات البيانات الخام والنظيفة مشتركة هنا:https://doi.org/10.6084/m9.figshare. 23272175.
تحليل البيانات
تم تحليل البيانات باستخدام Stata17 ورسمها باستخدام Python3 pandas وmatplotlib. تم تجميع الألواح وتنسيقها باستخدام Adobe Illustrator 2024. تم مشاركة كود تحليل البيانات في CodeOcean.https://codeocean.com/capsule/0942594/tree .
بالنسبة للمخطوطات التي تستخدم خوارزميات أو برامج مخصصة تكون مركزية في البحث ولكن لم يتم وصفها بعد في الأدبيات المنشورة، يجب أن تكون البرمجيات متاحة للمحررين والمراجعين. نحن نشجع بشدة على إيداع الشيفرة في مستودع مجتمعي (مثل GitHub). راجع إرشادات مجموعة Nature لتقديم الشيفرة والبرمجيات لمزيد من المعلومات.

بيانات

معلومات السياسة حول توفر البيانات
يجب أن تتضمن جميع المخطوطات بيانًا حول توفر البيانات. يجب أن يوفر هذا البيان المعلومات التالية، حيثما ينطبق:
  • رموز الانضمام، معرفات فريدة، أو روابط ويب لمجموعات البيانات المتاحة للجمهور
  • وصف لأي قيود على توفر البيانات
  • بالنسبة لمجموعات البيانات السريرية أو بيانات الطرف الثالث، يرجى التأكد من أن البيان يتماشى مع سياستنا
لقد قمنا بتضمين بيان توافر البيانات ونشارك جميع البيانات التي تم إنتاجها من هذه الدراسة.

البحث الذي يتضمن مشاركين بشريين، بياناتهم، أو مواد بيولوجية

معلومات السياسة حول الدراسات التي تشمل مشاركين بشريين أو بيانات بشرية. انظر أيضًا معلومات السياسة حول الجنس، الهوية/التقديم الجنسي، والتوجه الجنسي والعرق، والعرقية والعنصرية.
التقارير عن الجنس والنوع الاجتماعي غير متوفر
التقارير عن العرق أو الإثنية أو غيرها من التجمعات الاجتماعية ذات الصلة غير متوفر
خصائص السكان غير متوفر
التوظيف غير متوفر
رقابة الأخلاقيات نحن لا نتعامل مع أي مشاركين بشريين، أو بياناتهم أو موادهم البيولوجية. دراستنا تقتصر على تحليل السياسات التي تم تطويرها من قبل المؤسسات وقد تؤثر على البشر ولكنها لا تتعلق بهم بشكل مباشر.
يرجى ملاحظة أنه يجب أيضًا تقديم معلومات كاملة حول الموافقة على بروتوكول الدراسة في المخطوطة.

التقارير الخاصة بالمجال

يرجى اختيار الخيار أدناه الذي يناسب بحثك بشكل أفضل. إذا لم تكن متأكدًا، اقرأ الأقسام المناسبة قبل اتخاذ قرارك.
□ علوم الحياة
العلوم السلوكية والاجتماعية □ العلوم البيئية والتطورية والبيئية
لنسخة مرجعية من الوثيقة بجميع الأقسام، انظرnature.com/documents/nr-reporting-summary-flat.pdf

تصميم دراسة العلوم السلوكية والاجتماعية

يجب على جميع الدراسات الإفصاح عن هذه النقاط حتى عندما يكون الإفصاح سلبياً.
وصف الدراسة
عينة البحث
استراتيجية أخذ العينات
جمع البيانات
توقيت
استثناءات البيانات
عدم المشاركة
التوزيع العشوائي
قمنا بإجراء تحليل كمي مقطعي من خلال فحص معايير التقييم المستخدمة في سياسات الترقية. حددنا وحللنا بشكل منهجي معايير الترقية، وقارنّا الفروق والتشابهات عبر التخصصات والمجالات والمسارات وأنواع المؤسسات والدول، مع الأخذ في الاعتبار سياقاتها الاجتماعية والاقتصادية. قمنا بتسجيل وجود أو عدم وجود معايير تقييم متميزة مختارة بشكل ذاتي في الوثائق المتاحة التي تصف سياسات الترقية، دون أي اعتبار لعملية التوظيف أو الترقية.
حللت الدراسة 532 سياسة ترقية من 190 مؤسسة أكاديمية و58 وكالة حكومية عبر 121 دولة. تم اختيار العينة لتعظيم التنوع العالمي والتقاط مجموعة واسعة من الممارسات المؤسسية، مع التركيز على سياسات ترقية الأساتذة الكاملين باعتبارها أعلى منصب يمكن مقارنته بين المؤسسات في دول مختلفة. على الرغم من أنها ليست تمثيلية لجميع المنظمات الأكاديمية والوطنية، فإن عينتنا لديها القدرة على دعم ادعاءاتنا (انظر القسم 2.3 من SI)
تم الحصول على الوثائق من خلال عينة كرة الثلج العالمية التي نشأت من شبكة GYA بدلاً من كونها عينة عشوائية عبر جميع المؤسسات أو السلطات ذات الصلة في العالم، وعينتنا ليست تمثيلية على مستوى الدولة. تم إبلاغ حجم عينتنا من خلال تحليل القوة، والذي كما هو موضح في القسم 2.3 من SI يؤكد أن عينتنا لديها القدرة على دعم ادعاءاتنا.
تم الحصول على السياسات من مواقع الويب العامة والشبكات الأكاديمية والطلبات الرسمية. تم تحليل الوثائق المجمعة لتحديد وجود أو عدم وجود معايير محددة تتعلق بترقية الأساتذة الكاملين. تم تنفيذ ترميز البيانات من قبل أعضاء الفريق باستخدام قالب موحد وتعريفات وبروتوكولات ومواد داعمة.
بدأت دراسة البيانات في عام 2016 مع دراسة تجريبية لتعريف المنهجية. تم جمع الوثائق منذ ذلك الحين. ومع ذلك، تم الحصول على 83% من الوثائق في النسخة المنشورة من هذه المخطوطة في 2022/2023 لضمان أنها لا تزال صالحة.
استبعدنا البيانات من الوثائق التي لم تقدم معلومات واضحة أو شاملة حول معايير الترقية. بالإضافة إلى ذلك، قمنا بتقييد تحليلنا لسياسات الترقية للأساتذة الكاملين، مستبعدين الوثائق التي لم تغطي هذا الدور أو التي ركزت على مسارات مهنية غير مرتبطة بالبحث والتعليم، لضمان الاتساق وقابلية المقارنة لنقاط البيانات المختلفة. استبعدنا ما مجموعه 24 سياسة من دراستنا. طوال العملية، وثقنا استبعاد 59 سياسة.
n/a
n/a

التقارير عن مواد وأنظمة وأساليب محددة

نحتاج إلى معلومات من المؤلفين حول بعض أنواع المواد والأنظمة التجريبية والأساليب المستخدمة في العديد من الدراسات. هنا، حدد ما إذا كانت كل مادة أو نظام أو طريقة مدرجة ذات صلة بدراستك. إذا لم تكن متأكدًا مما إذا كان عنصر القائمة ينطبق على بحثك، اقرأ القسم المناسب قبل اختيار رد.
المواد والأنظمة التجريبية الأساليب
n/a المشاركة في الدراسة n/a
X X
X
X X
X
X

النباتات

بذور المخزون □
n/a
أنماط نباتية جديدة □ n/a
التحقق □
n/a

    1. ويلدسون، ج. وآخرون. المد المتري: تقرير المراجعة المستقلة لدور المقاييس في تقييم وإدارة البحث (HEFCE، 2015); https://doi.org/10.13140/ RG.2.1.4929.1363.
    2. كاري، س.، غاد، إ. وويلدسون، ج. استغلال المد المتري: المؤشرات والبنى التحتية والأولويات لتقييم البحث المسؤول في المملكة المتحدة – تقرير لجنة المد المتري المعاد النظر فيها (RORI، 2022); https://doi.org/10.6084/m9.figshare.21701624.
    3. فوزي، م. أ.، تان، س. ن. ل.، داود، م. وآوالودين، م. م. ن. تصنيفات الجامعات: مراجعة للعيوب المنهجية. قضايا البحث التعليمي. 30، 79-96 (2020).
    4. غاد، إ. قياس جامعاتنا بشكل خاطئ: لماذا لا تتوافق التصنيفات الجامعية العالمية. أمام. بحث. ميتري. تحليل. https://doi.org/10.3389/frma.2021.680023 (2021).

Journal: Nature, Volume: 638, Issue: 8050
DOI: https://doi.org/10.1038/s41586-024-08422-9
PMID: https://pubmed.ncbi.nlm.nih.gov/39843736
Publication Date: 2025-01-22

Regional and institutional trends in assessment for academic promotion

https://doi.org/10.1038/s41586-024-08422-9
Received: 1 June 2023
Accepted: 18 November 2024
Published online: 22 January 2025
Open access
Check for updates

B. H. Lim¹, C. D’Ippoliti , M. Dominik , A. C. Hernández-Mondragón , K. Vermeir , K. K. Chong , H. Hussein , V. S. Morales-Salgado , K. J. Cloete , J. N. Kimengsi , L. Balboa , S. Mondello , T. E. dela Cruz , S. Lopez-Verges , I. Sidi Zakari , A. Simonyan , I. Palomo , A. Režek Jambrak²3, J. Germo Nzweundji²4, A. Molnar , A. M. I. Saktiawati , S. Elagroudy , P. Kumar , S. Enany , V. Narita , M. Backes , V. Siciliano , D. Egamberdieva & Y. Flores Bueso

Abstract

The assessment of research performance is widely seen as a vital tool in upholding the highest standards of quality, with selection and competition believed to drive progress. Academic institutions need to take critical decisions on hiring and promotion, while facing external pressure by also being subject to research assessment . Here we present an outlook on research assessment for career progression with specific focus on promotion to full professorship, based on 314 policies from 190 academic institutions and 218 policies from 58 government agencies, covering 32 countries in the Global North and 89 countries in the Global South. We investigated how frequently various promotion criteria are mentioned and carried out a statistical analysis to infer commonalities and differences across policies. Although quantitative methods of assessment remain popular, in agreement with what is found in more geographically restricted studies , they are not omnipresent. We find differences between the Global North and the Global South as well as between institutional and national policies, but less so between disciplines. A preference for bibliometric indicators is more marked in upper-middle-income countries. Although we see some variation, many promotion policies are based on the assumption of specific career paths that become normative rather than embracing diversity. In turn, this restricts opportunities for researchers. These results challenge current practice and have strategic implications for researchers, research managers and national governments.

The pervasiveness of evaluation and the obsession with metrics in modern society often come at the cost of sensible judgement , and academia is no exception .Performance assessment is widely regarded as essential for upholding high standards, and selective processes and competition are believed to drive progress. However, performance indicators can become ends in themselves, and assessments lose effectiveness when misaligned with their original purpose . Moreover, one may question whether competition as a core value suits a global research ecosystem that thrives on diversity and depends on collaboration for impact . If our goal is to advance society through knowledge generation, we need to understand how research assessment, from the global level to individual researchers, can contribute positively to the research ecosystem.
Claiming the promotion of research ‘excellence’ and priding oneself in the record of ‘excellence’ has become commonplace, but what this excellence is concretely about is unclear . It might not be problematic if ‘excellence’ varies across contexts. However, increased marketization subjects research institutions to competitive pressure , under which research managers face the challenge of building efficient teams delivering long-term value while maintaining external recognition linked to financial support, which is frequently related to flawed university
rankings . These management decisions affect researchers at all career stages, especially in recruitment, evaluations, retention and promotion.
The widespread use of scientometrics, particularly bibliometrics , has fostered the perception of a universal research assessment system, but such a view fails to recognize the complexity and diversity of actual practices. Metrics are attractive owing to their simplicity, low cost and perceived objectivity, which is thought to mitigate favouritism . However, citation-based bibliometrics reflect social networks and accumulate subjective decisions . Rather than objectivity, transparency is key for maintaining integrity in assessments, which inevitably involve human judgement. Research outputs offer important evidence of progress but present only a narrow view of the broader research ecosystem. Evaluating them solely by productivity and popularity fails to capture both value and rigour. In the Leiden Manifesto, experts on scientometrics raised concerns that evaluation has increasingly become led by data rather than by judgement and warned of the misapplication of indicators, with the journal impact factor being a prime example . The SCOPE guide for research evaluation stresses that performance should be measured against the mission goals of institutions, groups or individuals, respecting relevant contexts . Assessment processes that do not meet their purpose are invalid.
The Hong Kong Principles for assessing researchers emerged from acknowledging the need for trustworthiness of knowledge , emphasizing the importance of recognizing behaviours that promote research integrity. However, the pursuit of ‘excellence’ through quantitative metrics often drives unethical behaviour . The United Nations Educational, Scientific and Cultural Organization (UNESCO) Recommendation on Open Science highlights that fostering a global research culture aligned with open science requires adequate evaluation processes that reward good practices , as previously stressed, for example, by the Global Young Academy and the European University Association .
Change is on the horizon as more signatories to the San Francisco Declaration on Research Assessment update their procedures, the Latin American Council of Social Sciences (CLACSO) launches the Latin American Forum for Research Assessment (FOLEC) , and collaborations such as that between the InterAcademy Partnership, the Global Young Academy and the International Science Council publish studies on research evaluation and plan joint future initiatives . All the while a large community originally gathered by the European Commission builds a Coalition for Advancing Research Assessment . Wide discontent with existing practices has also led to discourse at national levels about ways forwards with better approaches .
Our analysis of promotion practices across the world aims at overcoming some biased perceptions and illuminating the connection with competencies, skills, productivity, impact and benefits. We anticipate that our findings will prove valuable to both researchers and research managers for understanding career options and opportunities and offer guidance on how to build a robust and diverse research ecosystem driven by responsible actors contributing through their strengths.

Study design

To study how researchers are evaluated worldwide, we conducted a cross-sectional analysis examining the assessment criteria used in promotion policies. We systematically identified and analysed selected promotion criteria by capturing their presence or absence in promotion policies and comparing differences and similarities across disciplines, fields, tracks, types of institution and countries, considering their socioeconomic contexts. Rather than following a predefined protocol, we developed our methodology through an initial pilot study, which then evolved into a comprehensive framework (Supplementary Information section1.1), which allowed us to compare and quantify qualitative data from institutional documents worldwide.
Researchers operate in diverse environments across countries, regions and institutions, resulting in substantial variability in career progression roles. Mapping all career paths is beyond our aims, so we focused on promotion policies for (full) ‘professor’-the most senior academic role, widely recognized and comparable across countries. We distinguish the standard academic track, a research-focused track, a teaching-focused track and a clinical track. Additionally, we focus on assessment within academic institutions, and do not include roles beyond universities such as those in research institutes, clinical settings or commercial environments.
Between May 2016 and November 2023, we drew on the Global Young Academy membership and alumni network to collect documents outlining promotion policies, including criteria and procedures (Methods section “Data acquisition”). In a study pilot phase (2016-2018), we sourced 46 policies to inform our methodological framework. Subsequently, in a first data collection phase (2018-2021), we built a dataset of 196 policies from 55 countries. In 2023, we updated the data for all policies collected and broadened the scope of our effort to include policies from under-represented Global South regions, adding a further 440 policies. With this last round, we sourced policies set by 190 academic institutions (‘institutional policies’) and 58 government agencies (‘national policies’) across 121 countries. Additionally,
Fig.1|Sample of promotion policies. Map showing the geographical distribution of the data used for analysis. Blue colour shades (on logarithmic scale) indicate the number of estimated active researchers in each of the 121 countries from which we sourced policies . Other countries and territories are shown in grey. The area of the semicircles is proportional to, respectively, the number of institutions or agencies (yellow) and the number of policies (orange) from a given country. The map is based on geodata openly available at the Natural Earth repository, using the land polygon GeoJSON dataset (https://www.naturalearthdata.com/). The plot was generated with geopandas and matplolib wedge shape patch, as per the annotated code shared in the Code availability section. The authors do not endorse any position over any disputed area or contested border. The number of researchers was obtained from the UNESCO Institute for Statistics and UNESCO Science Reports (Supplementary Information section 1.7).
53 organizations’ (institutions’ or agencies’) documents in our sample defined multiple policies that distinguish between career tracks and/or disciplines, which brought the total of collected track-specific and discipline-specific policies to 532 (Fig.1; more in Methods sections “Translation” to “Clustering by disciplines, tracks, global region and economic status”).
Most of the organizations in our sample (73%) are based outside Europe and North America, offering a more diverse perspective than previous studies . Our study covers 32 countries in the Global North and 89 countries in the Global South, although we do not provide country-level analyses. To better reflect the realities of an average applicant, we applied post-sampling weights, so that each policy from the same organization had equal weight, each organization within a country had equal weight, and each country was weighted proportionally to its number of active researchers (Supplementary Information section 1.7 and Supplementary Tables 4 and 9). Our geographical coverage is illustrated in Fig.1, and a breakdown of the data is provided in Extended Data Table 1. Full data and code are available via the Data and Code availability sections.

General outlook of promotion criteria

We included all policies for promotion to professorship that clearly specified evaluation criteria, covering both research and teaching (see eligibility in Methods section “Data cleaning (eligibility criteria)”). Policy documents varied widely in scope, structure and level of detail; 28% of the policies in our sample were brief guidelines, whereas 72% included detailed application or evaluation forms with points-based systems (Extended Data Tables 2 and 3 and Supplementary Information sections 1.4 and 1.5). Generally, policies defined three domains:
Fig. 2 | Trends in research assessment. a,b, Frequency with which each of the 30 assessment criteria is estimated to affect researchers in the 121 countries surveyed. a shows 19 criteria along with the general category of research
outputs, which is expanded into 7 quantitative (top) and 4 qualitative (bottom) measures shown in . RC, recognition; GTs, general traits.
research, teaching and services. We identified 30 key criteria across 5 categories: research outputs; career development; recognition; teaching and service; and general traits. Within research outputs, 11 criteria were identified as either ‘quantitative’ (metrics-based; for example, bibliometrics) or ‘qualitative’ (narrative descriptions and/or peer-review) descriptors (Methods section 2.3 “Criteria and categories”, Extended Data Table 3, Supplementary Information section 1.3 and Supplementary Table 1).
As shown in Fig. 2, policies in our sample reflect an assessment system that prioritizes research outputs ( ), teaching ( ), funding (79%) and mentoring (75%), followed by criteria relating to professional services and recognition, such as administrative roles, awards and societal service (each between and ). Research outputs are more often assessed through quantitative measures (92%) than through qualitative measures ; in this section and the section below, all Wald tests for equal proportions account for sample weights and are based on an , with ). The use of the single quantitative and qualitative methods also varied, with a frequent reliance on patents (63%) and number of publications ( ) among the quantitative measures, and on societal impact (53%) among the qualitative ones.

Regional and institutional differences

A fair distribution in our sample of national ( ) and institutional (59%) policies from both the Global North (31%) and Global South (69%; United Nations Statistics Division 2018 classification) enabled us to analyse policy types by region. As shown in Fig. 3a, in our sample, both policy types assess teaching with no evidence for a statistical difference in frequency (national: , institutional: , ), and both use bibliometrics for assessing research outputs (national: 85%, institutional: 89% of documents using at least one quantitative criterion; Extended Data Table 3 and Extended Data
Fig. 1), such as the number of publications (national: 76%, institutional: ) or citations (national: ; institutional: , ), for which no evidence of significant differences was found, but their focus diverged on some specific criteria. National policies prioritized research output metrics, such as journal indexing and recent publications . By contrast, institutional policies reflected a broader scope, with greater emphasis on qualitative measures , for a test on the use of at least one policy criterion defined as qualitative; Extended Data Table 3), such as non-metric quality of publications ( , , and valued interdisciplinarity ( ) and career development aspects such as long-term scientific prospects (far-sight; ).
At the simple level of observed frequencies, we find a higher proportion of policies in the Global South ( ) relying on quantitative measures compared to the Global North . However, high variability within each group (with 95% confidence intervals of the estimated average frequencies ranging between 0.71 and 0.92 for the Global North, and between 0.76 and 0.99 for the Global South) renders this difference statistically nonsignificant ( ), although a one-sided equivalence test for a difference of at least 5 percentage points yields . Similarly, we observed a difference that is not statistically significant at the conventional level in the average frequency of reliance on qualitative measures in the Global North (83%) and the Global South ( ), yet again, the high variability within each group yields a one-sided equivalence test for a difference of at least 5 percentage points resulting in (in this case, the confidence intervals are for the Global North and 0.39-0.79 for the Global South; rationale for one-sided test in Methods section “Frequency statistics”). A disaggregated regional analysis, shown in Fig. 3b, revealed that most differences between types of policy are found in the Global North, for which qualitative criteria were more frequently used in institutional than in national policies (in
quantitative criteria for assessing research outputs within national (right) and institutional (left) policies, distinguishing between Global South (green) and Global North (grey). Institutional (North,141; South,173); national (North, 24; South, 194).
Fig. 3 | Frequencies by policy type and global regions. a, Spider plots showing the frequency of 30 criteria among institutional (grey) and national (red) policies, grouped into four spider plots according to the class of the criteria: research outputs; career development; teaching and services; and general traits and recognition. b, Bar plots comparing the frequency of qualitative and
measures (both at , with ; in this subsample, ). Detailed results for Pearson’s and design-based -tests of equal proportions for each criterion by policy type, world
and of policies, respectively; ; in this subsample, ). By contrast, the Global South does not exhibit significant differences between policy types in the use of qualitative
Fig. 4 | Factor analysis of the assessment criteria for promotion to professorship. The heat map shows the factor loadings (a measure of correlation; Methods) of each assessment criterion in the 532 policies on each of the 4 latent factors (factors 1-4) predicted after principal factor analysis and rotated with the oblimin oblique method. ‘Uniqueness’ is the fraction of the
variance that a given criterion does not share with others. Blanks denote loading <0.3 in absolute value, and other values are highlighted with a colour scale; all loadings are shown in Supplementary Table 5. We assigned factor interpretation labels to the four factors, to describe the set of criteria they cover.
region, discipline, track and economic status of the country are provided in Supplementary Table 5.
Beyond measuring frequencies, we examined co-occurrence patterns to examine whether any correlations between policy choices could be indicative of the standpoints of individual institutions and/or national governments. Using principal factor analysis, we found four latent
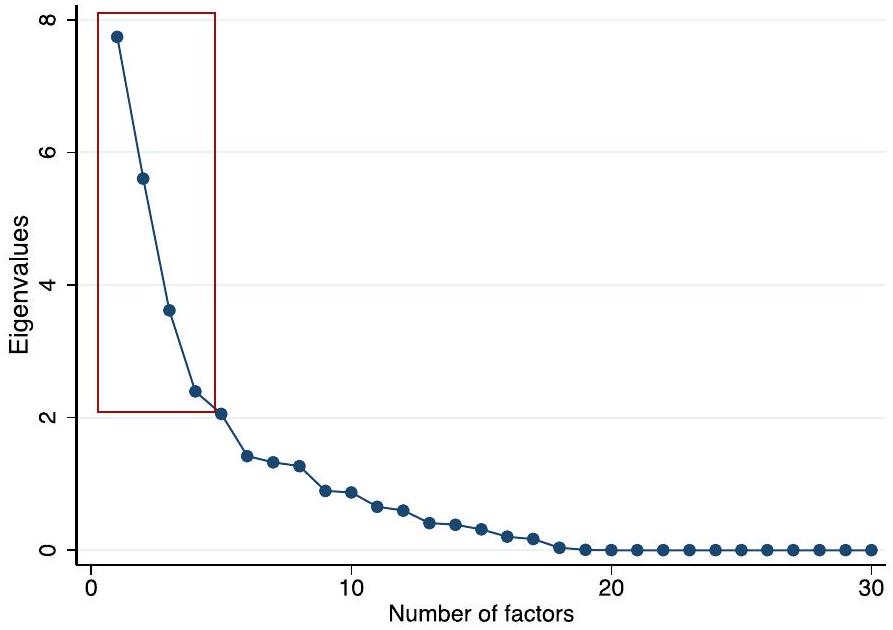
factors that collectively accounted for of the cumulative variance in the data (see scree plot in Extended Data Fig. 2). As can be observed in the loading plots (Extended Data Fig. 3), each factor represents a pattern of distinct clusters of criteria found together in the same policies. Notably, quantitative and qualitative criteria for assessing research outputs are clearly separated across factors, emphasizing their role as key differentiators in policy design. This suggests that organizations often make distinct choices between quantitative or qualitative methods and then consistently apply them throughout the
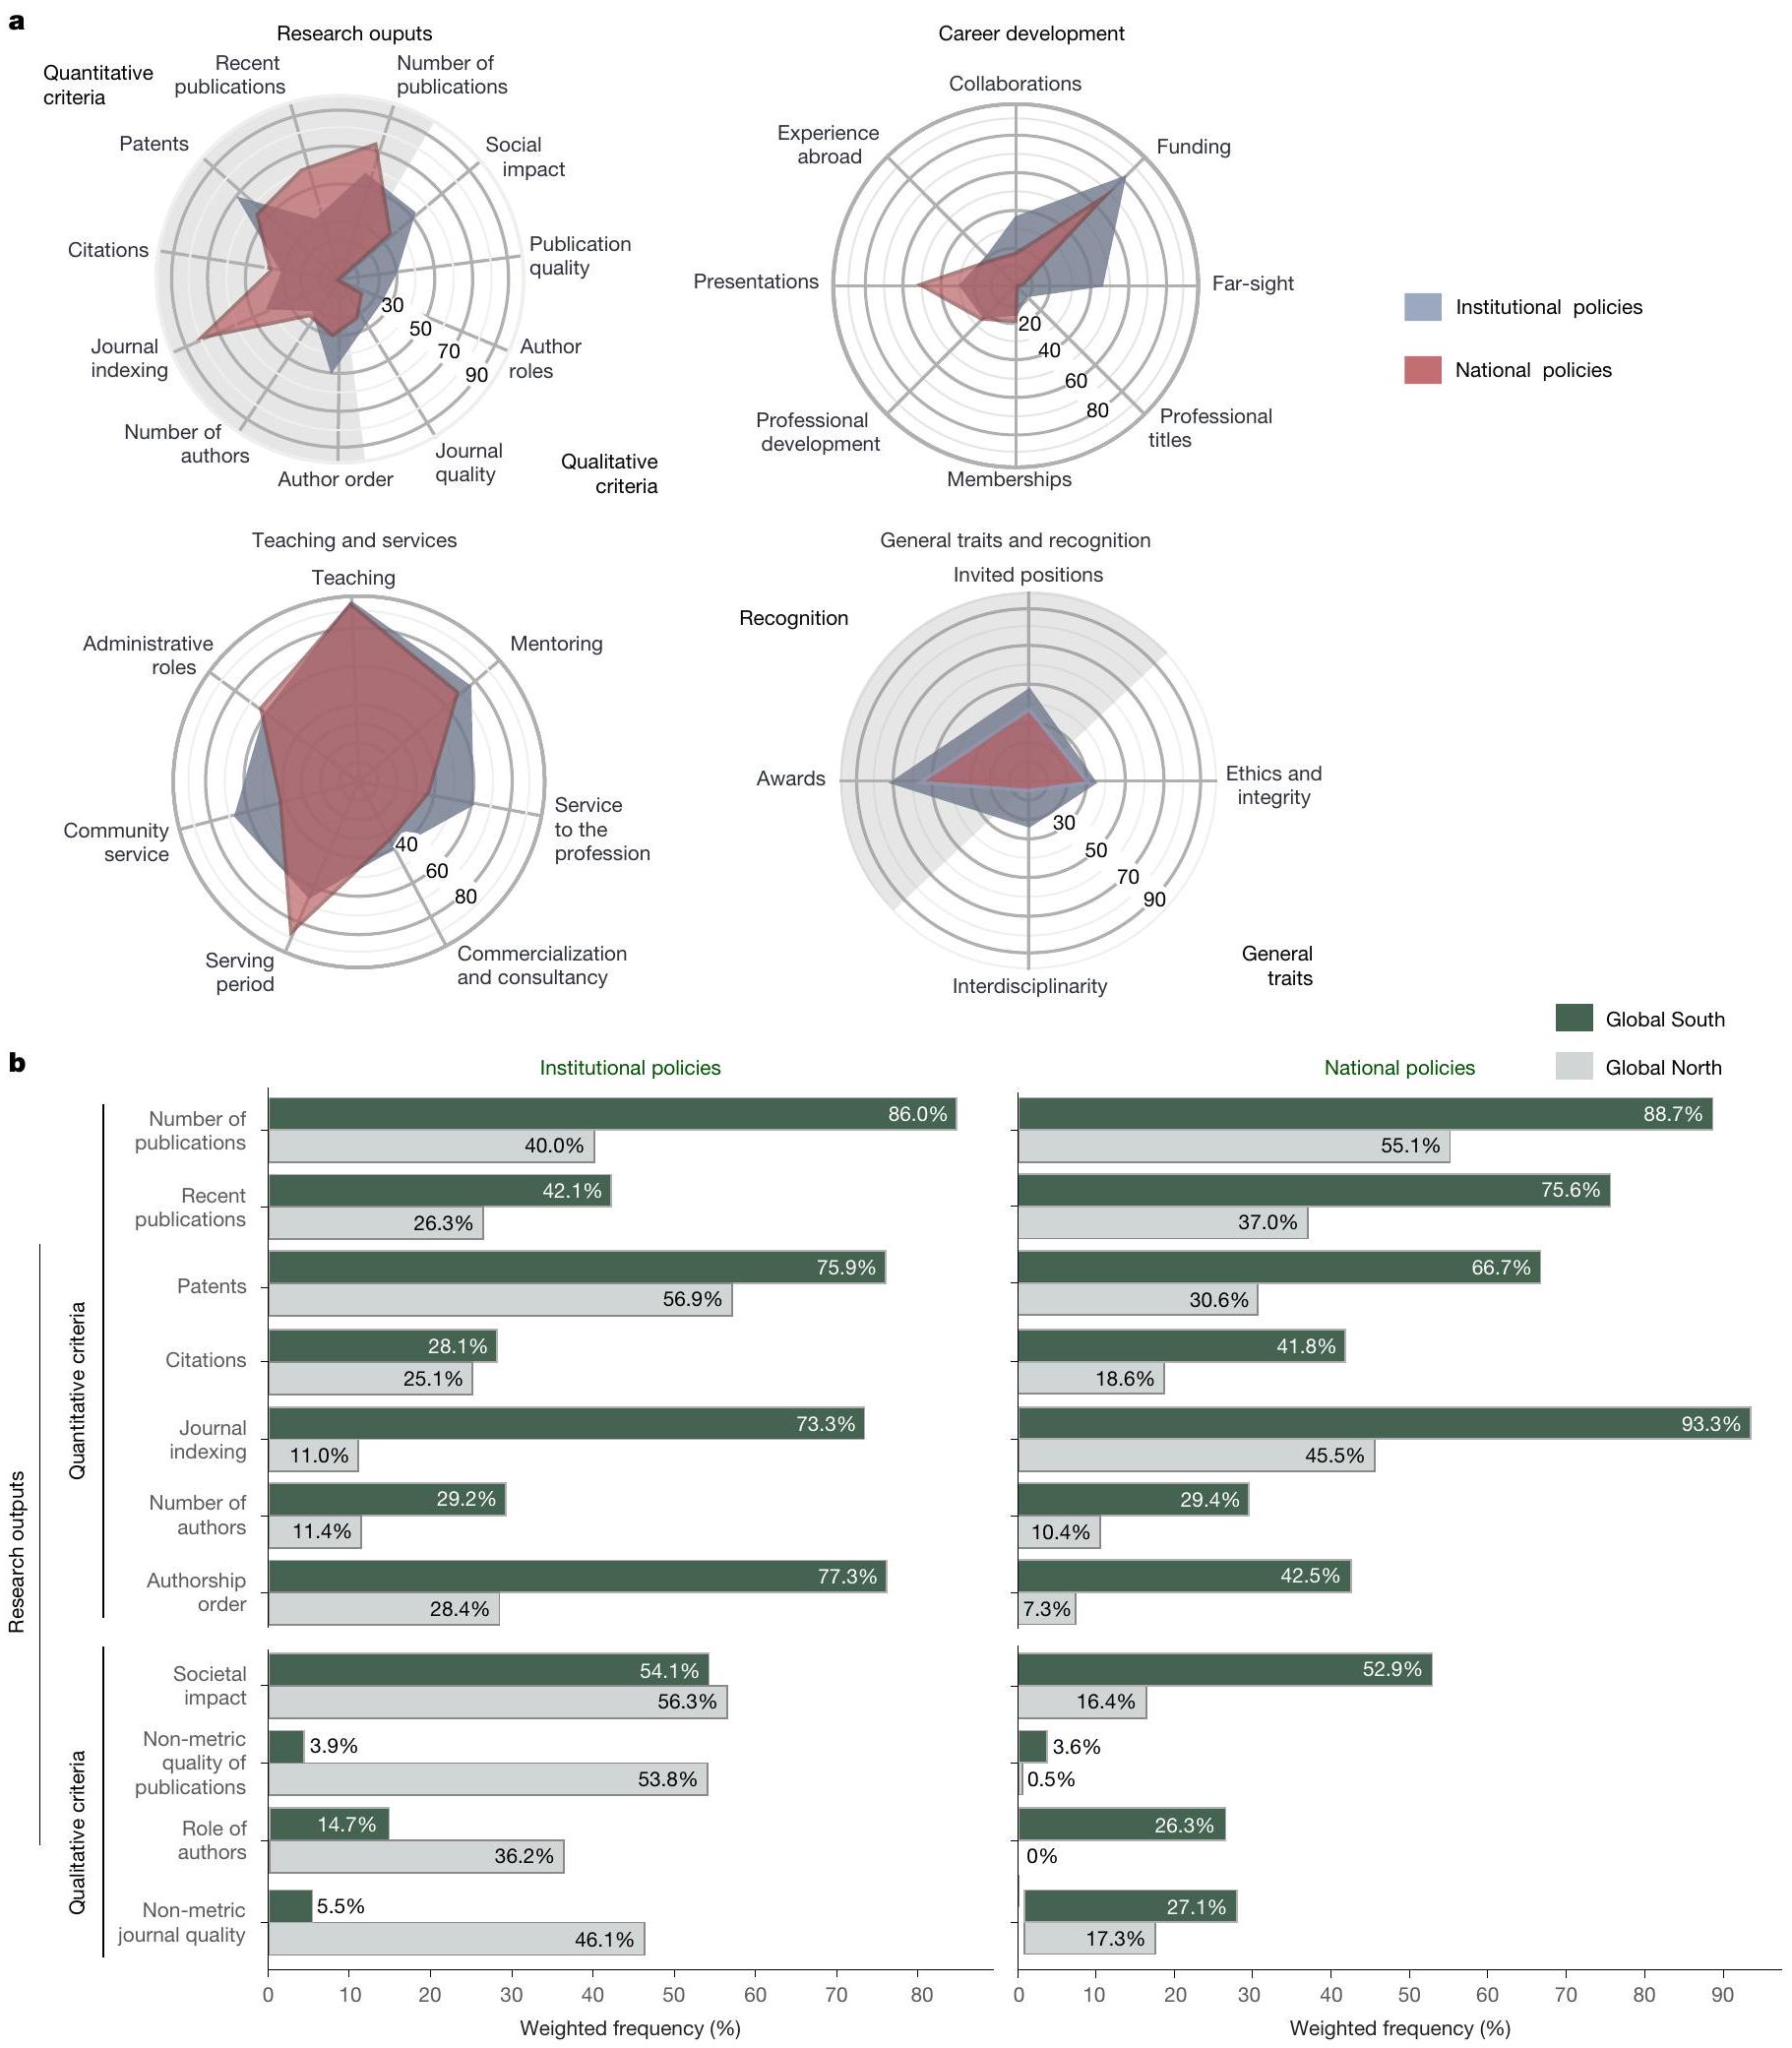
policy. By contrast, Fig. 4 illustrates how other categories of predefined criteria were intertwined, with some showing loadings greater than 0.3 across multiple factors. For ease of interpretation, all factors were standardized to range from 0 to 1 . A detailed description of the analysis is presented in the Methods section “Factor analysis”; the matrix of pairwise tetrachoric correlations of the single criteria is presented in Extended Data Table 4, along with the visualization of the distribution of factors and tests on the differences in the distribution of each factor between categories of policies and additional results (Extended Data Fig. 4 and Extended Data Table 5, accordingly). As shown in Fig. 4, each criterion aligned with at least one of the four factors (listed in order of variance explained), which can be interpreted as follows-(factor 1) output metrics: quantitative assessment of publications and awards; (factor 2) visibility and engagement: engagement with the academic and wider communities, interdisciplinary efforts, and recognition in terms of invited positions and awards; (factor 3) career development: experience abroad, professional development, service to the profession and mentoring, coupled with citations as an element of recognition; (factor 4) outcomes and impact: patents, funding, societal impact, far-sight, and commercialization and consultancy.

Factors influencing policy criteria

To investigate which policies placed greater emphasis on specific assessment criteria, we performed separate regression analyses on each of the four factors presented in Fig. 4 (as per Methods section “Multivariate regression”). Policies were classified on the basis of contextual factors, such as global region, national per-capita income (World Bank ) and continent; and policy- or job-related attributes, such as career track, discipline (Organisation for Economic Co-operation and Development ) or whether the policy was specific to full professorships or applied more broadly to scholars. Concerning the contextual factors, in a second set of regressions, we further differentiate policy type (institutional versus national) by global region. For both specifications, the coefficients along with robust standard errors and test statistics are detailed in Supplementary Table 7. Figure 5 summarizes the main results for the specification with region-specific policy types (as seen in Supplementary Table 7, the coefficients of the other variables do not change between the two specifications). Although direct comparisons across factors are impossible owing to the use of different dependent variables in each regression, the figure clearly demonstrates that the extent to which policy categories align with each factor varies substantially.
A key result of our study is that job characteristics-such as discipline, career track or rank-although intuitively relevant, often exhibited coefficients that were not statistically significant. For example, among disciplines, only engineering-specific policies differ significantly (with ) from those applicable across disciplines (the reference group), showing a higher emphasis on outcomes and impact (coefficient Coeff ; see Supplementary Table 7). Similarly, among the various tracks, only research-focused ones showed differences significant at the level, placing greater emphasis on candidates’ visibility (Coeff ) and outcomes and impact (Coeff ), and less on career development (including criteria such as experience abroad and mentoring; Coeff ). Policies specific to full professorships were also less likely to prioritize career development (Coeff ). All other coefficients related to job characteristics were not statistically significant at level in all four regressions (see also Extended Data Tables 4-6 for univariate analyses of differences across disciplines and tracks).
Regarding contextual characteristics of the policy documents, rather than characteristics of the job, we found statistically significant differences across continents compared to Europe. Policies from Asia placed less emphasis on visibility (Coeff ) and career development Coeff
while focusing more on outcomes and impact ( Coeff , ). Latin American policies relied less on output metrics (Coeff ) and visibility (Coeff , ), whereas Oceania’s policies focused more on outcomes and impact (Coeff ).
Overall, policies from the Global South exhibit a reliance on outcomes and impact that is not statistically different from those from the Global North (Coeff ), but the two regions differed in a statistically significant way in the other three factors, with the Global South relying more on output metrics ( Coeff , , visibility (Coeff ) and career development (Coeff ).
Across regions, national policies placed a stronger emphasis on output metrics compared to institutional policies (Coeff , ). However, more differences by policy type emerge when distinguishing the two main world regions (for all intersections, the reference group is the institutional policies in the Global South). National policies in the Global North emphasized output metrics (Coeff ) but showed a nonsignificant, negative association with visibility (Coeff ). Institutional policies from the Global South placed greater emphasis on output metrics (Coeff ), visibility (Coeff ) and career development, although the last of these did not reach statistical significance (Coeff = 0.110, ). Finally, national policies in the Global South placed more emphasis on output metrics (Coeff , , visibility (Coeff ) and career development (Coeff ).
Finally, our analysis revealed a significant association between average national income and promotion criteria. Visibility is a key focus in higher-income countries, whereas in comparison upper-middle-income countries place more emphasis on metrics (Coeff , ) and less on visibility (Coeff ). Similarly, lower-middle-income (Coeff ) and low-income (Coeff ) countries show a decreased emphasis on visibility, with low-income countries also showing a reduced focus on outcomes and impact (Coeff , ).
Beyond examining the statistical significance of individual coefficients, we compared likelihood-based information criteria for our models (Fig. 4 and Extended Data Table 6) with those of alternative models that exclude all job characteristics (disciplinary field, career track and full professorship specificity) or only exclude disciplinary fields. As shown in Supplementary Table 8, the models that include policy document characteristics (continent, global region and economic status of the country) show a substantial improvement in log-likelihood (ranging from 19% for career development to 127% for output metrics) over a simple intercept-alone model across all four factors. However, when it comes to including job characteristics, we see different preferred model specifications for each factor. The best-fitting models for output metrics and for visibility and engagement exclude job characteristics (or at least the disciplinary field), whereas models for outcomes and impact and for career development perform best with job characteristics included.
To investigate the geographical representativeness of our analysis, and understand whether researchers based in countries with smaller research systems face different conditions, we examined whether the results were influenced by a few countries with large research systems (Supplementary Information section 2.5). We repeated the principal factor and regression analyses on a subsample excluding the ten largest countries, which account for of the estimated global researcher population. In the resulting subsample, representing 28% of the research population, based in the smaller research systems, policies followed patterns similar to those of the full sample. The same four main factors of Fig. 4 emerged from the co-occurrence of criteria (see also Extended Data Table 6). These factors aligned with
Fig.5|Coefficients of the regression analyses. Relation between the four predicted factors and policy or country characteristics noted in this study. For the categorical variables, the relation is measured in terms of deviation from a reference category shown in brackets in the figure legend. From top to bottom, categories are: region and policy scope (dark blue), income level (blue), continents (cyan), tracks (orange), disciplines (salmon), and exclusive to full professor (red). Variables with a statistically significant coefficient are indicated; ; two-sided -tests of difference from
zero. Exact values for each variable are provided in Supplementary Table 7. The number of policies within each category can be found in Extended Data Table 1. The length of the bars denotes the size of the coefficient, and the length of the lines denotes the confidence intervals based on robust standard errors. Sample size . The values for each coefficient, their standard errors and statistical significance are reported in Supplementary Table 7. GN, Global North; GS, Global South; sci., science;Prof., professor.
policy characteristics similarly to the full sample (as seen in Fig. 5). However, as emerges from comparing Supplementary Tables 7, 10 and 11, some regression coefficients showed differences in statistical significance-most notably, the three coefficients highlighting
differences between the Global North and Global South are not statistically significant in the smaller subsample, as happens for the coefficients denoting upper-middle-income countries (see Supplementary Information section 2.5 for further details).

Discussion

Our study provides a broad, inclusive dataset capturing promotion policies across under-represented regions, presenting, to our knowledge, one of the most diverse views available on promotion practices. Through rigorous data coding and analysis methods, including post-sampling weighting and factor analysis, we reveal distinct patterns in assessment practices and explore factors that may influence them, offering insights into global policy alignment and diverse institutional needs. However, the scope of our analyses is limited to the presence or absence of criteria, without any regard to the process of hiring or promotion. We relied on snowball sampling rather than a randomized global sample, and our data are not representative at the country level. Additionally, our methodology was initially developed through a pilot study, with no established protocol at that stage.
Our analysis reveals key findings that both institutions and researchers should consider, and which are essential for shaping national research policies.
First, promotion criteria are not identical across institutions. We identified substantial variation around common profiles, with no universally applied criteria. Many institutions have the flexibility to adapt criteria to their needs, accommodating diversity among institutions and researchers’ career paths. However, we did not observe a free mix-and-match of criteria, but rather diversity around characteristic clustering of criteria. This allows researchers to align their skills with suitable institutions, although not every institution will be a good fit. However, differences between assessment systems that are uniform at the national level pose challenges for international mobility , particularly for early-career researchers from countries in the Global South .
Second, scientometrics are most popular in upper-middle-income countries. Although these aim to close the gap with stronger economies, high-income countries rely more on in-depth assessments of researchers’ qualities. This raises the question of the effectiveness of catch-up strategies. There may be a misunderstanding about what drives the success of top-performing economies. Metrics appeal owing to their perceived simplicity and objectivity, but the true meaning of ‘progress’ and ‘success’ may be unclear. If metrics are not aligned with societal goals, they lose purpose. Many metrics systemically disadvantage lower-income countries and their researchers . Focusing on these measures risks staying behind and missing opportunities to leap ahead. We note that this result is driven by few countries with large research systems and is not replicated in our subsample of smaller countries. This once again points to the variety of approaches among different contexts.
Third, national and institutional policies show different preferences, with divergent regional trends. Quantitative measures for assessing research outputs are generally more popular, but national policies more often emphasize publication counts and venues, whereas institutional policies focus on author order and roles. Quantitative measures are more popular in national policies and generally in the Global South, for which visibility and career development are emphasized too. It is an open question whether these trends are supply-led (for example, there may simply be more highly visible candidates in the upper-income countries, and this makes that group of criteria more feasible), or demand-led (the use of metrics in national policies is often defended on the basis of their scale and cost ).
Fourth, the pronounced differences are not between disciplines. We found more variation in assessment criteria within disciplines than between them, at least for two of our four main policy factors, and with geographic, regional and income group differences being often statistically significant. This contrasts with calls for discipline-specific assessments. Outcomes and impact resonate most with engineering, but many challenges and solutions lie between disciplines, as researchers rarely fit into one field. Discoveries in one area influence others, affecting society. Research assessment belongs to the social sciences and should be informed by them, although the popular h-index was introduced
by a physicist in 2005 (ref. 50). A one-size-fits-all approach will not work; we need a framework that respects diversity and encourages cross-disciplinary connections.
Fifth, a bibliometric profile is not a key to success everywhere. Whether to apply quantitative or qualitative approaches for assessing research outputs is a most distinctive feature of promotion policies. Bibliometrics are used frequently but not universally. Our study exhibits 39% of policies not mentioning publication counts, 57% not mentioning journal indexing, and 73% not mentioning citations. Policies covering 11% of candidates explicitly warn against the misuse of bibliometrics. These findings align with studies covering the USA and Canada . A strong bibliometric profile is often insufficient, especially in competitive promotions. Committees also value mentoring, administrative work and contributions to the field. For professorial candidates, relying on metrics without meaningful contributions may offer limited success.
Harnessing skills for a globally equitable research ecosystem requires moving beyond normative career tracks that serve as proxies for success. Conforming to standardized profiles harms diversity and limits mobility within and across academia, industry, government and non-profit-making organizations. Skilled researchers risk exclusion owing to rigid policies and biases held by assessors. Outer circumstances or luck should not be mistaken for individual ability. Previous achievement is not necessarily a good predictor of future potential. Models tailored to certain institutions or countries fail to provide meaningful global benchmarks, as researchers face varying conditions . Knowledge advancement should deliver societal benefits, but this is not simply about demonstrating ‘impact’. Impact can mean different things, from citations to tangible contributions such as technology transfer or economic returns . Citations mainly reflect social networks , and systems built on these metrics can support narcissistic, deceitful or abusive behaviour . Flawed methodologies often produce spectacular results, favouring the ‘natural selection of bad science . Research integrity is vital, yet some assessment practices fail to recognize it or even undermine good standards .
Meaningful assessment requires clarity about the desired qualities. It is necessary to have an understanding of what distinguishes an academic, and of the quality and value of intellectual achievements. Breakthroughs differ vastly from standardized industrial-scale output production. Moreover, researchers do not function independently, but are part of teams and collaborations, and are highly interdependent actors in an intrinsically complex global research and innovation ecosystem. Individual snapshots do not capture this well. We need team players who create added value by elevating their colleagues . Thus, it is worth building a narrative that captures all relevant dimensions of the researcher profile, considering their context, and potential for growth.
Metrics foster monocultures, whereas the global research ecosystem thrives from diversity across global, national and regional levels down to institutions and research teams . We need approaches that foster diversity, rather than imposing norms that limit creativity and impact by promoting a predominant culture . University ranking systems push institutions into unwinnable competition, preventing them from leveraging unique strengths. This raises the question of whether institutions need to break free from these pressures to deliver true value and benefits to society. If so, policies must not allocate funds or other benefits (such as eligibility for hosting students or research visitors, granting of visas and so on) on the basis of rankings.
Research assessment shapes career strategies. Researchers align with promotion criteria, but when measures become targets, they lose their effectiveness (‘Goodhart’s law’) . Some criteria remain vague, such as collegiality, which includes both good citizenship and conformity, subject to interpretation . Researchers often wonder how many publications are needed for career progression, but publication counts and journal prestige are not decisive in some processes . Researchers face a dissonance between what counts, what is perceived
to count, and what should count , leading to a dilemma: contribute to society or prioritize career advancement. Excelling depends on standing out, not just performing well on the same criteria as everyone else. Researchers must face the dilemma of building their career on profiting from fitting a popular profile, but potentially failing owing to the lack of distinction and personal ambitions, or by not developing a well-distinguished profile of excellence that is less popular but might appeal strongly to specific teams or institutions .
The obsession with frequently ill-suited metrics has created inefficiencies in the research ecosystem. Although many countries in the Global North can afford such inefficiency (but should not), it is important that the Global South adopts strategies focused on building appropriate research culture. Our study challenges South-North catch-up strategies based on unsuitable performance indicators. As demonstrated by Latin America’s world-leading model for open access publishing , building purposeful research environments is not primarily a matter of funding, but mostly about fostering a different kind of culture. Such initiatives can provide key input to platforms such as the Coalition for Advancing Research Assessment that aim at building a global community. Rather than letting the Global North sort out things that the Global South then adapts to, actors from the Global South are well suited to take the lead on global initiatives that show the way forwards.

Conclusions

Our findings reveal that promotion policies worldwide show considerable variation, with no universal criteria, reflecting diverse institutional and regional needs. Principal factor analysis identified four main assessment clusters-output metrics;visibility and engagement; career development; and outcomes and impact-each reflecting distinctive patterns across policies. Although trends appear when differentiating by policy scope, global region, continent or income group, substantial variability persists within each subsample. Quantitative metrics, particularly in the Global South, frequently underpin assessment frameworks, whereas high-income countries tend to prioritize qualitative attributes, such as visibility and engagement, to assess academic merit. This reliance on metrics in the Global South raises concerns about the effectiveness of ‘catch-up’ strategies, as metrics alone may reinforce regional inequities. National policies often emphasize output measures such as publication counts, whereas institutional policies, more responsive to local and institutional priorities, focus more broadly on aspects such as societal impact and interdisciplinary work. In contrast to assessment systems that that are uniform at national level and that may hinder international mobility, institutional policies may offer a framework enabling researchers to find institutions that match their skills. These insights suggest that flexible, context-sensitive frameworks are essential to balance global equity with institutional needs, fostering a resilient research ecosystem that values diverse contributions across the academic landscape.

Online content

Any methods, additional references, Nature Portfolio reporting summaries, source data, extended data, supplementary information, acknowledgements, peer review information; details of author contributions and competing interests; and statements of data and code availability are available at https://doi.org/10.1038/s41586-024-08422-9.
5. Parker, J. Comparing research and teaching in university promotion criteria. High. Educ. Q. 62, 237-251 (2008).
6. McKiernan, E. et al. Meta-research: use of the journal impact factor in academic review, promotion, and tenure evaluations. eLife 8, e47338 (2019).
7. Rice, D. B., Raffoul, H., Ioannidis, J. P. & Moher, D. Academic criteria for promotion and tenure in biomedical sciences faculties: cross sectional analysis of international sample of universities. Br. Med. J. 369, m2081(2020).
8. Rice, D. B., Raffoul, H., Ioannidis, J. P. & Moher, D. Academic criteria for promotion and tenure in faculties of medicine: a cross-sectional study of the Canadian U15 universities. FACETS 6, 58-70 (2021).
9. Pontika, N. et al. Indicators of research quality, quantity, openness and responsibility in institutional review, promotion and tenure policies across seven countries. Quant. Sci. Stud. 3, 888-911 (2022).
10. Muller, J. Z. The Tyranny of Metrics (Princeton Univ. Press, 2018).
11. Polese, A. The SCOPUS Diaries and the (II)Logics of Academic Survival – A Short Guide to Design Your Own Strategy and Survive Bibliometrics, Conferences, and Unreal Expectations in Academia (Ibidem, 2019).
12. Ter Bogt, H. J. & Scapens, R. W. Performance management in universities: effects of the transition to more quantitative measurement systems. Eur. Account. Rev. 21, 451-497 (2012).
13. Dominik, M. Research Assessment: Recognising the asset of diversity for scholarship serving society. ESO on-line conference: The Present and Future of Astronomy (14-18 February 2022). Zenodo https://doi.org/10.5281/zenodo.6246171 (2022).
14. Moore, S., Neylon, C., Eve, M. P., O’Donnell, D. P. & Pattinson, D. Excellence R Us: university research and the fetishisation of excellence. Palgrave Commun. 3, 16105 (2017).
15. Binswanger, M. in Opening Science (eds Bartling, S. & Frieseke, S.) 49-72 (Springer, 2014)
16. Kulczycki, E. The Evaluation Game – How Publication Metrics Shape Scholarly Communication (Cambridge Univ. Press, 2023).
17. Mryglod, O., Kenna, R., Holovatch, Y. & Berche, B. Comparison of a citation-based indicator and peer review for absolute and specific measures of research-group excellence. Scientometrics 97, 767-777 (2013).
18. Abramo, G., Cicero, T. & D’Angelo, C. A. National peer-review research assessment exercises for the hard sciences can be a complete waste of money: the Italian case. Scientometrics 95, 311-324 (2013).
19. D’Ippoliti, C. ‘Many-citedness’: citations measure more than just scientific quality. J. Econ. Surv. 35, 1271 (2021).
20. Hicks, D., Wouters, P., Waltman, L., de Rijcke, S. & Rafols, I. Bibliometrics: The Leiden Manifesto for research metrics. Nature 520, 429-431(2015).
21. Pudovkin, A. I. Comments on the use of the journal impact factor for assessing the research contributions of individual authors. Front. Res. Metr. Anal. https://doi.org/10.3389/frma.2018. 00002 (2018).
22. INORMS Research Evaluation Group. The SCOPE Framework: A Five-Stage Process for Evaluating Research Responsibly (Emerald Publishing, 2021); https://inorms.net/wp-content/ uploads/2022/03/21655-scope-guide-v10.pdf.
23. Moher, D. et al. The Hong Kong Principles for assessing researchers: fostering research integrity. PLoS Biol. 18, e3000737 (2020).
24. Paruzel-Czachura, M., Baran, L. & Spendel, Z. Publish or be ethical? Publishing pressure and scientific misconduct in research. Res. Ethics 17, 375-397 (2021).
25. Fanelli, D. How many scientists fabricate and falsify research? A systematic review and meta-analysis of survey data. PLoS ONE 4, e5738 (2009).
26. UNESCO Recommendation on Open Science. Adopted by the 41st session of the General Conference (9-24 Nov 2021), UNESDOC Digital Library, Document Code SC-PCB-SPP/ 2021/OS/UROS (United Nations Educational, Scientific and Cultural Organization, 2021); https://unesdoc.unesco.org/ark:/48223/pf0000379949.locale=en.
27. Dominik, M. et al. Publishing Models, Assessment, and Open Science (Global Young Academy, 2018); https://globalyoungacademy.net/wp-content/uploads/2018/10/APOS-Report-29.10.2018.pdf.
28. Saenen, B., Morais, R., Gaillard, V. & Borrell-Damián, L. Research Assessment in the Transition to Open Science: 2019 EUA Open Science and Access Survey Results (European University Association, 2019); https://eua.eu/downloads/publications/research assessment in%2Othe%2Otransition%2Oto%2Oopen%2Oscience.pdf.
29. San Francisco Declaration on Research Assessment (DORA) https://sfdora.org/ (DORA, accessed 10 November 2023).
30. A New Research Assessment towards a Socially Relevant Science in Latin America and the Caribbean (Latin American Council of Social Sciences (CLACSO), 2022); https:// biblioteca-repositorio.clacso.edu.ar/bitstream/CLACSO/169747/1/Declaration-ofPrincipes.pdf.
31. de Rijcke, S. et al. The Future of Research Evaluation: A Synthesis of Current Debates and Developments (IAP/GYA/ISC, 2023); https://www.interacademies.org/publication/future-research-evaluation-synthesis-current-debates-and-developments.
32. Towards a Reform of the Research Assessment System: Scoping Report (European Commission, Directorate-General for Research and Innovation, 2021); https://data.europa.eu/ doi/10.2777/707440.
33. Agreement on Reforming Research Assessment (Coalition for Advancing Research Assessment, 2022); https://coara.eu/app/uploads/2022/09/2022_07_19_rra_agreement_ final.pdf.
34. Room for Everyone’s Talent – Towards a New Balance in the Recognition and Reward of Academics (VSNU, NFU, KNAW, NWO and ZonMw, 2019); https://www.nwo.nl/sites/nwo/ files/media-files/2019-Recognition-Rewards-Position-Paper_EN.pdf.
35. Working Group for Responsible Evaluation of a Researcher. Good Practice in Researcher Evaluation. Recommendation for the Responsible Evaluation of a Researcher in Finland. Responsible Research Series 7:2020 (The Committee for Public Information (TJNK) and Federation of Finnish Learned Societies (TSV), 2020); https://doi.org/10.23847/isbn. 9789525995282.
36. UIS Data Centre. Science, Technology and Innovation: Research and Experimental Development, (9.5.2) Researchers (in full-time equivalent) per million inhabitants http:// data.uis.unesco.org/index.aspx?queryid=3685 (UNESCO, accessed 5 February 2024).
37. Researchers in R&D (per Million People) [SP.POP.SCIE.RD.P6] (UNESCO Institute for Statistics Bulk Data Download Service, accessed 27 November 2023); https://apiportal. uis.unesco.org/bdds.
38. UNESCO Science Report: Towards 2030. Second revised edition (UNESCO Publishing, 2016); https://doi.org/10.18356/9789210059053.
39. UNESCO Science Report: The Race Against Time for Smarter Development (eds Schneegans, S. et al.) (UNESCO Publishing, 2021); https://doi.org/10.18356/9789210058575.
40. Bangladesh Bureau of Statistics. Indicators 9.5.2: Researchers (in Full-Time Equivalent) per Million Inhabitants (2022) (SDG Tracker – Bangladesh’s Development Mirror, accessed 29 February 2024); https://sdg.gov.bd/page/indicator-wise/1/101/3/0.
41. National Statistical Committee of the Kyrgyz Republic. Indicator 9.5.2 – Researchers (in Full-Time Equivalent) per Million Inhabitants (2022) (Sustainable Development Goals in the Kyrgyz Republic, accessed 29 February 2024); https://sustainabledevelopment-kyrgyzstan.github.io/en/9-5-2/#:~:text=Year%2C%2O2017%2C%2O2018%2C% 202019%2C%2O2O20%2C%2OValue%2C%2O524%2C%2O555%2C%2O527% 2C%2O534%2C.
42. Number of Research Personnel per 10,000 Population in Taiwan from 2011 to 2021 (Statista, accessed 29 February 2024); https://www.statista.com/statistics/324708/taiwan-number-of-researchers-per-10000-population/.
43. Hoffmeister, O. Development Status as a Measure of Development United Nations Conference on Trade and Development (UNCTAD) Research Paper 46 (UN, 2020); https:// doi.org/10.18356/a29d2be8-en.
44. Country Classification: World Bank Country and Lending Groups. Fiscal Year 2012 (World Bank, accessed 22 January 2022); https://datahelpdesk.worldbank.org/knowledgebase/ articles/906519-world-bank-country-and-lending-groups.
45. Working Party of National Experts on Science and Technology Indicators. Revised Field of Science and Technology (FoS) Classification in the Research Manual DSTI/EAS/STP/ NESTI(2006)19/FINAL (Organisation for Economic Co-operation and Development, 2007).
46. Seeber, M., Debacker, N., Meoli, M. & Vandevelde, K. Exploring the effects of mobility and foreign nationality on internal career progression in universities. High. Educ. https://doi. org/10.1007/s10734-022-00878-w (2022).
47. Lopez-Verges, S. et al. Call to action: supporting Latin American early career researchers on the quest for sustainable development in the region. Front. Res. Metr. Anal. 6, 657120 (2021).
48. Dominik, M. et al. Open science – for whom? Data Sci. J. 21, 1 (2022).
49. Corsi, M., D’Ippoliti, C. & Zacchia, G. Diversity of backgrounds and ideas: the case of research evaluation in economics. Res. Policy 48, 103820 (2019).
50. Hirsch, J. E. An index to quantify an individual’s research output. Proc. Natl Acad. Sci. USA 102, 16569-16572 (2005).
51. Valenzuela-Toro, A. M. & Viglino, M. How Latin American researchers suffer in science. Nature 598, 374-375 (2021).
52. Smith, K. M., Crookes, E. & Crookes, P. A. Measuring research ‘impact’ for academic promotion issues from the literature. J. High. Educ. Policy Manag. 35, 410-420 (2013).
53. Necker, S. Scientific misbehavior in economics. Res. Policy 43, 1747-1759 (2014).
54. Täuber, S. & Mahmoudi, M. How bullying becomes a career tool. Nat. Hum. Behav. 6, 475 (2022).
55. Aubert Bonn, N., De Vries, R. G. & Pinxten, W. The failure of success: four lessons learned in five years of research on research integrity and research assessment. BMC Res. Notes 15, 309 (2022).
56. Anderson, M. S., Ronning, E. A., De Vries, R. & Martinson, B. C. The perverse effects of competition on scientists’ work and relationships. Sci. Eng. Ethics 13, 437-461 (2007).
57. Smaldino, P. E. & McElreath, R. The natural selection of bad science. R. Soc. Open Sci. 3, 160384 (2016).
58. Aubert Bonn, N. & Bouter, L. in Handbook of Bioethical Decisions Vol. II. Collaborative Bioethics, Vol. 3 (eds Valdés, E. & Lecaros, J. A.) (Springer, 2023).
59. Hall, K. L. et al. The science of team science: a review of the empirical evidence and research gaps on collaboration in science. Am. Psychol. 73, 532-548 (2018).
60. Scott, J. T. Research diversity and public policy toward invention. Soc. Sci. Res. Netw. https://doi.org/10.2139/ssrn. 4251768 (2022).
61. D’Ippoliti, C. Democratizing the Economics Debate: Pluralism and Research Evaluation (Routledge, 2022).
62. Goodhart, C. A. E. in Monetary Theory and Practice 91-121 (Palgrave, 1984).
63. Hoskin, K. in Accountability: Power, Ethos and the Technologies of Managing (eds Rolland, M. & J. Mouritsen, J.) 265-282 (International Thomson Business, 1996).
64. Dawson, D. et al. The role of collegiality in academic review, promotion, and tenure. PLoS ONE 17, e0265506 (2022).
65. Pepper, J., Krupińska, O. D., Stassun, K. G. & Gelino, D. M. What does a successful postdoctoral fellowship publication record look like? Pub. Astron. Soc. Pac. 131, 014501 (2019).
66. Fernandes, J. D. et al. Research culture: a survey-based analysis of the academic job market. eLife 9, e54097 (2020).
67. Aubert Bonn, N. & Pinxten, W. Advancing science or advancing careers? Researchers’ opinions on success indicators. PLoS ONE 16, eO243664 (2021).
68. Ross-Hellauer, T., Klebel, T., Knoth, P. & Pontika, N. Value dissonance in research(er) assessment: individual and perceived institutional priorities in review, promotion, and tenure. Sci. Public Policy https://doi.org/10.1093/scipol/scad073 (2023).
69. Becerril-García, A. & Aguado-López, E. Redalyc – AmeliCA: A Non-Profit Publishing Model to Preserve the Scholarly and Open Nature of Scientific Communication (United Nations Educational, Scientific and Cultural Organization; Latin American Council of Social Sciences; Network of Scientific Journals from Latin America and the Caribbean, Spain and Portugal; Autonomous University of the State of Mexico; National University of La Plata; University of Antioquia, 2019).
Publisher’s note Springer Nature remains neutral with regard to jurisdictional claims in published maps and institutional affiliations.
Open Access This article is licensed under a Creative Commons Attribution 4.0 International License, which permits use, sharing, adaptation, distribution and reproduction in any medium or format, as long as you give appropriate credit to the original author(s) and the source, provide a link to the Creative Commons licence, and indicate if changes were made. The images or other third party material in this article are included in the article’s Creative Commons licence, unless indicated otherwise in a credit line to the material. If material is not included in the article’s Creative Commons licence and your intended use is not permitted by statutory regulation or exceeds the permitted use, you will need to obtain permission directly from the copyright holder. To view a copy of this licence, visit http://creativecommons.org/licenses/by/4.0/.
(c) The Author(s) 2025
¹Lee Kong Chian Faculty of Engineering and Science, Universiti Tunku Abdul Rahman, Kajang, Malaysia. Department of Statistical Sciences, Sapienza University of Rome, Rome, Italy. Centro Interdisciplinare Linceo Giovani, Rome, Italy. Centre for Exoplanet Science, SUPA School of Physics & Astronomy, University of St Andrews, St Andrews, UK. Centro de Investigación y de Estudios Avanzados del IPN, Mexico City, Mexico. Laboratoire SPHERE UMR 7219, CNRS, Paris, France. Université Paris Cité, Paris, France. Université Paris-1 Panthéon-Sorbonne, Paris, France. Department of Politics and International Relations (DPIR), University of Oxford, Oxford, UK. Centro de Estudios de Derecho e Investigaciones Parlamentarias, Cámara de Diputados, Mexico City, Mexico. College of Graduate Studies, University of South Africa, Pretoria, South Africa. Nanosciences African Network (NANOAFNET), iThemba LABS-National Research Foudation, Somerset West, South Africa. Department of Geography, Higher Teacher Training College, The University of Bamenda, Bambili, Cameroon. Forest Institutions and International Development (FIID) Research Group, Faculty of Environmental Science, Technische Universität Dresden, Tharandt, Germany. Instituto de Medicina Experimental (IMEX), CONICET-Academia Nacional de Medicina, Buenos Aires, Argentina. Department of Biomedical and Dental Sciences and Morphofunctional Imaging, University of Messina, Messina, Italy. Department of Biological Sciences, College of Science, University of Santo Tomas, Manila, The Philippines. Department of Research in Virology and Biotechnology, Gorgas Memorial Institute for Health Studies, Panama City, Republic of Panama. Sistema Nacional de Investigación, Secretaria Nacional de Ciencia, Tecnologia e Innovacion, Panama City, Panama. Department of Mathematics and Computer Science, Faculty of Sciences and Technics, Abdou Moumouni University, Niamey, Niger. School of Law, Politics, and Sociology, University of Sussex, Brighton, UK. Univ. Grenoble Alpes, IRD, CNRS, INRAE, Grenoble INP, IGE, Grenoble, France. University of Zagreb, Faculty of Food Technology and Biotechnology, Zagreb, Croatia. Institute of Medical Research and Medicinal Plants Studies, Yaoundé, Cameroon. Department of Computing Technologies, Swinburne University of Technology, Melbourne, Victoria, Australia. Institute for Advanced Study, Technische Universität München, Garching, Germany. Department of Internal Medicine, Faculty of Medicine, Public Health, and Nursing, Universitas Gadjah Mada, Yogyakarta, Indonesia. Egypt Solid Waste Management Center of Excellence, Faculty of Engineering, Ain Shams University, Cairo, Egypt. Department of Pharmacy and Pharmacology, School of Therapeutic Sciences, Faculty of Health Sciences, University of the Witwatersrand, Johannesburg, South Africa. Department of Microbiology and Immunology, Faculty of Pharmacy, Suez Canal University, Ismailia, Egypt. Department of Chemical Engineering, International University of Liaison Indonesia, South Tangerang, Indonesia. Department of Physics, Chemistry & Material Science, University of Namibia, Windhoek, Namibia. Centre for Space Research, North-West University, Potchefstroom, South Africa. Synthetic and Systems Biology for Biomedicine, Istituto Italiano di Tecnologia, Naples, Italy. Institute of Fundamental and Applied Research, National Research University TIIAME, Tashkent, Uzbekistan. Faculty of Biology, National University of Uzbekistan, Tashkent, Uzbekistan. CancerResearch@UCC, University College Cork, Cork, Ireland. Institute for Protein Design, University of Washington, Seattle, WA, USA. e-mail: yensi.floresbueso@ucc.ie

Methods

This study aimed to identify commonalities and differences in promotion criteria to full professor across global institutions, as outlined in institutional and government documents. We focused on this senior role owing to its comparability, given that career progression pathways and roles vary substantially across countries. Rather than making a priori assumptions about the structure and content of promotion policies, our study design was informed by initial textual analysis described in Supplementary Information section 1.1. In the following, we focus on the methods allowing the reproduction of the manuscript results: data acquisition, data preparation and data analysis. Methods regarding the study design, including the sampling strategy, definition of subsamples, categories and criteria, are detailed in Supplementary Information section 1. The defined protocols are shared via Figshare (see Data availability).

Data acquisition

Using the network of members and alumni of the Global Young Academy as a platform, we conducted snowball sampling by requesting members, alumni and their networks to source documents describing academic promotion policies from their institutions and broader academic networks. This included collecting both publicly available and confidential documents from countries and regions for which they are familiar with the language and promotion frameworks. This approach enabled us to obtain a representative sample across all world regions without relying on impractical stratified random sampling. As mentioned in paragraph three of the “Study design” section in the main text and Supplementary Information section 1.2.2, we conducted three rounds of policy sourcing, with the latest in 2023. From this exercise, we sourced 440 policies, representing 83% of our data, with of the policies in our sample being applicable as of December 2023. Throughout this process, we included every sourced document that was clear and comprehensive enough to identify the presence or absence of specific promotion criteria, ensuring suitability for our analysis. More detail is available in Supplementary Information sections 1.1-1.2.1.

Data preparation

Given our sample of documents describing academic promotion policies, we needed to extract the ‘policy’ (that is, their content) from these documents and to identify suitable characteristics for statistical analysis. This involved the steps that are described in detail in Supplementary Information section 1.2, and summarized below.
Translation. Our sample included documents in 27 languages, which were translated to English using translation software (for example, Google Translate) for consistent analysis. Translations were verified by fluent speakers within the team. Non-machine-readable documents were processed using optical character recognition tools (more details in Supplementary Information section 1.2.4).
Data cleaning (eligibility criteria). The documents varied substantially in structure and level of detail (Extended Data Table 2 and Supplementary Information section 1.5). We included only documents with clear, measurable criteria, excluding duplicates such as national policies reported by multiple institutions. Documents relying on vague terms such as ‘excellence in research’, ‘leadership’ or ‘international visibility’ without specific, measurable achievements were excluded. Additionally, only documents addressing the role of full professor and covering both research and teaching responsibilities were considered. We focused on policies related to the sciences and humanities, excluding arts and creative works owing to substantial differences in outputs and achievements.
Criteria and categories. This study analyses the presence or absence of these 30 criteria in professorship promotion policies, originally
defined in a pilot study to capture key policy features comparably and quantifiably (Supplementary Information sections 1.1 and 1.4). Full definitions and rationale for these criteria are in Supplementary Table 1, with further explanation in Supplementary Information section 1.4.1 and Supplementary Table 2. The criteria are organized into three main categories: research ( 21 criteria); teaching and services (7 criteria); and general traits (2 criteria). Research is further divided into research outputs (11), career development (8) and recognition (2), with research outputs split into quantitative (7) and qualitative (4). Additional details on the rationale and categorization process are provided in Supplementary Information section 1.4.
Clustering by disciplines, tracks, global region and economic status. Each distinct set of assessment criteria was treated as a separate ‘policy for promotion’ and was clustered for analysis by: disciplines-on the basis of the Organisation for Economic Co-operation and Development classification , policies were categorized into natural sciences, engineering and technology, medical and health sciences, and social sciences and humanities, with a ‘general’ category for non-specific policies; career tracks-policies aligned with four tracks: standard academic, research-focused, teaching-focused and clinical;region-we followed the United Nations Geoscheme , defining six regions: Africa, Asia, Europe, Latin America and the Caribbean, Northern America, and Oceania; and economic classification-the World Bank’s income groups (low, lower-middle, upper-middle and high) and the United Nations Statistics Division 2018 Global North versus South classification were used. Policies were also categorized by whether they applied specifically to full professors or scholars in general. Full details of these classifications are in Supplementary Information section 1.3, with data splits shown in Extended Data Table 1.
Data coding. Our analysis focuses solely on the presence or absence of specific criteria, not the assessment process itself. We did not evaluate the role, weight or interpretation of criteria, or how assessment panels reach decisions, which may include additional, unstated criteria (Extended Data Table 2 and Supplementary Information sections 1.4 and 1.5). A standardized data coding template in Google Sheets was shared with regional teams through Google Drive, organized into region-specific folders with individual subfolders for each team member. Regional teams sourced documents, identified policies and coded attributes, including: policy scope (institutional or national); discipline and career track scope; regional data; and document details (for example, year of implementation and completeness). Data coders assessed each policy for 30 predefined promotion criteria, strictly adhering to definitions in Supplementary Table 1, scoring each as present (1) or absent (0) on the basis of exact definitions. To ensure transparency and reusability, coders documented the reference for each criterion, noting text location and relevant quotes from the policy in adjacent cells in the dataset, shared in the replication package (Data availability). Each policy was independently reviewed by two team members and cross-reviewed by the regional team lead. Team leaders consolidated data, mediated differences and consulted project leads as necessary. Discrepancies were resolved collaboratively among team leads, coders and project leads, with definitions of criteria refined as needed to ensure consistency across the dataset.
Weighting. We applied post-sampling weights in the analysis of the dataset obtained from coding the documents. As shown in Supplementary Table 9, the distribution of active researchers by country is highly skewed, with of them based in the ten countries with the largest research systems. Accordingly, policies from these countries substantially influence our findings. Specifically, with denoting the global number of researchers, and , respectively, representing the number of researchers and institutions (or agencies) in country , and representing the number of policies for institution , the weight of
a policy of institution in country becomes . This weight was then applied to each variable captured in the analysis. Information on the number of researchers was primarily obtained from the UNESCO World Data Bank (February 2024), with estimates for countries lacking data derived from alternative sources . Further details on data sources, assumptions and the impact of weighting on the results are provided in Supplementary Information section 1.7.

Data analysis and visualization

Frequency statistics. Data coded in Google Sheets was exported to an Excel 2024 workbook, cleaned to remove formatting, and converted to a CSV file before being imported into Stata 17 (both the raw and cleaned datasets are shared in our replication package). We analysed the frequency of criteria appearing in policies by grouping the data into subsets defined by key attributes: policy scope (institutional versus national), Global North versus South, national per-capita income group and disciplinary scope. Proportions within these categories were computed using the weighted data (as described in the “Weighting” section above). Power analysis for our dataset is in Supplementary Information section 2.3, Supplementary Fig. 1 and Supplementary Table 6; with all tests, the estimated power is above 0.95. Pearson chi-squared ( ) tests were used to assess systematic differences in criteria across policy categories. Given the weights applied to the data, we also performed a design-based -test, the most appropriate statistical test, as reported in the main text and fully detailed in Supplementary Table 5. All analyses were conducted in Stata 17. For specific code and scripts, see the replication package in CodeOcean (Data availability). One-sided equivalence tests were chosen in our analyses to assess whether differences between groups exceed a predefined threshold of practical relevance ( 5 percentage points). This approach was considered more parsimonious than a two-sided test as it directly addresses whether observed differences reach a meaningful level rather than testing for any deviation. One-sided tests are also well suited to cases with high within-group variability, focusing on practically relevant differences and enhancing interpretability while conserving statistical power.
Factor analysis. To identify potential associations between criteria in the analysed policies and assess their degree of co-occurrence, we computed a matrix of pairwise tetrachoric correlations for the dichotomous variables (present or absent), measuring the degree of co-occurrence between the criteria. The results of this correlation analysis are presented in Extended Data Table 4. We then conducted a principal factor analysis on this correlation matrix to explore the underlying factors or dimensions within the data. The primary trends in the research assessment criteria were synthesised using four continuous variables, all normalized to values between zero and one for ease of interpretation. The number of factors was chosen on the basis of both conceptual concerns (ease of interpretation and relevance of the latent factor) and empirical considerations (summarized by the eigenvalues, as shown in Extended Data Fig. 1). To facilitate interpretation, we applied oblimin oblique rotation to these factors. The full account of factor loadings is presented in Extended Data Table 6 and for more information on the method, see ref. 71 .
Multivariate regression. The factors derived from the previous analysis were predicted for the full sample and normalized to values between 0 and 1 . Separate regression analyses were conducted for each factor to examine how the criteria in the policy documents correlate with job-related characteristics (for example, track and discipline) and environmental characteristics (for example, policy scope, global region and country). The estimation method used was linear regression, applying the post-sampling weights as defined earlier, while controlling for potential heteroskedasticity and clustering of error terms by institution or national authority. We report in Supplementary Table 7 the full results of the regressions of the four factors on the explanatory
variables explored in this study, including heteroskedasticityrobust standard errors, two-sided -tests of difference from zero and corresponding values .
Data visualization. Data from Stata were imported into Python 3 and plotted using Python’s Matplotlib, seaborn and geopandas libraries. Panels were assembled and formatted in Adobe Illustrator 2024.

Reporting summary

Further information on research design is available in the Nature Portfolio Reporting Summary linked to this article.

Data availability

All the data sourced for this study are available via Figshare at https:// figshare.com/s/f8aa5ab402440a9a7933 (ref.74). Our data package includes the full raw dataset coded by the authors, the metadata in a readme file and the protocols used to source, code and analyse the data in a study protocol file. For institutions for which policies were not public the data were anonymized.

Code availability

All code used to generate the analysis in the manuscript is shared by the authors for reuse in a CodeOcean capsule available at https:// doi.org/10.24433/CO.0942594.v1 and https://doi.org/10.24433/ C0.3615162.v1.
70. United Nations Geoscheme. Standard country or area codes for statistical use (M49) https://unstats.un.org/unsd/methodology/m49/ (United Nations Statistics Division, accessed 10 November 2023).
71. Harman, H. H. Modern Factor Analysis 3rd edn (Univ. Chicago Press, 1976).
72. Huber, P. J. The behavior of maximum likelihood estimates under nonstandard conditions. In Proc. 5th Berkeley Symposium on Mathematical Statistics and Probability Vol. 1, 221-233 (Univ. California Press, 1967).
73. White, H. L. A heteroskedasticity-consistent covariance matrix estimator and a direct test for heteroskedasticity. Econometrica 48, 817-838 (1980).
74. Li, B. H. et al. A global assessment of academic promotion criteria: what really counts? Figshare https://figshare.com/s/f8aa5ab402440a9a7933 (2024).
Acknowledgements We thank the Global Young Academy, of which all authors except V.S.M.-S. are current members or alumni, for providing the platform and funding that facilitated the development of this work; our peers for voluntary participation, as much of this work was conducted on a voluntary basis; the Global Young Academy office for support; A. K. Claessens, A. Xuereb, A. Bhadra and G. Bassioni for advice and/or assistance at early stages of the project; our peers within and outside the Global Young Academy for assisting in collecting policies for this study, of whom we can mention (some we cannot): A.Ahmad, A.Samakov, A.Godoy-Faúndez, A.Villarreal Medina, A. Awan, A. Kuuwill, A. K. Claessens, A. Sum, A. Villarino, A. Rich, A. Bhadra, A.Sidorovich, A.Xuereb, A.Betti, A.Bernier, B.Hennig, C.E.Rojas Zenozaín, B.C.Kok, B.Wrobel, C.Choudhury, C.C.Diaz, C.Stanley, C.RiosRojas, C.Nshemereirwe, E. Rojas Prado, E.Castellanos, E.F.Khor, E.T.Lim, E.Corrales-Aguilar, E.Alisic, F.Ramos Quispe, F.A.Phang, F.Vargas Lehner, F. EdiSoetaredjo, N. Gaab, G.Ferreira, G.Fuente, G.Bassioni, G.Tornaría, H. Shunker, H.Abdalla, H. C. Yang, H. Cheng, H.H.Goh, I. Kurnaz, I. Torres, J. Young, J. D. Romero Carpio, K. Chan, K. Zaafouri, K.B.Tan, K.Binger, K.Fairfax, K.Taman, L.M.Freire, L. Fierce, L.Sokny, M.Nasr, M.Peccianti, M.VergaraRubio, M.Wieling, M. D. Balela, M. Elhadidy, M.T. Rahman, M.M. Karim, M. Wahajuddin, A.K.Mukong, M.Pieri, N.Nguyen, N.Guerrero González, N.Arenas, N.Kwarikunda, N.Yasuda, N. Meethong, N. Ahmed, O. Nguyen, O.Hod, O. Adeyemo, P. Simpemba, R. Owusu, R. Al Bakain, S.Leonelli, S.Kaur-Ghumaan, S.Maw, S.L.Fernández Valverde, S.Komai, S.T.Tan, S.Hild, S.Bhattarai, T.T.M. Hanh, W.S.Ho, W.S.Chang, W. Ochoa, W.Setthapun, X. Chiriboga, X.B.Tran, Y.F. Chan and Z. Haiguang. A. Simonyan acknowledges his scholarship from the Calouste Gulbenkian Foundation. All authors acknowledge funding support from Taighde Éireann Research Ireland under Grant number 18/SP/3522, Breakthrough Cancer Research under Precision Oncology Ireland, HORIZON-MSCA-2021-PF-101059124 (BacStar) and the Global Young Academy.
Author contributions K.V., B.H.L. and M.D. were involved in the conception, early design and execution of the study. K.V. led the project from 2016 to 2018, B.H.L. led the project from 2018 to 2021, and Y.F.B. led the project from 2021 until the publication of this work. Data coding, involving the collection, translation and tabulation of policy data, was carried out by (in descending order of contributions): B.H.L., K.V., L.B., J.N.K., A.M.I.S., I.S.Z., S. Elagroudy, K.J.C., A.C.H.-M., H.H., A.S., Y.F.B., P.K., V.S.M.-S., A.R.J., J.G.N., K.K.C., T.E.d.C., S. Enany, D.E., S.M., V.N., I.P., S.L.-V. and A.M. Data revision, involving the review of policies, reviewing annotation, discussion and agreement of definitions, was performed by (in descending order of contributions): B.H.L., Y.F.B., A.C.H.-M., H.H., V.S.M.-S., K.K.C., K.J.C., A.R.J., J.G.N., T.E.d.C., S.M., V.N., J.N.K., A.S., S. Enany, I.S.Z., S.L.-V., A.M., V.S., P.K., I.P., L.B., S. Elagroudy, D.E. and A.M.I.S. Refer to our dataset shared on the data section to see the exact policies tabulated and/or reviewed by each author, listed in the columns labelled “tabulated” and “reviewed”. B.H.L. and Y.F.B. collated and merged
the dataset. The published version of the manuscript was mainly drafted by M.D., C.D’I., Y.F.B., B.H.L. and A.C.H.-M. All figures were drafted by Y.F.B., with support from C.D’I., M.D. and B.H.L. All statistical analyses were performed by C.D’I., Y.F.B. and B.H.L. Manuscript revisions 3-5 were mainly performed by Y.F.B., C.D’I., M.D., B.H.L., A.C.H.-M., K.K.C., S.L.-V. and V.S.M.-S. (in descending order of contributions). The first submitted manuscript was prepared with substantial contributions from M.D., B.H.L., C.D’I., Y.F.B., M.B., K.K.C., A.C.H.-M., I.P., T.E.d.C., S.M., S.L.-V., P.K. and A.M. (in descending order of contributions). The protocol was drafted by S.M., Y.F.B., V.S.M.-S., S.L.-V., K.K.C., I.P., S. Elagroudy, B.H.L., C.D’I. and M.D., on the basis of guidelines and protocols prepared by Y.F.B. and B.H.L. All authors reviewed and approved the content of the study and are personally responsible for their contributions as stated here.
Competing interests The authors declare no competing interests.

Additional information

Supplementary information The online version contains supplementary material available at https://doi.org/10.1038/s41586-024-08422-9.
Correspondence and requests for materials should be addressed to Y. Flores Bueso.
Peer review information Nature thanks Juan Pablo Alperin, David Moher and Leslie Schimanski for their contribution to the peer review of this work. Peer reviewer reports are available.
Reprints and permissions information is available at http://www.nature.com/reprints.

Article

Extended Data Fig. 1| Approach to assessment of research outputs by policy
scope. Application of quantitative vs qualitative criteria for the 314 institutional and 218 national policies in our dataset. Result shown is the percentage of policies mentioning each type of assessment. Number of policies (n) for each criterion is presented above each corresponding bar.
Extended Data Fig. 2 |Scree plot for the factor analysis. Showing the factors obtained, ordered by eigenvalue – denoting the level of variability captured by the factors. In the red box are the Eigenvalues for the four factors used.
Extended Data Fig. 3 | Loading plots for each pair of factors. Each scatter plot in the grid represents a pairwise comparison between factors: Factor 1: Output Metrics, Factor 2: Visibility and Engagement, Factor 3: Career Development, and Factor 4: Outcomes & Impact. Data points are colour-coded to differentiate between quantitative outputs (blue), qualitative outputs (orange), career development criteria (yellow), services (purple), and recognition (red).
Ellipses represent the concentration and dispersion of data points associated with each group, indicating the variance and co-relationship strength between factors. Ellipses were overlaid using matplotlib, ellipse function, where the width and height of the ellipse were set to reflect the standard deviation for each group along the X and Y axes, respectively. .
Extended Data Fig. 4 | Single variable comparison between Global North and South. Violin plots showing median, quartiles, and the distributions of the families of criteria described by the four latent factors resulting from the principal factor analysis. Here, factor strength is the overall impact of the measured factor in explaining the observed data (factor score for each policy). Note: The correlation among criteria, the factor loadings and their variance, the factor scores and their graphical representation through kernel density and boxplots are all based on the weighted sample. N for Global North=165 and for Global South=367.
Extended Data Table 1 | Description of the sample and its distribution by Region, Economic Status, Disciplines, and Tracks
CLASS Counts
Countries Government Agencies Academic institutions National policies Institutional policies Total policies
Global Regions
Global North 32 14 73 24 141 165
Global South 89 44 117 194 173 367
Economic status (Income level)*
High-income 37 13 84 27 157 184
Upper-middle income 32 18 (2) 52 56 83 139
Lower-middle income 33 20 (8) 43 68 61 129
Low-income 19 6 (12) 11 67 13 80
Continents
Europe 28 15 40 25 62 87
Africa 41 14 44 145 61 206
Asia 33 19 56 28 91 119
Latin America 16 10 20 20 21 41
North America 2 0 20 0 57 57
Oceania 1 0 10 0 22 22
Disciplines
General 51 165 77 187 264
Natural sciences 9 16 41 24 65
Engineering & Technology 9 12 31 25 56
Medicine & Health Sciences 10 28 32 46 78
Social sciences & humanities 11 22 41 42 83
Tracks
Standard academic track 48 178 179 247 426
Research track 15 44 150 53 203
Teaching track 1 22 1 38 39
Clinical track 5 20 5 25 30
Other tracks 0 11 0 13 13
Evaluation exclusive to the role of (full) professor?
Not exclusive for professor 16 54 42 70 112
Specifically for professor 43 140 176 244 420
TOTAL
Number of countries 63 58 121
Full dataset 121 58 190 218 314 532
Total counts of policies segmented by global regions (Global North and Global South), economic status (high-income, upper-middle-income, lower-middle-income, and low-income countries), and continents for all out policies. It also breaks down the data by academic disciplines, career tracks, and whether the policies specifically apply to full professors. Both national and institutional policies are shown, with total policy counts for each category. The number in parenthesis gives the distribution across categories for the 22 countries covered by the supra-national agency CAMES. For the splits by disciplines and career tracks, some policies cover more than one category.
Extended Data Table 2 | Attributes of the documents describing promotion policies
Level of detail Score < 3 Score = 3 Score >3
Tracks
Academic 27 79 320
Research 2 16 185
Teaching 3 15 21
Clinical 1 10 19
Other 1 2 10
Disciplines
Natural Sciences 0 8 57
Engineering & technology 0 7 49
Medicine & health sciences 3 19 56
Social sciences & humanities 0 15 68
General 28 71 165
Source of policy
National 12 35 171
Institutional 19 81 214
Global North and Global South
Global North 11 37 117
Global South 20 79 268
Economic status (Income level)
High-income 12 45 127
Upper-middle income 8 27 104
Lower-middle income 7 35 87
Low-income 4 9 67
Summary of data collected on policy features. The collected documents varied in structure and detail. Key features summarised include document type, inclusion of supplementary materials, and whether criteria applied exclusively to professors or across disciplines/tracks. The table also includes average scores (1-3) for the level of detail, as assessed by the data coders.

Article

Extended Data Table 3 | Evaluation criteria classified by the sub-categories defined by the authors
CRITERIA Output metrics Visibility and engagement Career development Outcomes & impact Uniqueness
Number of Publications 0.8675 -0.014 0.0104 0.0972 0.2337
Recent Publications 0.6978 0.1426 0.2285 -0.2918 0.3874
Patents -0.0573 -0.1178 0.092 0.8723 0.2513
Citations 0.3456 0.2009 0.6365 0.1415 0.3446
Journal indexing 0.5572 -0.3516 0.2409 0.5315 0.2402
Number of authors 0.7047 0.0561 0.4771 -0.0561 0.2431
Authorship order 0.8551 0.1569 -0.1146 0.2475 0.2141
Non-metric journal quality -0.0458 0.8445 -0.093 -0.3991 0.2717
Role of authors -0.0693 0.7526 -0.2575 0.1521 0.3396
Nonmetric publication quality -0.8313 0.168 -0.0156 0.1459 0.2062
Social Impact -0.106 0.2397 -0.0518 0.6629 0.4207
Farsight -0.2675 0.0272 -0.63 0.6274 0.1806
Funding 0.1424 0.2192 0.0438 0.7258 0.3334
Collaborations -0.3079 0.4281 -0.061 0.3718 0.4802
Experience abroad 0.0998 -0.0792 0.775 0.0246 0.3892
Presentations -0.2093 0.5626 0.3029 0.0429 0.4504
Professional development 0.1092 -0.0446 0.7519 0.2109 0.3545
Memberships -0.2899 0.6235 0.1939 0.1469 0.3361
Professional Titles -0.3051 0.1224 0.3512 -0.2671 0.7137
Invited positions -0.5805 0.4375 0.2149 0.1462 0.2776
Awards 0.5102 0.6841 0.1412 0.2883 0.142
Commercialisation/Consultancy 0.0844 0.2786 0.3006 0.5785 0.3682
Service to the Profession -0.5701 0.1897 0.6828 0.2032 0.0589
Mentoring -0.4788 -0.1457 0.4415 0.3191 0.5135
Teaching -0.2053 -0.0367 0.2302 -0.0455 0.9124
Administrative roles -0.5579 0.3065 -0.019 0.323 0.3967
Community service 0.2388 0.7965 0.1087 0.1119 0.2701
Serving period 0.0096 -0.1548 -0.6141 -0.0229 0.5643
Interdisciplinarity -0.471 0.5808 0.104 -0.0079 0.3357
Ethics and integrity 0.3596 0.08 -0.6288 0.3714 0.4054
Sub-categories and criteria used to analyse promotion policies. The criteria were mainly grouped under three main categories: Research, Teaching & Service, and General Traits. Categories were selected through an exercise by team members as expanded in SI sect.1.4.

Extended Data Table 4 | Heatmap of the correlation among the criteria in each policy

CRITERIA No. Publications Recent publications Patents Citations Journal indexing No. authors Authorship order Non-metric jouranl quality Role of authors Non-metric quality of publications Societal impact Farsight Funding Collaborations Experience abroad Presentations Professional development Memberships Professional Titles Invited positions Awards Commercialisation / Consultancy Service to the profession Mentoring Teaching Administrative roles Community service Serving period Interdisciplinarity
Recent publications 0.84 1.00
Patents 0.08 -0.13 1.00
Citations 0.35 0.40 0.21 1.00
Journal indexing 0.77 0.24 0.40 0.42 1.00
No. authors 0.76 0.73 0.06 0.56 0.47 1.00
Authorship order 0.78 0.46 0.11 0.38 0.65 0.66 1.00
Non-metric jouranl quality -0.19 0.08 -0.27 0.06 -0.61 0.02 -0.09 1.00
Role of authors -0.12 0.01 0.29 0.18 -0.37 -0.47 0.03 0.47 1.00
Non-metric pulications qual. -0.74 -0.57 0.26 -0.18 -0.79 -0.62 -0.74 0.29 0.40 1.00
Societal impact -0.14 0.03 0.62 0.20 0.02 0.01 0.07 0.05 0.52 0.55 1.00
Farsight -0.19 -0.51 0.48 -0.45 -0.12 -0.74 0.15 -0.03 0.41 0.50 0.52 1.00
Funding 0.19 -0.16 0.58 0.23 0.36 0.31 0.52 0.28 0.30 0.20 0.58 0.68 1.00
Collaborations -0.24 -0.46 0.28 -0.01 0.04 -0.35 -0.26 0.21 0.30 0.50 0.49 0.38 0.30 1.00
Experience abroad 0.09 0.29 0.16 0.54 0.31 0.56 0.07 -0.22 -0.12 -0.03 0.11 -0.49 0.17 0.07 1.00
Presentations -0.27 -0.23 0.26 0.32 0.02 -0.05 -0.15 0.53 0.53 0.24 0.02 -0.12 0.28 0.39 0.13 1.00
Professional development 0.13 0.22 0.24 0.53 0.42 0.46 0.21 -0.09 -0.11 -0.24 0.12 -0.39 0.36 -0.09 0.37 0.38 1.00
Memberships -0.24 -0.14 0.26 0.07 -0.19 0.02 -0.36 0.47 0.53 0.42 0.38 0.06 0.30 0.60 0.10 0.66 0.19 1.00
Professional Titles -0.28 -0.02 -0.31 0.06 -0.19 -0.33 -0.14 0.05 -0.07 0.17 -0.41 -0.15 -0.14 0.34 0.56 0.32 0.27 0.43 1.00
Invited positions -0.53 -0.42 0.18 0.34 -0.33 -0.42 -0.41 0.47 0.59 0.62 0.39 0.19 0.31 0.44 0.02 0.75 0.06 0.71 0.17 1.00
Awards 0.40 0.13 0.35 0.60 0.30 0.64 0.61 0.34 0.63 -0.23 0.27 0.02 0.64 0.37 0.30 0.54 0.39 0.61 -0.12 0.22 1.00
Commercialisation/Consultancy 0.07 -0.03 0.60 0.46 0.42 0.22 0.11 0.08 0.18 0.03 0.52 0.06 0.64 0.60 0.31 0.35 0.32 0.52 0.02 0.21 0.58 1.00
Service to the profession -0.50 -0.26 0.31 0.40 -0.21 0.02 -0.38 0.20 0.28 0.69 0.52 -0.03 0.33 0.39 0.54 0.60 0.68 0.76 0.54 0.85 0.14 0.39 1.00
Mentoring -0.17 -0.15 0.43 0.22 -0.11 -0.15 -0.34 -0.04 0.23 0.49 0.17 0.19 0.38 -0.02 0.20 0.20 0.43 0.53 0.26 0.45 -0.04 0.11 0.71 1.00
Teaching -0.04 -0.06 -0.25 -0.15 0.09 0.20 -0.08 0.17 -0.38 0.13 0.01 -0.15 0.03 0.02 0.02 -0.02 0.19 0.05 0.46 0.15 -0.19 0.32 0.39 0.17 1.00
Administrative roles -0.58 -0.53 0.29 0.02 -0.17 -0.51 -0.37 0.29 0.27 0.56 0.47 0.28 0.30 0.58 -0.33 0.50 0.11 0.71 0.13 0.81 0.07 0.39 0.62 0.14 0.47 1.00
Community service 0.04 0.26 0.16 0.27 -0.06 0.38 0.39 0.49 0.53 0.12 0.51 -0.01 0.44 0.56 0.25 0.29 0.35 0.69 0.28 0.18 0.71 0.64 0.36 -0.10 0.13 0.37 1.00
Serving period 0.09 -0.08 -0.04 -0.72 0.00 -0.16 0.02 -0.11 -0.17 -0.15 -0.21 0.41 -0.11 -0.16 -0.56 -0.28 -0.54 -0.02 0.25 -0.35 -0.39 -0.29 -0.60 -0.20 0.35 0.03 -0.28 1.00
Interdisciplinarity -0.43 -0.33 0.06 0.04 -0.42 -0.40 -0.35 0.46 0.69 0.76 0.31 0.24 -0.04 0.65 0.11 0.49 0.04 0.61 0.37 0.56 0.23 0.36 0.73 0.43 0.33 0.37 0.65 -0.27 1.00
Ethics & integrity 0.29 -0.10 0.10 -0.13 0.30 -0.28 0.48 -0.28 0.19 -0.40 0.25 0.41 0.16 0.13 -0.45 -0.16 -0.24 -0.09 -0.14 -0.30 0.21 0.03 -0.56 -0.25 -0.03 -0.01 0.14 0.41 -0.16
Matrix of pairwise tetrachoric correlations among all the promotion criteria used in the analysis, in terms of presence/absence in the same policies (for all policies; N=532). The original matrix with pairwise tetrachoric correlations is not positive semidefinite; for the purposes of the subsequent factor analysis, it has been adjusted to be positive semidefinite.

Article

Extended Data Table 5 | Differences in the distribution of each factor, between categories of policies
CRITERIA Output metrics Visibility & Engagement Professional development Outcomes & Impact Uniqueness
N. of publications 0.682 0.4123
Recent publications 0.378 0.3895 -0.5299 0.3792
Patents 0.657 0.4493 0.4212
Citations 0.4566 0.4256 -0.4755 0.3798
Journal indexing 0.8841 0.1821
Number of authors 0.8619 0.2568
Authorship order 0.7279 0.2602
Non-metric journal quality -0.3468 0.7604 -0.3749 0.2467
Role of authors 0.3922 0.5019 -0.3868 0.4072
Nonmetric publication quality -0.4369 0.3218 0.3917 0.3822
Social Impact 0.5907 0.3856 0.3616
Farsight -0.4111 0.3827 0.4096 0.3866
Funding 0.4525 0.7686
Collaborations -0.3356 0.6163 0.2679
Experience abroad -0.4792 0.604 0.5202
Presentations 0.5423 0.3017 0.6059
Professional development -0.3141 0.6616 0.4992
Memberships 0.4024 0.3363 0.5264 0.4151
Professional Titles 0.8625
Invited positions 0.4003 0.521 0.4637
Awards 0.5332 0.554 0.4277
Commercialisation/Consultancy 0.38 0.7948
Service to the Profession 0.4043 0.6572 0.2814
Mentoring 0.6749 0.423
Teaching 0.6969 0.4175
Administrative roles 0.7128 0.4734 0.2194
Community service 0.7296 0.3479
Serving period 0.3848 0.4178 -0.4774 0.5234
Interdisciplinarity 0.5314 0.5894
Ethics and integrity 0.7222 0.3858
Results of Wald tests of equality of the means of each factor between institutional vs. national policies; Global North vs. Global South; countries’ economic status; disciplines; and tracks. Null hypothesis (HO): no difference (diff ) in the means between the compared categories; alternative hypothesis (H1): the average in one category (reported) is different ( f) from the average in the other(s). Bold font and green denote p-values < 0.05. N=532.
Extended Data Table 6 | Full Factor loadings
Level of detail Score < 3 Score = 3 Score >3
Tracks
Academic 27 79 320
Research 2 16 185
Teaching 3 15 21
Clinical 1 10 19
Other 1 2 10
Disciplines
Natural Sciences 0 8 57
Engineering & technology 0 7 49
Medicine & health sciences 3 19 56
Social sciences & humanities 0 15 68
General 28 71 165
Source of policy
National 12 35 171
Institutional 19 81 214
Global North and Global South
Global North 11 37 117
Global South 20 79 268
Economic status (Income level)
High-income 12 45 127
Upper-middle income 8 27 104
Lower-middle income 7 35 87
Low-income 4 9 67
Values for each assessment criterion in the 532 policy documents on each of the four latent factors (F1-F4) predicted after Principal Factor analysis and rotated with the oblimin oblique method (SI section 1.8.2). “Uniqueness” is the fraction of the variance that a given criterion does not share with others.

natureportfolio

Corresponding author(s): YENSI FLORES BUESO
Last updated by author(s): Oct 23, 2024

Reporting Summary

Nature Portfolio wishes to improve the reproducibility of the work that we publish. This form provides structure for consistency and transparency in reporting. For further information on Nature Portfolio policies, see our Editorial Policies and the Editorial Policy Checklist.

Statistics

For all statistical analyses, confirm that the following items are present in the figure legend, table legend, main text, or Methods section.
n/a
Confirmed
□ X
The exact sample size for each experimental group/condition, given as a discrete number and unit of measurement

A statement on whether measurements were taken from distinct samples or whether the same sample was measured repeatedly

The statistical test(s) used AND whether they are one- or two-sided
Only common tests should be described solely by name; describe more complex techniques in the Methods section.

A description of all covariates tested

A description of any assumptions or corrections, such as tests of normality and adjustment for multiple comparisons

A full description of the statistical parameters including central tendency (e.g. means) or other basic estimates (e.g. regression coefficient) AND variation (e.g. standard deviation) or associated estimates of uncertainty (e.g. confidence intervals)
□ X
For null hypothesis testing, the test statistic (e.g. ) with confidence intervals, effect sizes, degrees of freedom and value noted Give values as exact values whenever suitable.

□ For Bayesian analysis, information on the choice of priors and Markov chain Monte Carlo settings

□ For hierarchical and complex designs, identification of the appropriate level for tests and full reporting of outcomes

□ Estimates of effect sizes (e.g. Cohen’s , Pearson’s ), indicating how they were calculated
Our web collection on statistics for biologists contains articles on many of the points above.

Software and code

Policy information about availability of computer code
Data collection
Data was collected using Google Sheets and compiled into a single file downloaded and transformed in Microsoft Excel 16 (Mac) to a CSV file that was the input for the software for analysis. The raw data was shared in a csv format in CodeOcean. Both, raw and clean datasets are shared here: https://doi.org/10.6084/m9.figshare. 23272175.
Data analysis
Data was analysed using Stata17 and plotted using python3 pandas and matplotlib. The panels were assembled and formated using Adobe Ilustrator 2024. The code for data analysis was shared in CodeOcean. https://codeocean.com/capsule/0942594/tree .
For manuscripts utilizing custom algorithms or software that are central to the research but not yet described in published literature, software must be made available to editors and reviewers. We strongly encourage code deposition in a community repository (e.g. GitHub). See the Nature Portfolio guidelines for submitting code & software for further information.

Data

Policy information about availability of data
All manuscripts must include a data availability statement. This statement should provide the following information, where applicable:
  • Accession codes, unique identifiers, or web links for publicly available datasets
  • A description of any restrictions on data availability
  • For clinical datasets or third party data, please ensure that the statement adheres to our policy
We have included a Data availability statement and we share all the data produced by this study.

Research involving human participants, their data, or biological material

Policy information about studies with human participants or human data. See also policy information about sex, gender (identity/presentation), and sexual orientation and race, ethnicity and racism.
Reporting on sex and gender N/A
Reporting on race, ethnicity, or other socially relevant groupings N/A
Population characteristics N/A
Recruitment N/A
Ethics oversight We are not dealing with any humnan participants, their data or biological material. Our study is limited to the analysis of policies that are developed by instituions and may impact humans but do not directly relate to them.
Note that full information on the approval of the study protocol must also be provided in the manuscript.

Field-specific reporting

Please select the one below that is the best fit for your research. If you are not sure, read the appropriate sections before making your selection.
□ Life sciences
Behavioural & social sciences □ Ecological, evolutionary & environmental sciences
For a reference copy of the document with all sections, see nature.com/documents/nr-reporting-summary-flat.pdf

Behavioural & social sciences study design

All studies must disclose on these points even when the disclosure is negative.
Study description
Research sample
Sampling strategy
Data collection
Timing
Data exclusions
Non-participation
Randomization
We conducted a cross-sectional quantitative analysis by examining the assessment criteria used in promotion policies. We systematically identified and analysed promotion criteria, comparing differences and similarities across disciplines, fields, tracks, types of institutions, and countries, considering their socioeconomic contexts. We solely recorded the presence or absence of subjectively chosen distinct assessment criteria in available documents describing promotion policies, without any regard to the process of hiring or promotion.
The study analyzed 532 promotion policies from 190 academic institutions and 58 government agencies across 121 countries. The sample was chosen to maximize global diversity and capture a wide range of institutional practices, focusing on full professor promotion policies as is the most senior position that can be comparable between institutions in different countries. While not representative for all academic and national organisations, our sample has the power to sustain our claims (see SI sect 2.3)
The documents were obtained by global snowball sampling originating from the GYA network rather than as a randomised sample across all relevant institutions or authorities in the world, and our sample is not representative at country level. Our sample size was informed by power analysis, which as seen in SI section 2.3 confirm that our sample has the power to sustain our claims.
Policies were obtained from public websites, academic networks, and official requests. The collected documents were analyzed to identify the presence or absence of specific criteria related to the promotion of full professors. Data coding was performed by members of the team using a standardised template, definitions, protocols and supporting materials.
Data study was initiated in 2016 with a pilot study to define the methodology. Documents were collected since then. However, 83% documents in the version published of this manuscript were obtained in 2022/2023 to ensure that they are still valid.
We excluded data from documents that did not provide clear or comprehensive information about promotion criteria. Additionally, we limited our analysis to promotion policies for full professors, excluding documents that did not cover this role or focused on career tracks unrelated to both research and teaching, to ensure consistency and comparability of different data points. We excluded a total of 24 policies from our study. Throughout the process we documented the exclusion of 59 policies.
n/a
n/a

Reporting for specific materials, systems and methods

We require information from authors about some types of materials, experimental systems and methods used in many studies. Here, indicate whether each material, system or method listed is relevant to your study. If you are not sure if a list item applies to your research, read the appropriate section before selecting a response.
Materials & experimental systems Methods
n/a Involved in the study n/a
X X
X
X X
X
X

Plants

Seed stocks □
n/a
Novel plant genotypes □ n/a
Authentication □
n/a

    1. Wilsdon, J. et al. The Metric Tide: Report of the Independent Review of the Role of Metrics in Research Assessment and Management (HEFCE, 2015); https://doi.org/10.13140/ RG.2.1.4929.1363.
    2. Curry, S., Gadd, E. & Wilsdon, J. Harnessing the Metric Tide: Indicators, Infrastructures & Priorities for UK Responsible Research Assessment – Report of The Metric Tide Revisited Panel (RORI, 2022); https://doi.org/10.6084/m9.figshare.21701624.
    3. Fauzi, M. A., Tan, C. N. L., Daud, M. & Awalludin, M. M. N. University rankings: a review of methodological flaws. Issues Educ. Res. 30, 79-96 (2020).
    4. Gadd, E. Mis-measuring our universities: why global university rankings don’t add up. Front. Res. Metr. Anal. https://doi.org/10.3389/frma.2021.680023 (2021).