المجلة: Scientific Reports، المجلد: 14، العدد: 1
DOI: https://doi.org/10.1038/s41598-024-55034-4
PMID: https://pubmed.ncbi.nlm.nih.gov/38418566
تاريخ النشر: 2024-02-28
DOI: https://doi.org/10.1038/s41598-024-55034-4
PMID: https://pubmed.ncbi.nlm.nih.gov/38418566
تاريخ النشر: 2024-02-28
الاتجاه الزماني المكاني لحمى البروسيلات البشرية في الصين والعوامل المؤثرة باستخدام تحليل القابلية للتفسير
لقد عادت حمى البروسيلات البشرية للظهور في الصين، مع تغيير واضح في توزيعها الجغرافي. لقد ارتفعت نسبة حدوث حمى البروسيلات البشرية بشكل كبير في المناطق الداخلية من الصين. للحصول على رؤى حول خصائص الوباء وتحديد العوامل المؤثرة في الانتشار الجغرافي لحمى البروسيلات البشرية، استخدمت دراستنا خوارزمية تعزيز التدرج المتطرف (XGBoost) وتقنيات التعلم الآلي القابلة للتفسير. أظهرت النتائج اتجاهًا تصاعديًا مستمرًا في حدوث حمى البروسيلات البشرية، مع زيادة كبيرة قدرها
في البر الرئيسي للصين، والذي كان مفيدًا ومضيئًا للوقاية والسيطرة على حمى البروسيلات البشرية.
النتائج
الاتجاه الزماني المكاني لحمى البروسيلات البشرية في البر الرئيسي للصين بين 2004 و2021
بين 2004 و2021، أبلغت الصين عن إجمالي 684,293 حالة من حمى البروسيلات البشرية، مما أسفر عن معدل حدوث سنوي متوسط قدره 2.8 حالة لكل 100,000 فرد. على مر السنين، أظهر حدوث حمى البروسيلات البشرية اتجاهًا تصاعديًا مستمرًا (الشكل 1A). أظهر تحليل نموذج الانحدار النقاط المشتركة أن نسبة حالات حمى البروسيلات البشرية زادت بمعدل متوسط قدره
من حيث التوزيع المكاني، اختلف معدل الحدوث السنوي المبلغ عنه لحمى البروسيلات البشرية بشكل كبير عبر 31 مقاطعة، حيث تراوح من 0 إلى 88.61 حالة لكل 100,000 شخص (الشكل 2). كما هو موضح في الشكل 2، تتمتع منطقة منغوليا الداخلية ذاتية الحكم بأعلى معدل حدوث لحمى البروسيلات البشرية، تليها مقاطعة شانشي، ومقاطعة هيلونغجيانغ، ومنطقة شينجيانغ الويغورية ذاتية الحكم. من 2004 إلى 2015، لوحظ نمط على شكل قوس، مع حدوث أعلى في المنطقة الشمالية واتجاه تنازلي من الشرق إلى الغرب. وهذا يدل على تركيز الحالات في المقاطعات الشمالية وانخفاض تدريجي من الشرق إلى المناطق الغربية (الشكل 3A). بالمثل، من 2015 إلى 2018، كان هناك انخفاض في حدوث حمى البروسيلات البشرية من الشمال إلى الجنوب، بينما لوحظ نمط قوسي من الشرق إلى الغرب، حيث شهدت المنطقة الغربية حدوثًا أعلى (الشكل 3B). علاوة على ذلك، من 2018 إلى 2021، كان هناك انخفاض مستمر في حدوث حمى البروسيلات البشرية من الشمال إلى الجنوب، مصحوبًا باتجاه تنازلي من الغرب إلى الشرق (الشكل 3C). تسلط هذه النتائج الضوء على الفجوات المكانية في حدوث حمى البروسيلات البشرية عبر مناطق مختلفة من الصين. من الواضح أن المنطقة الشمالية تأثرت بشدة بحمى البروسيلات البشرية، وأن هذا الاتجاه مستمر. ومع ذلك، كان هناك توسع تدريجي لحمى البروسيلات البشرية في المناطق الجنوبية والغربية، ينتشر تدريجيًا إلى جميع أركان الصين. من المهم ملاحظة أن المناطق الشمالية لا تزال تواجه وباءً شديدًا، مع عدد كبير من الحالات المبلغ عنها. في المقابل، زاد حدوث حمى البروسيلات البشرية بشكل مطرد في المناطق الغربية والجنوبية، مما يشير إلى اتجاه مقلق لانتشارها.
نماذج التنبؤ لتوسع حمى البروسيلات البشرية الزماني المكاني
باستخدام طريقة لاسو في اختيار المتغيرات، حددنا إجمالي 11 متغيرًا وجد أنها تؤثر بشكل كبير على التنبؤ بانتشار حمى البروسيلات البشرية (الشكل 4). شملت هذه المتغيرات مجموعة من المتغيرات، بما في ذلك عدد الأسرة في المستشفيات لكل 1000 فرد، وطول السكك الحديدية، والناتج المحلي الإجمالي (GDP)، وGDP للفرد، والرطوبة، وعدد الأغنام، وأموال التعليم، وطول الطرق، ودرجة الحرارة، وعدد الماعز، وموظفي الرعاية الصحية.
لتطوير نماذج التنبؤ الخاصة بنا، استخدمنا خوارزمية تعزيز التدرج المتطرف (XGBoost)، وهي نموذج إحصائي معروف بدقته وموثوقيته. من خلال استغلال قوة XGBoost
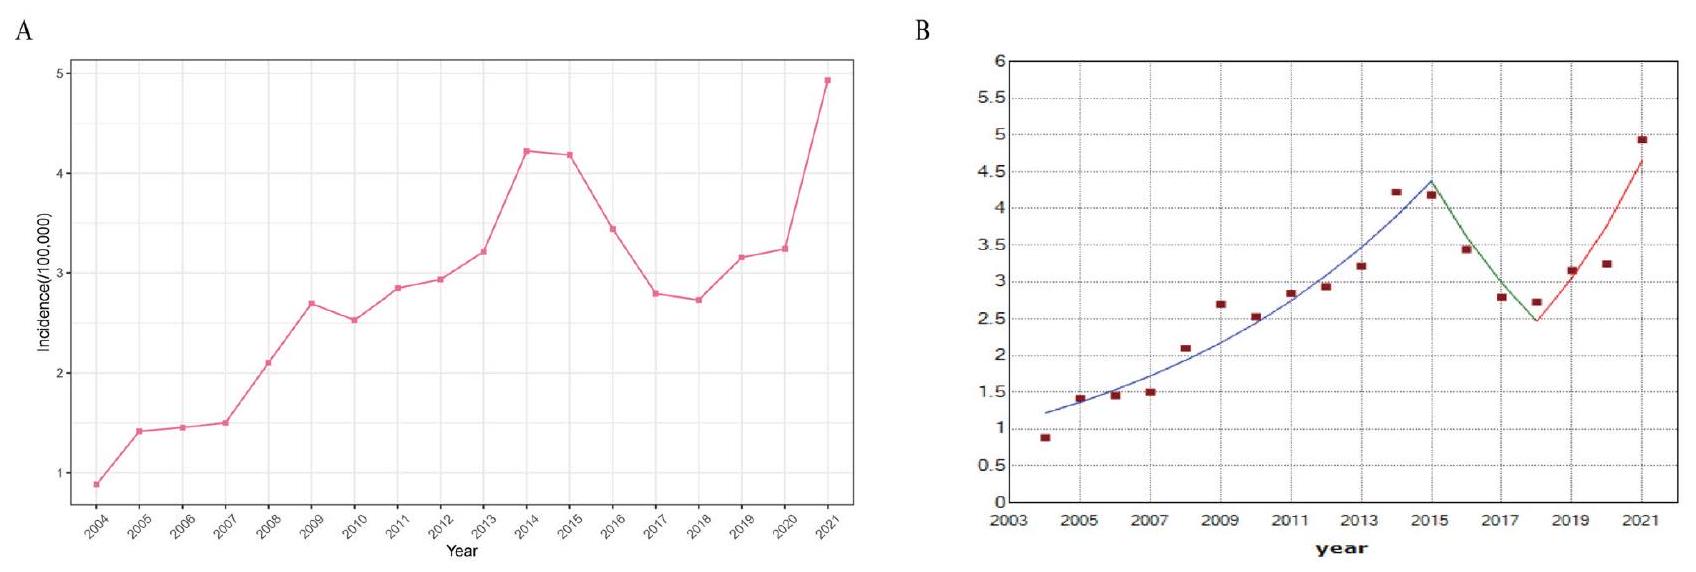
الشكل 1. أظهر حدوث حمى البروسيلات البشرية اتجاهًا تصاعديًا عامًا من 2004 إلى 2021. (A) مخطط خطي لحدوث حمى البروسيلات البشرية في البر الرئيسي للصين من 2004 إلى 2021. (B) مخطط النقاط المشتركة لحدوث حمى البروسيلات البشرية. أظهر التغير الزمني في الحدوث اتجاهًا أولاً بالزيادة، ثم بالانخفاض، ثم بالزيادة مرة أخرى.
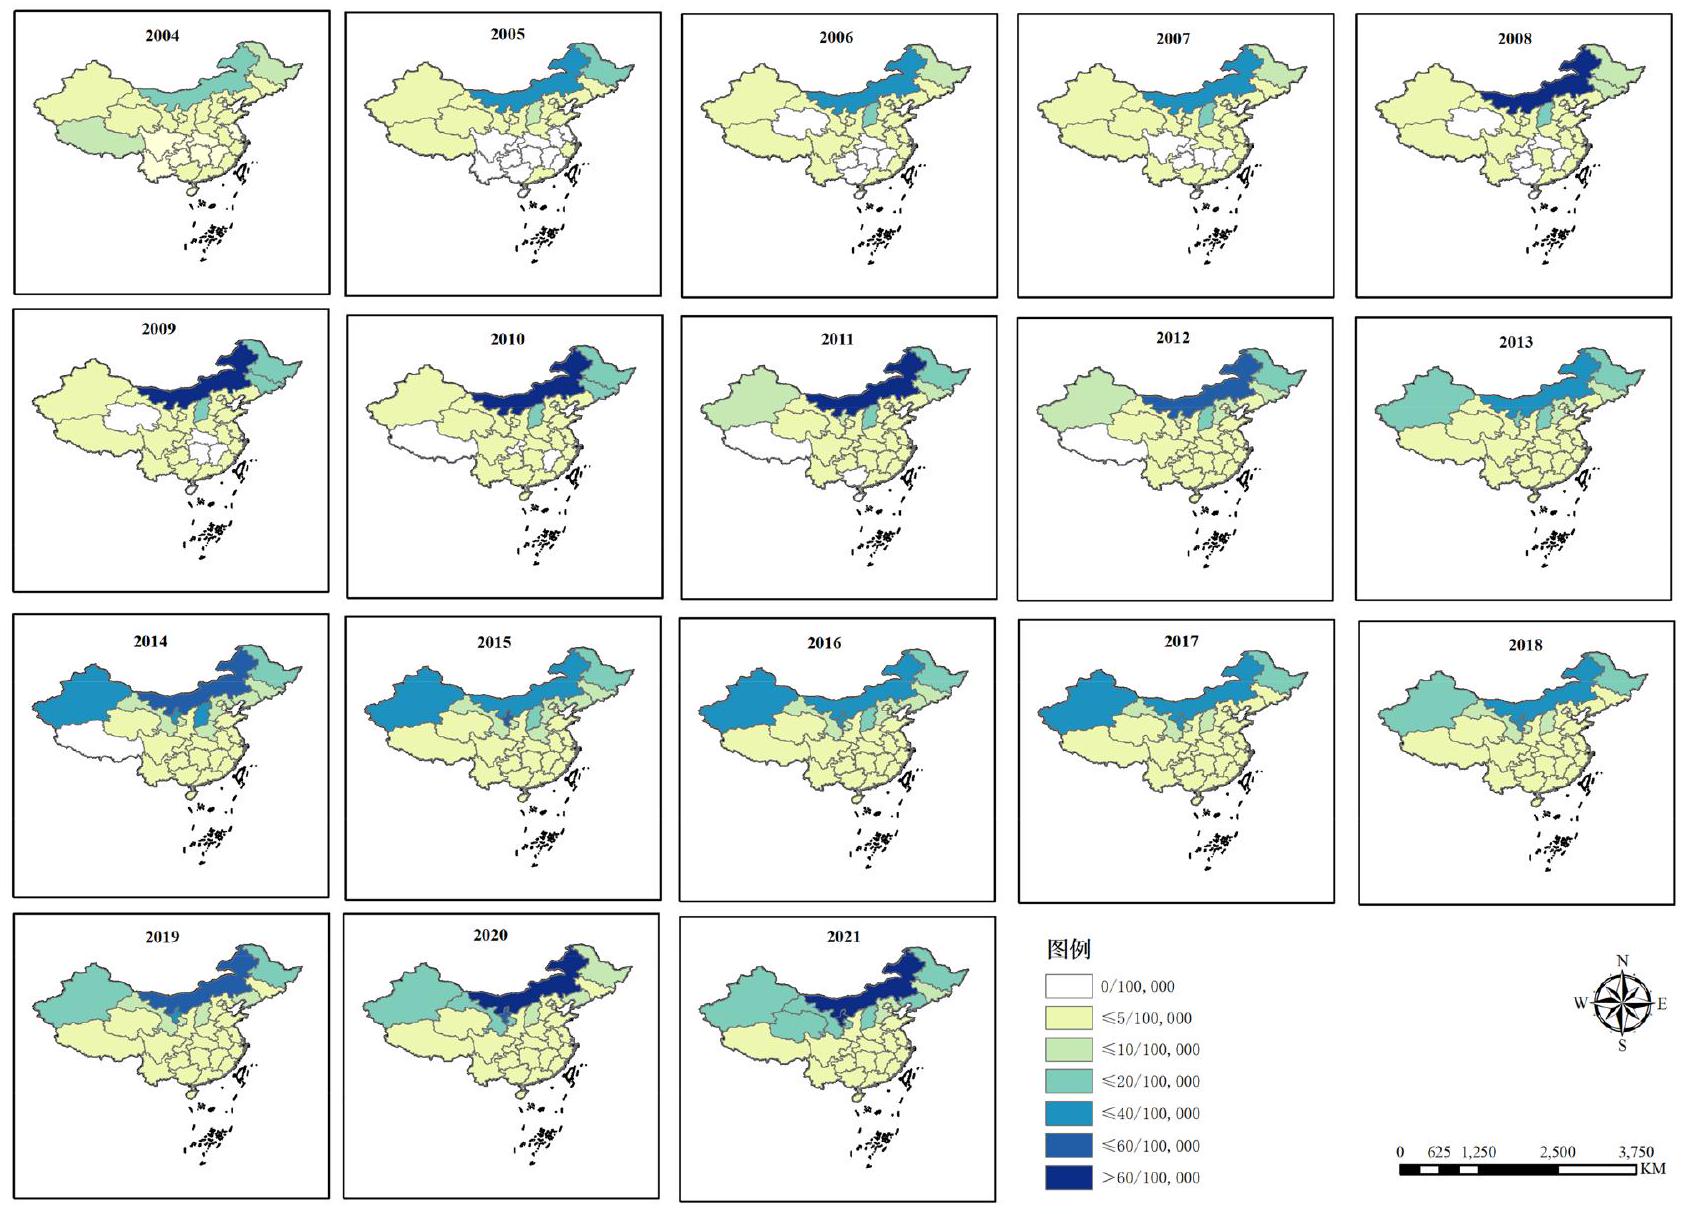
الشكل 2. التوزيع الجغرافي لمعدل الحدوث السنوي لكل 100,000 مقيم من حمى البروسيلات البشرية من 2004 إلى 2021 في البر الرئيسي للصين.
الشكل 3. اتجاه التوزيع المكاني لحدوث حمى البروسيلات البشرية المبلغ عنها في البر الرئيسي للصين على مدى فترات زمنية مختلفة. (A) من 2004 إلى 2015، لوحظ نمط على شكل قوس، مع حدوث أعلى في المنطقة الشمالية واتجاه تنازلي من الشرق إلى الغرب. (B) من 2015 إلى 2018، أظهر حدوث حمى البروسيلات البشرية اتجاهًا تنازليًا من الشمال إلى الجنوب، مصحوبًا بنمط على شكل قوس من الشرق إلى الغرب. كانت المنطقة الغربية تعاني من حدوث أعلى، مما يشير إلى عبء أكبر للمرض في المناطق الغربية. (C) من 2018 إلى 2021، كان هناك انخفاض مستمر في حدوث حمى البروسيلات البشرية من الشمال إلى الجنوب، بالإضافة إلى اتجاه تنازلي تدريجي من الغرب إلى الشرق.
الخوارزمية، كان هدفنا هو التنبؤ بفعالية وفهم الأنماط المكانية لحمى البروسيلات البشرية. قسمنا مجموعة البيانات الخاصة بنا إلى جزئين، مع تخصيص
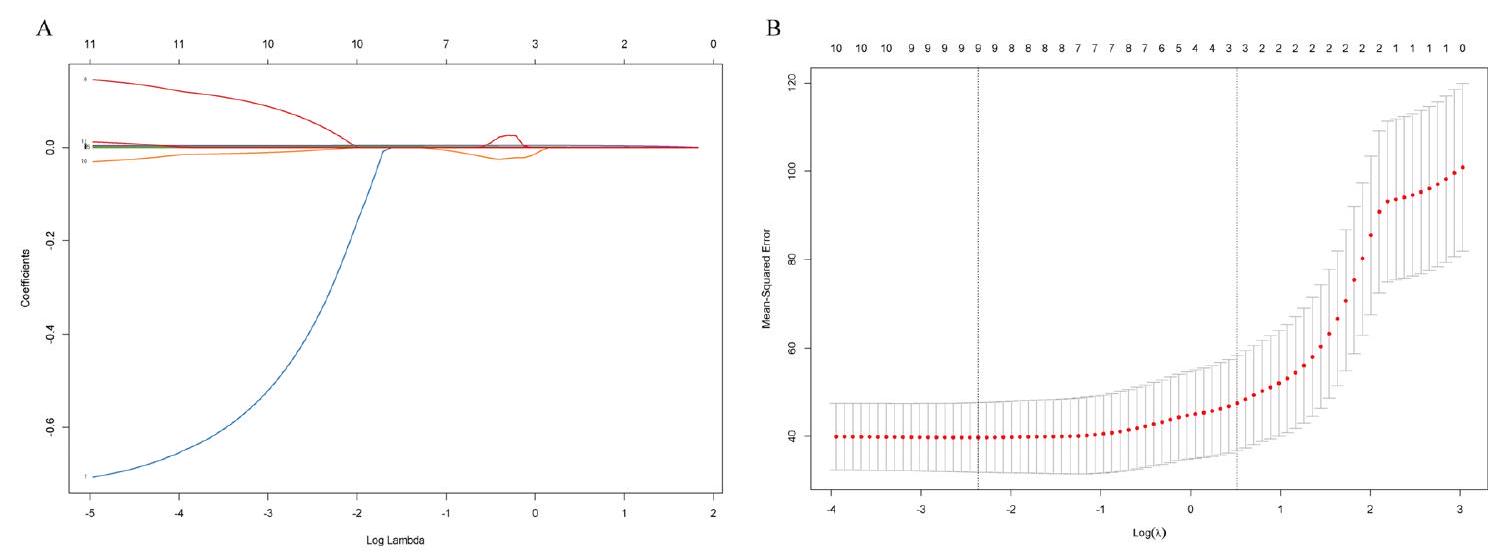
الشكل 4. تم إجراء اختيار الميزات باستخدام نموذج LASSO. (A) تم إنشاء مخطط ملف تعريف المعاملات من خلال رسم المعاملات مقابل
تحليل القابلية للتفسير
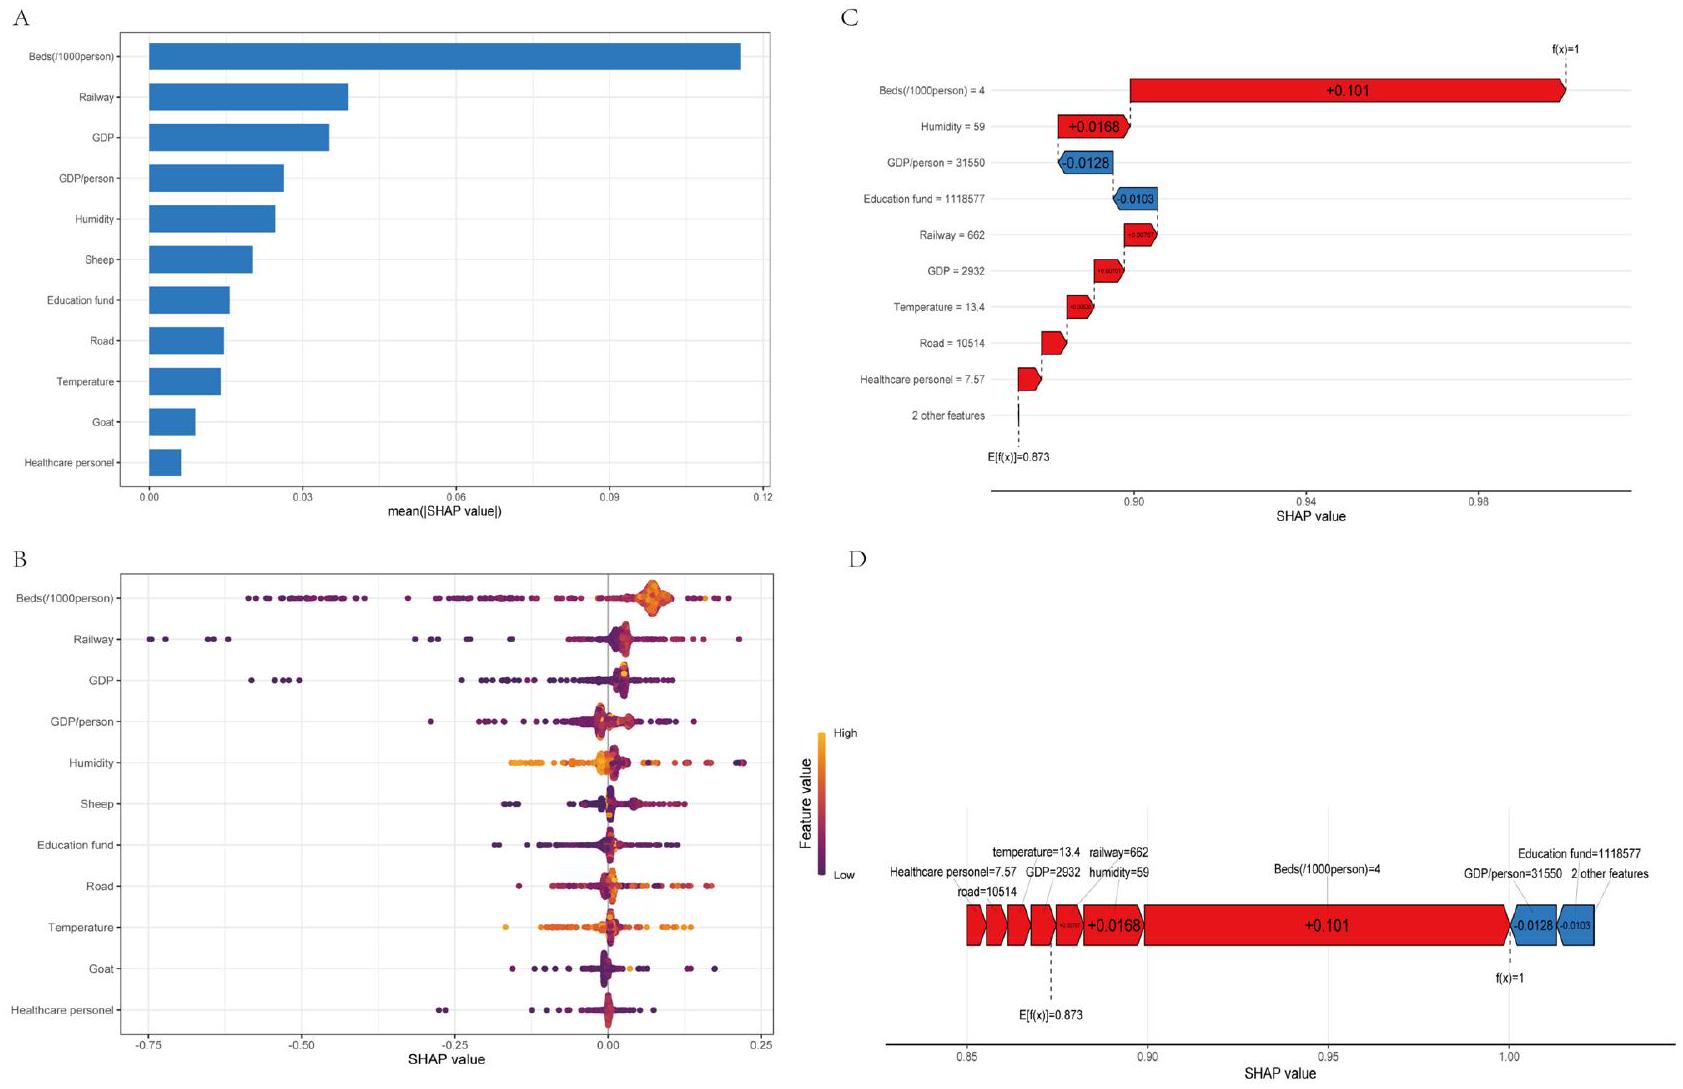
تم تلخيص قيم SHAP لأفضل نموذج في الشكل 5A وB لتسليط الضوء على أهمية المتنبئين. من خلال تحليل متوسط قيمة SHAP، تم تحديد أن أفضل أربعة متنبئين لحمى البروسيلات البشرية، حسب ترتيب الأهمية، كانوا عدد أسرة المستشفيات لكل ألف فرد، طول السكك الحديدية، الناتج المحلي الإجمالي، والناتج المحلي الإجمالي للفرد. تشير هذه النتيجة إلى أن العوامل الاجتماعية والاقتصادية لها تأثير أكبر على انتشار حمى البروسيلات البشرية مقارنة بالعوامل الأخرى.
قدم مخطط القوة ومخطط الشلال رؤى إضافية حول انتشار حمى البروسيلات البشرية. ومن المدهش أن ارتفاع الناتج المحلي الإجمالي للفرد وزيادة تمويل التعليم وُجد أنهما يقللان من انتشار حمى البروسيلات البشرية. من ناحية أخرى، أظهر انتشار حمى البروسيلات البشرية ارتباطًا إيجابيًا مع توفر أسرة المستشفيات لكل 1000 فرد، ومستويات الرطوبة، وطول السكك الحديدية، والناتج المحلي الإجمالي، وعوامل أخرى، كما هو موضح في الشكل 5C،D. تشير هذه النتائج بوضوح إلى أنه فيما يتعلق بالتوسع المكاني لحمى البروسيلات البشرية، تلعب العوامل الاجتماعية والاقتصادية دورًا أكثر أهمية من عوامل الثروة الحيوانية.
بالإضافة إلى تحليل المتنبئات، قمنا أيضًا بإنشاء مخططات اعتماد SHAP لتوسع داء البروسيلات البشري والستة متغيرات الأكثر أهمية. انخفضت قيم SHAP تدريجياً مع زيادة الناتج المحلي الإجمالي للفرد، مما يعني أن القيم المنخفضة للناتج المحلي الإجمالي للفرد كان لها تأثير إيجابي على توقع حدوث داء البروسيلات البشري (الشكل 6D). على النقيض من ذلك، أظهرت القيم المتزايدة لعدد أسرة المستشفيات لكل 1,000 شخص، ومسافة السكك الحديدية، والناتج المحلي الإجمالي، والرطوبة، وعدد الأغنام ارتباطًا إيجابيًا مع زيادة قيم SHAP (الشكل 6A-C، E، F). تؤكد هذه النتائج مرة أخرى على أهمية العوامل الاجتماعية والاقتصادية في توقع انتشار داء البروسيلات البشري.
نقاش
من 2004 إلى 2021، أظهرت حالات حمى البروسيلات البشرية المبلغ عنها تباينًا كبيرًا، مع معدل سنوي متوسط قدره 2.81 حالة لكل 100,000 شخص. تراوحت الحالات بين 0 و 88.62 حالة لكل 100,000 مقيم خلال هذه الفترة. أظهرت التحليلات التفصيلية أنه، في المتوسط، زادت نسبة حالات حمى البروسيلات البشرية بنسبة
للتحقيق في العلاقة بين العوامل المختلفة المساهمة وانتشار حمى البروسيلات البشرية في مناطق جغرافية مختلفة، استخدمنا طريقة التعلم الآلي XGBoost في بحثنا. أثبتت تقنية تصنيف XGBoost فعاليتها العالية في تحديد الأنماط المهمة وتطوير الحالات المستندة إلى
الشكل 5. أهمية المتنبئين لتوسع داء البروسيلات البشري باستخدام قيم SHAP في أفضل نموذج مع مخططات تفسيرية مختلفة. (أ) يوضح الرسم البياني العمودي قيم SHAP لكل محرك بترتيب تنازلي لقيم أهميتها المتوسطة. ارتفاع كل عمود يشير إلى حجم قيمة SHAP. (ب) يوفر مخطط ملخص SHAP تمثيلاً بصريًا لنطاق وكثافة قيم SHAP، والتي تصور توزيع تأثير كل ميزة على مخرجات أفضل نموذج. كل نقطة على المخطط تمثل حالة في مجموعة البيانات، مع لون النقطة الذي يشير إلى قيمة الميزة، بدءًا من الأرجواني (الأدنى) إلى الأصفر (الأعلى). يعرض المحور الأفقي قيمة SHAP المقابلة للميزة، حيث تساهم القيم الإيجابية في توقع حدوث الحالة والقيم السلبية تتنبأ بالعكس. تمثل النقاط من الأرجواني إلى الأصفر القيم المنخفضة إلى العالية لكل متنبئ. يظهر المحور السيني قيمة SHAP، مما يشير إلى مساهمة كل متنبئ في الاحتمالية المتوقعة لداء البروسيلات البشري، مع القيم الإيجابية التي تتنبأ باحتمالية أعلى والقيم السلبية التي تتنبأ باحتمالية أقل. (ج) مخطط الشلال يوضح التأثير التراكمي لكل محرك على النتيجة المتوقعة. أظهر كيف يساهم كل محرك في التوقع العام من خلال تكديس قيم SHAP بطريقة متتالية. تشير القيم الإيجابية إلى المحركات التي تزيد من النتيجة المتوقعة، بينما تشير القيم السلبية إلى المحركات التي تقلل منها. (د) يقدم مخطط القوة المساهمات الفردية لكل محرك في حدوث داء البروسيلات البشري المتوقع. يصور اتجاه وحجم قيم SHAP لكل محرك. تمثل لوحة الألوان في الرسم البياني قيمة كل ميزة، حيث يشير الأحمر إلى ارتباط إيجابي مع حدوث داء البروسيلات البشري، ويشير الأزرق إلى ارتباط سلبي، وطول كل عمود يمثل حجم تأثير الميزة.
خوارزميات الاستدلال، التي تم استخدامها على نطاق واسع في التحليل الإحصائي
أشارت الدراسات السابقة إلى أن الدول ذات الناتج المحلي الإجمالي المنخفض تميل إلى مواجهة حالات أكثر شدة من حمى البروسيلات البشرية.
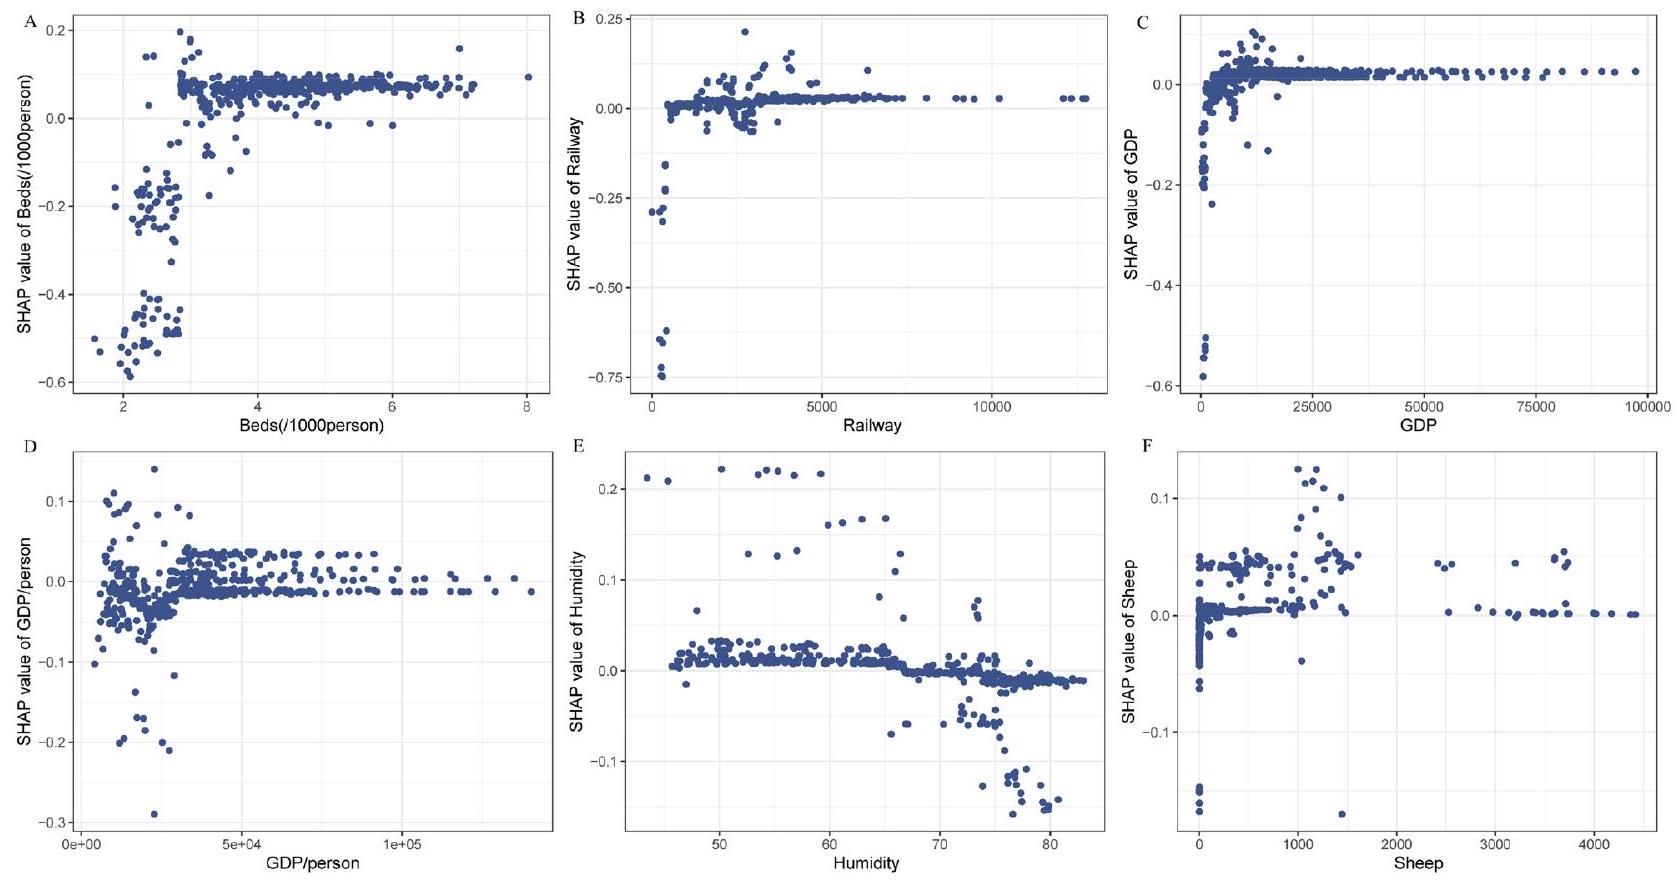
الشكل 6. رسم بياني لمدى تأثير SHAP بين انتشار حمى البروسيلات البشرية وعوامل الخطر الفردية لأهم ستة متنبئين بترتيب. (أ) رسم بياني للاعتماد بين عدد الأسرة لكل 1000 شخص وقيمة SHAP. (ب) رسم بياني للاعتماد بين طول السكك الحديدية وقيمة SHAP. (ج) رسم بياني للاعتماد بين الناتج المحلي الإجمالي وقيمة SHAP. (د) رسم بياني للاعتماد بين الناتج المحلي الإجمالي للفرد وقيمة SHAP. (هـ) رسم بياني للاعتماد بين الرطوبة وقيمة SHAP. (و) رسم بياني للاعتماد بين عدد الأغنام وقيمة SHAP.
مما أدى إلى زيادة إنتاج الماشية والذبح والنقل لاستهلاك اللحوم
لقد تم مناقشة تأثير نظام النقل العام، وبشكل خاص طول السكك الحديدية والطرق، بشكل موسع فيما يتعلق بانتشار الأمراض مثل COVID-19 والإنفلونزا
علاوة على ذلك، أدى زيادة أموال التعليم للسكان إلى تحسين مستويات التعليم وزيادة الوعي بالأمراض. مع زيادة تعليم الأفراد، يصبحون أكثر وعيًا بالأمراض ويتخذون الاحتياطات اللازمة
وجدت دراستنا أن انتشار حمى البروسيلات البشرية يمكن أن يتأثر بشكل إيجابي بزيادة الناتج المحلي الإجمالي للفرد، حيث أظهرت الازدهار الاقتصادي المتزايد أنه يحسن مستويات التعليم ويزيد الوعي بالمرض. وهذا، بدوره، يساهم في تقليل انتشار حمى البروسيلات. يمكن أن يوفر فهم العلاقة بين التعليم والتنمية الاقتصادية والوعي بالأمراض رؤى قيمة لاستراتيجيات الصحة العامة والتدخلات ضد حمى البروسيلات البشرية. أشارت العديد من الدراسات السابقة إلى أن زيادة عدد الأغنام والماشية كانت مسؤولة عن زيادة حدوث حمى البروسيلات البشرية
استقصت هذه الدراسة الاتجاه الزماني والمكاني لحمى البروسيلات البشرية واستكشفت العوامل المحركة التي تساهم في انتشارها الزماني والمكاني باستخدام إطار SHAP. ومع ذلك، من الضروري الاعتراف بحدود بحثنا. أولاً، قد لا توفر بيانات المراقبة السلبية صورة كاملة عن حدوث المرض مقارنة بأساليب المراقبة النشطة. تعتمد بيانات المراقبة السلبية على الإبلاغ الطوعي عن الحالات من قبل مقدمي الرعاية الصحية، مما قد يؤدي إلى تقليل الإبلاغ، خاصةً بالنسبة للحالات ذات الأعراض السريرية الخفيفة. وبالتالي، قد تكون بعض الحالات قد فاتت، مما يؤدي إلى تقدير أقل لحدوث المرض الحقيقي. تم جمع بيانات الدراسة من نظام الإبلاغ عن الأمراض المعدية الوطني، وهو نظام مراقبة سلبية يعتمد على مقدمي الرعاية الصحية للإبلاغ الطوعي عن الحالات. على الرغم من أن النظام يستوعب طيفًا واسعًا من الإبلاغ عن الأمراض، إلا أن الإبلاغ الطوعي قد يؤدي إلى تقليل الإبلاغ. وهذا واضح بشكل خاص في الحالات الأخف من حمى البروسيلات البشرية، حيث يمكن أن تكون الأعراض غير محددة وقد لا يتم اكتشافها على الفور. وبالتالي، قد تكون الحالات المبلغ عنها تقلل من حدوث
المرض. ثانيًا، تم جمع بيانات البحث المستخدمة في هذه الدراسة من المناطق الإدارية الإقليمية وعرضها كمتوسط إقليمي. كدولة شاسعة، تواجه الصين تحديات متنوعة تختلف بشكل كبير عبر مناطقها العديدة من المقاطعات والبلديات داخل نفس المقاطعة. يمكن أن تؤثر عوامل مثل التنمية الاقتصادية، وحجم السكان وحركتهم، والظروف الصحية على حدوث حمى البروسيلات البشرية. من المهم الاعتراف بأن هذه العوامل قد تختلف داخل المقاطعات، مما قد يؤثر على حدوث حمى البروسيلات البشرية. على الرغم من هذه القيود، توفر دراستنا رؤى قيمة حول انتشار حمى البروسيلات البشرية وتبرز أهمية النظر في العوامل الاجتماعية والاقتصادية. يمكن استخدام نتائجنا لإبلاغ سياسات الصحة العامة والتدخلات لتقليل العبء في المجتمعات المتأثرة.
المرض. ثانيًا، تم جمع بيانات البحث المستخدمة في هذه الدراسة من المناطق الإدارية الإقليمية وعرضها كمتوسط إقليمي. كدولة شاسعة، تواجه الصين تحديات متنوعة تختلف بشكل كبير عبر مناطقها العديدة من المقاطعات والبلديات داخل نفس المقاطعة. يمكن أن تؤثر عوامل مثل التنمية الاقتصادية، وحجم السكان وحركتهم، والظروف الصحية على حدوث حمى البروسيلات البشرية. من المهم الاعتراف بأن هذه العوامل قد تختلف داخل المقاطعات، مما قد يؤثر على حدوث حمى البروسيلات البشرية. على الرغم من هذه القيود، توفر دراستنا رؤى قيمة حول انتشار حمى البروسيلات البشرية وتبرز أهمية النظر في العوامل الاجتماعية والاقتصادية. يمكن استخدام نتائجنا لإبلاغ سياسات الصحة العامة والتدخلات لتقليل العبء في المجتمعات المتأثرة.
الاستنتاجات
أظهرت دراستنا اتجاهًا تصاعديًا ثابتًا في حدوث حمى البروسيلات البشرية، مع زيادة ملحوظة قدرها
المواد والأساليب حمى البروسيلات البشرية
حصل مركز بيانات الصحة العامة في الصين على بيانات حمى البروسيلات البشرية في البر الرئيسي للصين من 2004 إلى 2019، بما في ذلك عدد الحالات، ومعدل الحدوث، والمقاطعات التي حدثت فيها الحالات. تم الحصول على معدل حدوث حمى البروسيلات البشرية من 2020 إلى 2021 من الكتاب السنوي للإحصاءات الصحية. يتم حساب عدد حالات حمى البروسيلات البشرية بناءً على بيانات السكان المقيمين في نهاية السنة.
لتوفير سياق جغرافي، قمنا بتنزيل خريطة إلكترونية للصين بمقياس 1:1,000,000 من منصة مشاركة بيانات نظام الأرض الوطنية. ومن الجدير بالذكر أن داء البروسيلات البشري مصنف كمرض معدٍ من الفئة ب الذي يجب الإبلاغ عنه في الصين، وبالتالي يجب الإبلاغ عن جميع الحالات المشخصة إلى نظام مراقبة الأمراض المعدية القابلة للإبلاغ الوطني في الصين (NNDSS) خلال 24 ساعة. يعتمد تشخيص داء البروسيلات البشري في الصين على الإرشادات الموضحة في قانون الوقاية من الأمراض المعدية ومكافحتها، وهو دليل شامل نشرته اللجنة الوطنية للصحة لجمهورية الصين الشعبية. يتضمن التشخيص أخذ التاريخ الوبائي للفرد والأعراض السريرية في الاعتبار لضمان تقييم شامل ودقيق للحالة.
عوامل القيادة
البيانات الجوية، بما في ذلك هطول الأمطار الشهري (مم)، أقصى سرعة رياح (
تحليل الاتجاه الزمني
في هذه الدراسة، تم استخدام الانحدار عند نقاط الانعطاف للكشف عن وتحليل الاتجاهات. لقد أظهرت هذه الطريقة الإحصائية فعاليتها في مساعدة الباحثين على تحليل التغيرات في الاتجاهات الزمنية وتحديد النقاط التحول الهامة في البيانات.
تحليل الاتجاه المكاني
تحليل الاتجاهات المكانية هو تقنية تُستخدم لتحليل الأنماط والاتجاهات في البيانات المكانية من خلال تصور قيم السمات ذات الاهتمام على خريطة ثلاثية الأبعاد. يتم تحقيق ذلك من خلال رفع النقاط على الخريطة إلى ارتفاع يتناسب مع قيمة السمة، مع إسقاط النقاط على مستوى في اتجاهين متعامدين (الشمال والغرب). تحليل الاتجاهات المكانية هو تقنية متقدمة تستخدم الاستيفاء متعدد الحدود لإنشاء سطح سلس.
استنادًا إلى مجموعة من نقاط العينة. تتضمن العملية تطبيق الانحدار المتعدد لإنشاء صورة نقطية تناسب بشكل مثالي سطح المربعات الصغرى، مع إمكانية ضبط درجة كثير الحدود لتكييف السطح وفقًا لمتطلبات محددة.
استنادًا إلى مجموعة من نقاط العينة. تتضمن العملية تطبيق الانحدار المتعدد لإنشاء صورة نقطية تناسب بشكل مثالي سطح المربعات الصغرى، مع إمكانية ضبط درجة كثير الحدود لتكييف السطح وفقًا لمتطلبات محددة.
اختيار الميزات وتحسين المعلمات الفائقة
تم إجراء اختيار الميزات في دراستنا من خلال مزيج من مراجعة الأدبيات والنهج الخوارزمية. قمنا أولاً بإجراء مراجعة شاملة للدراسات ذات الصلة لتحديد العوامل المؤثرة المذكورة في الأوراق السابقة (الجدول التكميلي 1). ولتحديد عملية اختيار الميزات بشكل أفضل، استخدمنا تقنية الانكماش المطلق الأدنى ومشغل الاختيار (LASSO). هذه الطريقة تقلل من معاملات المتغيرات غير ذات الصلة إلى الصفر من خلال تطبيق مصطلح عقوبة على مجموع قيمها المطلقة.
بعد اختيار الميزات، استخدمنا طريقة التعلم الآلي XGBoost، التي تُعتبر معروفة وموثوقة في مجالات تنقيب البيانات والإحصاء. لقد اكتسبت هذه الخوارزمية شعبية وتم التصويت عليها كواحدة من أفضل عشرة خوارزميات لتعدين البيانات بسبب سهولة تنفيذها وأدائها الممتاز في التصنيف.
تحليل القابلية للتفسير باستخدام SHAP
لقد ظهر إطار عمل SHAP كأحدث تطوير لتقييم التنبؤات الناتجة عن خوارزميات التعلم الآلي المعقدة غير الشفافة. وهو يعتمد على القيم الشابلية المثلى نظريًا في اللعبة.
تم إجراء جميع التحليلات الإحصائية وتطوير نماذج التنبؤ باستخدام
توفر البيانات
تم جمع مجموعة البيانات التي تم تحليلها خلال الدراسة الحالية من قاعدة بيانات عامة في الصين وهي متاحة للجمهور على الإنترنت (مركز بيانات العلوم الصحية العامة في الصين:https://www.phsciencedata.cn/Share/دليل إحصاءات الصحة السنوي:http://www.nhc.gov.cn/mohwsbwstjxxzx/tjzxtjcbw/tjsj_list).
تاريخ الاستلام: 23 أكتوبر 2023؛ تاريخ القبول: 19 فبراير 2024
تم النشر على الإنترنت: 28 فبراير 2024
تم النشر على الإنترنت: 28 فبراير 2024
References
- Meslin, F. X. Global aspects of emerging and potential zoonoses: A WHO perspective. Emerg. Infect. Dis. 3, 223-228. https://doi. org/10.3201/eid0302.970220 (1997).
- Rajendhran, J. Genomic insights into Brucella. Infect. Genet. Evol. 87, 104635. https://doi.org/10.1016/j.meegid.2020.104635 (2021).
- Brown, V. R., Bowen, R. A. & Bosco-Lauth, A. M. Zoonotic pathogens from feral swine that pose a significant threat to public health. Transbound. Emerg. Dis. 65, 649-659. https://doi.org/10.1111/tbed.12820 (2018).
- Dean, A. S., Crump, L., Greter, H., Schelling, E. & Zinsstag, J. Global burden of human brucellosis: A systematic review of disease frequency. PLoS Negl. Trop. Dis. 6, e1865. https://doi.org/10.1371/journal.pntd. 0001865 (2012).
- De Figueiredo, P., Ficht, T. A., Rice-Ficht, A., Rossetti, C. A. & Adams, L. G. Pathogenesis and immunobiology of brucellosis: Review of Brucella-host interactions. Am. J. Pathol. 185, 1505-1517. https://doi.org/10.1016/j.ajpath.2015.03.003 (2015).
- Franco, M. P., Mulder, M., Gilman, R. H. & Smits, H. L. Human brucellosis. Lancet Infect. Dis. 7, 775-786. https://doi.org/10.1016/ s1473-3099(07)70286-4 (2007).
- Pappas, G., Papadimitriou, P., Akritidis, N., Christou, L. & Tsianos, E. V. The new global map of human brucellosis. Lancet Infect. Dis. 6, 91-99. https://doi.org/10.1016/S1473-3099(06)70382-6 (2006).
- Ragan, V. E. The Animal and Plant Health Inspection Service (APHIS) brucellosis eradication program in the United States. Vet. Microbiol. 90, 11-18. https://doi.org/10.1016/s0378-1135(02)00240-7 (2002).
- Godfroid, J. et al. Brucellosis at the animal/ecosystem/human interface at the beginning of the 21st century. Prev. Vet. Med. 102, 118-131. https://doi.org/10.1016/j.prevetmed.2011.04.007 (2011).
- Deng, Y., Liu, X., Duan, K. & Peng, Q. Research progress on brucellosis. Curr. Med. Chem. 26, 5598-5608. https://doi.org/10.2174/ 0929867325666180510125009 (2019).
- Dadar, M., Shahali, Y. & Whatmore, A. M. Human brucellosis caused by raw dairy products: A review on the occurrence, major risk factors and prevention. Int. J. Food Microbiol. 292, 39-47. https://doi.org/10.1016/j.ijfoodmicro.2018.12.009 (2019).
- Jia, P. & Joyner, A. Human brucellosis occurrences in inner mongolia, China: A spatio-temporal distribution and ecological niche modeling approach. BMC Infect. Dis. 15, 36. https://doi.org/10.1186/s12879-015-0763-9 (2015).
- Deqiu, S., Donglou, X. & Jiming, Y. Epidemiology and control of brucellosis in China. Vet. Microbiol. 90, 165-182. https://doi.org/ 10.1016/s0378-1135(02)00252-3 (2002).
- Lai, S. et al. Changing epidemiology of human brucellosis, China, 1955-2014. Emerg. Infect. Dis. 23, 184-194. https://doi.org/10. 3201/eid2302.151710 (2017).
- Yang, H. et al. Epidemiological characteristics and spatiotemporal trend analysis of human brucellosis in China, 1950-2018. Int. J. Environ. Res. Public Health https://doi.org/10.3390/ijerph17072382 (2020).
- Wang, T. et al. Spatio-temporal cluster and distribution of human brucellosis in Shanxi Province of China between 2011 and 2016. Sci. Rep. 8, 16977. https://doi.org/10.1038/s41598-018-34975-7 (2018).
- Li, Y. J., Li, X. L., Liang, S., Fang, L. Q. & Cao, W. C. Epidemiological features and risk factors associated with the spatial and temporal distribution of human brucellosis in China. BMC Infect. Dis. 13, 547. https://doi.org/10.1186/1471-2334-13-547 (2013).
- Lin, Y., Xu, M., Zhang, X. & Zhang, T. An exploratory study of factors associated with human brucellosis in mainland China based on time-series-cross-section data from 2005 to 2016. PLoS One 14, e0208292. https://doi.org/10.1371/journal.pone.0208292 (2019).
- Yang, Z. et al. Spatiotemporal expansion of human brucellosis in Shaanxi Province, Northwestern China and model for risk prediction. PeerJ 8, e10113. https://doi.org/10.7717/peerj. 10113 (2020).
- Liang, D. et al. Spatiotemporal distribution of human brucellosis in Inner Mongolia, China, in 2010-2015, and influencing factors. Sci. Rep. 11, 24213. https://doi.org/10.1038/s41598-021-03723-9 (2021).
- Xu, L. & Deng, Y. Spatiotemporal pattern evolution and driving factors of brucellosis in China, 2003-2019. Int. J. Environ. Res. Public Health 19, 1. https://doi.org/10.3390/ijerph191610082 (2022).
- Zhao, C. et al. Epidemic characteristics and transmission risk prediction of brucellosis in Xi’an city, Northwest China. Front. Public Health 10, 926812. https://doi.org/10.3389/fpubh.2022.926812 (2022).
- Cao, L. T. et al. Relationship of meteorological factors and human brucellosis in Hebei province, China. Sci. Total Environ. 703, 135491. https://doi.org/10.1016/j.scitotenv.2019.135491 (2020).
- Peng, C., Li, Y. J., Huang, D. S. & Guan, P. Spatial-temporal distribution of human brucellosis in mainland China from 2004 to 2017 and an analysis of social and environmental factors. Environ. Health Prev. Med. 25, 1. https://doi.org/10.1186/s12199-019-0839-z (2020).
- Ye Li, X. Y., Wang, D. & Li, T. Characteristics of brucellosis related public health emergencies in China, 2006-2012. Dis. Surveill. 28(9), 723-725. https://doi.org/10.3784/j.issn.1003-9961.2013.9.008 (2013).
- Chen, J. D. et al. Brucellosis in Guangdong Province, People’s Republic of China, 2005-2010. Emerg. Infect. Dis. 19, 817-818. https://doi.org/10.3201/eid1905.120146 (2013).
- Zhou, L., Fan, M., Hou, Q., Jin, Z. & Sun, X. Transmission dynamics and optimal control of brucellosis in Inner Mongolia of China. Math. Biosci. Eng. 15, 543-567. https://doi.org/10.3934/mbe. 2018025 (2018).
- Xing, L., Zhang, X., Guo, Y., Bai, D. & Xu, H. XGBoost-aided prediction of lip prominence based on hard-tissue measurements and demographic characteristics in an Asian population. Am. J. Orthod. Dentofac. Orthop. 164, 357-367. https://doi.org/10.1016/j. ajodo.2023.01.017 (2023).
- Scott M. Lundberg & Lee, S.-I. in Proceedings of the 31st International Conference on Neural Information Processing Systems, 4768-4777 (Curran Associates Inc., 2017).
- Covert., I. & Lee., S.-I. in Proceedings of The 24th International Conference on Artificial Intelligence and Statistics Vol. 130, 3457-3465 (PMLR, Proceedings of Machine Learning Research, 2021).
- Chen, S. et al. Increasing threat of brucellosis to low-risk persons in urban settings, China. Emerg. Infect. Dis. 20, 126-130. https:// doi.org/10.3201/eid2001.130324 (2014).
- Chen, Z. et al. High-risk regions of human brucellosis in china: Implications for prevention and early diagnosis of travel-related infections. Clin. Infect. Dis. 57, 330-332. https://doi.org/10.1093/cid/cit251 (2013).
- Tan, Z. et al. A familial cluster of human brucellosis attributable to contact with imported infected goats in Shuyang, Jiangsu Province, China, 2013. Am. J. Trop. Med. Hyg. 93, 757-760. https://doi.org/10.4269/ajtmh.15-0149 (2015).
- Rubach, M. P., Halliday, J. E. B., Cleaveland, S. & Crump, J. A. Brucellosis in low-income and middle-income countries. Curr. Opin. Infect. Dis. 26, 404-412 (2013).
- Zhang, N. et al. Animal brucellosis control or eradication programs worldwide: A systematic review of experiences and lessons learned. Prev. Vet. Med. 160, 105-115. https://doi.org/10.1016/j.prevetmed.2018.10.002 (2018).
- Gong, P. et al. Urbanisation and health in China. Lancet 379, 843-852. https://doi.org/10.1016/s0140-6736(11)61878-3 (2012).
- Goscé, L. & Johansson, A. Analysing the link between public transport use and airborne transmission: Mobility and contagion in the London underground. Environ. Health 17, 84. https://doi.org/10.1186/s12940-018-0427-5 (2018).
- Shen, J. et al. Prevention and control of COVID-19 in public transportation: Experience from China. Environ. Pollut. 266, 115291. https://doi.org/10.1016/j.envpol.2020.115291 (2020).
- Howland, R. E., Cowan, N. R., Wang, S. S., Moss, M. L. & Glied, S. Public transportation and transmission of viral respiratory disease: Evidence from influenza deaths in 121 cities in the United States. PLoS One 15, e0242990. https://doi.org/10.1371/journ al.pone. 0242990 (2020).
- China, H. C. o. t. P. s. R. o. Law of the People’s Republic of China on the prevention and treatment of infectious diseases. Vol. WS 269-2019 (Health Commission of the People’s Republic of China, 2019).
- Clegg, L. X., Hankey, B. F., Tiwari, R., Feuer, E. J. & Edwards, B. K. Estimating average annual percent change in trend analysis. Stat. Med. 28, 3670-3682. https://doi.org/10.1002/sim. 3733 (2009).
- Kim, H. J., Fay, M. P., Feuer, E. J. & Midthune, D. N. Permutation tests for joinpoint regression with applications to cancer rates. Stat. Med. 19, 335-351. https://doi.org/10.1002/(sici)1097-0258(20000215)19:3<335::aid-sim336>3.0.co;2-z (2000).
- Agterberg. & Frits. in Encyclopedia of Mathematical Geosciences (eds B. S. Daya Sagar, Qiuming. Cheng, Jennifer. McKinley, & Frits. Agterberg) 1-9 (Springer International Publishing, 2020).
- Şen, Z. Spatial Trend Analysis. Innovative Trend Methodologies in Science and Engineering, 227-280, doi:https://doi.org/10.1007/ 978-3-319-52338-5_6 (2017).
- Tibshirani, R. Regression shrinkage and selection via the lasso: A retrospective. J. R. Stat. Soc.: Series B (Stat. Methodol.) 73, 273-282. https://doi.org/10.1111/j.1467-9868.2011.00771.x (2011).
- Chen, T., & Guestrin, C. in Proceedings of the 22nd ACM SIGKDD International Conference on Knowledge Discovery and Data Mining (San Francisco, 2016).
- Tao, H. et al. An intelligent evolutionary extreme gradient boosting algorithm development for modeling scour depths under submerged weir. Inf. Sci. 570, 172-184. https://doi.org/10.1016/j.ins.2021.04.063 (2021).
- Ling, C. X., Huang, J. & Zhang, H. in Advances in Artificial Intelligence (eds Yang Xiang & Brahim Chaib-draa) 329-341 (Springer Berlin Heidelberg, 2003).
- Lundberg, S. M. et al. From local explanations to global understanding with explainable AI for trees. Nat. Mach. Intell. 2, 56-67. https://doi.org/10.1038/s42256-019-0138-9 (2020).
- Ogata, S. et al. Heatstroke predictions by machine learning, weather information, and an all-population registry for 12-hour heatstroke alerts. Nat. Commun. 12, 4575. https://doi.org/10.1038/s41467-021-24823-0 (2021).
الشكر والتقدير
يشكر المؤلفون مركز السيطرة على الأمراض في الصين لمشاركة بيانات مراقبة الأمراض المعدية عبر الإنترنت ولمن قدموا البيانات لهذه الدراسة، بما في ذلك الأطباء، وعمال خدمات الصحة المجتمعية، وموظفي مركز السيطرة على الأمراض.
مساهمات المؤلفين
كان X.W. مسؤولاً عن تصميم الدراسة، وأجرى التحليل الإحصائي وصاغ المسودة الأولية. ساعدت Y.W. في جمع البيانات. قام Z.S. بمراجعة المسودة الأولية، وقد قرأ جميع المؤلفين ووافقوا على المسودة النهائية.
التمويل
تم تمويل هذه الدراسة من قبل صندوق البحث الطبي والصحي العسكري 18CXZ011.
المصالح المتنافسة
يعلن المؤلفون عدم وجود مصالح متنافسة.
معلومات إضافية
المعلومات التكميلية النسخة على الإنترنت تحتوي على مواد تكميلية متاحة على https://doi.org/ 10.1038/s41598-024-55034-4.
يجب توجيه المراسلات وطلبات المواد إلى Z.S.
معلومات إعادة الطبع والتصاريح متاحة على www.nature.com/reprints.
ملاحظة الناشر تظل Springer Nature محايدة فيما يتعلق بالمطالبات القضائية في الخرائط المنشورة والانتماءات المؤسسية.
معلومات إعادة الطبع والتصاريح متاحة على www.nature.com/reprints.
ملاحظة الناشر تظل Springer Nature محايدة فيما يتعلق بالمطالبات القضائية في الخرائط المنشورة والانتماءات المؤسسية.
الوصول المفتوح هذه المقالة مرخصة بموجب رخصة المشاع الإبداعي للاستخدام والمشاركة والتكيف والتوزيع وإعادة الإنتاج في أي وسيلة أو صيغة، طالما أنك تعطي الائتمان المناسب للمؤلفين الأصليين والمصدر، وتوفر رابطًا لرخصة المشاع الإبداعي، وتوضح ما إذا كانت هناك تغييرات قد أجريت. الصور أو المواد الأخرى من طرف ثالث في هذه المقالة مشمولة في رخصة المشاع الإبداعي للمقالة، ما لم يُذكر خلاف ذلك في سطر الائتمان للمواد. إذا لم تكن المادة مشمولة في رخصة المشاع الإبداعي للمقالة واستخدامك المقصود غير مسموح به بموجب اللوائح القانونية أو يتجاوز الاستخدام المسموح به، ستحتاج إلى الحصول على إذن مباشرة من صاحب حقوق الطبع والنشر. لعرض نسخة من هذه الرخصة، قم بزيارة http://creativecommons.org/licenses/by/4.0/.
© المؤلفون 2024
© المؤلفون 2024
- حمى المالطية، التي تسببها بكتيريا بروسيلا، هي مرض حيواني المنشأ يؤثر على كل من البشر والحيوانات في جميع أنحاء العالم، باستثناء عدد قليل من الدول الصناعية
. تم تحديد أنواع حيوانية مختلفة كمضيفين رئيسيين لبروسيلا، بما في ذلك الحيوانات الأليفة مثل الماعز والأغنام والخنازير . يمكن أن تؤدي حمى المالطية في الحيوانات إلى الإجهاض والعقم وانخفاض إنتاج الحليب. علاوة على ذلك، فإن التكرار العالي للإجهاض في الحيوانات المصابة بسبب حمى المالطية يؤثر بشكل كبير على إنتاج الماشية . ينتقل المرض إلى البشر من خلال الاتصال المباشر مع الحيوانات المصابة أو إفرازاتها . تشمل الأعراض الشائعة لحمى المالطية البشرية الحمى، والقشعريرة، والتعرق الليلي، والتعب، والضعف، وآلام المفاصل، وآلام العضلات، ومشاكل الجهاز الهضمي . الطريقة الأكثر فعالية للوقاية من حمى المالطية هي تجنب الاتصال بالحيوانات المصابة، سواء من خلال إدارة الماشية أو اللقاءات مع الحياة البرية. اكتشف الباحثون أن أكثر من 500,000 حالة جديدة من حمى المالطية البشرية يتم الإبلاغ عنها سنويًا . وبالتالي، فرضت حمى المالطية عبئًا كبيرًا على كل من الصحة العامة والاقتصادات في جميع أنحاء العالم. بذلت الحكومات والوكالات الصحية في جميع أنحاء العالم جهودًا منسقة للسيطرة على انتشار هذا المرض ومكافحته . ومع ذلك، لا تزال حمى المالطية مرضًا حيوانيًا مهملًا، مما يسبب ضررًا كبيرًا لصحة واقتصادات الدول المتأثرة، وتستمر في كونها مشكلة صحية عامة خطيرة على مستوى العالم . في السنوات الأخيرة، كان هناك انتعاش في حمى المالطية البشرية في الصين، يتميز باتجاه مكاني زمني ملحوظ. لا تزال حمى المالطية البشرية مصدر قلق كبير للصحة العامة، مع الإبلاغ عن تفشيات في 25 من أصل 32 مقاطعة أو منطقة ذاتية الحكم في الصين . كانت نسبة حدوث حمى المالطية البشرية مرتفعة بشكل خاص في شمال الصين. ومع ذلك، كان هناك تحول ملحوظ في التوزيع الجغرافي للمرض، مع توسع نحو المناطق الحضرية في المناطق الداخلية الجنوبية من البلاد . يبرز هذا التغيير في التوزيع الحاجة إلى زيادة المراقبة وتدابير السيطرة لمعالجة انتشار حمى المالطية البشرية بشكل فعال في هذه المناطق المتأثرة حديثًا. تمتلك الصين مجموعة واسعة من المناظر الطبيعية البيئية والبيئية والأرصاد الجوية والاقتصادية في جميع أنحاء البلاد. تختلف الخصائص الوبائية وأسباب حمى المالطية البشرية، خاصةً مع اختلاف المناظر الطبيعية بشكل كبير في المنطقة. ركزت الدراسات السابقة على نسبة حدوث حمى المالطية البشرية
Journal: Scientific Reports, Volume: 14, Issue: 1
DOI: https://doi.org/10.1038/s41598-024-55034-4
PMID: https://pubmed.ncbi.nlm.nih.gov/38418566
Publication Date: 2024-02-28
DOI: https://doi.org/10.1038/s41598-024-55034-4
PMID: https://pubmed.ncbi.nlm.nih.gov/38418566
Publication Date: 2024-02-28
The spatiotemporal trend of human brucellosis in China and driving factors using interpretability analysis
Human brucellosis has reemerged in China, with a distinct change in its geographical distribution. The incidence of human brucellosis has significantly risen in inland regions of China. To gain insights into epidemic characteristics and identify factors influencing the geographic spread of human brucellosis, our study utilized the Extreme Gradient Boosting (XGBoost) algorithm and interpretable machine learning techniques. The results showed a consistent upward trend in the incidence of human brucellosis, with a significant increase of
in mainland China, which has been instructive and illuminating for the prevention and control of human brucellosis
Results
The spatiotemporal trend of human brucellosis in mainland China between 2004 and 2021
Between 2004 and 2021, China reported a total of 684,293 cases of human brucellosis, resulting in an average annual reported incidence rate of 2.8 cases per 100,000 individuals. Over the years, the incidence of human brucellosis has consistently shown an upward trend (Fig. 1A). The join point regression model analysis revealed that the percentage of human brucellosis cases increased by an average of
In terms of spatial distribution, the annual reported incidence of human brucellosis varied significantly across the 31 provinces, ranging from 0 to 88.61 cases per 100,000 people (Fig. 2). As shown in Fig. 2, Inner Mongolia Autonomous Region has the highest incidence rate of human brucellosis, followed by Shanxi Province, Heilongjiang Province, and Xinjiang Uygur Autonomous Region. From 2004 to 2015, an arch-shaped pattern was observed, with a higher incidence in the northern region and a decreasing trend from east to west. This indicated a concentration of cases in the northern provinces and a gradual decrease from east to western regions (Fig. 3A). Similarly, from 2015 to 2018, there was a decline in the incidence of human brucellosis from north to south, while an arch trend was observed from east to west, with the western region experiencing a higher incidence (Fig. 3B). Furthermore, from 2018 to 2021, there was a continued decrease in the incidence of human brucellosis from north to south, accompanied by a decreasing trend from west to east (Fig. 3C). These findings shed light on the spatial disparities in the incidence of human brucellosis across different regions of China. It is evident that the northern region has been severely impacted by human brucellosis, and this trend persists. However, there has been a gradual expansion of human brucellosis in the southern and western regions, progressively spreading to all corners of China. It is important to note that the northern regions continue to face a severe epidemic, with a high number of reported cases. In contrast, the incidence of human brucellosis has steadily increased in the western and southern regions, indicating a concerning trend of its spread.
Prediction models for spatiotemporal expansion of human brucellosis
Using the lasso method in the selection of predictors, we identified a total of 11 predictors that were found to have a significant impact on predicting the spread of human brucellosis (Fig. 4). These predictors encompassed a range of variables, including the number of hospital beds per 1000 individuals, railway mileage, Gross Domestic Product (GDP), GDP per capita, humidity, number of sheep, education funds, road mileage, temperature, goat population, and healthcare personnel.
To develop our prediction models, we utilized the Extreme Gradient Boosting (XGBoost) algorithm, a widely recognized statistical model known for its accuracy and reliability. By harnessing the power of the XGBoost
Figure 1. The incidence of human brucellosis exhibited a general upward trend from 2004 to 2021. (A) Line chart of human brucellosis incidence in mainland China from 2004 to 2021. (B) Joint point plot of human brucellosis incidence. The temporal change in incidence showed a trend of first increasing, decreasing, and then increasing.
Figure 2. Geographic distribution of the annual incidence per 100,000 residents of human brucellosis from 2004 to 2021 in mainland China.
Figure 3. The spatial distribution trend of reported human brucellosis incidence in mainland China over different time periods. (A) From 2004 to 2015, an arch-shaped pattern was observed, with a higher incidence in the northern region and a decreasing trend from east to west. (B) From 2015 to 2018, the incidence of human brucellosis exhibited a decreasing trend from north to south, accompanied by an arch-shaped pattern from east to west. The western region had a higher incidence, suggesting a higher burden of the disease in western areas. (C) From 2018 to 2021, there was a continued decrease in the incidence of human brucellosis from north to south, as well as a gradual decreasing trend from west to east.
algorithm, our objective was to effectively predict and comprehend the spatial patterns of human brucellosis. We divided our dataset into two parts, with
Figure 4. Feature selection was performed using the LASSO model. (A) A coefficient profile plot was generated by plotting the coefficients against the
Interpretability analysis
The SHAP values of the best model are summarized in Fig. 5A,B to highlight the importance of its predictors. Analyzing the mean SHAP value, it was determined that the top four predictors of human brucellosis, in order of significance, were the number of hospital beds per thousand individuals, railway mileage, GDP, and GDP per capita. This finding suggests that socioeconomic factors have a greater impact on the spread of human brucellosis than other factors.
The force plot and waterfall plot provided further insights into the expansion of human brucellosis. Surprisingly, higher GDP per capita and increased education funding were found to decrease the spread of human brucellosis. On the other hand, the expansion of human brucellosis showed a positive correlation with the availability of hospital beds per 1000 individuals, humidity levels, railway mileage, GDP, and other predictors, as depicted in Fig. 5C,D. These results clearly indicate that regarding the spatial expansion of human brucellosis, socioeconomic factors play a more significant role than livestock factors.
In addition to analyzing the predictors, we also generated SHAP dependence plots for human brucellosis expansion and the 6 most important variables. The SHAP values gradually decreased with increasing GDP per capita, implying that low GDP per capita values had a positive effect on predicting human brucellosis occurrence (Fig. 6D). In contrast, increasing values of the number of hospital beds per 1,000 people, railway mileage, GDP, humidity, and sheep number showed a positive correlation with increasing SHAP values (Fig. 6A-C,E,F). These findings further emphasize the significance of socioeconomic factors in predicting the spread of human brucellosis.
Discussion
From 2004 to 2021, the reported incidence of human brucellosis exhibited significant variation, with an average annual incidence of 2.81 cases per 100,000 people. The incidence ranged from 0 to 88.62 cases per 100,000 residents during this period. A detailed analysis indicated that, on average, the percentage of human brucellosis cases increased by
To investigate the relationship between various contributing factors and the spread of human brucellosis in different geographic regions, we employed the XGBoost machine learning method in our research. The XGBoost classification technique proved highly effective in identifying significant patterns and developing case-based
Figure 5. Importance of predictors for human brucellosis expansion using SHAP value values in the best model with different interpretability plots. (A) The bar chart shows the SHAP values for each driver in descending order of their mean importance values. The height of each bar indicates the magnitude of the SHAP value. (B) The SHAP summary plot provides a visual representation of the range and density of the SHAP values, which depict the distribution of each feature’s effect on the best model outputs. Each dot on the plot represents a case in the dataset, with the color of the dot indicating the feature’s value, ranging from purple (lowest) to yellow (highest). The horizontal axis displays the corresponding SHAP value of the feature, with positive values contributing to the prediction of occurrence and negative values predicting the opposite. The purple to yellow dots represents low to high values of each predictor. The x -axis shows the SHAP value, indicating the contribution of each predictor to the predicted probability of human brucellosis, with positive values predicting a higher probability and negative values predicting a lower probability. (C) Waterfall plot illustrating the cumulative effect of each driver on the predicted outcome. It showed how each driver contributes to the overall prediction by stacking the SHAP values in a cascading manner. Positive values indicate drivers that increase the predicted outcome, while negative values indicate drivers that decrease it. (D) Force plot presents the individual contributions of each driver to the predicted occurrence of human brucellosis. It visualizes the direction and magnitude of the SHAP values for each driver. The color scheme of the chart represents the value of each feature, with red indicating a positive correlation with the occurrence of human brucellosis, blue indicating a negative correlation, and the length of each column representing the weight size of the feature’s influence.
reasoning algorithms, which have been widely utilized in statistical analysis
Previous studies have indicated that countries with lower GDP tend to experience more severe cases of human brucellosis
Figure 6. SHAP decency plot between human brucellosis expansion and individual risk factors for the six most important predictors in order. (A) Dependence plot between the number of beds per 1000 people and SHAP value. (B) Dependence plot between railway mileage and SHAP value. (C) Dependence plot between GDP and SHAP value. (D) Dependence plot between GDP per capita and SHAP value. (E) Dependence plot between humidity and SHAP value. (F) Dependence plot between sheep number and SHAP value.
leading to a rise in livestock production, slaughter, and transportation for meat consumption
The impact of the public transportation system, specifically railway and road mileage, has been extensively discussed in relation to the spread of diseases such as COVID-19 and influenza
Furthermore, the increase in residents’ education funds has led to improvements in education levels and heightened disease awareness. As individuals become more educated, they are more likely to be aware of diseases and take necessary precautions
Our study found that human brucellosis expansion can potentially be mitigated by higher GDP per capita, as increased economic prosperity has been shown to improve education levels and raise awareness of the disease. This, in turn, contributes to a reduction in the spread of brucellosis. Understanding the relationship between education, economic development, and disease awareness can provide valuable insights into public health strategies and interventions against human brucellosis. Several previous studies indicated that an increased number of sheep and cattle were responsible for an increased human brucellosis incidence
This study investigated the spatiotemporal trend of human brucellosis and explored the driving factors contributing to its spatiotemporal spread using the SHAP framework. However, it is essential to acknowledge the limitations of our research. First, the use of passive surveillance data may not provide a complete picture of the disease’s incidence compared to active surveillance methods. Passive surveillance data rely on the voluntary reporting of cases by healthcare providers, which could result in underreporting, especially for cases with mild clinical symptoms. Consequently, some cases may have been missed, leading to an underestimation of the true incidence of the disease. The study’s data was collected from the National Infectious Disease Reporting System, a passive surveillance system that relies on healthcare providers to voluntarily report cases. Although the system accommodates a broad spectrum of disease reporting, voluntary reporting may lead to underreporting. This is especially evident in milder cases of human brucellosis, where symptoms can be nonspecific and might not be promptly detected. Consequently, the reported cases may potentially underestimate the actual occurrence of
the disease. Second, the research data used in this study were gathered from provincial administrative regions and presented as the provincial average. As a vast country, China encounters diverse challenges that differ significantly across its numerous county and municipal areas within the same province. Factors such as economic development, population size and movement, and health conditions could all influence the incidence of human brucellosis. It is important to recognize that these factors may vary within provinces, potentially influencing the incidence of human brucellosis. Despite these limitations, our study provides valuable insights into the expansion of human brucellosis and highlights the importance of considering socioeconomic factors. Our findings could be used to inform public health policies and interventions to reduce the burden in affected communities.
the disease. Second, the research data used in this study were gathered from provincial administrative regions and presented as the provincial average. As a vast country, China encounters diverse challenges that differ significantly across its numerous county and municipal areas within the same province. Factors such as economic development, population size and movement, and health conditions could all influence the incidence of human brucellosis. It is important to recognize that these factors may vary within provinces, potentially influencing the incidence of human brucellosis. Despite these limitations, our study provides valuable insights into the expansion of human brucellosis and highlights the importance of considering socioeconomic factors. Our findings could be used to inform public health policies and interventions to reduce the burden in affected communities.
Conclusions
Our study showed a consistent upward trend in the incidence of human brucellosis, with a significant increase of
Materials and methods Human brucellosis
The China Public Health Science Data Center obtained the data of human brucellosis in China mainland from 2004 to 2019, including the number of cases, the incidence rate, and the provinces where the cases occurred. The human brucellosis incidence from 2020 to 2021 was obtained from the Yearbook of Health Statistics. The number of cases of human brucellosis is calculated based on the year-end resident population data.
To provide geographical context, we downloaded an electronic map of China at a scale of 1:1,000,000 from the National Earth System Science Data Sharing Platform. It is worth noting that human brucellosis is classified as a notifiable class B infectious disease in China, and as such, all diagnosed cases must be reported to the China National Notifiable Infectious Disease Surveillance System (NNDSS) within 24 h. The diagnosis of human brucellosis in China adheres to the guidelines outlined in the Law of Communicable Diseases Prevention and Control, a comprehensive guidebook published by the National Health Commission of the People’s Republic of China. The diagnosis involves considering both the individual’s epidemiological history and clinical manifestations to ensure a thorough and accurate assessment of the condition
Driving factors
The meteorological data, including monthly precipitation ( mm ), maximum wind speed (
Temporal trend analysis
In this study, joint point regression was employed to detect and describe trend analysis. This statistical method has been shown to be effective in helping researchers analyze changes in time trends and identify significant turning points in the data
The spatial trend analysis
Spatial trend analysis is a technique used to analyze patterns and trends in spatial data by visualizing attribute values of interest on a 3D map. This is achieved by elevating the points on the map to a height corresponding to the attribute value, with the points projected onto a plane in two perpendicular directions (north and west). Spatial trend analysis is an advanced technique that employs polynomial interpolation to create a smooth surface
based on a set of sample points. The process involves the application of polynomial regression to create a raster that optimally fits a least square surface, with the degree of the polynomial being adjustable to tailor the surface to specific requirements
based on a set of sample points. The process involves the application of polynomial regression to create a raster that optimally fits a least square surface, with the degree of the polynomial being adjustable to tailor the surface to specific requirements
Feature selection and hyperparameter optimization
Feature selection in our study was conducted through a combination of literature review and algorithmic approaches. We first conducted a comprehensive review of relevant studies to identify influential factors mentioned in previous papers (Supplemental Table 1). To further refine the feature selection process, we utilized the least absolute shrinkage and selection operator (LASSO) technique. This method shrinks the coefficients of irrelevant variables to zero by applying a penalty term to the sum of their absolute values
After feature selection, we employed the XGBoost machine learning method, which is widely recognized and highly regarded in the fields of data mining and statistics. This algorithm has gained popularity and has been voted as one of the top ten data mining algorithms due to its straightforward implementation and excellent classification performance
Interpretability analysis with SHAP
The SHAP framework has emerged as a recent development for evaluating predictions generated by complex black box machine learning algorithms. It is based on the theoretically optimal Shapley values of the game
All statistical analyses and the development of prediction models were performed using
Data availability
The dataset analyzed during the current study was collected from a public database in China and is publicly available online (China Public Health Science Data Center: https://www.phsciencedata.cn/Share/, the Yearbook of Health Statistics: http://www.nhc.gov.cn/mohwsbwstjxxzx/tjzxtjcbw/tjsj_list).
Received: 23 October 2023; Accepted: 19 February 2024
Published online: 28 February 2024
Published online: 28 February 2024
References
- Meslin, F. X. Global aspects of emerging and potential zoonoses: A WHO perspective. Emerg. Infect. Dis. 3, 223-228. https://doi. org/10.3201/eid0302.970220 (1997).
- Rajendhran, J. Genomic insights into Brucella. Infect. Genet. Evol. 87, 104635. https://doi.org/10.1016/j.meegid.2020.104635 (2021).
- Brown, V. R., Bowen, R. A. & Bosco-Lauth, A. M. Zoonotic pathogens from feral swine that pose a significant threat to public health. Transbound. Emerg. Dis. 65, 649-659. https://doi.org/10.1111/tbed.12820 (2018).
- Dean, A. S., Crump, L., Greter, H., Schelling, E. & Zinsstag, J. Global burden of human brucellosis: A systematic review of disease frequency. PLoS Negl. Trop. Dis. 6, e1865. https://doi.org/10.1371/journal.pntd. 0001865 (2012).
- De Figueiredo, P., Ficht, T. A., Rice-Ficht, A., Rossetti, C. A. & Adams, L. G. Pathogenesis and immunobiology of brucellosis: Review of Brucella-host interactions. Am. J. Pathol. 185, 1505-1517. https://doi.org/10.1016/j.ajpath.2015.03.003 (2015).
- Franco, M. P., Mulder, M., Gilman, R. H. & Smits, H. L. Human brucellosis. Lancet Infect. Dis. 7, 775-786. https://doi.org/10.1016/ s1473-3099(07)70286-4 (2007).
- Pappas, G., Papadimitriou, P., Akritidis, N., Christou, L. & Tsianos, E. V. The new global map of human brucellosis. Lancet Infect. Dis. 6, 91-99. https://doi.org/10.1016/S1473-3099(06)70382-6 (2006).
- Ragan, V. E. The Animal and Plant Health Inspection Service (APHIS) brucellosis eradication program in the United States. Vet. Microbiol. 90, 11-18. https://doi.org/10.1016/s0378-1135(02)00240-7 (2002).
- Godfroid, J. et al. Brucellosis at the animal/ecosystem/human interface at the beginning of the 21st century. Prev. Vet. Med. 102, 118-131. https://doi.org/10.1016/j.prevetmed.2011.04.007 (2011).
- Deng, Y., Liu, X., Duan, K. & Peng, Q. Research progress on brucellosis. Curr. Med. Chem. 26, 5598-5608. https://doi.org/10.2174/ 0929867325666180510125009 (2019).
- Dadar, M., Shahali, Y. & Whatmore, A. M. Human brucellosis caused by raw dairy products: A review on the occurrence, major risk factors and prevention. Int. J. Food Microbiol. 292, 39-47. https://doi.org/10.1016/j.ijfoodmicro.2018.12.009 (2019).
- Jia, P. & Joyner, A. Human brucellosis occurrences in inner mongolia, China: A spatio-temporal distribution and ecological niche modeling approach. BMC Infect. Dis. 15, 36. https://doi.org/10.1186/s12879-015-0763-9 (2015).
- Deqiu, S., Donglou, X. & Jiming, Y. Epidemiology and control of brucellosis in China. Vet. Microbiol. 90, 165-182. https://doi.org/ 10.1016/s0378-1135(02)00252-3 (2002).
- Lai, S. et al. Changing epidemiology of human brucellosis, China, 1955-2014. Emerg. Infect. Dis. 23, 184-194. https://doi.org/10. 3201/eid2302.151710 (2017).
- Yang, H. et al. Epidemiological characteristics and spatiotemporal trend analysis of human brucellosis in China, 1950-2018. Int. J. Environ. Res. Public Health https://doi.org/10.3390/ijerph17072382 (2020).
- Wang, T. et al. Spatio-temporal cluster and distribution of human brucellosis in Shanxi Province of China between 2011 and 2016. Sci. Rep. 8, 16977. https://doi.org/10.1038/s41598-018-34975-7 (2018).
- Li, Y. J., Li, X. L., Liang, S., Fang, L. Q. & Cao, W. C. Epidemiological features and risk factors associated with the spatial and temporal distribution of human brucellosis in China. BMC Infect. Dis. 13, 547. https://doi.org/10.1186/1471-2334-13-547 (2013).
- Lin, Y., Xu, M., Zhang, X. & Zhang, T. An exploratory study of factors associated with human brucellosis in mainland China based on time-series-cross-section data from 2005 to 2016. PLoS One 14, e0208292. https://doi.org/10.1371/journal.pone.0208292 (2019).
- Yang, Z. et al. Spatiotemporal expansion of human brucellosis in Shaanxi Province, Northwestern China and model for risk prediction. PeerJ 8, e10113. https://doi.org/10.7717/peerj. 10113 (2020).
- Liang, D. et al. Spatiotemporal distribution of human brucellosis in Inner Mongolia, China, in 2010-2015, and influencing factors. Sci. Rep. 11, 24213. https://doi.org/10.1038/s41598-021-03723-9 (2021).
- Xu, L. & Deng, Y. Spatiotemporal pattern evolution and driving factors of brucellosis in China, 2003-2019. Int. J. Environ. Res. Public Health 19, 1. https://doi.org/10.3390/ijerph191610082 (2022).
- Zhao, C. et al. Epidemic characteristics and transmission risk prediction of brucellosis in Xi’an city, Northwest China. Front. Public Health 10, 926812. https://doi.org/10.3389/fpubh.2022.926812 (2022).
- Cao, L. T. et al. Relationship of meteorological factors and human brucellosis in Hebei province, China. Sci. Total Environ. 703, 135491. https://doi.org/10.1016/j.scitotenv.2019.135491 (2020).
- Peng, C., Li, Y. J., Huang, D. S. & Guan, P. Spatial-temporal distribution of human brucellosis in mainland China from 2004 to 2017 and an analysis of social and environmental factors. Environ. Health Prev. Med. 25, 1. https://doi.org/10.1186/s12199-019-0839-z (2020).
- Ye Li, X. Y., Wang, D. & Li, T. Characteristics of brucellosis related public health emergencies in China, 2006-2012. Dis. Surveill. 28(9), 723-725. https://doi.org/10.3784/j.issn.1003-9961.2013.9.008 (2013).
- Chen, J. D. et al. Brucellosis in Guangdong Province, People’s Republic of China, 2005-2010. Emerg. Infect. Dis. 19, 817-818. https://doi.org/10.3201/eid1905.120146 (2013).
- Zhou, L., Fan, M., Hou, Q., Jin, Z. & Sun, X. Transmission dynamics and optimal control of brucellosis in Inner Mongolia of China. Math. Biosci. Eng. 15, 543-567. https://doi.org/10.3934/mbe. 2018025 (2018).
- Xing, L., Zhang, X., Guo, Y., Bai, D. & Xu, H. XGBoost-aided prediction of lip prominence based on hard-tissue measurements and demographic characteristics in an Asian population. Am. J. Orthod. Dentofac. Orthop. 164, 357-367. https://doi.org/10.1016/j. ajodo.2023.01.017 (2023).
- Scott M. Lundberg & Lee, S.-I. in Proceedings of the 31st International Conference on Neural Information Processing Systems, 4768-4777 (Curran Associates Inc., 2017).
- Covert., I. & Lee., S.-I. in Proceedings of The 24th International Conference on Artificial Intelligence and Statistics Vol. 130, 3457-3465 (PMLR, Proceedings of Machine Learning Research, 2021).
- Chen, S. et al. Increasing threat of brucellosis to low-risk persons in urban settings, China. Emerg. Infect. Dis. 20, 126-130. https:// doi.org/10.3201/eid2001.130324 (2014).
- Chen, Z. et al. High-risk regions of human brucellosis in china: Implications for prevention and early diagnosis of travel-related infections. Clin. Infect. Dis. 57, 330-332. https://doi.org/10.1093/cid/cit251 (2013).
- Tan, Z. et al. A familial cluster of human brucellosis attributable to contact with imported infected goats in Shuyang, Jiangsu Province, China, 2013. Am. J. Trop. Med. Hyg. 93, 757-760. https://doi.org/10.4269/ajtmh.15-0149 (2015).
- Rubach, M. P., Halliday, J. E. B., Cleaveland, S. & Crump, J. A. Brucellosis in low-income and middle-income countries. Curr. Opin. Infect. Dis. 26, 404-412 (2013).
- Zhang, N. et al. Animal brucellosis control or eradication programs worldwide: A systematic review of experiences and lessons learned. Prev. Vet. Med. 160, 105-115. https://doi.org/10.1016/j.prevetmed.2018.10.002 (2018).
- Gong, P. et al. Urbanisation and health in China. Lancet 379, 843-852. https://doi.org/10.1016/s0140-6736(11)61878-3 (2012).
- Goscé, L. & Johansson, A. Analysing the link between public transport use and airborne transmission: Mobility and contagion in the London underground. Environ. Health 17, 84. https://doi.org/10.1186/s12940-018-0427-5 (2018).
- Shen, J. et al. Prevention and control of COVID-19 in public transportation: Experience from China. Environ. Pollut. 266, 115291. https://doi.org/10.1016/j.envpol.2020.115291 (2020).
- Howland, R. E., Cowan, N. R., Wang, S. S., Moss, M. L. & Glied, S. Public transportation and transmission of viral respiratory disease: Evidence from influenza deaths in 121 cities in the United States. PLoS One 15, e0242990. https://doi.org/10.1371/journ al.pone. 0242990 (2020).
- China, H. C. o. t. P. s. R. o. Law of the People’s Republic of China on the prevention and treatment of infectious diseases. Vol. WS 269-2019 (Health Commission of the People’s Republic of China, 2019).
- Clegg, L. X., Hankey, B. F., Tiwari, R., Feuer, E. J. & Edwards, B. K. Estimating average annual percent change in trend analysis. Stat. Med. 28, 3670-3682. https://doi.org/10.1002/sim. 3733 (2009).
- Kim, H. J., Fay, M. P., Feuer, E. J. & Midthune, D. N. Permutation tests for joinpoint regression with applications to cancer rates. Stat. Med. 19, 335-351. https://doi.org/10.1002/(sici)1097-0258(20000215)19:3<335::aid-sim336>3.0.co;2-z (2000).
- Agterberg. & Frits. in Encyclopedia of Mathematical Geosciences (eds B. S. Daya Sagar, Qiuming. Cheng, Jennifer. McKinley, & Frits. Agterberg) 1-9 (Springer International Publishing, 2020).
- Şen, Z. Spatial Trend Analysis. Innovative Trend Methodologies in Science and Engineering, 227-280, doi:https://doi.org/10.1007/ 978-3-319-52338-5_6 (2017).
- Tibshirani, R. Regression shrinkage and selection via the lasso: A retrospective. J. R. Stat. Soc.: Series B (Stat. Methodol.) 73, 273-282. https://doi.org/10.1111/j.1467-9868.2011.00771.x (2011).
- Chen, T., & Guestrin, C. in Proceedings of the 22nd ACM SIGKDD International Conference on Knowledge Discovery and Data Mining (San Francisco, 2016).
- Tao, H. et al. An intelligent evolutionary extreme gradient boosting algorithm development for modeling scour depths under submerged weir. Inf. Sci. 570, 172-184. https://doi.org/10.1016/j.ins.2021.04.063 (2021).
- Ling, C. X., Huang, J. & Zhang, H. in Advances in Artificial Intelligence (eds Yang Xiang & Brahim Chaib-draa) 329-341 (Springer Berlin Heidelberg, 2003).
- Lundberg, S. M. et al. From local explanations to global understanding with explainable AI for trees. Nat. Mach. Intell. 2, 56-67. https://doi.org/10.1038/s42256-019-0138-9 (2020).
- Ogata, S. et al. Heatstroke predictions by machine learning, weather information, and an all-population registry for 12-hour heatstroke alerts. Nat. Commun. 12, 4575. https://doi.org/10.1038/s41467-021-24823-0 (2021).
Acknowledgements
The authors thank the China CDC for sharing infectious disease surveillance data online and those who provided data for this study, including physicians, community health service workers and CDC workers.
Author contributions
X.W. was responsible for the study design, performed the statistical analysis and drafted the initial manuscript. Y.W. assisted with the data collection. Z.S. revised the initial manuscript, and all the authors have read and approved the final manuscript.
Funding
This study was funded by the Military Medical and Health Research Fund 18CXZ011.
Competing interests
The authors declare no competing interests.
Additional information
Supplementary Information The online version contains supplementary material available at https://doi.org/ 10.1038/s41598-024-55034-4.
Correspondence and requests for materials should be addressed to Z.S.
Reprints and permissions information is available at www.nature.com/reprints.
Publisher’s note Springer Nature remains neutral with regard to jurisdictional claims in published maps and institutional affiliations.
Reprints and permissions information is available at www.nature.com/reprints.
Publisher’s note Springer Nature remains neutral with regard to jurisdictional claims in published maps and institutional affiliations.
Open Access This article is licensed under a Creative Commons Attribution 4.0 International License, which permits use, sharing, adaptation, distribution and reproduction in any medium or format, as long as you give appropriate credit to the original author(s) and the source, provide a link to the Creative Commons licence, and indicate if changes were made. The images or other third party material in this article are included in the article’s Creative Commons licence, unless indicated otherwise in a credit line to the material. If material is not included in the article’s Creative Commons licence and your intended use is not permitted by statutory regulation or exceeds the permitted use, you will need to obtain permission directly from the copyright holder. To view a copy of this licence, visit http://creativecommons.org/licenses/by/4.0/.
© The Author(s) 2024
© The Author(s) 2024
- Brucellosis, caused by the bacterium Brucella, is a zoonotic disease that affects both humans and animals worldwide, except for a few industrialized countries
. Various animal species have been identified as primary hosts of Brucella, including domestic animals such as goats, sheep, and pigs . Brucellosis in animals can lead to miscarriage, infertility, and decreased milk production. Moreover, the high frequency of abortions in infected animals caused by brucellosis significantly impacts livestock production . The disease is transmitted to humans through direct contact with infected animals or their excretions . The common symptoms of human brucellosis include fever, chills, night sweats, fatigue, weakness, joint pain, muscle aches, and gastrointestinal problems . The most effective way to prevent brucellosis is to avoid contact with infected animals, whether through livestock management or encounters with wildlife. Researchers have discovered that more than 500,000 new human cases are reported annually . Thus, brucellosis has imposed a substantial burden on both public health and economies worldwide. Governments and health agencies across the globe have made concerted efforts to control and combat the spread of this disease . However, brucellosis remains a neglected zoonotic disease, causing substantial harm to the health and economies of affected countries, and continues to be a serious global public health problem . In recent years, there has been a resurgence of human brucellosis in China, characterized by a noticeable spatiotemporal trend. Human brucellosis remains a major public health concern, with outbreaks reported in 25 out of China’s 32 provinces or autonomous regions . The incidence of human brucellosis was particularly high in northern China. However, there has been a notable shift in the geographic distribution of the disease, with an expansion toward urban areas in the southern inland regions of the country . This change in distribution highlights the need for increased surveillance and control measures to effectively address the spread of human brucellosis in these newly affected areas. China has a wide variety of ecological, environmental, meteorological, and economic landscapes throughout the country. The epidemiological characteristics and causes of human brucellosis vary, especially as the area has significantly different landscapes. Previous studies have focused on the incidence of human brucellosis