DOI: https://doi.org/10.1371/journal.pntd.0012820
PMID: https://pubmed.ncbi.nlm.nih.gov/39836654
تاريخ النشر: 2025-01-21
تم الاستلام: 1 أكتوبر 2024
تم القبول: 30 ديسمبر 2024
تم النشر: 21 يناير 2025
حقوق الطبع والنشر: © 2025 كويرفو وآخرون. هذه مقالة مفتوحة الوصول موزعة بموجب شروط ترخيص المشاع الإبداعي، الذي يسمح بالاستخدام غير المقيد، والتوزيع، وإعادة الإنتاج في أي وسيلة، بشرط أن يتم الإشارة إلى المؤلف الأصلي والمصدر.
التأثيرات المتنوعة للمناطق على تغير المناخ في منطقة واسعة من الفاسيولiasis البشرية والحيوانية المفرطة الانتشار، التي تم تقييمها ضمن إجراء صحة واحدة للوقاية والسيطرة
الملخص
هضبة بوليفيا الشمالية هي المنطقة الموبوءة بالفاسيولاز حيث تم تسجيل أعلى معدلات وشدة في البشر. في هذه المنطقة الموبوءة بالفاسيولاز البشرية، تسبب المرض فقط فاسيولا هيباتيكا وينتقل بواسطة غالبا ترونكاتولا، النوع الوحيد من اللينمائيات الموجود في المنطقة. عند تحليل الرابط بين الاحتباس الحراري والانتشار الجغرافي المبلغ عنه مؤخرًا لعدد سكان اللينمائيات إلى المناطق الحدودية، وُجد تغير مناخي غير متجانس ملحوظ في جميع أنحاء المنطقة الموبوءة. كان الهدف من هذه الدراسة هو تحليل التباين الفيزيائي للمنطقة الموبوءة بالفاسيولاز في هضبة بوليفيا الشمالية، من أجل تقييم تداعياته في تنفيذ إجراء صحة واحدة. استخدمنا نماذج مختلطة خطية متعددة المتغيرات لتحليل تأثير عدد من الميزات الفيزيائية على التغير طويل الأمد في المناخ ومخاطر الانتقال. على الرغم من تجانسها الفيزيائي الظاهر، كشفت نتائج هذه الدراسة عن خصائص مناخية غير متجانسة بشكل ملحوظ في جميع أنحاء المنطقة الموبوءة. يتأثر هذا النمط غير المنتظم بميزات فيزيائية مثل الارتفاع، والتلال الداخلية، والقرب من بحيرة تيتيكاكا، وظاهرة النينيو- oscillation الجنوبية. هذه هي أوسع دراسة تم إجراؤها على الإطلاق في منطقة موبوءة بالفاسيولاز البشرية حول تأثير الفيزياء على المناخ. تسلط الضوء على أهمية النظر في الميزات الفيزيائية، وهو جانب عادة ما لا يؤخذ في الاعتبار في الدراسات التي تتعامل مع تأثيرات المناخ وتغير المناخ على الفاسيولاز البشرية والحيوانية. علاوة على ذلك، يظهر أن المنطقة الموبوءة قد تتطور مناخيًا بشكل مختلف في مناطقها الداخلية المختلفة ويؤكد الحاجة إلى المراقبة المستمرة لتقييم ما إذا كان ينبغي تعديل تدابير السيطرة وفقًا لذلك.
ملخص المؤلف
1. المقدمة
حملات العلاج الجماعي السنوية [20،24] التي تم تنفيذها من خلال عمل متعدد التخصصات في الصحة الواحدة [19].
2. الطرق
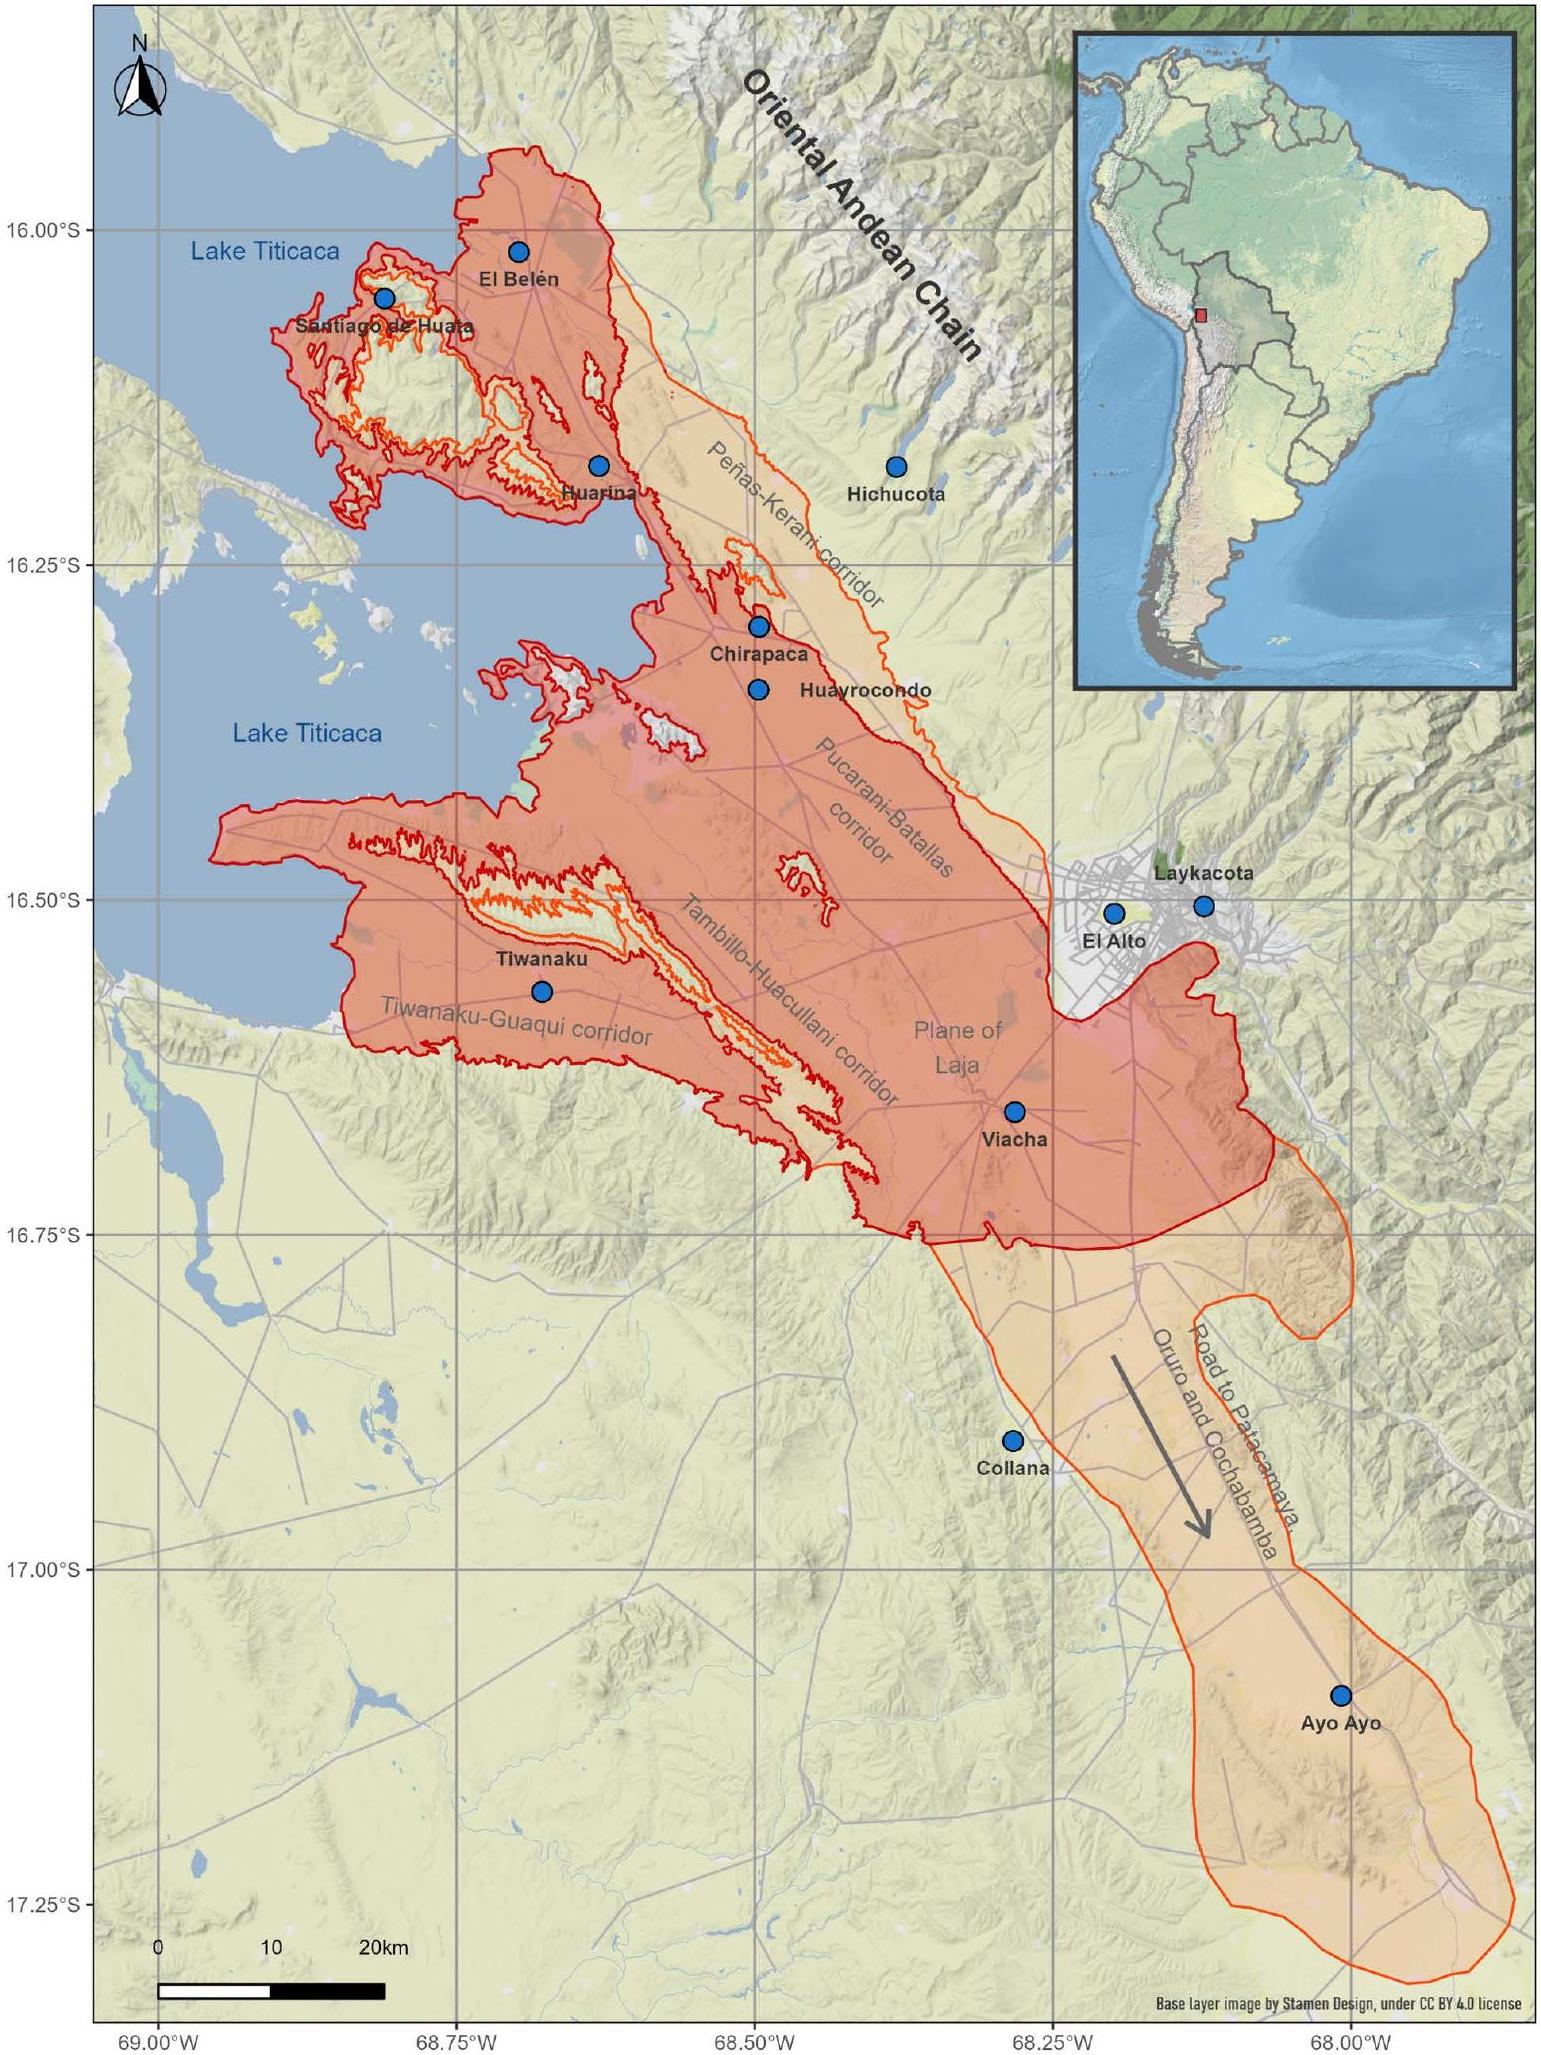
2.1. منطقة الدراسة
2.2. البيانات المناخية
https://doi.org/10.1371/journal.pntd.0012820.g001
| محطة | قسم | محافظة | الإحداثيات الجغرافية | ارتفاع | فترة زمنية |
| أيو أيو | لا باز | عطر |
|
٣٨٨٨ | 1958-2020 |
| ب. شيراباكا | لا باز | جبال الأنديز |
|
٣٨٧٠ | 1991-2020 |
| ج. قلادة | لا باز | عطر |
|
٤٥٠٠ | 1973-2020 |
| د. إل ألتو | لا باز | موريّو |
|
٤٠٧١ | 1962-2020 |
| e. البيلين | لا باز | أوماسويوس |
|
٣٨٣٣ | 1949-2017 |
| ف. هيشوكوتا | لا باز | جبال الأنديز |
|
4460 | 1979-2020 |
| غ. هوارينا | لا باز | أوماسويوس |
|
٣٨٣٨ | 1973-2011 |
| ه. هويركوندو | لا باز | جبال الأنديز |
|
٣٨٧٥ | 1991-2020 |
| لايكاكوتا | لا باز | موريّو |
|
٣٦٣٢ | 1945-2020 |
| ج. سانتياغو دي هواتا | لا باز | أوماسويوس |
|
٣٨٤٥ | 1985-2020 |
| ك. تيهواناكو | لا باز | إنغافي |
|
3863 | 1973-2016 |
| 1. فياتشا | لا باز | إنغافي |
|
3850 | 1965-2015 |
2.3. مؤشرات التنبؤ المناخي
2.4. تحليل تأثير الميزات الفيزيائية و ظاهرة النينيو – oscillation الجنوبية (ENSO) على العوامل المناخية ومؤشرات التنبؤ المناخي
| اختصار | وصف المتغير | إجراء المعالجة |
| المسافة إلى البحيرة | المسافة إلى بحيرة تيتيكاكا | أقصر مسافة من محطة الأرصاد الجوية إلى مضلع بحيرة تيتيكاكا
|
| المسافة إلى الكنتور | المسافة إلى حدود ممرات التلال | أقصر مسافة من محطة الأرصاد الجوية إلى حدود الممر، المحددة بواسطة خطوط الكنتور المستمدة من نموذج الارتفاع الرقمي (DEM)
|
| المسافة إلى المنحدر | المسافة إلى التلال القريبة | أقصر مسافة من محطة الأرصاد الجوية إلى المناطق ذات الانحدار الأكبر من
|
| dist2Andes | المسافة إلى أشد المنحدرات في سلسلة جبال الأنديز الشرقية | أقصر مسافة من محطة الأرصاد الجوية إلى المناطق ذات الانحدار الأكبر من
|
| ارتفاع | الارتفاع المستمد من نماذج الارتفاع الرقمية عالية الدقة المختلفة | القيم المستخرجة لكل محطة أرصاد جوية من صورة الارتفاع بواسطة العينة الثنائية الخطية
|
| شمالية | جيب الزاوية، مضروبًا في جيب التمام للاتجاه، يصف التوجه بالاشتراك مع الميل | القيم المستخرجة لكل محطة أرصاد جوية من مصفوفة ‘الشمالية’ بواسطة أخذ عينات ثنائية الخطوة
|
| شرقية | جيب الزاوية، مضروبًا في جيب الزاوية الجانبية، يصف الاتجاه بالاشتراك مع الميل | القيم المستخرجة لكل محطة أرصاد جوية من صورة ‘الاتجاه الشرقي’ بواسطة العينة الثنائية الخطية
|
| إدارة علاقات الموردين | مقياس وعورة التضاريس (VRM) يقيس وعورة التضاريس من خلال قياس تشتت المتجهات العمودية على سطح التضاريس. | القيم المستخرجة لكل محطة أرصاد جوية من صورة ‘VRM’ بواسطة العينة الثنائية الخطية
|
https://doi.org/10.1371/journal.pntd.0012820.g002
مُعرّف باستخدام مكونين جيبيين (جيب وجيب التمام) لأخذ في الاعتبار وجود نمط موسمي [46]. العامل العشوائي المتداخل
2.5. التحليلات المكانية والإحصائية
3. النتائج
| متغير | الميلاد (1949-2017) | سانتياغو دي هواتا (1985-2020) | هوا رينا كوتا كوتا (1973-2011) | شيرا باكا (1991-2020) | هوايروكندو (1991-2020) | تيواناكو (1973-2016) |
| ميت (
|
|
|
|
|
|
|
| MMT (
|
|
|
|
|
|
|
| مم ت
|
|
|
|
|
|
|
| EMT (
|
|
|
|
|
|
|
| إم تي (
|
|
|
|
|
|
|
| MTD (
|
|
|
|
|
|
|
| موعد المغادرة المتوقع (ETD)
|
|
|
|
|
|
|
| Pt (مم) |
|
|
|
|
|
|
| YP (مم) |
|
|
|
|
|
|
| ميغابكسل (مم) |
|
|
|
|
|
|
| DP (أيام) |
|
|
|
|
|
|
| DF (أيام) |
|
|
|
|
|
|
| الذكاء الاصطناعي (مم) |
|
|
|
|
|
|
| جبل |
|
|
|
|
|
|
| و ب-ب س |
|
|
|
|
|
|
| كم و ب – بس |
|
|
|
|
|
|
| متغير | هيتشوكوتا (1979-2020) | إل ألتو (1962-2020) | لايكاكوتا (1945-2020) | فياتشا (1965-2015) | كولانا (1973-2020) | أيو أيو (1958-2020) |
| ميت (
|
|
|
|
|
|
|
| MMT (
|
|
|
|
|
|
|
|
|
|
|
|
|
|
|
| EMT (
|
|
|
|
|
|
|
| إم تي (
|
|
|
|
|
|
|
| MTD (
|
|
|
|
|
|
|
| موعد المغادرة المتوقع (ETD)
|
|
|
|
|
|
|
| Pt (مم) |
|
|
|
|
|
|
| YP (مم) |
|
|
|
|
|
|
| ميغابكسل (مم) |
|
|
|
|
|
|
| DP (أيام) |
|
|
|
|
|
|
| DF (أيام) |
|
|
|
|
|
|
| الذكاء الاصطناعي (مم) |
|
|
|
|
|
|
| جبل |
|
|
|
|
|
|
| و ب-ب س |
|
|
|
|
|
|
| كم و ب – بس |
|
|
|
|
|
|
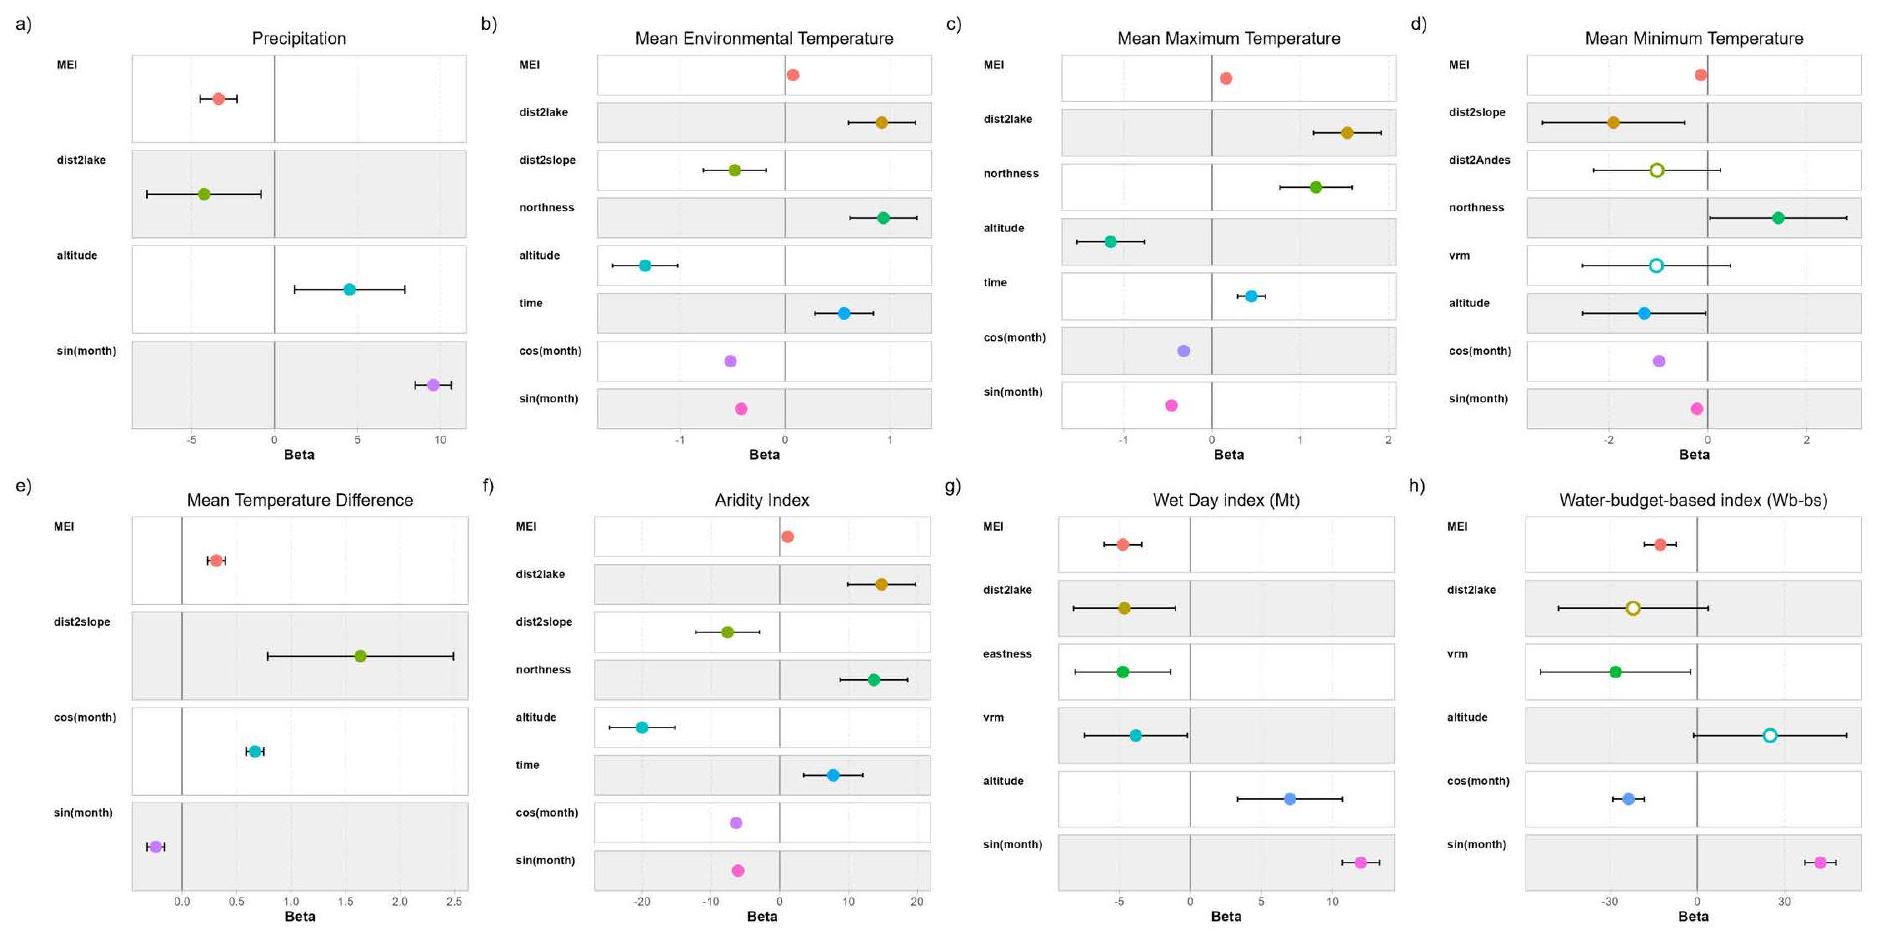
Initial models
Model A: response variable $sim$ MEI + dist2lake + dist2contour + dist2Andes + eastness + northness + VRM + altitude + time $+cos ($ month $)+sin ($ month $)$
+ (1 + time | stationID)
Model B: response variable $sim$ MEI + dist2lake + dist2slope + dist2Andes + eastness + northness + VRM + altitude + time $+cos ($ month $)+sin ($ month $)$
+ (1 + time | stationID)

begin{tabular}{|l|l|l|}
hline Simplified models & AICc & Weights \
hline multicolumn{3}{|l|}{Precipitation model: Pt ~MEI + dist2lake + altitude + sin(month) + (1 + time | stationID)} \
hline multicolumn{3}{|l|}{MET models:} \
hline model A: MET ~ MEI + dist2lake + dist2contour + northness + altitude + time + cos(month) + sin(month) + ( 1 + time | stationID) & 26658 & 0.027 \
hline model B: MET ~ MEI + dist2lake + dist2slope + northness + altitude + time + cos(month) + sin(month) + (1 + time | stationID) & 26651 & 0.973 \
hline multicolumn{3}{|l|}{MMT models: $M M T sim$ MEI + dist2lake + northness + altitude + time + cos(month) + sin(month) + (1 + time | stationID)} \
hline multicolumn{3}{|l|}{MmT models:} \
hline model A: MmT ~ MEI + cos(month) + sin(month) + (1 + time | stationID) & 35734 & 0.131 \
hline model B: MmT ~ MEI + dist2slope + dist2Andes + northness + VRM + altitude + cos(month) + sin(month) + (1 + time | stationID) & 35730 & 0.869 \
hline multicolumn{3}{|l|}{MTD models:} \
hline model A: MTD ~ MEI + dist2lake + dist2contour + cos(month) + sin(month) + (1 + time | stationID) & 34605 & 0.067 \
hline model B: MTD ~ MEI + dist2slope + cos(month) + sin(month) + (1 + time | stationID) & 34599 & 0.933 \
hline multicolumn{3}{|l|}{AI models:} \
hline model A: AI~MEI + dist2lake + dist2contour + northness + altitude + time + cos(month) + sin(month) + ( 1 + time $mid$ stationID) & 63337 & 0.026 \
hline model B: AI~MEI + dist2lake + dist2slope + northness + altitude + time + cos(month) + sin(month) + ( 1 + time $mid$ stationID) & 63330 & 0.974 \
hline
end{tabular}
Mt model: $M t sim M E I+$ dist2lake + eastness $+V R M+$ altitude $+sin ($ month $)+(1+$ time $mid$ stationID $)$
Wb-bs model: $W b-b s sim M E I+$ dist2lake $+V R M+$ altitude $+cos ($ month $)+sin ($ month $)+(1+$ time $mid$ stationID $)$
https://doi.org/10.1371/journal.pntd.0012820.t004
https://doi.org/10.1371/journal.pntd.0012820.g003
| النماذج الأولية | ||
| النموذج أ: المتغير التابع
|
||
| النموذج ب: المتغير الاستجابي
|
||
| نماذج مبسطة | AICc | أوزان |
| نموذج الهطول: Pt
|
||
| نماذج MET: | ||
| النموذج A: MET ~ الوقتMEI + المسافة إلى البحيرة + المسافة إلى الخط الجبلي + الوقتdist2Andes + الوقتالشرق + الوقتالشمال + الوقت * الارتفاع + جيب التمام (الشهر) + جيب (الشهر)
|
26650 | 0.032 |
| النموذج ب: MET ~ الوقتMEI + المسافة إلى البحيرة + المسافة إلى المنحدر + الوقتالمسافة إلى الأنديز + الوقتالشرق + الوقتالشمالية + الوقت*الارتفاع + جيب التمام (الشهر) + جيب (الشهر) + (1 + الوقت | معرف المحطة) | ٢٦٦٤٣ | 0.968 |
| نماذج MMT: | ||
| النموذج A: MMT ~ الوقتMEI + dist2lake + الوقتالمسافة إلى الكنتور + الوقتالشرق + الشمال + الزمنالارتفاع + جيب التمام (الشهر) + جيب (الشهر) + (1 + الوقت | معرف المحطة) | 22726 | 0.039 |
| النموذج ب: MMT ~ الوقتMEI + المسافة إلى البحيرة + الوقتالمسافة2الميل + الوقتشمال + وقتالارتفاع + جيب التمام (الشهر) + جيب (الشهر) + (1 + الوقت | معرف المحطة) | 22720 | 0.961 |
| نماذج MmT: | ||
| النموذج A: MmT ~ الوقت*MEI + cos(الشهر) + sin(الشهر) + (1 + الوقت | معرف المحطة) | ٣٥٦٩٨ | 0.120 |
| النموذج ب: MmT ~ الوقت * MEI + dist2slope + dist2Andes + northness + VRM + الارتفاع + cos(الشهر) + sin(الشهر) + (1 + الوقت | stationID) | ٣٥٦٩٤ | 0.880 |
| نماذج MTD: | ||
| النموذج A: MTD ~ الوقت*MEI + المسافة إلى البحيرة + المسافة إلى الخطوط الكنتورية + جيب التمام (الشهر) + جيب (الشهر) + (1 + الوقت | معرف المحطة) | ٣٤٥٨٩ | 0.070 |
| النموذج ب: MTD ~ الوقت*MEI + dist2slope + cos(الشهر) + sin(الشهر) + ( 1 + الوقت | معرف المحطة) | ٣٤٥٨٤ | 0.930 |
| نماذج الذكاء الاصطناعي: | ||
| النموذج A: الذكاء الاصطناعي ~ الوقتMEI + الوقتالمسافة إلى البحيرة + المسافة إلى الخطوط الكنتورية + الوقتالمسافة إلى الأنديز + الوقتالشرق + الوقتشمال + وقتالارتفاع + جيب التمام (الشهر) + جيب (الشهر) + (1 + الوقت | معرف المحطة) | 63321 | 0.022 |
| النموذج ب: الذكاء الاصطناعي ~ الوقتMEI + الوقتالمسافة إلى البحيرة + المسافة إلى المنحدر + الوقت * المسافة إلى الأنديز + الوقتالشرق + الوقتالشمالية + الوقت*الارتفاع + جيب التمام (الشهر) + جيب (الشهر)
|
63314 | 0.978 |
| نموذج Mt: Mt
|
||
| نماذج Wb-bs: | ||
| النموذج A: Wb-bs
|
91511 | 0.236 |
| النموذج ب: و ب-ب س
|
91509 | 0.764 |
https://doi.org/10.1371/journal.pntd.0012820.t005
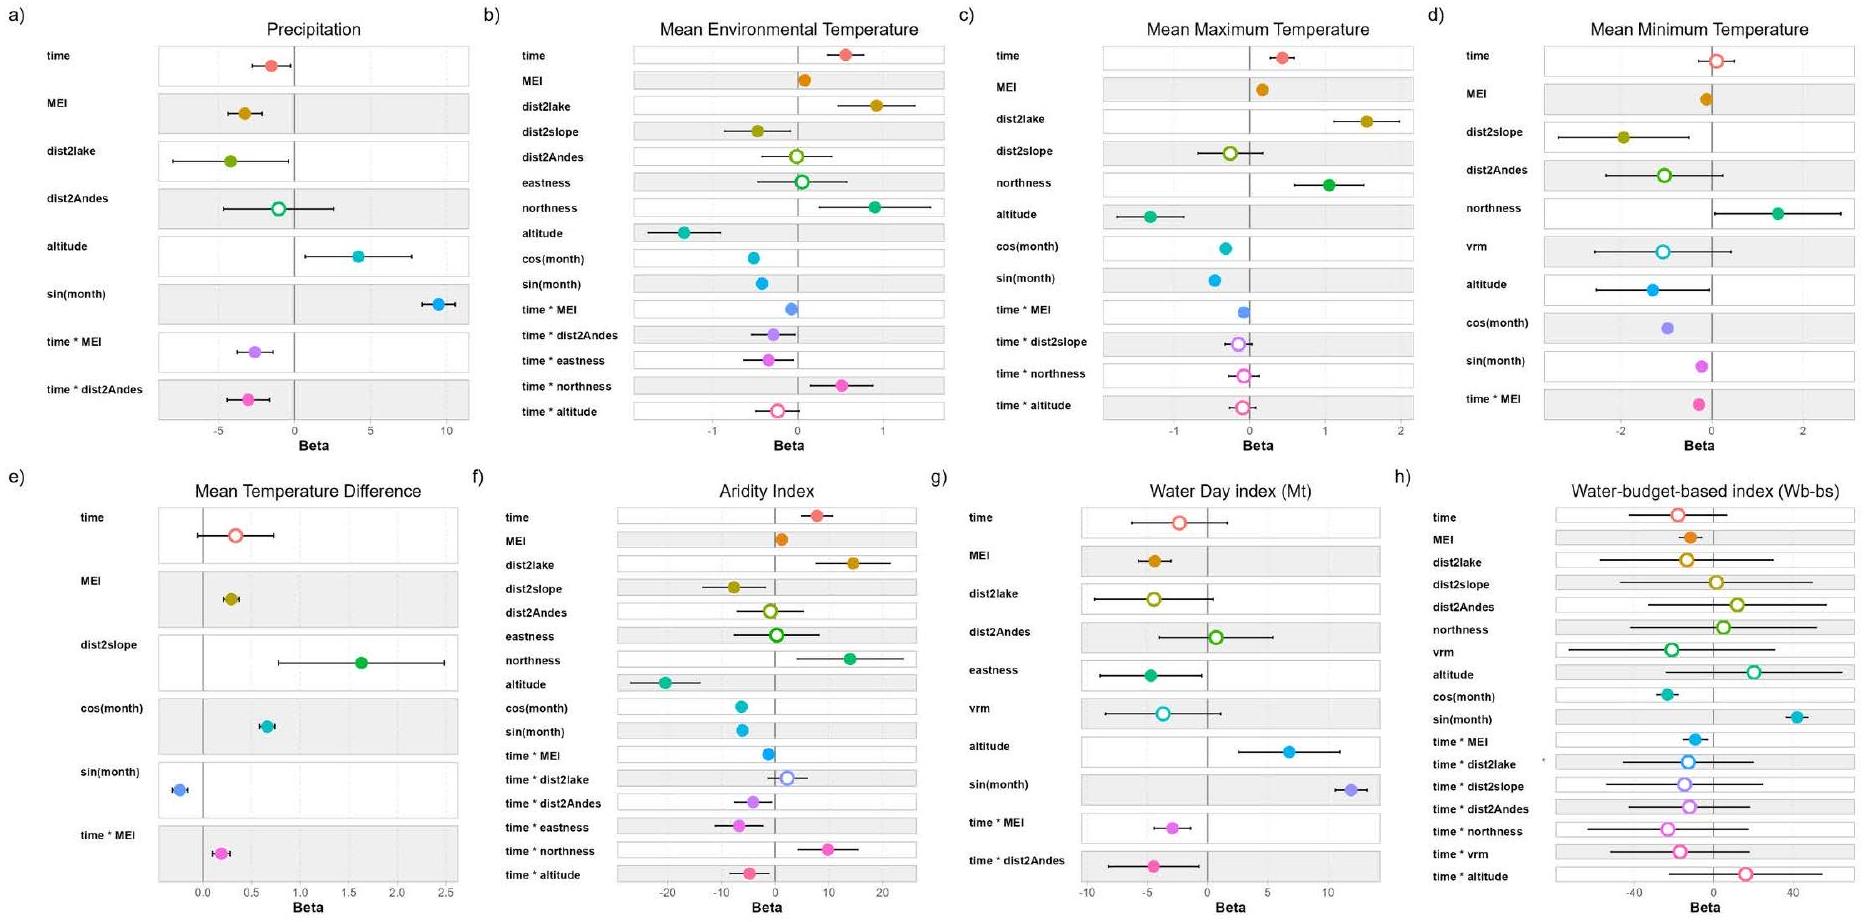
القرب من التلال الصغيرة القريبة من محطات الأرصاد الجوية (الشكل 4ب و4د)، بينما زادت سعة درجة الحرارة كلما ابتعدنا عن الارتفاعات المذكورة (الشكل 4هـ). كانت درجة الحرارة مرتبطة إيجابياً بالاتجاه نحو الشمال ومرتبطاً سلبياً بالارتفاع (الشكل 4ب و4ج و4د).
4. المناقشة
المرتفعات البوليفية. من أجل المساهمة في هذا العمل متعدد التخصصات في الصحة الواحدة، تشكل هذه الدراسة جهداً غير مسبوق لتحليل تأثير الجغرافيا على التطور طويل الأمد للعوامل المناخية وتأثيرها على انتقال الفاسيولياز، مع التركيز بشكل خاص على هذه المنطقة الوبائية العالية الارتفاع.
4.1. موسمية العوامل المناخية
تعتمد على هطول الأمطار، ولكن بشكل كبير على توفر مصادر المياه الدائمة [17،54]. وبالتالي، يبدو أن درجة الحرارة هي عامل أكثر أهمية من هطول الأمطار. في الواقع، عند تحليل مؤشرات توقع الفاسيولياز (أي، القيمة القصوى الشهرية والقيم السنوية المتوسطة المتراكمة على مدار عام كامل)، يتم تجاوز عتبة الانتقال، ويتم تقريبا مضاعفتها، في كل موقع تقريباً، مما يشير إلى أن الانتقال ممكن طوال العام بأكمله.
4.2. المسافة من بحيرة تيتيكاكا
4.3. القرب من التلال الأقرب
4.4. المسافة من سلسلة جبال الأنديز الشرقية
4.5. الميزات الطبوغرافية
4.6. تأثير ظاهرة النينيو – oscillation الجنوبية (ENSO)
لذلك، قد تصبح بؤر الانتقال مركزة مما يسهل انتقال المرض بسبب الحاجة لكل من البشر والماشية للاعتماد على نفس المصادر القليلة من المياه العذبة. وقد تم وصف مثل هذا الوضع بالفعل لمرض الفاسيوليازيس البشري في الأرجنتين. علاوة على ذلك، نظرًا لوجود اللينمايد في ظروف تضمن انتقال الفاسيوليازيس، فإن المراحل التطورية لدودة الكبد، اعتمادًا على الميزات البيئية، من المحتمل أن تستفيد من ارتفاع درجات الحرارة.
4.7. تأثير الميزات الفيزيائية على التغيرات طويلة الأمد في العوامل المناخية ومؤشرات التنبؤ المناخي
5. ملاحظات ختامية
شكر وتقدير
مساهمات المؤلفين
تنسيق البيانات: بابلو فرناندو كويرفو، باتريسيو أرتيغاز.
التحليل الرسمي: بابلو فرناندو كويرفو.
الحصول على التمويل: بابلو فرناندو كويرفو، ماريا دولوريس بارغيس، سانتياغو ماس-كوم.
الإشراف: ماريا دولوريس بارغيس، سانتياغو ماس-كوم.
الكتابة – المسودة الأصلية: بابلو فرناندو كويرفو.
الكتابة – المراجعة والتحرير: بابلو فرناندو كويرفو، ماريا دولوريس بارغيس، باتريسيو أرتيغاز، باولا بوشون، رينيه أنجلز، سانتياغو ماس-كوم.
References
- Hayward AD, Skuce PJ, McNeilly TN. The influence of liver fluke infection on production in sheep and cattle: a meta-analysis. Int J Parasitol. 2021;51(11):913-24. https://doi.org/10.1016/j.ijpara.2021.02.006 PMID: 33901437
- Van De N, Minh PN, Le TH, Dung DT, Duong TT, Tuan BV, et al. A multidisciplinary analysis of over 53,000 fascioliasis patients along the 1995-2019 countrywide spread in Vietnam defines a new epidemiological baseline for One Health approaches. One Health. 2024;19:100869. https://doi. org/10.1016/j.onehlt.2024.100869 PMID: 39220760
- Mas-Coma S, Bargues MD, Valero MA. Diagnosis of human fascioliasis by stool and blood techniques: update for the present global scenario. Parasitology. 2014;141(14):1918-46. https://doi. org/10.1017/S0031182014000869 PMID: 25077569
- Mas-Coma S, Agramunt VH, Valero MA. Neurological and ocular fascioliasis in humans. Adv Parasitol. 2014;84:27-149. https://doi.org/10.1016/B978-0-12-800099-1.00002-8 PMID: 24480313
- González-Miguel J, Valero MA, Reguera-Gomez M, Mas-Bargues C, Bargues MD, Simón F, et al. Numerous Fasciola plasminogen-binding proteins may underlie blood-brain barrier leakage and explain neurological disorder complexity and heterogeneity in the acute and chronic phases of human fascioliasis. Parasitology. 2019;146(3):284-98. https://doi.org/10.1017/S0031182018001464 PMID: 30246668
- Rondelaud D, Dreyfuss G, Vignoles P. Clinical and biological abnormalities in patients after fasciolosis treatment. Med Mal Infect. 2006;36(9):466-8. https://doi.org/10.1016/j.medmal.2006.07.018 PMID: 17030486
- Dalton JP, Robinson MW, Mulcahy G, O’Neill SM, Donnelly S. Immunomodulatory molecules of Fasciola hepatica: candidates for both vaccine and immunotherapeutic development. Vet Parasitol. 2013;195(3-4):272-85. https://doi.org/10.1016/j.vetpar.2013.04.008 PMID: 23623183
- Gironès N, Valero MA, García-Bodelón MA, Chico-Calero I, Punzón C, Fresno M, et al. Immune suppression in advanced chronic fascioliasis: an experimental study in a rat model. J Infect Dis. 2007;195(10):1504-12. https://doi.org/10.1086/514822 PMID: 17436231
- Aldridge A, O’Neill SM. Fasciola hepatica tegumental antigens induce anergic like T cells via dendritic cells in a mannose receptor dependent manner. Eur J Immunol. 2016; 46(5):1180-92. https://doi. org/10.1002/eji.201545905
- Esteban JG, Flores A, Aguirre C, Strauss W, Angles R, Mas-Coma S. Presence of very high prevalence and intensity of infection with Fasciola hepatica among Aymara children from the Northern Bolivian Altiplano. Acta Trop. 1997;66(1):1-14. https://doi.org/10.1016/s0001-706x(97)00669-4 PMID: 9177091
- Esteban JG, Flores A, Angles R, Strauss W, Aguirre C, Mas-Coma S. A population-based coprological study of human fascioliasis in a hyperendemic area of the Bolivian Altiplano. Trop Med Int Health. 1997;2(7):695-9. https://doi.org/10.1046/j.1365-3156.1997.d01-356.x PMID: 9270738
- Mas-Coma S. Human fascioliasis emergence risks in developed countries: from individual patients and small epidemics to climate and global change impacts. Enferm Infecc Microbiol Clin (Engl Ed). 2020;38(6):253-6. https://doi.org/10.1016/j.eimc.2020.01.014 PMID: 32107024
- World Health Organization. Sustaining the drive to overcome the global impact of neglected tropical diseases. Department of Control of Neglected Tropical Diseases. Geneva, Switzerland: World Health Organization; 2013 [cited 2024 Sept 6]. p. 128. Available from: https://iris.who.int/handle/10665/77950
- World Health Organization. Ending the neglect to attain the Sustainable Development Goals. A Road Map for Neglected Tropical Diseases 2021-2030. Geneva, Switzerland: World Health Organization; 2020 [cited 2024 Sept 6]. p. 1-47. Available from: https://iris.who.int/handle/10665/338565
- World Health Organization. Ending the neglect to attain the Sustainable Development Goals. One Health companion document to the Neglected Tropical Diseases Road Map 2021-2030. Draft for Public Consultation (updated 19 October 2021). Geneva, Switzerland: World Health Organization;
16. Hillyer GV, Soler de Galanes M, Rodriguez-Perez J, Bjorland J, Silva de Lagrava M, Ramirez Guzman S, et al. Use of the Falcon assay screening test-enzyme-linked immunosorbent assay (FAST-ELISA) and the enzyme-linked immunoelectrotransfer blot (EITB) to determine the prevalence of human fascioliasis in the Bolivian Altiplano. Am J Trop Med Hyg. 1992;46(5):603-9. https://doi.org/10.4269/ ajtmh.1992.46.603 PMID: 1599055
17. Mas-Coma S, Anglés R, Esteban JG, Bargues MD, Buchon P, Franken M, et al. The Northern Bolivian Altiplano: a region highly endemic for human fascioliasis. Trop Med Int Health. 1999;4(6):454-67. https://doi.org/10.1046/j.1365-3156.1999.00418.x PMID: 10444322
18. Esteban JG, Flores A, Angles R, Mas-Coma S. High endemicity of human fascioliasis between Lake Titicaca and La Paz valley, Bolivia. Trans R Soc Trop Med Hyg. 1999;93(2):151-6. https://doi. org/10.1016/s0035-9203(99)90289-4 PMID: 10450437
19. Mas-Coma S, Valero MA, Bargues MD. One Health for fascioliasis control in human endemic areas. Trends Parasitol. 2023;39(8):650-67. https://doi.org/10.1016/j.pt.2023.05.009 PMID: 37385922
20. Valero MA, Periago MV, Pérez-Crespo I, Angles R, Villegas F, Aguirre C, et al. Field evaluation of a coproantigen detection test for fascioliasis diagnosis and surveillance in human hyperendemic areas of Andean countries. PLoS Negl Trop Dis. 2012;6(9):e1812. https://doi.org/10.1371/journal. pntd. 0001812 PMID: 23029575
21. Mas-Coma S, Funatsu IR, Bargues MD. Fasciola hepatica and lymnaeid snails occurring at very high altitude in South America. Parasitology. 2001;123(Suppl 7):S115-27. https://doi.org/10.1017/ s0031182001008034 PMID: 11769277
22. Bargues MD, Artigas P, Angles R, Osca D, Duran P, Buchon P, et al. Genetic uniformity, geographical spread and anthropogenic habitat modifications of lymnaeid vectors found in a One Health initiative in the highest human fascioliasis hyperendemic of the Bolivian Altiplano. Parasit Vectors. 2020;13(1):171. https://doi.org/10.1186/s13071-020-04045-x PMID: 32252808
23. Mas-Coma S, Valero MA, Bargues MD. Human and animal fascioliasis: origins and worldwide evolving scenario. Clin Microbiol Rev. 2022;35(4):e0008819. https://doi.org/10.1128/cmr.00088-19 PMID: 36468877
24. Villegas F, Angles R, Barrientos R, Barrios G, Valero MA, Hamed K, et al. Administration of triclabendazole is safe and effective in controlling fascioliasis in an endemic community of the Bolivian Altiplano. PLoS Negl Trop Dis. 2012;6(8):e1720. https://doi.org/10.1371/journal.pntd. 0001720 PMID: 22880138
25. Cuervo PF, Bargues MD, Artigas P, Buchon P, Angles R, Mas-Coma S. Global warming induced spread of the highest human fascioliasis hyperendemic area. Parasit Vectors. 2024;17(1):434. https:// doi.org/10.1186/s13071-024-06514-z PMID: 39434158
26. López-Moreno JI, Morán-Tejeda E, Vicente-Serrano SM, Bazo J, Azorin-Molina C, Revuelto J, et al. Recent temperature variability and change in the Altiplano of Bolivia and Peru. Int J Climatol. 2015;36(4):1773-96. https://doi.org/10.1002/joc. 4459
27. Angles R, Buchon P, Valero MA, Bargues MD, Mas-Coma S. One health action against human fascioliasis in the bolivian altiplano: food, water, housing, behavioural traditions, social aspects, and livestock management linked to disease transmission and infection sources. Int J Environ Res Public Health. 2022;19(3):1120. https://doi.org/10.3390/ijerph19031120 PMID: 35162146
28. Fuentes MV, Valero MA, Bargues MD, Esteban JG, Angles R, Mas-Coma S. Analysis of climatic data and forecast indices for human fascioliasis at very high altitude. Ann Trop Med Parasitol. 1999;93(8):835-50. https://doi.org/10.1080/00034983.1999.11813491
29. Hintze JL, Nelson RD. Violin plots: a box plot-density trace synergism. Am Statist. 1998;52(2):181-4. https://doi.org/10.1080/00031305.1998.10480559
30. Mas-Coma S, Valero MA, Bargues MD. Effects of climate change on animal and zoonotic helminthiases. Rev Sci Tech Off Int Epizoot 2008;27(2):443-57. https://doi.org/10.20506/rst.27.2.1822
31. Mas-Coma S, Valero MA, Bargues MD. Climate change effects on trematodiases, with emphasis on zoonotic fascioliasis and schistosomiasis. Vet Parasitol. 2009;163(4):264-80. https://doi.org/10.1016/j. vetpar.2009.03.024 PMID: 19375233
32. Ollerenshaw CB, Rowlands WT. A method of forecasting the incidence of fascioliasis in Anglesey. Vet Rec. 1959;71:591-8.
33. Ollerenshaw CB. Quelques aspects des relations entre le climat et l’incidence de la fasciolose en Europe. Cah Med Vet. 1971;40:303-19.
34. Ollerenshaw CB. A comment on the epidemiology of Fasciola hepatica in Italy. Ann Fac Med Veterin Torino. 1973;20:83-121.
35. Malone JB, Williams TE, Muller RA, Geaghan JP, Loyacano AF. Fascioliasis in cattle in Louisiana: development of a system to predict disease risk by climate, using the Thornthwaite water budget. Am J Vet Res. 1987;48(7):1167-70. PMID: 3631704
36. Malone JB, Gommes R, Hansen J, Yilma JM, Slingenberg J, Snijders F, et al. A geographic information system on the potential distribution and abundance of Fasciola hepatica and F. gigantica in east Africa based on Food and Agriculture Organization databases. Vet Parasitol. 1998;78(2):87-101. https://doi.org/10.1016/s0304-4017(98)00137-x PMID: 9735915
37. Kendall S, McCullough F. The emergence of the cercariae of Fasciola hepatica from the snail Limnaea truncatula. J Helminthol. 1951;25(1-2):77-92.
38. Leimbacher F. Ecology and control of parasite stages in external environment. III. An ecological approach to the control of fascioliasis in France. In: Slusarski W, editor. Review of advances in parasitology. Polish Scientific Publishers; 1981. p. 531-8.
39. Schreiber D. A comparative examination of threshold values for dry months, taking the situation of Kenya as an example. Appl Geogr Dev. 1981;17:29-45.
40. Fuentes M, Malone J. Development of a forecast system for fasciolosis in central Chile using remote sensing and climatic data in a geographic information system. Res Rev Parasitol. 1999;59(3-4):129-34.
41. Afshan K, Fortes-Lima CA, Artigas P, Valero AM, Qayyum M, Mas-Coma S. Impact of climate change and man-made irrigation systems on the transmission risk, long-term trend and seasonality of human and animal fascioliasis in Pakistan. Geospat Health. 2014;8(2):317-34. https://doi.org/10.4081/ gh.2014.22 PMID: 24893010
42. Yilma JM, Malone JB. A geographic information system forecast model for strategic control of fasciolosis in Ethiopia. Vet Parasitol. 1998;78(2):103-27. https://doi.org/10.1016/s0304-4017(98)00136-8 PMID: 9735916
43. Mazzarella A, Giuliacci A, Liritzis I. On the 60-month cycle of multivariate ENSO index. Theor Appl Climatol. 2009;100(1-2):23-7. https://doi.org/10.1007/s00704-009-0159-0
44. Messager ML, Lehner B, Grill G, Nedeva I, Schmitt O. Estimating the volume and age of water stored in global lakes using a geo-statistical approach. Nat Commun. 2016;7:13603. https://doi.org/10.1038/ ncomms13603 PMID: 27976671
45. Amatulli G, Domisch S, Tuanmu M-N, Parmentier B, Ranipeta A, Malczyk J, et al. A suite of global, cross-scale topographic variables for environmental and biodiversity modeling. Sci Data. 2018;5:180040. https://doi.org/10.1038/sdata.2018.40 PMID: 29557978
46. Diggle P. Time series: a biostatistical introduction. Oxford, UK: Clarendon Press; 1990.
47. Quinn GP, Keough MJ. Experimental design and data analysis for biologists. 1st ed. Cambridge University Press; 2002.
48. Bolker BM, Brooks ME, Clark CJ, Geange SW, Poulsen JR, Stevens MHH, et al. Generalized linear mixed models: a practical guide for ecology and evolution. Trends Ecol Evol. 2009;24(3):127-35. https://doi.org/10.1016/j.tree.2008.10.008
49. Mas-Coma S, Bargues MD, Valero MA. Human fascioliasis infection sources, their diversity, incidence factors, analytical methods and prevention measures. Parasitol. 2018;145(13):1665-99. https://doi. org/10.1017/s0031182018000914
50. Mas-Coma S, Buchon P, Funatsu IR, Angles R, Artigas P, Valero MA, et al. Sheep and cattle reservoirs in the highest human fascioliasis hyperendemic area: experimental transmission capacity, field epidemiology, and control within a One Health Initiative in Bolivia. Front Vet Sci. 2020;7:583204. https://doi.org/10.3389/fvets.2020.583204 PMID: 33195605
51. Mas-Coma S, Buchon P, Funatsu IR, Angles R, Mas-Bargues C, Artigas P, et al. Donkey fascioliasis within a One Health control action: transmission capacity, field epidemiology, and reservoir role in a human hyperendemic area. Front Vet Sci. 2020;7:591384. https://doi.org/10.3389/fvets.2020.591384 PMID: 33251272
52. Mas-Coma S, Cafrune MM, Funatsu IR, Mangold AJ, Angles R, Buchon P, et al. Fascioliasis in Llama, Lama glama, in Andean Endemic Areas: experimental transmission capacity by the high altitude snail vector Galba truncatula and epidemiological analysis of its reservoir role. Animals. 2021;11(9):2693. https://doi.org/10.3390/ani11092693 PMID: 34573658
53. Mas-Coma S, Funatsu IR, Angles R, Buchon P, Mas-Bargues C, Artigas P, et al. Domestic pig prioritized in one health action against fascioliasis in human endemic areas: experimental assessment of
transmission capacity and epidemiological evaluation of reservoir role. One Health. 2021;13:100249. https://doi.org/10.1016/j.onehlt.2021.100249 PMID: 33997234
54. Bargues MD, Angles R, Coello J, Artigas P, Funatsu IR, Cuervo PF, et al. One Health initiative in the Bolivian Altiplano human fascioliasis hyperendemic area: Lymnaeid biology, population dynamics, microecology and climatic factor influences. Rev Bras Parasitol Vet. 2021;30(2):e025620. https://doi. org/10.1590/S1984-29612021014 PMID: 34076053
55. Kendall SB. The life story of Lymnaea truncatula under laboratory conditions. J Helminthol. 1953;27(1-2):17-28.
56. Pantelouris EM. Environmental influences on the life-cycle of the Liver-Fluke, Fasciola hepatica L. Ir Nat J. 1963;14(5):94-7. [cited 2024 Sept 6]. Available from: https://www.jstor.org/stable/25534881
57. Hodasi JK. The effects of low temperature on Lymnaea truncatula. Z Parasitenkd. 1976;48(3-4):2816. https://doi.org/10.1007/BF00380403 PMID: 1258528
58. Dube A, Kalinda C, Manyangadze T, Mindu T, Chimbari MJ. Effects of temperature on the life history traits of intermediate host snails of fascioliasis: a systematic review. PLoS Negl Trop Dis. 2023;17(12):e0011812. https://doi.org/10.1371/journal.pntd. 0011812 PMID: 38048345
59. Roche MA, Bourges J, Cortes J, Mattos R. Climatology and hydrology. In: Dejoux C, Iltis A, editors. Lake Titicaca. Monographiae Biologicae, vol 68. Dordrecht, Netherlands: Springer; 1992. p. 63-88. https://doi.org/10.1007/978-94-011-2406-5_4
60. Imfeld N, Sedlmeier K, Gubler S, Correa Marrou K, Davila CP, Huerta A, et al. A combined view on precipitation and temperature climatology and trends in the southern Andes of Peru. Int J Climatol. 2020;41(1):679-98. https://doi.org/10.1002/joc. 6645
61. Garreaud R, Vuille M, Clement AC. The climate of the Altiplano: observed current conditions and mechanisms of past changes. Palaeogeogr Palaeoclimatol Palaeoecol. 2003;194(1-3):5-22. https:// doi.org/10.1016/s0031-0182(03)00269-4
62. Kopec RJ. Continentality around the Great Lakes. Bull Am Meteorol Soc 1965;46(2):54-7. [cited 2024 Sept 6]. Available from: https://www.jstor.org/stable/26247810
63. Im H, Rathouz PJ, Frederick JE. Space-time modeling of 20 years of daily air temperature in the Chicago metropolitan region. Environmetrics. 2008;20(5):494-511. https://doi.org/10.1002/env. 940
64. Vuille M. Climate variability and high altitude temperature and precipitation. In: Singh VP, Singh P, Haritashya UK, editors. Encyclopedia of snow, ice and glaciers. Springer; 2011. p. 153-6.
65. Sappington JM, Longshore KM, Thompson DB. Quantifying landscape ruggedness for animal habitat analysis: a case study using bighorn sheep in the Mojave Desert. J Wildl Manag. 2007;71(5):1419-26. https://doi.org/10.2193/2005-723
66. Vuille M, Bradley RS, Keimig F. Interannual climate variability in the Central Andes and its relation to tropical Pacific and Atlantic forcing. J Geophys Res. 2000;105(D10):12447-60. https://doi. org/10.1029/2000jd900134
67. Rojas-Murillo K, Lupo AR, Garcia M, Gilles J, Korner A, Rivera MA. ENSO and PDO related interannual variability in the north and east-central part of the Bolivian Altiplano in South America. Int J Climatol. 2021;42(4):2413-39. https://doi.org/10.1002/joc. 7374
68. Jonaitis JA, Perry LB, Soulé PT, Thaxton C, Andrade-Flores MF, Vargas TI, et al. Spatiotemporal patterns of ENSO-precipitation relationships in the tropical Andes of southern Peru and Bolivia. Int J Climatol. 2021;41(8):4061-76. https://doi.org/10.1002/joc. 7058
69. Vuille M, Bradley RS, Keimig F. Climate variability in the Andes of Ecuador and its relation to tropical Pacific and Atlantic sea surface temperature anomalies. J Climate. 2000;13(14):2520-35. https://doi. org/10.1175/1520-0442(2000)013<2520:cvitao>2.0.co;2
70. Vicente-Serrano SM, Aguilar E, Martínez R, Martín-Hernández N, Azorin-Molina C, Sanchez-Lorenzo A, et al. The complex influence of ENSO on droughts in Ecuador. Clim Dyn. 2016;48(1-2):405-27. https://doi.org/10.1007/s00382-016-3082-y
71. Bargues MD, Malandrini JB, Artigas P, Soria CC, Velásquez JN, Carnevale S, et al. Human fascioliasis endemic areas in Argentina: multigene characterisation of the lymnaeid vectors and climatic-environmental assessment of the transmission pattern. Parasit Vectors. 2016;9(1):306. https:// doi.org/10.1186/s13071-016-1589-z PMID: 27229862
72. Cai W, Santoso A, Collins M, Dewitte B, Karamperidou C, Kug J-S, et al. Changing El Niño-Southern Oscillation in a warming climate. Nat Rev Earth Environ. 2021;2(9):628-44. https://doi.org/10.1038/ s43017-021-00199-z
- Sources
Georeferenced polygon of the Lake Titicaca extracted from HydroLAKES under CC BY 4.0 license (https://www. hydrosheds.org/products/hydrolakes) [44].
Georeferenced 3 arc second ( resolution) SRTM DEM from CGIAR-CSI under CC BY 4.0 license (https://csi-dotinfo.wordpress.com/data/srtm-90m-digital-elevation-database-v4-1/).
Georeferenced raster ( 1 km resolution) available for download and visualization at EarthEnv (https://www.earthenv. org/topography) under CC BY 3.0 license [45].
DOI: https://doi.org/10.1371/journal.pntd.0012820
PMID: https://pubmed.ncbi.nlm.nih.gov/39836654
Publication Date: 2025-01-21
Received: October 1, 2024
Accepted: December 30, 2024
Published: January 21, 2025
Copyright: © 2025 Cuervo et al. This is an open access article distributed under the terms of the Creative Commons Attribution License, which permits unrestricted use, distribution, and reproduction in any medium, provided the original author and source are credited.
Heterogeneous zonal impacts of climate change on a wide hyperendemic area of human and animal fascioliasis assessed within a One Health action for prevention and control
Abstract
The Northern Bolivian Altiplano is the fascioliasis endemic area where the highest prevalences and intensities in humans have been recorded. In this hyperendemic area of human fascioliasis, the disease is caused only by Fasciola hepatica and transmitted by Galba truncatula, the sole lymnaeid species present in the area. When analysing the link between global warning and the recently reported geographical spread of lymnaeid populations to out-border localities, a marked heterogeneous climatic change was found throughout the endemic area. The aim of the present study was to analyse the physiographical heterogeneity of the fascioliasis hyperendemic area in the Northern Bolivian Altiplano, in order to assess its repercussions in the implementation of a One Health action. We applied multivariate linear mixed models to analyse the influence of a number of physiographical features on the long-term variation of climate and of the risk of transmission. Despite its apparent physiographic homogeneity, the findings of this study revealed markedly heterogeneous climate characteristics throughout the endemic area. This irregular pattern is influenced by physiographical features such as altitude, inner hills, closeness to Lake Titicaca, and El Niño-Southern Oscillation. This is the broadest study ever performed in a human fascioliasis endemic area about the influence of physiography on climate. It highlights the importance of considering physiographical features, an aspect usually not considered in studies dealing with the influences of climate and climate change on human and animal fascioliasis. Moreover, it shows that an endemic area may climatically evolve differently in its various inner zones and emphasizes the need for continuous monitoring to assess whether control measures should be modified accordingly.
Author summary
1. Introduction
of yearly mass treatment campaigns [20,24] implemented through a multidisciplinary One Health action [19].
2. Methods
2.1. Study area
2.2. Climatic data
https://doi.org/10.1371/journal.pntd.0012820.g001
| Station | Department | Province | Geographical coordinates | Altitude | Time period |
| a. Ayo Ayo | La Paz | Aroma |
|
3888 | 1958-2020 |
| b. Chirapaca | La Paz | Los Andes |
|
3870 | 1991-2020 |
| c. Collana | La Paz | Aroma |
|
4500 | 1973-2020 |
| d. El Alto | La Paz | Murillo |
|
4071 | 1962-2020 |
| e. El Belén | La Paz | Omasuyos |
|
3833 | 1949-2017 |
| f. Hichucota | La Paz | Los Andes |
|
4460 | 1979-2020 |
| g. Huarina | La Paz | Omasuyos |
|
3838 | 1973-2011 |
| h. Huayrocondo | La Paz | Los Andes |
|
3875 | 1991-2020 |
| i. Laykacota | La Paz | Murillo |
|
3632 | 1945-2020 |
| j. Santiago de Huata | La Paz | Omasuyos |
|
3845 | 1985-2020 |
| k. Tiwanaku | La Paz | Ingavi |
|
3863 | 1973-2016 |
| 1. Viacha | La Paz | Ingavi |
|
3850 | 1965-2015 |
2.3. Climatic forecast indices
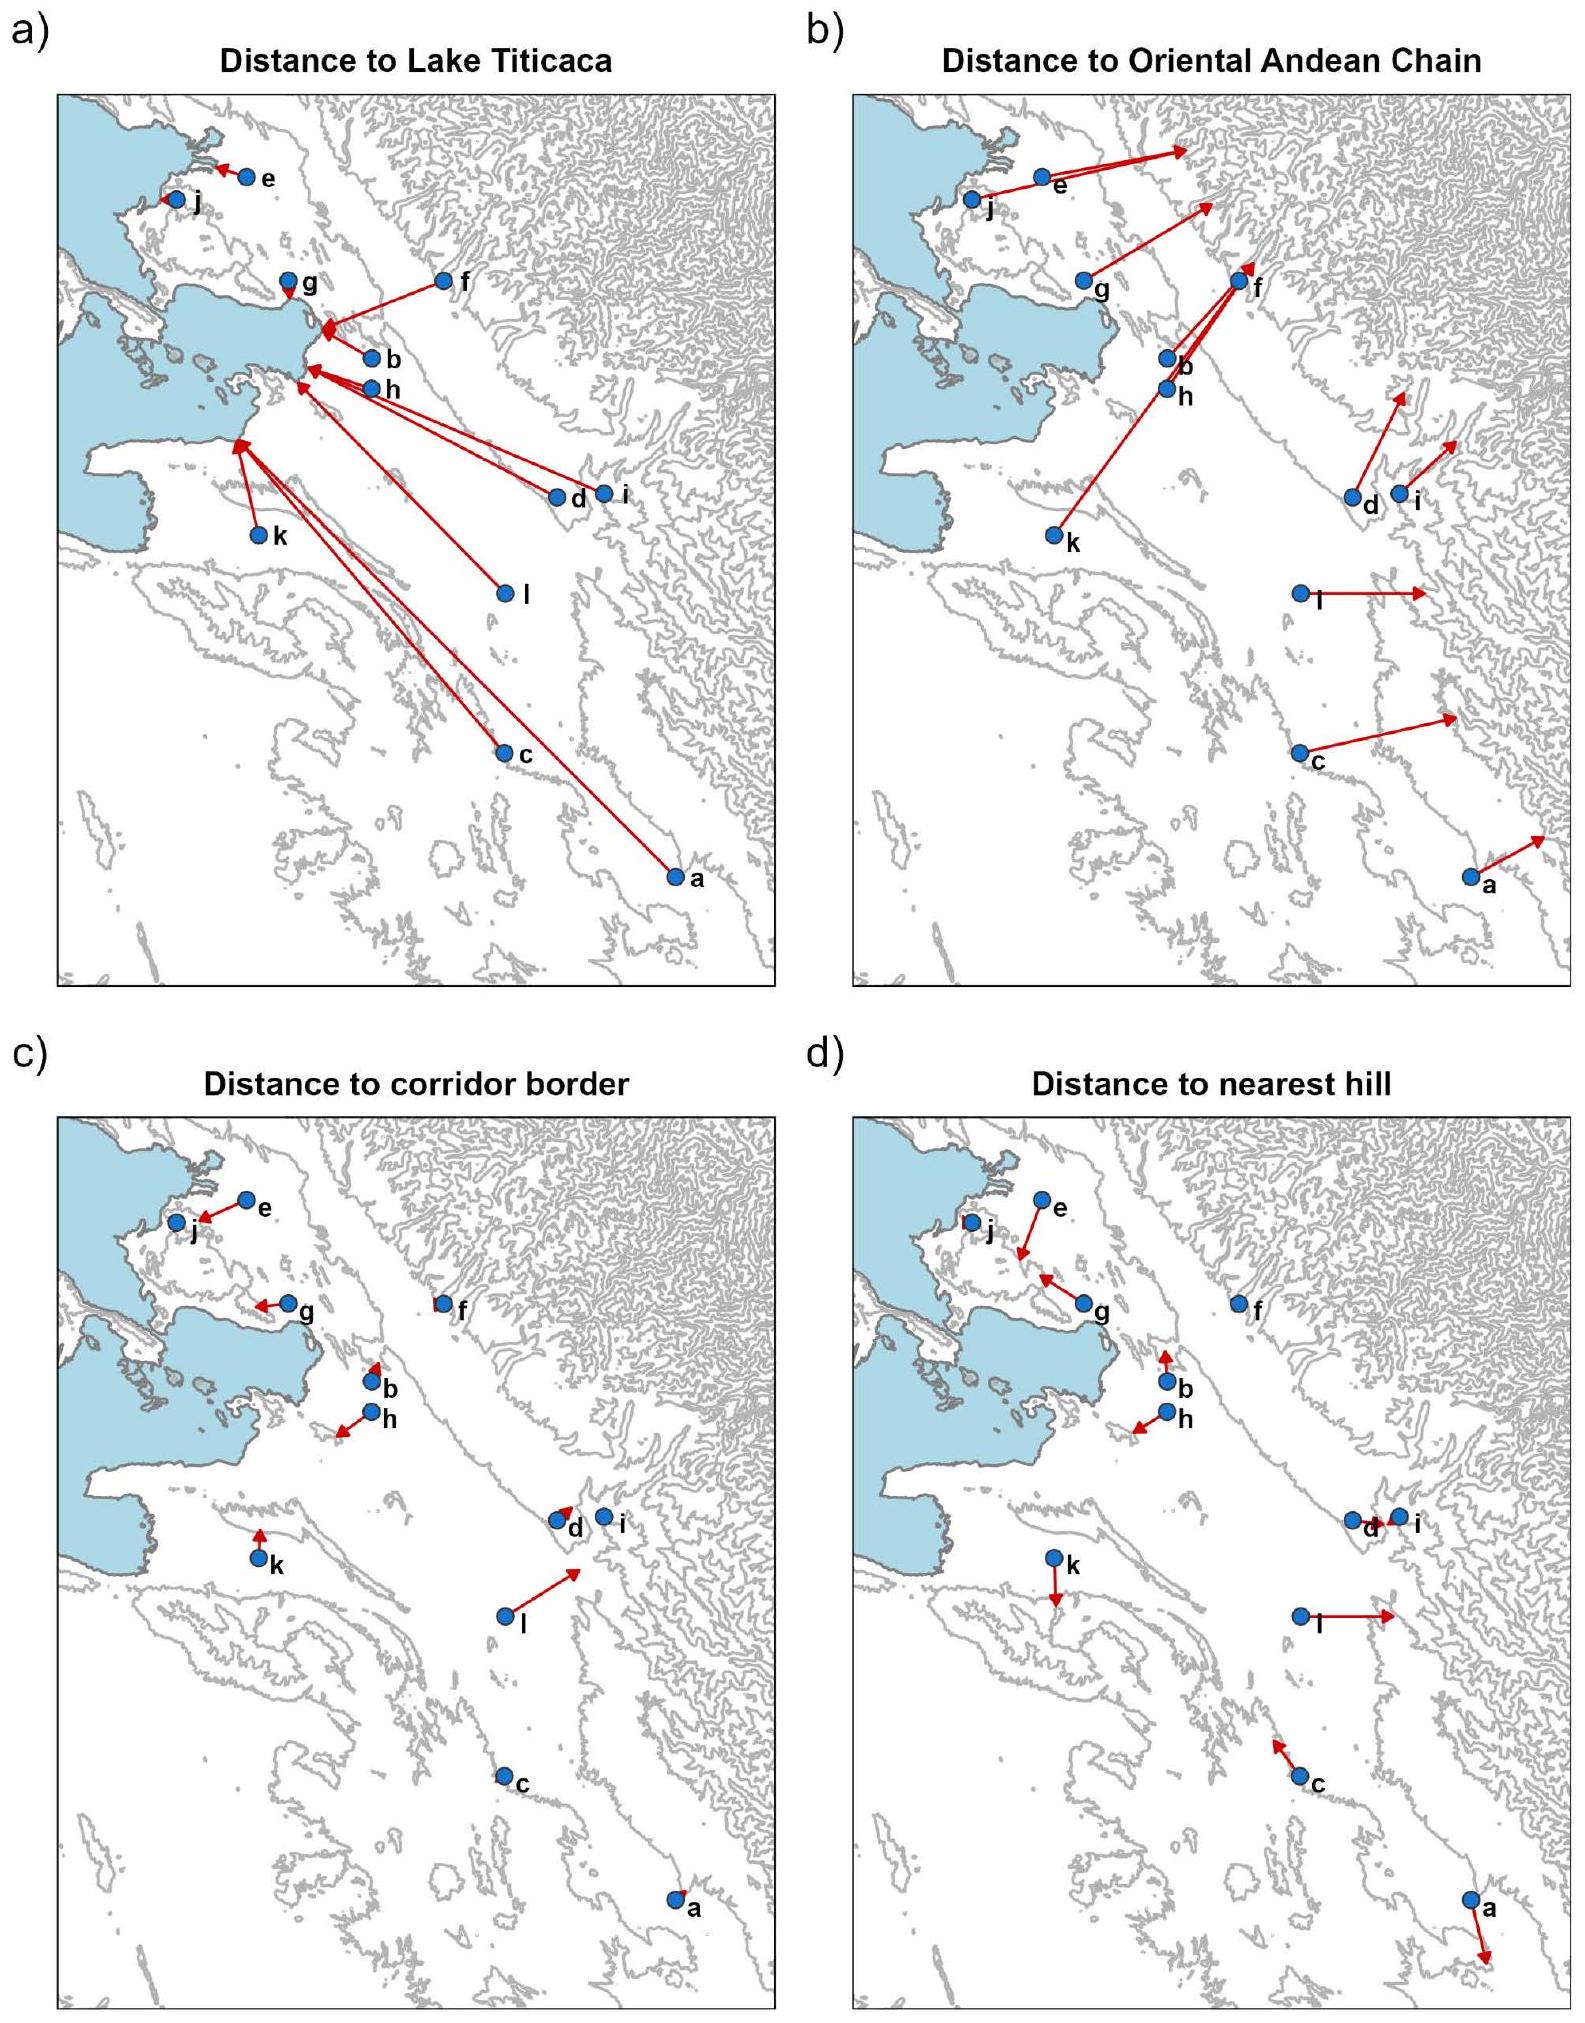
2.4. Analysis of the influence of physiographical features and El NiñoSouthern Oscillation (ENSO) on climatic factors and climatic forecast indices
| Acronym | Variable description | Processing procedure |
| dist2lake | Distance to Lake Titicaca | Shortest distance from meteorological station to polygon of the Lake Titicaca
|
| dist2contour | Distance to inter-hill corridor borders | Shortest distance from meteorological station to corridor borders, defined by contour lines derived from a Digital Elevation model (DEM)
|
| dist2slope | Distance to nearby hills | Shortest distance from meteorological station to areas with slope greater than
|
| dist2Andes | Distance to the steepest hillsides of the Oriental Andean Chain | Shortest distance from meteorological station to areas with slope greater than
|
| altitude | Elevation derived from different high resolution DEMs | Values extracted for each meteorological station from ‘elevation’ raster by bilinear sampling
|
| northness | Sine of the slope, multiplied by the cosine of the aspect, describing the orientation in combination with the slope | Values extracted for each meteorological station from ‘northness’ raster by bilinear sampling
|
| eastness | Sine of the slope, multiplied by the sine of the aspect, describing the orientation in combination with the slope | Values extracted for each meteorological station from ‘eastness’ raster by bilinear sampling
|
| VRM | Vector Ruggedness Measure (VRM) quantifies terrain ruggedness by measuring the dispersion of vectors orthogonal to the terrain surface | Values extracted for each meteorological station from ‘VRM’ raster by bilinear sampling
|
https://doi.org/10.1371/journal.pntd.0012820.g002
defined using two sinusoidal components (sine and cosine) to consider the presence of a seasonal pattern [46]. The nested random factor ”
2.5. Spatial and statistical analyses
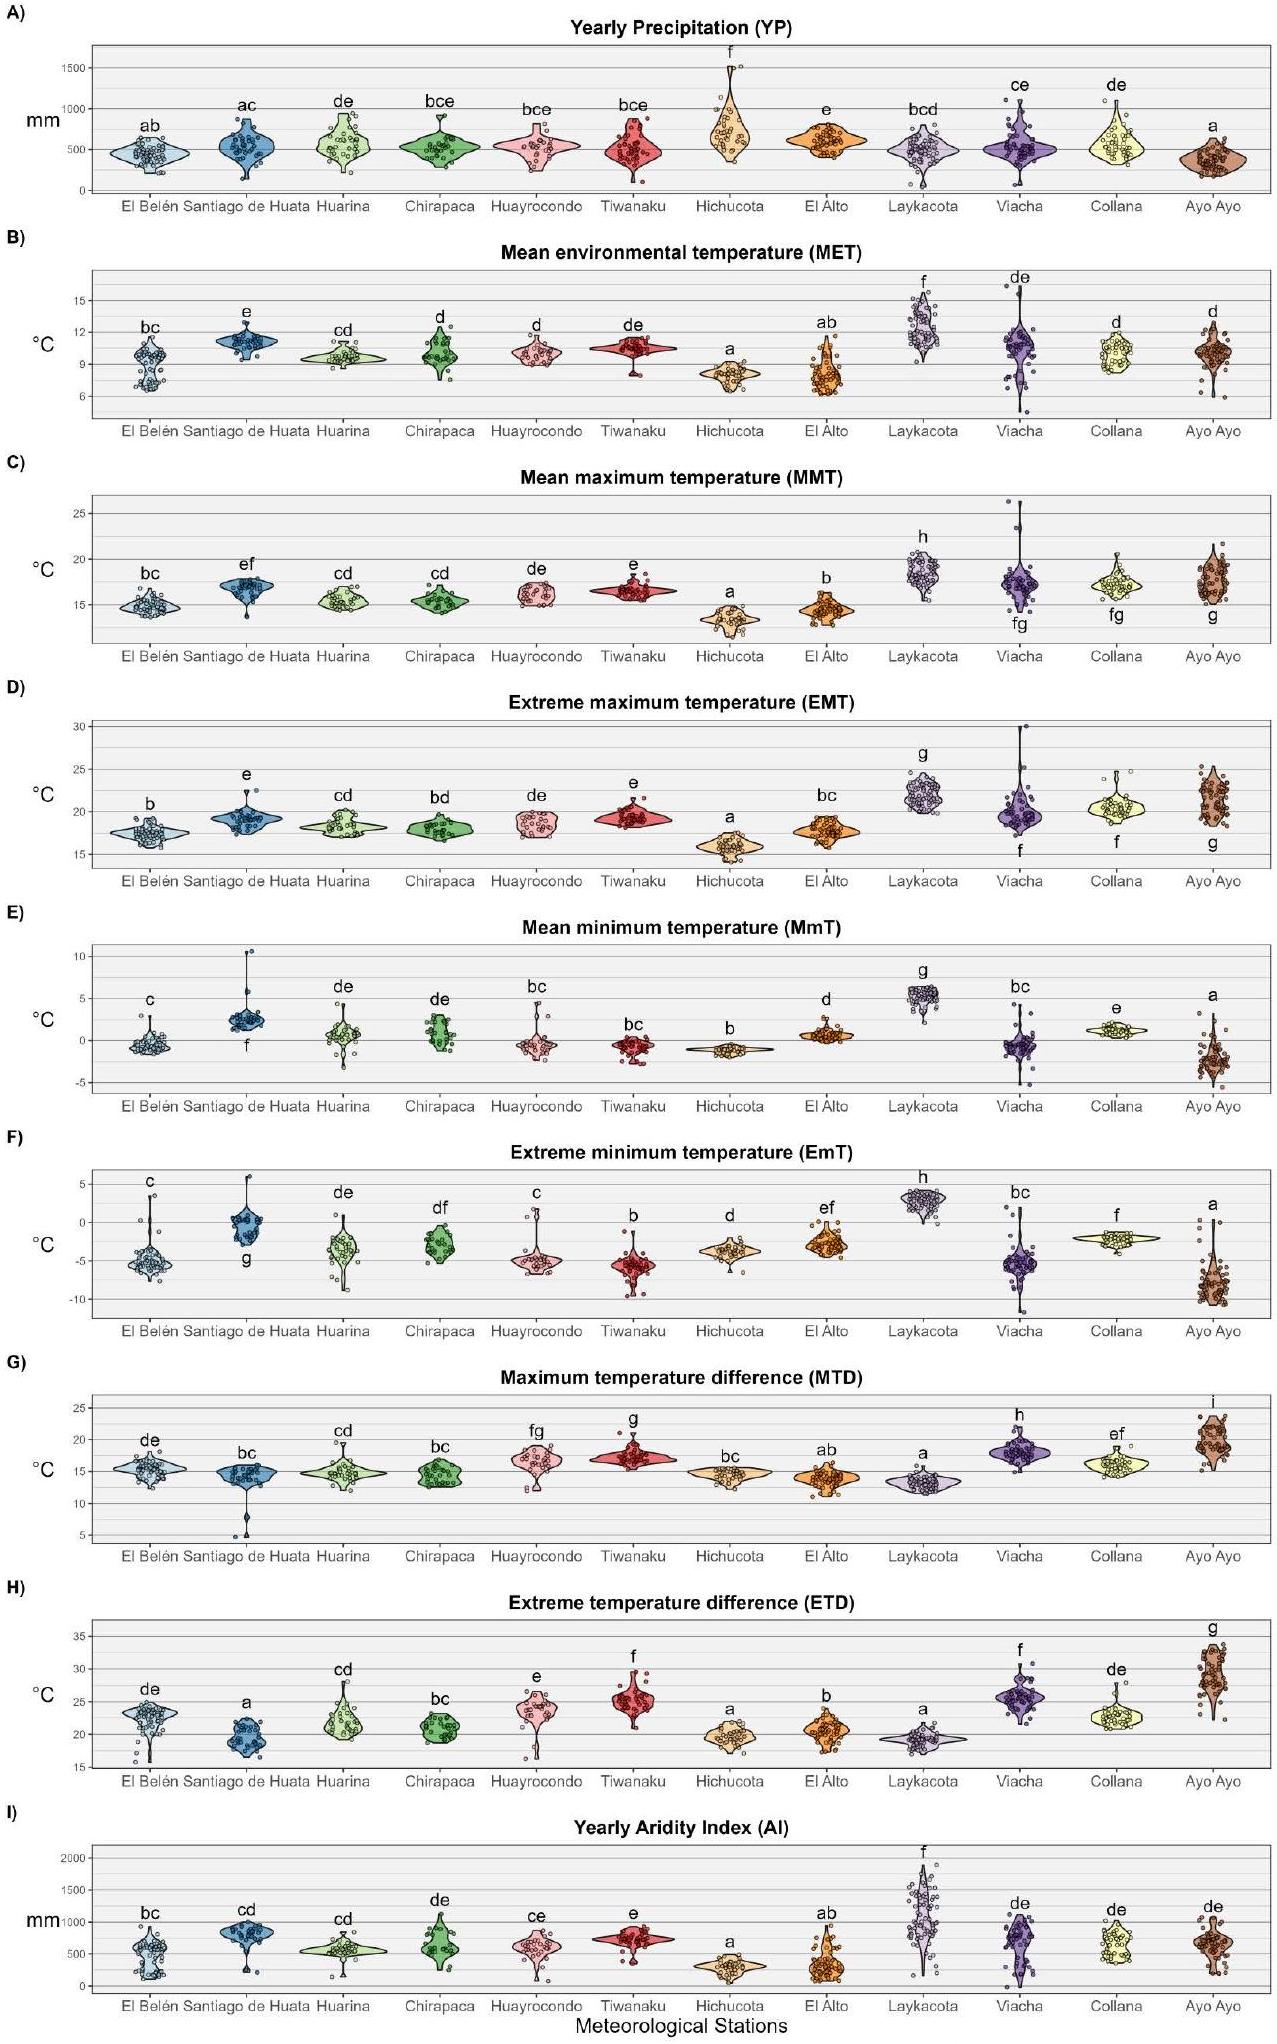
3. Results
| Variable | El Belén (1949-2017) | Santiago de Huata (1985-2020) | Huarina Cota Cota (1973-2011) | Chirapaca (1991-2020) | Huayrocondo (1991-2020) | Tiwanaku (1973-2016) |
| MET (
|
|
|
|
|
|
|
| MMT (
|
|
|
|
|
|
|
| MmT
|
|
|
|
|
|
|
| EMT (
|
|
|
|
|
|
|
| EmT (
|
|
|
|
|
|
|
| MTD (
|
|
|
|
|
|
|
| ETD (
|
|
|
|
|
|
|
| Pt (mm) |
|
|
|
|
|
|
| YP (mm) |
|
|
|
|
|
|
| MP (mm) |
|
|
|
|
|
|
| DP (days) |
|
|
|
|
|
|
| DF (days) |
|
|
|
|
|
|
| AI (mm) |
|
|
|
|
|
|
| Mt |
|
|
|
|
|
|
| Wb-bs |
|
|
|
|
|
|
| cumWb-bs |
|
|
|
|
|
|
| Variable | Hichucota (1979-2020) | El Alto (1962-2020) | Laykacota (1945-2020) | Viacha (1965-2015) | Collana (1973-2020) | Ayo Ayo (1958-2020) |
| MET (
|
|
|
|
|
|
|
| MMT (
|
|
|
|
|
|
|
|
|
|
|
|
|
|
|
| EMT (
|
|
|
|
|
|
|
| EmT (
|
|
|
|
|
|
|
| MTD (
|
|
|
|
|
|
|
| ETD (
|
|
|
|
|
|
|
| Pt (mm) |
|
|
|
|
|
|
| YP (mm) |
|
|
|
|
|
|
| MP (mm) |
|
|
|
|
|
|
| DP (days) |
|
|
|
|
|
|
| DF (days) |
|
|
|
|
|
|
| AI (mm) |
|
|
|
|
|
|
| Mt |
|
|
|
|
|
|
| Wb-bs |
|
|
|
|
|
|
| cumWb-bs |
|
|
|
|
|
|
Initial models
Model A: response variable $sim$ MEI + dist2lake + dist2contour + dist2Andes + eastness + northness + VRM + altitude + time $+cos ($ month $)+sin ($ month $)$
+ (1 + time | stationID)
Model B: response variable $sim$ MEI + dist2lake + dist2slope + dist2Andes + eastness + northness + VRM + altitude + time $+cos ($ month $)+sin ($ month $)$
+ (1 + time | stationID)

begin{tabular}{|l|l|l|}
hline Simplified models & AICc & Weights \
hline multicolumn{3}{|l|}{Precipitation model: Pt ~MEI + dist2lake + altitude + sin(month) + (1 + time | stationID)} \
hline multicolumn{3}{|l|}{MET models:} \
hline model A: MET ~ MEI + dist2lake + dist2contour + northness + altitude + time + cos(month) + sin(month) + ( 1 + time | stationID) & 26658 & 0.027 \
hline model B: MET ~ MEI + dist2lake + dist2slope + northness + altitude + time + cos(month) + sin(month) + (1 + time | stationID) & 26651 & 0.973 \
hline multicolumn{3}{|l|}{MMT models: $M M T sim$ MEI + dist2lake + northness + altitude + time + cos(month) + sin(month) + (1 + time | stationID)} \
hline multicolumn{3}{|l|}{MmT models:} \
hline model A: MmT ~ MEI + cos(month) + sin(month) + (1 + time | stationID) & 35734 & 0.131 \
hline model B: MmT ~ MEI + dist2slope + dist2Andes + northness + VRM + altitude + cos(month) + sin(month) + (1 + time | stationID) & 35730 & 0.869 \
hline multicolumn{3}{|l|}{MTD models:} \
hline model A: MTD ~ MEI + dist2lake + dist2contour + cos(month) + sin(month) + (1 + time | stationID) & 34605 & 0.067 \
hline model B: MTD ~ MEI + dist2slope + cos(month) + sin(month) + (1 + time | stationID) & 34599 & 0.933 \
hline multicolumn{3}{|l|}{AI models:} \
hline model A: AI~MEI + dist2lake + dist2contour + northness + altitude + time + cos(month) + sin(month) + ( 1 + time $mid$ stationID) & 63337 & 0.026 \
hline model B: AI~MEI + dist2lake + dist2slope + northness + altitude + time + cos(month) + sin(month) + ( 1 + time $mid$ stationID) & 63330 & 0.974 \
hline
end{tabular}
Mt model: $M t sim M E I+$ dist2lake + eastness $+V R M+$ altitude $+sin ($ month $)+(1+$ time $mid$ stationID $)$
Wb-bs model: $W b-b s sim M E I+$ dist2lake $+V R M+$ altitude $+cos ($ month $)+sin ($ month $)+(1+$ time $mid$ stationID $)$
https://doi.org/10.1371/journal.pntd.0012820.t004
https://doi.org/10.1371/journal.pntd.0012820.g003
| Initial models | ||
| Model A: response variable
|
||
| Model B: response variable
|
||
| Simplified models | AICc | Weights |
| Precipitation model: Pt
|
||
| MET models: | ||
| model A: MET ~ timeMEI + dist2lake + dist2contour + time dist2Andes + timeeastness + timenorthness + time*altitude + cos(month) + sin(month)
|
26650 | 0.032 |
| model B: MET ~ timeMEI + dist2lake + dist2slope + timedist2Andes + timeeastness + timenorthness + time*altitude + cos(month) + sin(month) + (1 + time | stationID) | 26643 | 0.968 |
| MMT models: | ||
| model A: MMT ~ timeMEI + dist2lake + time dist2contour + timeeastness + northness + timealtitude + cos(month) + sin(month) + (1 + time | stationID) | 22726 | 0.039 |
| model B: MMT ~ timeMEI + dist2lake + timedist2slope + timenorthness + timealtitude + cos(month) + sin(month) + ( 1 + time | stationID) | 22720 | 0.961 |
| MmT models: | ||
| model A: MmT ~ time*MEI + cos(month) + sin(month) + (1 + time | stationID) | 35698 | 0.120 |
| model B: MmT ~ time* MEI + dist2slope + dist2Andes + northness + VRM + altitude + cos(month) + sin(month) + ( 1 + time | stationID) | 35694 | 0.880 |
| MTD models: | ||
| model A: MTD ~ time*MEI + dist2lake + dist2contour + cos(month) + sin(month) + ( 1 + time | stationID) | 34589 | 0.070 |
| model B: MTD ~ time*MEI + dist2slope + cos(month) + sin(month) + ( 1 + time | stationID) | 34584 | 0.930 |
| AI models: | ||
| model A: AI ~ timeMEI + timedist2lake + dist2contour + timedist2Andes + timeeastness + timenorthness + timealtitude + cos(month) + sin(month) + (1 + time | stationID) | 63321 | 0.022 |
| model B: AI ~ timeMEI + timedist2lake + dist2slope + time* dist2Andes + timeeastness + timenorthness + time*altitude + cos(month) + sin(month)
|
63314 | 0.978 |
| Mt model: Mt
|
||
| Wb-bs models: | ||
| model A: Wb-bs
|
91511 | 0.236 |
| model B: Wb-bs
|
91509 | 0.764 |
https://doi.org/10.1371/journal.pntd.0012820.t005
proximity to minor hills nearby of the meteorological stations (Fig 4b and 4d), while temperature amplitude increased farther from the aforementioned elevations (Fig 4e). Temperature was positively associated with northness and negatively related with altitude (Fig 4b, 4c and 4d).
4. Discussion
Bolivian Altiplano [19]. In order to contribute to this multidisciplinary One Health action, the present study constitutes an unprecedented effort to analyse the influence of physiography on the long-term evolution of climatic factors and its impact on the transmission of fascioliasis, particularly focused on this high-altitude hyperendemic area.
4.1. Climatic factor seasonality
rely on precipitation, but largely on the availability of permanent water sources [ 17,54 ]. Thus, temperature seems to be a more relevant factor than precipitation. Indeed, when analysing the fascioliasis forecast indices (i.e., maximum monthly value and mean yearly values accumulated during an entire year), the transmission threshold is surpassed, and nearly duplicated, in almost every location, indicating that transmission is feasible throughout the entire year.
4.2. Distance from the Lake Titicaca
4.3. Closeness to nearest hills
4.4. Distance from the Oriental Andean Chain
4.5. Topographical features
4.6. Influence of El Niño-Southern Oscillation (ENSO)
lymnaeid populations. Thus, transmission foci may become concentrated facilitating the disease transmission because of the need for both humans and livestock to draw on the same, less numerous freshwater sources. Such a situation has already been described for human fascioliasis in Argentina [71]. Furthermore, given the presence of lymnaeids in conditions to ensure the fascioliasis transmission, the developmental stages of the liver fluke depending on environmental features will be likely favoured by increasing temperatures.
4.7. Influence of physiographical features on the long-term variation of climatic factors and climatic forecast indices
5. Concluding remarks
Acknowledgments
Author contributions
Data curation: Pablo Fernando Cuervo, Patricio Artigas.
Formal analysis: Pablo Fernando Cuervo.
Funding acquisition: Pablo Fernando Cuervo, María Dolores Bargues, Santiago Mas-Coma.
Supervision: María Dolores Bargues, Santiago Mas-Coma.
Writing – original draft: Pablo Fernando Cuervo.
Writing – review & editing: Pablo Fernando Cuervo, María Dolores Bargues, Patricio Artigas, Paola Buchon, Rene Angles, Santiago Mas-Coma.
References
- Hayward AD, Skuce PJ, McNeilly TN. The influence of liver fluke infection on production in sheep and cattle: a meta-analysis. Int J Parasitol. 2021;51(11):913-24. https://doi.org/10.1016/j.ijpara.2021.02.006 PMID: 33901437
- Van De N, Minh PN, Le TH, Dung DT, Duong TT, Tuan BV, et al. A multidisciplinary analysis of over 53,000 fascioliasis patients along the 1995-2019 countrywide spread in Vietnam defines a new epidemiological baseline for One Health approaches. One Health. 2024;19:100869. https://doi. org/10.1016/j.onehlt.2024.100869 PMID: 39220760
- Mas-Coma S, Bargues MD, Valero MA. Diagnosis of human fascioliasis by stool and blood techniques: update for the present global scenario. Parasitology. 2014;141(14):1918-46. https://doi. org/10.1017/S0031182014000869 PMID: 25077569
- Mas-Coma S, Agramunt VH, Valero MA. Neurological and ocular fascioliasis in humans. Adv Parasitol. 2014;84:27-149. https://doi.org/10.1016/B978-0-12-800099-1.00002-8 PMID: 24480313
- González-Miguel J, Valero MA, Reguera-Gomez M, Mas-Bargues C, Bargues MD, Simón F, et al. Numerous Fasciola plasminogen-binding proteins may underlie blood-brain barrier leakage and explain neurological disorder complexity and heterogeneity in the acute and chronic phases of human fascioliasis. Parasitology. 2019;146(3):284-98. https://doi.org/10.1017/S0031182018001464 PMID: 30246668
- Rondelaud D, Dreyfuss G, Vignoles P. Clinical and biological abnormalities in patients after fasciolosis treatment. Med Mal Infect. 2006;36(9):466-8. https://doi.org/10.1016/j.medmal.2006.07.018 PMID: 17030486
- Dalton JP, Robinson MW, Mulcahy G, O’Neill SM, Donnelly S. Immunomodulatory molecules of Fasciola hepatica: candidates for both vaccine and immunotherapeutic development. Vet Parasitol. 2013;195(3-4):272-85. https://doi.org/10.1016/j.vetpar.2013.04.008 PMID: 23623183
- Gironès N, Valero MA, García-Bodelón MA, Chico-Calero I, Punzón C, Fresno M, et al. Immune suppression in advanced chronic fascioliasis: an experimental study in a rat model. J Infect Dis. 2007;195(10):1504-12. https://doi.org/10.1086/514822 PMID: 17436231
- Aldridge A, O’Neill SM. Fasciola hepatica tegumental antigens induce anergic like T cells via dendritic cells in a mannose receptor dependent manner. Eur J Immunol. 2016; 46(5):1180-92. https://doi. org/10.1002/eji.201545905
- Esteban JG, Flores A, Aguirre C, Strauss W, Angles R, Mas-Coma S. Presence of very high prevalence and intensity of infection with Fasciola hepatica among Aymara children from the Northern Bolivian Altiplano. Acta Trop. 1997;66(1):1-14. https://doi.org/10.1016/s0001-706x(97)00669-4 PMID: 9177091
- Esteban JG, Flores A, Angles R, Strauss W, Aguirre C, Mas-Coma S. A population-based coprological study of human fascioliasis in a hyperendemic area of the Bolivian Altiplano. Trop Med Int Health. 1997;2(7):695-9. https://doi.org/10.1046/j.1365-3156.1997.d01-356.x PMID: 9270738
- Mas-Coma S. Human fascioliasis emergence risks in developed countries: from individual patients and small epidemics to climate and global change impacts. Enferm Infecc Microbiol Clin (Engl Ed). 2020;38(6):253-6. https://doi.org/10.1016/j.eimc.2020.01.014 PMID: 32107024
- World Health Organization. Sustaining the drive to overcome the global impact of neglected tropical diseases. Department of Control of Neglected Tropical Diseases. Geneva, Switzerland: World Health Organization; 2013 [cited 2024 Sept 6]. p. 128. Available from: https://iris.who.int/handle/10665/77950
- World Health Organization. Ending the neglect to attain the Sustainable Development Goals. A Road Map for Neglected Tropical Diseases 2021-2030. Geneva, Switzerland: World Health Organization; 2020 [cited 2024 Sept 6]. p. 1-47. Available from: https://iris.who.int/handle/10665/338565
- World Health Organization. Ending the neglect to attain the Sustainable Development Goals. One Health companion document to the Neglected Tropical Diseases Road Map 2021-2030. Draft for Public Consultation (updated 19 October 2021). Geneva, Switzerland: World Health Organization;
16. Hillyer GV, Soler de Galanes M, Rodriguez-Perez J, Bjorland J, Silva de Lagrava M, Ramirez Guzman S, et al. Use of the Falcon assay screening test-enzyme-linked immunosorbent assay (FAST-ELISA) and the enzyme-linked immunoelectrotransfer blot (EITB) to determine the prevalence of human fascioliasis in the Bolivian Altiplano. Am J Trop Med Hyg. 1992;46(5):603-9. https://doi.org/10.4269/ ajtmh.1992.46.603 PMID: 1599055
17. Mas-Coma S, Anglés R, Esteban JG, Bargues MD, Buchon P, Franken M, et al. The Northern Bolivian Altiplano: a region highly endemic for human fascioliasis. Trop Med Int Health. 1999;4(6):454-67. https://doi.org/10.1046/j.1365-3156.1999.00418.x PMID: 10444322
18. Esteban JG, Flores A, Angles R, Mas-Coma S. High endemicity of human fascioliasis between Lake Titicaca and La Paz valley, Bolivia. Trans R Soc Trop Med Hyg. 1999;93(2):151-6. https://doi. org/10.1016/s0035-9203(99)90289-4 PMID: 10450437
19. Mas-Coma S, Valero MA, Bargues MD. One Health for fascioliasis control in human endemic areas. Trends Parasitol. 2023;39(8):650-67. https://doi.org/10.1016/j.pt.2023.05.009 PMID: 37385922
20. Valero MA, Periago MV, Pérez-Crespo I, Angles R, Villegas F, Aguirre C, et al. Field evaluation of a coproantigen detection test for fascioliasis diagnosis and surveillance in human hyperendemic areas of Andean countries. PLoS Negl Trop Dis. 2012;6(9):e1812. https://doi.org/10.1371/journal. pntd. 0001812 PMID: 23029575
21. Mas-Coma S, Funatsu IR, Bargues MD. Fasciola hepatica and lymnaeid snails occurring at very high altitude in South America. Parasitology. 2001;123(Suppl 7):S115-27. https://doi.org/10.1017/ s0031182001008034 PMID: 11769277
22. Bargues MD, Artigas P, Angles R, Osca D, Duran P, Buchon P, et al. Genetic uniformity, geographical spread and anthropogenic habitat modifications of lymnaeid vectors found in a One Health initiative in the highest human fascioliasis hyperendemic of the Bolivian Altiplano. Parasit Vectors. 2020;13(1):171. https://doi.org/10.1186/s13071-020-04045-x PMID: 32252808
23. Mas-Coma S, Valero MA, Bargues MD. Human and animal fascioliasis: origins and worldwide evolving scenario. Clin Microbiol Rev. 2022;35(4):e0008819. https://doi.org/10.1128/cmr.00088-19 PMID: 36468877
24. Villegas F, Angles R, Barrientos R, Barrios G, Valero MA, Hamed K, et al. Administration of triclabendazole is safe and effective in controlling fascioliasis in an endemic community of the Bolivian Altiplano. PLoS Negl Trop Dis. 2012;6(8):e1720. https://doi.org/10.1371/journal.pntd. 0001720 PMID: 22880138
25. Cuervo PF, Bargues MD, Artigas P, Buchon P, Angles R, Mas-Coma S. Global warming induced spread of the highest human fascioliasis hyperendemic area. Parasit Vectors. 2024;17(1):434. https:// doi.org/10.1186/s13071-024-06514-z PMID: 39434158
26. López-Moreno JI, Morán-Tejeda E, Vicente-Serrano SM, Bazo J, Azorin-Molina C, Revuelto J, et al. Recent temperature variability and change in the Altiplano of Bolivia and Peru. Int J Climatol. 2015;36(4):1773-96. https://doi.org/10.1002/joc. 4459
27. Angles R, Buchon P, Valero MA, Bargues MD, Mas-Coma S. One health action against human fascioliasis in the bolivian altiplano: food, water, housing, behavioural traditions, social aspects, and livestock management linked to disease transmission and infection sources. Int J Environ Res Public Health. 2022;19(3):1120. https://doi.org/10.3390/ijerph19031120 PMID: 35162146
28. Fuentes MV, Valero MA, Bargues MD, Esteban JG, Angles R, Mas-Coma S. Analysis of climatic data and forecast indices for human fascioliasis at very high altitude. Ann Trop Med Parasitol. 1999;93(8):835-50. https://doi.org/10.1080/00034983.1999.11813491
29. Hintze JL, Nelson RD. Violin plots: a box plot-density trace synergism. Am Statist. 1998;52(2):181-4. https://doi.org/10.1080/00031305.1998.10480559
30. Mas-Coma S, Valero MA, Bargues MD. Effects of climate change on animal and zoonotic helminthiases. Rev Sci Tech Off Int Epizoot 2008;27(2):443-57. https://doi.org/10.20506/rst.27.2.1822
31. Mas-Coma S, Valero MA, Bargues MD. Climate change effects on trematodiases, with emphasis on zoonotic fascioliasis and schistosomiasis. Vet Parasitol. 2009;163(4):264-80. https://doi.org/10.1016/j. vetpar.2009.03.024 PMID: 19375233
32. Ollerenshaw CB, Rowlands WT. A method of forecasting the incidence of fascioliasis in Anglesey. Vet Rec. 1959;71:591-8.
33. Ollerenshaw CB. Quelques aspects des relations entre le climat et l’incidence de la fasciolose en Europe. Cah Med Vet. 1971;40:303-19.
34. Ollerenshaw CB. A comment on the epidemiology of Fasciola hepatica in Italy. Ann Fac Med Veterin Torino. 1973;20:83-121.
35. Malone JB, Williams TE, Muller RA, Geaghan JP, Loyacano AF. Fascioliasis in cattle in Louisiana: development of a system to predict disease risk by climate, using the Thornthwaite water budget. Am J Vet Res. 1987;48(7):1167-70. PMID: 3631704
36. Malone JB, Gommes R, Hansen J, Yilma JM, Slingenberg J, Snijders F, et al. A geographic information system on the potential distribution and abundance of Fasciola hepatica and F. gigantica in east Africa based on Food and Agriculture Organization databases. Vet Parasitol. 1998;78(2):87-101. https://doi.org/10.1016/s0304-4017(98)00137-x PMID: 9735915
37. Kendall S, McCullough F. The emergence of the cercariae of Fasciola hepatica from the snail Limnaea truncatula. J Helminthol. 1951;25(1-2):77-92.
38. Leimbacher F. Ecology and control of parasite stages in external environment. III. An ecological approach to the control of fascioliasis in France. In: Slusarski W, editor. Review of advances in parasitology. Polish Scientific Publishers; 1981. p. 531-8.
39. Schreiber D. A comparative examination of threshold values for dry months, taking the situation of Kenya as an example. Appl Geogr Dev. 1981;17:29-45.
40. Fuentes M, Malone J. Development of a forecast system for fasciolosis in central Chile using remote sensing and climatic data in a geographic information system. Res Rev Parasitol. 1999;59(3-4):129-34.
41. Afshan K, Fortes-Lima CA, Artigas P, Valero AM, Qayyum M, Mas-Coma S. Impact of climate change and man-made irrigation systems on the transmission risk, long-term trend and seasonality of human and animal fascioliasis in Pakistan. Geospat Health. 2014;8(2):317-34. https://doi.org/10.4081/ gh.2014.22 PMID: 24893010
42. Yilma JM, Malone JB. A geographic information system forecast model for strategic control of fasciolosis in Ethiopia. Vet Parasitol. 1998;78(2):103-27. https://doi.org/10.1016/s0304-4017(98)00136-8 PMID: 9735916
43. Mazzarella A, Giuliacci A, Liritzis I. On the 60-month cycle of multivariate ENSO index. Theor Appl Climatol. 2009;100(1-2):23-7. https://doi.org/10.1007/s00704-009-0159-0
44. Messager ML, Lehner B, Grill G, Nedeva I, Schmitt O. Estimating the volume and age of water stored in global lakes using a geo-statistical approach. Nat Commun. 2016;7:13603. https://doi.org/10.1038/ ncomms13603 PMID: 27976671
45. Amatulli G, Domisch S, Tuanmu M-N, Parmentier B, Ranipeta A, Malczyk J, et al. A suite of global, cross-scale topographic variables for environmental and biodiversity modeling. Sci Data. 2018;5:180040. https://doi.org/10.1038/sdata.2018.40 PMID: 29557978
46. Diggle P. Time series: a biostatistical introduction. Oxford, UK: Clarendon Press; 1990.
47. Quinn GP, Keough MJ. Experimental design and data analysis for biologists. 1st ed. Cambridge University Press; 2002.
48. Bolker BM, Brooks ME, Clark CJ, Geange SW, Poulsen JR, Stevens MHH, et al. Generalized linear mixed models: a practical guide for ecology and evolution. Trends Ecol Evol. 2009;24(3):127-35. https://doi.org/10.1016/j.tree.2008.10.008
49. Mas-Coma S, Bargues MD, Valero MA. Human fascioliasis infection sources, their diversity, incidence factors, analytical methods and prevention measures. Parasitol. 2018;145(13):1665-99. https://doi. org/10.1017/s0031182018000914
50. Mas-Coma S, Buchon P, Funatsu IR, Angles R, Artigas P, Valero MA, et al. Sheep and cattle reservoirs in the highest human fascioliasis hyperendemic area: experimental transmission capacity, field epidemiology, and control within a One Health Initiative in Bolivia. Front Vet Sci. 2020;7:583204. https://doi.org/10.3389/fvets.2020.583204 PMID: 33195605
51. Mas-Coma S, Buchon P, Funatsu IR, Angles R, Mas-Bargues C, Artigas P, et al. Donkey fascioliasis within a One Health control action: transmission capacity, field epidemiology, and reservoir role in a human hyperendemic area. Front Vet Sci. 2020;7:591384. https://doi.org/10.3389/fvets.2020.591384 PMID: 33251272
52. Mas-Coma S, Cafrune MM, Funatsu IR, Mangold AJ, Angles R, Buchon P, et al. Fascioliasis in Llama, Lama glama, in Andean Endemic Areas: experimental transmission capacity by the high altitude snail vector Galba truncatula and epidemiological analysis of its reservoir role. Animals. 2021;11(9):2693. https://doi.org/10.3390/ani11092693 PMID: 34573658
53. Mas-Coma S, Funatsu IR, Angles R, Buchon P, Mas-Bargues C, Artigas P, et al. Domestic pig prioritized in one health action against fascioliasis in human endemic areas: experimental assessment of
transmission capacity and epidemiological evaluation of reservoir role. One Health. 2021;13:100249. https://doi.org/10.1016/j.onehlt.2021.100249 PMID: 33997234
54. Bargues MD, Angles R, Coello J, Artigas P, Funatsu IR, Cuervo PF, et al. One Health initiative in the Bolivian Altiplano human fascioliasis hyperendemic area: Lymnaeid biology, population dynamics, microecology and climatic factor influences. Rev Bras Parasitol Vet. 2021;30(2):e025620. https://doi. org/10.1590/S1984-29612021014 PMID: 34076053
55. Kendall SB. The life story of Lymnaea truncatula under laboratory conditions. J Helminthol. 1953;27(1-2):17-28.
56. Pantelouris EM. Environmental influences on the life-cycle of the Liver-Fluke, Fasciola hepatica L. Ir Nat J. 1963;14(5):94-7. [cited 2024 Sept 6]. Available from: https://www.jstor.org/stable/25534881
57. Hodasi JK. The effects of low temperature on Lymnaea truncatula. Z Parasitenkd. 1976;48(3-4):2816. https://doi.org/10.1007/BF00380403 PMID: 1258528
58. Dube A, Kalinda C, Manyangadze T, Mindu T, Chimbari MJ. Effects of temperature on the life history traits of intermediate host snails of fascioliasis: a systematic review. PLoS Negl Trop Dis. 2023;17(12):e0011812. https://doi.org/10.1371/journal.pntd. 0011812 PMID: 38048345
59. Roche MA, Bourges J, Cortes J, Mattos R. Climatology and hydrology. In: Dejoux C, Iltis A, editors. Lake Titicaca. Monographiae Biologicae, vol 68. Dordrecht, Netherlands: Springer; 1992. p. 63-88. https://doi.org/10.1007/978-94-011-2406-5_4
60. Imfeld N, Sedlmeier K, Gubler S, Correa Marrou K, Davila CP, Huerta A, et al. A combined view on precipitation and temperature climatology and trends in the southern Andes of Peru. Int J Climatol. 2020;41(1):679-98. https://doi.org/10.1002/joc. 6645
61. Garreaud R, Vuille M, Clement AC. The climate of the Altiplano: observed current conditions and mechanisms of past changes. Palaeogeogr Palaeoclimatol Palaeoecol. 2003;194(1-3):5-22. https:// doi.org/10.1016/s0031-0182(03)00269-4
62. Kopec RJ. Continentality around the Great Lakes. Bull Am Meteorol Soc 1965;46(2):54-7. [cited 2024 Sept 6]. Available from: https://www.jstor.org/stable/26247810
63. Im H, Rathouz PJ, Frederick JE. Space-time modeling of 20 years of daily air temperature in the Chicago metropolitan region. Environmetrics. 2008;20(5):494-511. https://doi.org/10.1002/env. 940
64. Vuille M. Climate variability and high altitude temperature and precipitation. In: Singh VP, Singh P, Haritashya UK, editors. Encyclopedia of snow, ice and glaciers. Springer; 2011. p. 153-6.
65. Sappington JM, Longshore KM, Thompson DB. Quantifying landscape ruggedness for animal habitat analysis: a case study using bighorn sheep in the Mojave Desert. J Wildl Manag. 2007;71(5):1419-26. https://doi.org/10.2193/2005-723
66. Vuille M, Bradley RS, Keimig F. Interannual climate variability in the Central Andes and its relation to tropical Pacific and Atlantic forcing. J Geophys Res. 2000;105(D10):12447-60. https://doi. org/10.1029/2000jd900134
67. Rojas-Murillo K, Lupo AR, Garcia M, Gilles J, Korner A, Rivera MA. ENSO and PDO related interannual variability in the north and east-central part of the Bolivian Altiplano in South America. Int J Climatol. 2021;42(4):2413-39. https://doi.org/10.1002/joc. 7374
68. Jonaitis JA, Perry LB, Soulé PT, Thaxton C, Andrade-Flores MF, Vargas TI, et al. Spatiotemporal patterns of ENSO-precipitation relationships in the tropical Andes of southern Peru and Bolivia. Int J Climatol. 2021;41(8):4061-76. https://doi.org/10.1002/joc. 7058
69. Vuille M, Bradley RS, Keimig F. Climate variability in the Andes of Ecuador and its relation to tropical Pacific and Atlantic sea surface temperature anomalies. J Climate. 2000;13(14):2520-35. https://doi. org/10.1175/1520-0442(2000)013<2520:cvitao>2.0.co;2
70. Vicente-Serrano SM, Aguilar E, Martínez R, Martín-Hernández N, Azorin-Molina C, Sanchez-Lorenzo A, et al. The complex influence of ENSO on droughts in Ecuador. Clim Dyn. 2016;48(1-2):405-27. https://doi.org/10.1007/s00382-016-3082-y
71. Bargues MD, Malandrini JB, Artigas P, Soria CC, Velásquez JN, Carnevale S, et al. Human fascioliasis endemic areas in Argentina: multigene characterisation of the lymnaeid vectors and climatic-environmental assessment of the transmission pattern. Parasit Vectors. 2016;9(1):306. https:// doi.org/10.1186/s13071-016-1589-z PMID: 27229862
72. Cai W, Santoso A, Collins M, Dewitte B, Karamperidou C, Kug J-S, et al. Changing El Niño-Southern Oscillation in a warming climate. Nat Rev Earth Environ. 2021;2(9):628-44. https://doi.org/10.1038/ s43017-021-00199-z
- Sources
Georeferenced polygon of the Lake Titicaca extracted from HydroLAKES under CC BY 4.0 license (https://www. hydrosheds.org/products/hydrolakes) [44].
Georeferenced 3 arc second ( resolution) SRTM DEM from CGIAR-CSI under CC BY 4.0 license (https://csi-dotinfo.wordpress.com/data/srtm-90m-digital-elevation-database-v4-1/).
Georeferenced raster ( 1 km resolution) available for download and visualization at EarthEnv (https://www.earthenv. org/topography) under CC BY 3.0 license [45].