التشريح المنهجي لبيئات الخلايا المفردة بين الأورام الطبيعية عبر ألف ورم من 30 نوعًا من السرطان Systematic dissection of tumor-normal single-cell ecosystems across a thousand tumors of 30 cancer types
تعقيد بيئة الورم الدقيقة يطرح تحديات كبيرة في علاج السرطان. هنا، للتحقيق بشكل شامل في النظم البيئية للورم والطبيعي، نقوم بإجراء تحليل تكاملي لـ 4.9 مليون ترانسكريبتوم أحادي الخلية من 1070 عينة ورمية و493 عينة طبيعية، بالاشتراك مع 137 ترانسكريبتوم مكاني شامل للسرطان، و8887 من TCGA، و1261 ورم معالج بمثبطات نقاط التفتيش. نحن نحدد مجموعة متنوعة من حالات الخلايا التي تشكل النظم البيئية للورم والطبيعي، كما نحدد أيضًا توقيعات جينية مميزة عبر أنواع الخلايا المختلفة والأعضاء. يميز أطلسنا الفروق بين الألياف الالتهابية المميزة بـ AKR1C1 أو WNT5A من حيث التفاعلات الخلوية وأنماط التوضع المكاني المشترك. يكشف تحليل التواجد المشترك عن حالات مجتمعية غنية بالإنترفيرون تشمل مكونات الهيكل اللمفاوي الثالث (TLS)، والتي تظهر إعادة توصيل مختلفة بين الأنسجة الورمية، والأنسجة الطبيعية المجاورة، والأنسجة الطبيعية الصحية. يتم التحقق من الاستجابة الإيجابية لحالات المجتمع الغنية بالإنترفيرون للعلاج المناعي باستخدام سرطانات معالجة بالعلاج المناعي. ) بما في ذلك مجموعة مرضى سرطان الرئة لدينا ( تقوم عملية فك الالتواء للترانسكريبتومات المكانية بتمييز أنواع الخلايا الغنية بـ TLS عن الأنواع غير الغنية بين المكونات المواتية للعلاج المناعي. يوفر تحليلنا المنهجي للأنظمة البيئية للورم والطبيعي فهماً أعمق للتنوع بين الأورام وداخلها.
الأورام هي كيانات متغايرة للغاية تتكون من خلايا خبيثة وخلايا سدى ومناعة متنوعة تت infiltrate الأنسجة، والتي تشكل بيئة الورم الدقيقة (TME).لقد وفرت تقنيات تسلسل RNA أحادي الخلية (scRNA-seq) معلومات غير متحيزة و التحليل الجزيئي المنهجي للتوصيف عالي الدقة للتنوع الواسع المدمج في البيئة المجاورة للورم.
التنوع الجزيئي والخلوى داخل البيئة المجهرية للورم يؤثر بشكل جماعي على جوانب مختلفة من الأورام، بما في ذلك التقدم، والنقائل،
استجابة العلاجمع تزايد الأدلة على التباين داخل الورم وبين الأورام، تُبذل محاولات مختلفة لتجميع توقيعات جينية متوافقة على مستوى السرطان الشامل. على سبيل المثال، تم نشر أطلس شامل للسرطان للخلايا التائية، والخلايا النخاعية، والخلايا الخبيثة مؤخرًا.على الرغم من أن هذه التحليلات الشاملة للسرطان تصف بشكل جيد أنواع الخلايا المعنية، إلا أن التفاعلات المعقدة بين مكونات البيئة المجاورة للورم والاختلافات عن الأنسجة الطبيعية المقابلة لم يتم تقديرها بالكامل بعد، مما أدى إلى منظور محدود لتنوع الأورام، مع تجاهل أو تبسيط محتمل للتفاعلات الجزيئية والخلوية الهامة. في الواقع، فإن أنماط البيئة المجاورة للورم ليست ببساطة ثنائية بين مضادة للورم أو مؤيدة للورم، بل تمثل تنظيمات خلوية تفاعلية أو نظم بيئية.استهداف التفاعلات المحددة للأورام التي تكمن وراء نظم الأورام يمثل استراتيجية جذابة يمكن أن تحقق تأثيرات علاجية تآزرية.لذلك، من الضروري تحليل النظم البيئية المعقدة والمتعددة الطبقات عبر أنواع السرطان والأنسجة المختلفة لتطوير استراتيجيات علاجية أكثر كفاءة.
لقد ظهرت العلاجات المناعية للسرطان المعتمدة على حجب نقاط التفتيش كاستراتيجية علاجية واعدة لها تأثير عميق على علاج السرطان. ومع ذلك، فإن الطبيعة المتنوعة لبيئات الأورام تمثل أحد التحديات الرئيسية المتبقية، وهو الفعالية المتفاوتة لمثبطات نقاط التفتيش عبر أنواع السرطان والمرضى.أظهرت الدراسات الحديثة توقيعات الإنترفيرون وبنية الأنسجة اللمفاوية الثلاثية (TLS)، وهي تجمع غير طبيعي من خلايا المناعة ذات بنية شبيهة باللمفاوية، كعامل رئيسي في تحديد الاستجابات للعلاج المناعي.ومع ذلك، لا يزال الفهم التفصيلي للمكونات المواتية للعلاج المناعي المرتبطة بـ TLS بعيد المنال. لذلك، من الضروري إجراء تحليل شامل لجميع أنواع السرطان لبيئات الأورام لتمييز أنواع الخلايا الغنية بـ TLS وغير الغنية بها التي تمنح استجابات مواتية للعلاج المناعي، وتوضيح الآليات التي تشكل من خلالها هذه المكونات مناعة الورم، وفك التفاعلات بينها. ستتيح لنا هذه الرؤى فهمًا أفضل للاستجابة المختلفة للعلاج المناعي التي لوحظت لدى مرضى أنواع السرطان المتنوعة.
هنا، نقوم بإنشاء أطلس غير مرتب للتعبير الجيني على مستوى الخلية الواحدة بين الأورام والأنسجة الطبيعية يغطي 30 نوعًا من السرطان و4.9 مليون خلية من 1070 ورمًا و493 عينة طبيعية. تتضمن تحليلاتنا أساليب تحليل متنوعة بما في ذلك خوارزمية AND-gating والتصور باستخدام تحليل المصفوفة غير السلبية (NMF) بدقة الخلية الواحدة لكشف الفروق بين النظم البيئية للأورام والأنسجة الطبيعية. نحدد بصمات جينية مميزة عبر أنواع الخلايا والأعضاء المختلفة. تكشف تحليلاتنا عن تباين الألياف الالتهابية، بما في ذلك CXCL1/3/8 التي تعبر عن AKR1C1 وWNT5A.الألياف الالتهابية، التي تظهر تخصيصات عضوية مميزة، وتفضيلات نسيجية، وتفاعلات خلوية، وأنماط تواجد مكاني متزامن. من خلال تحليل أنماط التواجد المتزامن لحالات الخلايا، اكتشفنا إعادة توصيل محددة للأورام لمجتمع غني بالإنترفيرون والذي يتضمن مكونات TLS بما في ذلك CCL19.الخلايا الليفية و LAMP3DC التي تحمل دلالة سريرية مميزة في مجموعات العلاج المناعي )، بما في ذلك مجموعة سرطان الرئة (LC) الخاصة بنا ( ). علاوة على ذلك، نقوم بتصنيف أنواع الخلايا الغنية في TLS وتلك التي ليست ضمن طيف المكونات المواتية للعلاج المناعي باستخدام تحليل النسخ الجزيئي المكاني ونستخلص توقيع TLS الذي يتنبأ بالاستجابات المواتية للعلاج المناعي. باختصار، يوفر أطلسنا الشامل للسرطان رؤى أعمق حول النظم البيئية للأورام والطبيعية ويعمل كمورد قيم لتطوير استراتيجيات التشخيص والعلاج. لقد قمنا بإيداع مجموعات البيانات التي تم تحليلها بشكل شامل في مستودع زينودو (DOI:10.5281/zenodo.10651059) ويمكن تصور أطلسنا بشكل تفاعلي في https://cellatlas.kaist.ac.kr/ecosystem/.
النتائج
بناء أطلس ميتا خلوية فردية للأورام الطبيعية عبر جميع أنواع السرطان
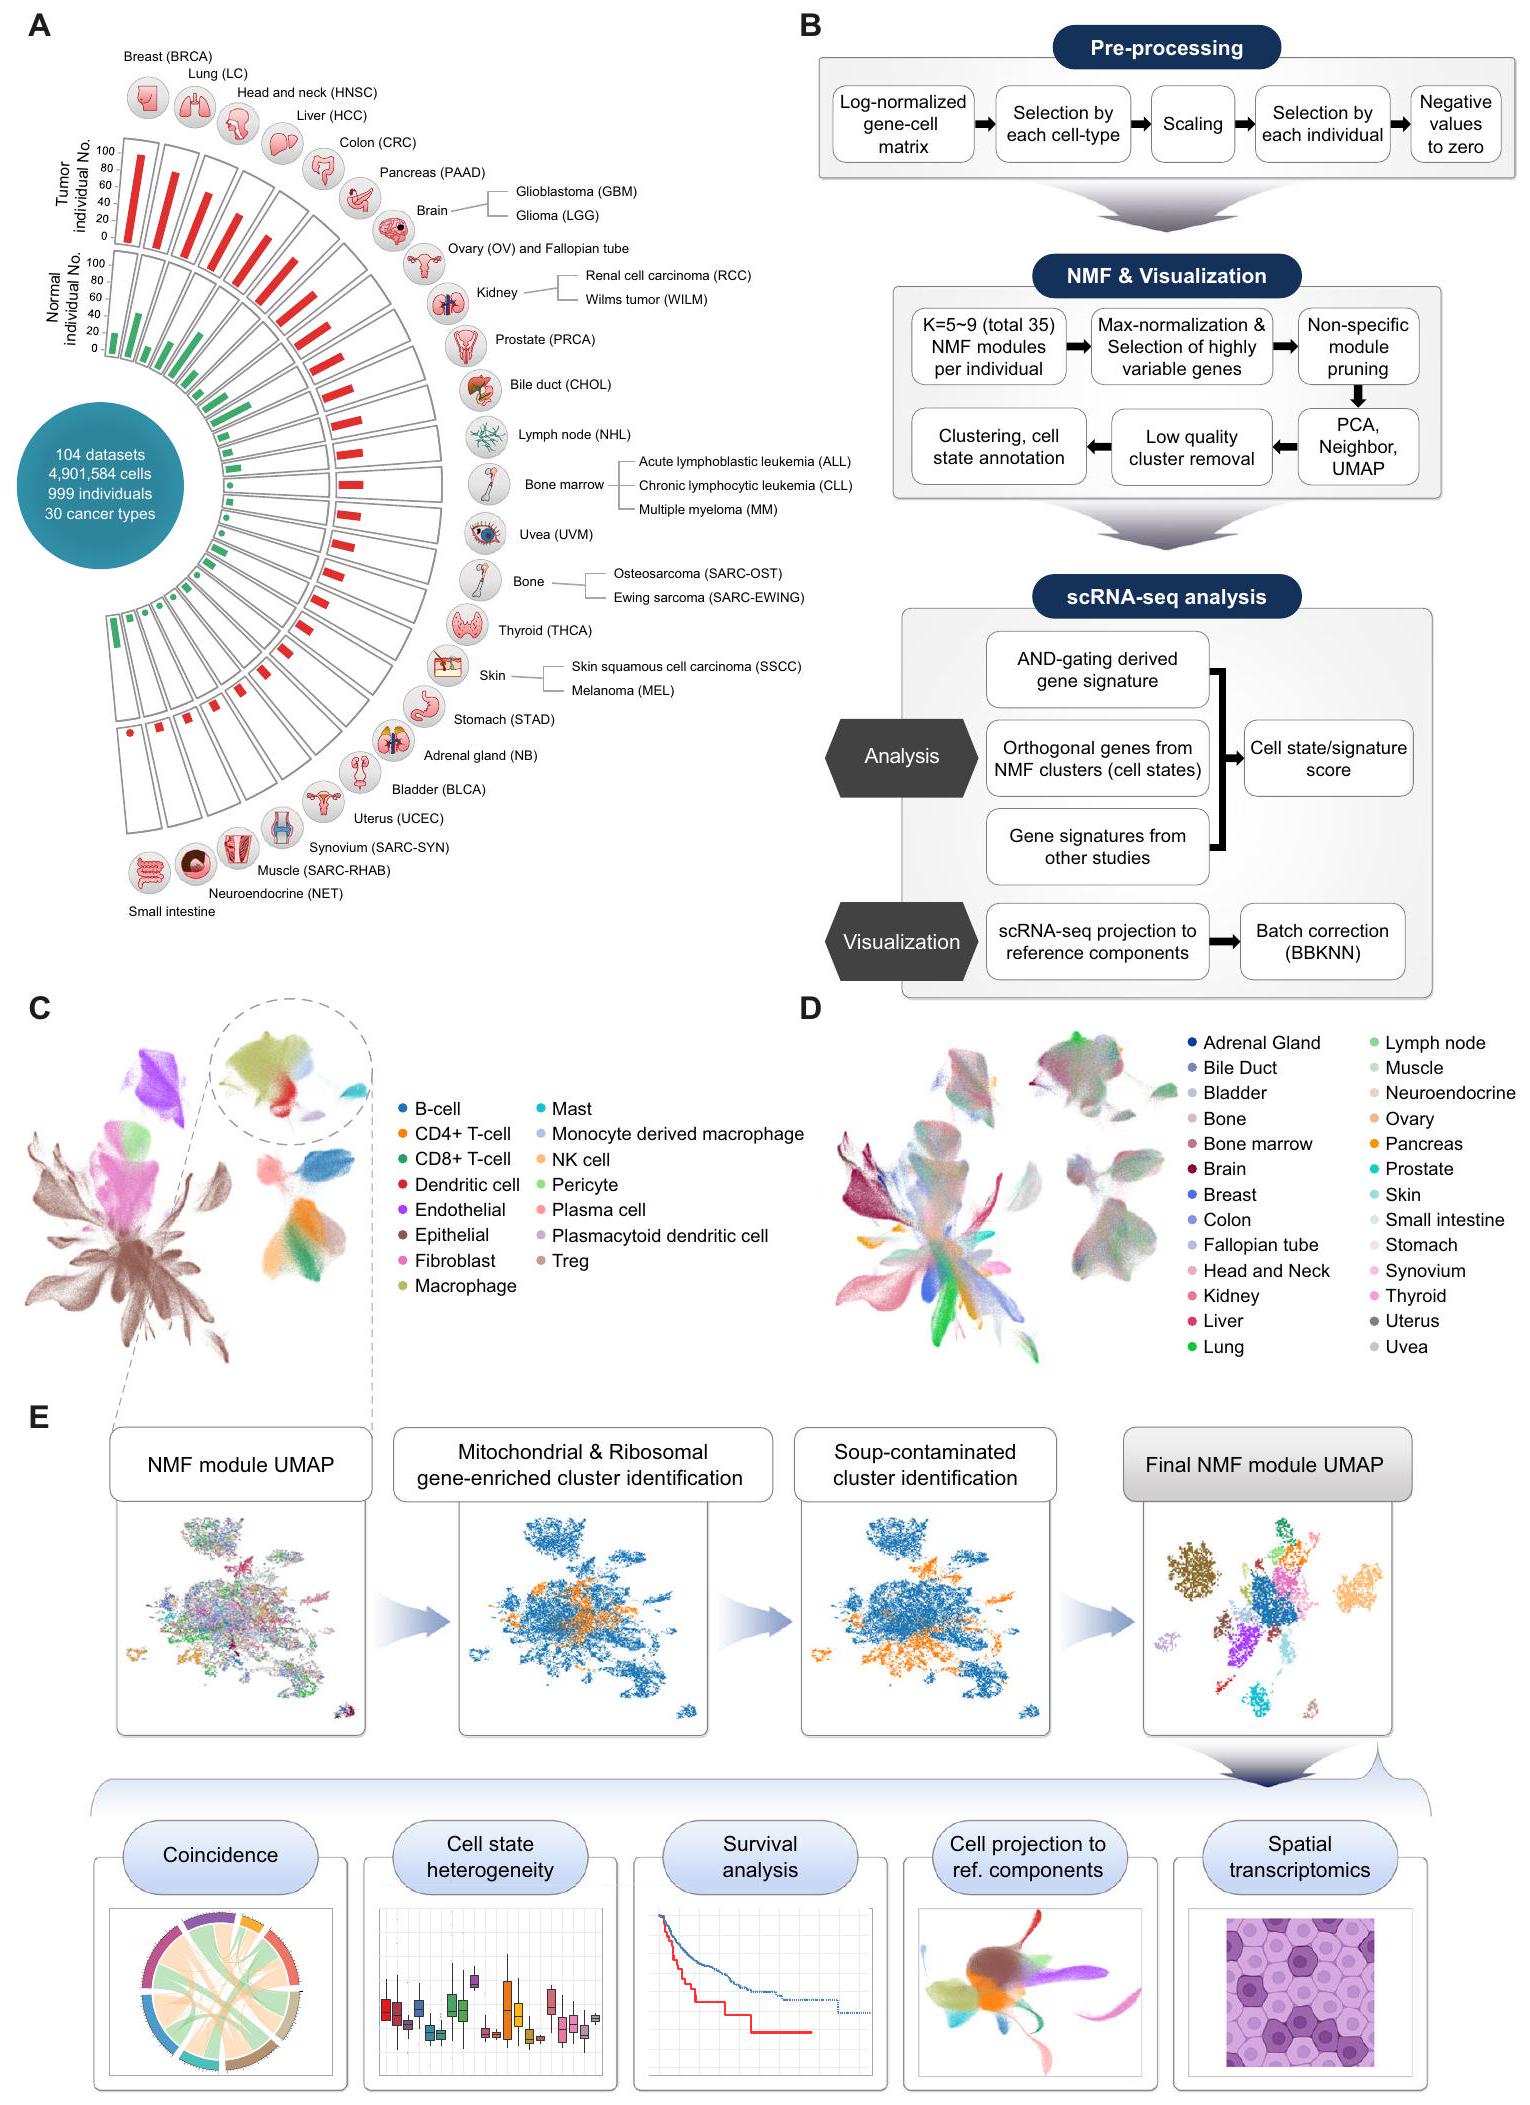
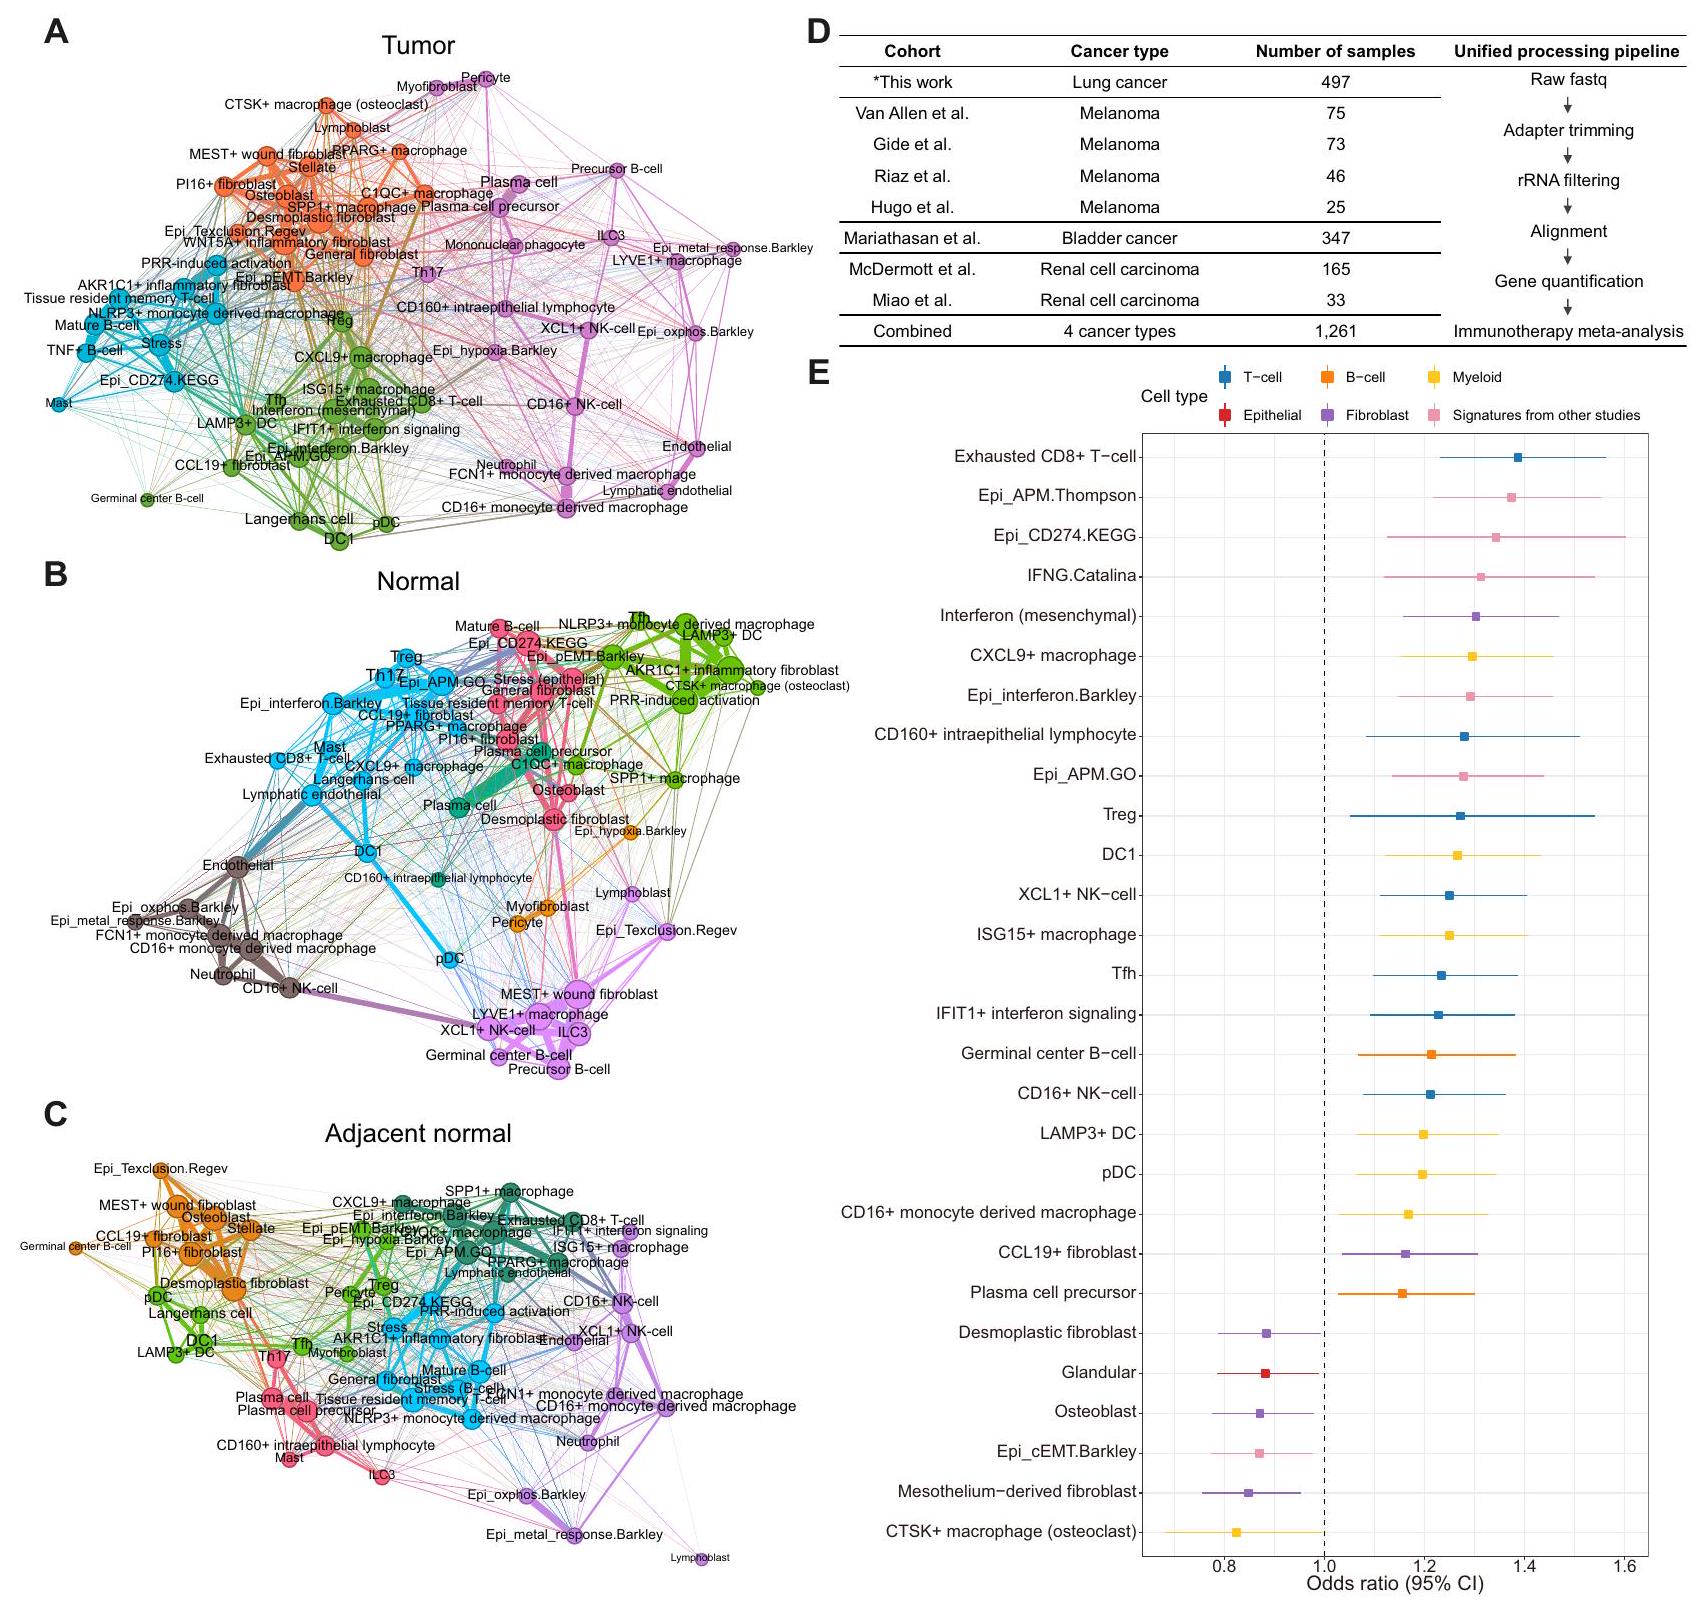
لإنشاء تعداد شامل لبيئات الورم والطبيعية، اخترنا مجموعات بيانات scRNA-seq المنشورة عن السرطان، تم بناء أطلس نسخي أحادي الخلية للورم الطبيعي يشمل 30 نوعًا مختلفًا من السرطان عبر 104 مجموعة بيانات، باستخدام عينات طبيعية مجاورة وعينات طبيعية صحية لم يتم تعزيزها لأنواع خلايا محددة. نتيجة لذلك، غطى هذا الأطلس الميتا 4.9 مليون خلية من 1,070 ورمًا و493 عينة طبيعية مأخوذة من 999 متبرعًا (الشكل 1A). كان سرطان الثدي (BRCA) هو النوع الأكثر وفرة من السرطان، يليه سرطان الرئة (LC) وسرطان الرأس والعنق (HNSC) وسرطان الكبد الخلوي (HCC).
لتحليل مجموعة متنوعة من النظم البيئية عبر أنواع السرطان والأنسجة المختلفة، تم دمج وتوصيف مجموعات البيانات الفردية المجمعة على نطاق عالمي. ثم تم تطبيق خوارزمية AND-gating (انظر الطرق) لتوصيف الجينات المعبر عنها بشكل مختلف والتي تكون نوعية للخلايا وتوجد بشكل عالمي في الأنسجة السرطانية والطبيعية لمختلف الأعضاء. بعد ذلك، تم تقسيم مصفوفات التعبير الجيني الموصوفة إلى أنواع خلايا رئيسية وتفكيكها إلى حالات خلوية متنوعة باستخدام تحليل NMF. (الشكل 1B-D والشكل التكميلي S1A، B). لتعظيم استعادة حالات الخلايا النادرة، تم جمع وحدات NMF لكل عينة فردية من خلال مسح عدة معلمات، وتم تجميع الوحدات الناتجة وإسقاطها على إسقاط التقريب الموحد (UMAP) للبحث عن وحدات توافق متكررة.
بين مجموعات وحدات NMF (حالات الخلايا)، حددنا تلك التي تمثل التلوث الناتج عن RNAs المحيطة أو الثنائيات وأزلنا تلك المجموعات من التحليل الإضافي باستخدام خط أنابيب آلي (الشكل 1E والشكل التكميلية S1C). كما تم تصفية مجموعات وحدات NMF الغنية بالجينات الريبوسومية / الميتوكوندرية. تمثل الصورة النهائية لـ UMAP لوحدات NMF الهيكل العام لحالات الخلايا المتكررة عبر عينات متعددة (الشكل 1E). يتيح لنا استخدام تمثيل UMAP لوحدات NMF فحص الخصائص البصرية لكل حالة خلوية حسب أصلها (مثل نوع الأنسجة، العضو، إلخ). تم تعريف حالات الخلايا وتوضيحها بناءً على الجينات ذات أعلى متوسط أوزان NMF (البيانات التكميلية 2). سمح لنا ذلك بتفكيك بيانات النسخ الجيني للخلايا الفردية والكتل باستخدام مرشحات حالات الخلايا المستمدة بدقة الخلايا الفردية (الشكل 1E، تباين حالات الخلايا) ومراقبة تواجدها المتزامن عبر العينات الطبيعية والورمية لتحديد التفاعلات المحتملة بين أنواع الخلايا ومساهمتها في البيئة المجهرية للورم (الشكل 1E، التزامن). كما طبقنا توقيعات حالات الخلايا لتفكيك مجموعات RNA-seq الكبيرة (TCGA، علاج نقاط التفتيش المناعية) للتحقق من آثارها السريرية (الشكل 1E، تحليل البقاء). أخيرًا، قمنا بإسقاط الخلايا باستخدام حالاتنا الخلوية كعنصر مرجعي لتقييم العلاقة بين حالات الخلايا وأنواع الخلايا. (الشكل 1E، إسقاط الخلايا إلى مكونات مرجعية) ونسخ جيني مكاني مفكك عبر 11 نوعًا من السرطان ( ) باستخدام أنواع خلايانا (الشكل 1E والبيانات التكميلية 3، النسخ الجيني المكاني).
تحديد بصمات الجينات العالمية المميزة لنظم الأورام الطبيعية
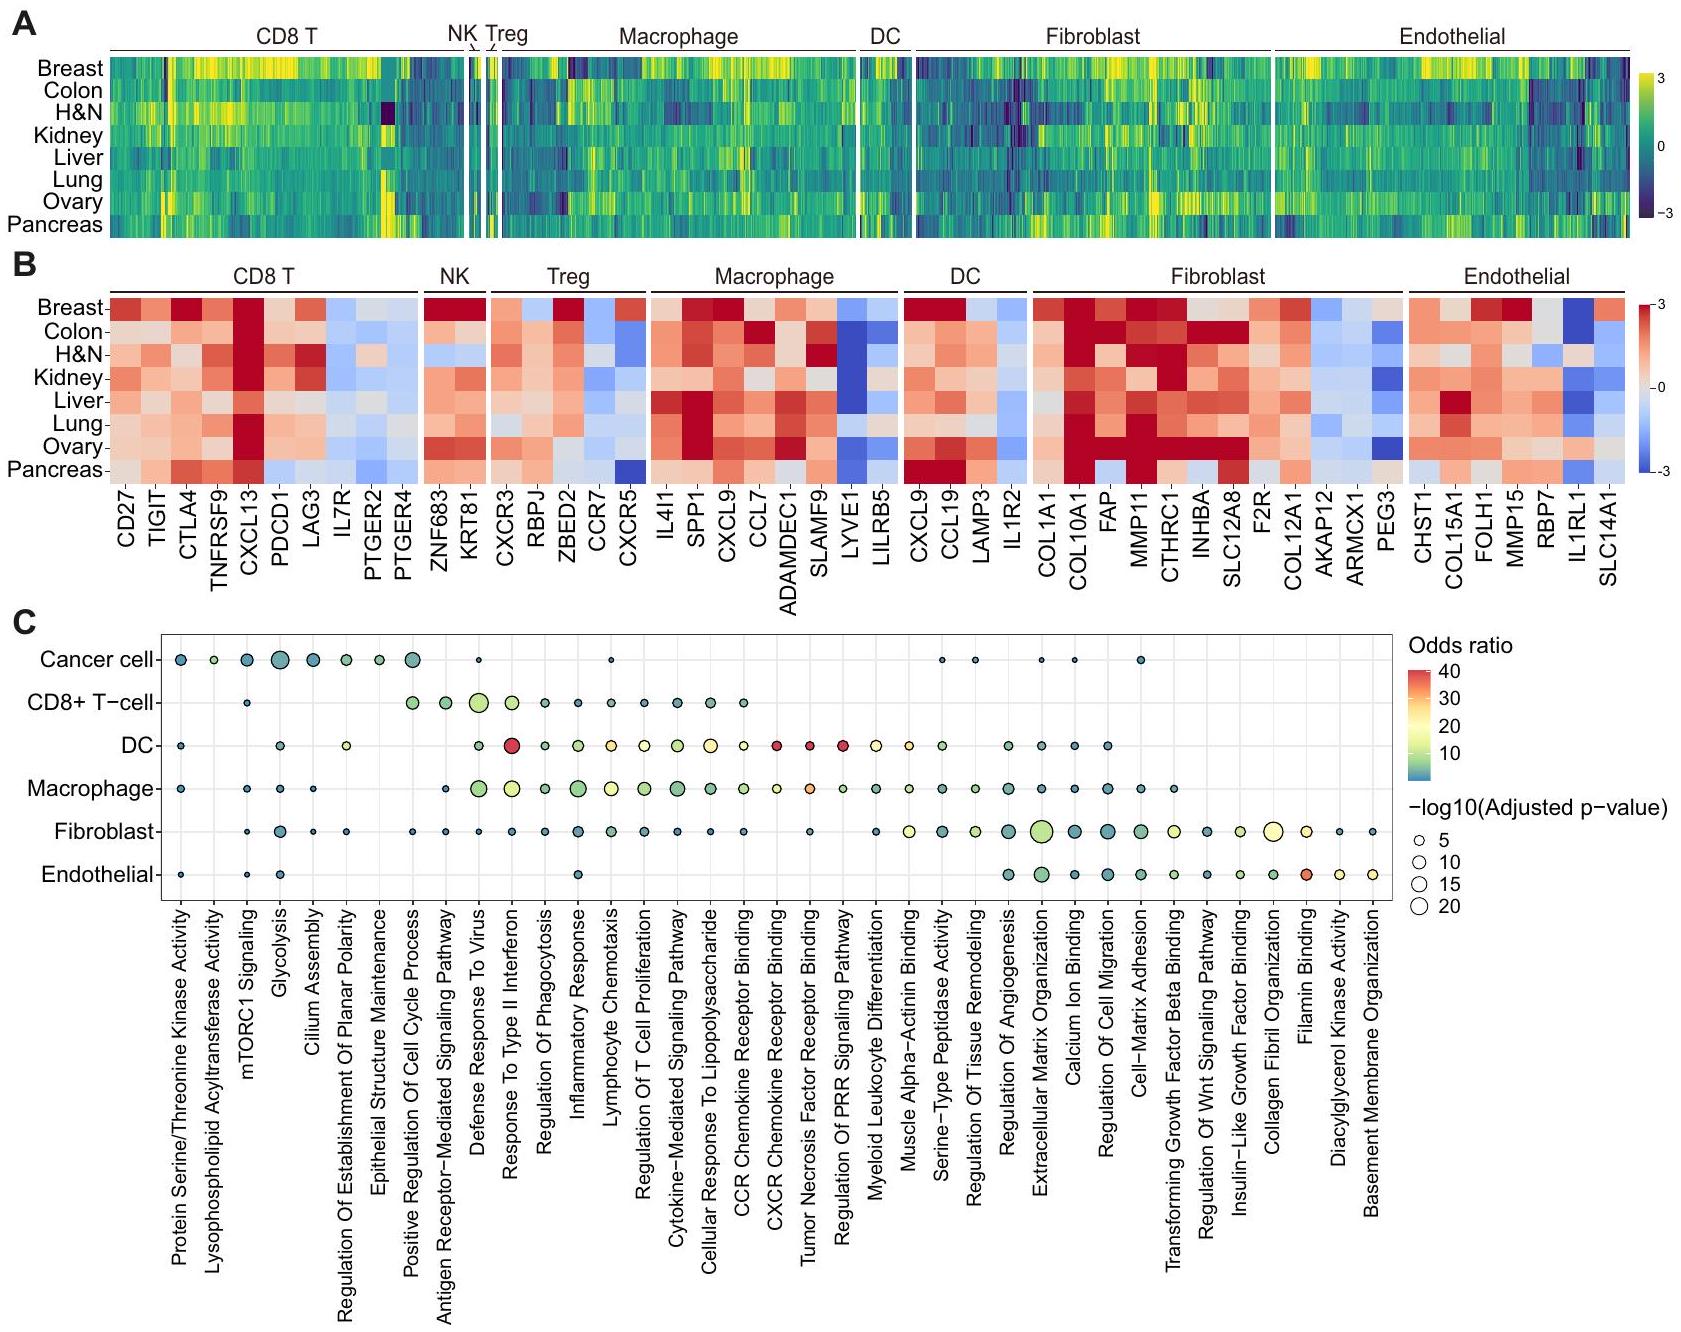
تم تنفيذ خوارزمية AND-gating (انظر الطرق) لتوصيف منهجي للجينات المميزة التي يتم تنظيمها بشكل متكرر في الأورام مقارنة بالأنسجة الطبيعية، والعكس بالعكس، في الأنواع الخلوية الرئيسية التي تشكل البيئة المجهرية للأورام (TME) في أعضاء متنوعة (الشكل التكميلية S2A والبيانات التكميلية 4). كانت الخلايا، وجزيئات التحفيز المساعد (CD27) وعلامات نقاط التفتيش المناعية أو علامات الإرهاق مثل CXCL13 وPDCD1 وTIGIT وCTLA4 وLAG3 وTNFRSF9 مرتفعة بشكل شائع في الأورام، بينما كانت IL7R وPTGER2 وPTGER4 مرتفعة في الأنسجة الطبيعية (الشكل 2A، B). ومن الجدير بالذكر، CD8لم تُظهر خلايا T في أنسجة الأورام البنكرياسية زيادة في تنظيم PDCD1 و LAG3، مما قد يفسر عدم قابلية استخدام مثبطات نقاط التفتيش المناعية في سرطان البنكرياس (PAAD) مقارنة بأنواع السرطان الأخرى.. وبالمثل، تم تمييز خلايا NK المرتبطة بالورم بواسطة ZNF683 و KRT81. في الأورام، زادت خلايا Tregs من التعبير عن جينات ذات وظائف تنظيمية مثل RBPJ و CXCR3 و ZBED2، في حين أن خلايا Tregs في الأنسجة الطبيعية زادت من التعبير عن CCR7 و CXCR5، مما يشير إلى آليات متميزة لخلايا المناعة.
الشكل 1 | نظرة عامة على مشهد الأورام الطبيعية عبر جميع أنواع السرطان بدقة الخلية الواحدة. أ نظرة عامة على مجموعة scRNA-seq عبر 30 نوعًا من السرطان تم جمعها في هذه الدراسة. ب سير العمل لأطلس النسخ الجيني للخلية الواحدة للأورام الطبيعية ومعالجة NMF. تصور UMAP لمجموعة فرعية من الأورام الطبيعية. خريطة الخلايا المفردة ملونة حسب (C) أنواع الخلايا و(D) أصول الأعضاء. E مخططات التجميع الرسومية لوحدات NMF مع خوارزمية الكشف عن تأثير الحساء المؤتمت والتحليلات اللاحقة.
الشكل 2 | مشهد الجينات المميزة لنظم الأنسجة عبر الأعضاء. أ. توصيف الجينات المميزة في نظم الأورام والعادية عبر الأعضاء. يتم الإشارة إلى نوع الخلية في أعلى خريطة الحرارة، ويتم تصوير الجينات التي تم تنظيمها بشكل مرتفع في أربعة أنواع أو أكثر من السرطان فقط. يمثل كل مربع في خريطة الحرارةقيم التغير النسبي مع القيم الإيجابية تشير إلى زيادة التعبير في الأورام. H&N، الرأس والعنق؛ DC، الخلية الشجرية؛ NK، الخلية القاتلة الطبيعية؛ Treg، الخلية التائية التنظيمية. B خريطة حرارية مفصلة للجينات الرئيسية المحددة في الشكل 2A عبر سرطان وأنواع الخلايا. كل لون في خريطة الحرارة يمثلقيم التغير النسبي مع القيم الإيجابية تشير إلى زيادة التعبير في الأورام. H&N، الرأس والعنق؛ DC، الخلية الشجرية؛ NK، الخلية القاتلة الطبيعية؛ Treg، الخلية التائية التنظيمية. ج تحليل علم وظائف الجينات لعلامات الأورام من أنواع خلايا متنوعة باستخدام Enrichr. اللون وحجم النقطة يمثلان نسبة الاحتمالات والقيمة من اختبار فيشر الدقيق ذو الجانبين، المعدل بطريقة بنجاميني-هوشبرغ، على التوالي. PRR، مستقبل التعرف على الأنماط. التجنيد والتسلل (الشكل 2A، B). على وجه الخصوص، كانت البلعميات المت infiltrated بالورم تعبر بشكل عالمي عن نقطة التفتيش المناعية (IL4I1) مرتبط بالاستقطاب M2 (SPP1)الجينات الالتهابية (CCL7 وADAMDEC1 وSLAMF9)، في حين وُجد أن الخلايا الشجرية في الأورام تظهر تعبيرًا مرتفعًا عن CCL19 وLAMP3، المرتبطة بالوظائف الالتهابية والهجرية (الشكل 2A، B). أظهر تحليل علم وظائف الجينات (GO) أن الجينات التي تم تنظيمها بشكل مرتفع في البلعميات المتسللة إلى الورم، والخلايا الشجرية، وتم إثراء خلايا T في الوظائف والمسارات ذات الصلة بما في ذلك الاستجابات الدفاعية ضد الفيروسات، والاستجابة للإنترفيرون من النوع الثاني، والاستجابات الالتهابية، وكيمياء الحركة للخلايا اللمفاوية، ومسارات الإشارات التي تتوسطها السيتوكينات (الشكل 2C).
أما بالنسبة لأنواع الخلايا غير المناعية، فقد أظهرت خلايا السرطان بشكل عام نشاط كيناز البروتين سيرين/ثريونين (PRKCA، GSK3B، وCAMKK2)، وتحلل الجلوكوز (PLOD1، EGLN3، وP4HA1)، وإشارات mTORC1 (SLC2A1، GMPS، وPDK1)، ومصطلحات GO المرتبطة بالتنظيم الإيجابي لعملية دورة الخلية (E2F7، E2F8، وKIF23؛ الشكل 2C والشكل التكميلي S2B). كما عبرت الألياف المرتبطة بالسرطان (CAF) عن علامات معروفة جيدًا بما في ذلك FAP، COL1A1، COL10A1، MMP11، وCTHRC1.، وجينات أخرى مثل INHBA، SLC12A8، F2R، و
COL12A1 في أعضاء مختلفة (الشكل 2A، B). زادت خلايا الأوعية الدموية الورمية من التعبير عن الجينات المرتبطة بتكوين الأوعية الدموية بما في ذلك CHST1 و FOLH1 و MMP15.تم إثراء كل من الألياف المرتبطة بالورم والخلايا البطانية بمصطلحات تتعلق بتنظيم المصفوفة خارج الخلوية، وتنظيم هجرة الخلايا، والالتصاق بين الخلايا والمصفوفة، وارتباط الفيلامين (الشكل 2C). بشكل عام، توضح هذه النتائج التوقيعات المميزة غير المنظمة لمكونات البيئة المجاورة للورم.
تحليل تفكيك النظم البيئية للأورام الطبيعية إلى حالات خلوية غير متجانسة
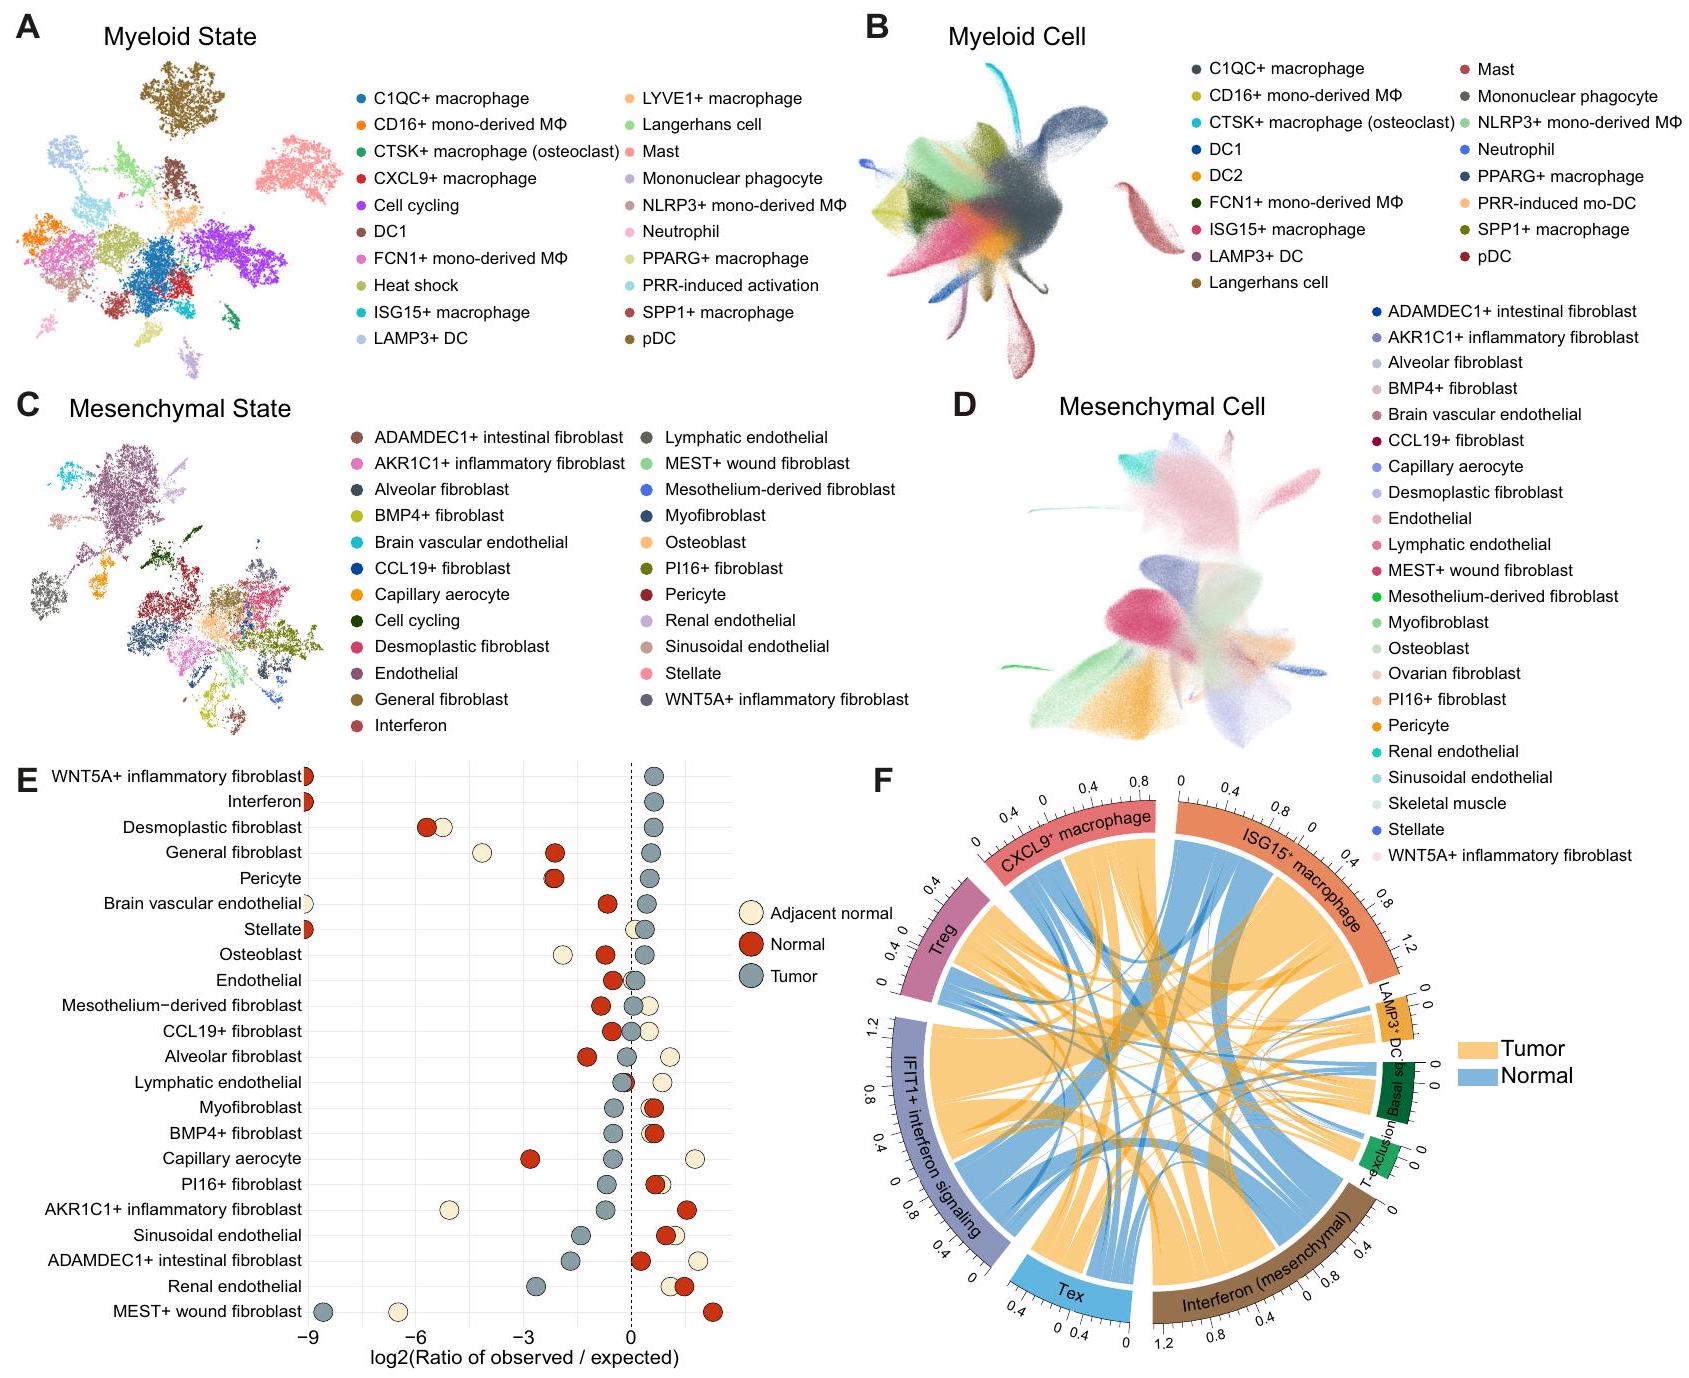
أدى التشريح المنهجي للورم المعقد والأنظمة البيئية الطبيعية إلى تحديد مجموعة متنوعة من حالات الخلايا أو الجينات المتنظمة بشكل مشترك التي تتوافق بشدة مع التوقيعات التي تم الإبلاغ عنها سابقًا وتلك التي لم يتم التعرف عليها بعد في التحليلات السابقة للسرطان الشامل. (الشكل 3A والشكل التكميلي S3، 4). بالنسبة لحالات الخلايا النخاعية، لاحظنا CTSKالبلاعم (SLC9B2 و CTSK)البلاعم الكبيرة (CXCL9 و ENPP2)، خلايا لانجرهانز (CD1A و CD207)، البلعميات أحادية النواة (DLEU2 و FMN1)، وحالة التنشيط المستحثة بواسطة PRR المميزة بالكيموكينات (CXCL1 و CXCL5)، والعلامات المهاجرة (SLAMF1) والعلامات المناعية التنظيمية (ITGB8). SLAMF1 و ITGB8 هي
الشكل 3 | فك تشفير نظام الورم-الطبيعي إلى حالات خلوية غير متجانسة. تصور UMAP لحالات الخلايا النخاعية (A) وتحليل المكونات المرجعية المقابل لخلايا النخاع (B). تم تجميع وحدات NMF رسوميًا وتلوينها وفقًا لحالات الخلايا (A). ثم، تم رسم الخلايا على المكونات المرجعية المكونة من جينات حالات الخلايا النخاعية (B). DC، خلية دندريتية؛ مشتقة من أحاديةخلايا البلعمة المشتقة من وحيدات النواة؛ mo-DC، خلايا دندريتية مشتقة من وحيدات النواة؛ pDC، خلايا دندريتية بلازمية؛ PRR، مستقبلات التعرف على الأنماط. تصور UMAP لحالات الخلايا الميزانشيمية (C) وتحليل المكونات المرجعية المقابل لخلايا الميزانشيم (D). تم تجميع وحدات NMF رسوميًا وتلوينها وفقًا لحالات الخلايا (C). ثم، تم رسم الخلايا إلى مكونات المرجع المكونة من جينات حالة الخلايا الميزانشيمية (D). تحليل Ro/e لتراكيز الأنسجة في حالات الخلايا الميزانشيمية. الخط العمودي المنقط يمثل النقطة التي يكون فيها Ro/e صفرًا.رسم دائري يوضح التواجد المتزامن بين حالات الخلايا في الأنسجة الطبيعية (باللون الأزرق) والورمية (باللون الأصفر). طول الأقواس يمثل مجموع التواجد المتزامن مع حالات خلايا أخرى في الجوار. قوس أطول يشير إلى تواجد متزامن أكثر تكرارًا مع حالات خلايا أخرى. الحالة القاعدية، الحالة القاعدية الحرشفية. DC، خلية دندريتية؛ Tex، CD8 المستنفد.خلية؛ استبعاد T، برنامج استبعاد الخلايا T؛ Treg، خلية T التنظيمية. يتم توفير بيانات المصدر كملف بيانات المصدر. مرتفع خلال نضوج خلايا DC المستحث بواسطة TLR، وبالتالي سميت تفعيل PRRinduced. كما حددنا مجموعة متنوعة منحالات الخلايا، بما في ذلك حالة خلايا B في المركز الجرثومي (GCB؛ SUGCT وRGS13) وحالة سلف خلايا البلازما (FNDC3B وFNDC3A) (الشكل التكميلي S3F). أظهر تقييم تركيز الأنسجة لحالات خلايا المناعة باستخدام تحليل Ro/e تفضيلات للخلايا المنهكة.خلية (LAG3 و TOX)، SPP1(SPP1 و ANGPTL4)، CTSK، و CXCL9 حالات البلعميات في الأورام (الشكل التكميلي S5A، B). كانت حالات GCB وخلايا البلازما وفيرة في الأنسجة الطبيعية المجاورة، بينما كانت حالات التنشيط الناتجة عن PRR غنية في الأنسجة الطبيعية الصحية (الشكل التكميلي S5B، C). باستخدام ملفات تعريف حالات الخلايا المحددة نوعياً كمرجع للتضمين، حددنا أنواع الخلايا التي تعكس بشكل جيد حالات الخلايا المقابلة (الشكل 3B والشكل التكميلي S6، 7): تم التقاط حالة التنشيط الناتجة عن PRR كعنقود خلايا mo-DC الناتجة عن PRR والتي نشأت بشكل أساسي من السرطانات النسائية مثل سرطان المبيض (OV) وسرطان بطانة الرحم في الجسم (UCEC) المرضى، بما يتماشى مع توزيع درجة حالة التنشيط الناتجة عن PRR (الشكل التوضيحي التكميلي S8).
تم تفكيك الخلايا الظهارية والعصبية إلى 35 حالة (الشكل التكميلي S9) وتم تحليل مكونات المرجع اللاحق باستخدام هذه الحالات الخلوية لتجميع الخلايا حسب أصولها (الشكل التكميلي S10A، B). تم العثور على برامج مميزة للخلايا الظهارية مثل الدورة (TOP2A و BIRC5) والإجهاد (PPP1R15A و KLF5). فيما يتعلق بالتوقيعات التي تم تصنيفها سابقًاأظهر سرطان الخلايا الكلوية (RCC) والورم الدبقي عالي الدرجة مستويات عالية من نقص الأكسجة واستجابة المعادن، بينما أظهرت الأورام الدبقية منخفضة الدرجة، وسرطان بطانة الرحم، والورم العصبي مستويات منخفضة من الانتقال الجزئي من الظهارة إلى الميزانشيم (pEMT)، والفوسفوريلات المؤكسدة، وتوقيعات آلية تقديم المستضدات، على التوالي (الشكل التكميلي S10C، D).
من الجدير بالذكر أننا قمنا بتصنيف وتوضيح حالات خلوية متنوعة من أصل ميزانشيمي، بما في ذلك CCL19الخلايا الليفية (CCL19 و CXCL13)، Pl16الخلايا الليفية (MFAP5 و IGFBP6)، الخلايا العضلية الليفية (ACTA2) و MYH11)، الخلايا الليفية التكوينية (LRRC15 و MMP11)، وحالات الخلايا الليفية الخاصة بأعضاء معينة التي تعكس وظائف محددة للأعضاء (الشكل 3C، D والشكل التكميلي S11). تم تحديد هذه الحالات أيضًا كتنوع من المجموعات الفرعية الميزانشيمية عند إسقاطها على المكونات المرجعية. بينما كانت حالة الخلايا الليفية التكوينية محددة بشكل كبير للأورام، كانت تجمعات الخلايا العضلية الليفية موزعة بالتساوي عبر الأنسجة غير الخبيثة، على عكس التقارير السابقة التي تشير إلى أن الخلايا العضلية الليفية هي CAFs الرئيسية (الشكل 3E)..
تشارك هذه الحالات الخلوية المتنوعة بشكل جماعي في تشكيل النظام البيئي المعقد للورم (الشكل 3F). على سبيل المثال، كان برنامج استبعاد خلايا T في الخلايا الظهارية مرتبطًا ارتباطًا وثيقًا بحالات Treg، مما يعزز الهروب المناعي وتقدم الورم.تزامن الحالة الحرشفية القاعدية مع حالات التهابية مثل CXCL9البلاعم، LAMP3DC، وحالات الإنترفيرون المشتقة من الميزانشيمية موجودة حصريًا في أنسجة الورم، مما يشير إلى السمة الجوهرية لأنواع السرطان المشتقة من الخلايا الحرشفية القاعدية (HNSC وسرطان الخلايا الحرشفية الجلدية) التي تحفز تسلل خلايا المناعة (الشكل 3F). على وجه الخصوص، تتضمن العديد من المصادفات حالة الإنترفيرون المشتقة من الميزانشيمية مع حالات الإنترفيرون من أنواع خلايا أخرى وتم تحديدها (الشكل 3F). تتزامن بشكل محدد مع الورم مع LAMP3تشير خلايا DC إلى أن الإنترفيرون المشتق من الخلايا المتوسطة ضروري لبدء إشارة الإنترفيرون الورمي لتجنيد خلايا المناعة وتفعيل خلايا T لاحقًا.
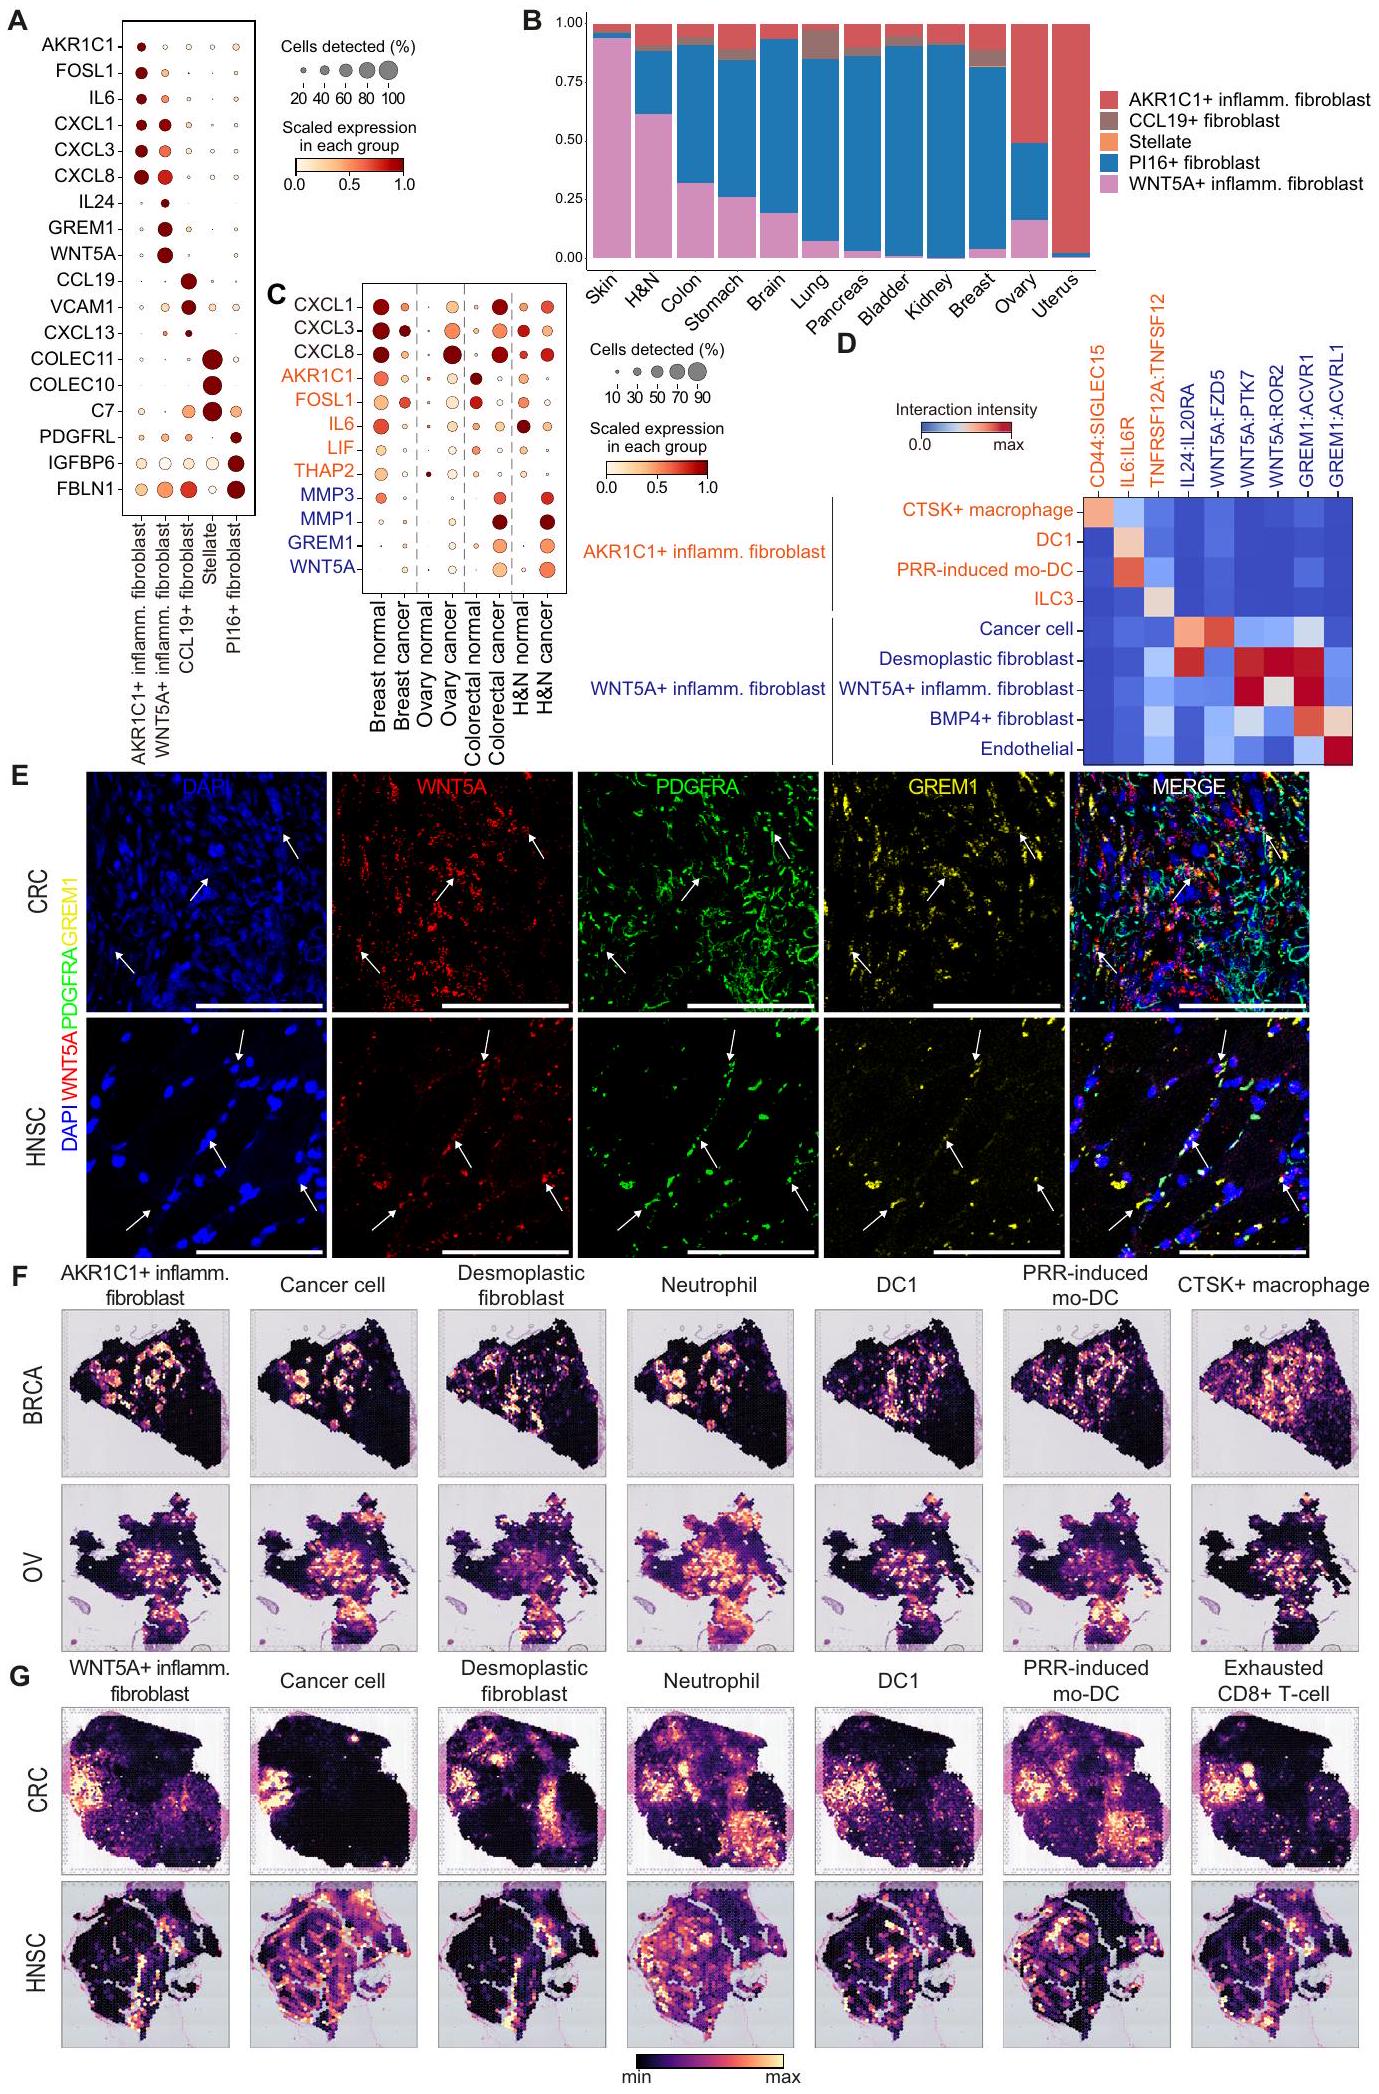
الأرومات الليفية هي مجموعة غير متجانسة للغاية تتمتع بوظائف متنوعة مثل ترسيب الكولاجين، وتكوين الأوعية الدموية، وإفراز السيتوكينات، والتي تلعب دورًا مركزيًا في تشكيل البيئة المجاورة للورم.تعمل الخلايا الليفية على تعزيز الالتهاب وتنظيم البيئة الدقيقة للأنسجة نحو كبت المناعة في سياق السرطان.لكن تنوع الألياف الالتهابية لم يتم استكشافه بشكل موسع في الدراسات السابقة المتعلقة بالسرطان الشامل.بينما نقوم بعرض مجموعات الخلايا الميزانشيمية على الحالات المحددة، حددنا عدة أنواع فرعية من الخلايا الليفية التي أظهرت تعبيرًا جينيًا متعلقًا بالمناعة (الشكل 4A). من بينها، لاحظنا الفروق بينوتعبير الفيبروبلاستات الالتهابية، والتي تزامنت مع حالة التنشيط الناتجة عن PRR وشاركت في تعبيرات جينات السيتوكين المماثلة (CXCL1/; الشكل 4A والشكل التكميلي S12A). ومع ذلك، كانت هناك اختلافات كبيرة في ما يتعلق بجينات العلامة (AKR1C1، FOSL1، LIF، وTHAP2 مقابل WNT5A، GREM1، TNC، وMMP1)، وأصول الأنسجة (طبيعية مقابل ورمية)، وتفضيلات الأعضاء (الأشكال 3E، 4A، B، والشكل التكميلي S12B، C). للتحقيق فيما إذا كانت هاتان الحالتان تمثلان أنواع فرعية متميزة حقًا من الألياف، أجرينا فحصًا دقيقًا لمجموعات بيانات scRNA-seq التي تشمل كل من الأنسجة الورمية والطبيعية من الثدي، والقولون، والرأس والعنق، والمبيض. كانت الأنسجة الورمية تعبر عن المزيد من جينات الكيموكين (CXCL1/3/8) مقارنة بالأنسجة الطبيعية باستثناء أنسجة الثدي. في الوقت نفسه، كانت أنماط التعبير عن AKR1C1 وWNT5A في هذين النوعين من الألياف الالتهابية متميزة عبر أعضاء مختلفة (الشكل 4C). عبر مرضى BRCA وOV عن كل من AKR1C1 وWNT5A، بينما عبرت أنسجة الثدي الطبيعية عن AKR1C1 فقط. من المثير للاهتمام أن مرضى سرطان القولون والمستقيم (CRC) وHNSC عبروا عن WNT5A ولكن ليس AKR1C1، في حين أظهرت الأنسجة الطبيعية المقابلة أنماط تعبير معاكسة (الشكل 4C).
للحصول على فهم لكيفية تشكيل هذه الخلايا الليفية الالتهابية للبيئة المجهرية الورمية، قمنا بإجراء تحليل الروابط والمستقبلات لكشف التفاعلات المميزة لـوالألياف الالتهابية مع أنواع خلايا أخرى في عينات BRCA و CRC و HNSC و OV (الشكل 4D والشكل التكميلي S12D و E). تم تحديد أنماط تفاعل منفصلة بين هذين الألياف الالتهابية.الخلايا الليفية الالتهابية تتفاعل مع CTSKالبلاعم (CD44:SIGLEC15)، المعروفة بأنها تحفز تقدم السرطان والانتشار في أنواع متعددة من السرطان (الشكل 4D والشكل التكميلي S12D).
علاوة على ذلك،الخلايا الليفية الالتهابية تعبر بقوة عن IL6 الذي يتفاعل معتم التعبير عنها على DC1 و mo-DC المستحثة بواسطة PRR، مما قد يساهم في نمو الورم ومقاومة العلاج. كما حددنا علاقة تداخلية بين TNFRSF12A (AKR1C1الأرومة الليفية الالتهابية) و TNFSF12 (ILC3). على النقيض، الـالخلايا الليفية الالتهابية تتفاعل مع خلايا السرطان عبر مسارات IL24:IL2ORA وWNT5A:FZD5، مما قد يعزز تقدم السرطان ومقاومة العلاج الكيميائي. (الشكل 4D والشكل التكميلي S12E). علاوة على ذلك، أظهرت الخلايا الليفية الالتهابية تفاعلات قوية مع تجمعات الخلايا الليفية بما في ذلك الخلايا الليفية النسيجية (WNT5A:PTK7، WNT5A:ROR2، وGREM1:ACVR1)، ومع نفسها في تفاعلات متجانسة (WNT5A:PTK7 وGREM1:ACVR1)، وBMP4.الأرومات الليفية (GREM1:ACVR1) لمحاكاة عملية إصلاح الجروح لتعزيز تكاثر الخلايا الجذعية المتوسطة ونمط هجرة الخلايا من خلال آلية ذاتية الإفراز وآلية إفرازية. (الشكل 4D والشكل التكميلي S12E). التفاعل المؤيد لتكوين الأوعية الدموية والمسبب للالتهابات لـ GREM1 من WNT5Aتم التعرف أيضًا على الألياف الالتهابية وACVRL1 من الخلايا البطانيةمجتمعين،تقوم الخلايا الليفية الالتهابية بإفراز مجموعة متنوعة من الروابط مثل WNT5A وGREM1 وIL24، التي تعزز التكاثر والهجرة والبقاء في سياقات متعددة، بما في ذلك تجديد الأنسجة والالتهاب والسرطان.. يتفاعلون مع مكونات خلوية متنوعة مثل خلايا السرطان، والألياف، والخلايا البطانية لتشكيل البيئة المجهرية المؤيدة للورم والالتهاب الأساسي في النهاية. لتحديد والتحقق من في تجمعات الألياف الالتهابية، قمنا بإجراء تمييز جزيئات RNA باستخدام الفلورة في الموقع (smFISH) مستهدفين WNT5A وGREM1 وPDGFRA في عينات أنسجة CRC وHNSC. وجود WNT5Aتم تأكيد وجود الألياف الالتهابية من خلال الإشارات المتداخلة من مجسات RNA لـ WNT5A و GREM1 و PDGFRA في السدى النسيجي المتصلب لأنسجة السرطان (الشكل 4E والشكل التكميلي S13 و S14).
افترضنا أن البيئات الميكروية المختلفة تؤدي إلى اختلاف الأنماط الظاهرية لهذين الليفوبلاستين الالتهابيين. لفحص أنماط التواجد المشترك لهما، قمنا بتحليل النسخ الجينية المكانية (BRCA، OV، وUCEC لـ AKR1C1).الأرومة الليفية الالتهابية، وسرطان القولون والمستقيم وسرطان الرأس والعنق لـ WNT5Aالأرومة الليفية الالتهابية). AKR1C1الأرومات الليفية الالتهابية تتواجد بشكل ملحوظ مع خلايا السرطان، والعدلات،البلاعم، DC1، و mo-DC المستحثة بواسطة PRR (الشكل 4F، G والشكل التوضيحي S15A، B). بالمقابل، WNT5Aالأرومة الليفية الالتهابية تتواجد بشكل ملحوظ مع الأرومة الليفية المتصلبة، المستنفدةخلايا T، Treg، DC 1، ومو-DC المستحثة بواسطة PRR، مما يبرز دورها في تشكيل البيئة المجهرية المثبطة للمناعة (الشكل 4F، G والشكل التكميلي S15A، B). على وجه الخصوص، AKR1C1 وكانت الخلايا الليفية الالتهابية متباينة بشكل متبادل مع الخلايا الليفية التصلبية والعدلات، مما يبرز الفروق بين نوعي الخلايا الليفية الالتهابية (الشكل 4F، G والشكل التكميلي S15A، B). التفاعلات الخلوية والقرب المكاني لـالأرومات الليفية الالتهابية المستنفدةدفعتنا خلايا T وخلايا Tregs إلى دراسة ارتباطها بعلاج المناعة في عينات HNSC المعالجة مسبقًا/بعد المعالجة.. كان هناك اتجاه نحو زيادة في الخلايا الليفية الالتهابية والخلايا الليفية التصلبية بعد علاج المناعة، على عكس غيرها من المجموعات الميزانشيمية (الشكل التكميلي S15C). وهذا يشير إلى أنمن المحتمل أن تتأثر الخلايا الليفية الالتهابية خلال علاج المناعة. بشكل جماعي، على الرغم من أن الخلايا الليفية الالتهابية تعبر عن CXCL1/3/8 بشكل مشترك، إلا أن تفضيلات الأعضاء/الأنسجة المتميزة، وأنماط التفاعل الخلوي، والقرب المكاني من أنواع الخلايا الأخرى تشير إلى دورها المختلف في تشكيل بيئة ورمية متجنبة للمناعة ومؤيدة للورم.
إعادة توصيل محددة للأورام لمجتمع غني بالإنترفيرون ومؤيد للأورام
لتصوير النظم البيئية متعددة الخلايا عبر أصول الأنسجة، قمنا بإنشاء شبكة غير موجهة مع تكرارات حالات الخلايا وحددنا مجتمعات شبكة متنوعة داخل الورم. الأنسجة الطبيعية المجاورة، والأنسجة الطبيعية (الشكل 5A-C). من المRemarkably، كان نظام الورم واحدًا مشغولًا بشكل واضح بحالات الإنترفيرون من أنواع خلايا مختلفة داخل الورم (مجتمع غني بالإنترفيرون؛ الشكل 5A). احتوى هذا المجتمع أيضًا على مكونات معروفة من TLS (LAMP3دي سي، سي سي إل 19الأرومة الليفية، وTfh)، خلايا دندريتية معينة وبلعميات (DC1، pDC، وCXCL9البلاعم) وآليات تقديم المستضدات. بالمقابل، عدة حالات من خلايا المناعة تضمن المجتمع الغني بالإنترفيرون موزعًا في جميع أنحاء الشبكة الصحية الطبيعية (الشكل 5B). ومن المثير للاهتمام، أن الجوارتم تحديد حالة خلايا المناعة الأخرى المضمنة في المجتمع الغني بالإنترفيرون (DC1، pDC، خلايا لانجرهانز، وTfh) في الشبكة الطبيعية المجاورة (الشكل 5C)، مما يوحي بأن تكوينات متميزة من النظم البيئية الخلوية موجودة حتى داخل الأنسجة الطبيعية المجاورة مقارنة بالأنسجة الطبيعية الصحية.
الشكل 4 | توصيفوالألياف الالتهابية. رسم نقطي لتعبيرات جينات العلامة لأنواع الألياف الالتهابية. التهاب، التهابي. ب توزيع الألياف الالتهابية عبر الأعضاء حيث -المحور يمثل نسبة الألياف الالتهابية في أنسجة الورم. H&N، الرأس والعنق؛ التهاب، التهابي. الرسم النقطي C يظهر تعبير الجين لـوجينات علامات الألياف الالتهابية في الأنسجة الطبيعية والورمية للأعضاء المعنية. H&N، الرأس والعنق. تفاعلات الليغاند-المستقبلات لـوالألياف الالتهابية مع أنواع خلايا أخرى. تم حساب شدة التفاعل من خلال ضرب قيم التعبير المنظم للروابط والمستقبلات في كل زوج من الخلايا. DC، خلية دندريتية؛ التهابية. التهاب؛ ILC3، خلايا لمفية فطرية من النوع 3؛ mo-DC، خلية دندريتية مشتقة من وحيدة النواة؛ PRR، مستقبل التعرف على الأنماط. E تمثيلي (صور للكشف عن RNA smFISH في الموقع لـ WNT5A (أحمر)، PDGFRA (أخضر)، وGREM1 (أصفر) في السدى التصلبي لسرطان القولون والمستقيم (CRC) (أعلى) وأنسجة سرطان الرأس والعنق (HNSC) (أسفل). مقياس الرسم:التكبير: 20X. أنماط التوضع المكاني المشترك لـ (F) AKR1C1و (G) WNT5Aالأرومة الليفية الالتهابية مع أنواع خلايا أخرى في الأعضاء ذات الصلة، مع ألوان تمثل وفرة الخلايا. DC، خلية دندريتية؛ Inflamm.، التهابية؛ mo-DC، خلية دندريتية مشتقة من وحيدة النواة؛ PRR، مستقبل التعرف على الأنماط. تم توفير بيانات المصدر كملف بيانات مصدر.
كما حددنا مجتمعًا آخر محددًا للأورام يشغله حالات مؤيدة للورم، مثل pEMT، وبرنامج استبعاد الخلايا التائية الظهارية،البلاعم الكبيرة، والليفات المتصلبة (الشكل 5A). البلاعم الغنية بالورم (والبلاعم) و WNT5Aتم العثور أيضًا على حالات الألياف الالتهابية، التي تساهم في جوانب متنوعة من تكوين الأورام، في المجتمع المؤيد لتكوين الأورام..
تحديد حالات الخلايا التنبؤية للعلاج المناعي عبر أنواع السرطان
بعد تحديد تنوع وديناميات المجتمعات الغنية بالإنترفيرون والمحفزة للورم بين الأنسجة السرطانية، والأنسجة الطبيعية المجاورة، والأنسجة الطبيعية السليمة، استخدمنا تلك الحالات الخلوية لفك تشفير النسخ الجينية الكلية لعينة المعالجة بمثبطات نقاط التفتيش في سرطان المثانة (BLCA)، الميلانوما (MEL)، سرطان الكلى (RCC) ومجموعة LC الخاصة بنا (الشكل 5D). تم تسليط الضوء على الفوائد السريرية لحجب نقاط التفتيش من خلال التعبير المرهقخلية، إنترفيرون مشتق من الميزانشيمالبلاعمالخلايا اللمفاوية داخل الظهارة، Treg، DC1، ISG15البلاعمخليةإشارات الإنترفيرونلامب 3DC، pDC، CD16البلاعم المشتقة من وحيدات النواة، CCL19حالات الخلايا الليفية وسابقة خلايا البلازما في التحليل الشامل للسرطان (الشكل 5E). في الوقت نفسه، قدمت توقيعات الجينات المحددة سابقًا مثل مسار PD-L1 وآلية تقديم المستضدات وتوقيعات الإنترفيرون من دراسات مختلفة استجابات إيجابية للعلاج المناعي. كانت حالات الخلايا ذات القوة التنبؤية الكبيرة في الغالب مكونات من المجتمع الغني بالإنترفيرون. من بين حالات الخلايا المواتية للعلاج المناعي، أكدنا وجود خلايا ميزانشيمية تعبر عن الإنترفيرون (CXCL10 و PDGFRA) في عينة نسيج HNSC باستخدام تقنية RNA smFISH (الشكل التكميلية S16).
على النقيض، الخلايا الليفية النسيجية، الخلايا العظمية، الخلايا الليفية المشتقة من الغشاء المصلي، وكانت حالات خلايا البلعميات مرتبطة باستجابات ضعيفة للعلاج المناعي عبر المجموعات، العديد منها ينتمي إلى المجتمع المؤيد للورم (الشكل 5E). بالنظر إلى أن هذه الحالات المكونة المؤيدة للورم (أي، الألياف النسيجية التصلبية، الخلايا العظمية، وتؤثر الخلايا الكبيرة (المكروفاج) سلبًا على استجابات العلاج المناعي عبر أنواع مختلفة من السرطان، ويجب السعي وراء استراتيجيات علاجية بديلة للمرضى الذين لديهم أنظمة بيئية تعزز الورم. ومن الجدير بالذكر أن الغالبية العظمى من حالات الخلايا التي تتنبأ باستجابة العلاج المناعي لم تؤثر بشكل كبير على التشخيص عبر مجموعات TCGA (الأشكال التكميلية S17، 18).
على الرغم من التأثير غير المتجانس لحالات الخلايا المتنوعة في العلاج المناعي، تساءلنا عما إذا كان هناك توقيع جيني مشترك بين المستجيبين. لتحديد الجينات التي يتم تنظيمها بشكل مختلف بغض النظر عن الأعضاء بين المستجيبين وغير المستجيبين للعلاج المناعي لأنواع الخلايا الرئيسية، قمنا بالتحقيق في مجموعات العلاج المناعي لأربعة أنواع من السرطان بدقة الخلية الواحدة (BRCA، LC، MEL، وRCC؛ البيانات التكميلية 5). في CD8تم التعبير عن خلايا T وPDCD1 وLAG3 وCXCL13 وCXCR6 وVCAM1 وCCDC141 وZBED2 بشكل شائع في المستجيبين للعلاج المناعي، بينما تم التعبير عن ZNF8O في غير المستجيبين (الشكل التكميلي S19A والبيانات التكميلية 6). في البلعميات، تم تحديد زيادة عالمية في التعبير عن SCIN وOLFML3 وPLD4 وP2RY11 وSLAMF7 في المستجيبين، بينما عبر غير المستجيبين عن COLEC12 وPROS1 وCTSK وMOB3B وADAMTSL4 وTSPAN15 و
GPX3 (الشكل التكميلي S19A). آثار البقاء المفيدة المعبر عنها عالميًاتم التحقق أيضًا من جينات الخلايا في المستجيبين للعلاج المناعي في مجموعة LC الخاصة بنا، مما يشير إلى أن برامج التعبير الجيني المشتركة في المستجيبين للعلاج المناعي تحمل دلالة تنبؤية حتى في المرضى من أنواع سرطانية مختلفة (الشكل التكميلي S19B).
تحقيق منهجي في نظم الأورام البيئية باستخدام النسخ الجيني المكاني عبر أنواع متعددة من السرطان
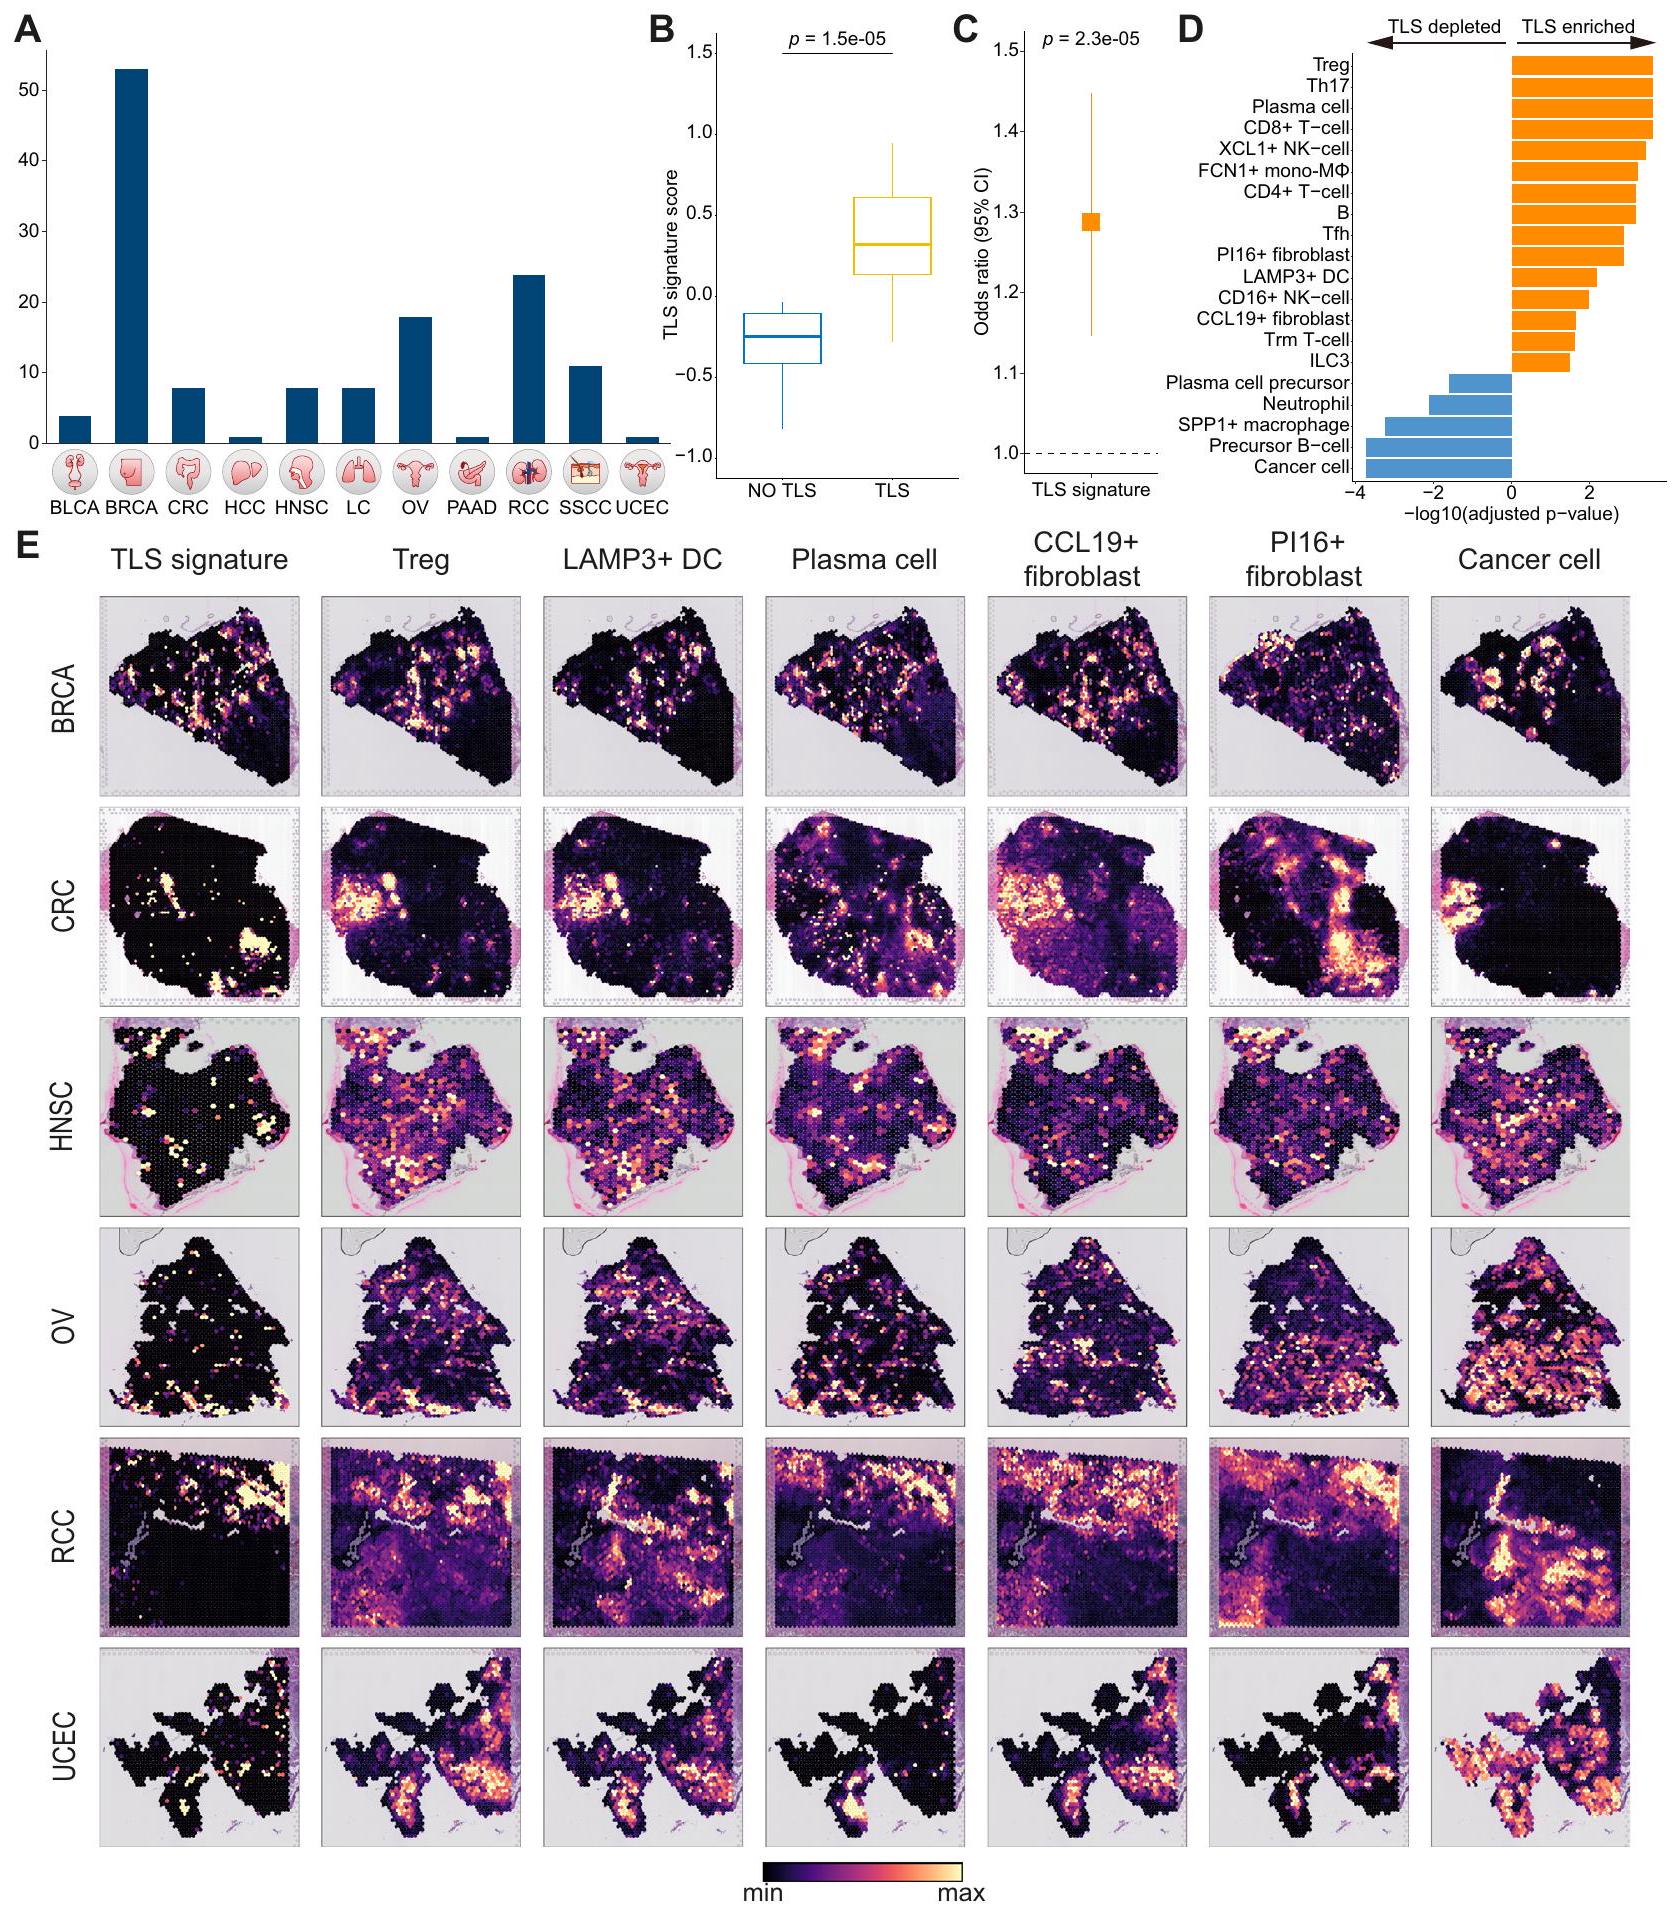
لفحص التنظيم المكاني لنظام الورم، قمنا بإجراء تحليل منهجي لبيانات النسخ الجينية المكانية عبر 11 نوعًا مختلفًا من السرطان.الشكل 6A). نظرًا لأن TLS قد ارتبط سابقًا باستجابات العلاج المناعي المواتية، هدفنا أولاً إلى اشتقاق توقيع جيني محدد لـ TLS وأيضًا دراسة العلاقات المكانية بين المكونات المرتبطة بالاستجابات الإيجابية للعلاج المناعي وTLS المحددة مرضيًا. لتحقيق هذا الهدف، استخدمنا بيانات النسخ الجيني المكاني لـ RCC التي تحتوي على نقاط TLS المحددة مرضيًا.من خلال إجراء تحليل التعبير التفاضلي بين بقع TLS وغير TLS، حصلنا على توقيع TLS الذي يميز بفعالية بين بقع TLS وغير TLS.“; الشكل 6B والبيانات التكميلية 7). كما توقعت توقيع TLS لدينا استجابات إيجابية للعلاج المناعي في المجموعات المعالجة بالعلاج المناعي (; الشكل 6C والشكل التكميلي S20A). بالإضافة إلى ذلك، استخدمنا cell2location لفك تشفير كل نقطة مكانية مع ملفات النسخ الجيني على مستوى الخلية الواحدة وقارنّا وفرة أنواع الخلايا بين نقاط TLS ونقاط غير TLS. حددنا أنواع الخلايا التي كانت غنية بشكل ملحوظ في TLS، بما في ذلك Treg، وخلايا البلازما، XCL1 خلايا NK، Tfh، LAMP3دي سي، سي سي إل 19الخلايا الليفية، وILC3 (الشكل 6D). من الجدير بالذكر أن بعض أنواع الخلايا، مثل الخلايا المستنفدةخلية، ISG15تفتقر البلعميات، DC1، وpDC، إلى الارتباط المكاني مع TLS، ومع ذلك أظهرت استجابات إيجابية للعلاج المناعي مشابهة لأنواع الخلايا الغنية بـ TLS (الأشكال 5E، 6D).
من خلال تقييم أنماط التوضع المكاني لأنواع الخلايا الغنية بـ TLS في أنواع السرطان الأخرى، أكدنا التوضع المشترك لأنواع الخلايا الغنية بـ TLS بما في ذلكDC، Treg، خلية بلازمية، وCCL19الخلايا الليفية عبر أنواع متعددة من السرطان (الشكل 6E). علاوة على ذلك، لاحظنا أن توقيع TLS الخاص بنا يلتقط بفعالية المواقع الغنية بأنواع الخلايا المعززة بـ TLS في عينات الأورام المختلفة من أنواع السرطان المختلفة (الشكل 6E). بالمقابل، أظهرت المكونات المؤيدة للورم أنماط تداخل مميزة (الشكل التكميلي S20B). ومن الجدير بالذكر أن الخلايا الليفية المتصلبة والماكروفاجات SPP1 تداخلت معكانت الألياف الالتهابية متبادلة الحصرية مع بعضها البعض، مما يدل على مساهمات مستقلة في البيئة المؤيدة للورم. في الختام، استخدمت دراستنا تسلسل الجينات على مستوى الخلية الواحدة عبر جميع أنواع السرطان وتسلسل الجينات المكاني لوصف التنظيم المكاني المعقد للبيئة المجهرية للورم.
نقاش
في هذا العمل، قمنا بدمج أطلس ترنسكريبتومي يتكون من 4.9 مليون خلية من 999 فردًا عبر 30 نوعًا من السرطان، بما في ذلك الأنسجة الورمية وغير الورمية. حدد تحليلنا توقيعات جينية مميزة ورسم بشكل منهجي حالات الخلايا التي تشكل نظم السرطان الطبيعية. علاوة على ذلك، أوضحنا الفروق بينوالأرومة الليفية تشكل النواة
الشكل 5 | حدوث محدد للورم لمجتمع غني بالإنترفيرون ومؤيد للورم وتحديد حالات الخلايا المتنبئة بالعلاج المناعي. شبكة التعايش في (أ) الورم، (ب) الأنسجة الطبيعية، و(ج) الأنسجة الطبيعية المجاورة. لون العقد والحواف يتوافق مع مجتمع التمايز وسمك الحواف يتوافق مع حجم القرب. DC، خلية دندريتية؛ EMT، الانتقال من الظهارة إلى الميزانشيم؛ ILC3، نوع 3 من الخلايا اللمفاوية الفطرية؛ NK، خلية قاتلة طبيعية؛ pDC، خلية دندريتية بلازميدية؛ PRR، مستقبل التعرف على الأنماط؛ Texclusion، برنامج استبعاد الخلايا التائية؛خلايا المساعدة الجريبية؛ Th17، نوع المساعد T 17؛ Treg، الخلية التائية التنظيمية. د ملخص لمجموعات RNA-seq الضخمة المعالجة بالعلاج المناعي مع بيانات الاستجابة المستخدمة في هذه الدراسة. * تشير إلى بيانات تم إنشاؤها حديثًا. هـ مخطط الغابة لحالات الخلايا التنبؤية للاستجابة للعلاج المناعي وتوقيعات الجينات من دراسات أخرى من خلال التحليل التلوي لـ مجموعات تسلسل RNA الضخم المعالجة بالعلاج المناعيالمرضى). يمثل المحور السيني نسبة الأرجحية، حيث تمثل الخط العمودي المنقط نسبة أرجحية تساوي 1، ويمثل المحور الصادي حالات الخلايا وتوقيعات الجينات المحددة سابقًا. لكل حالة خلوية، تمثل المستطيلات والخطوط الممتدة نسب الأرجحية وفترات الثقة، على التوالي، تم حسابها من خلال التحليل التلوي من الانحدار اللوجستي للاستجابة السريرية عبر مجموعات العلاج المناعي. فقط حالات الخلايا التي حققت دلالة إحصائية موضحة. حالات الخلايا التي لديها نسب الأرجحية أكبر من 1 هي تلك المرتبطة بالاستجابات المواتية للعلاج المناعي. الألوان تت correspond إلى فئات نوع الخلية لكل حالة خلوية. APM، آلية تقديم المستضدات؛ DC، خلية دندريتية؛ EMT، الانتقال من الظهارة إلى الميزانشيم؛ IFNG، إنترفيرون غاما؛ NK، خلية قاتلة طبيعية؛ pDC، خلية دندريتية بلازميدية؛ Treg، خلية T تنظيمية. تم توفير بيانات المصدر كملف بيانات مصدر. بيئة الورم الالتهابية. مكونات متنوعة من المجتمع الغني بالإنترفيرون بما في ذلك LAMP3دي سي، سي سي إل 19الخلايا الليفية، CXCL9تمنح حالات الإنترفيرون المستمدة من البلعميات والخلايا الميزنشيمية استجابات إيجابية للعلاج المناعي وتشكل أنظمة بيئية مختلفة بين الورم والأنسجة الطبيعية المجاورة والأنسجة الطبيعية السليمة. سمح التوصيف عالي الدقة لحالات الخلايا الشاملة من أطلس الخلايا المفردة الخاص بنا عبر جميع أنواع السرطان، بالاشتراك مع النسخ الجيني المكاني، بتصنيف أنواع الخلايا الغنية في مواقع التفاعل اللمفاوي الثانوي وتلك التي ليست كذلك. ضمن مكونات العلاج المناعي المواتية، والتحقيق في الأنماط التي تعكس بشكل كبير بيولوجيا الورم المعقدة.
على الرغم من أن تباين التعبير الجيني يتم التخفيف منه خلال التحول الخبيث للأنسجة في العديد من أنواع السرطان، تفتقر الأدلة على وحدات الجينات المتزامنة التعبير في البيئة المجهرية للورم عند دقة الخلية الواحدة. هنا، هدفنا هو تحديد برامج التعبير الجيني المميزة في الأنسجة الخبيثة مقارنة بالأنسجة الطبيعية عبر أنواع الخلايا المختلفة، بغض النظر عن الأعضاء. على الرغم من أن
الشكل 6 | تحليل النسخ الجيني المكاني لبيئات الأورام عبر أنواع السرطان المتعددة. أ نظرة عامة على النسخ الجيني المكاني الشامل للسرطان الذي تم تحليله في هذه الدراسة. ب مخطط الصندوق يقارن بين درجات توقيع TLS بين نقاط TLS وغير TLS. تم حساب الأهمية الإحصائية باستخدام اختبار ويلكوكسون للرتب المجمعة ذو الجانبين.في مخطط الصندوق، تمثل الخط المركزي، الحد العلوي للصندوق، الحد السفلي للصندوق، والشعيرات الوسيطة الوسيط، الربع الأول، والربع الثالث، ونطاق الربيع الداخلي، على التوالي. ج. القوة التنبؤية لتوقيع TLS لاستجابة العلاج المناعي في مجموعات RNA-seq الكثيفة المعالجة بالعلاج المناعي. يمثل المستطيل والخطوط الممتدة نسبة الأرجحية وفترة الثقة، على التوالي، تم حسابها باستخدام درجات توقيع TLS من خلال التحليل التلوي من الانحدار اللوجستي للاستجابة السريرية عبر مجموعات العلاج المناعي (، ). اسمي ذو جانبين -تم الحصول على القيم من نتائج التحليل التلوي لتحليل الانحدار اللوجستي. رسم بياني شريطي لأنواع الخلايا الغنية بـ TLS باستخدام النسخ الجينية المكانية لـ RCC المسمى بـ TLS. تم حساب الأهمية الإحصائية للغنى أو النقص باستخدام اختبار ويلكوكسون للرتب المزدوجة وتم تعديلها بطريقة بنجاميني-هوشبرغ. يتم تقديم فقط أنواع الخلايا التي وصلت إلى الأهمية الإحصائية. DC، خلية دندريتية؛ ILC3، نوع 3 من الخلايا اللمفاوية الفطرية؛ mono-Mماكروفاج مشتق من وحيدات النواة؛ NK، خلية قاتلة طبيعية؛ Tfh، خلايا المساعدة الجريبية T؛ Th17، نوع 17 من خلايا المساعدة T؛ Treg، خلية تنظيمية T؛ Trm، ذاكرة مقيمة في الأنسجة. E التوزيعات المكانية المشتركة لتوقيعات TLS مع أنواع خلايا متنوعة عبر أنواع السرطان. DC، خلية دندريتية؛ Treg، خلية تنظيمية T. يتم توفير بيانات المصدر كملف بيانات مصدر. تظهر نتائجنا أنه على الرغم من التباين العالي المدمج في نظم الأنسجة البيئية، فإن برامج التعبير الجيني الشاملة موجودة عبر أنواع خلايا متنوعة. قد تفسر هذه البرامج العالمية للتعبير الجيني التطبيق الواسع للعلاج المناعي (مثل مثبطات PD-1/PD-L1 ومثبطات CTLA4) في مجموعة متنوعة من السرطانات، على عكس العلاج المستهدف الذي له مؤشرات محدودة في أنواع معينة من السرطان. الدراسات الشاملة في المستقبل ضرورية لكشف الدور المناعي لجينات العلامات المميزة للبيئة المجهرية للورم، والتي قد تمثل نقاط تفتيش مناعية أو أهداف علاجية في البيئة المجهرية للورم لأنواع السرطان المتنوعة.
تتميز دراستنا بتحقيق شامل لحالات الميزانشيم في الأنسجة الورمية والطبيعية. على وجه الخصوص، حددناوحالات الألياف الالتهابية، التي أظهرت أنماط تزامن مشابهة مع حالة التنشيط الناتجة عن PRR وملفات التعبير الجيني للسيتوكينات. على الرغم من أنه تم التعرف على هذه المجموعات من الألياف الالتهابية سابقًا في عدة أنواع من السرطان.تقدم دراستنا استكشافًا مفصلًا وكشفت عن الفروق بين هذه المجموعات من حيث تفضيلات الأنسجة والأعضاء، والتفاعلات الخلوية، وأنماط التوضع المكاني، مما يبرز الحاجة إلى أطلس تكاملي.تمتاز حالة الخلايا الليفية بوجود جينات مثل AKR1C1 وCXCL8 وCXCL2 وCXCL3 وTNFAIP6 التي تتنبأ باستجابات سلبية للعلاج المناعي.. لذلك، استهداف الـقد تقدم الخلايا الليفية الالتهابية رؤى علاجية جديدة، خاصة في سرطان المبيض وسرطان بطانة الرحم. ومن المثير للاهتمام،لقد أظهرت الخلايا الليفية الالتهابية أنها تتفاعل مع مكونات متنوعة من بيئة الورم، مما يشكل بيئة التهابية ومؤيدة للورم عبر WNT5A وGREM1 وIL24.الدراسات المستقبلية التي تستهدف علاجياًيجب السعي وراء الألياف الالتهابية لتخفيف العواقب الضارة المرتبطة بهذه الألياف المسببة للورم. علاوة على ذلك، أظهرت الألياف العضلية في دراستنا غنىً نسبياً أعلى في الأنسجة الطبيعية مقارنةً بالنتائج التي توصلت إليها الدراسة السابقة الشاملة للسرطان.من الجدير بالذكر أن دراستنا شملت عينات من الأورام وعينات طبيعية من أعضاء مختلفة، وأن تركيز الأنسجة من الخلايا الليفية العضلية يمثل نتيجة شاملة عبر جميع الأعضاء (الشكل 3E). أظهر التحليل حسب الأعضاء تركيز الخلايا الليفية العضلية في أنسجة الأورام في الثدي والبنكرياس والكبد والكلى (الشكل التكميلي S18C)، مما يشير إلى دور محتمل لهذه الخلايا الليفية في تكوين الأورام في هذه الأعضاء.ومع ذلك، كان تركيز الخلايا العضلية الليفية في الورم والطبيعي في القولون والمعدة متشابهاً، مما يتماشى مع الدراسات السابقة التي وثقت وجود الخلايا العضلية الليفية في الأمعاء الطبيعية..
تعتبر حالات الخلايا المتنوعة الناتجة عن أنواع خلايا متميزة، والتي كانت العديد منها مكونات من المجتمع الغني بالإنترفيرون، ملائمة للعلاج المناعي. بينما تم تحديد TLS سابقًا كمؤشر لاستجابة العلاج المناعي.نؤكد أن كلا من أنواع الخلايا الغنية بـ TLS وغير الغنية بها تساهم بشكل إيجابي في استجابات العلاج المناعي. علاوة على ذلك، فإن توقيع TLS لدينا، الذي يميز بفعالية بين مواقع TLS وغير TLS في مرضى RCC، يتنبأ باستجابات إيجابية للعلاج المناعي ويتوحد بنجاح مع أنواع الخلايا الغنية بـ TLS في أنواع السرطان المختلفة. ومع ذلك، لا يزال يتعين تأكيد ما إذا كانت أنواع الخلايا الغنية بـ TLS قابلة للمقارنة في الأنسجة المحددة بـ TLS لأنواع السرطان الأخرى غير RCC. بالإضافة إلى ذلك، تم تحديد حالات متعددة تؤدي إلى استجابات سلبية لكتلة نقاط التفتيش، مما يبرز الحاجة إلى خيارات علاجية بديلة. للتأكيد، على الرغم من أن هذه الحالات الخلوية المتنبئة بالعلاج المناعي لم تظهر أي دلالة تنبؤية على مجموعات TCGA، إلا أن العلاج المناعي أظهر استجابات علاجية مختلفة وفقًا للحالات الخلوية لكل نوع من أنواع السرطان، مما يشير إلى أن آليات متميزة تسود خلال مسار علاج المناعة عبر أنواع السرطان.
تقدم دراستنا وجهة نظر مميزة من خلال إنشاء أطلس شامل يجمع بين الخلايا الفردية، والفضاء، و مجموعة البيانات الكبيرة المعالجة بالعلاج المناعي، ومن خلال المقارنة المنهجية بين نظم الأورام والعادية عبر أعضاء متنوعة. وقد أتاح لنا ذلك كشف التوقيعات الجينية المميزة لنظم الأورام والعادية، وتحديد الفروق بين AKR1C1والخلايا الليفية الالتهابية، وتوصيف أنواع الخلايا الغنية وغير الغنية بـ TLS بين المكونات المواتية للعلاج المناعي. ستوفر خريطة الخلايا المفردة للورم الطبيعي عبر السرطان المقدمة في الدراسة رؤى أساسية لفهم أعمق للأنظمة البيئية للورم الطبيعي وتضع الأساس للدراسات المستقبلية في علم الأورام الدقيق. لفائدة مجتمع البحث، يمكن الوصول إلى خريطتنا من خلال مستودع زينودو (DOI:10.5281/zenodo.10651059) وبوابة الويب.https://cellatlas. kaist.ac.kr/ecosystem/).
طرق
موافقة الأخلاقيات والموافقة على المشاركة
تمت الموافقة على دراسة مجموعة العلاج المناعي من قبل مجلس المراجعة المؤسسية لمركز سامسونغ الطبي (SMC 2018-03-130). قدم جميع المرضى المشاركين في الدراسة موافقة خطية مستنيرة.
مجموعة مرضى سرطان الرئة المعالجة بالعلاج المناعي
مرضى سرطان الغدة الرئوية وسرطان الخلايا الحرشفية الرئوية المؤكدين نسيجياً، بما في ذلك الحالات المبلغ عنها سابقاًتم تجنيد المرضى الذين تم علاجهم إما بمثبطات PD-1 أو PD-L1. تم جمع المعلومات السريرية لهذه المجموعة من السجلات الطبية الإلكترونية وتم تقييم استجابة الورم باستخدام معايير تقييم الاستجابة في الأورام الصلبة (الإصدار 1.1). تم تعريف البقاء بدون تقدم (PFS) على أنه الوقت من بدء مثبطات PD-1/PD-L1 حتى تاريخ تسجيل تقدم المرض أو الوفاة لأي سبب، أيهما حدث أولاً. تم تعريف البقاء العام (OS) على أنه الوقت من بدء مثبطات PD-1/PD-L1 حتى الوفاة لأي سبب (البيانات التكميلية 8). تم استخدام مجموعة AllPrep DNA/RNA Mini Kit (Qiagen، الولايات المتحدة الأمريكية) لتنقية RNA من عينات الورم المثبتة بالفورمالين والمحفوظة في البارافين (FFPE) أو عينات الورم الطازجة. بعد ذلك، تم استخدام NanoDrop وBioanalyzer (Agilent، الولايات المتحدة الأمريكية) لقياس تركيز RNA ونقاوته. تم إعداد المكتبة باستخدام إما مجموعة TruSeq RNA Library Prep Kit v2 (Illumina، الولايات المتحدة الأمريكية) أو مجموعة TruSeq RNA Access Library Prep Kit (Illumina، الولايات المتحدة الأمريكية)، وفقًا لتعليمات الشركة المصنعة. في المجموع، قمنا بإنشاء بيانات النسخ الجيني لـ 497 مريضًا مصابًا بسرطان الرئة الذين تم علاجهم بالعلاج المناعي.
معايير إدراج بيانات الخلايا المفردة وجمعها
لانتقاء البيانات، بحثنا أولاً عن مجموعات بيانات 10x scRNA-seq ذات الصلة لتوحيد وتقليل مشكلات الدفعات الناجمة عن كيميائيات مختلفة. تم البحث عن مجموعات البيانات وتنزيلها من PubMed وGoogle Scholar وGene Expression Omnibus وSingle Cell Portal (https://singlecell.broadinstitute.org/single_cellخريطة خلايا كوفيد-19 (https:// www.covid19cellatlas.org/وخرائط خلايا السرطان المنسقة (https:// www.weizmann.ac.il/sites/3CA/).
كانت معايير الإدراج كما يلي: الدراسات التي تم إنتاجها من مجموعات أدوات 10xgenomics والدراسات التي تشمل السرطان، والأورام ما قبل السرطانية، والأورام الحميدة، والعينات الطبيعية. من بين عينات التحكم الطبيعية، تم جمع الأنسجة غير الخبيثة المأخوذة من مرضى السرطان (المعلمة كطبيعي مجاور) والأنسجة من الأفراد الأصحاء الطبيعيين (المعلمة كطبيعي) بشكل منفصل. الدراسات التي تشمل فقط الخلايا المفروزة (مثل؛ CD45تم استبعاد العينات السائلة (مثل؛ الاستسقاء، السائل الدماغي الشوكي، أو خلايا الدم المحيطية)، وزراعة خلايا الخطوط الخلوية، والدراسات على الفئران، والدراسات الناتجة عن تسلسل النوى. بشكل إجمالي، تم جمع وتكامل 104 مجموعة بيانات من تسلسل RNA أحادي الخلية تضم 1070 ورمًا، و493 عينة طبيعية (عينة طبيعية مجاورة + عينة طبيعية صحية)، وحوالي 4.9 مليون خلية من 999 فردًا (البيانات التكميلية 1).
تحليل بيانات تسلسل RNA أحادي الخلية
تم إعادة محاذاة أعمدة الجينات في كل مجموعة بيانات وفقًا لجينوم المرجع البشري GRCh38 (مرجع Cell Ranger الرسمي،
الإصدار 2020-A). بالنسبة لكل مجموعة بيانات، تم اعتبار الخلايا التي تحتوي على أقل من 1000 عدد UMI و500 جين مكتشف كقطرات فارغة وتمت إزالتها من مجموعة البيانات. تم اعتبار الخلايا التي تحتوي على أكثر من 7000 جين مكتشف كأزواج محتملة وتمت إزالتها من مجموعة البيانات. تم استخدام حزمة Scanpy (v.1.8.2) بلغة بايثون لتحميل مصفوفة عدد الجينات الخلوية وللتحليل . تم إجراء التجميع والتعليق والتحليل اللاحق باستخدام الأدوات في حزمة Scanpy مع بعض الأكواد المخصصة. تم استخدام Scrublet لاكتشاف الأزواج .
لتقليل العبء الحسابي وتسريع التحليل اللاحق، تم اختيار مجموعة فرعية من الخلايا لكل مجموعة بيانات باستخدام رسم هندسي يعكس التنوع النسخي ويحافظ على أنواع الخلايا النادرة (الشكل 1B-D والشكل التكميلي S1A).
تعليق نوع الخلية وتصحيح الدفعة
قمنا بدمج جميع بيانات scRNA-seq للأورام الطبيعية وقمنا بتقسيم مجموعات البيانات لتقليل العبء الحسابي، وتصوير، وتعليق الخلايا. تم استخدام BBKNN كخوارزمية تصحيح تأثير الدفعة لإنشاء هيكل رسم بياني متصل ، وبعد الحصول على UMAP على نطاق عالمي، تم إجراء التعليقات بناءً على جينات علامات نوع الخلية المحددة (الشكل التكميلي S1B). ثم، قمنا بفحص وتنقيح التعليقات الرئيسية لأنواع الخلايا لكل مجموعة بيانات.
استنتاج تغير عدد النسخ لتحديد الخلايا الخبيثة
تم استنتاج تغير عدد النسخ (CNV) للخلايا الخبيثة بناءً على النسخ الجيني للخلايا المفردة باستخدام inferCNVpy (باستخدام الحزمة المتاحة على https://github.com/icbi-lab/infercnvpy, v.0.4.2) مع حجم نافذة افتراضي وgencode v29 كمرجع لموقع الجينوم. استخدمنا infercnvpy.tl.infercnv لاستنتاج CNV واخترنا خلايا المناعة الطبيعية أو الخلايا الليفية كخلايا طبيعية مرجعية اعتمادًا على نوع السرطان. بعد تقليل الأبعاد (infercnvpy.tl.pca) والتجميع بناءً على ملفات تعريف CNV (infercnupy.tl.leiden)، تم تصوير الخلايا على UMAP CNV (infercnvpy.tl.umap) وتم حساب درجات CNV باستخدام infercnvpy.tl.cnv_score. تم تعريف الخلايا الخبيثة المحتملة بناءً على معيارين: (i) تشكيل مجموعات منفصلة، وهي خاصية معروفة للخلايا الخبيثة ، و(ii) درجات CNV أعلى مقارنة بأنواع الخلايا الطبيعية المعروفة (الظهارية الطبيعية، الخلايا الليفية، أو خلايا المناعة بناءً على كل نوع سرطان).
قمنا بتطبيق خوارزمية AND-gating لاستخراج توقيعات الجينات الغنية بالأورام أو المفضلة للعلاج المناعي لكل نوع خلية عبر سرطانات مختلفة (الشكل التكميلي S2A). تم تقسيم الخلايا من عضو معين وتم إجراء تحليل التعبير التفاضلي لتحديد الجينات التي كانت (i) مرتفعة التعبير في نوع الخلية المعني مقارنة بأنواع الخلايا الأخرى ( fold-change ) و(ii) معبرة بشكل كبير في نوع الخلية المعني في أنسجة الأورام (أو المستجيبين للعلاج المناعي) مقارنة بالأنسجة الطبيعية (أو غير المستجيبين للعلاج المناعي؛ fold-change وتم تعديلها . تم الاحتفاظ بالجينات التي استوفت كلا الشرطين لإنشاء توقيعات جينية خاصة بالأورام/مفضلة للعلاج المناعي. تم حساب القيم باستخدام اختبار ذو جانبين على مصفوفات الجينات المعدلة لوغاريتميًا وتم تعديلها باستخدام طريقة بنجاميني-هوشبرغ (حزم بايثون scipy.stats v.1.10.0 وstatsmodels.stats v.0.13.5). بعد الحصول على توقيعات الجينات المستمدة من AND-gating لكل نوع خلية وعضو، قمنا بدمج توقيعات الجينات من عدة أعضاء لتحديد توقيعات الجينات المميزة لكل نوع خلية.
التعليق البيولوجي لتوقيعات الجينات المميزة لنظم الأورام الطبيعية
استخدمنا Enrichr لتعليق الوظائف البيولوجية لتوقيعات الجينات المميزة الخاصة بالأورام عبر أنواع الخلايا المتنوعة. نحن
استخدمنا مصطلحات GO من MsigDB Hallmark 2020، GO Biological Process 2023، وGO Molecular Function 2023، وتم اعتبار المصطلحات التي تحتوي على تعديل كأهمية (الشكل 2C).
التحضير المسبق NMF والتصوير
بعد تعليق نوع الخلية، قمنا بإجراء NMF لكل نسيج فردي بشكل منفصل، مع الأخذ في الاعتبار كل فئة نوع خلية وأصل النسيج، لإنشاء حالات خلوية تساهم في التباين داخل كل فرد. بدءًا من مصفوفة التعبير المركزية المعدلة لوغاريتميًا لجميع الجينات، تم تعيين القيم السلبية إلى صفر. تم تطبيق طريقة sklearn.decomposition.NMF مع المعلمات الافتراضية كما هو مطبق في حزمة scikit-learn بلغة بايثون v1.0.2. نظرًا لأن NMF يتطلب معلمة K التي تؤثر على النتائج، قمنا بتشغيل NMF باستخدام قيم مختلفة ()، مما أدى إلى إنشاء 35 وحدة لكل فرد.
بعد ذلك، قمنا بتطبيق نهج رسومي لتجميع وتصوير وحدات NMF. أولاً، قمنا بتطبيع القيم القصوى ودمج جميع الوحدات المستمدة من كل نوع خلية وتحويلها إلى كائن anndata. بعد اختيار الجينات ذات التباين العالي، قمنا بإزالة الوحدات ذات الجودة المنخفضة (الوحدات التي تحتوي على وزن NMF أقل من 10-20 أو أكبر من 150-170، اعتمادًا على كل نوع خلية). تم إجراء تقليل الأبعاد باستخدام المكونات الرئيسية وتم تصوير UMAP، وتمت إزالة مجموعات الوحدات الصغيرة التي تحتوي على أقل من 150 وحدة. ثم تم إجراء تجميع Leiden وتم اشتقاق قائمة بأفضل 50 جينًا لكل مجموعة. ثم قمنا بإزالة المجموعات الغنية إما بجينات البروتين الريبوسومي أو الجينات المشفرة للميتوكوندريا، المكونة من وحدات NMF من دراسة واحدة، والمشتبه بها لتعكس خلايا الأزواج أو تأثير الحساء بناءً على التشابه العالي مع ملف التعبير من نوع خلية آخر (على سبيل المثال؛ جينات خلايا T في وحدات NMF الميزانشيمية).
أتمتة إزالة مجموعات الأزواج أو تأثير الحساء
لتحديد وإزالة مجموعات وحدات NMF (حالات الخلايا) التي تشير إلى خلايا الأزواج أو تأثير الحساء، قمنا ببناء خوارزمية لأتمتة اكتشاف مجموعات الأزواج أو تأثير الحساء. بالتفصيل، حددنا العضوين (عضو واحد فقط إذا كان هناك أكثر من 2 -fold اختلافات في عدد وحدات NMF بين العضوين السائدين) اللذين يشكلان غالبية مجموعة NMF المعنية. ثم قمنا بتقسيم الأعضاء المقابلة في رسمنا الهندسي anndata لمتاتلاس الأورام الطبيعية لدينا. مع أفضل 50 جينًا المستمدة من المجموعة، قمنا بتسجيل كل فئة نوع خلية في anndata المقسمة باستخدام وظيفة sc.tl.score في حزمة Scanpy. إذا كانت الدرجات أكبر من 0.2 في نوع خلية مختلف (على سبيل المثال، خلايا T) مقارنة بنوع الخلية المعني (على سبيل المثال، الميزانشيمية)، تم تعريف المجموعة كمجموعة أزواج أو مجموعة تأثير الحساء وتمت إزالتها لاحقًا. لم يتم التخلص من المجموعات ذات الدرجات الميزانشيمية الأعلى من حالات الخلايا الظهارية لمنع إزالة حالة EMT.
تحديد وتعليق حالات الخلايا
بعد تصوير وحدات NMF وتجميع الحالات، تم تحديد أفضل 50 جينًا بمتوسطات مرجحة لكل حالة. بالنسبة للجينات المتداخلة بين حالات الخلايا، قمنا بتعيين الجينات بشكل عمودي إلى الحالة ذات المتوسط المرجح الأعلى (البيانات التكملية 2). تم استخدام Azimuth (https://azimuth.hubmapconsortium.org/), أطلس البروتين البشري (https://www.proteinatlas.org/), وEnrichr كمراجع رئيسية لتعليق حالات الخلايا. أيضًا، للتحقق من صحة حالات الخلايا لدينا، قمنا بمقارنة حالاتنا مع توقيعات الجينات المستمدة من دراسات أخرى باستخدام معامل ارتباط بيرسون (الشكل التكميلي S4).
بناء مكونات مرجعية مع حالات الخلايا
لتقييم العلاقة بين حالات الخلايا وأنواع الخلايا الفرعية، قمنا بإسقاط الخلايا باستخدام ملفات تعريف حالات الخلايا المحددة كمرجع . بالنسبة لحالات الخلايا من كل فئة نوع خلية، تم تحديد الجينات العمودية ذات المتوسطات المرجحة لكل منها
الدولة (انظر تعريف وتوضيح حالات الخلايا). ثم، تم إزالة دورات الخلايا وحالات الخلايا المستمدة من RNAs المحيطة أو الثنائيات، وتم اختيار الجينات التي تشكل الحالات المتبقية كجينات متغيرة في مجموعة بيانات scRNA-seq المعالجة لوغاريتمياً. تم بناء المكونات المرجعية من خلال إجراء ضرب المصفوفات بين بيانات scRNA-seq anndata ومتوسطات حالات الخلايا الموزونة (RCA=anndata.X.dot(cell state weighted average)). تم استخدام هذه المكونات المرجعية لاستبدال المكونات الرئيسية، وبعد ذلك، تم تنفيذ BBKNN، باستخدام مجموعة البيانات كدفعة . ثم، تم إجراء التوضيحات النهائية لأنواع الخلايا بناءً على جينات العلامات المحددة لنوع الخلايا (الشكل 3B، D والأشكال التكميلية S6 و7).
قياس توزيعات درجات حالة الخلية وتحليل التوافق
لتحديد أي حالات خلوية غنية في خلايا كل فرد، قمنا بتسجيل كل فرد باستخدام الجينات المتعامدة لحالات الخلايا باستخدام وظيفة sc.tl.score genes لقياس درجات حالة الخلية. بالنسبة لـ 8 أنواع من السرطان التي تشكل الغالبية من أطلس السرطان الشامل (BRCA، CRC، HCC، HNSC، LC، OV، PAAD، وRCC)، قمنا بحساب المتوسطات لكل فرد، وتم إجراء ارتباط بيرسون بين حالات الخلايا لقياس التوافق. لكل توافق بين حالات الخلايا، تم حساب القرب باستخدام حزمة WGCNA (v.1.71) , وتم تصوير مخطط Circos باستخدام حزمة circlize (v.0.4.15). سمك الخطوط في مخطط Circos يتوافق مع القرب بين حالات الخلايا.
نسبة الملاحظات إلى المتوقع لحالات الخلايا
لتحديد تفضيل الأنسجة أو الأعضاء لحالات الخلايا، قمنا بحساب نسبة الملاحظات إلى المتوقع (Ro/e). لتحديد Ro/e الأنسجة، أنشأنا جدول طوارئ عن طريق عد حدوث أصول الأنسجة (أي؛ طبيعي، طبيعي مجاور، وورم) من وحدات NMF من حالة الخلية المعنية وغيرها. للنظر في الأنسجة وأصول الأعضاء عند حساب Ro/e، قمنا أولاً باستخراج وحدات NMF من حالة خلوية، وتحديد نسب أصول الأعضاء داخل هذه الوحدات، وتصفيتها من تلك المستمدة من الأعضاء التي تشكل أقل من . ثم، لكل أصل نسيجي، تم إنشاء جدول طوارئ عن طريق عد حدوث أصول الأعضاء من وحدات NMF من حالة الخلية المعنية مقابل حالات الخلايا الأخرى. تم اشتقاق عدد متوقع باستخدام تحليل كاي-تربيع وتم حساب Ro/e كـ ملاحظ. اعتبرنا حالة خلوية غنية أو ناقصة في نسيج/عضو معين إذا كان Ro/e أو Ro/ , على التوالي.
تحليل تفاعل الليغاند-المستقبل
لفهم الخصائص الوظيفية لـ و الألياف الالتهابية، قمنا بالتحقيق في التفاعلات الخلوية المحتملة بين و الألياف الالتهابية مع أنواع خلايا أخرى باستخدام أدوات استنتاج تفاعل الخلايا مثل CellPhoneDB (v.3.1.0) , مع التركيز على برامج التعبير الجيني المحددة لهذين الألياف الالتهابية. تم حساب شدة التفاعل من خلال ضرب قيم التعبير المعالجة لليغاندات والمستقبلات في كل زوج من الخلايا.
RNA smFISH
تم إجراء RNA smFISH على مقاطع الأنسجة FFPE المأخوذة من الستروما الدسملويدية في مرضى CRC وHNSC. استخدمنا مجسات RNAscope تستهدف WNT5A البشرية (AD604921، 1:1500، Opal 570)، GREM1 (AD312831-C2، 1:1500، Opal 690)، وPDGFRA (AD604481-C3، 1:3000، Opal 520) لتحديد الألياف الالتهابية، وCXCL10 (AD311851، 1:1500، Opal 570) وPDGFRA (AD604481-C2، 1:3000، Opal 520) لتحديد الألياف التي تعبر عن الإنترفيرون. تم إزالة البارافين من مقاطع الأنسجة FFPE بسماكة خمسة باستخدام الزيلين وتمت معالجتها بعد ذلك باستخدام مجموعة أدوات RNAscope Multiplex Fluorescent Reagent Kit Assay، وفقًا لتعليمات الشركة المصنعة. تم الحصول على صور الفلورية باستخدام مجهر ZEISS LSM 980 المجهري
باستخدام FITC (Opal 520)، TRITC (Opal 570)، Cy5.5 (Opal 690)، وقنوات DAPI.
تحليل البقاء باستخدام النسخ الجيني الكلي
لتقييم القيمة التنبؤية لحالات الخلايا وتوقيعات العلامات في كل نوع من السرطان، قمنا بإجراء تحليل البقاء باستخدام بيانات TCGA RNA-seq. تم جمع بيانات FPKM المعالجة من الربع العلوي من UCSC Xena عبر 28 نوعًا من السرطان . تم الحصول على بيانات TCGA السريرية (OS) من البيانات المقدمة من مورد بيانات TCGA PanCancer السريرية . تم حساب غنى حالات الخلايا وتوقيعات العلامات لكل عينة سرطان أولية من TCGA باستخدام وظيفة تحليل غنى مجموعة الجينات ذات العينة الواحدة (ssGSEA) المطبقة في حزمة Corto (v.1.1.10) . تم تقسيم المرضى إلى مجموعات ناقصة وغنية بناءً على متوسط درجة حالة الخلية للعينات التي تم تحليلها. تم رسم منحنيات كابلان-ماير باستخدام وظيفة ggsurvplot وتم إجراء اختبار logrank لتحديد الأهمية الإحصائية. تم تطبيق طريقة بنجاميني-هوشبرغ لتصحيح الاختبارات المتعددة. لتقييم الأهمية التنبؤية لحالات الخلايا في الأعضاء ذات الصلة، حددنا عتبة تصفية Ro/e لكل نوع خلية باستخدام الصيغة التالية:
حددنا حالات الخلايا على أنها نادرة داخل عضو إذا كانت قيم Ro/e المستمدة من الورم لتلك الحالات داخل ذلك العضو لا تتجاوز عتبة التصفية. هذا منع فك تشفير حالات الخلايا النادرة التي لا تتعلق بتحليلات البقاء للأعضاء المحددة.
بناء الشبكة مع حالات الخلايا
قمنا ببناء شبكة غير موجهة مع حالات الخلايا لتصور أنماط تواجدها المشترك. عند بناء كل شبكة نسيج، استخدمنا حالات الخلايا التي تم تحديدها في الأصل النسيجي المقابل (على سبيل المثال، الألياف الالتهابية في شبكة الورم فقط). بعد حساب التواجد المشترك لحالات الخلايا، تم حساب مصفوفة القرب باستخدام حزمة WGCNA (v.1.71) . تم تعيين قيم القرب لزوج حالات الخلايا التي لديها قيمة أكبر من 0.05 إلى 0 لتقليل التأثيرات الزائفة. ثم، تم استيراد مصفوفة القرب إلى gephi (v.0.10.1) لبناء شبكة متصلة . قمنا بإجراء اكتشاف المجتمع مع المعلمات الافتراضية، ولوننا العقد مع فئة التمايز، وزدنا حجم العقد مع الدرجة المتوسطة الموزونة. اخترنا ForceAtlas2 لتضمين الرسم البياني.
جمع ومعالجة بيانات النسخ الجيني لفرق العلاج المناعي
قمنا بجمع النسخ الجيني الكلي لفرق العلاج المناعي (4 أنواع من السرطان، 8 فرق). تم إنتاج بيانات النسخ الجيني لفريق LC بواسطة مركز سامسونغ الطبي (فريق LC الخاص بنا، ; انظر فريق سرطان الرئة المعالج بالعلاج المناعي لدينا). بالنسبة لفرق MEL، تم جمع بيانات Van Allen وآخرون. , وGide وآخرون. , وRiaz وآخرون. , وHugo وآخرون. مع فرق BLCA بواسطة Mariathasan وآخرون. , وتم جمع فرق RCC بما في ذلك McDermott وآخرون. وMiao وآخرون. أيضًا . بالنسبة لجميع الفرق، تم الحصول على ملفات FASTQ الخام ومعالجتها في خط أنابيب موحد (الشكل 5D). أولاً، تم قص تسلسلات المحولات في ملف FASTQ بواسطة Trimmomatic (v.0.39) . لتصفية rRNA، تم استخدام SortMeRNA (v.2.1b) . تم محاذاة القراءات المصفاة إلى الجينوم المرجعي hg38 بواسطة محاذي STAR (v.2.7.6a) في وضع أساسي ذو تمريرين مع توضيح gencode (v.35) . ثم تم فرز القراءات بواسطة samtools (v.1.7) وتم حساب عدد القراءات بواسطة HTSeq (v.0.12.4) . لتحديد التعبير الجيني، تم تطبيع عدد القراءات في قيمة TPM.
تحليل فرق العلاج المناعي
تم إجراء ssGSEA باستخدام gseapy (v.0.10.8) لتسجيل حالة الخلية لكل عينة وتم استخدام درجة الغنى المعالجة في التحليل . بالنسبة لتحليلنا الشامل للسرطان، تم تضمين العينات التي تحتوي على بيانات الاستجابة والبقاء فقط؛ تم تصنيف المرضى الذين حصلوا على فوائد سريرية دائمة (استجابة كاملة، استجابة جزئية، مرض مستقر مع PFS >6 أشهر أو OS > 1 سنة) على أنهم مستجيبون، والآخرون على أنهم غير مستجيبين. ثم أجرينا تحليلًا ميتا لتحديد العلاقات بين الاستجابة السريرية للعلاج المناعي وحالات الخلايا في عدة فرق. أولاً، تم ملاءمة درجة التوقيع المقاسة للاستجابة السريرية باستخدام الانحدار اللوجستي لكل فريق. ثم تم تجميع التقديرات المحسوبة والأخطاء المعيارية عبر الفرق باستخدام وظيفة metagen في حزمة meta . أخيرًا، وبالنظر إلى التباين بين الدراسات، تم إنشاء نموذج التأثير العشوائي لتقدير تأثير حالات الخلايا. من نموذج التأثير العشوائي، التقدير العام، الخطأ المعياري، وتم الحصول على القيم.
تحليل النسخ الجيني المكاني الشامل للسرطان
تم إجراء تحليل النسخ الجيني المكاني لـ 137 مجموعة بيانات سرطانية عبر 11 نوعًا من السرطان باستخدام cell2locationاستخدام المعلمات الافتراضية لتحديد التوزيع المكاني لأنواع الخلايا (الشكل 6A). لكل نوع من أنواع السرطان في النسخ الجينية المكانية، استخدمنا مجموعات بيانات scRNA-seq الخاصة بالسرطان من أطلس الخلايا الفردية الشامل كمرجع. ثم، استخدمنا معامل الارتباط بيرسون على مستوى النقاط مع تقدير وفرة أنواع الخلايا لتحديد أنماط التوضع المكاني المتزامن، على غرار الدراسات السابقة.أشار معامل الارتباط بيرسون الإيجابي العالي إلى أن نوعي الخلايا أظهرا توزيعات مكانية مشابهة، بينما اقترح معامل الارتباط بيرسون السلبي توزيعات مكانية مميزة بين نوعي الخلايا.
بناء توقيع جين TLS وتحديد أنواع الخلايا الغنية بـ TLS
لإنشاء توقيع TLS وتحديد أنواع الخلايا الغنية في TLS باستخدام بيانات النسخ الجيني المكاني من RCC مع معلومات عن نقاط TLS المحددة مرضيًاتم تجميع مصفوفة زائفة للكتلة لكل من نقاط TLS وغير TLS في كل عينة، وتم إجراء تحليل التعبير التفاضلي اللاحق باستخدام PyDESeq2 (الإصدار 0.4.3).. من الجينات التي تظهر تعديلاً، اخترنا أفضل 50 جينًا بأعلىتم قياس قيم التغير النسبي (البيانات التكميلية 7). تم تقدير إثراء توقيع جينات TLS باستخدام دالة sc.tl.score من حزمة Scanpy لكل نقطة، مما يتيح تحديد النقاط الغنية بتوقيع TLS في أنسجة النسخ الجيني المكاني.لتحديد أنواع الخلايا الغنية بـ TLS، قمنا بمقارنة وفرة الخلايا بين نقاط TLS ونقاط غير TLS باستخدام اختبار ويلكوكسون للرتب الموقعة (حزم بايثون scipy.stats v.1.10.0) ووصفنا أنواع الخلايا التي تتواجد بكثرة في TLS (الشكل 6B).
ملخص التقرير
معلومات إضافية حول تصميم البحث متاحة في ملخص تقارير مجموعة ناتشر المرتبط بهذه المقالة.
توفر البيانات
تتوفر مجموعات بيانات scRNA-seq و transcriptome المكاني التي تم تحليلها في هذه الدراسة في البيانات التكميلية 1 و 3 و 5، مع رموز الوصول والروابط الخاصة بها. تتوفر بيانات scRNA-seq و transcriptome المكاني المعالجة في مستودع زينودو (DOI:10.5281/ zenodo.10651059).تم إيداع بيانات مجموعة سرطان الرئة المعالجة بالعلاج المناعي التي تم الحصول عليها في هذه الدراسة في مستودع Gene Expression Omnibus تحت رمز الوصول GSE218989. كما تم إيداع بيانات التسلسل الخام لمجموعة سرطان الرئة المعالجة بالعلاج المناعي في أرشيف الجينوم والظواهر الأوروبي (EGA). تحت وصول مُراقب برقم الإضافة EGAD50000000469. ستتم مراجعة طلبات البيانات للأغراض الأكاديمية أو الفكرية من قبل لجنة الوصول إلى البيانات، ومن المتوقع أن يتم الرد عليها خلال 4 أسابيع. يمكن تصور مجموعة البيانات الخاصة بنا بشكل تفاعلي فيhttps://cellatlas. kaist.ac.kr/ecosystem/تم توفير بيانات المصدر مع هذه الورقة.
Hanahan, D. & Weinberg, R. A. Hallmarks of cancer: the next generation. Cell 144, 646-674 (2011).
Patel, A. P. et al. Single-cell RNA-seq highlights intratumoral heterogeneity in primary glioblastoma. Science 344, 1396-1401 (2014).
Puram, S. V. et al. Single-cell transcriptomic analysis of primary and metastatic tumor ecosystems in head and neck cancer. Cell 171, 1611-1624.e24 (2017).
Bassez, A. et al. A single-cell map of intratumoral changes during anti-PD1 treatment of patients with breast cancer. Nat. Med. 27, 820-832 (2021).
Cheng, S. et al. A pan-cancer single-cell transcriptional atlas of tumor infiltrating myeloid cells. Cell 184, 792-809.e23 (2021).
Zheng, L. et al. Pan-cancer single-cell landscape of tumorinfiltrating T cells. Science 374, abe6474 (2021).
Barkley, D. et al. Cancer cell states recur across tumor types and form specific interactions with the tumor microenvironment. Nat. Genet. 54, 1192-1201 (2022).
Gavish, A. et al. Hallmarks of transcriptional intratumour heterogeneity across a thousand tumours. Nature 618, 598-606 (2023).
Giraldo, N. A. et al. The clinical role of the TME in solid cancer. Br. J. Cancer 120, 45-53 (2019).
Burgos-Panadero, R. et al. The tumour microenvironment as an integrated framework to understand cancer biology. Cancer Lett. 461, 112-122 (2019).
Shelton, S. E., Nguyen, H. T., Barbie, D. A. & Kamm, R. D. Engineering approaches for studying immune-tumor cell interactions and immunotherapy. iScience 24, 101985 (2021).
Sautès-Fridman, C., Petitprez, F., Calderaro, J. & Fridman, W. H. Tertiary lymphoid structures in the era of cancer immunotherapy. Nat. Rev. Cancer 19, 307-325 (2019).
Schumacher, T. N. & Thommen, D. S. Tertiary lymphoid structures in cancer. Science 375, eabf9419 (2022).
Jorgovanovic, D., Song, M., Wang, L. & Zhang, Y. Roles of IFN- y in tumor progression and regression: a review. Biomark. Res. 8, 49 (2020).
Li, H. et al. Reference component analysis of single-cell transcriptomes elucidates cellular heterogeneity in human colorectal tumors. Nat. Genet. 49, 708-718 (2017).
Di Federico, A. et al. Immunotherapy in pancreatic cancer: why do we keep failing? A focus on tumor immune microenvironment, predictive biomarkers and treatment outcomes. Cancers 14, 2429 (2022).
Delacher, M. et al. Rbpj expression in regulatory T cells is critical for restraining TH2 responses. Nat. Commun. 10, 1621 (2019).
Sadik, A. et al. IL4II is a metabolic immune checkpoint that activates the AHR and promotes tumor progression. Cell 182, 1252-1270.e34 (2020).
Zhang, Y., Du, W., Chen, Z. & Xiang, C. Upregulation of PD-L1 by SPP1 mediates macrophage polarization and facilitates immune escape in lung adenocarcinoma. Exp. Cell Res. 359, 449-457 (2017).
Li, H., Liu, W., Zhang, X. & Wang, Y. Cancer-associated fibroblastsecreted collagen triple helix repeat containing-1 promotes breast cancer cell migration, invasiveness and epithelial-mesenchymal
transition by activating the Wnt/ -catenin pathway. Oncol. Lett. 22, 814 (2021).
Gieniec, K. A., Butler, L. M., Worthley, D. L. & Woods, S. L. Cancerassociated fibroblasts-heroes or villains? Br. J. Cancer 121, 293-302 (2019).
Pan, E. et al. Characterization of FOLH1 expression in renal cell carcinoma (RCC). J. Clin. Orthod. 41, 713-713 (2023).
Wang, Y. et al. Silencing LINC00482 inhibits tumor-associated inflammation and angiogenesis through down-regulation of MMP15 via FOXA1 in bladder cancer. Aging 13, 2264-2278 (2020).
Kim, W. K. et al. Identification of specifically activated angiogenic molecules in HMGB-1-induced angiogenesis. BMB Rep. 50, 590-595 (2017).
Dalod, M., Chelbi, R., Malissen, B. & Lawrence, T. Dendritic cell maturation: functional specialization through signaling specificity and transcriptional programming. EMBO J. 33, 1104-1116 (2014).
Zhang, A., Lacy-Hulbert, A., Anderton, S., Haslett, C. & Savill, J. Apoptotic cell-directed resolution of lung inflammation requires myeloid integrin-mediated induction of regulatory T Lymphocytes. Am. J. Pathol. 190, 1224-1235 (2020).
Fenton, T. M. et al. Inflammatory cues enhance TGF activation by distinct subsets of human intestinal dendritic cells via integrin . Mucosal Immunol. 10, 624-634 (2017).
Yurchenko, M. et al. SLAMF1 is required for TLR4-mediated TRAM-TRIF-dependent signaling in human macrophages. J. Cell Biol. 217, 1411-1429 (2018).
Jerby-Arnon, L. et al. A cancer cell program promotes T cell exclusion and resistance to checkpoint blockade. Cell 175, 984-997.e24 (2018).
Luo, H. et al. Pan-cancer single-cell analysis reveals the heterogeneity and plasticity of cancer-associated fibroblasts in the tumor microenvironment. Nat. Commun. 13, 6619 (2022).
Galbo, P. M. Jr, Zang, X. & Zheng, D. Molecular features of cancerassociated fibroblast subtypes and their implication on cancer pathogenesis, prognosis, and immunotherapy resistance. Clin. Cancer Res. 27, 2636-2647 (2021).
Facciabene, A., Motz, G. T. & Coukos, G. T-regulatory cells: key players in tumor immune escape and angiogenesis. Cancer Res. 72, 2162-2171 (2012).
Sahai, E. et al. A framework for advancing our understanding of cancer-associated fibroblasts. Nat. Rev. Cancer 20, 174-186 (2020).
Monteran, L. & Erez, N. The dark side of fibroblasts: cancerassociated fibroblasts as mediators of immunosuppression in the tumor microenvironment. Front. Immunol. 10, 1835 (2019).
Liu, W. et al. Siglec-15 promotes the migration of liver cancer cells by repressing lysosomal degradation of CD44. FEBS Lett. 595, 2290-2302 (2021).
Chonov, D. C., Ignatova, M. M. K., Ananiev, J. R. & Gulubova, M. V. IL6 activities in the tumour microenvironment. Part 1. Open Access Maced. J. Med. Sci. 7, 2391-2398 (2019).
Masjedi, A. et al. The significant role of interleukin-6 and its signaling pathway in the immunopathogenesis and treatment of breast cancer. Biomed. Pharmacother. 108, 1415-1424 (2018).
Dostert, C., Grusdat, M., Letellier, E. & Brenner, D. The TNF family of ligands and receptors: communication modules in the immune system and beyond. Physiol. Rev. 99, 115-160 (2019).
Fuertes, G. et al. Noncanonical Wnt signaling promotes colon tumor growth, chemoresistance and tumor fibroblast activation. EMBO Rep. 24, e54895 (2023).
Hirashima, T. et al. Wnt5a in cancer-associated fibroblasts promotes colorectal cancer progression. Biochem. Biophys. Res. Commun. 568, 37-42 (2021).
Liu, S. et al. A tissue injury sensing and repair pathway distinct from host pathogen defense. Cell 186, 2127-2143.e22 (2023).
Martinez, S. et al. The PTK7 and ROR2 protein receptors interact in the vertebrate WNT/Planar Cell Polarity (PCP) pathway. J. Biol. Chem. 290, 30562-30572 (2015).
Corsini, M. et al. Cyclic adenosine monophosphate-response ele-ment-binding protein mediates the proangiogenic or proinflammatory activity of gremlin. Arterioscler. Thromb. Vasc. Biol. 34, 136-145 (2014).
Ren, J. et al. Cancer-associated fibroblast-derived Gremlin 1 promotes breast cancer progression. Breast Cancer Res. 21, 109 (2019).
Kumawat, K. & Gosens, R. WNT-5A: signaling and functions in health and disease. Cell. Mol. Life Sci. 73, 567-587 (2016).
Maeda, M. et al. Cancer cell niche factors secreted from cancerassociated fibroblast by loss of H3K27me3. Gut 69, 243-251 (2020).
Obradovic, A. et al. Immunostimulatory cancer-associated fibroblast subpopulations can predict immunotherapy response in head and neck cancer. Clin. Cancer Res. 28, 2094-2109 (2022).
Revel, M., Sautès-Fridman, C., Fridman, W.-H. & Roumenina, L. T. C1q+ macrophages: passengers or drivers of cancer progression. Trends Cancer Res. 8, 517-526 (2022).
Zhang, Y., Zhao, Y., Li, Q. & Wang, Y. Macrophages, as a promising strategy to targeted treatment for colorectal cancer metastasis in tumor immune microenvironment. Front. Immunol. 12, 685978 (2021).
Meylan, M. et al. Tertiary lymphoid structures generate and propagate anti-tumor antibody-producing plasma cells in renal cell cancer. Immunity 55, 527-541.e5 (2022).
Hu, W., Yang, Y., Li, X. & Zheng, S. Pan-organ transcriptome variation across 21 cancer types. Oncotarget 8, 6809-6818 (2017).
Wenners, A. et al. Stromal markers AKR1C1 and AKR1C2 are prognostic factors in primary human breast cancer. Int. J. Clin. Oncol. 21, 548-556 (2016).
Ma, Z. et al. Interferon-dependent SLC14A1+ cancer-associated fibroblasts promote cancer stemness via WNT5A in bladder cancer. Cancer Cell 40, 1550-1565.e7 (2022).
Huang, F., Zheng, Y., Li, X., Luo, H. & Luo, L. Ferroptosis-related gene AKR1C1 predicts the prognosis of non-small cell lung cancer. Cancer Cell Int. 21, 567 (2021).
Steele, C. W. et al. CXCR2 inhibition profoundly suppresses metastases and augments immunotherapy in pancreatic ductal adenocarcinoma. Cancer Cell 29, 832-845 (2016).
Xiong, X. et al. CXCL8 in tumor biology and its implications for clinical translation. Front. Mol. Biosci. 9, 723846 (2022).
Tian, H. et al. High expression of AKR1C1 is associated with proliferation and migration of small-cell lung cancer cells. Lung Cancer 7, 53-61 (2016).
Zhang, X., Xue, J., Yang, H., Zhou, T. & Zu, G. TNFAIP6 promotes invasion and metastasis of gastric cancer and indicates poor prognosis of patients. Tissue Cell 68, 101455 (2021).
Hosein, A. N., Brekken, R. A. & Maitra, A. Pancreatic cancer stroma: an update on therapeutic targeting strategies. Nat. Rev. Gastroenterol. Hepatol. 17, 487-505 (2020).
Costa, A. et al. Fibroblast heterogeneity and immunosuppressive environment in human breast cancer. Cancer Cell 33, 463-479.e10 (2018).
Krishnamurty, A. T. et al. LRRC15+ myofibroblasts dictate the stromal setpoint to suppress tumour immunity. Nature 611, 148-154 (2022).
Mifflin, R. C., Pinchuk, I. V., Saada, J. I. & Powell, D. W. Intestinal myofibroblasts: targets for stem cell therapy. Am. J. Physiol. Gastrointest. Liver Physiol. 300, G684-G696 (2011).
Roulis, M. & Flavell, R. A. Fibroblasts and myofibroblasts of the intestinal lamina propria in physiology and disease. Differentiation 92, 116-131 (2016).
Roh, W. et al. High-resolution profiling of lung adenocarcinoma identifies expression subtypes with specific biomarkers and clinically relevant vulnerabilities. Cancer Res. 82, 3917-3931 (2022).
Wolf, F. A., Angerer, P. & Theis, F. J. SCANPY: large-scale single-cell gene expression data analysis. Genome Biol. 19, 15 (2018).
Wolock, S. L., Lopez, R. & Klein, A. M. Scrublet: computational identification of cell doublets in single-cell transcriptomic data. Cell Syst. 8, 281-291.e9 (2019).
Hie, B., Cho, H., DeMeo, B., Bryson, B. & Berger, B. Geometric sketching compactly summarizes the single-cell transcriptomic landscape. Cell Syst. 8, 483-493.e7 (2019).
Polański, K. et al. BBKNN: fast batch alignment of single cell transcriptomes. Bioinformatics 36, 964-965 (2020).
Tirosh, I. et al. Dissecting the multicellular ecosystem of metastatic melanoma by single-cell RNA-seq. Science 352, 189-196 (2016).
Kuai, Z. & Hu, Y. Integration single-cell and bulk RNA-sequencing data to reveal senescence gene expression profiles in heart failure. Heliyon 9, e16214 (2023).
Kuleshov, M. V. et al. Enrichr: a comprehensive gene set enrichment analysis web server 2016 update. Nucleic Acids Res. 44, W90-W97 (2016).
Langfelder, P. & Horvath, S. WGCNA: an R package for weighted correlation network analysis. BMC Bioinforma. 9, 559 (2008).
Gu, Z., Gu, L., Eils, R., Schlesner, M. & Brors, B. circlize implements and enhances circular visualization in R. Bioinformatics 30, 2811-2812 (2014).
Efremova, M., Vento-Tormo, M., Teichmann, S. A. & Vento-Tormo, R. CellPhoneDB: inferring cell-cell communication from combined expression of multi-subunit ligand-receptor complexes. Nat. Protoc. 15, 1484-1506 (2020).
Goldman, M. J. et al. Visualizing and interpreting cancer genomics data via the Xena platform. Nat. Biotechnol. 38, 675-678 (2020).
Liu, J. et al. An integrated TCGA pan-cancer clinical data resource to drive high-quality survival outcome analytics. Cell 173, 400-416.e11 (2018).
Mercatelli, D., Lopez-Garcia, G. & Giorgi, F. M. corto: a lightweight R package for gene network inference and master regulator analysis. Bioinformatics 36, 3916-3917 (2020).
Bastian, M., Heymann, S. & Jacomy, M. Gephi: an Open source software for exploring and manipulating networks. ICWSM 3, 361-362 (2009).
Van Allen, E. M. et al. Genomic correlates of response to CTLA-4 blockade in metastatic melanoma. Science 350, 207-211 (2015).
Gide, T. N. et al. Distinct immune cell populations define response to Anti-PD-1 monotherapy and Anti-PD-1/Anti-CTLA-4 combined therapy. Cancer Cell 35, 238-255.e6 (2019).
Riaz, N. et al. Tumor and microenvironment evolution during immunotherapy with nivolumab. Cell 171, 934-949.e16 (2017).
Hugo, W. et al. Genomic and transcriptomic features of response to Anti-PD-1 therapy in metastatic melanoma. Cell 165, 35-44 (2016).
Mariathasan, S. et al. TGF attenuates tumour response to PD-L1 blockade by contributing to exclusion of T cells. Nature 554, 544-548 (2018).
McDermott, D. F. et al. Clinical activity and molecular correlates of response to atezolizumab alone or in combination with bevacizumab versus sunitinib in renal cell carcinoma. Nat. Med. 24, 749-757 (2018).
Miao, D. et al. Genomic correlates of response to immune checkpoint therapies in clear cell renal cell carcinoma. Science 359, 801-806 (2018).
Bolger, A. M., Lohse, M. & Usadel, B. Trimmomatic: a flexible trimmer for Illumina sequence data. Bioinformatics 30, 2114-2120 (2014).
Kopylova, E., Noé, L. & Touzet, H. SortMeRNA: fast and accurate filtering of ribosomal RNAs in metatranscriptomic data. Bioinformatics 28, 3211-3217 (2012).
Dobin, A. et al. STAR: ultrafast universal RNA-seq aligner. Bioinformatics 29, 15-21 (2013).
Frankish, A. et al. GENCODE 2021. Nucleic Acids Res. 49, D916-D923 (2021).
Li, H. et al. The Sequence Alignment/Map format and SAMtools. Bioinformatics 25, 2078-2079 (2009).
Anders, S., Pyl, P. T. & Huber, W. HTSeq-a Python framework to work with high-throughput sequencing data. Bioinformatics 31, 166-169 (2015).
Subramanian, A. et al. Gene set enrichment analysis: a knowledgebased approach for interpreting genome-wide expression profiles. Proc. Natl Acad. Sci. USA 102, 15545-15550 (2005).
Kleshchevnikov, V. et al. Cell2location maps fine-grained cell types in spatial transcriptomics. Nat. Biotechnol. 40, 661-671 (2022).
Zhou, Z., Zhong, Y., Zhang, Z. & Ren, X. Spatial transcriptomics deconvolution at single-cell resolution by Redeconve. bioRxiv 2022.12.22.521551 https://doi.org/10.1101/2022.12.22. 521551 (2022).
Massier, L. et al. An integrated single cell and spatial transcriptomic map of human white adipose tissue. Nat. Commun. 14, 1438 (2023).
Muzellec, B., Teleńczuk, M., Cabeli, V. & Andreux, M. PyDESeq2: a python package for bulk RNA-seq differential expression analysis. Bioinformatics 39, btad547 (2023).
Kang, J., Lee, J. H., Choi, J. K. & Park, J.-E. Systematic dissection of tumor-normal single-cell ecosystems across a thousand tumors of 30 cancer types. https://doi.org/10.5281/ZENODO. 10651059 (2024).
شكر وتقدير
تم دعم هذا العمل من قبل مؤسسة البحث الوطنية (NRF) الممولة من الحكومة الكورية (MSIT) (NRF-2022R1A4A5028131، NRF-2021M3A9I4024447، NRF-2021R1C1C1010094، وNRF2020R1A2C3006535)، مشروع الطب المستقبلي 2030 من مركز سامسونغ الطبي (SMX1240011)، وHR21C019803. تم دعم هذا البحث من خلال منحة من برنامج MD-PhD/تدريب العلماء الطبيين (جونهو كانغ) ومشروع البحث والتطوير في تكنولوجيا الصحة الكورية (HR21CO198) من خلال معهد تطوير صناعة الصحة الكورية (KHIDI)، الممول من وزارة الصحة والرعاية الاجتماعية، جمهورية كوريا. تم دعم جونغ-أون بارك من قبل زمالة علوم بوسكو. يقر المؤلفون بخدمة شبكة البيئة البحثية الكورية المفتوحة (KREONET) واستخدام مركز بيانات التجارب العلمية العالمية (GSDC) المقدم من معهد كوريا لمعلومات العلوم والتكنولوجيا (KISTI). هذه النشر هو جزء من أطلس الخلايا البشرية –www.humancellatlas.org/publications/.
مساهمات المؤلفين
قام J.K.C و J.E.P بتصميم الدراسة والإشراف عليها. جمع J.H.Kang و D.H.A البيانات وحللوها، وقام J.H.Kang و J.H.L بإجراء التحليل الحسابي، وساهموا في تفسير البيانات، وأعدوا المسودة الأولى من المخطوطة. قام S.H.L و H.C بتوليد بيانات LC المعالجة بالعلاج المناعي، وجمع A.Y.K و H.J.A عينات الأنسجة من المرضى. أجرى J.H.Kang و J.H.L و S.L و S.K التجارب، وقدم J.H.Kang و J.H.L و J.H.Kwon و J.H.A و S.Y.K مساهمات في إنشاء الأشكال، وأنشأ M.Y.B و J.H.Kang بوابة الويب. قام جميع المؤلفين بمراجعة المسودة بشكل نقدي للمحتوى الفكري المهم ومنحوا الموافقة النهائية على النسخة النهائية من المخطوطة للنشر.
يجب توجيه المراسلات والطلبات للحصول على المواد إلى سي-هون لي، جونغ كيون تشوي أو جونغ-أون بارك.
معلومات مراجعة الأقران تشكر مجلة Nature Communications هينغ شو، والمراجعين الآخرين المجهولين، على مساهمتهم في مراجعة هذا العمل. يتوفر ملف مراجعة الأقران.
كلية الدراسات العليا للعلوم الطبية والهندسة، المعهد المتقدم للعلوم والتكنولوجيا في كوريا، دايجون، جمهورية كوريا.قسم الهندسة الحيوية ودماغ الهندسة، المعهد المتقدم للعلوم والتكنولوجيا، دايجون، جمهورية كوريا.قسم أمراض الدم والأورام، قسم الطب، مركز سامسونغ الطبي، كلية الطب بجامعة سونغكيوكوان، سيول، جمهورية كوريا.قسم علوم بيانات السرطان، المركز الوطني للسرطان، فرع المعلوماتية الحيوية، كويانغ، جمهورية كوريا.قسم علم الأمراض، مركز تشا الطبي بوندانغ، جامعة تشا، سيونغنام، جمهورية كوريا.قسم علوم الصحة والتكنولوجيا، معهد سامسونغ المتقدم لعلوم الصحة والتكنولوجيا، كلية الطب بجامعة سونغكيوكوان، سيول، جمهورية كوريا.شركة بنتا ميدكس المحدودة، سيونغنام-سي، محافظة غيونغغي، جمهورية كوريا.مركز الأبحاث الطبية الحيوية، المعهد المتقدم للعلوم والتكنولوجيا في كوريا، دايجون، جمهورية كوريا.ساهم هؤلاء المؤلفون بالتساوي: جونهو كانغ، جون هيونغ لي. البريد الإلكتروني:shlee119@skku.edu; جونغكيون@كايس.أك.كوم; jp24@kaist.ac.kr
The complexity of the tumor microenvironment poses significant challenges in cancer therapy. Here, to comprehensively investigate the tumor-normal ecosystems, we perform an integrative analysis of 4.9 million single-cell transcriptomes from 1070 tumor and 493 normal samples in combination with pan-cancer 137 spatial transcriptomics, 8887 TCGA, and 1261 checkpoint inhibitor-treated bulk tumors. We define a myriad of cell states constituting the tumor-normal ecosystems and also identify hallmark gene signatures across different cell types and organs. Our atlas characterizes distinctions between inflammatory fibroblasts marked by AKR1C1 or WNT5A in terms of cellular interactions and spatial co-localization patterns. Co-occurrence analysis reveals interferon-enriched community states including tertiary lymphoid structure (TLS) components, which exhibit differential rewiring between tumor, adjacent normal, and healthy normal tissues. The favorable response of interferon-enriched community states to immunotherapy is validated using immunotherapy-treated cancers ( ) including our lung cancer cohort ( ). Deconvolution of spatial transcriptomes discriminates TLS-enriched from non-enriched cell types among immunotherapy-favorable components. Our systematic dissection of tumor-normal ecosystems provides a deeper understanding of inter- and intra-tumoral heterogeneity.
Tumors are highly heterogeneous entities composed of malignant cells and diverse tissue-infiltrating stromal and immune cells that form the tumor microenvironment (TME) . The advent of single-cell RNA sequencing (scRNA-seq) technologies has provided unbiased and
systematic molecular profiling for high-resolution characterization of extensive heterogeneity embedded in the TME .
Molecular and cellular heterogeneity within the TME collectively influences various aspects of tumors, including progression, metastasis,
and treatment response . As evidence of intra-tumoral and inter-tumoral heterogeneity mounts, various attempts are being made to compile consensus gene signatures at the pan-cancer level. For example, a pancancer atlas of T, myeloid, and malignant cells has recently been published . Although these pan-cancer analyses well characterize the cell types of interest, complex interactions among the TME components and the distinctions from paired normal tissues have not yet been fully appreciated, leading to a limited perspective of tumor heterogeneity, neglecting or oversimplifying potentially crucial molecular and cellular interactions. Indeed, TME phenotypes are not simply binarized into antitumor or pro-tumor but rather represent interactive cellular organizations or ecosystems . Targeting tumor-specific interactions underlying tumor ecosystems presents an appealing strategy that can yield synergistic therapeutic effects . Therefore, it is crucial to dissect the intricate and multilayered ecosystems across diverse cancer and tissue types to develop more efficient therapeutic strategies.
Cancer immunotherapy based on checkpoint blockade has emerged as a promising therapeutic strategy with a profound impact on cancer treatment. However, the heterogeneous nature of tumor ecosystems poses one of the main remaining challenges, that is, the varying efficacy of checkpoint inhibitors across cancer types and patients . Recent studies have highlighted interferon signatures and tertiary lymphoid structure (TLS), an ectopic aggregate of immune cells with a lymphoid-like structure, as a key determinant of responses to immunotherapy . Nevertheless, a detailed understanding of components favorable for immunotherapy that are associated with TLS remains elusive. Therefore, a comprehensive pan-cancer dissection of tumor ecosystems is necessary to discriminate TLS-enriched and nonenriched cell types that confer favorable responses to immunotherapy, elucidate the mechanisms by which these components shape tumor immunity, and unravel the interactions among them. Such insights will enable us to better comprehend the differential response to immunotherapy observed in patients of diverse cancer types.
Herein, we construct an unsorted tumor-normal single-cell transcriptomic atlas covering 30 cancer types and 4.9 million cells from 1070 tumors and 493 normal samples. Our analysis incorporates diverse analytical approaches including the AND-gating algorithm and non-negative matrix factorization (NMF) visualization at single-cell resolution to unveil the distinctions between tumor/normal ecosystems. We outline hallmark gene signatures across diverse cell types and organs. Our analysis reveals the heterogeneity of inflammatory fibroblasts, including CXCL1/3/8 expressing AKR1C1 and WNT5A inflammatory fibroblasts, which exhibit distinct organ allocations, tissue preferences, cellular interactions, and spatial co-localization patterns. By analyzing the co-occurrence patterns of cell states, we have uncovered tumor-specific rewiring of interferon-enriched community which comprise TLS components including CCL19 fibroblast and LAMP3 DC that hold distinct clinical significance in immunotherapytreated cohorts ( ), including our lung cancer (LC) cohort ( ). Furthermore, we categorize cell types enriched in TLS and those that are not within the spectrum of immunotherapy-favorable components using spatial transcriptome analysis and derive a TLS signature that predicts favorable responses to immunotherapy. In summary, our pan-cancer meta-atlas provide deeper insights into tumor-normal ecosystems and serve as a valuable resource for the development of diagnostic and therapeutic strategies. We have deposited the comprehensively analyzed datasets to the Zenodo repository (DOI:10.5281/zenodo.10651059) and our atlas can be interactively visualized at https://cellatlas.kaist.ac.kr/ecosystem/.
Results
Construction of a pan-cancer tumor-normal single-cell meta-atlas
To generate a comprehensive census of the tumor and normal ecosystems, we selected published scRNA-seq datasets on cancer,
adjacent normal, and healthy normal samples that have not been enriched for specific cell types. As a result, a tumor-normal single-cell transcriptomic atlas encompassing 30 different cancer types across 104 datasets was constructed (Supplementary Data 1). After data curation, this meta-atlas covered 4.9 million cells from 1,070 tumors and 493 normal samples derived from 999 donors (Fig. 1A). Breast cancer (BRCA) was the most abundant cancer type, followed by LC, head and neck cancer (HNSC), and hepatocellular carcinoma (HCC).
To profile a variety of ecosystems across diverse cancer and tissue types, entire collected single-cell datasets were integrated and annotated at a global scale. Then, an AND-gating algorithm (see Methods) was applied to characterize differentially expressed genes that are cell type-specific and universally found in tumor and normal tissues of various organs. Subsequently, the annotated gene expression matrices were then split into major cell types and decomposed into various cell states using an NMF analysis (Fig. 1B-D and Supplementary Fig. S1A, B). To maximize the recovery of rare cell states, NMF modules were collected per individual samples by scanning multiple parameters, and the resulting modules were clustered and projected to Uniform Manifold Approximation Projection (UMAP) to search recurring consensus modules.
Among the clusters of NMF modules (cell states), we identified the ones representing the contaminations from ambient RNAs or doublets and removed those clusters from further analysis using an automated pipeline (Fig. 1E and Supplementary Fig. S1C). NMF module clusters enriched with ribosomal/mitochondrial genes were also filtered out. The final UMAP representation of NMF modules demonstrates the overall structure of recurring cell states across multiple samples (Fig. 1E). Utilizing UMAP representation for NMF modules allows us to visually inspect the characteristics of each cell state by their origin (e.g., tissue type, organ, etc.). The cell states were defined and annotated based on genes with the highest average NMF weights (Supplementary Data 2). This allowed us to dissect tumor single-cell and bulk transcriptome data using the cell state filters derived at single-cell resolution (Fig. 1E, Cell state heterogeneity) and monitor their cooccurrence across normal and tumor samples to identify potential interactions between cell types and their contribution to the TME (Fig. 1E, Coincidence). We also applied the cell state signatures to deconvolute bulk RNA-seq cohorts (TCGA, immune checkpoint therapy) to check their clinical implications (Fig. 1E, Survival analysis). Finally, we projected cells using our cell states as a reference component to assess the correspondence between cell states and cell types (Fig. 1E, Cell projection to reference components) and deconvoluted spatial transcriptomics across 11 cancer types ( ) using our cell types (Fig. 1E and Supplementary Data 3, Spatial transcriptomics).
Identification of universal hallmark gene signatures of tumornormal ecosystems
An AND-gating algorithm (see Methods) was implemented to systematically characterize hallmark genes that are recurrently upregulated in tumors compared with normal tissues, and vice versa, in major cell types comprising the TME of diverse organs (Supplementary Fig. S2A and Supplementary Data 4). For cells, costimulatory molecule (CD27) and immune checkpoint or exhaustion markers such as CXCL13, PDCD1, TIGIT, CTLA4, LAG3, and TNFRSF9 were commonly elevated in tumors whereas IL7R, PTGER2, and PTGER4 were elevated in normal tissues (Fig. 2A, B). Of note, CD8 T cells of pancreatic tumor tissues did not show upregulation of PDCD1 and LAG3, which potentially accounts for the current inapplicability of immune checkpoint inhibitors in pancreatic cancer (PAAD) in contrast to other cancer types . Similarly, tumorassociated NK cells were marked by ZNF683 and KRT81. Tregs in tumors elevated genes with regulatory functions such as RBPJ, CXCR3, and ZBED2 whereas Tregs in normal tissues upregulated CCR7 and CXCR5, indicating distinct mechanisms for immune cell
Fig. 1 | Overview of the pan-cancer tumor-normal landscape at single-cell resolution. A Overview of the scRNA-seq cohort across the 30 cancer types collected in this study. B Workflow of the tumor-normal single-cell transcriptomic atlas and NMF processing. UMAP visualization of a subset of the tumor-normal
single-cell atlas colored by (C) cell types and (D) organ origins. E Graphical clustering schematics of NMF modules with automatized soup-effect detection algorithm and subsequent analyses.
Fig. 2 | Landscape of hallmark genes of tissue ecosystems across organs. A Characterization of hallmark genes in tumor and normal ecosystems across organs. Cell type is noted on top of the heatmap and only the genes that are upregulated in four or more cancer types are depicted. Each box in the heatmap represents fold-change values with positive values indicating upregulation in tumors. H&N, head and neck; DC, dendritic cell; NK, natural killer cell; Treg, regulatory T cell. B Detailed heatmap of hallmark genes identified in Fig. 2A across
cancer and cell types. Each color in the heatmap represents fold-change values with positive values indicating upregulation in tumors. H&N, head and neck; DC, dendritic cell; NK, natural killer cell; Treg, regulatory T cell. C Gene ontology analysis of tumor hallmark genes of diverse cell types using Enrichr. The color and size of the dot represent the odds ratio and value from two-sided Fisher’s exact test, adjusted with the Benjamini-Hochberg method, respectively. PRR, pattern recognition receptor.
recruitment and infiltration (Fig. 2A, B). In particular, tumorinfiltrated macrophages universally expressed immune checkpoint (IL4I1) , M2 polarization-related (SPP1) , and inflammatory genes (CCL7, ADAMDEC1, and SLAMF9), whereas dendritic cells in tumors were found to exhibit elevated expression of CCL19 and LAMP3, which are associated with inflammatory and migratory functions (Fig. 2A, B). Gene ontology (GO) analysis revealed that genes upregulated in tumor-infiltrating macrophages, dendritic cells, and T cells were enriched in related functions and pathways including defense responses to viruses, response to type II interferon, inflammatory responses, chemotaxis of lymphocytes, and cytokinemediated signaling pathways (Fig. 2C).
As for non-immune cell types, cancer cells universally manifested protein serine/threonine kinase activity (PRKCA, GSK3B, and CAMKK2), glycolysis (PLOD1, EGLN3, and P4HA1), mTORC1 signaling (SLC2A1, GMPS, and PDK1), and GO terms associated with the positive regulation of the cell cycle process (E2F7, E2F8, and KIF23; Fig. 2C and Supplementary Fig. S2B). Cancer-associated fibroblasts (CAF) expressed wellknown markers including FAP, COL1A1, COL10A1, MMP11, and CTHRC1 , and other genes such as INHBA, SLC12A8, F2R, and
COL12A1 in various organs (Fig. 2A, B). Tumor endothelial cells upregulated angiogenesis-associated genes including CHST1, FOLH1, and MMP15 . Both tumor-associated fibroblasts and endothelial cells were enriched in terms related to extracellular matrix organization, regulation of cell migration, cell-matrix adhesion, and filamin binding (Fig. 2C). Overall, these results outline dysregulated hallmark signatures of the TME components.
Deconvolution of tumor-normal ecosystems into heterogeneous cell states
The systematic dissection of the complex tumor and normal ecosystems identified a myriad of cell states or co-regulated genes that are strongly consistent with previously reported signatures and those that have not been yet identified in the previous pan-cancer analyses (Fig. 3A and Supplementary Fig. S3, 4). For myeloid cell states, we noted CTSK macrophage (SLC9B2 and CTSK ), macrophage (CXCL9 and ENPP2), Langerhans cell (CD1A and CD207), mononuclear phagocyte (DLEU2 and FMN1), and PRR-induced activation state marked by chemokines (CXCL1 and CXCL5), migratory (SLAMF1) and immunoregulatory markers (ITGB8). SLAMF1 and ITGB8 are
Fig. 3 | Deconvolution of the tumor-normal ecosystem into heterogeneous cell states. UMAP visualization of (A) myeloid cell states and (B) corresponding reference component analysis of myeloid cells. NMF modules were graphically clustered and colored according to cell states (A). Then, cells were mapped to the reference components composed of myeloid cell state genes (B). DC, dendritic cell; mono-derived , monocyte-derived macrophage; mo-DC, monocyte-derived dendritic cell; pDC, plasmacytoid dendritic cell; PRR, pattern recognition receptor. UMAP visualization of (C) mesenchymal cell states and (D) corresponding reference component analysis of mesenchymal cells. NMF modules were graphically clustered and colored according to cell states (C). Then, cells were mapped to the
reference components composed of mesenchymal cell state genes (D). E Ro/e analysis of tissue enrichments in mesenchymal cell states. The dotted vertical line represents where Ro/e is zero. Circos plot illustrating co-occurrences between the cell states in normal (blue) and tumor (yellow) tissues. The length of the arcs represents the sum of co-occurrences with other cell states in adjacency. A longer arc indicates more frequent co-occurrence with other cell states. Basal sq, basal squamous state. DC, dendritic cell; Tex, exhausted CD8 cell; T -exclusion, T cell exclusion program; Treg, regulatory T cell. Source data are provided as a Source Data file.
upregulated during TLR-induced DC maturation , thus named PRRinduced activation. We also identified various cell states, including the germinal center B cell (GCB; SUGCT and RGS13) and plasma cell precursor (FNDC3B and FNDC3A) states (Supplementary Fig. S3F). Evaluation of tissue enrichment of immune cell states with Ro/e analysis revealed preferences of exhausted cell (LAG3 and TOX), SPP1 (SPP1 and ANGPTL4), CTSK , and CXCL9 macrophage states in tumors (Supplementary Fig. S5A, B) . GCB and plasma cell states were abundant in adjacent normal tissues, while PRR-induced activation states were enriched in healthy normal tissues (Supplementary Fig. S5B, C). Utilizing cell type specific cell state profiles as a reference for embedding, we identified cell types that well reflect corresponding cell states (Fig. 3B and Supplementary Fig. S6, 7): the PRR-induced activation state was captured as a PRR-induced mo-DC cell cluster that predominantly originated from gynecological cancers such as ovarian cancer (OV) and uterine corpus endometrial carcinoma (UCEC)
patients, consistent with the distribution of PRR-induced activation state score (Supplementary Fig. S8).
The epithelial and neural cells were deconvoluted into 35 states (Supplementary Fig. S9) and the subsequent reference component analysis using these cell states clustered cells by their origins (Supplementary Fig. S10A, B). Epithelial hallmark programs such as cycling (TOP2A and BIRC5) and stress (PPP1R15A and KLF5) were found. Regarding previously cataloged signatures , renal cell carcinoma (RCC) and glioblastoma manifested high levels of hypoxia and metal response while low-grade glioma, UCEC, and neuroblastoma exhibited low levels of partial epithelial-to-mesenchymal transition (pEMT), oxidative phosphorylation, and antigen-presenting machinery signatures, respectively (Supplementary Fig. S10C, D).
Notably, we classified and annotated diverse cell states of mesenchymal origin, including the CCL19 fibroblast (CCL19 and CXCL13), Pl16 fibroblast (MFAP5 and IGFBP6), myofibroblast (ACTA2
and MYH11), desmoplastic fibroblast (LRRC15 and MMP11), and fibroblast states exclusive to specific organs that potentially reflect organspecific functions (Fig. 3C, D and Supplementary Fig. S11). These states were also identified as a variety of mesenchymal subpopulations when projected onto the reference components. While the desmoplastic fibroblast state was highly tumor-specific, the myofibroblast populations were evenly distributed across non-malignant tissues, in contrast to the previous reports suggesting myofibroblasts as major CAFs (Fig. 3E) .
These diverse cell states are collectively engaged to shape the complex tumor ecosystem (Fig. 3F). For instance, in tumors, the T cell exclusion program of epithelial cells was closely associated with the Treg states, promoting immune escape and tumor progression . The basal squamous state coincided with inflammatory states such as CXCL9 macrophage, LAMP3 DC, and mesenchymal-derived interferon states exclusively in tumor tissues, suggesting the intrinsic feature of basal squamous originated cancer types (HNSC and skin squamous cell carcinoma) that triggers the immune cell infiltration (Fig. 3F). In particular, multiple coincidences involving mesenchymal-derived interferon state with interferon states from other cell types and were identified (Fig. 3F). Its tumor-specific coincidence with the LAMP3 DC suggests that mesenchymal-derived interferon is necessary to initiate the tumor interferon signaling for the subsequent recruitment of immune cells and T cell priming.
Characterization of and inflammatory fibroblasts as distinct subtypes
Fibroblasts are a highly heterogeneous population with diverse functions such as collagen deposition, angiogenesis, and cytokine secretion that play a central role in forming the TME . Fibroblasts promote inflammation and orchestrate the tissue microenvironment toward immunosuppression in the context of cancer , but the diversity of inflammatory fibroblasts has not been extensively explored in previous pan-cancer studies . As we project mesenchymal cell collections upon the defined states, we identified multiple fibroblast subtypes that displayed immune-related gene expression (Fig. 4A). Among them, we noted the distinctions between and expressing inflammatory fibroblasts, both of which coincided with PRR-induced activation state and shared similar cytokine gene expressions (CXCL1/ ; Fig. 4A and Supplementary Fig. S12A). However, they significantly differed in terms of marker genes (AKR1C1, FOSL1, LIF, and THAP2 vs. WNT5A, GREM1, TNC, and MMP1), tissue origins (normal vs. tumor), and organ preferences (Figs. 3E, 4A, B, and Supplementary Fig. S12B, C). To investigate whether these two states represent genuinely distinct subtypes of fibroblasts, we conducted a detailed examination of scRNA-seq datasets encompassing both tumor and normal tissues of the breast, colon, head and neck, and ovary. Tumor tissues expressed more chemokine genes (CXCL1/3/8) than normal tissues with the exception of the breast tissue. Simultaneously, the expression patterns of AKR1C1 and WNT5A in these two types of inflammatory fibroblasts were distinct across different organs (Fig. 4C). BRCA and OV patients expressed both AKR1C1 and WNT5A, while normal breast tissues expressed only AKR1C1. Intriguingly, colorectal cancer (CRC) and HNSC patients expressed WNT5A but not AKR1C1 whereas the corresponding normal tissues showed opposite expression patterns (Fig. 4C).
To gain insight into how these inflammatory fibroblasts shape the TME, we performed ligand-receptor analysis to unravel distinct interactions of and inflammatory fibroblasts with other cell types in BRCA, CRC, HNSC, and OV samples (Fig. 4D and Supplementary Fig. S12D, E). Discrete interaction patterns were identified between these two inflammatory fibroblasts. The inflammatory fibroblast interacts with CTSK macrophages (CD44:SIGLEC15), which are known to induce cancer progression and metastasis in multiple cancer types (Fig. 4D and Supplementary Fig. S12D).
Moreover, the inflammatory fibroblast strongly expresses IL6 which interacts with expressed on DC1 and PRR-induced mo-DC, potentially contributing to tumor growth and therapeutic resistance . We also identified an interrelation between TNFRSF12A (AKR1C1 inflammatory fibroblast) and TNFSF12 (ILC3) . In contrast, the inflammatory fibroblast interacts with cancer cells via IL24:IL2ORA and WNT5A:FZD5 pathways, which could promote cancer progression and chemoresistance (Fig. 4D and Supplementary Fig. S12E). Furthermore, inflammatory fibroblast showed strong interactions with fibroblast populations including desmoplastic fibroblasts (WNT5A:PTK7, WNT5A:ROR2, and GREM1:ACVR1), with themselves in homotypic interactions (WNT5A:PTK7 and GREM1:ACVR1), and BMP4 fibroblasts (GREM1:ACVR1) to mimic wound repair process to potentiate mesenchymal proliferation and migratory phenotype of cells through both autocrine and paracrine mechanism (Fig. 4D and Supplementary Fig. S12E). Proangiogenic and proinflammatory engagement of GREM1 from WNT5A inflammatory fibroblast and ACVRL1 from endothelial cells were also recognized . Collectively, inflammatory fibroblasts secrete diverse ligands such as WNT5A, GREM1, and IL24, that potentiate proliferation, migration, and survival in numerous contexts, including tissue regeneration, inflammation, and cancer . They interact with diverse cellular components such as cancer cells, fibroblasts, and endothelial cells to ultimately shape the pro-tumorigenic and core inflammatory TME. To locate and validate inflammatory fibroblast populations, we performed RNA single-molecule fluorescence in situ hybridization (smFISH) targeting WNT5A, GREM1, and PDGFRA in CRC and HNSC tissue samples. The presence of WNT5A inflammatory fibroblasts was confirmed by the overlapping signals from the WNT5A, GREM1, and PDGFRA RNA probes in the desmoplastic stroma of cancer tissues (Fig. 4E and Supplementary Fig. S13, 14).
We hypothesized that distinct microenvironmental surroundings induce the divergent phenotypes of these two inflammatory fibroblasts. To examine their co-localization patterns, we analyzed spatial transcriptomics (BRCA, OV, and UCEC for AKR1C1 inflammatory fibroblast, and CRC and HNSC for WNT5A inflammatory fibroblast). AKR1C1 inflammatory fibroblast significantly co-localized with cancer cells, neutrophil, macrophage, DC1, and PRR-induced mo-DC (Fig. 4F, G and Supplementary Fig. S15A, B). In contrast, WNT5A inflammatory fibroblast significantly co-localized with desmoplastic fibroblast, exhausted T cell, Treg, DC 1 , and PRR -induced mo-DC, highlighting its role in shaping the immunosuppressive TME (Fig. 4F, G and Supplementary Fig. S15A, B). In particular, AKR1C1 and inflammatory fibroblasts were mutually exclusive with desmoplastic fibroblast and neutrophil, respectively, further highlighting the distinctions between the two inflammatory fibroblasts (Fig. 4F, G and Supplementary Fig. S15A, B). The cellular interactions and spatial proximity of inflammatory fibroblasts with exhausted T cells and Tregs prompted us to investigate its association with immunotherapy treatment in pre/post-treated HNSC samples . There was a trend toward an increase in inflammatory fibroblasts and desmoplastic fibroblasts after immunotherapy treatment, unlike other mesenchymal populations (Supplementary Fig. S15C). This indicates that inflammatory fibroblasts are potentially affected in the course of immunotherapy treatment. Collectively, although the two inflammatory fibroblasts express CXCL1/3/8 in common, distinct organ/tissue preferences, cellular interaction patterns, and spatial proximities with other cell types suggest their differential role in forming an immune-evasive and pro-tumorigenic TME.
Tumor-specific rewiring of interferon-enriched and protumorigenic community
To depict multicellular ecosystems across tissue origins, we constructed an undirected network with co-occurrences of the cell states and identified diverse network communities within the tumor,
adjacent normal, and normal tissues (Fig. 5A-C). Remarkably, one tumor ecosystem was distinctly occupied by interferon states from various cell types within the tumor (interferon-enriched community; Fig. 5A). This community also contained well-known components of the TLS (LAMP3 DC, CCL19 fibroblast, and Tfh), particular DCs and macrophages (DC1, pDC, and CXCL9 macrophage), and antigenpresenting machinery states. In contrast, several immune cell states
included within the interferon-enriched community were scattered throughout the healthy normal network (Fig. 5B). Interestingly, the vicinity of with other immune cell states included in the interferon-enriched community (DC1, pDC, Langerhans cell, and Tfh) was identified in the adjacent normal network (Fig. 5C), implying that distinct configurations of cellular ecosystems even exist within the adjacent normal tissues compared to healthy normal tissues.
Fig. 4 | Characterization of and inflammatory fibroblasts. A Dot plot of marker gene expressions of inflammatory fibroblast subtypes. Inflamm., inflammatory. B Distribution of inflammatory fibroblasts across organs where the -axis represents the proportion of inflammatory fibroblasts in tumor tissues. H&N, head and neck; Inflamm., inflammatory. C Dot plot showing gene expression of and inflammatory fibroblast marker genes in normal and tumor tissues of relevant organs. H&N, head and neck. D Ligand-receptor interactions of and inflammatory fibroblasts with other cell types. The interaction intensity was calculated by multiplying the normalized expression values of ligands and receptors in each cell-cell pair. DC, dendritic cell; Inflamm.,
inflammatory; ILC3, type 3 innate lymphoid cells; mo-DC, monocyte-derived dendritic cell; PRR, pattern recognition receptor. E Representative ( ) images of in situ RNA smFISH detection of WNT5A (red), PDGFRA (green), and GREM1 (yellow) in the desmoplastic stroma of CRC (top) and HNSC (bottom) tissues. scale bar: . Magnification: 20X. Spatial co-localization patterns of (F) AKR1C1 and (G) WNT5A inflammatory fibroblast with other cell types in relevant organs, with colors representing cell abundance. DC, dendritic cell; Inflamm., inflammatory; mo-DC, monocyte-derived dendritic cell; PRR, pattern recognition receptor. Source data are provided as a Source Data file.
We also identified another tumor-specific community occupied by pro-tumorigenic states, such as pEMT, epithelial T cell exclusion program, macrophage, and desmoplastic fibroblast (Fig. 5A). Tumor-enriched macrophages ( and macrophage) and WNT5A inflammatory fibroblast states, which contribute to diverse aspects of tumorigenesis, were also found in the pro-tumorigenic community .
Determination of immunotherapy-predictive cell states across cancer types
Having identified the diversity and dynamics of interferon-enriched and pro-tumorigenic communities among tumor, adjacent normal, and healthy normal tissues, we utilized those cell states to deconvolute the bulk transcriptomes of checkpoint inhibitor-treated samples in bladder cancer (BLCA), melanoma (MEL), RCC and our LC cohort (Fig. 5D). The clinical benefits of checkpoint blockade were highlighted by the exhausted cell, mesenchymal-derived interferon, macrophage, intraepithelial lymphocyte, Treg, DC1, ISG15 macrophage, cell, interferon signaling, , LAMP3 DC, pDC, CD16 monocyte-derived macrophage, CCL19 fibroblast, and plasma cell precursor states in the pan-cancer metaanalysis (Fig. 5E). Simultaneously, previously defined gene signatures such as the PD-L1 pathway, antigen-presenting machinery, and interferon signatures from various studies conferred favorable responses to immunotherapy. The cell states with significant predictive power were mostly components of the interferon-enriched community. Among the cell states favorable for immunotherapy, we confirmed the presence of interferon-expressing mesenchymal cells (CXCL10 and PDGFRA) in the HNSC tissue sample using RNA smFISH (Supplementary Fig. S16).
In contrast, the desmoplastic fibroblast, osteoblast, mesotheliumderived fibroblast, and macrophage cell states were associated with poor responses to immunotherapy across the cohorts, many of which belonged to the pro-tumorigenic community (Fig. 5E). Considering that these pro-tumorigenic component states (i.e., desmoplastic fibroblast, osteoblast, and macrophage) negatively impact immunotherapy responses across different cancer types, alternative treatment strategies should be pursued for patients with pro-tumorigenic ecosystems. Notably, the majority of cell states predicting immunotherapy response did not significantly affect the prognosis across TCGA cohorts (Supplementary Figs. S17, 18).
Despite the heterogeneous effect of diverse cell states in immunotherapy, we questioned whether a common gene signature exists among responders. To identify genes that are differentially regulated regardless of organs between immunotherapy responders and nonresponders for major cell types, we investigated immunotherapy cohorts of 4 cancer types at single-cell resolution (BRCA, LC, MEL, and RCC; Supplementary Data 5). In CD8 T cells, PDCD1, LAG3, CXCL13, CXCR6, VCAM1, CCDC141, and ZBED2 were commonly expressed in immunotherapy responders, while ZNF8O was expressed in nonresponders (Supplementary Fig. S19A and Supplementary Data 6). In macrophages, universal upregulation of SCIN, OLFML3, PLD4, P2RY11, and SLAMF7 were identified in responders, while non-responders expressed COLEC12, PROS1, CTSK, MOB3B, ADAMTSL4, TSPAN15, and
GPX3 (Supplementary Fig. S19A). Beneficial survival effects of universally expressed cell genes in immunotherapy responders were also validated in our LC cohort, indicating common gene expression programs in immunotherapy responders hold prognostic significance even in patients of different cancer types (Supplementary Fig. S19B).
Systematic investigation of tumor ecosystems with spatial transcriptomics across multiple cancer types
To examine the spatial organization of the tumor ecosystem, we conducted a systematic analysis of spatial transcriptomics data across 11 different cancer types ( , Fig. 6A). Given that TLS has previously been linked to favorable immunotherapy responses , we first aimed to derive a gene signature specific to TLS and also investigate spatial relationships between components associated with favorable responses to immunotherapy and pathologically defined TLS. To achieve this goal, we utilized the RCC spatial transcriptome data which contains pathologically defined TLS spots . By performing differential expression analysis between TLS and non-TLS spots, we obtained a TLS signature that effectively distinguishes TLS from non-TLS spots ( ; Fig. 6B and Supplementary Data 7). Our TLS signature also predicted favorable responses to immunotherapy in immunotherapytreated cohorts ( ; Fig. 6C and Supplementary Fig. S20A). Additionally, we utilized cell2location to deconvolute each spatial spot with single-cell transcriptome profiles and compared cell type abundances between TLS and non-TLS spots. We identified cell types that were significantly enriched in TLS, including Treg, plasma cell, XCL1 NK cells, Tfh, LAMP3 DC, CCL19 fibroblast, and ILC3 (Fig. 6D). It is noteworthy that some cell types, such as exhausted cell, ISG15 macrophage, DC1, and pDC, lack spatial association with TLS, yet they exhibited favorable responses to immunotherapy similar to TLS-enriched cell types (Figs. 5E, 6D).
By evaluating the spatial co-localization patterns of TLS-enriched cell types in other cancer types, we confirmed the co-localization of TLS-enriched cell types including DC, Treg, plasma cell, and CCL19 fibroblast across multiple cancer types (Fig. 6E). Furthermore, we observed that our TLS signature effectively captures spots abundant with TLS-enriched cell types in various tumor samples of different cancer types (Fig. 6E). In contrast, pro-tumorigenic components exhibited distinct co-localization patterns (Supplementary Fig. S20B). Notably, desmoplastic fibroblasts and SPP1 macrophages both colocalized with inflammatory fibroblasts but were mutually exclusive with each other, indicating independent contributions to the pro-tumorigenic milieu. In summary, our study leveraged pan-cancer single-cell transcriptomes and spatial transcriptomes to characterize the intricate spatial organization of the TME.
Discussion
In this work, we integrated a transcriptomic atlas comprising 4.9 million cells from 999 individuals across 30 cancer types, including both tumor and non-tumor tissues. Our analysis outlined hallmark gene signatures and systematically visualized the cell states that shape tumor-normal ecosystems. Furthermore, we elucidated distinctions between and fibroblasts shaping the core
Fig. 5 | Tumor-specific occurrence of interferon-enriched and pro-tumorigenic community and determination of immunotherapy-predictive cell states. Cooccurrence network in the (A) tumor, (B) normal, and (C) adjacent normal tissues. The color of the nodes and edges corresponds to the modularity community and the thickness of the edges corresponds to the magnitude of adjacency. DC, dendritic cell; EMT, epithelial-to-mesenchymal transition; ILC3, type 3 innate lymphoid cells; NK, natural killer cell; pDC, plasmacytoid dendritic cell; PRR, pattern recognition receptor; Texclusion, T cell exclusion program; follicular helper cells; Th17, T helper type 17; Treg, regulatory T cell. D Summary of the immunotherapytreated bulk RNA-seq cohorts with response data used in this study. * indicates newly generated data. E Forest plot of immunotherapy-response predictive cell states and gene signatures from other studies through meta-analysis of
immunotherapy-treated bulk RNA-seq cohorts ( patients). The x-axis represents the odds ratio, in which the dotted vertical line represents an odds ratio of 1, and the y-axis denotes cell states and previously defined gene signatures. For each cell state, rectangles and extended lines represent odds ratios and confidence intervals, respectively, calculated through meta-analysis from logistic regression for clinical response across immunotherapy-treated cohorts. Only cell states that achieved statistical significance are depicted. Cell states with odds ratios greater than 1 are those associated with favorable responses to immunotherapy. The colors correspond to the cell type categories of each cell state. APM, antigenpresenting machinery; DC, dendritic cell; EMT, epithelial-to-mesenchymal transition; IFNG, interferon-gamma; NK, natural killer cell; pDC, plasmacytoid dendritic cell; Treg, regulatory T cell. Source data are provided as a Source Data file.
inflammatory TME. Diverse components of the interferon-enriched community including LAMP3 DC, CCL19 fibroblast, CXCL9 macrophage, and mesenchymal-derived interferon states confer favorable responses to immunotherapy and form different ecosystems between tumor, adjacent normal, and healthy normal tissues. High-resolution annotation of comprehensive cell states from our pan-cancer singlecell atlas, in combination with spatial transcriptomics, enabled the categorization of cell types enriched in TLS and those that are not
within immunotherapy-favorable components, and the investigation of patterns that are highly reflective of complex tumor biology.
Although the gene expression divergence is mitigated during the malignant transformation of tissues in many cancer types , the evidence of the co-expressed gene modules in the TME at single-cell resolution is lacking. Herein, we aimed to identify hallmark gene expression programs in malignant tissues compared with normal tissues across various cell types, irrespective of the organs. Despite the
Fig. 6 | Spatial transcriptome analysis of tumor ecosystems across multiple cancer types. A Overview of pan-cancer spatial transcriptome analyzed in this study. B Boxplot comparing TLS signature scores between TLS and non-TLS spots. Statistical significance was calculated with the two-sided Wilcoxon rank sum test ( ). In the box plot, the center line, upper box limit, lower box limit, and whiskers represent the median, first quartile, third quartile, and interquartile range, respectively. C Predictive power of TLS signature for immunotherapy response in bulk RNA-seq cohorts treated with immunotherapy. The rectangle and extended lines represent the odds ratio and confidence interval, respectively, calculated using TLS signature scores through meta-analysis from logistic regression for clinical response across immunotherapy-treated cohorts ( , ). Nominal two-sided -values were obtained from the meta-analysis results of the logistic regression analysis. D Barplot of TLS-enriched cell types using TLSlabeled RCC spatial transcriptomes. The statistical significance of the enrichment or depletion was calculated using the two-sided Wilcoxon rank sum test and adjusted with the Benjamini-Hochberg method. Only the cell types reaching statistical significance are presented. DC, dendritic cell; ILC3, type 3 innate lymphoid cells; mono-M , monocyte-derived macrophage; NK, natural killer cell; Tfh, T follicular helper cells; Th17, T helper type 17; Treg, regulatory T cell, Trm; Tissueresident memory. E Spatial co-localizations of TLS signatures with diverse cell types across cancer types. DC, dendritic cell; Treg, regulatory T cell. Source data are provided as a Source Data file.
high heterogeneity embedded in the tissue ecosystems, our findings suggest that pan-organ gene expression programs exist across diverse cell types. These universal gene expression programs may account for the widespread application of immunotherapy (e.g., PD-1/PD-L1 inhibitors and CTLA4 inhibitors) in a variety of cancers, in contrast to the targeted therapy which has limited indications in specific cancer types. Comprehensive future studies are necessary to uncover the immunoregulatory role of the TME hallmark genes, which may represent immune checkpoints or therapeutic targets in the TME of diverse cancer types.
Our study features a thorough investigation of the mesenchymal states in tumor and normal tissues. In particular, we identified and inflammatory fibroblast states, which exhibited similar coincidence patterns with PRR-induced activation state and cytokine gene expression profiles. Although these inflammatory fibroblast populations have been previously recognized in several cancer types , our study provides a detailed exploration and uncovered the distinctions between these populations in terms of tissue and organ preferences, cellular interactions, and spatial colocalization patterns, thus underscoring the need for an integrative atlas. The fibroblast state was characterized by genes such as AKR1C1, CXCL8, CXCL2, CXCL3, and TNFAIP6 that are predictive of adverse responses to immunotherapy . Therefore, targeting the inflammatory fibroblast might offer new therapeutic insights, especially in OV and UCEC. Intriguingly, inflammatory fibroblast has been shown to interact with diverse TME components configuring inflammatory and pro-tumorigenic milieu via WNT5A, GREM1, and IL24 . Future studies that therapeutically target inflammatory fibroblasts should be pursued to mitigate deleterious consequences associated with these protumorigenic fibroblasts. Moreover, myofibroblasts in our study exhibited relatively higher enrichment in normal tissues compared with the findings of the previous pan-cancer study . It is worth noting that our study encompassed both tumor and normal samples from various organs, and the tissue enrichments of myofibroblasts represent a comprehensive outcome across all organs (Fig. 3E). Organ-wise analysis revealed myofibroblast enrichment in tumor tissues of the breast, pancreas, liver, and kidney (Supplementary Fig. S18C), suggesting a potential tumorigenic role of these fibroblasts in these organs . However, tumor-normal enrichment of myofibroblasts in the colon and stomach was comparable, aligning with prior studies that have documented the presence of myofibroblasts in the normal intestine .
Various cell states arising from distinct cell types, many of which were components of the interferon-enriched community, were favorable for immunotherapy. While TLS has previously been identified as a predictor of immunotherapy response , we emphasize that both TLS-enriched and non-enriched cell types contribute positively to immunotherapy responses. Furthermore, our TLS signature, which effectively distinguishes TLS from non-TLS spots in RCC patients, predicts favorable responses to immunotherapy and also successfully co-localizes with TLS-enriched cell types in various cancer types. However, it remains to be confirmed whether TLSenriched cell types are comparable in TLS-defined tissues of cancer types other than RCC. In addition, multiple states that confer adverse responses to the checkpoint blockade were also characterized, highlighting the need for alternative therapeutic options. To emphasize, although these immunotherapy-predictive cell states merely showed no prognostic significance on TCGA cohorts, immunotherapy showed differential treatment responses according to cell states for each cancer type, indicating that distinct mechanisms prevail in the course of immunotherapy treatment across cancer types.
Our study presents a distinctive perspective by constructing an extensive atlas that combines single-cell, spatial, and
immunotherapy-treated bulk datasets, and by systematically comparing tumor and normal ecosystems across diverse organs. This allowed us to unravel hallmark gene signatures of the tumor-normal ecosystems, outline distinctions between AKR1C1 and inflammatory fibroblasts, and characterize TLS-enriched and nonenriched cell types among immunotherapy-favorable components. The pan-cancer tumor-normal single-cell meta-atlas presented in the study would provide essential insights into a deeper understanding of tumor-normal ecosystems and lay the groundwork for future studies in precision oncology. For the benefit of the research community, our atlas can be accessed through the Zenodo repository (DOI:10.5281/zenodo.10651059) and web portal (https://cellatlas. kaist.ac.kr/ecosystem/).
Methods
Ethics approval and consent to participate
Our immunotherapy cohort study was approved by the Institutional Review Board of Samsung Medical Center (SMC 2018-03-130). All patients enrolled in the study provided informed written consent.
Our immunotherapy-treated lung cancer cohort
Histologically confirmed lung adenocarcinoma and lung squamous cell carcinoma patients, including previously reported cases , treated with either PD-1 or PD-L1 inhibitors were recruited. Clinical information of this cohort was collected from electronic medical records and tumor response was evaluated with Response Evaluation Criteria in Solid Tumors (v1.1). Progression-free survival (PFS) was defined as the time from the initiation of PD-1/PD-L1 inhibitors until the date of documented disease progression or death from any cause, whichever occurred first. Overall survival (OS) was defined as the time from the initiation of PD-1/PD-L1 inhibitors to death from any cause (Supplementary Data 8). The AllPrep DNA/RNA Mini Kit (Qiagen, USA) was used to purify RNA from formalin-fixed paraffin-embedded (FFPE) or fresh tumor samples. Subsequently, NanoDrop and Bioanalyzer (Agilent, USA) were used to measure the RNA concentration and purity. Library preparation was performed with either the TruSeq RNA Library Prep Kit v2 (Illumina, USA) or the TruSeq RNA Access Library Prep Kit (Illumina, USA), following the manufacturer’s instructions. In total, we generated transcriptome data for 497 immunotherapy-treated LC patients.
Single-cell data inclusion criteria and collection
For data selection, we first searched for relevant 10x scRNA-seq datasets to homogenize and reduce batch issues arising from different chemistries. Datasets were searched and downloaded from PubMed, Google Scholar, Gene Expression Omnibus, Single Cell Portal (https:// singlecell.broadinstitute.org/single_cell), COVID-19 Cell Atlas (https:// www.covid19cellatlas.org/), and Curated Cancer Cell Atlas (https:// www.weizmann.ac.il/sites/3CA/).
The inclusion criteria were as follows: studies generated from 10xgenomics reagent kits and studies that include cancer, pre-cancerous, benign tumors, and normal samples. Among normal control samples, non-malignant tissues derived from cancer patients (annotated as adjacent normal) and tissues from healthy normal individuals (annotated as normal) were collected separately. Studies that only include sorted cells (e.g.,; CD45 sorting), fluid samples (e.g.; ascites, CSF, or PBMC), cell-line cultures, mouse studies, and studies generated from nuclei-seq were excluded. Altogether, a total of 104 scRNA-seq datasets comprising 1070 tumors, 493 normal (adjacent normal + healthy normal) samples, and approximately 4.9 million cells from 999 individuals, were collected and integrated (Supplementary Data 1).
Single-cell RNA sequencing data analysis
The gene columns of each dataset were re-aligned according to the GRCh38 human reference genome (official Cell Ranger reference,
version 2020-A). For each dataset, cells with fewer than 1000 UMI counts and 500 detected genes were considered to be empty droplets and removed from the dataset. Cells with more than 7000 detected genes were considered potential doublets and removed from the dataset. The Scanpy (v.1.8.2) Python package was used to load the cellgene count matrix and for analysis . Clustering, annotation, and downstream analysis were performed using the tools in the Scanpy package complemented with some custom codes. Scrublet was used for doublet detection .
To reduce the computational burden and accelerate downstream analysis, a subset of cells was selected for each dataset with a Geometric sketch that mirrors the transcriptional diversity and preserves rare cell types (Fig. 1B-D and Supplementary Fig. S1A).
Cell type annotation and batch correction
We merged all tumor-normal scRNA-seq and divided the datasets to reduce the computational burden, visualize, and annotate cells. BBKNN was used as a batch effect correction algorithm to generate a connected graph structure , and after obtaining UMAP at a global scale, annotations were made based on cell type-specific marker genes (Supplementary Fig. S1B). Then, we examined and refined major cell type annotations for each dataset.
Copy number variation inference for identification of malignant cells
Single-cell transcriptome-based large-scale copy number variation (CNV) of malignant cells was inferred using inferCNVpy (using the package available at https://github.com/icbi-lab/infercnvpy, v.0.4.2) with default window size and gencode v29 for genomic location reference. We employed infercnvpy.tl.infercnv to infer CNV and selected normal immune cells or fibroblasts as reference normal cells depending on each cancer type. Following dimensional reduction (infercnvpy.tl.pca) and clustering based on CNV profiles (infercnupy.tl.leiden), cells were visualized on a CNV UMAP (infercnvpy.tl.umap) and CNV scores were calculated using infercnvpy.tl.cnv_score. Putative malignant cells were defined based on two criteria: (i) Formation of separate clusters, a known property of malignant cells , and (ii) higher CNV scores compared with known normal cell types (normal epithelial, fibroblasts, or immune cells based on each cancer type).
AND-gating algorithm of differential expression of genes for identification of hallmark gene signatures
We applied an AND-gating algorithm to extract tumor-enriched or immunotherapy-favorable gene signatures for each cell type across different cancers (Supplementary Fig. S2A). Cells from a specific organ were subsetted and differential expression analysis was performed to identify genes that were (i) upregulated in the cell type of interest compared with other cell types ( fold-change ) and (ii) highly expressed in the cell type of interest in tumor tissues (or immunotherapy responders) compared with normal tissues (or immunotherapy non-responders; fold-change and adjusted . Genes that satisfied both conditions were retained to create tumor-specific/immunotherapy-favorable gene signatures. The values were calculated using the two-sided test on log-normalized gene matrices and adjusted with the Benjamini-Hochberg method (Python packages scipy.stats v.1.10.0 and statsmodels.stats v.0.13.5). After obtaining the gene signatures derived from the AND-gating for each cell type and organ, we integrated the gene signatures from multiple organs to identify hallmark gene signatures for each cell type.
Biological annotation of the hallmark gene signatures of tumornormal ecosystems
We utilized Enrichr to annotate the biological functions of the tumorspecific hallmark gene signatures across diverse cell types. We
employed GO terms from MsigDB Hallmark 2020, GO Biological Process 2023, and GO Molecular Function 2023, and only the terms with an adjusted were considered as significant (Fig. 2C).
NMF pre-processing and visualization
After cell type annotation, we performed NMF for each individual tissue separately, accounting for each cell type category and tissue origin, to generate cell states that contribute to the heterogeneity within each individual. Starting from the log-normalized centered expression matrix of all genes, the negative values were set to zero. The sklearn.decomposition.NMF method was applied with default parameters as implemented in the scikit-learn python package v1.0.2. Considering that NMF requires a K parameter that influences the results, we ran NMF using different values ( ), thereby generating 35 modules for each individual.
Next, we applied a graphical approach to cluster and visualize the NMF modules. First, we max-normalized and merged all modules derived from each cell type and converted it to an anndata object. After highly variable gene selection, we removed low-quality modules (modules with an NMF weight less than 10-20 or greater than 150-170, depending on each cell type). Dimensional reduction using principal components and UMAP visualization was performed, and small module clusters with less than 150 modules were removed. Leiden clustering was then performed and a list of the top 50 genes was derived for each cluster. We then removed clusters enriched with either ribosomal protein genes or mitochondrial-encoded genes, composed of NMF modules from a single study, and suspected to reflect doublet cells or the soup effect based on high similarity to the expression profile from another cell type (e.g.; T cells genes in mesenchymal NMF modules).
Automation of doublet or soup effect cluster removal
To identify and remove NMF module clusters (cell states) indicating doublet cells or the soup effect, we built an algorithm for automating doublet or soup effect cluster detection. In detail, we identified the 2 organs (only 1 organ if there were more than 2 -fold differences of NMF module counts between the two predominant organs) that compose the majority of the NMF cluster of interest. We then subsetted the corresponding organs in our geometric sketched anndata of our tumor-normal meta-atlas. With the top 50 genes derived from the cluster, we scored each cell type category in the subsetted anndata using the sc.tl.score function in the Scanpy package. If the scores were greater than 0.2 in a different cell type (e.g., T cells) compared with the cell type of interest (e.g., mesenchymal), the cluster was defined as a doublet or soup effect cluster and was subsequently removed. Clusters with higher mesenchymal scores were not discarded from epithelial cell states to prevent the EMT state from being removed.
Defining and annotating cell states
After visualizing NMF modules and clustering the states, the top 50 genes with weighted averages were identified for each state. For overlapping genes between cell states, we orthogonally assigned the genes to the state with a higher NMF weighted average (Supplementary Data 2). Azimuth (https://azimuth.hubmapconsortium.org/), The Human Protein Atlas (https://www.proteinatlas.org/), and Enrichr were used as main references to annotate cell states. Also, to validate our cell states, we compared our states to the gene signatures derived from other studies with the Pearson correlation (Supplementary Fig. S4).
Construction of reference components with the cell states
To assess the correspondence between cell states and cell subtypes, we projected cells utilizing cell-type specific cell state profiles as reference components . For cell states from each cell type category, orthogonal genes with weighted averages were identified for each
state (see Defining and annotating cell states). Then, cell cycling and cell states derived from ambient RNAs or doublets were removed, and the genes constituting the remnant states were selected as variable genes in the log-normalized scRNA-seq dataset. Reference components were constructed by performing matrix multiplication between the scRNA-seq anndata and the cell state weighted averages (RCA=anndata.X.dot(cell state weighted average)). These reference components were used to replace the principal components, and subsequently, BBKNN was performed, using the dataset as a batch . Then, final cell type annotations were made based on cell typespecific marker genes (Fig. 3B, D and Supplementary Figs. S6, and 7).
Measuring cell state score distributions and coincidence analysis
To identify which cell states are enriched in the cells of each individual, we scored each individual with the orthogonal genes of the cell states using the sc.tl.score genes function to measure cell state scores. For 8 cancer types that constitute the majority of the pan-cancer atlas (BRCA, CRC, HCC, HNSC, LC, OV, PAAD, and RCC), we calculated the mean scores for each individual, and Pearson correlation was performed between cell states to measure the coincidence. For each coincidence between cell states, the adjacency was calculated with the WGCNA package (v.1.71) , and the Circos plot was depicted with the circlize package (v.0.4.15). The thickness of lines in the Circos plot corresponds to the adjacency between cell states.
The ratio of observed to expected of cell states
To quantify the tissue or organ preference of the cell states, we calculated the ratio of observed to expected (Ro/e). To quantify the tissue Ro/e, we created a contingency table by counting the occurrence of tissue origins (i.e.; normal, adjacent normal, and tumor) of NMF modules from the cell state of interest and others. To simultaneously consider the tissue and organ origins when calculating the Ro/e, we first extracted NMF modules of a cell state, determined proportions of organ origins within these modules, and filtered out those derived from organs constituting less than . Then, for each tissue origin, a contingency table was created by counting the occurrence of the organ origins of NMF modules from the cell state of interest versus other cell states. An expected number was derived using chi-square analysis and Ro/e was calculated as observed. We considered a cell state enriched or depleted in a specific tissue/organ if Ro/e or Ro/ , respectively.
Ligand-receptor interaction analysis
To understand the functional characteristics of and inflammatory fibroblasts, we investigated the potential cellular interactions between and inflammatory fibroblasts with other cell types using cell-cell interaction inference tools such as CellPhoneDB (v.3.1.0) , focusing on gene expression programs specific to these two inflammatory fibroblasts. The interaction intensity was calculated by multiplying the normalized expression values of ligands and receptors in each cell-cell pair.
RNA smFISH
RNA smFISH was performed on FFPE tissue sections obtained from desmoplastic stromas in patients with CRC and HNSC. We used RNAscope probes targeting human WNT5A (AD604921, 1:1500, Opal 570), GREM1 (AD312831-C2, 1:1500, Opal 690), and PDGFRA (AD604481-C3, 1:3000, Opal 520) to identify inflammatory fibroblasts, and CXCL10 (AD311851, 1:1500, Opal 570) and PDGFRA (AD604481-C2, 1:3000, Opal 520) to identify interferon-expressing fibroblasts. Five thick FFPE tissue sections were deparaffinized with xylene and subsequently processed with RNAscope Multiplex Fluorescent Reagent Kit Assay, following the manufacturer’s instructions. Fluorescence images were acquired with a ZEISS LSM 980 confocal
microscope using FITC (Opal 520), TRITC (Opal 570), Cy5.5 (Opal 690), and DAPI channels.
Survival analysis using bulk transcriptome
To evaluate the prognostic value of cell states and hallmark signatures in each cancer type, we performed survival analysis with TCGA RNA-seq data. Upper-quartile normalized FPKM data was collected from UCSC Xena across 28 cancer types . TCGA clinical data (OS) was obtained from data provided by the TCGA PanCancer clinical data resource . Enrichments of cell states and hallmark signatures were calculated for each TCGA primary cancer sample using the single-sample gene set enrichment analysis (ssGSEA) function implemented in the Corto package (v.1.1.10) . Patients were grouped into depleted and enriched groups based on the average cell state score of the analyzed samples. The Kaplan -Meier curves were plotted with a ggsurvplot function and the logrank test was performed to quantify statistical significance. The Benjamini-Hochberg method was applied to correct multiple testing. To evaluate the prognostic significance of cell states in relevant organs, we determined the Ro/e filtering threshold for each cell type using the following formula:
We identified cell states as rare within an organ if the tumorderived Ro/e values for those cell states within that organ did not exceed the filtering threshold. This prevented the deconvolution of rare cell states that are not relevant to the survival analyses of specific organs.
Network construction with cell states
We constructed an undirected network with cell states to visualize their co-occurrence patterns. When constructing each tissue network, we utilized cell states that are identified in the corresponding tissue origin (e.g., inflammatory fibroblast in tumor network only). After calculating the co-occurrence of cell states, the adjacency matrix was calculated with the WGCNA package (v.1.71) . The adjacency values of the cell state pair with a value greater than 0.05 were set to 0 to minimize spurious effects. Then, the adjacency matrix was imported into gephi (v.0.10.1) to construct a connected network . We conducted community detection with default parameters, colored the nodes with modularity class, and enlarged the nodes with the average weighted degree. We selected ForceAtlas2 for graph embedding.
Collection and processing of immunotherapy cohorts’ transcriptome data
We collected bulk transcriptome of immunotherapy-treated cohorts (4 cancer types, 8 cohorts). Transcriptomic data of the LC cohort was generated by Samsung Medical Center (our LC cohort, ; See Our immunotherapy-treated lung cancer cohort). For MEL cohorts, Van Allen et al. , Gide et al. , Riaz et al., , and Hugo et al. cohorts were gathered. Along with the BLCA cohort by Mariathasan et al. , RCC cohorts including McDermott et al. and Miao et al. were also collected . For all cohorts, the raw FASTQ files were obtained and processed in a unified pipeline (Fig. 5D). First, the adapter sequences in the FASTQ file were trimmed out by Trimmomatic (v.0.39) . To filter out rRNA, SortMeRNA (v.2.1b) was used . The filtered reads were aligned to the hg38 reference genome by the STAR aligner (v.2.7.6a) in two-pass basic mode with gencode annotation (v.35) . The aligned reads were then sorted by samtools (v.1.7) and the read counts were calculated by HTSeq (v.0.12.4) . To quantify gene expression, the read counts were normalized in the TPM value.
Analysis of immunotherapy cohorts
ssGSEA with gseapy (v.0.10.8) was performed to score cell state per sample and the normalized enrichment score was used in the analysis . For our pan-cancer analysis, only samples with both response and survival data were included; patients who had durable clinical benefits (complete response, partial response, stable disease with PFS >6 months or OS > 1 year) were classified as responders, and others as non-responders. We then conducted a meta-analysis to identify the associations between the clinical response to immunotherapy and cell states in multiple cohorts. First, the scaled signature score was fitted to the clinical response with logistic regression for each cohort. The calculated estimates and standard errors were then pooled across cohorts using the metagen function in the meta package . Finally, considering the heterogeneity between studies, the random effect model was established to estimate the effect of the cell states. From the random effect model, the overall estimate, standard error, and values were obtained.
Pan-cancer spatial transcriptome analysis
Spatial transcriptome analysis of 137 cancer datasets across 11 cancer types was performed with cell2location using default parameters to quantify the spatial distribution of cell types (Fig. 6A). For each spatial transcriptome cancer type, we employed the respective cancer scRNA-seq datasets from our pan-cancer single-cell atlas as a reference. Then, we employed spot-wise Pearson correlation with an estimated abundance of cell types to quantify spatial colocalization patterns, analogous to previous studies . A high positive Pearson correlation indicated that two cell types exhibited similar spatial distributions, while a negative Pearson correlation suggested distinct spatial distributions between the two cell types.
Construction of TLS gene signature and identification of TLSenriched cell types
To create a TLS signature and pinpoint cell types enriched in TLS using the RCC spatial transcriptome data with information of pathologically defined TLS spots . A pseudo-bulk matrix was compiled for both TLS and non-TLS spots in each sample, and subsequent differential expression analysis was performed with PyDESeq2 (v.0.4.3) . From genes exhibiting an adjusted , we selected the top 50 genes with the highest fold-change values (Supplementary Data 7). Enrichment of TLS gene signature was quantified with the sc.tl.score function of the Scanpy package for each spot, enabling the identification of spots enriched with the TLS signature in spatial transcriptome tissues . To identify TLS-enriched cell types, we compared cell abundances between TLS and non-TLS spots with the Wilcoxon signed-rank test (Python packages scipy.stats v.1.10.0) and characterized cell types that are enriched in TLS (Fig. 6B).
Reporting summary
Further information on research design is available in the Nature Portfolio Reporting Summary linked to this article.
Data availability
The scRNA-seq and spatial transcriptome datasets analyzed in this study are provided in Supplementary Data 1, 3, and 5, along with their accession codes and links. The processed scRNA-seq and spatial transcriptome data are available at Zenodo repository (DOI:10.5281/ zenodo.10651059) . Processed immunotherapy-treated lung cancer cohort data generated in this study have been deposited in the Gene Expression Omnibus repository under accession code GSE218989. Raw sequencing data of the immunotherapy-treated lung cancer cohort have been deposited in the European Genome-phenome Archive (EGA)
under controlled access with accession number EGAD50000000469. Data requests for academic or intellectual purposes will be reviewed by the data access committee, and are expected to be responded within 4 weeks. Our dataset can be interactively visualized at https://cellatlas. kaist.ac.kr/ecosystem/. Source data are provided with this paper.
Hanahan, D. & Weinberg, R. A. Hallmarks of cancer: the next generation. Cell 144, 646-674 (2011).
Patel, A. P. et al. Single-cell RNA-seq highlights intratumoral heterogeneity in primary glioblastoma. Science 344, 1396-1401 (2014).
Puram, S. V. et al. Single-cell transcriptomic analysis of primary and metastatic tumor ecosystems in head and neck cancer. Cell 171, 1611-1624.e24 (2017).
Bassez, A. et al. A single-cell map of intratumoral changes during anti-PD1 treatment of patients with breast cancer. Nat. Med. 27, 820-832 (2021).
Cheng, S. et al. A pan-cancer single-cell transcriptional atlas of tumor infiltrating myeloid cells. Cell 184, 792-809.e23 (2021).
Zheng, L. et al. Pan-cancer single-cell landscape of tumorinfiltrating T cells. Science 374, abe6474 (2021).
Barkley, D. et al. Cancer cell states recur across tumor types and form specific interactions with the tumor microenvironment. Nat. Genet. 54, 1192-1201 (2022).
Gavish, A. et al. Hallmarks of transcriptional intratumour heterogeneity across a thousand tumours. Nature 618, 598-606 (2023).
Giraldo, N. A. et al. The clinical role of the TME in solid cancer. Br. J. Cancer 120, 45-53 (2019).
Burgos-Panadero, R. et al. The tumour microenvironment as an integrated framework to understand cancer biology. Cancer Lett. 461, 112-122 (2019).
Shelton, S. E., Nguyen, H. T., Barbie, D. A. & Kamm, R. D. Engineering approaches for studying immune-tumor cell interactions and immunotherapy. iScience 24, 101985 (2021).
Sautès-Fridman, C., Petitprez, F., Calderaro, J. & Fridman, W. H. Tertiary lymphoid structures in the era of cancer immunotherapy. Nat. Rev. Cancer 19, 307-325 (2019).
Schumacher, T. N. & Thommen, D. S. Tertiary lymphoid structures in cancer. Science 375, eabf9419 (2022).
Jorgovanovic, D., Song, M., Wang, L. & Zhang, Y. Roles of IFN- y in tumor progression and regression: a review. Biomark. Res. 8, 49 (2020).
Li, H. et al. Reference component analysis of single-cell transcriptomes elucidates cellular heterogeneity in human colorectal tumors. Nat. Genet. 49, 708-718 (2017).
Di Federico, A. et al. Immunotherapy in pancreatic cancer: why do we keep failing? A focus on tumor immune microenvironment, predictive biomarkers and treatment outcomes. Cancers 14, 2429 (2022).
Delacher, M. et al. Rbpj expression in regulatory T cells is critical for restraining TH2 responses. Nat. Commun. 10, 1621 (2019).
Sadik, A. et al. IL4II is a metabolic immune checkpoint that activates the AHR and promotes tumor progression. Cell 182, 1252-1270.e34 (2020).
Zhang, Y., Du, W., Chen, Z. & Xiang, C. Upregulation of PD-L1 by SPP1 mediates macrophage polarization and facilitates immune escape in lung adenocarcinoma. Exp. Cell Res. 359, 449-457 (2017).
Li, H., Liu, W., Zhang, X. & Wang, Y. Cancer-associated fibroblastsecreted collagen triple helix repeat containing-1 promotes breast cancer cell migration, invasiveness and epithelial-mesenchymal
transition by activating the Wnt/ -catenin pathway. Oncol. Lett. 22, 814 (2021).
Gieniec, K. A., Butler, L. M., Worthley, D. L. & Woods, S. L. Cancerassociated fibroblasts-heroes or villains? Br. J. Cancer 121, 293-302 (2019).
Pan, E. et al. Characterization of FOLH1 expression in renal cell carcinoma (RCC). J. Clin. Orthod. 41, 713-713 (2023).
Wang, Y. et al. Silencing LINC00482 inhibits tumor-associated inflammation and angiogenesis through down-regulation of MMP15 via FOXA1 in bladder cancer. Aging 13, 2264-2278 (2020).
Kim, W. K. et al. Identification of specifically activated angiogenic molecules in HMGB-1-induced angiogenesis. BMB Rep. 50, 590-595 (2017).
Dalod, M., Chelbi, R., Malissen, B. & Lawrence, T. Dendritic cell maturation: functional specialization through signaling specificity and transcriptional programming. EMBO J. 33, 1104-1116 (2014).
Zhang, A., Lacy-Hulbert, A., Anderton, S., Haslett, C. & Savill, J. Apoptotic cell-directed resolution of lung inflammation requires myeloid integrin-mediated induction of regulatory T Lymphocytes. Am. J. Pathol. 190, 1224-1235 (2020).
Fenton, T. M. et al. Inflammatory cues enhance TGF activation by distinct subsets of human intestinal dendritic cells via integrin . Mucosal Immunol. 10, 624-634 (2017).
Yurchenko, M. et al. SLAMF1 is required for TLR4-mediated TRAM-TRIF-dependent signaling in human macrophages. J. Cell Biol. 217, 1411-1429 (2018).
Jerby-Arnon, L. et al. A cancer cell program promotes T cell exclusion and resistance to checkpoint blockade. Cell 175, 984-997.e24 (2018).
Luo, H. et al. Pan-cancer single-cell analysis reveals the heterogeneity and plasticity of cancer-associated fibroblasts in the tumor microenvironment. Nat. Commun. 13, 6619 (2022).
Galbo, P. M. Jr, Zang, X. & Zheng, D. Molecular features of cancerassociated fibroblast subtypes and their implication on cancer pathogenesis, prognosis, and immunotherapy resistance. Clin. Cancer Res. 27, 2636-2647 (2021).
Facciabene, A., Motz, G. T. & Coukos, G. T-regulatory cells: key players in tumor immune escape and angiogenesis. Cancer Res. 72, 2162-2171 (2012).
Sahai, E. et al. A framework for advancing our understanding of cancer-associated fibroblasts. Nat. Rev. Cancer 20, 174-186 (2020).
Monteran, L. & Erez, N. The dark side of fibroblasts: cancerassociated fibroblasts as mediators of immunosuppression in the tumor microenvironment. Front. Immunol. 10, 1835 (2019).
Liu, W. et al. Siglec-15 promotes the migration of liver cancer cells by repressing lysosomal degradation of CD44. FEBS Lett. 595, 2290-2302 (2021).
Chonov, D. C., Ignatova, M. M. K., Ananiev, J. R. & Gulubova, M. V. IL6 activities in the tumour microenvironment. Part 1. Open Access Maced. J. Med. Sci. 7, 2391-2398 (2019).
Masjedi, A. et al. The significant role of interleukin-6 and its signaling pathway in the immunopathogenesis and treatment of breast cancer. Biomed. Pharmacother. 108, 1415-1424 (2018).
Dostert, C., Grusdat, M., Letellier, E. & Brenner, D. The TNF family of ligands and receptors: communication modules in the immune system and beyond. Physiol. Rev. 99, 115-160 (2019).
Fuertes, G. et al. Noncanonical Wnt signaling promotes colon tumor growth, chemoresistance and tumor fibroblast activation. EMBO Rep. 24, e54895 (2023).
Hirashima, T. et al. Wnt5a in cancer-associated fibroblasts promotes colorectal cancer progression. Biochem. Biophys. Res. Commun. 568, 37-42 (2021).
Liu, S. et al. A tissue injury sensing and repair pathway distinct from host pathogen defense. Cell 186, 2127-2143.e22 (2023).
Martinez, S. et al. The PTK7 and ROR2 protein receptors interact in the vertebrate WNT/Planar Cell Polarity (PCP) pathway. J. Biol. Chem. 290, 30562-30572 (2015).
Corsini, M. et al. Cyclic adenosine monophosphate-response ele-ment-binding protein mediates the proangiogenic or proinflammatory activity of gremlin. Arterioscler. Thromb. Vasc. Biol. 34, 136-145 (2014).
Ren, J. et al. Cancer-associated fibroblast-derived Gremlin 1 promotes breast cancer progression. Breast Cancer Res. 21, 109 (2019).
Kumawat, K. & Gosens, R. WNT-5A: signaling and functions in health and disease. Cell. Mol. Life Sci. 73, 567-587 (2016).
Maeda, M. et al. Cancer cell niche factors secreted from cancerassociated fibroblast by loss of H3K27me3. Gut 69, 243-251 (2020).
Obradovic, A. et al. Immunostimulatory cancer-associated fibroblast subpopulations can predict immunotherapy response in head and neck cancer. Clin. Cancer Res. 28, 2094-2109 (2022).
Revel, M., Sautès-Fridman, C., Fridman, W.-H. & Roumenina, L. T. C1q+ macrophages: passengers or drivers of cancer progression. Trends Cancer Res. 8, 517-526 (2022).
Zhang, Y., Zhao, Y., Li, Q. & Wang, Y. Macrophages, as a promising strategy to targeted treatment for colorectal cancer metastasis in tumor immune microenvironment. Front. Immunol. 12, 685978 (2021).
Meylan, M. et al. Tertiary lymphoid structures generate and propagate anti-tumor antibody-producing plasma cells in renal cell cancer. Immunity 55, 527-541.e5 (2022).
Hu, W., Yang, Y., Li, X. & Zheng, S. Pan-organ transcriptome variation across 21 cancer types. Oncotarget 8, 6809-6818 (2017).
Wenners, A. et al. Stromal markers AKR1C1 and AKR1C2 are prognostic factors in primary human breast cancer. Int. J. Clin. Oncol. 21, 548-556 (2016).
Ma, Z. et al. Interferon-dependent SLC14A1+ cancer-associated fibroblasts promote cancer stemness via WNT5A in bladder cancer. Cancer Cell 40, 1550-1565.e7 (2022).
Huang, F., Zheng, Y., Li, X., Luo, H. & Luo, L. Ferroptosis-related gene AKR1C1 predicts the prognosis of non-small cell lung cancer. Cancer Cell Int. 21, 567 (2021).
Steele, C. W. et al. CXCR2 inhibition profoundly suppresses metastases and augments immunotherapy in pancreatic ductal adenocarcinoma. Cancer Cell 29, 832-845 (2016).
Xiong, X. et al. CXCL8 in tumor biology and its implications for clinical translation. Front. Mol. Biosci. 9, 723846 (2022).
Tian, H. et al. High expression of AKR1C1 is associated with proliferation and migration of small-cell lung cancer cells. Lung Cancer 7, 53-61 (2016).
Zhang, X., Xue, J., Yang, H., Zhou, T. & Zu, G. TNFAIP6 promotes invasion and metastasis of gastric cancer and indicates poor prognosis of patients. Tissue Cell 68, 101455 (2021).
Hosein, A. N., Brekken, R. A. & Maitra, A. Pancreatic cancer stroma: an update on therapeutic targeting strategies. Nat. Rev. Gastroenterol. Hepatol. 17, 487-505 (2020).
Costa, A. et al. Fibroblast heterogeneity and immunosuppressive environment in human breast cancer. Cancer Cell 33, 463-479.e10 (2018).
Krishnamurty, A. T. et al. LRRC15+ myofibroblasts dictate the stromal setpoint to suppress tumour immunity. Nature 611, 148-154 (2022).
Mifflin, R. C., Pinchuk, I. V., Saada, J. I. & Powell, D. W. Intestinal myofibroblasts: targets for stem cell therapy. Am. J. Physiol. Gastrointest. Liver Physiol. 300, G684-G696 (2011).
Roulis, M. & Flavell, R. A. Fibroblasts and myofibroblasts of the intestinal lamina propria in physiology and disease. Differentiation 92, 116-131 (2016).
Roh, W. et al. High-resolution profiling of lung adenocarcinoma identifies expression subtypes with specific biomarkers and clinically relevant vulnerabilities. Cancer Res. 82, 3917-3931 (2022).
Wolf, F. A., Angerer, P. & Theis, F. J. SCANPY: large-scale single-cell gene expression data analysis. Genome Biol. 19, 15 (2018).
Wolock, S. L., Lopez, R. & Klein, A. M. Scrublet: computational identification of cell doublets in single-cell transcriptomic data. Cell Syst. 8, 281-291.e9 (2019).
Hie, B., Cho, H., DeMeo, B., Bryson, B. & Berger, B. Geometric sketching compactly summarizes the single-cell transcriptomic landscape. Cell Syst. 8, 483-493.e7 (2019).
Polański, K. et al. BBKNN: fast batch alignment of single cell transcriptomes. Bioinformatics 36, 964-965 (2020).
Tirosh, I. et al. Dissecting the multicellular ecosystem of metastatic melanoma by single-cell RNA-seq. Science 352, 189-196 (2016).
Kuai, Z. & Hu, Y. Integration single-cell and bulk RNA-sequencing data to reveal senescence gene expression profiles in heart failure. Heliyon 9, e16214 (2023).
Kuleshov, M. V. et al. Enrichr: a comprehensive gene set enrichment analysis web server 2016 update. Nucleic Acids Res. 44, W90-W97 (2016).
Langfelder, P. & Horvath, S. WGCNA: an R package for weighted correlation network analysis. BMC Bioinforma. 9, 559 (2008).
Gu, Z., Gu, L., Eils, R., Schlesner, M. & Brors, B. circlize implements and enhances circular visualization in R. Bioinformatics 30, 2811-2812 (2014).
Efremova, M., Vento-Tormo, M., Teichmann, S. A. & Vento-Tormo, R. CellPhoneDB: inferring cell-cell communication from combined expression of multi-subunit ligand-receptor complexes. Nat. Protoc. 15, 1484-1506 (2020).
Goldman, M. J. et al. Visualizing and interpreting cancer genomics data via the Xena platform. Nat. Biotechnol. 38, 675-678 (2020).
Liu, J. et al. An integrated TCGA pan-cancer clinical data resource to drive high-quality survival outcome analytics. Cell 173, 400-416.e11 (2018).
Mercatelli, D., Lopez-Garcia, G. & Giorgi, F. M. corto: a lightweight R package for gene network inference and master regulator analysis. Bioinformatics 36, 3916-3917 (2020).
Bastian, M., Heymann, S. & Jacomy, M. Gephi: an Open source software for exploring and manipulating networks. ICWSM 3, 361-362 (2009).
Van Allen, E. M. et al. Genomic correlates of response to CTLA-4 blockade in metastatic melanoma. Science 350, 207-211 (2015).
Gide, T. N. et al. Distinct immune cell populations define response to Anti-PD-1 monotherapy and Anti-PD-1/Anti-CTLA-4 combined therapy. Cancer Cell 35, 238-255.e6 (2019).
Riaz, N. et al. Tumor and microenvironment evolution during immunotherapy with nivolumab. Cell 171, 934-949.e16 (2017).
Hugo, W. et al. Genomic and transcriptomic features of response to Anti-PD-1 therapy in metastatic melanoma. Cell 165, 35-44 (2016).
Mariathasan, S. et al. TGF attenuates tumour response to PD-L1 blockade by contributing to exclusion of T cells. Nature 554, 544-548 (2018).
McDermott, D. F. et al. Clinical activity and molecular correlates of response to atezolizumab alone or in combination with bevacizumab versus sunitinib in renal cell carcinoma. Nat. Med. 24, 749-757 (2018).
Miao, D. et al. Genomic correlates of response to immune checkpoint therapies in clear cell renal cell carcinoma. Science 359, 801-806 (2018).
Bolger, A. M., Lohse, M. & Usadel, B. Trimmomatic: a flexible trimmer for Illumina sequence data. Bioinformatics 30, 2114-2120 (2014).
Kopylova, E., Noé, L. & Touzet, H. SortMeRNA: fast and accurate filtering of ribosomal RNAs in metatranscriptomic data. Bioinformatics 28, 3211-3217 (2012).
Dobin, A. et al. STAR: ultrafast universal RNA-seq aligner. Bioinformatics 29, 15-21 (2013).
Frankish, A. et al. GENCODE 2021. Nucleic Acids Res. 49, D916-D923 (2021).
Li, H. et al. The Sequence Alignment/Map format and SAMtools. Bioinformatics 25, 2078-2079 (2009).
Anders, S., Pyl, P. T. & Huber, W. HTSeq-a Python framework to work with high-throughput sequencing data. Bioinformatics 31, 166-169 (2015).
Subramanian, A. et al. Gene set enrichment analysis: a knowledgebased approach for interpreting genome-wide expression profiles. Proc. Natl Acad. Sci. USA 102, 15545-15550 (2005).
Kleshchevnikov, V. et al. Cell2location maps fine-grained cell types in spatial transcriptomics. Nat. Biotechnol. 40, 661-671 (2022).
Zhou, Z., Zhong, Y., Zhang, Z. & Ren, X. Spatial transcriptomics deconvolution at single-cell resolution by Redeconve. bioRxiv 2022.12.22.521551 https://doi.org/10.1101/2022.12.22. 521551 (2022).
Massier, L. et al. An integrated single cell and spatial transcriptomic map of human white adipose tissue. Nat. Commun. 14, 1438 (2023).
Muzellec, B., Teleńczuk, M., Cabeli, V. & Andreux, M. PyDESeq2: a python package for bulk RNA-seq differential expression analysis. Bioinformatics 39, btad547 (2023).
Kang, J., Lee, J. H., Choi, J. K. & Park, J.-E. Systematic dissection of tumor-normal single-cell ecosystems across a thousand tumors of 30 cancer types. https://doi.org/10.5281/ZENODO. 10651059 (2024).
Acknowledgements
This work was supported by the National Research Foundation (NRF) funded by the Korean government (MSIT) (NRF-2022R1A4A5028131, NRF-2021M3A9I4024447, NRF-2021R1C1C1010094, and NRF2020R1A2C3006535), Future Medicine 2030 Project of the Samsung Medical Center (SMX1240011), and HR21C019803. This research was supported by a grant from the MD-PhD/Medical Scientist Training Program (Junho Kang) and Korea Health Technology R&D Project (HR21CO198) through the Korea Health Industry Development Institute (KHIDI), funded by the Ministry of Health & Welfare, Republic of Korea. Jong-Eun Park was supported by the POSCO Science Fellowship. The authors acknowledge the Korea Research Environment Open Network (KREONET) service and the usage of the Global Science Experimental Data Hub Center (GSDC) provided by Korea Institute of Science and Technology Information (KISTI). This publication is part of the Human Cell Atlas – www.humancellatlas.org/publications/.
Author contributions
J.K.C and J.E.P conceived and supervised the study. J.H.Kang and D.H.A collected and analyzed the datasets, J.H.Kang and J.H.L performed computational analysis, contributed to the interpretation of data, and prepared the first draft of the manuscript. S.H.L and H.C generated the immunotherapy-treated LC data, and A.Y.K and H.J.A collected patient tissue samples. J.H.Kang, J.H.L, S.L, and S.K performed experiments, J.H.Kang, J.H.L, J.H.Kwon, J.H.A, and S.Y.K made contributions to figure generation, and M.Y.B and J.H.Kang created the web portal. All authors revised the draft critically for important intellectual content and gave final approval for the final manuscript version to be published.
Correspondence and requests for materials should be addressed to Se-Hoon Lee, Jung Kyoon Choi or Jong-Eun Park.
Peer review information Nature Communications thanks Heng Xu, and the other, anonymous, reviewer(s) for their contribution to the peer review of this work. A peer review file is available.
Graduate School of Medical Science and Engineering, Korea Advanced Institute of Science and Technology, Daejeon, Republic of Korea. Department of Bio and Brain Engineering, Korea Advanced Institute of Science and Technology, Daejeon, Republic of Korea. Division of Hematology-Oncology, Department of Medicine, Samsung Medical Center, Sungkyunkwan University School of Medicine, Seoul, Republic of Korea. Division of Cancer Data Science, National Cancer Center, Bioinformatics Branch, Goyang, Republic of Korea. Department of Pathology, CHA Bundang Medical Center, CHA University, Seongnamsi, Republic of Korea. Department of Health Sciences and Technology, Samsung Advanced Institute of Health Science and Technology, Sungkyunkwan University School of Medicine, Seoul, Republic of Korea. Penta Medix Co., Ltd., Seongnam-si, Gyeonggi-do, Republic of Korea. Biomedical Research Center, Korea Advanced Institute of Science and Technology, Daejeon, Republic of Korea. These authors contributed equally: Junho Kang, Jun Hyeong Lee.
-e-mail: shlee119@skku.edu; jungkyoon@kaist.ac.kr; jp24@kaist.ac.kr