التصوير المقطعي المحوسب عالي السرعة لتصوير الديناميات الميكروهيكلية ثلاثية الأبعاد لامتصاص الزيت في الأطعمة المقلية عميقاً High-speed computed tomography to visualise the 3D microstructural dynamics of oil uptake in deep-fried foods
التصوير المقطعي المحوسب عالي السرعة لتصوير الديناميات الميكروهيكلية ثلاثية الأبعاد لامتصاص الزيت في الأطعمة المقلية عميقاً
تاريخ الاستلام: 13 يونيو 2024
تم القبول: 27 فبراير 2025
نُشر على الإنترنت: 16 مارس 2025
يو. فيرماآي. إم. رايليب. لوكيć ل. بروش بي. فيربوفنج. أ. ديلكور و ب. م. نيكولاى
يعمل الزيت كوسيلة تسخين عالية الحرارة خلال عمليات القلي العميق، وأيضًا كمساهم في الخصائص الحسية للأطعمة المقلية. يرتبط امتصاصه بالتشوهات الهيكلية أثناء القلي العميق التي تخلق مسارات لدخول الزيت إلى الميكروهيكل الغذائي. تقترح هذه الدراسة نظام تصوير رباعي الأبعاد (ثلاثة أبعاد مكانية والزمن) باستخدام التصوير المقطعي بالإشعاع السنكروتروني السريع للتصور في الموقع أثناء القلي العميق والتبريد بعد القلي لفهم الآليات وراء امتصاص الزيت. باستخدام عجينة دقيق القمح كنظام غذائي نموذجي، نحقق في تأثير درجة حرارة زيت القلي على التشوه الهيكلي وتكوين المسام في القشرة واللب، وسلامة هيكل المسام، وامتصاص الزيت وتوزيعه. تظهر النتائج أن درجات الحرارة الأعلى تؤدي إلى تكوين قشرة مميزة مع فتحات سطحية، مما يسهل امتصاص الزيت بشكل أكبر في المسام الصغيرة للقشرة من خلال العمل الشعري. عند مقارنة الهياكل الدقيقة ثلاثية الأبعاد التي تم الحصول عليها عند درجات حرارة زيت القلي المختلفة، يصل محتوى الزيت النهائي إلىفي، “في، و فيمع التغيرات الهيكلية المعتمدة على درجة الحرارة في ترابط المسام وسلامة الشبكة التي تؤثر بشكل كبير على معدل امتصاص النفط وتوزيعه.
القلي العميق هو تقنية معالجة غذائية شائعة جداً حيث يتم غمر الأطعمة بالكامل في زيت ساخن.إن قابلية تطبيق هذه العملية على مجموعة واسعة من المنتجات الغذائية والخصائص المميزة للنكهة والحساسية التي تضفيها قد جعلت الأطعمة المقلية في الزيت عنصرًا أساسيًا في الأنظمة الغذائية في جميع أنحاء العالم، وخاصة في الأنظمة الغذائية الغربية.منتجات مقلية تعتمد على دقيق القمح (حوالي 70-75% نشا والبروتين) شائعة عبر عدة فئات من المنتجات (مثل، الكعك، المعكرونة، المنتجات المقلية) وتنوعات المنتجات الخاصة بالثقافة داخل كل فئة (مثل، الكعك الفرنسي المعروف باسم بيني في فرنسا، الشوروز في إسبانيا، يوتياو في الصين) جعلت الأطعمة المقلية المصنوعة من دقيق القمح شائعة في جميع أنحاء العالم. ومع ذلك، فإن هذه المنتجات عادة ما تحتوي على نسبة عالية من الدهون (حواليجزء) وبالتالي، كثافة طاقة عاليةتسلط العديد من المراجعات المنهجية الضوء على ارتباط مقلق بين المحتوى العالي من السعرات الحرارية في الأطعمة المقلية. المنتجات والحالات الصحية الضارة المرتبطة باستهلاكها (المفرط)علاوة على ذلك، فإن درجات الحرارة العالية المتضمنة في عملية القلي العميق تسهل التفاعلات الكيميائية التي تنتج الأكريلاميد، وهو مركب مصنف كعامل مسرطن محتمل للبشر، مما يزيد من المخاطر الصحية المحتملة مع الاستهلاك المنتظم.توصي الإرشادات الغذائية الحالية لمنظمة الصحة العالمية (WHO) بتقليل إجمالي استهلاك الدهون إلىمن إجمالي استهلاك الطاقةعلى الرغم من أن الحصول على منتجات غذائية مقلية عميقًا تتمتع بخصائص حسية مرغوبة وملف غذائي مناسب لا يزال يمثل تحديًا لصناعة المواد الغذائية، إلا أنه أصبح أكثر أهمية مع تزايد القضايا الصحية المرتبطة باستهلاكها والتمحيص في المواد الغذائية المعالجة في السنوات الأخيرة..
تتطور الخصائص الهيكلية لمصفوفات الطعام المسامية المقلية في الزيت العميق أثناء القلي (جزئيًا) بسبب التحول السريع في الطور.
من الماء إلى البخار مما يتسبب في تكوين خلايا غازية وتمتلئ بالبخار. الزيادة الناتجة في الضغط الداخلي تؤدي إلى تمدد وتشوه الهيكل الداخلي قبل أن يهرب البخار في النهاية إلى السطح.تختلف المصفوفة الصلبة المسامية الناتجة (المشار إليها فيما بعد بالميكروهيكل) مكانيًا عبر المنتج المقلي وتتميز بتوزيع واسع لأحجام المسام وسمك الجدران الصلبة.على الرغم من أن الآلية (الآليات) التي تحدد و/أو تؤثر على امتصاص الزيت خلال وبعد عملية القلي العميق قد تم الإبلاغ عنها سابقًالا تزال ديناميات هذه العمليات وكذلك مساهمتها في محتوى الزيت النهائي للمنتج غير مفهومة تمامًا. من المحتمل أن يكون ذلك بسبب الطبيعة المعقدة والعنيفة لعملية القلي العميق، المتعلقة بالظواهر السريعة والمتزامنة لنقل الحرارة والكتلة، مما جعل الدراسات في الموقع ضرورية لدعم الفرضيات المقترحة بشكل صعب.
اعتبرت الدراسات المبكرة امتصاص النفط ظاهرة سطحية بحتة وأبرزت أهمية خصائص السطح (مثل، خشونة السطحالهندسةنفاذية للنفط ) في التأثير على التصاق زيت القلي على سطح المنتجات المقلية العميقة اليوم، يُقبل عمومًا أن امتصاص الزيت هو ظاهرة مدفوعة بالضغط. الضغوط الداخلية الإيجابية التي تتطور أثناء تبخر الماء وتوسع المنتج تعيق دخول الزيت أثناء القلي العميق. أثناء التبريد، يوفر تكثف البخار تدرج ضغط ملائم لامتصاص الزيت الموجود على سطح الطعام إلى المصفوفة الداخلية.عدة دراسات تجريبيةونماذج عدديةركزت الدراسات على ديناميات امتصاص الزيت وأظهرت أن دخول الزيت يحدث بشكل أساسي بعد إزالة الطعام من زيت القلي. بالإضافة إلى ذلك، تم عزو امتصاص الزيت في المسام الدقيقة للقشرة إلى التغيرات في الضغوط الشعرية، مما يشير إلى الدور الحاسم الذي تلعبه مورفولوجيا شبكة المسام (مثل المسامية).حجم المسام ) وفي المقابل، قد تؤثر التغيرات المجهرية خلال عملية القلي العميق على ديناميات امتصاص الزيت . يعتمد مدى هذه التغيرات المجهرية على تركيبة المنتج (مثل محتوى الرطوبة )، خصائص النشا والبروتين وظروف القلي (مثل، درجة حرارة الزيتمدة القليمؤخراً، تم التحقيق في العلاقة بين الميكروهيكل المنتج وامتصاص الزيت أثناء القلي العميق لفهم سلوك امتصاص الزيت الناتج عن القلي العميق بشكل أفضل.. ومع ذلك، بسبب عدم القدرة السابقة على دراسة عملية القلي العميق في الوقت الحقيقي، فإن العلاقات المحددة والمباشرة بين الهيكل المجهري ثلاثي الأبعاد المتطور وامتصاص الزيت تفتقر حاليًا.يعتبر إنشاء رابط بين هذه الظواهر أمرًا ضروريًا لفهم امتصاص الزيت الناتج عن القلي العميق في المواد الغذائية بشكل أفضل.
يتم تشكيل عجينة دقيق القمح (WFD) من خلال ترطيب جزيئات الدقيق والضغوط الميكانيكية الناتجة عن العجن، مما يؤدي إلى تطوير شبكة جلوتين لزجة متقاطعة مميزة تحيط بحبيبات النشا وتحبس فقاعات الغاز (خلايا الغاز) بداخلها.تتعلق الخصائص المجهرية للأطعمة المعتمدة على دقيق القمح المقلي بعمق ارتباطًا وثيقًا بالتغيرات الفيزيائية والكيميائية والانتقالات الطورية (مثل انتقال الزجاج) لكل من النشا وبروتينات الجلوتين التي تحدث خلال العملية.تنتفخ حبيبات النشا وتتحول إلى هلام أثناء القلي العميق، مما يظهر خصائص شكلية متغيرة (مثل، تدمير و/أو تجمع الحبيبات).لقد أظهرت الدراسات أيضًا أن خصائص تشوه المنتج الناتجة عن القلي العميق تتأثر بشدة بمحتوى الجلوتين، حيث تظهر أنظمة WFD ذات محتوى الجلوتين الأعلى امتصاصًا أقل للزيت.علاوة على ذلك، من المحتمل أن التغيرات المجهرية وامتصاص الزيت تعتمد أيضًا على محتوى الرطوبة..
يمكن أن يساعد مراقبة التغيرات المجهرية في أنظمة WFD أثناء القلي العميق والتبريد اللاحق في ربط التحولات التي تحدث في هذه التركيبة الغذائية المعقدة بسلوك امتصاص الزيت الناتج عن عملية القلي العميق. تقنيات التصوير المتطورة (المجهر الضوئي)المجهر الإلكتروني الماسحمجهر المسح الضوئي بالليزر المتماسكلقد تم استخدامها على نطاق واسع لاستكشاف البنية المجهرية للأطعمة المقلية، وتحليل هيكل المسام في مناطق القشرة والنواة، و تحديد النفط داخل هذه المنتجاتلقد أصبح التصوير غير التدميري ممكنًا باستخدام التصوير بالرنين المغناطيسيوتصوير الأشعة السينية المجهري المحوسبمع أن الأخيرة توفر دقة مكانية أعلى بشكل ملحوظ لوصف البنية الدقيقة، إلا أن ديناميات العملية لم يتم التقاطها بالكامل أبداً.تتيح براعة مصادر ضوء السنكروترونالاستحواذات بدقة مكانية وزمنية أعلى بكثير من تلك القابلة للتحقيق حاليًا في المختبراتالإعدادات. 4D تم استخدام التصوير بدقة زمنية منخفضة للحصول على رؤى قيمة حول عمليات مثل تخمير عجينة الخبز.خبز الخبزوديناميكية التجفيف بالتجميدنظرًا للمرونة الإضافية من حيث إعدادات التجارب، فإنها جذابة للتحقيق وكشف النظريات المتعلقة بعملية القلي العميق.
هنا، قمنا بتطوير وتطبيق التصوير المقطعي المحوسب بالأشعة السينية المتزامن مع الزمن في بيئة السنكروترون لتصوير عملية القلي العميق تحت ظروف العالم الحقيقي. تم بناء نظام قلى عميق في الموقع وتم تشغيله عن بُعد مع تحكم دقيق في موضع العينة، ودرجة حرارة زيت القلي، ومدة القلي العميق أثناء التصوير. ساعد البعد الرباعي في هذه الدراسة على التقييم الكمي لديناميات امتصاص الزيت والتوزيع المكاني داخل التركيبة المعتمدة على WFD أثناء وبعد القلي العميق. سمح التصوير الديناميكي عالي السرعة، المحسن لكل من الدقة الزمنية والمكانية، بدراسة التغيرات في البنية المجهرية المسامية ثلاثية الأبعاد، ومحتوى الزيت، وتوزيع الزيت في WFD المقلي عميقًا عند درجات حرارة مختلفة. تم استخدام قياسات تكميلية لمراقبة تطور درجة الحرارة ومحتوى الرطوبة (MC) لـ WFD لتوضيح التغيرات الهيكلية الدقيقة التي تم ملاحظتها بواسطة التصوير المقطعي. المعرفة المكتسبة من خلال هذه التجارب تعزز فهم سلوك امتصاص الزيت وتطور شكل المسام طوال عملية القلي العميق، وبالتالي تعزز فهم العوامل التي تؤثر على الديناميات الهيكلية الدقيقة المتغيرة بسرعة للأطعمة التي تخضع لهذه العملية.تفتح الدروس أبوابًا لتحقيقات مستقبلية حول كيفية تخصيص تركيبات المنتجات أو معايير المعالجة لتصنيع المنتجات الغذائية المقلية التي تتماشى مع توقعات المستهلكين الحسية وإرشادات الصحة.
النتائج
4D (ثلاثة أبعاد مكانية والزمن) تم إجراؤه لدراسة التغيرات الميكروهيكلية وديناميات امتصاص الزيت في نقاط زمنية مختلفة خلال 56 ثانية من عملية القلي العميق و63 ثانية التالية من التبريد بعد القلي لعينات WFD (محتوى الرطوبة). درجات حرارة القلي العميق المختلفة (180، 150 وتم اعتبار ) مما أدى إلى تغييرات ميكروهيكلية مميزة أثناء القلي العميق وبالتالي مكن من فهم تأثير ظروف العملية على تطوير المسامية وديناميات امتصاص الزيت الناتجة. تم تحديد محتوى الرطوبة في مراحل مختلفة من عملية القلي العميق لتقييم كيفية ارتباط ديناميات فقدان الرطوبة عند درجات حرارة القلي العميق المختلفة بالتغييرات الميكروهيكلية الملحوظة. علاوة على ذلك، تم قياس ملفات درجات الحرارة المحلية تحت السطح (تمثل مناطق القشرة) وفي المركز (تمثل مناطق اللب) أثناء القلي العميق وتبريد ما بعد القلي لمراقبة تطور تدرج الحرارة، بما في ذلك تقدم جبهة التبخر، وتأثيرها على تشوه الهيكل.
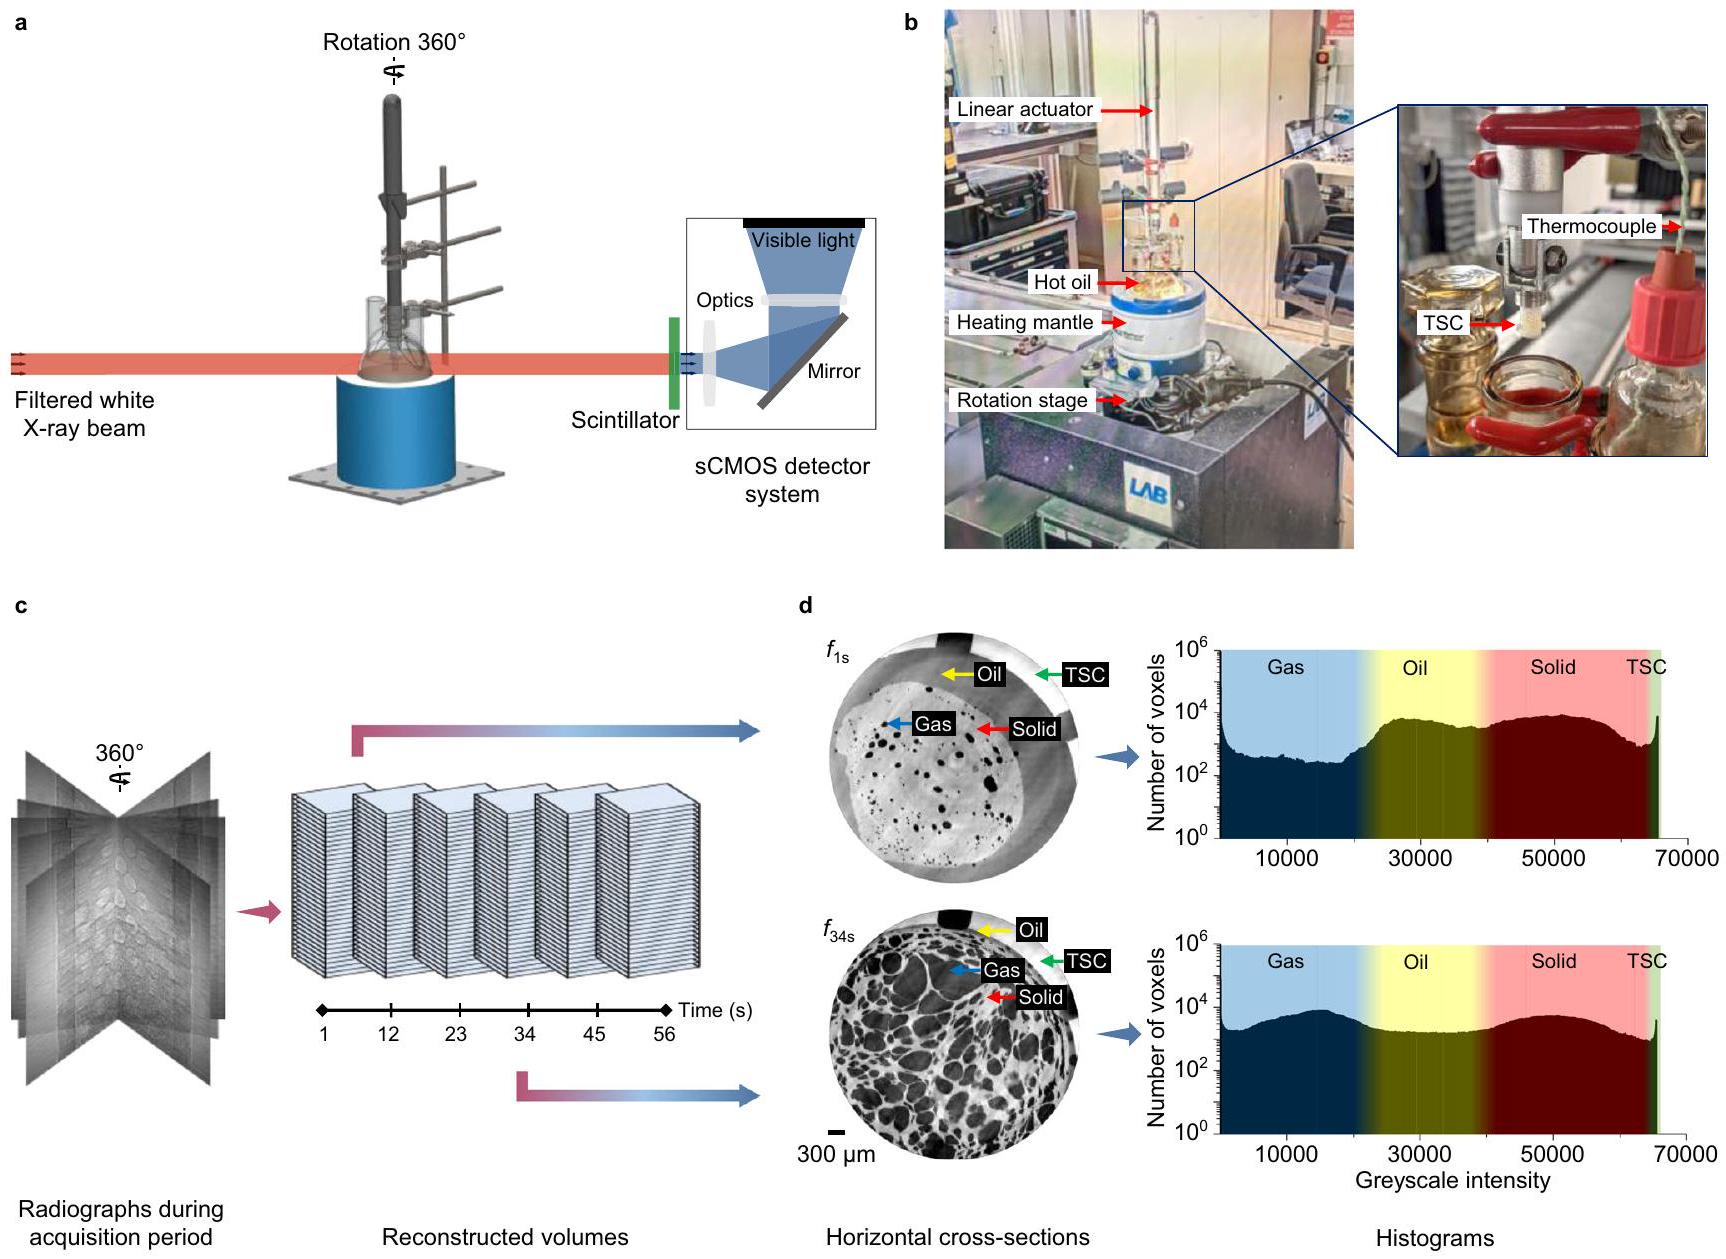
تم إجراء تصوير ديناميكي عالي السرعة على خط الشعاع ID19 في المنشأة الأوروبية للأشعة السينية (ESRF، غرونوبل، فرنسا) القادرة على التصوير المقطعي فائق السرعة بدقة مكانية عالية.لإدراج نتائج التحقيق الزمني في السياق، تم تصوير عينات WFD قبل القلي العميق باستخدام مختبر. (انظر “الطرق”). تم وضع عينات تحتوي على 50 ملغ من المادة الجافة (DM) في حامل العينات لإنشاء صور بحجم فوكسل أثناء القلي العميق وخلال التبريد المحيط اللاحق. الشكل 1أ يوضح مخطط إعداد تجريبي مخصص مزود بتحكم عمودي عن بُعد في عينة في إعداد تصوير تزامني، مع الإعداد الفعلي.
الشكل 1 | نظرة عامة تخطيطية على إعداد التصوير المقطعي بالأشعة السينية السريعة في الموقع. أ الإعداد التجريبي في خط الأشعة ID19 من ESRF (غرونوبل، فرنسا). يمر شعاع الأشعة السينية البيضاء المفلترة عبر العينة الدوارة بينما يتم جمع الصور الشعاعية بواسطة نظام كاشف غير مباشر سريع من نوع sCMOS؛ ب الإعداد التجريبي المثبت على مرحلة الدوران للاكتساب السريع، (الإطار) حاوية العينة مثبتة على المحرك الخطي للتلاعب بالعينة عن بُعد أثناء وبعد عملية القلي العميق؛ ج الصور الشعاعية الملتقطة في ستة متتاليات. نقاط زمنية خلال فترة الاكتساب، تتكون الأحجام المعاد بناؤها لاحقًا من صور مقاطع عرضية بتدرج الرمادي؛ د مقاطع عرضية أفقية تمثيلية من الأحجام ثلاثية الأبعاد المعاد بناؤها (في النقاط الزمنية 1 ثانية و34 ثانية خلال القلي العميق) مع مراحل مختلفة موضحة بناءً على قيمة الكثافة، والتجزئة المقابلة على هيستوغرام كثافة تدرج الرمادي مع نطاقات الكثافة محددة بألوان مميزة لتحديد المراحل، الصلبة (أحمر)، الزيت (أصفر)، الغاز (أزرق)، TSC (أخضر)، متأثرة بخصائص التوهين الخاصة بها. موضحة في الشكل 1ب (للحصول على وصف تفصيلي لعملية الإعداد وبروتوكول الاستحواذ، انظر “الطرق”). باستخدام إعادة بناء التصفية العكسية مع استرجاع الطور (الشكل 1ج)، تم الحصول على صور حجم ثلاثية الأبعاد تُظهر الهيكل المجهري المسامي الذي يميز المصفوفة الصلبة، والفراغات المملوءة بالغاز أو الزيت وزيت القلي بالإضافة إلى حاوية عينة التفلون (TSC) (الشكل 1د). هنا، يبدو أن الطور الصلب ذو التوهين العالي (الذي يمثل WFD المقلي بعمق) أكثر سطوعًا في الصور المقطعية، مما يمكّن من الفصل عن الغاز ذو التوهين المنخفض، بينما يقع طور الزيت بين هذين الطورين بسبب الاختلافات في توهين الأشعة السينية وتأثيرات الطور. لم يتم تمييز الطورين بناءً فقط على عتبات كثافة الرمادي، ولكن مع السياق المكاني والزماني في مراحل مختلفة أثناء الاستحواذ. مع توسع العينة أثناء القلي العميق، زاد الفضاء الذي تشغله بسبب زيادة حجم الغاز (الذي يمثل زيادة في نسبة الهيستوغرام) مما أدى إلى إزاحة حجم الزيت (الذي يمثل انخفاضًا في نسبة الهيستوغرام).
توسع المسام السريع أثناء القلي العميق يشوه الهيكل
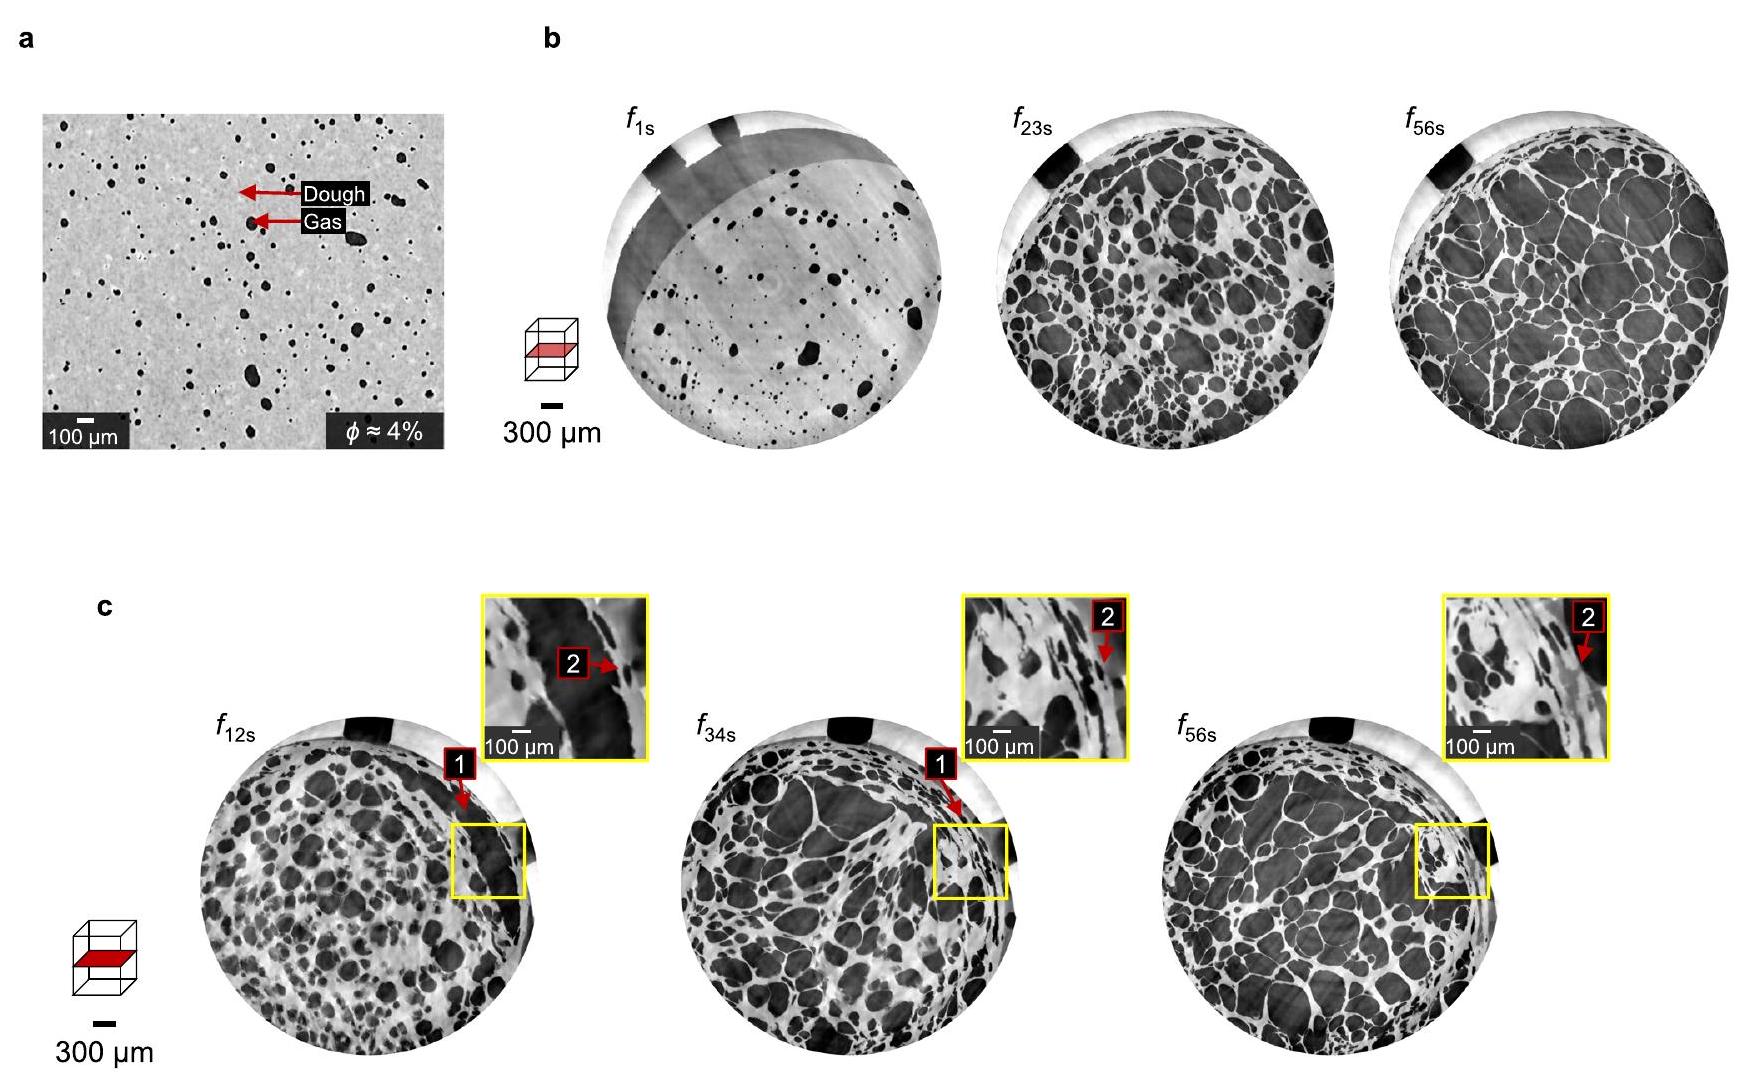
الأظهرت صور عينات WFD قبل القلي العميق مرحلة مادة العجين مع مسام مليئة بالغاز موزعة بشكل موحد (الشكل 2أ)، والتي تُعرف بشكل أكثر شيوعًا بخلايا الغاز في أبحاث الحبوب.. غاز المسام مشغولةمن الحجم بحواليمتوسط قطر حجم المسام، يتراوح من 5 إلى (توزيع حجم المسام موضح في الشكل التكميلية 1).
المقاطع العرضية الأفقية لعينات WFD التي تخضع لتغير هيكلي أثناء القلي العميق فيمُعَروضة في الشكل 2ب، يُظهر الشكل 3 المرافق المقاطع العرضية الرأسية المقابلة. عند الاتصال الأولي لعينة WFD مع زيت القلي (أي بعد 1 ثانية من الغمر)، كانت البنية الدقيقة الكثيفة المكونة من العديد من المسام الصغيرة المملوءة بالغاز لا تزال مرئية وكانت تشبه بنية عينة WFD غير المقلية. في هذه المرحلة من القلي العميق، يؤدي انتقال الحرارة الحملية من زيت القلي الساخن إلى غليان سطحي فقط، مما يبدأ التحويل الفوري للماء إلى بخار وتكوين فقاعات بخار على السطح..
من خلال استمرار توصيل الحرارة داخل العينة، اقتربت درجات الحرارة تحت السطح بسرعة من نقطة غليان الماء، بينما تقدم توصيل الحرارة بشكل أبطأ نحو المركز (الشكل 4ب). نتيجة لزيادة توليد البخار وارتفاع ضغوط الغاز، تم بدء التشوه من خلال تمدد المسام الموجودة مسبقًا، والتي كانت تعمل بشكل أساسي كمواقع نواة. توسعت البنية خلال المراحل المبكرة من القلي العميق (أي بين 1 و 13 ثانية) وتحولت إلى مصفوفة صلبة ذات مسامية عالية (الشكل 3أ). لوحظ أن أجزاء من شبكة النشا-الجلوتين قد تمزقت تحت
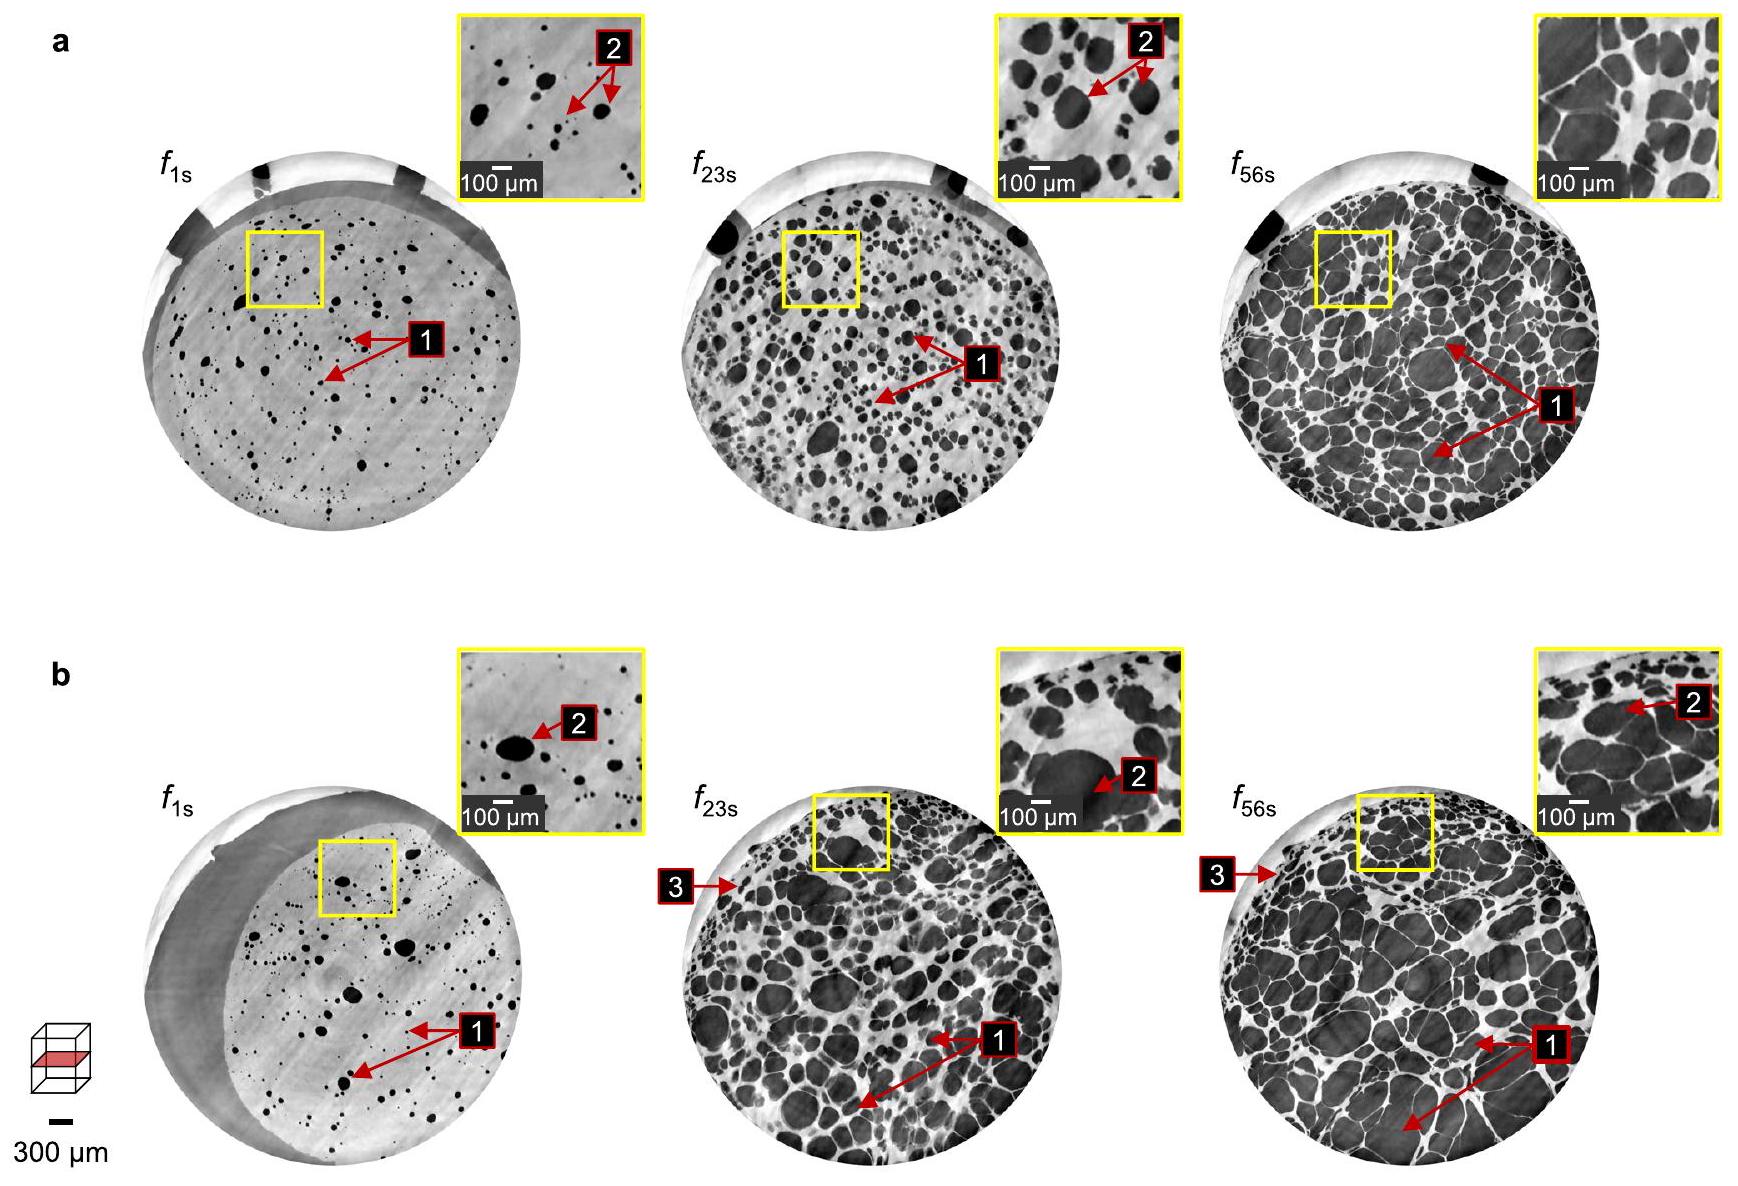
الشكل 2 | تطور الميكروهيكل في عينات WFD أثناء القلي العميق في. شريحة معاد بناؤها من عينة WFD قبل القلي العميق تظهر هيكلًا متجانسًا يتضمن مسامًا مليئة بالغاز موزعة بشكل موحد؛ ب شريحة معاد بناؤها من التغير في الميكروهيكل على مدار عملية القلي العميق؛ ج مناطق الاهتمام (المربعات الصفراء) في شرائح الأشعة السينية CT في مراحل مختلفة من القلي العميق-
أوقات القلي: (1) تشكيل مسام كبيرة عند حواف العينات التي تم ضغطها لاحقًا تحت التمدد الداخلي للمسام، (2) دخول الزيت المحلي من خلال جدران المسام المفتوحة الممزقة على السطح خلال المراحل المتأخرة من القلي العميق. تم الإشارة إلى القضبان المقياس في ; تسميات الوقت تشير إلى الملاحظات خلال فترة القلي العميق، وتدل المؤشرات السفلية على الوقت بالثواني.
استمر التمدد، مما أدى إلى تشكيل مسام كبيرة حيث تكتلت المسام الغازية الأصغر المجاورة. في هذه المرحلة، كانت نسبة الرطوبة DM (, الشكل 4أ) مما يدل على أن العينة فقدت جزءًا صغيرًا من الماء. تمت إزالة الرطوبة بشكل أساسي من خلال التبخر على السطح، حيث تم نقلها بعيدًا بواسطة الزيت . داخليًا، مع زيادة ضغط البخار بسبب التبخر عند واجهات المسام والمصفوفة في جميع أنحاء المادة، انتشرت الرطوبة تدريجيًا من مناطق التشبع الأعلى نحو السطح . وهذا يثبت أن التمدد الحجمي المستمر الناتج عن تبخر الماء وزيادة حجم المسام المملوءة بالبخار داخل الهيكل الصلب لنظام WFD exerted المزيد من القوى على الجدران الداخلية مما أدى إلى ترقق المصفوفة الصلبة.
بين 19 و 23 ثانية، استقرت درجات الحرارة في القشرة عند حوالي لفترة قصيرة قبل أن تزداد بمعدل أبطأ بعد ذلك (الشكل 4ب). تشير هذه الفترة القصيرة حيث استقرت درجات الحرارة في القشرة إلى أن جبهة التبخر تقدمت إلى المناطق الأساسية بمجرد إزالة كمية كافية من الرطوبة من القشرة. استمر التمدد في المناطق الأساسية حيث استقرت درجات الحرارة عند (الشكل 4ب)، مما دفع الطبقات السطحية ضد الجدران الداخلية لحامل العينة (تم ملاحظته من 23 ثانية فصاعدًا في الأشكال 3ب و 2ج) مما يدل على مرونة عالية لمكونات البوليمر الحيوي مما يعيق هروب البخار على السطح خلال المراحل المبكرة من القلي العميق .
استمرت درجات الحرارة في الارتفاع فوق في القشرة، بينما استقرت حول نقطة غليان الماء في النواة (الشكل 4ب). أدت فقدان الرطوبة المستمر , الشكل 4أ) إلى تشكيل منطقة مميزة تمثل هيكلًا يشبه القشرة بعد 34 ثانية من القلي العميق (الشكل 2ج). استمر انتقال الرطوبة من النواة إلى القشرة من خلال مزيج من الحمل المدفوع بالضغط والانتشار الشعري لكل من البخار والسائل
الماء , بينما تمت إزالة الرطوبة باستمرار من القشرة من خلال الانتشار والحمل للبخار. تم تسهيل تشكيل القشرة من خلال انتقال الرطوبة الأبطأ من النواة مقارنة بالتبخر السريع على السطح . كانت القشرة تتكون إلى حد كبير من العديد من المسام الصغيرة المسطحة ذات الجدران السميكة، بينما كانت منطقة النواة تتكون من مسام أكبر غير منتظمة ذات جدران رقيقة. تباطأ التمدد داخل الهيكل المسامي العالي بشكل متتابع بين 45 و 56 ثانية من القلي العميق، والذي تم نسبه (جزئيًا) إلى فقدان الرطوبة الكبير (النهائي , الشكل 4أ) وزيادة الصلابة الهيكلية للبوليمرات الحيوية في نظام WFD . كانت الغالبية العظمى من تدفق الحرارة الداخلي موجهة نحو تحويل الماء السائل إلى بخار من خلال الغليان الذي لوحظ من خلال استمرار استقرار درجة حرارة النواة عند . أظهرت الدراسات حول الميكروهيكل للمنتجات القائمة على البطاطس أن تشكيل المسام الصغيرة في القشرة يُعزى إلى انكماش العينة الناتج عن فقدان الرطوبة بعد القلي العميق المطول . ومع ذلك، تظهر الصور الديناميكية لنظام WFD المقلي هنا أن هذه المسام الصغيرة تتشكل بسبب تمدد المناطق الأساسية والضغط اللاحق للمسام تحت السطح.
يمر النشا والجلوتين في العينات بتحولات هيكلية تدريجية خلال القلي العميق . في نظام WFD، على الرغم من أن النشا هو مكون رئيسي، إلا أن الهيكل مدعوم بشكل أساسي بشبكة الجلوتين اللزجة بسبب التغيرات الهيكلية الواسعة التي تحدث خلال القلي العميق . ومع ذلك، تم مؤخرًا إظهار أن انتقال نشا البطاطس (في أنظمة نموذج نشا البطاطس-الماء) من الحالة المطاطية، بعد الجيلاتينية، إلى الحالة الزجاجية، ضروري للحفاظ على الهيكل المتوسع بسبب تبخر الماء الناتج عن القلي . توفر التغيرات في محتوى الرطوبة للعينة في مراحل مختلفة من القلي العميق، جنبًا إلى جنب مع قياسات درجة الحرارة في القشرة والنواة، مزيدًا من
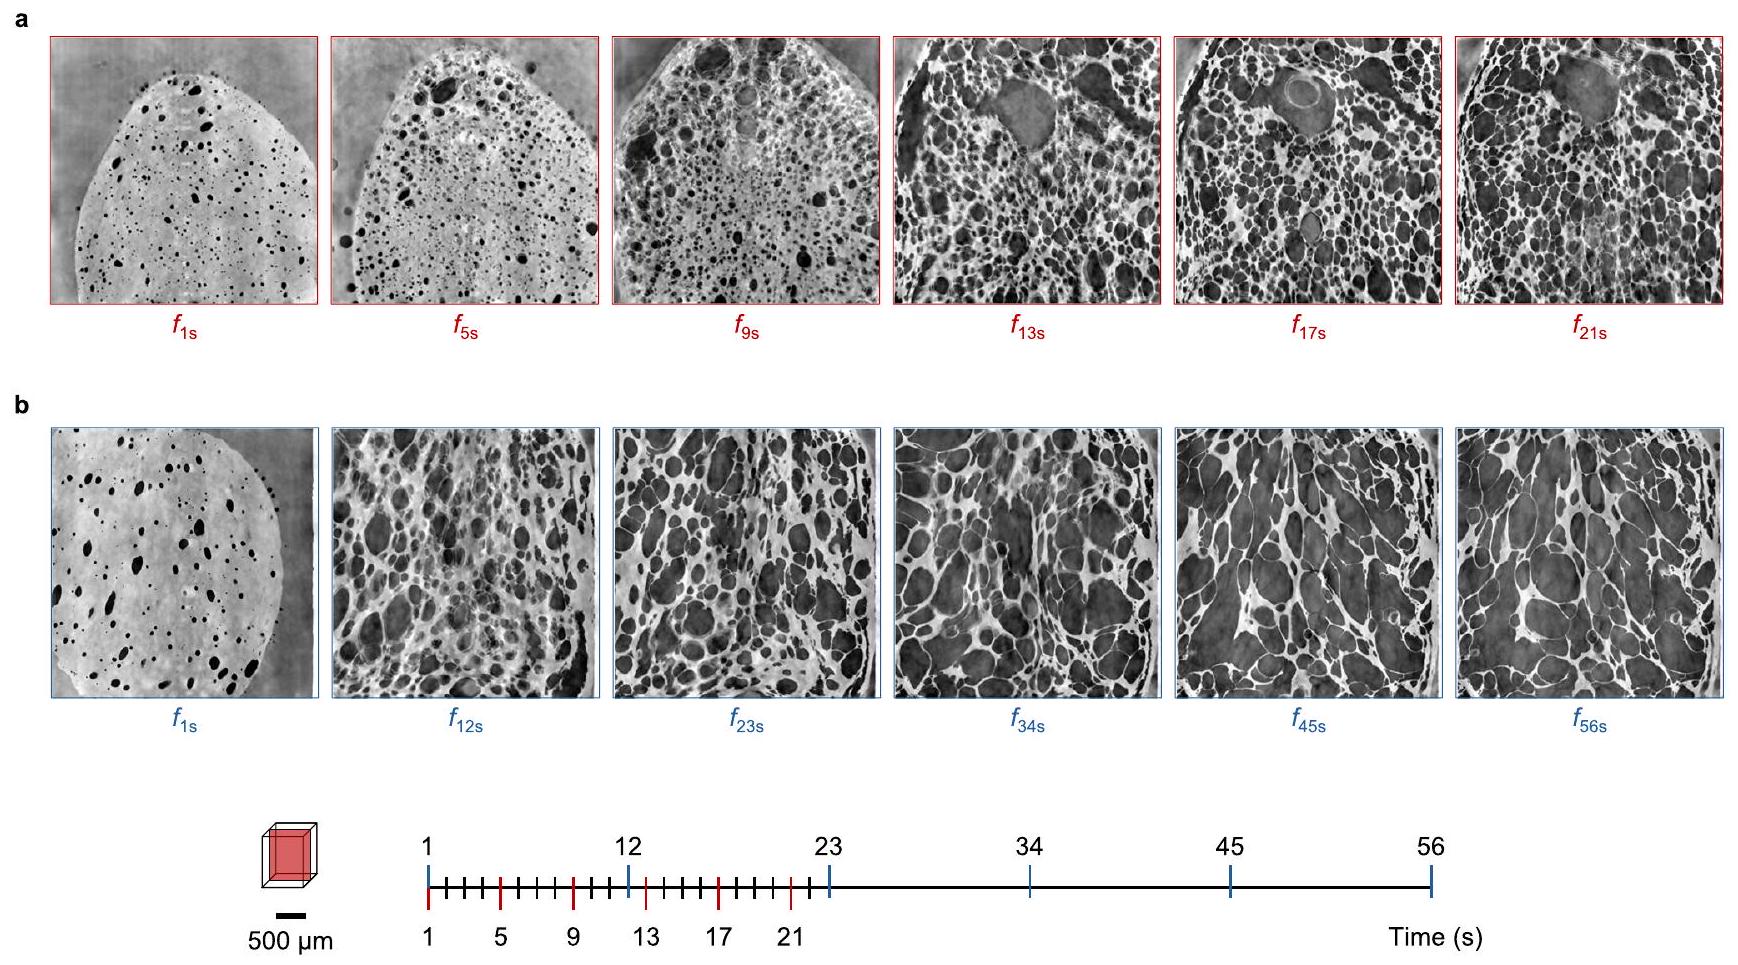
الشكل 3 | مقاطع عرضية عمودية من الصور المعاد بناؤها تبرز تطور الميكروهيكل في عينات WFD خلال القلي العميق في الموقع عند .
تتبع الصور المعاد بناؤها توسع هيكل WFD خلال أول 21 ثانية (ملاحظات كل 4 ثوانٍ) بعد الغمر في الزيت الساخن؛ تتبع الصور المعاد بناؤها
تطور الميكروهيكل لـ WFD خلال 56 ثانية من القلي العميق (ملاحظات كل 11 ثانية). تم الإشارة إلى القضيب المقياس في ; تسميات الوقت تشير إلى الملاحظات خلال فترة القلي العميق، وتدل المؤشرات السفلية على الوقت بالثواني.
رؤى حول الظروف التي تكمن وراء التحولات الهيكلية داخل نظام WFD. من خلال التسخين، ارتفعت درجة الحرارة إلى نقطة الغليان وتبخر الماء. ارتفعت درجات الحرارة في القشرة من وبلغت بنهاية القلي العميق. أدى فقدان الرطوبة المستمر وزيادة درجات الحرارة تحت السطح إلى تشكيل قشرة صلبة بعد الانتقال إلى حالة زجاجية . في النواة، استقرت درجات الحرارة عند مع احتجاز البخار داخل الهيكل، مما يشير إلى أن كمية الرطوبة في هذه المنطقة كانت كافية للبوليمرات الحيوية للبقاء في حالة مطاطية، مما يدعم بذلك التمدد الهيكلي الناتج عن توليد البخار. تكشف بيانات الصورة التي تصور تمدد الهيكل خلال القلي العميق عن الحد الأدنى من تغيير الهيكل في المناطق السطحية المتصلبة بينما تتشوه المناطق المركزية باستمرار (الشكل 3)، مما يشير إلى وجود فرق بين الحالات الفيزيائية لمناطق القشرة والنواة في نهاية 56 ثانية من القلي العميق.
الضغط الناتج عن الغازات الهاربة من توليد البخار المستمر خلال القلي العميق يمنع دخول الزيت إلى الهيكل . بالإضافة إلى ذلك، فإن غياب المسارات المناسبة من القشرة إلى المناطق الأساسية أعاق أيضًا بشكل كبير امتصاص الزيت تحت السطح حتى بعد تشوه هيكلي واسع خلال القلي العميق. كانت المسام الموجودة في المناطق الخارجية للقشرة مفصولة بشكل واضح عن المناطق الأساسية للعينة، كما يتضح من مساحة المسام المسمى في الشكل التكميلي 2. حتى عندما تم اكتشاف الزيت في المسام القريبة من السطح، لم يكن قادرًا على التغلغل أكثر في العينة مما يشير إلى عدم وجود اتصال مع مسام أخرى مجاورة كما يتضح من الضغط خلال التمدد الداخلي (الشكل 2ج). من المحتمل أن يتوافق هذا الدخول للزيت مع ما يسمى بـ ‘زيت الهيكل’ الذي يدخل مصفوفة الطعام خلال القلي العميق .
امتصاص الزيت بعد القلي
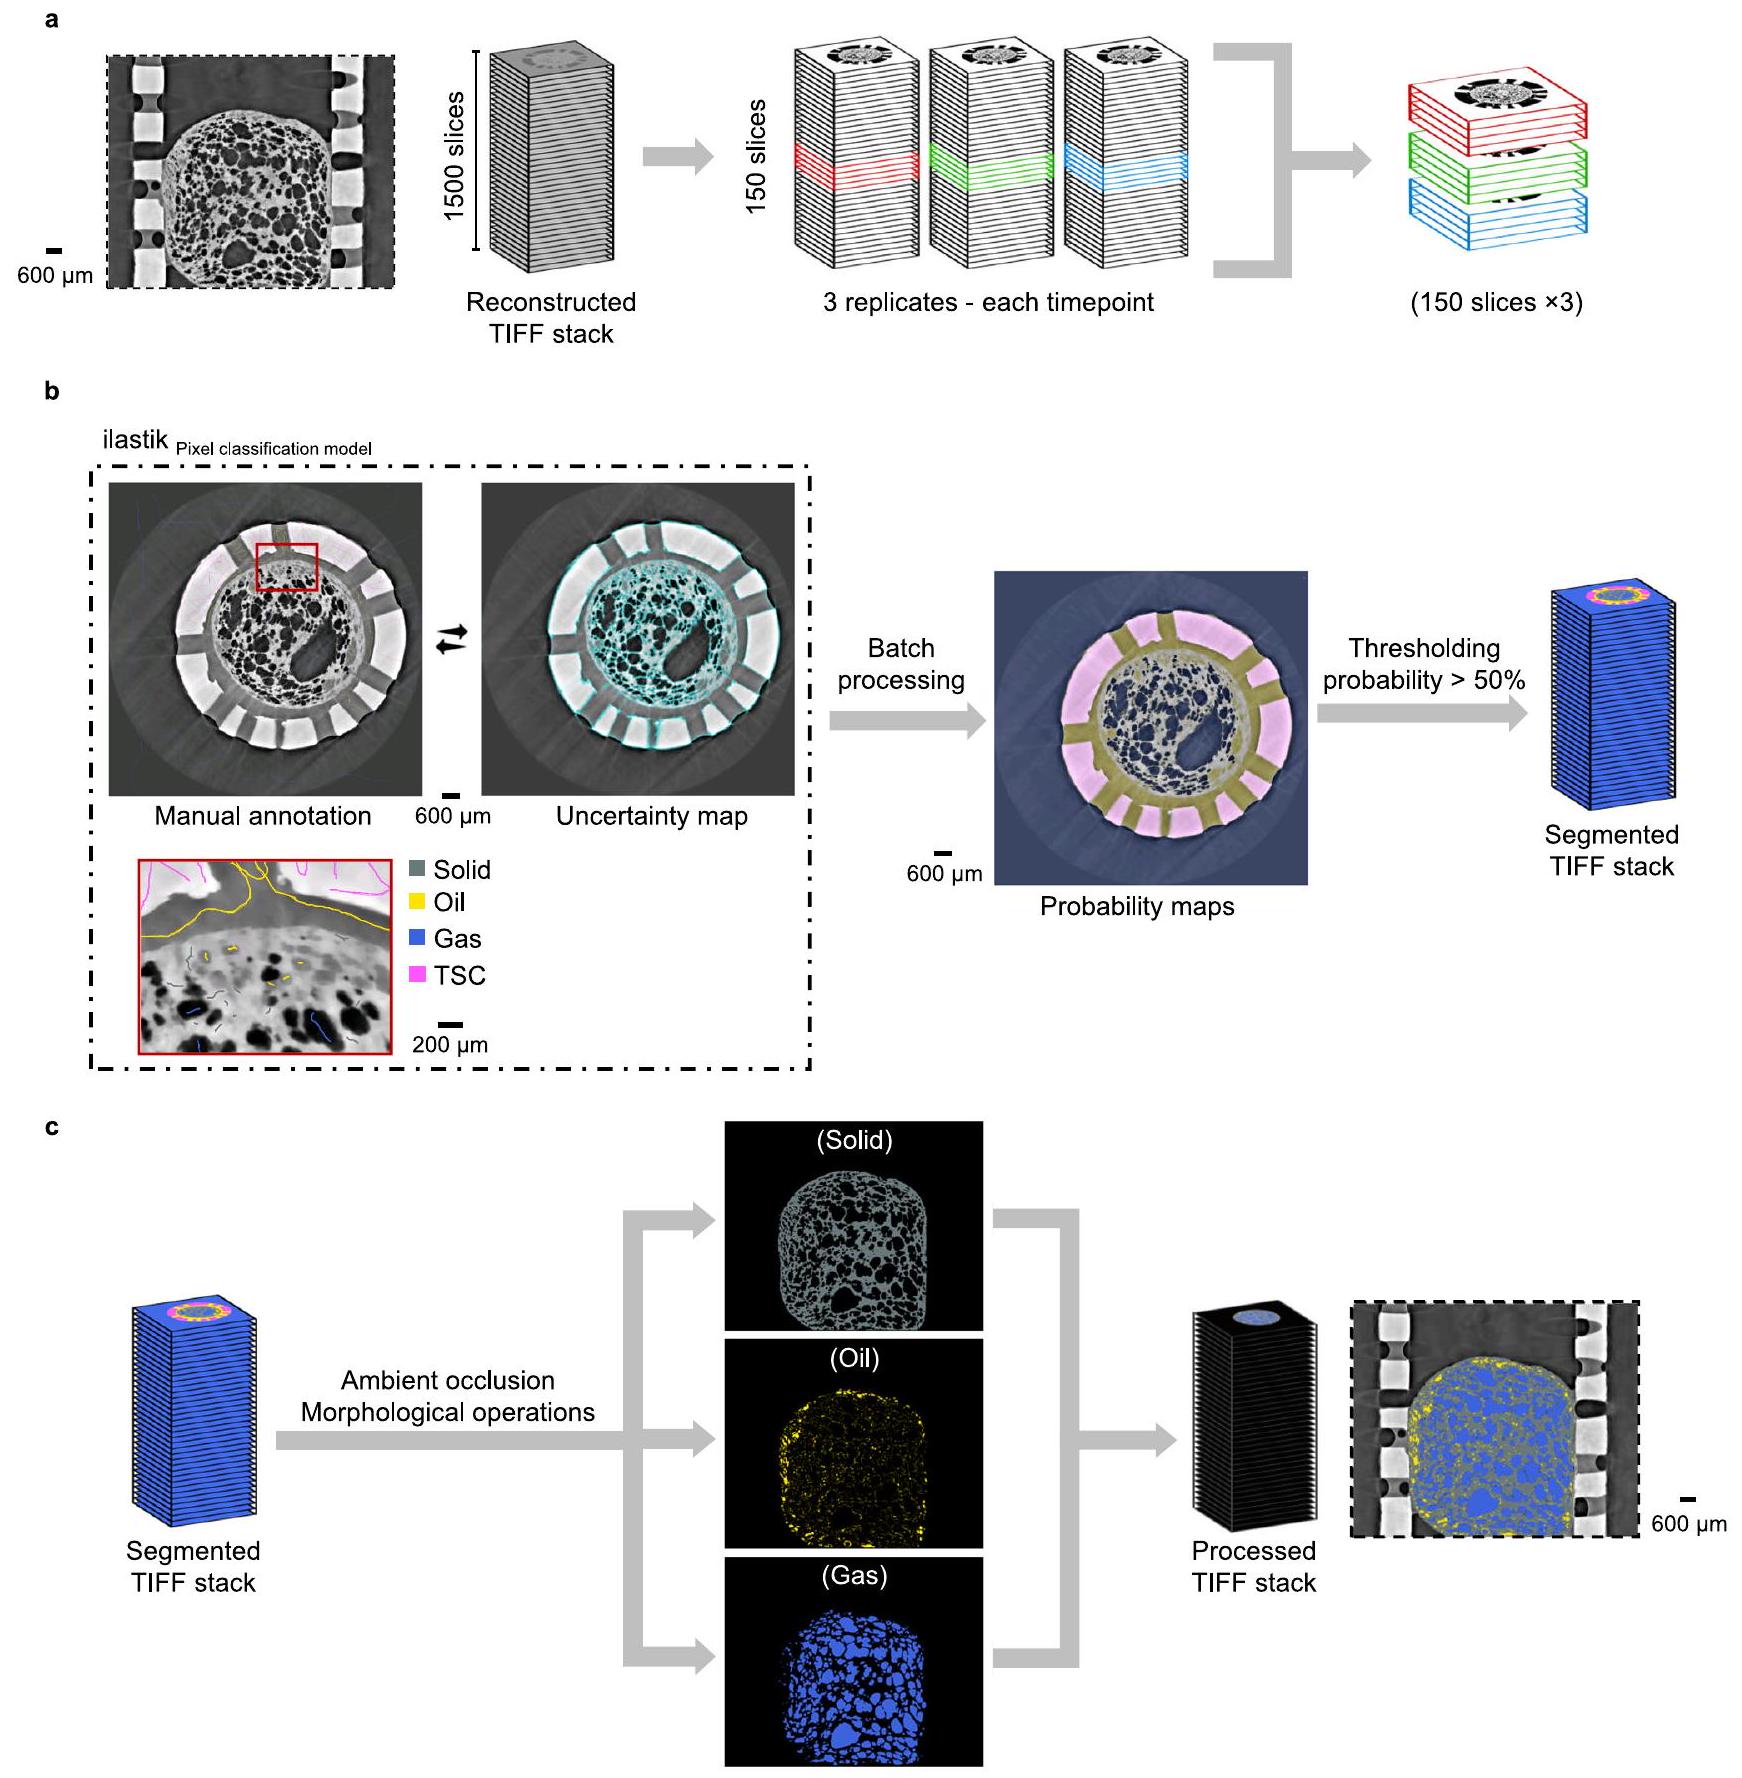
يعتبر التشوه الهيكلي الواسع خلال القلي العميق والخصائص الميكروهيكلية في نهاية العملية أساسًا لفهم الآليات التي يحدث بها امتصاص الزيت خلال مرحلة التبريد مباشرة بعد القلي العميق. هنا، تم تقسيم الصور ثلاثية الأبعاد التي تم التقاطها بعد القلي بمساعدة تصنيف البكسل المدعوم بالتعلم الآلي في Ilastik v1.4.0 (الشكل 5 يظهر سير عمل معالجة الصورة، لمزيد من الوصف انظر “الطرق”). كان الهدف من التقسيم هو قياس كمية وموقع الزيت في الهيكل المسامي وكذلك تحليل الاتصال بين المسام عبر حجم العينة المقلية. أخذ المصنف في الاعتبار عدم اليقين في تعيين التسميات (كما يتضح من خريطة عدم اليقين في الشكل 5) ، والتي اعتبرت نطاق عدم يقين إضافي في الأحجام المقسمة المحسوبة لمراحل مختلفة (انظر “الطرق”). من خلال التقسيم، تم فصل المراحل المختلفة (الزيت، الغاز، والمصفوفة الصلبة) وقياسها (نسب الحجم والمسامية المقدمة في الجدول 1). علاوة على ذلك، توفر التصويرات الحجمية للعينات المقلية عند (الشكل 6أ) تمثيلًا مكانيًا للتغيرات في توزيع الزيت خلال التبريد. تم تقييم الخصائص الشكلية للقشرة (المعتبرة كطبقة تحت السطح بسماكة 0.5 مم) والنواة (المناطق الداخلية المتبقية) باستخدام سمك الهيكل المحلي لجدران خلايا الغاز الصلبة (المقدمة في الشكل التكميلي 6 والجدول التكميلي 1) وتوزيعات حجم المسام (الشكل التكميلي 7أ).
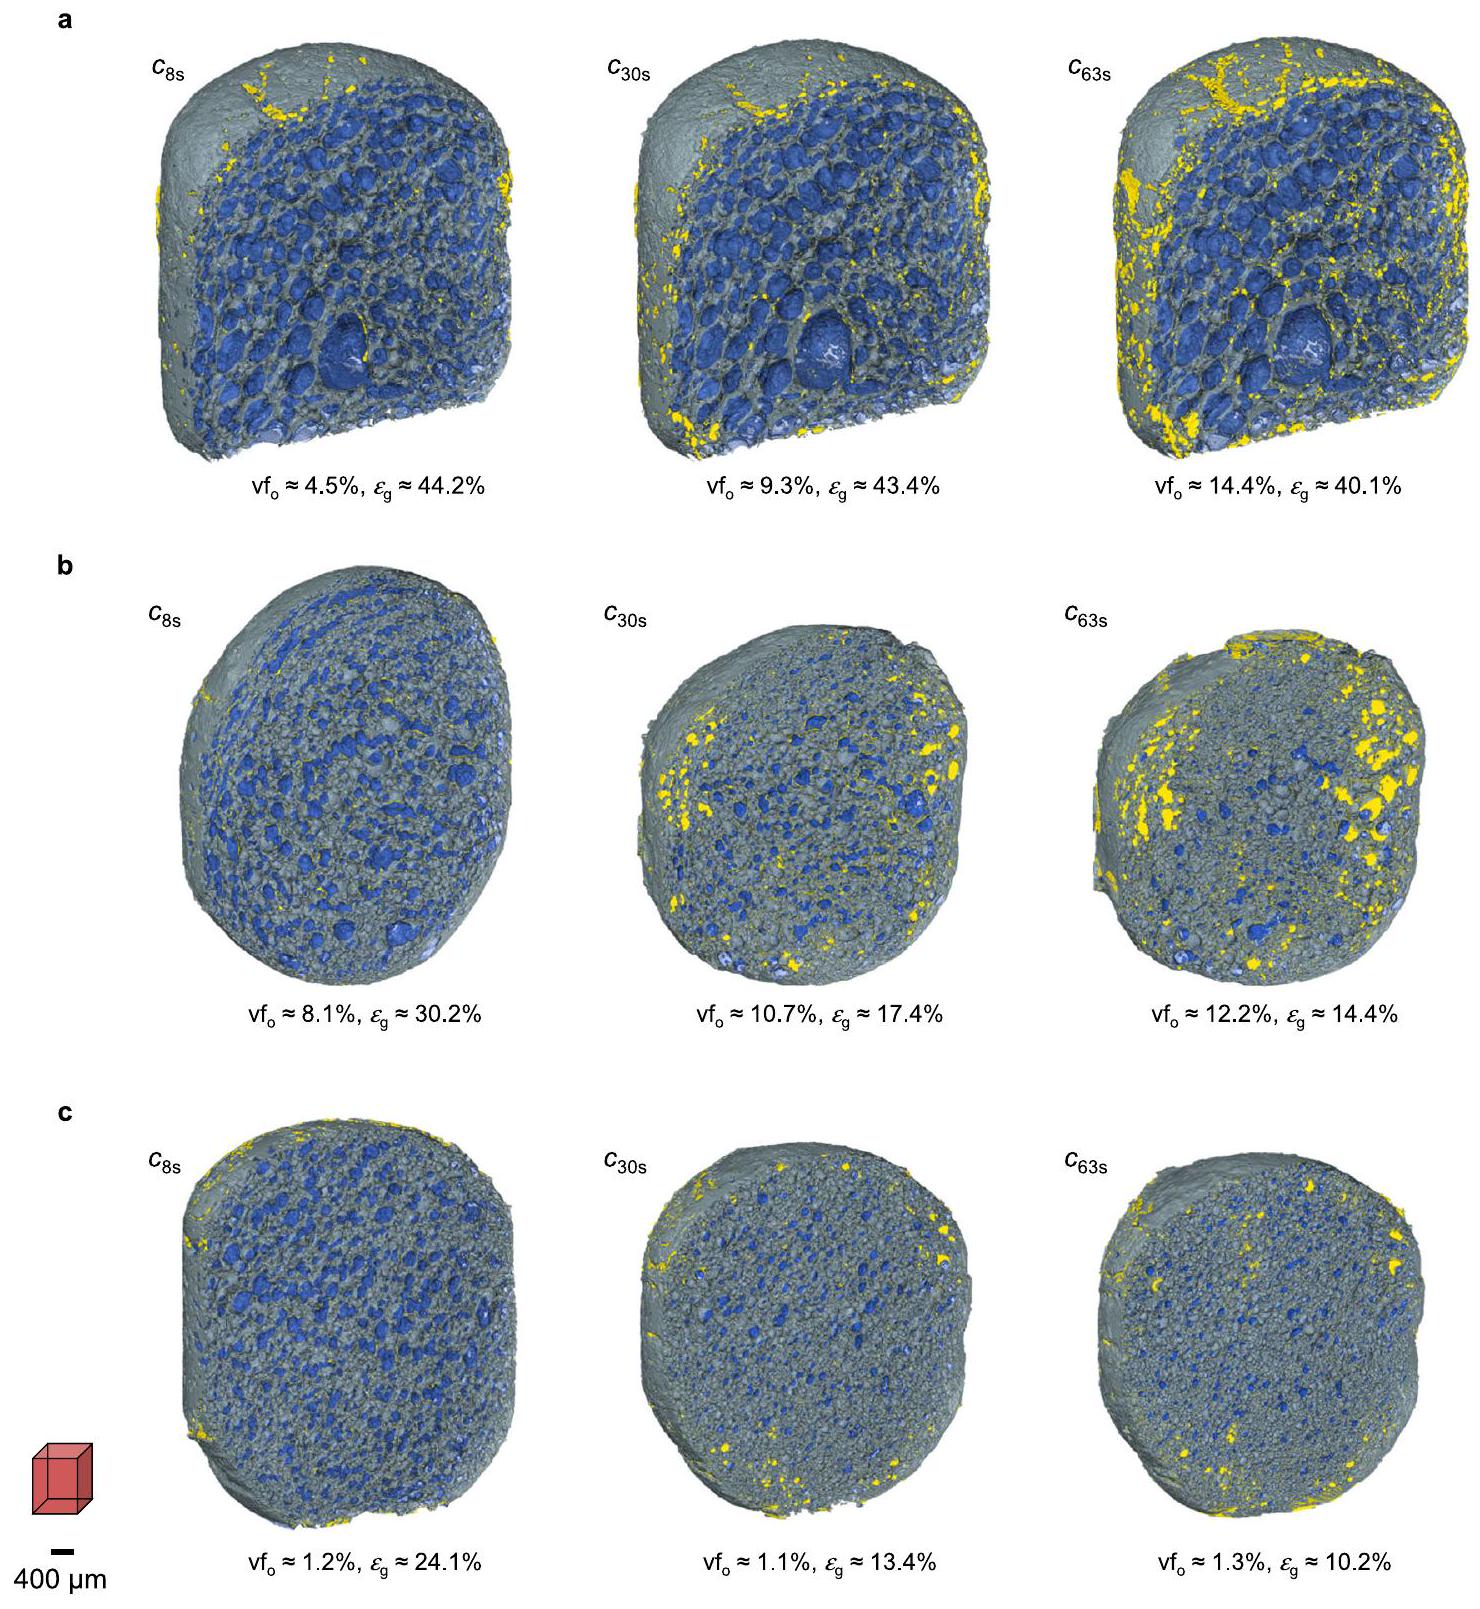
بعد إزالة العينات من زيت القلي، بدأت درجات الحرارة الداخلية في الانخفاض. كان معدل انخفاض درجة الحرارة يختلف بشكل كبير بين القشرة واللب، حيث كانت القشرة تبرد أسرع من اللب (الشكل 4ب). ومن الجدير بالذكر أن درجات حرارة اللب لم تنخفض تحتخلال مرحلة التبريد بعد القلي التي تم تقييمها هنا (أي 63 ثانية)، حيث عزلت القشرة المناطق الداخلية. بعد 8 ثوانٍ من التبريد، أظهر عينة WFD بنية ميكروية رقيقة الجدران وعالية المسامية تشبه البنية في النقطة الزمنية النهائية للقلي العميق. قدمت البنية حوالي.من الحجم المميز كجزء من الزيت وأظهر مسامية غازية تبلغ حوالي 44.2%. كما هو موضح في الشكل 6a، زاد محتوى الزيت خلال فترة التبريد حيث تم سحب الزيت السطحي والزيت المتاح في حامل العينة تدريجياً إلى الهيكل (مرتفعاً إلى حواليبعد 63 ثانية، انظر الشكل التكميلي 3). لم يُلاحظ أي تشوه ملحوظ في الهيكل طوال
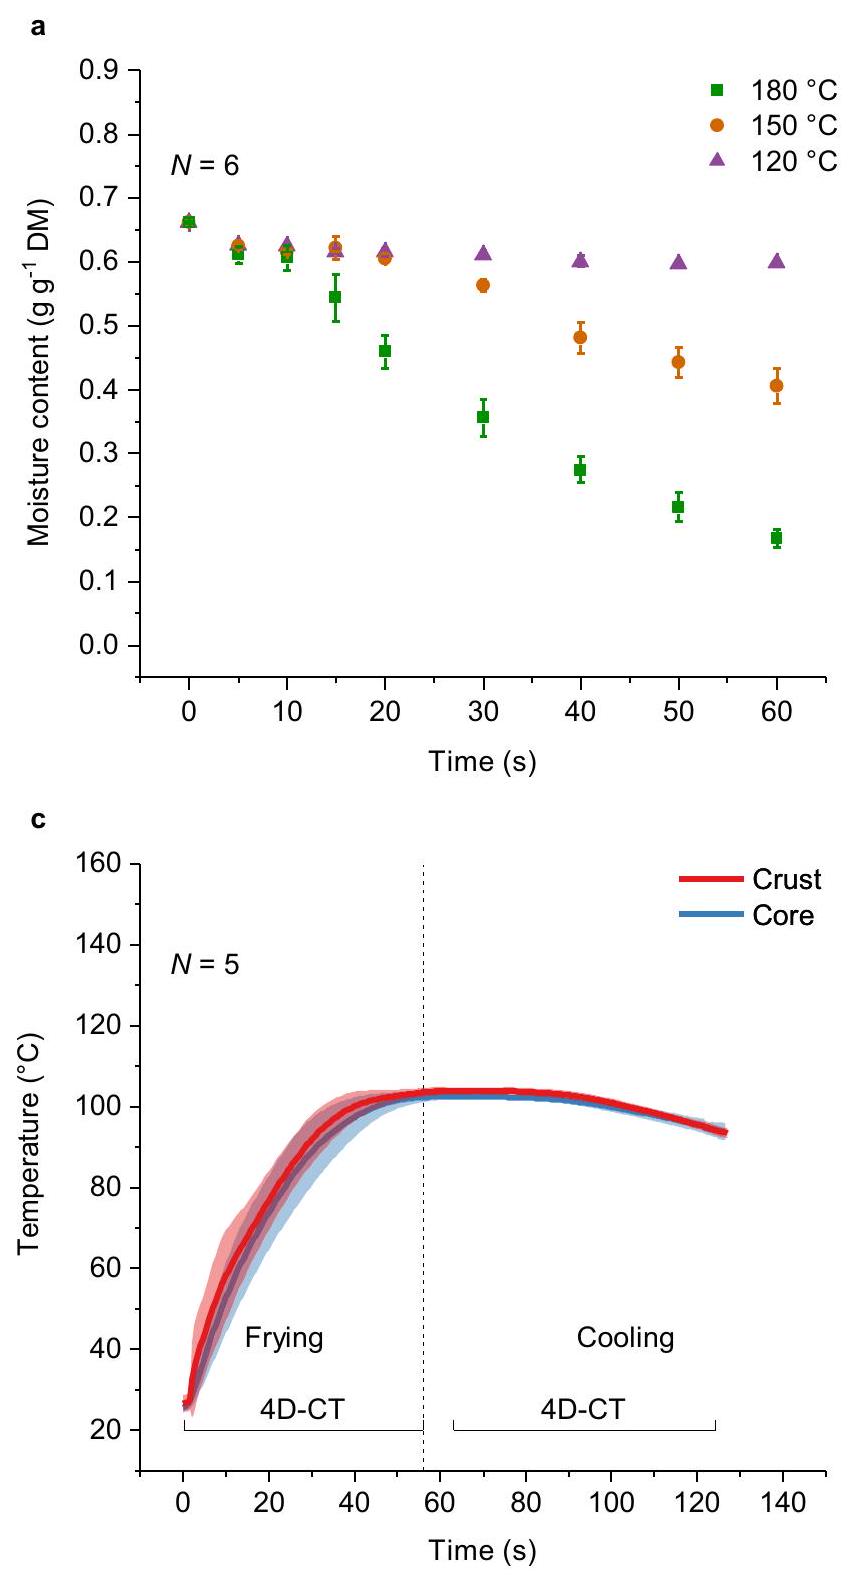
الشكل 4 | قياسات محتوى الرطوبة ودرجة الحرارة لعينات WFD. محتوى الرطوبة للمنتجات غير المقلية (0 ثانية) والمقلية عميقًا (عينات WFD بمستويات ترطيب أولية منمقلي في زيت عميق عند درجات حرارة مختلفةباللون الأخضر،باللون البرتقالي وباللون الأرجواني). يتم حساب MC على أساس المادة الجافة الخالية من الزيت، حيث الكتلة ( ) يتم التعبير عنها بالجرامات و DM هو المادة الجافة للعجين بالجرامات. يتم حساب المتوسطات على ست قياسات، وتمثل أشرطة الخطأ الانحرافات المعيارية؛ قياسات درجة الحرارة المحلية داخل
عينات WFD أثناء القلي العميق والتبريد بعد القلي عند درجات حرارة زيت مختلفة (ب-180، و تتوافق قياسات درجة الحرارة مع مراحل القلي العميق ومرحلة التبريد بعد القلي، مفصولة بخط عمودي منقط، ومتوافقة مع فترات 4D.الملاحظات. كل رسم يوضح متوسط ملفات درجات الحرارة في مناطق القشرة والنواة داخل العينات، والمناطق المظللة تمثل الانحراف المعياري عبر خمس أو سبع قياسات. فترة التبريد (مسامية الغاز في الجدول 1)، مما يؤكد أن المصفوفة الصلبة التي تشكلت أثناء القلي العميق كانت صلبة بما يكفي لمقاومة أي انهيار هيكلي كبير. وقد تم الإبلاغ عن أنه مع انخفاض درجات الحرارة، يتوقف طرد الغاز من السطح بسبب الضغوط السلبية الناتجة عن بخار التكثف.، مما يسحب النفط بعد ذلك إلى المسام المفتوحة على السطح. ومع ذلك، في عينات WFD، ظلت درجات الحرارة فوقفي كل من القشرة والمناطق الأساسية في نهاية 63 ثانية أثناء التبريد. على الرغم من أنه لا يمكن استبعاد امتصاص الزيت المرتبط بتأثير الفراغ الناتج عن تكثف الأبخرة تمامًا، إلا أنه من المرجح أن يكون امتصاص الزيت الملحوظ مدفوعًا بشكل أساسي بفعل الشعيرات الدموية في المسام الصغيرة للقشرة، حيث لم يكن من الممكن أن تنخفض ضغوط البخار داخل هذه المسام تحت الضغط الجوي. في رقائق التورتيلا، وُجد أن محتوى الزيت يتأثر أيضًا بشكل أساسي بالمسام الصغيرة التي تمارس تأثيرًا شعريًا كبيرًا. قبل حدوث التكثفالقشرة التي تتكون في الغالب من مسام صغيرة متصلة (توزيع حجم المسام موضح في الشكل التكميلية 7a) كانت مشبعة بالزيت..
ترابط المسام
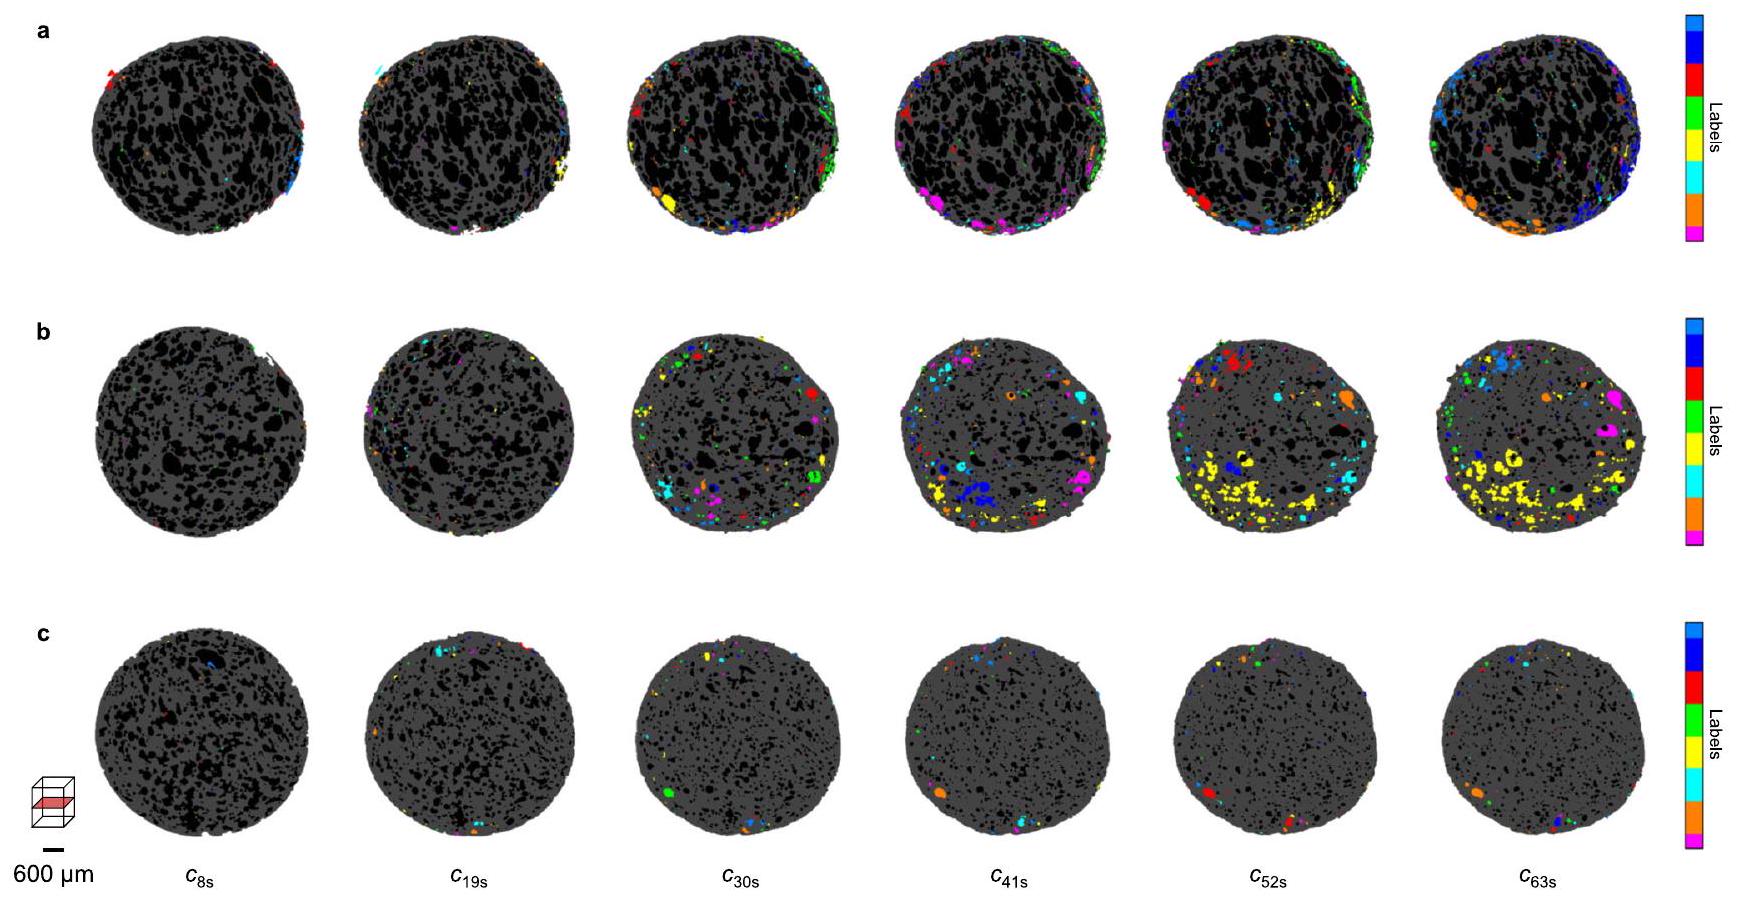
تظهر الرسوم البيانية ثلاثية الأبعاد أثناء التبريد أن معظم الزيت مركّز في المسام تحت السطح، مع كميات صغيرة من الزيت تم اكتشافها في النواة التي كانت لديها درجة عالية من عدم اليقين في التنبؤ أثناء التقسيم (الشكل 6أ). قدمت تسمية الصور المقسمة وسيلة للإشارة إلى ترابط أحجام المسام وكشفت أن ملء المسام تقدم تدريجياً من خلال شبكات فرعية منفصلة من المسام المتصلة (الشكل 7أ). أكدت هذه النتائج أيضاً أن امتصاص الزيت كان محدوداً بشكل رئيسي إلى منطقة القشرة الخارجية من العينة (انظر الشكل التكميلي 3). أثناء القلي العميق، كانت مساحة المسام
الشكل 5 | سير عمل معالجة الصور لمجموعة بيانات الأشعة السينية بعد القلي. أتم استيراد الصور المقطعية ذات التدرج الرمادي من الأحجام المعاد بناؤها لكل نسخة إلى برنامج ilastik باستخدام ملحق ilastik4ij (https://github. com/ilastik/ilastik4ij) في فيجي. ب تم تدريب نموذج تصنيف البكسل بشكل تكراري لخطوات زمنية مختلفة من خلال التوصيف اليدوي للمراحل المختلفة: WFD الصلب المقلي (رمادي)، الزيت (أصفر)، الغاز (أزرق)، وTSC (وردي)، مع تقليل عدم اليقين في تم إنشاء خرائط الاحتمالات للطور من أجل الأحجام الكاملة ثم تم تقسيمها باستخدام عتبة الاحتمالية.للحصول على مجموعة الصور المقطعية. تم تطبيق الإغلاق البيئي وعمليات شكلية أخرى على الصور المقطعة لعزل حدود العينة وفصل المراحل الفردية من أجل التكميم. تم الإشارة إلى شريط القياس في. توسعت باستمرار في المنطقة الأساسية وضغطت المسام في المناطق الخارجية من الهيكل، مما أدى إلى زيادة تكرار المسام الصغيرة في القشرة (انظر الشكل التوضيحي 7a). إن الحد الأدنى من الاتصال بين المسام في القشرة والنواة بسبب شبكة الجدران السليمة منع كميات كبيرة من النفط من التغلغل أعمق في الهيكل، حيث تم تحديد معظم النفط في مسام صغيرة مضغوطة بالقرب من السطح. ربما تكون النتيجة الأكثر أهمية التي لها دلالة على امتصاص النفط هي أن الاتصال بشبكة المسام تحت القشرة قد تغير بسبب الاستمرار في التوسع الداخلي أثناء القلي العميق (كما هو موضح في الشكل التوضيحي 2).
البنية المجهرية وامتصاص الزيت المتأثر بدرجة حرارة الزيت
تظهر الشكل 8 تطور البنية المجهرية للعينات أثناء القلي العميق في (الشكل 8أ) و (الشكل 8ب). مشابه لما تم إظهاره عند القلي العميق في تم بدء توسيع الهيكل من خلايا الغاز الموجودة مسبقًا في العجين غير المقلي. ومع ذلك، زادت أحجام خلايا الغاز بمعدل أبطأ بشكل ملحوظ في هذه العينات.
الجدول 1 | محتوى الزيت والمسامية لعجينة دقيق القمح المقلية (WFD) التركيبة معمحتوى الرطوبة الذي تم تقييمه خلال فترة التبريد بعد القلي
درجة حرارة الزيت
وقت التبريد (ثانية)
نسبة حجم الزيت (% زيت/حجم العينة)
نسبة حجم الزيت (% زيت/صلب)
مسامية الغاز (%)
المسامية الكلية (%)
٨
٤.٤٧ (٢.٧٢)
7.90 (4.67)
٤٤٫٢٠ (١٫٩٠)
٤٨.٦٧ (١.٧٧)
19
4.32 (1.65)
7.76 (2.79)
٤٥.٠١ (٢.١٨)
٤٩.٣٣ (٠.٧٩)
30
9.28 (0.75)
16.39 (1.05)
٤٣.٤٣ (١.٥٥)
52.71 (1.11)
41
14.97 (0.40)
42.87 (1.12)
51.42 (1.18)
52
12.33 (0.40)
22.30 (0.78)
44.68 (1.23)
57.02 (1.21)
63
14.42 (1.34)
٢٤.٠٤ (١.٧٦)
40.09 (1.25)
54.51 (0.17)
٨
8.12 (1.13)
11.66 (1.82)
30.16 (1.22)
٣٨.٢٨ (٢.٣٥)
19
10.66 (0.79)
14.70 (1.72)
27.09 (3.15)
٣٧.٧٥ (٣.٩٤)
30
10.73 (1.12)
13.06 (1.87)
17.40 (3.37)
28.12 (4.43)
41
11.88 (1.02)
13.87 (0.30)
14.42 (5.94)
٢٦.٣٠ (٤.٩٥)
52
12.22 (0.43)
14.24 (0.63)
13.97 (5.39)
٢٦.٢٠ (٥.٠٩)
63
12.20 (0.90)
14.29 (1.31)
14.36 (4.60)
٢٦.٥٦ (٤.٧٥)
٨
1.15 (0.34)
1.53 (0.51)
٢٤.١٣ (٣.٧١)
25.28 (3.93)
19
1.08 (0.34)
1.30 (0.41)
17.29 (2.36)
18.36 (2.37)
30
13.35 (1.74)
14.44 (1.51)
41
1.32 (0.62)
11.39 (1.65)
12.58 (1.21)
52
1.43 (0.70)
10.68 (1.48)
11.96 (0.96)
63
1.28 (0.71)
1.41 (0.76)
10.21 (1.48)
11.49 (0.84)
تمثل القيم المتوسط ( ) مع الانحراف المعياري المقدم بين قوسين. القيم في نفس العمود تختلف بشكل كبير ( عندما لا يتم مشاركة نفس الحرف الأبجدي الصغير. مقارنة بتلك المقلية عميقًا في (انظر الشكل التوضيحي التكميلي 4). يُعزى هذا التمدد المتأخر إلى تكوين البخار بشكل أبطأ عند درجات حرارة القلي العميق المنخفضة، حيث تقدم توصيل الحرارة داخل هذه العينات بمعدل أبطأ. استمر التخفيف الداخلي للمصفوفة الصلبة نتيجة التمدد المستمر في المناطق المركزية. لم تتجاوز درجات الحرارة داخل العينات (الشكل 4د) و (الشكل 4ج) عند القلي العميق في و ، على التوالي. التوزيع الأكثر تجانسًا في درجة الحرارة الذي لوحظ في هذه العينات، مقارنةً بتلك المقلية عميقًا فينتج عن آليات نقل الحرارة والكتلة المترابطة في الهيكل المتشوه. حدث تسخين أبطأ بسبب انخفاض معاملات نقل الحرارة بالحمل عند السطح، مما أدى إلى انخفاض ضغوط البخار، وتقليل فقدان الماء السطحي، وعدم اكتمال تبخر الماء السائل.. وبالتالي، لم ترتفع درجات الحرارة فوق نقطة الغليان أثناء القلي العميق، مما سمح بتوزيع أكثر انتظامًا لدرجات الحرارة داخل العينة. على النقيض من ذلك، القلي العميق عندنتجت عن ذلك تدرجات حرارية كبيرة بين القشرة والنواة، مدفوعة بتدفق حراري أعلى، وزيادة في ضغوط البخار، وتبخر سريع على السطح..
مقارنة الهياكل المجهرية لعينات WFD المقلية عميقًا (56 ثانية) عند و ، تلك المقلية فيقدمت مورفولوجيا مسام أكثر تجانسًا دون قشرة مميزة (انظر الشكل التكميلي 4a). مع ارتفاع درجات الحرارة الداخلية للعينات المقلية في الزيتلم تصل إلى نقطة غليان الماء، لم تظهر البنية علامات تشوه واسع النطاق بما في ذلك تمزق الجدران الرقيقة (الشكل التكميلي 4a). كانت نسبة الرطوبة المتبقية أعلى بعد القلي العميق (النهائيتشير الشكل 4أ) إلى أن معظم المناطق الداخلية لا تزال موجودة في حالة مطاطية، مما يمنع أي تمزق واضح للهياكل ذات الجدران الرقيقة في النواة. حدث فقدان الرطوبة على السطح من خلال ضغوط بخار توازن منخفضة ومعاملات نقل حرارة موصل منخفضة.تشير الفروق الصغيرة في درجة الحرارة بين السطح ومناطق القلب إلى تدرجات بخار الماء الضئيلة، مما يوحي بأن هجرة الرطوبة الداخلية كانت بطيئة ومدفوعة بالانتشار.. من ناحية أخرى، فإن البنية المجهرية في عينات WFD المقلية عميقًا لمدة 56 ثانية عند كشف عن هيكل يحتوي على مسام أكبر وغير منتظمة تشكلت نتيجة تمزق الجدران الرقيقة للمصفوفة الصلبة واندماج خلايا الغاز بشكل أكثر تطوراً (انظر
الشكل التكميلي 4ب). لوحظت قشرة سميكة مميزة في الشكل 8ب مع مسام صغيرة ومسطحة تشبه البنية المجهرية للقشرة لـ WFD المقلية عميقًا عند (الشكل 2ب). كانت تدفق الحرارة أسرع من لكن أبطأ من عندزيادة درجات حرارة السطح بشكل أبطأ أثناء القلي العميق عندقلل من فقدان الرطوبة الكلي من القشرة مقارنةً بالقلي العميق عند. وقد أدى ذلك إلى زيادة محتوى الماء السائل المتبقي طوال العملية (النهائيDM الشكل 4أ)، كما يتضح من الهضبة الحرارية حول نقطة غليان الماء في كل من القشرة والنواة (الشكل 4ج).
لم يتم ملاحظة أي دخول كبير للزيت أثناء القلي العميق في العينات المقلية في درجات حرارة منخفضة (انظر الشكل التوضيحي 4). أثرت درجة حرارة الزيت بشكل كبير على ديناميات فقدان الرطوبة في عينات القلي العميق بسبب الاختلافات في معدل توصيل الحرارة (الشكل 4). لوحظ توسع تدريجي في الهيكل الداخلي عند درجات حرارة تقترب من نقطة غليان الماء، نتيجة لتوليد البخار البطيء. تم ملاحظة ميزات ميكروهيكلية مشابهة بين العينات المقلية فيبعد 12 ثانية (الشكل 3ب)،بعد 23 ثانية (الشكل التوضيحي 4ب) وبعد 34 ثانية (الشكل التوضيحي 4a) مع قياس محتوى الرطوبة عندDM في جميع العينات (الشكل 4أ). عند درجات حرارة حوالي، تم تحفيز تشوهات هيكلية أكثر عنفًا مثل تكوين مسام كبيرة وتمزق الجدران الرقيقة بسبب التبخر المستمر وزيادة ضغط البخار داخل الهيكل. كان ذلك واضحًا من الصور المعاد بناؤها للعينات المقلية عميقًا فيبعد 23 ثانية (الشكل 3ب) وعندبعد 45 ثانية (الشكل التكميلي 4ب)، والتي تتوافق مع قيم محتوى رطوبة مماثلة لـلـ و لـ (الشكل 4أ). معدل فقدان الرطوبة الأبطأ في العينات المقلية عميقًا في ، مقارنةً مع أولئك في يمكن أن يُعزى ذلك إلى انخفاض معاملات نقل الحرارة الحملية وانخفاض ضغوط البخار التوازني..
بعد إزالتها من الزيت الساخن (أي، 8 ثوانٍ من التبريد)، تم قلي عينات WFD في و احتفظت بهياكلها الدقيقة المسامية (الشكل 6)، مما جعلها تشبه الهياكل التي لوحظت في النقطة الزمنية النهائية للقلي العميق (الشكل 8). ومع ذلك، انهارت هذه العينات تدريجياً خلال فترة التبريد، حيث انكمشت إلى أقل من نصف مساميتها الغازية الأولية (الجدول 1) بينما كانت النواة الداخلية
الشكل 6 | تمثيلات ثلاثية الأبعاد لحجم عينات WFD خلال فترة التبريد بعد القلي. الصفوف تتوافق مع عينات WFD المقلية في درجات حرارة مختلفة (أ و ). تم ملاحظة الزيت وهو يغزو المسام الصغيرة في منطقة القشرة المميزة للعينة. ترتبط بقع الزيت الداخلية المجزأة بمستويات عالية من عدم اليقين؛ ب تم قلي العينات عند . هنا، كان انهيار الهيكل مصحوبًا بزيادة محتوى النفط مع انخفاض مسامية الغاز؛ ج. تم قلي العينات في . انهار الهيكل خلال الفترة الملاحظة، لكن محتوى النفط ظل ثابتًا نسبيًا مع انخفاض مسامية الغاز. تم الإشارة إلى مقياس الرسم في م؛ مراحل مقسمة تظهر كمواد صلبة مقلية عميقًا (رمادي)، زيت (أصفر)، وغاز (أزرق)؛ تسميات الوقتتشير الملاحظات إلى فترة التبريد بعد الانسحاب من الزيت، وتدل الأرقام السفلية على الوقت بالثواني بعد الانسحاب من الزيت؛ يدل على نسبة حجم الزيت؛ يشير إلى مسامية الغاز. انهار (انظر الشكل التوضيحي 5 والجدول التوضيحي 1). من المحتمل أن يكون هذا الظاهرة مرتبطة بالحالة المطاطية المستدامة للبوليمرات الحيوية بسبب الرطوبة المتبقية الأعلى (النهائيدي إم الشكل 4أ) الناتج عن تراكم البخار داخل المناطق الأساسية للهياكل أثناء القلي العميق. كانت المناطق الأساسية التي تفتقر إلى الصلابة الكافية غير قادرة على الحفاظ على الشكل المتوسع حيث أن تكثف البخار يؤدي إلى ضغوط بخارية سلبية بسبب انخفاض درجات الحرارة أثناء التبريد..
تحليل الشكل في مناطق القشرة واللب المنفصلة مقارنة بعينات WFD المقلية عميقًا في يكشف عن اختلافات كبيرة ( ) في سلوك انهيار الهيكل لعينات WFD المقلية عميقًا في و (الجدول التكميلي 1). تكرار المسام الأصغر ( زاد بشكل كبير بعد الانهيار في كل من القشرة والمناطق الأساسية (الشكل التوضيحي 7ب، ج). في عينات مقلية عميقًا عند“، كانت توزيعات سمك جدار الخلية المحلي في مناطق ‘القشرة’ و ‘النواة’ غير قابلة للتمييز تقريبًا (الشكل التوضيحي 6). كان متوسط سمك الهيكل في مناطق ‘القشرة’ التي تم تقييمها مختلفًا بشكل كبير ( ) مقارنة بمناطق القشرة من العينات المقلية عميقًا في و (الجدول التكميلي 1)، مما يدعم الملاحظة بأنه لم يتشكل قشرة مميزة في هذه العينات أثناء القلي العميق. على النقيض، في العينات المقلية عميقاً في لم يكن سمك الهيكل المتوسط للقشرة عند 8 ثوانٍ مختلفًا بشكل كبير ) من القشرة في عينات مقلية عميقًا في عند 8 ثوانٍ (الجدول التكميلي 1)، مما يؤكد وجود قشرة صلبة. علاوة على ذلك، خلال الانهيار، كانت التحولات في توزيع سمك الهيكل المحلي نحو جدران المسام الأكثر سمكًا أبطأ بشكل ملحوظ في القشرة مقارنةً بالنواة، مما يشير إلى أن أجزاء من القشرة كانت أكثر صلابة من مناطق النواة.
الشكل 7 | صور مقاطع عرضية أفقية للزيت المقسم والموسوم من الأشعة السينية في الموقع خلال فترة التبريد بعد القلي. الصفوف تت correspond إلى عينات WFD (الموضحة باللون الرمادي) المقلية في درجات حرارة مختلفة., ب و تم تصنيف المسام المجزأة باستخدام خريطة ألوان فئوية متكررة حيث يمثل نفس لون التسمية للأجسام المجاورة
يصور مرحلة زيت متصلة. يوفر التقدم مع مرور الوقت نظرة عامة على دخول الزيت إلى المناطق الداخلية من العينة من خلال المسام المتصلة. تم الإشارة إلى مقياس الرسم في; تسميات الوقت تشير الملاحظات إلى فترة التبريد بعد الانسحاب من الزيت، وتدل الأرقام السفلية على الوقت بالثواني.
مماثل للعينات المقلية فيحدثت معظم امتصاص الزيت في العينات المقلية في درجات حرارة منخفضة أثناء التبريد. تغيير الضغوط الشعرية في مسام القشرة وتكثف البخار من درجات الحرارة التي تنخفض تحتداخل العينة أثناء التبريد من المتوقع أن يكون لهما دور في امتصاص الزيت. العينات المقلية عميقًا فيexperienced significantly lower”
“عانى من انخفاض كبيرامتصاص الزيت عبر جميع العينات بسبب محدودية الترابط بين المسام على السطح نتيجة لعدم وجود تشكيل قشرة مميزة أثناء القلي العميق (الشكل 7c). أدى الانهيار الهيكلي الواسع إلى انكماش المسام داخل العينة وأعاق بشكل جماعي دخول الزيت أثناء التبريد (الجدول 1 والشكل التوضيحي 7). بالمقابل، العينات المقلية عميقاً فيأظهرت اختراق النفط في المسام الموجودة تحت القشرة أثناء التبريد (الشكل 7ب). مع انهيار الهيكل، تم تعطيل الاتصال بين المسام في القشرة والنواة. أدى وجود قشرة صلبة إلى تشكيل مسام متصلة بالسطح تمتد أعمق في العينة، مما سمح بدخول كميات أكبر من النفط تحت القشرة (الشكل 6ب).
نقاش
على الرغم من تزايد الوعي الصحي بين المستهلكين، تظل الأطعمة المقلية عميقًا شائعة في سوق الوجبات الخفيفة العالمي. إن كثافتها الحرارية العالية، الناتجة عن امتصاص الزيت خلال عملية القلي العميق، لها آثار كبيرة على كل من المستهلكين الذين يفضلون المنتجات منخفضة الدهون واستراتيجيات التركيب داخل صناعة المواد الغذائية. تتطلب الابتكارات في تقنيات القلي الأكثر صحة وتركيبة منتجات مقلية جديدة بمحتوى دهون مخفض معرفة أساسية بآليات ديناميات امتصاص الزيت. ومع ذلك، كانت الآليات التي تؤدي إلى امتصاص الزيت الناتج عن القلي العميق صعبة التحقق (ناهيك عن تصورها) بسبب الطبيعة المعقدة والعنيفة للعملية..
أظهرنا أن التصوير المقطعي بالأشعة السينية عالي السرعة والزمني يمكن أن يكون تقنية مفيدة للتصور الديناميكي في الموقع لعملية القلي العميق وقدّمنا دراسة شاملة تستكشف التغيرات المكانية (في ثلاثة أبعاد) والزمنية في
الميكروهيكل أثناء وبعد القلي العميق وتأثيره على ديناميات امتصاص الزيت. تم استخدام تأثير درجات حرارة القلي المختلفة لدراسة الفروق في تشوه الهيكل، وامتصاص الزيت، وتطور مناطق القشرة والنواة في نظام عجينة دقيق القمح (WFD).
تتناول الدراسة الحالية قيود طرق التصوير المستخدمة سابقًا في هذا المجال البحثي (مثل CLSM، SEM) التي تفتقر إلى الدقة المكانية والزمنية المدمجة اللازمة لالتقاط هذه العملية الديناميكية للغاية. باستخدام إعداد تجريبي مخصص ومضغوط مع تحكم في درجة الحرارة قابل للتعديل وتشغيل عن بُعد في بيئة السنكروترون، أزلنا الحاجة إلى معالجة العينة أثناء وبعد القلي العميق. بالإضافة إلى ذلك، مكّنت الدقة المكانية والزمنية المحسّنة من الحصول السريع بمعدل 1 مقطع تصويري في الثانية، مما سمح لنا بحل الميزات الحرجة للميكروهيكل الداخلي المتطور والتقاط أحداث لم تكن قابلة للرؤية سابقًا، مثل تأثير ترابط المسام على امتصاص الزيت. تسهل هذه التقنية تعديلات نسبية سهلة على بروتوكول الاستحواذ من حيث ظروف القلي (المدة، درجة الحرارة)، والدقة المكانية والزمنية، مما يسمح بالتحقيق في ظواهر محددة تتعلق بعملية القلي العميق.
على الرغم من المزايا الواضحة التي تقدمها التقنية المعروضة، لا تزال هناك بعض القيود. أولاً، لم يتم حل المرحلة المائية في الصور وتم دمجها مع المصفوفة الصلبة بسبب التفاعلات المعقدة بين مكونات العينة، مما جعل من الصعب التحقق من آليات فقدان الرطوبة المعروفة.. ومع ذلك، فإن التحسينات المستمرة في الأجهزة المتطورة في مصادر النيوترونات تثير اهتمامًا في الاستخدام المشترك للتصوير بالنيوترونات السريعة وتصوير الأشعة السينية.. إن الحساسية الأعلى للنيوترونات لذرات الهيدروجين تحمل إمكانات كبيرة لتصوير نقل الرطوبة في الوسائط المتغيرة، مثل أثناء القلي العميق..
ثانيًا، أعاقت عيوب الحركة تقسيم المرحلة للصور الملتقطة أثناء القلي العميق. لا يزال تحقيق توازن بين الدقة المكانية والزمنية، جنبًا إلى جنب مع متطلبات معالجة البيانات، يمثل تحديًا رئيسيًا. ومع ذلك، فإن الابتكارات في التصوير بالأشعة السينية المتعددة بدون دوران،
الشكل 8 | تطور الميكروهيكل في عينات WFD أثناء القلي العميق عندو. مناطق الاهتمام (المربعات الصفراء) في مقاطع الأشعة السينية CT للعينات المقلية عند: (1) تحويل العينة الكثيفة إلى ميكروهيكل مسامي للغاية مع جدران رقيقة وحجم مسام متجانس نسبيًا، (2) تطور المسام الموجودة مسبقًا في العينة أثناء التمدد؛مناطق الاهتمام (المربعات الصفراء) في مقاطع الأشعة السينية CT للعينات المقلية عند: (1) تحويل
العينة الكثيفة إلى ميكروهيكل مسامي للغاية مع مسام صغيرة وكبيرة مدعومة بجدران رقيقة، (2) تطور المسام الموجودة مسبقًا في العينة أثناء التمدد ثم ضغطها بسبب استمرار تمدد المناطق الداخلية؛ (3) تشكيل القشرة السميكة التي تتكون لاحقًا من مسام صغيرة مضغوطة تحت التمدد الداخلي. تم الإشارة إلى أشرطة القياس في; تسميات الوقتتشير إلى الملاحظات خلال فترة القلي العميق، وتدل الأرقام الفرعية على الوقت بالثواني.
تظهر التصوير الإسقاطي وعودًا في التقاط الظواهر فائقة السرعة..
ثالثًا، لا يزال امتصاص الزيت الذي قد يحدث في المسام النانوية الصغيرة غير قابل للكشف عند دقة الفوكسل الحالية. يمكن تحسين ذلك باستخدام إعداد أكثر تخصيصًا وبيئة عينة لتمكين حساسية أعلى، وتباين ودقة مكانية، خاصة مع التصوير بالأشعة الوردية.. بينما يحد الاعتماد على مصادر الضوء السنكروترونية حاليًا من الوصول، فإن التقدم السريع في الأنظمة المعملية وأنظمة إعادة البناء التكرارية يحمل وعدًا كبيرًا لتطبيق أوسع لهذه التقنية في تطبيقات مماثلة في معالجة الطعام..
أخيرًا، يمثل نظام نموذج WFD فئة مماثلة من المنتجات (مثل الكعك، والمعكرونة). سيوفر تطبيق هذه التقنية على المنتجات التقليدية المستندة إلى البطاطس (مثل البطاطس المقلية، ورقائق البطاطس) والأطعمة المغلفة تحت ظروف تجريبية متنوعة رؤى قيمة يمكن نقلها إلى منتجات أخرى تستهلك بكثرة. لقد ساهم تحليل الميكروهيكل الغذائي باستخدام تقنيات التصوير المختلفة بالفعل في تحقيق تقدم كبير عبر أنواع المنتجات المختلفة.. مع استمرار تطور طرق التصوير في الموقع، من المحتمل أن تمكن من تحقيق المزيد من الاختراقات. بينما تطرح القيود الحالية تحديات، فإنها تقدم أيضًا فرصًا للتحسينات والابتكارات المستقبلية.
تجعل كميات كبيرة من بيانات السلاسل الزمنية الناتجة أثناء التصوير تقسيم البيانات المدعوم بالتعلم الآلي أمرًا لا غنى عنه لمعالجة وتقسيم المراحل المختلفة لت quantification المعلمات المهمة خلال فترة التبريد بعد القلي. إن عدم اليقين في
خرائط التنبؤ أثناء التصنيف، خاصة عند حدود انتقال المرحلة، أمر لا مفر منه. تم تطبيق خطوات التحقق، بما في ذلك التحقق البصري بين مجموعات البيانات المقسمة والصور الرمادية المقابلة، مع وجود إنسان في الحلقة أثناء التدريب، لتقليل الأخطاء. من المتوقع أن تحسن التقدم في خوارزميات التعلم العميق لدقة تقسيم مجموعات البيانات الكبيرة من دقة التقسيم.. علاوة على ذلك،يقدم تحليل الصور مزايا واضحة على الطرق التقليدية مثل امتصاص النيتروجين (NAM) وقياس المسام بالتسرب الزئبقي (MIP) لتقييم خصائص المسام. تتطلب هذه التقنيات إعداد عينات مكثف، بما في ذلك إزالة الغاز وإزالة الزيت والرطوبة، مما قد يؤدي إلى تغييرات لا رجعة فيها في الميكروهيكل للعينة (مثل الانكماش)، مما قد يؤدي إلى تناقضات في القيم المقاسة. يعتبر NAM فعالًا في اكتشاف المسام النانوية ولكنه غير مناسب لوصف المسام الأكبر ()، بينما يتطلب MIP، على الرغم من كونه مفيدًا لتحليل المسام الأكبر ()، ضغوطًا عالية للتسرب الزئبقي الفعال، مما قد يتسبب في تلف العينات.. على النقيض من ذلك، أظهرت عدة دراسات أن تحليل الصور () ينتج نتائج قابلة للمقارنة مع الطرق التحليلية التقليدية، دون وجود اختلافات كبيرة في قياسات محتوى الزيت والتمعدن،، مما يؤكد موثوقية ودقة معالجة الصور لوصف هذه الهياكل المسامية.
تمكنا من تأكيد عدد من النظريات الموجودة مسبقًا المتعلقة بالعملية، (1) الغازات التي تهرب باستمرار تعيق بشكل كبير امتصاص الزيت أثناء القلي العميق.; (2) تؤدي درجة حرارة الزيت الأعلى، وبالتالي فقدان الرطوبة بشكل أكبر، أثناء القلي العميق إلى
زيادة امتصاص الزيت.; و (3) الاتجاه المتزايد لامتصاص الزيت أثناء فترة التبريد بعد القلي.. بالاشتراك مع اختبارات مكملة لمحتوى الرطوبة وقياسات درجة الحرارة، توفر التحقيقات الحالية رؤى إضافية حول هذه النظريات الأساسية. كانت الحركة الشعرية داخل المسام الصغيرة للقشرة هي المحرك الرئيسي لامتصاص الزيت أثناء التبريد، مع تكثف البخار الذي يساهم بشكل أكبر في امتصاص الزيت مع انخفاض درجات الحرارة إلى ما دون. تشكيل قشرة مميزة في العينات المقلية عميقًا عندوكان أكثر ملاءمة لامتصاص الزيت بسبب الفتحات السطحية في بنية ميكروية مشوهة. ساهمت الاختلافات في التحول الهيكلي (للمكونات النشوية والبروتينية) بسبب معدلات فقدان الرطوبة المختلفة الناتجة عن توصيل الحرارة داخل العينات في معدلات امتصاص الزيت المختلفة بشكل ملحوظ وتوزيع الزيت داخل البنية الميكروية. بالنسبة للعينات المقلية عميقًا فيأدى التشوه المحدود أثناء القلي العميق إلى انخفاض كبير في محتوى الزيت النهائي بسبب تقليل الاتصال في مساحة المسام المنهارة أثناء التبريد.
كشف تحليل ترابط المسام أن الزيت ملأ بشكل أساسي المسام الأصغر في مناطق القشرة، مع اختراق مقيد إلى النواة بسبب محدودية ترابط شبكة المسام والشبكات الجدارية السليمة. ومع ذلك، فإن النماذج الحالية تفتقر إلى القدرة على عكس التغيرات في خصائص الهيكل المسامي بدقة أثناء القلي العميق. إن دمج 4Dمن المتوقع أن يعزز بشكل كبير الإطار النمذجي القائممن خلال توفير تصوير عالي الدقة وذو زمن محدد للتغيرات الديناميكية في الهياكل الدقيقة للطعام وامتصاص الزيت. لقد أظهرت نماذج شبكة المسام المعادلة (PNM) التي تم إنشاؤها باستخدام صور الأشعة المقطعية المقطعة لالتقاط هندسة مساحة المسام، وعدًا كبيرًا في محاكاة التدفق متعدد الأطوار على المقياس المجهري.يمكن استخدام هذه النماذج بشكل مشابه لمحاكاة تدفق متعدد الأطوار الديناميكي ودراسة امتصاص النفط مع دمج تأثيرات تغير أشكال المسام. يمكن أن يؤدي ذلك إلى تحسين الدقة في نماذج المقاييس الكبيرة والوسائط المسامية، مما يؤدي إلى تحسين توقعات نقل النفط والماء والبخار، وبالتالي تحسين عملية القلي العميق.
القلي العميق لا يؤدي فقط إلى تغييرات فيزيائية وكيميائية في مكونات الطعام، بل أيضًا في وسط القلي (الزيت) حيث تم ربط تدهور الزيت بمدة القلي ودرجة الحرارة.. علاوة على ذلك، من المعروف جيدًا أن تكوين الأكريلاميد، وهو مركب مصنف كعامل مسرطن محتمل للبشر من قبل الوكالة الدولية لبحوث السرطان، يتسارع عند درجات حرارة أعلى من. بينما أدى ذلك إلى اعتماد العديد من تقنيات المعالجة المسبقة (مثل، الحقل الكهربائي النبضي، الموجات فوق الصوتية، الترددات الراديوية، إلخ) وتم تعديل عمليات القلي عند درجات حرارة منخفضة (مثل القلي الجزئي والقلي تحت الفراغ)، التأثير الدقيق على الميكروهيكل المنتج وديناميات امتصاص الزيت لا يزال غير واضح. 4Dيمكن استخدام التصوير لتقييم فعالية تقنيات المعالجة المسبقة المختلفة في المنتجات التي تخضع لعمليات القلي العميق للمساعدة في تفسير والتحكم في امتصاص الزيت.
بشكل عام، تؤكد هذه الدراسة أن دخول الزيت يمكن ربطه بعدة عوامل مترابطة، مثل معدل فقدان الرطوبة، ودرجة حرارة القلي، وترابط المسام مع سطح الطعام، والصلابة الهيكلية. وهذا يقدم أدلة جديدة تكمل النتائج السابقة وتوفر طرقًا جديدة لفهم وتحسين عمليات القلي العميق. لبناء المزيد على هذا العمل، يُنصح باتباع نهج متعدد الجوانب للحصول على فهم أفضل للعلاقة بين درجة حرارة القلي العميق والخصائص الحسية والتغذوية للمنتج. علاوة على ذلك، يُوصى بإجراء تحقيقات مستقبلية للحصول على رؤى حول كيفية مساهمة عوامل أخرى (مثل تركيبات الطعام، وأنواع الزيوت، والخصائص الفيزيائية الكيميائية لمكونات الكربوهيدرات أو البروتينات، إلخ) في ترابط شبكة المسام، حيث تصبح طرق التصوير عالية الدقة والزمنية أكثر سهولة.
طرق
المواد
دقيق القمحمحتوى الرطوبة وتم شراء (محتوى البروتين) من مولينز فاندن بيمبت (سانت-جوريس-وييرت، بلجيكا). تم إضافة 175 مل من الماء المنزوع الأيونات إلى 400 جرام من الدقيق. بعد فترة راحة مدتها 15 دقيقة، تم عجن العجين لمدة 15 دقيقة باستخدام ماكينة خبز أوتوماتيكية من باناسونيك (كادوما، أوساكا، اليابان) SD-25511WXE وترك لمدة 70 دقيقة. العينات (50 ملغ على أساس المادة الجافة) المشار إليها لاحقًا باسم WFD (عجين دقيق القمح يحتوي علىتم سحب الماء وتشكيله ليتناسب مع حامل العينة (TSC) قبل القلي العميق. تم الحصول على زيت القلي من عباد الشمس من شركة أجريستو (الناصرة، بلجيكا)، وتم اختياره كوسيلة للقلي بسبب شعبيته في تطبيقات القلي العميق الصناعية. تم تصنيع TSCs أسطوانية الشكل من قضبان بولي تترافلورو إيثيلين (PTFE) بتكوين قياسي بقطر داخلي 5.5 مم وارتفاع 18 مم، معمساحة السطح المفتوحة من خلالثقوب بقطر 0.7 مم على السطح و 17 ثقبًا بقطر 0.3 مم في القاع للسماح بتبادل السوائل بسهولة أثناء القلي العميق (انظر الشكل التوضيحي التكميلي 8a، b).
إعداد التجربة
تم تطوير إعداد تجربة مخصص للتحكم عن بُعد في العينة في الموقع أثناء القلي العميق وتبريد ما بعد القلي باستخدام إعداد تصوير السنكروترون (الشكل 1أ). تم إضافة زيت القلي إلى دورق ذو قاع دائري مع ثلاثة عنق متوازية (500 مل، Lenz Laborglas، ويرثايم، ألمانيا)؛ لتسخين والحفاظ على درجة حرارة زيت القلي (تم تسجيلها باستخدام ترمومتر نوع J، انظر الشكل التوضيحي 8ج)، تم تثبيت غلاف تسخين (WHM12033، witeg Labortechnik، ويرثايم، ألمانيا) مع تحريك مدمج بشكل آمن على منصة الدوران الدقيقة. تم تسهيل الحركة العمودية للعينة (لخفض العينة في الزيت الساخن للقلي العميق وسحب العينة من الزيت بعد القلي العميق) باستخدام مشغل خطي (طول شوط 8 بوصات، Firgelli Automations، فيرنديل، واشنطن، الولايات المتحدة الأمريكية) مع موصل من الألمنيوم مصمم خصيصًا (الشكل 1ب) للسماح بتبادل TSCs بين عمليات الاستحواذ دون إزعاج الإعداد. تم التحكم في طول الشوط للتمديد (لضمان غمر حامل العينة بالكامل في الزيت الساخن) وسحب عمود المشغل باستخدام مؤقت مضبوط على 7 ثوانٍ. للحفاظ على استقرار العينة وضمن مجال الرؤية (FOV) أثناء التصوير المقطعي، تم محاذاة المشغل مع محور الدوران والعنق المركزي للدورق باستخدام قضيب دعم من الألمنيوم (قطر 12.5 مم) ملولب إلى لوحة التثبيت. تم نقل إشارات الترمومتر والمشغل عبر حلقة انزلاقية في منصة الدوران، مما يسهل التشغيل عن بُعد لحركة العينة من حجرة التحكم.
عمليات القلي العميق وما بعد القلي
قبل كل عملية استحواذ، كان زيت القلي يسخن بشكل متساوٍ إلى (أين، درجة حرارة الزيت عند 180 أو 150تم وضع العينة المعدة بعناية في TSC. بعد ذلك، تم تثبيت TSC بشكل آمن على موصل المحرك، وبعد ذلك، تم فصل غلاف التسخين للسماح بالدوران الحر للمرحلة التجريبية؛ في الاختبارات غير المتصلة، تم التأكد من أن الحرارة المتبقية في غلاف التسخين كانت كافية للحفاظ على درجة الحرارة المطلوبة للزيت. بعد الانتهاء من إجراءات السلامة اللازمة لخط الأشعة لتأمين حجرة التجربة (حوالي 1 دقيقة)، تم رفع سرعة مرحلة الدوران إلى السرعة المطلوبة وتم تمديد عمود المحرك عن بُعد إلى زيت القلي. بمجرد غمر العينة بالكامل في الزيت وثباتها (حوالي 1 ثانية في الزيت)، تم بدء بروتوكول الاكتساب، حيث بدأت النقطة الزمنية الأولى عند أول تصوير تم التقاطه (الشكل 1d). لتصوير مرحلة ما بعد القلي، اتبعت الجزء الأول نفس الخطوات كما في القلي العميق. تم قلي العينات لمدة 56 ثانية، بعد ذلك تم سحب عمود المحرك من الزيت إلى موضعه الابتدائي. بدأ بروتوكول الاكتساب بمجرد أن أصبح العمود ثابتًا، وكانت العينة في مجال الرؤية (كان يجب تضمين تأخير حوالي 7 ثوانٍ بين استخراج العينة من الزيت إلى حالة ثابتة وأول تصوير تم التقاطه). تم تقييم كل عينة ثلاث مرات لكل من عمليات القلي العميق وعمليات ما بعد القلي.
تصوير الطيف الزمني المتزامن للأشعة السينية في الموقع
تم استخدام شعاع أشعة سينية واسع الطيف مُصفى تم توفيره بواسطة جهاز إدخال متذبذب لتوفير كثافة تدفق فوتوني عالية بما فيه الكفاية في غرفة التجارب في خط الأشعة ID19 الواقعة على بعد 150 مترًا من المصدر..
على طول أنبوب الطيران الفراغي (أي بين المصدر والكوخ التجريبي)، تم تعديل الشعاع باستخدام مجموعتين من شقوق الشعاع الأبيض، الشقوق الأولية على بعد 40 مترًا من المصدر لتخفيف الحمل الحراري والشقوق الثانوية لتقويم الشعاع الموجودة على بعد 140 مترًا من المصدر، بالإضافة إلى سلسلة من المثبطات لتحسين طيف العينة. تم اعتبار التسخين الناتج عن تعرض الشعاع للعينة ضئيلًا نظرًا للحالة السابقة المتمثلة في الغمر في زيت ساخن. بعد اصطدام الشعاع بالعينة الدوارة بسرعة، تم الكشف عن الشعاع المنقول باستخدام مجموعة كاشف غير مباشر تتكون من كاشف لامع، ومرآة قابلة للطي، وعدسة موضوعية وكاميرا sCMOS سريعة.تم استخدام تكوينين لرؤية توموغرافية سريعة في الموقع لعمليات القلي العميق وما بعد القلي. لتتبع تكوين المسام في مرحلة النواة من عملية القلي العميق، تم تعديل الشعاع باستخدام مثبطات من الألمنيوم بسمك 1.4 مم والماس بسمك 0.8 مم، مما يوفر طاقة قصوى تبلغ 30 كيلو إلكترون فولت. كان الكاشف غير المباشر السريع، الذي تم وضعه على بعد 1 متر من العينة، يتكون منعدسة موضوعية ميتوتويو (كاناغاوا، اليابان) بلان أب (NA=0.14) مع :هذا الكاشف يوفر حجم فوكسل الناتج من وإجمالي مجال الرؤية لرؤية عملية التبريد بعد القلي، مرت الشعاع عبر 1.4 مم من الألمنيوم، و0.14 مم من النحاس، و0.8 مم من المثمن، مما يوفر طاقة ذروة قدرها 35 كيلو إلكترون فولت. كان الكاشف غير المباشر السريع، الذي تم وضعه على بعد 7 أمتار من العينة، يتكون منعدسة تانديم موضوعيةهاسلبلاد) معLuAG:Ce كاشف ضوء يوفر حجم فوكسل منومجال رؤية أسطواني من. تم تنفيذ هذه التصويرية لعملية التبريد في مجال رؤية أوسع لتصوير العينة بالكامل وللحصول على مرجع سياقي لتقييم أنماط امتصاص الزيت. بالنسبة لكلا الإعدادين، تم التقاط الإشارة الضوئية المحولة من الكاشف باستخدام كاميرا من نوع sCMOS pco.dimax (S7، PCO AG، ألمانيا) مع عدد بكسلات لكل إطار من بكسلات، تحتوي على حجم البيكسل على المستشعر والذاكرة المدمجة. لالتقاط العملية الديناميكية عند عينة زمنية تمثيلية، تم إجراء عمليات الاستحواذ على فترات زمنية ثابتة بسبب الذاكرة المدمجة المحدودة. تم الحصول على ستة توموغرافيات كاملة لكل عملية استحواذ بمعدل توموغراف واحد في الثانية (1000 صورة شعاعية بتعرض لمدة 1 مللي ثانية على مدارلكل جهاز تصوير مقطعي). تم الحفاظ على الفاصل الزمني بين كل جهاز تصوير مقطعي عند 10 ثوانٍ خلال القلي العميق (المشار إليه بـ ) وعملية القلي بعد الطهي (المشار إليها بـ ). تم إجراء مجموعة إضافية من الملاحظات بفواصل زمنية قدرها 3 ثوانٍ (المشار إليها بـ لرؤية مرحلة النواة خلال عملية القلي العميق للعينات المقلية في. أخيرًا، لتأسيس مرجع لميكروهيكل العينة، تم وضع العينات المحضرة المائية في أنابيب ميكروسنترفيج وتم تصويرها في دقة البكسل باستخدام جهاز الأشعة السينية UniTom HRماسح (TESCAN XRE، غنت، بلجيكا) وفقًا لبروتوكول الاستحواذ الموصوف في رايلي وآخرون..
معالجة الصور وتحليلها
تم إجراء إعادة بناء الصورة باستخدام خوارزمية الإسقاط المعكوس المدعومة بمعيار الذهب والتي تتضمن استرجاع الطور على مسافة واحدة.باستخدام برنامج تم تطويره داخليًا، Tomwer v1.0.0 (https:// gitlab.esrf.fr/tomotools/tomwer). تم إعادة بناء التضاريس ثلاثية الأبعاد لكل نقطة زمنية للاكتساب مع الأخذ في الاعتبار معايير مثل محاذاة مركز الدوران، ونسبة معامل الانكسار المعقد لمادة واحدة [دلتا/بيتا = 1000 (قبل القلي)، 6000 (بعد القلي)] وإزالة عيوب الحلقة للحصول على كومات صور مقطع عرضي لتوزيع المواد في ثلاثي الأبعاد. تم تقليل الشعاع المنقول الذي اكتشفه تجميع الكاشف ليس فقط بواسطة مكونات العينة الفردية، ولكن أيضًا بواسطة زجاج البوروسيليكات (الزجاجة) وحجم كبير من زيت القلي الساخن. نظرًا لمساهمة التباين الطوري القائم على الانتشار بفضل (التوافق المكاني الجزئي) للإشعاع الساقط، تم الحصول على حساسية كافية للتمييز بين أربعة مراحل مختلفة داخل مجالات الطور المعاد بناؤها ثلاثية الأبعاد: الغاز، الزيت، العينة، TSC. بعد ذلك، تم استيراد الصور إلى برنامج Avizo 3D 2021.2 (FEI Thermo Fisher Scientific، وولثام، ماساتشوستس، الولايات المتحدة الأمريكية) لمزيد من معالجة الصور. المعالجة. تم تحويل الأحجام المعاد بناؤها 32 بت إلى 16 بت مع الأخذ في الاعتبارقيم الكثافة في هيستوغرام الحجم لتوصيف المراحل ذات الاهتمام. بعد ذلك، تم تطبيق فلتر غير محلي ثلاثي الأبعاد لإزالة الضوضاء من الصورة مع الحفاظ على الهياكل الرقيقة.
نظرًا لأن المراحل الفردية أثرت على خصائص امتصاص الأشعة السينية، تم تصنيف المراحل باستخدام قيم الكثافة الخاصة بها بناءً على خصائص التوهين المميزة الناتجة عن الاختلافات في العدد الذري والكثافة، بالإضافة إلى السياق المكاني والزماني من بيانات السلاسل الزمنية في مراحل مختلفة أثناء الاكتساب.. على سبيل المثال، من الصور وتوزيعات كثافة اللون الرمادي في الشكل 1d، حددنا الزيت المتصل بالعينة داخل TSC عندتليها طرد النفط في نقاط زمنية لاحقةواستخدم معامل التوهين المقابل لتحديد الزيت في العينة. كانت ترتيب كثافات التدرج الرمادي (من الفاتح إلى الداكن) كالتالي: TSC > صلب > زيت > غاز. هنا، الهيكل الصلب يتوافق مع WFD (المقلي) بما في ذلك النشا-الجلوتين-الماء حيث تغيرت التفاعلات بين المكونات خلال العملية. وقد تم إثبات ذلك سابقًا باستخدام المختبر.أن الهيكل الصلب من النشا والماء أظهر بالفعل تشتت أشعة X أعلى من الزيت والهواءنظرًا لأن معظم الماء كان مرتبطًا بمكونات النشا والجلوتين في عينة WFD المائية، فإن نسبة صغيرة فقط من الماء الحر كانت متاحة.أثناء القلي العميق، ستؤدي عملية تحويل الماء إلى بخار إلى جعل تحديد الماء أكثر صعوبة حيث يستمر محتوى الرطوبة في الانخفاض خلال العملية (الشكل 4أ). لذلك، لم يكن من الممكن تحديد الماء وفصله عن المادة الصلبة. وقد أكد مؤلفون آخرون التحدي المتمثل في فصل الماء عن الهيكل الصلب بسبب تشابه الرقم الذري الفعال لهما.نظرًا للتشوه الهيكلي الواسع في مصفوفة العينة أثناء القلي العميق، تعرضت بعض المناطق للتوسع السريع، أسرع من معدل الاكتساب مما أدى إلى حدوث عيوب حركية موضعية أثناء إعادة البناء. وبالتالي، لم يكن من الممكن إجراء تقسيم موثوق للاكتسابات أثناء القلي العميق. الشكل 1d يقدم مثالًا على تحول الهيستوغرام خلال عملية القلي العميق حيث يتشوه الهيكل، وتبرز المناطق الملونة قيم الكثافة المرتبطة بالمراحل المختلفة. نظرًا للخصائص الجوهرية لاكتساب الأشعة المقطعية، فإن الصور المعاد بناؤها عرضة للضوضاء الغاوسية أو تأثيرات تحت البكسل، وبالتالي من المتوقع حدوث بعض التداخل بين كثافة المراحل. تم تحديد ميزات الميكروهيكل القابلة للتعرف مثل المراحل الفردية، المسامية، المسام المتصلة عادةً بناءً على ضعف حجم الفوكس الممسوح على الأقل للصورة..
على العكس، كانت تشوهات العينة محدودة خلال عملية القلي ولم تؤثر على التقسيم. تم ذلك بمساعدة تصنيف البكسل المدعوم بتعلم الآلة في Ilastik v1.4.0.تمت الإشارة إلى التعليقات اليدوية النادرة بناءً على السياق المكاني وكثافات التدرج الرمادي عبرللصور المعاد بناؤها (150 شريحة مقطعية) لكل فترة زمنية ولكل مجموعة عينة من درجات حرارة القلي العميق المختلفة (180، 150 و ) كبيانات تدريب لمصنف الغابة العشوائية لتصنيف البكسلات إلى أربع فئات: النفط، الغاز، الصلب وTSC. تم تدريب النماذج بشكل تكراري لتقليل عدم اليقين بين الفئات وتقليل خطأ خارج الحقيبة (OOB) (المتوفر في الجدول التكميلي 2) للبكسلات المعلّمة. حيث أن المصنف عرضة لعدم يقين أعلى في مناطق انتقال الطور (أي، حدود علامتين) مقارنة بالأجزاء المتجانسة.خطأ إضافي (حواليتم العثور على اختلافات عبر مجموعات البيانات من حيث إجمالي أحجام تسميات الفئات، والتي تُعزى بشكل رئيسي إلى انتقالات المسام-جدار الخلية. تم تقسيم خرائط الاحتمالية المقابلة باستخدام عتبة عالمية تم تعيينها على 0.5 في MATLAB (الإصدار 2019b، MathWorks، ناتيك، ماساتشوستس، الولايات المتحدة الأمريكية). في المناطق ذات عدم اليقين العالي، كانت احتمالية أن يكون بكسل ما مطابقًا لأي فئة أقل من 0.5، وفي هذه الحالات المحددة، تُركت البكسلات غير المعينة من أجل الكمية. ثم تم إعادة استيراد كومات الصور المقسمة في Avizo لإجراء عدة عمليات شكلية (تصفية حسب القياس، إغلاق محيطي، إلخ) لعزل العينة و الزيت داخل العينة (عملية معالجة الصور المعروضة في الشكل 5). تم إجراء الحسابات الفردية لنسبة حجم المراحل الثلاث والمسامات (الإجمالية والغازية). تم حساب نسبة حجم المراحل المتميزة على النحو التالي:
معكسر الحجم من-المرحلة (النشا، الزيت، الغاز)،حجم– المرحلة، والحجم الكلي للعينة.
تم حساب محتويات الزيت الحجمية داخل المصفوفة الصلبة بطريقتين: أولاً، كنسبة الحجم الذي تشغله مرحلة الزيت (المسام المملوءة بالزيت) إلى حجم كل من مرحلتي الزيت والنشا؛ وثانياً، كنسبة الحجم الذي تشغله مرحلة الزيت (المسام المملوءة بالزيت) إلى الحجم الكلي للعينة المميزة. لم يتم التحقيق في امتصاص الزيت في المسام النانوية الصغيرة الموجودة في منطقة القشرة لتحقيق توازن جيد لبروتوكول الاستحواذ عبر معدل الاستحواذ، دقة الفوكس، واعتبارات مجال الرؤية. علاوة على ذلك، لتقييم الاتصال بين المسام المملوءة بالزيت داخل المصفوفة الصلبة، تم تصنيف مرحلة الزيت المقطعة بعد إجراء عملية فتح لمنع تأثيرات عيوب انتقال الطور.تم تلوين المسام المعنونة بناءً على ترابط المكونات المجاورة.
المسامية الكلية (تم تقييمه بناءً على حجم المسام الذي يشغله النفط ) وغاز ( ):
تم حساب مسامية الغاز في العينات غير المقلية عبر 3 أحجام تمثيلية من.
لتحقيق الفروق الميكروهيكلية بين مناطق القشرة والنواة في العينات المقلية عميقًا، تم فصل طبقة خارجية بسمك ثابت قدره 0.5 مم عند السطح باستخدام خريطة مسافة الحواف في برنامج أفيسو. تم إخفاء مناطق القشرة والنواة من مجموعة البيانات المجزأة وتم تقييم توزيع حجم المسام عند 8 و63 ثانية خلال فترة التبريد بعد القلي بعد فصل المياه.
توزيع سمك الهيكل المحلي (معبر عنه بـتم تقييم ) مصفوفة النشا-الجلوتين للعينة والمناطق المنفصلة من القشرة واللب باستخدام CTAn (الإصدار 1.18.8.0، Bruker SkyScan، كونتيش، بلجيكا). قدم خوارزمية ملاءمة الكرة في وحدة التحليل ثلاثي الأبعاد السماكة المحلية للهيكل كما هو موضح بواسطة قطر أكبر كرة محاطة..
تحديد محتوى الرطوبة
محتوى الرطوبة في عينات WFD والمقلية عميقًا عند 180، 150، أولـ، وتم تقييم 60 ثانية باستخدام طريقة AACC 44-15.02تم قلي العينات في زيت عميق باستخدام نفس الإعداد التجريبي وتم تبريدها لمدة 60 ثانية قبل تحديد محتوى الرطوبة. تم تكرار القياسات لستة تكرارات لكل من نقاط الزمن. تم حساب محتوى الرطوبة على أساس المادة الجافة.، حيث الكتلةيتم التعبير عنها بالجرامات وDM تشير إلى المادة الجافة للمواد الصلبة (باستثناء الزيت الممتص نتيجة القلي العميق).
قياسات درجة الحرارة أثناء القلي العميق وبعد القلي
تم قياس ملفات درجات الحرارة داخل عينات WFD أثناء وبعد القلي العميق في القشرة واللب بشكل منفصل باستخدام مقياس حرارة من النوع K (قطر مسبار 0.075 مم، RS-pro، لندن، المملكة المتحدة) متصل بنظام اكتساب رقمي (34970 A، Agilent Technologies، سانتا كلارا، كاليفورنيا، الولايات المتحدة الأمريكية) يسجل البيانات بتردد 2 هرتز. تم إجراء القياسات في مناطق القشرة واللب بالقرب من السطح للقشرة (ضمن 1 مم) وفي مركز العينة لللب (انظر الشكل التوضيحي التكميلي 9). تم تسجيل درجات الحرارة بشكل مستمر أثناء القلي العميق. وما بعد القلي فترة، نفس الشيء كما في 4Dالتصوير. تم الحصول على ما لا يقل عن خمسة تكرارات لـ درجة حرارة القلي العميق 180، 150، أولأخذ أي تباين في موضع الثيرموكوبل في الاعتبار.
التحليل الإحصائي
تم التعبير عن النتائج كمتوسط والانحراف المعياري للتكرارات. لتحديد ما إذا كانت المتوسطات مختلفة بشكل كبير، تم إجراء نموذج مختلط مع تحليل التباين أحادي الاتجاه لتحديد التأثير المشترك لدرجة حرارة القلي والوقت. تم إجراء اختبار المقارنات المتعددة باستخدام فرق توكي الصادق الهام لجميع المقارنات الثنائية مع تحديد مستوى الدلالة عندتم إجراء جميع التحليلات الإحصائية باستخدام JMP pro 17.2 (معهد SAS، كاري، نورث كارولينا، الولايات المتحدة الأمريكية).
ملخص التقرير
معلومات إضافية حول تصميم البحث متاحة في ملخص تقارير مجموعة ناتشر المرتبط بهذه المقالة.
توفر البيانات
البيانات التي تدعم نتائج هذه الدراسة متاحة من بوابة بيانات ESRFزينودوومن المؤلف المراسل عند الطلب.
References
Gamble, M. H., Rice, P. & Selman, J. D. Relationship between oil uptake and moisture loss during frying of potato slices from c. v. Record U.K. tubers. Int. J. Food Sci. Technol. 22, 233-241 (1987).
Ziaiifar, A. M., Achir, N., Courtois, F., Trezzani, I. & Trystram, G. Review of mechanisms, conditions, and factors involved in the oil uptake phenomenon during the deep-fat frying process. Int. J. Food Sci. Technol. 43, 1410-1423 (2008).
U.S. Department of Agriculture, A. R. S. USDA Food and Nutrient Database for Dietary Studies 2019-2020. (2022).
Dana, D. & Saguy, I. S. Review: Mechanism of oil uptake during deep-fat frying and the surfactant effect-theory and myth. Adv. Colloid Interface Sci 128-130, 267-272 (2006).
Hooper, L. et al. Reduction in saturated fat intake for cardiovascular disease. Cochrane Database Syst. Rev. 2020, (2020).
Hooper, L., Abdelhamid, A. S., Jimoh, O. F., Bunn, D. & Skeaff, C. M. Effects of total fat intake on body fatness in adults. Cochrane Database Syst. Rev. 2020, CD013636 (2020).
Mottram, D. S., Wedzicha, B. L. & Dodson, A. T. Acrylamide is formed in the Maillard reaction. Nature 419, 448-449 (2002).
World Health Organization. Total Fat Intake for the Prevention of Unhealthy Weight Gain in Adults and Children. (2023).
Pagliai, G. et al. Consumption of ultra-processed foods and health status: a systematic review and meta-analysis. Br. J. Nutr. 125, 308-318 (2021).
Monteiro, C. A., Moubarac, J. -C., Cannon, G., Ng, S. W. & Popkin, B. Ultra-processed products are becoming dominant in the global food system. Obes. Rev. 14, 21-28 (2013).
Vitrac, O., Trystram, G. & Raoult-Wack, A. L. Deep-fat frying of food: Heat and mass transfer, transformations and reactions inside the frying material. Eur. J. Lipid Sci. Technol. 102, 529-538 (2000).
Moreira, R. G., Sun, X. & Chen, Y. Factors affecting oil uptake in tortilla chips in deep-fat frying. J. Food Eng. 31, 485-498 (1997).
Alam, T. & Takhar, P. S. Microstructural characterization of fried potato disks using x-ray micro computed tomography. J. Food Sci. 81, E651-E664 (2016).
Riley, I. M. et al. Impact of potato starch structural transitions on microstructure development during deep-frying. Food Hydrocoll 142, 108833 (2023).
Bouchon, P., Aguilera, J. M. & Pyle, D. L. Structure Oil-Absorption Relationships during Deep-Fat Frying. J. Food Sci. 68, 2711-2716 (2003).
Ufheil, G. & Escher, F. Dynamics of oil uptake during deep-fat frying of potato slices. Lwt 29, 640-644 (1996).
Dueik, V., Moreno, M. C. & Bouchon, P. Microstructural approach to understand oil absorption during vacuum and atmospheric frying. J. Food Eng. 111, 528-536 (2012).
Moreno, M. C., Brown, C. A. & Bouchon, P. Effect of food surface roughness on oil uptake by deep-fat fried products. J. Food Eng. 101, 179-186 (2010).
Baumann, B. & Escher, F. Mass and heat transfer during deep-fat frying of potato slices -I. rate of drying and oil uptake. LWT – Food Sci. Technol. 28, 395-403 (1995).
Albert, S. & Mittal, G. S. Comparative evaluation of edible coatings to reduce fat uptake in a deep-fried cereal product. Food Res. Int. 35, 445-458 (2002).
Liberty, J. T., Dehghannya, J. & Ngadi, M. O. Effective strategies for reduction of oil content in deep-fat fried foods: A review. Trends Food Sci. Technol. 92, 172-183 (2019).
Ziaiifar, A. M., Courtois, F. & Trystram, G. Porosity development and its effect on oil uptake during frying process. J. Food Process Eng. 33, 191-212 (2010).
Halder, A., Dhall, A. & Datta, A. K. An improved, easily implementable, porous media based model for deep-fat frying. Part II: Results, validation and sensitivity analysis. Food Bioprod. Process. 85, 220-230 (2007).
Zhang, J., Liu, Y. & Fan, L. Effect of pore characteristics on oil absorption behavior during frying of potato chips. Innov. Food Sci. Emerg. Technol. 66, 102508 (2020).
Kalogianni, E. P. & Papastergiadis, E. Crust pore characteristics and their development during frying of French-fries. J. Food Eng. 120, 175-182 (2014).
Moreira, R. G. & Barrufet, M. A. A new approach to describe oil absorption in fried foods: a simulation study. J. Food Eng. 35, 1-22 (1998).
Zhang, T., Li, J., Ding, Z. & Fan, L. Effects of initial moisture content on the oil absorption behavior of potato chips during frying process. Food Bioprocess Technol 9, 331-340 (2016).
Reyniers, S. et al. Amylose molecular fine structure dictates water-oil dynamics during deep-frying and the caloric density of potato crisps. Nat. Food 1, 736-745 (2020).
Gazmuri, A. M. & Bouchon, P. Analysis of wheat gluten and starch matrices during deep-fat frying. Food Chem 115, 999-1005 (2009).
Liu, Y., Tian, J., Zhang, T. & Fan, L. Effects of frying temperature and pore profile on the oil absorption behavior of fried potato chips. Food Chem 345, 128832 (2021).
Touffet, M., Trystram, G. & Vitrac, O. Revisiting the mechanisms of oil uptake during deep-frying. Food Bioprod. Process. 123, 14-30 (2020).
Jekle, M., Mühlberger, K. & Becker, T. Starch-gluten interactions during gelatinization and its functionality in dough like model systems. Food Hydrocoll 54, 196-201 (2016).
Thanatuksorn, P., Kajiwara, K. & Suzuki, T. Characterization of deepfat frying in a wheat flour-water mixture model using a state diagram. J. Sci. Food Agric. 87, 2648-2656 (2007).
Wang, Z. et al. Effects of thermal properties and behavior of wheat starch and gluten on their interaction: a review. Int. J. Biol. Macromol. 177, 474-484 (2021).
Chen, L. et al. Comprehensive investigation and comparison of surface microstructure of fractionated potato starches. Food Hydrocoll 89, 11-19 (2019).
Li, W. et al. Low and high methoxyl pectin lowers on structural change and digestibility of fried potato starch. LWT 132, 109853 (2020).
Aguilera, J. M., Cadoche, L., Loópez, C. & Gutierrez, G. Microstructural changes of potato cells and starch granules heated in oil. Food Res. Int. 34, 939-947 (2001).
Kawas, M. L. & Moreira, R. G. Characterization of product quality attributes of tortilla chips during the frying process. J. Food Eng. 47, 97-107 (2001).
Bouchon, P. & Aguilera, J. M. Microstructural analysis of frying potatoes. Int. J. Food Sci. Technol. 36, 669-676 (2001).
Dhital, S., Baier, S. K., Gidley, M. J. & Stokes, J. R. Microstructural properties of potato chips. Food Struct 16, 17-26 (2018).
Aguilera, J. M. Why food micro structure? J. Food Eng. 67, 3-11 (2005).
Dehghannya, J. & Ngadi, M. Recent advances in microstructure characterization of fried foods: different frying techniques and process modeling. Trends Food Sci. Technol. 116, 786-801 (2021).
Yang, D., Wu, G., Li, P., Zhang, H. & Qi, X. Comparative analysis of the oil absorption behavior and microstructural changes of fresh and pre-frozen potato strips during frying via MRL, SEM, and XRD. Food Res. Int. 122, 295-302 (2019).
Li, P. et al. Effect of multistage process on the quality, water and oil distribution and microstructure of French fries. Food Res. Int. 137, 109229 (2020).
Contardo, I., James, B. & Bouchon, P. Microstructural characterization of vacuum-fried matrices and their influence on starch digestion. Food Struct 25, 100146 (2020).
Dewanckele, J., Boone, M. A., Coppens, F., van Loo, D. & Merkle, A. P. Innovations in laboratory-based dynamic micro-CT to accelerate in situ research. J. Microsc. 277, 197-209 (2020).
Withers, P. J. et al. X-ray computed tomography. Nat. Rev. Methods Prim. 1, 18 (2021).
Turbin-Orger, A. et al. Growth and setting of gas bubbles in a viscoelastic matrix imaged by X-ray microtomography: The evolution of cellular structures in fermenting wheat flour dough. Soft Matter 11, 3373-3384 (2015).
Schott, F. et al. Structural formation during bread baking in a combined microwave-convective oven determined by sub-second in-situ synchrotron X-ray microtomography. Food Res. Int. 173, 113283 (2023).
Gruber, S. et al. Pore shape matters – In-situ investigation of freezedrying kinetics by 4D XCT methods. Food Res. Int. 193, 114837 (2024).
Patsioura, A. et al. Microscopic imaging of biphasic oil-air flow in F rench fries using synchrotron radiation. AIChE J. 61, 1427-1446 (2015).
Blankenburg, C., Rack, A., Daul, C. & Ohser, J. Torsion estimation of particle paths through porous media observed by in-situ timeresolved microtomography. J. Microsc. 266, 141-152 (2017).
Piovesan, A. et al. 4D synchrotron microtomography and porenetwork modelling for direct in situ capillary flow visualization in 3D printed microfluidic channels. Lab Chip 20, 2403-2411 (2020).
Delcour, J. A. & Hoseney, R. C. Principles of Cereal Science and Technology. (AACC International, 2010).
Farkas, B. E., Singh, R. P. & Rumsey, T. R. Modeling heat and mass transfer in immersion frying. I, model development. J. Food Eng. 29, 211-226 (1996).
Mondal, A. & Datta, A. K. Bread baking – A review. J. Food Eng. 86, 465-474 (2008).
Ni, H. & Datta, A. K. Moisture, oil and energy transport during deepfat frying of food materials. Food Bioprod. Process. Trans. Inst. Chem. Eng. Part C 77, 194-204 (1999).
Reyniers, S., Ooms, N. & Delcour, J. A. Transformations and functional role of starch during potato crisp making: A review. J. Food Sci. 85, 4118-4129 (2020).
Riley, I. M., Verma, U., Verboven, P., Nicolai, B. M. & Delcour, J. A. Wheat gluten structure and (non-)covalent network formation during deep-fat frying. Food Res. Int. 188, 114503 (2024).
Berg, S. et al. Ilastik: interactive machine learning for (Bio)image analysis. Nat. Methods 16, 1226-1232 (2019).
Sandhu, J., Bansal, H. & Takhar, P. S. Experimental measurement of physical pressure in foods during frying. J. Food Eng. 115, 272-277 (2013).
HUBBARD, L. J. & FARKAS, B. E. Influence of oil temperature on convective heat transfer during immersion frying. J. Food Process. Preserv. 24, 143-162 (2000).
van der Sman, R. G. M. & van der Goot, A. J. The science of food structuring. Soft Matter 5, 501-510 (2009).
Tengattini, A. et al. NeXT-Grenoble, the Neutron and X-ray tomograph in Grenoble. Nucl. Instruments Methods Phys. Res. Sect. A Accel. Spectrometers, Detect. Assoc. Equip. 968, 163939 (2020).
Nemati, A., Lukić, B., Tengattini, A., Briffaut, M. & Séchet, P. Water vapor condensation in porous media: effects of fracture, porosity, and flow rate revealed by rapid 4D neutron imaging. Adv. Water Resour. 195, 104872 (2025).
Asimakopoulou, E. M. et al. Development towards high-resolution kHz -speed rotation-free volumetric imaging. Opt. Express 32, 4413 (2024).
Mittone, A. et al. Multiscale pink-beam microCT imaging at the ESRF-ID17 biomedical beamline. J. Synchrotron Radiat. 27, 1347-1357 (2020).
Aguilera, J. M. Food structure revisited. Trends Food Sci. Technol. 147, 104459 (2024).
Schoeman, L., Williams, P., du Plessis, A. & Manley, M. X-ray microcomputed tomography ( ) for non-destructive characterisation of food microstructure. Trends Food Sci. Technol. 47, 10-24 (2016).
Archana, R. & Jeevaraj, P. S. E. Deep learning models for digital image processing: a review. Artif. Intell. Rev. 57, 11 (2024).
Zhang, J., Li, J. & Fan, L. Comparative analysis of oil absorption and microstructure of fried potato chips treated with different pretreatment via X-ray micro-computed tomography and mercury intrusion method. J. Food Compos. Anal. 129, 106129 (2024).
Xue, S. et al. Comparison of mercury intrusion porosimetry and multi-scale X-ray CT on characterizing the microstructure of heattreated cement mortar. Mater. Charact. 160, 110085 (2020).
Contardo, I. & Bouchon, P. Enhancing Micro-CT methods to quantify oil content and porosity in starch-gluten matrices. J. Food Eng. 237, 154-161 (2018).
Bouchon, P. & Pyle, D. L. Modelling oil absorption during post-frying cooling II: solution of the mathematical model, model testing and simulations. Food Bioprod. Process. 83, 261-272 (2005).
Datta, A. et al. Computer-aided food engineering. Nat. Food 3, 894-904 (2022).
Aladedunye, F. A. & Przybylski, R. Degradation and Nutritional Quality Changes of Oil During Frying. J. Am. Oil Chem. Soc. 86, 149-156 (2009).
EFSA Panel on Contaminants in the Food Chain. Scientific Opinion on acrylamide in food. EFSA J. 13, (2015).
Zhang, J., Li, J. & Fan, L. Application of innovative techniques in modifying microstructures and reducing oil uptake of fried food: A review. Food Res. Int. 196, 115049 (2024).
Kumari, A., Bhattacharya, B., Agarwal, T., Paul, V. & Chakkaravarthi, S. Integrated approach towards acrylamide reduction in potatobased snacks: A critical review. Food Res. Int. 156, 111172 (2022).
Weitkamp, T. et al. Status and evolution of the ESRF beamline ID19. in X-ray Optics and Microanalysis: Proceedings of the 20th International Congress 33-38 (AIP Publishing, Karlsruhe, 2010).
Douissard, P. A. et al. A versatile indirect detector design for hard X-ray microimaging. J. Instrum. 7, P09016-P09016 (2012).
Paganin, D., Mayo, S. C., Gureyev, T. E., Miller, P. R. & Wilkins, S. W. Simultaneous phase and amplitude extraction from a single defocused image of a homogeneous object. J. Microsc. 206, 33-40 (2002).
Jackson, D. F. & Hawkes, D. J. X-ray attenuation coefficients of elements and mixtures. Phys. Rep. 70, 169-233 (1981).
Maire, E. & Withers, P. J. Quantitative X-ray tomography. Int. Mater. Rev. 59, 1-43 (2014).
Riley, I. M., Nivelle, M. A., Ooms, N. & Delcour, J. A. The use of time domain 1 H NMR to study proton dynamics in starch-rich foods: A review. Compr. Rev. Food Sci. Food Saf. 21, 4738-4775 (2022).
Schlüter, S., Sheppard, A., Brown, K. & Wildenschild, D. Image processing of multiphase images obtained via X-ray microtomography: A review. Water Resour. Res. 50, 3615-3639 (2014).
Kerckhofs, G., Schrooten, J., Van Cleynenbreugel, T., Lomov, S. V. & Wevers, M. Validation of x-ray microfocus computed tomography as an imaging tool for porous structures. Rev. Sci. Instrum. 79, 013711 (2008).
Hildebrand, T. & Rüegsegger, P. A new method for the modelindependent assessment of thickness in three-dimensional images. J. Microsc. 185, 67-75 (1997).
Moisture-Air-Oven Methods. in AACC International Approved Methods (AACC International, 2009).
Verma, U., Riley, I. M., Verboven, P. & Nicolaï, B. M. In situ visualization of fluid flow during deep-fat frying process using ultrafast synchrotron microtomography. ERSF data repository https://doi. org/10.15151/ESRF-ES-930328408 (2025).
Verma, U., Riley, I. M., Verboven, P. & Nicolaï, B. M. Supporting data. Zenodo https://doi.org/10.5281/zenodo. 14507722 (2025).
شكر وتقدير
تم الاعتراف بـ FWO-Vlaanderen لتمويل منحة مشروع البحث G.0903.19 N. يقر المؤلفون بمرفق الإشعاع السنكروتروني الأوروبي لتوفير وقت الشعاع في خط الشعاع ID19 بموجب الاقتراح ‘LS-3126’. ألكسندر راك ومارتا مايكوت (علماء خط الشعاع، ID19 ESRF) على نصائحهم القيمة المتعلقة بالاقتراح والنقاشات المثمرة المتعلقة بالاعتبارات التجريبية خلال اختبار الإعداد، على التوالي. كما يعرب المؤلفون عن امتنانهم لجيرت فان بينيدن، إيفس سيفيرينز وريت راماكرز (من CMW وCDE وKU Leuven على التوالي) لمساعدتهم في مكونات فردية محددة من الإعداد التجريبي.
مساهمات المؤلفين
قام ب.م.ن.، ب.ف. و ج.أ.د. بالإشراف على المشروع. قام ب.ف.، ب.م.ن. و أ.ف. بتصميم العمل وتقديم طلب للحصول على وقت الأشعة في ESRF. قام أ.ف. بتصميم إعداد التجربة. قام إ.م.ر. بتصميم وتحسين صيغة العينة. قام أ.ف.، إ.م.ر.، ب.ف. و ب.م.ن. بإجراء تجربة الميكروتوموغرافي في السنكروترون بمساعدة من ب.ل. و ل.ب. في إعداد خط الأشعة في ESRF. قام أ.ف. بمعالجة بيانات تصوير الأشعة السينية. قام جميع المؤلفين بتفسير ومناقشة النتائج. قام أ.ف. بإعداد المسودة الأصلية للمخطوطة. ساهم جميع المؤلفين في مراجعة وتحرير المخطوطة.
يجب توجيه المراسلات والطلبات للحصول على المواد إلى P. Verboven.
معلومات مراجعة الأقران تشكر مجلة Nature Communications بيدرو بوشون، ليوبينغ فان والمراجعين الآخرين المجهولين على مساهمتهم في مراجعة هذا العمل. يتوفر ملف مراجعة الأقران.
قسم BIOSYST-MeBioS، جامعة KU Leuven، ويليم دي كرويلاان 42، B-3001 لوفين، بلجيكا.مختبر كيمياء الأغذية وعلم الأحياء الدقيقة، جامعة KU Leuven، كاستيلبارك أرينبرغ 20، B-3001 لوفين، بلجيكا.مرفق الإشعاع السنكروتروني الأوروبي، CS 40220، غرونوبل F-38043، فرنسا.مركز فلاندرز لتكنولوجيا ما بعد الحصاد، ويليم دي كرويلاان 42، B-3001 لوفين، بلجيكا. البريد الإلكتروني:pieter.verboven@kuleuven.be
High-speed computed tomography to visualise the 3D microstructural dynamics of oil uptake in deep-fried foods
Received: 13 June 2024
Accepted: 27 February 2025
Published online: 16 March 2025
U. Verma , I. M. Riley , B. Lukić , L. Broche , P. Verboven , J. A. Delcour & B. M. Nicolaï
Oil serves as both the high-temperature heating medium during deep-frying unit operations and a contributor to the organoleptic properties of deep-fried foods. Its absorption is linked to structural deformations during deep-frying that create pathways for oil to enter the food microstructure. This study proposes a 4D imaging system (three spatial dimensions and time) using fast synchrotron radiation tomography for in-situ visualisation during deep-frying and post-frying cooling to understand the mechanisms behind oil absorption. Using wheat flour dough as a model food system, we investigate the impact of frying oil temperature on structural deformation and pore formation in the crust and core, pore structure integrity, and oil uptake and distribution. The results show that higher temperatures lead to the formation of a distinguished crust with surface openings, facilitating greater oil absorption in small crust pores through capillary action. Comparing 3D microstructures attained at different frying oil temperatures, final oil content reaches at , at , and at , with temperature-dependent structural changes in pore connectivity and network integrity significantly impacting the rate of oil uptake and its distribution.
Deep-frying is a widely popular food processing technique in which foods are fully immersed in hot oil . The applicability of this process to a large variety of food products and the distinct flavour and sensory characteristics imparted thereby have made deep-fried foods a staple in diets all over the world, particularly so for Western diets . Deep-fried products based on wheat flour (ca. 70-75% starch and protein) are popular across several product categories (e.g., donuts, noodles, breaded products) and culture-specific product variations within each category (e.g., the donut-style beignet in France, churros in Spain, youtiao in China) have made deep-fried foods based on wheat flour ubiquitous worldwide. These products, however, typically have a high fat content (ca. portion) and thus, high energy density . Numerous systematic reviews highlight a concerning association between the excessive caloric content in deep-fried
products and detrimental health conditions associated with their (over-)consumption . Moreover, the high temperatures involved in the deep-frying process facilitate chemical reactions that produce acrylamide, a compound classified as a probable human carcinogen, thereby raising potential health risks with regular consumption . Current World Health Organisation (WHO) dietary guidelines recommend limiting total fat intake to of the total energy intake . Though obtaining deep-fried food products with desirable organoleptic characteristics and adequate nutritional profile remains a challenge for the food industry, it is ever so more essential as health-related issues associated with their consumption and scrutiny over processed food materials has continued to grow in recent years .
The structural properties of deep-fried porous food matrices develop during deep-frying (in part) due to the rapid phase conversion
of water to steam which causes gas cells to form and fill with steam. The consequent increase in internal pressure results in the expansion and deformation of the internal structure before steam eventually escapes at the surface . The resulting porous solid matrix (hereafter referred as the microstructure) varies spatially across the fried product and features a broad distribution of pore volumes and thicknesses of the solid walls . Although the mechanism(s) dictating and/or influencing oil absorption during and after the deep-frying process have been previously reported , the dynamics of these processes as well as their contribution to the final product oil content are still not fully understood. This is likely due to the highly complex and intense nature of the deep-frying process, as related to the rapid and simultaneous heat and mass transfer phenomena, which have made in-situ studies necessary to underpin the proposed hypotheses challenging.
Early studies regarded oil uptake purely as a surface phenomenon and highlighted the importance of surface properties (e.g., surface roughness , geometry , permeability to oil ) in influencing adhesion of frying oil at the surface of deep-fried products . Today, it is generally accepted that oil uptake is a pressure driven phenomenon. Positive internal pressures developing during water evaporation and product expansion inhibit oil ingress during deep-frying. During cooling, vapour condensation provides a favourable pressure gradient for the absorption of oil present on the surface of the food into the internal matrix . Several experimental studies and numerical models focused on oil uptake dynamics have demonstrated oil ingress to primarily occur after removal from the frying oil. Additionally, oil uptake in the crust micropores has been ascribed to changes in capillary pressures, indicating the crucial role that the pore network morphology (e.g., porosity , pore size ) and in turn, microstructural changes during the deep-frying process, may have on the dynamics of oil absorption . The extent of these microstructural changes depends on the product composition (e.g., moisture content ), starch and protein properties , and frying conditions (e.g., oil temperature , frying duration ). Recently, the relationship between product microstructure and oil-absorption during deepfrying has been investigated to better understand deep-frying induced oil absorption behaviour . However, due to the previous inability to study the deep-frying process in real time, specific and direct relationships between the evolving 3D microstructure and oil uptake are currently lacking . Establishing a link between these phenomena is deemed essential to further understand deep-frying induced oil absorption in food materials.
Wheat-flour dough (WFD) is formed by hydration of flour particles and kneading-induced mechanical stresses which lead to the development of a distinct cross-linked viscoelastic gluten network which surrounds starch granules and entraps gas pores (gas cells) therein . The microstructural properties of deep-fried WFD-based foods are strongly related to the physicochemical changes and phase transitions (e.g., glass transition) of both starch and gluten proteins that occur during the process . Starch granules swell and gelatinise during deep-frying, thereby exhibiting altered morphological properties (e.g., disruption and/or aggregation of granules) . It has also been shown that deep-frying induced product deformation characteristics are strongly influenced by the gluten content, with WFD systems of higher gluten content exhibiting lower oil uptake . Furthermore, the microstructural changes and oil uptake likely also depend on the moisture content .
Monitoring the microstructural changes of WFD-based systems during deep-frying and subsequent cooling can assist in linking the transformations taking place in this complex food formulation with oil absorption behaviour induced by the deep-frying process. State-of-the-art imaging techniques (optical light microscopy , scanning electron microscopy , confocal laser scanning microscopy ) have been extensively utilised for exploring the microstructure of deepfried foods, analysing pore structure in crust and core regions, and
locating oil inside these products . Non-destructive imaging has become feasible using magnetic resonance imaging and X-ray microcomputed tomography , with the latter providing significantly higher spatial resolution to characterise the microstructure, although the dynamics of the process have never been captured completely . The brilliance of synchrotron light sources enable acquisitions at spatial and temporal resolutions that are magnitudes higher than those currently achievable in lab-based settings . 4D imaging has been used at lower temporal resolutions to gain valuable insights into processes such as bread dough fermentation , bread baking , and freeze-drying kinetics . Given the added flexibility in terms of experimental setups, these are attractive for investigating and uncovering theories related to the deep-frying process.
Here, we developed and applied time-resolved X-ray computed tomography in a synchrotron setting to visualise the deep-frying process under real-world conditions. An in-situ deep-frying setup was constructed and operated remotely with precise controls over sample positioning, oil frying temperature and deep-frying time during imaging. The 4D aspect of this study facilitated quantitative evaluation of the dynamics of oil uptake and spatial distribution inside WFD-based formulation during and after deep-frying. High-speed dynamic imaging optimised for both temporal and spatial resolution enabled the study of changes in the 3D porous microstructure, oil content and oil distribution in WFD deep-fried at different temperatures. Complimentary measurements monitoring the temperature and moisture content (MC) evolution of WFD are used to elucidate the microstructural changes observed by tomography. The knowledge gained through these experiments stands to enhance the understanding of oil uptake behaviour and pore morphology development throughout the deep-frying process and thereby, enhance the understanding of factors that impact the rapidly changing microstructural dynamics of foods undergoing this process . The learnings open doors for future investigations on how product formulations or processing parameters can be tailored to manufacture deep-fried food products that align with consumer sensory expectations and health guidelines.
Results
4D (three spatial dimensions and time) was performed to study the microstructural changes and oil uptake dynamics at various time points during 56 s of the deep-frying process and subsequent 63 s of the post-frying cooling of WFD samples ( moisture content). Different deep-frying temperatures ( 180,150 and ) were considered which resulted in distinct microstructural changes during deep-frying and thus enabled understanding the influence of process conditions on porosity development and consequent oil uptake dynamics. The moisture content was determined at various stages of the deep-frying process to evaluate how moisture loss dynamics at different deepfrying temperatures relate to the observed microstructural changes. Furthermore, local temperature profiles were measured beneath the surface (representing the crust regions) and at the centre (representing the core regions) during deep-frying and post-frying cooling to monitor the evolving temperature gradient, including the advancement of the evaporation front, and its effect on structure deformation.
High-speed dynamic imaging was carried out on the ID19 beamline at European Synchrotron Radiation Facility (ESRF, Grenoble, France) capable of ultrafast tomography at high spatial resolution . To place results from the time-resolved investigation in context, the WFD samples were imaged before deep-frying using lab-based (see “Methods”). Samples containing 50 mg dry matter (DM) were fitted into a sample holder to create images with a voxel size of during deep-frying and during subsequent ambient cooling. Figure 1a shows the scheme of a custom experimental setup equipped with remote vertical sample manipulation in a synchrotron tomography setting, with the actual setup
Fig. 1 | Schematic overview of the fast in-situ synchrotron x-ray tomography setup. a Experimental setup at the ID19 beamline of ESRF (Grenoble, France). A filtered white X-ray beam passes through the rotating sample while transmission radiographs are collected by a fast sCMOS indirect detector system; b Experimental setup mounted on the rotation stage for fast acquisition, (inset) the sample container is fixed to the linear actuator for remote sample manipulation during and after the deep-frying process; c Radiographs captured at six successive
timepoints over the acquisition period, subsequent reconstructed volumes comprised of greyscale cross-section images; d Representative horizontal crosssections from the reconstructed 3D volumes (at time points 1 s and 34 s during deep-frying) with different phases annotated based on the intensity value, corresponding segmentation on the greyscale intensity histogram with intensity ranges marked in distinct colours for identification of phases, solid (red), oil (yellow), gas (blue), TSC (green), influenced by their attenuation characteristics.
pictured in Fig. 1b (for detailed description of setup operation and acquisition protocol, see “Methods”). Using filtered back propagation reconstruction with phase retrieval (Fig. 1c), 3D volume images were obtained that render the porous microstructure contrasting the solid matrix, gas or oil filled pores and frying oil in addition to the Teflon sample container (TSC) (Fig. 1d). Here, the highly attenuating solid phase (representing the deep-fried WFD) appears brighter in the tomograms, thus enabling the separation from the lowly attenuating gas, whereas the oil phase lies in-between these two phases due to differences in X-ray attenuation and phase effects. The phases were not differentiated based solely on their greyscale intensity thresholds, but together with spatial and temporal context at different stages during acquisition. As the sample expanded during deep-frying, the space it occupied increased due to increasing gas volume (representing increased histogram fraction) thus displacing the oil volume (representing a decreasing histogram fraction).
Rapid pore expansion during deep-frying deforms structure
The images of the WFD samples before deep-frying revealed the dough material phase with uniformly distributed gas-filled pores (Fig. 2a), more commonly termed as gas cells in cereal research . Gas
pores occupied of the volume with ca. mean pore size diameter, ranging from 5 to (pore size distribution shown in Supplementary Fig. 1).
Horizontal cross sections of WFD samples undergoing structural change during deep-frying at are presented in Fig. 2b, the accompanying Fig. 3 shows the corresponding vertical cross-sections. Upon initial contact of the WFD sample with the frying oil (i.e., 1 s after immersion), the dense microstructure consisting of numerous, small gas-filled pores was still visible and resembled the structure of the nonfried WFD sample. At this stage of deep-frying, convective heat transfer from the hot frying oil merely results in superficial boiling, initiating the instantaneous conversion of water to vapour and formation of steam bubbles at the surface .
Through continued heat conduction inside the sample, the temperatures below the surface rapidly approached the boiling point of water, while heat conduction progressed more slowly into the centre (Fig. 4b). As a consequence of the increased steam generation and rising gas pressures, deformation was initiated by expansion of preexisting pores, essentially serving as nucleation sites. The structure expanded during the early stages of deep-frying (i.e., between 1 and 13 s ) and was transformed into a highly porous solid matrix (Fig. 3a). Parts of the starch-gluten network were observed to rupture under
Fig. 2 | Microstructure development in WFD samples during deep-frying at . a Reconstructed slice of the WFD sample before deep-frying exhibiting a homogeneous structure incorporating uniformly distributed gas-filled pores; b Reconstructed slices of the changing microstructure over the course of deepfrying; c Regions of interest (yellow squares) in the X-ray CT slices at different deep-
frying times: (1) formation of large pores at the edge of samples subsequently compressed under internal expansion of pores, (2) localised oil ingress through ruptured walls of open pores at the surface during late stages of deep-frying. Scale bars indicated in ; time labels denote observations during deep-frying period, subscripts denote the time in seconds.
continued expansion, thus forming large pores as smaller adjacent gas pores coalesced. At this stage, the moisture content was DM ( , Fig. 4a) indicating that the sample had lost a small portion of water. Moisture was primarily removed through vaporisation at the surface, where it was convected away by the oil . Internally, as vapour pressure increased due to evaporation at pore-matrix interfaces throughout the material, moisture gradually diffused from regions of higher saturation towards the surface . This thus substantiates that persistent volumetric expansion induced by water evaporation and consequent enlargement of steam-filled pores inside the WFD solid structure increasingly exerted more forces on the internal walls resulting in thinning of the solid matrix.
Between 19 and 23 s , the temperatures in the crust plateaued at around for a brief period before increasing at a slower rate thereafter (Fig. 4b). This brief period where temperatures in the crust plateaued suggests that the evaporation front advanced to the core regions once sufficient moisture was removed from the crust. Expansion in the core regions continued as temperatures level to (Fig. 4b), simultaneously pushing the surface layers against the inner walls of the sample holder (observed from 23 s onwards in Figs. 3b and 2c) indicated a high flexibility of the biopolymer constituents hampering vapour escape at the surface during the early stages of deepfrying .
Temperatures steadily increased above in the crust, while stabilising around the boiling point of water in the core (Fig. 4b). Prolonged moisture loss , Fig. 4a) prompted the formation of a distinct region representing a crust-like structure after 34 s of deep-frying (Fig. 2c). Moisture migration from the core to the crust continued through a combination of pressuredriven convection and capillary diffusion for both vapour and liquid
water , while moisture was continually removed from the crust through diffusion and convection of vapour. Crust formation was facilitated by the slower moisture migration from the core compared to the rapid vaporisation at the surface . The crust was largely composed of numerous small, flattened pores with thick walls, while the core region consisted of larger irregular pores with thin walls. Expansion inside the highly porous structure successively slowed down between 45 and 56 s of deep-frying, which was attributed (in part) to the substantial loss of moisture (final , Fig. 4a) and the increased structural rigidity of the biopolymers in the WFD system . The majority of internal heat flow was directed towards converting liquid water to vapour by boiling observed by the continued core temperature plateau at . Studies on the microstructure of potato-based products have attributed the formation of small pores in the crust to sample shrinkage induced by moisture loss after prolonged deep-frying . However, dynamic imaging of the deepfried WFD system here shows that these small pores are formed due to the expansion of the core regions and the subsequent compression of pores below the surface.
Starch and gluten in the samples progressively undergo structural transformations during deep-frying . In the WFD system, despite starch being a major component, the structure is primarily supported by the viscoelastic gluten network due to the extensive structural changes that occur during deep-frying . However, it was recently shown that the transition of potato starch (in potato starch-water model systems) from the rubbery state, after gelatinisation, to the glassy state, is necessary to maintain the expanded structure due to frying-induced water evaporation . Changes in the moisture content of the sample at different stages of deep-frying, together with temperature measurements in the crust and core, provides additional
Fig. 3 | Vertical cross-sections of reconstructed images highlighting microstructure development in WFD samples during in-situ deep-frying at .
a Reconstructed images follow the expansion of WFD structure during the first 21 s (observations every 4 s ) after immersion in hot oil; Reconstructed images follow
the development of WFD microstructure during 56 s of deep-frying (observations every 11 s ). Scale bar indicated in ; time labels denote observations during deep-frying period, subscripts denote the time in seconds.
insights into the conditions underlying structural transitions inside the WFD system. Through heating, the temperature increased to the boiling point and water evaporated. Temperatures in the crust increased from and reached by the end of deepfrying. Continued loss of moisture and increasing temperatures below the surface led to a rigid crust after transitioning into a glassy state . In the core, temperatures stabilised at with steam trapped inside the structure, suggesting that the amount of moisture in this region was sufficient for the biopolymers to remain in a rubbery state, thereby supporting structure expansion induced by steam generation. Image data depicting structure expansion during deep-frying reveals minimal structure alteration of hardened surface regions while the central regions continually deform (Fig. 3), indicating a difference between the physical states of crust and core regions at the end of 56 s of deep-frying.
The pressure exerted by escaping gases from continuous vapour generation during deep-frying inhibits oil entry into the structure . In addition, the absence of suitable pathways from the crust to core regions also significantly impeded oil uptake below the surface even after extensive structural deformation during deep-frying. Pores present in the outer crust regions were distinctly disconnected to the core regions of the sample, as seen from the labelled pore space in Supplementary Fig. 2. Even when oil was detected in pores near the surface, it was unable to penetrate further into the sample indicating lack of connectivity to other adjacent pores as seen compressing during internal expansion (Fig. 2c). This oil ingress likely corresponds to socalled ‘structural oil’ entering the food matrix during deep-frying .
Post-frying oil uptake
Extensive structure deformation during deep-frying and the microstructural characteristics at the end of the process serve as the basis for understanding the mechanisms by which oil uptake occurs during the cooling phase immediately after deep-frying. Here, the 3D images
captured post-frying were segmented with the help of machine learning assisted pixel classification in Ilastik v1.4.0 (Fig. 5 shows the image processing workflow, for detailed description see “Methods”). The aim of segmentation was to quantify the amount and location of oil in the porous structure as well as to analyse the connectivity of pores across the fried sample volume. The classifier accounted for the uncertainty in assigning labels (as seen from the uncertainty map in Fig. 5) , which was considered as an additional uncertainty range in the calculated segmented volumes of the different phases (see “Methods”). Through segmentation, the different phases (oil, gas, and solid matrix) were separated and quantified (volume fractions and porosity presented in Table 1). Furthermore, volumetric renderings of the samples deep-fried at (Fig. 6a) provide a spatial representation of the changes in oil distribution during cooling. The morphological properties of the crust (considered as a 0.5 mm thickness subsurface layer) and core (remaining internal regions) were evaluated by using the local structure thickness of the solid gas cell walls (presented in Supplementary Fig. 6 and Supplementary Table 1) and pore size distributions (Supplementary Fig. 7a).
After removing the samples from the frying oil, the internal temperatures began to drop. The rate of temperature decrease varied significantly between the crust and core, with the crust cooling faster than the core (Fig. 4b). It is of note that the core temperatures did not fall below during the post-frying cooling phase assessed here (i.e., 63 s ), as the crust insulated the core regions. After 8 s of cooling, the WFD sample displayed a highly porous, thin-walled microstructure that resembled the structure at the final time point of deep-frying. The structure presented ca. of the characterised volume as the oil fraction and exhibited a gas porosity of ca. 44.2%. As shown in Fig. 6a, oil content increased during the cooling period as surface oil and oil available in the sample holder was gradually pulled into the structure (rising to ca. after 63 s , see Supplementary Fig. 3). No noteworthy structure deformation was observed throughout the
Fig. 4 | Moisture content and temperature measurements of WFD samples.
a Moisture content of non-fried ( 0 s ) and deep-fried ( ) WFD samples with initial hydration levels of deep-fried at different temperatures ( in green, in orange and in purple). MC is calculated on an oil free dry matter basis , where mass ( ) is expressed in grams and DM is the dry matter of the dough in grams. Means are calculated over six measurements, error bars represent standard deviations; Local temperature measurements inside the
WFD samples during deep-frying and post-frying cooling at different oil temperatures (b-180 , and ). The temperature measurements correspond to the deep-frying and post-frying cooling phases, separated by a vertical dotted line, and aligned with periods of 4D observations. Each plot presents mean temperature profiles in the crust and core regions inside the samples, shaded regions represent the standard deviation across five or seven measurements.
cooling period (gas porosity in Table 1), confirming that the solid matrix formed during deep-frying was sufficiently rigid to resist any significant structural collapse. It has been reported that, as temperatures drop, gas expulsion from the surface stops due to negative gauge pressures induced by condensing vapours , which subsequently pulls oil into open pores at the surface. However, in the WFD samples the temperatures stayed above in both the crust and core regions at the end of 63 s during cooling. Although the oil uptake associated with the vacuum effect from condensing vapours cannot be completely ruled out, it is more likely that the observed oil uptake was primarily driven by capillary action in the small crust pores, as the vapour pressures inside these pores could not drop below the atmospheric pressure. In tortilla chips, oil content was also found to be primarily influenced by small pores exerting great capillary action
before condensation occurs . The crust comprising of mostly small, connected pores (pore size distribution shown in Supplementary Fig. 7a) was saturated with oil .
Pore connectivity
The 3D volume renderings during cooling show most of the oil concentrated in pores below the surface, with small amounts of oil detected in the core having high prediction uncertainty during segmentation (Fig. 6a). Labelling the segmented images provided a means to indicate connectivity of pore volumes and revealed that pore-filling progressed gradually through discrete sub-networks of connected pores (Fig. 7a). These findings also confirmed that oil uptake was mainly limited to the outer crust region of the sample (see Supplementary Fig. 3). During deep-frying the pore-space
Fig. 5 | Image processing workflow for the post-frying cooling X-ray CT dataset. a of the greyscale cross-sectional images from the reconstructed volumes of each replicate were imported into ilastik using the ilastik4ij plugin (https://github. com/ilastik/ilastik4ij) in Fiji. b A pixel classification model was trained iteratively for different timesteps by manually annotating the different phases: deep-fried solid WFD (grey), oil (yellow), gas (blue), and TSC (pink), while minimising uncertainty in
class predictions. Probability maps for the phases were generated for the complete volumes and subsequently segmented using a thresholding probability to obtain the segmented image stack. c Ambient occlusion and other morphological operations were applied on the segmented images to isolate the sample boundaries and separate the individual phases for quantification. Scale bar indicated in .
continually expanded in the core region and compressed pores in the outer regions of the structure, resulting in a higher frequency of smaller pores in the crust (see Supplementary Fig. 7a). The minimal pore connectivity between the crust and the core due to an intact wall network prevented large amounts of oil from penetrating deeper into the structure, with most of the oil identified in small, compressed pores near the surface. Perhaps the most important finding with an implication for oil uptake is that the connectivity of the pore network below the crust was altered due to the continued
internal expansion during deep-frying (as seen in Supplementary Fig. 2).
Microstructure and oil uptake influenced by oil temperature
Figure 8 shows the microstructure development of the samples during deep-frying at (Fig. 8a) and (Fig. 8b). Similar to what had been shown when deep-frying at , structure expansion initiated from the pre-existing gas cells present in the non-fried dough. However, gas cell sizes increased at a notably slower rate in these samples
Table 1 | Oil content and porosity of fried wheat flour dough (WFD) formulation with moisture content evaluated during post-frying cooling
Oil temperature
Cooling time (s)
Volume fraction of oil (% oil/sample volume)
Volume fraction of oil (% oil/solid)
Gas porosity (%)
Total porosity (%)
8
4.47 (2.72)
7.90 (4.67)
44.20 (1.90)
48.67 (1.77)
19
4.32 (1.65)
7.76 (2.79)
45.01 (2.18)
49.33 (0.79)
30
9.28 (0.75)
16.39 (1.05)
43.43 (1.55)
52.71 (1.11)
41
14.97 (0.40)
42.87 (1.12)
51.42 (1.18)
52
12.33 (0.40)
22.30 (0.78)
44.68 (1.23)
57.02 (1.21)
63
14.42 (1.34)
24.04 (1.76)
40.09 (1.25)
54.51 (0.17)
8
8.12 (1.13)
11.66 (1.82)
30.16 (1.22)
38.28 (2.35)
19
10.66 (0.79)
14.70 (1.72)
27.09 (3.15)
37.75 (3.94)
30
10.73 (1.12)
13.06 (1.87)
17.40 (3.37)
28.12 (4.43)
41
11.88 (1.02)
13.87 (0.30)
14.42 (5.94)
26.30 (4.95)
52
12.22 (0.43)
14.24 (0.63)
13.97 (5.39)
26.20 (5.09)
63
12.20 (0.90)
14.29 (1.31)
14.36 (4.60)
26.56 (4.75)
8
1.15 (0.34)
1.53 (0.51)
24.13 (3.71)
25.28 (3.93)
19
1.08 (0.34)
1.30 (0.41)
17.29 (2.36)
18.36 (2.37)
30
13.35 (1.74)
14.44 (1.51)
41
1.32 (0.62)
11.39 (1.65)
12.58 (1.21)
52
1.43 (0.70)
10.68 (1.48)
11.96 (0.96)
63
1.28 (0.71)
1.41 (0.76)
10.21 (1.48)
11.49 (0.84)
Values represent the mean ( ) with standard deviation presented in brackets. Values in the same column are significantly different ( ) when not sharing the same lower-case alphabetic character.
compared to those deep-fried at (see Supplementary Fig. 4). This delayed expansion is attributed to the slower steam formation at lower deep-frying temperatures since heat conduction inside these samples progressed at a slower rate. Internal thinning of the solid matrix continued from sustained expansion in the core regions. Temperatures within the samples did not exceed (Fig. 4d) and (Fig.4c) when deep-fried at and , respectively. The more uniform temperature distribution observed in these samples, compared to those deep-fried at , resulted from coupled heat and mass transfer mechanisms in the deforming structure. Slower heating occurred due to lower convective heat transfer coefficients at the surface, leading to lower vapour pressures, reduced surface water loss, and incomplete liquid water evaporation . Consequently, the temperatures did not rise above the boiling point during deep-frying, allowing for a more uniform temperature distribution within the sample. In contrast, deep-frying at resulted in significant temperature gradients between the crust and the core, driven by higher heat flux, increased vapour pressures, and rapid vaporisation at the surface .
Comparing the microstructures of deep-fried (56 s) WFD samples at and , those deep-fried at presented a more uniform pore morphology without a distinct crust (see Supplementary Fig. 4a). As the internal temperatures of samples deep-fried at did not reach the boiling point of water, the structure did not show signs of extensive deformation including thin wall rupture (Supplementary Fig. 4a). The higher residual moisture content after deepfrying (final , Fig. 4a) suggests that most internal regions still existed in a rubbery state, preventing any apparent rupture of the thin-walled structures in the core. Moisture loss occurred at the surface through low equilibrium vapour pressures and low convective heat transfer coefficients . The smaller temperature difference between the surface and the core regions indicates negligible water vapour gradients, suggesting that internal moisture migration was slow and driven by diffusion . On the other hand, the microstructure in WFD samples deep-fried for 56 s at revealed a structure with larger, irregular pores formed due to the rupturing thin walls of the solid matrix and more advanced gas cell coalescence (see
Supplementary Fig. 4b). A distinct, thick crust was observed in Fig. 8b with small, flattened pores analogous to the crust microstructure of WFD deep-fried at (Fig. 2b). Heat flow was faster than at but slower than at . The slower increase in surface temperatures during deep-frying at reduced the overall moisture loss from the crust compared to deep-frying at . This resulted in higher residual liquid water content throughout the process (final DM Fig. 4a), as evidenced by the temperature plateau around the boiling point of water in both the crust and core (Fig. 4c).
No significant oil ingress was observed during deep-frying in samples deep-fried at low temperatures (see Supplementary Fig.4). Oil temperature significantly affected the moisture loss kinetics in WFD samples due to differences in the rate of heat conduction (Fig. 4). Gradual internal structure expansion was observed at temperatures approaching the boiling point of water, as a result of slow vapour generation. Similar microstructural features were seen among samples deep-fried at after 12 s (Fig. 3b), after 23 s (Supplementary Fig. 4b) and after 34 s (Supplementary Fig. 4a) with moisture content measuring at DM in all samples (Fig. 4a). At temperatures around , more violent structure deformations such as formation of large pores and thin wall rupture were induced by continuous evaporation and increasing vapour pressure inside the structure. This was apparent from the reconstructed images for samples deep-fried at after 23 s (Fig. 3b) and at after 45 s (Supplementary Fig. 4b), which corresponded to similar moisture content values of for and for (Fig. 4a). The slower rate of moisture loss in samples deep-fried at , compared to those at , can be attributed to the lower convective heat transfer coefficients and lower equilibrium vapour pressures .
After removal from the hot oil (i.e., 8 s of cooling), the WFD samples deep-fried at and preserved their porous microstructures (Fig. 6), thus resembling the structures observed at the final time point of deep-frying (Fig. 8). However, these samples progressively collapsed during the cooling period, shrinking to less than half of their initial gas porosity (Table 1) as the internal core
Fig. 6 | 3D volume renders of WFD samples during the post-frying cooling period. Rows correspond to WFD samples deep-fried at different temperatures (a and ). a Oil was observed invading the small pores in the distinct crust region of the sample. Internal segmented oil spots are associated with high uncertainty levels; b Samples fried at . Here, the structure collapse was accompanied by oil content rising with decreasing gas porosity; c Samples fried at . The structure collapsed over the observed duration, but the oil content stayed relatively constant with decreasing gas porosity. Scale bar indicated in m; segmented phases depicted as deep-fried solid WFD (grey), oil (yellow), and gas (blue); time labels denote observations during cooling after retraction from oil, subscripts denote the time in seconds after retraction from oil; denotes volume fraction of oil; denotes gas porosity.
collapsed (see Supplementary Fig. 5 and Supplementary Table 1). This phenomenon was likely related to the sustained rubbery state of biopolymers due to higher residual moisture (final DM, DM Fig. 4a) resulting from steam accumulation inside the core regions of the structures during deep-frying. Core regions lacking sufficient rigidity were unable to maintain the expanded shape as steam condensation induces negative vapour pressures due to reducing temperatures during cooling .
Analysis of the morphology in the separated crust and core regions in comparison to WFD samples deep-fried at reveals significant differences ( ) in the structure collapse behaviour of WFD samples deep-fried at and (Supplementary Table 1). The frequency of smaller pores ( ) increased significantly after collapse in both crust and core regions (Supplementary Fig. 7b, c). In
samples deep-fried at , the distributions of local cell wall thickness in the ‘crust’ and ‘core’ regions were virtually indistinguishable (Supplementary Fig. 6). The average structure thickness in the evaluated ‘crust’ regions was significantly different ( ) compared to the crust regions of the samples deep-fried at and (Supplementary Table 1), further supporting the observation that no distinct crust was formed in these samples during deep-frying. In contrast, in the samples deep-fried at , the average structure thickness of the crust at 8 s was not significantly different ( ) from the crust in samples deep-fried at at 8 s (Supplementary Table 1), confirming the presence of a rigid crust. Furthermore, during collapse, the shift in the distribution of local structure thickness towards thicker pore walls was notably slower in the crust than in the core, indicating that portions of the crust were more rigid than the core regions.
Fig. 7 | Horizontal cross-sections images of segmented and labelled oil-phase from in-situ X-ray CT during post-frying cooling. Rows correspond to WFD samples (depicted in grey) deep-fried at different temperatures ( , b and ). The segmented pores are labelled using a repeating categorical colormap where the same label colour of adjacent objects represents
depicts a connected oil phase. The progression over time provides an overview of oil entering the internal regions of the sample through connected pores. Scale bar indicated in ; time labels denote observations during cooling after retraction from oil, subscripts denote the time in seconds.
Similar to the samples deep-fried at , most of the oil absorption in samples deep-fried at lower temperatures occurred during cooling. Changing capillary pressures in crust pores and vapour condensation from temperatures decreasing below inside the sample during cooling are both expected to have contributed to oil uptake. The samples deep-fried at experienced significantly lower ( ) oil uptake across all samples due to the limited interconnectivity of pores at the surface due to lack of a distinct crust formation during deep-frying (Fig. 7c). Extensive structure collapse led to shrinking of pores inside the sample and collectively hindered oil ingress during cooling (Table 1 and Supplementary Fig. 7). In contrast, samples deep-fried at displayed oil penetration in pores further below the crust during cooling (Fig. 7b). As the structure collapsed, pore connectivity between the crust and core was disrupted. The presence of a rigid crust led to the formation of surface-connected pores that extended deeper into the sample, allowing greater amounts of oil to enter below the crust (Fig. 6b).
Discussion
Despite growing health consciousness among consumers, deep-fried foods remain popular in the global snack market. Their high caloric density, resulting from oil uptake during the deep-frying process, has significant implications for both consumers with preferences for lowfat products and formulation strategies within the food industry. Innovations in healthier frying techniques and the formulation of new deep-fried products with reduced fat content require fundamental knowledge of the mechanisms governing oil absorption dynamics. However, the mechanisms resulting in deep-frying-induced oil uptake have been difficult to substantiate (much less visualise) due to the highly complex and intense nature of the process .
We demonstrated that high speed time-resolved X-ray tomography can be a useful technique for dynamic in-situ visualization of the deep-frying process and presented a comprehensive study exploring the spatial (in three dimensions) and temporal changes in
microstructure during and after deep-frying and its impact on oil absorption dynamics. The effect of different frying temperatures was used to study differences in the structure deformation, oil uptake, and the development of crust and core regions in a model wheat flour dough (WFD) system.
The current study addresses the limitations of previously used imaging methods in this research domain (e.g., CLSM, SEM) that lack the combined spatial and temporal resolution necessary to capture this highly dynamic process. Using a bespoke, compact experimental setup with adjustable temperature control and remote operation in a synchrotron setting, we eliminated the need for sample manipulation during and after deep-frying. Additionally, optimised spatial and temporal resolutions enabled fast acquisition at 1 tomograph per second, allowing us to resolve critical features of the evolving internal microstructure and capture previously unobservable events, such as the influence of pore connectivity on oil uptake. This technique facilitates relatively easy adjustments to the acquisition protocol in terms of frying conditions (duration, temperature), spatial and temporal resolution, allowing for the investigation of specific phenomena related to the deep-frying process.
Despite the clear advantages offered by the presented technique, certain limitations remain. First, the water phase was not resolved in the images and was lumped together with the solid matrix due to complex interactions between the sample constituents, which made it challenging to validate established moisture loss mechanisms . However, ongoing improvements in state-of the-art instrumentation at neutron sources are generating interest in the combined use of fast neutron and X-ray imaging . The higher neutron sensitivity of hydrogen atoms holds great potential for visualising moisture transport in deforming media, such as during deep-frying .
Second, motion artefacts hindered phase segmentation of images captured during deep-frying. Balancing the spatial and temporal resolution, alongside data processing demands remains a key challenge. However, innovations in rotation free X-ray multi-
Fig. 8 | Microstructure development in WFD samples during deep-frying at and . a Regions of interest (yellow squares) in the X-ray CT slices of samples fried at : (1) Transformation of the dense sample into a highly porous microstructure with thin-walls and relatively uniform pore size, (2) Evolution of preexisting pores in the sample during expansion; Regions of interest (yellow squares) in the X-ray CT slices of samples fried at : (1) Transformation of the
dense sample into a highly porous microstructure with small and large pores supported by thin-walls, (2) Evolution of pre-existing pores in the sample during expansion subsequently compressed by continued expansion of internal regions; (3) Formation of the thick crust subsequently comprising of small pores compressed under internal expansion. Scale bars indicated in ; time labels denote observations during deep-frying period, subscripts denote the time in seconds.
projection imaging are showing promise in capturing ultra-fast phenomenon .
Third, oil uptake that may be occurring in the small nano-pores remains undetectable at current voxel resolutions. This could be improved by using a more tailored setup and sample environment to enable higher sensitivity, contrast and spatial resolution, particularly with pink beam imaging . While reliance on synchrotron light sources currently limits accessibility, rapid advances in lab-based systems and iterative reconstruction algorithms hold significant promise for broader application of this technique for similar applications in food processing .
Finally, the WFD model system represents a similar class of products (e.g., donuts, noodles). Applying this technique to more traditional potato-based products (e.g., French fries, potato chips) and breaded foods under varying experimental conditions will provide valuable insights transferable to other mass-consumed products. Food microstructure analysis using various imaging techniques has already contributed to significant advancements across different product types . As in-situ imaging methods continue to evolve, they are likely to enable further breakthroughs. While the current limitations pose challenges, they also present opportunities for future improvements and innovations.
The large amounts of time series data generated during imaging make machine learning assisted segmentation indispensable for the processing and segmentation of the different phases for quantification of important parameters during post-frying cooling. Uncertainty in
prediction maps during classification, especially at phase transition boundaries, is unavoidable. Validation steps, including visual crosschecks between segmented datasets and corresponding grey-scale images, with a human-in-the-loop during training, were applied to minimise errors. Advances in deep learning algorithms for segmentation of large imaging datasets are expected to further improve segmentation accuracy . Moreover, image analysis offers distinct advantages over traditional methods such as nitrogen adsorption (NAM) and mercury intrusion porosimetry (MIP) for evaluating pore characteristics. These techniques require extensive sample preparation, including degassing and removal of oil and moisture, which can induce irreversible changes to the sample microstructure (e.g., shrinkage), potentially leading to discrepancies in measured values. NAM is effective for detecting nanopores but is not suited for characterising larger pores ( , while MIP, although useful for analysing larger pores ( ), requires high pressures for effective mercury intrusion, that can potentially damage the samples . In contrast, several studies have shown that image analysis ( ) yields results comparable to traditional analytical methods, with no significant differences in oil content and porosity measurements , confirming the reliability and accuracy of image processing for characterising these porous structures.
We were able to confirm a number of pre-existing theories related to the process, (1) continually escaping gases significantly impede oil uptake during deep-frying ; (2) higher oil temperature, and, consequently more extensive moisture loss, during deep-frying results in
higher oil uptake ; and (3) the rising trend of oil uptake during postfrying cooling . Combined with complementary tests for moisture content and temperature measurements, the present investigation provides additional insights into these underlying theories. Capillary action within the small crust pores was the primary driver of oil absorption during cooling, with vapour condensation further contributing to oil uptake as temperatures drop below . The formation of a distinct crust in samples deep-fried at and was more conducive for oil uptake due to surface openings in a deformed microstructure. Differences in structural transformation (of starch and protein constituents) due to differing rates of moisture loss from heat conduction within the samples contributed to the distinctly different oil uptake rates and oil distribution inside the microstructure. For samples deep-fried at , limited deformation during deepfrying resulted in a significantly lower final oil content due to reduced connectivity of the collapsed pore-space during cooling.
Pore connectivity analysis revealed that oil primarily filled the smaller pores in the crust regions, with restrained penetration into the core due to limited pore network connectivity and intact wall networks. However, current models lack the capability to accurately reflect changes in pore structural properties during deep-frying. The integration of 4D is expected to significantly enhance the existing modelling framework by providing high-resolution, time-resolved imaging of the dynamic changes in food microstructures and oil uptake. Equivalent pore network models (PNM) generated using segmented CT images to capture pore space geometry, have shown great promise in simulating multiphase flow at the microscale . These models similarly can be used to simulate dynamic multiphase flow and study oil imbibition while incorporating the effects of varying pore morphologies. This can lead to improved precision in macroscale and porous media models, resulting in better predictions of oil, water, and vapour transport, thereby optimising the deep-frying process.
Deep-frying not only induces physicochemical changes in food components but also in the frying medium (oil) as oil degradation has been linked to frying duration and temperature . Moreover, it is well established that the formation of acrylamide, a compound classified as a probable human carcinogen by the International Agency for Research on Cancer, accelerates at temperatures above . While this has prompted the adoption of several pretreatment techniques (e.g., pulsed electric field, ultrasound, radiofrequency, etc.) and modified frying processes at lower temperatures (e.g., par-frying and vacuum frying) , the exact influence on the product microstructure and dynamics of oil uptake remains unclear. 4D imaging can be employed to assess the effectiveness of the different preprocessing techniques in products undergoing deep-frying operations to assist with the interpretation and control of oil uptake.
Broadly, this study underscores that oil ingress can be linked to several interdependent factors, such as the rate of moisture loss, frying temperature, pore connectivity to the food surface, and structural rigidity. This presents new evidence that complements earlier results and provides new avenues for understanding and optimising deepfrying processes. To build further on this work, a multifaceted approach is advised to gain a better understanding of the relationship between deep-frying temperature and sensory and nutritional properties of the product. Furthermore, future investigations to gain insights into how other factors (e.g., food formulations, oil types, physicochemical properties of carbohydrate or protein constituents etc.) contribute to pore network connectivity are recommended as high-resolution, timeresolved imaging methods become more accessible.
Methods
Materials
Wheat flour ( moisture content and protein content) was purchased from Molens Vanden Bempt (Sint-Joris-Weert, Belgium). To 400 g flour, 175 mL deionized water was added. After a 15 min rest, the
dough was kneaded for 15 min using a Panasonic (Kadoma, Osaka, Japan) SD-25511WXE automated bread maker and rested for 70 min. Samples ( 50 mg DM basis) further referred to as WFD (wheat flour dough containing water) were withdrawn and shaped to fit inside the sample holder (TSC) before deep-frying. Sunflower frying oil was obtained from Agristo (Nazareth, Belgium), and was chosen as a frying medium due to its popularity in industrial deep-frying applications. Cylindrical TSCs were machined from Polytetrafluoroethylene (PTFE) rods in a standard configuration of 5.5 mm internal diameter and 18 mm high, with open surface area through perforations with a diameter of 0.7 mm along the surface and 17 perforations with a diameter of 0.3 mm at the bottom to allow easy exchange of fluids during deep-frying (see Supplementary Fig. 8a, b).
Experiment setup
A custom experiment setup was developed to remotely manipulate the sample in-situ during deep-frying and post-frying cooling using the synchrotron imaging setup (Fig. 1a). Frying oil was added to a round bottom flask with three parallel necks ( 500 mL , Lenz Laborglas, Wertheim, Germany); to heat and maintain the temperature of frying oil (logged using a J- type thermocouple, see Supplementary Fig. 8c), a heating mantle (WHM12033, witeg Labortechnik, Wertheim, Germany) with built-in stirring was mounted securely to the precision rotation stage. Vertical movement of the sample (to lower the sample into hot oil for deep-frying and retract the sample from oil after deep-frying) was facilitated using a linear actuator (8-inch stroke, Firgelli Automations, Ferndale, WA, USA) with a custom machined aluminium coupler (Fig. 1b) to allow interchanging TSCs between acquisitions without disturbing the setup. The stroke length for extension (ensuring full immersion of the sample holder in hot oil) and retraction of actuator shaft was controlled using a timer set at 7 s . To keep the sample stable and within the field of view (FOV) during tomography, the actuator was aligned with the axis of rotation and the central neck of the flask using an aluminium support rod ( 12.5 mm diameter) threaded to the mounting plate. Thermocouple and actuator signals were transmitted through a slip-ring in the rotation stage, facilitating remote operation of sample movement from the control hutch.
Deep-frying and post-frying processes
Before every acquisition, the frying oil was heated uniformly to (where, is the temperature of oil at 180,150 or ). The prepared sample was carefully placed in the TSC. Next, the TSC was securely attached to the actuator coupler, and, subsequently, the heating mantle was unplugged to allow free rotation of the experimental stage; in offline tests it was confirmed that the residual heat in the heating mantle was sufficient to maintain the required temperature of the oil. After completion of necessary beamline safety procedures to secure the experiment hutch (ca. 1 min ), the rotation stage was brought up to the required speed and actuator shaft was remotely extended into the frying oil. Once the sample was completely immersed in oil and stationary (ca. 1 s in oil) the acquisition protocol was initiated, with the first time point beginning at the first captured tomograph (Fig. 1d). For imaging the post-frying phase, the first part followed the same steps as deep-frying. The samples were fried for the duration of 56 s , after which the actuator shaft was retracted from the oil to its starting position. The acquisition protocol began once the shaft was stationary, and the sample was in the FOV (a delay of about 7 s had to be included between the sample being extracted from the oil to a stationary state and the first captured tomograph). Each sample was evaluated in triplicate for both deepfrying and the post-frying processes.
A filtered broad-spectrum X-ray beam provided by a wiggler insertion device was used to provide sufficiently high photon-flux density in the ID19 beamline experimental hutch located 150 m from the source .
Along the vacuum flight tube (i.e., between the source and the experimental hutch), the beam was conditioned with two sets of whitebeam slits, primary slits at 40 m from the source for heat load moderation and secondary slits for beam collimation located 140 m from the source, as well as a series of attenuators for optimisation of the onsample spectrum. The beam exposure induced heating on the sample was considered to be negligible due to the pre-existing condition of immersion in hot oil. After impinging the fast rotating sample, the transmitted beam was detected with an indirect detector assembly consisting of a scintillator, a folding mirror, objective lens and a fast sCMOS camera . Two configurations for fast in-situ tomographic visualization of the deep-frying and post-frying processes were utilised. For in-situ tracking of the pore formation during nucleation stage of the deep-frying process, the beam was conditioned with 1.4 mm aluminium and 0.8 mm diamond attenuators providing a peak energy of 30 keV . The fast indirect detector positioned 1 m away from the sample consisted of a objective lens Mitutoyo (Kanagawa, Japan) Plan Apo (NA=0.14) with a :Ce scintillator providing a resulting voxel size of and total FOV of . For the visualization of the post-frying cooling process the beam passed through 1.4 mm aluminium, 0.14 mm copper and 0.8 mm diamond attenuators providing a peak energy of 35 keV . The fast indirect detector positioned 7 m away from the sample consisted of a objective tandem lens Hasselblad) with a LuAG:Ce scintillator providing a voxel size of and cylindrical FOV of . This visualization of the cooling process was performed at a wider FOV to visualise the sample in its entirety and to obtain a contextual reference for evaluating oil uptake patterns. For both setups, the optical signal converted from the scintillator was captured using a sCMOS camera-type pco.dimax (S7, PCO AG, Germany) with a pixel count per frame of pixels, having a on-sensor pixel size and onboard memory. To capture the dynamic process at a representative temporal sampling, acquisitions were performed at fixed time intervals due to the limited onboard memory. Six full tomographs were acquired for each acquisition at 1 tomograph per second (1000 radiographs at 1 ms exposure over for each tomograph). The time spacing between each tomograph was kept at 10 s during deep-frying (denoted by ) and postfrying process (denoted by ). An additional set of observations were performed at 3 s interval spacing (denoted by ) to visualise the nucleation stage during the deep-frying process for samples fried at . Finally, to establish a reference for sample microstructure, hydrated prepared samples were placed in microcentrifuge tubes and imaged at pixel resolution using a UniTom HR X-ray scanner (TESCAN XRE, Ghent, Belgium) following the acquisition protocol described in Riley et al. .
Image processing and analysis
Image reconstruction was performed with the gold-standard filteredback projection algorithm incorporating single distance phase retrieval using in-house developed software, Tomwer v1.0.0 (https:// gitlab.esrf.fr/tomotools/tomwer). The 3D topographies for each acquisition time point were reconstructed taking into account parameters such as centre-of-rotation alignment, single material complex refraction index ratio [delta/beta = 1000 (frying), 6000 (post-frying)] and ring artefact removal to obtain cross-section image stacks of 3D distribution of material phases. The transmitted beam detected by the detector assembly was attenuated not just by the individual sample constituents, but also by the borosilicate glass (flask) and a significant volume of hot frying oil. Owing to propagation-based phase contrast contribution thanks to (partial)spatial coherence of the impinging radiation, sufficient sensitivity was obtained to distinguish between four different phases within the 3D reconstructed phase fields: gas, oil, sample, TSC. Subsequently, images were imported in Avizo 3D 2021.2 (FEI Thermo Fisher Scientific, Waltham, MA, USA) for further image
processing. The reconstructed 32-bit volumes were cast as 16-bit considering intensity values in the volume histogram to subsequently characterise the phases of interest. Following this, a 3D non-local means filter was applied to denoise the image while preserving thin structures.
As individual phases affected the absorption characteristics of Xrays, phases were characterised using their respective intensity values based on their distinct attenuation characteristics arising from differences in atomic number and density along with spatial and temporal context from time-series data at different stages during acquisition . For example, from the images and grey intensity histograms in Fig. 1d we identified oil in contact with the sample inside the TSC at followed by subsequent expulsion of oil in later timepoints and used the corresponding attenuation coefficient to identify oil in the sample. The order of greyscale intensities (from bright to dark) followed TSC > solid > oil > gas. Here, the solid structure corresponds to the (deepfried) WFD including starch-gluten-water as the interaction between the components changed during the process. It was previously demonstrated using lab-based that the starch-water solid structure indeed exhibited higher X-ray attenuation than oil and air . As most of the water was bound by the starch and gluten components in the hydrated WFD sample, only a small proportion of free water would have been available . During deep-frying, the phase conversion of water to vapour would further render the identification of water difficult as the moisture content continuously reduced during the process (Fig. 4a). Therefore, it was not possible to identify and segment water from the solid. Other authors confirmed the challenge of separating water from the solid structure due to their similarity of effective atomic number . Due to extensive structural deformation of the sample matrix during deep-frying, certain regions underwent rapid expansion, faster than the acquisition rate leading to localised motion artefacts during reconstruction. Consequently, reliable segmentation of the acquisitions during deep-frying was not possible. Figure 1d provides an example of histogram shift during the deep-frying process as the structure deforms, the coloured regions highlight the intensity values corresponding to the different phases. Due to the inherent properties of CT acquisition, the reconstructed images are prone to gaussian noise or sub-pixel effects, thus some overlap between the intensity of the phases is to be expected. Identifiable microstructural features such as individual phases, porosity, connected pores were characterised typically based on at least double the scanned voxel size of the image .
Conversely, sample deformation was limited for the post-frying process and did not influence the segmentation. This was performed with the help of machine learning assisted pixel classification in Ilastik v1.4.0 . Sparse manual annotations were marked based on spatial context and greyscale intensities across of the reconstructed images (150 cross-sectional slices) for each timestep and for each sample group from the different deep-frying temperatures (180, 150 and ) as training data for the random forest classifier to label pixels into four classes: oil, gas, solid and TSC. The models were trained iteratively to reduce the uncertainty between classes and reduce out-of-bag (OOB) error (available in Supplementary Table 2) for the annotated pixels. As the classifier is susceptible to a higher uncertainty in regions of phase transition (i.e., boundary of two labels) compared to homogeneous parts , an additional error (ca. ) across the datasets was found in terms of class label total volumes, mainly attributed to pore-cell wall transitions. Corresponding probability maps were segmented using a global threshold set to 0.5 in MATLAB (version 2019b, MathWorks, Natick, MA, USA). In regions of high uncertainty, the probability of a pixel corresponding to either class was below 0.5, in these particular cases the pixels were left unassigned for the quantification. The segmented images stacks were then reimported in Avizo to perform several morphological operations (filter by measure, ambient occlusion etc.) to isolate the sample and
the oil inside the sample (image processing workflow presented in Fig. 5). The individual calculations of volume fraction of the three phases and porosities (total and gas) was conducted. The volume fraction of the distinct phases was calculated as:
with the volume fraction of -th phase (starch, oil, gas), the volume of -th phase, and the total volume of the sample.
The volumetric oil contents inside solid matrix were calculated in two ways: first, as the ratio of the volume occupied by the oil phase (oilfilled pores) to the volume of both oil and starch phases; and second, as the ratio of the volume occupied by the oil phase (oil-filled pores) to the total characterised sample volume. Oil uptake in the small nanopores present in the crust region was not investigated to achieve a good balance for the acquisition protocol across acquisition rate, voxel resolution and FOV considerations. Furthermore, to evaluate the connectivity of oil-filled pores inside the solid matrix, the segmented oil phase was labelled following an opening operation to prevent effects of phase-transition artefacts . The labelled pores were coloured based on the connectivity of adjacent components.
The total porosity ( ) was evaluated based on the pore volume occupied by oil ( ) and gas ( ):
The gas porosity of the non-fried samples was calculated across 3 representative volumes of .
To investigate the microstructural differences between the crust and core regions of the deep-fried samples, an outer layer with a constant thickness of 0.5 mm was separated at the surface using the chamfer distance map in Avizo. The crust and core regions were masked from the segmented dataset and pore size distribution was evaluated at 8 and 63 s during the post-frying cooling following a watershed separation.
The local structure thickness distribution (expressed in ) of the starch-gluten matrix was evaluated for the sample and the separated crust and core regions using CTAn (Version 1.18.8.0, Bruker SkyScan, Kontich, Belgium). The sphere-fitting algorithm in the 3D analysis module provided the local thickness of the structure as represented by the diameter of the largest enclosed sphere .
Determination of moisture content
The moisture content of the WFD and deep-fried samples at 180,150 , or for , and 60 s was evaluated using the AACC method 44-15.02 . Samples were deep-fried using the same experimental setup and cooled for 60 s before moisture content determination. The measurements were repeated for a total of six replicates for each of the time points. The moisture content was calculated on a dry matter basis , where mass is expressed in grams and DM indicates dry matter of the solids (excluding oil absorbed as a consequence of deep-frying).
Temperature measurements during deep-frying and post-frying
Temperature profiles inside the WFD samples during and after deepfrying were measured in the crust and core separately using a K-type thermocouple ( 0.075 mm probe diameter, RS-pro, London, UK) connected to a digital acquisition system ( 34970 A, Agilent Technologies, Santa Clara, CA, USA) recording data at a frequency of 2 Hz . The measurements in the crust and core regions were conducted near the surface for the crust (within 1 mm ) and at the centre of the sample for the core (see Supplementary Fig. 9). Temperatures were logged continuously during deep-frying and the post-frying period, same as the 4D imaging. At least five replicates were obtained for
each deep-frying temperature 180,150 , or to account for any variation in the placement of the thermocouple.
Statistical analysis
The results are expressed as mean and standard deviation of replicates. To determine whether the means were significantly different, a mixed model with one-way ANOVA was performed to determine the combined effect of frying temperature and time. A multiple comparisons test was performed using Tukey’s honest significant difference for all pairwise comparisons with the level of significance set at . All statistical analyses were performed using JMP pro 17.2 (SAS Institute, Cary, NC, USA).
Reporting summary
Further information on research design is available in the Nature Portfolio Reporting Summary linked to this article.
Data availability
The data that support the findings of this study are available from the ESRF data portal , Zenodo , and from the corresponding author upon request.
References
Gamble, M. H., Rice, P. & Selman, J. D. Relationship between oil uptake and moisture loss during frying of potato slices from c. v. Record U.K. tubers. Int. J. Food Sci. Technol. 22, 233-241 (1987).
Ziaiifar, A. M., Achir, N., Courtois, F., Trezzani, I. & Trystram, G. Review of mechanisms, conditions, and factors involved in the oil uptake phenomenon during the deep-fat frying process. Int. J. Food Sci. Technol. 43, 1410-1423 (2008).
U.S. Department of Agriculture, A. R. S. USDA Food and Nutrient Database for Dietary Studies 2019-2020. (2022).
Dana, D. & Saguy, I. S. Review: Mechanism of oil uptake during deep-fat frying and the surfactant effect-theory and myth. Adv. Colloid Interface Sci 128-130, 267-272 (2006).
Hooper, L. et al. Reduction in saturated fat intake for cardiovascular disease. Cochrane Database Syst. Rev. 2020, (2020).
Hooper, L., Abdelhamid, A. S., Jimoh, O. F., Bunn, D. & Skeaff, C. M. Effects of total fat intake on body fatness in adults. Cochrane Database Syst. Rev. 2020, CD013636 (2020).
Mottram, D. S., Wedzicha, B. L. & Dodson, A. T. Acrylamide is formed in the Maillard reaction. Nature 419, 448-449 (2002).
World Health Organization. Total Fat Intake for the Prevention of Unhealthy Weight Gain in Adults and Children. (2023).
Pagliai, G. et al. Consumption of ultra-processed foods and health status: a systematic review and meta-analysis. Br. J. Nutr. 125, 308-318 (2021).
Monteiro, C. A., Moubarac, J. -C., Cannon, G., Ng, S. W. & Popkin, B. Ultra-processed products are becoming dominant in the global food system. Obes. Rev. 14, 21-28 (2013).
Vitrac, O., Trystram, G. & Raoult-Wack, A. L. Deep-fat frying of food: Heat and mass transfer, transformations and reactions inside the frying material. Eur. J. Lipid Sci. Technol. 102, 529-538 (2000).
Moreira, R. G., Sun, X. & Chen, Y. Factors affecting oil uptake in tortilla chips in deep-fat frying. J. Food Eng. 31, 485-498 (1997).
Alam, T. & Takhar, P. S. Microstructural characterization of fried potato disks using x-ray micro computed tomography. J. Food Sci. 81, E651-E664 (2016).
Riley, I. M. et al. Impact of potato starch structural transitions on microstructure development during deep-frying. Food Hydrocoll 142, 108833 (2023).
Bouchon, P., Aguilera, J. M. & Pyle, D. L. Structure Oil-Absorption Relationships during Deep-Fat Frying. J. Food Sci. 68, 2711-2716 (2003).
Ufheil, G. & Escher, F. Dynamics of oil uptake during deep-fat frying of potato slices. Lwt 29, 640-644 (1996).
Dueik, V., Moreno, M. C. & Bouchon, P. Microstructural approach to understand oil absorption during vacuum and atmospheric frying. J. Food Eng. 111, 528-536 (2012).
Moreno, M. C., Brown, C. A. & Bouchon, P. Effect of food surface roughness on oil uptake by deep-fat fried products. J. Food Eng. 101, 179-186 (2010).
Baumann, B. & Escher, F. Mass and heat transfer during deep-fat frying of potato slices -I. rate of drying and oil uptake. LWT – Food Sci. Technol. 28, 395-403 (1995).
Albert, S. & Mittal, G. S. Comparative evaluation of edible coatings to reduce fat uptake in a deep-fried cereal product. Food Res. Int. 35, 445-458 (2002).
Liberty, J. T., Dehghannya, J. & Ngadi, M. O. Effective strategies for reduction of oil content in deep-fat fried foods: A review. Trends Food Sci. Technol. 92, 172-183 (2019).
Ziaiifar, A. M., Courtois, F. & Trystram, G. Porosity development and its effect on oil uptake during frying process. J. Food Process Eng. 33, 191-212 (2010).
Halder, A., Dhall, A. & Datta, A. K. An improved, easily implementable, porous media based model for deep-fat frying. Part II: Results, validation and sensitivity analysis. Food Bioprod. Process. 85, 220-230 (2007).
Zhang, J., Liu, Y. & Fan, L. Effect of pore characteristics on oil absorption behavior during frying of potato chips. Innov. Food Sci. Emerg. Technol. 66, 102508 (2020).
Kalogianni, E. P. & Papastergiadis, E. Crust pore characteristics and their development during frying of French-fries. J. Food Eng. 120, 175-182 (2014).
Moreira, R. G. & Barrufet, M. A. A new approach to describe oil absorption in fried foods: a simulation study. J. Food Eng. 35, 1-22 (1998).
Zhang, T., Li, J., Ding, Z. & Fan, L. Effects of initial moisture content on the oil absorption behavior of potato chips during frying process. Food Bioprocess Technol 9, 331-340 (2016).
Reyniers, S. et al. Amylose molecular fine structure dictates water-oil dynamics during deep-frying and the caloric density of potato crisps. Nat. Food 1, 736-745 (2020).
Gazmuri, A. M. & Bouchon, P. Analysis of wheat gluten and starch matrices during deep-fat frying. Food Chem 115, 999-1005 (2009).
Liu, Y., Tian, J., Zhang, T. & Fan, L. Effects of frying temperature and pore profile on the oil absorption behavior of fried potato chips. Food Chem 345, 128832 (2021).
Touffet, M., Trystram, G. & Vitrac, O. Revisiting the mechanisms of oil uptake during deep-frying. Food Bioprod. Process. 123, 14-30 (2020).
Jekle, M., Mühlberger, K. & Becker, T. Starch-gluten interactions during gelatinization and its functionality in dough like model systems. Food Hydrocoll 54, 196-201 (2016).
Thanatuksorn, P., Kajiwara, K. & Suzuki, T. Characterization of deepfat frying in a wheat flour-water mixture model using a state diagram. J. Sci. Food Agric. 87, 2648-2656 (2007).
Wang, Z. et al. Effects of thermal properties and behavior of wheat starch and gluten on their interaction: a review. Int. J. Biol. Macromol. 177, 474-484 (2021).
Chen, L. et al. Comprehensive investigation and comparison of surface microstructure of fractionated potato starches. Food Hydrocoll 89, 11-19 (2019).
Li, W. et al. Low and high methoxyl pectin lowers on structural change and digestibility of fried potato starch. LWT 132, 109853 (2020).
Aguilera, J. M., Cadoche, L., Loópez, C. & Gutierrez, G. Microstructural changes of potato cells and starch granules heated in oil. Food Res. Int. 34, 939-947 (2001).
Kawas, M. L. & Moreira, R. G. Characterization of product quality attributes of tortilla chips during the frying process. J. Food Eng. 47, 97-107 (2001).
Bouchon, P. & Aguilera, J. M. Microstructural analysis of frying potatoes. Int. J. Food Sci. Technol. 36, 669-676 (2001).
Dhital, S., Baier, S. K., Gidley, M. J. & Stokes, J. R. Microstructural properties of potato chips. Food Struct 16, 17-26 (2018).
Aguilera, J. M. Why food micro structure? J. Food Eng. 67, 3-11 (2005).
Dehghannya, J. & Ngadi, M. Recent advances in microstructure characterization of fried foods: different frying techniques and process modeling. Trends Food Sci. Technol. 116, 786-801 (2021).
Yang, D., Wu, G., Li, P., Zhang, H. & Qi, X. Comparative analysis of the oil absorption behavior and microstructural changes of fresh and pre-frozen potato strips during frying via MRL, SEM, and XRD. Food Res. Int. 122, 295-302 (2019).
Li, P. et al. Effect of multistage process on the quality, water and oil distribution and microstructure of French fries. Food Res. Int. 137, 109229 (2020).
Contardo, I., James, B. & Bouchon, P. Microstructural characterization of vacuum-fried matrices and their influence on starch digestion. Food Struct 25, 100146 (2020).
Dewanckele, J., Boone, M. A., Coppens, F., van Loo, D. & Merkle, A. P. Innovations in laboratory-based dynamic micro-CT to accelerate in situ research. J. Microsc. 277, 197-209 (2020).
Withers, P. J. et al. X-ray computed tomography. Nat. Rev. Methods Prim. 1, 18 (2021).
Turbin-Orger, A. et al. Growth and setting of gas bubbles in a viscoelastic matrix imaged by X-ray microtomography: The evolution of cellular structures in fermenting wheat flour dough. Soft Matter 11, 3373-3384 (2015).
Schott, F. et al. Structural formation during bread baking in a combined microwave-convective oven determined by sub-second in-situ synchrotron X-ray microtomography. Food Res. Int. 173, 113283 (2023).
Gruber, S. et al. Pore shape matters – In-situ investigation of freezedrying kinetics by 4D XCT methods. Food Res. Int. 193, 114837 (2024).
Patsioura, A. et al. Microscopic imaging of biphasic oil-air flow in F rench fries using synchrotron radiation. AIChE J. 61, 1427-1446 (2015).
Blankenburg, C., Rack, A., Daul, C. & Ohser, J. Torsion estimation of particle paths through porous media observed by in-situ timeresolved microtomography. J. Microsc. 266, 141-152 (2017).
Piovesan, A. et al. 4D synchrotron microtomography and porenetwork modelling for direct in situ capillary flow visualization in 3D printed microfluidic channels. Lab Chip 20, 2403-2411 (2020).
Delcour, J. A. & Hoseney, R. C. Principles of Cereal Science and Technology. (AACC International, 2010).
Farkas, B. E., Singh, R. P. & Rumsey, T. R. Modeling heat and mass transfer in immersion frying. I, model development. J. Food Eng. 29, 211-226 (1996).
Mondal, A. & Datta, A. K. Bread baking – A review. J. Food Eng. 86, 465-474 (2008).
Ni, H. & Datta, A. K. Moisture, oil and energy transport during deepfat frying of food materials. Food Bioprod. Process. Trans. Inst. Chem. Eng. Part C 77, 194-204 (1999).
Reyniers, S., Ooms, N. & Delcour, J. A. Transformations and functional role of starch during potato crisp making: A review. J. Food Sci. 85, 4118-4129 (2020).
Riley, I. M., Verma, U., Verboven, P., Nicolai, B. M. & Delcour, J. A. Wheat gluten structure and (non-)covalent network formation during deep-fat frying. Food Res. Int. 188, 114503 (2024).
Berg, S. et al. Ilastik: interactive machine learning for (Bio)image analysis. Nat. Methods 16, 1226-1232 (2019).
Sandhu, J., Bansal, H. & Takhar, P. S. Experimental measurement of physical pressure in foods during frying. J. Food Eng. 115, 272-277 (2013).
HUBBARD, L. J. & FARKAS, B. E. Influence of oil temperature on convective heat transfer during immersion frying. J. Food Process. Preserv. 24, 143-162 (2000).
van der Sman, R. G. M. & van der Goot, A. J. The science of food structuring. Soft Matter 5, 501-510 (2009).
Tengattini, A. et al. NeXT-Grenoble, the Neutron and X-ray tomograph in Grenoble. Nucl. Instruments Methods Phys. Res. Sect. A Accel. Spectrometers, Detect. Assoc. Equip. 968, 163939 (2020).
Nemati, A., Lukić, B., Tengattini, A., Briffaut, M. & Séchet, P. Water vapor condensation in porous media: effects of fracture, porosity, and flow rate revealed by rapid 4D neutron imaging. Adv. Water Resour. 195, 104872 (2025).
Asimakopoulou, E. M. et al. Development towards high-resolution kHz -speed rotation-free volumetric imaging. Opt. Express 32, 4413 (2024).
Mittone, A. et al. Multiscale pink-beam microCT imaging at the ESRF-ID17 biomedical beamline. J. Synchrotron Radiat. 27, 1347-1357 (2020).
Aguilera, J. M. Food structure revisited. Trends Food Sci. Technol. 147, 104459 (2024).
Schoeman, L., Williams, P., du Plessis, A. & Manley, M. X-ray microcomputed tomography ( ) for non-destructive characterisation of food microstructure. Trends Food Sci. Technol. 47, 10-24 (2016).
Archana, R. & Jeevaraj, P. S. E. Deep learning models for digital image processing: a review. Artif. Intell. Rev. 57, 11 (2024).
Zhang, J., Li, J. & Fan, L. Comparative analysis of oil absorption and microstructure of fried potato chips treated with different pretreatment via X-ray micro-computed tomography and mercury intrusion method. J. Food Compos. Anal. 129, 106129 (2024).
Xue, S. et al. Comparison of mercury intrusion porosimetry and multi-scale X-ray CT on characterizing the microstructure of heattreated cement mortar. Mater. Charact. 160, 110085 (2020).
Contardo, I. & Bouchon, P. Enhancing Micro-CT methods to quantify oil content and porosity in starch-gluten matrices. J. Food Eng. 237, 154-161 (2018).
Bouchon, P. & Pyle, D. L. Modelling oil absorption during post-frying cooling II: solution of the mathematical model, model testing and simulations. Food Bioprod. Process. 83, 261-272 (2005).
Datta, A. et al. Computer-aided food engineering. Nat. Food 3, 894-904 (2022).
Aladedunye, F. A. & Przybylski, R. Degradation and Nutritional Quality Changes of Oil During Frying. J. Am. Oil Chem. Soc. 86, 149-156 (2009).
EFSA Panel on Contaminants in the Food Chain. Scientific Opinion on acrylamide in food. EFSA J. 13, (2015).
Zhang, J., Li, J. & Fan, L. Application of innovative techniques in modifying microstructures and reducing oil uptake of fried food: A review. Food Res. Int. 196, 115049 (2024).
Kumari, A., Bhattacharya, B., Agarwal, T., Paul, V. & Chakkaravarthi, S. Integrated approach towards acrylamide reduction in potatobased snacks: A critical review. Food Res. Int. 156, 111172 (2022).
Weitkamp, T. et al. Status and evolution of the ESRF beamline ID19. in X-ray Optics and Microanalysis: Proceedings of the 20th International Congress 33-38 (AIP Publishing, Karlsruhe, 2010).
Douissard, P. A. et al. A versatile indirect detector design for hard X-ray microimaging. J. Instrum. 7, P09016-P09016 (2012).
Paganin, D., Mayo, S. C., Gureyev, T. E., Miller, P. R. & Wilkins, S. W. Simultaneous phase and amplitude extraction from a single defocused image of a homogeneous object. J. Microsc. 206, 33-40 (2002).
Jackson, D. F. & Hawkes, D. J. X-ray attenuation coefficients of elements and mixtures. Phys. Rep. 70, 169-233 (1981).
Maire, E. & Withers, P. J. Quantitative X-ray tomography. Int. Mater. Rev. 59, 1-43 (2014).
Riley, I. M., Nivelle, M. A., Ooms, N. & Delcour, J. A. The use of time domain 1 H NMR to study proton dynamics in starch-rich foods: A review. Compr. Rev. Food Sci. Food Saf. 21, 4738-4775 (2022).
Schlüter, S., Sheppard, A., Brown, K. & Wildenschild, D. Image processing of multiphase images obtained via X-ray microtomography: A review. Water Resour. Res. 50, 3615-3639 (2014).
Kerckhofs, G., Schrooten, J., Van Cleynenbreugel, T., Lomov, S. V. & Wevers, M. Validation of x-ray microfocus computed tomography as an imaging tool for porous structures. Rev. Sci. Instrum. 79, 013711 (2008).
Hildebrand, T. & Rüegsegger, P. A new method for the modelindependent assessment of thickness in three-dimensional images. J. Microsc. 185, 67-75 (1997).
Moisture-Air-Oven Methods. in AACC International Approved Methods (AACC International, 2009).
Verma, U., Riley, I. M., Verboven, P. & Nicolaï, B. M. In situ visualization of fluid flow during deep-fat frying process using ultrafast synchrotron microtomography. ERSF data repository https://doi. org/10.15151/ESRF-ES-930328408 (2025).
Verma, U., Riley, I. M., Verboven, P. & Nicolaï, B. M. Supporting data. Zenodo https://doi.org/10.5281/zenodo. 14507722 (2025).
Acknowledgements
FWO-Vlaanderen is acknowledged for funding the research project grant G.0903.19 N. The authors acknowledge the European Synchrotron Radiation Facility for provision of beamtime at beamline ID19 under the proposal ‘LS-3126’. Alexander Rack and Marta Majkut (beamline scientists, ID19 ESRF) for their valuable advice related to the proposal and fruitful discussions related to experimental considerations during setup testing, respectively. The authors are also grateful to Gert van Beneden, Yves Severeyns and Riet Ramaekers (from CMW, CDE, KU Leuven respectively) for their assistance with specific individual components of the experimental setup.
Author contributions
B.M.N., P.V. and J.A.D. supervised the project. U.V., P.V. and B.M.N. conceptualised the work and applied for beamtime at ESRF. U.V. designed the experiment setup. I.M.R. designed and optimised the sample formulation. U.V., I.M.R., P.V. and B.M.N. conducted the synchrotron microtomographic experiment with help from B.L. and L.B. setting up the beamline at ESRF. U.V. processed the X-ray imaging data. All authors interpreted and discussed the results. U.V. prepared the original manuscript draft. All authors contributed to reviewing and editing the manuscript.
Correspondence and requests for materials should be addressed to P. Verboven.
Peer review information Nature Communications thanks Pedro Bouchon, Liuping Fan and the other, anonymous, reviewer(s) for their contribution to the peer review of this work. A peer review file is available.
Division BIOSYST-MeBioS, KU Leuven, Willem de Croylaan 42, B-3001 Leuven, Belgium. Laboratory of Food Chemistry and Biochemistry, KU Leuven, Kasteelpark Arenberg 20, B-3001 Leuven, Belgium. European Synchrotron Radiation Facility, CS 40220, Grenoble F-38043, France. Flanders Centre of Postharvest Technology, Willem de Croylaan 42, B-3001 Leuven, Belgium. e-mail: pieter.verboven@kuleuven.be