المجرات الحمراء للغاية عند z = 5-9 باستخدام MIRI وNIRSpec: مجرات غبارية أم نوى مجرية نشطة محجوبة؟ Extremely Red Galaxies at z = 5–9 with MIRI and NIRSpec: Dusty Galaxies or Obscured Active Galactic Nuclei?
المجرات الحمراء للغاية عند z = 5-9 باستخدام MIRI وNIRSpec: مجرات غبارية أم نوى مجرية نشطة محجوبة؟
جييرمو بارو (D)، بابلو جي. بيريز-غونزاليس (D)، ديل د. كوتسيفسكي (D)، إليزابيث ج. مكغرات (D)، جوناثان ر. ترامب (D)، ريموند سي. سيمونز (D)، راشيل س. سومرفيل (D)، ل. ي. آرون يونغ (D)، بابلو أرابال هارو (D)، هوليس ب. أكينز (D)، ميكايلا ب. باجلي (D)، نيكو ج. كليري (D)، لوكا كوستنتين (D)، كيلسي ديفيس (D)، مارك ديكنسون (D)، ستيف ل. فينكلشتاين (D)، ماورو جيفاليشكو (D)، كارلوس غوميز-غيخارو (D)، نيميش ب. هاثي (D)، ميكايلا هيرشمان (D)، بيني و. هولويردا (D)، مارك هيرتاس-شركة (D)، جيهان س. كارتالتيبي (D)، أنطون م. كوكيمور (D)، راي أ. لوكاس (D)، كيسي بابوفيتش (D)، نور بيرزكال (D)، ليز-ماري سيليه (D)، ساندرو تاكلا (D)، ستاين ويستس (D)، ستيفن م. ويلكنز (D)، ألكسندر دي لا فيغا (D)، جوانغ يانغ (D)، وخورخي أ. زافالا (د)قسم الفيزياء وعلم الفلك، جامعة المحيط الهادئ، ستوكستون، كاليفورنيا 90340 الولايات المتحدة الأمريكية؛ gbarro@pacific.eduمركز علم الأحياء الفلكية (CAB)، CSIC-INTA، طريق أجيلفير كم 4، تورخون دي أردوز، E-28850 مدريد، إسبانياقسم الفيزياء وعلم الفلك، كلية كولبي، واترفيل، مين 04901، الولايات المتحدة الأمريكيةقسم الفيزياء، 196A طريق الأوديتوريوم، الوحدة 3046، جامعة كونيتيكت، ستورز، CT 06269، الولايات المتحدة الأمريكيةمركز علم الفلك الحاسوبي، معهد فلاتايرون، 162 الجادة الخامسة، نيويورك، نيويورك 10010، الولايات المتحدة الأمريكيةقسم علوم الفيزياء الفلكية، مركز غودارد لرحلات الفضاء التابع لناسا، 8800 طريق غرينبيلت، غرينبيلت، ماريلاند 20771، الولايات المتحدة الأمريكيةمختبر الأبحاث الوطنية للعلم الفلك البصري والأشعة تحت الحمراء التابع لـ NSF، 950 شارع تشيري الشمالي، توكسون، أريزونا 85719، الولايات المتحدة الأمريكيةقسم الفلك، جامعة تكساس في أوستن، أوستن، تكساس، الولايات المتحدة الأمريكيةقسم الفيزياء وعلم الفلك، جامعة تكساس A&M، كوليج ستيشن، تكساس 77843-4242 الولايات المتحدة الأمريكيةمعهد جورج ب. وسينثيا وودز ميتشل للفيزياء الأساسية وعلم الفلك، جامعة تكساس A&M، كوليج ستيشن، تكساسالولايات المتحدة الأمريكيةمركز علم الأحياء الفلكية (CAB/CSIC-INTA)، طريق أجايلفير كم 4، تورخون دي أردوز، E-28850 مدريد، إسبانياجامعة ماساتشوستس أمهيرست، 710 شارع نورث بليزنت، أمهيرست، MA 01003-9305، الولايات المتحدة الأمريكيةجامعة باريس-ساكلاي، جامعة باريس سيتé، CEA، CNRS، AIM، F-91191 غيف-سور-إيفيت، فرنسامعهد علوم تلسكوب الفضاء، بالتيمور، ماريلاند، الولايات المتحدة الأمريكيةمعهد الفيزياء، مختبر تطور المجرات، المدرسة الفيدرالية Polytechnic في لوزان (EPFL)، مرصد سافيرني، 1290 فيرسوا، سويسراقسم الفيزياء وعلم الفلك، جامعة لويزفيل، لويزفيل، كنتاكي 40292، الولايات المتحدة الأمريكيةمعهد علم الفلك في جزر الكناري، لا لاغونا، تينيريفي، إسبانياجامعة لا لاغونا، لا لاغونا، تينيريفي، إسبانياجامعة باريس-سيتé، LERMA-مرصد باريس، PSL، باريس، فرنسامختبر الفيزياء الفلكية متعددة الأطوال الموجية، كلية الفيزياء وعلم الفلك، معهد روتشستر للتكنولوجيا، 84 طريق لومب التذكاري، روتشستر، نيويورك 14623، الولايات المتحدة الأمريكيةمعهد علوم تلسكوب الفضاء، 3700 سان مارتن درايف، بالتيمور، MD 21218، الولايات المتحدة الأمريكيةجامعة إكس مارسيليا، المركز الوطني للبحث العلمي، المركز الوطني لدراسات الفضاء، مختبر أبحاث الفضاء مارسيليا، فرنسامعهد كافلي لعلم الكون، جامعة كامبريدج، طريق مادلينغلي، كامبريدج CB3 0HA، المملكة المتحدةمختبر كافنديش، جامعة كامبريدج، 19 شارع جي جي طومسون، كامبريدج CB3 0HE، المملكة المتحدةقسم الفيزياء، جامعة باث، كلافيرتون داون، باث BA2 7AY، المملكة المتحدةمركز الفلك، جامعة ساسكس، فالمير، برايتون BN1 9QH، المملكة المتحدةمعهد علوم الفضاء والفلك، جامعة مالطا، مسيدا MSD 2080، مالطاقسم الفيزياء وعلم الفلك، جامعة كاليفورنيا، 900 شارع الجامعة، ريفرسايد، كاليفورنيا 92521، الولايات المتحدة الأمريكيةمعهد كابتين الفلكي، جامعة غرونينغن، صندوق بريد 800، 9700 AV غرونينغن، هولندامعهد SRON الهولندي لأبحاث الفضاء، صندوق بريد 800، 9700 AV غرونينغن، هولنداالمرصد الوطني الفلكي في اليابان، 2-21-1 أوساوا، ميتاكا، طوكيو 181-8588، الياباناستلم في 22 مايو 2023؛ تم تنقيحه في 17 نوفمبر 2023؛ تم قبوله في 6 ديسمبر 2023؛ نُشر في 6 مارس 2024
الملخص
ندرس مجموعة جديدة من الأجسام الحمراء للغاية (EROs) التي تم اكتشافها مؤخرًا بواسطة تلسكوب جيمس ويب الفضائي (JWST) بناءً على ألوان NIRCam الخاصة بها F277W – F444W > 1.5 مغ. نجد 37 EROs في مجال مسح علوم الإصدارات المبكرة لتطور الكون (CEERS) مع F444W < 28 مغ وزخارف ضوئية حمراء بين، مع الوسيطمن المدهش، على الرغم من ألوانها الحمراء ذات الطول الموجي الطويل، أن هذه الكائنات EROs لها ألوان زرقاء ذات الطول الموجي القصير (F150W – F200W ~0 mag) مما يدل على توزيع طيفي للطاقة ثنائي النمط (SEDs) مع ميل أحمر حاد في الإطار الزمني البصري، وميل أزرق مسطح في الإطار الزمني للأشعة فوق البنفسجية. علاوة على ذلك، فإن جميع هذه الكائنات EROs غير محددة، وهي مصادر نقطية في جميع نطاقات NIRCam. نقوم بتحليل SEDs لثمانية منها باستخدام ملاحظات MIRI وNIRSpec باستخدام نماذج تجمع النجوم وقوالب النواة المجرية النشطة (AGN). نجد أن المجرات المليئة بالغبار أو AGNs المحجوبة توفر ملاءمات SED جيدة بنفس القدر ولكن بخصائص نجمية مختلفة: ضخمة ومليئة بالغبار. و أو ذات كتلة منخفضة ومخفية، و مج، يستضيف كائن شبه نجمي غير واضح (QSO). نمذجة SED لا تفضل أي سيناريو، لكن أحجامها غير المحللة تشير أكثر إلى AGNs. إذا تم تأكيد أي EROs أن لديها، سيزيد من كثافة العدد قبل JWST عندبمعدل يصل إلى. بالمثل، إذا كانت هذه اتصالات كونية مع سطوع في
زميل ما بعد الدكتوراه في ناسا. إذا كان نطاقهم، فإن عددهم سيتجاوز عدد الكوازارات الزرقاء الساطعة بأكثر من ثلاثة أوامر من حيث الحجم. ستكشف القياسات الضوئية عند أطوال موجية متوسطة من الأشعة تحت الحمراء عن الطبيعة الحقيقية لانبعاث الاستمرارية الحمراء في هذه الكائنات ذات الانزياح الأحمر، وستضع هذه المجموعة المحيرة في السياق الصحيح لتطور المجرات. مفاهيم معجم الفلك الموحد: تشكيل المجرات (595)؛ تطور المجرات (594)؛ المجرات ذات الانزياح الأحمر العالي (734)؛ تجمعات النجوم (1622)؛ تلسكوب جيمس ويب الفضائي (2291)؛ فوتومترية المجرات (611)
1. المقدمة
تتيح القدرات الاستثنائية لتلسكوب جيمس ويب الفضائي (JWST) الفرصة لتحويل فهمنا تمامًا للكون عالي الانزياح الأحمر. لقد مكنت الحساسية الضوئية المحسنة والدقة المكانية عند أطوال موجية متوسطة من الأشعة تحت الحمراء، مقارنة بتلسكوب هابل الفضائي (HST) أو سبitzer، في الأشهر القليلة الأولى من العمليات، عددًا من الدراسات التي دفعت حدود اكتشاف أصغر وأبعد المجرات التي تم رصدها في عصر إعادة التأين (على سبيل المثال، كاستيلانو وآخرون 2022؛ نايدو وآخرون 2022؛ فينكلشتاين وآخرون 2023أ؛ بيريز-غونزاليس وآخرون 2023أ، 2023ب؛ آدامز وآخرون 2023؛ ويتلر وآخرون 2023) بالإضافة إلى توسيع معرفتنا بمجرات أكثر ضخامة تصل إلىوما بعدها (على سبيل المثال، تاكشيلا وآخرون 2022؛ إندسلي وآخرون 2023؛ لابي وآخرون 2023؛ نيلسون وآخرون 2023). في هذه العملية، بدأت هذه الأوراق تكشف عن طبيعة أكبر المجرات التي لم يتم اكتشافها سابقًا بواسطة تلسكوب هابل (HST-dark) وتم اكتشافها فقط بواسطة سبitzer/IRAC، وأطوال موجات الراديو الأطول، والأطوال الموجية تحت الملليمتر (باروفات وآخرون 2023؛ بيريز غونزاليس وآخرون 2023a؛ غوميز-غويخارو وآخرون 2023؛ روديغيرو وآخرون 2023؛ زافالا وآخرون 2023)، أو لم يتم اكتشافها على الإطلاق.
ومع ذلك، بينما نعمل نحو إحصاء أكثر اكتمالاً للكون عالي الانزياح الأحمر، هناك قلق من أن بعض هذه التقديرات المبكرة لكثافة عدد المجرات أو كتلها النجمية (الكبيرة) قد تكون في تناقض مع توقعات النماذج (على سبيل المثال، بويلان-كولتشين 2023؛ فيرارا وآخرون 2023؛ ميسون وآخرون 2023). أحد التحذيرات المحتملة لهذه الدراسات الفوتومترية هو أنه بينما نستكشف المجرات في أول مليار سنة من عمر الكون، قد نجد عددًا كبيرًا من المجرات الشابة ذات الكتلة المنخفضة مع خطوط انبعاث شديدة وعرض مكافئ (EWs) كبير محتمل يتجاوزكما اقترحت الدراسات المبكرة عن الخافتةالمجرات مع سبitzer/IRAC (على سبيل المثال، إيغامي وآخرون 2005؛ إيلز وآخرون 2007؛ ستارك وآخرون 2009؛ غونزاليس وآخرون 2014؛ لابي وآخرون 2013). يمكن أن تجعل مثل هذه القيم الكبيرة لـ EWs الهيدروجين، [O III]، و تزيد تدفقات الخطوط من دقة الفوتومترية في نطاقات الضوء العريض والمتوسط في مرشحات JWST/NIRCam حتى F444W، مما يجعلها تبدو حمراء جدًا. يمكن أن تؤثر التأثيرات على الألوان على كل من الانزياحات الحمراء الفوتومترية (على سبيل المثال، أرابال هارو وآخرون 2023) وخصائص تجمع النجوم لهذه المجرات الزرقاء الشابة، مما يقدم تحيزًا نحو أعمار أكبر، وغطاء غباري أكبر، وكتل أكبر بشكل ملحوظ (). وقد أفادت الأوراق الحديثة المستندة إلى JWST أن خطوط الانبعاث ذات EW الكبيرة التي تلوث الفوتومترية NIRCam هي بالفعل ظاهرة شائعة (إندسلي وآخرون 2021، 2023؛ ماثي وآخرون 2023؛ رينالدي وآخرون 2023)، مما قد يعيق تحديد المجرات الضخمة الحقيقية عند . وهناك قلق محتمل آخر بشأن اختيارات المجرات الضخمة بناءً على الألوان الحمراء للغاية هو التلوث الناتج عن النوى المجرية النشطة المحجوبة (AGNs). كما هو موضح أيضًا في الدراسات المستندة إلى IRAC، يمكن أن يؤدي الانبعاث الأحمر الشبيه بالقوة من AGN المحجوب أيضًا إلى ألوان بصرية إلى تحت الحمراء حمراء جدًا، والتي تم استخدامها على نطاق واسع لتحديد هذه المجرات في المسوحات الكونية (على سبيل المثال،
ألونسو-هيريرو وآخرون 2004؛ ستيرن وآخرون 2005؛ لايسي وآخرون 2007؛ دونلي وآخرون 2008، 2012). بينما تكون نسبة تلوث خطوط الانبعاث أو AGN في العينات المختارة بالألوان عند الانزياحات الحمراء المنخفضة إلى المتوسطة ضئيلة فقط، فإن التأثير على المسوحات المستندة إلى JWST لا يزال غير واضح.
طريقة للمضي قدمًا للتغلب على التداخل في أصل الألوان في المجرات الحمراء (خطوط الانبعاث عالية EW مقابل الاستمرارية النجمية أو AGN) هي الحصول على فوتومترية في نطاقات متعددة وتوسيع التغطية إلى أطوال موجية أطول. ستؤكد الاكتشافات الواضحة عند الأطوال الموجية التي لا تتأثر بشدة بخطوط الانبعاث القوية على انبعاث الاستمرارية. وبالمثل، يمكن أن تساعد الاكتشافات عند الأطوال الموجية الطويلة (LW) التي تستكشف إطار الأشعة تحت الحمراء القريبة (NIR) للمجرات في التمييز بين انبعاث AGN الشبيه بالقوة والاستمرارية النجمية (ساويكي 2002؛ دونلي وآخرون 2007). ستساعد الملاحظات باستخدام JWST/MIRI عند في كسر كلا هذين التداخلين. وبالمثل، يمكن أن يوفر JWST/NIRSpec انزياحات حمراء دقيقة لهذه المجرات ويساعد في معايرة تأثير خطوط الانبعاث في الملاحظات الفوتومترية.
في هذه الورقة، نستخدم البيانات من الحقبتين الأولى والثانية من مسح العلوم المبكر لتطور الكون (CEERS؛ فينكلشتاين وآخرون 2017) لتحديد المرشحين لمجرات ضخمة مغبرة عند بألوان حمراء جدًا في مرشحات LW NIRCam. ثم نركز على مجموعة فرعية من تلك المجرات مع ملاحظات MIRI وNIRSpec لوضع قيود أفضل على انزياحاتها وانبعاثها عند الأطوال الموجية الأطول، ونقوم بإجراء تحليل مفصل لسيناريوهات نمذجة توزيع الطاقة الطيفية (SED) المختلفة لتحديد احتمال كونها مجرات زرقاء عالية EW، أو مجرات ضخمة مغبرة، أو AGNs محجوبة والآثار المترتبة على الكتل النجمية وكثافات الأعداد للعينة في كل حالة.
تُبنى الورقة على النحو التالي. في القسم 2، نصف تقليل البيانات لصور NIRCam وMIRI متعددة النطاقات وطيف NIRSpec. كما نصف القياسات الفوتومترية، وإنشاء الفهارس، والتقديرات الأولية للانزياحات الحمراء الفوتومترية والخصائص النجمية لمنطقة CEERS بأكملها. في القسمين 3 و4، نقوم بإجراء اختيار لون الكائنات الحمراء للغاية (ERO) ونصف الألوان وSEDs والانزياحات الحمراء الفوتومترية والكتل النجمية للعينة المختارة بهذه الطريقة. في القسم 5، نقوم بإجراء نمذجة مفصلة لـ SED لمجموعة فرعية من ثمانية EROs تم ملاحظتها باستخدام MIRI وNIRSpec باستخدام مجموعة متنوعة من نماذج SED التي تهدف إلى اختبار سيناريوهات المجرة المغبرة مقابل AGN المحجوبة وآثارها على خصائص تجمع النجوم. في القسم 6، نناقش احتمال السيناريوهات النمذجة المختلفة بناءً على الخصائص العامة لـ EROs وكذلك أفضل SEDs لها. أخيرًا، نلخص نتائجنا ونناقش الآفاق المستقبلية في القسم 7.
طوال هذه الورقة، نفترض كونًا مع ، و. يتم اقتباس عدم اليقين عند مستوى الثقة . جميع المقاييس في وحدات AB (أوك وغون 1983).
2. البيانات
تستند هذه الورقة إلى ملاحظات من CEERS، وهو برنامج علوم للإصدار المبكر (فينكلشتاين وآخرون 2017) يغطي حوالي من شريط غروث الممتد (EGS) مع التصوير والطيف باستخدام ملاحظات متوازية منسقة ومتداخلة بواسطة عدة أدوات من JWST. هذه الصور متاحة على موقع CEERS وعلى MAST كمنتج علمي عالي المستوى (doi:10.17909/z7p0-8481، فينكلشتاين وآخرون 2023b). هنا نستخدم البيانات التي تم الحصول عليها في يونيو وديسمبر 2022 والتي تتضمن 10 نقاط NIRCam في سبعة مرشحات: ثلاثة عند الأطوال الموجية القصيرة (SW؛ F115W، F150W، وF200W)، وأربعة عند LW (F277W، F356W، F410M، وF444W)؛ وثماني نقاط MIRI في سبعة مرشحات (F560W، F770W، F1000W، F1280W، F1500W، F1800W، وF2100W). نظرًا لطبيعة ملاحظات CEERS المتوازية، يتم ملاحظة بعض نقاط MIRI فقط إما في مرشحات الأطوال الموجية القصيرة (F560W وF770W) أو الطويلة (F1000W إلى F2100W) وفقط ستة منها تتداخل مع تصوير NIRCam. أسماء هذه النقاط في ملف المراقبة APT هي ، و9، تم ملاحظتها في F560W وF770W، و5 و8، تم ملاحظتهما عند LW فقط. بالإضافة إلى تصوير NIRCam، تتداخل النقاط 3 و6 و7 مع ملاحظات NIRCam WFSS grism ونقطتين من نقاط NIRSpec المسماة 9 و10 في ملف APT.
تمت معايرة بيانات NIRCam وMIRI باستخدام الإصدار 1.7.2 من خط أنابيب معايرة JWST، وملفات المرجع في إصدار pmap 0214 (الذي يتضمن معايرة فوتومترية مطورة مطابقة من كاشف إلى كاشف)، مع بعض التعديلات الإضافية الموصوفة بمزيد من التفصيل في فينكلشتاين وآخرون (2023a) وباغلي وآخرون (2023) لـ NIRCam وبابوفيتش وآخرون (2023) وG. يانغ وآخرون (2024، قيد الإعداد) لـ MIRI. يتم تسجيل الصور المخفضة إلى نفس إطار نظام الإحداثيات العالمي (استنادًا إلى Gaia DR1.2؛ تعاون Gaia وآخرون 2016) وتجميعها في فسيفساء واحدة مع مقاييس بكسل من و بكسل لـ NIRCam وMIRI، على التوالي.
تمت معالجة ملاحظات CEERS NIRSpec (P. أرابال هارو 2024، قيد الإعداد) باستخدام الإصدار 1.8.5 من خط أنابيب معايرة علوم JWST، مع نظام بيانات مرجعية للمعايرة يحدد 1027 متبعًا إجراءات مماثلة كما في فوجيموتو وآخرون (2023) وكوتسيفسكي وآخرون (2023). باختصار، نقوم بتصحيح ضوضاء الكاشف، وطرح التيار المظلم والانحياز، وإنشاء خرائط معدل العد بدءًا من الصور غير المعايرة. نقوم بتطبيق بعض الخطوات المخصصة الإضافية لتحسين معالجة “كرات الثلج” الناتجة عن الأشعة الكونية. تتم معالجة الخرائط الناتجة باستخدام المرحلة الثانية من خط الأنابيب لإنشاء طيف ثنائي الأبعاد مخفض مع أثر مصحح ومنحدر مسطح. يتم تحديد فتحات الاستخراج المخصصة بصريًا من خلال فحص الصور بحثًا عن استمرارية ذات نسبة إشارة إلى ضوضاء عالية أو خطوط انبعاث. أخيرًا، نقوم باستخراج طيف 1D من فتحات boxcar المركزية على الأثر المحدد بصريًا.
2.1. استخراج المصدر والفوتومترية
تمت عملية استخراج المصدر والقياسات الفوتومترية متعددة النطاقات باستخدام نفس الطرق كما هو موضح في بيانات الحقبة الأولى بالتفصيل في فينكلشتاين وآخرون (2023a). باختصار، تم حساب الفوتومترية على الصور المطابقة لوظيفة انتشار النقطة (PSF) باستخدام SExtractor (بيرتين وآرنوتس 1996) v2.25.0 في وضع صورتين، مع تركيبة معكوسة التباين
الموزونة من صور F277W وF356W المطابقة لوظيفة انتشار النقطة كصورة الكشف. تم قياس الفوتومترية في جميع سبعة نطاقات NIRCam التي تم ملاحظتها بواسطة CEERS، بالإضافة إلى نطاقات HST F606W وF814W وF105W وF125W وF140W وF160W باستخدام البيانات التي تم الحصول عليها من مسوحات CANDELS و3D-HST (برامر وآخرون 2011؛ غروغين وآخرون 2011؛ كوكيمور وآخرون 2011).
2.2. فوتومترية الفتحة الدائرية
نقوم بإعادة حساب الفوتومترية لعينة فرعية من الأجسام المدروسة في القسم 5 باستخدام فتحات دائرية أصغر لتحسين الدقة في أخطاء الفوتومترية ولتجنب التلوث الفوتومتري المحتمل من مصادر قريبة أو مشاكل طرح الخلفية. نظرًا لأن طبيعة مجراتنا متجانسة جدًا، وجميع المصادر التي تم تحليلها في هذه الورقة بالكاد تم حلها أو لم يتم حلها (انظر القسم 4)، كانت الفتحات الفوتومترية بقطر كانت الأكثر ملاءمة للحصول على أكثر الأطياف الطيفية الإشعاعية دقة وموثوقية. تم قياس الفوتومترية في الصور الأصلية والصور المطابقة لوظيفة النقطة، وبعد تطبيق تصحيحات الفتحة للمصادر النقطية للأولى، توصلنا إلى ألوان متسقة ضمن نصف قيمة تصحيحات الفوتومترية على الأقل.
2.3. الانزياحات الفوتومترية وخصائص تجمع النجوم
نقدر الانزياحات الفوتومترية لكامل الكتالوج الأساسي من خلال ملاءمة الأطياف الطيفية متعددة النطاقات باستخدام الشيفرة EAZYpy (بريمر وآخرون 2008). تقوم الشيفرة بملاءمة تركيبات خطية غير سالبة من النماذج للبيانات المرصودة لاشتقاق دوال توزيع الاحتمالات (PDFs). هنا نستخدم مجموعة النماذج الافتراضية “tweak fsps QSF 12 v 3” التي تتكون من مجموعة من 12 نموذجًا مستمدة من شيفرة تركيب تجمع النجوم FSPS (كونروي وآخرون 2010). ونتيجة لذلك، بالإضافة إلى الانزياح الفوتومتري، توفر الشيفرة أيضًا تقديرًا لكتلة النجوم بالإضافة إلى التوهين الناتج عن الغبار. بالإضافة إلى ذلك، نقدر أيضًا خصائص تجمع النجوم من خلال ملاءمة الأطياف الطيفية البصرية وNIR باستخدام FAST (كريك وآخرون 2009)، مع افتراض نماذج تركيب تجمع النجوم لبروزوال وشارلوت (2003)، متبعين دالة الكتلة الأولية (IMF) لشابرييه (2003)، وتاريخ تكوين النجوم الأسي المتأخر (SFH)، وقانون الغبار لكالزتي وآخرون (2000) مع توهين مغ.
3. اختيار العينة
3.1. معيار لون ERO
نحدد المجرات الحمراء للغاية عند الانزياحات العالية باستخدام قطع لون واحد من F277W – F444W > 1.5 مغ. هذه الطريقة مشابهة لاختيار ERO التقليدي (; على سبيل المثال، مكارثي وآخرون 2004) أو IERO (; على سبيل المثال، وانغ وآخرون 2012؛ كابوتي 2013؛ ستيفانون وآخرون 2013) التي تستخدم الألوان الحمراء من البصرية إلى NIR للعثور على مجرات ضخمة، مغبرة، أو هادئة مع انكسارات بالمر قوية أو عند . مع وصول JWST، تم توسيع هذه التقنية إلى درجات سطوع أضعف وانزياحات أعلى باستخدام فلاتر عند أطوال موجية أطول، على سبيل المثال، F150W – F444W في باروفات وآخرون (2023)، أو F150W – F356W في بيريز-غونزاليس وآخرون (2023a). مؤخرًا، استخدم لابي وآخرون (2023) عتبة من F277W – F444W > 1 مغ لتحديد المرشحين لمجرات ضخمة عند . هنا نستخدم لونًا أحمر قليلاً ونتخلى عن القيود اللونية الإضافية لخفض الانزياح الأحمر للاختيار إلى . يمكن أن يقلل عتبة اللون الأحمر أيضًا من التلوث الناتج عن المجرات
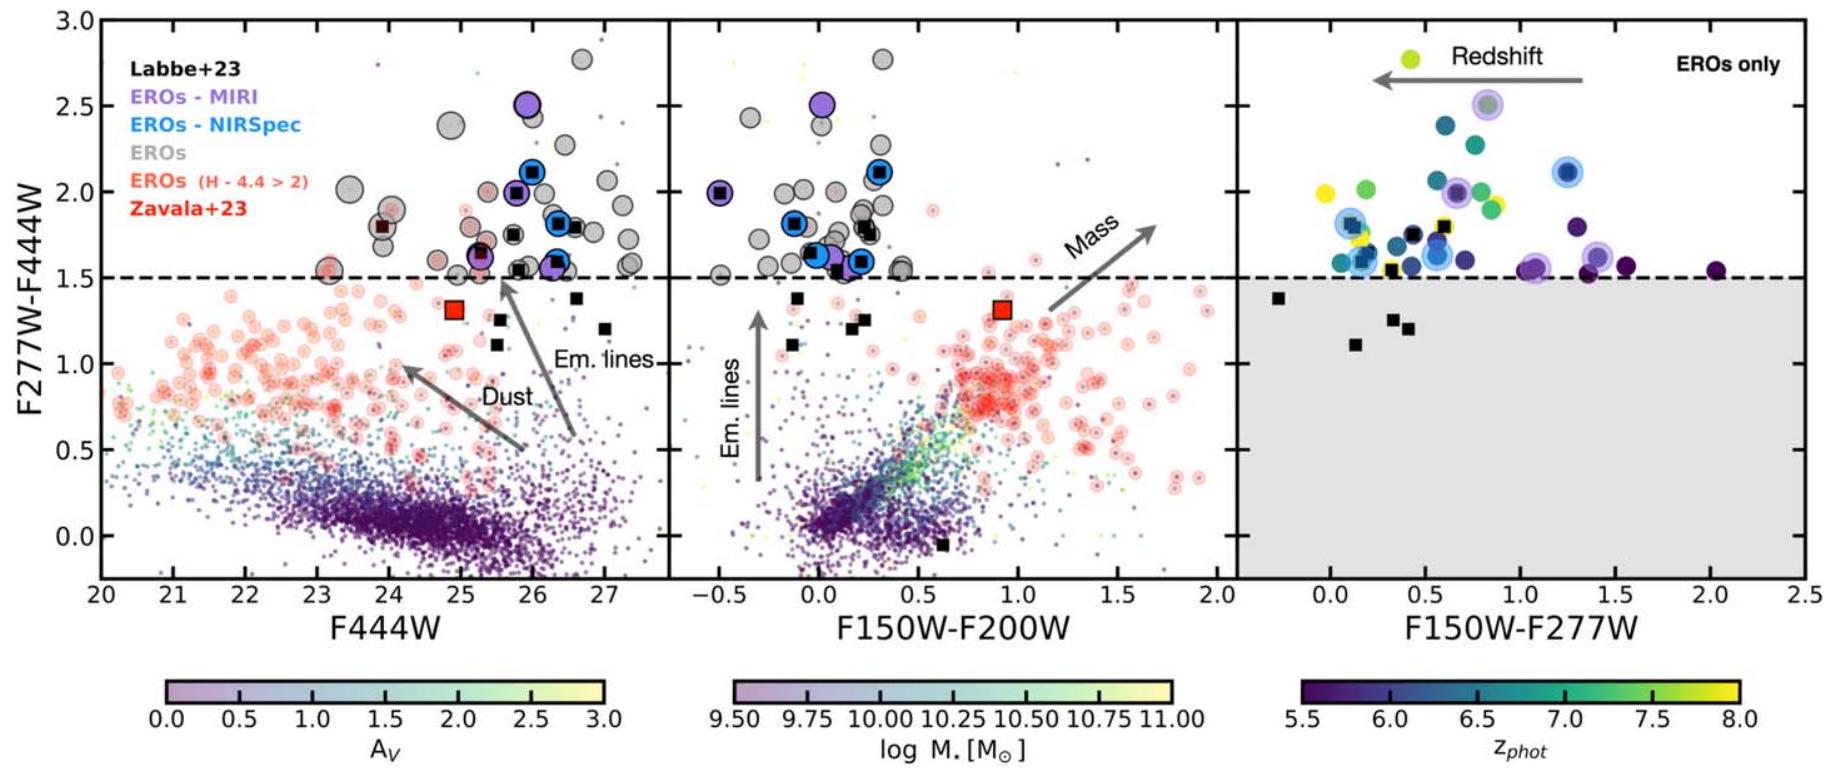
الشكل 1. مخططات اللون-السطوع واللون-اللون التي تظهر عتبة الاختيار لـ EROs F277W (دوائر؛ F277W – F444W > 1.5 مغ)، بالنسبة لكتالوج مجرات CEERS، مشفرة بالألوان حسب كتلة النجوم و، ومجموعة فرعية من EROs F150W (F150W – F444W مغ). تشير العلامات الزرقاء والبنفسجية إلى EROs التي تم رصدها باستخدام MIRI وNIRSpec، على التوالي. تظهر المربعات السوداء EROs من لابي وآخرون (2023). تظهر الألواح اليسرى والوسطى الاتجاهات العامة نحو الألوان الأكثر احمرارًا مع زيادة الكتلة وتوهين الغبار (الأسهم)، مما يشير إلى أن EROs F277W هي مجرات ضخمة ومغبرة. ومع ذلك، تكشف اللوحة المركزية أن EROs F277W لديها ألوان زرقاء بشكل مدهش عند SW، F150W – F200W ~ 0 مغ، مختلفة جدًا عن تلك الخاصة بـ EROs F150W ومجرات ضخمة مغبرة بشكل عام. يظهر المربع الأحمر مجرة ضخمة، مغبرة، تحت المليمتر عند من زافالا وآخرون (2023) والتي هي أيضًا حمراء في جميع النطاقات. وهذا يعني أن EROs F277W لديها أطياف طيفية ثنائية الشكل بألوان زرقاء في SW وألوان حمراء في LW. تظهر اللوحة اليمنى العلاقة بين الانزياح الفوتومتري ولون F150W – F277W لـ EROs F277W. مع انتقال فلتر F277W من النطاق البصري الحاد إلى النطاق UV المسطح مع زيادة الانزياح، ينخفض اللون إلى F150W – F277W ~ 0 مغ.
مع خطوط انبعاث عالية EW () تعزز تدفقات NIR للمجرات الزرقاء مع استمرارية نجمية نسبية ضحلة. على سبيل المثال، يجد إندسلي وآخرون (2023) ألوانًا حمراء، و، في عينة من مرشحي مجرات ليمان-كسر منخفضة الكتلة عند والتي كانت مدفوعة إلى حد كبير بخطوط III عالية EW التي تعزز التدفق في F444W. تم تأكيد هذه الخطوط القوية أيضًا طيفيًا من خلال مسوحات NIRCam/WFSS الأخيرة عند انزياحات أقل قليلاً من (ماثي وآخرون 2023).
توضح اللوحة اليسرى من الشكل 1 اختيار العينة في مخطط اللون-السطوع مقارنة بالتوزيع العام للمجرات في كتالوج CEERS، مشفرة بالألوان حسب خصائص مختلفة، ومجموعة فرعية من EROs F150W (F150W – F444W > 2 وF444W <25 مغ؛ دوائر حمراء). تظهر 13 مجرة من لابي وآخرون (2023) بمربعات سوداء. جميعها باستثناء الأربعة ذات الألوان مدرجة في عينتنا. يبرز رمز اللون في عينة CEERS الاتجاه نحو زيادة ألوان NIR مع الانقراض (وبالمثل مع الكتلة النجمية والانزياح في الألواح الأخرى). كما تم مناقشته أعلاه، فإن المجرات الأكثر احمرارًا من عتبة اللون (الخط المنقط) هي مرشحة لمجرات ضخمة ذات أطياف طيفية حمراء، مغبرة، أو هادئة وربما بعض المجرات ذات خطوط انبعاث عالية EW. من المثير للاهتمام، أن هناك بعض الاختلافات بين عينة EROs F150W وEROs F277W. أولاً، EROs F277W أضعف، بمتوسط سطوع قدره ، بينما تمتد EROs F150W عبر نطاق أوسع في السطوع بدءًا من مغ، وهو ما يتماشى مع الفكرة القائلة بأنه من خلال الاختيار في نطاق أكثر احمرارًا، تميل EROs F277W أكثر نحو ذيل الانزياح الأحمر الأعلى لاختيار المجرات الضخمة. ثانيًا، عادةً ما يتم اختيار EROs F150W ضمن سطوع حد أعلى لتقييد عدد المجرات في الطرف الأدنى من الاختيار
معايير (على سبيل المثال، F444W -26؛ ألكالدي بامبليغا وآخرون 2019؛ غوميز-غويخارو وآخرون 2023). ومع ذلك، فإن استخدام سطوع حد أضعف يزيد من التداخل بين عينتي ERO، كما هو موضح على سبيل المثال في بيريز-غونزاليس وآخرون (2023a). ومع ذلك، نجد أنه حتى ضمن نطاق سطوع مشابه، فإن اختيار F150W يفوت بعض EROs F277W لأنها تحتوي على ألوان زرقاء أكثر في .
السبب وراء هذا الاختلاف الرئيسي موضح في اللوحة المركزية من الشكل 1، التي تظهر أن جميع EROs F277W زرقاء بشكل مدهش في F150W – F200W مغ، والتي تستكشف النطاق UV عند . وبالتالي، فإن هذه EROs تشغل منطقة مختلفة جدًا من مخطط اللون-اللون بعيدًا عن مواقع EROs F150W، وجميع المجرات الضخمة الأخرى التي عادةً ما تكون ذات ألوان حمراء، . وهذا يعني أنه، على عكس غالبية المجرات الضخمة الأخرى، التي تكون حمراء عبر أطيافها الطيفية بالكامل، فإن EROs F277W زرقاء في النطاق UV وتكون حمراء في النطاق البصري. تشير هذه الألوان الغريبة إلى أن هذه EROs لديها أطياف طيفية ثنائية الشكل زرقاء-حمراء (على شكل أو على شكل في )، كما أشار لابي وآخرون (2023). تظهر اللوحة اليمنى أن الهدف من عتبة اللون الثانية () في طريقة اختيار لابي وآخرون (2023) هو إزالة المجرات عند من العينة. يعمل لون F150W – F270W كزيف انزياح لأن فلتر F277W ينتقل من الجانب البصري الحاد للأطياف الطيفية إلى UV المسطح مع زيادة الانزياح. وبالتالي، ينخفض اللون بسرعة نحو F150W – F270W ~0 للمجرات عند . لنفس السبب، قد يبدأ الاختيار الأساسي في F277W – F444W في فقدان مجرات من هذا النوع عند عندما يبدأ فلتر F444W في الانتقال من النطاق البصري الحاد. أخيرًا، نلاحظ أن الاختيار في نظيف بشكل مدهش حيث أنه فقط
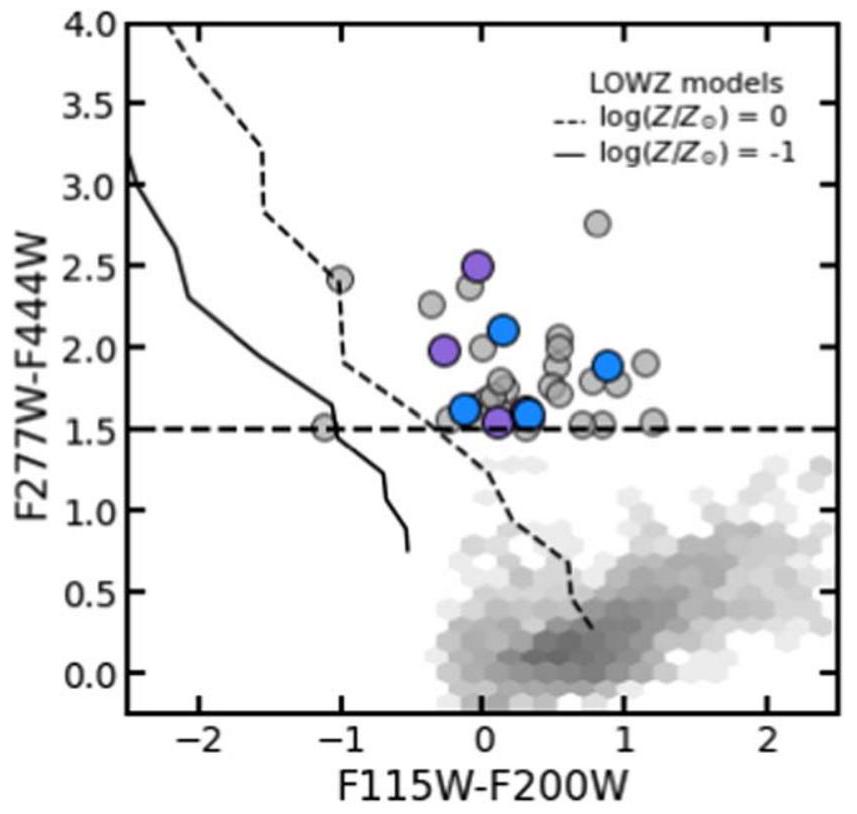
الشكل 2. مخطط اللون-اللون NIRCam، F115W – F200W مقابل F277W – F444W يظهر الجزء الأكبر من سكان مجرات CEERS (مقياس رمادي) وEROs (دوائر) المختارة في القسم 3.1 بناءً على ألوانها الزرقاء-الحمراء المميزة في نطاقات SW وLW. الألوان هي نفسها كما في الشكل 1. توضح الخطوط السوداء الصلبة والمنقطة مسارات اللون كدالة لدرجة الحرارة () والمواد الكيميائية ( و 0 ) مشتقة من نماذج النجوم القزمة البنية LOWZ (Meisner et al. 2021). بينما يبدو أن القزمات البنية تمتلك أيضًا أطيافًا ضوئية زرقاء-حمراء في نطاقات NIRCam، فإن ألوانها في الأشعة تحت الحمراء القصيرة عادة ما تكون أكثر زرقة، ، من سكان ERO عند ألوان LW مماثلة. بناءً على هذا التمييز، نحدد مرشحين محتملين للقزم البني في عينة من 37 ERO.
يحدد هذه EROs الغريبة ذات الأطياف الطيفية ثنائية الوضع، الزرقاء-الحمراء، دون تلوث من EROs النموذجية (أي، الحمراء عبر أطيافها الطيفية بالكامل).
نحدد 37 EROs وفقًا لمعيار اللون الموصوف أعلاه. نقوم بفحص جميع المرشحين بصريًا ونزيل بعض الاكتشافات غير الموثوقة (مثل البكسلات الساخنة أو الأجسام المزيفة المستخرجة بالقرب من أشواك الانكسار للنجوم الساطعة). متوسط قدراتهم في F444W و F536W و F277W و F150W هو، و على التوالي، والتي تتماشى مع معيار اختيار اللون. إن شدة سطوعها الخافتة جداً في F150W تشير إلى أن هذه الأجسام جميعها هي من نوع HST/WFC3 dropouts عند عمق بيانات CANDELS في منطقة CEERS.
3.2. تلوث الأقزام البنية
تختلف الأطياف الطيفية الثنائية الأوضاع (SEDs) للأجسام ذات الانزياح الأحمر الكبير (EROs) بشكل كبير عن الأطياف الطيفية للعديد من المجرات الضخمة والمغبرة في أي انزياح أحمر. ومع ذلك، فإنها تظهر بعض التشابهات معSEDs للأقزام البنية الباردة في مجرة درب التبانة (على سبيل المثال، ويلكنز وآخرون 2014). في الواقع، ألوان NIRCam في الأشعة تحت الحمراء القريبة للأقزام البنية زرقاء جداً وتتناقص تدفقاتها بشكل حاد في F 090 W، مما يمكن أن يُفسر بشكل خاطئ على أنه كسر ليمان في حالة عالية-المجرة. في الوقت نفسه، تظهر الأقزام البنية أيضًا زيادة في منحنيات الطيف الكهرومغناطيسي الخاصة بها بدءًا من حواليووصوله إلى ذروته عند، مما يؤدي إلى ألوان LW الحمراء. تم تحديد مرشحي الأقزام البنية بالفعل فوتوغرافيًا بسبب طيفهم الطيفي الأزرق-red الغريب باستخدام عتبات اللون-اللون المشابهة لمعايير اختيار ERO (على سبيل المثال، هينلاين وآخرون 2023؛ هولويردا وآخرون 2023؛ نونينو وآخرون 2023؛ وانغ وآخرون 2023)، و
أكدت ملاحظات NIRSpec الطبيعة النجمية لعدد قليل منها (لانجيرودي وآخرون 2023؛ بورغاسر وآخرون 2024).
لتحقيق في احتمال تلوث الأقزام البنية في عينة EROs لدينا، ندرس التداخل بين المجموعتين في فضاء اللون-اللون. الشكل 2، يظهر ألوان F115W-F200W مقابل F277W-F444W لجزء كبير من عينة CEERS (مقياس رمادي) و EROs (دوائر ملونة) التي تم تحديدها في القسم السابق (اللوحة المركزية من الشكل 1). في الوقت نفسه، توضح الخطوط السوداء مسارات اللون-اللون للأقزام البنية ضمن نطاق صغير من درجات الحرارة. ) و المعادن -1 و 0 )، تم حسابها باستخدام قوالب الغلاف الجوي النجمي LOWZ (Meisner et al. 2021). تبرز الشكل مرة أخرى الطبيعة المزدوجة الزرقاء-الحمراء لـ EROs بالنسبة لكتلة المجرات، على الرغم من أنه، على هذا الأساس اللوني الأطول، فإن بعض EROs لديها ألوان حمراء قليلاً في إطار UV (متوسط F115W-F200Wضد F150W – F200Wمن المثير للاهتمام أن جميع الأقزام البنية التي لديها ألوان F277W – F444W > 1.5 هي أزرق بكثير من أي من EROs (أي أن لديها انحدارات زرقاء بدلاً من أن تكون مسطحة نسبيًا). بناءً على هذا التوزيع، نتوقع أن تكون التلوث غير موجود تقريبًا بالنسبة لـ EROs مع F115W-F200W.نحدد فقط اثنين من الملوثات المحتملة من الأقزام البنية في عينة من 37 EROs بناءً على ألوانها الزرقاء بشكل أكبر في F115W-F200W. نشير إلى هذه الأجسام في الجدول 1.
بالإضافة إلى ذلك، نستخدم قوالب النجوم القزمة البنية لدراسة ألوانها النموذجية عند أطوال موجات MIRI. نظرًا لأن أطيافها الطيفية لها حد أقصى عند حوالي، تتحول ألوان LW بسرعة إلى الأزرق بالنسبة لـ F 444 W. في المتوسط، نجد MIRI الأزرق F444W-F560Wو F444W-F777Wالألوان، التي تتناقض مع ألوان NIRCam الحمراءكما هو موضح في القسم التالي، يبدو أن الأجسام الغريبة (EROs) لها ألوان حمراء في نطاقات MIRI، مما يستمر في الاتجاه الحاد لمخطط الطيف الطيفي (SED) لنطاقات NIRCAM. وبالتالي، توفر ألوان MIRI مزيدًا من القوة التمييزية للتفريق بين المجرات والأقزام البنية.
3.3. اكتشاف MIRI وطيف NIRSpec للـ EROs
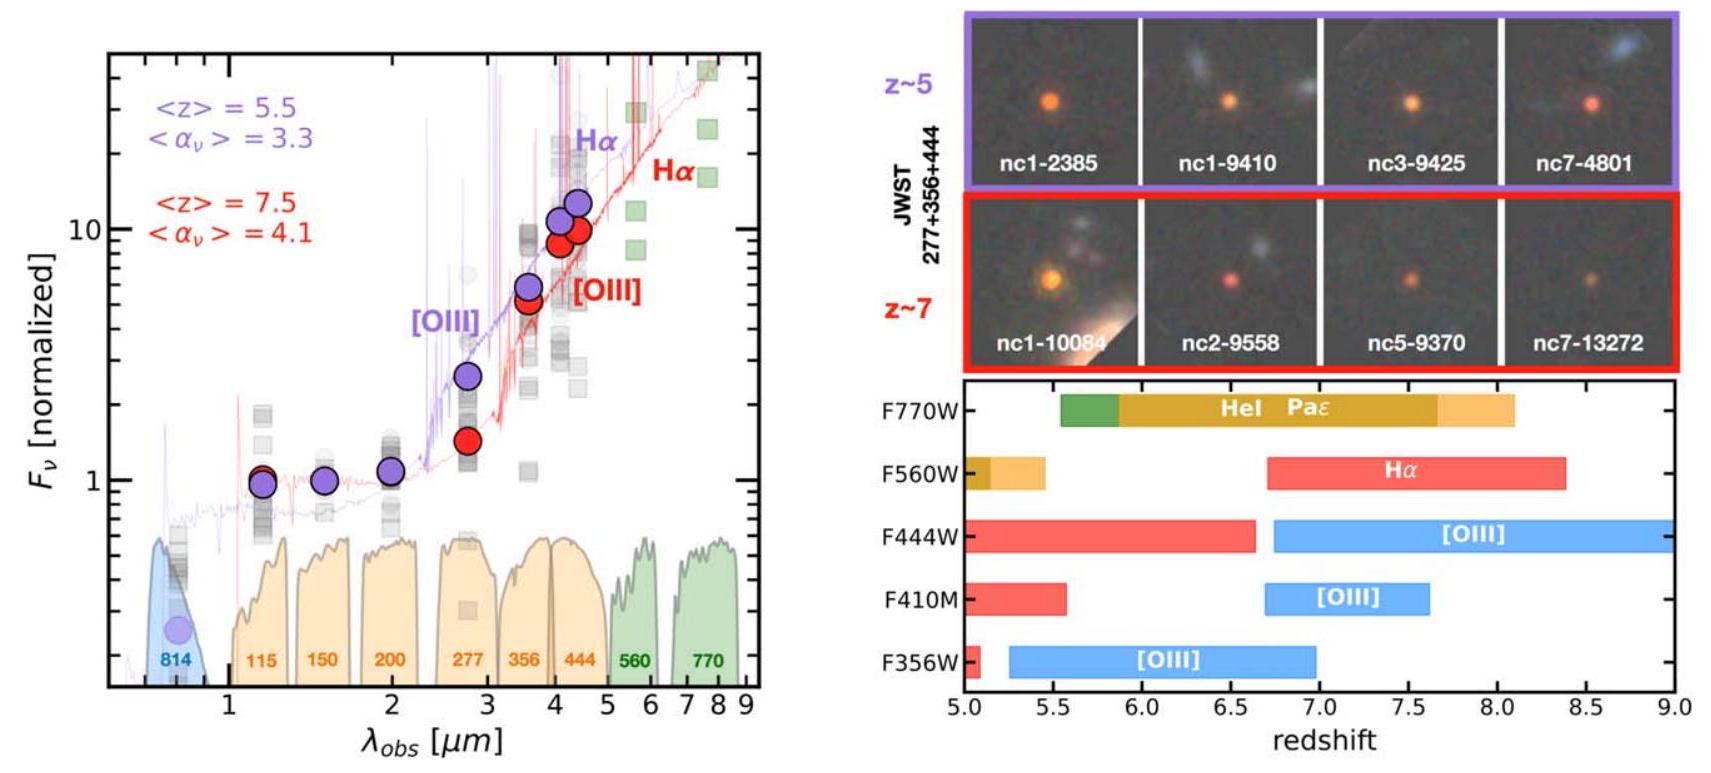
نبحث عن نظائر لـ 37 ERO في ملاحظات CEERS MIRI و NIRSpec. للأسف، تغطية MIRI لموزاييك CEERS/NIRCam محدودة للغاية (أقل منمن المنطقة) ولا توجد أي من النقاط الملاحظة في نطاقات SW و LW في نفس الوقت. بشكل عام، فقط أربعة من نقاط MIRI في F560W و F770W واثنان من النقاط الملاحظة في F1000W وما بعده تتداخل مع تغطية NIRCam. من المدهش أننا نجد اكتشافات واضحة لجميع الأربعة من 37 ERO التي تقع ضمن المنطقة الملاحظة بواسطة MIRI. تم اكتشاف ثلاثة منها في F560W و F770W بمتوسط سطوع و ، على التوالي، وأحدها تم اكتشافه بشكل ضعيف ولكن واضح في F1000W عند 24.6 مغ. بينما من الصعب استنتاج شيء من عينة صغيرة كهذه، فإن النسبة العالية من استعادة الأجسام المرصودة، بالإضافة إلى الميل الأحمر جداً، الشبيه بالقوة، لطيف الطيف الكهرومغناطيسي في نطاقات LW NIRcam، تشير إلى أن الملاحظات اللاحقة لأجسام EROs المختارة بشكل مشابه في مجالات أخرى ذات تغطية MIRI أكثر كثافة من المحتمل أن تسفر عن عدد كبير من الاكتشافات. بالنظر إلى المقدار الوسيط لهذه الأجسام، نتوقع اكتشافات في F560W و F777W فينطاق المغناطيس، الذي يقع بوضوح ضمنحدود للاستطلاعات المشابهة لـ CEERS، مثل PRIMER أو COSMOS-Web. لاحظ أيضًا أن أعلاه، الـتحول خطوط الانبعاث إلى فلتر F560W (انظر المناقشة في القسم 4.3)
الجدول 1 مبادرات MIRI و NIRSpec في مجلة الفيزياء الفلكية، 963:128 (23 صفحة)، 10 مارس 2024
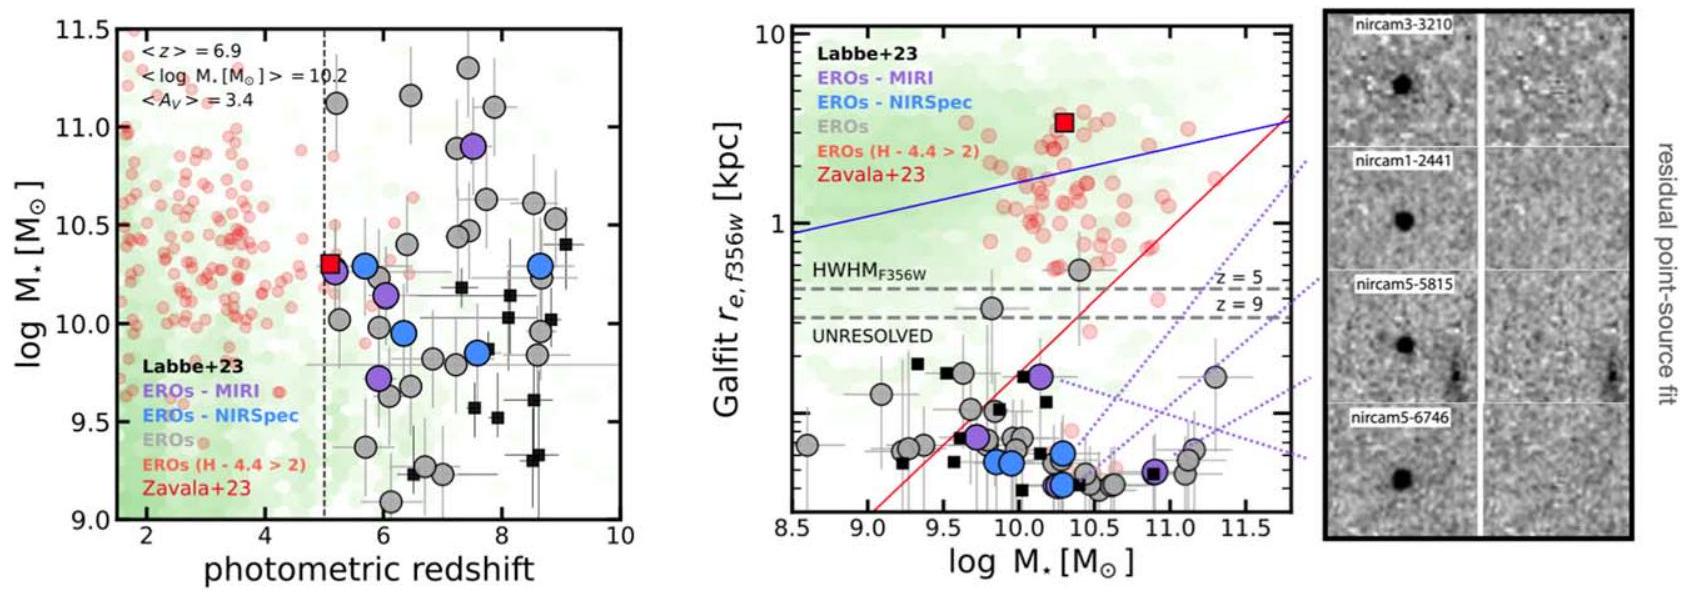
الشكل 3. اليسار: مخطط الانزياح الأحمر الفوتومتري مقابل الكتلة النجمية السريعة لـ EROs F277W (دوائر، مشفرة بالألوان كما في الشكل 1)، عينة مجرات CEERS (خريطة كثافة خضراء)، و EROs F150W (أحمر). للمقارنة، نعرض أيضًا المجرات من Labbé et al. (2023) باستخدام انزياحاتهم وكتلهم النجمية (مربعات). تعتبر EROs F277W ذات كتلة نسبية كبيرة،، ومغبر، ماج ويمتد نطاق الانزياح الأحمر. بشكل عام، تعتبر EROs F277W من بين أكثر المجرات ضخامة عند انزياحها الأحمر، لكنها أقل ضخامة من EROs F150W عند انزياح أحمر أقل، مما يتبع الانخفاض المتوقع في عدد المجرات الضخمة جداً مع انزياح الأحمر. ومع ذلك، فإن بعضاً منها أكثر ضخامة بكثير ( )، مما يشير إلى أنه قد تكون هناك قيود في ملاءمة SEDs ثنائية الوضع الخاصة بهم أو ربما أن استمراريتهم ليست نجمية، بل تهيمن عليها AGN (انظر المناقشة في القسم 5). اليمين: الكتلة النجمية مقابل نصف القطر الفعال F356W لنفس المجرات. بالنسبة لمجرات لابي et al. (2023) نستخدم تقديرات نصف الأقطار الفعالة لدينا. تُظهر الخطوط الزرقاء والحمراء علاقات الكتلة والحجم لمجرات تتشكل نجومياً ومجرات هادئة من van der Wel et al. (2014). تشير الخطوط المنقطة إلى حد الدقة التقريبي من نصف العرض عند نصف الحد الأقصى (HWHM) لـ PSF في F356W (FHWM 15) في و من المRemarkably، يبدو أن جميع مصادر EROs F277W غير محلولة وتظهر كنقاط ضوئية، على عكس الانتشار النموذجي لمصادر EROs F150W وغيرها من المجرات الضخمة. نجد نتائج مشابهة في نطاقات NIRCam الأخرى، مما يشير إلى أن EROs غير محلولة في جميع الأطوال الموجية. تُظهر الألواح على اليمين أفضل تطابقات لدالة النقطة في F444W لأربع مجرات مع اكتشافات MIRI، والتي تظهر بقايا ضئيلة.
الذي قد يعزز التدفق بشكل أكبر ويسهل الكشف.
بالإضافة إلى اكتشافات MIRI، تم رصد أربعة EROs أخرى كجزء من مسح CEERS NIRSpec. جميعها تحتوي على خطوط انبعاث واضحة توفر تقديرًا قويًا لانزياحاتها الحمراء. تم تقديم ومناقشة اثنين منها بالفعل في Fujimoto et al. (2023) و Kocevski et al. (2023)، nircam3-2232 و nircam3-3210، على التوالي. المجرتان فيعرض فقط واكتشافات [O III]، بينما الآخران في عرضأيضًا. المجرة التي تم مناقشتها في كوستفسكي وآخرون (2023)، عندهو الوحيد الذي لديه كشف مستمر ويظهر خطًا عريضًاانبعاث، مما يؤكد أنه نجم نشط. جميع المجرات لديها مستويات منخفضة نسبياً III ومع ذلك، كما أشار كوتسيفسكي وآخرون (2023)، فإن نسب خطوط الانبعاث الضيقة مشابهة جدًا لتلك الخاصة بالمجرات التي تشكل النجوم (SFGs) التي تم رصدها عند انزياحات حمراء مماثلة، مما يعني أن تشخيص AGN بناءً على نسب الخطوط قد لا يكون فعالًا بشكل خاص في.
4. خصائص EROs
4.1. الانزياحات الضوئية والكتل النجمية
تظهر اللوحة اليسرى من الشكل 3 التوزيع العام لـ F277W EROs في الانزياح الأحمر الفوتومتري وكتلة النجوم مقارنةً بمعظم عينة CEERS (خريطة الكثافة الخضراء) وعينة F150W EROs من الشكل 1 (باللون الأحمر). بشكل عام، فإن F277W EROs تعتبر ذات كتلة نسبية عالية وغنية بالغبار مع قيم متوسطة لـ و المغ، مشابه لتلك المبلغ عنها في لابي وآخرون (2023) لـالسكان. يتراوح توزيع الانزياح الأحمر بينبمتوسط قدره. هذا يشير إلى أن ما يقرب من نصف العينة عند انزياحات حمراء، كما اقترح بيريز-غونزاليس وآخرون (2023أ). نحن نزيل كائنًا واحدًا عندلتحقيق التجانس، لكن اختيار الألوان، بشكل عام، فعال جداً في تحديد المجرات فيكما هو متوقع من اختيار الألوان، تميل EROs إلى أن تكون من بين الأكثر ضخامة. المجرات عند انزياحها الأحمر (أي، بالنسبة للخريطة الخضراء). بالمقارنة مع EROs الأخرى في F150W عند انزياح أقل، تميل EROs في F277W إلى اتباع الانخفاض المتوقع في عدد المجرات الضخمة جداً،، مع انزياح نحو الأحمر. ومع ذلك، نجد عددًا قليلاً من المجرات ذات الكتل الكبيرة،حتى في، والتي، إذا تم تأكيدها، سيكون من الصعب التوفيق بينها وبين وظائف الكتلة النجمية المرصودة (SMFs) وكذلك نماذج تطور المجرات (على سبيل المثال، انظر المناقشة في Boylan-Kolchin 2023). وليس من المستغرب أن تكون هذه المجرات أيضًا من بين الأكثر سطوعًا في F444W بحوالي 1 أو 2 مغ بالنسبة للوسيط في العينة. إن موثوقية تقديرات الكتلة النجمية هي بالفعل واحدة من الأسئلة الأساسية حول هذه EROs ذات الأطياف الطيفية غير العادية. القيم التي تم مناقشتها في هذا القسم تم حسابها باستخدام FAST بناءً على افتراضات نمذجة نموذجية (انظر القسم 2.3)، والتي تعمل بشكل جيد لمعظم المجرات عند الانزياحات الحمراء المنخفضة إلى المتوسطة. ومع ذلك، قد تكون لهذه الطريقة قيود بالنسبة لهذه EROs (على سبيل المثال، بسبب خطوط الانبعاث القوية أو التعتيم الشديد). في القسم 5، نقوم بتحليل تأثير استخدام رموز مختلفة وافتراضات نمذجة على الكتل النجمية المستنتجة بالتفصيل.
4.2. الأحجام والأشكال
تظهر اللوحة اليمنى من الشكل 3 توزيع EROs F277W في مخطط الكتلة النجمية مقابل الحجم مقارنةً بـ EROs F150W عند“، والتوزيع العام للمجرات في كتالوج CANDELS F160W في المنطقة المتداخلة مع CEERS (خريطة الكثافة الخضراء). تم اشتقاق قياسات CANDELS من ستيفانون وآخرون (2015) وفان دير ويل وآخرون (2014). يتم تمثيل الأحجام بواسطة نصف القطر الفعال،، من ملاءمة ملف سيرسيك (شميت 1968) التي تم تنفيذها باستخدام GALFIT v3.0.5 (بينغ وآخرون 2002) في نطاق F356W. تم تشغيل الكود على الصور التي تم طرح الخلفية منها بحجم 2.5 مرة من نصف قطر كرون. تم استخدام مصفوفة، تشمل ضوء السماء الخلفي، وضوضاء بواسون، وضوضاء القراءة، كخريطة ضوضاء مدخلة. تم بناء PSFs تجريبية باستخدام النجوم في جميع نقاط CEERS. جميع المجرات في القطع المصورة ضمن
الشكل 4. اليسار: الطيف الطاقي المتراكم لـ 37 كائنًا من EROs (مربعات رمادية) مقسمة إلى مجموعتين أدناه وأعلاه، الموضحة باللونين الأرجواني والأحمر، على التوالي. يتم عرض فوتومترية MIRI باللون الأخضر. جميع المجرات تظهر طيف انبعاث ثنائي الشكل مميز. تمثيلات أفضل تطابق لطيف الانبعاث باستخدام EAZYPy في و (الخطوط الصلبة الأرجوانية والحمراء، على التوالي) تظهر أن شكل SED الغريب هذا يتم إعادة إنتاجه عادةً بواسطة SED مركب مع استمرارية زرقاء مسطحة في نطاق الأشعة فوق البنفسجية في إطار الراحة واستمرارية حمراء شديدة في البصري. في الواقع، فإن أفضل قانون قوة يتناسب مع التدفقات الحمراء لـ F 277 W كبير جدًا ( )، مما يدل على استمرارية حمراء بشدة. كما تبرز SEDs المكدسة الفرق في F277W حيث تنتقل النطاقات من الميل الحاد إلى الميل المسطح مع زيادة الانزياح الأحمر. اليمين (الأعلى): 2 !” !” 5 قصاصات من EROs في حوضي الانزياح الأحمر يظهرون مظهرهم البصري المدمج والخالي من الميزات بشكل مشابه. اليمين (أسفل): قائمة ببعض أقوى خطوط الانبعاث التي يمكن أن تسبب بشكل محتمل زيادة مدفوعة بخطوط الانبعاث في فوتومترية NIRCAM وMIRI عند انزياحات حمراء مختلفة. مواقع أقوى وتم الإشارة أيضًا إلى خطوط [O III] في اللوحة اليسرى.
تم ضبط 3 مغ من المصدر الرئيسي في نفس الوقت. تم إخفاء جميع المصادر الأخرى أثناء الضبط. تم السماح لمتغيرات الضبط بالتغير ضمن الحدود المعقولة التالية: مؤشر سيرسيتش (نصف القطر الفعال ( بكسل)، نسبة المحور ( )، الحجم ( المغ من القيمة الأولية)، والموقع (بكسلات من القيمة الأولية).
بشكل عام، نجد أنه بينما تميل EROs من F150W إلى التداخل مع غالبية عينة المجرات، تتوزع بين العلاقات المتوقعة للكتلة والحجم للمجرات النشطة والمستقرة (الخطوط الزرقاء والحمراء من فان دير ويل وآخرون 2014 فيجميع EROs F277W صغيرة للغاية، تحت حدود الدقة بشكل منهجي بغض النظر عن كتلها النجمية. أفضل ملاءمة لـ GALFIT009 (0.3 بكسل) يعود في معظم الحالات إلى الحد الأدنى المطلق المحدد للتناسب، مما يشير إلى أن المجرات غير مُحللة. الخطوط المتقطعة تشير إلى الأحجام الدنيا القابلة للقياس تقريبًا كـ HWHM لـ PSF. ) في و تقريبًا. نستكشف أيضًا قياسات حجم الـ EROs في F200W و F277W و F444W، ونحصل على نتائج مشابهة تشير إلى أنها غير محددة في جميع الأطوال الموجية المرصودة. لاحظ أن الـ EROs عادة ما تكون خافتة جدًا (في جميع نطاقات SW NIRcam، وفي معظم الحالات، لديهم فقط عدد قليل من البكسلات الساطعة للتناسب. أخيرًا، نقوم أيضًا بتناسب ملفات الثمانية EROs مع اكتشافات MIRI وNIRSpec باستخدام PSFs شبيهة بالنقاط ونجد توافقًا ممتازًا مع بقايا ضئيلة (اللوحة اليمنى من الشكل 3)، مما يشير إلى أنهم غير محلولين بالفعل.
4.3. النتائج العامة لنماذج SEDs والسيناريوهات المحتملة للنمذجة
تظهر اللوحة اليمنى من الشكل 4 توزيع الطاقة الطيفية المتراكمة لجميع الكائنات ذات الألوان الزاهية (EROs) التي تم تطبيعها إلى الوسيط للكونتينوم UV المسطح نسبيًا الذي تتبعه F115W وF150W وF200W، مقسمة إلى مجموعتين عند الانزياحات الحمراء التي تقل عن وتزيد عنمع الأرجواني وأقلام حمراء، على التوالي. كلا المجموعتين تظهران الأطياف الطيفية الثنائية المميزة التي تم مناقشتها في القسم 3، والتي تتكون من ألوان حمراء للغاية فيمع ميل قانون القوة الثابت نسبيًا، وانبعاث مسطح في الأطوال الموجية الأقصر. عادةً ما يرتبط الانبعاث الأحمر، الشبيه بالقوة، بكميات كبيرة من التوهين الناتج عن الغبار. ومع ذلك، كما تم مناقشته في القسم 3.1، من الممكن أيضًا أن يكون التدفق في بعض فلاتر LW مدعومًا جزئيًا بخطوط انبعاث قوية، مما يجعل الألوان أكثر احمرارًا من الاستمرارية النجمية الأساسية. يبرز اللوحة اليمنى من الشكل 4 موقع بعض من أقوى الخطوط التي يمكن أن تعزز الانبعاث في فلاتر مختلفة كدالة من الانزياح الأحمر. عند ، الـويمكن أن تتلوث خطوط [O III] بمرشحات F444W وF356W بينما يستكشف F277W الاستمرارية نحو الأحمر مناستراحة. في، تتحول نفس الخطوط إلى F444W وMIRI/F560W بينما يستكشف F356W الاستمرارية الحمراء. إن متوسط التدفقات المجمعة في F277W وF356W لمجموعات الانزياح الأحمر المنخفض والعالي أعلى بوضوح من الاستمرارية المسطحة في إطار الأشعة فوق البنفسجية، مما يشير إلى أن هناك على الأقل بعض الانبعاث المستمر نحو الأحمر من. علاوة على ذلك، سيكون من الصعب إعادة إنتاج ميل قانون القوة الثابت الذي يمتد عبر نطاقي NIRCam وMIRI مع انزياح طيفي منخفض نسبيًا.خطوط الانبعاث، حيث أنه عادةً ما يجب أن لا تتأثر على الأقل واحدة، ولكن من المحتمل أن تتأثر عدة نطاقات، بأكثر خطوط الانبعاث بروزًا.
ومع ذلك، فإن التغير الملحوظ جدًا في الميل من المناطق الطيفية الزرقاء إلى الحمراء يصعب أيضًا نمذجته من حيث استمرارية نجمية واحدة. في الواقع، فإن أفضل القوالب المتوافقة من EAZYpy عند و الموضح في اللوحة اليسرى من الشكل 4 غالبًا ما يكون مركبًا من نموذجين بأعمار نجمية وكتل وامتصاصات غبارية مختلفة جدًا: من جهة، مجرة شابة ذات كتلة منخفضة وامتصاص منخفض (أي، مجرة نموذجية من نوع Lyman-break) ومن جهة أخرى، مجرة أكثر كتلة وغبارًا. ونتيجة لذلك، فإن الاستنتاج عادةً ما تكون الكتلة النجمية والانقراض للمركب كبيرة جدًا، لأنها تتأثر بشكل كبير بنسبة الكتلة إلى الضوء الأكبر في المجرة الأقدم.
مؤخراً، ناقشت أعمال أخرى (مثل، إندسلي وآخرون 2023؛ فورتاك وآخرون 2023) إمكانية أن تكون الأطياف الطيفية لبعض هذه الكائنات ذات الانزياح الأحمر الشديد (EROs) قابلة للتفسير جزئياً أو كلياً بواسطة خطوط انبعاث قوية جداً مدفوعة بواسطة نوى مجرية نشطة (AGN). وجود خطوط انبعاث ذات عرض مكافئ عالٍ (يمكن أن تعزز خطوط الانبعاث التدفق في جميع الفلاتر حيث إنها ليست مقيدة فقط بألمع خطوط الانبعاث الناتجة عن تكوين النجوم. وبالمثل، يمكن أيضًا تفسير الأطياف الغريبة من حيث الانبعاث المستمر من AGN الذي يتفوق على مضيف المجرة في مناطق طيفية مختلفة. تم استكشاف هذه الإمكانية مؤخرًا في Kocevski et al. (2023) لأحد EROs فيمع ملاحظات NIRSpec، والتي تم تضمينها أيضًا في عينتنا (nircam3-3210). تم مناقشة هذه المجرة أيضًا في لابيه وآخرون (2023) لكن التقدير للز التصويري كان أعلى بكثير،هذا يبرز مرة أخرى المخاطر المحتملة في نمذجة SED لهذه المجرات. اقترح كوتسيفسكي وآخرون (2023) بعض السيناريوهات التي تهيمن عليها AGN حيث يمكن تفسير SED من خلال: (1) كائن شبه نجمي (QSO) مغطى بشكل كبير يهيمن على تدفقات LW ونسبة صغيرة من الضوء المتناثر من مكون الخط العريض الذي يسبب الانبعاث الأزرق وSW (على سبيل المثال، كما في نموذج التوروس لبوليتا وآخرون 2006)؛ (2) كائن شبه نجمي مغطى بشكل كبير يهيمن على تدفقات LW بالإضافة إلى مضيف مجرة زرقاء منخفضة الكتلة، والتي تهيمن على تدفقات SW؛ أو (3) كائن شبه نجمي من النوع 1 أزرق يهيمن على تدفقات SW في مجرة نجمية غبارية، والتي بدورها تهيمن على انبعاث LW. الأخير مشابه أيضًا لسيناريو QSO الأحمر في فوجيموتو وآخرون (2022).
من المهم أن العديد من هذه السيناريوهات المختلفة يمكن تأكيدها أو استبعادها من خلال ملاحظات إضافية مثل طيف NIRSpec في Kocevski وآخرون (2023) أو من خلال فوتومترية إضافية عند أطوال موجية أطول من JWST/MIRI. على سبيل المثال، أظهر Papovich وآخرون (2023) وRinaldi وآخرون (2023) مؤخرًا أن العديد من مجرات Lyman-break الزرقاء ذات الكتلة المنخفضة فيمع الزيادات المدفوعة بخطوط الانبعاث في F444W، توجد اكتشافات واضحة في MIRI عند F560W وF777W يمكن أن تتبع الاستمرارية في منطقة طيفية بدون خطوط انبعاث بارزة. بالنسبة لهذه EROs، يمكن لاكتشافات MIRI في الاستمرارية البصرية في إطار الزمان أن تميز بين السيناريوهات حيث تكون الألوان البصرية الحمراء مدفوعة أساسًا بخطوط انبعاث ذات عرض مكافئ مرتفع مقابل أي نوع من الانبعاث المهيمن على الاستمرارية من مجرة حمراء مغبرة أو كائن كوانتي. في القسم 5، ندرس احتمالية وآثار السيناريوهات المختلفة الموضحة أعلاه من خلال تحليل مفصل لنمذجة SED لأربعة مجرات مع قيود فوتومترية إضافية من MIRI وأربعة مجرات مع انزياحات طيفية من NIRSpec. في القسم 6، نستخدم تلك النتائج لإبلاغ المناقشة حول ما سيكون السيناريو الأكثر احتمالًا لجميع سكان EROs.
5. نمذجة SED للأجسام ذات الانزياح الأحمر الكبير المكتشفة بواسطة MIRI و NIRSpec
5.1. نمذجة الرموز
في هذا القسم، نقوم بإجراء نمذجة أكثر تفصيلاً لمخططات الطيف الطيفي للأجسام الثمانية EROs باستخدام ملاحظات MIRI وNIRSpec، مستندين إلى المخططات المستمدة من فوتومترية الفتحة الدائرية الموضحة في القسم 2.2 ومجموعة متنوعة من الأكواد التي تهدف إلى استكشاف احتمالية السيناريوهات المختلفة للغلاكسات المغبرة مقابل AGN المحجوبة التي تم توضيحها في القسم السابق. تفصيلياً يوفر الملحق أ وصفًا لافتراضات النمذجة المعتمدة لكل كود. باختصار، نستخدم EAZYpy (بريمر وآخرون 2008)، Synthesizer (بيريز-غونزاليس وآخرون 2008أ)، Prospector (جونسن وآخرون 2021)، وكود مخصص لإجراء ملاءمة هجينة لنماذج السكان النجميين من Prospector مع قوالب AGN من بوليتا وآخرون (2006). تستند ملاءمات EAZYpy إلى نفس مجموعة القوالب الافتراضية المستخدمة في القسم 2.3. تستخدم عملية Synthesizer تاريخًا زمنيًا للنجوم بارامترية، متبعةً تأخيرًا-وظيفة تتميز بنماذج تجمع النجوم لبروزوال وتشارلوت (2003)، وقانون التخفيف لكالزتي وآخرون (2000)، وانبعاث غازي يتبع فيرلاند وآخرون (1998). مع بروسبكتور، نستخدم ثلاث خيارات مختلفة: (1) نموذج مرجعي مع تأخير بارامتري –قانون التوهين لـ SFH و Calzetti وآخرون (2000)؛ (2) تاريخ تكوين النجوم غير المعلمي استنادًا إلى أولويات الاستمرارية لـ Pro-spector- (على سبيل المثال، Leja وآخرون 2019 أو Tacchella وآخرون 2022) ولكن بحد أقصى لعمر 100 مليون سنة وباستخدام قانون التخفيف لـ Calzetti وآخرون (2000)؛ و (3) تاريخ تكوين النجوم غير البارامترية مشابه مع نموذج أكثر تعقيدًا لتخفيف الغبار استنادًا إلى Charlot & Fall (2000) و Kriek & Conroy (2013). جميع الخيارات الثلاثة تعتمد على نماذج FSPS (Conroy وآخرون 2009) وتشتمل على انبعاث غازي من النجوم الشابة. كما أن لديها عددًا من الافتراضات النمذجة الأخرى المشتركة (المعدنية الغازية والنجومية، معامل التأين، إلخ) الموضحة في الملحق. تهدف الخياران الأولان إلى استكشاف تأثير استخدام تاريخ تكوين النجوم البارامترية/غير البارامترية ونماذج السكان النجميين المختلفة بالنسبة لـ Synthesizer، بينما يركز الثالث على تأثير قانون التخفيف للغبار. النموذج الأخير لطيف الانبعاث الطيفي هو هجين بين مجرة و QSO محجوب بالغبار. هنا نفترض أن الانبعاث في نطاقات LW NIRCam و MIRI يهيمن عليه بشكل كبير QSO محجوب تم نمذجته بعد QSO2 من Polletta وآخرون (2006)، بينما يأتي التدفق في التدفقات SW من مضيف المجرة. كما نعرض الملاءمات لقالب QSO الأزرق جوهريًا، QSO1 من Polletta وآخرون (2006)، مع مبني مرة أخرى على قانون التخفيف من كالزتي. بينما يتناسب هذا النموذج بشكل أسوأ من نموذج QSO2، إلا أنه مفيد لتوضيح الفروق ويوفر وسيلة لتقدير اللمعان الكلي لـ QSO من الانبعاث غير المحجوب. نقوم بتناسب نموذج QSO في ثلاث خطوات. أولاً، نقوم بملاءمة خشنة لنموذج QSO2 مع تدفقات LW، ثم نقوم بملاءمة جميع القياسات الضوئية بطرح التدفقات الأفضل ملاءمة من نموذج QSO باستخدام Prospector المتأخر.النماذج، وأخيرًا، نقوم بإجراء ملاءمة متزامنة مع نموذج QSO لبيانات SED الخاصة بالمجرات المستمدة من الخلفية الناتجة عن ملاءمة Prospector. النتائج من هذه الطريقة مشابهة لتلك التي تم الحصول عليها باستخدام النسخة المعدلة من FAST (Aird et al. 2018) المستخدمة في Kocevski et al. (2023). ميزة ملاءمة Prospector هي أنها تشمل خطوط الانبعاث التي يمكن أن تساعد في تعزيز قيود نموذج QSO المحجوب، الذي يحتوي على مجموعة ثابتة من خطوط الانبعاث. على الرغم من أن هذه ليست طريقة AGN متسقة تمامًا، إلا أنها تساعد في حساب مساهمة خطوط الانبعاث في الفوتومترية.
5.2. الانزياحات الضوئية الفوتومترية لأربعة EROs مع اكتشافات MIRI
تجعل الخصائص الغريبة لمخططات SEDs الخاصة بـ EROs والاحتمالات العالية بأن بعض التدفقات معززة جزئيًا على الأقل بواسطة خطوط الانبعاث، تقديرات الانزياح الأحمر الفوتومتري واحدة من المعلمات الرئيسية وربما واحدة من الأكثر إشكالية. لهذا السبب، نقوم بتشغيل EAZYpy مرتين، أولاً باستخدام الافتراضات النموذجية الافتراضية ومرة ثانية باستخدام النماذج المحدثة مؤخرًا التي تتضمن نموذج مجرة زرقاء مع
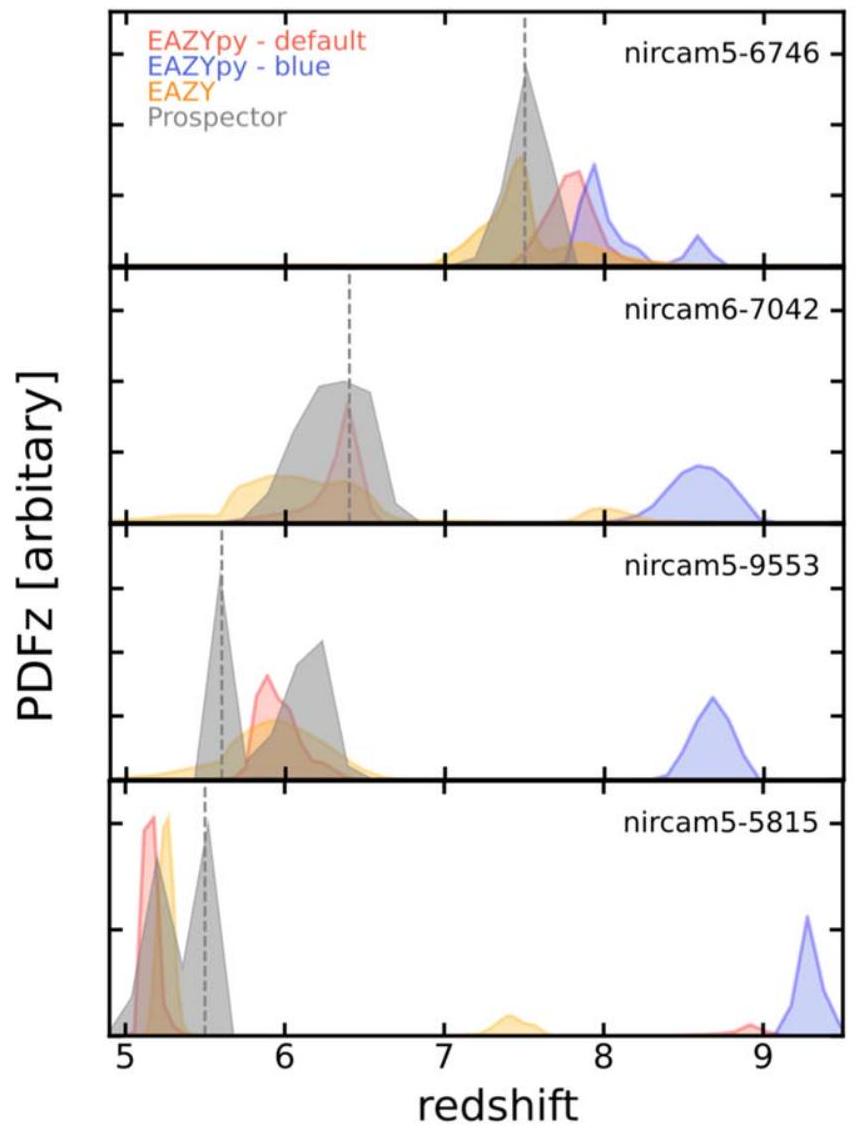
الشكل 5. توزيعات الانزياح الأحمر الفوتومتري (PDFz) لأربعة EROs تم اكتشافها بواسطة MIRI تم حسابها باستخدام EAZY وEAZYpy وProspector. تتفق PDFzs المستمدة من النسخ الافتراضية والزرقاء من قوالب EAZYpy بشكل جيد مع بعضها البعض ومع تقديرات Prospector لجميع المجرات. بالنسبة للمجرات الثلاث عندتشير ملفات PDF المستندة إلى القوالب ذات الخطوط العالية جدًا (باللون الأزرق) إلى وجود قمة ثانوية عند انزياح أحمر أعلى، وهو ما لا تدعمه الاكتشافات في F150W. الفرق الرئيسي بين الانزياح المنخفض والعالي-القمم عادة ما تكون فائضًا مدفوعًا بخطوط الانبعاث في F444W والذي يمكن أن يُعزى إلىأو [OIII]، على التوالي (انظر أيضًا الشكل 4).
خطوط انبعاث قوية وعالية الطاقة مشابهة لتلك التي لوحظت في طيف NIRSpec الأخير لـالمجرات. نحن أيضًا ندرج في التحليل توزيعات احتمالية الانزياح الأحمر (PDFz)، الموضحة في الشكل 5، والقيم المحسوبة في Finkelstein et al. (2023a) باستخدام النسخة الأصلية من EAZY مع مجموعة قوالب محدثة تم تحسينها للانزياح الأحمر العالي المقدمة في Larson et al. (2023). لا تشمل هذه التقديرات تدفقات MIRI وبالتالي تسمح لنا بتقييم تأثير الفوتومترية الإضافية في احتمالية الانزياح الأحمر. أخيرًا، ندرج أيضًا تقدير PDFz من التناسب القياسي Prospector الموصوف في القسم السابق. nircam5-5815. تتفق الحلول الأساسية EAZYpy وProspector على قيمة لأي قويسيؤدي الانبعاث إلى زيادة التدفقات في F410M و F444W. هناك حل ثانوي عندالذي يتسبب فيه اللون الأحمر F277W – F444W بسبب كسر بالمر قوي. ومع ذلك، عند هذا الانزياح الأحمر، يجب أن تكون المجرة غير مرئية في F150W، والمجرة تم اكتشافها بوضوح فيلذلك، نتبنى الحل ذو الانزياح الأحمر المنخفض كالحل الرئيسي. nircam5-9553. توزيعات الانزياح الأحمر الفوتومتري من EAZYpy وprospector متسقة إلى حد كبير، حيث تصل إلى ذروتها حواليعند هذا الانزياح الأحمر، III و يمكن أن تساهم الخطوط في التدفق في F356W و F444W ولكن ليس في F410M (أو على الأقل ليس بشكل كبير). هناك قمة ثانوية عند الذي ينتج أيضًا ملاءمة جيدة نسبيًا. ومع ذلك، كما في المجرة السابقة، سيتطلب ذلك أن يكون تدفق F150W غير موجود، والمجرة ضعيفة ولكن تم الكشف عنها بوضوح في تلك النطاق. لذلك نعتبر حل الانزياح الأحمر المنخفض هو الحل الرئيسي. nircam6-7042. هذه هي المجرة الوحيدة التي تم رصدها في نطاقات LW MIRI. لديها اكتشاف خافت ولكن واضح في F 1000 W لكنها لم تُكتشف في F1500W. على غرار المجرات المذكورة أعلاه، يظهر PDFz قمة رئيسية عندوقمة ثانوية عندالذي هو أقرب إلى القيمة المقدمة في لابيه وآخرون (2023)،. تحاول الحلول المختلفة ملاءمة الزيادة في F444W بالنسبة إلى F410M مع خط انبعاث قوي، إما أو [O III] عند المستويات المنخفضة والعاليةعلى التوالي. ومع ذلك، نلاحظ أن تدفق F277W لهذا المصدر يتجاوز الاستمرارية المسطحة نسبيًا التي تحددها نطاقات SW، مما يشير إلى أنه قد يكون عينة من الاستمرارية نحو الأحمر بعد كسر 4000 أنغستروم، وبالتالي يفضل الحل المنخفض الز. يبدو أن قياسات F277W في لابيه وآخرون (2023) أضعف وأقرب إلى النطاقات الزرقاء، مما قد يفضل الحل العالي الز. عند الانزياح الأحمر للحلّين المحتملين، لا يزال اكتشاف F 1000 W (والحد الأعلى في F 1500 W) يستكشف أطوال موجية في إطار الراحة أقصر من ت bump وبالتالي لا يمكن أن تساعد في التمييز بينهما. نيركام5-6746. تقدم هذه المجرة PDFz مركزة حولدون وجود قمم ثانوية عند انزياحات حمراء مختلفة بشكل ملحوظ. كما أن سطوع تدفق MIRI في F560W مقارنة بـ F770W يدعم أيضًا انزياحًا قدره، مما يشير إلى أن هناك قوة الإشعاع يعزز التدفق في F 560 W وبالمثل [O III] في F410M وF444W. يتم مناقشة هذه المجرة أيضًا في أكينز وآخرون (2023) مع انزياح ضوئي فوتومتري مشابه وتوافق في ملاءمة السكان النجميين.
5.3. خصائص الملاءمة الأفضل و SEDs
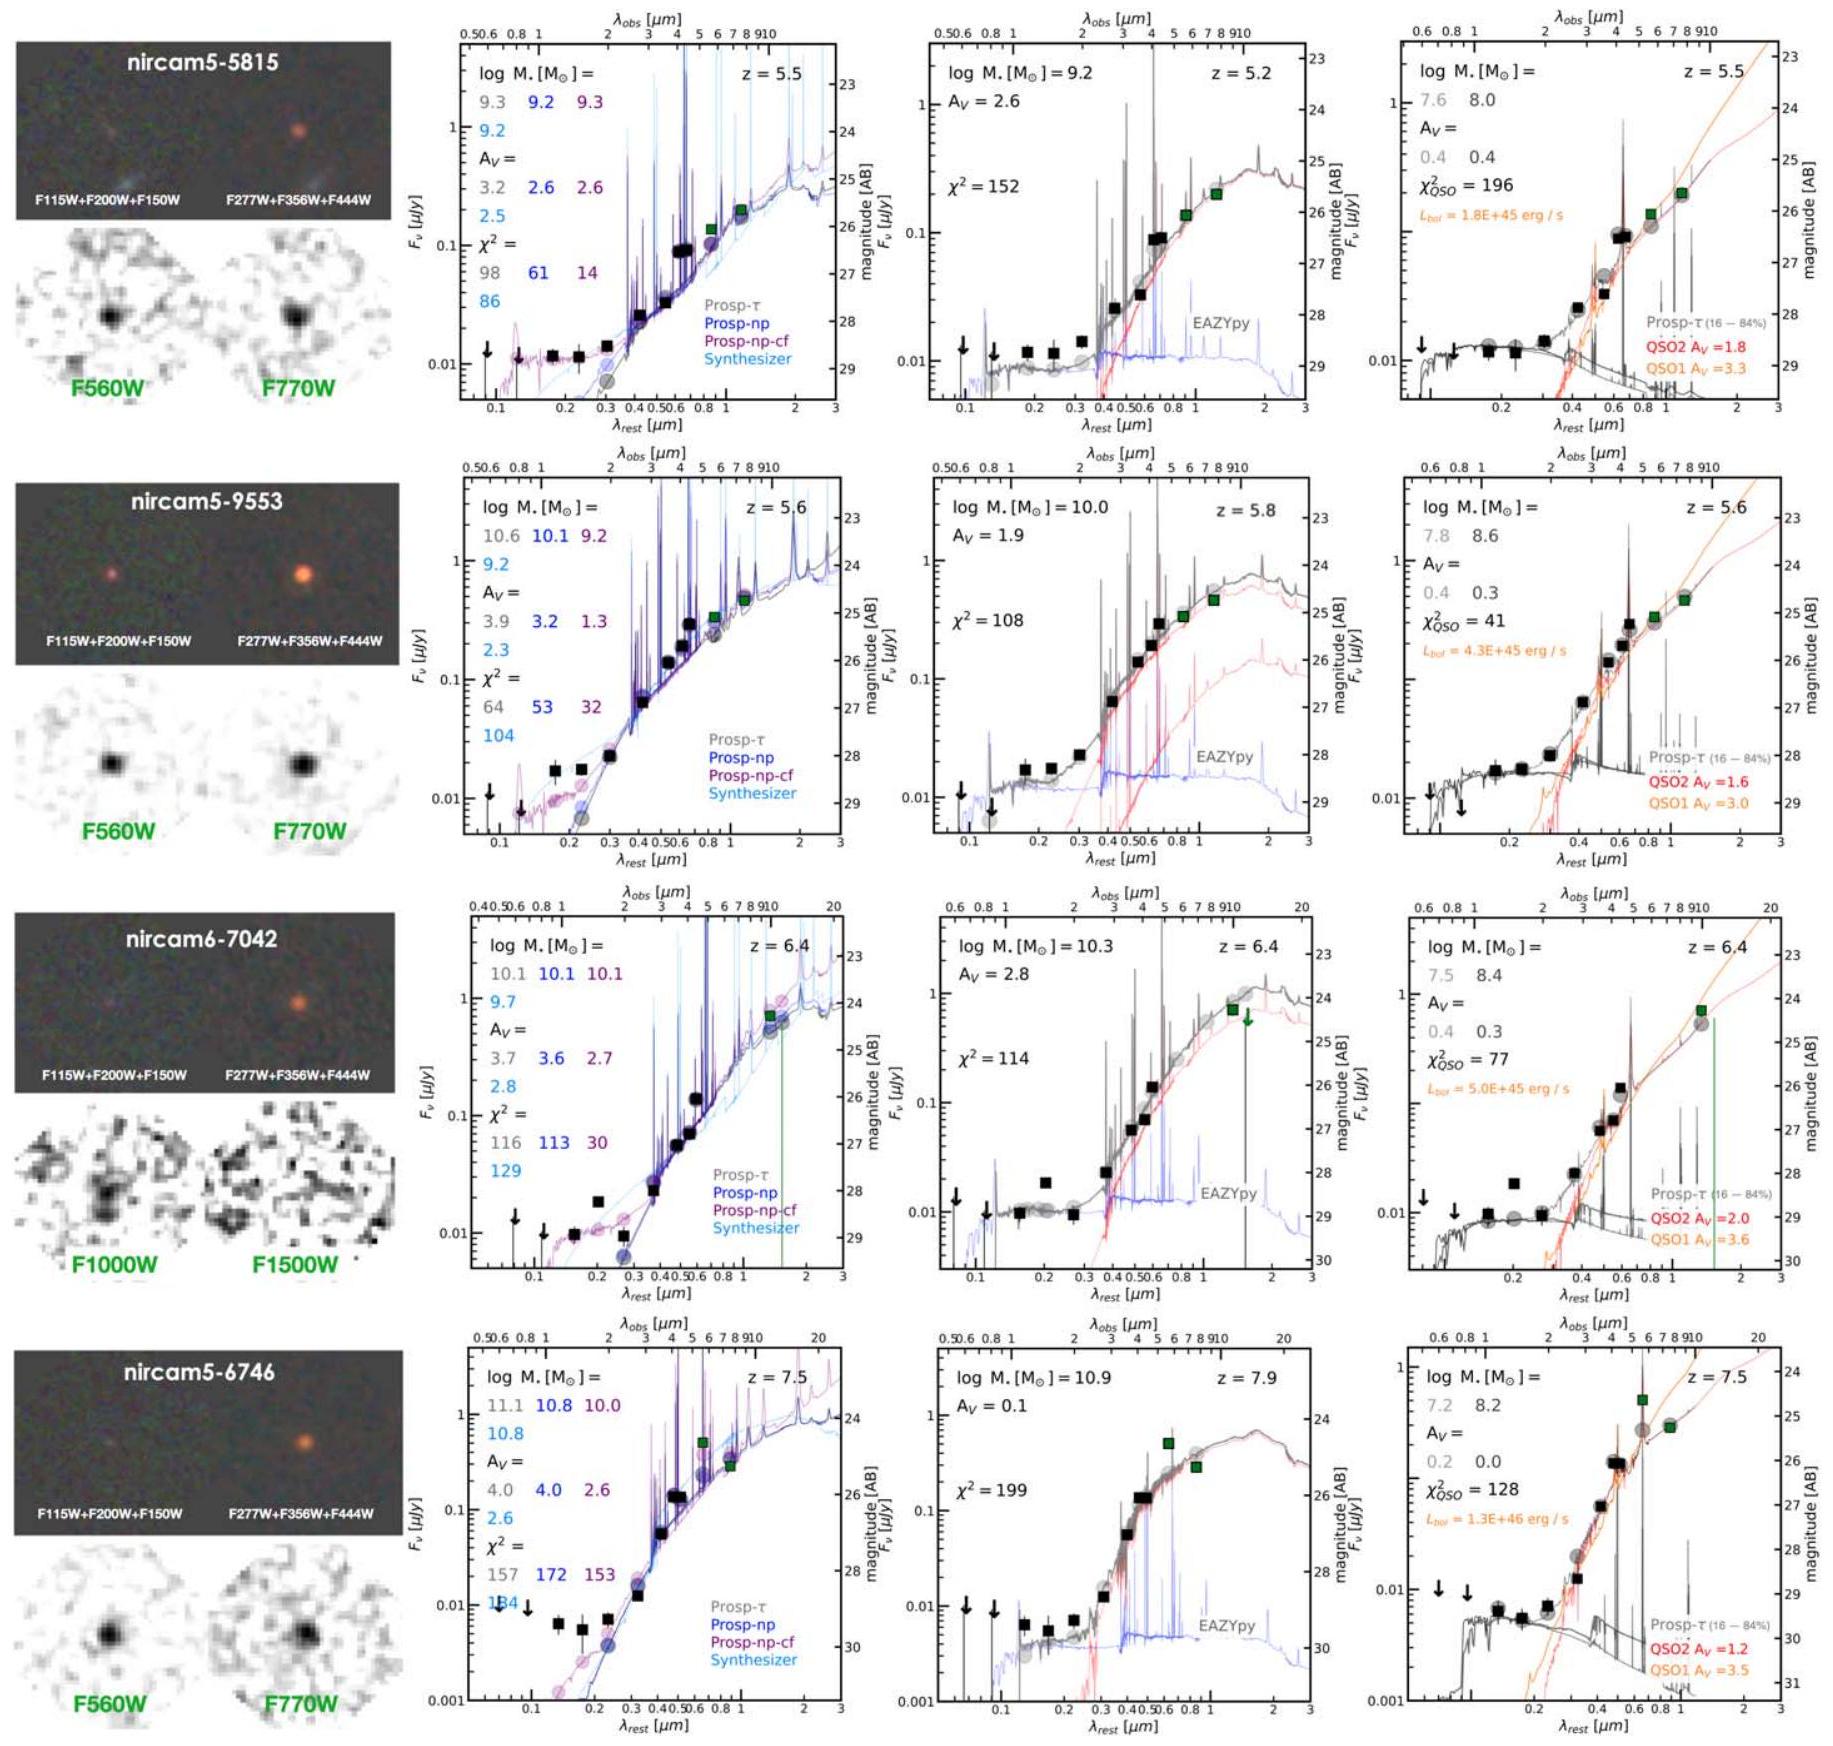
تظهر الأشكال 6 و 7 الصور متعددة النطاقات، وطيف NIRSpec، و SEDs لثمانية مجرات تم اكتشافها بواسطة MIRI و NIRSpec جنبًا إلى جنب مع النماذج الأفضل ملاءمة التي تم الحصول عليها باستخدام الأكواد المختلفة الموضحة في القسم السابق. من اليسار إلى اليمين، تعرض الألواح ملاءمة تجمع النجوم باستخدام Prospector (-النموذج وغير المعلمي) وSynthesizer، مجموعات النجوم المركبة مع EAZYpy (في المنتصف)، ونماذج المجرة + AGN الهجينة (على اليمين).
تدفقات MIRI وسيناريو خط الانبعاث العالي. تظهر المجرات الأربعة التي تم الكشف عنها بواسطة MIRI تدفقات F560W وF777W التي تستمر في الاتجاه الأحمر لقانون القوة الذي تم توضيحه بواسطة نطاقات NIRCam LW. بالنسبة لثلاثة منها، تستكشف نطاقات MIRI منطقة طيفية نحو الأحمر من، التي لا تحتوي على أي خطوط انبعاث بارزة. الاستثناء هو nc5-6746 عند، الذي يبدو أنه يحتوي على فائض في F560W بسبب H قويخط، ولكن ليس في F777W، الذي يستمر أيضًا في نفس الاتجاه لزيادة التدفقات الأكبر كما هو الحال في المجرات الثلاث الأخرى. لذلك، تشير اكتشافات MIRI بقوة إلى وجود انبعاث مستمر أحمر في هذه المجرات، مما يعارض السيناريو الذي يفيد بأن التدفقات الضوئية الحمراء تنشأ من مجرة زرقاء ذات خطوط انبعاث عالية جدًا تتنكر كاستمرارية حمراء. ومع ذلك، نلاحظ أن أفضل ملاءمات SED لهذه EROs تظهر خطوط انبعاث قوية وحتى فائض مدفوع بخطوط الانبعاث في واحدة أو اثنتين من نطاقات LW NIRCam. ومع ذلك، فإن هذه الخطوط لها EWs طبيعية نسبيًا لمجرة SFG ضخمة.بسبب وجود استمرارية نجمية حمراء.
مستكشف، -np، وSynthesizer. بشكل عام، توفر هذه النماذج المستندة إلى SFHs مختلفة ولكنها تستخدم نفس قانون التخفيف من Calzetti وآخرون (2000) ملاءمة جيدة نسبيًا لـ
الشكل 6. متعدد النطاقات 2 ! !” 5 قصاصات من EROs المكتشفة بواسطة MIRI ونماذج SED الأفضل ملاءمة المحسوبة باستخدام EAZYpy وProspector وSynthesizer، وهجين من نموذج مجرة بالإضافة إلى نموذج QSO أحمر (إما QSO1 أو QSO2) من بوليتا وآخرون (2006). توضح الألواح اليسرى أن الملاءمات المستندة إلى مكون واحد من السكان النجميين توفر ملاءمة جيدة للقياسات الضوئية العامة لـ LW NIRCam وMIRI (المربعات السوداء والخضراء) لكنها تفشل بشكل منهجي في إعادة إنتاج الأشعة فوق البنفسجية في إطار الزمان التي تم استكشافها بواسطة نطاقات SW NIRCam. تظهر الألواح الوسطى أن نموذجًا مركبًا يتكون من اثنين (أو أكثر) من السكان النجميين يوفر ملاءمة ممتازة لجميع النطاقات من خلال دمج مجرة حمراء وكبيرة وغنية بالغبار تناسب نطاقات LW ومجرة زرقاء ومنخفضة الكتلة تناسب نطاقات SW ولكن لها تأثير ضئيل على الكتلة النجمية. تظهر الألواح اليمنى أن نموذج المجرة + QSO الهجين (QSO1 وQSO2، باللون البرتقالي والأحمر، على التوالي) يوفر ملاءمة جيدة (أو أفضل) لـ SED مقارنة بالنماذج الأخرى. هنا، يهيمن QSO المحجوب بالغبار على القياسات الضوئية لـ LW لكنه لا يساهم في الكتلة النجمية لمضيف أزرق غير محجوب، وبالتالي يؤدي إلى كتل نجمية إجمالية.أقل بمقدار مرتين من السيناريوهات الأخرى. توضح القوالب النجمية (باللون الرمادي) نطاق الثقة في الكتلة النجمية لمكون المجرة. تظهر الأطياف الطيفية الانبعاثات فوق البنفسجية بشكل مشابه ولكن مع انبعاثات بصرية أكبر بشكل متزايد مع الكتلة.
غالبية نطاقات LW NIRCam وتدفقات MIRI. ومع ذلك، فإنها جميعًا تفشل في إعادة إنتاج تدفقات الأشعة فوق البنفسجية في إطار الزمان التي تم استكشافها بواسطة F115W وF150W، وفي بعض الحالات، F200W، بغض النظر عن تاريخ تشكيل النجوم. كلا التناسبين من Prospector يعطيان تدفقات أقل بشكل منهجي في الأشعة فوق البنفسجية في إطار الزمان، بينما يجد Synthesizer أحيانًا توازنًا بين تحسين التناسب مع نطاقات الأشعة فوق البنفسجية على حساب تناسب أسوأ مع النطاقات البصرية. السبب وراء هذه المشكلة المنهجية لجميع النماذج هو أن التخفيف الكبير للغبار المطلوب لإعادة إنتاج الألوان البصرية الحمراء للغاية يؤدي إلى تخفيف أكبر في الأشعة فوق البنفسجية، مما يقضي تمامًا على الانبعاث المتوقع بغض النظر عن معلمات السكان النجميين أو تاريخ تشكيل النجوم؛ أي، حتى تاريخ تشكيل النجوم غير المعلمي الذي يحتوي على معدلات تشكيل نجوم كبيرة في الآونة الأخيرةلا تزال تعطي ألوانًا حمراء جدًا في إطار UV. هذه المشكلة لا مفر منها بالنسبة لقوانين التخفيف النموذجية مثل كالزتي. )، وسيكون
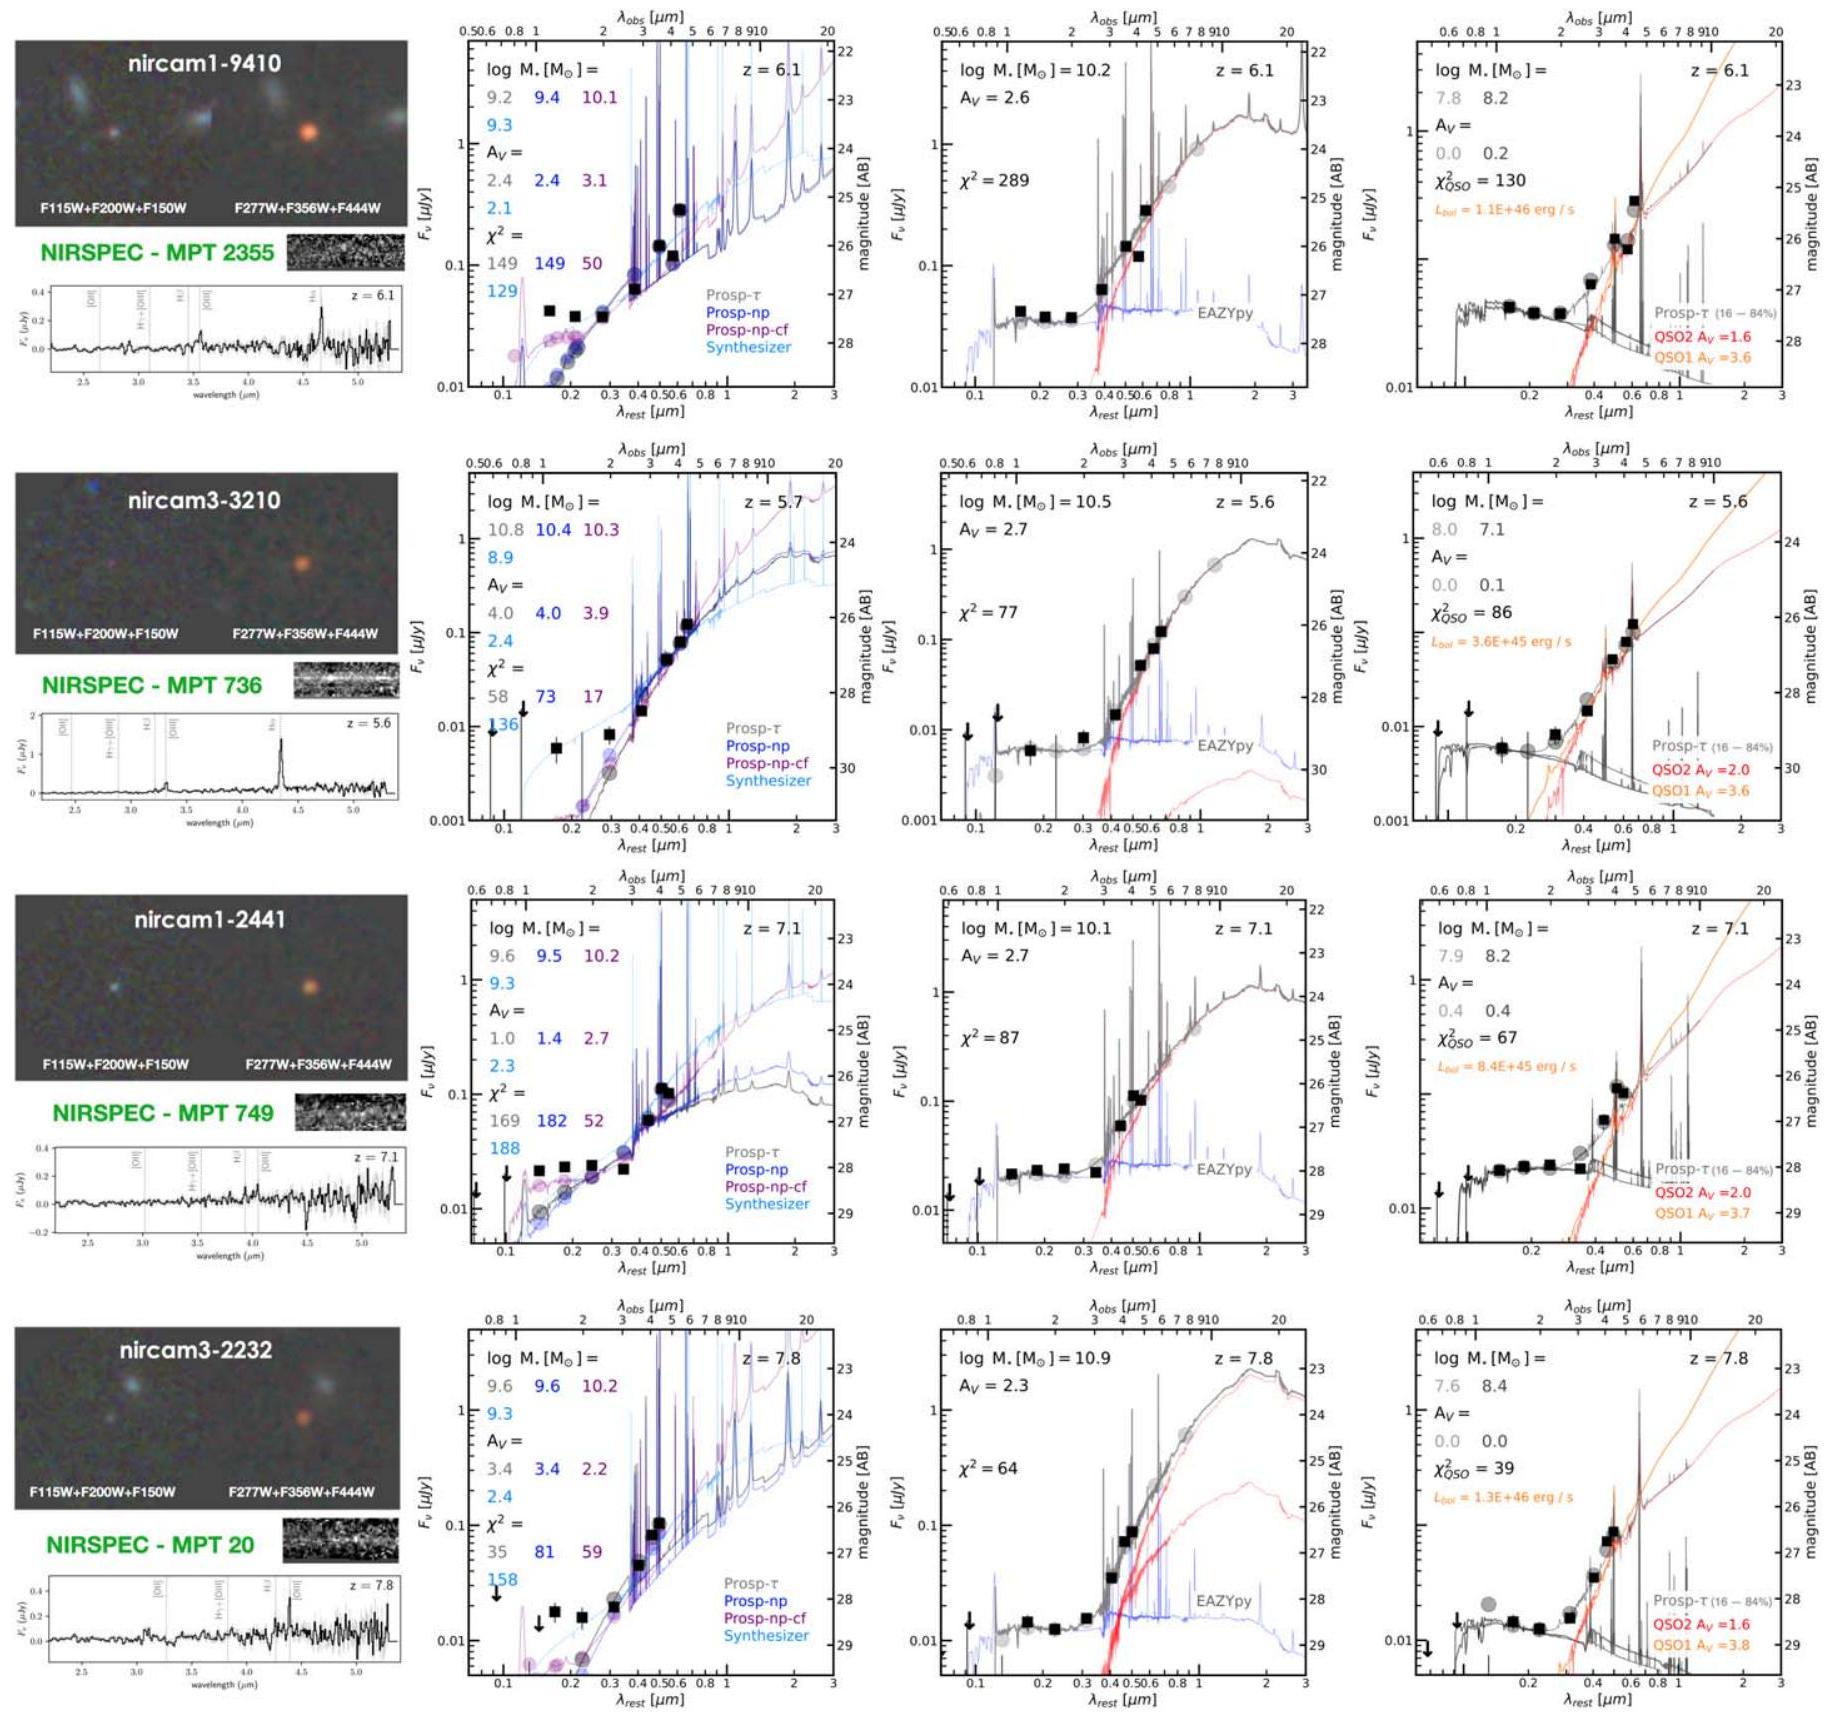
الشكل 7. متعدد النطاقاتقصاصات وطيف NIRSpec ثنائي الأبعاد/أحادي الأبعاد للكائنات EROs المكتشفة بواسطة NIRSpec. نماذج SED الأفضل ملاءمة المحسوبة باستخدام EAZYpy وProspector وSynthesizer، وخلط بين نموذج المجرة ونموذج QSO2 من Polletta وآخرون (2006) هي نفسها كما في الشكل 6 ولكن ثابتة على الانزياح الطيفي.
سيكون أسوأ لقوانين التخفيف الأكثر حدة مثل نوع SMC ( ) أو نوع درب التبانة مع نتوء فوق بنفسجي عند ومع ذلك، فإن قانون التوهين الأكثر ضحالة ورماديًا، الذي قد ينتج عن توزيع أكثر تباينًا للغبار في المجرة، يمكن أن يخفف من هذه المشكلة.
Prospector-np-cf. في الواقع، توفر نماذج SED الأكثر ملاءمة المستمدة من Prospector باستخدام SFHs غير المعلمية ونموذج تضعيف الغبار الأكثر تعقيدًا، القائم على Charlot & Fall (2000) و Kriek & Conroy (2013)، تطابقًا أفضل مع تدفقات الأشعة فوق البنفسجية مع درجات متفاوتة من التحسين. في هذا النموذج، يتم ضرب التضعيف المنتشر بقانون القوة مع مؤشرالذي يزيد/يقلل من ميل قانون التوهين بالنسبة لكالزتي (أي، لـ يصبح كالزتي). النماذج التي تناسب تدفقات الأشعة فوق البنفسجية بشكل أفضل (مثل nc5-5815، nc6-7042، أو nc1-2441) جميعها لديها قوانين تضعيف مشابهة تميل بشدة نحو أضعف قانون تضعيف ممكن مسموح به من قبل الأوليات ( و )؛ أي أن التوزيع الخلفي ليس موزعًا بشكل متساوٍ بل يميل نحو القيمة القصوى. النماذج التي لا تحقق تحسينًا كبيرًا في ملاءمة الأشعة فوق البنفسجية لا تزال تعود بنتيجة أفضل من fits المستندة إلى Calzetti. بالنسبة لهذه المجرات، يبدو أن التخفيف التفاضلي بين الاستمرارية النجمية وخطوط الانبعاث التي أدخلها وصف Charlot & Fall (2000) ذو المكونين يسمح بخطوط انبعاث أقوى تحسن من الملاءمة للأطياف ذات الفائض في خطوط الانبعاث.
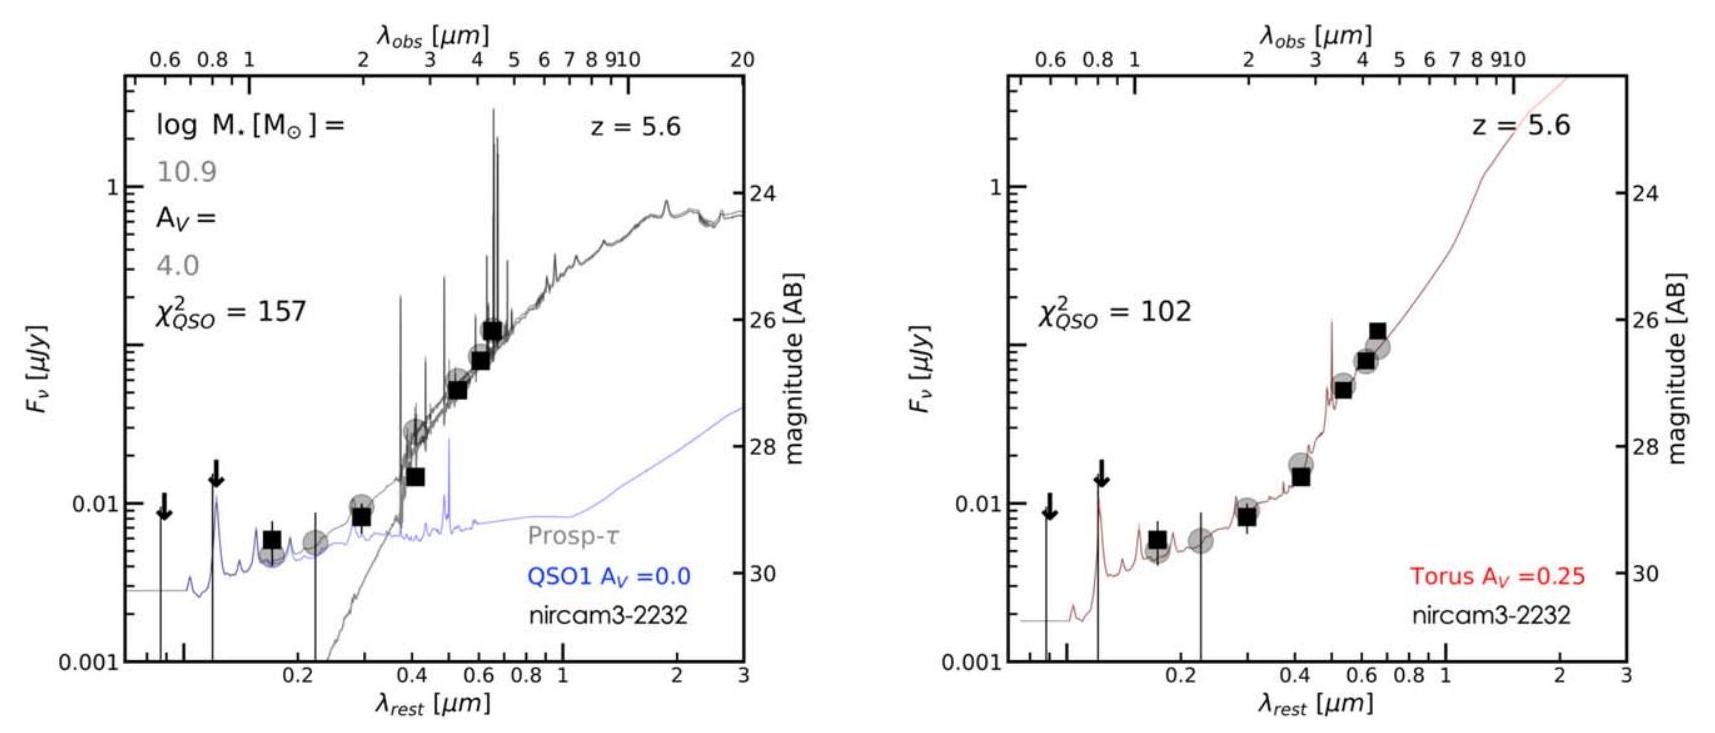
الشكل 8. سيناريوهات نمذجة SED الإضافية التي تتضمن QSO. اليسار: مزيج من SED الذي تهيمن عليه المجرة الغبارية مع QSO أزرق ومنخفض الانقراض يساهم فقط في انبعاث الأشعة فوق البنفسجية في إطار الزمان. هذا السيناريو مشابه لملاءمات EAZYpy التي تستبدل المجرة الزرقاء بـ QSO أزرق مع تأثير ضئيل على الكتلة النجمية للمركب. اليمين: نموذج خالص يهيمن عليه QSO يعتمد على نموذج التوروس من بوليتا وآخرون (2006) حيث يتفوق انبعاث QSO على المجرة المضيفة في جميع الأطوال الموجية. الشكل الداخلي لـ SED التوروس مشابه جدًا لـ SED ثنائي النمط لـ EROs. ومع ذلك، نجد أن استخدام نموذج واحد يحد من مرونة الملاءمات ويؤدي عمومًا إلى توافق أسوأ. ) مع البيانات.
EAZYpy. توفر هذه النماذج تطابقًا جيدًا مع كل من الأطياف الطيفية في نطاق الأشعة فوق البنفسجية والأطياف البصرية في إطار الراحة. الفرق بالنسبة لملاءمات Prospector وSynthesizer هو أن EAZYpy يستخدم نماذج مركبة تكون تركيبات خطية من قوالب ذات أعمار مختلفة، ومعدلات تكوين النجوم، والأهم من ذلك، تضعيف الغبار. وبالتالي، فإن الطيف المركب ليس بالضرورة مقيدًا بنفس تضعيف الغبار عبر النطاق الطيفي بأكمله. النماذج الأفضل ملاءمة لجميع EROs هي دائمًا مزيج من قوالب على الأقل ذات خصائص مختلفة جدًا: مجرة شابة وزرقاء مع تضعيف غبار منخفض تناسب الانبعاثات فوق البنفسجية المسطحة نسبيًا، ومجرة أقدم مع تضعيف غبار كبير تناسب الانبعاثات البصرية الحمراء.
مجرة هجينة + كائن كوانتي أحمر. تُظهر الألواح اليمنى من الأشكال 6 و 7 التوافقات مع النموذج الهجين لمجرة زرقاء وكائن كوانتي محجوب بالغبار (نموذج QSO2 باللون الأحمر). يُظهر هذا النموذج توافقًا ممتازًا مع الطيف الكلي بما في ذلك الأشعة فوق البنفسجية في إطار الراحة وتدفقات MIRI. في هذا السيناريو، تهيمن الإشعاعات المستمرة من الكائن الكوانتي المحجوب على الطيف الأحمر من F277W بينما تهيمن مكون المجرة على الإشعاع فوق البنفسجي في إطار الراحة. وبالتالي، فإن أفضل نموذج لمجرة هو مجرة زرقاء ذات انكسار منخفض مشابهة للمكون الأزرق في التركيب EAZYpy. توضح الخطوط الرمادية والمغنتا في التوافقات نطاق الكتل النجمية التي تكون، في جميع الحالات، صغيرة جداً،الفرق الرئيسي في أفضل ملاءمة لمخططات الطيف الطيفي (SEDs) بين السيناريوهات التي تهيمن عليها الكوازارات وتلك التي تهيمن عليها المجرات هو أنه في الأخيرة، يظهر الاستمرارية النجمية عادةً ذروة حولبينما يزيد انبعاث QSO باستمرار نحو منتصف الأشعة تحت الحمراء في إطار الراحة. للأسف، عندتكتشف MIRI في F560W و F777W أطوال موجية في إطار الراحة أقصر من، وحتى بالنسبة للمجرة الوحيدة المكتشفة في F 1000 W، فإن تدفق الإطار المرجعي لا يزال قريبًا جدًا منتعتبر الاكتشافات عند الأطوال الموجية الأطول ضرورية بوضوح للتمييز بشكل قاطع بين استمرارية نجمية متناقصة وانبعاث QSO متزايد. كما تظهر الألواح أيضًا التوافقات باستخدام نموذج QSO1 الأزرق مع تضعيفات كبيرة جدًا.، البرتقالي). هذه عادة ما تكون أقل توافقًا مع بيانات MIRI لأنها تحتوي على تزداد SEDs بشكل أكثر حدة، لكنها تساعد في تقديم تقدير تقريبي لسطوع QSO الكلي.
نموذج QSO الهجين الأزرق + المجرة المغبرة وQSO النقي + التوروس. الشكل 8 يظهر أفضل ملاءمة لـ SED لـ nc3-3210 (الـ AGN ذو الخطوط العريضة المدروسة باستخدام NIRSpec في Kocevski et al. 2023) مع السيناريوهين الآخرين المحتملين اللذين يتضمنان QSO: انبعاث QSO-توروس ونموذج هجين يتكون من QSO أزرق ومجرة حمراء مغبرة. في نموذج التوروس، يكون SED مهيمنًا بالكامل على QSO في جميع الأطوال الموجية (مثل، الضوء فوق البنفسجي المتناثر، والانبعاث الضوئي المخفف، وإعادة الانبعاث في منتصف إلى بعيد الأشعة تحت الحمراء بواسطة الغبار). هنا نستخدم نموذج التوروس من Polletta et al. (2006) لتناسب SED المرصود ونجد أنه بينما الشكل الداخلي لنموذج SED التوروس مشابه إلى حد ما لـ SED ثنائي الوضع لـ EROs، فإن نموذجًا واحدًا ليس مرنًا بما يكفي للحصول على ملاءمة أفضل من أي من السيناريوهات الأخرى التي تم مناقشتها أعلاه. من المحتمل أن تكون هذه قيودًا على نهجنا القائم على نموذج واحد، ومن الممكن أن يكون هناك كود نمذجة AGN أكثر شمولاً يمكنه إعادة إنتاج SED المرصود بدقة أعلى. السيناريو الذي يتضمن مجرة بالإضافة إلى QSO أزرق مشابه إلى حد ما لنموذج EAZYpy. في كلاهما، تهيمن نطاقات LW NIRCam إلى حد كبير على انبعاث مجرة حمراء مغبرة بينما تهيمن النطاقات SW على مجرة زرقاء ذات انقراض منخفض أو QSO. وبالتالي، فإن الكتل النجمية المستنتجة والتخفيفات الناتجة عن الغبار لمعظم المجرة متشابهة جدًا، حيث إن أي من المكونات الزرقاء لا تساهم بشكل كبير في الكتلة. لم يتم مناقشة هذين السيناريوهين بالتفصيل بالنسبة للأجسام الأخرى لأن نموذج QSO الأزرق يؤدي إلى نتائج مشابهة للخصائص النجمية مثل السيناريوهات الأخرى المهيمنة على المجرة، ولا يوفر نموذج التوروس قيودًا على الكتلة النجمية للمضيف أو سطوع QSO.
5.4. كتل النجوم والتخفيفات
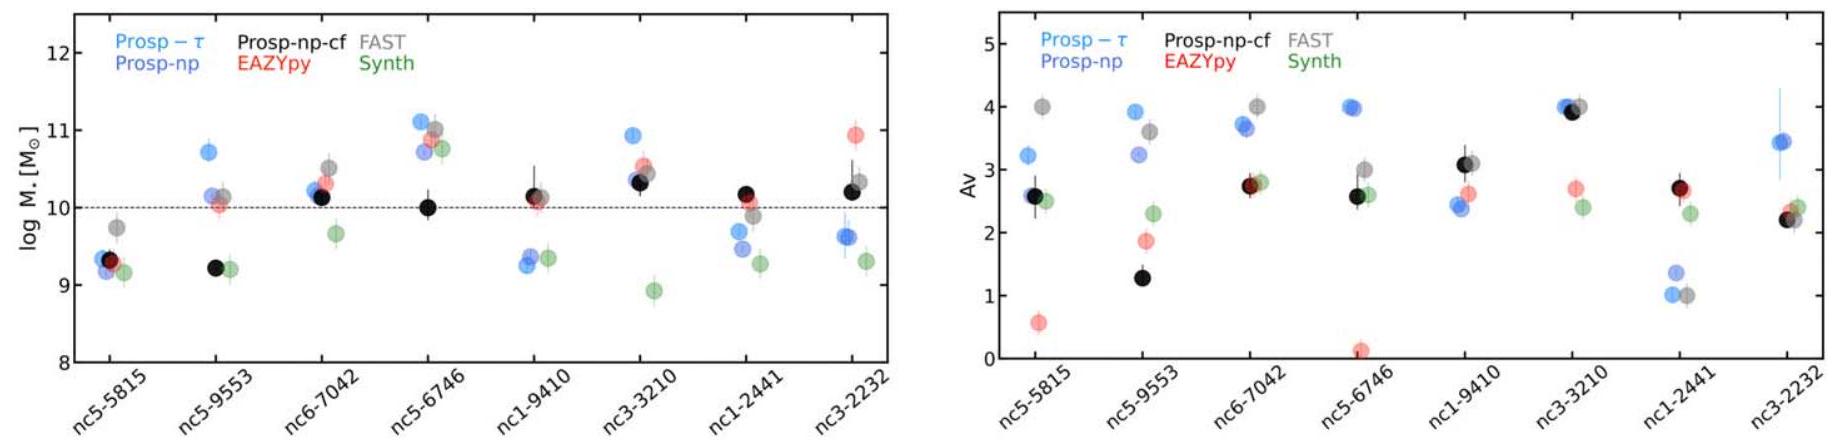
تظهر الشكل 9 نطاقات الكتل النجمية وتخفيف الغبار لثمانية EROs تم الحصول عليها باستخدام أكواد نمذجة SED المختلفة. كما ندرج الكتل النجمية والتخفيفات المحسوبة باستخدام FAST ونستخدمها كمعيار.
الشكل 9. نطاقات الكتل النجمية والقيم المستخلصة من افتراضات نمذجة SED المختلفة لثمانية EROs مع ملاحظات MIRI وNIRSpec. بشكل عام، القيم المستمدة من الطرق الشائعة الاستخدام EAZYpy وFAST تقدم تقديرات مشابهة لتلك التي يوفرها نموذج Prospector القياسي.النموذج، وعادة ما تكون الأكبر (علامات حمراء ورمادية وزرقاء فاتحة، على التوالي). يؤدي نموذج Prospector-np غير المعلمي (الأزرق الداكن) إلى كتل نجمية أصغر بمقدار 0.4 دكس، في المتوسط. يمكن أن يؤدي نموذج غير معلمي مع قانون تلاشي رمادي، Prospector-np-cf (أسود)، إلى كتل أصغر بمقدار 0.7 دكس عندما تكون تدفقات MIRI متاحة، لكنه يحصل على قيم مشابهة للنماذج المرجعية حيث لا تكون متاحة. كتل النجوم من Synthesizer (أخضر) هي الأصغر بـديكس بالنسبة للقيم المرجعية، لكن دقة الملاءمة أسوأ. القيم التي تم الحصول عليها باستخدام نموذج المجرة الهجينة بالإضافة إلى نموذج الكوازار المحجوب (غير معروض) أصغر بكثير،لأن الـ QSO يهيمن على SED دون أن يساهم في الكتلة النجمية للمضيف الأزرق ذو الكتلة المنخفضة.
نموذج للمقارنات لدراسة التأثيرات النظامية. تم اختبار FAST على نطاق واسع في المجرات النموذجية عند الانزياحات الحمراء المنخفضة إلى المتوسطة بنتائج دقيقة، ولكن من الضروري فهم ما إذا كانت هناك مشكلات محتملة في نمذجة هذه المجرات ذات الانزياح الأحمر العالي مع الأطياف الطيفية الغريبة.
تكون الكتل النجمية المحسوبة باستخدام FAST و EAZYpy هي الأكبر، وهي متشابهة جدًا، مع فرق وسطي وتشتت قدره (فاست-إيزي باي) على الرغم من أن نموذج SED مع FAST لا يعيد إنتاج تدفقات الأشعة فوق البنفسجية مثل نماذج SED المركبة مع EAZYpy، إلا أن التأثير على الكتلة النجمية ضئيل جداً. وذلك لأن المكون الأحمر، الغباري في نموذج EAZYpy، الذي يشبه النموذج العام لـ FAST، يهيمن على الكتلة النجمية مقارنة بالمكون الشاب، الأزرق، الذي لديه نسبة كتلة إلى ضوء أقل بكثير.
من المثير للاهتمام أن الفرق الوسيط بالنسبة للكتل النجمية المحسوبة باستخدام ملاءمات بروسبكتور القياسية (-نموذج مع تضعيف كالتزتي) صغير نسبيًا، مع تشتت أكبرFAST – المنقب-هذا يعني أنه على الرغم من النمذجة الأكثر مرونة للمعلمات الرئيسية مثل قوة خط الانبعاث أو المعدنية، فإن الكتلة النجمية مدفوعة في الغالب بالحاجة إلى ملاءمة الميل البصري الأحمر مع التعتيم العالي. في الواقع، فإن الحالات التي تحصل فيها أداة Prospector على أكبر الكتل النجمية هي عادة تلك التي يكون فيها الانخفاض في الضوء في أقصى حد.لاحظ أيضًا أن قيم الانقراض من FAST و Prospector عادة ما تكون الأكبر، حيث تتراوح بينتتميز تركيبات EAZYpy بانخفاض الانقراضاتجزئيًا بسبب الجمع مع نموذج أزرق )، ولكن أحيانًا لأنها تتضمن نموذجًا هادئًا أحمر يحتوي أيضًا على انخفاض في التوهين ولكن نسبة كبيرة من الكتلة إلى الضوء، مما يؤدي بدوره إلى كتل نجمية أكبر (على سبيل المثال، كما في nc3-2232).
يتناسب Prospector مع تاريخ التكوين غير المعلمي المحدد بحد أقصى لعمر التكوين يبلغ 100 مليون سنة، وقانون التخفيف من Calzetti يؤدي إلى كتل نجمية أقل بشكل منهجي من Prospector القياسي.، مع –. هذا لأن النموذج المرجعي لديه بداية قصوى قديمة لتاريخ تشكيل النجوم عند عمر الكون عند انزياح الطيف للمجموعة الشمسية، وبالتالي، يميل إلى تشكيل المزيد من النجوم على مدى فترة زمنية أطول. ونتيجة لذلك، تكون الكتل أصغر حتى بالنسبة لـ FAST. (فاست-بروسبكتور-ن ب) .
يتناسب جهاز التنقيب مع تاريخ تطور النجوم غير المعلمي وقانون التوهين الأكثر مرونة بناءً على تشارلوت وفال (2000)، والذي يوفر أفضل ملاءمات SED، ويظهر سلوكًا مثيرًا للاهتمام. بالنسبة للخمسة مجرات التي تم الكشف عنها بواسطة MIRI، فإن الكتل النجمية أقل بكثير مع (FAST-Prospector-np-cf) لكن بالنسبة للمجرات الأربع التي تحتوي على بيانات NIRSpec، فإن الفرق يكاد يكون صفراً، (فاست-بروسبكتور-ن ب) السبب وراء هذا الاختلاف واضح تمامًا في ملاءمات SED الموضحة في الأشكال 6 و 7. بدون بيانات MIRI لتقييد انبعاث الاستمرارية بعد F444W، يفضل Prospector الحلول التي تتمتع باستمرارية أقوى (أي، أكثر كتلة) وEWs أقل للخطوط. على سبيل المثال، في nc3-3210 أو nc1-9410، فإن أفضل نماذج ملاءمة مع Prospector- مقابل Prospector-np-cf ستظهر اختلافات في التدفقات المتوقعة F560W و F770W من حيث .
تقدم التقديرات مع Synthesizer أصغر تقديرات للكتلة النجمية، أقل بحوالي 1 دكس من FAST، (المSynthesizer السريع) كما تم مناقشته في القسم السابق، فإن هذه التعديلات على SED هي، بشكل عام، أقل دقة من الأكواد الأخرى، لكنها تميل إلى ملاءمة منطقة الأشعة فوق البنفسجية بشكل أفضل قليلاً على حساب ملاءمة أسوأ للضوء المرئي. ونتيجة لذلك، فإنها تتمتع بتقليل أقل لـوبالتالي، كتل نجمية أقل.
أخيرًا، في سيناريو المجرة الهجينة بالإضافة إلى الكائنات الكونية الخفية، تهيمن الأخيرة تمامًا على الجزء الأكبر من الانبعاث في نطاقات LW. ومع ذلك، فهي لا تساهم في الكتلة النجمية، التي تعتمد حصريًا على مضيف المجرة الزرقاء الخافتة. وبالتالي، فإن الكتل النجمية المستنتجة هيرتبتين من حيث الحجمأصغر من أي من السيناريوهات التي ينشأ فيها الاستمرارية اللامعة من مجرة ضخمة غنية بالغبار.
باختصار، الطرق المستخدمة بشكل شائع تعتمد على-نماذج وامتصاص كالزتي، أو متغيرات EAZY مع القوالب الافتراضية (بما في ذلك القوالب الأكثر احمرارًا وقدمًا) من المحتمل أن تحصل على أكبر الكتل النجمية. تاريخ تطور النجوم غير المعلمي أو المماثل الذي يحد من عمر المجرة إلى قيم شابة نسبيًا (يمكن أن تؤدي إلى تقليل الكتل النجمية بمقدار 0.4 دكس. يمكن أن يؤدي إضافة نموذج غبار أكثر مرونة للسماح بمنحنيات تلاشي أكثر رمادية إلى كتل نجمية أصغر تصل إلى 0.7 دكس. ومع ذلك، بدون بيانات MIRI، يمكن أن تكون الكتل النجمية مرتفعة كما هو الحال في النموذج القياسي.-نماذج.
6. المناقشة
6.1. احتمال سيناريو المجرة المغبرة
في الأقسام السابقة، ناقشنا ثلاثة سيناريوهات محتملة حيث يمكن أن يتناسب غاز الغبار، SFG مع SEDs العامة لـ EROs التي تهيمن على الانبعاث في الإطار الزمني البصري: مع قانون تلاشي مسطح ورمادي أو مع مكون ثانوي إما أنه مجرة زرقاء ذات انقراض منخفض أو QSO أزرق، يتناسب مع UV في الإطار الزمني.
عند النظر إلى هذه الاحتمالات في ضوء الأحجام النقطية غير المحلولة لجميع هذه المجرات، يبدو أن السيناريو الذي يتضمن مكونين نجميين متميزين غير محتمل إلى حد كبير. سيكون مثل هذا النموذج أكثر منطقية لمجرة موسعة ذات مناطق متميزة بوضوح (مثل الكتل، أو الانتفاخ). من ناحية أخرى، قد يساعد الحجم المدمج في تفسير قانون التعتيم الرمادي جداً من حيث الهندسة وتوزيع الغبار في بيئة ذات كثافة عالية. على سبيل المثال، بدلاً من سيناريو غلاف الغبار، قد يكون لدينا توزيع مختلط من النجوم والغبار (ربما متكتل) والذي ينتج قوانين التعتيم الرمادي بما في ذلك الانقراضات الضخمة.أو أكثر)، ولكن أيضًا تشتت كبير يؤدي إلى انخفاض إجمالي في التوهين ودرجات رمادية أقل، وبالتالي ألوان فوق بنفسجية أكثر زرقة (ويت وغوردون 2000).
السيناريو الذي يتضمن كائنًا كونيًا ضوئيًا منخفض اللمعان باللون الأزرق يبدو أيضًا معقولًا لأنه يمكن أن يساعد في تفسير سبب اختلاف ألوان هذه الكائنات عن ألوان كائنات EROs في نطاق F150W وغيرها من المجرات المليئة بالغبار عند انزياحات حمراء أعلى تم تحديدها مؤخرًا باستخدام تلسكوب جيمس ويب (على سبيل المثال، بيريز-غونزاليس وآخرون 2023أ؛ زافالا وآخرون 2023)، والتي تكون حمراء في جميع نطاقات NIRCam. كما تم مناقشته في كوتسيفسكي وآخرون (2023؛ انظر أيضًا فوجيموتو وآخرون 2022) قد يكون هذا السيناريو مرحلة انتقالية في تطور انفجار نجمي محجوب بالغبار الذي يقوم بإزالة الغبار ويمهد الطريق لكائن كوني ضوئي غير محجوب. لاحظ أنه بينما تم الإبلاغ عن ألوان فوق بنفسجية أكثر زرقة في الكائنات النجمية المليئة بالغبار فيمع سطوع IR كبير (على سبيل المثال، كيسي وآخرون 2014)، فإن هذه EROs زرقاء جدًا، مع استمرارية UV مسطحة نسبيًا فيالتي تشير إلى انحدارات UV شديدة الانحدارللاعتبارات العالية للتخفيف التي تشير إليها نمذجة SED، أي،.
عند أخذها معًا، قد تشير الألوان والأشكال المختلفة لهذه الكوازارات النشطة بالنسبة لبقية المجرات الغبارية الضخمة إلى أنها مجموعة متميزة، ربما تمر بمرحلة قوية من انفجار النجوم النووي كما هو مشاهد على سبيل المثال في بعض المجرات المكتشفة بواسطة الراديو/تحت المليمتر في (بارو وآخرون 2017؛ تاداكي وآخرون 2017). إلى حد ما، قد يكون هذا السيناريو مشابهًا لذلك الخاص بـ SFGs المدمجة فيالتي هي أيضًا صغيرة (لكن تم حلها، )، ضخمة، ومغبرة (على سبيل المثال، بارو وآخرون 2013؛ نيلسون وآخرون 2014؛ ويليامز وآخرون 2014؛ فان دوكوم وآخرون 2015)، وتظهر نسبة كبيرة من اكتشافات AGN بالأشعة السينية (كوتسيفسكي وآخرون 2017). في الواقع، تقترح نماذج تشكيل المجرات أن أسلاف تلك المجرات المدمجة قد تكون أصغر حتى عند الانزياحات الحمراء الأعلى بسبب خزانات الغاز الأكبر التي تؤدي إلى أحداث الانضغاط الرطب التي تؤدي إلى تشكيل نواة كثيفة جداً (على سبيل المثال، ويلونز وآخرون 2015؛ زولوتوف وآخرون 2015؛ تاكشيلا وآخرون 2016).
ومع ذلك، يبدو غريبًا أن جميع هذه EROs فيلا تزال غير محلولة. إذا كانت ستتطور إلى مجمعات سريعة التكوين مضغوطة فينتوقع أن ينتقل بعضهم من حالة غير محسومة بالكامل إلى العلاقة المميزة بين الكتلة والحجم التي تتبعها المجرات النجمية الكثيفة. (بارو وآخرون 2017). علاوة على ذلك، نلاحظ أنه إذا كانت الأحجام الجوهرية لهذه المجرات تحت حد نصف قطر الضوء 200-300 فرسخ (أو حتى 150 فرسخ؛ على سبيل المثال، باجن وآخرون 2023) فإن الكثافات الكتلية النجمية المستنتجة لأكثر EROات ضخمة، أكثر من، ستتجاوز حتى كثافات الكتلة النجمية الملاحظة حتى في أكثر المجرات ضخامة في; بيزانسون وآخرون 2009؛ هوبكنز وآخرون 2010).
6.2. احتمال سيناريوهات AGN المخفية
سيناريو بديل لمجموعات النجوم الغبارية حيث نتوقع مصادر غير محلولة تشبه النقاط وطيف انبعاث غير نجمي غريب هو في النوى المجرية النشطة حيث يمكن أن يتفوق كائن كوانتي ساطع على انبعاث مضيفه في نطاقات طيفية مختلفة من الأشعة فوق البنفسجية إلى الأشعة تحت الحمراء المتوسطة. على سبيل المثال، تعتبر أطياف المجرات الهجينة + النوى المجرية النشطة حيث يهيمن الأخير على انبعاث الأشعة تحت الحمراء القريبة إلى المتوسطة حدثًا شائعًا نسبيًا في مسوحات المجرات عند الانزياحات الحمراء المتوسطة إلى العالية (ستيرن وآخرون 2005؛ لايسي وآخرون 2007؛ دونلي وآخرون 2012، 2018). في الأقسام السابقة، ناقشنا سيناريوهين محتملين حيث يمكن أن يتناسب نواة مجرية نشطة محجوبة مع الطيف الكلي لمصادر الإشعاع الأحمر التي تهيمن على الانبعاث البصري الأحمر: (1) بالاقتران مع مضيف مجرة زرقاء منخفضة الكتلة أو (2) في نموذج نواة مجرية نشطة نقية حيث يهيمن الانبعاث من الكائن الكوانتي على جميع الأطوال الموجية.
السيناريو الأول يعني أن جميع هذه الكوازارات ذات الكتلة المنخفضة هي مجرات ذات كتلة منخفضة حيث يتم إضاءة تدفقات الضوء المرئي إلى الأشعة تحت الحمراء بالكامل بواسطة انبعاث كوازار مخفي. العامل المحدد في هذا السيناريو هو اللمعان الكلي وكتلة الثقب الأسود المفترضة للكوازارات، والتي يجب أن تكون على الأقل بمرتبة أو مرتبتين أدنى من الكتل النجمية للمضيفين (على سبيل المثال، كورمندى وهو 2013). تتراوح الكتل النجمية للمضيفين الزرقاء ذات الانخفاض المنخفض المستنتجة في القسم السابق بينلذلك، نتوقع أن تكون كتل الثقوب السوداء من حيثوبناءً على العلاقة النموذجية بين اللمعان وكتلة الثقب الأسود (غرين وهو 2007)، فإن اللمعانات البولومترية لـ QSO هيإرجأو أصغر، حيث أن هذه هي القيمة في الطرف الأعلى من معدل التراكم،.
لسوء الحظ، يتطلب تقدير اللمعان البولومتري لكائنات كوانتية مشوشة بيانات الأشعة السينية أو الأشعة فوق البنفسجية أو اللمعان البولومتري، ولا يمكن حساب أي منها بسهولة لهذه المجرات. بالنسبة لكائنات كوانتية زرقاء بطبيعتها، يمكن تقدير اللمعان الكلي من اللمعانات أحادية الطول الموجي باستخدام تصحيحات بولومترية (على سبيل المثال، ريتشاردز وآخرون 2006). ومع ذلك، بالنسبة لكائنات النشاط النووي الخفية، يتم عادة استنتاج اللمعانات الكلية من اللمعانات في إطار الراحة للأشعة تحت الحمراء من اللمعان الكلي للأشعة تحت الحمراء (على سبيل المثال، دونلي وآخرون 2012؛ رونو وآخرون 2012)، والتي تتطلب لهذه المجرات تدفقات MIRI عند أطول الأطوال الموجية. وبالتالي، فإن البديل الوحيد لتقدير اللمعان هو ملاءمة SED مع نموذج كائن كوانتي أزرق مشوش بشدة باستخدام قانون التوهين لكالزتي، ثم تحويل اللمعان فوق البنفسجي المصحح بالغبار إلى (على سبيل المثال، ؛ ريتشاردز وآخرون 2006). تتراوح القيم التي تم الحصول عليها للـ EROs باستخدام هذه الطريقة بينالتي هييكون دكس أكبر من التوقعات من نسب كتلة الثقب الأسود إلى كتلة النجوم في الانزياح الأحمر المنخفض (أي، ستكون كوازارات لامعة جداً). ومع ذلك، نود أن نحذر من أن هذه التقديرات هي تبسيط كبير، حيث كما هو موضح في القسم 5، يختلف طيف الكوازارات الحمراء (QSO2) عن طيف الكوازارات الزرقاء المخففة (QSO1 + كالتزتي). تعتمد قانون التخفيف الحقيقي لكوازار محجوب على عوامل متعددة مثل هندسة وتوزيع الغبار في التوروس أو ميل خط الرؤية. في المجرات المدمجة عند ارتفاعقد تعتمد حتى على الظروف الكونية على مستوى المجرة (نسب الغاز/الغبار؛ على سبيل المثال، جيلي وآخرون 2014). وبالتالي، فإن اللمعان الكلي للـ QSOs المحجوبة ربما يكون
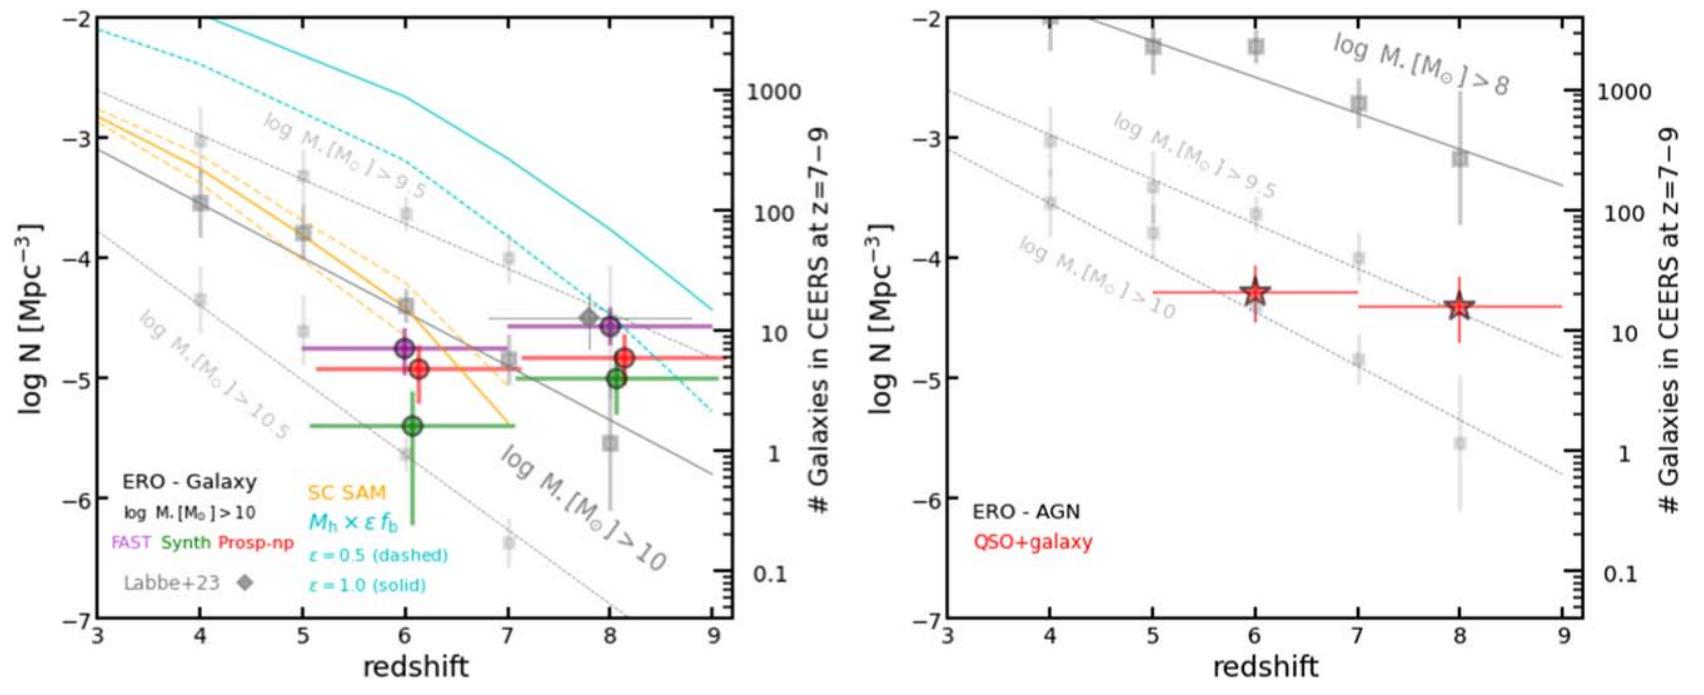
الشكل 10. اليسار: كثافات عدد المجرات مع كتل نجمية أعلى (مربعات رمادية داكنة) و و 10.5 (باللون الرمادي المظلل) كدالة من الانزياح الأحمر المحسوب من SMFs في الأدبيات (انظر النص). تشير الدوائر إلى كثافة عدد EROs مع إذا كانت مجرات ضخمة مغبرة. الألوان الأرجوانية والخضراء والحمراء تظهر التوقعات المستندة إلى ثلاثة سيناريوهات لنمذجة SED والتي تشمل عادةً تقديرات الحد الأدنى/الحد الأقصى لكتلة النجوم (انظر القسم 5.4). الخطوط البرتقالية تظهر توقعًا مشابهًا مستمدًا من الوسيط والنسب المئوية لـ 100 سحب بحجم CEERS لمساحة 2 درجة.مخروط الضوء استنادًا إلى نماذج سانتا كروز شبه التحليلية. يوضح التشتت حول الوسيط تأثير التباين الكوني في منطقة بحجم بصمة CEERS. وبالمثل، تظهر الخطوط السماوية التوقعات من مخاريط الضوء الوهمية ذات كفاءات تحويل الباريونات الأكبر. و 1 ). في كثافة EROs أقل من القيم الموجودة في الأدبيات، ومع ذلك، عنديمكن أن تكون الكثافة حتى عامل منأكبر لبعض التقديرات ذات الكتل النجمية الأكبر. بينما يمكن التوفيق بين هذا الاختلاف مع الشكوك الكبيرة من SMFs وتنوع نمذجة SED، فإن التباين في الكتل الأكبر،أكبر بكثير. نتوقع وجود مجرة واحدة في منطقة أكبر 10-20 مرة من CEERS ونجد ثلاث مجرات. اليمين: كثافات عدد المجرات مع الكتل النجميةمن الأدبيات (المربعات الرمادية) كدالة من الانزياح الأحمر. تظهر النجوم الحمراء كثافة EROs إذا كانت مزيجًا من AGN المحجوب ومضيف مجرة زرقاء غير محجوبة (انظر القسم 5.3). في هذا السيناريو، تمتلك المضيفات كتل نجمية أقل بكثير مقارنة بسيناريو المجرة المغبرة تصل إلى 2 دكس. ونتيجة لذلك، تشكل EROs فقط جزءًا صغيرًا من ) من مجموعة المجرات ذات الكتلة المنخفضة الأكثر وفرة.
أقل من القيم المقدرة باستخدام نموذج QSO الأزرق، والتي يجب اعتبارها حدودًا عليا.
في السيناريو الثاني، يتفوق الكائن السماوي المظلم تمامًا على انبعاث مضيف المجرة عبر كامل النطاق الطيفي؛ أي أن كل من تدفقات NIRCam في النطاقين القصير والطويل تأتي من الكائن السماوي. سيكون هذا السيناريو الأكثر احتمالًا بناءً على الأحجام غير المحلولة لهذه المجرات في جميع نطاقات NIRCam. للأسف، يتطلب التوصيف الأكثر تفصيلًا للسطوع الكلي في هذا النوع من السيناريو نمذجة أكثر تعقيدًا لعملية الانطفاء والتشتت لانبعاث الكائن السماوي، وهو ما يتجاوز نطاق هذه الورقة. ومن المثير للاهتمام، في هذا السيناريو، قد تكون القيود المفروضة على السطوع الكلي للكائن السماوي أقل صرامة نظرًا لأن مضيف المجرة لا يتعين اكتشافه في الأشعة فوق البنفسجية. لذلك، قد تكون هناك مجرة أكثر كثافة وغبارًا قليلاً،يمكن أن تختبئ ربما تحت الطيف الأحمر الساطع للـ QSO دون أن يكون لها تأثير كبير على SED المرصودة.
6.3. الآثار على كثافات الأعداد ودوال الكتلة والسطوع
6.3.1. إذا كانت EROs مجرات ضخمة ومغبرة
كما تم مناقشته في لابيه وآخرون (2023)، إذا كانت جميع هذه الكوازارات الغبارية تحتوي على كتل كبيرة نسبيًا، أو حتى بالنسبة لبعض الأجسام الأكثر تطرفًا، يمكن أن تؤدي كثافاتها العددية إلى بعض التوتر مع وظائف الكتلة النجمية المرصودة، مما يعني كفاءات أعلى من المتوقع لتكوين النجوم (Boylan-Kolchin 2023). نقوم بمراجعة تقديرات الكثافة العددية باستخدام العينة الكاملة من 37 EROs المختارة على مساحة أكبر من المسح الكامل CEERS وتغطي نطاقًا أوسع من الانزياح الأحمر منتظهر الشكل 10 تطور الانزياح الأحمر في كثافة عدد المجرات مع كتل نجمية أكبر من (9.5 و 10.5 بخطوط منقطة) مستمدة من SMFs قبل JWST في الأدبيات (Muzzin et al. 2013; Grazian et al. 2015; Stefanon et al. 2015; Song et al. 2016; Stefanon et al. 2021). تظهر الخطوط البرتقالية توقعًا مشابهًا من كتالوجات وهمية بناءً على نماذج سانتا كروز شبه التحليلية (Somerville et al. 2015; Yung et al. 2019b; Somerville et al. 2021; Yung et al. 2022)، والتي تظهر الوسيط والنسب المئوية 84 و 16 من 100 حقل بحجم CEERS تم أخذ عينات منه.مخروط الضوء (يونغ وآخرون 2023) لتوضيح تأثير التباين الكوني. وقد أظهرت هذه النتائج توافقًا جيدًا مع وظائف اللمعان المرصودة وملاحظات أخرى في هذه النطاقات الزمانية (يونغ وآخرون 2019أ، 2019ب). تُظهر العلامات الأرجوانية والحمراء والخضراء كثافات عددية لـ EROs مععند انزياحات حمراء و ، المقدرة باستخدام FAST و Pro-spector-np و Synthesizer، على التوالي. تشير أشرطة الخطأ إلى أخطاء بواسون. كما تم مناقشته في الأقسام السابقة، فإن هذه القيم عادةً ما تغطي أكبر وأصغر تقديرات الكتلة النجمية، وبالتالي توفر وسيلة لتقدير تأثير خيارات نمذجة SED على كثافات الأعداد.
كثافات الأجسام القريبة من الأرض معفيجميعها أقل قليلاً من القيم المذكورة في الأدبيات، مما يسمح بوجود مجرات ضخمة إضافية غير ERO عند هذا الانزياح الأحمر (على سبيل المثال، زافالا وآخرون 2023) دون أي تناقض مع الأدبيات. عند، العدد المتوقع من المجرات معفي منطقة CEERS، تكون الكثافة تقريبًا واحدة (مع أخطاء كبيرة) بينما تتراوح كثافات EROs، المستنتجة من تقديرات الكتلة النجمية المختلفة، بين 2 و 10. ومع ذلك، لا تزال هذه الاختلافات ضمن نطاق عدم اليقين في نمذجة SED والتباين الكوني. علاوة على ذلك، من الممكن أن تكون SMFs قبل JWST قد فاتتها
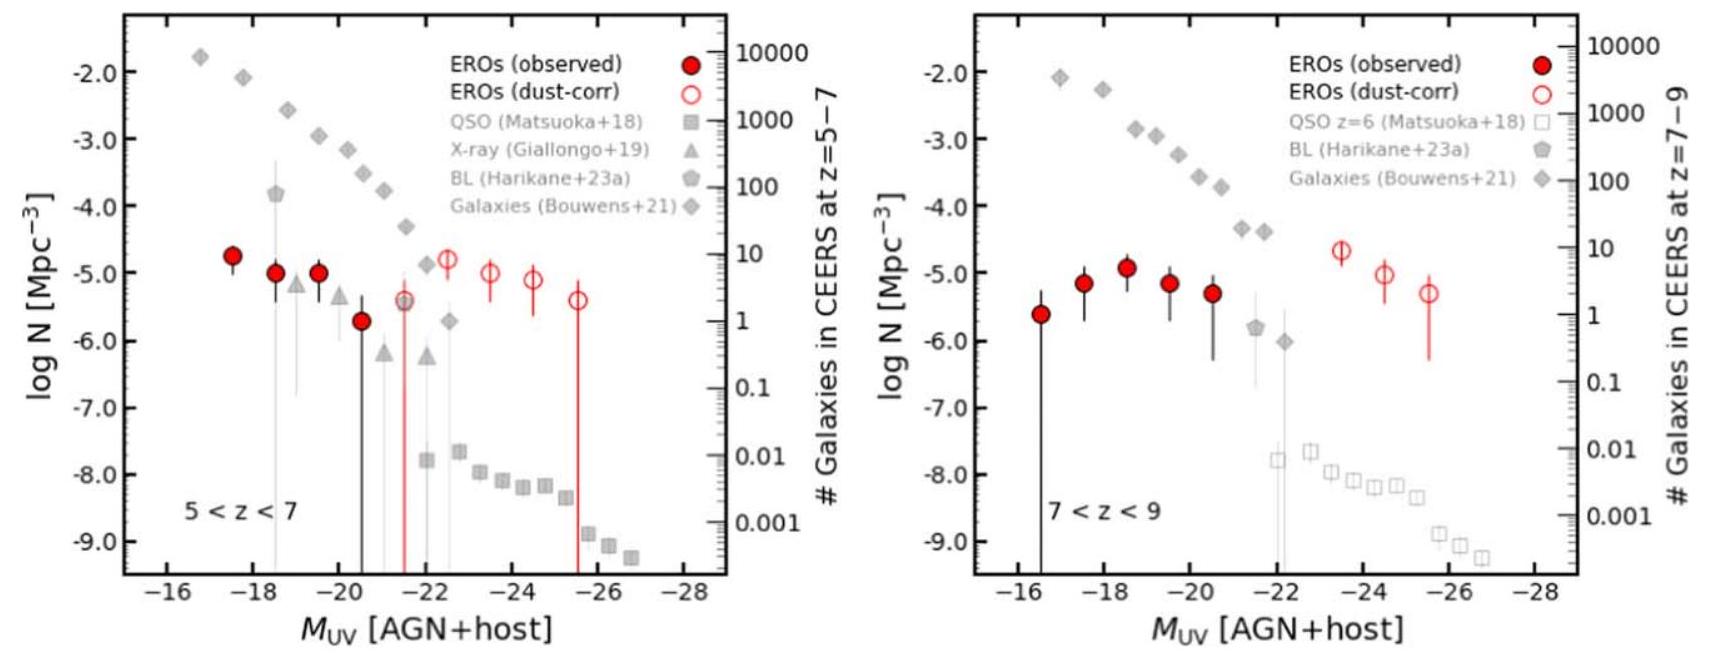
الشكل 11. دوال اللمعان فوق البنفسجي عند الانزياحات الحمراء و تظهر العلامات الرمادية كثافة المجرات وAGNs من الأدبيات المحددة بمعايير مختلفة (QSO، الأشعة السينية، واكتشاف الخطوط العريضة). تشير الدوائر الحمراء إلى كثافة العينة الكاملة من EROs إذا كانت QSOs محجوبة. تظهر العلامات المملوءة والفارغة الكثافات المختلفة المحسوبة إما من اللمعان فوق البنفسجي المرصود أو المصحح بالغبار. بينما تكون الكثافة واللمعان المرصودين لـ EROs متشابهين تقريبًا مع تلك الخاصة بالسكان ذوي الأشعة السينية عندإذا كانت هذه المجرات النشطة المظلمة، فإن سطوعها الجوهري أكبر بكثير،، مقارنة بنهاية اللمعان الخافت لسكان الكوازارات الساطعة ولكنها أكثر وفرة بنحو ثلاثة أوامر من حيث الحجم. مثل هذه اللمعان ستشير أيضًا إلى أن الكائنات ذات اللمعان الخافت تمتلك كتل ثقوب سوداء من حجم، تقريبًا بحجم الكتل النجمية المقدرة لمضيفيهم من المجرات الزرقاء، مما سيؤدي إلى نسب كتل غير متوقعة من.
بعض من أكبر المجرات. عند أكبر الكتل،ومع ذلك، فإن الفرق يزيد ليصل إلى عامل منيجب ألا نكتشف أي من هذه المجرات في منطقة CEERS (أو حتى في منطقة أكبر بعشر مرات). أبلغ لابي وآخرون (2023) عن واحدة من تلك المجرات في عينتهم. هنا نحدد خمس مجرات (بما في ذلك مجرة لابي وآخرون 2023) بكتل تفوقمن قبل اثنين على الأقل من التقديرات الثلاثة، اثنان منهما عندوثلاثة أخرى في (nc1-10084، nc5-3637، و nc8-13596، انظر الجدول 2). هذه المجرات هي أيضًا من بين الأكثر سطوعًا في F444W (حتى 2 مغ أضوأ من الوسيط لجميع EROs)، مما يشير إلى أنها مختلفة بطريقة ما وربما تكون هي تلك التي هي AGNs. ومع ذلك، فإن التحليل الفردي لهذه المصادر الذي يميز خصائصها الضوئية بدقة –القيم والكتل مطلوبة لتوضيح التباين الكبير بالنسبة للكثافات المتوقعة. باختصار، بينما تظهر كثافات عدد EROs بعض التوتر مع توقعات SMFs قبل JWST إذا كانت جميعها مجرات غبارية، فإن الأعداد تتطابق بشكل جيد نسبيًا إذا كانت جميع الكتل أقرب إلىكما تم التنبؤ به من قبل بعض سيناريوهات نمذجة SED. ومع ذلك، حتى لو تم تأكيد أن القليل منها فقط ضخم جداً،ستكون الفجوة مع SMFs كبيرة جدًا.
بالمقارنة مع المحاكاة، تظهر الخطوط السماوية في الشكل 10 التوقعات المستندة إلى المخاريط الضوئية الوهمية المقدمة في يانغ وآخرون (2023)، والتي تم استخراج هالات المادة المظلمة منها-محاكاة الجسيمات في نموذج لامدا للمادة المظلمة الباردة (علم الكون. كل خط يشير إلى كثافة الأجسام التي ستنتج إذا كان بإمكان كل هالة تحويل جزء مختلف من محتواها الباريوني إلى نجوم (أي، ، حيث و 1 ، على التوالي. قيمة من المتوقع أن ينتج حدًا أقصى متطرفًا نظرًا لأن النسب في الكون المحلي عادة ما تكون أقل من. النماذج المعتمدة على كفاءات منخفضة مماثلة، مثل نموذج سانتا كروز شبه التحليلي (الخطوط البرتقالية)، تحقق توافقًا جيدًا مع كثافة EROs عند. ومع ذلك، فإن الكتل الضمنية لـ EROs في إذا كانت مدفوعة بشكل أساسي بالنجوم، فإن ذلك يعني أن تكون أعلى بكثير من القيم المتوقعة لكفاءة تحويل هذا الباريونعلى الرغم من عدم وجود توتر أساسي مع.
6.3.2. إذا كانت EROs هي AGNs المحجوبة
كما تم مناقشته في القسم 5.4، إذا كانت الانبعاثات الضوئية الساطعة لـ EROs تهيمن عليها AGN المحجوبة، ولكن الانبعاثات فوق البنفسجية الخافتة تنشأ من مضيف مجرة غير محجوبة، فإن الكتل النجمية المستنتجة لـ EROs يمكن أن تكون أقل بمقدار يصل إلى مرتبتين من حيث الحجم مقارنة بسيناريو المجرة المغبرة. نحن نطبق نمذجة SED الموضحة في القسم 5.3 لحالة المجرة الهجينة + QSO الأحمر على العينة الكاملة من 37 EROs ونحصل على كتل نجمية منخفضة مماثلة مع وسطي ونسب المئوية لـفي هذا السيناريو، تكون كثافات الأعداد الناتجة من EROs أقل بمقدار من مرتبتين إلى ثلاث مراتب من الكثافات النموذجية للمجرات منخفضة الكتلة المستنتجة من SMFs في الأدبيات (اللوحة اليمنى في الشكل 10). وهذا يعني أنه، على عكس سيناريو المجرات المغبرة، ستكون نسبة AGNs المحجوبة في المضيفات الزرقاء منخفضة الكتلة صغيرة جداً مقارنةً بالعينة الأصلية من المجرات ذات الكتل النجمية المماثلة.
في هذا السيناريو، من الصعب تحديد مساهمة EROs في إجمالي عدد AGN عند الانزياح الأحمر العالي بسبب طبيعتها المظلمة جداً. من الناحية المثالية، سيكون من المرغوب استخدام خاصية جوهرية من AGNs، مثل اللمعان الكلي أو كتلة الثقب الأسود؛ ومع ذلك، فإن هذه القياسات ليست دائماً متاحة لعينات AGN المختارة بطرق مختلفة (مثل الأشعة السينية أو خطوط الانبعاث العريضة). بدلاً من ذلك، غالباً ما يتم إجراء المقارنات في سياق دوال اللمعان فوق البنفسجي (عند )، مما يسمح بإجراء مقارنة مباشرة مع دوال اللمعان للمجرات اللامعة، الكوازارات الزرقاء، التي كانت، حتى ظهور تلسكوب جيمس ويب، أكبر مجموعة من الكائنات عالية الAGNs.
لسوء الحظ، فإن هذه المقارنة قد تكون مضللة بالنسبة للأجسام النشطة الخافتة في الأشعة فوق البنفسجية، والتي تكون خافتة في الأشعة فوق البنفسجية ولكنها ساطعة وكبيرة من حيث الكتلة. يوضح الشكل 11 دالة اللمعان في الأشعة فوق البنفسجية لـ 37 جسمًا نشطًا في حقل الأشعة تحت الحمراء في فئتين من الانزياح الأحمر، و ، مقارنةً بعينات أخرى من الكوازارات الساطعة (ماتسوكو وآخرون 2018)، AGNs المختارة بالأشعة السينية (جيالونغو وآخرون 2019)، خطوط الانبعاث العريضة
AGNs (Harikane وآخرون 2023؛ Kocevski وآخرون 2023)، والمجرات (Bouwens وآخرون 2021) عند نفس الانزياحات الحمراء. الدوائر الحمراء المملوءة تظهر كثافة EROs بناءً على سطوعها فوق البنفسجي المرصود (أي، المحجوب). من حيث القيمة الظاهرة، فإن كثافتها أعلى بكثير من كثافة مجموعة QSOs اللامعة فوق البنفسجية ولكنها قابلة للمقارنة مع تلك الخاصة بـ AGNs ذات الأشعة السينية أو ذات الخطوط العريضة العريضة، التي تظهر سطوعًا مشابهًا. ومع ذلك، نلاحظ أنه حتى الآن لم يتم اكتشاف هذه EROs بالأشعة السينية، على الأرجح بسبب حجبها العالي (على سبيل المثال، Kocevski وآخرون 2023). مقارنة بكثافة المجرات، لا تزال EROs تشكل فقط جزءًا صغيرًا من مجموعة المجرات الأم، على الرغم من أنه كما تم الإشارة إليه في Harikane وآخرون (2023)، فإن هذا الرقم أكبر من ذلك في الكون المحلي.; ستيرن ولور 2012).
إذا قمنا بدلاً من ذلك بمقارنة الكثافات المستمدة من اللمعان فوق البنفسجي الداخلي المصحح بالغبار للـ AGNs (دوائر حمراء مفتوحة)، فإن مجموعة ERO تتداخل في اللمعان مع ذيل توزيع الـ QSO اللامع فوق البنفسجي، وهي أكثر وفرة بنحو ثلاثة أوامر من حيث الحجم. وهذا قد يعني زيادة كبيرة بشكل مدهش في عدد الـ AGNs اللامعة والكبيرة نسبيًا. لتأكيد التمييز الرئيسي بين اللمعان فوق البنفسجي المرصود/الداخلي، من الجدير بالذكر أنه إذا كانت الـ EROs عبارة عن مزيج من المجرات الضخمة المليئة بالغبار وQSOs الزرقاء الخافتة التي تهيمن على الانبعاث فوق البنفسجي (كما هو موضح في ملاءمات SED في اللوحة اليسرى من الشكل 8) فسوف نحصل على نفس دالة اللمعان فوق البنفسجي بالضبط (دوائر حمراء مملوءة) ولكن، في هذه الحالة، ستكون الـ AGNs خافتة بشكل داخلي مع لمعات بولومترية منخفضة من.
الوسيط واللمعان البولومتري لـ 37 EROs هو، مما يعني أن كتل الثقوب السوداء من رتبة، بافتراض نسب إيدينغتون من، أو أكبر لأنظمة تحت إيدنجتون. إن مقارنة كتل هذه الثقوب السوداء مع الكتل النجمية لمضيفيها، المستمدة من نموذج المجرة الزرقاء الهجينة + نموذج الكوازار الأحمر، ستشير إلى نسب كتل كبيرة وغير مسبوقة،، أكبر بكثير من النسبة النموذجية لـرُصد محليًا (كورمندي وهو 2013؛ رينيس وفولونتيري 2015).
باختصار، إذا كانت EROs هي AGNs الم obscured، فإن الزيادة الكبيرة في عدد الثقوب السوداء الضخمة اللامعة تعني أننا بدأنا في كشف حقبة رئيسية من النمو السريع والمكثف للثقوب السوداء مع دورات عمل قصيرة تحدث في أول مليار سنة من عمر الكون.
6.4. آفاق الكشف عن طبيعة هذه EROs
هذه المصادر معقدة في التفسير. على الرغم من أن الفوتومترية في نطاق الأشعة تحت الحمراء القصيرة باستخدام MIRI والطيفية باستخدام NIRSpec تساعد في وضع قيود أفضل على وجود استمرارية حمراء أو الانزياح الأحمر لهذه المصادر، إلا أنها ليست كافية لكسر التداخلات في السيناريوهات النمذجة المحتملة. يمكن أن تميز فوتومترية MIRI الإضافية عند أطوال موجية أطول بين الاستمرارية المتزايدة لكائن كوانتي مشوش والانخفاض في SED النجمي بعد. يمكن أن تكشف التحليلات الطيفية الأعمق لنظام NIRSpec في إطار UV أو البصري عن خطوط انبعاث عالية الإثارة (مثل C II و Mg II، أو He II و [ Ne V ])، مما يدل على وجود AGNs أو الوصول إلى الاستمرارية النجمية التي تظهر خطوط امتصاص تؤكد وجود مجموعة نجمية أساسية.
7. ملخص
نحدد 37 EROs في مجال CEERS بألوان NIRCam مغ، حتى حد
الحد من السطوع هو مغ. هؤلاء هم مرشحين لمجرات ضخمة مغبرة عند .
الميزة الرئيسية المحددة لهذه EROs هي أن جميعها لها ألوان زرقاء في نطاقات NIRCam SW (F150W – F277W ~0). تشير اختلافات الألوان في نطاقات SW و LW إلى أن هذه المجرات تحتوي على SEDs ثنائية النمط تتكون من ميل أحمر، قانون القوة ( ) في الإطار البصري، وميل أزرق، مسطح في الإطار UV. هذه الألوان و SEDs تختلف تمامًا عن تلك الخاصة بمجرات EROs الأخرى أو المجرات الضخمة المغبرة عند انزياحات حمراء أقل أو مماثلة.
ميزة رئيسية أخرى هي أن جميعها مضغوطة بشكل ملحوظ وبدون ميزات. تشير ملفات الضوء التي تناسب GALFIT إلى أنها مصادر غير محلولة، تشبه النقاط في جميع نطاقات NIRCam. وهذا يختلف مرة أخرى عن الانتشار النموذجي في الكتلة النجمية وحجم المجرات الأخرى EROs أو المجرات الضخمة عند انزياحات حمراء مماثلة.
تتراوح انزياحاتها الفوتومترية، وكتلها النجمية، وانخفاضات الغبار المستمدة باستخدام أكواد ملاءمة SED القياسية EAZYPY و FAST من مع قيم متوسطة و ، على التوالي. ومع ذلك، إذا لم تكن الألوان الحمراء ناتجة عن انبعاث الاستمرارية النجمية في مجرة مغبرة، فقد تكون هذه القيم مبالغ فيها. تشمل السيناريوهات البديلة: خطوط انبعاث مع EWs متطرفة A من مجرة أو AGN تعزز تدفقات LW، هجين من مجرة و QSO مغبرة مع الأخيرة تهيمن على الاستمرارية LW، أو AGN تهيمن على SED بالكامل.
تم الكشف عن أربعة من هذه EROs ضمن مشاهد MIRI المحدودة التي تتداخل مع فسيفساء CEERS/NIRCam بوضوح، مما يظهر أن الألوان الحمراء للغاية تمتد إلى أطوال موجية أطول. تم رصد أربعة EROs أخرى باستخدام NIRSpec وتظهر خطوط انبعاث [O III] و H التي تؤكد انزياحات حمراء طيفية في نطاق . تشير اكتشافات MIRI عند الأطوال الموجية المستريحة الحمراء من خطوط الانبعاث الأكثر بروزًا إلى وجود استمرارية وتعارض سيناريو حيث تكون هذه EROs مجرات زرقاء جوهريًا مع خطوط انبعاث عالية EWs تتنكر كاستمرارية حمراء.
نحقق في احتمالية وتأثيرات السيناريوهات النمذجة المختلفة باستخدام ثمانية EROs تم اكتشافها بواسطة MIRI و NIRSpec لاختبار مجموعة متنوعة من الأكواد مع خيارات مرنة لوصف الاستمرارية النجمية، خطوط الانبعاث، انخفاض الغبار، SFH، إلخ. بالنسبة للسيناريوهات التي تهيمن فيها نطاقات LW على مجرة مغبرة، نجد: (1) نماذج SED تعتمد على SFHs بارامترية أو غير بارامترية وقانون انخفاض Calzetti تفشل في إعادة إنتاج انبعاث UV الأزرق، بغض النظر عن افتراضات النمذجة (العمر، المعدن، إلخ) وغالبًا ما تؤدي إلى أكبر كتل نجمية، ; (2) النماذج التي تحتوي على قانون انخفاض رمادي مسطح توفر ملاءمة أفضل لمنطقة UV وكتل نجمية أقل؛ و (3) SEDs المركبة مع مجرة مغبرة و إما مجرة زرقاء أو QSO زرقاء تهيمن على نطاقات SW توفر أيضًا ملاءمة جيدة بشكل عام لـ SED وكتل مماثلة مع السيناريو (1). بالنسبة للسيناريوهات التي تهيمن فيها نطاقات LW على AGN محجوبة، نجد أن النماذج المعتمدة على QSO محجوبة بالإضافة إلى مجرة زرقاء تهيمن على نطاقات SW، أو نماذج AGN نقية، حيث تهيمن مجموعة من الانبعاث المحجوب والمتناثر بواسطة التوروس على SED بالكامل، توفر ملاءمة جيدة لـ
SED العام وتؤدي إلى كتل نجمية لمضيف المجرة أقل بمقدار مرتبتين من حيث الحجم مقارنة بالسيناريوهات التي تهيمن عليها المجرة المغبرة، مع .
الأحجام غير المحلولة، التي تشبه النقاط لجميع EROs تشير بشكل أكبر إلى سيناريو يهيمن عليه AGN وتعارض سيناريو يهيمن عليه المجرة حيث تتسبب SEDs الزرقاء والحمراء في مجموعات نجمية مختلفة في مناطق متميزة من المجرة.
ألوان NIRCam ليست كافية لكسر تدهور نماذج SED وتمييز المعنى بين السيناريوهات التي تهيمن عليها المجرة أو AGN. ستتمكن قياسات MIRI الإضافية الحمراء من F 1000 W، التي تستكشف SED الإطار بين 1 و ، من الإجابة على هذا السؤال بشكل قاطع.
كثافات الأعداد لا تفضل أي من السيناريوهات المتعلقة بالمجرة مقابل AGN أيضًا، حيث أن كلاهما لهما آثار محتملة إشكالية إذا تم تأكيد الخصائص المتطرفة لبعض هذه EROs. سيناريو المجرة المغبرة سيشير إلى زيادة في كثافة عدد المجرات الضخمة جدًا، ، عند تصل إلى عامل من ، مقارنة بتقديرات ما قبل JWST حتى لو تم تأكيد عدد قليل منها فقط على أنها ضخمة. وبالمثل، في سيناريو AGN المحجوب، ستشير اللمعان الكبير، المصحح للغبار، في UV إلى عدد غير متوقع كبير، ، من QSOs المحجوبة ولكن اللامعة، ، عند ، أكثر من ثلاث مرات أكبر من الكثافة المرصودة لـ QSOs غير المحجوبة مع -24 مغ.
شكر وتقدير
يقر P.G.P-G. بالدعم من المنحة PID2022-139567NB-I00 الممولة من وزارة العلوم والابتكار الإسبانية MCIN/AEI/10.13039/501100011033، FEDER طريقة واحدة للقيام بأوروبا. نحن نقر بالدعم من ناسا من خلال منحة STScI ERS JWST-ERS-1345. تم الحصول على بعض/كل البيانات المقدمة في هذه الورقة من أرشيف ميكولسكي لتلسكوبات الفضاء (MAST) في معهد علوم تلسكوب الفضاء. يمكن الوصول إلى الملاحظات المحددة التي تم تحليلها عبر doi:10.17909/z7p0-8481. لقد استخدمت هذه العمل قاعدة بيانات مسوحات الكون قوس قزح، التي تديرها مركز الأستروبيولوجيا (CAB)، CSICINTA، بالشراكة مع مراصد جامعة كاليفورنيا في سانتا كروز (UCO/Lick، UCSC).
هنا نقدم تفاصيل إضافية حول افتراضات النمذجة المعتمدة مع كل من الطرق التي تم مناقشتها في القسم 5.
بالنسبة لـ EAZYpy (بريمر وآخرون 2008) نستخدم مجموعة القوالب الافتراضية “tweak fsps QSF 12 v3″، والتي تتكون من مجموعة 12
قوالب مستمدة من كود تخليق السكان النجمي FSPS (كونروي وآخرون 2010). تغطي القوالب نطاقات واسعة في الأعمار، وانخفاضات الغبار، و-SFHs الطبيعية ويتم حسابها باستخدام IMF من شابرييه (2003) وقانون انخفاض كريك وكونروي (2013).
بالنسبة لـ Synthesizer (بيريز-غونزاليس وآخرون 2008b) نعتمد الافتراضات التالية: أسلوب أسي متأخر كـ SFH، مع قيم زمنية بين 100 مليون سنة و 5 مليارات سنة، أعمار بين 1 مليون سنة وعمر الكون عند انزياح المصدر، جميع المعدلات المعدنية المنفصلة المقدمة من نماذج بروزوال وشارلوت (2003)، قانون انخفاض كالسيتتي وآخرون (2000) مع قيم انخفاض -band، بين 0 و 5 مغ، و IMF من شابرييه (2003). تمت إضافة الاستمرارية النجمية وخطوط الانبعاث إلى النماذج كما هو موضح في بيريز-غونزاليس وآخرون (2008b). تم إجراء طريقة مونت كارلو للحصول على عدم اليقين وحساب التدهورات (انظر دومينغيز سانشيز وآخرون 2016).
بالنسبة لـ Prospector (Leja et al. 2019; Johnson et al. 2021) نتبنى الافتراضات التالية: نستخدم مسارات تطور النجوم وisochrones من MIST (Choi et al. 2016)، دالة الكتلة الأولية Chabrier (2003)، نطاق من المعادن النجمية بين -1.0 و 0.19، ونطاق من المعادن في الطور الغازي بين -2.0 و 0.5. يتراوح معامل التأين لانبعاث السديم بين -4 و -1. يتم توليد انبعاث الخطوط السديمية والانبعاث المستمر باستخدام CLOUDY Ferland et al. (1998) المضمن في FSPS والمُوصف في Byler et al. (2017). بالنسبة لقانون التوهين، نستخدم إما Calzetti et al. (2000) أو نموذج التوهين المعقد الذي يجمع بين نهج Charlot & Fall (2000) ذو المكونين، سحب الولادة مقابل شاشات الغبار المنتشرة، مع طريقة Kriek & Conroy (2013) التي تُعَلم المكون المنتشر كمزيج من توهين Calzetti بالإضافة إلى Lorentzian Drude لنمذجة قوة قمة الأشعة فوق البنفسجية. يتم تعديل كلا المكونين بواسطة عامل قانون القوة الذي يُسطح أو يُحدِّب من انحدار التوهين بالنسبة لـ Calzetti. المعلمات التي يتم ضبطها في هذه الحالة هي نسبة التوهين السديمي إلى التوهين المنتشر، والتي تتراوح بين صفر واثنين، ولكنها تتبع أولوية طبيعية مقطوعة مركزة عند واحد، ومؤشر الغبار لقانون القوة، الذي يتراوح بين -1 و 0.4. واحدة من المزايا الرئيسية لـ Prospector هي إمكانية استخدام SFHs مرنة. لغرض تحليلنا، نستكشف خيارين: تأخير قياسي.-نموذج وSFH غير بارامترية مقطعية. السكان الواحد-النموذج يستخدم أولويات واسعة نسبيًا على أعمار النجوم، تتراوح بين 1 مليون سنة وعمر الكون عند الانزياح الأحمر لكل مصدر، وعامل مقياس تشكيل النجوممن 100 مليون سنة إلى 20 مليار سنة. بالنسبة للنموذج غير المعلمي، نتبنى وصف تاريخ تشكيل النجوم المرن (Leja et al. 2019) مع ستة فترات زمنية وفرضية الاستمرارية المتقطعة (Tacchella et al. 2022). يتضمن هذا النموذج خمسة معلمات حرة تتحكم في نسبة معدل تشكيل النجوم في ستة فترات زمنية متجاورة؛ الفترتان الأوليان متباعدتان عند و من وقت النظر إلى الوراء، والأربعة صناديق المتبقية موزعة بشكل لوغاريتمي حتى عمر أقصى يبلغ 100 مليون سنة.
لنموذج المجرة الهجينة + QSO، نقوم بدمج مكون المجرة المستمد من Prospector باستخدام المعايير القياسيةنموذج مع قوالب QSO من بوليتا وآخرون (2006). ومع ذلك، لتوفير مزيد من المرونة لمكون AGN، نضيف درجة حرية إضافية في نمذجة Prospector تتضمن خطوط انبعاث AGN تتبع نسب الخطوط الموصوفة في ريتشاردسون وآخرون (2014).
الملحق ب جدول مع الـ 29 ERO المتبقية
نظرًا للاهتمام بالمصادر الغريبة لمزيد من التحليل أو المتابعة، نقوم بإدراج خصائص الـ 29 ERO المتبقية في العينة المختارة حسب اللون المكونة من 37 كائنًا في الجدول 2، ونظهرقصاصات ملونة مركبة لجميعهم في الشكل 12. بالإضافة إلى الإحداثيات، ندرج في الجدول تقديرات الانزياح الأحمر الفوتومتري باستخدام EAZY و كتل النجوم المستخدمة في تقديرات كثافة العدد في القسم 6. كما تم مناقشته في القسم 5.4، فإن القيم التي تم الحصول عليها باستخدام FAST وProspector-np وSynthesizer توفر نطاقًا تمثيليًا للتغيرات في كتل النجوم من أكبر القيم إلى أصغرها. نحن نؤجل تحليلًا أكثر تفصيلًا وتفردًا للمصادر الـ 29، مع مناقشة السيناريوهات التي تهيمن عليها AGN، إلى ورقة مستقبلية (D. Kocevski 2024، قيد الإعداد).
الجدول 2 جدول بالـ 29 ERO المتبقية
هوية
R.A. (درجة)
إعلان (درجة)
علم
( )
(1)
(2)
(3)
(4)
(5)
(6)
(7)
(8)
(9)
(10)
نيركام1-1507
214.9372049
52.9653511
0
نيركام1-2385
٢١٤.٩٩٨٤٠٧٢
53.0046186
0
نيركام1-2821
214.9568340
52.9731536
0
نيركام1-10084
٢١٤.٩٨٣٠٣٦٤
52.9560063
0
نيركام2-1604
214.9022374
52.9393697
0
نيركام2-3729
214.9257607
52.9456616
0
نيركام2-6335
٢١٤.٩٢٧٢٤٣٣
52.9338926
0
نيركام2-9558
٢١٤.٨٧٦١٤٥٨
52.8808258
0
نيركام3-9524
214.8066661
52.8378071
0
نيركام4-2690
214.6951501
52.7485639
0
نيركام4-6348
٢١٤.٧٩٥٣٦٧٢
52.7888465
0
نيركام5-3637
214.8922437
52.8774066
0
نيركام5-4552
214.8967641
52.8757973
0
نيركام5-9370
214.9102805
52.8600731
1
نيركام7-4742
215.1314689
52.9849141
0
نيركام7-4801
215.1370670
52.9885588
0
نيركام7-5787
215.0617802
52.9311768
0
نيركام7-5797
215.1437160
52.9888945
0
نيركام7-10403
215.1072079
52.9428524
0
نيركام7-12337
215.1370160
52.9556504
0
نيركام7-13272
215.0817101
52.9122515
1
نيركام8-8565
٢١٤.٩٧٩٩٦٠١
52.8610789
0
نيركام8-13596
215.0802967
52.9079028
0
نيركام9-3184
٢١٤.٨٨٦٤٢٢٥
52.8233786
0
نيركام9-5291
214.8760316
52.8061093
0
نيركام9-6909
٢١٤.٨٩٤٥٥٥
52.8121629
0
نيركام9-9665
214.8998043
52.8015414
0
نيركام9-12002
٢١٤.٨٩٦٤٧٠٠
52.7876884
0
نيركام10-1157
214.8513502
52.7992928
0
نيركام1-1507
نيركام1-2385
نيركام1-2821
نيركام1-10084
نيركام2-1604
نيركام2-3729
نيركام2-6335
نيركام2-9558
نيركام3-9524
نيركام4-2690
نيركام4-6348
نيركام5-3637
نيركام5-4552
نيركام5-9370
نيركام7-4742
نيركام7-4801
نيركام7-5787
نيركام7-5797
نيركام7-10403
نيركام7-12337
نيركام7-13272
نيركام8-8565
نيركام8-13596
نيركام9-3184
نيركام9-5291
نيركام9-6909
نيركام9-9665
نيركام9-12002
نيركام10-1157
الشكل 12. تركيبة لونية (F277W + F356W + F444W) 2″.5 قصاصات من 29 EROs الأخرى في العينة المختارة حسب اللون. مشابهة للثمانية مصادر الأساسية في الأشكال 6 و 7، هذه الأجسام أيضًا حمراء جدًا وموحدة بشكل ملحوظ ومضغوطة.
Adams, N. J., Conselice, C. J., Ferreira, L., et al. 2023, MNRAS, 518, 4755
Aird, J., Coil, A. L., & Georgakakis, A. 2018, MNRAS, 474, 1225
Akins, H. B., Casey, C. M., Allen, N., et al. 2023, ApJ, 956, 61
Alcalde Pampliega, B., Pérez-González, P. G., Barro, G., et al. 2019, ApJ, 876, 135
Alonso-Herrero, A., Pérez-González, P. G., Rigby, J., et al. 2004, ApJS, 154, 155
Arrabal Haro, P., Dickinson, M., Finkelstein, S. L., et al. 2023, Natur, 622, 7984
Astropy Collaboration, Price-Whelan, A. M., Lim, P. L., et al. 2022, ApJ, 935, 167
Baggen, J. F. W., van Dokkum, P., Labbe, I., et al. 2023, ApJL, 955, L12
Bagley, M. B., Finkelstein, S. L., Koekemoer, A. M., et al. 2023, ApJL, 946, L12
Barro, G., Faber, S. M., Koo, D. C., et al. 2017, ApJ, 840, 47
Barro, G., Faber, S. M., Pérez-González, P. G., et al. 2013, ApJ, 765, 104
Barro, G., Pérez-González, P. G., Gallego, J., et al. 2011, ApJS, 193, 30
Barrufet, L., Oesch, P. A., Weibel, A., et al. 2023, MNRAS, 522, 449
Bertin, E., & Arnouts, S. 1996, A&AS, 117, 393
Bezanson, R., van Dokkum, P. G., Tal, T., et al. 2009, ApJ, 697, 1290
Bouwens, R. J., Oesch, P. A., Stefanon, M., et al. 2021, AJ, 162, 47
Boylan-Kolchin, M. 2023, NatAs, 7, 731
Brammer, G. B., van Dokkum, P. G., & Coppi, P. 2008, ApJ, 686, 1503
Brammer, G. B., Whitaker, K. E., van Dokkum, P. G., et al. 2011, ApJ, 739, 24
Bruzual, G., & Charlot, S. 2003, MNRAS, 344, 1000
Burgasser, A. J., Gerasimov, R., Bezanson, R., et al. 2024, ApJ, 962, 177
Byler, N., Dalcanton, J. J., Conroy, C., & Johnson, B. D. 2017, ApJ, 840, 44
Calzetti, D., Armus, L., Bohlin, R. C., et al. 2000, ApJ, 533, 682
Caputi, K. I. 2013, ApJ, 768, 103
Casey, C. M., Scoville, N. Z., Sanders, D. B., et al. 2014, ApJ, 796, 95
Castellano, M., Fontana, A., Treu, T., et al. 2022, ApJL, 938, L15
Chabrier, G. 2003, PASP, 115, 763
Charlot, S., & Fall, S. M. 2000, ApJ, 539, 718
Choi, J., Dotter, A., Conroy, C., et al. 2016, ApJ, 823, 102
Conroy, C., Gunn, J. E., & White, M. 2009, ApJ, 699, 486
Conroy, C., White, M., & Gunn, J. E. 2010, ApJ, 708, 58
Domínguez Sánchez, H., Pérez-González, P. G., Esquej, P., et al. 2016, MNRAS, 457, 3743
Donley, J. L., Kartaltepe, J., Kocevski, D., et al. 2018, ApJ, 853, 63
Donley, J. L., Koekemoer, A. M., Brusa, M., et al. 2012, ApJ, 748, 142
Donley, J. L., Rieke, G. H., Pérez-González, P. G., & Barro, G. 2008, ApJ, 687, 111
Donley, J. L., Rieke, G. H., Pérez-González, P. G., Rigby, J. R., & Alonso-Herrero, A. 2007, ApJ, 660, 167
Egami, E., Kneib, J. P., Rieke, G. H., et al. 2005, ApJL, 618, L5
Endsley, R., Stark, D. P., Chevallard, J., & Charlot, S. 2021, MNRAS, 500, 5229
Endsley, R., Stark, D. P., Whitler, L., et al. 2023, MNRAS, 524, 2312
Eyles, L. P., Bunker, A. J., Ellis, R. S., et al. 2007, MNRAS, 374, 910
Ferland, G. J., Korista, K. T., Verner, D. A., et al. 1998, PASP, 110, 761
Ferrara, A., Pallottini, A., & Dayal, P. 2023, MNRAS, 522, 3986
Finkelstein, S., Bagley, M., & Yang, G. 2023b, Data from The Cosmic Evolution Early Release Science Survey (CEERS), STScI/MAST, doi:10. 17909/Z7P0-8481
Finkelstein, S. L., Bagley, M. B., Ferguson, H. C., et al. 2023a, ApJL, 946, L13
Finkelstein, S. L., Dickinson, M., Ferguson, H. C., et al. 2017, The Cosmic Evolution Early Release Science (CEERS) Survey, JWST Proposal, Cycle 0, STScI, 1345
Fujimoto, S., Arrabal Haro, P., Dickinson, M., et al. 2023, ApJL, 949, L25
Fujimoto, S., Brammer, G. B., Watson, D., et al. 2022, Natur, 604, 261
Furtak, L. J., Zitrin, A., Plat, A., et al. 2023, ApJ, 952, 142
Gaia Collaboration, Prusti, T., de Bruijne, J. H. J., et al. 2016, A&A, 595, A1
Giallongo, E., Grazian, A., Fiore, F., et al. 2019, ApJ, 884, 19
Gilli, R., Norman, C., Vignali, C., et al. 2014, A&A, 562, A67
Gómez-Guijarro, C., Magnelli, B., Elbaz, D., et al. 2023, A&A, 677, A34
González, V., Bouwens, R., llingworth, G., et al. 2014, ApJ, 781, 34
Grazian, A., Fontana, A., Santini, P., et al. 2015, A&A, 575, A96
Greene, J. E., & Ho, L. C. 2007, ApJ, 670, 92
Grogin, N. A., Kocevski, D. D., Faber, S. M., et al. 2011, ApJS, 197, 35
Hainline, K. N., Helton, J. M., Johnson, B. D., et al. 2023, arXiv:2309.03250
Harikane, Y., Zhang, Y., Nakajima, K., et al. 2023, ApJ, 959, 39
Holwerda, B., Pirzkal, N., Burgasser, A., & Hsu, C. C. 2023, arXiv:2306. 12363
Hopkins, P. F., Bundy, K., Hernquist, L., Wuyts, S., & Cox, T. J. 2010, MNRAS, 401, 1099
Hunter, J. D. 2007, CSE, 9, 90
Johnson, B. D., Leja, J., Conroy, C., & Speagle, J. S. 2021, ApJS, 254, 22
Kocevski, D. D., Barro, G., Faber, S. M., et al. 2017, ApJ, 846, 112
Kocevski, D. D., Onoue, M., Inayoshi, K., et al. 2023, ApJL, 954, L4
Koekemoer, A. M., Faber, S. M., Ferguson, H. C., et al. 2011, ApJS, 197, 36
Kormendy, J., & Ho, L. C. 2013, ARA&A, 51, 511
Kriek, M., & Conroy, C. 2013, ApJL, 775, L16
Kriek, M., van Dokkum, P. G., Franx, M., Illingworth, G. D., & Magee, D. K. 2009, ApJL, 705, L71
Labbé, I., Oesch, P. A., Bouwens, R. J., et al. 2013, ApJL, 777, L19
Labbé, I., van Dokkum, P., Nelson, E., et al. 2023, Natur, 616, 266
Lacy, M., Sajina, A., Petric, A. O., et al. 2007, ApJL, 669, L61
Langeroodi, D., Hjorth, J., & Zhang, Z. 2023, ApJ, 957, L27
Larson, R. L., Hutchison, T. A., Bagley, M., et al. 2023, ApJ, 958, 141
Leja, J., Carnall, A. C., Johnson, B. D., Conroy, C., & Speagle, J. S. 2019, ApJ, 876, 3
Mason, C. A., Trenti, M., & Treu, T. 2023, MNRAS, 521, 497
Matsuoka, Y., Strauss, M. A., Kashikawa, N., et al. 2018, ApJ, 869, 150
Matthee, J., Mackenzie, R., Simcoe, R. A., et al. 2023, ApJ, 950, 67
McCarthy, P. J., Le Borgne, D., Crampton, D., et al. 2004, ApJL, 614, L9
Meisner, A. M., Schneider, A. C., Burgasser, A. J., et al. 2021, ApJ, 915, 120
Muzzin, A., Marchesini, D., Stefanon, M., et al. 2013, ApJ, 777, 18
Naidu, R. P., Oesch, P. A., Setton, D. J., et al. 2022, arXiv:2208.02794
Nelson, E., van Dokkum, P., Franx, M., et al. 2014, Natur, 513, 394
Nelson, E. J., Suess, K. A., Bezanson, R., et al. 2023, ApJL, 948, L18
Nonino, M., Glazebrook, K., Burgasser, A. J., et al. 2023, ApJL, 942, L29
Oke, J. B., & Gunn, J. E. 1983, ApJ, 266, 713
Papovich, C., Cole, J., Yang, G., et al. 2023, ApJL, 949, L18
Peng, C. Y., Ho, L. C., Impey, C. D., & Rix, H. W. 2002, AJ, 124, 266
Pérez-González, P. G., Barro, G., Annunziatella, M., et al. 2023a, ApJL, 946, L16
Pérez-González, P. G., Costantin, L., Langeroodi, D., et al. 2023b, ApJL, 951, L1
Pérez-González, P. G., Rieke, G. H., Egami, E., et al. 2005, ApJ, 630, 82
Pérez-González, P. G., Rieke, G. H., Villar, V., et al. 2008a, ApJ, 675, 234
Pérez-González, P. G., Trujillo, I., Barro, G., et al. 2008b, ApJ, 687, 50
Polletta, M. d. C., Wilkes, B. J., Siana, B., et al. 2006, ApJ, 642, 673
Reines, A. E., & Volonteri, M. 2015, ApJ, 813, 82
Richards, G. T., Lacy, M., Storrie-Lombardi, L. J., et al. 2006, ApJS, 166, 470
Richardson, C. T., Allen, J. T., Baldwin, J. A., Hewett, P. C., & Ferland, G. J. 2014, MNRAS, 437, 2376
Rinaldi, P., Caputi, K. I., Costantin, L., et al. 2023, ApJ, 952, 143
Rodighiero, G., Bisigello, L., Iani, E., et al. 2023, MNRAS, 518, L19
Runnoe, J. C., Brotherton, M. S., & Shang, Z. 2012, MNRAS, 422, 478
Sawicki, M. 2002, AJ, 124, 3050
Schmidt, M. 1968, ApJ, 151, 393
Somerville, R. S., Olsen, C., Yung, L. Y. A., et al. 2021, MNRAS, 502, 4858
Somerville, R. S., Popping, G., & Trager, S. C. 2015, MNRAS, 453, 4337
Song, M., Finkelstein, S. L., Ashby, M. L. N., et al. 2016, ApJ, 825, 5
Stark, D. P., Ellis, R. S., Bunker, A., et al. 2009, ApJ, 697, 1493
Stefanon, M., Bouwens, R. J., Labbé, I., et al. 2021, ApJ, 922, 29
Stefanon, M., Marchesini, D., Muzzin, A., et al. 2015, ApJ, 803, 11
Stefanon, M., Marchesini, D., Rudnick, G. H., Brammer, G. B., & Whitaker, K. E. 2013, ApJ, 768, 92
Stern, D., Eisenhardt, P., Gorjian, V., et al. 2005, ApJ, 631, 163
Stern, J., & Laor, A. 2012, MNRAS, 426, 2703
Tacchella, S., Dekel, A., Carollo, C. M., et al. 2016, MNRAS, 458, 242
Tacchella, S., Finkelstein, S. L., Bagley, M., et al. 2022, ApJ, 927, 170
Tadaki, K. i., Genzel, R., Kodama, T., et al. 2017, ApJ, 834, 135
van der Walt, S., Colbert, S. C., & Varoquaux, G. 2011, CSE, 13, 22
van der Wel, A., Franx, M., van Dokkum, P. G., et al. 2014, ApJ, 788, 28
van Dokkum, P. G., Nelson, E. J., Franx, M., et al. 2015, ApJ, 813, 23
Wang, P. Y., Goto, T., Ho, S. C. C., et al. 2023, MNRAS, 523, 4534
Wang, T., Huang, J. S., Faber, S. M., et al. 2012, ApJ, 752, 134
Wellons, S., Torrey, P., Ma, C. P., et al. 2015, MNRAS, 449, 361
Whitler, L., Endsley, R., Stark, D. P., et al. 2023, MNRAS, 519, 157
Wilkins, S. M., Stanway, E. R., & Bremer, M. N. 2014, MNRAS, 439, 1038
Williams, C. C., Giavalisco, M., Cassata, P., et al. 2014, ApJ, 780, 1
Witt, A. N., & Gordon, K. D. 2000, ApJ, 528, 799
Yung, L. Y. A., Somerville, R. S., Ferguson, H. C., et al. 2022, MNRAS, 515, 5416
Yung, L. Y. A., Somerville, R. S., Finkelstein, S. L., Popping, G., & Davé, R. 2019a, MNRAS, 483, 2983
Yung, L. Y. A., Somerville, R. S., Finkelstein, S. L., et al. 2023, MNRAS, 519, 1578
Yung, L. Y. A., Somerville, R. S., Popping, G., et al. 2019b, MNRAS, 490, 2855
Zavala, J. A., Buat, V., Casey, C. M., et al. 2023, ApJL, 943, L9
Zolotov, A., Dekel, A., Mandelker, N., et al. 2015, MNRAS, 450, 2327
dominated scenarios. This object is also studied in Akins et al. (2023). This object is also studied in Kocevski et al. (2023) as MPTID-746. This object is also studied in Fujimoto et al. (2023) as MPTID-20.
Notes. (1) Source ID in the CEERS catalog. (2) R.A. (J2000). (3) Decl. (J2000). (4) Brown dwarf flag based on blue color, F115W-F200<-1. (5) Photometric redshift in Section 2.3. (6) Stellar masses derived using FAST. (7) Stellar masses derived using Prospector-np. (8) Stellar masses derived using Synthesizer. (9) Stellar masses derived using the hybrid galaxy + QSO model. (10) Rest-frame UV luminosity, not corrected for extinction. This object is also studied in Pérez-González et al. (2023a). This object is also studied in Labbé et al. (2023).
Extremely Red Galaxies at with MIRI and NIRSpec: Dusty Galaxies or Obscured Active Galactic Nuclei?
Guillermo Barro (D), Pablo G. Pérez-González (D), Dale D. Kocevski (D), Elizabeth J. McGrath (D), Jonathan R. Trump (D), Raymond C. Simons (D), Rachel S. Somerville (D), L. Y. Aaron Yung (D), Pablo Arrabal Haro (D), Hollis B. Akins (D), Michaela B. Bagley (D), Nikko J. Cleri (D), Luca Costantin (D), Kelcey Davis (D), Mark Dickinson (D), Steve L. Finkelstein (D), Mauro Giavalisco (D), Carlos Gómez-Guijarro (D), Nimish P. Hathi (D), Michaela Hirschmann (D), Benne W. Holwerda (D), Marc Huertas-Company (D), Jeyhan S. Kartaltepe (D), Anton M. Koekemoer (D), Ray A. Lucas (D), Casey Papovich (D), Nor Pirzkal (D), Lise-Marie Seillé (D), Sandro Tacchella (D), Stijn Wuyts (D), Stephen M. Wilkins (D), Alexander de la Vega (D), Guang Yang (D), and Jorge A. Zavala (D) Department of Physics and Astronomy, University of the Pacific, Stockton, CA 90340 USA; gbarro@pacific.edu Centro de Astrobiología (CAB), CSIC-INTA, Ctra. de Ajalvir km 4, Torrejón de Ardoz, E-28850 Madrid, Spain Department of Physics and Astronomy, Colby College, Waterville, ME 04901, USA Department of Physics, 196A Auditorium Road, Unit 3046, University of Connecticut, Storrs, CT 06269, USA Center for Computational Astrophysics, Flatiron Institute, 162 5th Avenue, New York, NY 10010, USA Astrophysics Science Division, NASA Goddard Space Flight Center, 8800 Greenbelt Road, Greenbelt, MD 20771, USA NSF’s National Optical-Infrared Astronomy Research Laboratory, 950 N. Cherry Avenue, Tucson, AZ 85719, USA Department of Astronomy, The University of Texas at Austin, Austin, TX, USA Department of Physics and Astronomy, Texas A&M University, College Station, TX 77843-4242 USA George P. and Cynthia Woods Mitchell Institute for Fundamental Physics and Astronomy, Texas A&M University, College Station, TX USA Centro de Astrobiología (CAB/CSIC-INTA), Ctra. de Ajalvir km 4, Torrejón de Ardoz, E-28850 Madrid, Spain University of Massachusetts Amherst, 710 North Pleasant Street, Amherst, MA 01003-9305, USA Université Paris-Saclay, Université Paris Cité, CEA, CNRS, AIM, F-91191 Gif-sur-Yvette, France Space Telescope Science Institute, Baltimore, MD, USA Institute of Physics, Laboratory of Galaxy Evolution, Ecole Polytechnique Fédérale de Lausanne (EPFL), Observatoire de Sauverny, 1290 Versoix, Switzerland Physics & Astronomy Department, University of Louisville, Louisville, KY 40292, USA Instituto de Astrofísica de Canarias, La Laguna, Tenerife, Spain Universidad de la Laguna, La Laguna, Tenerife, Spain Université Paris-Cité, LERMA-Observatoire de Paris, PSL, Paris, France Laboratory for Multiwavelength Astrophysics, School of Physics and Astronomy, Rochester Institute of Technology, 84 Lomb Memorial Drive, Rochester, NY 14623, USA Space Telescope Science Institute, 3700 San Martin Drive, Baltimore, MD 21218, USA Aix Marseille Univ, CNRS, CNES, LAM Marseille, France Kavli Institute for Cosmology, University of Cambridge, Madingley Road, Cambridge CB3 0HA, UK Cavendish Laboratory, University of Cambridge, 19 JJ Thomson Avenue, Cambridge CB3 0HE, UK Department of Physics, University of Bath, Claverton Down, Bath BA2 7AY, UK Astronomy Centre, University of Sussex, Falmer, Brighton BN1 9QH, UK Institute of Space Sciences and Astronomy, University of Malta, Msida MSD 2080, Malta Department of Physics and Astronomy, University of California, 900 University Avenue, Riverside, CA 92521, USA Kapteyn Astronomical Institute, University of Groningen, P.O. Box 800, 9700 AV Groningen, The Netherlands SRON Netherlands Institute for Space Research, Postbus 800, 9700 AV Groningen, The Netherlands National Astronomical Observatory of Japan, 2-21-1 Osawa, Mitaka, Tokyo 181-8588, JapanReceived 2023 May 22; revised 2023 November 17; accepted 2023 December 6; published 2024 March 6
Abstract
We study a new population of extremely red objects (EROs) recently discovered by the James Webb Space Telescope (JWST) based on their NIRCam colors F277W – F444W > 1.5 mag. We find 37 EROs in the Cosmic Evolution Early Release Science Survey (CEERS) field with F444W < 28 mag and photometric redshifts between , with median . Surprisingly, despite their red long-wavelength colors, these EROs have blue short-wavelength colors (F150W – F200W ~0 mag) indicative of bimodal spectral energy distributions (SEDs) with a red, steep slope in the rest-frame optical, and a blue, flat slope in the rest-frame UV. Moreover, all these EROs are unresolved, point-like sources in all NIRCam bands. We analyze the SEDs of eight of them with MIRI and NIRSpec observations using stellar population models and active galactic nucleus (AGN) templates. We find that dusty galaxies or obscured AGNs provide similarly good SED fits but different stellar properties: massive and dusty, and , or low mass and obscured, and mag, hosting an obscured quasi-stellar object (QSO). SED modeling does not favor either scenario, but their unresolved sizes are more suggestive of AGNs. If any EROs are confirmed to have , it would increase the pre-JWST number density at by up to a factor . Similarly, if they are QSOs with luminosities in the
NASA Postdoctoral Fellow.
range, their number would exceed that of bright blue QSOs by more than three orders of magnitude. Additional photometry at mid-infrared wavelengths will reveal the true nature of the red continuum emission in these EROs and will place this puzzling population in the right context of galaxy evolution.
Unified Astronomy Thesaurus concepts: Galaxy formation (595); Galaxy evolution (594); High-redshift galaxies (734); Stellar populations (1622); James Webb Space Telescope (2291); Galaxy photometry (611)
1. Introduction
The extraordinary capabilities of the James Webb Space Telescope (JWST) provide the opportunity to completely transform our understanding of the high-redshift Universe. The enhanced photometric sensitivity and spatial resolution at mid-infrared wavelengths relative to the Hubble Space Telescope (HST) or Spitzer have enabled, in the first few months of operations, a number of studies that have pushed the limits of the youngest and most distant galaxies detected in the epoch of reionization (e.g., Castellano et al. 2022; Naidu et al. 2022; Finkelstein et al. 2023a; Pérez-González et al. 2023a, 2023b; Adams et al. 2023; Whitler et al. 2023) as well as expanded our identification of more massive galaxies up to and beyond (e.g., Tacchella et al. 2022; Endsley et al. 2023; Labbé et al. 2023; Nelson et al. 2023). In the process, these papers have started to reveal the nature of the most massive galaxies that were previously undetected by HST (HST-dark) and detected only by Spitzer/IRAC, longer radio, and submillimeter wavelengths (Barrufet et al. 2023; PérezGonzález et al. 2023a; Gómez-Guijarro et al. 2023; Rodighiero et al. 2023; Zavala et al. 2023), or not at all.
However, as we work our way toward a more complete census of the high-redshift Universe, there is a concern that some of these early estimates of the number density of galaxies or their (large) stellar masses could be in tension with model predictions (e.g., Boylan-Kolchin 2023; Ferrara et al. 2023; Mason et al. 2023). A potential caveat for these photometric studies is that as we probe galaxies in the first 1 Gyr of the lifetime of the Universe we might find a large number of young, low-mass galaxies with extreme emission lines and potentially large equivalent widths (EWs) of more than , as suggested by early studies of faint galaxies with Spitzer/IRAC (e.g., Egami et al. 2005; Eyles et al. 2007; Stark et al. 2009; González et al. 2014; Labbé et al. 2013). Such large EWs can make the H , [O III], and line fluxes boost the broad- and medium-band photometry in the JWST/NIRCam filters up to F444W, making them appear very red. The impact on the colors can affect both the photometric redshifts (e.g., Arrabal Haro et al. 2023) and the stellar population properties of these young, blue galaxies, introducing a bias toward older ages, more dust obscuration, and significantly larger masses ( ). Recent JWST-based papers have reported that emission lines with large EWs contaminating the NIRCam photometry are indeed a common occurrence (Endsley et al. 2021, 2023; Matthee et al. 2023; Rinaldi et al. 2023), which may hamper the identification of true massive galaxies at . Another potential concern with massive galaxy selections based on extremely red colors is the contamination by obscured active galactic nuclei (AGNs). As shown also in IRAC-based studies, the red, power-law-like emission of an obscured AGN can also lead to very red optical to IR colors, which have been widely used to identify these galaxies in cosmological surveys (e.g.,
Alonso-Herrero et al. 2004; Stern et al. 2005; Lacy et al. 2007; Donley et al. 2008, 2012). While the incidence of emission line or AGN contamination in color-selected samples at low to mid redshifts is only minor, the impact on JWST-based surveys is still unclear.
A way forward to overcome the degeneracy in the origin of colors in red galaxies (high-EW emission lines versus stellar or AGN continuum) is to obtain photometry in multiple bands and extend the coverage to longer wavelengths. Clear detections at wavelengths that are not severely affected by strong emission lines would be a clear confirmation of continuum emission. Likewise, long-wavelength (LW) detections probing the restframe near-infrared (NIR) of the galaxies can help distinguish between power-law AGN emission and the stellar bump (Sawicki 2002; Donley et al. 2007). Observations with JWST/MIRI at help break both of these degeneracies. Similarly, JWST/NIRSpec can provide precise redshifts for these galaxies and help calibrate the impact of the emission lines in photometric observations.
In this paper, we use the first and second epochs of data from the Cosmic Evolution Early Release Science Survey (CEERS; Finkelstein et al. 2017) to identify candidates for massive dusty galaxies at with very red colors in the LW NIRCam filters. Then, we focus on a subset of those galaxies with MIRI and NIRSpec observations to place better constraints on their redshifts and their emission at longer wavelengths, and we perform a detailed analysis of different spectral energy distribution (SED) modeling scenarios to determine the likelihood that they are blue high-EW galaxies, dusty massive galaxies, or obscured AGNs and the implications for the stellar masses and number densities of the sample in each case.
The paper is structured as follows. In Section 2, we describe the data reduction of the multiband NIRCam and MIRI imaging and the NIRSpec spectroscopy. We also describe the photometric measurements, catalog creation, and preliminary estimates of the photometric redshifts and stellar properties for the whole CEERS region. In Sections 3 and 4, we perform the extremely red object (ERO) color selection and we describe the colors, SEDs, photometric redshifts, and stellar masses of the sample selected that way. In Section 5, we perform a detailed SED modeling of a subset of eight EROs observed with MIRI and NIRSpec using a variety of SED models aimed at testing the dusty galaxy versus obscured-AGN scenarios and their implications on the stellar population properties. In Section 6, we discuss the likelihood of the different modeling scenarios based on the general properties of the EROs as well as their best-fit SEDs. Lastly, We summarize our results and discuss future prospects in Section 7.
Throughout this paper, we assume a cosmology with , and . Quoted uncertainties are at the confidence level. All magnitudes are in AB units (Oke & Gunn 1983).
2. Data
This paper is based on observations from CEERS, an early release science program (Finkelstein et al. 2017) which covers approximately of the Extended Groth Strip (EGS) with imaging and spectroscopy using coordinated, overlapping parallel observations by multiple JWST instruments. These images are available on the CEERS website and on MAST as a High Level Science Product (doi:10.17909/z7p0-8481, Finkelstein et al. 2023b). Here we use the data acquired in 2022 June and December which comprise 10 NIRCam pointings in seven filters: three at short wavelengths (SW; F115W, F150W, and F200W), and four at LW (F277W, F356W, F410M, and F444W); and eight MIRI pointings in seven filters (F560W, F770W, F1000W, F1280W, F1500W, F1800W, and F2100W). Due to the nature of the CEERS parallel observations, some of the MIRI pointings are only observed either in the short (F560W and F770W) or long (F1000W to F2100W) wavelength filters and only six of them overlap with the NIRCam imaging. The names of these pointings in the APT observing file are , and 9 , observed in F560W and F770W, and 5 and 8, observed at LW only. In addition to NIRCam imaging, pointings 3, 6, and 7 overlap with the NIRCam WFSS grism observations and two of the NIRSpec pointings named 9 and 10 in the APT file.
The NIRCam and MIRI data were calibrated using version 1.7.2 of the JWST Calibration Pipeline, reference files in pmap version 0214 (which includes a detector-to-detector-matched, improved absolute photometric calibration), with some additional modifications described in more detail in Finkelstein et al. (2023a) and Bagley et al. (2023) for NIRCam and Papovich et al. (2023) and G. Yang et al. (2024, in preparation) for MIRI. The reduced images are registered to the same world coordinate system reference frame (based on Gaia DR1.2; Gaia Collaboration et al. 2016) and coadded into single mosaics with pixel scales of and pixel for NIRCam and MIRI, respectively.
The CEERS NIRSpec observations (P. Arrabal Haro 2024, in preparation) were processed using version 1.8.5 of the JWST Science Calibration Pipeline, with the Calibration Reference Data System mapping 1027 following similar procedures as in Fujimoto et al. (2023) and Kocevski et al. (2023). Briefly, we correct for detector noise, subtract the dark current and bias, and generate count-rate maps starting from the uncalibrated images. We apply a few additional custom steps to improve the treatment of cosmic-ray “snowballs.” The resulting maps are processed with stage two of the pipeline to generate reduced 2D spectra with a rectified trace and flat slope. Custom extraction apertures are determined visually by inspecting the images for high signal-to-noise ratio continuum or emission lines. Lastly, we extract the 1D spectra boxcar apertures centered on the visually identified trace.
2.1. Source Extraction and Photometry
The source extraction and multiband photometric measurements were performed following the same methods as for the first epoch data described in detail in Finkelstein et al. (2023a). Briefly, photometry was computed on point-spread function (PSF)-matched images using SExtractor (Bertin & Arnouts 1996) v2.25.0 in two-image mode, with an inverse-variance
weighted combination of the PSF-matched F277W and F356W images as the detection image. Photometry was measured in all seven of the NIRCam bands observed by CEERS, as well as the F606W, F814W, F105W, F125W, F140W, and F160W HST bands using data obtained by the CANDELS and 3D-HST surveys (Brammer et al. 2011; Grogin et al. 2011; Koekemoer et al. 2011).
2.2. Circular Aperture Photometry
We recompute the photometry of the subsample of objects studied in Section 5 using smaller circular apertures to improve the precision in the photometric errors and to avoid potential photometric contamination by nearby sources or background subtraction problems. Given that the nature of our galaxies is very homogeneous, and all sources analyzed in this paper are barely resolved or unresolved (see Section 4), photometric apertures with a diameter were the most adequate to obtain the most precise and reliable SEDs. Photometry was measured in original and PSF-matched images, and after applying aperture corrections for point-like sources for the former, we arrived at consistent colors within at least half the value of the photometric corrections.
2.3. Photometric Redshifts and Stellar Population Properties
We estimate photometric redshifts for the whole parent catalog by fitting the multiband SEDs using the code EAZYpy (Brammer et al. 2008). The code fits nonnegative linear combinations of templates to the observed data to derive probability distribution functions (PDFs). Here we use the default template set “tweak fsps QSF 12 v 3 ” which consists of a set of 12 templates derived from the stellar population synthesis code FSPS (Conroy et al. 2010). As a result, in addition to the photometric redshift the code also provides an estimate of the stellar mass as well as the dust attenuation. In addition, we also estimate stellar population properties by fitting the optical and NIR SEDs using FAST (Kriek et al. 2009), assuming Bruzual & Charlot (2003) stellar population synthesis models, following a Chabrier (2003) initial mass function (IMF), a delayed exponential star formation history (SFH), and the Calzetti et al. (2000) dust law with attenuation mag.
3. Sample Selection
3.1. ERO Color Criterion
We identify extremely red galaxies at high redshift using a single color cut of F277W – F444W > 1.5 mag. This method is similar to the traditional ERO ( ; e.g., McCarthy et al. 2004) or IERO ( ; e.g., Wang et al. 2012; Caputi 2013; Stefanon et al. 2013) selections, which use red optical to NIR colors to find massive, dusty, or quiescent galaxies with strong Balmer or breaks at . With the arrival of JWST, this technique has been extended to fainter magnitudes and higher redshifts by using filters at longer wavelengths, for example, F150W – F444W in Barrufet et al. (2023), or F150W – F356W in Pérez-González et al. (2023a). Recently, Labbé et al. (2023) used a threshold of F277W – F444W > 1 mag to identify candidates to massive galaxies at . Here we use a slightly redder color and we drop the additional color constraints to lower the selection redshift to . A redder color threshold can also reduce the contamination by galaxies
Figure 1. Color-magnitude and color-color diagrams showing the selection threshold for F277W EROs (circles; F277W – F444W > 1.5 mag), relative to the bulk of the CEERS galaxy catalog, color coded by stellar mass and , and a subset of F150W EROs (F150W – F444W mag). The blue and purple markers indicate the EROs observed with MIRI and NIRSpec, respectively. The black squares show the EROs from Labbé et al. (2023). The left and central panels show the general trends toward redder colors with increasing mass and dust attenuation (arrows), which suggest that F277W EROs are massive and dusty galaxies. However, the central panel reveals that F277W EROs have surprisingly blue colors at SW, F150W – F200W ~ 0 mag, very different from those of F150W EROs and massive dusty galaxies in general. The red square shows a massive, dusty, submillimeter galaxy at from Zavala et al. (2023) which is also red in all bands. This implies that F277W EROs have bimodal SEDs with blue SW colors and red LW colors. The right panel shows the correlation between photometric redshift and F150W – F277W color for the F277W EROs. As the F277W filter shifts from the steep, rest-frame optical range to the flat rest-frame UV range with increasing redshift, the color declines to F150W – F277W ~ 0 mag.
with high-EW emission lines ( ) boosting the NIR fluxes of blue galaxies with a relatively shallow stellar continuum. For example, Endsley et al. (2023) find red colors, and , in a sample of low-mass, Lyman-break galaxy candidates at which were largely driven by high-EW III lines boosting the flux in F444W. Such strong lines have also been spectroscopically confirmed by recent NIRCam/WFSS surveys at slightly lower redshifts of (Matthee et al. 2023).
The left panel of Figure 1 illustrates the sample selection in a color-magnitude diagram compared to the overall distribution of galaxies in the CEERS catalog, color coded by different properties, and a subsample of F150W EROS (F150W – F444W > 2 and F444W <25 mag; red circles). The 13 galaxies from Labbé et al. (2023) are shown with black squares. All of them except the four with colors are included in our sample. The color code in the CEERS sample highlights the trend of increasing NIR colors with extinction (and similarly with stellar mass and redshift in the other panels). As discussed above, galaxies redder than the color threshold (dashed line) are candidates for massive galaxies with red, dusty, or quiescent SEDs and possibly some galaxies with high-EW emission lines. Interestingly, there are some differences between the sample of F150W EROs and F277W EROs. First, F277W EROs are fainter, with a median magnitude of , whereas F150W EROs span a broader range in magnitude starting at mag, which is consistent with the notion that by selecting in a redder band, F277W EROs lean more toward the higher-redshift tail of the massive galaxy selection. Second, F150W EROs are typically selected within a brighter limiting magnitude to restrict the number of galaxies in the lower-mass end of the selection
criteria (e.g., F444W -26; Alcalde Pampliega et al. 2019; Gómez-Guijarro et al. 2023). However, using a fainter limiting magnitude increases the overlap between the two ERO samples, as shown for example in Pérez-González et al. (2023a). Nevertheless, we find that, even within a similar magnitude range, the F150W selection misses some F277W EROs because they have bluer colors in .
The reason for this key difference is highlighted in the central panel of Figure 1, which shows that all the F277W EROs are surprisingly blue in F150W – F200W mag, which probes the rest-frame UV at . Consequently, these EROs populate a very different region of the color-color diagram far from the loci of the F150W EROs, and all other massive galaxies which typically have red colors, . This means that, unlike the majority of other massive galaxies, which are red across their whole SEDs, the F277W EROs are blue in the rest-frame UV and red in the rest-frame optical. Such peculiar colors indicate that these EROs have bimodal blue-red SEDs ( shaped or shaped in ), as noted by Labbé et al. (2023). The right panel shows that the goal of the second color threshold ( ) in the selection method of Labbé et al. (2023) is to remove galaxies at from the sample. The F150W – F270W color acts as a pseudoredshift because the F277W filter shifts from the steep optical side of the SED to the flat UV with increasing redshift. Consequently, the color quickly declines toward F150W – F270W ~0 for galaxies at . For the same reason, the primary selection in F277W – F444W might start missing galaxies of this type at when the F444W filter starts to shift out the steep restframe optical range. Lastly, we note that the selection in is surprisingly clean as it only
Figure 2. NIRCam color-color, F115W – F200W vs. F277W – F444W diagram showing the bulk of the CEERS galaxy population (gray scale) and the EROs (circles) selected in Section 3.1 based on their characteristic blue-red colors in the SW and LW bands. The colors are the same as in Figure 1. The solid and dashed black lines depict the color tracks as a function of temperature ( ) and metallicity ( and 0 ) derived from LOWZ brown dwarf stellar templates (Meisner et al. 2021). While brown dwarfs also appear to have blue-red SEDs in the NIRCam bands, their SW colors are typically bluer, , than the ERO population at similar LW colors. Based on this distinction we identify two potential brown dwarf candidates in our sample of 37 EROs.
identifies these peculiar EROs with bimodal, blue-red SEDs with no contamination from typical EROs (i.e., red across their whole SEDs).
We identify 37 EROs with the color criterion described above. We visually inspect all the candidates and we remove some unreliable detections (e.g., hot pixels or fake objects extracted near the diffraction spikes of bright stars). Their average magnitudes in F444W, F536W, F277W, and F150W are , and , respectively, which are consistent with the color selection criterion. Their very faint magnitudes in F150W imply that these objects are all HST/WFC3 dropouts at the depth of the CANDELS data in the CEERS region.
3.2. Brown Dwarf Contamination
The bimodal SEDs of the EROs are very different from the SEDs of typical massive, dusty galaxies at any redshift. However, they do exhibit some similarities with the SEDs of cool, brown dwarfs in the Milky Way (e.g., Wilkins et al. 2014). Indeed, the SW NIRCam colors of brown dwarfs are quite blue and their fluxes drop abruptly in F 090 W , which can be misinterpreted as a Lyman break in a high- galaxy. At the same time, brown dwarfs also exhibit an upturn in their SEDs starting around and peaking at , which leads to red LW colors. Brown dwarf candidates have already been identified photometrically due to their peculiar blue-red SEDs using color-color thresholds similar to the ERO selection criteria (e.g., Hainline et al. 2023; Holwerda et al. 2023; Nonino et al. 2023; Wang et al. 2023), and recent
NIRSpec observations have confirmed the stellar nature of handful of them (Langeroodi et al. 2023; Burgasser et al. 2024).
To investigate the likelihood of brown dwarf contamination in our sample of EROs we study the overlap between the two populations in color-color space. Figure 2, shows the F115W-F200W versus F277W-F444W colors for the bulk of the CEERS sample (gray scale) and the EROs (colored circles) identified in the previous section (central panel of Figure 1). Simultaneously, the black lines depict the colorcolor tracks for brown dwarfs within a small range of temperatures ( ) and metallicities -1 and 0 ), computed using LOWZ stellar atmosphere templates (Meisner et al. 2021). The figure highlights again the dual blue-red nature of the EROs relative to the bulk of the galaxies, although, over this longer color baseline, some of the EROs have slightly redder colors in rest-frame UV (average F115W-F200W versus F150W – F200W ). Interestingly, all the brown dwarfs with red F277W – F444W > 1.5 colors are much bluer than any of the EROs (i.e., they have blue slopes rather than relatively flat). Based on this distribution we expect the contamination to be essentially nonexistent for EROs with F115W-F200W . We identify only two potential brown dwarf contaminants in our sample of 37 EROs based on their much bluer F115W-F200W colors. We flag these objects in Table 1.
In addition, we use the brown dwarf stellar templates to study their typical colors at MIRI wavelengths. Since their SEDs have a maximum at around , the LW colors quickly turn blue relative to F 444 W . On average, we find blue MIRI F444W-F560W and F444W-F777W colors, which contrast with the red NIRCam colors . As described in the following section, the EROs appear to have red colors in the MIRI bands, continuing the steep SED trend of the NIRCAM bands. Consequently, the MIRI colors provide additional leverage to distinguish galaxies from brown dwarfs.
3.3. MIRI Detection and NIRSpec Spectroscopy of the EROs
We search for counterparts of the 37 EROs in the CEERS MIRI and NIRSpec observations. Unfortunately, the MIRI coverage of the CEERS/NIRCam mosaic is quite limited (less than of the area) and none of the pointings have simultaneous observations in the SW and LW bands. Overall, only four of the MIRI pointings in F560W and F770W and two of the pointings observed in F1000W and onward overlap with the NIRCam coverage. Surprisingly, we find clear detections for all four of the 37 EROs that lie within the MIRI-observed area. Three of them are detected in F560W and F770W with an average magnitude of and , respectively, and one of them is weakly but clearly detected in F1000W at 24.6 mag. While it is difficult to extrapolate from such a small sample, the high recovery fraction of observed objects, as well as the very red, power-law-like slope of the SED in the LW NIRcam bands, suggests that follow-up observations of similarly selected EROs in other fields with denser MIRI coverage is likely to yield a significant number of detections. Given the median magnitude of these objects, , we would expect detections in F560W and F 777 W in the mag range, which is clearly within the limit for surveys similar to CEERS, like PRIMER or COSMOS-Web. Note also that above , the emission line shifts into the F560W filter (see discussion in Section 4.3),
Table 1
MIRI and NIRSpec EROs at
The Astrophysical Journal, 963:128 (23pp), 2024 March 10
Figure 3. Left: photometric redshift vs. FAST stellar mass diagram for the F277W EROs (circles, color coded as in Figure 1), the CEERS galaxy sample (green density map), and the F150W EROs (red). For comparison, we also show the galaxies from Labbé et al. (2023) using their redshifts and stellar masses (squares). The F277W EROs are relatively massive, , and dusty, mag and they span the redshift range . Overall, F277W EROs are among the most massive galaxies at their redshift, but less massive than the F150W EROs at lower redshift, following the expected decline in the number of very massive galaxies with redshift. However, a few of them are much more massive ( ), suggesting that there might be limitations in the fitting of their bimodal SEDs or perhaps that their continua are not stellar, but AGN dominated (see the discussion in Section 5). Right: stellar mass vs. F356W effective radius for the same galaxies. For the Labbé et al. (2023) galaxies we use our effective radii estimates. The blue and red lines show the mass-size relations for star-forming and quiescent galaxies from van der Wel et al. (2014). The dashed lines indicate the approximate resolution limit from the half-width at half-maximum (HWHM) of the PSF in F356W (FHWM 15) at and . Remarkably, all the F277W EROs appear to be unresolved point-like sources in contrast with the typical spread of F150W EROs and other massive galaxies. We find similar results in the other NIRCam bands, suggesting that the EROs are unresolved at all wavelengths. The panels on the right show the best fits to a PSF in F444W for the four galaxies with MIRI detections, which show negligible residuals.
which might further enhance the flux and facilitate the detection.
In addition to the MIRI detections, four other EROs have been observed as part of the CEERS NIRSpec survey. All of them have clear emission lines that provide a robust estimate of their redshifts. Two of them have already been presented and discussed in Fujimoto et al. (2023) and Kocevski et al. (2023), nircam3-2232 and nircam3-3210, respectively. The two galaxies at exhibit only and [O III] detections, while the other two at show as well. The galaxy discussed in Kocevski et al. (2023), at , is the only one that has a continuum detection and exhibits a broad-line emission, which confirms that it is an AGN. All galaxies have relatively low III ratios, however, as noted Kocevski et al. (2023), the narrow emission-line ratios are very similar to those of star-forming galaxies (SFGs) observed at similar redshifts, which means that the line-ratio AGN diagnostic might not be particularly effective at .
4. Properties of the EROs
4.1. Photometric Redshifts and Stellar Masses
The left panel of Figure 3 shows the overall distribution of the F277W EROs in photometric redshift and stellar mass compared to the bulk of the CEERS sample (green density map) and the sample of F150W EROs from Figure 1 (red). Overall, the F277W EROs are relatively massive and dusty with median values of and mag, similar to those reported in Labbé et al. (2023) for the population. The redshift distribution ranges between with a median of . This indicates that nearly half the sample is at redshifts , as suggested by Pérez-González et al. (2023a). We remove a single object at for homogeneity, but the color selection is, overall, very effective at identifying galaxies at . As expected from the color selection, the EROs tend to be among the most massive
galaxies at their redshift (i.e., relative to the green map). Compared to the other F150W EROs at lower redshift, the F277W EROs tend to follow the expected decline in the number of very massive galaxies, , with redshift. However, we find a handful of galaxies with large masses, , even at , which, if confirmed, would be hard to reconcile with the observed stellar mass functions (SMFs) as well as models of galaxy evolution (e.g., see the discussion in Boylan-Kolchin 2023). Not surprisingly, these galaxies are also among the brightest in F444W by nearly 1 or 2 mag relative to the median of the sample. The reliability of the stellar mass estimates is indeed one of the fundamental questions about these EROs with unusual SEDs. The values discussed in this section are computed with FAST based on typical modeling assumptions (see Section 2.3), which work well for most galaxies at low to mid redshifts. However, this method might have limitations for these EROs (e.g., because of strong emission lines or extreme obscurations). In Section 5 we analyze in detail the impact of using different codes and modeling assumptions on the inferred stellar masses.
4.2. Sizes and Morphologies
The right panel of Figure 3 shows the distribution of the F277W EROs in a stellar mass versus size diagram compared to F150W EROs at , and the overall distribution of galaxies in the CANDELS F160W catalog in the overlapping area with CEERS (green density map). The CANDELS measurements are derived from Stefanon et al. (2015) and van der Wel et al. (2014). Sizes are represented by the effective radius, , of the Sérsic (Schmidt 1968) profile fit performed with GALFIT v3.0.5 (Peng et al. 2002) in the F356W band. The code was run on the background-subtracted images with sizes 2.5 times the Kron radius. An array, which includes background sky, Poisson, and read noise, was used as the input noise map. Empirical PSFs were constructed using stars in all CEERS pointings. All galaxies in the image cutout within
Figure 4. Left: stacked SED of the 37 EROs (gray squares) divided into two groups below and above , shown in purple and red, respectively. The MIRI photometry is shown in green. All galaxies exhibit a characteristic bimodal SED. Representative best-fit SEDs with EAZYPy at and (purple and red solid lines, respectively) show that this peculiar SED shape is typically reproduced by a composite SED with a blue, flat continuum in the rest-frame UV and red, steep continuum in the optical. Indeed, the best-fit power law to the fluxes redward of F 277 W is quite large ( ), indicative of a heavily reddened continuum. The stacked SEDs also highlight the difference in F277W as the bands shift from the steep to the flat slope with increasing redshift. Right (top): 2 !” !” 5 cutouts of EROs in the two redshift bins showing their similar compact and featureless visual appearances. Right (bottom): list of some of the strongest emission lines that can potentially cause emission-line-driven excesses in the NIRCAM and MIRI photometry at different redshifts. The locations of the strongest and [O III] lines are also indicated in the left panel.
3 mag of the primary source were fit simultaneously. All other sources were masked out during the fitting. The fitting parameters were allowed to vary within the following reasonable bounds: Sérsic index ( ), effective radius ( pixels), axis ratio ( ), magnitude ( mag from the initial value), and position ( pixels from the initial value).
Overall, we find that while the F150W EROs tend to overlap with the bulk of the galaxy sample, scattered in between the expected mass-size relations for star-forming and quiescent galaxies (blue and red lines from van der Wel et al. 2014 at ), all the F277W EROs are extremely small, systematically under the resolution limits regardless of their stellar masses. The best-fit GALFIT ” 009 ( 0.3 pixels) returns in most cases the absolute lower limit set for the fitting, suggesting that the galaxies are not resolved. The dashed lines indicate the approximate minimum sizes measurable as the HWHM of the PSF ( ) at and , roughly . We further explore the size measurements of the EROs in F200W, F277W, and F444W, obtaining similar results which suggest that they are unresolved in all the observed wavelengths. Note that the EROs are typically very faint ( ) in all the SW NIRcam bands and, in most cases, they have only a handful of bright pixels for the fitting. Lastly, we also fit the profiles of the eight EROs with MIRI and NIRSpec detections using point-like PSFs and we find excellent agreement with negligible residuals (right panel of Figure 3), indicating that they are indeed unresolved.
4.3. Overall SEDs and Possible Modeling Scenarios
The right panel of Figure 4 shows the stacked SED of all the EROs normalized to the median of the relatively flat rest-frame UV continuum traced by F115W, F150W, and F200W, divided into two groups at redshifts below and above with purple
and red markers, respectively. Both groups exhibit the distinctive, bimodal SEDs discussed in Section 3, which consist of extremely red colors at , with a relatively constant power-law slope , and a flat SED at shorter wavelengths. The red, power-law-like emission is typically associated with large amounts of dust attenuation. However, as discussed in Section 3.1, it is also possible that the flux in some of the LW filters is partially boosted by strong emission lines, making the colors redder than the underlying stellar continuum. The right panel of Figure 4 highlights the location of some of the strongest lines that can boost the emission in different filters as a function of redshift. At , the and [O III] lines can contaminate the F444W and F356W filters while F277W probes the continuum redward of the break. At , the same lines shift into F444W and MIRI/F560W while F356W probes the red continuum. The average, stacked fluxes in F277W and F356W for the lowand high-redshift groups are both clearly above the flat continuum in the rest-frame UV, suggesting that there is at least some continuum emission redward of . Furthermore, it would be difficult to reproduce a constant power-law slope spanning both the NIRCam and MIRI bands with relatively normal, low-EW ( ) emission lines since typically at least one, but probably several bands, should not be affected by the most prominent emission lines.
Nonetheless, the very pronounced change in the slope from the blue to the red spectral regions is also difficult to model in terms of a single stellar continuum. Indeed, the best-fit templates from EAZYpy at and shown in the left panel of Figure 4 are often composites of two templates with very different stellar ages, masses, and dust attenuations: on the one hand, a young, low-mass, low-attenuation galaxy (i.e., a typical Lyman-break galaxy) and, on the other, a more massive and dusty galaxy. As a consequence, the inferred
stellar mass and extinction of the composite is usually quite large, because it is dominated by the larger mass-to-light ratio of the older galaxy.
Recently, other works (e.g., Endsley et al. 2023; Furtak et al. 2023) discussed the possibility that the SEDs of some of these EROs could be explained partially, or completely, by very strong, AGN-driven emission lines. The presence of high-EW ( ) emission lines can boost the flux in all the filters since these are not restricted to just the brightest emission lines due to star formation. Similarly, the peculiar SEDs can also be explained in terms of continuum emission from an AGN which outshines the galaxy host in different spectral regions. This possibility was recently explored in Kocevski et al. (2023) for one of the EROs at with NIRSpec observations, which is also included in our sample (nircam3-3210). This galaxy was also discussed in Labbé et al. (2023) but the estimated photo-z was much higher, . This highlights again the potential pitfalls in the SED modeling of these galaxies. Kocevski et al. (2023) proposed some AGN-dominated scenarios where the SED could be explained by: (1) a heavily obscured quasi-stellar object (QSO) dominating the LW fluxes and a small percentage of scattered light from the broad-line component causing the blue, SW emission (e.g., as in the Polletta et al. 2006 torus template); (2) a heavily obscured QSO dominating the LW fluxes plus a blue, low-mass galaxy host, which dominates the SW fluxes; or (3) a blue, type-1 QSO dominating the SW fluxes in a dusty starburst galaxy, which in turn dominates the LW emission. The latter is also similar to the red QSO scenario in Fujimoto et al. (2022).
Crucially, many of these different scenarios can be confirmed or ruled out with additional observations such as the NIRSpec spectroscopy in Kocevski et al. (2023) or with additional photometry at longer wavelengths from JWST/ MIRI. For example, Papovich et al. (2023) and Rinaldi et al. (2023), have recently shown that many of the blue, low-mass Lyman-break galaxies at with emission-line-driven excesses in F444W have clear detections in MIRI at F560W and F777W that can trace the continuum in a spectral region without prominent emission lines. For these EROs, MIRI detections in the rest-frame optical continuum can distinguish between scenarios where the red optical colors are primarily driven by high-EW emission line versus any kind of continuum-dominated emission by a red, dusty galaxy or a QSO. In the Section 5, we study the likelihood and implications of the different scenarios outlined above from a detailed analysis of the SED modeling of the four galaxies with additional photometric constraints from MIRI and the four galaxies with spectroscopic redshifts from NIRSpec. In Section 6 we use those results to inform the discussion on what would be the most likely scenario for the whole population of EROs.
5. SED Modeling of the MIRI- and NIRSpecdetected EROs
5.1. Modeling Codes
In this section, we perform more detailed SED modeling of the eight EROs with MIRI and NIRSpec observations using the SEDs derived from the circular aperture photometry described in Section 2.2 and a variety of codes aimed at exploring the likelihood of the different dusty galaxy versus obscured-AGN scenarios outlined in the previous section. A detailed
description of the modeling assumptions adopted for each code is provided in Appendix A. Briefly, we use EAZYpy (Brammer et al. 2008), Synthesizer (Pérez-González et al. 2008a), Prospector (Johnson et al. 2021), and a custom code to perform a hybrid fit of the stellar population models from Prospector with the AGN templates of Polletta et al. (2006). The EAZYpy fits are based on the same default template set used in Section 2.3. The Synthesizer run uses parametric SFHs, following a delayed- function characterized with the Bruzual & Charlot (2003) stellar population models, a Calzetti et al. (2000) attenuation law, and nebular emission following Ferland et al. (1998). With Prospector, we use three different options: (1) a fiducial model with a parametric delayed- SFH and Calzetti et al. (2000) attenuation law; (2) a nonparametric SFH based on the continuity priors of Pro-spector- (e.g., Leja et al. 2019 or Tacchella et al. 2022) but with a maximum age of 100 Myr and using a Calzetti et al. (2000) attenuation law; and (3) a similar nonparametric SFH with a more complex dust attenuation model based on Charlot & Fall (2000) and Kriek & Conroy (2013). All three options are based on FSPS models (Conroy et al. 2009) and include nebular emission from young stars. They also have a number of other modeling assumptions in common (gas and stellar metallicity, ionization parameter, etc.) described in the Appendix. The first two options are aimed at exploring the impact of using parametric/nonparametric SFHs and different stellar population models with respect to Synthesizer, while the third focuses on the impact of the dust attenuation law. The last SED model is a hybrid of a galaxy and a dustobscured QSO. Here we assume that the emission in the LW NIRCam and MIRI bands is largely dominated by an obscured QSO modeled after the QSO2 from Polletta et al. (2006), while the flux in the SW fluxes comes from the galaxy host. We also show the fits to an intrinsically blue QSO template, QSO1 from Polletta et al. (2006), with a large based again on a Calzetti attenuation law. While this template fits worse than the QSO2 one, it is useful to illustrate the differences and it provides a way to estimate the bolometric luminosity of the QSO from the unobscured emission. We fit the QSO model in three steps. First, we do a coarse fit of the QSO2 template to the LW fluxes, then we fit all the photometry subtracting the bestfit fluxes from the QSO template with Prospector delayed- models, and lastly, we perform a simultaneous fit with the QSO template to galaxy SEDs drawn from the posterior of the Prospector fit. The results from this method are similar to those obtained with the modified version of FAST (Aird et al. 2018) used in Kocevski et al. (2023). The advantage of the Prospector fit is that it includes emission lines that can help shore up the limitations of the obscured QSO template, which has a fixed set of emission lines. While this is not a fully selfconsistent AGN method, it helps to account for the contribution of emission lines to the photometry.
5.2. Photometric Redshifts of the Four EROs with MIRI Detections
The peculiar SEDs of the EROs and the high chances that some of the fluxes are at least partially boosted by emission lines make the photometric redshift estimates one of the key parameters and potentially one of the most problematic. For that reason, we run EAZYpy twice, first using the default modeling assumptions and a second time using the recently updated models which include a blue galaxy template with
Figure 5. Photometric redshift distributions (PDFz) for the four MIRI-detected EROs computed using EAZY, EAZYpy, and Prospector. The PDFzs derived with the default and blue versions of the EAZYpy templates agree well with one another and with the Prospector estimates for all the galaxies. For the three galaxies at , the PDFzs based on the templates with very highEW lines (blue) suggest a secondary peak at higher redshift that is not supported by the detections in F150W. The key difference between the lowand high- peaks is typically an emission-line-driven excess in F444W which could be attributed to or [OIII], respectively (see also Figure 4).
strong, high-EW emission lines similar to those observed in recent NIRSpec spectra of galaxies. We also include in the analysis the redshift probability distributions (PDFz), shown in Figure 5, the values computed in Finkelstein et al. (2023a) using the original version of EAZY with an updated template set optimized for high redshift presented in Larson et al. (2023). The latter fits do not include the MIRI fluxes and thus allow us to gauge the impact of the additional photometry in the redshift likelihood. Lastly, we also include the PDFz estimate from the fiducial Prospector fit described in the previous section.
nircam5-5815. The primary EAZYpy and Prospector solutions agree on a value of for which strong emission would boost the fluxes in F410M and F444W. There is a secondary solution at for which the red F277W – F444W color is caused by a strong Balmer break. However, at that redshift, the galaxy should be an F150W dropout, and the galaxy is clearly detected at . Therefore, we adopt the lower redshift solution as the primary.
nircam5-9553. The photometric redshift distributions from EAZYpy and prospector are quite consistent, peaking around . At this redshift, the III and lines can contribute to the flux in F356W and F444W but not in F410M (or at least not significantly). There is a secondary peak at which also produces a relatively good fit. However, like in the previous galaxy, this would require the F150W flux to be a dropout, and the galaxy is faint but clearly detected in that band. Therefore we consider the low-redshift solution as the primary.
nircam6-7042. This is the only galaxy observed in the LW MIRI bands. It has a faint but clear detection in F 1000 W but is not detected in F1500W. Similarly to the galaxies above, the PDFz exhibits a primary peak at and a secondary peak at , which is closer to the value presented in Labbé et al. (2023), . The two different solutions try to fit an excess in F444W relative to F410M with a strong emission line, either or [O III] at low and high respectively. We notice however that the F277W flux for this source is above the relatively flat continuum delineated by the SW bands, suggesting that it might be sampling the continuum redward of the 4000 A break and therefore favoring the low-z solution. The F277W photometry in Labbé et al. (2023) appears to be fainter and closer to the bluer bands, which might favor the high-z solution. At the redshift of the two possible solutions, the F 1000 W detection (and the upper limit in F 1500 W ) still probes rest-frame wavelengths shorter than the bump and thus cannot help discriminate between them.
nircam5-6746. This galaxy presents a PDFz centered around with no secondary peaks at significantly different redshifts. The brighter MIRI flux in F560W relative to F770W also favors a redshift of , suggesting that strong emission is boosting the flux in F 560 W and similarly [O III] in F410M and F444W. This galaxy is also discussed in Akins et al. (2023) with a similar photometric redshift and consistent stellar population fits.
5.3. Best-fit Properties and SEDs
Figures 6 and 7 show the multiband images, NIRSpec spectra, and SEDs for the eight MIRI- and NIRSpec-detected galaxies jointly with the best-fit models obtained with the different codes outlined in the previous section. From left to right, the panels show the stellar population fits with Prospector ( -model and nonparametric) and Synthesizer, the composite stellar populations with EAZYpy (middle), and the hybrid galaxy + AGN models (right).
MIRI fluxes and the high-EW emission-line scenario. The four galaxies with MIRI detections exhibit F560W and F777W fluxes that continue the red power-law trend outlined by the NIRCam LW bands. For three of them, the MIRI bands probe a spectral region redward of , which does not have any prominent emission lines. The exception is nc5-6746 at , which seems to have an excess in F560W due to a strong H line, but not in F777W, which also continues the same trend of increasingly larger fluxes as the other three galaxies. Therefore, the MIRI detections strongly suggest the presence of red continuum emission in these galaxies, which disfavors the scenario where the red optical fluxes originate in a blue galaxy with very high-EW emission lines masquerading as a red continuum. Nonetheless, we note that the best-fit SEDs for these EROs show strong emission lines and even emission-line-driven excess in one or two of the LW NIRCam bands. However, these lines have relatively normal EWs for a massive SFG ( ) due to the presence of a red stellar continuum.
Prospector- , -np, and Synthesizer. Overall, these models based on different SFHs but using the same Calzetti et al. (2000) attenuation law provide a relatively good fit to the
Figure 6. Multiband 2 ! !” 5 cutouts of the MIRI-detected EROs and best-fit SED models computed with EAZYpy, Prospector, Synthesizer, and a hybrid of a galaxy plus a red QSO template (either QSO1 or QSO2) from Polletta et al. (2006). The left panels illustrate that fits based on a single stellar population component provide a good fit to the overall LW NIRCam and MIRI photometry (black and green squares) but they systematically fail to reproduce the rest-frame UV probed by the SW NIRCam bands. The middle panels show that a composite model consisting of two (or more) stellar populations provides an excellent fit to all the bands by combining a red, massive, and dusty galaxy that fits the LW bands and a blue, low-mass galaxy that fits the SW bands but has little impact on the stellar mass. The right panels show that the hybrid galaxy + QSO model (QSO1 and QSO2, orange and red, respectively) provides an equally good (or better) fit to the SED than the other models. Here, a dust-obscured QSO dominates the LW photometry but does not contribute to the stellar mass of a blue unobscured host, and consequently leads to total stellar masses two orders of magnitude smaller than the other scenarios. The two stellar templates (gray) illustrate the confidence range in stellar mass for the galaxy component. The SEDs exhibit similar UV emission but increasingly larger optical emission with mass.
majority of the LW NIRCam bands and the MIRI fluxes. However, they all fail to reproduce the rest-frame UV fluxes probed by F115W, F150W, and, in some cases, F200W, regardless of the SFH. Both Prospector fits yield systematically lower fluxes in the rest-frame UV, while Synthesizer sometimes finds a trade-off between improving the fit to the UV bands at the expense of a worse fit to the optical bands. The reason behind this systematic issue for all the models is
that the large dust attenuations required to reproduce the extremely red optical colors lead to even larger attenuations in the UV which completely suppress the predicted emission regardless of the stellar population parameters or SFHs ; i.e., even nonparametric SFHs having substantial star formation rates (SFRs) in the last still yield very red colors in the rest-frame UV. This problem is unavoidable for the typical attenuation laws such as Calzetti ( ), and it would
Figure 7. Multiband cutouts and 2D/1D NIRSpec spectra of the NIRSpec-detected EROs. The best-fit SED models computed with EAZYpy, Prospector, Synthesizer, and a hybrid of galaxy plus the QSO2 template from Polletta et al. (2006) are the same as in Figure 6 but fixed to the spectroscopic redshift.
be worse for steeper attenuation laws such as an SMC type ( ) or a Milky Way type with a UV bump at . However, a shallower, grayer attenuation law, resulting perhaps from a more patchy distribution of the dust in the galaxy, could alleviate this problem.
Prospector-np-cf. Indeed, the best-fit SED models derived with Prospector using nonparametric SFHs and a more complex, two-component dust attenuation model based on Charlot & Fall (2000) and Kriek & Conroy (2013) provide a better match to the UV fluxes with varying degrees of improvement. In this model, the diffuse attenuation is multiplied by a power law with index that increases/lowers the
slope of the attenuation law relative to Calzetti (i.e., for it becomes Calzetti). The models that fit the UV fluxes best (e.g., nc5-5815, nc6-7042, or nc1-2441) all have similar attenuation laws which lean heavily toward the shallowest (grayest) possible attenuation law allowed by the priors ( and ); i.e., the posterior is not evenly sampled but rather skewed to the maximum value. The models without a significant improvement of the UV fit still return a better than the Calzetti-based fits. For these galaxies differential attenuation between the stellar continuum and the emission lines introduced by the two-component Charlot & Fall (2000) prescription appears to allow stronger emission lines that improve the fit to the bands with emission-line excesses.
Figure 8. Additional SED modeling scenarios involving a QSO. Left: a hybrid of a dusty-galaxy-dominated SED with a blue, low-extinction QSO contributing only to the rest-frame UV emission. This scenario is similar to the EAZYpy fits replacing the blue galaxy with a blue QSO with a minimal impact on the stellar mass of the composite. Right: a pure QSO-dominated model based on the torus template from Polletta et al. (2006) where the emission from the QSO outshines the galaxy host at all wavelengths. The intrinsic shape of the torus SED is very similar to the bimodal SED of the EROs. However, we find that using a single template limits the flexibility of the fits and it leads to generally worse agreement ( ) with the data.
EAZYpy. These models provide a good match to both the rest-frame UV and optical SEDs. The difference with respect to the Prospector and Synthesizer fits is that EAZYpy uses composite models that are linear combinations of templates with different ages, SFRs, and, crucially, dust attenuations. Consequently, the composite SED is not necessarily bounded by the same dust attenuation across the whole spectral range. The best-fit models for all the EROs are always a combination of at least two templates with very different properties: a young, blue galaxy with low dust attenuation that fits the relatively flat rest-frame UV emission and an older galaxy with large dust attenuation that fits the red optical emission.
Hybrid galaxy + red QSO. The rightmost panels of Figures 6 and 7 show the fits to the hybrid model of a blue galaxy and a dust-obscured QSO (QSO2 template in red). This model shows an excellent fit to the overall SED including the rest-frame UV and the MIRI fluxes. In this scenario, the continuum emission from the obscured QSO dominates the SED redward of F277W while the galaxy component dominates the rest-frame UV emission. Consequently, the best-fit galaxy model is a blue, low-extinction galaxy similar to the blue component in the EAZYpy composite. The gray and magenta lines in the fits illustrate the range in the stellar masses which are, in all cases, very small, . The main difference in the best-fit SEDs of QSO-dominated versus galaxy-dominated scenarios is that in the latter, the stellar continuum typically exhibits a peak around , whereas the QSO emission increases continuously toward the rest-frame mid-infrared. Unfortunately, at the MIRI detections in F560W and F777W still probe rest-frame wavelengths shorter than , and even for the one galaxy detected in F 1000 W , the rest-frame flux is still too close to . Detections at longer wavelengths are clearly necessary to distinguish conclusively between a declining stellar continuum and rising QSO emission. The panels show also the fits using the blue QSO1 template with very large attenuations ( , orange). These are generally a worse fit to the MIRI data because they have
more steeply rising SEDs, but they help provide an order-ofmagnitude estimate of the QSO bolometric luminosity.
Hybrid blue QSO + dusty galaxy and pure QSO + torus. Figure 8 shows the best-fit SED of nc3-3210 (the broad-lined AGN with NIRSpec studied in Kocevski et al. 2023) to the other two possible scenarios involving a QSO: QSO-torus emission and a hybrid model consisting of a blue QSO and a red, dusty galaxy. In the torus model, the SED is completely QSO dominated at all wavelengths (e.g., scattered UV light, attenuated optical emission, and mid- to far-infrared reemission by dust). Here we use the torus template from Polletta et al. (2006) to fit the observed SED and we find that while the intrinsic shape of the torus SED template is, to some extent, similar to the bimodal SED of the EROs, a single template is not flexible enough to obtain a better fit than any of the other scenarios discussed above. This is likely a limitation of our approach based on a single template, and it is possible that a more comprehensive AGN modeling code can fully reproduce the observed SED with higher accuracy. The scenario involving a galaxy plus a blue QSO is, to some extent, similar to the EAZYpy model. In both of them, the LW NIRCam bands are largely dominated by the emission of a red, dusty galaxy while the SW bands are dominated by a blue, low-extinction galaxy or QSO. Consequently, the inferred stellar masses and dust attenuations for the bulk of the galaxy are also very similar, since none of the blue components contribute significantly to the mass. These two scenarios are not discussed in detail for the other objects because the blue QSO model leads to similar results for the stellar properties as the other galaxy-dominated scenarios, and the torus model does not provide constraints on the stellar mass of the host or the luminosity of the QSO.
5.4. Stellar Masses and Attenuations
Figure 9 shows the ranges of stellar masses and dust attenuations for the eight EROs obtained with the different SED modeling codes. We also include the stellar masses and attenuations computed with FAST and use it as a benchmark
Figure 9. Ranges of stellar masses and values obtained with different SED modeling assumptions for the eight EROs with MIRI and NIRSpec observations. Overall, the values derived with the commonly used EAZYpy and FAST methods provide similar estimates as the fiducial Prospector- model, and they are typically the largest (red, gray, and light blue markers, respectively). The Prospector-np nonparametric model (dark blue) leads to smaller stellar masses by 0.4 dex, on average. A nonparametric model with a gray attenuation law, Prospector-np-cf (black), can lead to even smaller masses by 0.7 dex when MIRI fluxes are available, but it obtains similar values to the fiducial models where they are not. The stellar masses from Synthesizer (green) are the smallest by dex relative to the fiducial values, but the accuracy of the fit is worse. The values obtained with the hybrid galaxy plus obscured QSO model (not shown) are much smaller, because the QSO dominates the SED without contributing to the stellar mass of the blue, low-mass host.
model for the comparisons to study systematic effects. FAST has been widely tested in typical galaxies at low to mid redshift with accurate results, but it is critical to understand if there are potential issues modeling these high-z galaxies with peculiar SEDs.
The stellar masses computed with FAST and EAZYpy tend to be the largest, and they are very similar, with a median difference and scatter of (FAST-EAZYpy) dex. Although the SED fits with FAST do not reproduce the UV fluxes like the composite SEDs with EAZYpy, the effect on the stellar mass is very minor. This is because the red, dusty component in the EAZYpy fit, which is similar to the overall FAST fit, dominates the stellar mass over the young, blue component, which has a much lower mass-to-light ratio.
Interestingly, the median difference with respect to the stellar masses computed with the fiducial Prospector fits ( -model with Calzetti attenuation) is relatively small, with a larger scatter FAST – Prospector- dex. This means that despite the more flexible modeling of key parameters like emission-line strength or metallicity, the stellar mass is mostly driven by the need to fit the red optical slope with high dust attenuation. In fact, the cases where the Prospector fits obtain the largest stellar masses are typically those where the extinction is a maximum . Note also that the extinction values from FAST and Prospector are typically the largest, ranging between . The EAZYpy fits have lower extinctions in part because of the combination with a blue template ( ), but sometimes because it includes a red, quiescent template that also has a low attenuation but a large mass-to-light ratio, which, in turn, leads to larger stellar masses (e.g., as in nc3-2232).
The Prospector fits with nonparametric SFHs capped at a maximum formation age of 100 Myr and a Calzetti attenuation law leads to systematically lower stellar masses than the fiducial Prospector- , with –. This is because the fiducial model has a maximally old start of the SFH at of the age of the Universe at the redshift of the galaxy and, consequently, tends to form more stars over a longer period of time. Consequently, the masses are even smaller relative to FAST (FAST-Prospector-np) .
The Prospector fits with nonparametric SFHs and a more flexible attenuation law based on Charlot & Fall (2000), which provides the best SED fits, exhibit an interesting behavior. For the four galaxies with MIRI detections, the stellar masses are significantly lower with (FAST-Prospector-np-cf) , but for the four galaxies with NIRSpec data the difference is nearly zero, (FAST-Prospector-np) . The reason for this difference is clearly visible in the SED fits shown in Figures 6 and 7. Without MIRI data to constrain the continuum emission beyond F444W, Prospector favors solutions with a stronger continuum (i.e., more massive) and lower EWs for the lines. For example, in nc3-3210 or nc1-9410, the best-fit models with Prospector- versus Prospector-np-cf would exhibit differences in the predicted F560W and F770W fluxes of the order of .
The fits with Synthesizer provide the smallest stellar mass estimates, nearly 1 dex smaller than FAST, (FAST-Synthesizer) dex. As discussed in the previous section, these SED fits are, overall, less accurate than the other codes, but tend to fit the UV region a bit better at the expense of a worse fit to the optical. As a result, they have lower attenuations of and, consequently, lower stellar masses.
Lastly, in the hybrid galaxy plus obscured QSO scenario, the latter completely dominates the bulk of the emission in the LW bands. However, it does not contribute to the stellar mass, which depends exclusively on the faint blue galaxy host. Consequently, inferred stellar masses are two orders of magnitude, , smaller than in any of the scenarios where the bright LW continuum originates in a dusty massive galaxy.
In summary, the commonly used methods based on -models and Calzetti attenuation, or variants of EAZY with the default templates (including the reddest dusty/old templates) are likely to obtain the largest stellar masses. Nonparametric or similar SFHs that limit the age of the galaxy to relatively young values ( ) lead to lead to lower stellar masses by 0.4 dex . The addition of a more flexible dust modeling to allow grayer attenuation curves can lead to stellar masses up to 0.7 dex smaller. However, without MIRI data, the stellar masses can also be as high as for the fiducial -models.
6. Discussion
6.1. Likelihood of the Dusty-galaxy Scenario
In the previous sections, we discussed three possible scenarios where a dusty, SFG can fit the overall SEDs of the EROs dominating the emission in the rest-frame optical: with a flat, gray attenuation law or with a secondary component which is either a blue, low-extinction galaxy or a blue QSO, that fits the rest-frame UV.
Looking at these possibilities in the light of the point-like, unresolved sizes for all these galaxies, the scenario with two distinct stellar components seems quite unlikely. Such a model would make more sense for an extended galaxy with clearly differentiated regions (e.g., clumps, or a bulge). On the other hand, a compact size might help explain the very gray attenuation law in terms of the geometry and distribution of dust in a high-density environment. For example, rather than a dust-shell scenario we might have a mixed star-dust distribution (probably clumpy) which produces gray attenuation laws including huge extinctions ( or more), but also significant scattering resulting in much lower and grayer total attenuations and, consequently, bluer UV colors (Witt & Gordon 2000).
The scenario involving a blue, low-luminosity QSO is also plausible as it can help explain why the colors of these EROs are very different from those of F150W EROs and other dusty galaxies at higher redshift recently identified with JWST (e.g., Pérez-González et al. 2023a; Zavala et al. 2023), which are red in all the NIRCam bands. As discussed in Kocevski et al. (2023; see also Fujimoto et al. 2022) this scenario could be a transitional phase in the evolution of a dust-obscured starburst that is clearing up the dust and leading the way to an unobscured QSO. Note that while bluer UV colors have been reported in dusty SFGs at with large IR luminosities (e.g., Casey et al. 2014), these EROs are very blue, with relatively flat UV continua in , which imply very steep UV slopes of for the high attenuations implied by the SED modeling, i.e., .
Taken together, the different colors and morphologies of these EROs relative to the other massive dusty galaxies might be an indication that they are a distinct population, perhaps undergoing a strong nuclear starburst phase as seen for example in some of the radio/submillimeter-detected galaxies at (Barro et al. 2017; Tadaki et al. 2017). To some degree, this scenario might be similar to that of the compact SFGs at which are also small (but resolved, ), massive, and dusty (e.g., Barro et al. 2013; Nelson et al. 2014; Williams et al. 2014; van Dokkum et al. 2015), and exhibit a large fraction of X-ray AGN detections (Kocevski et al. 2017). Indeed, galaxy formation models suggest that the progenitors of those compact SFGs could be even smaller at higher redshift due to the larger gas reservoirs leading to wet-compaction events that result in the formation of a very dense core (e.g., Wellons et al. 2015; Zolotov et al. 2015; Tacchella et al. 2016).
Nevertheless, it seems odd that all these EROs at are unresolved. If they were to evolve into compact SFGs at we would expect some of them to be transitioning from purely unresolved to the characteristic mass-size relation that compact SFGs follow at (Barro et al. 2017). Furthermore, we note that if the intrinsic sizes of these galaxies are under the 200-300 pc half-light radius limit (or even 150 pc; e.g., Baggen et al. 2023) the implied stellar mass densities for the most
massive EROs, over , would exceed even the stellar mass densities observed even in the most massive galaxies at ; Bezanson et al. 2009; Hopkins et al. 2010).
6.2. Likelihood of the Obscured-AGN Scenarios
An alternative scenario to the dusty SFGs where we expect unresolved, point-like sources and peculiar, nonstellar SEDs is in AGNs where a bright QSO can outshine the emission of its host in different spectral ranges from the UV to the midinfrared. For example, hybrid galaxy + AGN SEDs where the latter dominates the near- to mid-infrared emission are a relatively common occurrence in galaxy surveys at mid to high redshifts (Stern et al. 2005; Lacy et al. 2007; Donley et al. 2012, 2018). In the previous sections, we discussed two possible scenarios where an obscured AGN can fit the overall SED of the EROs dominating the red optical emission: (1) combined with a blue, low-mass galaxy host or (2) in a pure AGN model where the emission from the QSO dominates at all wavelengths.
The first scenario would imply that all these EROs are lowmass galaxies whose optical to IR fluxes are completely outshined by the emission of an obscured QSO. The limiting factor in this scenario is the bolometric luminosity and implied black hole mass of the QSOs, which should be at least one or two orders of magnitude lower than the stellar masses of the hosts (e.g., Kormendy & Ho 2013). The stellar masses of the blue, low-extinction hosts inferred in the previous section range between . Therefore, we would expect black hole masses of the order of and, based on the typical luminosity-black hole mass relation (Greene & Ho 2007), QSO bolometric luminosities of erg or smaller, since this is the value at the higher end of the accretion rate, .
Unfortunately, the estimate of the bolometric luminosity of an obscured QSO requires X-ray, UV, or bolometric luminosities, none of which can be easily computed for these galaxies. For intrinsically blue QSOs the total luminosities can be estimated from monochromatic luminosities using bolometric corrections (e.g., Richards et al. 2006). However, for obscured AGNs, the total luminosities are usually inferred from rest-frame IR luminosities of the total IR luminosity (e.g., Donley et al. 2012; Runnoe et al. 2012), which for these galaxies would require MIRI fluxes at the longest wavelengths. Thus, the only alternative to estimate a luminosity is to fit the SED with a blue QSO template heavily obscured with a Calzetti attenuation law and then transform the dust-corrected UV luminosity into (e.g., ; Richards et al. 2006). The values obtained for the EROs with this method range between , which are dex larger than the expectation from typical low-redshift black hole mass to stellar mass ratios (i.e., they would be very luminous QSOs). We caution however, that this estimate is a large oversimplification since, as shown in Section 5, the red QSO SED (QSO2) differs from the attenuated blue QSO SED (QSO1 + Calzetti). The true attenuation law of an obscured QSO depends on multiple factors such as the geometry and distribution of dust in the torus or the line-of-sight inclination. In compact galaxies at high , it might even depend on the galaxy-wide conditions (gas/dust fractions; e.g., Gilli et al. 2014). Consequently, the bolometric luminosities of obscured QSOs are probably
Figure 10. Left: galaxy number densities with stellar masses above (dark gray squares) and and 10.5 (in shaded gray) as a function of redshift computed from SMFs in the literature (see text). Circles indicate the number density of EROs with if they are massive dusty galaxies. The purple, green, and red colors show the predictions based on three SED modeling scenarios which typically encompass the minimum/maximum stellar mass estimates (see Section 5.4). The orange lines show a similar prediction derived from the median and percentiles of 100 CEERS-sized draws of a 2 deg light cone based on the Santa Cruz semianalytic models. The scatter around the median illustrates the impact of cosmic variance in an area of the size of the CEERS footprint. Similarly, the cyan lines show the predictions from mock light cones with larger baryon conversion efficiencies ( and 1 ). At the density of EROs is lower than the values from the literature, however, at the density can be up to a factor of larger for some of the estimates with the largest stellar masses. While this difference can still be reconciled with the large uncertainties from the SMFs and the SED modeling variations, the discrepancy at larger masses, , is much larger. We expect one galaxy in an area 10-20 times larger than CEERS and we find three. Right: galaxy number densities with stellar masses from the literature (gray squares) as a function of redshift. The red stars show the density of EROs if they are a hybrid of an obscured AGN and an unobscured, blue galaxy host (see Section 5.3). In this scenario, the hosts have significantly lower stellar masses than in the dusty-galaxy scenario by up to 2 dex. As a result, the EROs only make up for a small fraction ( ) of the much more abundant low-mass galaxy population.
lower than the values estimated with a blue QSO template, which should be considered upper limits.
In the second scenario, the obscured QSO completely outshines the galaxy host emission across the whole spectral range; i.e., both the SW and LW NIRCam fluxes arise from the QSO. This scenario would be the most plausible based on the unresolved sizes of these galaxies in all the NIRCam bands. Unfortunately, a more detailed characterization of the bolometric luminosity in this type of scenario requires more complex modeling of the extinction and scattering of the QSO emission that is beyond the scope of this paper. Interestingly, in this scenario, the constraints on the bolometric luminosity of the QSO might be less strict since the galaxy host does not have to be detected in the UV. Therefore, a slightly more massive and dusty galaxy, , can perhaps hide under the bright red continuum of the QSO without having a significant impact on the observed SED.
6.3. Implications for Number Densities and Mass and Luminosity Functions
6.3.1. If the EROs Are Massive, Dusty Galaxies
As discussed in Labbé et al. (2023), if all of these EROs are dusty galaxies with relatively large masses , or up to for some of the most extreme objects, their number densities can lead to some tension with the observed SMFs and would imply higher than expected star formation efficiencies (Boylan-Kolchin 2023). We review the number density estimates using the full sample of 37 EROs selected over the larger area of the full CEERS survey and spanning a broader redshift range from . Figure 10 shows the redshift evolution in the number density of galaxies
with stellar masses larger than (9.5 and 10.5 in dashed lines) derived from pre-JWST SMFs in the literature (Muzzin et al. 2013; Grazian et al. 2015; Stefanon et al. 2015; Song et al. 2016; Stefanon et al. 2021). The orange lines show a similar prediction from mock catalogs based on the Santa Cruz semianalytic models (Somerville et al. 2015; Yung et al. 2019b; Somerville et al. 2021; Yung et al. 2022), which shows the median and 84th and 16th percentiles from 100 CEERSsized fields subsampled from a light cone (Yung et al. 2023) to illustrate the effect of cosmic variance. These results have been shown to agree well with observed luminosity functions and other observations in this redshift range (Yung et al. 2019a, 2019b). The purple, red, and green markers show the number densities of EROs with at redshifts and , estimated with FAST, Pro-spector-np, and Synthesizer, respectively. The error bars indicate Poissonian errors. As discussed in the previous sections, these values generally bracket the largest to smallest stellar mass estimates and therefore provide a way to estimate the impact of the SED modeling choices on the number densities.
The densities of EROs with at are all slightly under the values from the literature, which still allow additional, non-ERO, massive galaxies to exist at this redshift (e.g., Zavala et al. 2023) without tension with the literature. At , the expected number of galaxies with in the area of CEERS is roughly one (with large errors) while the densities of EROs, inferred from the different stellar mass estimates, range between 2 and 10 . Nonetheless, these differences are still within the range of the uncertainties in the SED modeling and cosmic variance. Furthermore, it is possible that pre-JWST SMFs missed
Figure 11. UV luminosity functions at redshifts and . The gray markers show the density of galaxies and AGNs from the literature identified with different criteria (QSO, X-ray, and broad-line detection). The red circles indicate the density of the full sample of EROs if they are obscured QSOs. The filled and open markers show the different densities computed either from the observed or the dust-corrected UV luminosities. While the observed density and luminosities of the EROs are roughly similar to those of the X-ray population at , if they are obscured AGNs, their intrinsic luminosities are much larger, , comparable to the faint end of the bright QSO population but nearly three orders of magnitude more abundant. Such luminosities would also imply that the EROs have black hole masses of the order of , nearly as large as the estimated stellar masses of their blue galaxy hosts, which would lead to unexpectedly large mass ratios of .
some of the most massive galaxies. At the largest masses, , however, the difference increases up to a factor of . We should not detect any such galaxies in the area of CEERS (or even an area 10 times larger). Labbé et al. (2023) reported one of those galaxies in their sample. Here we identify five galaxies (including Labbé et al. 2023’s) with masses above by at least two out of the three estimates, two of them at , and another three at (nc1-10084, nc5-3637, and nc8-13596, see Table 2). These galaxies are also among the brightest in F444W (up to 2 mag brighter than the median of all EROs), which indicates that they are different in some way and perhaps they are the ones that are AGNs. Nonetheless, an individual analysis of these sources carefully characterizing their photo- values and masses is required to clarify the strong discrepancy with respect to the expected densities. In summary, while the number densities of EROs exhibit some tension with the predictions of pre-JWST SMFs if they are all dusty galaxies, the numbers match relatively well if all the masses are closer to , as predicted by some of the SED modeling scenarios. Nonetheless, even if just a few of them are confirmed to be very massive, , the discrepancy with the SMFs would be very large.
Comparing to simulations, the cyan lines in Figure 10 show the predictions based on mock light cones presented in Yung et al. (2023), for which dark matter halos have been extracted from -body simulations in a standard Lambda cold dark matter ( ) cosmology. Each line indicates the density of objects that would result if each halo is able to convert a different fraction of its baryon content into stars (i.e., , where and 1 , respectively. A value of is expected to yield an extreme upper limit since the fractions in the local Universe are typically less than . Models based on similarly low efficiencies, such as the Santa Cruz semianalytic model (orange lines), yield good agreement with the density of EROs at . However, the implied masses of the EROs in the , if they are primarily powered by stars, would imply significantly higher than
expected values of this baryon conversion efficiency , although not in fundamental tension with .
6.3.2. If the EROs Are Obscured AGNs
As discussed in Section 5.4, if the bright optical emission of the EROs is dominated by an obscured AGN, but the faint UV emission arises from an unobscured galaxy host, the implied stellar masses of the EROs can be up to two orders of magnitude smaller than in the dusty-galaxy scenario. We apply the SED modeling described in Section 5.3 for the hybrid galaxy + red QSO case to the full sample of 37 EROs and we obtain similarly low stellar masses with a median and percentiles of . In this scenario, the resulting number densities of EROs are one to two orders of magnitude lower than the typical densities for low-mass galaxies inferred from the SMFs in the literature (right panel in Figure 10). This implies that, as opposed to the dusty-galaxy scenario, the fraction of obscured AGNs in blue, low-mass hosts would be very small compared to the parent sample of galaxies with similar stellar masses.
In this scenario, the contribution of the EROs to the overall AGN population at high redshift is difficult to quantify because of their very obscured nature. Ideally, one would like to use an intrinsic property of the AGNs, such as bolometric luminosity or black hole mass; however, these measurements are not always available for AGN samples selected with different methods (e.g., X-rays or broad emission lines). Instead, comparisons are often done in the context of UV luminosity functions (at ), which allow for a direct comparison to the luminosity functions of galaxies bright, blue QSOs, which, until the advent of JWST, was the largest population of high- AGNs.
Unfortunately, this comparison is potentially misleading for obscured AGNs, which are UV faint but intrinsically bright and massive. Figure 11 shows the UV luminosity function for the 37 EROs in two redshift bins, and , compared to other samples of bright QSOs (Matsuoka et al. 2018), X-ray selected AGNs (Giallongo et al. 2019), broad-emission-line
AGNs (Harikane et al. 2023; Kocevski et al. 2023), and galaxies (Bouwens et al. 2021) at the same redshifts. The filled red circles show the density of EROs based on their observed (i.e., obscured) UV luminosities. At face value, their density is much higher than the UV-bright QSO population but is comparable to those of the X-ray or broad-lined AGNs, which exhibit similar luminosities. We note, however, that so far these EROs have not been X-ray detected, most likely due to their high obscuration (e.g., Kocevski et al. 2023). Compared to the density of galaxies, the EROs still make up only a small fraction of the parent galaxy population, although, as noted in Harikane et al. (2023), this number is larger than in the local Universe ( ; Stern & Laor 2012).
If instead we compare the densities derived from the intrinsic, dust-corrected UV luminosities of the AGNs (open red circles), the ERO population overlaps in luminosity with the tail of the UV-bright QSO distribution, and they are nearly three orders of magnitude more abundant. This would imply a surprisingly large increase in the number of relatively luminous and massive AGNs. To emphasize the key distinction between the observed/intrinsic UV luminosity it is worth noting that if the EROs were instead a combination of massive, dusty galaxies and faint, blue QSOs dominating the UV emission (as in the SED fits shown in the left panel of Figure 8) we would obtain exactly the same UV luminosity function (filled red circles) but, in that case, the AGNs would be intrinsically faint with low bolometric luminosities of .
The median and bolometric luminosity of the 37 EROs is , which implies black hole masses of the order of , assuming Eddington ratios of , or larger for sub-Eddington regimes. The comparison of these black hole masses with the stellar masses of their hosts, derived with the hybrid blue galaxy + red QSO model, would imply large, unprecedented mass fractions, , much larger than the typical ratio of seen locally (Kormendy & Ho 2013; Reines & Volonteri 2015).
In summary, if the EROs are obscured AGNs, the significant increase in the number of bright, massive BHs would mean that we are beginning to unveil a key era of very quick, heavily obscured, black hole growth with short-duty cycles occurring in the first 1 Gyr of the Universe.
6.4. Prospects for Revealing the Nature of These EROs
These sources are complex to interpret. Even though the SW photometry with MIRI and the spectroscopy with NIRSpec help place better constraints on the presence of a red continuum or the redshift of these sources, they are not enough to break the degeneracies in the possible modeling scenarios. Additional MIRI photometry at longer wavelengths can distinguish between the rising continuum of an obscured QSO and the decline in the stellar SED past . Deeper NIRSpec spectroscopy of their rest-frame UV or rest-frame optical can reveal high-excitation emission lines (e.g., C II and Mg II, or He II and [ Ne V ]), indicative of AGNs or reach the stellar continuum showing absorption lines that would confirm the presence of an underlying stellar population.
7. Summary
We identify 37 EROs in the CEERS field with NIRCam colors mag, down to a limiting
magnitude of mag. These are candidate massive dusty galaxies at .
A key defining feature of these EROs is that all of them have blue colors in the SW NIRCam bands (F150W – F277W ~0). The color difference in the SW and LW bands indicates that these galaxies have bimodal SEDs consisting of a red, power-law slope ( ) in the rest-frame optical, and a blue, flat slope in the rest-frame UV. These colors and SEDs are very different from those of other EROs or massive dusty galaxies at lower or similar redshifts.
Another key feature is that all of them are remarkably compact and featureless. The light profile fits with GALFIT indicate that they are unresolved, point-like sources in all the NIRCam bands. This differs again from the typical spread in stellar mass and size of other EROs or massive galaxies at similar redshifts.
Their photometric redshifts, stellar masses, and dust extinctions derived with standard SED fitting codes EAZYPY and FAST range from with median values and , respectively. However, if the red colors are not due to stellar continuum emission in a dusty galaxy, these values might be overestimated. Alternative scenarios include: emission lines with extreme EWs A from a galaxy or an AGN boosting the LW fluxes, a hybrid of a galaxy and a dusty QSO with the latter dominating the LW continuum, or an AGN dominating the whole SED.
Four of these EROs within the limited MIRI views overlap with the CEERS/NIRCam mosaic are clearly detected, showing that the extremely red colors extend to longer wavelengths. Another four EROs were observed with NIRSpec and they exhibit [O III] and H emission lines which confirm spectroscopic redshifts in the range. The MIRI detections at rest wavelengths redward of the most prominent emission lines indicate the presence of a continuum and disfavors a scenario where these EROs are intrinsically blue galaxies with high-EW emission lines masquerading as a red continuum.
We investigate the likelihood and implications of the different modeling scenarios using the eight MIRI- and NIRSpec-detected EROs to test a variety of codes with flexible options to characterize the stellar continuum, emission lines, dust attenuation, SFH, etc. For scenarios where the LW bands are dominated by a dusty galaxy, we find: (1) SED models based on either parametric or nonparametric SFHs and a Calzetti attenuation law fail to reproduce the blue, rest-frame UV emission regardless of the modeling assumptions (age, metallicity, etc.) and often lead to the largest stellar masses, ; (2) models with a flatter, gray attenuation law provide a better fit the UV region and lower stellar masses; and (3) composite SEDs with a dusty galaxy and either a blue galaxy or a blue QSO dominating the SW bands also provide a good overall fit to SED and similar masses with scenario (1). For scenarios where the LW bands are dominated by an obscured AGN, we find that models based on an obscured QSO plus a blue galaxy dominating the SW bands, or pure AGN models, where a combination of obscured and scattered emission by the torus dominates the whole SED, provide a good fit to the
overall SED and lead to stellar masses for the galaxy host that are two orders of magnitude lower than in the dusty-galaxy-dominated scenarios, with .
The unresolved, point-like sizes of all the EROs are more suggestive of an AGN-dominated scenario and disfavor a galaxy-dominated scenario where the blue and red SEDs are caused by different stellar populations in distinct regions of the galaxy.
The NIRCam colors are not enough to break the SED model degeneracies and meaningfully distinguish between galaxy- or AGN-dominated scenarios. Additional MIRI photometry redward of F 1000 W , probing the rest-frame SED between 1 and , will be able to answer this question definitely.
The number densities do not favor any of the galaxy versus AGN scenarios either since both have potentially problematic implications if the extreme properties of some of these EROs are confirmed. The dusty-galaxy scenario would imply an increase in the number density of very massive galaxies, , at of up to a factor of , relative to the pre-JWST estimates even if just a handful of them are confirmed to be that massive. Similarly, in the obscured-AGN scenario, the large, dust-corrected UV luminosities would imply an unexpectedly large number, , of obscured but luminous, , QSOs at , more than three orders of magnitude larger than the observed density of unobscured QSOs with similar -24 mag .
Acknowledgments
P.G.P-G. acknowledges support from grant PID2022-139567NB-I00 funded by Spanish Ministerio de Ciencia e Innovación MCIN/AEI/10.13039/501100011033, FEDER Una manera de hacer Europa. We acknowledge support from NASA through STScI ERS award JWST-ERS-1345. Some/all of the data presented in this paper were obtained from the Mikulski Archive for Space Telescopes (MAST) at the Space Telescope Science Institute. The specific observations analyzed can be accessed via doi:10.17909/z7p0-8481. This work has made use of the Rainbow Cosmological Surveys Database, which is operated by the Centrode Astrobiología (CAB), CSICINTA, partnered with the University of California Observatories at Santa Cruz (UCO/Lick, UCSC).
Software: Astropy (Astropy Collaboration et al. 2022), EAZY (Brammer et al. 2008), GALFIT (Peng et al. 2002), matplotlib (Hunter 2007), NumPy (van der Walt et al. 2011), PZETA (Pérez-González et al. 2008a), Prospector (Leja et al. 2019; Johnson et al. 2021), Rainbow pipeline (Pérez-González et al. 2005, 2008a; Barro et al. 2011), SExtractor (Bertin & Arnouts 1996), and Synthesizer (Pérez-González et al. 2005, 2008b)
Appendix A
Summary of Modeling Assumptions
Here we provide additional details on the modeling assumptions adopted with each of the methods discussed in Section 5.
For EAZYpy (Brammer et al. 2008) we use the default template set “tweak fsps QSF 12 v3,” which consists of a set 12
templates derived from the stellar population synthesis code FSPS (Conroy et al. 2010). The templates cover wide ranges in ages, dust attenuations, and -normal SFHs and they are computed using a Chabrier (2003) IMF and Kriek & Conroy (2013) dust attenuation law.
For Synthesizer (Pérez-González et al. 2008b) we adopt the following assumptions: a delayed exponential as the SFH, with timescale values between 100 Myr and 5 Gyr , ages between 1 Myr and the age of the Universe at the redshift of the source, all discrete metallicities provided by the Bruzual & Charlot (2003) models, a Calzetti et al. (2000) attenuation law with -band extinction values, between 0 and 5 mag, and a Chabrier (2003) IMF. Nebular continuum and emission lines were added to the models as described in Pérez-González et al. (2008b). A Monte Carlo method was carried out in order to obtain uncertainties and account for degeneracies (see Domínguez Sánchez et al. 2016).
For Prospector (Leja et al. 2019; Johnson et al. 2021) we adopt the following assumptions: we use the MIST stellar evolutionary tracks and isochrones (Choi et al. 2016), a Chabrier (2003) IMF, a range of stellar metallicities between -1.0 and 0.19 , and a range of gas-phase metallicities between -2.0 and 0.5 . The ionization parameter for the nebular emission ranges between -4 . and -1 . The nebular line and continuum emission is generated using CLOUDY Ferland et al. (1998) contained in FSPS and described in Byler et al. (2017). For the attenuation law, we use either Calzetti et al. (2000) or the more complex dust attenuation model which combines the Charlot & Fall (2000) two-component, birth-cloud versus diffuse dust screens approach with the Kriek & Conroy (2013) method that parameterizes the diffuse component as a combination of Calzetti attenuation plus a Lorentzian Drude to model the strength of the UV bump. Both components are then modulated by a power-law factor that flattens or steepens the slope of the attenuation relative to Calzetti. The parameters being fit in this case are the ratio of the nebular to diffuse attenuation, which ranges between zero and two, but follows a clipped normal prior centered at one, and the dust index of the power law, which ranges between -1 and 0.4 . One of the main advantages of Prospector is the possibility of using flexible SFHs. For the purpose of our analysis, we explore two options: a fiducial delayed -model and a nonparametric piece-wise SFH. The one-population -model uses relatively wide priors on the stellar ages, ranging between 1 Myr and the age of the Universe at the redshift of each source, and the star formation scale factor from 100 Myr to 20 Gyr . For the nonparametric model, we adopt the flexible SFH prescription (Leja et al. 2019) with six time bins and the burstycontinuity prior (Tacchella et al. 2022). This model includes five free parameters which control the ratio of the SFR in six adjacent time bins; the first two bins are spaced at and of lookback time, and the remaining four bins are log-spaced to a maximum age of 100 Myr.
For the hybrid galaxy + QSO model we combine a galaxy component derived from Prospector using the fiducial model with the QSO templates from Polletta et al. (2006). However, to provide more flexibility to the AGN component we include an additional degree of freedom in the Prospector modeling that includes AGN emission lines following the line ratios described in Richardson et al. (2014).
Appendix B Table with the Remaining 29 EROs
Because of the interest in the peculiar sources for further analysis or follow up, we list in Table 2 the properties of the 29 remaining EROs in the color-selected sample of 37 objects, and we show color composite cutouts for all them in Figure 12. In addition to the coordinates, we include in the table the photometric redshift estimates with EAZY and the
stellar masses used in the number density estimates in Section 6. As discussed in Section 5.4, the values obtained with FAST, Prospector-np, and Synthesizer provide a representative range of the variations in the stellar masses from the largest to the smallest values. We defer a more detailed, individualized analysis of the 29 sources, discussing the AGNdominated scenarios, to a future paper (D. Kocevski 2024, in preparation).
Table 2
Table with the Remaining 29 EROs
ID
R.A. (deg)
Decl. (deg)
Flag
( )
(1)
(2)
(3)
(4)
(5)
(6)
(7)
(8)
(9)
(10)
nircam1-1507
214.9372049
52.9653511
0
nircam1-2385
214.9984072
53.0046186
0
nircam1-2821
214.9568340
52.9731536
0
nircam1-10084
214.9830364
52.9560063
0
nircam2-1604
214.9022374
52.9393697
0
nircam2-3729
214.9257607
52.9456616
0
nircam2-6335
214.9272433
52.9338926
0
nircam2-9558
214.8761458
52.8808258
0
nircam3-9524
214.8066661
52.8378071
0
nircam4-2690
214.6951501
52.7485639
0
nircam4-6348
214.7953672
52.7888465
0
nircam5-3637
214.8922437
52.8774066
0
nircam5-4552
214.8967641
52.8757973
0
nircam5-9370
214.9102805
52.8600731
1
nircam7-4742
215.1314689
52.9849141
0
nircam7-4801
215.1370670
52.9885588
0
nircam7-5787
215.0617802
52.9311768
0
nircam7-5797
215.1437160
52.9888945
0
nircam7-10403
215.1072079
52.9428524
0
nircam7-12337
215.1370160
52.9556504
0
nircam7-13272
215.0817101
52.9122515
1
nircam8-8565
214.9799601
52.8610789
0
nircam8-13596
215.0802967
52.9079028
0
nircam9-3184
214.8864225
52.8233786
0
nircam9-5291
214.8760316
52.8061093
0
nircam9-6909
214.8945555
52.8121629
0
nircam9-9665
214.8998043
52.8015414
0
nircam9-12002
214.8964700
52.7876884
0
nircam10-1157
214.8513502
52.7992928
0
nircam1-1507
nircam1-2385
nircam1-2821
nircam1-10084
nircam2-1604
nircam2-3729
nircam2-6335
nircam2-9558
nircam3-9524
nircam4-2690
nircam4-6348
nircam5-3637
nircam5-4552
nircam5-9370
nircam7-4742
nircam7-4801
nircam7-5787
nircam7-5797
nircam7-10403
nircam7-12337
nircam7-13272
nircam8-8565
nircam8-13596
nircam9-3184
nircam9-5291
nircam9-6909
nircam9-9665
nircam9-12002
nircam10-1157
Figure 12. Color composite (F277W + F356W + F444W) 2 “. “. 5 cutouts of the 29 other EROs in the color-selected sample. Similar to the eight primary sources in Figures 6 and 7, these objects are also very red and remarkably homogeneous and compact.
Adams, N. J., Conselice, C. J., Ferreira, L., et al. 2023, MNRAS, 518, 4755
Aird, J., Coil, A. L., & Georgakakis, A. 2018, MNRAS, 474, 1225
Akins, H. B., Casey, C. M., Allen, N., et al. 2023, ApJ, 956, 61
Alcalde Pampliega, B., Pérez-González, P. G., Barro, G., et al. 2019, ApJ, 876, 135
Alonso-Herrero, A., Pérez-González, P. G., Rigby, J., et al. 2004, ApJS, 154, 155
Arrabal Haro, P., Dickinson, M., Finkelstein, S. L., et al. 2023, Natur, 622, 7984
Astropy Collaboration, Price-Whelan, A. M., Lim, P. L., et al. 2022, ApJ, 935, 167
Baggen, J. F. W., van Dokkum, P., Labbe, I., et al. 2023, ApJL, 955, L12
Bagley, M. B., Finkelstein, S. L., Koekemoer, A. M., et al. 2023, ApJL, 946, L12
Barro, G., Faber, S. M., Koo, D. C., et al. 2017, ApJ, 840, 47
Barro, G., Faber, S. M., Pérez-González, P. G., et al. 2013, ApJ, 765, 104
Barro, G., Pérez-González, P. G., Gallego, J., et al. 2011, ApJS, 193, 30
Barrufet, L., Oesch, P. A., Weibel, A., et al. 2023, MNRAS, 522, 449
Bertin, E., & Arnouts, S. 1996, A&AS, 117, 393
Bezanson, R., van Dokkum, P. G., Tal, T., et al. 2009, ApJ, 697, 1290
Bouwens, R. J., Oesch, P. A., Stefanon, M., et al. 2021, AJ, 162, 47
Boylan-Kolchin, M. 2023, NatAs, 7, 731
Brammer, G. B., van Dokkum, P. G., & Coppi, P. 2008, ApJ, 686, 1503
Brammer, G. B., Whitaker, K. E., van Dokkum, P. G., et al. 2011, ApJ, 739, 24
Bruzual, G., & Charlot, S. 2003, MNRAS, 344, 1000
Burgasser, A. J., Gerasimov, R., Bezanson, R., et al. 2024, ApJ, 962, 177
Byler, N., Dalcanton, J. J., Conroy, C., & Johnson, B. D. 2017, ApJ, 840, 44
Calzetti, D., Armus, L., Bohlin, R. C., et al. 2000, ApJ, 533, 682
Caputi, K. I. 2013, ApJ, 768, 103
Casey, C. M., Scoville, N. Z., Sanders, D. B., et al. 2014, ApJ, 796, 95
Castellano, M., Fontana, A., Treu, T., et al. 2022, ApJL, 938, L15
Chabrier, G. 2003, PASP, 115, 763
Charlot, S., & Fall, S. M. 2000, ApJ, 539, 718
Choi, J., Dotter, A., Conroy, C., et al. 2016, ApJ, 823, 102
Conroy, C., Gunn, J. E., & White, M. 2009, ApJ, 699, 486
Conroy, C., White, M., & Gunn, J. E. 2010, ApJ, 708, 58
Domínguez Sánchez, H., Pérez-González, P. G., Esquej, P., et al. 2016, MNRAS, 457, 3743
Donley, J. L., Kartaltepe, J., Kocevski, D., et al. 2018, ApJ, 853, 63
Donley, J. L., Koekemoer, A. M., Brusa, M., et al. 2012, ApJ, 748, 142
Donley, J. L., Rieke, G. H., Pérez-González, P. G., & Barro, G. 2008, ApJ, 687, 111
Donley, J. L., Rieke, G. H., Pérez-González, P. G., Rigby, J. R., & Alonso-Herrero, A. 2007, ApJ, 660, 167
Egami, E., Kneib, J. P., Rieke, G. H., et al. 2005, ApJL, 618, L5
Endsley, R., Stark, D. P., Chevallard, J., & Charlot, S. 2021, MNRAS, 500, 5229
Endsley, R., Stark, D. P., Whitler, L., et al. 2023, MNRAS, 524, 2312
Eyles, L. P., Bunker, A. J., Ellis, R. S., et al. 2007, MNRAS, 374, 910
Ferland, G. J., Korista, K. T., Verner, D. A., et al. 1998, PASP, 110, 761
Ferrara, A., Pallottini, A., & Dayal, P. 2023, MNRAS, 522, 3986
Finkelstein, S., Bagley, M., & Yang, G. 2023b, Data from The Cosmic Evolution Early Release Science Survey (CEERS), STScI/MAST, doi:10. 17909/Z7P0-8481
Finkelstein, S. L., Bagley, M. B., Ferguson, H. C., et al. 2023a, ApJL, 946, L13
Finkelstein, S. L., Dickinson, M., Ferguson, H. C., et al. 2017, The Cosmic Evolution Early Release Science (CEERS) Survey, JWST Proposal, Cycle 0, STScI, 1345
Fujimoto, S., Arrabal Haro, P., Dickinson, M., et al. 2023, ApJL, 949, L25
Fujimoto, S., Brammer, G. B., Watson, D., et al. 2022, Natur, 604, 261
Furtak, L. J., Zitrin, A., Plat, A., et al. 2023, ApJ, 952, 142
Gaia Collaboration, Prusti, T., de Bruijne, J. H. J., et al. 2016, A&A, 595, A1
Giallongo, E., Grazian, A., Fiore, F., et al. 2019, ApJ, 884, 19
Gilli, R., Norman, C., Vignali, C., et al. 2014, A&A, 562, A67
Gómez-Guijarro, C., Magnelli, B., Elbaz, D., et al. 2023, A&A, 677, A34
González, V., Bouwens, R., llingworth, G., et al. 2014, ApJ, 781, 34
Grazian, A., Fontana, A., Santini, P., et al. 2015, A&A, 575, A96
Greene, J. E., & Ho, L. C. 2007, ApJ, 670, 92
Grogin, N. A., Kocevski, D. D., Faber, S. M., et al. 2011, ApJS, 197, 35
Hainline, K. N., Helton, J. M., Johnson, B. D., et al. 2023, arXiv:2309.03250
Harikane, Y., Zhang, Y., Nakajima, K., et al. 2023, ApJ, 959, 39
Holwerda, B., Pirzkal, N., Burgasser, A., & Hsu, C. C. 2023, arXiv:2306. 12363
Hopkins, P. F., Bundy, K., Hernquist, L., Wuyts, S., & Cox, T. J. 2010, MNRAS, 401, 1099
Hunter, J. D. 2007, CSE, 9, 90
Johnson, B. D., Leja, J., Conroy, C., & Speagle, J. S. 2021, ApJS, 254, 22
Kocevski, D. D., Barro, G., Faber, S. M., et al. 2017, ApJ, 846, 112
Kocevski, D. D., Onoue, M., Inayoshi, K., et al. 2023, ApJL, 954, L4
Koekemoer, A. M., Faber, S. M., Ferguson, H. C., et al. 2011, ApJS, 197, 36
Kormendy, J., & Ho, L. C. 2013, ARA&A, 51, 511
Kriek, M., & Conroy, C. 2013, ApJL, 775, L16
Kriek, M., van Dokkum, P. G., Franx, M., Illingworth, G. D., & Magee, D. K. 2009, ApJL, 705, L71
Labbé, I., Oesch, P. A., Bouwens, R. J., et al. 2013, ApJL, 777, L19
Labbé, I., van Dokkum, P., Nelson, E., et al. 2023, Natur, 616, 266
Lacy, M., Sajina, A., Petric, A. O., et al. 2007, ApJL, 669, L61
Langeroodi, D., Hjorth, J., & Zhang, Z. 2023, ApJ, 957, L27
Larson, R. L., Hutchison, T. A., Bagley, M., et al. 2023, ApJ, 958, 141
Leja, J., Carnall, A. C., Johnson, B. D., Conroy, C., & Speagle, J. S. 2019, ApJ, 876, 3
Mason, C. A., Trenti, M., & Treu, T. 2023, MNRAS, 521, 497
Matsuoka, Y., Strauss, M. A., Kashikawa, N., et al. 2018, ApJ, 869, 150
Matthee, J., Mackenzie, R., Simcoe, R. A., et al. 2023, ApJ, 950, 67
McCarthy, P. J., Le Borgne, D., Crampton, D., et al. 2004, ApJL, 614, L9
Meisner, A. M., Schneider, A. C., Burgasser, A. J., et al. 2021, ApJ, 915, 120
Muzzin, A., Marchesini, D., Stefanon, M., et al. 2013, ApJ, 777, 18
Naidu, R. P., Oesch, P. A., Setton, D. J., et al. 2022, arXiv:2208.02794
Nelson, E., van Dokkum, P., Franx, M., et al. 2014, Natur, 513, 394
Nelson, E. J., Suess, K. A., Bezanson, R., et al. 2023, ApJL, 948, L18
Nonino, M., Glazebrook, K., Burgasser, A. J., et al. 2023, ApJL, 942, L29
Oke, J. B., & Gunn, J. E. 1983, ApJ, 266, 713
Papovich, C., Cole, J., Yang, G., et al. 2023, ApJL, 949, L18
Peng, C. Y., Ho, L. C., Impey, C. D., & Rix, H. W. 2002, AJ, 124, 266
Pérez-González, P. G., Barro, G., Annunziatella, M., et al. 2023a, ApJL, 946, L16
Pérez-González, P. G., Costantin, L., Langeroodi, D., et al. 2023b, ApJL, 951, L1
Pérez-González, P. G., Rieke, G. H., Egami, E., et al. 2005, ApJ, 630, 82
Pérez-González, P. G., Rieke, G. H., Villar, V., et al. 2008a, ApJ, 675, 234
Pérez-González, P. G., Trujillo, I., Barro, G., et al. 2008b, ApJ, 687, 50
Polletta, M. d. C., Wilkes, B. J., Siana, B., et al. 2006, ApJ, 642, 673
Reines, A. E., & Volonteri, M. 2015, ApJ, 813, 82
Richards, G. T., Lacy, M., Storrie-Lombardi, L. J., et al. 2006, ApJS, 166, 470
Richardson, C. T., Allen, J. T., Baldwin, J. A., Hewett, P. C., & Ferland, G. J. 2014, MNRAS, 437, 2376
Rinaldi, P., Caputi, K. I., Costantin, L., et al. 2023, ApJ, 952, 143
Rodighiero, G., Bisigello, L., Iani, E., et al. 2023, MNRAS, 518, L19
Runnoe, J. C., Brotherton, M. S., & Shang, Z. 2012, MNRAS, 422, 478
Sawicki, M. 2002, AJ, 124, 3050
Schmidt, M. 1968, ApJ, 151, 393
Somerville, R. S., Olsen, C., Yung, L. Y. A., et al. 2021, MNRAS, 502, 4858
Somerville, R. S., Popping, G., & Trager, S. C. 2015, MNRAS, 453, 4337
Song, M., Finkelstein, S. L., Ashby, M. L. N., et al. 2016, ApJ, 825, 5
Stark, D. P., Ellis, R. S., Bunker, A., et al. 2009, ApJ, 697, 1493
Stefanon, M., Bouwens, R. J., Labbé, I., et al. 2021, ApJ, 922, 29
Stefanon, M., Marchesini, D., Muzzin, A., et al. 2015, ApJ, 803, 11
Stefanon, M., Marchesini, D., Rudnick, G. H., Brammer, G. B., & Whitaker, K. E. 2013, ApJ, 768, 92
Stern, D., Eisenhardt, P., Gorjian, V., et al. 2005, ApJ, 631, 163
Stern, J., & Laor, A. 2012, MNRAS, 426, 2703
Tacchella, S., Dekel, A., Carollo, C. M., et al. 2016, MNRAS, 458, 242
Tacchella, S., Finkelstein, S. L., Bagley, M., et al. 2022, ApJ, 927, 170
Tadaki, K. i., Genzel, R., Kodama, T., et al. 2017, ApJ, 834, 135
van der Walt, S., Colbert, S. C., & Varoquaux, G. 2011, CSE, 13, 22
van der Wel, A., Franx, M., van Dokkum, P. G., et al. 2014, ApJ, 788, 28
van Dokkum, P. G., Nelson, E. J., Franx, M., et al. 2015, ApJ, 813, 23
Wang, P. Y., Goto, T., Ho, S. C. C., et al. 2023, MNRAS, 523, 4534
Wang, T., Huang, J. S., Faber, S. M., et al. 2012, ApJ, 752, 134
Wellons, S., Torrey, P., Ma, C. P., et al. 2015, MNRAS, 449, 361
Whitler, L., Endsley, R., Stark, D. P., et al. 2023, MNRAS, 519, 157
Wilkins, S. M., Stanway, E. R., & Bremer, M. N. 2014, MNRAS, 439, 1038
Williams, C. C., Giavalisco, M., Cassata, P., et al. 2014, ApJ, 780, 1
Witt, A. N., & Gordon, K. D. 2000, ApJ, 528, 799
Yung, L. Y. A., Somerville, R. S., Ferguson, H. C., et al. 2022, MNRAS, 515, 5416
Yung, L. Y. A., Somerville, R. S., Finkelstein, S. L., Popping, G., & Davé, R. 2019a, MNRAS, 483, 2983
Yung, L. Y. A., Somerville, R. S., Finkelstein, S. L., et al. 2023, MNRAS, 519, 1578
Yung, L. Y. A., Somerville, R. S., Popping, G., et al. 2019b, MNRAS, 490, 2855
Zavala, J. A., Buat, V., Casey, C. M., et al. 2023, ApJL, 943, L9
Zolotov, A., Dekel, A., Mandelker, N., et al. 2015, MNRAS, 450, 2327
dominated scenarios. This object is also studied in Akins et al. (2023). This object is also studied in Kocevski et al. (2023) as MPTID-746. This object is also studied in Fujimoto et al. (2023) as MPTID-20.
Notes. (1) Source ID in the CEERS catalog. (2) R.A. (J2000). (3) Decl. (J2000). (4) Brown dwarf flag based on blue color, F115W-F200<-1. (5) Photometric redshift in Section 2.3. (6) Stellar masses derived using FAST. (7) Stellar masses derived using Prospector-np. (8) Stellar masses derived using Synthesizer. (9) Stellar masses derived using the hybrid galaxy + QSO model. (10) Rest-frame UV luminosity, not corrected for extinction. This object is also studied in Pérez-González et al. (2023a). This object is also studied in Labbé et al. (2023).