DOI: https://doi.org/10.1136/gutjnl-2023-330971
PMID: https://pubmed.ncbi.nlm.nih.gov/38290832
تاريخ النشر: 2024-01-30
النظام الغذائي في مرحلة الطفولة المبكرة وخطر الإصابة بمرض الأمعاء الالتهابي: دراسة مجمعة في مجموعتين من مواليد الدول الاسكندنافية
- المواد الإضافية التكميلية تُنشر عبر الإنترنت فقط. لعرضها، يرجى زيارة المجلة على الإنترنت (http://dx.doi.org/10.1136/gutjnl-2023-330971).
آني قوه، قسم طب الأطفال، جامعة غوتنبرغ، غوتنبرغ 405 30، السويد؛annie.guo@gu.se
تم القبول في 23 ديسمبر 2023
© المؤلف(ون) (أو صاحب العمل(ين) الخاص(ين) بهم) 2024. يُسمح بإعادة الاستخدام بموجب CC BY-NC. لا يُسمح بإعادة الاستخدام التجاري. انظر الحقوق والتصاريح. نُشر بواسطة BMJ.
غوتجنل-2023-330971
الملخص
الهدف: قمنا بتقييم ما إذا كانت جودة النظام الغذائي في مرحلة الطفولة المبكرة وتكرار تناول الطعام مرتبطين بمرض التهاب الأمعاء (IBD) لاحقًا. التصميم: تم استخدام استبيانات مسجلة بشكل Prospective لمدة عام واحد وثلاثة أعوام في الأطفال من دراسة جميع الأطفال في جنوب شرق السويد ودراسة الأمهات والآباء والأطفال النرويجية لتقييم جودة النظام الغذائي باستخدام مؤشر الأكل الصحي وتكرار تناول مجموعات الطعام. تم تعريف مرض التهاب الأمعاء على أنه أكثر من حالتين تشخيصيتين في السجلات الوطنية للمرضى. أسفرت تحليل الانحدار Cox عن معدلات الخطر المعدلة (aHRs) لجنس الطفل، ومرض التهاب الأمعاء لدى الوالدين، والأصل، ومستوى التعليم، والأمراض المصاحبة للأم. تم تجميع النتائج الخاصة بالكوهرات باستخدام نموذج التأثيرات العشوائية. النتائج: خلال 1304433 سنة-شخص من المتابعة، تابعنا 81280 مشاركًا من الولادة حتى الطفولة والمراهقة، حيث تم تشخيص 307 منهم بمرض التهاب الأمعاء. بالمقارنة مع جودة النظام الغذائي المنخفضة، كانت جودة النظام الغذائي المتوسطة والعالية في عمر سنة واحدة مرتبطة بانخفاض خطر الإصابة بمرض التهاب الأمعاء (aHR المجمعة 0.75 (
مقدمة
ما هو معروف بالفعل عن هذا الموضوع
ماذا تضيف هذه الدراسة
كيف يمكن أن تؤثر هذه الدراسة على البحث أو الممارسة أو السياسة
التسامح
المواد والأساليب
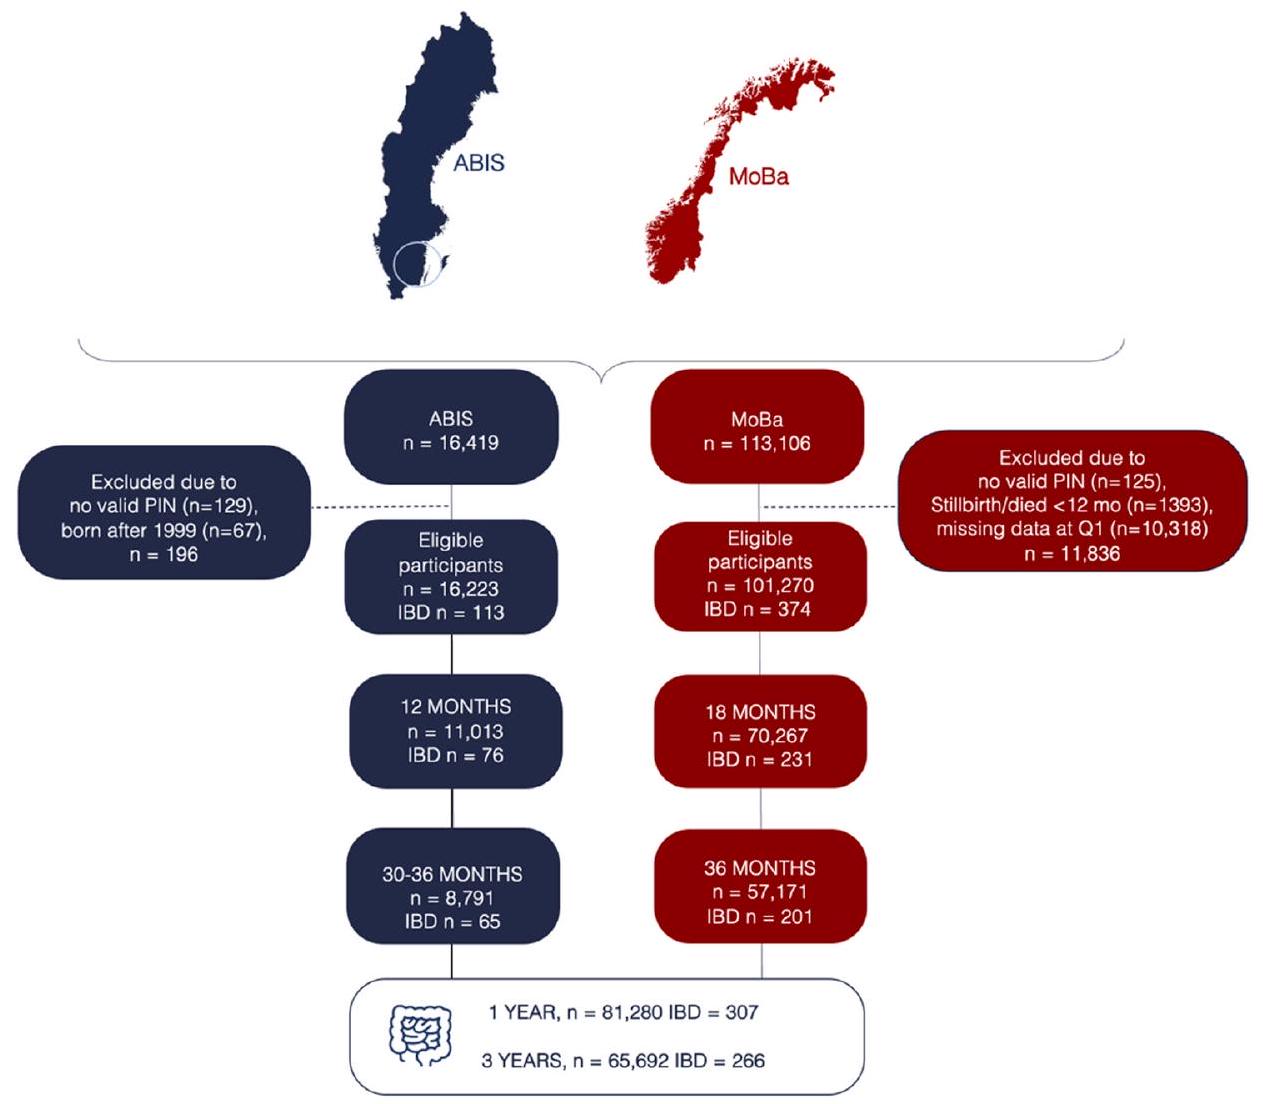
السكان المدروسون
نظام الغذاء في مرحلة الطفولة المبكرة
كان مستوى تناول الطعام لدى الأطفال ضمن كل مجموعة نموذجية مصنفة كمتغير تعرض ثلاثي. تم تقديم وصف أكثر تفصيلاً في الملف التكميلي عبر الإنترنت 1.
مؤشرًا على جودة غذائية أعلى، تم تقسيمه إلى ثلاثة أقسام تمثل جودة غذائية منخفضة ومتوسطة وعالية.
مرض الأمعاء الالتهابي
بيانات أخرى
التحليلات الإحصائية
باستخدام نموذج التأثيرات العشوائية.
تحليلات ما بعد الحدث
مشاركة المرضى والجمهور
النتائج
جودة النظام الغذائي
| خصائص | أبيس (
|
مو با (
|
||||
| جودة النظام الغذائي في عمر سنة واحدة | جودة النظام الغذائي في عمر سنة واحدة | |||||
| منخفض
|
متوسط
|
عالي
|
منخفض
|
متوسط
|
عالي
|
|
| IBD* | 37 (0.8) | 25 (0.7) | 14 (0.5) | 91 (0.4) | 75 (0.3) | 65 (0.3) |
| قرص مضغوط | 18 (0.4) | 8 (0.2) | 3 (0.1) | ٣٥ (٠.٢) | ٣٦ (٠.١) | 31 (0.1) |
| UC | 14 (0.3) | 13 (0.4) | 8 (0.3) | 24 (0.1) | 21 (0.1) | 17 (0.1) |
| جنس الطفل | ||||||
| فتيات | ٢٢١٣ (٤٨.٦) | 1617 (47.0) | 1460 (48.2) | ١٠٢٤٢ (٤٧.٩) | 13086 (49.1) | 11012 (49.5) |
| أولاد | 2336 (51.4) | 1820 (53.0) | 1567 (51.8) | 11147 (52.1) | 13551 (50.9) | 11229 (50.5) |
| المتابعة (سنوات) | ||||||
| المتوسط (الانحراف المعياري) | 21.2 (1.0) | 21.7 (0.8) | ٢١.٣ (٠.٩) | 15.6 (1.9) | 15.2 (2.0) | 14.9 (1.9) |
| الوسيط (المدى interquartile) | 21.3 (20.9-21.6) | 21.4 (20.9-21.7) | ٢١.٤ (٢١.٠-٢١.٨) | 15.7 (14.7-16.8) | 15.2 (14.2-16.2) | 14.7 (13.7-15.6) |
| الأصل الوالدي
|
||||||
| السويد/النرويج | 3958 (87.0) | ٣٠٨٩ (٨٩.٩) | 2695 (89.0) | 20232 (94.6) | ٢٥١٠٥ (٩٤.٢) | ٢٠٧٨٣ (٩٣.٤) |
| بيانات مفقودة | 98 (2.2) | 76 (2.2) | 66 (2.2) | 187 (0.9) | 212 (0.8) | 187 (0.8) |
| مستوى تعليم الأم (سنوات)
|
||||||
|
|
393 (8.6) | 222 (6.5) | 174 (5.7) | 1710 (8.0) | 1554 (5.8) | 969 (4.4) |
| 12 | 2509 (55.2) | 1879 (54.7) | 1583 (52.3) | 6976 (32.6) | 7069 (26.5) | 5147 (23.1) |
|
|
1543 (33.9) | 1255 (36.5) | 1208 (39.9) | 12437 (58.1) | 17686 (66.4) | 15861 (71.3) |
| بيانات مفقودة | ١٠٤ (٢.٣) | 81 (2.4) | 62 (2.0) | 266 (1.2) | ٣٢٨ (١.٢) | 264 (1.2) |
| مستوى التعليم الأبوي (سنوات)
|
||||||
|
|
629 (13.8) | ٣٩٢ (١١.٤) | 377 (12.5) | 2560 (12.0) | 2355 (8.8) | 1539 (6.9) |
| 12 | 2658 (58.4) | 2047 (59.6) | 1685 (55.7) | 9075 (42.4) | 10046 (37.7) | 7527 (33.8) |
|
|
1106 (24.3) | 867 (25.2) | 863 (28.5) | 8946 (41.8) | 13265 (49.8) | 12351 (55.5) |
| بيانات مفقودة | 156 (3.4) | 131 (3.8) | ١٠٢ (٣.٤) | 808 (3.8) | 971 (3.6) | 824 (3.7) |
| التهاب الأمعاء المزمن لدى الوالدين§ | ||||||
| نعم | ٥٩ (١.٣) | 51 (1.5) | 31 (1.0) | 532 (2.5) | 641 (2.4) | 537 (2.4) |
| الأمراض المصاحبة للأم
|
||||||
| نعم | 140 (3.1) | 123 (3.6) | ١٢٢ (٤.٠) | 877 (4.1) | ١٠٩٢ (٤.١) | 884 (4.0) |
| تدخين الأمهات أثناء الحمل | ||||||
| نعم | 473 (10.4) | 300 (8.7) | 236 (7.8) | 2218 (10.4) | 1992 (7.5) | 1307 (5.9) |
| مفقود | ١٠٣ (٢.٣) | 79 (2.3) | 65 (2.1) | 264 (1.2) | 311 (1.2) | 292 (1.3) |
| عمر الأم عند الولادة (سنوات)** | ||||||
| <25 | 735 (16.1) | 462 (13.4) | 358 (11.8) | ٢٥١٤ (١١.٧) | 2458 (9.2) | 1667 (7.5) |
| 25-34 | ٣٢٢١ (٧٠.٦) | 2525 (73.5) | 2171 (71.7) | 15384 (71.9) | 19330 (72.5) | 16349 (73.5) |
| 35-44 | 528 (11.6) | 377 (10.9) | 453 (15.0) | 3485 (16.3) | ٤٨٣٧ (١٨.٢) | 4208 (18.9) |
| بيانات مفقودة | 75 (1.6) | 73 (2.1) | ٤٥ (١.٥) | 6 (0.0) | 12 (0.0) | 17 (0.1) |
| وضع التسليم | ||||||
| مهبلي | 3694 (81.2) | 2756 (80.2) | 2455 (81.1) | 18284 (85.5) | 22779 (85.5) | 18926 (85.1) |
| قيصري | 515 (11.3) | 404 (11.8) | 321 (10.6) | 3105 (14.5) | 3858 (14.5) | ٣٣١٥ (١٤.٩) |
| بيانات مفقودة | 340 (7.5) | 277 (8.1) | ٢٥١ (٨.٣) | 0 (0.0) | 0 (0.0) | 0 (0.0) |
| وزن الولادة (غ)
|
||||||
| المتوسط (الانحراف المعياري) | ٣٥٧١ (٥٥٤) | ٣٥٩٢ (٢) | 3580 (533) | ٣٥٩٦ (٥٧٨) | ٣٥٧٧ (٥٧٦) | ٣٥٤٠ (٥٨٠) |
| بيانات مفقودة | ٤٩ (١.١) | ٣٥ (١.٠) | ٢٦ (٠.٩) | 6 (0.0) | 16 (0.1) | 17 (0.1) |
| عمر الحمل (أسابيع)
|
||||||
| المتوسط (الانحراف المعياري) | ٣٩.٧ (١.٨) | ٣٩.٧ (١.٧) | ٣٩.٨ (١.٧) | ٣٩.٤ (١.٨) | ٣٩.٤ (١.٩) | ٣٩.٤ (١.٩) |
| بيانات مفقودة | 85 (1.9) | ٥٦ (١.٦) | 53 (1.8) | 84 (0.4) | ١١٨ (٠.٤) | 87 (0.4) |
| الرضاعة الطبيعية الكاملة (بالأشهر) | ||||||
| <4 | ١٠٨٧ (٢٣.٩) | 845 (24.6) | 743 (24.5) | 8717 (40.8) | ١٠٣٦٠ (٣٨.٩) | 8564 (38.5) |
| ٤-٦ | 1387 (30.5) | 1077 (31.3) | 938 (31.0) | 9424 (44.1) | 11711 (44.0) | 9426 (42.4) |
| >6 | 630 (13.8) | ٤٥٦ (١٣.٣) | 431 (14.2) | 2456 (11.5) | 3574 (13.4) | ٣٤١٥ (١٥.٤) |
| بيانات مفقودة | ١٤٤٥ (٣١.٨) | ١٠٥٩ (٣٠.٨) | 905 (30.2) | 792 (3.7) | 992 (3.7) | 836 (3.8) |
| عمر إدخال الطعام (بالشهور) | ||||||
| <4 | ٢٧١٦ (٥٩.٧) | 1757 (51.1) | 1426 (47.1) | 1511 (7.1) | 1391 (5.2) | 829 (3.7) |
| ٤-٦ | 1810 (39.8) | 1675 (48.7) | 1600 (52.9) | 18543 (86.7) | 23580 (88.5) | 19979 (89.8) |
| >6 | 22 (0.5) | 5 (0.1) | 1 (0.0) | 543 (2.5) | 674 (2.5) | 597 (2.7) |
| أبيس (
|
مو با (
|
|||||||||||||||
| خصائص | جودة النظام الغذائي في عمر سنة واحدة | جودة النظام الغذائي في عمر سنة واحدة | ||||||||||||||
| منخفض
|
متوسط
|
عالي
|
منخفض
|
متوسط
|
عالي
|
|||||||||||
| بيانات مفقودة | 1 (0.0) | 0 (0.0) | 0 (0.0) | 792 (3.7) | 992 (3.7) | 836 (3.8) | ||||||||||
|
||||||||||||||||
مجموعات الطعام
إلى 0.89)؛ مرتفع، 0.72 (
تحليلات فرعية
تحليلات ما بعد الحدث
| تعرض النظام الغذائي | الإجمالي ن | حدث التهاب الأمعاء | معدل الخطر غير المعدل (95% فترة الثقة) | النموذج 1 aHR (95%CI) | ||
| جودة النظام الغذائي | ||||||
| منخفض | ٢٥,٩٣٥ | 128 | مرجع | مرجع | ||
| وسيط | 30,069 | 99 | = | 0.74 (0.57، 0.97) | 0.75 (0.58، 0.98) | |
| عالي | ٢٥٢٦٨ | 79 | – | 0.73 (0.55، 0.97) | 0.75 (0.56، 1.00) | |
| لكل زيادة في الفئة | 0.84 (0.73، 0.97) | 0.86 (0.74، 0.99) | ||||
| لحم | ||||||
| منخفض | ٢٠٢٧٦ | 95 | مرجع | مرجع | ||
| وسيط | ٣٣,٠٧٤ | ١٠٨ | -1.1 | 0.76 (0.58، 1.00) | 0.78 (0.59، 1.04) | |
| عالي | ٢٧,٩٣٠ | ١٠٤ | – | 0.89 (0.67، 1.19) | 0.94 (0.70، 1.27) | |
| لكل زيادة في الفئة |
|
0.95 (0.82، 1.11) | 0.99 (0.85, 1.15) | |||
| سمك | ||||||
| منخفض | 18,464 | ١٠١ | مرجع | مرجع | ||
| وسيط | ٣٧,٣٨٢ | 135 | – | 0.79 (0.60، 1.03) | 0.82 (0.62، 1.08) | |
| عالي | ٢٥,٤٣٤ | 71 |
|
0.66 (0.46، 0.93) | 0.70 (0.49، 1.00) | |
| لكل زيادة في الفئة | * | 0.82 (0.70، 0.97) | 0.85 (0.71، 1.00) | |||
| منتجات الألبان | ||||||
| منخفض | ٢٦,٣٠٢ | 95 | مرجع | مرجع | ||
| وسيط | ٢٦,٤٠٢ | 90 |
|
0.93 (0.70، 1.24) | 0.99 (0.74, 1.32) | |
| عالي | ٢٨,٥٧٦ | ١٢٢ |  |
1.12 (0.86, 1.47) | 1.16 (0.89, 1.53) | |
| لكل زيادة في الفئة | 1.07 (0.93، 1.22) | 1.08 (0.94، 1.25) | ||||
| فواكه | ||||||
| منخفض | ٢٣,٢٣٠ | 91 | مرجع | مرجع | ||
| وسيط | 44,147 | 143 |
|
0.92 (0.58، 1.47) | 0.99 (0.53, 1.85) | |
| عالي | ١٣,٩٠٣ | 73 | |
0.94 (0.53، 1.66) | 0.96 (0.48، 1.92) | |
| لكل زيادة في الفئة | 0.98 (0.70، 1.38) | 1.00 (0.68, 1.48) | ||||
| خضروات | ||||||
| منخفض | 19,270 | 89 | مرجع | مرجع | ||
| وسيط | ٢٥,٥٤٣ | 81 | = | 0.66 (0.49، 0.89) | 0.68 (0.50، 0.93) | |
| عالي | ٣٦,٤٦٧ | ١٣٧ | |
0.72 (0.55، 0.95) | 0.77 (0.58، 1.03) | |
| لكل زيادة في الفئة | |
0.85 (0.74، 0.98) | 0.88 (0.76, 1.02) | |||
| حبوب | ||||||
| منخفض | ٢٦,٦٩٥ | ١١٦ | مرجع | مرجع | ||
| وسيط | ٢٥,٩٤٣ | ٨٠ | – | 0.79 (0.54، 1.17) | 0.80 (0.56، 1.15) | |
| عالي | ٢٨,٦٤٢ | 111 | |
0.91 (0.63، 1.32) | 0.94 (0.67، 1.32) | |
| لكل زيادة في الفئة | ٧ | 0.94 (0.82، 1.08) | 0.96 (0.84, 1.11) | |||
| بطاطس | ||||||
| منخفض | 13,401 | 69 | مرجع | مرجع | ||
| وسيط | ٣٦٩٩٠ | 132 | |
1.16 (0.78, 1.74) | 1.19 (0.78, 1.83) | |
| عالي | 30,889 | ١٠٦ |
|
0.80 (0.57، 1.12) | 0.84 (0.59، 1.20) | |
| لكل زيادة في الفئة |
|
0.88 (0.75, 1.02) | 0.89 (0.76، 1.05) | |||
| طعام غني بالسكر والدهون | ||||||
| منخفض | ٢٤,٥٤٣ | ٨٨ | مرجع | مرجع | ||
| وسيط | 30,044 | ١١٩ | |
1.19 (0.90, 1.57) | 1.19 (0.89, 1.58) | |
| عالي | ٢٦,٦٩٣ | 100 | |
1.05 (0.78, 1.41) | 1.05 (0.78، 1.41) | |
| لكل زيادة في الفئة | 1.03 (0.89، 1.18) | 1.03 (0.89، 1.19) | ||||
| المشروبات المحلاة بالسكر | ||||||
| لا استهلاك | ٢٢,٥٥٠ | ٨٨ | مرجع | مرجع | ||
| بعض المدخلات | ٥٨,٧٣٠ | ٢١٩ | |
1.46 (0.94، 2.27) | 1.42 (1.05، 1.90) | |
| نموذج | معدل الخطر غير المعدل (95% فترة الثقة) | النموذج 1 aHR (95%CI) | ||||
نقاش
عند سن 3 سنوات، كان تناول السمك فقط مرتبطًا بمرض الأمعاء الالتهابي لاحقًا، وخاصة التهاب القولون التقرحي.
كان الالتزام العالي بنظام غذائي متوسطي معدل مرتبطًا بانخفاض خطر الإصابة بمرض السيلياك، ولكن ليس بمرض التهاب الأمعاء التقرحي.
| تعرض النظام الغذائي | الإجمالي ن | حدث UC | معدل الخطر غير المعدل (95% فترة الثقة) | النموذج 1 aHR (95%CI) | ||||||||||
| جودة النظام الغذائي | ||||||||||||||
| منخفض | ٢٥,٨٤٥ | ٣٨ | مرجع | مرجع | ||||||||||
| وسيط | ٣٠٠٠٣ | ٣٣ |  |
0.89 (0.56، 1.42) | 0.92 (0.57، 1.48) | |||||||||
| عالي | ٢٥,٢١٤ | ٢٥ | |
0.83 (0.50، 1.38) | 0.89 (0.54، 1.50) | |||||||||
| لكل زيادة في الفئة | |
0.91 (0.71، 1.18) | 0.95 (0.73، 1.23) | |||||||||||
| لحم | ||||||||||||||
|
٢٠٢١٥ | ٣٤ |
|
|||||||||||
| ٣٢,٩٩٨ | 32 | |||||||||||||
|
٢٧,٨٥٧ | 31 | ||||||||||||
|
||||||||||||||
| سمك | ||||||||||||||
|
18,404 | 41 | مرجع | مرجع | ||||||||||
| ٣٣٧١٢ | ٣٨ | |
0.65 (0.36, 1.15) | 0.68 (0.38، 1.21) | ||||||||||
| عالي | ٢٥,٣٨١ | ١٨ | |
0.46 (0.22، 1.00) | 0.46 (0.21، 0.99) | |||||||||
| لكل زيادة في الفئة | |
0.72 (0.53، 0.97) | 0.73 (0.53، 0.98) | |||||||||||
| منتجات الألبان | ||||||||||||||
|
٢٦,٢٤١ | ٣٤ | مرجع | مرجع | ||||||||||
| ٢٦,٣٤٤ | 32 | |
0.92 (0.57، 1.50) | 1.00 (0.61, 1.63) | ||||||||||
| عالي | ٢٨٤٨٥ | |
0.79 (0.48، 1.28) | 0.85 (0.52، 1.40) | ||||||||||
| لكل زيادة في الفئة | – | 0.89 (0.70، 1.13) | 0.92 (0.72, 1.18) | |||||||||||
| فواكه | ||||||||||||||
| منخفض | ٢٣,١٦٥ | 26 | مرجع | مرجع | ||||||||||
| متوسط | ٤٤,٠٤٤ | 40 |
|
0.87 (0.53، 1.43) | 0.97 (0.58، 1.64) | |||||||||
| عالي | 13,861 | 31 | |
1.09 (0.49, 2.42) | 1.24 (0.55, 2.81) | |||||||||
| لكل زيادة في الفئة | |
0.99 (0.70, 1.38) | 1.07 (0.76, 1.51) | |||||||||||
| خضروات | ||||||||||||||
| منخفض | 19,209 | مرجع | مرجع | |||||||||||
| وسيط | ٢٥,٤٨٣ | |
0.70 (0.19, 2.62) | 0.73 (0.17, 3.10) | ||||||||||
| عالي | ٣٦,٣٧٨ | ٤٨ | |
0.87 (0.24, 3.13) | 0.96 (0.24, 3.92) | |||||||||
| لكل زيادة في الفئة | – | 0.84 (0.64، 1.09) | 0.87 (0.66، 1.13) | |||||||||||
| حبوب | ||||||||||||||
| منخفض | ٢٢,٨٧٧ | ٣٣ | مرجع | مرجع | ||||||||||
| وسيط | ٢٥,٨٨٧ | ٢٤ | |
1.04 (0.28, 3.84) | 1.05 (0.28، 4.00) | |||||||||
| عالي | ٢٨,٥٧١ | 40 | |
1.34 (0.37, 4.82) | 1.41 (0.38, 5.22) | |||||||||
| لكل زيادة في الفئة | |
1.13 (0.65, 1.96) | 1.16 (0.67, 1.99) | |||||||||||
| بطاطس | ||||||||||||||
| منخفض | 13,363 | 31 | مرجع | مرجع | ||||||||||
| وسيط | ٣٦,٨٩٦ | ٣٨ | |
1.00 (0.45, 2.19) | 0.97 (0.48، 1.95) | |||||||||
| عالي | 30,811 | ٢٨ | – | |
0.52 (0.25، 1.09) | 0.54 (0.29، 1.03) | ||||||||
| لكل زيادة في الفئة | |
0.75 (0.57، 0.97) | ||||||||||||
| طعام غني بالسكر والدهون | ||||||||||||||
| منخفض | ٢٤٤٨٧ | ٣٢ | مرجع | مرجع | ||||||||||
| وسيط | ٢٩,٩٥٩ | ٣٤ | |
|
0.99 (0.60, 1.63) | |||||||||
| عالي | ٢٦,٦٢٤ | 31 |
|
0.98 (0.59، 1.63) | 0.92 (0.55، 1.53) | |||||||||
| لكل زيادة في الفئة | – | 1.00 (0.77، 1.28) | 0.97 (0.75, 1.24) | |||||||||||
| المشروبات المحلاة بالسكر | ||||||||||||||
|
٢٢,٥٠٠ | ٣٨ |
|
مرجع | ||||||||||
| ٥٨,٥٧٠ | |
0.92 (0.25, 3.26) | ||||||||||||
|
||||||||||||||
لجزء واحد فقط من النظام الغذائي. علاوة على ذلك، قد يتم إدخال خطأ من النوع الثاني في تحليلات مرض كرون والتهاب القولون التقرحي، مرتبطًا بعدد أقل من الأحداث في تلك التحليلات وزيادة خطر التصنيف الخاطئ بين الأنواع الفرعية.
أكثر من مرة في الأسبوع للأطفال
نقاط القوة والقيود
الاستنتاج
الانتماءات المؤلفين
شكر خاص لـ ليزلي شابس، في خدمات التدقيق والتحرير والترجمة العالمية لتحرير اللغة.
المساهمون AG – تصميم الدراسة، التحليل الإحصائي وتفسير البيانات، صياغة ومراجعة المقالة والموافقة النهائية. ALB وSK وMO – تفسير البيانات، مراجعة المقالة والموافقة النهائية. KS وJL – مفهوم الدراسة، تفسير البيانات، مراجعة المقالة والموافقة النهائية. KM – المسؤول عن سلامة البيانات، حصل على التمويل، مفهوم الدراسة، تفسير البيانات، الضامن، مراجعة المقالة والموافقة النهائية.
لا توجد مصالح متعارضة تم الإبلاغ عنها.
لا حاجة لموافقة المرضى للنشر.
الأصل ومراجعة الأقران لم يتم تكليفه؛ تمت مراجعته خارجيًا.
بيان توفر البيانات البيانات متاحة عند الطلب المعقول. سيتم مشاركة البيانات التي تم جمعها لهذا المقال عند الطلب المعقول من المحقق الرئيسي للدراسة، كارل ماريليد (karlmarild@gmail.com).
المواد التكميلية تم تزويد هذا المحتوى من قبل المؤلفين. لم يتم فحصه من قبل مجموعة نشر BMJ (BMJ) وقد لا يكون قد تم مراجعته من قبل الأقران. أي آراء أو توصيات تم مناقشتها هي فقط آراء المؤلفين وليست مدعومة من قبل BMJ. تتنصل BMJ من جميع المسؤوليات والالتزامات الناشئة عن أي اعتماد على المحتوى. حيثما يتضمن المحتوى أي مواد مترجمة، لا تضمن BMJ دقة وموثوقية الترجمات (بما في ذلك على سبيل المثال لا الحصر اللوائح المحلية، الإرشادات السريرية، المصطلحات، أسماء الأدوية وجرعات الأدوية)، ولا تتحمل أي مسؤولية عن أي أخطاء و/أو سهو ناشئ عن الترجمة والتكيف أو خلاف ذلك.
الوصول المفتوح هذه مقالة وصول مفتوح موزعة وفقًا لرخصة المشاع الإبداعي للاستخدام غير التجاري (CC BY-NC 4.0)، والتي تسمح للآخرين بتوزيع، وإعادة مزج، وتكييف، والبناء على هذا العمل بشكل غير تجاري، وترخيص أعمالهم المشتقة بشروط مختلفة، شريطة أن يتم الاستشهاد بالعمل الأصلي بشكل صحيح، ومنح الائتمان المناسب، والإشارة إلى أي تغييرات تم إجراؤها، وأن يكون الاستخدام غير تجاري. انظر: http://creativecommons.org/licenses/by-nc/4.0/.
معرفات ORCID
جوني لودفيغسون http://orcid.org/0000-0003-1695-5234
آن ليز برانتسيتير http://orcid.org/0000-0001-6315-7134
صوفيا كلينغبرغ http://orcid.org/0000-0002-9093-2826
مالين أوستنسون http://orcid.org/0000-0002-8184-9609
كيتيل ستوردال http://orcid.org/0000-0001-7826-8646
كارل ماريليد http://orcid.org/0000-0003-2285-8713
REFERENCES
2 Racine A, Carbonnel F, Chan SSM, et al. Dietary patterns and risk of inflammatory bowel disease in Europe: results from the EPIC study. Inflamm Bowel Dis 2016;22:345-54.
3 Ananthakrishnan AN, Khalili H, Konijeti GG, et al. Long-term intake of dietary fat and risk of ulcerative colitis and Crohn’s disease. Gut 2014;63:776-84.
4 Dong C, Chan SSM, Jantchou P, et al. Meat intake is associated with a higher risk of ulcerative colitis in a large European prospective cohort study. J Crohns Colitis 2022;16:1187-96.
5 Milajerdi A, Ebrahimi-Daryani N, Dieleman LA, et al. Association of dietary fiber, fruit, and vegetable consumption with risk of inflammatory bowel disease: a systematic review and meta-analysis. Adv Nutr 2021;12:735-43.
6 Li F, Liu X, Wang W, et al. Consumption of vegetables and fruit and the risk of inflammatory bowel disease: a meta-analysis. Eur I Gastroenterol Hepatol 2015;27:623-30.
7 Mozaffari H, Daneshzad E, Larijani B, et al. Dietary intake of fish, N-3 polyunsaturated fatty acids, and risk of inflammatory bowel disease: a systematic review and metaanalysis of observational studies. Eur J Nutr 2020;59:1-17.
8 Peters V, Bolte L, Schuttert EM, et al. Western and carnivorous dietary patterns are associated with greater likelihood of IBD development in a large prospective population-based cohort. J Crohns Colitis 2022;16:931-9.
10 Jakobsen C, Paerregaard A, Munkholm P, et al. Environmental factors and risk of developing paediatric inflammatory bowel disease — a population based study 20072009. J Crohns Colitis 2013;7:79-88.
12 Magnus P, Birke C, Vejrup K, et al. Cohort profile update: the Norwegian mother and child cohort study (MoBa). Int I Epidemiol 2016;45:382-8.
13 Agnihotri N, Øverby NC, Bere E, et al. Childhood adherence to a potentially healthy and sustainable Nordic diet and later overweight: the Norwegian mother, father and child cohort study (Moba). Matern Child Nutr 2021;17:e13101.
14 Källén B, Källén K, Otterblad Olausson P. The Swedish medical birth register A summary of content and quality. Research report from Epc. n.d. Available: https:// www.socialstyrelsen.se/globalassets/sharepoint-dokument/artikelkatalog/ovrigt/2003-112-3_20031123.pdf
15 Ludvigsson JF, Almqvist C, Bonamy A-KE, et al. Registers of the Swedish total population and their use in medical research. Eur J Epidemiol 2016;31:125-36.
16 Ludvigsson JF, Otterblad-Olausson P, Pettersson BU, et al. The Swedish personal identity number: possibilities and pitfalls in Healthcare and medical research. Eur 1 Epidemiol 2009;24:659-67.
17 Bakken IJ, Ariansen AMS, Knudsen GP, et al. The Norwegian patient Registry and the Norwegian Registry for primary health care: research potential of two nationwide health-care registries. Scand J Public Health 2020;48:49-55.
18 Irgens LM. The medical birth Registry of Norway. Epidemiological research and surveillance throughout 30 years. Acta Obstet Gynecol Scand 2000;79:435-9.
19 Huus K, Brekke HK, Ludvigsson JF, et al. Relationship of food frequencies as reported by parents to overweight and obesity at 5 years. Acta Paediatr 2009;98:139-43.
20 Jacka FN, Ystrom E, Brantsaeter AL, et al. Maternal and early postnatal nutrition and mental health of offspring by age 5 years: a prospective cohort study. J Am Acad Child Adolesc Psychiatry 2013;52:1038-47.
21 Kindgren E, Fredrikson M, Ludvigsson J. Early feeding and risk of juvenile idiopathic arthritis: a case control study in a prospective birth cohort. Pediatr Rheumatol Online J 2017;15:46.
22 Sørensen LMN, Aamodt G, Brantsæter AL, et al. Diet quality of Norwegian children at 3 and 7 years: changes, predictors and longitudinal association with weight. Int J Obes (Lond) 2022;46:10-20.
23 Vejrup K, Agnihotri N, Bere E, et al. Adherence to a healthy and potentially sustainable Nordic diet is associated with child development in the Norwegian mother, father and child cohort study (MoBa). Nutr I 2022;21:46.
24 Agnihotri N, Rudjord Hillesund E, Bere E, et al. Development and description of new Nordic diet scores across infancy and childhood in the Norwegian mother, father and child cohort study (MoBa). Matern Child Nutr 2021;17:e13150.
25 Cade J, Thompson R, Burley V, et al. Development, validation and utilisation of foodfrequency questionnaires – a review. Public Health Nutr 2002;5:567-87.
26 Vilela S, Oliveira A, Ramos E, et al. Association between energy-dense food consumption at 2 years of age and diet quality at 4 years of age. Br J Nutr 2014;111:1275-82.
27 World Health Organization, Regional Office for Europe. Food and nutrition policy for schools: a tool for the development of school nutrition programmes in the European Region. Copenhagen: WHO Regional Office for Europe, 2006. Available: https://apps. who.int/iris/handle/10665/107797
28 Strisciuglio C, Giugliano F, Martinelli M, et al. Impact of environmental and familial factors in a cohort of pediatric patients with inflammatory bowel disease. J Pediatr Gastroenterol Nutr 2017;64:569-74.
29 Ludvigsson JF, Andersson E, Ekbom A, et al. External review and validation of the Swedish National inpatient register. BMC Public Health 2011;11:450.
30 Mouratidou N, Malmborg P, Järås J, et al. Identification of childhood-onset inflammatory bowel disease in Swedish Healthcare registers: a validation study. Clin Epidemiol 2022;14:591-600.
31 Östensson M, Björkqvist O, Guo A, et al. Epidemiology, validation, and clinical characteristics of inflammatory bowel disease: the ABIS birth cohort study. BMC Gastroenterol 2023;23:199.
32 Xu F, Dahlhamer JM, Zammitti EP, et al. Health-risk behaviors and chronic conditions among adults with inflammatory bowel disease – United States, 2015 and 2016. MMWR Morb Mortal Wkly Rep 2018;67:190-5.
33 Schoenfeld D. Partial residuals for the proportional hazards regression model. Biometrika 1982;69:239-41.
34 DerSimonian R, Laird N. Meta-analysis in clinical trials. Control Clin Trials 1986;7:177-88.
35 Kelsen JR, Sullivan KE, Rabizadeh S, et al. North American society for pediatric Gastroenterology, Hepatology, and nutrition position paper on the evaluation and management for patients with very early-onset inflammatory bowel disease. J Pediatr Gastroenterol Nutr 2020;70:389-403.
36 Rothman KJ. No adjustments are needed for multiple comparisons. Epidemiology 1990;1:43-6.
38 Khalili H, Håkansson N, Chan SS, et al. Adherence to a mediterranean diet is associated with a lower risk of later-onset Crohn’s disease: results from two large prospective cohort studies. Gut 2020;69:1637-44.
39 Amre DK, D’Souza S, Morgan K, et al. Imbalances in dietary consumption of fatty acids, vegetables, and fruits are associated with risk for Crohn’s disease in children. Am J Gastroenterol 2007;102:2016-25.
40 Ananthakrishnan AN, Khalili H, Higuchi LM, et al. Higher predicted vitamin D status is associated with reduced risk of Crohn’s disease. Gastroenterology 2012;142:482-9.
41 Issa M, Saeian K. Diet in inflammatory bowel disease. Nutr Clin Pract 2011;26:151-4.
42 Piovani D, Danese S, Peyrin-Biroulet L, et al. Environmental risk factors for inflammatory bowel diseases: an umbrella review of meta-analyses. Gastroenterology 2019;157:647-59.
43 Zhernakova A, Kurilshikov A, Bonder MJ, et al. Population-based metagenomics analysis reveals markers for gut microbiome composition and diversity. Science 2016;352:565-9.
44 Khan S, Waliullah S, Godfrey V, et al. Dietary simple sugars alter microbial ecology in the gut and promote colitis in mice. Sci Transl Med 2020;12:eaay6218.
46 Khalili H, Hakansson N, Chan SS, et al. No association between consumption of sweetened Beverages and risk of later-onset Crohn’s disease or ulcerative colitis. Clin Gastroenterol Hepatol 2019;17:123-9.
47 Stewart CJ, Ajami NJ, O’Brien JL, et al. Temporal development of the gut microbiome in early childhood from the TEDDY study. Nature 2018;562:583-8.
48 Laue HE, Coker MO, Madan JC. The developing Microbiome from birth to 3 years: the gut-brain axis and neurodevelopmental outcomes. Front Pediatr 2022;10:815885.
49 Larsen JH, Anderson S, Perminow G, et al. Higher incidence of childhood-onset inflammatory bowel disease by increasing latitude in Norway, but stable incidence by age for cohorts born 2004-2012 [Manuscript submitted for publication]. 2023.
50 loannidis JPA. Implausible results in human nutrition research. BMJ 2013;347:f6698.
51 Nilsen RM, Vollset SE, Gjessing HK, et al. Self-selection and bias in a large prospective pregnancy cohort in Norway. Paediatr Perinat Epidemiol 2009;23:597-608.
52 Mårild K, Tapia G, Midttun Ø, et al. Smoking in pregnancy, cord blood cotinine and risk of celiac disease diagnosis in offspring. Eur J Epidemiol 2019;34:637-49.
DOI: https://doi.org/10.1136/gutjnl-2023-330971
PMID: https://pubmed.ncbi.nlm.nih.gov/38290832
Publication Date: 2024-01-30
Early-life diet and risk of inflammatory bowel disease: a pooled study in two Scandinavian birth cohorts
- Additional supplemental material is published online only. To view, please visit the journal online (http://dx.doi.org/ 10.1136/gutjnl-2023-330971).
Annie Guo, Department of Pediatrics, University of Gothenburg, Gothenburg 405 30, Sweden; annie.guo@gu.se
Accepted 23 December 2023
© Author(s) (or their employer(s)) 2024. Re-use permitted under CC BY-NC. No commercial re-use. See rights and permissions. Published by BMJ.
gutjnl-2023-330971
Abstract
Objective We assessed whether early-life diet quality and food intake frequencies were associated with subsequent IBD. Design Prospectively recorded 1-year and 3-year questionnaires in children from the All Babies in Southeast Sweden and The Norwegian Mother, Father and Child Cohort Study were used to assess diet quality using a Healthy Eating Index and intake frequency of food groups. IBD was defined as >2 diagnoses in national patient registers. Cox regression yielded HRs adjusted (aHRs) for child’s sex, parental IBD, origin, education level and maternal comorbidities. Cohortspecific results were pooled using a random-effects model. Results During 1304433 person-years of follow-up, we followed 81280 participants from birth through childhood and adolescence, whereof 307 were diagnosed with IBD. Compared with low diet quality, medium and high diet quality at 1 year of age were associated with a reduced risk of IBD (pooled aHR 0.75 (
INTRODUCTION
WHAT IS ALREADY KNOWN ON THIS TOPIC
WHAT THIS STUDY ADDS
HOW THIS STUDY MIGHT AFFECT RESEARCH, PRACTICE OR POLICY
tolerance,
MATERIALS AND METHODS
Study population
Early-life diet
child’s food intake level was within each cohort modelled as a trichotomous exposure variable. A more detailed description is provided in the online supplemental file 1.
indicating a higher dietary quality, was divided into thirds representing low, medium and high diet quality.
Inflammatory bowel disease
Other data
Statistical analyses
using a random-effects model.
Post hoc analyses
Patient and public involvement
RESULTS
Diet quality
| Characteristics | ABIS (
|
MoBa (
|
||||
| Diet quality at 1 year of age | Diet quality at 1 year of age | |||||
| Low (
|
Medium (
|
High (
|
Low (
|
Medium (
|
High (
|
|
| IBD* | 37 (0.8) | 25 (0.7) | 14 (0.5) | 91 (0.4) | 75 (0.3) | 65 (0.3) |
| CD | 18 (0.4) | 8 (0.2) | 3 (0.1) | 35 (0.2) | 36 (0.1) | 31 (0.1) |
| UC | 14 (0.3) | 13 (0.4) | 8 (0.3) | 24 (0.1) | 21 (0.1) | 17 (0.1) |
| Child’s sex | ||||||
| Girls | 2213 (48.6) | 1617 (47.0) | 1460 (48.2) | 10242 (47.9) | 13086 (49.1) | 11012 (49.5) |
| Boys | 2336 (51.4) | 1820 (53.0) | 1567 (51.8) | 11147 (52.1) | 13551 (50.9) | 11229 (50.5) |
| Follow-up (years) | ||||||
| Mean (SD) | 21.2 (1.0) | 21.7 (0.8) | 21.3 (0.9) | 15.6 (1.9) | 15.2 (2.0) | 14.9 (1.9) |
| Median (IQR) | 21.3 (20.9-21.6) | 21.4 (20.9-21.7) | 21.4 (21.0-21.8) | 15.7 (14.7-16.8) | 15.2 (14.2-16.2) | 14.7 (13.7-15.6) |
| Parental origin
|
||||||
| Sweden/Norway | 3958 (87.0) | 3089 (89.9) | 2695 (89.0) | 20232 (94.6) | 25105 (94.2) | 20783 (93.4) |
| Missing data | 98 (2.2) | 76 (2.2) | 66 (2.2) | 187 (0.9) | 212 (0.8) | 187 (0.8) |
| Maternal education level (years)
|
||||||
|
|
393 (8.6) | 222 (6.5) | 174 (5.7) | 1710 (8.0) | 1554 (5.8) | 969 (4.4) |
| 12 | 2509 (55.2) | 1879 (54.7) | 1583 (52.3) | 6976 (32.6) | 7069 (26.5) | 5147 (23.1) |
|
|
1543 (33.9) | 1255 (36.5) | 1208 (39.9) | 12437 (58.1) | 17686 (66.4) | 15861 (71.3) |
| Missing data | 104 (2.3) | 81 (2.4) | 62 (2.0) | 266 (1.2) | 328 (1.2) | 264 (1.2) |
| Paternal education level (years)
|
||||||
|
|
629 (13.8) | 392 (11.4) | 377 (12.5) | 2560 (12.0) | 2355 (8.8) | 1539 (6.9) |
| 12 | 2658 (58.4) | 2047 (59.6) | 1685 (55.7) | 9075 (42.4) | 10046 (37.7) | 7527 (33.8) |
|
|
1106 (24.3) | 867 (25.2) | 863 (28.5) | 8946 (41.8) | 13265 (49.8) | 12351 (55.5) |
| Missing data | 156 (3.4) | 131 (3.8) | 102 (3.4) | 808 (3.8) | 971 (3.6) | 824 (3.7) |
| Parental IBD§ | ||||||
| Yes | 59 (1.3) | 51 (1.5) | 31 (1.0) | 532 (2.5) | 641 (2.4) | 537 (2.4) |
| Maternal comorbidities
|
||||||
| Yes | 140 (3.1) | 123 (3.6) | 122 (4.0) | 877 (4.1) | 1092 (4.1) | 884 (4.0) |
| Maternal smoking in pregnancy | ||||||
| Yes | 473 (10.4) | 300 (8.7) | 236 (7.8) | 2218 (10.4) | 1992 (7.5) | 1307 (5.9) |
| Missing | 103 (2.3) | 79 (2.3) | 65 (2.1) | 264 (1.2) | 311 (1.2) | 292 (1.3) |
| Maternal age at delivery (years)** | ||||||
| <25 | 735 (16.1) | 462 (13.4) | 358 (11.8) | 2514 (11.7) | 2458 (9.2) | 1667 (7.5) |
| 25-34 | 3221 (70.6) | 2525 (73.5) | 2171 (71.7) | 15384 (71.9) | 19330 (72.5) | 16349 (73.5) |
| 35-44 | 528 (11.6) | 377 (10.9) | 453 (15.0) | 3485 (16.3) | 4837 (18.2) | 4208 (18.9) |
| Missing data | 75 (1.6) | 73 (2.1) | 45 (1.5) | 6 (0.0) | 12 (0.0) | 17 (0.1) |
| Delivery mode | ||||||
| Vaginal | 3694 (81.2) | 2756 (80.2) | 2455 (81.1) | 18284 (85.5) | 22779 (85.5) | 18926 (85.1) |
| Caesarean | 515 (11.3) | 404 (11.8) | 321 (10.6) | 3105 (14.5) | 3858 (14.5) | 3315 (14.9) |
| Missing data | 340 (7.5) | 277 (8.1) | 251 (8.3) | 0 (0.0) | 0 (0.0) | 0 (0.0) |
| Birth weight (g)
|
||||||
| Mean (SD) | 3571 (554) | 3592 (2) | 3580 (533) | 3596 (578) | 3577 (576) | 3540 (580) |
| Missing data | 49 (1.1) | 35 (1.0) | 26 (0.9) | 6 (0.0) | 16 (0.1) | 17 (0.1) |
| Gestational age (weeks)
|
||||||
| Mean (SD) | 39.7 (1.8) | 39.7 (1.7) | 39.8 (1.7) | 39.4 (1.8) | 39.4 (1.9) | 39.4 (1.9) |
| Missing data | 85 (1.9) | 56 (1.6) | 53 (1.8) | 84 (0.4) | 118 (0.4) | 87 (0.4) |
| Full breast feeding (months) | ||||||
| <4 | 1087 (23.9) | 845 (24.6) | 743 (24.5) | 8717 (40.8) | 10360 (38.9) | 8564 (38.5) |
| 4-6 | 1387 (30.5) | 1077 (31.3) | 938 (31.0) | 9424 (44.1) | 11711 (44.0) | 9426 (42.4) |
| >6 | 630 (13.8) | 456 (13.3) | 431 (14.2) | 2456 (11.5) | 3574 (13.4) | 3415 (15.4) |
| Missing data | 1445 (31.8) | 1059 (30.8) | 905 (30.2) | 792 (3.7) | 992 (3.7) | 836 (3.8) |
| Age at food introduction (months) | ||||||
| <4 | 2716 (59.7) | 1757 (51.1) | 1426 (47.1) | 1511 (7.1) | 1391 (5.2) | 829 (3.7) |
| 4-6 | 1810 (39.8) | 1675 (48.7) | 1600 (52.9) | 18543 (86.7) | 23580 (88.5) | 19979 (89.8) |
| >6 | 22 (0.5) | 5 (0.1) | 1 (0.0) | 543 (2.5) | 674 (2.5) | 597 (2.7) |
| ABIS (
|
MoBa (
|
|||||||||||||||
| Characteristics | Diet quality at 1 year of age | Diet quality at 1 year of age | ||||||||||||||
| Low (
|
Medium (
|
High (
|
Low (
|
Medium (
|
High (
|
|||||||||||
| Missing data | 1 (0.0) | 0 (0.0) | 0 (0.0) | 792 (3.7) | 992 (3.7) | 836 (3.8) | ||||||||||
|
||||||||||||||||
Food groups
to 0.89); high, 0.72 (
Subanalyses
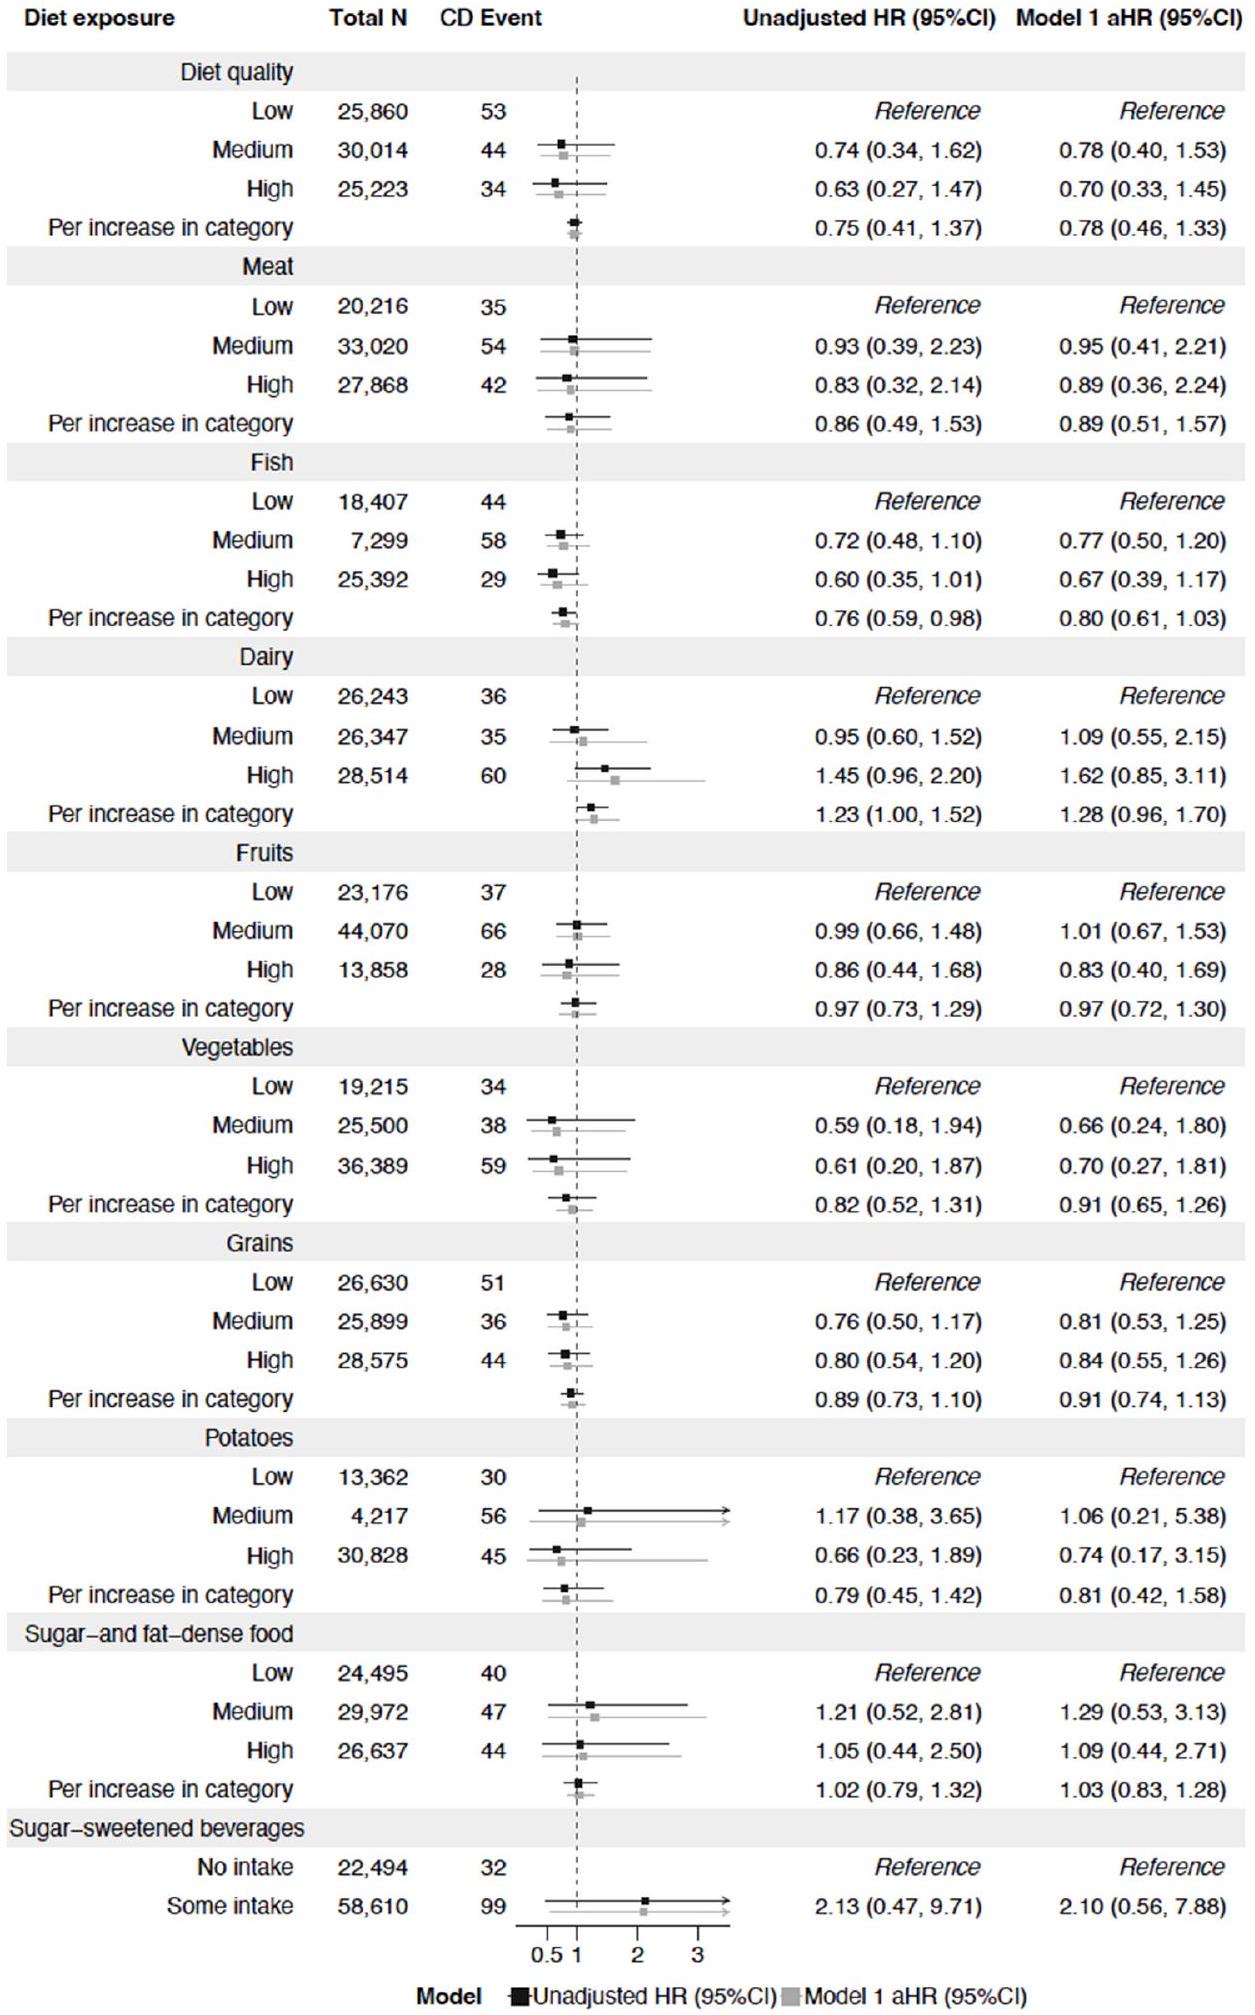
Post hoc analyses
| Diet exposure | Total N | IBD Event | Unadjusted HR (95%CI) | Model 1 aHR (95%CI) | ||
| Diet quality | ||||||
| Low | 25,935 | 128 | Reference | Reference | ||
| Medium | 30,069 | 99 | = | 0.74 (0.57, 0.97) | 0.75 (0.58, 0.98) | |
| High | 25,268 | 79 | – | 0.73 (0.55, 0.97) | 0.75 (0.56, 1.00) | |
| Per increase in category | 0.84 (0.73, 0.97) | 0.86 (0.74, 0.99) | ||||
| Meat | ||||||
| Low | 20,276 | 95 | Reference | Reference | ||
| Medium | 33,074 | 108 | -1.1 | 0.76 (0.58, 1.00) | 0.78 (0.59, 1.04) | |
| High | 27,930 | 104 | – | 0.89 (0.67, 1.19) | 0.94 (0.70, 1.27) | |
| Per increase in category |
|
0.95 (0.82, 1.11) | 0.99 (0.85, 1.15) | |||
| Fish | ||||||
| Low | 18,464 | 101 | Reference | Reference | ||
| Medium | 37,382 | 135 | – | 0.79 (0.60, 1.03) | 0.82 (0.62, 1.08) | |
| High | 25,434 | 71 |
|
0.66 (0.46, 0.93) | 0.70 (0.49, 1.00) | |
| Per increase in category | * | 0.82 (0.70, 0.97) | 0.85 (0.71, 1.00) | |||
| Dairy | ||||||
| Low | 26,302 | 95 | Reference | Reference | ||
| Medium | 26,402 | 90 |
|
0.93 (0.70, 1.24) | 0.99 (0.74, 1.32) | |
| High | 28,576 | 122 | |
1.12 (0.86, 1.47) | 1.16 (0.89, 1.53) | |
| Per increase in category | 1.07 (0.93, 1.22) | 1.08 (0.94, 1.25) | ||||
| Fruits | ||||||
| Low | 23,230 | 91 | Reference | Reference | ||
| Medium | 44,147 | 143 |
|
0.92 (0.58, 1.47) | 0.99 (0.53, 1.85) | |
| High | 13,903 | 73 | |
0.94 (0.53, 1.66) | 0.96 (0.48, 1.92) | |
| Per increase in category | 0.98 (0.70, 1.38) | 1.00 (0.68, 1.48) | ||||
| Vegetables | ||||||
| Low | 19,270 | 89 | Reference | Reference | ||
| Medium | 25,543 | 81 | = | 0.66 (0.49, 0.89) | 0.68 (0.50, 0.93) | |
| High | 36,467 | 137 | |
0.72 (0.55, 0.95) | 0.77 (0.58, 1.03) | |
| Per increase in category | |
0.85 (0.74, 0.98) | 0.88 (0.76, 1.02) | |||
| Grains | ||||||
| Low | 26,695 | 116 | Reference | Reference | ||
| Medium | 25,943 | 80 | – | 0.79 (0.54, 1.17) | 0.80 (0.56, 1.15) | |
| High | 28,642 | 111 | |
0.91 (0.63, 1.32) | 0.94 (0.67, 1.32) | |
| Per increase in category | 7 | 0.94 (0.82, 1.08) | 0.96 (0.84, 1.11) | |||
| Potatoes | ||||||
| Low | 13,401 | 69 | Reference | Reference | ||
| Medium | 36,990 | 132 | |
1.16 (0.78, 1.74) | 1.19 (0.78, 1.83) | |
| High | 30,889 | 106 |
|
0.80 (0.57, 1.12) | 0.84 (0.59, 1.20) | |
| Per increase in category |
|
0.88 (0.75, 1.02) | 0.89 (0.76, 1.05) | |||
| Sugar-and fat-dense food | ||||||
| Low | 24,543 | 88 | Reference | Reference | ||
| Medium | 30,044 | 119 | |
1.19 (0.90, 1.57) | 1.19 (0.89, 1.58) | |
| High | 26,693 | 100 | |
1.05 (0.78, 1.41) | 1.05 (0.78, 1.41) | |
| Per increase in category | 1.03 (0.89, 1.18) | 1.03 (0.89, 1.19) | ||||
| Sugar-sweetened beverages | ||||||
| No intake | 22,550 | 88 | Reference | Reference | ||
| Some intake | 58,730 | 219 | |
1.46 (0.94, 2.27) | 1.42 (1.05, 1.90) | |
| Model | Unadjusted HR (95%CI) | Model 1 aHR (95%CI) | ||||
DISCUSSION
at 3 years of age, only fish intake was associated with later IBD, particularly UC.
high adherence to a modified Mediterranean diet was associated with a lower risk of CD, but not UC.
| Diet exposure | Total N | UC Event | Unadjusted HR (95%CI) | Model 1 aHR (95%CI) | ||||||||||
| Diet quality | ||||||||||||||
| Low | 25,845 | 38 | Reference | Reference | ||||||||||
| Medium | 30,003 | 33 | |
0.89 (0.56, 1.42) | 0.92 (0.57, 1.48) | |||||||||
| High | 25,214 | 25 | |
0.83 (0.50, 1.38) | 0.89 (0.54, 1.50) | |||||||||
| Per increase in category | |
0.91 (0.71, 1.18) | 0.95 (0.73, 1.23) | |||||||||||
| Meat | ||||||||||||||
|
20,215 | 34 |
|
|||||||||||
| 32,998 | 32 | |||||||||||||
|
27,857 | 31 | ||||||||||||
|
||||||||||||||
| Fish | ||||||||||||||
|
18,404 | 41 | Reference | Reference | ||||||||||
| 33,712 | 38 | |
0.65 (0.36, 1.15) | 0.68 (0.38, 1.21) | ||||||||||
| High | 25,381 | 18 | |
0.46 (0.22, 1.00) | 0.46 (0.21, 0.99) | |||||||||
| Per increase in category | |
0.72 (0.53, 0.97) | 0.73 (0.53, 0.98) | |||||||||||
| Dairy | ||||||||||||||
|
26,241 | 34 | Reference | Reference | ||||||||||
| 26,344 | 32 | |
0.92 (0.57, 1.50) | 1.00 (0.61, 1.63) | ||||||||||
| High | 28,485 | |
0.79 (0.48, 1.28) | 0.85 (0.52, 1.40) | ||||||||||
| Per increase in category | – | 0.89 (0.70, 1.13) | 0.92 (0.72, 1.18) | |||||||||||
| Fruits | ||||||||||||||
| Low | 23,165 | 26 | Reference | Reference | ||||||||||
| Medium | 44,044 | 40 |
|
0.87 (0.53, 1.43) | 0.97 (0.58, 1.64) | |||||||||
| High | 13,861 | 31 | |
1.09 (0.49, 2.42) | 1.24 (0.55, 2.81) | |||||||||
| Per increase in category | |
0.99 (0.70, 1.38) | 1.07 (0.76, 1.51) | |||||||||||
| Vegetables | ||||||||||||||
| Low | 19,209 | Reference | Reference | |||||||||||
| Medium | 25,483 | |
0.70 (0.19, 2.62) | 0.73 (0.17, 3.10) | ||||||||||
| High | 36,378 | 48 | |
0.87 (0.24, 3.13) | 0.96 (0.24, 3.92) | |||||||||
| Per increase in category | – | 0.84 (0.64, 1.09) | 0.87 (0.66, 1.13) | |||||||||||
| Grains | ||||||||||||||
| Low | 22,877 | 33 | Reference | Reference | ||||||||||
| Medium | 25,887 | 24 | |
1.04 (0.28, 3.84) | 1.05 (0.28, 4.00) | |||||||||
| High | 28,571 | 40 | |
1.34 (0.37, 4.82) | 1.41 (0.38, 5.22) | |||||||||
| Per increase in category | |
1.13 (0.65, 1.96) | 1.16 (0.67, 1.99) | |||||||||||
| Potatoes | ||||||||||||||
| Low | 13,363 | 31 | Reference | Reference | ||||||||||
| Medium | 36,896 | 38 | |
1.00 (0.45, 2.19) | 0.97 (0.48, 1.95) | |||||||||
| High | 30,811 | 28 | – | |
0.52 (0.25, 1.09) | 0.54 (0.29, 1.03) | ||||||||
| Per increase in category | |
0.75 (0.57, 0.97) | ||||||||||||
| Sugar-and fat-dense food | ||||||||||||||
| Low | 24,487 | 32 | Reference | Reference | ||||||||||
| Medium | 29,959 | 34 | |
|
0.99 (0.60, 1.63) | |||||||||
| High | 26,624 | 31 |
|
0.98 (0.59, 1.63) | 0.92 (0.55, 1.53) | |||||||||
| Per increase in category | – | 1.00 (0.77, 1.28) | 0.97 (0.75, 1.24) | |||||||||||
| Sugar-sweetened beverages | ||||||||||||||
|
22,500 | 38 |
|
Reference | ||||||||||
| 58,570 | |
0.92 (0.25, 3.26) | ||||||||||||
|
||||||||||||||
of a single diet component. Moreover, a type 2 error might be introduced for analyses of CD and UC, related to fewer events in those analyses and a higher risk of misclassification between subtypes.
more times a week in children
Strengths and limitations
CONCLUSION
Author affiliations
Contributors AG-conception and design of the study, statistical analysis and data interpretation, drafting and revision of the article and final approval. ALB, SK and MO -data interpretation, revision of the article and final approval. KS and JL-study concept, data interpretation, revision of the article and final approval. KM—responisble for data integrity, obtained funding, study concept, data interpretation, guarantor, revision of the article and final approval.
Funding The All Babies in Southeast Sweden Study is supported by Barndiabetesfonden (Swedish Child Diabetes Foundation; grant/award number: 0000); Swedish Council for Working Life and Social Research (grant/award numbers: FAS2004-1775, FAS2004-1775); Swedish Research Council (grant/award numbers: K2005-72X-11242-11A and K2008-69X-20826-01-4, K2008-69X-20826-01-4); Medical Research Council of Southeast Sweden (FORSS; grant/award number: 0000); JDRF Wallenberg Foundation (grant/award number: K 98-99D-1281301A); ALF and LFoU grants from Region Östergötland and Linköping University, Sweden (grant/award number: 0000); and Joanna Cocozza Foundation (grant/ award number: 0000). The Norwegian Mother, Father and Child Cohort Study is supported by the Norwegian Ministry of Health and Care Services and the Ministry of Education and Research. KM has received funding from the Swedish Society for Medical Research (S20-0007), the Swedish Research Council (2020-01980) and ALF (ALFGBG-915661). AG received grants from the Swedish Society for Medical
Competing interests None declared.
Patient consent for publication Not required.
Provenance and peer review Not commissioned; externally peer reviewed.
Data availability statement Data are available upon reasonable request. The data collected for this article will be shared on reasonable request to the study’s principal investigator, Karl Mårild (karlmarild@gmail.com).
Supplemental material This content has been supplied by the author(s). It has not been vetted by BMJ Publishing Group Limited (BMJ) and may not have been peer-reviewed. Any opinions or recommendations discussed are solely those of the author(s) and are not endorsed by BMJ. BMJ disclaims all liability and responsibility arising from any reliance placed on the content. Where the content includes any translated material, BMJ does not warrant the accuracy and reliability of the translations (including but not limited to local regulations, clinical guidelines, terminology, drug names and drug dosages), and is not responsible for any error and/or omissions arising from translation and adaptation or otherwise.
Open access This is an open access article distributed in accordance with the Creative Commons Attribution Non Commercial (CC BY-NC 4.0) license, which permits others to distribute, remix, adapt, build upon this work non-commercially, and license their derivative works on different terms, provided the original work is properly cited, appropriate credit is given, any changes made indicated, and the use is non-commercial. See: http://creativecommons.org/licenses/by-nc/4.0/.
ORCID iDs
Johnny Ludvigsson http://orcid.org/0000-0003-1695-5234
Anne Lise Brantsæter http://orcid.org/0000-0001-6315-7134
Sofia Klingberg http://orcid.org/0000-0002-9093-2826
Malin Östensson http://orcid.org/0000-0002-8184-9609
Ketil Størdal http://orcid.org/0000-0001-7826-8646
Karl Mårild http://orcid.org/0000-0003-2285-8713
REFERENCES
2 Racine A, Carbonnel F, Chan SSM, et al. Dietary patterns and risk of inflammatory bowel disease in Europe: results from the EPIC study. Inflamm Bowel Dis 2016;22:345-54.
3 Ananthakrishnan AN, Khalili H, Konijeti GG, et al. Long-term intake of dietary fat and risk of ulcerative colitis and Crohn’s disease. Gut 2014;63:776-84.
4 Dong C, Chan SSM, Jantchou P, et al. Meat intake is associated with a higher risk of ulcerative colitis in a large European prospective cohort study. J Crohns Colitis 2022;16:1187-96.
5 Milajerdi A, Ebrahimi-Daryani N, Dieleman LA, et al. Association of dietary fiber, fruit, and vegetable consumption with risk of inflammatory bowel disease: a systematic review and meta-analysis. Adv Nutr 2021;12:735-43.
6 Li F, Liu X, Wang W, et al. Consumption of vegetables and fruit and the risk of inflammatory bowel disease: a meta-analysis. Eur I Gastroenterol Hepatol 2015;27:623-30.
7 Mozaffari H, Daneshzad E, Larijani B, et al. Dietary intake of fish, N-3 polyunsaturated fatty acids, and risk of inflammatory bowel disease: a systematic review and metaanalysis of observational studies. Eur J Nutr 2020;59:1-17.
8 Peters V, Bolte L, Schuttert EM, et al. Western and carnivorous dietary patterns are associated with greater likelihood of IBD development in a large prospective population-based cohort. J Crohns Colitis 2022;16:931-9.
10 Jakobsen C, Paerregaard A, Munkholm P, et al. Environmental factors and risk of developing paediatric inflammatory bowel disease — a population based study 20072009. J Crohns Colitis 2013;7:79-88.
12 Magnus P, Birke C, Vejrup K, et al. Cohort profile update: the Norwegian mother and child cohort study (MoBa). Int I Epidemiol 2016;45:382-8.
13 Agnihotri N, Øverby NC, Bere E, et al. Childhood adherence to a potentially healthy and sustainable Nordic diet and later overweight: the Norwegian mother, father and child cohort study (Moba). Matern Child Nutr 2021;17:e13101.
14 Källén B, Källén K, Otterblad Olausson P. The Swedish medical birth register A summary of content and quality. Research report from Epc. n.d. Available: https:// www.socialstyrelsen.se/globalassets/sharepoint-dokument/artikelkatalog/ovrigt/2003-112-3_20031123.pdf
15 Ludvigsson JF, Almqvist C, Bonamy A-KE, et al. Registers of the Swedish total population and their use in medical research. Eur J Epidemiol 2016;31:125-36.
16 Ludvigsson JF, Otterblad-Olausson P, Pettersson BU, et al. The Swedish personal identity number: possibilities and pitfalls in Healthcare and medical research. Eur 1 Epidemiol 2009;24:659-67.
17 Bakken IJ, Ariansen AMS, Knudsen GP, et al. The Norwegian patient Registry and the Norwegian Registry for primary health care: research potential of two nationwide health-care registries. Scand J Public Health 2020;48:49-55.
18 Irgens LM. The medical birth Registry of Norway. Epidemiological research and surveillance throughout 30 years. Acta Obstet Gynecol Scand 2000;79:435-9.
19 Huus K, Brekke HK, Ludvigsson JF, et al. Relationship of food frequencies as reported by parents to overweight and obesity at 5 years. Acta Paediatr 2009;98:139-43.
20 Jacka FN, Ystrom E, Brantsaeter AL, et al. Maternal and early postnatal nutrition and mental health of offspring by age 5 years: a prospective cohort study. J Am Acad Child Adolesc Psychiatry 2013;52:1038-47.
21 Kindgren E, Fredrikson M, Ludvigsson J. Early feeding and risk of juvenile idiopathic arthritis: a case control study in a prospective birth cohort. Pediatr Rheumatol Online J 2017;15:46.
22 Sørensen LMN, Aamodt G, Brantsæter AL, et al. Diet quality of Norwegian children at 3 and 7 years: changes, predictors and longitudinal association with weight. Int J Obes (Lond) 2022;46:10-20.
23 Vejrup K, Agnihotri N, Bere E, et al. Adherence to a healthy and potentially sustainable Nordic diet is associated with child development in the Norwegian mother, father and child cohort study (MoBa). Nutr I 2022;21:46.
24 Agnihotri N, Rudjord Hillesund E, Bere E, et al. Development and description of new Nordic diet scores across infancy and childhood in the Norwegian mother, father and child cohort study (MoBa). Matern Child Nutr 2021;17:e13150.
25 Cade J, Thompson R, Burley V, et al. Development, validation and utilisation of foodfrequency questionnaires – a review. Public Health Nutr 2002;5:567-87.
26 Vilela S, Oliveira A, Ramos E, et al. Association between energy-dense food consumption at 2 years of age and diet quality at 4 years of age. Br J Nutr 2014;111:1275-82.
27 World Health Organization, Regional Office for Europe. Food and nutrition policy for schools: a tool for the development of school nutrition programmes in the European Region. Copenhagen: WHO Regional Office for Europe, 2006. Available: https://apps. who.int/iris/handle/10665/107797
28 Strisciuglio C, Giugliano F, Martinelli M, et al. Impact of environmental and familial factors in a cohort of pediatric patients with inflammatory bowel disease. J Pediatr Gastroenterol Nutr 2017;64:569-74.
29 Ludvigsson JF, Andersson E, Ekbom A, et al. External review and validation of the Swedish National inpatient register. BMC Public Health 2011;11:450.
30 Mouratidou N, Malmborg P, Järås J, et al. Identification of childhood-onset inflammatory bowel disease in Swedish Healthcare registers: a validation study. Clin Epidemiol 2022;14:591-600.
31 Östensson M, Björkqvist O, Guo A, et al. Epidemiology, validation, and clinical characteristics of inflammatory bowel disease: the ABIS birth cohort study. BMC Gastroenterol 2023;23:199.
32 Xu F, Dahlhamer JM, Zammitti EP, et al. Health-risk behaviors and chronic conditions among adults with inflammatory bowel disease – United States, 2015 and 2016. MMWR Morb Mortal Wkly Rep 2018;67:190-5.
33 Schoenfeld D. Partial residuals for the proportional hazards regression model. Biometrika 1982;69:239-41.
34 DerSimonian R, Laird N. Meta-analysis in clinical trials. Control Clin Trials 1986;7:177-88.
35 Kelsen JR, Sullivan KE, Rabizadeh S, et al. North American society for pediatric Gastroenterology, Hepatology, and nutrition position paper on the evaluation and management for patients with very early-onset inflammatory bowel disease. J Pediatr Gastroenterol Nutr 2020;70:389-403.
36 Rothman KJ. No adjustments are needed for multiple comparisons. Epidemiology 1990;1:43-6.
38 Khalili H, Håkansson N, Chan SS, et al. Adherence to a mediterranean diet is associated with a lower risk of later-onset Crohn’s disease: results from two large prospective cohort studies. Gut 2020;69:1637-44.
39 Amre DK, D’Souza S, Morgan K, et al. Imbalances in dietary consumption of fatty acids, vegetables, and fruits are associated with risk for Crohn’s disease in children. Am J Gastroenterol 2007;102:2016-25.
40 Ananthakrishnan AN, Khalili H, Higuchi LM, et al. Higher predicted vitamin D status is associated with reduced risk of Crohn’s disease. Gastroenterology 2012;142:482-9.
41 Issa M, Saeian K. Diet in inflammatory bowel disease. Nutr Clin Pract 2011;26:151-4.
42 Piovani D, Danese S, Peyrin-Biroulet L, et al. Environmental risk factors for inflammatory bowel diseases: an umbrella review of meta-analyses. Gastroenterology 2019;157:647-59.
43 Zhernakova A, Kurilshikov A, Bonder MJ, et al. Population-based metagenomics analysis reveals markers for gut microbiome composition and diversity. Science 2016;352:565-9.
44 Khan S, Waliullah S, Godfrey V, et al. Dietary simple sugars alter microbial ecology in the gut and promote colitis in mice. Sci Transl Med 2020;12:eaay6218.
46 Khalili H, Hakansson N, Chan SS, et al. No association between consumption of sweetened Beverages and risk of later-onset Crohn’s disease or ulcerative colitis. Clin Gastroenterol Hepatol 2019;17:123-9.
47 Stewart CJ, Ajami NJ, O’Brien JL, et al. Temporal development of the gut microbiome in early childhood from the TEDDY study. Nature 2018;562:583-8.
48 Laue HE, Coker MO, Madan JC. The developing Microbiome from birth to 3 years: the gut-brain axis and neurodevelopmental outcomes. Front Pediatr 2022;10:815885.
49 Larsen JH, Anderson S, Perminow G, et al. Higher incidence of childhood-onset inflammatory bowel disease by increasing latitude in Norway, but stable incidence by age for cohorts born 2004-2012 [Manuscript submitted for publication]. 2023.
50 loannidis JPA. Implausible results in human nutrition research. BMJ 2013;347:f6698.
51 Nilsen RM, Vollset SE, Gjessing HK, et al. Self-selection and bias in a large prospective pregnancy cohort in Norway. Paediatr Perinat Epidemiol 2009;23:597-608.
52 Mårild K, Tapia G, Midttun Ø, et al. Smoking in pregnancy, cord blood cotinine and risk of celiac disease diagnosis in offspring. Eur J Epidemiol 2019;34:637-49.