DOI: https://doi.org/10.15585/mmwr.ss7402a1
PMID: https://pubmed.ncbi.nlm.nih.gov/40232988
تاريخ النشر: 2025-04-15
انتشار والتعرف المبكر على اضطراب طيف التوحد بين الأطفال الذين تتراوح أعمارهم بين 4 و 8 سنوات – شبكة مراقبة التوحد والإعاقات التنموية، 16 موقعًا، الولايات المتحدة، 2022
المحتويات
طرق ….. 3
النتائج ….. 5
المناقشة ….. 9
القيود ….. 14
الاتجاهات المستقبلية ….. 14
الخاتمة ….. 14
المراجع ….. 15
الاستشهاد المقترح: [أسماء المؤلفين؛ الثلاثة الأوائل، ثم وآخرون، إذا كان العدد أكثر من ستة.] [العنوان]. ملخصات مراقبة MMWR 2025;74(SS-#):[أرقام الصفحات الشاملة].
مراكز السيطرة على الأمراض والوقاية منها
سوزان موناrez، دكتوراه، المديرة المؤقتة
ديبرا هوري، دكتور في الطب، ماجستير في الصحة العامة، كبير المسؤولين الطبيين ونائب المدير للبرامج والعلوم
صموئيل ف. بوزنر، دكتوراه، مدير مكتب العلوم
فريق التحرير والإنتاج في MMWR (السلاسل)
ليزلي هاملين، لوري جونسون،
أخصائيو الاتصال الصحي
ويل يانغ، ماجستير
أخصائي المعلومات البصرية
مجلس تحرير MMWR
| تيموثي ف. جونز، دكتور في الطب، رئيس | باتريك ل. ريمينغتون، دكتور في الطب، ماجستير في الصحة العامة | ||
| ديفيد و. فليمنغ، دكتور في الطب | |||
| ويليام إي. هالبرين، دكتور في الطب، دكتور في الصحة العامة، ماجستير في الصحة العامة |
|
||
| جويل مولن، دكتور في الطب، ماجستير في الصحة العامة، ماجستير في الإدارة العامة | |||
| جيف نيدر ديب، دكتوراه | مورغان بوب سوانسون، دكتور في الطب، دكتوراه | ||
| باتريشيا كوينليسكي، دكتور في الطب، ماجستير في الصحة العامة |
كارولين بروكس، دكتوراه في العلوم، ماجستير
الدكتورة فيرجينيا أ. كين
جوناثان إي. فيلدينغ، دكتور في الطب، ماجستير في الصحة العامة، ماجستير في إدارة الأعمال
انتشار والتعرف المبكر على اضطراب طيف التوحد بين الأطفال الذين تتراوح أعمارهم بين 4 و 8 سنوات – شبكة مراقبة التوحد والإعاقات التنموية، 16 موقعًا، الولايات المتحدة، 2022
الملخص
المشكلة/الحالة: اضطراب طيف التوحد (ASD). الفترة المغطاة: 2022. وصف النظام: شبكة مراقبة التوحد والإعاقات التنموية هي برنامج مراقبة نشط يقدر انتشار وخصائص ASD ويراقب توقيت تحديد ASD بين الأطفال الذين تتراوح أعمارهم بين 4 و 8 سنوات. في عام 2022، أجرت 16 موقعًا (تقع في أريزونا، وأركنساس، وكاليفورنيا، وجورجيا، وإنديانا، وماريلاند، ومينيسوتا، وميسوري، ونيو جيرسي، وبنسلفانيا، وبورتو ريكو، وتينيسي، وتكساس [موقعان: أوستن ولاريدو]، ويوتا، وويسكونسن) مراقبة لـ ASD بين الأطفال الذين تتراوح أعمارهم بين 4 و 8 سنوات واشتبه في إصابتهم بـ ASD بين الأطفال الذين تبلغ أعمارهم 4 سنوات. شملت المراقبة الأطفال الذين عاشوا في منطقة المراقبة في أي وقت خلال عام 2022. تم تصنيف الأطفال على أنهم مصابون بـ ASD إذا كانوا قد حصلوا على 1) بيان تشخيص ASD في تقييم تنموي شامل، 2) أهلية التعليم الخاص بالتوحد، أو 3) رمز تصنيف الأمراض الدولي، الإصدار التاسع (ICD-9) في نطاق 299 أو رمز تصنيف الأمراض الدولي، الإصدار العاشر (ICD-10) من F84.0، F84.3، F84.5، F84.8، أو F84.9. تم تصنيف الأطفال الذين تبلغ أعمارهم 4 سنوات على أنهم يشتبه في إصابتهم بـ ASD إذا لم يستوفوا تعريف الحالة لـ ASD ولكن كان هناك شك من المُقيّم بشأن ASD موثق في تقييم تنموي شامل. النتائج: بين الأطفال الذين تبلغ أعمارهم 8 سنوات في عام 2022، كان انتشار ASD 32.2 لكل 1,000 طفل (واحد من 31) عبر 16 موقعًا، تراوحت من 9.7 في تكساس (لاريدو) إلى 53.1 في كاليفورنيا. كانت تقديرات انتشار ASD الملاحظة العامة مشابهة للتقديرات المحسوبة باستخدام نماذج بايزيان الهرمية ونماذج التأثيرات العشوائية. كان ASD أكثر انتشارًا بمقدار 3.4 مرة بين الأولاد (49.2) مقارنة بالفتيات (14.3). بشكل عام، كان انتشار ASD أقل بين الأطفال البيض غير اللاتينيين (27.7) مقارنة بالأطفال الآسيويين أو سكان جزر المحيط الهادئ (38.2)، والأمريكيين الأصليين أو سكان ألاسكا الأصليين (37.5)، والأفارقة الأمريكيين غير اللاتينيين (36.6)، واللاتينيين أو الهسبانيين (33.0)، والأطفال المتعددين الأعراق (31.9). لم يُلاحظ أي ارتباط بين انتشار ASD ومتوسط دخل الأسرة في الحي (MHI) في 11 موقعًا؛ كان انتشار ASD الأعلى مرتبطًا بانخفاض متوسط دخل الأسرة في الحي في خمسة مواقع. تم الانتهاء من تجميع السجلات لـ 15 من 16 موقعًا لـ 8,613 طفلًا يبلغون من العمر 8 سنوات الذين استوفوا تعريف حالة ASD. من بين هؤلاء 8,613 طفلًا،
من بين 5,292 (61.4% من 8,613) طفلًا يبلغون من العمر 8 سنوات مصابين باضطراب طيف التوحد ولديهم معلومات عن القدرة المعرفية،
كانت نسبة الإصابة التراكمية بتشخيص اضطراب طيف التوحد أو الأهلية بحلول سن 48 شهرًا أعلى بين الأطفال المولودين في عام 2018 (الذين تبلغ أعمارهم 4 سنوات في عام 2022) مقارنة بالأطفال المولودين في عام 2014 (الذين تبلغ أعمارهم 8 سنوات في عام 2022) في 13 من أصل 15 موقعًا كانت قادرة على استخراج السجلات. كانت نسبة الإصابة التراكمية العامة بتشخيص اضطراب طيف التوحد أو الأهلية بحلول سن 48 شهرًا أعلى بمقدار 1.7 مرة بين المولودين في عام 2018 مقارنة بالمولودين في عام 2014، وتراوحت من 1.4 مرة أعلى في أريزونا وجورجيا إلى 3.1 مرة أعلى في بورتو ريكو. بين الأطفال الذين تبلغ أعمارهم 4 سنوات، كان هناك طفل واحد يفي بتعريف حالة اضطراب طيف التوحد من بين كل 10 أطفال.
الأطفال الذين يعانون من اضطراب طيف التوحد والذين وُلِدوا في عام 2018 حصلوا على المزيد من التقييمات والتعرف عليهم خلال الأعمار
بشكل عام،
التفسير: كانت نسبة انتشار ASD بين الأطفال الذين تتراوح أعمارهم بين 8 سنوات أعلى في عام 2022 مقارنة بالسنوات السابقة. كانت نسبة انتشار ASD أعلى بين الأطفال من أصول آسيوية/جزر المحيط الهادئ، والسود، والأطفال من أصل إسباني الذين تتراوح أعمارهم بين 8 سنوات مقارنة بالأطفال البيض الذين تتراوح أعمارهم بين 8 سنوات، مما يستمر في نمط لوحظ لأول مرة في عام 2020. كان الأطفال من أصول آسيوية/جزر المحيط الهادئ، والسود، والأطفال من أصل إسباني الذين تتراوح أعمارهم بين 8 سنوات مع ASD أكثر احتمالًا من الأطفال البيض أو المتعددين الأعراق الذين يعانون من ASD أن يكون لديهم إعاقة عقلية متزامنة. كانت نسبة التعرف عند عمر 48 شهرًا أعلى بين الأطفال المولودين في عام 2018 مقارنة بالأطفال المولودين في عام 2014، مما يشير إلى زيادة التعرف المبكر بما يتماشى مع الأنماط التاريخية.
الإجراء الصحي العام: إن زيادة التعرف على التوحد، وخاصة بين الأطفال الصغار جدًا والمجموعات التي كانت تحت التعرف سابقًا، يبرز الطلب المتزايد والحاجة المستمرة للتخطيط المحسن لتوفير خدمات تشخيص وعلاج ودعم متكافئة لجميع الأطفال الذين يعانون من ASD. تشير التباينات الكبيرة في التعرف على ASD عبر المواقع إلى فرص لتحديد وتنفيذ استراتيجيات وممارسات ناجحة في المجتمعات لضمان وصول جميع الأطفال الذين يعانون من ASD إلى إمكاناتهم.
مقدمة
حالة اجتماعية اقتصادية أعلى (SES) (7). في عام 2020، لوحظت لأول مرة نسبة انتشار أعلى لـ ASD بين المجموعات التي كانت تاريخيًا غير مخدومة بما في ذلك الأطفال السود غير الإسبان والأطفال من أصل إسباني، ولم تكن هناك علاقة بين نسبة انتشار ASD وSES (المقاسة بواسطة الوسيط الدخل الأسري [MHI] tertile) في الغالبية العظمى من المواقع (6).
الطرق
مواقع وإجراءات المراقبة
تحديد الحالة وتعريف حالة المراقبة
(مثل Medicaid) إدارية بطبيعتها ولم يكن لديها سجلات فعلية أو إلكترونية مثل التقييمات التنموية المتاحة للمراجعة. كانت إنديانا لديها وصول فقط إلى بيانات فئة أهلية التعليم الخاص من مصدرها التعليمي ورموز ICD من مصدرها الطبي. لذلك، لم يتم تضمين إنديانا في التحليلات أو التصورات لعناصر تعريف حالة ASD لأن المعلومات حول بيانات تشخيص ASD لم تكن متاحة.
مصادر بيانات إضافية وتعريفات المتغيرات
بالنسبة للأطفال الذين لديهم فقط رمز ICD لم تكن متاحة). تم ربط الأطفال على مستوى مقطع التعداد بمؤشرات اجتماعية واقتصادية لمؤشر الصحة النفسية للحي من تقديرات ACS لمدة 5 سنوات لعام 2022 (14) ومؤشر الضعف الاجتماعي (SVI) من CDC (15).
طرق التحليل
النتائج
انتشار اضطراب طيف التوحد بين
الأطفال الذين تتراوح أعمارهم بين 8 سنوات
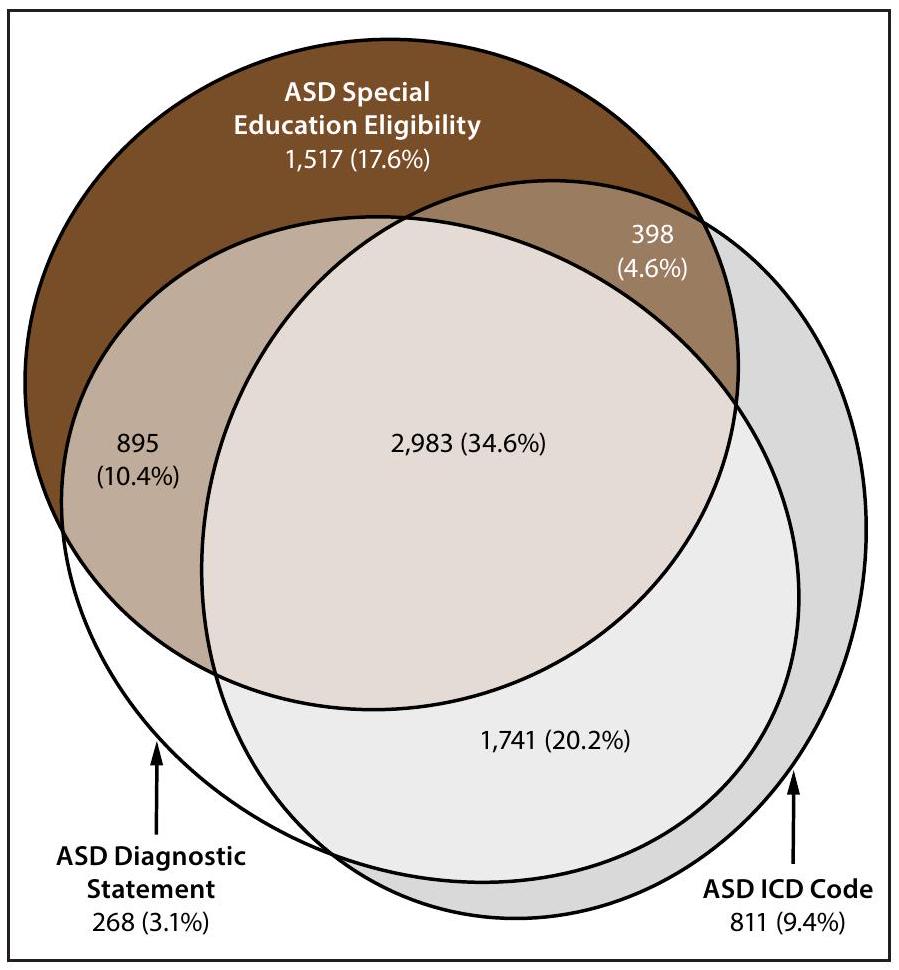
وجود بيانات تشخيص اضطراب طيف التوحد، أهلية التعليم الخاص، وأكواد التصنيف الدولي للأمراض بين الأطفال الذين تتراوح أعمارهم بين 8 سنوات
-
(شبكة ADDM لديها 16 موقعًا؛ إنديانا غير مشمولة لأن الموقع لم يكن لديه بيانات بيان تشخيص ASD متاحة من تجريد السجلات).
القدرة المعرفية لدى الأطفال المصابين باضطراب طيف التوحد الذين تتراوح أعمارهم بين 8 سنوات
العمر عند التقييم الأول وتشخيص اضطراب طيف التوحد بين الأطفال الذين تتراوح أعمارهم بين 8 سنوات
التعرف المبكر على اضطراب طيف التوحد لدى الأطفال الذين تتراوح أعمارهم بين 4 و 8 سنوات
التقييم والتحديد بعد بدء جائحة كوفيد-19
اختبار التوحد بين الأطفال الذين تتراوح أعمارهم بين 4 و 8 سنوات
كان لديهم اختبار ASD موثق في سجلاتهم (69.1%)، على الرغم من أن ترتيب الاختبارات حسب التكرار كان مختلفًا (الشكل التوضيحي 8،I’m sorry, but I cannot access external links or content from URLs. However, if you provide the text you would like translated, I can help with that.). كان الاختبار الأكثر شيوعًا للتوحد الموثق بين الأطفال الذين تتراوح أعمارهم بين 4 سنوات والذين يعانون من اضطراب طيف التوحد هو CARS (
نقاش
القيود
الاتجاهات المستقبلية
الخاتمة
كان لديهم انتشار أعلى لاضطراب طيف التوحد مقارنة بالأطفال في المجتمعات ذات الدخل المرتفع أو الضعف المنخفض. مع تزايد الأدلة على زيادة الوصول إلى التحديد بين المجموعات التي كانت تعاني من نقص الخدمات سابقًا، قد يتحول الانتباه إلى العوامل، مثل العوامل الاجتماعية والاقتصادية، التي قد تؤدي إلى معدلات أعلى من الإعاقة بين بعض السكان. وُجد أن معدل تحديد اضطراب طيف التوحد عند 48 شهرًا كان أعلى بين الأطفال المولودين في عام 2018 مقارنة بالأطفال المولودين في عام 2014. حصلت المجموعة المولودة في عام 2018 على مزيد من التقييمات وتحديد اضطراب طيف التوحد مقارنة بالمجموعة المولودة في عام 2014 خلال نفس فترة العمر؛ كان الاضطراب مرئيًا عند بدء جائحة COVID-19 في أوائل عام 2020 ولكن نمط التحديد الأعلى عاد بحلول نهاية عام 2020. قد تشير الزيادات المستمرة في الانتشار والتحسينات في التحديد المبكر لاضطراب طيف التوحد إلى الحاجة المتزايدة للخدمات. توجد فرص للتعلم من السياسات والأنظمة والممارسات الناجحة في مجتمعات مختلفة وتنفيذ أساليب للتحديد العادل أو أهلية الخدمة لمساعدة العائلات أو الأفراد على تلقي الدعم الذي يحتاجونه في أقرب وقت ممكن لتحسين النتائج للأطفال الذين يعانون من اضطراب طيف التوحد.
الشكر والتقدير
تعارض المصالح
References
- American Psychiatric Association. Diagnostic and statistical manual of mental disorders. 5th ed., text revision. Washington, DC: American Psychiatric Association; 2022.
- Hyman SL, Levy SE, Myers SM, et al.; Council on Children with Disabilities, Section on Developmental and Behavioral Pediatrics. Identification, evaluation, and management of children with autism spectrum disorder. Pediatrics 2020;145:e20193447. PMID:31843864 https://doi.org/10.1542/peds.2019-3447
- Lipkin PH, Macias MM, Norwood KW Jr, et al.; Council on Children with Disabilities, Section on Developmental and Behavioral Pediatrics. Promoting optimal development: identifying infants and young children with developmental disorders through developmental surveillance and screening. Pediatrics 2020;145:e20193449. PMID:31843861 https:// doi.org/10.1542/peds.2019-3449
- Zwaigenbaum L, Bauman ML, Choueiri R, et al. Early intervention for children with autism spectrum disorder under 3 years of age: recommendations for practice and research. Pediatrics 2015;136(Suppl 1):S60-81. PMID:26430170 https://doi.org/10.1542/ peds.2014-3667E
- Autism and Developmental Disabilities Monitoring Network Surveillance Year 2000 Principal Investigators; CDC. Prevalence of autism spectrum disorders-Autism and Developmental Disabilities Monitoring Network, six sites, United States, 2000. MMWR Surveill Summ 2007;56(No. SS-1):1-11. PMID:17287714
- Maenner MJ, Warren Z, Williams AR, et al. Prevalence and characteristics of autism spectrum disorder among children aged 8 years-Autism and Developmental Disabilities Monitoring Network, 11 sites, United States, 2020. MMWR Surveill Summ 2023;72(No. SS-2):1-14. PMID:36952288 https://doi.org/10.15585/mmwr.ss7202a1
- Durkin MS, Maenner MJ, Baio J, et al. Autism spectrum disorder among US children (2002-2010): socioeconomic, racial, and ethnic disparities. Am J Public Health 2017;107:1818-26. PMID:28933930 https://doi. org/10.2105/AJPH.2017.304032
- Christensen DL, Bilder DA, Zahorodny W, et al. Prevalence and characteristics of autism spectrum disorder among 4-year-old children in the Autism and Developmental Disabilities Monitoring Network. J Dev Behav Pediatr 2016;37:1-8. PMID:26651088 https://doi.org/10.1097/ DBP. 0000000000000235
- Shaw KA, Maenner MJ, Baio J, et al. Early identification of autism spectrum disorder among children aged 4 years-Early Autism and Developmental Disabilities Monitoring Network, six sites, United States, 2016. MMWR Surveill Summ 2020;69(No. SS-3):1-11. PMID:32214075 https://doi.org/10.15585/mmwr.ss6903a1
- Shaw KA, Maenner MJ, Bakian AV, et al. Early identification of autism spectrum disorder among children aged 4 years-Autism and Developmental Disabilities Monitoring Network, 11 sites, United States, 2018. MMWR Surveill Summ 2021;70(No. SS-10):1-14. PMID:34855727 https://doi.org/10.15585/mmwr.ss7010a1
- Shaw KA, Bilder DA, McArthur D, et al. Early identification of autism spectrum disorder among children aged 4 years-Autism and Developmental Disabilities Monitoring Network, 11 sites, United States, 2020. MMWR Surveill Summ 2023;72(No. SS-1):1-15. PMID:36952289 https://doi.org/10.15585/mmwr.ss7201a1
- Consolidation Appropriations Act, 2023, Pub. L. 117-328, 136 Stat. 4459 (Dec. 29, 2022).
- Maenner MJ, Shaw KA, Bakian AV, et al. Prevalence and characteristics of autism spectrum disorder among children aged 8 years-Autism and Developmental Disabilities Monitoring Network, 11 sites, United States, 2018. MMWR Surveill Summ 2021;70(No. SS-10):1-16. PMID:34855725 https://doi.org/10.15585/mmwr.ss7011a1
- US Census Bureau. American Community Survey index [Internet]. Suitland, MD: US Department of Commerce, US Census Bureau; 2022. https://www.census.gov/programs-surveys/acs/data.html
- CDC, Agency for Toxic Substances and Disease Registry. CDC/ATSDR SVI 2022 documentation. Atlanta, GA: US Department of Health and Human Services, CDC; 2024. https://atsdr.cdc.gov/place-health/php/ svi/svi-data-documentation-download.html
- US Census Bureau. QuickFacts: Puerto Rico. Suitland, MD: US Department of Commerce, US Census Bureau; 2024. https://www. census.gov/quickfacts/fact/table/PR/RHI725223#RHI725223
- Pierce K, Gazestani V, Bacon E, et al. Get SET Early to identify and treatment refer autism spectrum disorder at 1 year and discover factors that influence early diagnosis. J Pediatr 2021;236:179-88. PMID:33915154 https://doi.org/10.1016/j.jpeds.2021.04.041
- Commonwealth of Pennsylvania, Department of Human Services. Medicaid for children with special needs. Harrisburg, PA: Commonwealth of Pennsylvania, Department of Human Services; 2024. https://www. pa.gov/agencies/dhs/resources/medicaid/medicaid-children-special-needs-ph95.html
- Departamento de Salud. Autismo: Red para la Vigilancia de Autismo y Desórdenes del Desarrollo guías y manuales [Spanish]. San Juan, PR: Departamento de Salud; 2024. https://www.salud.pr.gov/CMS/242
- Maternal and Child Health Bureau. State application/annual report. Rockville, MD: US Department of Health and Human Services, Health Resources and Services, Maternal and Child Health Bureau; 2024. https://mchb.tvisdata.hrsa.gov/Home/StateApplicationOrAnnualReport
- Departamento de Salud. Pasaporte a la Salud. San Juan, PR: Departamento de Salud; 2023. https://www.salud.pr.gov/CMS/ DOWNLOAD/8184
- Patrick ME, Williams AR, Shaw KA, et al. Social vulnerability and the prevalence of autism spectrum disorder among 8 -year-old children, Autism and Developmental Disabilities Monitoring Network, 2020. Ann Epidemiol 2025;104:8-14. PMID:40024386 https://doi.org/10.1016/j. annepidem.2025.02.014
- QuickStats: percentage of children and adolescents aged 3-17 years who ever received a diagnosis of autism spectrum disorder, by family income, 2020-2022. MMWR Morb Mortal Wkly Rep 2024;73:358. PMID:38635498 https://doi.org/10.15585/mmwr.mm7315a5
- Roman-Urrestarazu A, van Kessel R, Allison C, Matthews FE, Brayne C, Baron-Cohen S. Association of race/ethnicity and social disadvantage with autism prevalence in 7 million school children in England. JAMA Pediatr 2021;175:e210054. PMID:33779707 https://doi.org/10.1001/ jamapediatrics.2021.0054
- Winter AS, Fountain C, Cheslack-Postava K, Bearman PS. The social patterning of autism diagnoses reversed in California between 1992 and 2018. Proc Natl Acad Sci U S A 2020;117:30295-302. PMID:33199592 https://doi.org/10.1073/pnas. 2015762117
- US Department of Health and Human Services, Office of Disease Prevention and Health Promotion. Healthy People 2030 social determinants of health. Washington DC: US Department of Health and Human Services; 2022. https://odphp.health.gov/healthypeople/ priority-areas/social-determinants-health
- Durkin MS, Yeargin-Allsopp M. Socioeconomic status and pediatric neurologic disorders: current evidence. Semin Pediatr Neurol 2018;27:16-25. PMID:30293586 https://doi.org/10.1016/j. spen.2018.03.003
- Patrick ME, Shaw KA, Dietz PM, et al. Prevalence of intellectual disability among eight-year-old children from selected communities in the United States, 2014. Disabil Health J 2021;14:101023. PMID:33272883 https://doi.org/10.1016/j.dhjo.2020.101023
- Rogers EE, Hintz SR. Early neurodevelopmental outcomes of extremely preterm infants. Semin Perinatol 2016;40:497-509. PMID:27865437 https://doi.org/10.1053/j.semperi.2016.09.002
- Barfield WD. Public health implications of very preterm birth. Clin Perinatol 2018;45:565-77. PMID:30144856 https://doi.org/10.1016/j. clp.2018.05.007
- Institute of Medicine (US) Committee on Understanding Premature Birth and Assuring Healthy Outcomes. Behrman RE, Butler AS, eds. Sociodemographic and community factors contributing to preterm birth [Chapter 4]. In: Preterm birth: causes, consequences, and prevention. Washington, DC: National Academies Press (US); 2007:124-47.
- Lorch SA, Enlow E. The role of social determinants in explaining racial/ ethnic disparities in perinatal outcomes. Pediatr Res 2016;79:141-7. PMID:26466077 https://doi.org/10.1038/pr.2015.199
- Martin JA, Osterman MJK. Shifts in the distribution of births by gestational age: United States, 2014-2022. Natl Vital Stat Rep 2024;73:1-11. PMID:38300755
- Johnson LW, Diaz I. Exploring the social determinants of health and health disparities in traumatic brain injury: a scoping review. Brain Sci 2023;13:707. PMID:37239178 https://doi.org/10.3390/ brainsci13050707
- Muller C, Sampson RJ, Winter AS. Environmental inequality: the social causes and consequences of lead exposure. Annu Rev Sociol 2018;44:263-82. https://doi.org/10.1146/annurev-soc-073117-041222
- Fuller EA, Oliver K, Vejnoska SF, Rogers SJ. The effects of the Early Start Denver Model for children with autism spectrum disorder: a meta-analysis. Brain Sci 2020;10:368. PMID:32545615 https://doi. org/10.3390/brainsci10060368
- Shaw KA, McArthur D, Hughes MM, et al. Progress and disparities in early identification of autism spectrum disorder: Autism and Developmental Disabilities Monitoring Network, 2002-2016. J Am Acad Child Adolesc Psychiatry 2022;61:905-14. PMID:34838692 https://doi.org/10.1016/j.jaac.2021.11.019
- American Academy of Pediatrics. National payer advocacy letter. Itasca, IL: American Academy of Pediatrics; 2024. https://downloads.aap.org/ AAP/PDF/AAP%20Autism%20Spectrum%20Disorder%20Payer%20 Advocacy%20Letter.pdf
- State of Georgia. Georgia Medicaid. TEFRA/Katie Beckett. Atlanta, GA: State of Georgia; 2022. https://medicaid.georgia.gov/programs/ all-programs/tefrakatie-beckett
- Pierce K, Gazestani VH, Bacon E, et al. Evaluation of the diagnostic stability of the early autism spectrum disorder phenotype in the general population starting at 12 months. JAMA Pediatr 2019;173:578-87. PMID:31034004 https://doi.org/10.1001/jamapediatrics.2019.0624
- Hughes MM, Pas ET, Durkin MS, et al. Health conditions, education services, and transition planning for adolescents with autism. Pediatrics 2024;153:e2023063672. PMID:38501189 https://doi.org/10.1542/ peds.2023-063672
- Shaw KA, Williams S, Hughes MM, et al. Statewide county-level autism spectrum disorder prevalence estimates-seven U.S. states, 2018. Ann Epidemiol 2023;79:39-43. PMID:36669598 https://doi.org/10.1016/j. annepidem.2023.01.010
| Site | Surveillance area description | Types of data sources used* | % population coverage of education data sources
|
% of cases with records available for abstraction at
|
Total population | No. with ASD | ASD prevalence (95% CI)
|
| Arizona | Part of one county in metropolitan Phoenix | Health and education | 100 | 100 | 6,709** | 210 | 31.3 (27.4-35.7) |
| Arkansas | 21 counties in central Arkansas | Health and education | 100 | 99.8 | 15,319 | 457 | 29.8 (27.3-32.6) |
| California | Part of one county in metropolitan San Diego | Health, education, early intervention, and state developmental disability services | 100 | 100 | 15,212** | 807 | 53.1 (49.6-56.7) |
| Georgia | Three counties in metropolitan Atlanta | Health and education | 97.3 | 80.3 | 35,213 | 1,149 | 32.6 (30.8-34.5) |
| Indiana | One county in metropolitan Indianapolis | Health and education | 100 | –
|
13,155 | 241 | 18.3 (16.2-20.8) |
| Maryland | Five counties in the Baltimore area | Health, education, and early intervention | 100 | 99.8 | 21,206 | 558 | 26.3 (24.2-28.6) |
| Minnesota | Parts of three counties in the Twin Cities metropolitan area | Health and education | 100 | 91.2 | 17,331** | 616 | 35.5 (32.9-38.4) |
| Missouri | Three counties in metropolitan St. Louis | Health and education | 68.0 | 100 | 19,968 | 640 | 32.1 (29.7-34.6) |
| New Jersey | Two counties in the New York metropolitan area | Health, education, and early intervention | 100 | 97.9 | 18,334 | 623 | 34.0 (31.5-36.7) |
| Pennsylvania | One county in suburban Philadelphia | Health, education, early intervention, and Medicaid claims including state-funded long-term care programs | 100 | 83.9 | 7,066 | 335 | 47.4 (42.7-52.6) |
| Puerto Rico | 32 municipalities in north, east, south, and central regions of Puerto Rico | Health, education, early intervention, Medicaid claims, and autism registry | 100 | 98.7 | 17,457 | 461 | 26.4 (24.1-28.9) |
| Tennessee | 11 counties in middle Tennessee | Health and education | 100 | 88.8 | 26,182 | 889 | 34.0 (31.8-36.2) |
| Texas (Austin
|
Part of one county in south central Texas | Health and education | 100 | 84.7 | 4,356** | 85 | 19.5 (15.8-24.1) |
| Texas (Laredo) | One county in south Texas | Health and education | 99.7 | 83.0 | 4,856 | 47 | 9.7 (7.3-12.8) |
| Utah | Three counties in northern Utah | Health, education, early intervention, and habilitative services | 100 | 89.8 | 24,395 | 658 | 27.0 (25.0-29.1) |
| Wisconsin | Eight counties in southeastern Wisconsin | Health, education, early intervention, Medicaid claims, and state-funded long-term care program | 100 | 77.8 | 28,098 | 1,078 | 38.4 (36.2-40.7) |
| Total | 90.9 ॥ | 274,857 | 8,854 | 32.2 (31.6-32.9) |
| Site/Characteristic | Total no. with ASD | With IQ information | Median age of most recent IQ test (months) | Cognitive level | ||
| No. (%) |
|
IQ 71-85 (%) |
|
|||
| Site | ||||||
| Arizona | 210 | 163 (77.6) | 82 | 51 (31.3) | 48 (29.4) | 64 (39.3) |
| Arkansas | 457 | 412 (90.2) | 76 | 179 (43.4) | 87 (21.1) | 146 (35.4) |
| California | 807 | 658 (81.5) | 64 | 187 (28.4) | 179 (27.2) | 292 (44.4) |
| Georgia | 1,149 | 625 (54.4) | 56 | 306 (49.0) | 147 (23.5) | 172 (27.5) |
| Maryland | 558 | 426 (76.3) | 77 | 186 (43.7) | 114 (26.8) | 126 (29.6) |
| Minnesota | 616 | 436 (70.8) | 72.5 | 163 (37.4) | 91 (20.9) | 182 (41.7) |
| Missouri | 640 | 415 (64.8) | 67 | 135 (32.5) | 110 (26.5) | 170 (41.0) |
| New Jersey | 623 | 345 (55.4) | 64 | 141 (40.9) | 92 (26.7) | 112 (32.5) |
| Pennsylvania | 335 | 204 (60.9) | 62 | 69 (33.8) | 62 (30.4) | 73 (35.8) |
| Puerto Rico | 461 | 314 (68.1) | 85 | 78 (24.8) | 59 (18.8) | 177 (56.4) |
| Tennessee | 889 | 549 (61.8) | 49 | 272 (49.5) | 148 (27.0) | 129 (23.5) |
| Texas (Austin) | 85 | 54 (63.5) | 45 | 38 (70.4) | -** | – |
| Texas (Laredo) | 47 | 10 (21.3) | 80.5 | 8 (80.0) | – | – |
| Utah | 658 | 360 (54.7) | 71.5 | 124 (34.4) | 84 (23.3) | 152 (42.2) |
| Wisconsin | 1,078 | 321 (29.8) | 58 | 161 (50.2) | 52 (16.2) | 108 (33.6) |
| Total | 8,613 | 5,292 (61.4) | 67 | 2,098 (39.6) | 1,282 (24.2) | 1,912 (36.1) |
| Sex
|
||||||
| Female | 1,868 | 1,140 (61.0) | 66 | 460 (40.4) | 282 (24.7) | 398 (34.9) |
| Male | 6,732 | 4,152 (61.7) | 68 | 1,638 (39.5) | 1,000 (24.1) | 1,514 (36.5) |
| Race and ethnicity
|
||||||
| AI/AN | 32 | 22 (68.8) | 61 | 11 (50.0) | – | – |
| A/PI | 627 | 394 (62.8) | 68 | 173 (43.9) | 89 (22.6) | 132 (33.5) |
| Black | 2,024 | 1,200 (59.3) | 62 | 634 (52.8) | 313 (26.1) | 253 (21.1) |
| Hispanic | 2,289 | 1,405 (61.4) | 71 | 545 (38.8) | 353 (25.1) | 507 (36.1) |
| Multiracial | 396 | 263 (66.4) | 67 | 82 (31.2) | 65 (24.7) | 116 (44.1) |
| White | 3,132 | 1,975 (63.1) | 68 | 646 (32.7) | 452 (22.9) | 877 (44.4) |
-
(the ADDM Network includes 16 sites; Indiana is not included because the site did not have data from record abstraction available).
Excludes children with unknown sex ( ).
Excludes children of other or unknown race ( ). Persons of Hispanic origin might be of any race but are categorized as Hispanic; all racial groups are non-Hispanic.
Includes 25 children stated to have an IQ score > 70 but specific score was not given.
** Dashes indicate suppressed estimate because relative standard error wasof the estimate.
Pearson chi-square test for proportion of males versus females with ASD and IQ information ( ); proportion of males versus females with ASD and IQ .
Significant differences for Pearson chi-square tests for proportion of Black versus multiracial or White children with ASD and IQ information available (each comparison ).
I Significant differences for Pearson chi-square tests for proportion of Black children with IQ among children with ASD versus A/PI, Hispanic, multiracial, or White (each comparison ); A/PI children with IQ among children with ASD versus multiracial or White (each comparison ); Hispanic children with among children with ASD versus multiracial ( ) or White children ( ).
| Site | Total no. with ASD | No. with evaluation (%) | No. with evaluation at
|
No. with diagnosis | Median age of earliest documented diagnosis among children with an ASD diagnostic statement (mos) | ||
| All |
|
IQ
|
|||||
| Arizona | 210 | 191 (91.0) | 104 (54.5) | 139 | 45 | 38.5 | 47 |
| Arkansas | 457 | 457 (100.0) | 228 (49.9) | 421 | 53 | 48 | 60 |
| California | 807 | 801 (99.3) | 448 (55.9) | 643 | 36 | 36 | 35 |
| Georgia | 1,149 | 770 (67.0) | 340 (44.2) | 608 | 48 | 45 | 48.5 |
| Maryland | 558 | 546 (97.8) | 337 (61.7) | 460 | 48 | 38 | 52 |
| Minnesota | 616 | 514 (83.4) | 250 (48.6) | 332 | 52.5 | 43 | 63 |
| Missouri | 640 | 640 (100.0) | 270 (42.2) | 503 | 46 | 51 | 49.5 |
| New Jersey | 623 | 599 (96.1) | 314 (52.4) | 562 | 43 | 41 | 44 |
| Pennsylvania | 335 | 269 (80.3) | 171 (63.6) | 183 | 39 | 38 | 39 |
| Puerto Rico | 461 | 455 (98.7) | 268 (58.9) | 438 | 54 | 60 | 59.5 |
| Tennessee | 889 | 713 (80.2) | 302 (42.4) | 550 | 49.5 | 38 | 50 |
| Texas (Austin) | 85 | 67 (78.8) | 41 (61.2) | 35 | 42 | 38.5 | 46.5 |
| Texas (Laredo) | 47 | 32 (68.1) | –
|
30 | 69.5 | 75 | 34 |
| Utah | 658 | 576 (87.5) | 245 (42.5) | 497 | 54 | 46 | 58.5 |
| Wisconsin | 1,078 | 597 (55.4) | 315 (52.8) | 486 | 43 | 38 | 50 |
| Total | 8,613 | 7,227 (83.9) | 3,638 (50.3) | 5,887 | 47 | 43 | 49 |
| Site* | Denominator for children aged 4 yrs | ASD cases among children aged 4 yrs | ASD prevalence among children aged 4 yrs (
|
ASD prevalence ratio comparing children aged 4 yrs with children aged 8 yrs (
|
| Arizona | 6,286 | 122 | 19.4 (16.3-23.1) | 0.6 (0.5-0.8)
|
| Arkansas | 14,644 | 360 | 24.6 (22.2-27.2) | 0.8 (0.7-0.9)
|
| California | 14,936 | 905 | 60.6 (56.9-64.5) | 1.1 (1.0-1.3)
|
| Georgia | 33,592 | 684 | 20.4 (18.9-21.9) | 0.6 (0.6-0.7)
|
| Indiana | 13,346 | 172 | 12.9 (11.1-14.9) | 0.7 (0.6-0.9)
|
| Maryland | 20,005 | 483 | 24.1 (22.1-26.4) | 0.9 (0.8-1.0) |
| Minnesota | 17,069 | 426 | 25.0 (22.7-27.4) | 0.7 (0.6-0.8)
|
| Missouri | 19,298 | 478 | 24.8 (22.7-27.1) | 0.8 (0.7-0.9)
|
| New Jersey | 18,260 | 665 | 36.4 (33.8-39.2) | 1.1 (1.0-1.2)
|
| Pennsylvania | 6,653 | 284 | 42.7 (38.1-47.8) | 0.9 (0.8-1.1) |
| Puerto Rico | 12,849 | 607 | 47.2 (43.7-51.0) | 1.8 (1.6-2.0)
|
| Tennessee | 26,363 | 958 | 36.3 (34.1-38.7) | 1.1 (1.0-1.2)
|
| Texas (Austin) | 4,405 | 74 | 16.8 (13.4-21.0) | 0.9 (0.6-1.2) |
| Texas (Laredo) | 4,357 | 62 | 14.2 (11.1-18.2) | 1.5 (1.0-2.1)
|
| Utah | 21,807 | 397 | 18.2 (16.5-20.1) | 0.7 (0.6-0.8)
|
| Wisconsin | 27,042 | 980 | 36.2 (34.1-38.5) | 0.9 (0.9-1.0) |
| Total | 260,912 | 7,657 | 29.3 (28.7-30.0) | 0.9 (0.9-0.9)
|
Readers who have difficulty accessing this PDF file may access the HTML file at https://www.cdc.gov/mmwr/volumes/74/ss/ss7402a1.htm?s_ cid=ss7402al_w. Address all inquiries about the
All material in the
Use of trade names and commercial sources is for identification only and does not imply endorsement by the U.S. Department of Health and Human Services.
References to non-CDC sites on the Internet are provided as a service to
- Corresponding author: Kelly A. Shaw, National Center on Birth Defects and Developmental Disabilities, CDC. Telephone: 404-498-2729; Email: nrb7@cdc.gov.
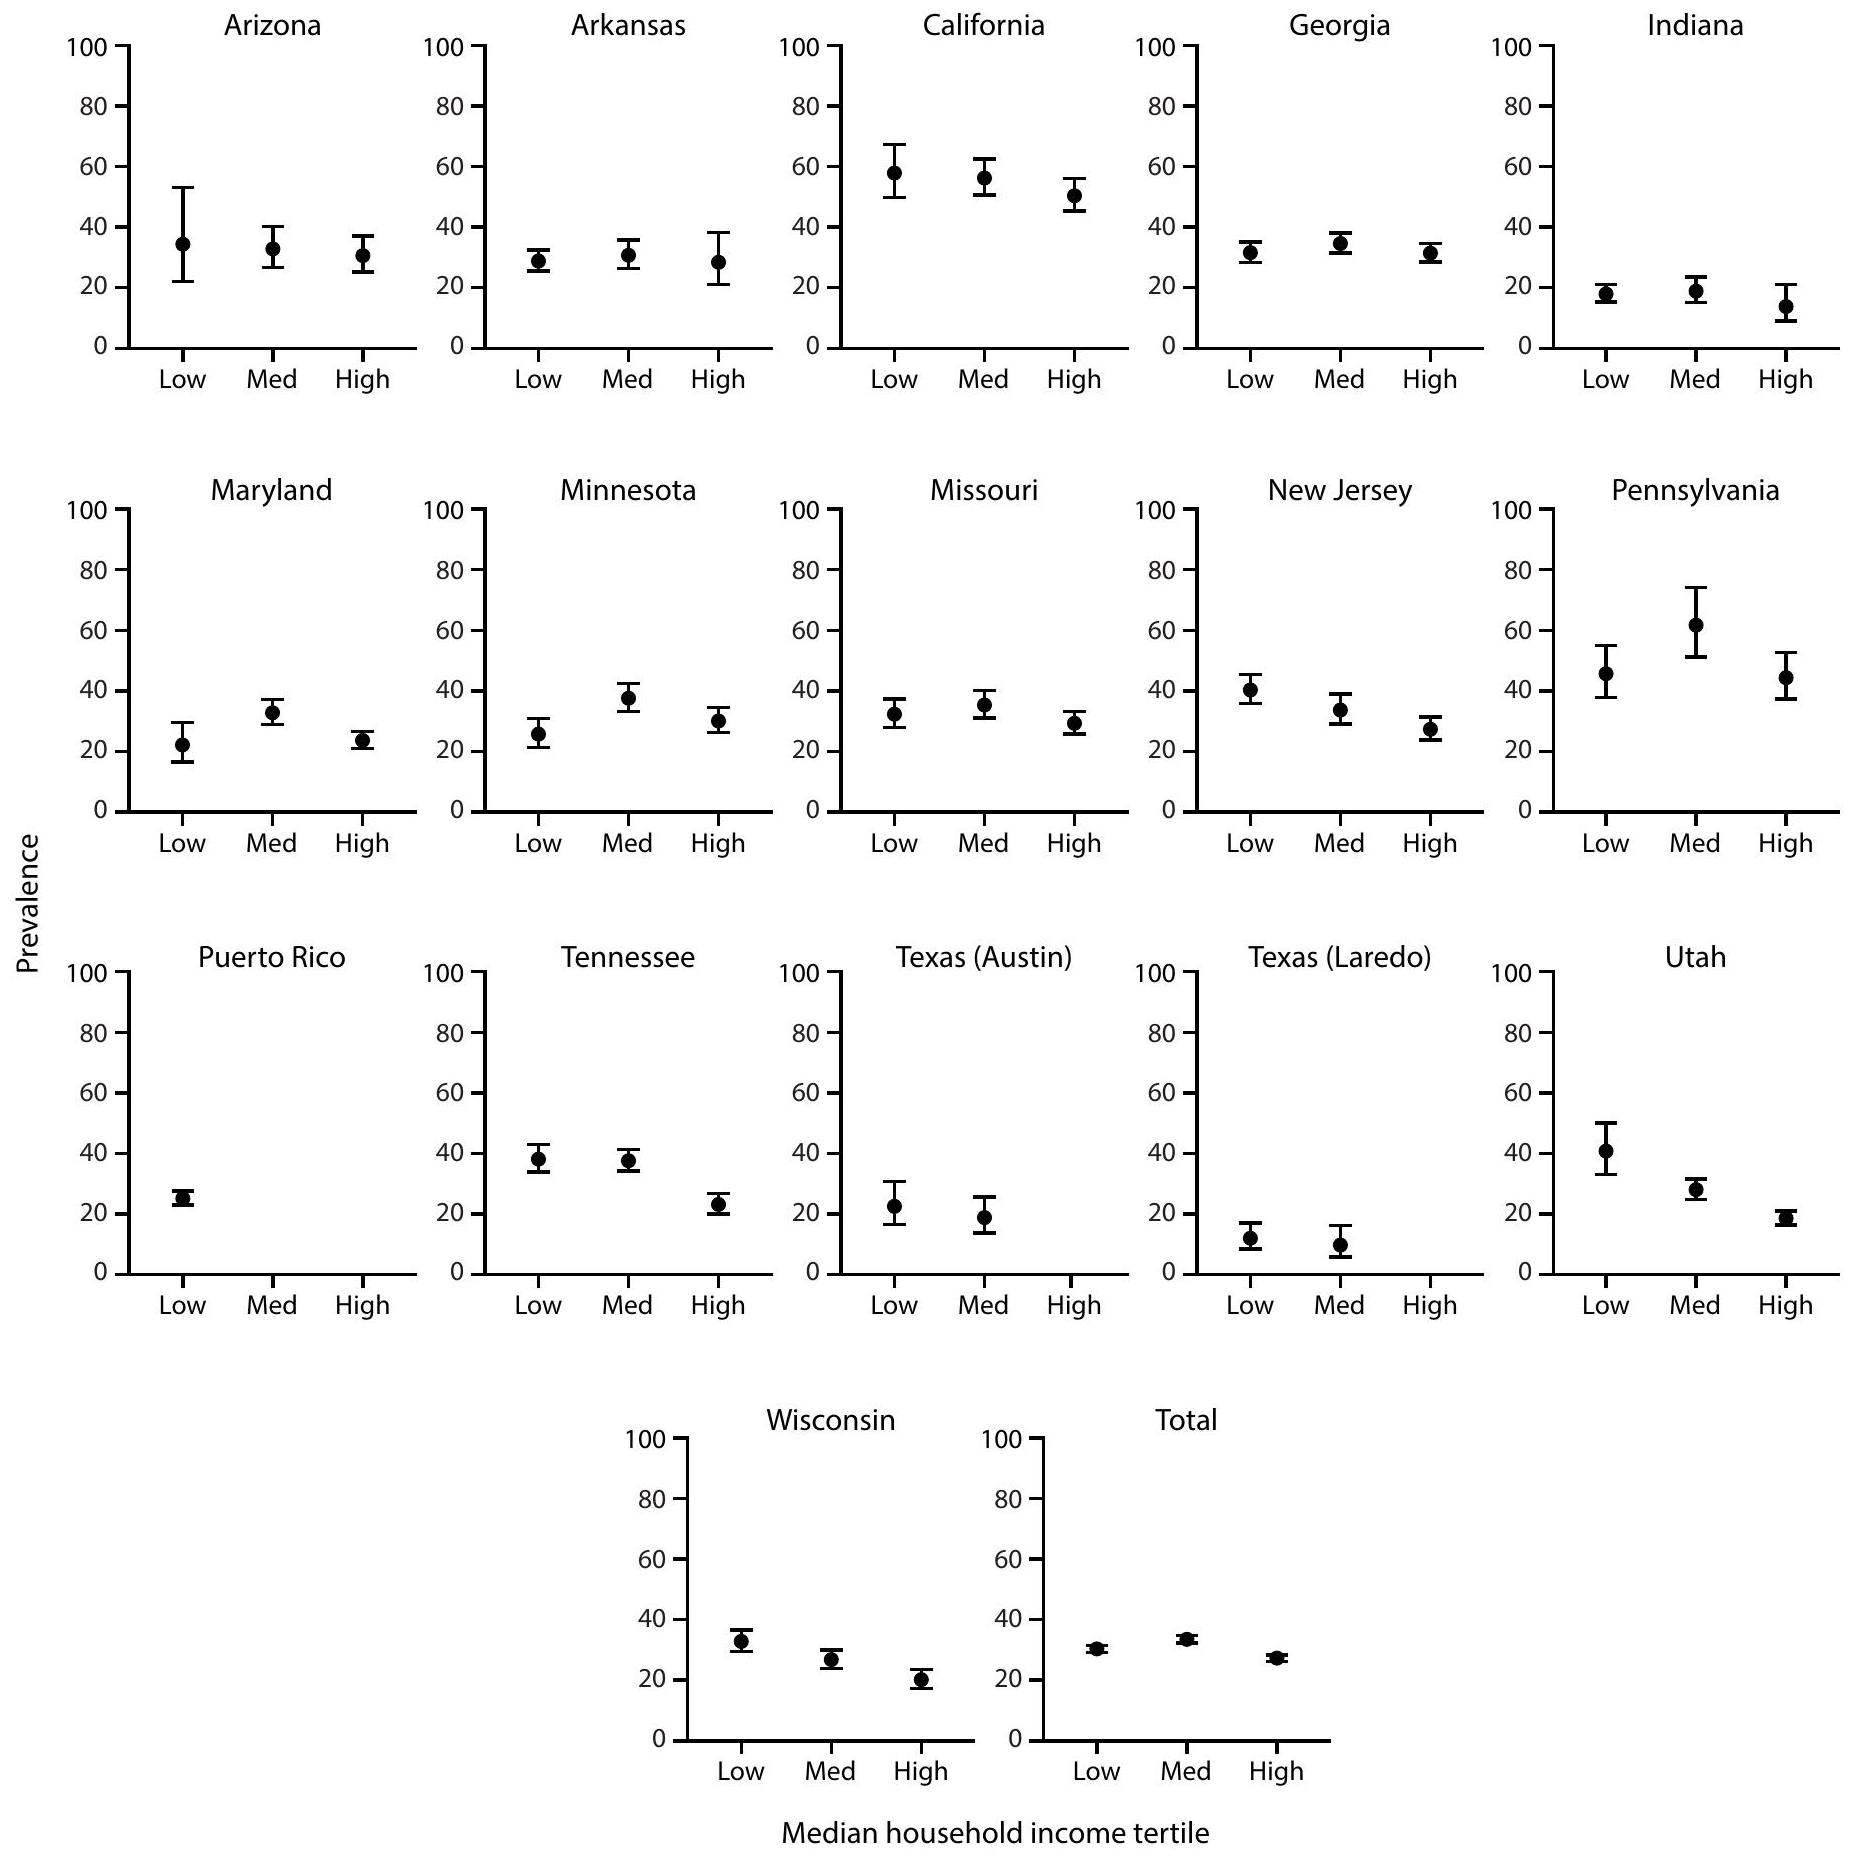
- Abbreviation: ASD = autism spectrum disorder; MHI = median household income.
- Per 1,000 children aged 8 years.
Dots are point estimates and horizontal lines are CIs. Neighborhood MHI tertiles low , medium ( ), high ( ). Estimates for Puerto Rico medium and high MHI tertiles and Texas (Austin) and Texas (Laredo) high MHI tertiles were suppressed because relative standard error was of the estimate.
Cochran-Armitage test of trend for association between MHI tertile and ASD prevalence, by site and overall: Arizona ; Arkansas ; California ; Georgia ; Indiana ; Maryland ; Minnesota ; Missouri ; New Jersey ; Pennsylvania ; Puerto Rico ; Tennessee ; Texas (Austin) ; Texas (Laredo) ; Utah ; Wisconsin ; Total (not monotonic). Ns and prevalence for each MHI tertile by site are available (Supplementary Table 4, https://stacks.cdc.gov/view/cdc/177099#tabs-3).
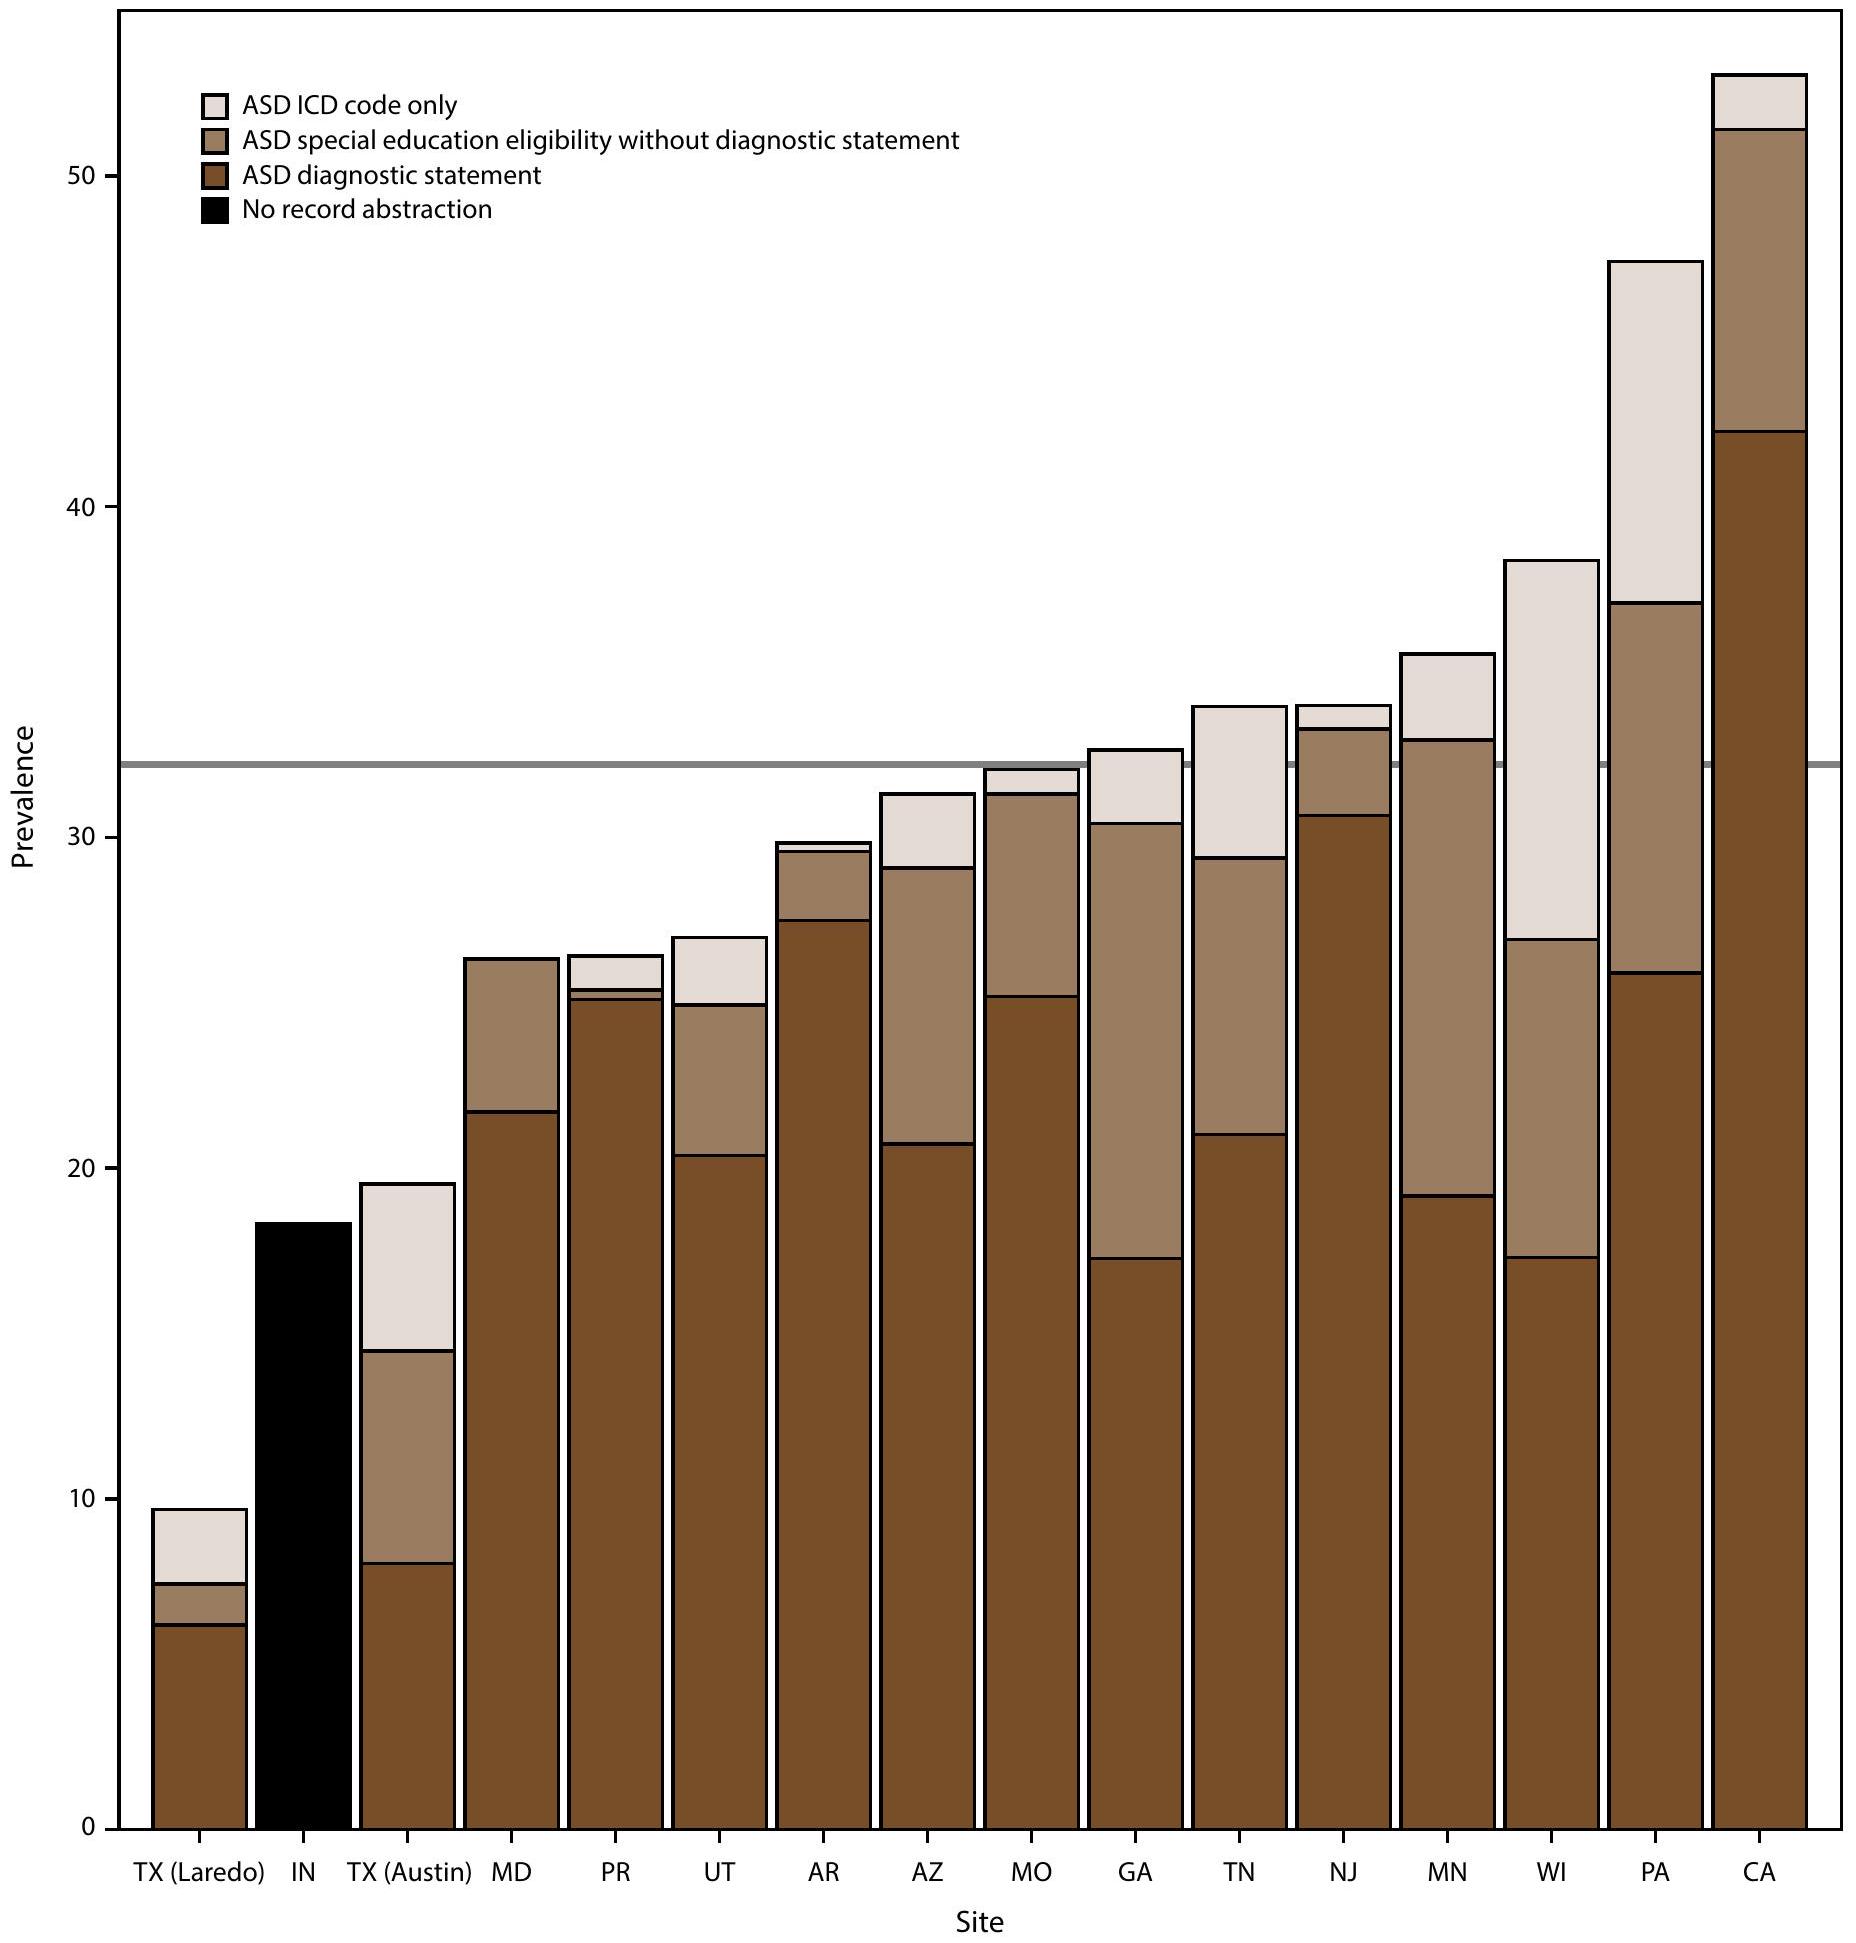
- Per 1,000 children aged 8 years.
- Abbreviations: ASD = autism spectrum disorder; ICD = International Classification of Diseases.
- Per 1,000 children aged 8 years.
Data from record abstraction were not available for Indiana.
Horizontal line is the overall Autism and Developmental Disabilities Monitoring Network prevalence of 32.2 per 1,000 children aged 8 years. Children with documented ASD statements could also have ASD eligibility in special education or ASD ICD codes. Underlying data are available (Supplementary Table 6, https://stacks.cdc.gov/ view/cdc/177099#tabs-3).
- Per 1,000 children aged 8 years.
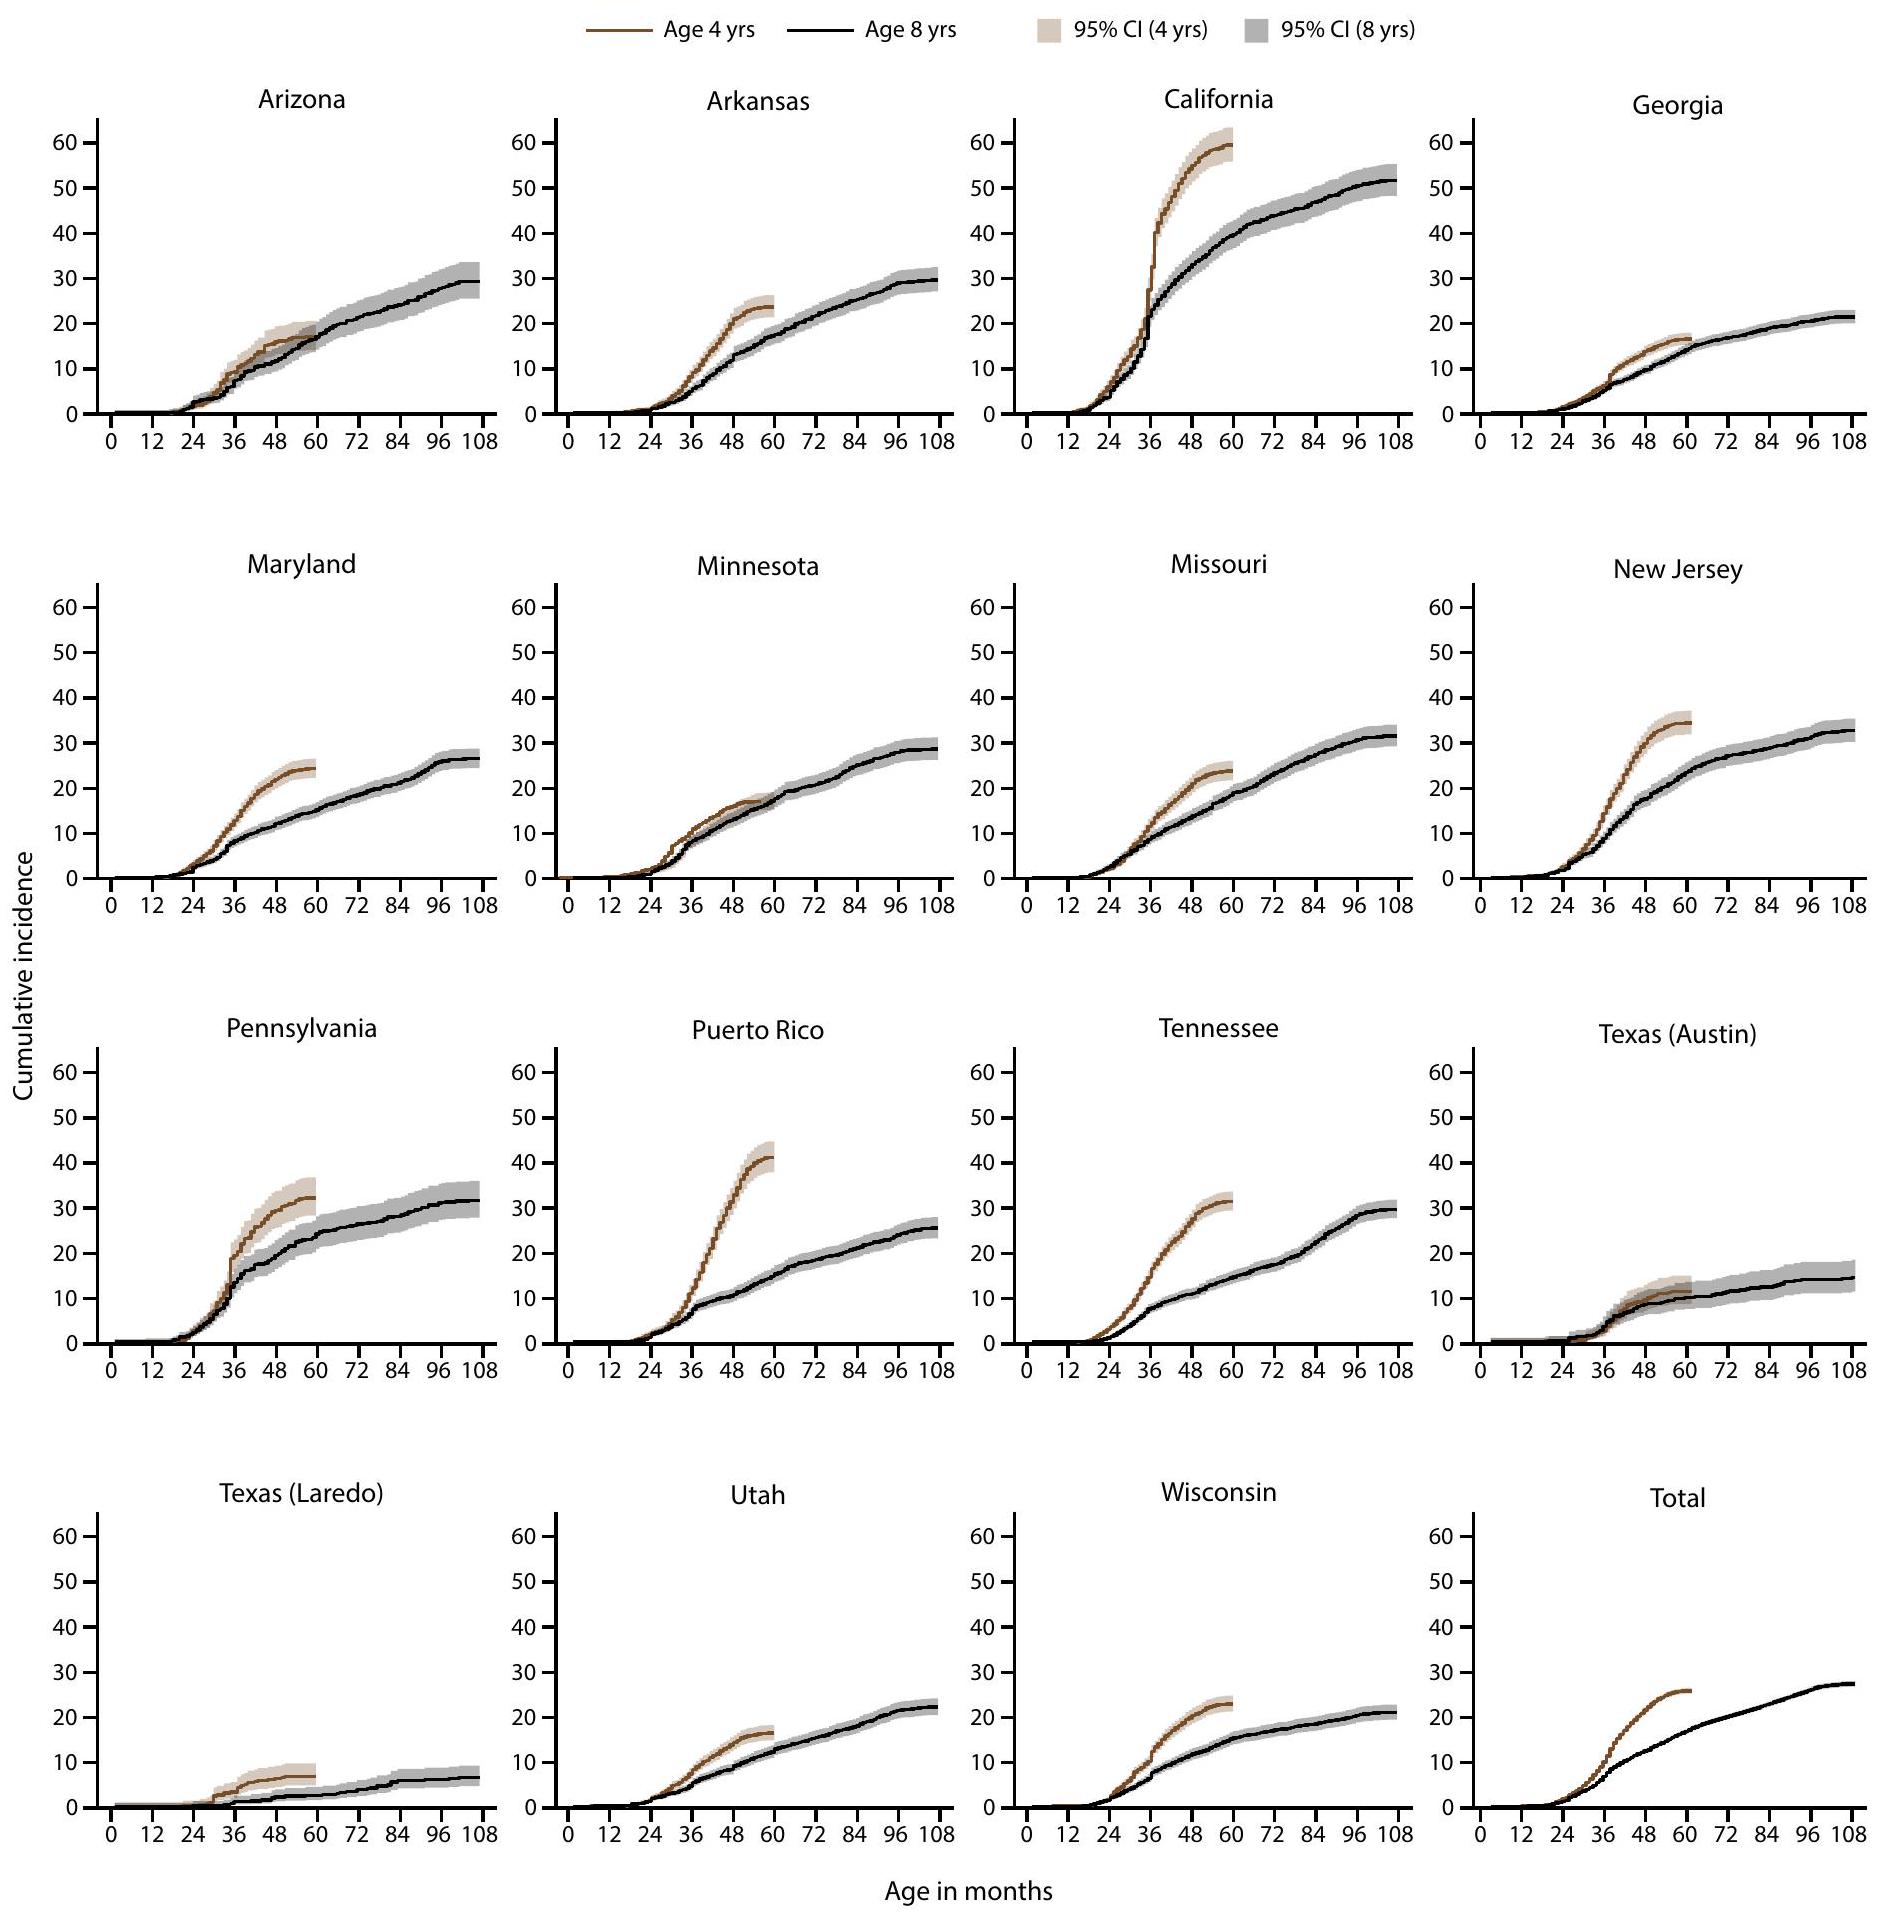
- Per 1,000 children aged 4 or 8 years.
The ADDM Network has 16 sites; Indiana is not included because the site did not have data from record abstraction available.
Not all children aged 4 years reach age 60 months and not all children aged 8 years reach age 108 months during the surveillance year.
Data comparing cumulative incidence of autism spectrum disorder diagnosis or autism special education eligibility by age 48 months among children aged 4 or 8 years are available (Supplementary Table 10, https://stacks.cdc.gov/view/cdc/177099#tabs-3).
- Per 1,000 children aged 4 or 8 years.
- Per 1,000 children aged 4 or 8 years.
The ADDM Network has 16 sites; Indiana is not included because the site did not have data from record abstraction available.
For children aged 4 years, year 0 to year 4 represents 2018-2022; for children aged 8 years, year 0 to year 4 represents 2014-2018. The dashed line shows the COVID-19 pandemic onset for children aged 4 years in 2022 compared with the analogous time window for children aged 8 years in 2022.
- Per 1,000 children aged 4 or 8 years.
- Abbreviations: ADI-R = Autism Diagnostic Interview-Revised; ADOS = Autism Diagnostic Observation Schedule; ASD = autism spectrum disorder; ASRS = Autism Spectrum Rating Scales; CARS = Childhood Autism Rating Scale; GARS = Gilliam Autism Rating Scale; SRS = Social Responsiveness Scale; other test category includes Asperger Syndrome Diagnostic Scale, Gilliam Asperger’s Disorder Scale, and TELE-ASD-PEDS.
-
(the ADDM Network has 16 sites; Indiana is not included because the site did not have data from record abstraction available).
-
- Abbreviations: ASD = autism spectrum disorder.
- Health sources include records from medical and service providers that evaluate children with developmental disabilities.
For public schools in the surveillance area.
The percentage of children with electronic or physical records available from source for abstraction. Certain data sources (e.g., Medicaid) are administrative in nature and do not have physical or electronic records such as developmental evaluations available for review.
Cls were calculated using the Wilson score method.
** Denominator excludes tracts that were not included in the surveillance area using American Community Survey data.
Indiana did not have data from record abstraction available.
Site name reflects the location of the surveillance team and not the surveillance area.
III The total number of cases with records available for abstraction atsource was 7,831 and total number of cases from sites with data from record abstraction available was 8,613.
- Health sources include records from medical and service providers that evaluate children with developmental disabilities.
- Abbreviations: ASD = autism spectrum disorder; IQ = intelligence quotient.
-
(the ADDM Network has 16 sites; Indiana is not included because the site did not have data from record abstraction available).
Includes only children with IQ information available.
Estimate suppressed because relative standard error was of the estimate.
-
- Abbreviation: ASD = autism spectrum disorder.
- Surveillance areas and data sources are the same for children aged 4 and aged 8 years.
CIs were calculated using the Wilson score method.
Significant prevalence ratio (95% Cl excludes 1.0).
- Surveillance areas and data sources are the same for children aged 4 and aged 8 years.
DOI: https://doi.org/10.15585/mmwr.ss7402a1
PMID: https://pubmed.ncbi.nlm.nih.gov/40232988
Publication Date: 2025-04-15
Prevalence and Early Identification of Autism Spectrum Disorder Among Children Aged 4 and 8 Years – Autism and Developmental Disabilities Monitoring Network, 16 Sites, United States, 2022
CONTENTS
Methods ….. 3
Results ….. 5
Discussion ….. 9
Limitations ….. 14
Future Directions ….. 14
Conclusion ….. 14
References ….. 15
Suggested citation: [Author names; first three, then et al., if more than six.] [Title]. MMWR Surveill Summ 2025;74(SS-#):[inclusive page numbers].
Centers for Disease Control and Prevention
Susan Monarez, PhD, Acting Director
Debra Houry, MD, MPH, Chief Medical Officer and Deputy Director for Program and Science
Samuel F. Posner, PhD, Director, Office of Science
MMWR Editorial and Production Staff (Serials)
Leslie Hamlin, Lowery Johnson,
Health Communication Specialists
Will Yang, MA,
Visual Information Specialist
MMWR Editorial Board
| Timothy F. Jones, MD, Chairman | Patrick L. Remington, MD, MPH | ||
| David W. Fleming, MD | |||
| William E. Halperin, MD, DrPH, MPH |
|
||
| Jewel Mullen, MD, MPH, MPA | |||
| Jeff Niederdeppe, PhD | Morgan Bobb Swanson, MD, PhD | ||
| Patricia Quinlisk, MD, MPH |
Carolyn Brooks, ScD, MA
Virginia A. Caine, MD
Jonathan E. Fielding, MD, MPH, MBA
Prevalence and Early Identification of Autism Spectrum Disorder Among Children Aged 4 and 8 Years – Autism and Developmental Disabilities Monitoring Network, 16 Sites, United States, 2022
Abstract
Problem/Condition: Autism spectrum disorder (ASD). Period Covered: 2022. Description of System: The Autism and Developmental Disabilities Monitoring Network is an active surveillance program that estimates prevalence and characteristics of ASD and monitors timing of ASD identification among children aged 4 and 8 years. In 2022, a total of 16 sites (located in Arizona, Arkansas, California, Georgia, Indiana, Maryland, Minnesota, Missouri, New Jersey, Pennsylvania, Puerto Rico, Tennessee, Texas [two sites: Austin and Laredo], Utah, and Wisconsin) conducted surveillance for ASD among children aged 4 and 8 years and suspected ASD among children aged 4 years. Surveillance included children who lived in the surveillance area at any time during 2022. Children were classified as having ASD if they ever received 1) an ASD diagnostic statement in a comprehensive developmental evaluation, 2) autism special education eligibility, or 3) an ASD International Classification of Diseases, Ninth Revision (ICD-9) code in the 299 range or International Classification of Diseases, Tenth Revision (ICD-10) code of F84.0, F84.3, F84.5, F84.8, or F84.9. Children aged 4 years were classified as having suspected ASD if they did not meet the case definition for ASD but had an evaluator’s suspicion of ASD documented in a comprehensive developmental evaluation. Results: Among children aged 8 years in 2022, ASD prevalence was 32.2 per 1,000 children (one in 31 ) across the 16 sites, ranging from 9.7 in Texas (Laredo) to 53.1 in California. The overall observed prevalence estimate was similar to estimates calculated using Bayesian hierarchical and random effects models. ASD was 3.4 times as prevalent among boys (49.2) than girls (14.3). Overall, ASD prevalence was lower among non-Hispanic White (White) children (27.7) than among Asian or Pacific Islander (A/PI) (38.2), American Indian or Alaska Native (AI/AN) (37.5), non-Hispanic Black or African American (Black) (36.6), Hispanic or Latino (Hispanic) (33.0), and multiracial children (31.9). No association was observed between ASD prevalence and neighborhood median household income (MHI) at 11 sites; higher ASD prevalence was associated with lower neighborhood MHI at five sites. Record abstraction was completed for 15 of the 16 sites for 8,613 children aged 8 years who met the ASD case definition. Of these 8,613 children,
Among 5,292 (61.4% of 8,613) children aged 8 years with ASD with information on cognitive ability,
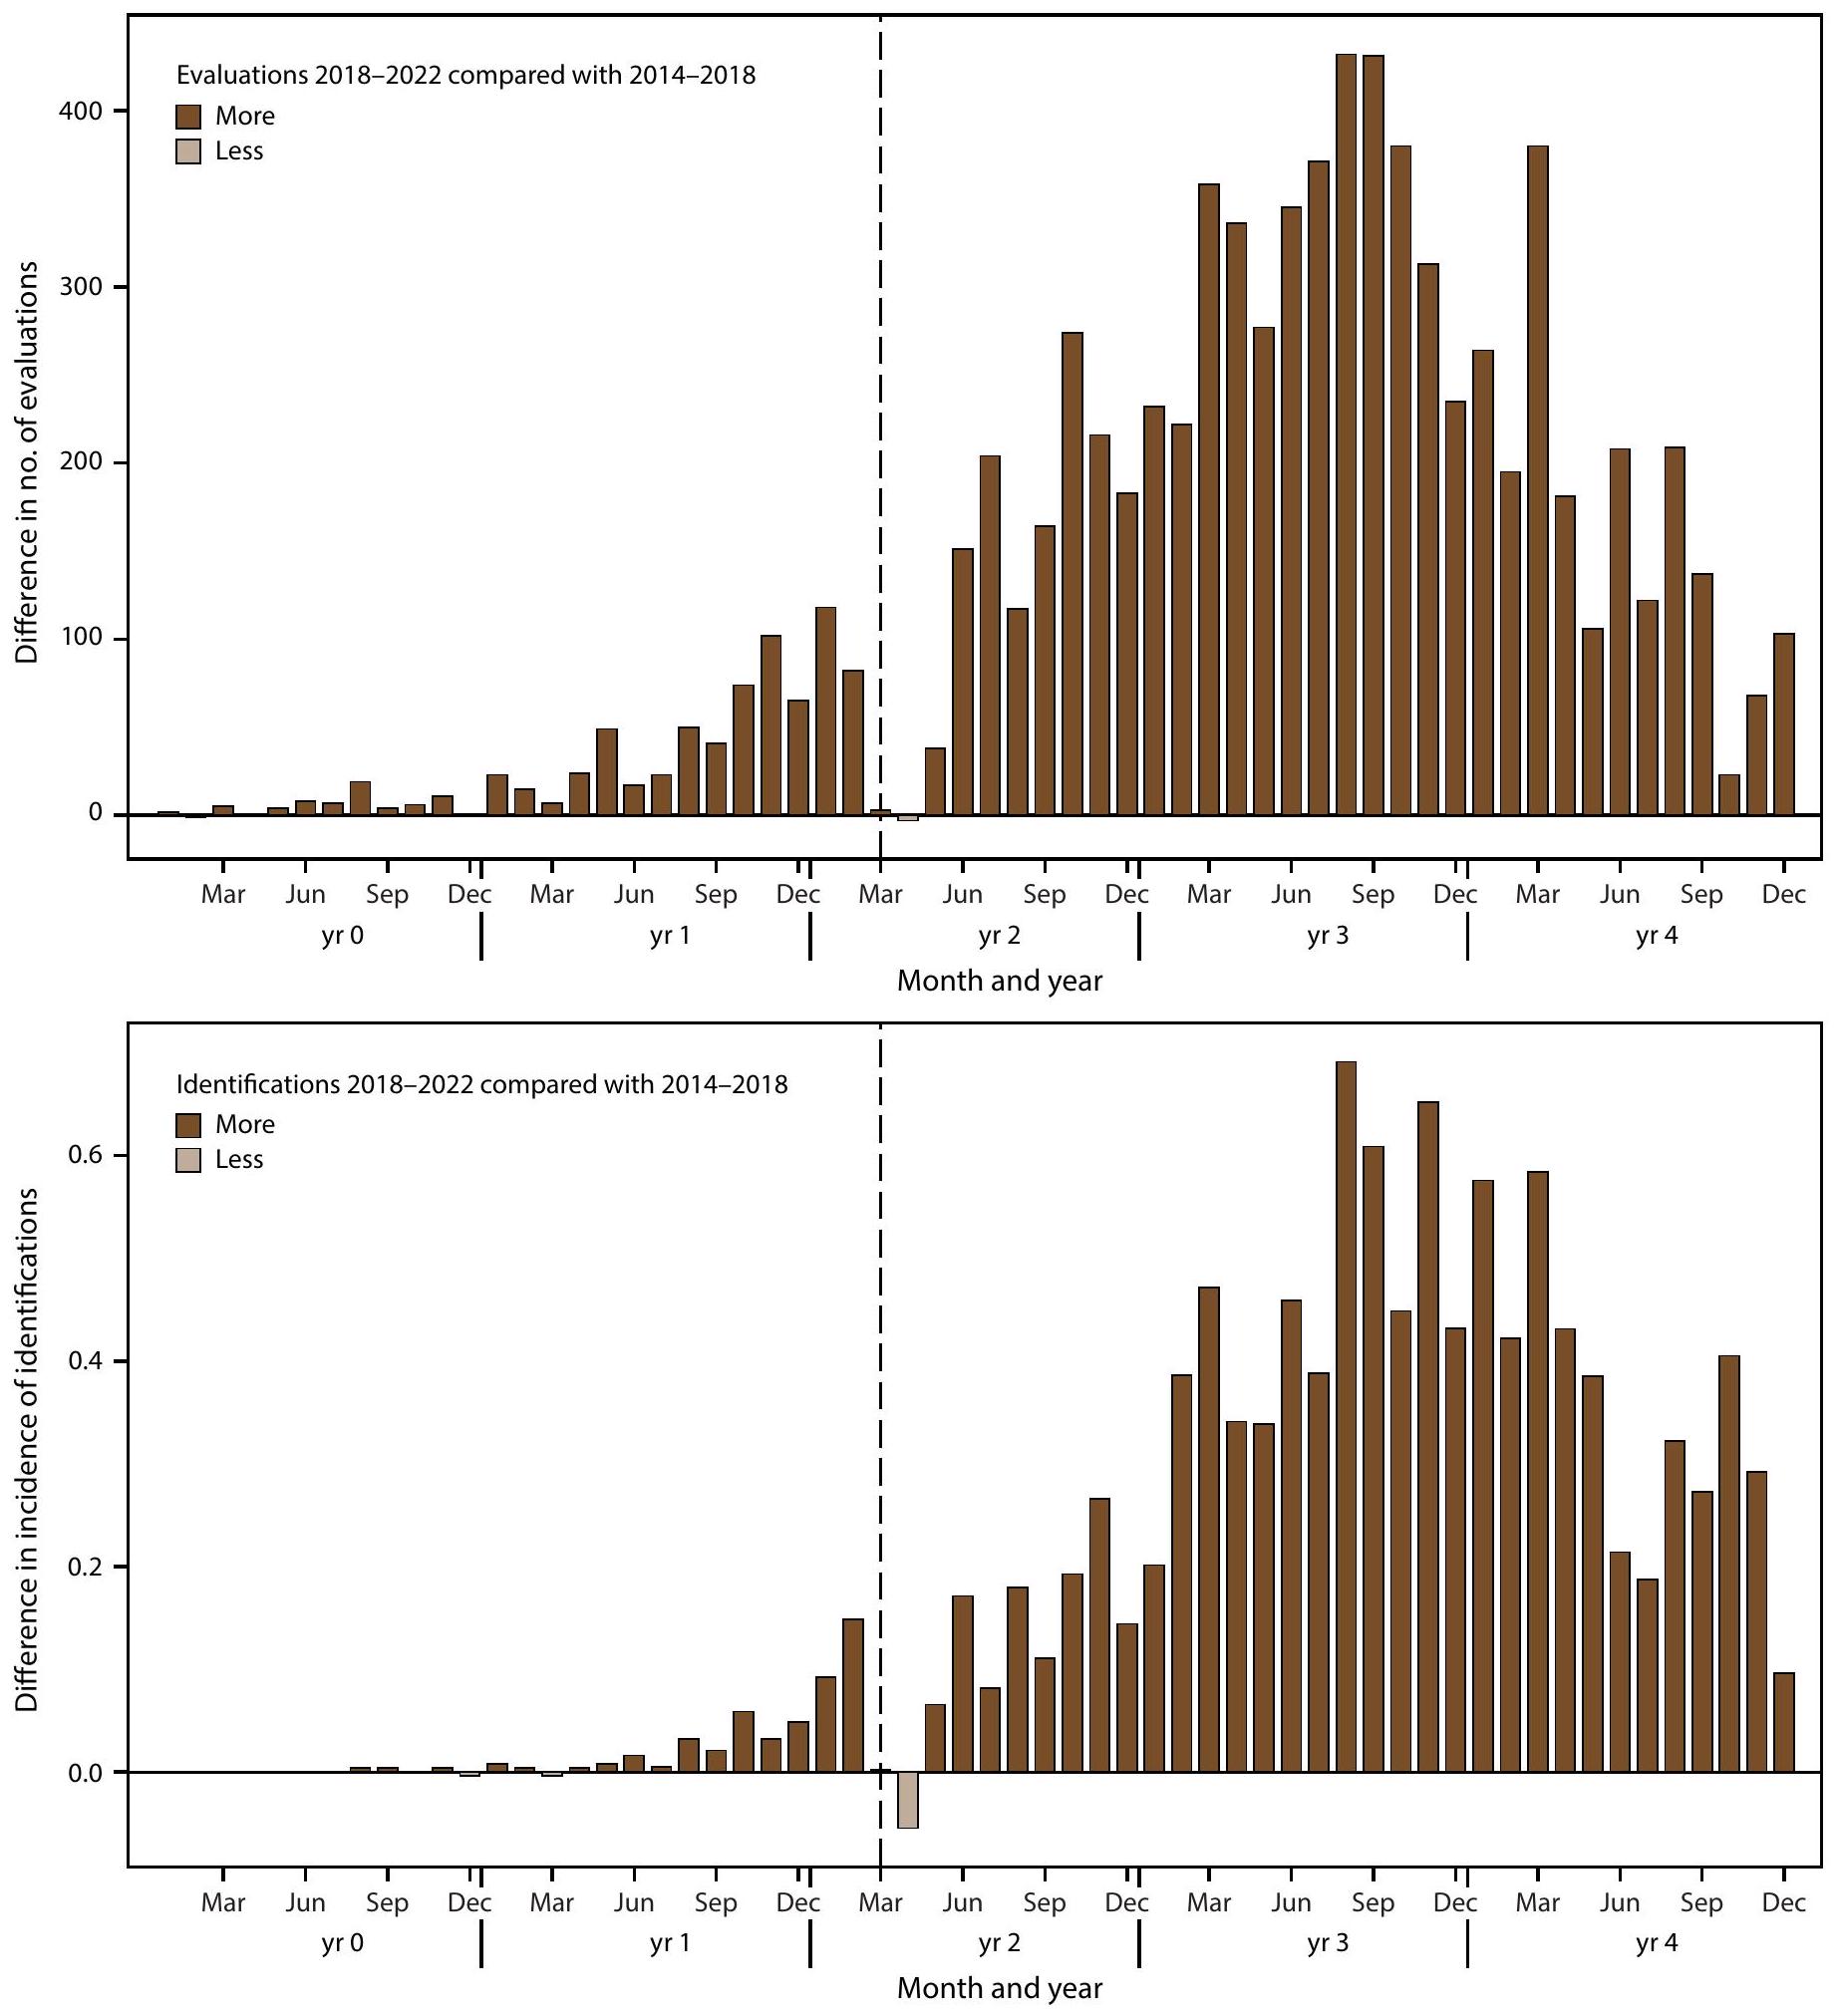
Cumulative incidence of ASD diagnosis or eligibility by age 48 months was higher among children born in 2018 (aged 4 years in 2022) than children born in 2014 (aged 8 years in 2022) at 13 of the 15 sites that were able to abstract records. Overall cumulative incidence of ASD diagnosis or eligibility by age 48 months was 1.7 times as high among those born in 2018 compared with those born in 2014 and ranged from 1.4 times as high in Arizona and Georgia to 3.1 times as high in Puerto Rico. Among children aged 4 years, for every 10 children meeting the case definition of ASD, one child met the definition of suspected ASD.
Children with ASD who were born in 2018 had more evaluations and identification during ages
Overall,
Interpretation: Prevalence of ASD among children aged 8 years was higher in 2022 than previous years. ASD prevalence was higher among A/PI, Black, and Hispanic children aged 8 years than White children aged 8 years, continuing a pattern first observed in 2020. A/PI, Black, and Hispanic children aged 8 years with ASD were also more likely than White or multiracial children with ASD to have a co-occurring intellectual disability. Identification by age 48 months was higher among children born in 2018 compared with children born in 2014, suggesting increased early identification consistent with historical patterns.
Public Health Action: Increased identification of autism, particularly among very young children and previously underidentified groups, underscores the increased demand and ongoing need for enhanced planning to provide equitable diagnostic, treatment, and support services for all children with ASD. The substantial variability in ASD identification across sites suggests opportunities to identify and implement successful strategies and practices in communities to ensure all children with ASD reach their potential.
Introduction
higher socioeconomic status (SES) (7). In 2020, higher ASD prevalence was observed for the first time among historically underserved groups including non-Hispanic Black and Hispanic children, and an association between ASD prevalence and SES (measured by median household income [MHI] tertile) was not present in the majority of sites (6).
Methods
Surveillance Sites and Procedures
Case Ascertainment and Surveillance Case Definition
(e.g., Medicaid) are administrative in nature and did not have physical or electronic records such as developmental evaluations available for review. Indiana had access only to special education eligibility category data from its educational source and ICD codes from its medical source. Therefore, Indiana was not included in analyses or visualizations of elements of the ASD case definition because information about ASD diagnostic statements was not available.
Additional Data Sources and Variable Definitions
for children with only an ICD code were not available). Children were linked at the census tract level to socioeconomic indicators of neighborhood MHI from the 2022 ACS 5-year estimates (14) and CDC’s social vulnerability index (SVI) (15).
Analytic Methods
Results
ASD Prevalence Among
Children Aged 8 Years
Presence of ASD Diagnostic Statements, Special Education Eligibility, and ICD Codes Among Children Aged 8 Years
-
(the ADDM Network has 16 sites; Indiana is not included because the site did not have ASD diagnostic statement data from record abstraction available).
Cognitive Ability Among Children with ASD Aged 8 Years
Age at First Evaluation and ASD Diagnosis Among Children Aged 8 Years
Early ASD Identification Among Children Aged 4 and 8 Years
Evaluation and Identification After COVID-19 Pandemic Onset
ASD Testing Among Children Aged 4 and 8 Years
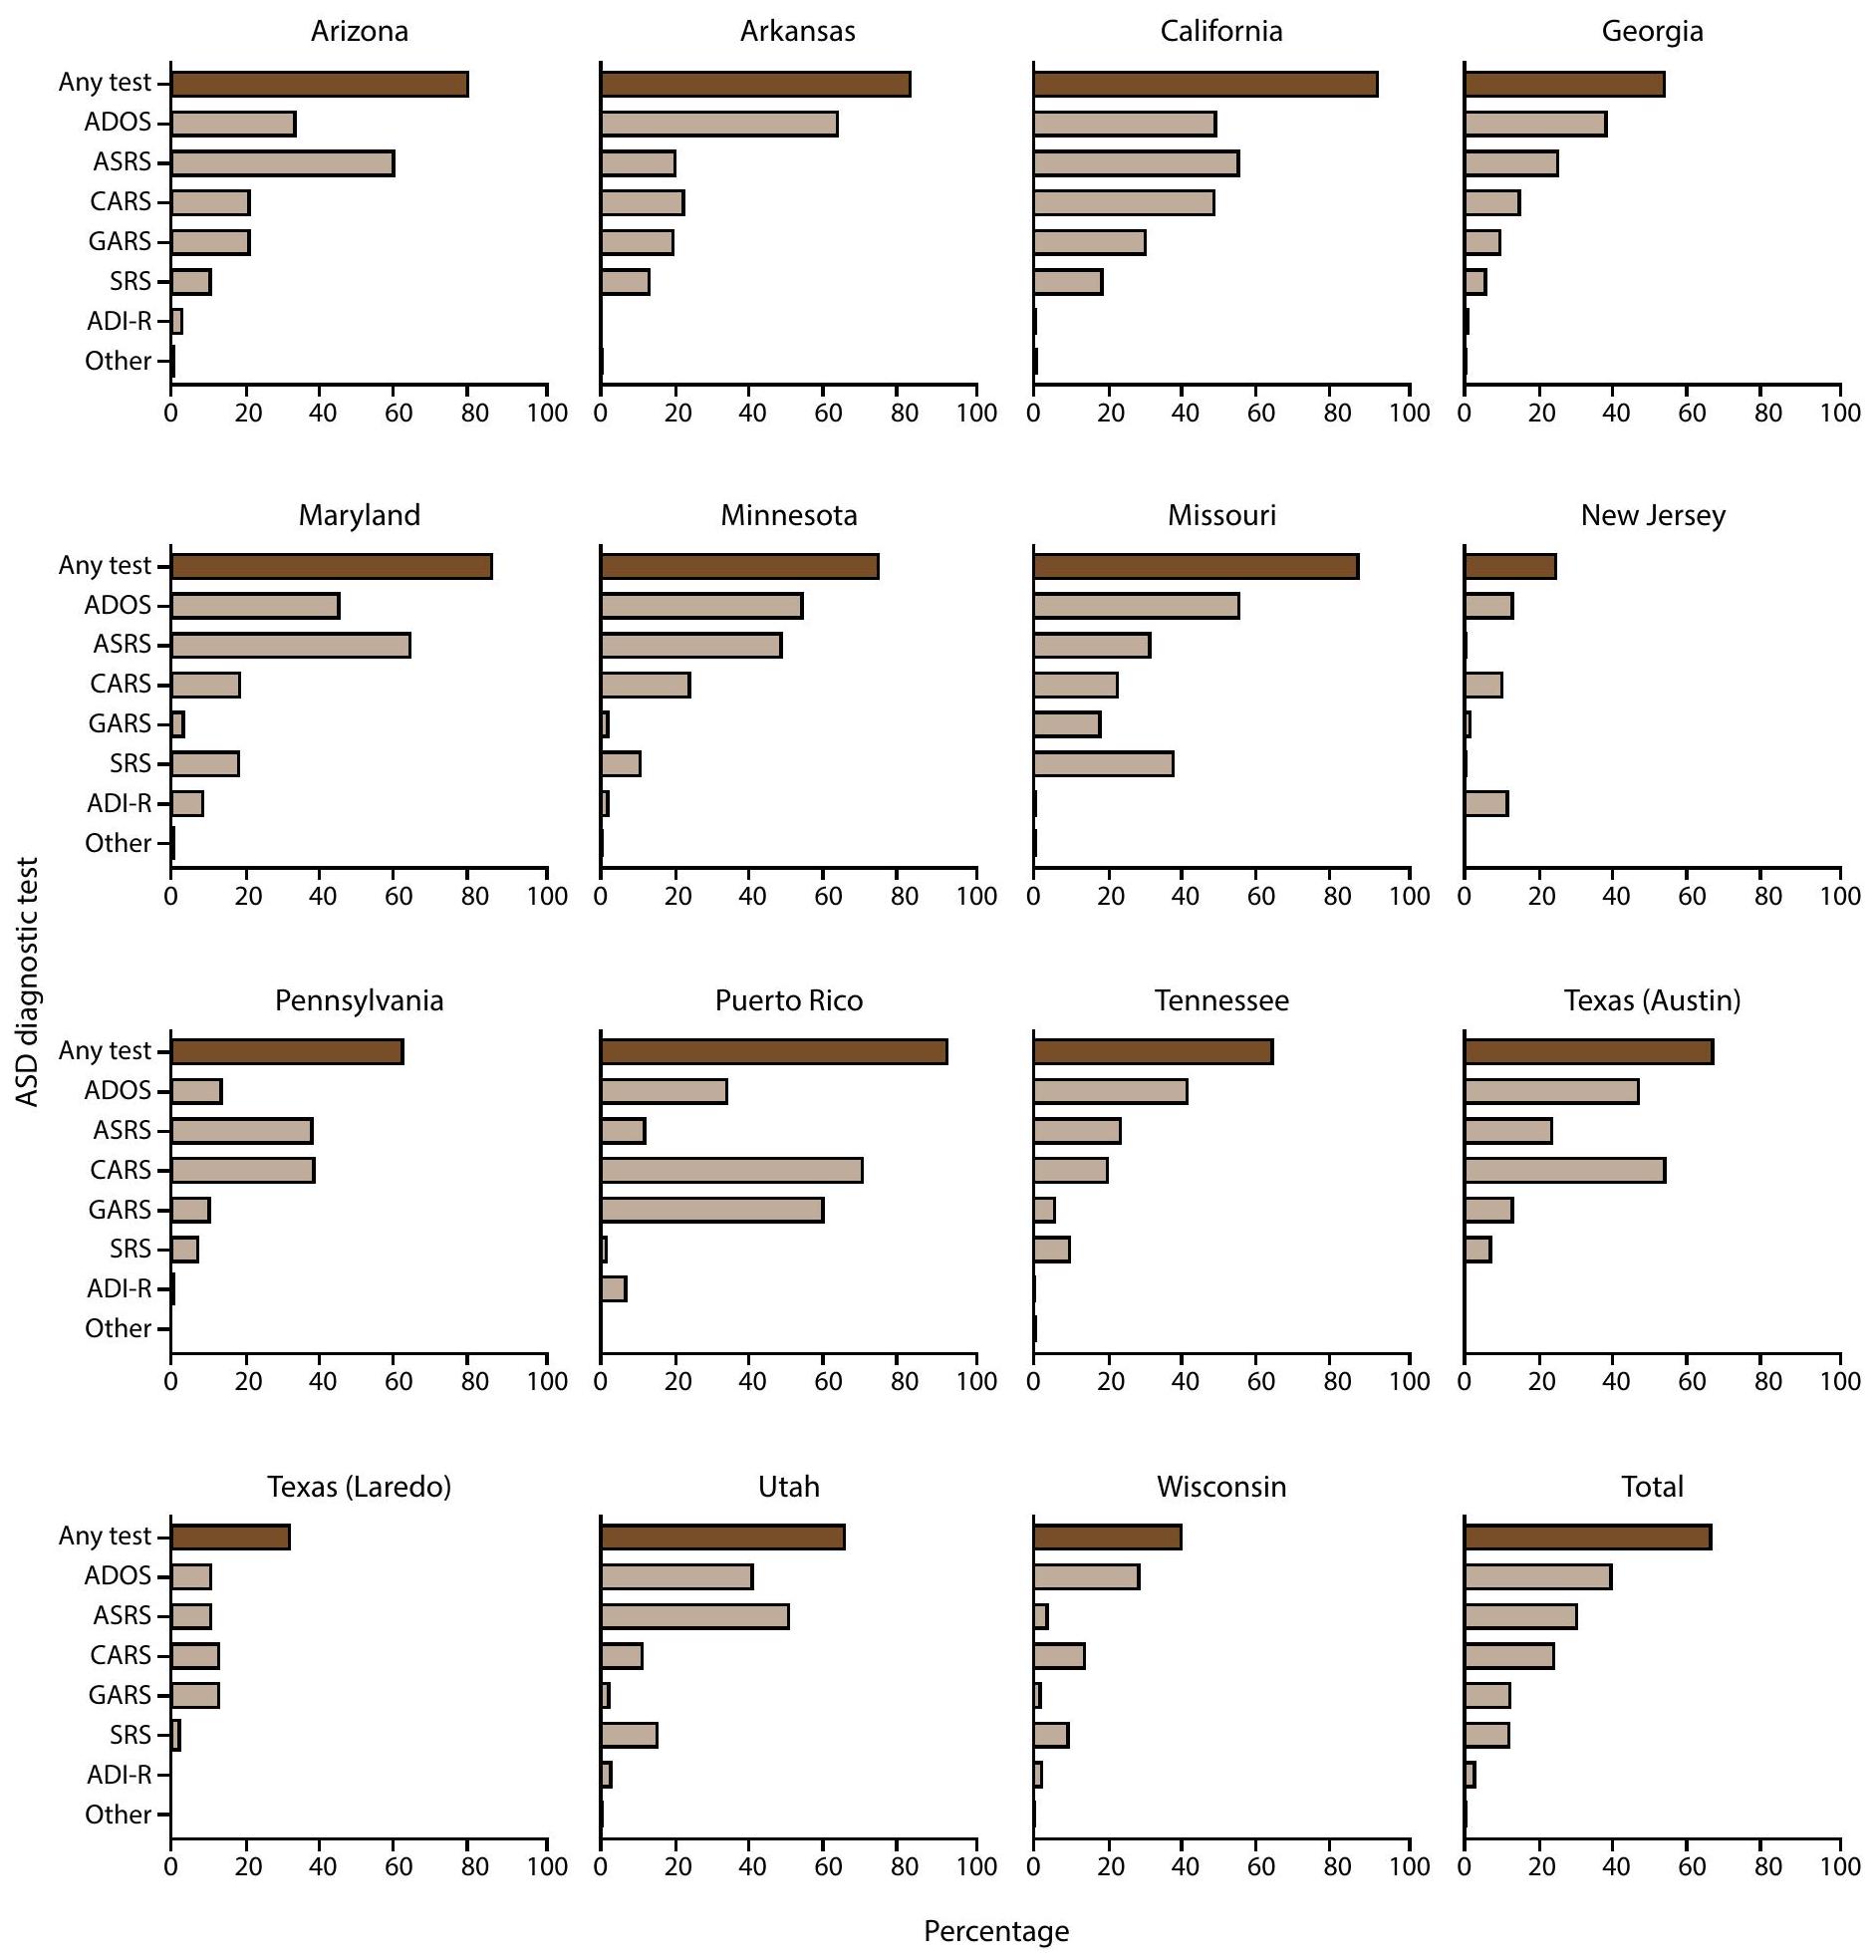
had an ASD test documented in their records (69.1%), though the order of tests by frequency was different (Supplementary Figure 8, https://stacks.cdc.gov/view/cdc/177099#tabs-3). The most common autism test documented among children aged 4 years with ASD was the CARS (
Discussion
Limitations
Future Directions
Conclusion
communities for five sites had higher prevalence of ASD than children in high MHI or low vulnerability communities. As evidence grows of increased access to identification among previously underserved groups, attention might shift to what factors, such as SDOH, could lead to higher rates of disability among certain populations. A higher rate of ASD identification by 48 months was found among children born in 2018 compared with children born in 2014. The cohort born in 2018 received more evaluations and ASD identifications than the cohort born in 2014 did during the same age window; disruption was visible at COVID-19 pandemic onset in early 2020 but the pattern of higher identification reappeared by the end of 2020. Continued increases in prevalence and improvements in early identification of ASD could indicate increasing need for services. Opportunities exist to learn from successful policies, systems, and practices in different communities and implement approaches for equitable identification or service eligibility to help families or persons receive the support they need as early as possible to improve outcomes for children with ASD.
Acknowledgments
Conflict of Interest
References
- American Psychiatric Association. Diagnostic and statistical manual of mental disorders. 5th ed., text revision. Washington, DC: American Psychiatric Association; 2022.
- Hyman SL, Levy SE, Myers SM, et al.; Council on Children with Disabilities, Section on Developmental and Behavioral Pediatrics. Identification, evaluation, and management of children with autism spectrum disorder. Pediatrics 2020;145:e20193447. PMID:31843864 https://doi.org/10.1542/peds.2019-3447
- Lipkin PH, Macias MM, Norwood KW Jr, et al.; Council on Children with Disabilities, Section on Developmental and Behavioral Pediatrics. Promoting optimal development: identifying infants and young children with developmental disorders through developmental surveillance and screening. Pediatrics 2020;145:e20193449. PMID:31843861 https:// doi.org/10.1542/peds.2019-3449
- Zwaigenbaum L, Bauman ML, Choueiri R, et al. Early intervention for children with autism spectrum disorder under 3 years of age: recommendations for practice and research. Pediatrics 2015;136(Suppl 1):S60-81. PMID:26430170 https://doi.org/10.1542/ peds.2014-3667E
- Autism and Developmental Disabilities Monitoring Network Surveillance Year 2000 Principal Investigators; CDC. Prevalence of autism spectrum disorders-Autism and Developmental Disabilities Monitoring Network, six sites, United States, 2000. MMWR Surveill Summ 2007;56(No. SS-1):1-11. PMID:17287714
- Maenner MJ, Warren Z, Williams AR, et al. Prevalence and characteristics of autism spectrum disorder among children aged 8 years-Autism and Developmental Disabilities Monitoring Network, 11 sites, United States, 2020. MMWR Surveill Summ 2023;72(No. SS-2):1-14. PMID:36952288 https://doi.org/10.15585/mmwr.ss7202a1
- Durkin MS, Maenner MJ, Baio J, et al. Autism spectrum disorder among US children (2002-2010): socioeconomic, racial, and ethnic disparities. Am J Public Health 2017;107:1818-26. PMID:28933930 https://doi. org/10.2105/AJPH.2017.304032
- Christensen DL, Bilder DA, Zahorodny W, et al. Prevalence and characteristics of autism spectrum disorder among 4-year-old children in the Autism and Developmental Disabilities Monitoring Network. J Dev Behav Pediatr 2016;37:1-8. PMID:26651088 https://doi.org/10.1097/ DBP. 0000000000000235
- Shaw KA, Maenner MJ, Baio J, et al. Early identification of autism spectrum disorder among children aged 4 years-Early Autism and Developmental Disabilities Monitoring Network, six sites, United States, 2016. MMWR Surveill Summ 2020;69(No. SS-3):1-11. PMID:32214075 https://doi.org/10.15585/mmwr.ss6903a1
- Shaw KA, Maenner MJ, Bakian AV, et al. Early identification of autism spectrum disorder among children aged 4 years-Autism and Developmental Disabilities Monitoring Network, 11 sites, United States, 2018. MMWR Surveill Summ 2021;70(No. SS-10):1-14. PMID:34855727 https://doi.org/10.15585/mmwr.ss7010a1
- Shaw KA, Bilder DA, McArthur D, et al. Early identification of autism spectrum disorder among children aged 4 years-Autism and Developmental Disabilities Monitoring Network, 11 sites, United States, 2020. MMWR Surveill Summ 2023;72(No. SS-1):1-15. PMID:36952289 https://doi.org/10.15585/mmwr.ss7201a1
- Consolidation Appropriations Act, 2023, Pub. L. 117-328, 136 Stat. 4459 (Dec. 29, 2022).
- Maenner MJ, Shaw KA, Bakian AV, et al. Prevalence and characteristics of autism spectrum disorder among children aged 8 years-Autism and Developmental Disabilities Monitoring Network, 11 sites, United States, 2018. MMWR Surveill Summ 2021;70(No. SS-10):1-16. PMID:34855725 https://doi.org/10.15585/mmwr.ss7011a1
- US Census Bureau. American Community Survey index [Internet]. Suitland, MD: US Department of Commerce, US Census Bureau; 2022. https://www.census.gov/programs-surveys/acs/data.html
- CDC, Agency for Toxic Substances and Disease Registry. CDC/ATSDR SVI 2022 documentation. Atlanta, GA: US Department of Health and Human Services, CDC; 2024. https://atsdr.cdc.gov/place-health/php/ svi/svi-data-documentation-download.html
- US Census Bureau. QuickFacts: Puerto Rico. Suitland, MD: US Department of Commerce, US Census Bureau; 2024. https://www. census.gov/quickfacts/fact/table/PR/RHI725223#RHI725223
- Pierce K, Gazestani V, Bacon E, et al. Get SET Early to identify and treatment refer autism spectrum disorder at 1 year and discover factors that influence early diagnosis. J Pediatr 2021;236:179-88. PMID:33915154 https://doi.org/10.1016/j.jpeds.2021.04.041
- Commonwealth of Pennsylvania, Department of Human Services. Medicaid for children with special needs. Harrisburg, PA: Commonwealth of Pennsylvania, Department of Human Services; 2024. https://www. pa.gov/agencies/dhs/resources/medicaid/medicaid-children-special-needs-ph95.html
- Departamento de Salud. Autismo: Red para la Vigilancia de Autismo y Desórdenes del Desarrollo guías y manuales [Spanish]. San Juan, PR: Departamento de Salud; 2024. https://www.salud.pr.gov/CMS/242
- Maternal and Child Health Bureau. State application/annual report. Rockville, MD: US Department of Health and Human Services, Health Resources and Services, Maternal and Child Health Bureau; 2024. https://mchb.tvisdata.hrsa.gov/Home/StateApplicationOrAnnualReport
- Departamento de Salud. Pasaporte a la Salud. San Juan, PR: Departamento de Salud; 2023. https://www.salud.pr.gov/CMS/ DOWNLOAD/8184
- Patrick ME, Williams AR, Shaw KA, et al. Social vulnerability and the prevalence of autism spectrum disorder among 8 -year-old children, Autism and Developmental Disabilities Monitoring Network, 2020. Ann Epidemiol 2025;104:8-14. PMID:40024386 https://doi.org/10.1016/j. annepidem.2025.02.014
- QuickStats: percentage of children and adolescents aged 3-17 years who ever received a diagnosis of autism spectrum disorder, by family income, 2020-2022. MMWR Morb Mortal Wkly Rep 2024;73:358. PMID:38635498 https://doi.org/10.15585/mmwr.mm7315a5
- Roman-Urrestarazu A, van Kessel R, Allison C, Matthews FE, Brayne C, Baron-Cohen S. Association of race/ethnicity and social disadvantage with autism prevalence in 7 million school children in England. JAMA Pediatr 2021;175:e210054. PMID:33779707 https://doi.org/10.1001/ jamapediatrics.2021.0054
- Winter AS, Fountain C, Cheslack-Postava K, Bearman PS. The social patterning of autism diagnoses reversed in California between 1992 and 2018. Proc Natl Acad Sci U S A 2020;117:30295-302. PMID:33199592 https://doi.org/10.1073/pnas. 2015762117
- US Department of Health and Human Services, Office of Disease Prevention and Health Promotion. Healthy People 2030 social determinants of health. Washington DC: US Department of Health and Human Services; 2022. https://odphp.health.gov/healthypeople/ priority-areas/social-determinants-health
- Durkin MS, Yeargin-Allsopp M. Socioeconomic status and pediatric neurologic disorders: current evidence. Semin Pediatr Neurol 2018;27:16-25. PMID:30293586 https://doi.org/10.1016/j. spen.2018.03.003
- Patrick ME, Shaw KA, Dietz PM, et al. Prevalence of intellectual disability among eight-year-old children from selected communities in the United States, 2014. Disabil Health J 2021;14:101023. PMID:33272883 https://doi.org/10.1016/j.dhjo.2020.101023
- Rogers EE, Hintz SR. Early neurodevelopmental outcomes of extremely preterm infants. Semin Perinatol 2016;40:497-509. PMID:27865437 https://doi.org/10.1053/j.semperi.2016.09.002
- Barfield WD. Public health implications of very preterm birth. Clin Perinatol 2018;45:565-77. PMID:30144856 https://doi.org/10.1016/j. clp.2018.05.007
- Institute of Medicine (US) Committee on Understanding Premature Birth and Assuring Healthy Outcomes. Behrman RE, Butler AS, eds. Sociodemographic and community factors contributing to preterm birth [Chapter 4]. In: Preterm birth: causes, consequences, and prevention. Washington, DC: National Academies Press (US); 2007:124-47.
- Lorch SA, Enlow E. The role of social determinants in explaining racial/ ethnic disparities in perinatal outcomes. Pediatr Res 2016;79:141-7. PMID:26466077 https://doi.org/10.1038/pr.2015.199
- Martin JA, Osterman MJK. Shifts in the distribution of births by gestational age: United States, 2014-2022. Natl Vital Stat Rep 2024;73:1-11. PMID:38300755
- Johnson LW, Diaz I. Exploring the social determinants of health and health disparities in traumatic brain injury: a scoping review. Brain Sci 2023;13:707. PMID:37239178 https://doi.org/10.3390/ brainsci13050707
- Muller C, Sampson RJ, Winter AS. Environmental inequality: the social causes and consequences of lead exposure. Annu Rev Sociol 2018;44:263-82. https://doi.org/10.1146/annurev-soc-073117-041222
- Fuller EA, Oliver K, Vejnoska SF, Rogers SJ. The effects of the Early Start Denver Model for children with autism spectrum disorder: a meta-analysis. Brain Sci 2020;10:368. PMID:32545615 https://doi. org/10.3390/brainsci10060368
- Shaw KA, McArthur D, Hughes MM, et al. Progress and disparities in early identification of autism spectrum disorder: Autism and Developmental Disabilities Monitoring Network, 2002-2016. J Am Acad Child Adolesc Psychiatry 2022;61:905-14. PMID:34838692 https://doi.org/10.1016/j.jaac.2021.11.019
- American Academy of Pediatrics. National payer advocacy letter. Itasca, IL: American Academy of Pediatrics; 2024. https://downloads.aap.org/ AAP/PDF/AAP%20Autism%20Spectrum%20Disorder%20Payer%20 Advocacy%20Letter.pdf
- State of Georgia. Georgia Medicaid. TEFRA/Katie Beckett. Atlanta, GA: State of Georgia; 2022. https://medicaid.georgia.gov/programs/ all-programs/tefrakatie-beckett
- Pierce K, Gazestani VH, Bacon E, et al. Evaluation of the diagnostic stability of the early autism spectrum disorder phenotype in the general population starting at 12 months. JAMA Pediatr 2019;173:578-87. PMID:31034004 https://doi.org/10.1001/jamapediatrics.2019.0624
- Hughes MM, Pas ET, Durkin MS, et al. Health conditions, education services, and transition planning for adolescents with autism. Pediatrics 2024;153:e2023063672. PMID:38501189 https://doi.org/10.1542/ peds.2023-063672
- Shaw KA, Williams S, Hughes MM, et al. Statewide county-level autism spectrum disorder prevalence estimates-seven U.S. states, 2018. Ann Epidemiol 2023;79:39-43. PMID:36669598 https://doi.org/10.1016/j. annepidem.2023.01.010
| Site | Surveillance area description | Types of data sources used* | % population coverage of education data sources
|
% of cases with records available for abstraction at
|
Total population | No. with ASD | ASD prevalence (95% CI)
|
| Arizona | Part of one county in metropolitan Phoenix | Health and education | 100 | 100 | 6,709** | 210 | 31.3 (27.4-35.7) |
| Arkansas | 21 counties in central Arkansas | Health and education | 100 | 99.8 | 15,319 | 457 | 29.8 (27.3-32.6) |
| California | Part of one county in metropolitan San Diego | Health, education, early intervention, and state developmental disability services | 100 | 100 | 15,212** | 807 | 53.1 (49.6-56.7) |
| Georgia | Three counties in metropolitan Atlanta | Health and education | 97.3 | 80.3 | 35,213 | 1,149 | 32.6 (30.8-34.5) |
| Indiana | One county in metropolitan Indianapolis | Health and education | 100 | –
|
13,155 | 241 | 18.3 (16.2-20.8) |
| Maryland | Five counties in the Baltimore area | Health, education, and early intervention | 100 | 99.8 | 21,206 | 558 | 26.3 (24.2-28.6) |
| Minnesota | Parts of three counties in the Twin Cities metropolitan area | Health and education | 100 | 91.2 | 17,331** | 616 | 35.5 (32.9-38.4) |
| Missouri | Three counties in metropolitan St. Louis | Health and education | 68.0 | 100 | 19,968 | 640 | 32.1 (29.7-34.6) |
| New Jersey | Two counties in the New York metropolitan area | Health, education, and early intervention | 100 | 97.9 | 18,334 | 623 | 34.0 (31.5-36.7) |
| Pennsylvania | One county in suburban Philadelphia | Health, education, early intervention, and Medicaid claims including state-funded long-term care programs | 100 | 83.9 | 7,066 | 335 | 47.4 (42.7-52.6) |
| Puerto Rico | 32 municipalities in north, east, south, and central regions of Puerto Rico | Health, education, early intervention, Medicaid claims, and autism registry | 100 | 98.7 | 17,457 | 461 | 26.4 (24.1-28.9) |
| Tennessee | 11 counties in middle Tennessee | Health and education | 100 | 88.8 | 26,182 | 889 | 34.0 (31.8-36.2) |
| Texas (Austin
|
Part of one county in south central Texas | Health and education | 100 | 84.7 | 4,356** | 85 | 19.5 (15.8-24.1) |
| Texas (Laredo) | One county in south Texas | Health and education | 99.7 | 83.0 | 4,856 | 47 | 9.7 (7.3-12.8) |
| Utah | Three counties in northern Utah | Health, education, early intervention, and habilitative services | 100 | 89.8 | 24,395 | 658 | 27.0 (25.0-29.1) |
| Wisconsin | Eight counties in southeastern Wisconsin | Health, education, early intervention, Medicaid claims, and state-funded long-term care program | 100 | 77.8 | 28,098 | 1,078 | 38.4 (36.2-40.7) |
| Total | 90.9 ॥ | 274,857 | 8,854 | 32.2 (31.6-32.9) |
| Site/Characteristic | Total no. with ASD | With IQ information | Median age of most recent IQ test (months) | Cognitive level | ||
| No. (%) |
|
IQ 71-85 (%) |
|
|||
| Site | ||||||
| Arizona | 210 | 163 (77.6) | 82 | 51 (31.3) | 48 (29.4) | 64 (39.3) |
| Arkansas | 457 | 412 (90.2) | 76 | 179 (43.4) | 87 (21.1) | 146 (35.4) |
| California | 807 | 658 (81.5) | 64 | 187 (28.4) | 179 (27.2) | 292 (44.4) |
| Georgia | 1,149 | 625 (54.4) | 56 | 306 (49.0) | 147 (23.5) | 172 (27.5) |
| Maryland | 558 | 426 (76.3) | 77 | 186 (43.7) | 114 (26.8) | 126 (29.6) |
| Minnesota | 616 | 436 (70.8) | 72.5 | 163 (37.4) | 91 (20.9) | 182 (41.7) |
| Missouri | 640 | 415 (64.8) | 67 | 135 (32.5) | 110 (26.5) | 170 (41.0) |
| New Jersey | 623 | 345 (55.4) | 64 | 141 (40.9) | 92 (26.7) | 112 (32.5) |
| Pennsylvania | 335 | 204 (60.9) | 62 | 69 (33.8) | 62 (30.4) | 73 (35.8) |
| Puerto Rico | 461 | 314 (68.1) | 85 | 78 (24.8) | 59 (18.8) | 177 (56.4) |
| Tennessee | 889 | 549 (61.8) | 49 | 272 (49.5) | 148 (27.0) | 129 (23.5) |
| Texas (Austin) | 85 | 54 (63.5) | 45 | 38 (70.4) | -** | – |
| Texas (Laredo) | 47 | 10 (21.3) | 80.5 | 8 (80.0) | – | – |
| Utah | 658 | 360 (54.7) | 71.5 | 124 (34.4) | 84 (23.3) | 152 (42.2) |
| Wisconsin | 1,078 | 321 (29.8) | 58 | 161 (50.2) | 52 (16.2) | 108 (33.6) |
| Total | 8,613 | 5,292 (61.4) | 67 | 2,098 (39.6) | 1,282 (24.2) | 1,912 (36.1) |
| Sex
|
||||||
| Female | 1,868 | 1,140 (61.0) | 66 | 460 (40.4) | 282 (24.7) | 398 (34.9) |
| Male | 6,732 | 4,152 (61.7) | 68 | 1,638 (39.5) | 1,000 (24.1) | 1,514 (36.5) |
| Race and ethnicity
|
||||||
| AI/AN | 32 | 22 (68.8) | 61 | 11 (50.0) | – | – |
| A/PI | 627 | 394 (62.8) | 68 | 173 (43.9) | 89 (22.6) | 132 (33.5) |
| Black | 2,024 | 1,200 (59.3) | 62 | 634 (52.8) | 313 (26.1) | 253 (21.1) |
| Hispanic | 2,289 | 1,405 (61.4) | 71 | 545 (38.8) | 353 (25.1) | 507 (36.1) |
| Multiracial | 396 | 263 (66.4) | 67 | 82 (31.2) | 65 (24.7) | 116 (44.1) |
| White | 3,132 | 1,975 (63.1) | 68 | 646 (32.7) | 452 (22.9) | 877 (44.4) |
-
(the ADDM Network includes 16 sites; Indiana is not included because the site did not have data from record abstraction available).
Excludes children with unknown sex ( ).
Excludes children of other or unknown race ( ). Persons of Hispanic origin might be of any race but are categorized as Hispanic; all racial groups are non-Hispanic.
Includes 25 children stated to have an IQ score > 70 but specific score was not given.
** Dashes indicate suppressed estimate because relative standard error wasof the estimate.
Pearson chi-square test for proportion of males versus females with ASD and IQ information ( ); proportion of males versus females with ASD and IQ .
Significant differences for Pearson chi-square tests for proportion of Black versus multiracial or White children with ASD and IQ information available (each comparison ).
I Significant differences for Pearson chi-square tests for proportion of Black children with IQ among children with ASD versus A/PI, Hispanic, multiracial, or White (each comparison ); A/PI children with IQ among children with ASD versus multiracial or White (each comparison ); Hispanic children with among children with ASD versus multiracial ( ) or White children ( ).
| Site | Total no. with ASD | No. with evaluation (%) | No. with evaluation at
|
No. with diagnosis | Median age of earliest documented diagnosis among children with an ASD diagnostic statement (mos) | ||
| All |
|
IQ
|
|||||
| Arizona | 210 | 191 (91.0) | 104 (54.5) | 139 | 45 | 38.5 | 47 |
| Arkansas | 457 | 457 (100.0) | 228 (49.9) | 421 | 53 | 48 | 60 |
| California | 807 | 801 (99.3) | 448 (55.9) | 643 | 36 | 36 | 35 |
| Georgia | 1,149 | 770 (67.0) | 340 (44.2) | 608 | 48 | 45 | 48.5 |
| Maryland | 558 | 546 (97.8) | 337 (61.7) | 460 | 48 | 38 | 52 |
| Minnesota | 616 | 514 (83.4) | 250 (48.6) | 332 | 52.5 | 43 | 63 |
| Missouri | 640 | 640 (100.0) | 270 (42.2) | 503 | 46 | 51 | 49.5 |
| New Jersey | 623 | 599 (96.1) | 314 (52.4) | 562 | 43 | 41 | 44 |
| Pennsylvania | 335 | 269 (80.3) | 171 (63.6) | 183 | 39 | 38 | 39 |
| Puerto Rico | 461 | 455 (98.7) | 268 (58.9) | 438 | 54 | 60 | 59.5 |
| Tennessee | 889 | 713 (80.2) | 302 (42.4) | 550 | 49.5 | 38 | 50 |
| Texas (Austin) | 85 | 67 (78.8) | 41 (61.2) | 35 | 42 | 38.5 | 46.5 |
| Texas (Laredo) | 47 | 32 (68.1) | –
|
30 | 69.5 | 75 | 34 |
| Utah | 658 | 576 (87.5) | 245 (42.5) | 497 | 54 | 46 | 58.5 |
| Wisconsin | 1,078 | 597 (55.4) | 315 (52.8) | 486 | 43 | 38 | 50 |
| Total | 8,613 | 7,227 (83.9) | 3,638 (50.3) | 5,887 | 47 | 43 | 49 |
| Site* | Denominator for children aged 4 yrs | ASD cases among children aged 4 yrs | ASD prevalence among children aged 4 yrs (
|
ASD prevalence ratio comparing children aged 4 yrs with children aged 8 yrs (
|
| Arizona | 6,286 | 122 | 19.4 (16.3-23.1) | 0.6 (0.5-0.8)
|
| Arkansas | 14,644 | 360 | 24.6 (22.2-27.2) | 0.8 (0.7-0.9)
|
| California | 14,936 | 905 | 60.6 (56.9-64.5) | 1.1 (1.0-1.3)
|
| Georgia | 33,592 | 684 | 20.4 (18.9-21.9) | 0.6 (0.6-0.7)
|
| Indiana | 13,346 | 172 | 12.9 (11.1-14.9) | 0.7 (0.6-0.9)
|
| Maryland | 20,005 | 483 | 24.1 (22.1-26.4) | 0.9 (0.8-1.0) |
| Minnesota | 17,069 | 426 | 25.0 (22.7-27.4) | 0.7 (0.6-0.8)
|
| Missouri | 19,298 | 478 | 24.8 (22.7-27.1) | 0.8 (0.7-0.9)
|
| New Jersey | 18,260 | 665 | 36.4 (33.8-39.2) | 1.1 (1.0-1.2)
|
| Pennsylvania | 6,653 | 284 | 42.7 (38.1-47.8) | 0.9 (0.8-1.1) |
| Puerto Rico | 12,849 | 607 | 47.2 (43.7-51.0) | 1.8 (1.6-2.0)
|
| Tennessee | 26,363 | 958 | 36.3 (34.1-38.7) | 1.1 (1.0-1.2)
|
| Texas (Austin) | 4,405 | 74 | 16.8 (13.4-21.0) | 0.9 (0.6-1.2) |
| Texas (Laredo) | 4,357 | 62 | 14.2 (11.1-18.2) | 1.5 (1.0-2.1)
|
| Utah | 21,807 | 397 | 18.2 (16.5-20.1) | 0.7 (0.6-0.8)
|
| Wisconsin | 27,042 | 980 | 36.2 (34.1-38.5) | 0.9 (0.9-1.0) |
| Total | 260,912 | 7,657 | 29.3 (28.7-30.0) | 0.9 (0.9-0.9)
|
Readers who have difficulty accessing this PDF file may access the HTML file at https://www.cdc.gov/mmwr/volumes/74/ss/ss7402a1.htm?s_ cid=ss7402al_w. Address all inquiries about the
All material in the
Use of trade names and commercial sources is for identification only and does not imply endorsement by the U.S. Department of Health and Human Services.
References to non-CDC sites on the Internet are provided as a service to
- Corresponding author: Kelly A. Shaw, National Center on Birth Defects and Developmental Disabilities, CDC. Telephone: 404-498-2729; Email: nrb7@cdc.gov.
- Abbreviation: ASD = autism spectrum disorder; MHI = median household income.
- Per 1,000 children aged 8 years.
Dots are point estimates and horizontal lines are CIs. Neighborhood MHI tertiles low , medium ( ), high ( ). Estimates for Puerto Rico medium and high MHI tertiles and Texas (Austin) and Texas (Laredo) high MHI tertiles were suppressed because relative standard error was of the estimate.
Cochran-Armitage test of trend for association between MHI tertile and ASD prevalence, by site and overall: Arizona ; Arkansas ; California ; Georgia ; Indiana ; Maryland ; Minnesota ; Missouri ; New Jersey ; Pennsylvania ; Puerto Rico ; Tennessee ; Texas (Austin) ; Texas (Laredo) ; Utah ; Wisconsin ; Total (not monotonic). Ns and prevalence for each MHI tertile by site are available (Supplementary Table 4, https://stacks.cdc.gov/view/cdc/177099#tabs-3).
- Per 1,000 children aged 8 years.
- Abbreviations: ASD = autism spectrum disorder; ICD = International Classification of Diseases.
- Per 1,000 children aged 8 years.
Data from record abstraction were not available for Indiana.
Horizontal line is the overall Autism and Developmental Disabilities Monitoring Network prevalence of 32.2 per 1,000 children aged 8 years. Children with documented ASD statements could also have ASD eligibility in special education or ASD ICD codes. Underlying data are available (Supplementary Table 6, https://stacks.cdc.gov/ view/cdc/177099#tabs-3).
- Per 1,000 children aged 8 years.
- Per 1,000 children aged 4 or 8 years.
The ADDM Network has 16 sites; Indiana is not included because the site did not have data from record abstraction available.
Not all children aged 4 years reach age 60 months and not all children aged 8 years reach age 108 months during the surveillance year.
Data comparing cumulative incidence of autism spectrum disorder diagnosis or autism special education eligibility by age 48 months among children aged 4 or 8 years are available (Supplementary Table 10, https://stacks.cdc.gov/view/cdc/177099#tabs-3).
- Per 1,000 children aged 4 or 8 years.
- Per 1,000 children aged 4 or 8 years.
The ADDM Network has 16 sites; Indiana is not included because the site did not have data from record abstraction available.
For children aged 4 years, year 0 to year 4 represents 2018-2022; for children aged 8 years, year 0 to year 4 represents 2014-2018. The dashed line shows the COVID-19 pandemic onset for children aged 4 years in 2022 compared with the analogous time window for children aged 8 years in 2022.
- Per 1,000 children aged 4 or 8 years.
- Abbreviations: ADI-R = Autism Diagnostic Interview-Revised; ADOS = Autism Diagnostic Observation Schedule; ASD = autism spectrum disorder; ASRS = Autism Spectrum Rating Scales; CARS = Childhood Autism Rating Scale; GARS = Gilliam Autism Rating Scale; SRS = Social Responsiveness Scale; other test category includes Asperger Syndrome Diagnostic Scale, Gilliam Asperger’s Disorder Scale, and TELE-ASD-PEDS.
-
(the ADDM Network has 16 sites; Indiana is not included because the site did not have data from record abstraction available).
-
- Abbreviations: ASD = autism spectrum disorder.
- Health sources include records from medical and service providers that evaluate children with developmental disabilities.
For public schools in the surveillance area.
The percentage of children with electronic or physical records available from source for abstraction. Certain data sources (e.g., Medicaid) are administrative in nature and do not have physical or electronic records such as developmental evaluations available for review.
Cls were calculated using the Wilson score method.
** Denominator excludes tracts that were not included in the surveillance area using American Community Survey data.
Indiana did not have data from record abstraction available.
Site name reflects the location of the surveillance team and not the surveillance area.
III The total number of cases with records available for abstraction atsource was 7,831 and total number of cases from sites with data from record abstraction available was 8,613.
- Health sources include records from medical and service providers that evaluate children with developmental disabilities.
- Abbreviations: ASD = autism spectrum disorder; IQ = intelligence quotient.
-
(the ADDM Network has 16 sites; Indiana is not included because the site did not have data from record abstraction available).
Includes only children with IQ information available.
Estimate suppressed because relative standard error was of the estimate.
-
- Abbreviation: ASD = autism spectrum disorder.
- Surveillance areas and data sources are the same for children aged 4 and aged 8 years.
CIs were calculated using the Wilson score method.
Significant prevalence ratio (95% Cl excludes 1.0).
- Surveillance areas and data sources are the same for children aged 4 and aged 8 years.