تتلقى مخرجات البحث ذات الوصول المفتوح اقتباسات أكثر تنوعًا Open access research outputs receive more diverse citations

المجلة: Scientometrics، المجلد: 129، العدد: 2
DOI: https://doi.org/10.1007/s11192-023-04894-0
تاريخ النشر: 2024-01-08

تتلقى مخرجات البحث ذات الوصول المفتوح اقتباسات أكثر تنوعًا

تشون-كاي هوانغ (د) . كاميرون نيلون (د) . لوسي مونتغومري (د) .ريتشارد هوسكينغ جيمس ب. ديبروز

تاريخ الاستلام: 10 يناير 2023 / تاريخ القبول: 30 نوفمبر 2023 / تاريخ النشر على الإنترنت: 8 يناير 2024
© المؤلف(ون) 2024

الملخص

الهدف من الوصول المفتوح هو السماح لمزيد من الأشخاص بقراءة واستخدام مخرجات البحث. وقد تم الادعاء بوجود ارتباط ملحوظ بين مخرجات البحث ذات الاقتباسات العالية والوصول المفتوح كدليل على زيادة استخدام البحث، لكن هذا لا يزال مثيرًا للجدل. كما أن عدد الاقتباسات الأعلى لا يعني بالضرورة استخدامًا أوسع مثل الاقتباسات من مؤلفين من أماكن أكثر. هناك فجوة معرفية في فهمنا لمن يحصل على استخدام مخرجات البحث ذات الوصول المفتوح وأين يقع المستخدمون. هنا نتناول هذه الفجوة من خلال دراسة العلاقة بين حالة الوصول المفتوح لمخرجات البحث وتنوع مخرجات البحث التي تقتبسها. من خلال تحليل بيانات ببليوغرافية واسعة النطاق من 2010 إلى 2019، وجدنا ارتباطًا قويًا بين الوصول المفتوح وزيادة تنوع مصادر الاقتباس من قبل المؤسسات والدول والمناطق الفرعية والمناطق وحقول البحث، عبر مخرجات ذات عدد اقتباسات عالي ومتوسط-منخفض. أظهر الوصول المفتوح من خلال المستودعات التخصصية أو المؤسسية تأثيرًا أقوى من الوصول المفتوح عبر منصات الناشرين. تضيف هذه الدراسة منظورًا جديدًا لفهمنا لكيفية استخدام الاقتباسات لاستكشاف آثار الوصول المفتوح. كما توفر دليلًا جديدًا على نطاق عالمي لفوائد الوصول المفتوح كآلية لتوسيع استخدام البحث وزيادة تنوع المجتمعات التي تستفيد منه.

الكلمات المفتاحية الوصول المفتوح تحليل الاقتباسات تنوع الاقتباسات استخدام المقالات تأثير البحث العلوم المفتوحة

المقدمة

الغرض من البحث هو أن يتم استخدامه، إما لتطبيقه لحل المشكلات ومعالجة القضايا، أو بشكل أكثر ضيق لتوفير رؤى وقدرات وإلهام لمزيد من البحث. تأسست حركة الوصول المفتوح (OA) على أهداف وضع البحث في أيدي المزيد من الناس وجعله أكثر قابلية للاستخدام (على سبيل المثال، مبادرة بودابست OA) (تشان وآخرون،
2002). حدث تحول زلزالي في نماذج الوصول لمخرجات البحث الأكاديمية (أي، من نماذج قائمة على الاشتراك إلى نماذج OA) على مدار العقد الماضي مع ارتفاع المخرجات القابلة للوصول (أي يمكن قراءتها أو تنزيلها دون دفع) من حوالي من المخرجات العالمية المنشورة في 2011 إلى أكثر من من جميع المخرجات المنشورة في 2020 التي كانت قابلة للوصول بشكل ما (نيلون وهوانغ، 2022).
لا يزال من الصعب إثبات فوائد هذا التحول في نماذج الوصول لمخرجات البحث الأكاديمية بشكل قاطع. ساعدت دراسات الحالة والنهج البحثية النوعية في تسليط الضوء على العلاقات المعقدة بين نماذج الوصول والاستخدام والتأثير. سعت الدراسات إلى الحصول على أدلة كمية على زيادة الاستخدام من خلال مجموعة متنوعة من الطرق. وقد لاحظ البعض وجود ارتباطات بين زيادة عدد الاقتباسات وOA، مما يوفر أكثر الأدلة العالمية على زيادة استخدام المقالات (أرشامبو وآخرون، 2014؛ باوتيستا-بويغ وآخرون، 2020؛ بيوار وآخرون، 2018). ومع ذلك، هناك عدة عوامل مشوشة تضعف الادعاءات بوجود رابط سببي بين OA وزيادة استخدام مخرجات البحث (باسون وآخرون، 2021؛ دورتا-غونزاليس وآخرون، 2017). مجموعة من التجارب العشوائية المحددة بشكل ضيق لا تجد أي تأثير (ديفيس، 2011)، وهناك حجة بأن الوصول إلى الموارد الأكاديمية والهيبة قد يكون مرتبطًا بكل من الاختيار لجعل مخرجات OA واحتمالية الحصول على اقتباسات أعلى (هوا وآخرون، 2016؛ لويس، 2018؛ سوتوده، 2020؛ زانغ وواتسون، 2017).
بالإضافة إلى ذلك، نشعر أن التركيز على عدد الاقتباسات يفشل في معالجة الأهداف الأساسية لـ OA، على وجه التحديد أن مجموعة أوسع من مستخدمي البحث لديها وصول أكبر (داهلر-لارسن، 2018؛ لينكوف وآخرون، 2021؛ نيلون وآخرون، 2021). نحتاج إلى نهج مختلف لتحديد تأثير OA مع التركيز على توسيع تنوع المستخدمين القادرين على الوصول إلى المحتوى الأكاديمي. تعني التقدمات الأخيرة في توفر البيانات ومعالجتها أننا قادرون الآن على تحديد انتماءات المؤلفين المقتبسين على نطاق واسع وبالتالي تقييم التنوع المؤسسي والجغرافي للمؤلفين المقتبسين عالميًا بشكل كمي. وبالمثل، يمكننا تحليل مجالات البحث عبر المخرجات المقتبسة. نشير إلى هذه التدابير تحت مصطلح شامل واحد: تنوع الاقتباسات.

البحث ذي الصلة

هناك كمية محدودة من الأدبيات الأكاديمية التي تحقق في العلاقات بين OA وتأثيره المحتمل على توسيع النشر الجغرافي والتخصصي واستخدام البحث. العملان الأكثر ارتباطًا هما يونغ وبراندس (2020) ونيلون وآخرون (2021). أفاد الأول أن مقالات OA تلقت اقتباسات أكثر تنوعًا بين التخصصات مقارنة بالمقالات غير OA، على الرغم من أنه تم دراسة بيانات من مجلتين فقط. أظهر نيلون وآخرون (2021) أن الكتب ذات الوصول المفتوح حصلت على استخدام أكثر تنوعًا (عبر المواقع الجغرافية للتنزيلات) مقارنة بالكتب المغلقة. أظهرت هذه الدراسة ليس فقط أن الكتب ذات الوصول المفتوح يتم الاقتباس منها وتنزيلها أكثر من نظيراتها المغلقة، ولكن أيضًا أنها يتم تنزيلها من قبل جمهور أوسع. استكشفت بعض الدراسات الأخرى (على الرغم من أنها أقل اهتمامًا بـ OA) تنوع المراجع والتعاون في التأليف. اقترح لينكوف وآخرون (2021) مؤشر التنوع اللغوي كقياس علمي لتنوع المصادر اللغوية المقتبسة في المقالات. يهدف هذا المؤشر إلى تشجيع استخدام المصادر من مجموعات ثقافية أكثر تنوعًا، مع وضع أهمية أكبر على المجموعات الثقافية الممثلة بشكل نادر. أظهر ناك وآخرون (2023) أن التنوع الجغرافي (من خلال شبكة النقل الجوي) في التعاون في التأليف له تأثير إيجابي على عدد الاقتباسات، على الرغم من اختلاف مستويات القوة عبر مجالات الموضوع المختلفة. تسلط هذه الأعمال الضوء على كيفية مساعدة مقاييس التنوع في تعزيز فهمنا لمشهد النشر الأكاديمي. يظهر أن التنوع له علاقات محتملة مع عدد الاقتباسات ومستويات الاستخدام ومستويات OA لمخرجات البحث.
ومع ذلك، توجد فجوة معرفية في الدراسة الشاملة والواسعة النطاق لتنوع الاقتباسات من حيث الجغرافيا وكيفية ارتباطها بـ OA.

المساهمة

الهدف من المقالة الحالية هو معالجة الفجوة المذكورة أعلاه من خلال استكشاف العلاقات بين OA وتنوع الاقتباسات. نقوم بذلك من خلال دراسة المواقع الجغرافية لانتماءات المؤلفين، وحقول البحث، للمخرجات المقتبسة. نستخدم تنوع هذه المخرجات المقتبسة كبديل لتوسيع نشر البحث. من خلال ذلك، هدفنا هو تحديد تأثير OA على الاستخدام الأوسع للبحث. تمتد الدراسة إلى العمل السابق وتضيف إلى الأدبيات بالطرق التالية:
  • تمتد الدراسة بمفهوم تنوع الاقتباسات لتشمل المواقع الجغرافية لانتماءات المؤلفين للمخرجات المقتبسة بالإضافة إلى حقول البحث.
  • تستند الدراسة إلى مجموعات بيانات متاحة للجمهور تشمل 19 مليون مخرج بحثي و420 مليون رابط اقتباس على مستوى العالم، مما يجعلها أكبر دراسة من نوعها حتى الآن.
  • تمكن البيانات واسعة النطاق الدراسة من استكشاف قوة النتائج من خلال مقارنة النتائج عبر الزمن، وقياسات التنوع المختلفة، ومجموعات مختلفة من روابط الاقتباس والانتماء، وعدد الاقتباسات، وفحص اعتماداتها.
  • تأخذ الدراسة أيضًا استكشافًا أوليًا في فحص ما إذا كانت هناك اختلافات عبر المناطق الجغرافية من حيث كيفية تأثير OA على تنوع الاقتباسات (على سبيل المثال، من أين تأتي الاقتباسات المتزايدة).
هيكل بقية المقالة كما يلي. في قسم “الطريقة”، نقدم تفاصيل البيانات والأساليب المستخدمة في هذه الدراسة. يتضمن قسم “النتائج” النتائج الرئيسية من التحليل، مع مناقشات ملخصة حول قوة النتائج المقدمة أيضًا في نهاية القسم. نقدم مناقشات مفصلة حول النتائج في قسم “المناقشة” بما في ذلك الآثار على مزيد من البحث. ينتهي قسم “الاستنتاج” الدراسة. يتم تقديم معلومات ونتائج إضافية في المواد التكميلية.

الطريقة

نقوم بتحديد تنوع الاقتباسات باستخدام مقياسين قياسيين مختلفين للتنوع يكونان أقل حساسية لعدد الاقتباسات. يساعدنا ذلك في معالجة قضايا الوصول إلى الموارد والهيبة التي قد تكون عوامل مشوشة (ديفيس، 2011؛ هوا وآخرون، 2016؛ لويس، 2018؛ سوتوده، 2020؛ زانغ وواتسون، 2017) في التحليلات المعتمدة ببساطة على عدد الاقتباسات، والتي تبقى مع مقاييس أكثر تعقيدًا مثل سرعة الاقتباس، كما هو موضح في الأبحاث السابقة (هتشينز وآخرون، 2016؛ سيبانيين وآخرون، 2022).
لتحليلنا، قمنا باستخراج جميع مخرجات البحث التي تتراوح سنوات نشرها من 2010 إلى 2019 (انظر قسم “بيانات الإدخال” للحصول على التفاصيل). لكل من 19 مليون مخرج، قمنا باستخراج عدد الاقتباسات (من إجمالي 420 مليون رابط اقتباس)، وبيانات التعريف لمخرجات الاقتباس والانتماءات المؤلفين، وحسابنا إنتروبيا شانون (أو مؤشر شانون) ومؤشر جيني-سيمبسون (أو مؤشر تنوع جيني) كمقاييس لتنوع الاقتباسات (انظر الجدول 1). تشير الدرجات الأعلى لهذه المؤشرات إلى مزيد من تنوع الاقتباسات. نعتبر تنوع الاقتباسات بناءً على خمس طرق مختلفة لتجميع روابط الاقتباس: حسب المؤسسات، البلدان، المناطق الفرعية، المناطق، وحقول البحث (أي، الفاعلين المقتبسين – انظر
الجدول 1 قائمة المصطلحات
المصطلح/المتغير التعريف وصف البيانات
مخرج الاقتباس (أو الورقة) إذا كان المخرج A يشير إلى المخرج B، فإن المخرج A هو مخرج اقتباس للمخرج B تحدد مخرجات الاقتباس باستخدام جدول روابط الاقتباس في MAG. يتم تضمين المخرجات التي تحتوي على DOIs من Crossref فقط
الفاعل المقتبس فاعل يمكن أن يرتبط به أو يتميز به مخرج الاقتباس، مثل المؤلف، انتماء المؤلف، بلد انتماء المؤلف، مجال البحث، إلخ بمجرد تحديد مخرج الاقتباس (كما هو موضح أعلاه)، يتم تحديد المؤلفين، انتماءات المؤلفين، وحقول البحث باستخدام MAG. ثم يتم تحديد المواقع الجغرافية لانتماءات المؤلفين (مثل، البلد، المنطقة الفرعية، المنطقة) باستخدام ROR
المؤلف المقتبس مؤلف لمخرج اقتباس انظر وصف البيانات لـ “الفاعل المقتبس”
المؤسسة المقتبسة مؤسسة مدرجة كانتماء مؤلف في مخرج اقتباس انظر وصف البيانات لـ “الفاعل المقتبس”
البلد المقتبس بلد المؤسسة المقتبسة انظر وصف البيانات لـ “الفاعل المقتبس”
المنطقة الفرعية المقتبسة المنطقة الفرعية للمؤسسة المقتبسة انظر وصف البيانات لـ “الفاعل المقتبس”
المنطقة المقتبسة المنطقة للمؤسسة المقتبسة انظر وصف البيانات لـ “الفاعل المقتبس”
عدد الاقتباسات عدد الاقتباسات (مخرجات الاقتباس) التي حصل عليها مخرج يتم حساب ذلك عن طريق عد عدد مخرجات الاقتباس. انظر وصف البيانات لـ “مخرجات الاقتباس”
حقول البحث مجال البحث (أو التخصص) المعين لمخرج معين نستخدم البيانات كما هو محدد بواسطة “حقول المستوى 0” في MAG تحت تسلسل MAG لـ “المفاهيم” المعينة للمخرجات. المستوى 0 هو أعلى المفاهيم الأبوية في تسلسل مفاهيم MAG، أي، أكثر المصطلحات عمومية
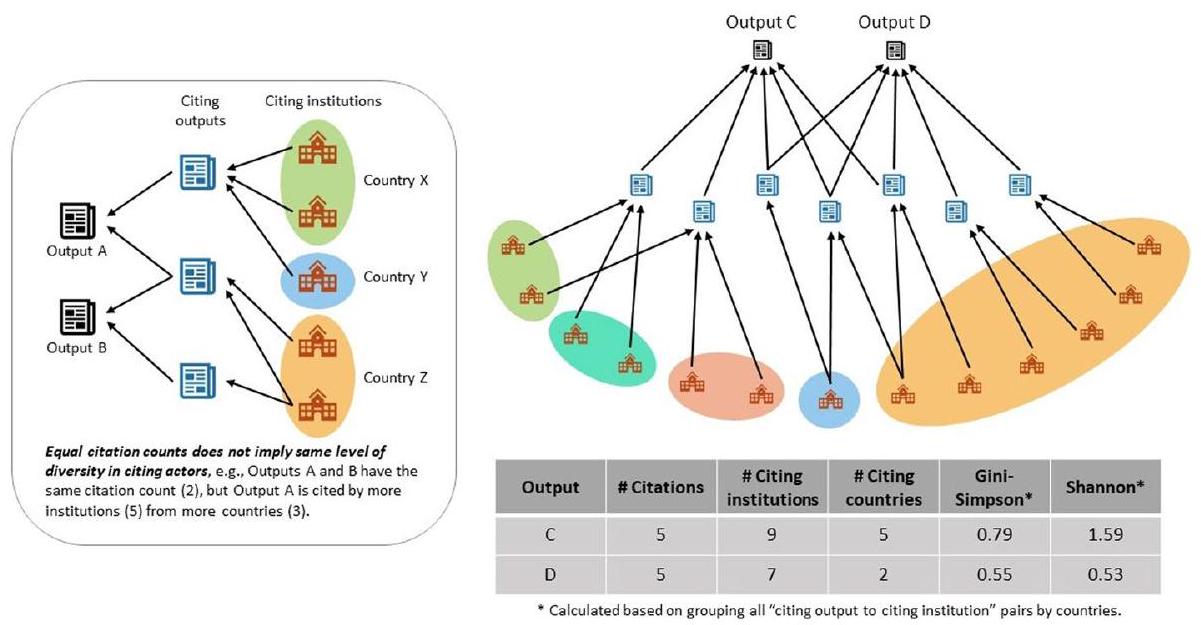
تنوع الاقتباسات مصطلح يصف مدى تنوع اقتباسات مخرج ما من حيث روابطها بالفاعلين المقتبسين هناك العديد من الطرق لتحديد تنوع روابط المخرج-الفاعل المقتبس. يتم استخدام مؤشر جيني-سيمبسون وإنتروبيا شانون لهذه الدراسة. يتم حسابها باستخدام روابط الاقتباس في MAG وتعيينات حقول البحث، وبيانات ROR التنظيمية
مؤشر جيني-سيمبسون (مؤشر تنوع جيني) مقياس تنوع يحدد احتمال أن تنتمي رابطتين عشوائيتين من المخرج إلى الفاعل المقتبس إلى نفس مجموعة الفاعلين المقتبسين بالنسبة لمخرج معين، يتم حساب مؤشر جيني-سيمبسون عن طريق وضع جميع روابط المخرج-الفاعل المقتبس في صناديق وفقًا لمجموعات مختلفة من الفاعلين المقتبسين (مثل، البلدان). ثم يتم حساب النسب لهذه الروابط في كل صندوق (بلد). أخيرًا، يتم تطبيق صيغة مؤشر جيني-سيمبسون
الجدول 1 (مستمر)
المصطلح/المتغير التعريف وصف البيانات
إنتروبيا شانون (مؤشر شانون) مقياس تنوع يحدد مستوى عدم اليقين في توقع تعيين مجموعة الفاعل المقتبس لرابط مخرج-فاعل مقتبس تم اختياره عشوائيًا يتم حساب ذلك بنفس العملية مثل مؤشر جيني-سيمبسون باستثناء استبدال الصيغة بصيغة إنتروبيا شانون
مخرجات الوصول المفتوح (OPEN) مخرجات يمكن الوصول إليها مجانًا عبر منصات الناشرين أو مستودعات الوصول المفتوح يتم تحديد حالة الوصول المفتوح لمخرج وفقًا لبيانات Unpaywall
مخرجات الذهب (GOLD) مخرجات يمكن الوصول إليها مجانًا عبر منصات الناشرين مع تراخيص مفتوحة يتم تحديد حالة الذهب لمخرج وفقًا لبيانات Unpaywall
مخرجات الأخضر (GREEN) مخرجات يمكن الوصول إليها مجانًا عبر مستودعات تخصصية ومؤسسية يتم تحديد حالة الأخضر لمخرج وفقًا لبيانات Unpaywall
مخرجات مغلقة (CLOSED) مخرجات لا تتوفر نسخ وصول مفتوح من منصات الناشرين أو مستودعات مفتوحة يتم تحديد حالة الوصول المفتوح لمخرج وفقًا لبيانات Unpaywall
ميزة الاقتباس من الوصول المفتوح (OACA) هذا بيان يعني أن الوصول المفتوح يزيد من عدد الاقتباسات التي يحصل عليها مخرج NA
ميزة تنوع الاقتباس من الوصول المفتوح هذا بيان يعني أن الوصول المفتوح يوسع تنوع الاقتباسات التي يحصل عليها مخرج NA
نسبة (%) التغيير في إجمالي الاقتباسات إجمالي الاقتباسات لمخرجات الوصول المفتوح ناقص إجمالي الاقتباسات لمخرجات غير الوصول المفتوح، ثم مقسومًا على إجمالي الاقتباسات لمخرجات غير الوصول المفتوح، ومضروبًا في مئة يتم حساب ذلك لمجموعة محددة من المخرجات المستهدفة، ومخرجات الاقتباس من فاعل مقتبس محدد. على سبيل المثال، قد نكون مهتمين بالاقتباسات من المنطقة الفرعية Y إلى المنطقة الفرعية . وبالتالي، يتم تقسيم المخرجات من المنطقة الفرعية إلى مخرجات OPEN وCLOSED. يتم تحديد عدد مخرجات الاقتباس لكل من هذه المخرجات من المنطقة الفرعية Y. ثم يتم حساب نسبة التغيير في إجمالي الاقتباسات
نسبة (%) المتوسط في الاقتباسات متوسط عدد الاقتباسات لمخرجات الوصول المفتوح، مقسومًا على متوسط عدد الاقتباسات لمخرجات غير الوصول المفتوح، ومضروبًا في مئة يتم حساب ذلك بطريقة مشابهة لما سبق، باستثناء أن عدد الاقتباسات يتم حسابه كمتوسط عبر عدد المخرجات المستهدفة في كل من مجموعات OPEN وCLOSED
تقدير كثافة النواة (KDEs) هذا تقدير غير معلمي لدالة الكثافة الاحتمالية لمتغير عشوائي معين. في دراستنا نهتم بمقارنة تقديرات الكثافة (KDEs) بين المخرجات المفتوحة والمخرجات المغلقة. تم إنشاء هذا باستخدام الدالة create_distplot في حزمة Plotly Figure Factory بلغة بايثون. وقد طبقنا هذا التقدير على 10,000 عينة من المخرجات المفتوحة و10,000 عينة من المخرجات المغلقة، على التوالي، لكل تركيب من مقياس التنوع، نوع الجهة المستشهدة، وسنوات النشر.
الجدول 1 (مستمر)
الجدول 1). توضح الشكل 1 كيف أن تنوع الاقتباسات الذي يتم تقييمه باستخدام هذه المؤشرات يختلف عن عدد الاقتباسات التقليدي. يمكن أن تحتوي مخرجان على تنوع مختلف جدًا من الفاعلين المقتبسين على الرغم من أن عدد الاقتباسات متساوي. على سبيل المثال، قد تحتوي مقالة يتم الاقتباس منها من مجموعة واسعة من المؤسسات ولكن لديها نفس عدد الاقتباسات على تنوع أكبر في الاقتباسات.

بيانات الإدخال

مرصد COKI الأكاديمي

مرصد COKI الأكاديمي (https://github.com/The-Academic-Observatory) هو قاعدة بيانات علاقات كبيرة تتبع أداء المعرفة المفتوحة للمؤسسات البحثية في جميع أنحاء العالم. تم تصميمه ليكون مصدرًا مفتوح المصدر، مدفوعًا من قبل المجتمع وقابل للوصول من قبل المجتمع، مبنيًا حول بنية سحابية قابلة لإعادة الاستخدام وافتراضات شفافة. تم تطويره بواسطة مشروع COKI، ومقره في جامعة كورتين. يهدف المشروع إلى إنشاء بنية بيانات رائدة في العالم حول التواصل الأكاديمي، الوصول المفتوح، التنوع، الشمولية، وأكثر. هدف COKI هو ضمان أن الأدوات والبيانات المستخدمة لتقييم المخرجات الأكاديمية والمؤسسات البحثية تدعم ممارسات أكثر انفتاحًا وإنتاجية، بحيث يمكن للجامعات تغيير القصص التي ترويها عن نفسها، ووضع المعرفة المفتوحة في مركز هذه السرديات.
الشكل 1 أمثلة توضيحية لتوضيح الفروق بين عدد الاقتباسات، عدد الجهات المستشهدة، ومقاييس التنوع. المخرجات التي لها عدد اقتباسات متساوي لا تعني بالضرورة أن لديها نفس مستوى التنوع في الجهات المستشهدة. المخرجات المستشهد بها مرتبطة بالمؤسسات، ويمكن تجميع هذه الروابط المؤسسية حسب مواقعها. هذه توفر الأساس لحساب مقاييس التنوع. يتم تقديم درجات تنوع على مستوى الدولة فقط في الشكل. انظر قسم “منهجية التحليل” للحصول على تفاصيل حساب إنتروبيا شانون (أو مؤشر شانون) ومؤشر جيني-سيمبسون (أو مؤشر تنوع جيني). اليسار: المخرج A والمخرج B كلاهما لهما اقتباسين. ومع ذلك، يتم الاستشهاد بالمخرج A من قبل مؤسسات من دولتين مختلفتين، بينما جميع المؤسسات المستشهدة بالمخرج B هي من الدولة Z. وبالتالي، فإن المخرج A لديه مستوى أعلى من تنوع الاقتباسات حسب الدولة. اليمين: المخرج C والمخرج D كلاهما لهما خمسة اقتباسات. ومع ذلك، يحتوي المخرج C على المزيد من المؤسسات المستشهدة، وهذه المؤسسات من دول أكثر. وهذا يعني أن المخرج C لديه مستوى أعلى من تنوع الاقتباسات حسب الدولة، أي، درجة أعلى في مقاييس التنوع.
لتحليل تنوع الاقتباسات، استخدمنا تدفقات البيانات ومجموعات البيانات التي طورتها مبادرة المعرفة المفتوحة في كورتين (COKI) لتحليل أداء المعرفة المفتوحة. يتم استخدام خط أنابيب جمع بيانات مرصد الأكاديميين COKI (هوسكينغ وآخرون، 2022) لإنشاء مجموعة بيانات مرصد الأكاديميين التي تستخدم لتحليل عدد الاقتباسات، والانتماءات، والتنوع. يدمج هذا الخط بيانات من بيانات Crossref (DOIs، تواريخ النشر)، Unpaywall (حالة OA)، Microsoft Academic Graph (MAG) (الانتماءات المؤسسية، روابط الاقتباس، مجالات البحث؛ منذ أن اكتمل هذا الدراسة تم استبداله بـ OpenAlex)، سجل المنظمات البحثية (ROR) (معلومات مؤسسية) لإنشاء “جدول DOI” – مصدر بيانات غنية حول المخرجات البحثية.
يتم تحديث هذه المجموعات بانتظام مع تحديث MAG كل أسبوعين (قبل أن يتم إيقافه) وتحديث بيانات Crossref شهريًا. الحالات المحددة للجداول المستخدمة مباشرة هي:
  • academic-observatory.observatory.doi20220730
  • academic-observatory.mag.PaperReferences20211206
نقوم بتصفية جميع DOIs لتلك التي تحتوي أيضًا على “PaperIDs” من MAG وتواريخ النشر من 2010 إلى 2019 (كلاهما شامل). تم اختيار نطاق التاريخ بناءً على ثقتنا في جودة البيانات وأيضًا الاعتبارات المعطاة لحقيقة أن معظم المخرجات الجديدة سيكون لديها وقت قليل لجذب الاقتباسات. نستخدم استخراج البيانات النهائي من MAG (11 ديسمبر 2021) للتحليل.
تشمل البيانات الكاملة في نطاق الوقت 37 مليون مخرج مع 424 مليون رابط اقتباس. ومع ذلك، فإن المخرجات التي تحتوي على اقتباسين أو أكثر فقط هي القابلة (غير التافهة) في حسابات مقاييس تنوع الاقتباسات. أدى ذلك إلى البيانات النهائية المكونة من 19 مليون مخرج و420 مليون رابط اقتباس بين هذه المخرجات.

منهجية التحليل

كما هو موضح في الشكل 1، وحدة التحليل لدينا هي رابط الانتماء أو مجال البحث المرتبط بالمرجع الوارد إلى مخرج معين. نقوم بحساب درجات إنتروبيا شانون ومؤشر جيني-سيمبسون لمجموعة الانتماءات المرتبطة بالمخرجات المستشهد بها، مع مراعاة التجميعات حسب المؤسسات، الدول، المناطق الفرعية، والمناطق، وأيضًا “المجالات من المستوى 0” في MAG (المعروفة أيضًا بـ “مجالات البحث”) المرتبطة بالمخرجات المستشهد بها. توفر هذان المقياسان للتنوع تقديرات مكملة للتنوع في روابط الانتماء/المجال المرتبطة بالمخرجات المستشهد بها. نلاحظ أن “رابط الاقتباس” يشير إلى رابط مخرج إلى مخرج عبر الاستشهاد، بينما “رابط الانتماء المستشهد” أو “رابط المجال المستشهد” هو خطوة إضافية لتحديد الرابط بين مخرج وانتماء مرتبط بمخرج مستشهد به، أو بين مخرج ومجال البحث المرتبط بمخرج مستشهد به، على التوالي. بشكل عام، نشير إلى هذه على أنها “روابط مخرج إلى جهة مستشهدة”، حيث قد تكون الجهات المستشهدة مؤسسات، دول، مناطق فرعية، مناطق، أو مجالات بحث مرتبطة بالمخرج المستشهد به.
نحن نعرف كعدد المجموعات (مثل، الدول، مجالات البحث) و كنسبة روابط مخرج إلى جهة مستشهدة المعينة لمجموعة معينة. تقيس إنتروبيا شانون مستوى عدم اليقين في توقع تعيين المجموعة لرابط مخرج إلى جهة مستشهدة مختارة عشوائيًا على النحو التالي:
بينما يقيس مؤشر جيني-سيمبسون احتمال أن ينتمي رابطا مخرج إلى جهة مستشهدة مختارين عشوائيًا إلى نفس المجموعة:
مع كلوغاريتم طبيعي لـ .
تم تنفيذ التحليل في استعلامات SQL نموذجية يتم تشغيلها عبر إطار تقارير آلي تم تنفيذه بلغة بايثون. الخطوة الأولى هي تجميع الانتماءات المرتبطة بالاقتباسات الواردة لكل من 37 مليون مخرج و424 مليون رابط اقتباس في فترة الوقت المستهدفة. يتم تخزين الجدول الناتج “citation_diversity_global” في قاعدة بيانات BigQuery السحابية من جوجل. يتم تصفية التحليلات اللاحقة واستعلامات SQL المقابلة لتقليلها إلى المخرجات التي تحتوي على اقتباسين أو أكثر، والتي تتوافق مع 19 مليون مخرج مع 420 مليون رابط اقتباس. القرار بالاعتبار فقط المخرجات التي تحتوي على اقتباسين أو أكثر يعتمد على حقيقة أن قياس التنوع للمخرجات التي تحتوي على صفر اقتباسات هو أمر غير منطقي وأن المخرجات التي تحتوي على اقتباس واحد فقط ستُعطى بشكل تافه درجة تنوع تساوي صفر. ومع ذلك، يتم الاحتفاظ بهذه المخرجات في الجدول أعلاه لأغراض التحقق.
تتم تنفيذ خطوات التحليل اللاحقة في استعلامات SQL نموذجية لقاعدة البيانات السحابية مع تنزيل البيانات الناتجة كملفات نصية مفصولة بفواصل (CSVs) مناسبة للاستخدام في مكتبة Pandas بلغة بايثون وتخزينها محليًا. يتم استخدام هذه البيانات المحلية بعد ذلك لإنشاء الجداول والرسوم البيانية في هذه المقالة. يتم تحديد العملية الكاملة من البيانات المصدر إلى المخرجات النهائية في الشيفرة وأتمتتها لدعم إمكانية التكرار وتمكين النقد التفصيلي (هوانغ ونيلون، 2022).
في هذه الدراسة، نعتبر أربع فئات مختلفة (لكن قد تتداخل) من المخرجات: OPEN، GOLD، GREEN، وCLOSED (انظر الجدول 1 للتعريفات). يتم مقارنة النتائج عبر هذه الفئات المختلفة فيما يتعلق بتأثيرها على تنوع الاقتباسات، عند الضرورة. نستخدم أيضًا نسب النسب المئوية في متوسط الاقتباسات والتغيرات النسبية في إجمالي الاقتباسات (انظر الجدول 1 للتعريفات) لفحص مصدر الاقتباسات المتزايدة واستخدامها لمقارنة مستويات ميزة تنوع الاقتباسات عبر مناطق فرعية ومناطق مختلفة.

الدلالة الإحصائية

في هذه الدراسة، تجنبنا استخدام الدلالة الإحصائية كمقياس لاحتمالية تأثير ما. هناك عدة أسباب لهذا الاختيار. أولاً، نحن نتعامل بشكل أساسي مع مجموعة من المخرجات بدلاً من عينات مستهدفة من المخرجات. يشمل ذلك جميع المخرجات التي تم التقاطها بواسطة نظام يهدف إلى تضمين المخرجات البحثية العالمية التي لديها DOIs من Crossref وPaperIDs من MAG. ثانيًا، نظرًا للأعداد الكبيرة من المخرجات المدرجة في معظم تحليلاتنا، فإن قيم p الناتجة صغيرة جدًا ومرتبطة بشدة بأحجام العينات المختارة، مما يجعلها أقل فائدة كمقياس للثقة. ثالثًا، مقارنة الدلالة الإحصائية عبر عدد كبير من المجموعات، حيث تختلف المجموعات أيضًا بشكل كبير في التوزيع، هو أمر صعب للغاية. سيتطلب ذلك اعتبارات لكل من تأثيرات المقارنات المتعددة وإجراءات أخذ العينات المتقدمة. من ناحية أخرى، فإن التحليلات التوزيعية اللاحقة لأعداد كبيرة من المخرجات ليست عملية أيضًا. بالنظر إلى
ما سبق، اتخذنا البديل في استكشاف اتساق ميزة تنوع الاقتباسات OA عبر طرق متعددة لتحليل مجموعة المخرجات. ومع ذلك، حيثما كان ذلك ممكنًا، قمنا بتضمين بعض تحليلات أخذ العينات الفرعية للتأكيد على أن هذا الاتساق يتم الحفاظ عليه عبر عينات صغيرة قابلة للمقارنة بالنسبة للبيانات الكاملة.

النتائج

مقارنة فئات OA

كخطوة أولى في تحليلنا، نؤكد على ميزة الاقتباس من الوصول المفتوح (انظر الجدول 1) التي تم ملاحظتها سابقًا، للمرة الأولى على نطاق عالمي. نلاحظ وجود ارتباط بين الوصول المفتوح وارتفاع الاقتباسات على المستوى العالمي، وهو ما يتماشى مع الأدبيات السابقة حول ميزة عدد الاقتباسات للوصول المفتوح ولكن مع التحذيرات المعروفة التي تم وصفها سابقًا. نرى أن هذا الارتباط قوي عبر سنوات النشر وفئات الوصول المفتوح (انظر “صلابة النتائج”). يمكن أن تساعد الأعمال الإضافية حول ميزة عدد الاقتباسات للوصول المفتوح باستخدام مجموعات بيانات عالمية في الكشف عن العوامل المرتبطة بهذه التأثيرات المعقدة. كما نقوم بتوصيف الاقتباسات من خلال عدد المؤسسات المقتبسة الفريدة، والدول، والمناطق الفرعية، والمناطق، وحقول البحث (انظر الجدول 1). مرة أخرى، يتم ملاحظة ميزة قوية لفئات الوصول المفتوح (مع بعض الاستثناءات الموجودة) مما يوفر طرقًا لمزيد من التحليل للتأثيرات السببية الكامنة وراء ميزة تنوع الاقتباسات للوصول المفتوح (انظر “صلابة النتائج” للتفاصيل).
بالانتقال إلى محور تركيزنا الرئيسي، تنوع الاقتباسات، أظهرت نتائجنا تنوعًا معززًا في المؤسسات المقتبسة والدول والمناطق الفرعية والمناطق لمخرجات البحث للوصول المفتوح، مع ملاحظة هذا التأثير بشكل متسق عبر جميع سنوات النشر منذ عام 2010 (انظر الشكل 2 أ و ب)، وعبر تقريبًا جميع حقول البحث في بيانات دراستنا. هناك اختلافات على مر الزمن، بين حقول البحث وبين بلد انتماء المؤلف في نطاق التأثير، فضلاً عن مقاييس التنوع الأساسية. هذه مجالات مثيرة للاهتمام للدراسة المستقبلية. ما يثير الدهشة هو مدى اتساق التأثير الملحوظ عبر جميع هذه التجمعات المحتملة. يشمل ذلك التحولات التوزيعية نحو درجات تنوع أعلى لمخرجات الوصول المفتوح (بالنسبة لمخرجات الوصول المغلق) لجميع مجموعات الفاعلين المقتبسين، وسنوات النشر، وكلا مقاييس التنوع. يوضح الشكل 2 ج بعض تلك التحولات التوزيعية. على الرغم من أن التحول قد يكون صغيرًا في بعض الحالات، إلا أنه متسق عبر تقريبًا جميع المقارنات لمجموعات مختلفة. انظر “صلابة النتائج” والمواد التكميلية للحصول على النتائج عبر جميع التجمعات المختلفة.
عند مقارنة آليات الوصول المفتوح، نرى تأثيرًا أكبر في تنوع الدول المقتبسة والمناطق الفرعية والمناطق وحقول البحث عبر جميع السنوات، وللوصول المقدم من خلال المستودعات (أي، المخرجات الخضراء) مقارنةً بالوصول المفتوح المقدم عبر مواقع الناشرين (الشكل 2 ب و ج). يظهر هذا التأثير تأثيرات مثيرة للاهتمام على التخصص وبلد المؤلف تستحق مزيدًا من التحقيق.
تسيطر الأسئلة المتعلقة بتأثيرات التداخل على النقاش حول ميزة عدد الاقتباسات، وتحديدًا ما إذا كان الوصول المفتوح أكثر سهولة للباحثين من المؤسسات الأكثر ثراءً وسمعةً و/أو ما إذا كان الباحثون يختارون بشكل انتقائي جعل أفضل أعمالهم مفتوحة الوصول. لمعالجة ذلك، أظهرنا أيضًا أن ميزة تنوع الاقتباسات موجودة، بغض النظر عن عدد الاقتباسات (انظر “صلابة النتائج”). إن عدم وجود ارتباط عام بين عدد الاقتباسات وتنوع الاقتباسات يوفر دليلًا على أن عدد الاقتباسات وتنوع الاقتباسات يتتبعان جوانب مختلفة من الاستخدام وأن هناك تداخلًا محدودًا مشتركًا على النطاق العالمي. ومع ذلك، فإن هذا الارتباط أعلى للمخرجات ذات الأعداد المنخفضة من الاقتباسات. تحتوي مجموعات المخرجات المنشورة في السنوات اللاحقة على نسب أعلى من المخرجات ذات الاقتباسات المنخفضة.
الشكل 2 مقارنة تنوع الاقتباسات بين فئات الوصول المفتوح. أ يتم مقارنة درجات شانون الوسيطة من قبل المؤسسات المقتبسة بين المخرجات المفتوحة والمغلقة على مدى فترة عشر سنوات. تحصل المخرجات السابقة على درجات أعلى نتيجة لوجود وقت أكثر لجمع الاقتباسات (ومن ثم المزيد من إمكانية وجود انتماءات اقتباسية أوسع). ومع ذلك، يتم ملاحظة أن المخرجات المفتوحة تؤدي بشكل أفضل في تنوع المؤسسات المقتبسة على مدار جميع السنوات. تتم مقارنة متوسط درجات شانون عبر فئات الوصول المفتوح، مع حساب الدرجات بناءً على تجميع روابط انتماء الاقتباس حسب الدول والمناطق الفرعية والمناطق، والمخرجات المقتبسة حسب حقول البحث. في الحالات الثلاث الأولى، تتفوق جميع فئات الوصول المفتوح باستمرار على المخرجات المغلقة. كما تتفوق المخرجات المفتوحة على المخرجات المغلقة في حقول البحث في السنوات الأخيرة. من المحتمل أن يكون هذا نتيجة لممارسات البحث المتطورة ومستويات جودة البيانات. نلاحظ أيضًا أنه لا ينبغي مقارنة الدرجات عبر أنواع الفاعلين المقتبسين المختلفة حيث تقيس طرقًا مختلفة لتجميع روابط الفاعلين المقتبسين (ومن ثم مقاييس مختلفة). ج يتم تقديم مخططات الصندوق لدرجات شانون لعينات من مخرجات عام 2017 لمختلف الفاعلين المقتبسين ومقارنتها بين فئات الوصول المفتوح المختلفة. يتم استخدام عينات متساوية الحجم عبر فئات الوصول المفتوح لهذه المقارنة.
(أي، وقت أقل لتجميع الاقتباسات)، مما قد يفسر جزئيًا الاتجاهات التنازلية في درجات تنوع الاقتباسات الوسيطة (الشكل 2 أ و ب). هناك حاجة إلى تحليل أكثر عمقًا من خلال مزيد من البحث.
كدراسة جماعية رصدية، لا يستطيع تحليلنا تأكيد الروابط السببية الدقيقة بين الوصول المفتوح وزيادة تنوع الاقتباسات. ومع ذلك، كتحليل عالمي يمكننا أن نقول بشكل قاطع أنه ضمن المجموعة الكاملة في مجموعة بياناتنا التي تحتوي على 19 مليون مخرج، تتمتع المخرجات المفتوحة بمستوى أكبر من تنوع الاقتباسات. يتم إثبات ذلك من خلال كل من الإحصائيات الملخصة والتحليلات التوزيعية.

مقارنة الجغرافيا

لفهم المزيد عن مصدر زيادة تنوع الاقتباسات وكيفية مقارنته عبر الجغرافيا، نقوم أيضًا بفحص التوزيع الجغرافي للاقتباسات. نقوم بذلك من خلال فحص نسبة التغيير في إجمالي الاقتباسات ونسبة التغيير في متوسط الاقتباسات (انظر الجدول 1) عبر المخرجات المفتوحة والمغلقة لجميع أزواج المناطق الفرعية والمناطق. تمثل هذه المستويات من التغيير في الاقتباس من منطقة فرعية أو منطقة معينة عند الانتقال من المخرجات المغلقة إلى المفتوحة. كعرض مصغر، يظهر الشكل 3 الفروقات بين المخرجات المفتوحة والمغلقة فيما يتعلق بالاقتباسات إلى ومن ثلاث مناطق فرعية مختارة.
الشكل 3 التغييرات في الاقتباسات إلى ومن المناطق الفرعية المختارة. أ تشبه الرسوم البيانية الثلاثة روابط الاقتباس المختارة للمخرجات حسب المناطق الفرعية: شمال أوروبا، أفريقيا جنوب الصحراء، وشرق آسيا، على التوالي. داخل كل رسم بياني، يتم عرض نسبة التغيير في إجمالي الاقتباسات (انظر “صلابة النتائج”) من المناطق الفرعية الثلاث المختارة (لسنة 2019). تشير القيمة التي تزيد عن الصفر إلى تأثير إيجابي للوصول المفتوح. بينما تستفيد كل من شمال أوروبا وأفريقيا جنوب الصحراء من المخرجات المفتوحة، هناك اختلافات في النتائج. تعتبر شرق آسيا واحدة من الاستثناءات الناتجة عن تغطية أقل شمولاً من قبل الأنظمة الببليوغرافية الغربية. ب يتم استخدام مقياس بديل لتتبع الفروقات في متوسط الاقتباسات بين المخرجات المفتوحة والمغلقة – نسب النسبة المئوية (انظر “الطريقة”). يتم تقديم النتائج لجميع السنوات المدرجة في الدراسة. تشير القيمة التي تزيد عن 100 إلى تأثير إيجابي للوصول المفتوح.
تظهر اللوحة العلوية في الشكل 3أ أن أعداد الاقتباسات من جميع المناطق الفرعية الثلاثة إلى المخرجات المرتبطة بشمال أوروبا قد زادت عند الانتقال من المخرجات المغلقة إلى المخرجات المفتوحة. كانت الزيادة أكبر بالنسبة للاقتباسات من أفريقيا جنوب الصحراء (حوالي خمسة أضعاف)، مع زيادة الاقتباسات من شمال أوروبا نفسها بنسبة 400 في المئة وزيادة الاقتباسات من شرق آسيا بأكثر من 200 في المئة. كما تظهر اللوحة الوسطى في الشكل 3أ تأثيرات إيجابية مماثلة لمخرجات أفريقيا جنوب الصحراء، وإن كانت بمستويات أقل بكثير. يمثل شرق آسيا (اللوحة السفلية في الشكل 3أ) حالة مثيرة للاهتمام حيث يبدو أن تأثير الوصول المفتوح على الاقتباسات قليل أو سلبي. من المحتمل أن يكون ذلك بسبب السياسات المحلية ونقص التغطية الشاملة للبيانات من المنطقة الفرعية. يصف الشكل 3ب بدلاً من ذلك التغيرات في الاقتباسات باستخدام نسبة مئوية في متوسط الاقتباسات. ومع ذلك، يتم ملاحظة نفس الاتجاهات وتظل متسقة على مر الزمن. في هذا المثال المصغر، نرى أن المخرجات المرتبطة بشمال أوروبا تستفيد أكثر من كل من أعلى زيادة في الاقتباسات لمخرجاتها المفتوحة (أي، أعلى زيادة في الاستخدام من جميع المناطق الفرعية)، وأعلى زيادة في اقتباسات المخرجات الأوروبية الشمالية إلى أفريقيا جنوب الصحراء.
يتم ملاحظة هذا النمط أيضًا في التحليل الأكبر الذي يقارن جميع المناطق الفرعية والمناطق. عند تحليل المناطق الفرعية حيث تقع affiliations المخرجات المستشهد بها، نرى زيادة في الاقتباسات لمخرجات الوصول المفتوح من المؤسسات التقليدية التي تمثل تمثيلًا ناقصًا والتي تقع في مناطق فرعية ذات موارد بحثية أقل (على سبيل المثال، كما تم قياسه في إحصاءات البنك الدولي حول إنفاق البحث) (البنك الدولي، 2022). يتماشى هذا مع الوصول الأكبر إلى الوصول المفتوح المرتبط بزيادة استخدام مخرجات الوصول المفتوح من هذه المناطق الفرعية، على الأقل كما تم قياسه من خلال الاقتباسات (انظر “متانة النتائج”). ومع ذلك، فإن ميزة تنوع الاقتباسات تتراكم أيضًا بشكل تفضيلي لمراكز البحث التقليدية المرموقة.
بشكل عام، نرى أن المراكز التقليدية “المرموقة” للتميز (من حيث الثروة والحجم، على سبيل المثال، شمال أوروبا، أمريكا الشمالية) تستفيد أكثر من كل من الزيادات في الاقتباسات لمخرجاتها المفتوحة (أي، استخدام مخرجاتها من قبل مناطق فرعية أخرى)، وزيادات في الاقتباسات من مخرجاتها إلى مخرجات الوصول المفتوح من مناطق فرعية أخرى (أي، استخدامهم لمخرجات مرتبطة بمناطق فرعية أخرى). هناك أيضًا إشارات إلى أن مستوى ميزة تنوع الاقتباسات للوصول المفتوح أقل بشكل عام للمخرجات ذات affiliations من المناطق الفرعية أو المناطق التقليدية الممثلة تمثيلًا ناقصًا (على سبيل المثال، أفريقيا جنوب الصحراء، شمال أفريقيا، أمريكا اللاتينية)، ولكنها تظهر زيادة مع مرور الوقت من مستويات منخفضة أو سلبية. قد يكون هذا دليلًا على زيادة الرؤية على مدى فترة الدراسة، والتي يمكن أن ترتبط بتغيير مسارات الاكتشاف للوصول المفتوح. ومع ذلك، يتطلب الأمر مزيدًا من العمل للتحقيق في هذه التأثيرات بالتفصيل. انظر “متانة النتائج” والمواد التكميلية لمجموعة النتائج الكاملة.

متانة النتائج

لضمان متانة نتائجنا، نقوم بتضمين تحليلات نتائجنا مقارنة عبر طرق متعددة لتجميع البيانات – على مر الزمن، مقاييس تنوع مختلفة، أعداد الاقتباسات، فئات الوصول المفتوح، مجموعات affiliations المختلفة حسب التعيينات الجغرافية، مقاييس ملخصة، إلخ. يتم تقديم جميع النتائج في المواد التكميلية، مع تلخيص النتائج الرئيسية أدناه.

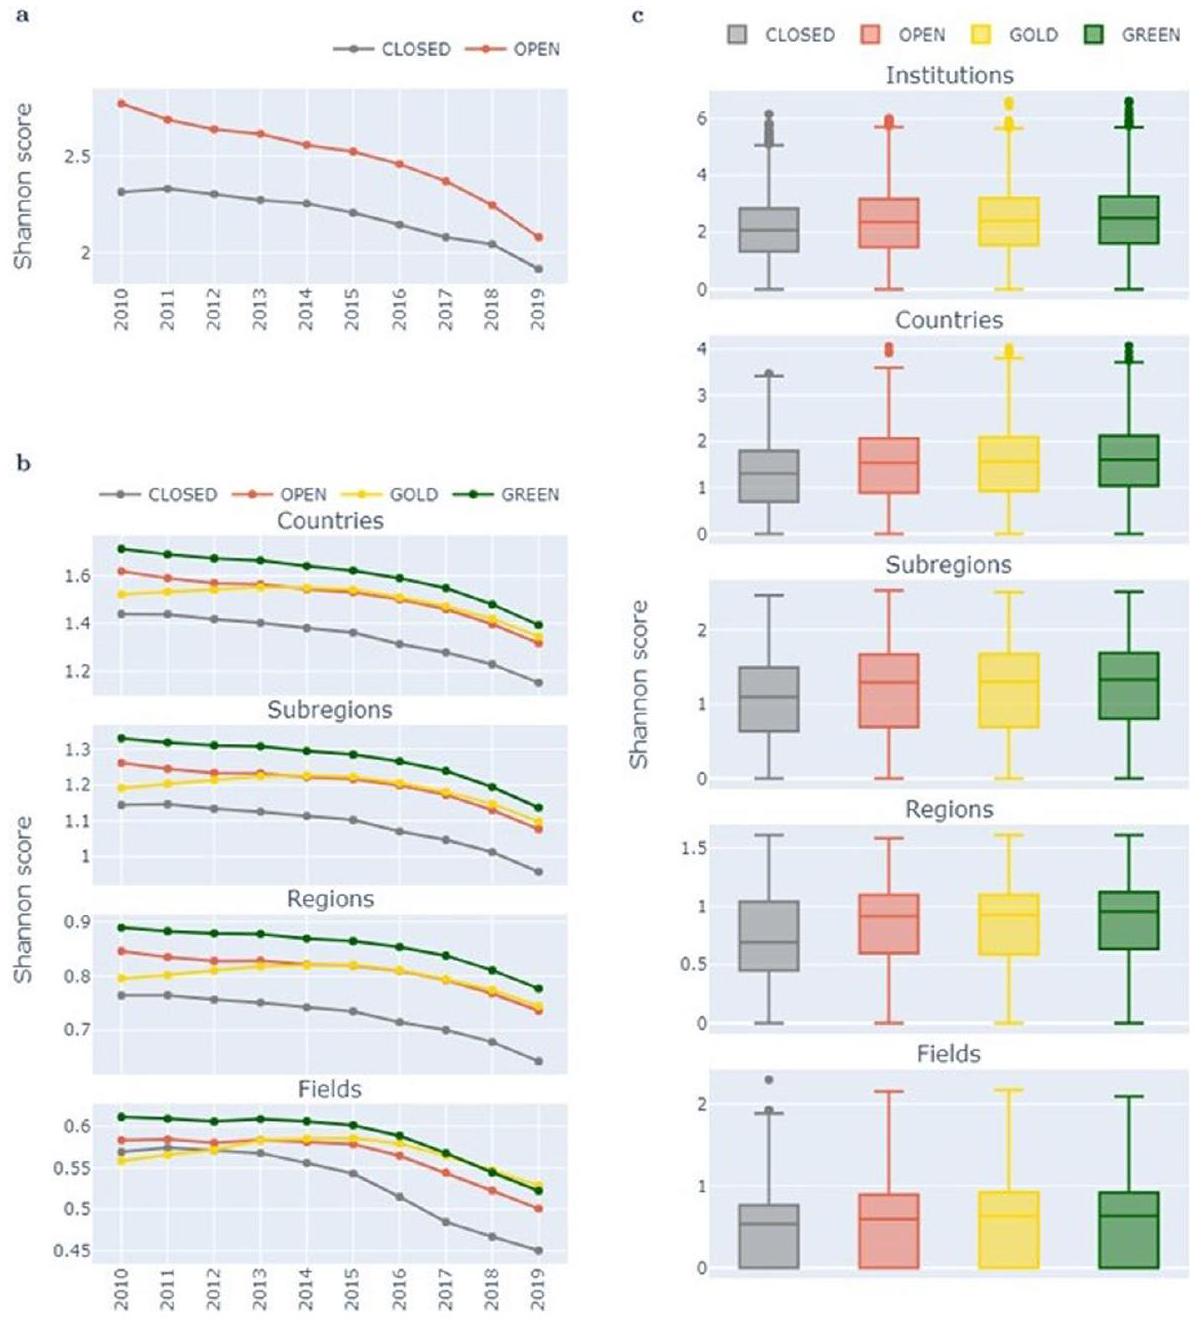
تأثير متسق عبر الزمن والمقاييس والفئات

كما ذكرنا سابقًا، نعيد إنتاج ميزة عدد الاقتباسات الموصوفة سابقًا عبر مجموعة البيانات بأكملها. نرى ارتباطًا بين الوصول المفتوح (جميع الفئات) مع أعداد اقتباسات أعلى لجميع السنوات في التحليل. نلاحظ أيضًا الاتجاه العام المتناقص لعدد الاقتباسات
بسبب وجود مخرجات أكثر حداثة تحتوي على عدد أقل من الاقتباسات. يتم تقديم هذه النتائج في الأشكال التكميلية A.
ثم ننتقل إلى تحليل الروابط بين المخرجات والمستشهدين. نبدأ بفحص أعداد المستشهدين الفريدين المميزين من حيث المؤسسات والدول والمناطق الفرعية والمناطق وحقول البحث. بعبارة أخرى، لكل مخرج مستشهد به، نقوم بعدّ عدد المؤسسات والدول والمناطق الفرعية والمناطق وحقول البحث الفريدة المستشهد بها، على التوالي، مع دمج جميع مخرجاته المستشهد بها. يتم اعتبار المتوسط والوسيط لعدد المستشهدين الفريدين لكل فئة من فئات الوصول المفتوح وتظهر ميزة متسقة للمخرجات المفتوحة على المخرجات المغلقة، أي، تجذب مخرجات الوصول المفتوح المزيد من المستشهدين الفريدين، لجميع السنوات المدرجة (الأشكال التكميلية B). الاستثناءات أو الأنماط الأقل وضوحًا للعدد الوسيط من حيث المناطق الفرعية والمناطق وحقول الدراسة تعود إلى التجميع الأوسع للمستشهدين وعدد كبير من المخرجات ذات أعداد اقتباسات منخفضة.
لتأكيد هذه النتيجة عبر توزيعات المخرجات، نقوم أيضًا بتضمين الملخصات التوزيعية (في شكل مخططات صندوقية) للعينات (أي، 10,000 مخرج من كل فئة من فئات الوصول المفتوح) المأخوذة بشكل مستقل لكل فئة من فئات الوصول المفتوح ولكل سنة نشر (الأشكال التكميلية C). في هذه المخططات الصندوقية، يُلاحظ أن مخرجات الوصول المفتوح تتميز بذيل علوي أثقل (وغالبًا ما يكون الصندوق مائلًا للأعلى) عند مقارنتها بفئة المخرجات المغلقة عبر جميع سنوات النشر وجميع أنواع المستشهدين. مرة أخرى، نلاحظ التحذيرات حول الأعداد الصغيرة من المجموعات والأعداد الكبيرة من المخرجات لبعض الحالات في مجموعة بيانات الدراسة. تبرز مخرجات الفئة الخضراء كأفضل فئة أداءً من حيث عدد المستشهدين الفريدين (المؤسسات والدول والمناطق الفرعية والمناطق).
ثم نقدم مقاييس تنوع الاقتباسات وفقًا للجزء الرئيسي من تحليلنا العام. بالنسبة لمقاييس شانون وجيني-سيمبسون، نرى درجات تنوع أعلى في المتوسط والوسيط للمخرجات المفتوحة (مقابل المخرجات المغلقة) لكل سنة نشر، فيما يتعلق بالمؤسسات المستشهد بها والدول والمناطق الفرعية والمناطق. فيما يتعلق بحقول البحث المستشهد بها، هناك عيب طفيف لمخرجات الذهب في 2010-2011 والذي يتحول إلى ميزة بحلول عام 2012 (الأشكال التكميلية D). نقوم أيضًا بفحص توزيعات درجات التنوع للعينات المأخوذة من كل فئة لكل سنة باستخدام المخططات الصندوقية (الأشكال التكميلية E). بالإضافة إلى زيادة الاتجاه المركزي لفئات الوصول المفتوح، هناك أيضًا علامات في هذه المخططات الصندوقية على ذيول علوية أطول وذيول سفلية أقصر – مؤشرات إضافية لميزة تنوع الاقتباسات للوصول المفتوح.
لتأكيد أن نتائجنا ليست محصورة في نسب مئوية محددة من البيانات، نقوم أيضًا بدراسة تقديرات كثافة النواة (KDEs – انظر الجدول 1) والتوزيعات الخاصة بدرجات التنوع، لجميع تركيبات مقاييس التنوع والمستشهدين وسنوات النشر. يتم مقارنة KDEs والتوزيعات بين المخرجات المفتوحة والمغلقة (لـ 10,000 مخرج مأخوذ من كل منهما). تكشف النتائج عن نتيجة متسقة للغاية لميزة تنوع الاقتباسات للوصول المفتوح. بالنسبة لجميع البيانات التي تم تحليلها في هذه الأشكال، تؤدي مخرجات الوصول المفتوح إلى تحول توزيعي نحو درجات تنوع أعلى، ونسب أقل من المخرجات ذات درجات تنوع منخفضة، وزيادة نسب المخرجات التي تسجل درجات عالية للتنوع (الأشكال التكميلية F).
تظل ميزة تنوع الاقتباسات للوصول المفتوح قائمة لكل من الوصول عبر الناشرين (أي، مخرجات الذهب) وكذلك للوصول عبر منصات المستودعات الأخرى (أي، مخرجات الخضراء) مع إظهار الأخيرة تأثيرًا أكبر. أحد التأثيرات المحتملة المربكة هو هيمنة Pubmed Central وEurope Pubmed Central كمستودعات مهمة وارتفاع متوسط أعداد الاقتباسات لمقالات البحث الطبية الحيوية. لمعالجة ذلك، نقوم بفحص تأثير تنوع الاقتباسات حسب حقول البحث للمقالات المستشهد بها ونلاحظ أن ميزة تنوع الاقتباسات للوصول المفتوح متسقة للغاية عبر جميع حقول “MAG Level 0” لمخرجات الفئة الخضراء (الأشكال التكميلية G). هناك تباين كبير لمخرجات الذهب وأداء الوصول المفتوح بشكل عام. نلاحظ أيضًا اختلافات كبيرة في تأثير الوصول المفتوح بين المختارين
مجالات البحث. ولكن بالنسبة للأغلبية من المجالات التي تغطيها مجموعة بياناتنا بشكل جيد، فإن ميزة تنوع الاقتباسات في الوصول المفتوح واضحة، بما في ذلك التخصصات المختلفة عن العلوم الطبية الحيوية، مما يظهر أن التأثير قوي عبر العلوم الطبيعية والبيولوجية والسريرية، وفي عدة مجالات من العلوم الاجتماعية.

العلاقات بين تنوع الاقتباسات وعدد الاقتباسات

تتمثل إحدى الانتقادات للادعاءات المتعلقة بميزة الاقتباسات في الوصول المفتوح في أن الباحثين يركزون على ضمان أن أفضل أعمالهم هي الأكثر وصولاً و/أو أن الميزة هي في الأساس وظيفة من هيبة المؤلفين ومؤسساتهم. كان أحد أهدافنا من تحليل التنوع هو استخدام مؤشرات أقل اعتمادًا على عدد الاقتباسات كوسيلة لتقليل هذا التأثير المحتمل المربك.
باستثناء الحالات القصوى حيث تحتوي المقالات المستشهد بها على عدد كبير جدًا من المؤلفين، ستقتصر المقالات ذات عدد الاقتباسات المنخفض جدًا على القيم التي يمكن أن تأخذها مقاييس التنوع. لذلك، قمنا بدراسة ميزة التنوع كدالة لعدد الاقتباسات لضمان أن التأثير كان قويًا تجاه هذه القضية.
نقوم بإجراء هذا التحليل على مستوى مجموعة البيانات الكاملة وكذلك مع مجموعة من العينات ذات الحجم المتسق لمعالجة الاختلافات في أعداد المخرجات المفتوحة والمغلقة على مر الزمن. مرة أخرى، فإن ميزة تنوع الاقتباسات في الوصول المفتوح قوية عبر جميع فئات عدد الاقتباسات لجميع سنوات النشر لمقاييس التنوع المستندة إلى الاقتباسات من مؤسسات ودول ومناطق فرعية ومناطق مختلفة (مع بعض التحفظات على الأخيرة بسبب العدد القليل من المناطق).
أولاً، نعيد النظر في كيفية حساب الأعداد الفريدة من الجهات المستشهدة. لتأكيد أن ملاحظاتنا السابقة قوية بالنسبة للمخرجات التي تجذب مستويات مختلفة من الاقتباسات، قمنا بتقسيم المخرجات من نفس السنة إلى 14 فئة اعتمادًا على أعداد الاقتباسات الخاصة بها (مع الحفاظ تقريبًا على تشابه الفئات في حجم السكان) وقارنّا توزيعات أعداد الجهات المستشهدة الفريدة عبر المخرجات المفتوحة والمغلقة للعينات المأخوذة (أي، 2000 مخرجات مفتوحة مقابل 2000 مخرجات مغلقة) من كل فئة اقتباس (الرسوم التوضيحية التكميلية H). تم تقديم مخططات الصندوق للمخرجات المفتوحة مقابل المغلقة لكل مجموعة اقتباس لجميع السنوات وجميع أنواع الجهات المستشهدة. نجد أن المخرجات المفتوحة لا تؤدي بشكل أسوأ، وفي الواقع أفضل في معظم الحالات، من المخرجات المغلقة في جذب أعداد فريدة من الجهات المستشهدة.
وبالمثل، نقوم ببناء مقارنة لدرجات التنوع عبر فئات الاقتباسات لجميع السنوات وكلا مقاييس التنوع (الرسوم التوضيحية التكميلية I). من الواضح من هذه النتائج أن هناك اتساقًا في ميزة تنوع الاقتباسات في الوصول المفتوح عبر فئات الاقتباسات تقريبًا لجميع الحالات المدروسة. الاستثناءات الرئيسية هي في السنوات السابقة لمجالات البحث. ومع ذلك، تشير هذه الرسوم البيانية إلى تحول من التأثيرات السلبية إلى الإيجابية في السنوات الأخيرة، بما يتماشى مع ملاحظاتنا السابقة لدرجات التنوع المتوسطة والوسيط. لاستكشاف العلاقة المحتملة بين درجات التنوع وعدد الاقتباسات بشكل أكبر، نقوم أيضًا بحساب الأرباع لدرجات التنوع للبيانات الكاملة لكل سنة. يتم تقديم هذه كرسوم بيانية خطية (الرسوم التوضيحية التكميلية J). تظهر هذه النتائج علاقة ضعيفة بين درجات التنوع وعدد الاقتباسات، ولكن فقط لعدد الاقتباسات المنخفض، وهو ما لا يُفاجئ نظرًا لزيادة احتمالية وجود روابط أكثر للجهات المستشهدة. تضعف قوة هذه العلاقة الضعيفة أكثر بالنسبة للمخرجات ذات الاقتباسات الكبيرة.
باختصار، نجد أن ميزة تنوع الاقتباسات في الوصول المفتوح ليست مدفوعة تمامًا بعدد كبير من المخرجات ذات الاقتباسات المنخفضة، ولا هي ببساطة تأثير المخرجات ذات الاقتباسات العالية. بل، إن ميزة تنوع الاقتباسات في الوصول المفتوح هي تأثير متسق يُرى عبر مجموعة المخرجات.

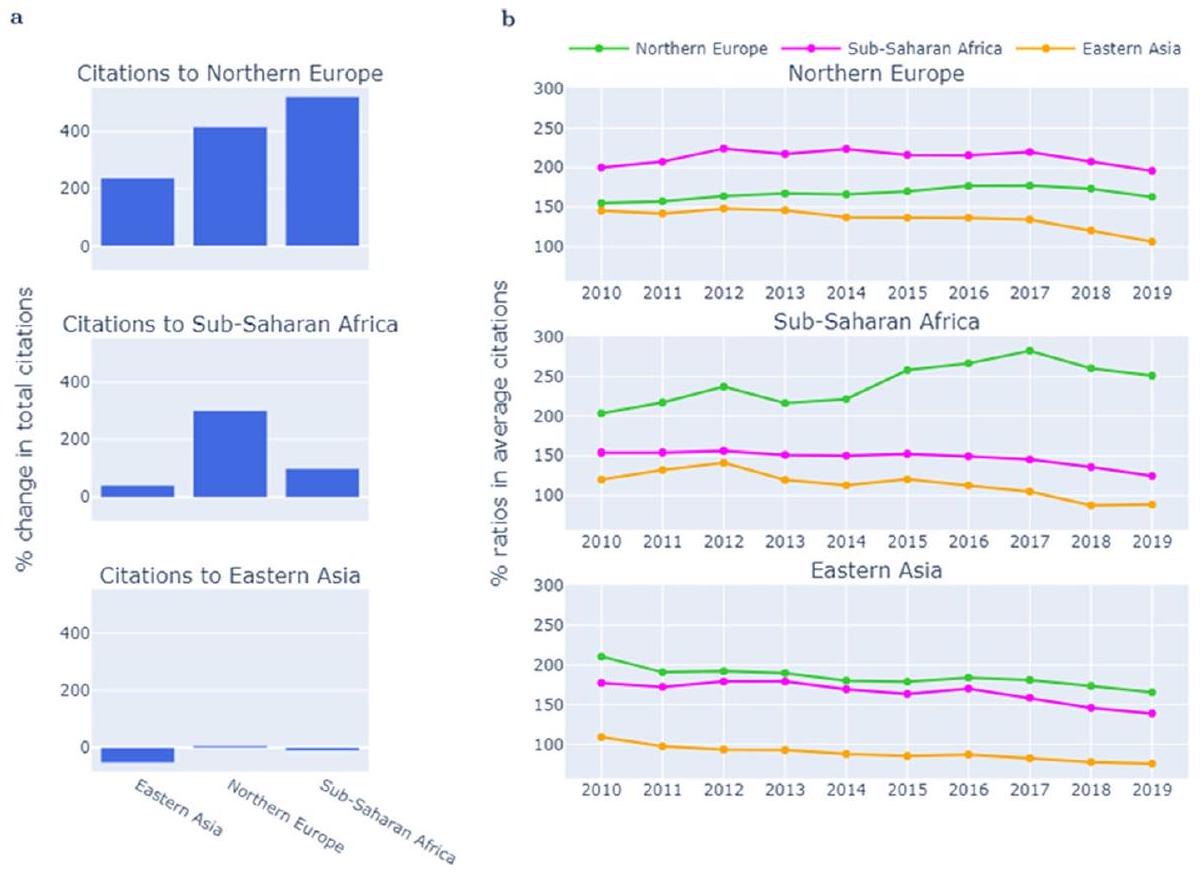
الاقتباسات بين المناطق الفرعية والمناطق

علاوة على ملاحظة ميزة تنوع الاقتباسات في الوصول المفتوح، من المهم أيضًا فهم من أين تنشأ زيادة تنوع الاقتباسات. على وجه الخصوص، نحتاج إلى أن نكون قادرين على تتبع كيف تستفيد منطقة فرعية أو منطقة من جعل مخرجاتها مفتوحة (مثل: المزيد من الاقتباسات من الآخرين) وأيضًا كيف تستفيد من مخرجات الوصول المفتوح من مناطق فرعية أو مناطق أخرى (مثل: المزيد من الوصول إلى مخرجات الآخرين). لمساعدة مثل هذا التحليل، نقوم بتصفية البيانات إلى مناطق فرعية ومناطق فردية. ثم، بالنسبة لمنطقة فرعية أو منطقة معينة، نحدد أعداد الاقتباسات لمخرجاتها المفتوحة والمغلقة من كل من المناطق الفرعية أو المناطق الأخرى، على التوالي. يتم حساب متوسط نسب الاقتباسات (أي، متوسط عدد الاقتباسات لمخرجات الوصول المفتوح، مقسومًا على متوسط عدد الاقتباسات لمخرجات غير الوصول المفتوح، وضربه في مئة) ونسبة التغيير في إجمالي الاقتباسات (أي، إجمالي الاقتباسات لمخرجات الوصول المفتوح ناقص إجمالي الاقتباسات لمخرجات غير الوصول المفتوح، ثم مقسومًا على إجمالي الاقتباسات لمخرجات غير الوصول المفتوح، وضربه في مئة) لكل منطقة فرعية أو منطقة مستشهدة. تشير القيمة التي تزيد عن مئة في الأولى إلى ميزة الوصول المفتوح وتشير القيمة التي تزيد عن 0 في الثانية إلى ميزة الوصول المفتوح. يتم تقديم النتائج في الرسوم التوضيحية التكميلية K إلى N.
بالنسبة لمعظم المناطق الفرعية والمناطق، نلاحظ ميزة الوصول المفتوح للاقتباسات القادمة من مناطق فرعية ومناطق أخرى. على وجه الخصوص، هناك زيادة في الاقتباسات للمخرجات المفتوحة المرتبطة بمؤسسات من مناطق فرعية تمثل تقليديًا تمثيلًا ناقصًا في الأدبيات أو لديها موارد أقل، مثل: شمال إفريقيا، إفريقيا جنوب الصحراء، وأمريكا اللاتينية ومنطقة البحر الكاريبي. يتماشى هذا مع زيادة استخدام المخرجات من خلال الوصول الأكبر من هذه المناطق الفرعية والمناطق. ومع ذلك، نلاحظ أيضًا أن ميزة تنوع الاقتباسات في الوصول المفتوح تتراكم بشكل تفضيلي لمراكز البحث التقليدية “المرموقة” من حيث الثروة وحجم مخرجات البحث. على سبيل المثال، يبدو أن شمال أوروبا يستفيد أكثر من كل من زيادة الاقتباسات من مناطق فرعية أخرى (أي، تُرى ميزة وصول مفتوح عالية تقريبًا لجميع المناطق الفرعية المستشهدة لشمال أوروبا)، ومن زيادة استخدامه لمخرجات من مناطق فرعية أخرى (أي، إنه المنطقة الفرعية التي تُعتبر باستمرار واحدة من أعلى المناطق الفرعية المستشهدة من حيث ميزة الوصول المفتوح لمخرجات المناطق الفرعية الأخرى). يتم ملاحظة نمط مشابه لأمريكا الشمالية. هناك أيضًا علامات على تغير الاتجاهات من حيث نسبة التغير في إجمالي الاقتباسات، حيث زادت ميزة الوصول المفتوح أو تحولت من سلبية إلى إيجابية في السنوات الأخيرة، لبعض المناطق الفرعية أو المناطق المختارة.

نقاش

يقترح هذا المقال طرقًا جديدة لفهم وتقييم الاقتباسات فيما يتعلق بالانتشار الأوسع لتنوع الاقتباسات البحثية عبر المؤسسات والدول والمناطق الفرعية والمناطق ومجالات البحث. الغرض الرئيسي من هذه المقاييس والتحليلات البيانية المقابلة هو فهم تأثير الوصول المفتوح على تنوع مستخدمي مخرجات البحث. نحن مهتمون أيضًا بكيفية مقارنة مستوى هذا التأثير عبر مناطق جغرافية مختلفة.
ركزت معظم الأدبيات السابقة على ميزة “عدد” الاقتباسات في الوصول المفتوح – أي، المخرجات المفتوحة لديها أعداد اقتباسات أعلى من المخرجات المغلقة. كما ذُكر في المقدمة، هناك العديد من النقاشات حول ما إذا كانت هناك ميزة حقيقية للاقتباسات في الوصول المفتوح. تشمل بعض العوامل المربكة (Tennant et al., 2016) اختيار المؤلف الذاتي (أي، يختار المؤلفون جعل أفضل مقالاتهم مفتوحة)، والتحيزات التخصصية (أي، اختلافات محتملة كبيرة عبر التخصصات)، والوصول إلى الموارد والهيبة (أي، المؤلفون المعروفون ذوو
المزيد من الموارد هم أكثر احتمالًا لجعل أعمالهم مفتوحة). تشير هذه إلى أن التركيز على عدد الاقتباسات لا يمكنه رسم الصورة الكاملة لفوائد الوصول المفتوح. قد تتلقى مخرجات مفتوحة المزيد من الاقتباسات، ولكن قد تستمر هذه الاقتباسات في القدوم من نفس مجموعات الباحثين. على العكس، قد لا تتلقى مخرجات مفتوحة المزيد من الاقتباسات، ولكن قد تأتي الاقتباسات من مجموعة أوسع من مستخدمي البحث. ومن ثم، نجادل بأن التحول إلى فهم تنوع الاقتباسات يوفر دليلًا أقوى وأكثر معنى لفوائد الوصول المفتوح في الوصول إلى جماهير أوسع.
كنتيجة رئيسية، نجد أن الوصول المفتوح مرتبط بتنوع أعلى في الاقتباسات، أي أن المخرجات المفتوحة تتلقى اقتباسات أكثر تنوعًا مقارنة بالمخرجات المغلقة. نشير إلى هذه الظاهرة كميزة تنوع الاقتباسات في الوصول المفتوح. نجد أن هذه الميزة متسقة بشكل ملحوظ عبر العديد من الطرق التي قمنا بتحليل البيانات بها (باستثناء الحالات القليلة المتطرفة جدًا)، مما يعالج المخاوف بشأن العوامل المربكة المذكورة أعلاه. الفئة الخضراء هي الأفضل أداءً في الوصول المفتوح من حيث توفير أعلى درجات تنوع الاقتباسات بشكل عام. على الرغم من أننا ندرك أنه من الصعب فصل تأثيرات المخرجات الذهبية والخضراء تمامًا.
نجد أيضًا أن هناك اختلافات عبر المناطق الفرعية والمناطق من حيث مدى استفادتها من ميزة تنوع الاقتباسات في الوصول المفتوح. على وجه الخصوص، يبدو أن المراكز البحثية الأكثر ثراءً والأكبر تاريخيًا تستفيد أكثر من هذا التأثير – حيث يكون لديها المزيد من الآخرين الذين يقتبسون من أعمالهم المفتوحة وأيضًا يقتبسون المزيد من أعمال الآخرين المفتوحة. سواء كان هذا نمطًا حقيقيًا لـ “الأغنياء يزدادون غنى” وما يعنيه ذلك محتملًا لتقدم الدعوة للوصول المفتوح وصنع السياسات سيكون مجالًا مهمًا لمزيد من البحث.
توسع المقال الحالي ويعمم من أعمال يونغ وبراندس (2020) ونييلون وآخرون (2021) ويفتح الباب لمزيد من البحث. اتجاه واضح هو توسيع مقاييس تنوع الاقتباسات سواء في مقاييس أكثر تعقيدًا (مثل الأخذ في الاعتبار الروابط المتعددة لانتساب المؤلفين) وإدخال تصنيفات جديدة لتنوع الاقتباسات (مثل تنوع اللغة للمخرجات المقتبسة؛ انظر لينكوف وآخرون، 2021 وديبروز وآخرون، 2023). يتم استخراج بيانات مجالات البحث لدينا من MAG الذي تم إيقافه الآن. سيكون من المثير للاهتمام فحص كيف قد تتغير نتائجنا إذا تم استخدام نظام تصنيف موضوعات مختلف (مثل تصنيف موضوعات Web of Science) أو قاعدة بيانات (مثل OpenAlex). سيكون من المثير للاهتمام أيضًا استكشاف كيف يرتبط تنوع الاقتباسات بتنوع التعاون بين المؤلفين (نايك وآخرون، 2023). تحسين تغطية البيانات للمناطق الجغرافية والتخصصات والمخرجات غير التقليدية التي تم تمثيلها تاريخيًا لا يزال يمثل تحديًا.

قيود البيانات

نقر بأن هناك قيودًا في البيانات المستخدمة في تحليلنا:
  • المخرجات البحثية المدرجة في تحليلنا هي تلك التي تم تعيين DOIs لها بواسطة Crossref. نحن ندرك أن هناك وكالات تسجيل DOI أخرى تعين DOIs للمخرجات البحثية (مثل البنية التحتية الوطنية للمعرفة في الصين – CNKI) وهذه ليست مدرجة حاليًا في نظامنا. وبالتالي، قد تكون هناك قيود في تغطيتنا لبعض مناطق آسيا وأفريقيا جنوب الصحراء ومناطق أخرى. هناك أيضًا قضايا عامة تتعلق بتغطية بعض مجالات البحث حيث لا تُستخدم DOIs تقليديًا على نطاق واسع (مثل الفن، العلوم السياسية، إلخ). بالإضافة إلى ذلك، قد تكون هناك قضايا تتعلق بنوافذ التحرك من حيث تعيين المخرجات لمجالات البحث، كنتيجة للتغيرات الثقافية والمنهجية على مر الزمن (مثل تعيين مخرجات الهندسة لعلوم المواد وعلوم الحاسوب في السنوات الأخيرة).
  • البيانات حول مجالات البحث المستخدمة في تحليلنا مستخرجة مباشرة من MAG. استخدم MAG أساليب التعلم الآلي لتصنيف المخرجات البحثية إلى “مفاهيم” وبناء تسلسل هرمي لهذه المفاهيم (وانغ وآخرون، 2020). نحن نستخدم فقط المفاهيم المحددة في المستوى 0 (أكثر المفاهيم عمومية أو أعلى المفاهيم الأبوية) من التسلسل الهرمي. من الممكن أن تختلف نتائجنا بناءً على مجالات البحث إذا تم استخدام مجموعة بيانات مختلفة حول مجالات البحث أو التخصصات. يجب أن نلاحظ أيضًا أن MAG قد تم إيقافه الآن، وسيتم استخدام مصدر بديل في الأعمال المستقبلية (مثل OpenAlex).
  • تعريفنا لتنوع الاقتباسات يعتمد على توزيع “روابط المخرجات إلى روابط الاقتباس” عبر مجموعات الاقتباس. وهذا يعني أنه إذا كان هناك مخرج مقتبس له مؤلفون متعددون ينتمون إلى انتسابات متعددة، فمن المحتمل أن يستنتج روابط متعددة من المخرج إلى روابط الاقتباس. بعبارة أخرى، قد ينتمي هذا المخرج المقتبس إلى مناطق متعددة (على سبيل المثال). قد يكون لهذا تأثير على المخرجات ذات الاقتباسات المنخفضة مع وجود مخرج واحد على الأقل مقتبس له عدد كبير بشكل استثنائي من المؤلفين من انتسابات متعددة. ومع ذلك، كشفت فحوصات الجودة لدينا عن عدد قليل جدًا من هذه الحالات (أي، القيم المتطرفة) وليس لها تأثير واضح على النتائج العامة. قد تكون هناك طرق أخرى لتعريف أو قياس تنوع الاقتباسات التي تتضمن مثل هذه الحالات.

استنتاج

مبادرة الوصول المفتوح في بودابست (شان وآخرون، 2002)، التي مضى عليها الآن أكثر من 20 عامًا، تشير إلى أن الوصول المفتوح يجعل من الممكن
…التوزيع الإلكتروني العالمي للأدبيات العلمية التي تمت مراجعتها من قبل الأقران والوصول المجاني وغير المقيد إليها من قبل جميع العلماء والباحثين والمعلمين والطلاب والعقول الفضولية الأخرى.
توفير منفعة عامة ست
“…تسرع البحث، وتثري التعليم، وتشارك تعلم الأغنياء مع الفقراء والفقراء مع الأغنياء، وتجعل هذه الأدبيات مفيدة قدر الإمكان، وتضع الأساس لتوحيد الإنسانية في محادثة فكرية مشتركة وسعي للمعرفة”.
تظل الجهود لإظهار نجاح هذا المسعى مثيرة للجدل مثل اختيار الطرق نحو تحقيق الوصول المفتوح. سيظل استخدام الاقتباسات لالتقاط استخدام وقيمة البحث محدودًا دائمًا، ولكن البيانات حول أشكال الاستخدام الأخرى للنشر الأكاديمي لا تزال تمثل تحديًا وغير مكتملة. من خلال تحويل الانتباه من عد الاقتباسات إلى تقييم تنوع المخرجات المقتبسة، أظهرنا أن البيانات الحالية يمكن إعادة استخدامها لتحليل أهداف مختلفة. من خلال القيام بذلك، أظهرنا أنه حتى بالنسبة للشكل الضيق للاستخدام الذي تمثله الاقتباسات من المخرجات البحثية، يتم استخدام المخرجات المفتوحة من قبل تنوع أوسع من المخرجات المقتبسة، سواء قمنا بتحليل تلك المخرجات المقتبسة حسب المؤسسة أو البلد أو المنطقة الفرعية أو المنطقة أو مجالات البحث.
بشكل أوسع، تقدم مقاييس تنوع الاقتباسات رؤية جديدة للبيانات الحالية، مما يوفر رؤى محتملة لا تقدمها مجرد عد الاقتباسات. كإشارة محتملة إلى أين تُرى فوائد الوصول المفتوح ودليل لتحسين تنفيذ سياساتنا للوصول المفتوح من أجل وصول أوسع، يقدم هذا النهج العديد من الفرص في معالجة (شان وآخرون، 2002)
“…مهمة إزالة الحواجز أمام الوصول المفتوح وبناء مستقبل يكون فيه البحث والتعليم في كل جزء من العالم أكثر حرية للازدهار”.
معلومات إضافية تحتوي النسخة الإلكترونية على مواد إضافية متاحة علىhttps://doi. org/10.1007/s11192-023-04894-0.
شكر وتقدير تم تمويل هذا العمل من قبل مكتب البحث في كورتين من خلال منحة استراتيجية، كلية العلوم الإنسانية بجامعة كورتين، ومدرسة الإعلام والفنون الإبداعية والدراسات الاجتماعية. المؤلفون مرتبطون بمبادرة كورتين للمعرفة المفتوحة التي هي أيضًا متلقية لمنحة من Arcadia، صندوق خيري من ليسبيت راسينغ وبيتر بالدوين.
مساهمات المؤلفين كان CKH وCN وLM مشاركين في التصور وإدارة المشروع. كان CKH وCN وRH مسؤولين عن تنسيق البيانات. كان CK وCN مسؤولين عن التحليل الرسمي، والتحقيق، والمنهجية، والتحقق، والتصور وكتابة المسودة الأصلية للمقال. كان CN وLM مسؤولين عن الحصول على التمويل والإشراف. كان CKH وCN مسؤولين عن البرنامج الذي أنتج البيانات المعالجة، والتحليل، والرسوم البيانية، والنصوص النهائية. كان RH وJPD مسؤولين عن البرنامج الذي جمع وأنشأ جداول البيانات المستخدمة كمدخلات للمشروع. ساهم CKH وCN وLM وRH وJPD وRNH وKW في المراجعة النهائية، والتحرير، والموافقة على المخطوطة.
تمويل تم تمكين وتنظيم تمويل الوصول المفتوح بواسطة CAUL ومؤسساته الأعضاء. تم تمويل هذا العمل من قبل مكتب البحث بجامعة كورتين، كلية العلوم الإنسانية بجامعة كورتين، مدرسة الإعلام والفنون الإبداعية والدراسات الاجتماعية بجامعة كورتين، Arcadia صندوق خيري من ليسبيت راسينغ وبيتر بالدوين.
توفر البيانات البيانات المعالجة (كملفات CSV) المستخدمة في التحليل وفي إنشاء الأشكال مشتركة على زينودو (https://doi.org/https://doi.org/10.5281/zenodo.7081118) وGitHub (https://github.com/مبادرة كورتين للمعرفة المفتوحة/تنوع الاقتباس).
توفر الكود استعلامات SQL المستخدمة لإنشاء جميع البيانات، مع الأكواد المستخدمة لإنتاج الأشكال، لإجراء التحليل، ولإنشاء الوثائق النصية النهائية مشتركة عبر زينودو (https://doi.org/https:// doi.org/10.5281/zenodo.7081118) وGitHub (https://github.com/Curtin-Open-Knowledge-Initiative/citation-diversity).

الإعلانات

تعارض المصالح يعلن المؤلفون أنهم ليس لديهم مصالح متنافسة.
الوصول المفتوح هذه المقالة مرخصة بموجب رخصة المشاع الإبداعي للاستخدام الدولي 4.0، والتي تسمح بالاستخدام والمشاركة والتكيف والتوزيع وإعادة الإنتاج في أي وسيلة أو صيغة، طالما أنك تعطي الائتمان المناسب للمؤلفين الأصليين والمصدر، وتوفر رابطًا لرخصة المشاع الإبداعي، وتوضح ما إذا كانت هناك تغييرات قد تم إجراؤها. الصور أو المواد الأخرى من طرف ثالث في هذه المقالة مشمولة في رخصة المشاع الإبداعي للمقالة، ما لم يُشار إلى خلاف ذلك في سطر الائتمان للمادة. إذا لم تكن المادة مشمولة في رخصة المشاع الإبداعي للمقالة واستخدامك المقصود غير مسموح به بموجب اللوائح القانونية أو يتجاوز الاستخدام المسموح به، ستحتاج إلى الحصول على إذن مباشرة من صاحب حقوق الطبع والنشر. لعرض نسخة من هذه الرخصة، قم بزيارة http://creativecommons.org/licenses/by/4.0/.

References

Archambault, E., Amyot, D., Deschamps, P., Nicol, A., Provencher, F., Rebout, L., & Roberge, G. (2014). Proportion of open access papers published in peer-reviewed journals at the European and world level-1996-2013. RTD-B6-PP-2011-2: Study to develop a set of indicators to measure open access. Report. Science-Metrix. Retrieved August 19, 2022, from https://science-metrix.com/sites/default/files/science-metrix/publications/d_1.8_sm_ec_dg-rtd_proportion_oa_1996-2013_v11p.pdf
Basson, I., Blanckenberg, J. P., & Prozesky, H. (2021). Do open access journal articles experience a citation advantage? Results and methodological reflections of an application of multiple measures to an analysis by WoS subject areas. Scientometrics, 126, 459-484. https://doi.org/10.1007/s11192-020-03734-9
Bautista-Puig, N., Lopez-Illescas, C., de Moya-Anegon, F., Guerrero-Bote, V., & Moed, H. F. (2020). Do journals flipping to gold open access show an OA citation or publication advantage? Scientometrics, 124, 2551-2575. https://doi.org/10.1007/s11192-020-03546-x
Chan, L., Cuplinskas, D., Eisen, M., Friend, F., Genova, Y., Guédon, J., Hagemann, M., Harnad, S., Johnson, R., Kupryte, R., La Manna, M., Rév, I., Segbert, M., de Souza, S., Suber P., Velterop, J. (2002). Read the declaration-Budapest Open Access Initiative. Retrieved September 6, 2022, from https://www.budap estopenaccessinitiative.org/read/
Dahler-Larsen, P. (2018). Making citations of publications in languages other than English visible: on the feasibility of a PLOTE-index. Research Evaluation, 27(3), 212-221. https://doi.org/10.1093/reseval/rvy010
Davis, P. M. (2011). Open access, readership, citations: A randomized controlled trial of scientific journal publishing. The FASEB Journal, 25(7), 2129-2134. https://doi.org/10.1096/fj.11-183988
Diprose, J., Neylon, C., & Kramer, B. (2022). Language Diversity in Scholarly Publishing. Curtin Open Knowledge Initiative News. Retrieved September 5, 2023, from https://openknowledge.community/languagediversity/
Dorta-González, P., González-Betancor, S. M., & Dorta-González, M. I. (2017). Reconsidering the gold open access citation advantage postulate in a multidisciplinary context: An analysis of the subject categories in the Web of Science database 2009-2014. Scientometrics, 112, 877-901. https://doi.org/10.1007/ s11192-017-2422-y
Hosking, R., Diprose, J. P., Roelofs, A., Chien, T.-Y., Handcock, R. N., Kramer, B., Napier, K., Montgomery, L., & Neylon, C. (2022). Academic observatory workflows [software]. Zenodo. https://doi.org/10.5281/ zenodo. 6366694
Hua, F., Sun, H., Walsh, T., Worthington, H., & Glenny, A. (2016). Open access to journal articles in dentistry: Prevalence and citation impact. Journal of Dentistry, 47, 41-48. https://doi.org/10.1016/j.jdent.2016.02. 005
Huang, C.-K., & Neylon, C. (2022). Curtin-open-knowledge-initiative/citation-diversity: Codes and data for open access research outputs receive more diverse citations [software]. Zenodo. https://doi.org/10.5281/ zenodo. 7081118
Hutchins, B. I., Yuan, X., Anderson, J. M., & Santangelo, G. M. (2016). Relative citation ratio (RCR): A new metric that uses citation rates to measure influence at the article level. PLoS Biology, 14(9), e1002541. https://doi.org/10.1371/journal.pbio. 1002541
Lewis, C. L. (2018). The open access citation advantage: Does it exist and what does it mean for libraries? Information Technology and Libraries, 37(3), 50-65. https://doi.org/10.6017/ital.v37i3.10604
Linkov, V., O’Doherty, K., Choi, E., & Han, G. (2021). Linguistic diversity index: a scientometric measure to enhance the relevance of small and minority group languages. SAGE Open, 11(2), 1-9. https://doi.org/10. 1177/21582440211009191
Naik, C., Sugimoto, C. R., Larivière, V., Leng, C., & Guo, W. (2023). Impact of geographic diversity on citation of collaborative research. Quantitative Science Studies, 4(2), 442-465. https://doi.org/10.1162/qss_a_ 00248
Neylon, C., & Huang, C.-K. (2022). The global state of open access 2021. Zenodo. https://doi.org/10.5281/ zenodo. 7059176
Neylon, C., Ozaygen, A., Montgomery, L., Huang, C.-K., Pyne, R., Lucraft, M., & Emery, C. (2021). More readers in more places: the benefits of open access for scholarly books. Insights, 34(1), 27. https://doi.org/ 10.1629/uksg. 558
Piwowar, H., Priem, J., Larivière, V., Alperin, J. P., Matthias, L., Norlander, B., Farley, A., West, J., & Haustein, S. (2018). The state of OA: A large-scale analysis of the prevalence and impact of open access articles. PeerJ, 6, e4375. https://doi.org/10.7717/peerj. 4375
Seppänen, J.-T., Värri, H., & Ylönen, I. (2022). Co-citation percentile rank and JYUcite: A new network-standardized output-level citation influence metric and its implementation using dimensions API. Scientometrics, 127, 3523-3541. https://doi.org/10.1007/s11192-022-04393-8
Sotudeh, H. (2020). Does open access citation advantage depend on paper topics? Journal of Information Science, 46(5), 696-709. https://doi.org/10.1177/0165551519865489
Tennant, J. P., Waldner, F., Jacques, D. C., Masuzzo, P., Collister, L. B., & Hartgerink, C. H. (2016). The academic, economic and societal impacts of open access: An evidence-based review. F1000 Research, 5, 632. https://doi.org/10.12688/f1000research.8460.3
The World Bank. (2022). Research and development expenditure (% of GDP). World Bank Group. Retrieved September 6, 2022, from https://data.worldbank.org/indicator/GB.XPD.RSDV.GD.ZS
Wang, K., Shen, Z., Huang, C., Wu, C., Dong, Y., & Kanakia, A. (2020). Microsoft academic graph: When experts are not enough. Quantitative Science Studies, 1(1), 396-413. https://doi.org/10.1162/qss_a_00021
Young, J. S., & Brandes, P. M. (2020). Green and gold open access citation and interdisciplinary advantage: A bibliometric study of two science journals. The Journal of Academic Librarianship, 46(2), 102105. https:// doi.org/10.1016/j.acalib.2019.102105
Zhang, L., & Watson, E. M. (2017). Measuring the impact of gold and green open access. The Journal of Academic Librarianship, 43(4), 337-345. https://doi.org/10.1016/j.acalib.2017.06.004
Publisher’s Note Springer Nature remains neutral with regard to jurisdictional claims in published maps and institutional affiliations.

  1. Chun-Kai Huang
    karl.huang@curtin.edu.au
    1 Centre for Culture and Technology, Curtin University, Bentley, WA, Australia
    2 Curtin Institute for Data Science, Curtin University, Bentley, WA, Australia
    3 Faculty of Education, Te Herenga Waka – Victoria University of Wellington, Wellington, New Zealand

Journal: Scientometrics, Volume: 129, Issue: 2
DOI: https://doi.org/10.1007/s11192-023-04894-0
Publication Date: 2024-01-08

Open access research outputs receive more diverse citations

Chun-Kai Huang (D) . Cameron Neylon (D) . Lucy Montgomery (D) .Richard Hosking James P. Diprose

Received: 10 January 2023 / Accepted: 30 November 2023 / Published online: 8 January 2024
© The Author(s) 2024

Abstract

The goal of open access is to allow more people to read and use research outputs. An observed association between highly cited research outputs and open access has been claimed as evidence of increased usage of the research, but this remains controversial. A higher citation count also does not necessarily imply wider usage such as citations by authors from more places. A knowledge gap exists in our understanding of who gets to use open access research outputs and where users are located. Here we address this gap by examining the association between an output’s open access status and the diversity of research outputs that cite it. By analysing large-scale bibliographic data from 2010 to 2019, we found a robust association between open access and increased diversity of citation sources by institutions, countries, subregions, regions, and fields of research, across outputs with both high and medium-low citation counts. Open access through disciplinary or institutional repositories showed a stronger effect than open access via publisher platforms. This study adds a new perspective to our understanding of how citations can be used to explore the effects of open access. It also provides new evidence at global scale of the benefits of open access as a mechanism for widening the use of research and increasing the diversity of the communities that benefit from it.

Keywords Open access Citation analysis Citation diversity Article usage Research impact Open science

Introduction

The purpose of research is for it to be used, either applied to solve problems and address issues, or more narrowly to provide insight, capacity, and inspiration for further research. The open access (OA) movement is founded on the goals of putting research in the hands of more people and making it more usable (e.g., the Budapest OA Initiative) (Chan et al.,
2002). A seismic shift in access models for scholarly outputs (i.e., from subscription-based models to OA models) has occurred over the past decade with accessible outputs (i.e. can be read or downloaded without payment) rising from approximately of global outputs published in 2011 to over of all outputs published in 2020 being accessible in some form (Neylon & Huang, 2022).
It remains challenging to conclusively demonstrate the benefits of this shift in access models for scholarly outputs. Case studies and qualitative research approaches have helped to shed light on complex relationships between access models, use and impact. Studies have sought quantitative evidence of enhanced usage via a variety of methods. Some have observed associations between increased citation counts and OA, providing the most global evidence of enhanced article usage (Archambault et al., 2014; Bautista-Puig et al., 2020; Piwowar et al., 2018). However, there are several confounding factors that weaken claims of a causal link between OA and enhanced use of research outputs (Basson et al., 2021; Dorta-González et al., 2017). A set of narrowly defined randomised control trials finds no effect (Davis, 2011), and there is an argument that access to academic resources and prestige may well be associated with both the choice to make an output OA and the likelihood of higher citations (Hua et al., 2016; Lewis, 2018; Sotudeh, 2020; Zhang & Watson, 2017).
In addition, we feel that the focus on citation counts fails to address the core goals of OA, specifically that a wider range of research users has more access (Dahler-Larsen, 2018; Linkov et al., 2021; Neylon et al., 2021). We need a different approach to quantify the impact of OA focusing on widening the diversity of users who are able to access scholarly content. Recent advances in data availability and processing mean that we are now able to identify the affiliations of citing authors at scale and hence quantitatively assess the institutional and geographic diversity of citing authors globally. Similarly, we can analyse the fields of research across citing outputs. We refer to these measures under one umbrella term: citation diversity.

Relevant research

There is limited amount of scholarly literature that investigates the relationships between OA and its potential impact on widening the geographic and interdisciplinary dissemination and use of research. Two most closely related works are Young and Brandes (2020) and Neylon et al. (2021). The former reported that OA articles received more interdisciplinary diverse citations than non-OA articles, although only data from two journals were studied. Neylon et al. (2021) showed that OA books garnered more diverse usage (via geographic locations of downloads) as compared to closed books. This study showed not only that OA books are cited and downloaded more than their closed counterparts, but also that they are downloaded by a wider audience. A few other studies (though less concerned with OA ) explored the diversity of references and co-authorships. Linkov et al. (2021) proposed the Linguistic Diversity Index as a scientometric measure of the linguistic diversity of sources cited in articles. This index is aimed at encouraging the use of sources from more diverse cultural groups, placing higher importance on rarely represented cultural groups. Naik et al. (2023) showed that the geographic diversity (by air transport network) in co-authorships as having a positive impact on citation counts, albeit at varying levels of strength across different subject areas. These works highlight how diversity measures can help further our understandings of the academic publishing landscape. Diversity is shown to have potential relationships with citation counts, usage levels, and OA levels of research
outputs. However, a knowledge gap exists in the comprehensive and large-scale study of citation diversity in terms of geographies and how it relates to OA .

Contribution

The objective of the current article is to address the above gap by exploring the relationships between OA and citation diversity. We do this by examining the geographic locations of author affiliations, and the fields of research, of citing outputs. We use the diversity of these citing outputs as a proxy for wider dissemination of research. Through this our goal is to define the impact of OA on the wider use of research. The study extends previous work and adds to the literature in the following ways:
  • The study extends the concept of citation diversity to consider the geographic locations of author affiliations of citing outputs in addition to the fields of research.
  • The study draws on publicly available datasets that include 19 million research outputs and 420 million citation links worldwide, making it the largest study of this type to date.
  • The large-scale data also enables the study to explore the robustness of the results by comparing results across time, different measures of diversity, various groupings of citation-affiliation links, citation counts, and examining their dependencies.
  • The study also takes a first exploration in examining whether there are differences across geographic regions in terms of how OA influences citation diversity (e.g., where increased citations come from).
The rest of the article is structured as follows. In “Method” section, we provide details of the data and methods used for this study. “Results” section includes the main results from the analysis, with summarised discussions on the robustness of the results also provided at the end of the section. We provide detailed discussions of the results in “Discussion” section including implications for further research. “Conclusion” section concludes the study. Additional information and results are provided in Supplementary material.

Method

We quantify citation diversity using two different standard measures of diversity that are less sensitive to citation counts. This helps us to address the issues of access to resources and prestige that are potential confounders (Davis, 2011; Hua et al., 2016; Lewis, 2018; Sotudeh, 2020; Zhang & Watson, 2017) in analyses based simply on citation counts which remain with more sophisticated measures such as citation velocity, as shown in previous research (Hutchins et al., 2016; Seppänen et al., 2022).
For our analysis we extracted all research outputs with publication years from 2010 to 2019 (see “Input data” section for details). For each of the 19 million outputs, we extracted citation counts (from the total of 420 million citation links), metadata of their citing outputs and citing author affiliations, and calculated the Shannon Entropy (or Shannon Index) and the Gini-Simpson Index (or Gini’s Diversity Index) as measures of citation diversity (see Table 1). Higher scores for these indices are indicators of more citation diversity. We consider citation diversity based on five different ways of grouping citation links: by institutions, countries, subregions, regions, and fields of research (i.e., citing actors-see
Table 1 List of terms
Term/variable Definition Data description
Citing output (or paper) If Output A references Output B, then Output A is a citing output for Output B Citing outputs are identified using the table of reference links in MAG. Only outputs with Crossref DOIs are included
Citing actor An actor upon which a citing output can be affiliated or characterised, e.g., author, author affiliation, country of author affiliation, field of research, etc Once a citing output is identified (as above), the authors, author affiliations, and fields of research are identified using MAG. Then geographic locations of author affiliations (e.g., country, subregion, region) are identified using ROR
Citing author An author of a citing output See data description for “Citing actor”
Citing institution An institution that is included as an author affiliation in a citing output See data description for “Citing actor”
Citing country The country of a citing institution See data description for “Citing actor”
Citing subregion The subregion of a citing institution See data description for “Citing actor”
Citing region The region of a citing institution See data description for “Citing actor”
Citation count The number of citations (citing outputs) that an output received This is calculated by counting the number of citing outputs. See data description of “Citing outputs”
Fields of research The field of research (or subject discipline) assigned to a given output We use data as defined by MAG’s “Level 0 fields” under the MAG hierarchy of “concepts” assigned to outputs. Level 0 is the highest-level parent concepts in the MAG concepts hierarchy, i.e., most broad terms
Citation diversity A term describing how diverse an output’s citations are in terms of their links to citing actors There are many ways to quantify diversity of the output-tociting actor links. The Gini-Simpson Index and the Shannon Entropy are used for this study. These are calculated using MAG’s citation links and fields of research assignments, and ROR’s organisational metadata
Gini-Simpson Index (Gini’s Diversity Index) A diversity measure that quantifies the probability that two randomly selected output-to-citing actor links belong to the same citing actor group For a given output, the Gini-Simpson Index is calculated by first placing all output-to-citing actor links into bins according to different groups of citing actors (e.g., countries). Then proportions of these links in each bin (country) is calculated. Finally, the Gini-Simpson Index formula is applied
Table 1 (continued)
Term/variable Definition Data description
Shannon Entropy (Shannon Index) A diversity measure that quantifies the level of uncertainty in predicting the citing actor group assignment of a randomly selected output-to-citing actor link This is calculated following the same process as Gini-Simpson Index except with the formula replaced by the Shannon Entropy formula
Open access outputs (OPEN) Outputs that are freely accessible via either publisher platforms or OA repositories An output’s OA status is determined as per Unpaywall data
Gold outputs (GOLD) Outputs that are freely accessible via publisher platforms with open licences An output’s GOLD status is determined as per Unpaywall data
Green outputs (GREEN) Outputs that are freely accessible via disciplinary and institutional repositories An output’s GREEN status is determined as per Unpaywall data
Closed outputs (CLOSED) Outputs with no OA copies available from publisher platforms nor open repositories An output’s OA status is determined as per Unpaywall data
Open access citation advantage (OACA) This is a statement implying that OA increases the number of citations that an output receives NA
Open access citation diversity advantage This is a statement implying that OA widens the diversity of citations that an output receives NA
Percentage (%) change in total citations Total citations to OA outputs minus total citations to non-OA outputs, then divided by total citations to non-OA outputs, and multiplied by one hundred This is calculated for a specified set of target outputs, and citing outputs from a specified citing actor. For example, we may be interested in the citations from subregion Y to subregion . Hence, outputs from subregion are split into OPEN and CLOSED outputs. Citing outputs for each of these outputs from subregion Y are identified and counted. Then the percentage change in total citations is calculated
Percentage (%) ratio in average citations The average number of citations to OA outputs, divided by the average number of citations to non-OA outputs, and times by one hundred This is calculated in a similar way to the above, except the citation count is averaged across the number of target outputs in each of OPEN and CLOSED sets
Kernel density estimate (KDEs) This is a non-parametric estimate of the probability density function of a given random variable. In our study we are interested in comparing KDEs between OPEN and CLOSED outputs This is created using the create_distplot function in the Plotly Figure Factory package in Python. We applied this estimation to 10,000 sampled OPEN outputs and 10,000 sampled CLOSED outputs, respectively, for each combination of diversity measure, citing actor type, and years of publication
Table 1). Figure 1 demonstrates how citation diversity assessed using these indices is different from traditional citation counts. Two outputs can have a very different diversity of citing actors despite having equal citation counts. For instance, an article that is cited from a wider range of institutions but has the same number of citations will have a greater citation diversity.

Input data

COKI academic observatory

The COKI Academic Observatory (https://github.com/The-Academic-Observatory) is a large-scale relational database tracking open knowledge performance of research institutions worldwide. It is designed to be an open source, community-driven and community accessible resource, built around re-usable cloud architecture and transparent assumptions. It is developed by the COKI project, based at Curtin University. The project aims to create the world’s leading data infrastructure on scholarly communication, OA, diversity, inclusion, and more. COKI’s goal is to ensure that the tools and data used to evaluate scholarly outputs and research institutions support more open and productive practices, so that universities can change the stories they tell about themselves, and to put open knowledge at the centre of these narratives.
Fig. 1 Illustrative examples to demonstrate differences between citation counts, number of citing actors, and diversity measures. Outputs with equal citation counts do not necessarily have the same level of diversity in citing actors. Citing outputs are affiliated to institutions and these institutional-links can be grouped by their locations. These provide the basis for calculating diversity measures. Only country level diversity scores are provided in the figure. See “Analysis methodology” section for details of calculating the Shannon Entropy (or Shannon Index) and the Gini-Simpson Index (or Gini’s Diversity Index). Left: Output A and Output B both have two citations. However, Output A is cited by institutions from two different countries, while all citing institutions for Output B are from Country Z. Hence, Output A has a higher level of citation diversity by country. Right: Output C and Output D both have five citations. However, Output C has both more citing institutions, and these institutions are from more countries. This implies Output C has a higher level of citation diversity by country, i.e., higher score in diversity measures.
To analyse citation diversity, we used the data workflows and datasets developed by the Curtin Open Knowledge Initiative (COKI) for analysis of open knowledge performance. The COKI Academic Observatory data collection pipeline (Hosking et al., 2022) is used to create the Academic Observatory dataset which is used to analyse citation counts, affiliations and diversity. This pipeline integrates data from Crossref Metadata (DOIs, publication dates), Unpaywall (OA status), Microsoft Academic Graph (MAG) (institutional affiliations, citation links, fields of research; since this study was completed this has been replaced with OpenAlex), Research Organization Registry (ROR) (institutional information) to generate the “DOI Table”-an enriched metadata source on research outputs.
These datasets are updated on a regular cycle with MAG updated fortnightly (before it was retired) and Crossref Metadata updated monthly. The specific instances of the tables used directly are:
  • “academic-observatory.observatory.doi20220730”
  • “academic-observatory.mag.PaperReferences20211206”
We filter all DOIs to those that also have “PaperIDs” from MAG and to publication dates from 2010 to 2019 (both inclusive). The date range is selected based on our confidence in data quality and also considerations given to the fact that most new outputs would have had little time to attract citations. We use the final data extraction of MAG (11 December 2021) for analysis.
The full data in the time range includes 37 million outputs with 424 million citation links. However, only outputs with two or more citations are applicable (non-trivial) in the calculations of citation diversity measures. This resulted in the final data of 19 million outputs and 420 million citation links between these outputs.

Analysis methodology

As shown in Fig. 1 our unit of analysis is the affiliation link or field of research associated with an incoming reference to a given output. We calculate the Shannon Entropy and Gini-Simpson Index scores of the set of affiliations associated with citing outputs, with respect to groupings by institutions, countries, subregions, and regions, and also the MAG “Level 0 fields” (aka “fields of research”) associated with citing outputs. These two diversity measures provide complementary quantifications of diversity in the citing affiliation/field links associated with individual cited outputs. We note that a “citation link” refers to an output-to-output link via referencing, whereas a “citing affiliation link” or “citing field link” is a further step forward determining the link between an output and an affiliation associated with a citing output, or between an output and the field of research associated with a citing output, respectively. More generally, we refer to these as “output-to-citing actor” links, where the citing actors may be institutions, countries, subregions, regions, or fields of research associated with the citing output.
We define as the number of groups (e.g., countries, fields of research) and as the proportion of output-to-citing actor links assigned to a given group. The Shannon Entropy quantifies the level of uncertainty in predicting the group assignment of a randomly selected output-to-citing actor link as:
whereas the Gini-Simpson Index measures the probability that two randomly selected out-put-to-citing actor links belongs to the same group:
with as the natural logarithm of .
The analysis is implemented in template SQL queries that are run via an automated reporting framework implemented in Python. The first step is the aggregation of the affiliations associated with incoming citations for each of the 37 million outputs and 424 million citation links in the target time period. The resulting table “citation_diversity_global” is stored in Google’s cloud-based BigQuery database. Subsequent analyses and corresponding SQL queries further filter this down to outputs with two or more citations, which corresponds to 19 million outputs with 420 million citation links. The decision to only consider outputs with two or more citations is based on the fact that measuring diversity for outputs with zero citations is nonsensical and outputs with only one citation will trivially be assigned a diversity score of zero. However, these outputs are kept in the table above for validation purposes.
Subsequent analysis steps are implemented in template SQL queries of the cloud-based database with the resulting data downloaded as comma delimited text files (CSVs) suitable for use in the Pandas Python library and stored locally. These local data are then used to generate the tables and graphs in this article. The full process from source data to final outputs is specified in code and automated to support reproducibility and enable detailed critique (Huang & Neylon, 2022).
For this study, we consider four different (but potentially overlapping) categories of outputs: OPEN, GOLD, GREEN, and CLOSED (see Table 1 for definitions). Results are compared across these different categories in relation to their impact on citation diversity, where necessary. We also use percentage ratios in average citations and percentage changes in total citations (see Table 1 for definitions) to examine where increased citations come from and use these to compare the levels of citation diversity advantage across different subregions and regions.

Statistical significance

In this study we have avoided using statistical significance as a measure of the likelihood of an effect. There are several reasons for this choice. Firstly, we are predominantly dealing with a population of outputs rather than targeted samples of outputs. This includes all outputs captured by a system that aims to include worldwide research outputs that have Crossref DOIs and MAG PaperIDs. Second, given the large numbers of outputs included in most of our analyses, the resulting p-values are both diminutive and highly associated with sample sizes chosen, making them less useful as a measure of confidence. Third, comparing statistical significance across a large number of groups, where groups also differ widely in distribution, is highly challenging. This would entail considerations for both the effects of multiple comparisons and advanced sampling procedures. On the other hand, downstream distributional analyses of large numbers of outputs are also not practical. Given the
above, we have taken the alternative in exploring the consistency of the OA citation diversity advantage across multiple ways of analysing the corpus of outputs. However, where possible, we have included some subsampling analyses to emphasise that this consistency is maintained across comparable but small samples relative to the whole data.

Results

Comparing OA categories

As a first step in our analysis, we confirm the previously observed OA citation advantage (see Table 1), for the first time at a global scale. We observe an association of OA with higher citations at the global scale, consistent with previous literature on OA citation count advantage but with the known caveats described earlier. We see that this association is robust across years of publication, and OA categories (See “Robustness of results”). Further work on this OA citation count advantage using global datasets could help to reveal what factors are associated with these complex effects. We also characterise the citations by the number of unique citing institutions, countries, subregions, regions, and fields of research (see Table 1). Again, a robust advantage for OA categories is observed (with a few existing exceptions) which offers avenues for further analysis of the causal effects underlying the citation diversity advantage for OA (see “Robustness of results” for details).
Turning to our main focus, the diversity of citations, our results showed an enhanced diversity of citing institutions, countries, subregions, and regions for OA research outputs, with this effect being consistently observed across all publication years since 2010 (see Fig. 2a and b), and across almost all fields of research in our study data. There are differences over time, between fields of research and between author’s country of affiliation in the scale of the effect, as well as the underlying diversity measures. These are interesting areas for future study. What is striking is how consistent the observed effect is across all these potential groupings. This includes distributional shifts toward higher diversity scores for OA outputs (relative to CLOSED outputs) for all citing actor groups, publication years, and both diversity measures. Figure 2c demonstrates some of those distributional shifts. Although the shift can be small in some cases, it is consistent across almost all comparisons for various groupings. See “Robustness of results” and Supplementary Material for results across all different groupings.
When comparing mechanisms of OA, we see a larger effect in the diversity of citing countries, subregions, regions, and fields of research across all years, and for access provided through repositories (i.e., GREEN outputs) than for OA provided via publisher websites (Fig. 2b and c). This effect shows interesting discipline and author-country effects which merit further investigation.
The debate over the citation count advantage is dominated by questions of confounding effects, specifically whether OA is more accessible to researchers from wealthier and more prestigious institutions and/or whether researchers selectively make their best work OA . To address this, we also showed that the citation diversity advantage is present, independent of citation counts (see “Robustness of results”). The lack of overall correlation between citation count and citation diversity provides evidence that citation count and citation diversity track different aspects of usage and that there is limited common confounding at the global scale. However, this correlation is higher for outputs with low citation numbers. The cohorts of outputs published in later years have higher proportions of low-citation outputs
Fig. 2 Comparing citation diversity between OA categories. a The median Shannon scores by citing institutions are compared between OA and CLOSED outputs over a ten-year period. Earlier outputs receive higher scores as a result of having had more time to garner citations (hence more possibility of wider citing affiliations). However, it is consistently observed that OA outputs perform better in the diversity of citing institutions for all years. The mean Shannon scores are compared across the OA categories, with the scores calculated based on the grouping of citing affiliation links by countries, subregions, and regions, and citing outputs by fields of research. For the first three cases, all OA categories consistently outperform CLOSED outputs. OA outputs also outperform CLOSED outputs for the fields of research in more recent years. This is likely a result of evolving research practices and data quality levels. We also note that the scores should not be compared across different citing actor types as they measure different ways of grouping citing actor links (hence different scales). c Boxplots of Shannon scores for samples of 2017 outputs are provided for various citing actors and compared between various OA categories. Equal size samples are used across OA categories for this comparison
(i.e., less time to accumulate citations), which may partially explain the downward trends in the median citation diversity scores (Fig. 2a and b). A more in-depth analysis is needed through further research.
As an observational cohort study, our analysis is not able to confirm the exact causal links between OA and enhanced citation diversity. However, as a global analysis we can definitively say that within the full cohort in our dataset of 19 million outputs, OA outputs have a greater level of citation diversity. This is demonstrated through both summary statistics and distributional analyses.

Comparing geographies

To further understand where increased citation diversity comes from and how it compares across geographies, we also examine the geographical distribution of citations. We do this by examining the percentage change in total citations and the percentage ratio in average citations (see Table 1) across OPEN and CLOSED outputs for all pairs of subregions and regions. These represent the levels of change in citation from a specific subregion or region when moving from CLOSED to OPEN outputs. As a miniature demonstration, Fig. 3 shows differences between OPEN and CLOSED outputs with respect to citations to and from three selected subregions.
Fig. 3 Changes in citations to and from selected subregions. a The three graphs resemble selected citation links to outputs by the subregions: Northern Europe, Sub-Saharan Africa, and Eastern Asia, respectively. Within each graph, the percentage change in total citations (see “Robustness of results”) from the three selected subregions (for 2019) are shown. A value above zero indicates a positive effect for OA. While both Northern Europe and Sub-Saharan Africa benefit from OA outputs, there are differences in the results. Eastern Asia is one of the exceptions resulting from less comprehensive coverage by Western bibliographic systems. b An alternative measure is used to track differences in mean citations between OA and CLOSED outputs-percentage ratios (see “Method”). The results are provided for all years included in the study. A value above 100 indicates a positive effect for OA
The top panel in Fig. 3a shows that numbers of citations from all three subregions to outputs affiliated with Northern Europe have increased when moving from CLOSED to OPEN outputs. The increase is greatest for citations from Sub-Saharan Africa (almost five folds), with citations from Northern Europe itself increasing by 400 percent and citations from Eastern Asia increasing by over 200 percent. The middle panel in Fig. 3a similarly shows positive impacts for Sub-Saharan African outputs, albeit at much lower levels. Eastern Asia (Fig. 3a bottom panel) represents an interesting case where the impact of OA on citations seems to be little to negative. This is likely due to local policies and the lack of comprehensive coverage of data from the subregion. Figure 3b alternatively describes the changes in citations using percentage ratio in average citations. However, the same trends are observed and are consistent over time. In this miniature example we see that outputs affiliated with Northern Europe benefit most from both the highest increased citations to its OA outputs (i.e., highest increased usage by all subregions), and for the highest increased citation of Northern European outputs to Sub-Saharan Africa.
This pattern is also observed for the larger analysis comparing all subregions and regions. Analysing the subregions where the affiliations of citing outputs are located, we see an increase in citations to OA outputs from traditionally under-represented institutions based in subregions with fewer research resources (e.g., as measured in World Bank Statistics on research expenditure) (The World Bank, 2022). This is consistent with greater access to OA being linked to greater use of OA outputs from these subregions, at least as measured by citations (see “Robustness of Results”). However, the citation diversity advantage also accrues preferentially to traditionally prestigious centres of research.
Overall, we see that traditionally “prestigious” centres of excellence (in terms of wealth and scale, e.g., Northern Europe, North America) benefit most from both increases in citations to their OA outputs (i.e., usage of their outputs by other subregions), and increases in citations from their outputs to OA outputs of other subregions (i.e., their usage of outputs affiliated to other subregions). There are also signals that the level of OA citation diversity advantage is lower overall for outputs with affiliations from traditionally underrepresented subregions or regions (e.g., Sub-Saharan Africa, Northern Africa, Latin America), but show an increase over time from low or negative levels. This may be evidence of increasing visibility over the period of study, which could be linked to OA shifting discovery pathways. However, more work is required to investigate these effects in detail. See “Robustness of Results” and Supplementary Material for the full set of results.

Robustness of results

To ensure the robustness of our results we include the analyses of our results compared across multiple ways of grouping the data – over time, different diversity measures, citation counts, OA categories, different affiliation groupings by geographic assignments, summary measures, etc. All results are provided in the Supplementary material, with the main findings summarised below.

A consistent effect across time, measures, and categories

As mentioned earlier, we reproduce the previously described citation count advantage across the whole dataset. We see an association of OA (all categories) with higher citation counts for all years in the analysis. We also note the overall decreasing trend of citation
counts due to more recent outputs having fewer citations. These results are presented in Supplementary Figures A.
We then turn to the analysis of the output-to-citing actor links. We start by examining counts of unique citing actors characterised by institutions, countries, subregions, regions, and fields of research. In other words, for each cited output, we count the number of unique citing institutions, countries, subregions, regions, and fields of research, respectively, combining all its citing outputs. The mean and median number of unique citing actors for each OA category are considered and show consistent advantage of OPEN outputs over CLOSED outputs, i.e., OA outputs attract more unique citing actors, for all years included (Supplementary Figures B). Exceptions or less clear patterns for the median count in terms of subregions, regions and fields of study are due to the broader grouping of citing actors and large number of outputs with low citation counts.
To confirm this finding across the distributions of outputs, we also include the distributional summaries (in the form of boxplots) of samples (i.e., 10,000 outputs from each OA category) drawn independently for each OA category and each publication year (Supplementary Figures C ). In these boxplots it is observed that OA outputs are characterised by heavier upper tails (and often with the box shifted upward) when compared to the CLOSED category across all publication years and all types of citing actors. Again, we note caveats around small numbers of groups and large numbers of outputs for certain cases in the study dataset. GREEN outputs stand out as the best performing category in terms of the number of unique citing actors (institutions, countries, subregions, regions).
We then introduce citation diversity measures as per the main part of our overall analysis. For both the Shannon and Gini-Simpson measures we see higher mean and median diversity scores for the OPEN outputs (vs. CLOSED outputs) for every year of publication, with respect to citing institutions, countries, subregions and regions. With respect to citing fields of research there is a slight disadvantage for GOLD outputs in 2010-2011 which turns into an advantage by 2012 (Supplementary Figures D). We also examine the distributions of diversity scores for the samples drawn from each category for each year using boxplots (Supplementary Figures E). In addition to increased central tendency for the OA categories, there are also signs in these boxplots of longer upper tails and shorter lower tails-added indications of the OA citation diversity advantage.
To confirm our findings are not confined to specific percentiles of the data, we also study the kernel density estimates (KDEs-see Table 1) and histograms of the diversity scores, for all combinations of diversity measures, citing actors, and years of publication. The KDEs and histograms are compared between OPEN and CLOSED outputs (for 10,000 outputs drawn from each). The results reveal a highly consistent finding of the OA citation diversity advantage. For all data analysed in these figures, OA outputs result in a distributional shift towards higher diversity scores, lower proportions of outputs with low diversity scores, and increased proportions of outputs that score highly for diversity (Supplementary Figures F).
The OA citation diversity advantage holds for both access via the publishers (i.e., GOLD outputs) as well as for access via other repository platforms (i.e., GREEN outputs) with the latter showing a larger effect. One possible confounding effect is the dominance of Pubmed Central and Europe Pubmed Central as important repositories and the higher average citation counts of biomedical research articles. To address this we examine the citation diversity effect by fields of research of the cited articles and note that the OA citation diversity advantage is highly consistent across all “MAG Level 0 ” fields for GREEN outputs (Supplementary Figures G). There is substantial variation for GOLD outputs and overall OA performances. We also note large differences in the OA effect between selected
fields of research. But for the majority of fields where our dataset has good coverage, the OA citation diversity advantage is clearly seen, including for disciplines distinct from biomedical sciences showing that the effect is robust across natural, biological and clinical sciences, and in several areas of social sciences.

Relationships between citation diversity and citation count

A criticism of claims for an OA citation advantage is that researchers focus on ensuring that their best work is the most accessible and/or that the advantage is primarily a function of the prestige of the authors and their institutions. One of our goals with the diversity analysis was to use indicators that are less dependent on citation counts as a means of reducing this potentially confounding effect.
With the exception of extreme cases where the citing articles have very many authors, articles with very low citation counts will be limited in the values that the diversity measures can take on. We therefore examined the diversity advantage as a function of citation counts to ensure that the effect was robust to this issue.
We undertake this analysis both at the level of the whole corpus and with a set of consistent sized samples to address the differences in the numbers of OPEN and CLOSED outputs over time. Again, the OA citation diversity advantage is robust across all citation count bins for all years of publication for diversity measures based on citations from different institutions, countries, subregions and regions (with some caveats on the last due to the small number of regions).
First, we revisit how unique numbers of citing actors are counted. To confirm that our earlier observations are robust for outputs that attract different levels of citations, we split outputs from the same year into 14 bins depending on their citation counts (roughly keeping bins similar in population size) and compared the distributions of counts of unique citing affiliations across OPEN and CLOSED outputs for samples drawn (i.e., 2000 OPEN vs 2000 CLOSED outputs) from each citation bin (Supplementary Figures H). Boxplots are presented for OPEN vs CLOSED outputs for each citation group for all years and all types of citing actors. We find that OPEN outputs perform no worse, and in fact better in most cases, than CLOSED outputs in attracting unique numbers of citing actors.
Similarly, we construct the comparison of diversity scores across citation bins for all years and both diversity measures (Supplementary Figures I). It is clear from these results that there is consistency in the OA citation diversity advantage across citation bins for almost all cases considered. The main exceptions are in the earlier years for the fields of research plots. However, these plots indicate a switch from negative to positive effects in more recent years, consistent with our earlier observations for mean and median diversity scores. To further explore the potential relationship between the diversity scores and citation counts, we also calculate the quartiles of diversity scores for the complete data for each year. These are presented as line charts (Supplementary Figures J). These results show a weak relationship between diversity scores and citation counts, but only for low citation count, which is not unexpected given the increasing likelihood of more citing affiliations links. The strength of this weak relationship further weakens for outputs with substantial citations.
In summary we find the OA citation diversity advantage to be not completely driven by the large number of low-citation outputs, nor is it simply an effect of highly cited outputs. Rather, the OA citation diversity advantage is a consistent effect that is seen across the cohort of outputs.

Citations between subregions and regions

Further to observing an OA citation diversity advantage, it is also important to understand where the increased citation diversity originates. In particular, we need to be able to track how a subregion or region benefits from making its outputs OA (e.g., more citations from others) and also how they benefit from OA outputs of other subregions or regions (e.g., more access to outputs of others). To aid such an analysis, we filter the data down to individual subregions and regions. Then, for a given subregion or region, we determine the numbers of citations to its OPEN and CLOSED outputs from each of the other subregions or regions, respectively. Average citation ratios (i.e., the average number of citations to OA outputs, divided by the average number of citations to non-OA outputs, and times by one hundred) and percentage change in total citations (i.e., total citations to OA outputs minus total citations to non-OA outputs, then divided by total citations to non-OA outputs, and multiplied by one hundred) are calculated for each citing subregion or region. A value above one hundred in the former indicates an OA advantage and a value above 0 for the latter indicates an OA advantage. The results are presented in Supplementary Figures K to N.
For most subregions and regions, we observe an OA advantage for citations coming from other subregions and regions. In particular, there are increased citations to OPEN outputs affiliated to institutions from subregions that are traditionally underrepresented in the literature or have fewer resources, e.g., North Africa, Sub-Saharan Africa, and Latin America and the Caribbean. This is consistent with the increased output usage through greater access from these subregions and regions. However, we also note that the OA citation diversity advantage accrues preferentially to traditionally “prestigious” centres of research in terms of wealth and scale of research outputs. For example, Northern Europe seems to benefit most from both increased citations from other subregions (i.e., high OA advantage is seen for almost all citing subregions to Northern Europe), and for its increased usage of outputs from other subregions (i.e., it is the subregion that is consistently one of the top citing subregions in terms of OA advantage for outputs by other subregions). A similar pattern is observed for North America. There are also signs of changing trends in terms of percentage changes in total citations, where the OA advantage has either increased or shifted from negative to positive in more recent years, for selected subregions or regions.

Discussion

This article proposes new ways of understanding and evaluating citations in relation to the wider dissemination of research-citation diversity via institutions, countries, subregions, regions, and fields of research. The main purpose of these measures and the corresponding data analyses is to understand the impact of OA on the diversity of users of research outputs. We are also interested in how the level of this impact compares across different geographic regions.
Most previous literature has focused on the OA citation “count” advantage – i.e., OPEN outputs have higher citation counts than CLOSED outputs. As mentioned in the Introduction, there are many debates as to whether there is a real OA citation advantage. Some confounding factors (Tennant et al., 2016) include author self-selection (i.e., authors choose to make their best articles OA), discipline biases (i.e., potentially significant differences across disciplines), and access to resources and prestige (i.e., well-known authors with
more resources are more likely to make their work OA ). These imply that the focus on citation counting is not able to paint the full picture of the benefits of OA. An OPEN output may receive more citations, but these citations may continue to come from the same groups of researchers. Conversely, an OPEN output may not have received more citations, but the citations may come from a broader set of research users. Hence, we argue that a shift to understanding the diversity of citations provides a stronger and more meaningful evidence of the benefits of OA in reaching wider audiences.
As the main result, we find that OA is associated with higher citation diversity, i.e., OPEN outputs receive more diverse citations as compared to CLOSED outputs. We refer to this phenomenon as OA citation diversity advantage. We find this advantage to be remarkably consistent across the many ways in which we have analysed the data (bar the very few extreme cases), which addresses concerns of confounding factors mentioned above. GREEN is the best performing OA category in terms of providing the highest citation diversity scores overall. Though we do recognise it is difficult to completely split out the effects of GOLD and GREEN outputs.
We also find that there are differences across subregions and regions in terms of how much they benefit from OA citation diversity advantage. In particular, historically wealthier and larger centres of research seem to benefit more from this effect-having more of others citing their OA work and also citing more of others’ OA work. Whether this is a true pattern of “the rich get richer” and what that potentially means for advancing OA advocacy and policy making will be an important area for further research.
The current article extends and generalises from the works of Young and Brandes (2020) and Neylon et al. (2021) and opens the door to much further research. An obvious direction is to expand on the measures of citation diversity both in more complex measures (such as accounting for multiple author affiliation links) and introducing new characterisations of citation diversity (such as language diversity of citing outputs; see Linkov et al., 2021 and Diprose et al., 2023). Our fields of research data are drawn from MAG which is now discontinued. It would be interesting to examine how our results may change if a different subject classification system (e.g., Web of Science subject classification) or database (e.g., OpenAlex) is used. It would also be interesting to explore how citation diversity relates to the diversity in author collaboration (Naik et al., 2023). Improving data coverage of historically underrepresented geographies, disciplines and non-traditional outputs also continues to be a challenge.

Data limitations

We acknowledge the following limitations in the data used for our analysis:
  • Research outputs included in our analysis are those that are assigned DOIs by Crossref. We acknowledge that there are other DOI registration agencies that assign DOIs to research outputs (e.g., China National Knowledge Infrastructure-CNKI) and these are not currently indexed in our system. Consequently, there may be limitations in our coverage of certain areas of Asia, Sub-Saharan Africa and other regions. There are also general issues with coverage of certain fields of research where DOIs are not traditionally used in scale (such as in Art, Political Sciences, etc.). In addition, there may be issues of moving windows in terms of assignments of outputs to fields of research, as results of both cultural and methodological changes over time (e.g., Engineering outputs being assigned to Material Science and Computer Science in more recent years).
  • The data on fields of research used in our analysis are directly extracted from MAG. MAG used machine learning approaches to classify research outputs into “concepts” and build a hierarchy of these concepts (Wang et al., 2020). We only use the concepts specified in level 0 (most broad or highest parent concepts) of the hierarchy. It is possible that our results based on fields of research may differ if a different set of data on fields of research or subject disciplines is used. We should also note that MAG is now discontinued, and an alternative source will be used in future work (e.g., OpenAlex).
  • Our definition of citation diversity is based on the distribution of “output-to-citation actor links” across citation actor groups. This does imply that if a citing output has multiple authors belonging to multiple affiliations, then it will possibly infer multiple output-to-citing actor links. In other words, this citing output may belong to multiple regions (for example). This may have an impact on low-citation outputs with at least one citing output with extraordinarily large number of authors from multiple affiliations. However, our quality checks revealed very low number of such cases (i.e., outliers) and they have no obvious impact on the overall findings. There may be other ways to define or measure citation diversity that incorporate such cases.

Conclusion

The Budapest OA Initiative (Chan et al., 2002), now over 20 years old, notes that OA makes possible
“…the world-wide electronic distribution of the peer-reviewed journal literature and completely free and unrestricted access to it by all scientists, scholars, teachers, students, and other curious minds.”
providing a public good which will
“…accelerate research, enrich education, share the learning of the rich with the poor and the poor with the rich, make this literature as useful as it can be, and lay the foundation for uniting humanity in a common intellectual conversation and quest for knowledge”.
Efforts to demonstrate the success of this endeavour remain as controversial as the choice of paths towards achieving OA . The use of citations to capture the use and value of research will always be limited, but data on other forms of usage for scholarly publishing remain challenging and incomplete. By shifting attention from counting citations to assessing the diversity of citing outputs we have demonstrated that existing data can be repurposed to analyse different goals. In doing so we have demonstrated that even for the narrow form of usage that citation from research outputs represents, OA outputs are being used by a wider diversity of citing outputs, whether we analyse those citing outputs by institution, country, subregion, region, or fields of research.
More broadly, citation diversity measures offer a new view over existing data, providing potential insights that are not offered by simple citation counts. As a potential insight into where the benefits of OA are being seen and a guide to improving our policy implementation of OA for wider access this approach offers many opportunities in addressing (Chan et al., 2002)
“…the task of removing the barriers to open access and building a future in which research and education in every part of the world are that much more free to flourish”.
Supplementary Information The online version contains supplementary material available at https://doi. org/10.1007/s11192-023-04894-0.
Acknowledgements This work was funded by the Research Office of Curtin through a strategic grant, the Curtin University Faculty of Humanities, and the School of Media, Creative Arts and Social Inquiry. The authors are affiliated to the Curtin Open Knowledge Initiative which is also a recipient of a grant from Arcadia a Charitable Fund of Lisbet Rausing & Peter Baldwin.
Author contributions CKH, CN, and LM were involved with the conceptualization and project administration. CKH, CN, and RH were responsible for data curation. CK and CN were responsible for formal analysis, investigation, methodology, validation, visualisation and writing the original draft of the article. CN and LM were responsible for funding acquisition and supervision. CKH and CN were responsible for the software that produced the processed data, analysis, figures, and the final text documents. RH and JPD were responsible for the software that collected and created data tables used as input for the project. CKH, CN, LM, RH, JPD, RNH and KW contributed to the final review, editing and approval of the manuscript.
Funding Open Access funding enabled and organized by CAUL and its Member Institutions. This work was funded by Curtin University Research Office, Curtin University Faculty of Humanities, Curtin University School of Media, Creative Arts and Social Inquiry, Arcadia a Charitable Fund of Lisbet Rausing & Peter Baldwin.
Data availability The processed data (as CSV files) used for the analysis and for generating figures are shared on Zenodo (https://doi.org/https://doi.org/10.5281/zenodo.7081118) and GitHub (https://github.com/ Curtin-Open-Knowledge-Initiative/citation-diversity).
Code availability The SQL queries used to generate all data, together with codes used to produce figures, to perform the analysis, and to generate the final text documents are shared via Zenodo (https://doi.org/https:// doi.org/10.5281/zenodo.7081118) and GitHub (https://github.com/Curtin-Open-Knowledge-Initiative/citat ion-diversity).

Declarations

Conflict of interest The authors declare that they have no competing interests.
Open Access This article is licensed under a Creative Commons Attribution 4.0 International License, which permits use, sharing, adaptation, distribution and reproduction in any medium or format, as long as you give appropriate credit to the original author(s) and the source, provide a link to the Creative Commons licence, and indicate if changes were made. The images or other third party material in this article are included in the article’s Creative Commons licence, unless indicated otherwise in a credit line to the material. If material is not included in the article’s Creative Commons licence and your intended use is not permitted by statutory regulation or exceeds the permitted use, you will need to obtain permission directly from the copyright holder. To view a copy of this licence, visit http://creativecommons.org/licenses/by/4.0/.

References

Archambault, E., Amyot, D., Deschamps, P., Nicol, A., Provencher, F., Rebout, L., & Roberge, G. (2014). Proportion of open access papers published in peer-reviewed journals at the European and world level-1996-2013. RTD-B6-PP-2011-2: Study to develop a set of indicators to measure open access. Report. Science-Metrix. Retrieved August 19, 2022, from https://science-metrix.com/sites/default/files/science-metrix/publications/d_1.8_sm_ec_dg-rtd_proportion_oa_1996-2013_v11p.pdf
Basson, I., Blanckenberg, J. P., & Prozesky, H. (2021). Do open access journal articles experience a citation advantage? Results and methodological reflections of an application of multiple measures to an analysis by WoS subject areas. Scientometrics, 126, 459-484. https://doi.org/10.1007/s11192-020-03734-9
Bautista-Puig, N., Lopez-Illescas, C., de Moya-Anegon, F., Guerrero-Bote, V., & Moed, H. F. (2020). Do journals flipping to gold open access show an OA citation or publication advantage? Scientometrics, 124, 2551-2575. https://doi.org/10.1007/s11192-020-03546-x
Chan, L., Cuplinskas, D., Eisen, M., Friend, F., Genova, Y., Guédon, J., Hagemann, M., Harnad, S., Johnson, R., Kupryte, R., La Manna, M., Rév, I., Segbert, M., de Souza, S., Suber P., Velterop, J. (2002). Read the declaration-Budapest Open Access Initiative. Retrieved September 6, 2022, from https://www.budap estopenaccessinitiative.org/read/
Dahler-Larsen, P. (2018). Making citations of publications in languages other than English visible: on the feasibility of a PLOTE-index. Research Evaluation, 27(3), 212-221. https://doi.org/10.1093/reseval/rvy010
Davis, P. M. (2011). Open access, readership, citations: A randomized controlled trial of scientific journal publishing. The FASEB Journal, 25(7), 2129-2134. https://doi.org/10.1096/fj.11-183988
Diprose, J., Neylon, C., & Kramer, B. (2022). Language Diversity in Scholarly Publishing. Curtin Open Knowledge Initiative News. Retrieved September 5, 2023, from https://openknowledge.community/languagediversity/
Dorta-González, P., González-Betancor, S. M., & Dorta-González, M. I. (2017). Reconsidering the gold open access citation advantage postulate in a multidisciplinary context: An analysis of the subject categories in the Web of Science database 2009-2014. Scientometrics, 112, 877-901. https://doi.org/10.1007/ s11192-017-2422-y
Hosking, R., Diprose, J. P., Roelofs, A., Chien, T.-Y., Handcock, R. N., Kramer, B., Napier, K., Montgomery, L., & Neylon, C. (2022). Academic observatory workflows [software]. Zenodo. https://doi.org/10.5281/ zenodo. 6366694
Hua, F., Sun, H., Walsh, T., Worthington, H., & Glenny, A. (2016). Open access to journal articles in dentistry: Prevalence and citation impact. Journal of Dentistry, 47, 41-48. https://doi.org/10.1016/j.jdent.2016.02. 005
Huang, C.-K., & Neylon, C. (2022). Curtin-open-knowledge-initiative/citation-diversity: Codes and data for open access research outputs receive more diverse citations [software]. Zenodo. https://doi.org/10.5281/ zenodo. 7081118
Hutchins, B. I., Yuan, X., Anderson, J. M., & Santangelo, G. M. (2016). Relative citation ratio (RCR): A new metric that uses citation rates to measure influence at the article level. PLoS Biology, 14(9), e1002541. https://doi.org/10.1371/journal.pbio. 1002541
Lewis, C. L. (2018). The open access citation advantage: Does it exist and what does it mean for libraries? Information Technology and Libraries, 37(3), 50-65. https://doi.org/10.6017/ital.v37i3.10604
Linkov, V., O’Doherty, K., Choi, E., & Han, G. (2021). Linguistic diversity index: a scientometric measure to enhance the relevance of small and minority group languages. SAGE Open, 11(2), 1-9. https://doi.org/10. 1177/21582440211009191
Naik, C., Sugimoto, C. R., Larivière, V., Leng, C., & Guo, W. (2023). Impact of geographic diversity on citation of collaborative research. Quantitative Science Studies, 4(2), 442-465. https://doi.org/10.1162/qss_a_ 00248
Neylon, C., & Huang, C.-K. (2022). The global state of open access 2021. Zenodo. https://doi.org/10.5281/ zenodo. 7059176
Neylon, C., Ozaygen, A., Montgomery, L., Huang, C.-K., Pyne, R., Lucraft, M., & Emery, C. (2021). More readers in more places: the benefits of open access for scholarly books. Insights, 34(1), 27. https://doi.org/ 10.1629/uksg. 558
Piwowar, H., Priem, J., Larivière, V., Alperin, J. P., Matthias, L., Norlander, B., Farley, A., West, J., & Haustein, S. (2018). The state of OA: A large-scale analysis of the prevalence and impact of open access articles. PeerJ, 6, e4375. https://doi.org/10.7717/peerj. 4375
Seppänen, J.-T., Värri, H., & Ylönen, I. (2022). Co-citation percentile rank and JYUcite: A new network-standardized output-level citation influence metric and its implementation using dimensions API. Scientometrics, 127, 3523-3541. https://doi.org/10.1007/s11192-022-04393-8
Sotudeh, H. (2020). Does open access citation advantage depend on paper topics? Journal of Information Science, 46(5), 696-709. https://doi.org/10.1177/0165551519865489
Tennant, J. P., Waldner, F., Jacques, D. C., Masuzzo, P., Collister, L. B., & Hartgerink, C. H. (2016). The academic, economic and societal impacts of open access: An evidence-based review. F1000 Research, 5, 632. https://doi.org/10.12688/f1000research.8460.3
The World Bank. (2022). Research and development expenditure (% of GDP). World Bank Group. Retrieved September 6, 2022, from https://data.worldbank.org/indicator/GB.XPD.RSDV.GD.ZS
Wang, K., Shen, Z., Huang, C., Wu, C., Dong, Y., & Kanakia, A. (2020). Microsoft academic graph: When experts are not enough. Quantitative Science Studies, 1(1), 396-413. https://doi.org/10.1162/qss_a_00021
Young, J. S., & Brandes, P. M. (2020). Green and gold open access citation and interdisciplinary advantage: A bibliometric study of two science journals. The Journal of Academic Librarianship, 46(2), 102105. https:// doi.org/10.1016/j.acalib.2019.102105
Zhang, L., & Watson, E. M. (2017). Measuring the impact of gold and green open access. The Journal of Academic Librarianship, 43(4), 337-345. https://doi.org/10.1016/j.acalib.2017.06.004
Publisher’s Note Springer Nature remains neutral with regard to jurisdictional claims in published maps and institutional affiliations.

  1. Chun-Kai Huang
    karl.huang@curtin.edu.au
    1 Centre for Culture and Technology, Curtin University, Bentley, WA, Australia
    2 Curtin Institute for Data Science, Curtin University, Bentley, WA, Australia
    3 Faculty of Education, Te Herenga Waka – Victoria University of Wellington, Wellington, New Zealand