DOI: https://doi.org/10.1016/j.cell.2024.01.012
PMID: https://pubmed.ncbi.nlm.nih.gov/38309258
تاريخ النشر: 2024-02-01
خلية
تحتفظ الخلايا الدبقية الصغيرة بالسلامة الهيكلية خلال تشكيل دماغ الجنين
ملخص رسومي
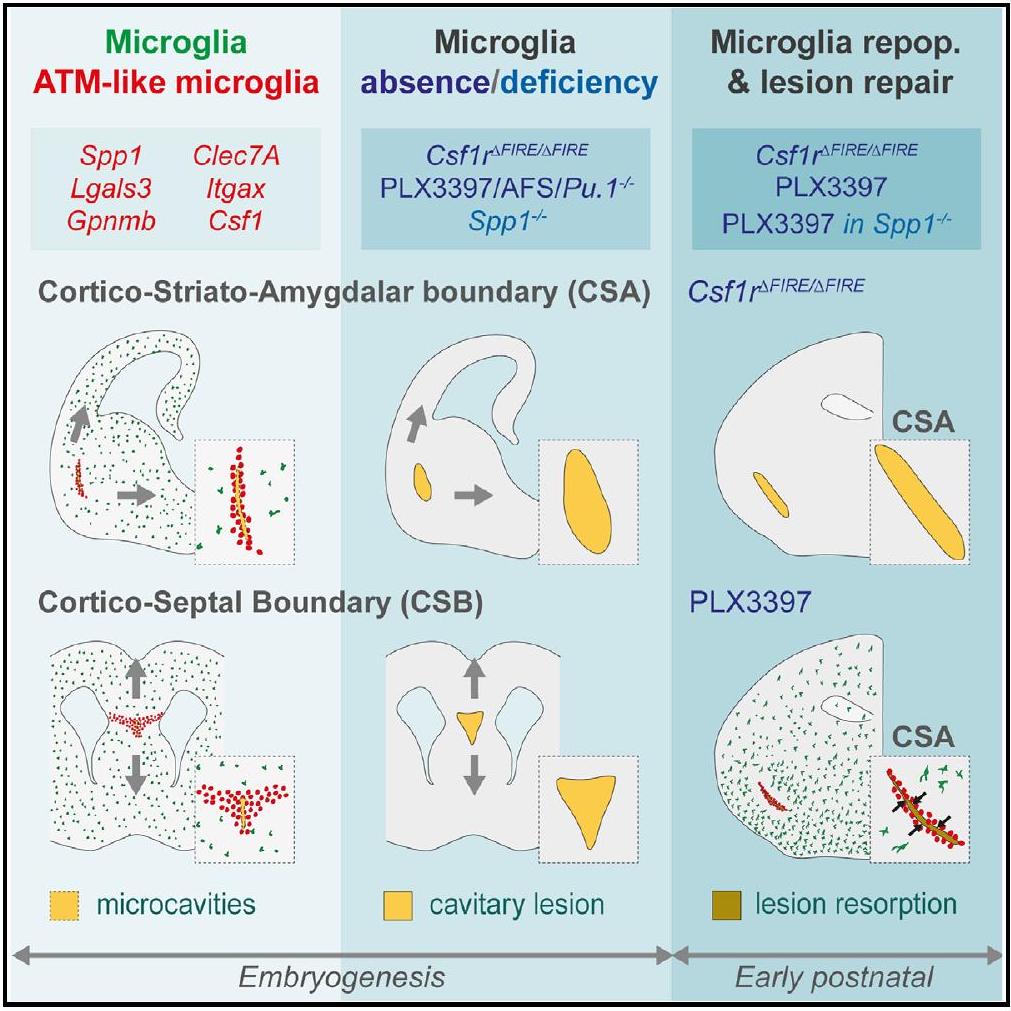
أهم النقاط
- تتراكم خلايا الميكروغليا الشبيهة بـ ATM الجنينية عند الحدود القشرية الرئيسية
- الميكروغليا تمنع تكوين الآفات التجويفية بسبب الضغط المورفوجيني
- عامل Spp1 الأساسي في ATM يساهم في الأدوار الحامية للأعصاب للميكروغليا
- تساهم الخلايا الدبقية الصغيرة وSpp1 في الإصلاح السريع للآفات التجويفية
المؤلفون
المراسلات
باختصار
تحتفظ الخلايا الدبقية الصغيرة بالسلامة الهيكلية خلال تشكل دماغ الجنين
الملخص
الملخص تلعب الخلايا الدبقية الصغيرة (MG)، وهي البلعميات المقيمة في الدماغ، أدوارًا رئيسية في الصحة والمرض من خلال تنوع حالات الخلايا. بينما تظهر الخلايا الدبقية الصغيرة الجنينية تنوعًا كبيرًا في توزيع الخلايا وحالات النسخ الجيني، تظل وظائفها غير موصوفة بشكل جيد. هنا، اكتشفنا دورًا للخلايا الدبقية الصغيرة في الحفاظ على السلامة الهيكلية عند حدين قشريين جنينيين. عند هذه الحدود بين الهياكل التي تنمو في اتجاهات متميزة، تتجمع الخلايا الدبقية الصغيرة الجنينية، وتظهر حالة تشبه الخلايا الدبقية المرتبطة بالألياف العصبية بعد الولادة (ATM) وتمنع تقدم الميكروكافيتات إلى آفات تجويفية كبيرة، جزئيًا من خلال آلية تتضمن عامل ATM Spp1. تساهم الخلايا الدبقية الصغيرة وSpp1 أيضًا في الإصلاح السريع للآفات، مما يبرز بشكل جماعي الوظائف الوقائية التي تحافظ على الدماغ الجنيني من الضغط المورفوجيني الفسيولوجي والإصابة. وبالتالي، تبرز دراستنا الأدوار الرئيسية للخلايا الدبقية الصغيرة الجنينية وSpp1 في الحفاظ على السلامة الهيكلية خلال المورفوجينيسيس، مع تداعيات كبيرة لفهمنا لوظائف الخلايا الدبقية الصغيرة وتطور الدماغ.
مقدمة
النتائج
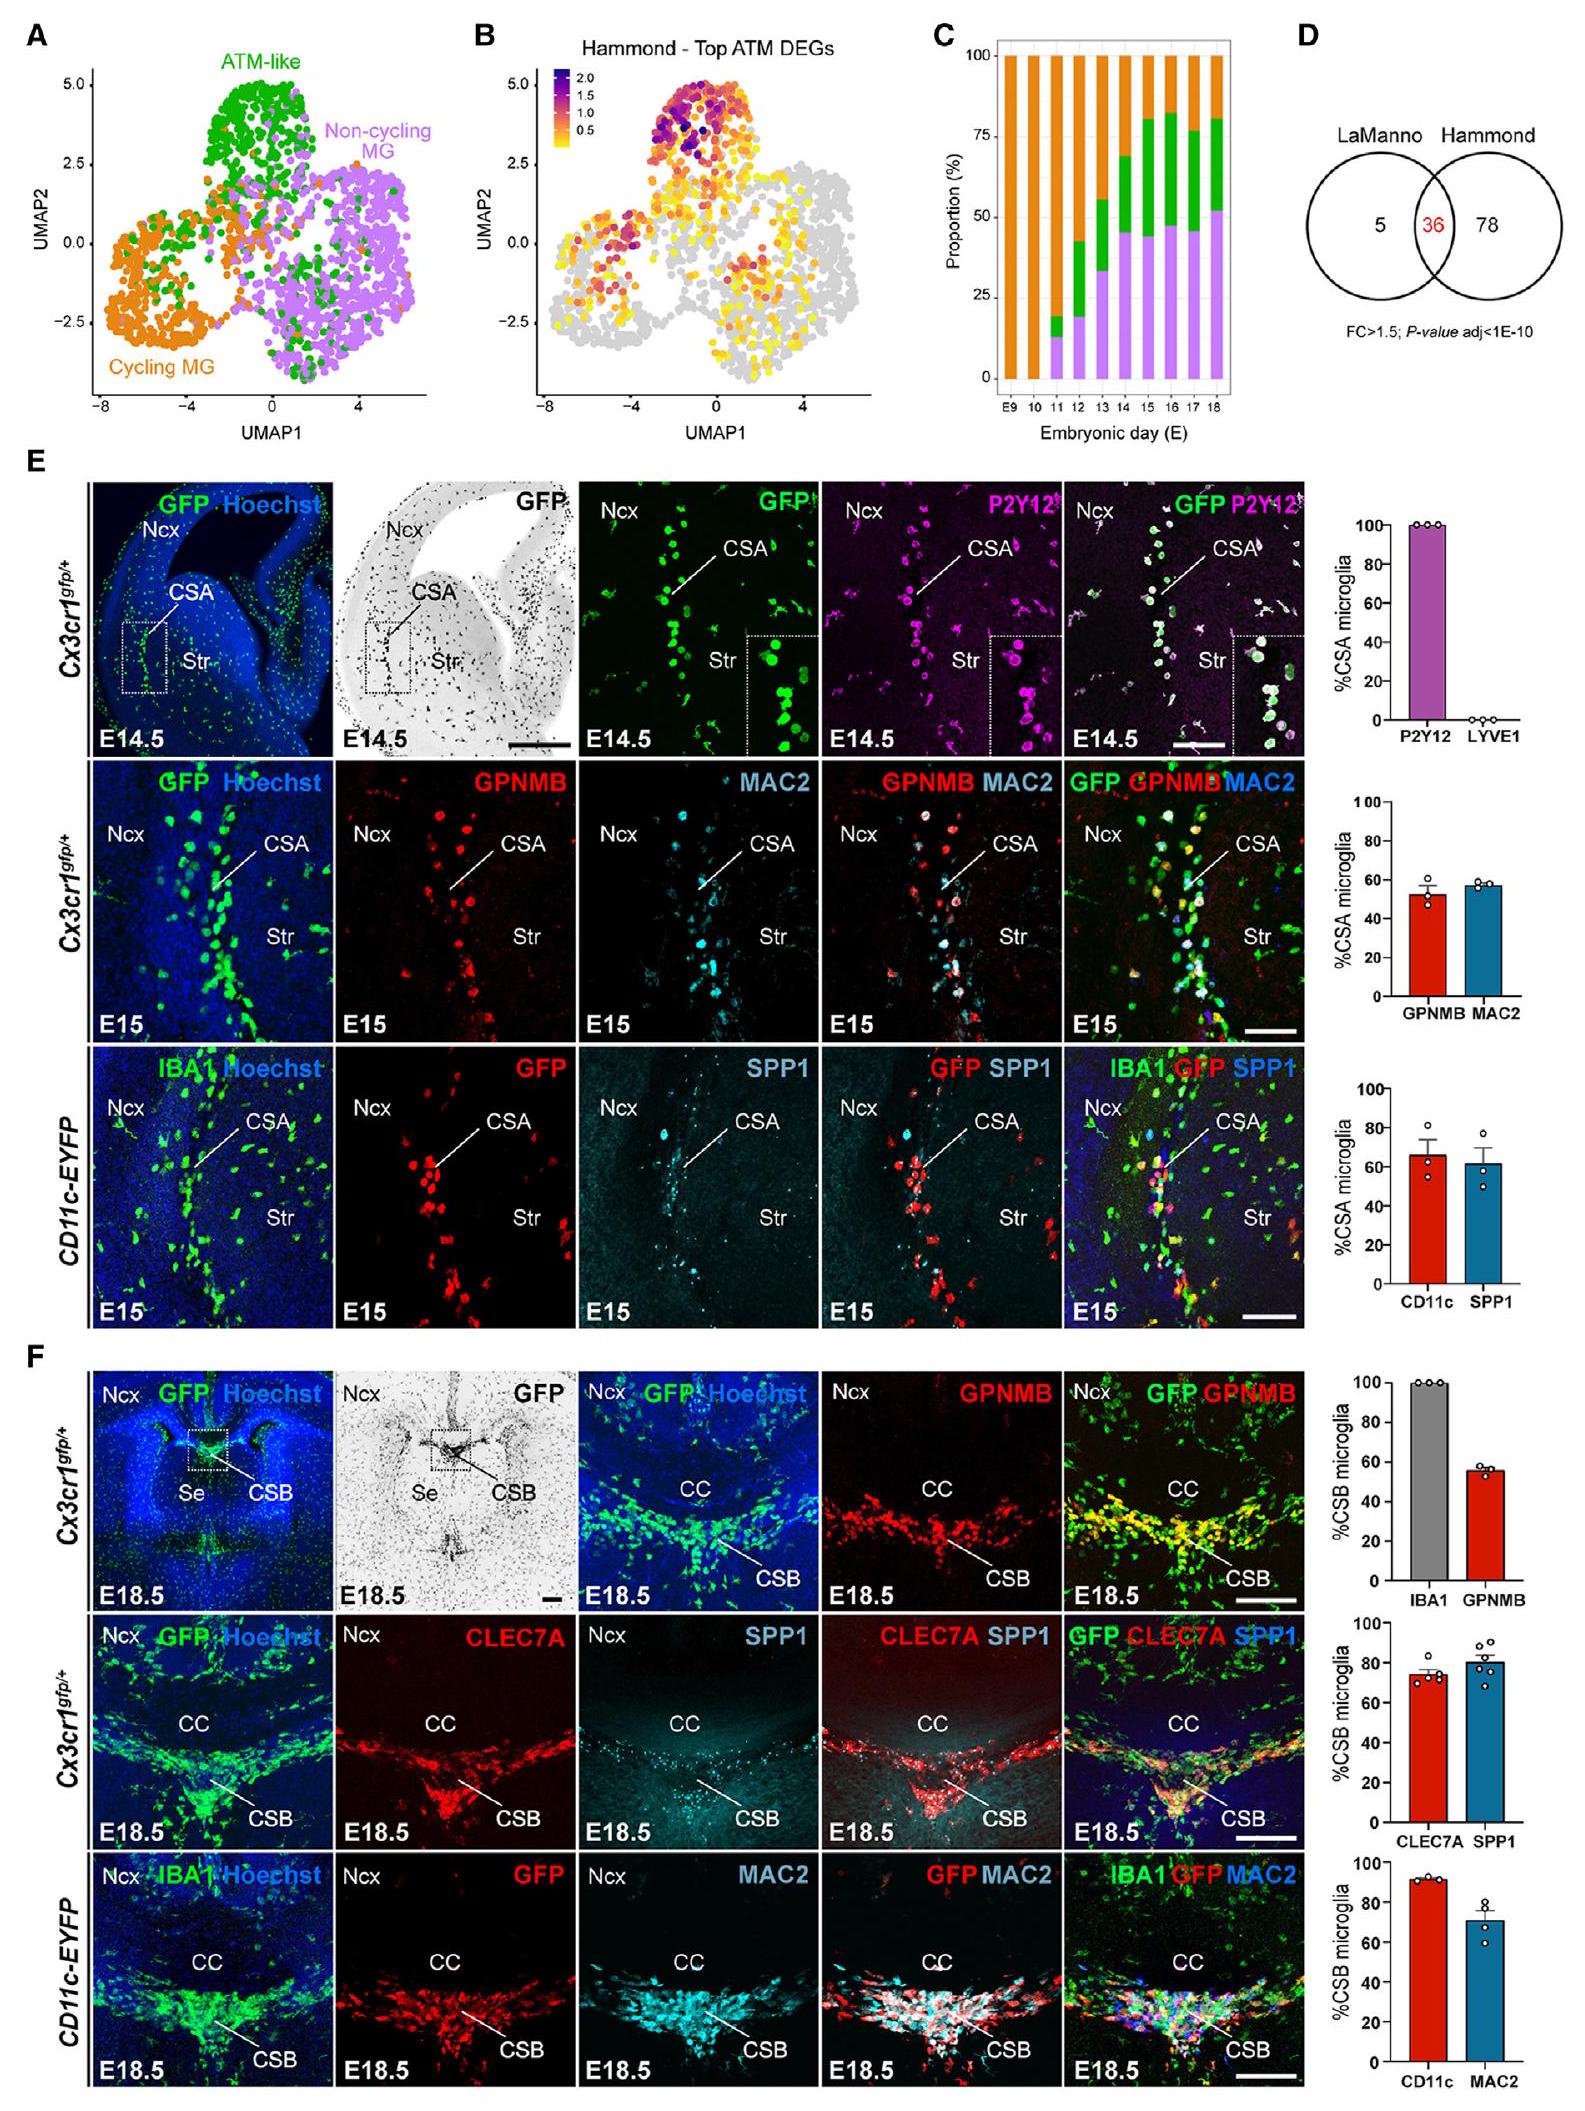
تتجمع MG الشبيهة بالصرافات الآلية عند حدين قشريين جنينيين
تحافظ MG على السلامة الهيكلية عند الحدود القشرية الكثيفة لأجهزة الصراف الآلي
تطوير المايلين، وكلاهما مرتبط بوظائف ATM بعد الولادة. للتحقيق في الدور المحتمل لـ MG في تطوير CSA و CSB، قمنا بفحص نماذج مختلفة من استنفاد البلعميات و MG، من خلال استهداف مسار إشارة مستقبل عامل تحفيز المستعمرات 1 (CSF1R) بشكل رئيسي، والذي يتطلب لبقاء الخلايا الدبقية الصغيرة.
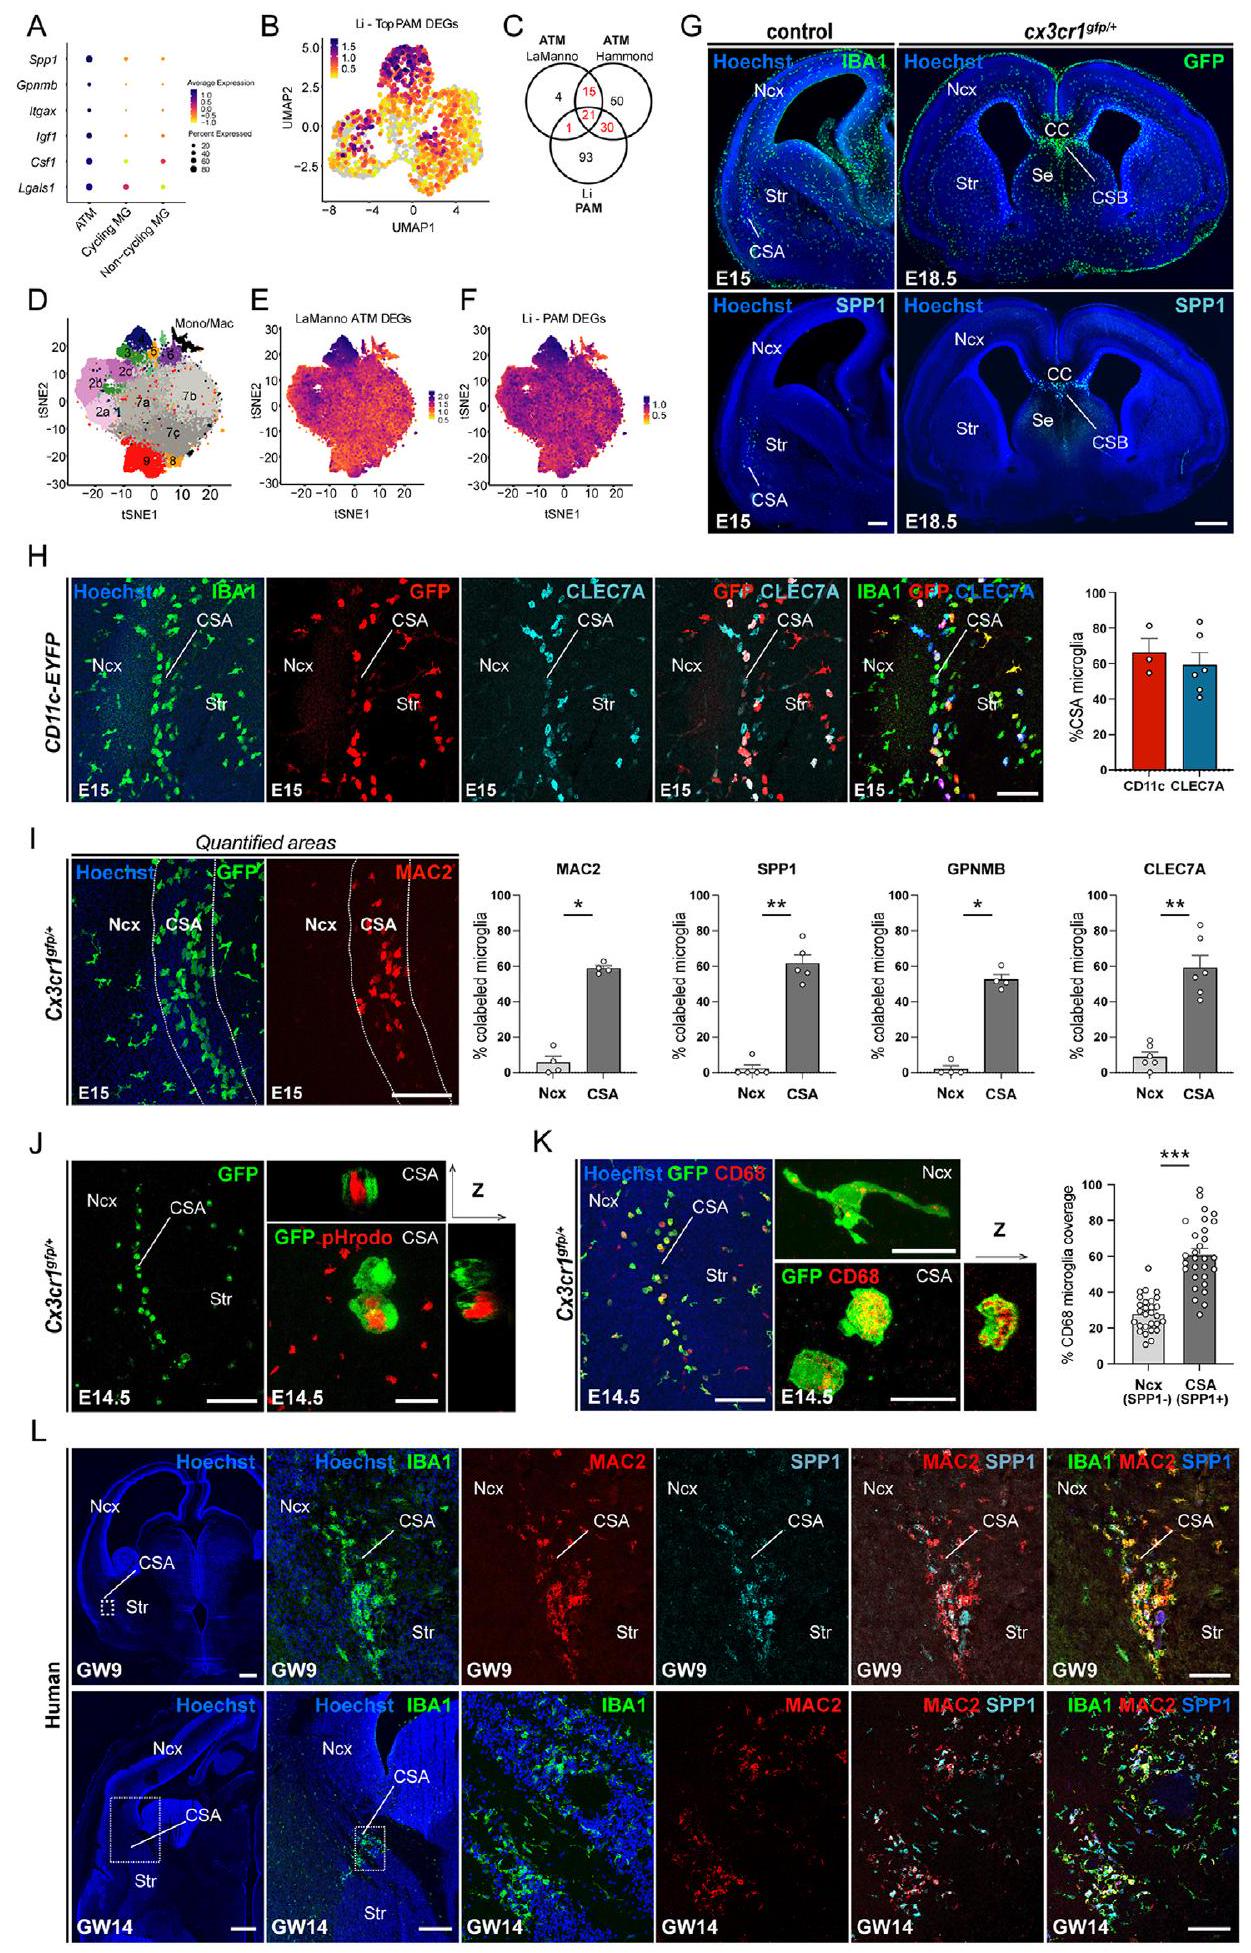
(أ) رسم تخطيطي لتقريب وإسقاط الفضاء الموحد للتعبير الجيني على مستوى الخلية الواحدة (UMAP) لخلايا الميكروغليا الجنينية
(ب) إسقاط توقيع ATM بعد الولادة (الجينات المعبر عنها بشكل مختلف الأكثر غنىً [DEGs]) من مجموعة بيانات هاموند
(ج) نسبة الدراجات (برتقالي)، غير الدراجات (بنفسجي)، و ATM-like MG الجنيني (أخضر) في مراحل جنينية مختلفة.
(د) مخطط فين يوضح التداخل بين جينات التعبير المميزة لـ ATM في المرحلة الجنينية وما بعد الولادة، كما تم تحديدها من قبل لا مانّو
(E) وسم المناعة لمقاطع الدماغ من E14.5 أو E15 Cx3cr1
(F) وسم المناعة لشرائح الدماغ التاجية من E18.5 Cx3cr1
تظهر الرسوم البيانية المتوسطات
ATM، ميكروغليا المرتبطة بالألياف العصبية؛ ATM-like، ميكروغليا المرتبطة بالألياف العصبية على نحو مشابه؛ CC، الجسم الثفني؛ CSA، حدود القشرة المخية-المخططية-اللوزة؛ CSB، حدود القشرة-الحاجز؛ DEGs، الجينات المعبر عنها بشكل مختلف؛ MG، ميكروغليا؛ Ncx، القشرة الجديدة؛ Se، الحاجز؛ Str، المخطط.
انظر أيضًا الشكل S1 والجدول S1.
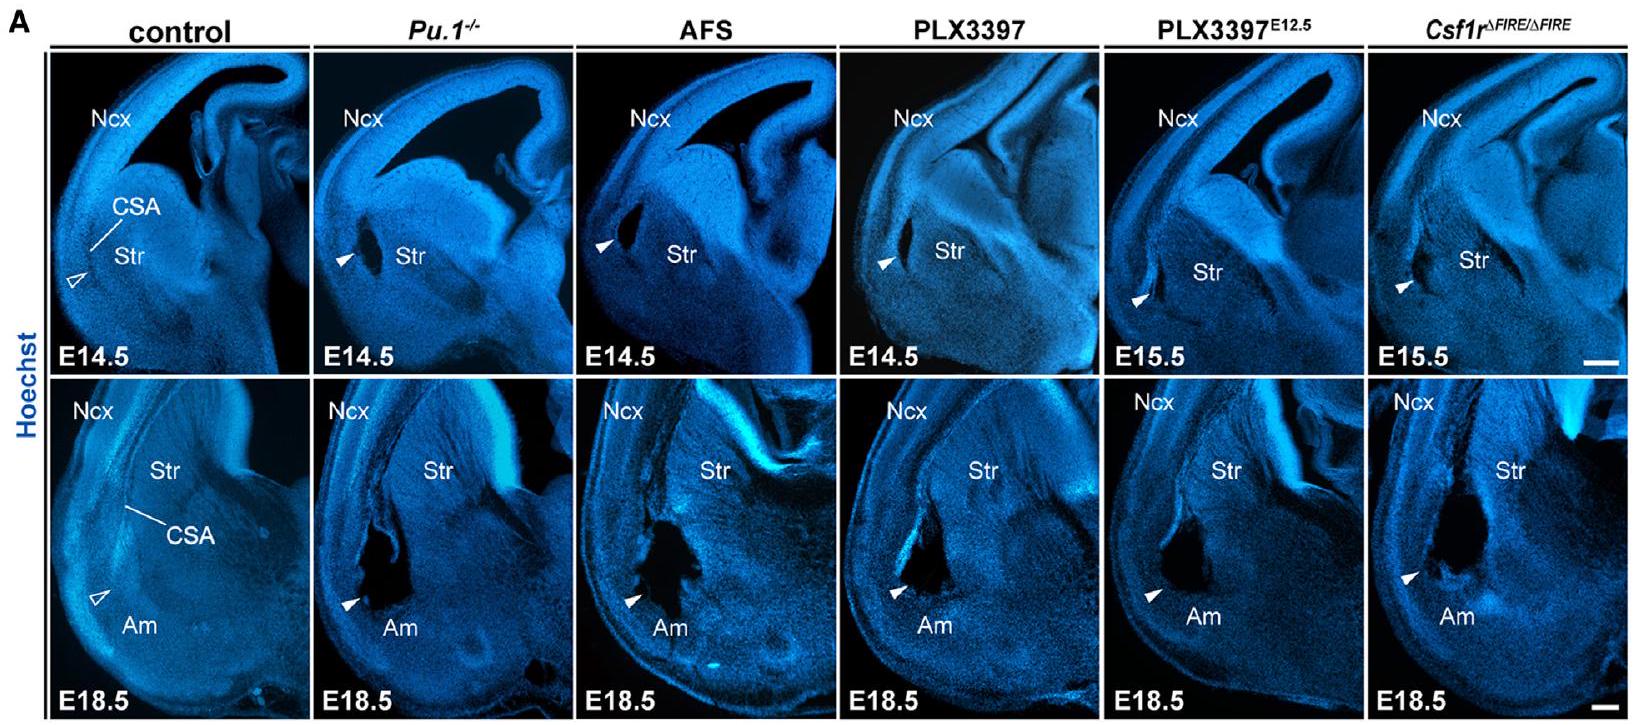
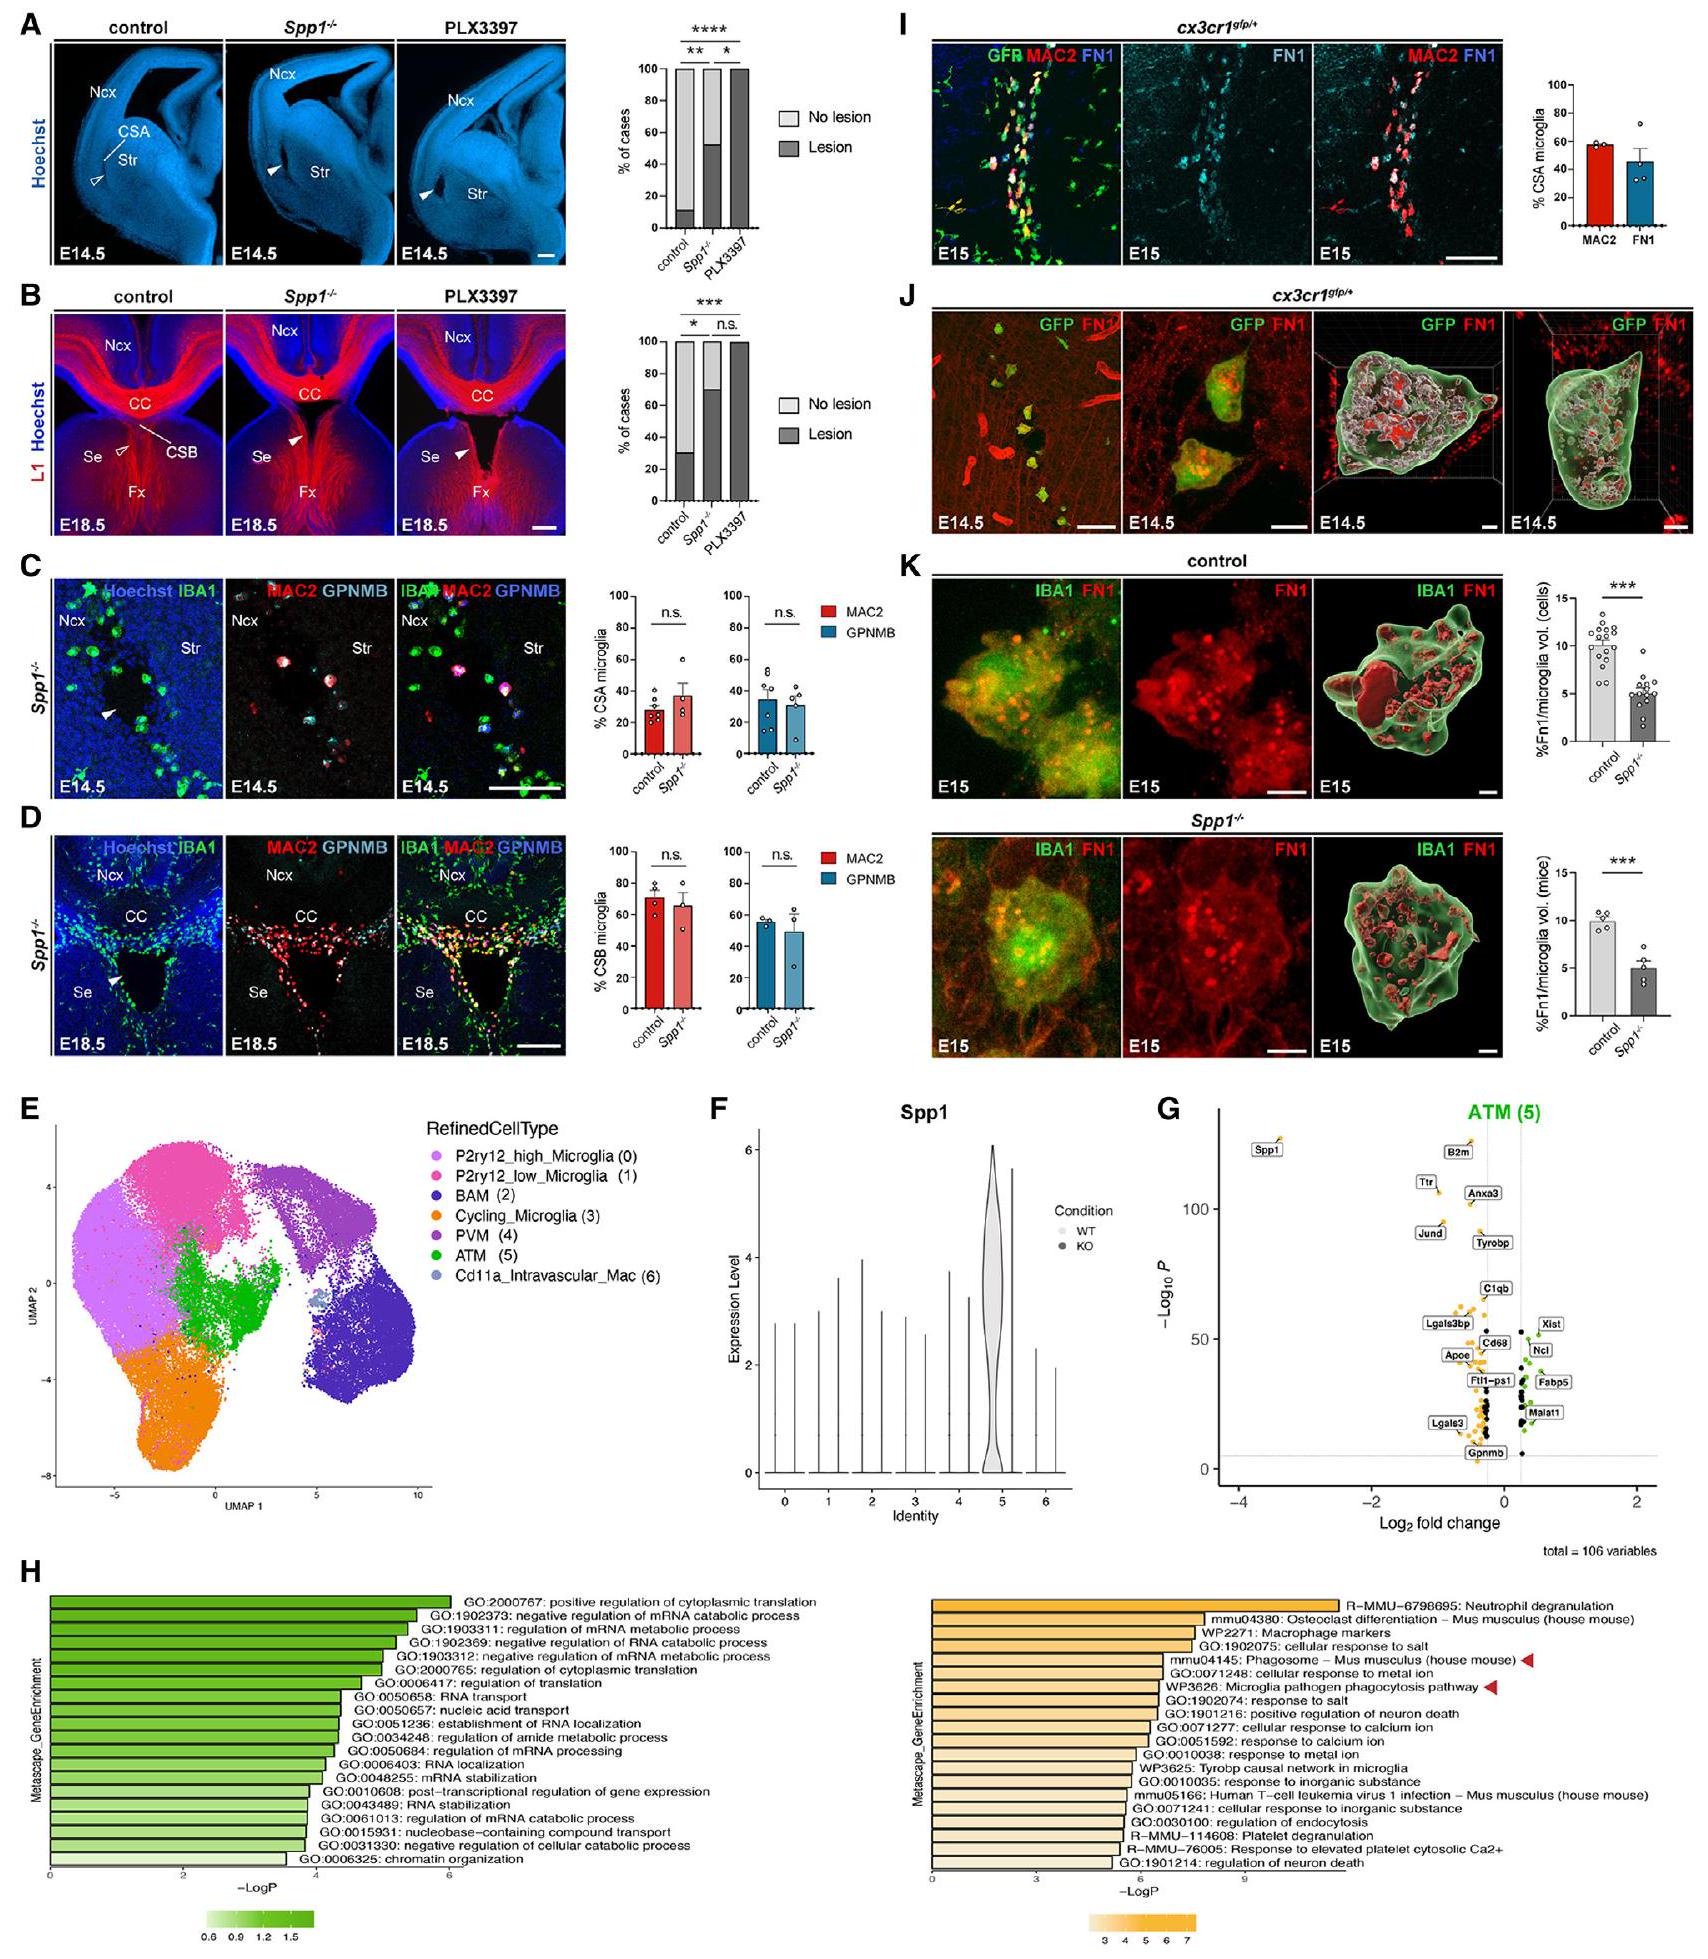
MG تحد من تشكيل الآفات التجويفية بسبب الضغط المورفوجيني
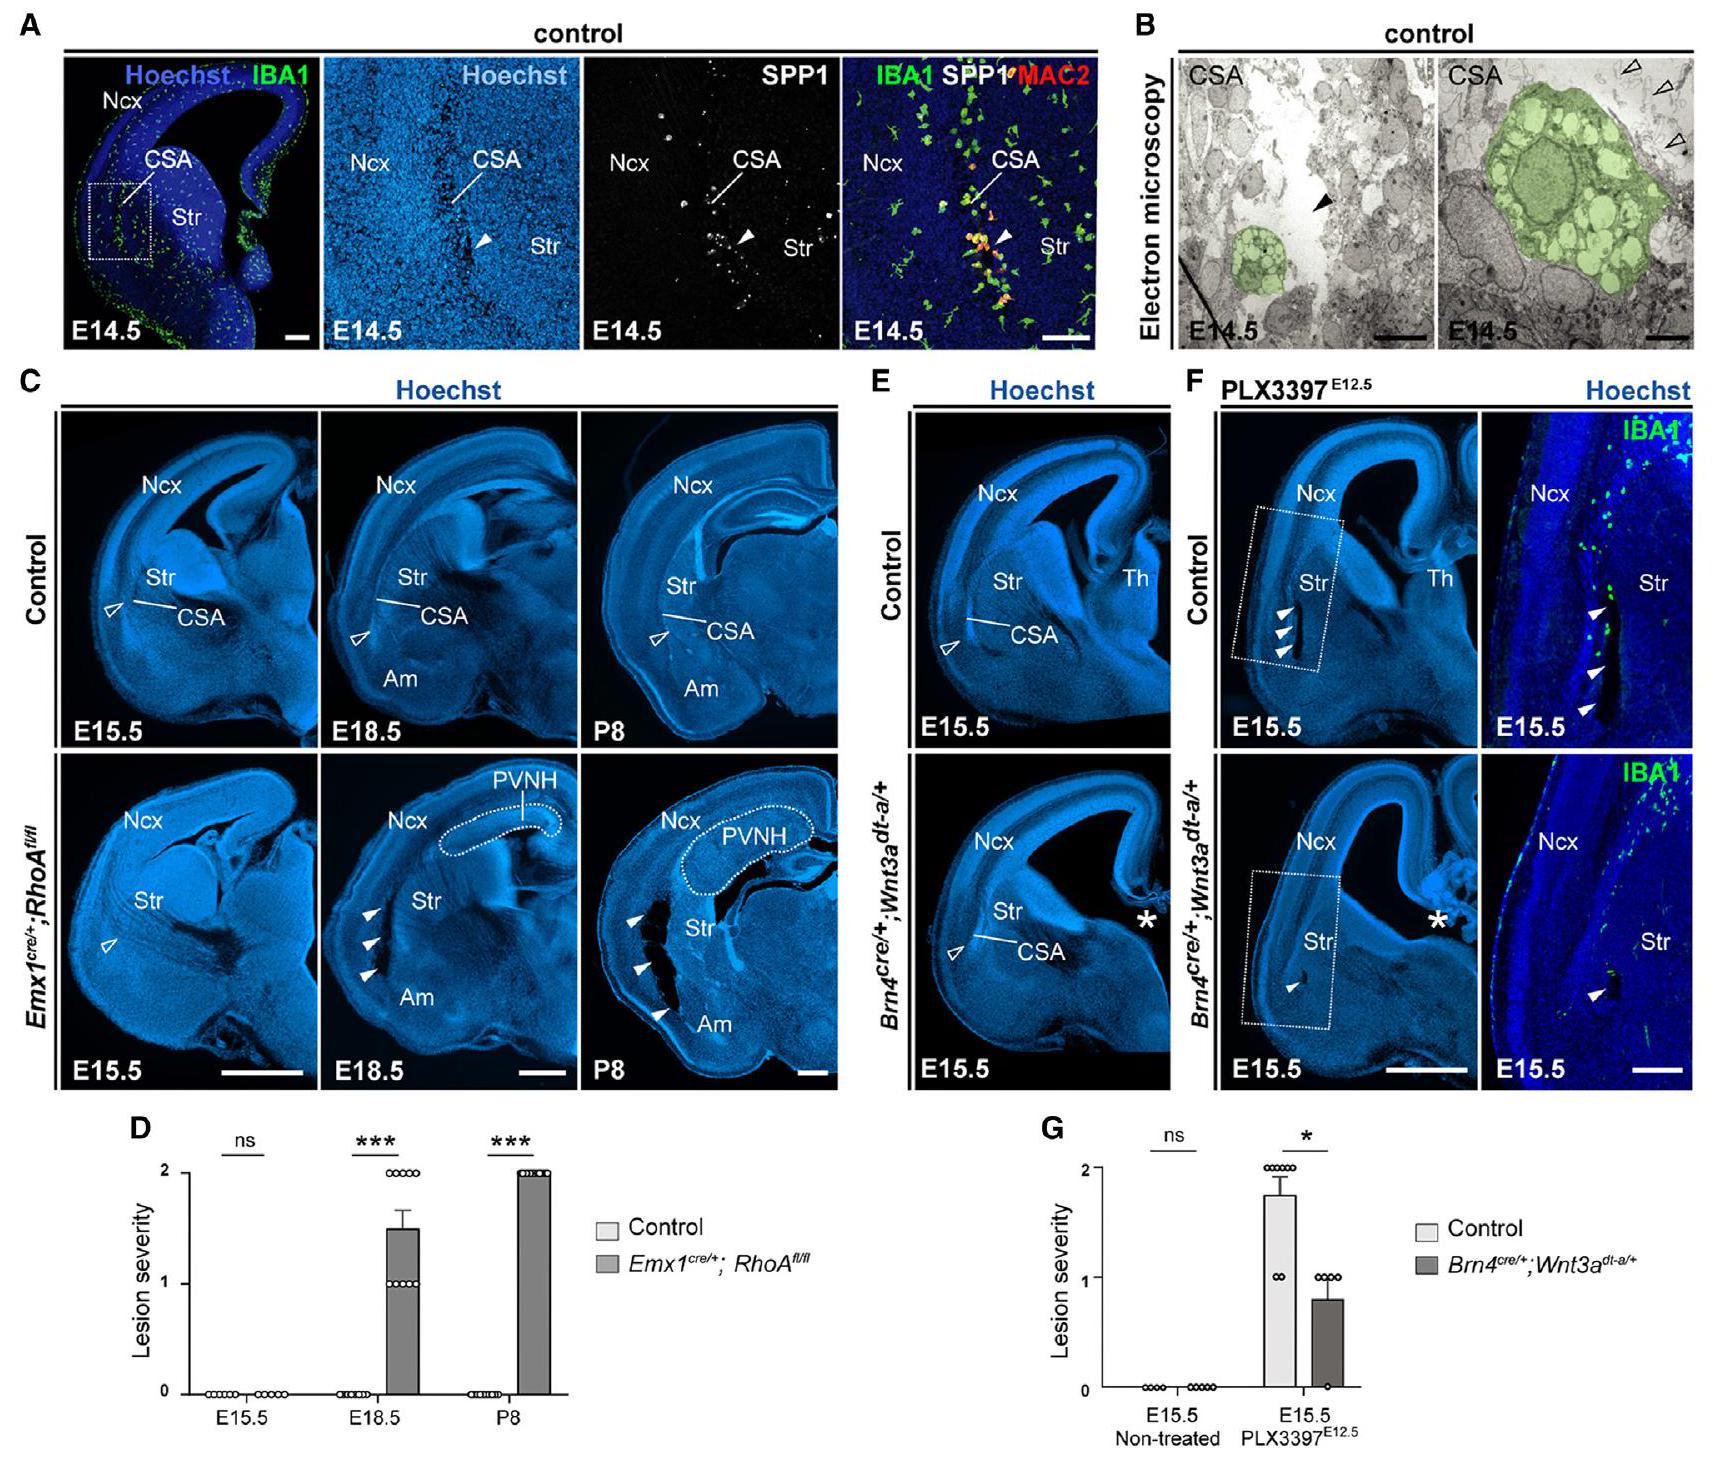
(أ) تشير نتائج تلوين الأجسام المضادة IBA1 وSpp1 وMac2 إلى أن التجاويف الدقيقة في خط ATM (رؤوس الأسهم الصلبة) مرئية بواسطة تلوين هوشت عند E14.5 (
(ب) تكشف المجهرية الإلكترونية المنقولة (EM) أيضًا عن وجود تجاويف دقيقة (رؤوس الأسهم الصلبة)، مغطاة بخلايا الدبقية الأميبية (اللون الأخضر الزائف)، وتحتوي على قطع غشاء (رؤوس الأسهم المفتوحة) (
(ج و د) مقاطع نصفية إكليلية (ج) من الفئران الضابطة و
(هـ) مقاطع نصفية إكليلية من أدمغة E15.5 من Brn4
(و و ز) مقاطع نصفية إكليلية (و) من أدمغة E15.5 من الفئران الضابطة و Brn4
تظهر الرسوم البيانية المتوسطات
Am، اللوزة؛ CSA، حدود القشرة-المخطط-اللوزة؛ PVNH، تكتل غير طبيعي حول البطين؛ Ncx، القشرة الجديدة؛ Str، المخطط؛ Th، المهاد.
انظر أيضًا الشكل S3.
MG شبيهة بـ ATM تتأثر بالضغط المورفوجيني وآفات الأنسجة
يساهم عامل ATM Spp1 في السلامة الهيكلية عند الحدود القشرية
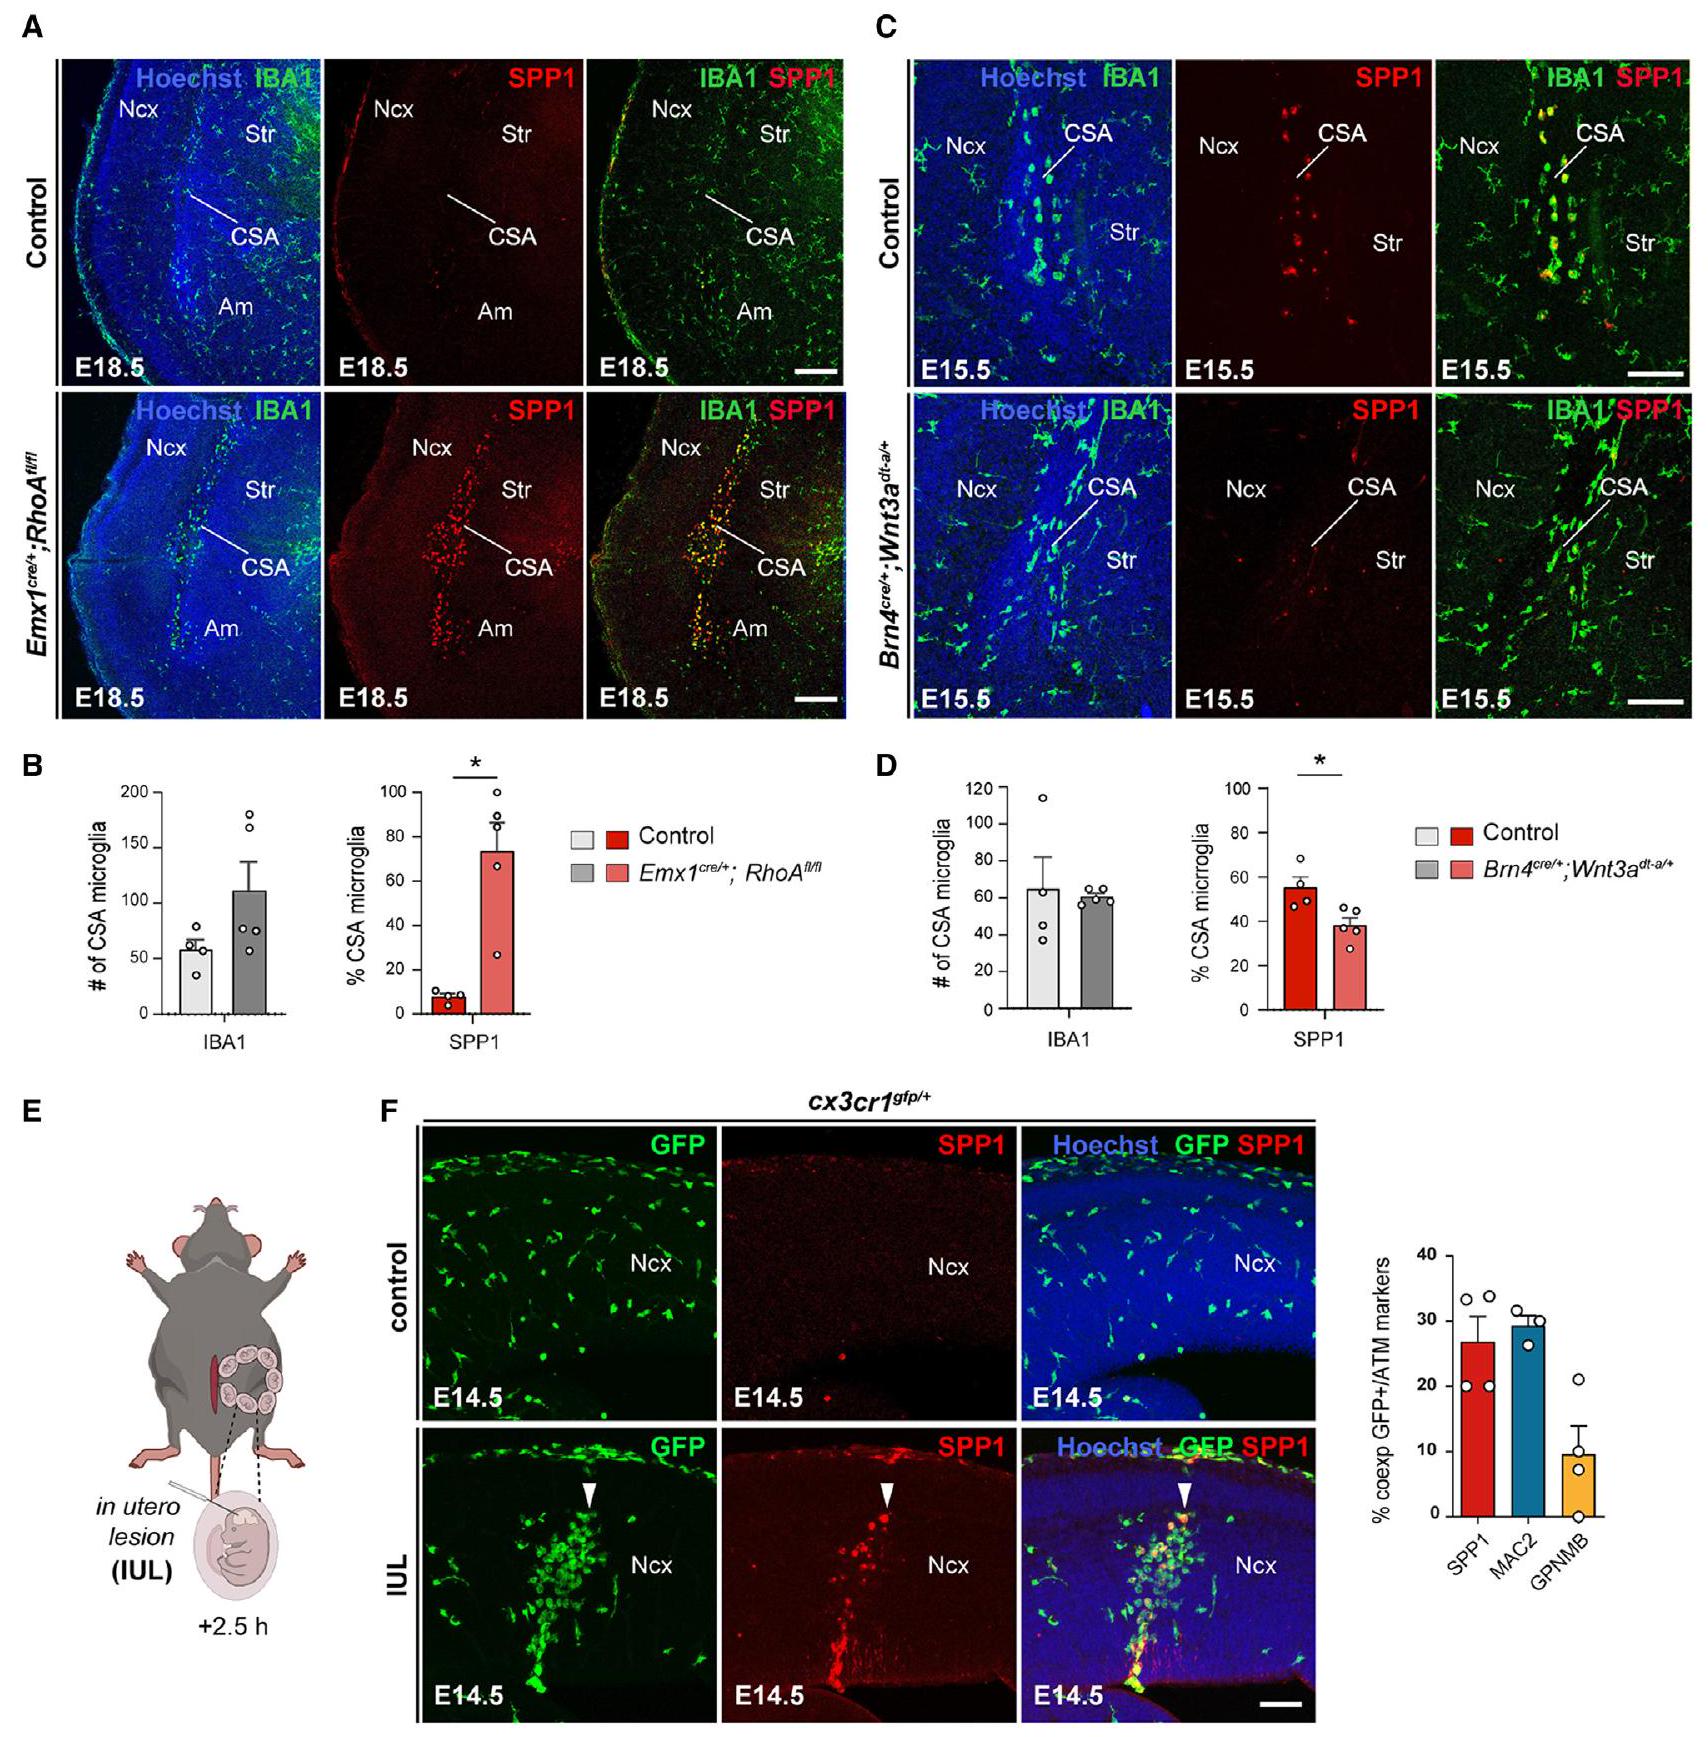
(A و B) مقاطع نصفية من دماغ E18.5 تم صبغها مناعياً باستخدام IBA1 و Spp1 تُظهر تجنيداً ملحوظاً لميكروغليا تعبر عن Spp1 في CSA لـ Emx1
(C و D) مقاطع نصفية من دماغ E15.5 تم تلطيخها مناعياً لـ IBA1 و Spp1 تظهر نسبة ملحوظة من انخفاض نسبة خلايا الميكروغليا CSA التي تعبر عن Spp1 في E15.5 Brn4
تمثيل تخطيطي لإجراء إصابة داخل الرحم (IUL) الناتج عن الوخز الميكانيكي للقشرة الجديدة باستخدام شعيرة زجاجية.
(F) مقاطع كورونالية من القشرة الجديدة في الأجنة الضابطة و IUL في عمر 14.5 يومًا تم جمعها بعد 2.5 ساعة من تحفيز الإصابة، تظهر خلايا Cx3cr1 الأميبية
تظهر الرسوم البيانية المتوسطات
(أ) مقاطع نصفية تاجية من أدمغة E14.5 ملونة بهوشت تكشف عن اضطراب CSA في 50% من الطفرات Spp1-/- (رؤوس الأسهم الصلبة) مقارنة بالتحكمات (رؤوس الأسهم المفتوحة) و في
(ب) تتيح تلوين المناعية L1 تصور المحاور العصبية (رؤوس الأسهم المفتوحة) والإصابات في الخط الأوسط (رؤوس الأسهم الصلبة) في حوالي
تساهم MG و Spp1 في الإصلاح السريع للآفات التجويفية
الأمم في البالغين،
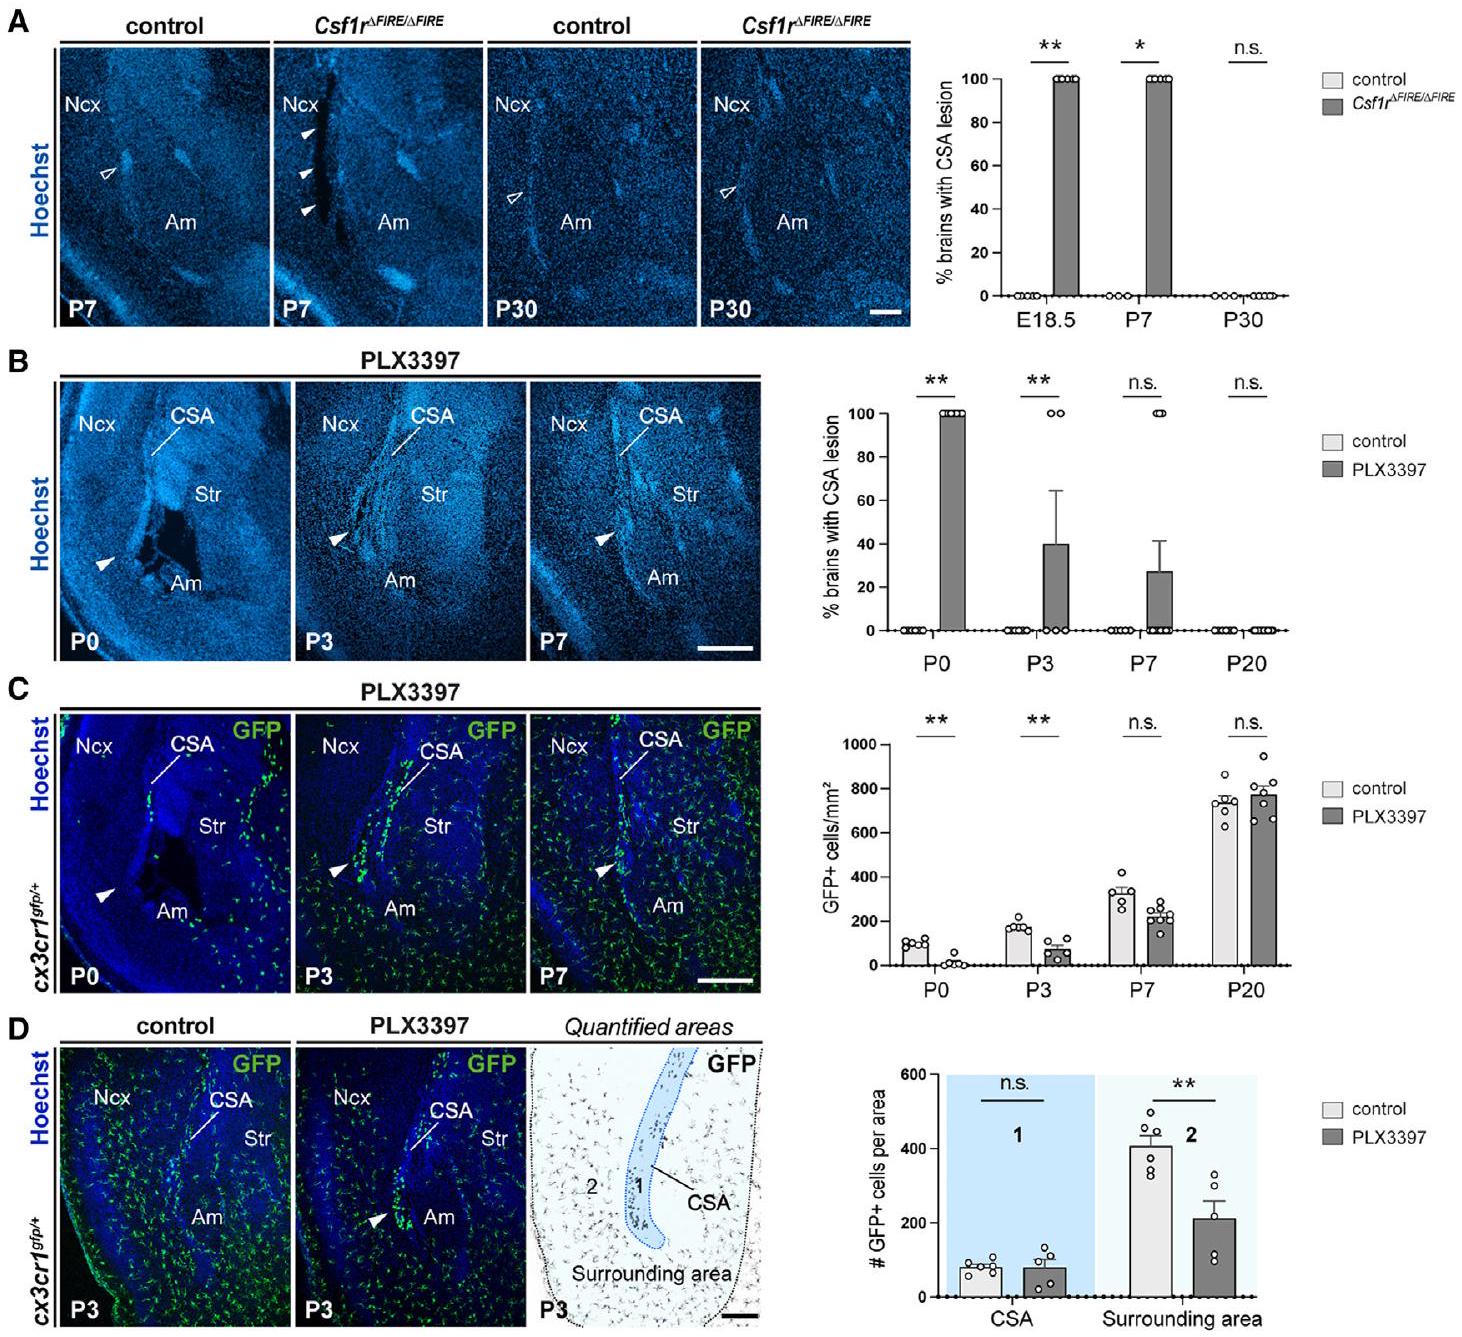
(أ) مقاطع كورونالية تظهر منطقة CSA في الضوابط و Csf1r
(ب وج) مقاطع كورونالية من أدمغة تعرضت قبل الولادة لـ PLX 3397 تظهر منطقة CSA (رؤوس الأسهم الصلبة) عند
(د) أعداد الميكروغليا المتجددة قابلة للمقارنة في CSA من الضوابط والأجنة المعرضة لـ PLX3397 عند P3، حتى لو ظلت أعداد الميكروغليا أقل في المنطقة المحيطة بالأدمغة التي يتم إعادة امتصاصها (
تم إجراء اختبار فيشر الدقيق
أم، اللوزة؛ CSA، حدود القشرة-المخطط-اللوزة؛ Ncx، القشرة الجديدة؛ Str، المخطط.
انظر أيضًا الأشكال S5 و S6.
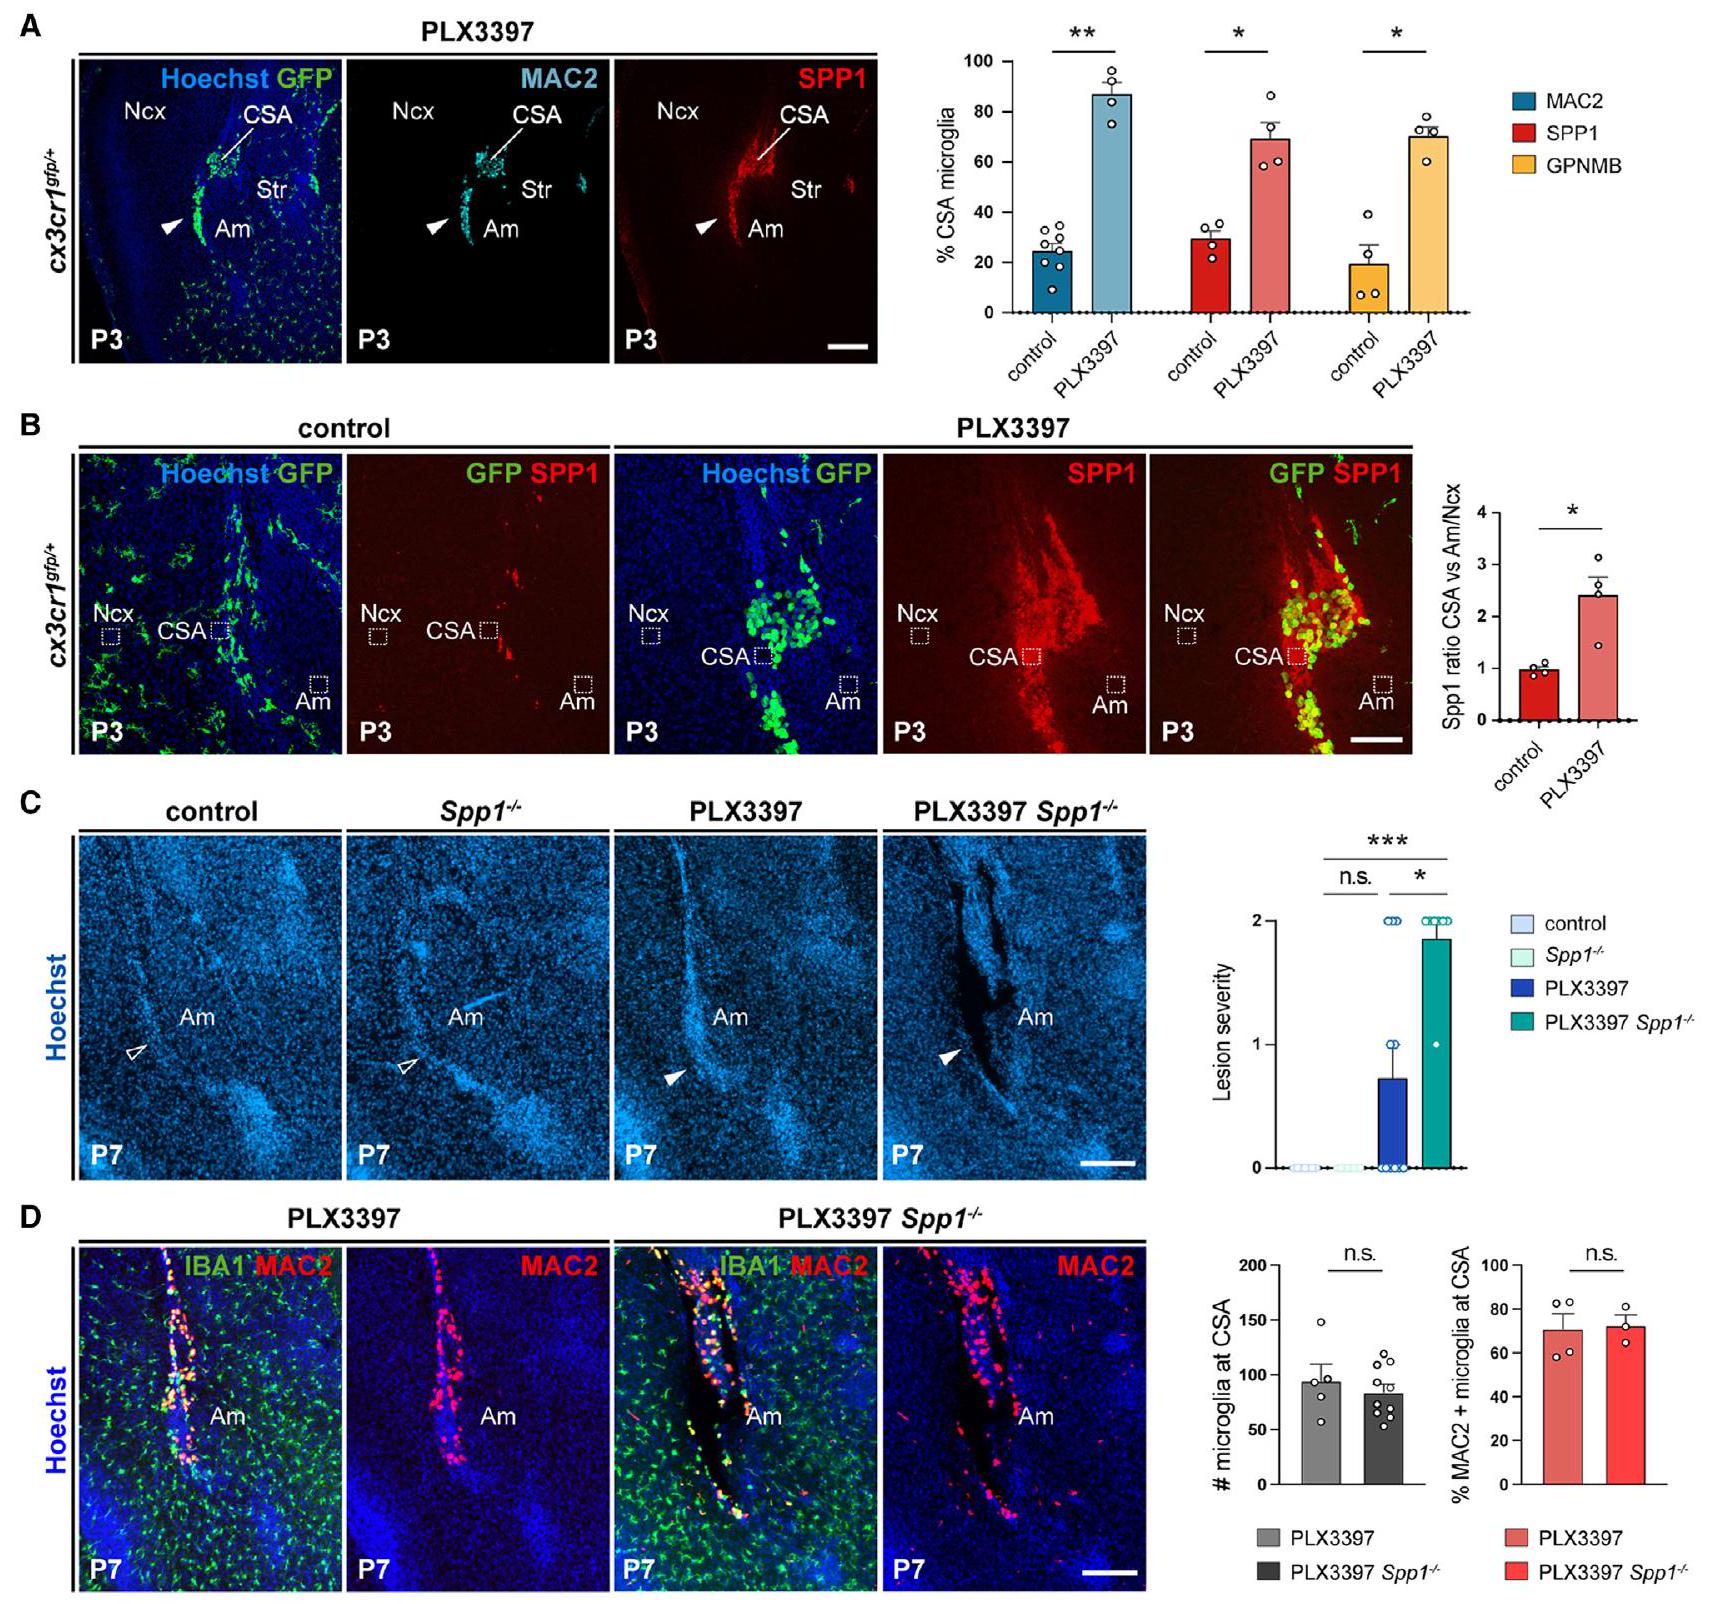
(أ) خلايا Cx3cr1
(ب) إشارة Spp1 خارج الخلية، المحددة بواسطة التلوين المناعي ووضع علامة هوشت، تتراكم في CSA المعاد امتصاصها عند P3. تظهر الرسوم البيانية زيادة شدة الإشارة في CSA (الخطوط المنقطة) مقارنة بمتوسط شدة الإشارة المقاسة في القشرة الجديدة المحيطة (الخطوط المنقطة) واللوزة (الخطوط المنقطة) في الجراء المعرضة لـ PLX3397 مقابل الضوابط (
(ج) على عكس الضوابط، أظهرت الطفرات Spp1-/- المعرضة لـ PLX3397، والضوابط المعرضة لـ PLX3397، أن الطفرات Spp1-/- المعرضة لـ PLX3397 عرضت بشكل متكرر آفات مرئية بواسطة تلوين هوشت (رؤوس الأسهم الصلبة مقابل المفتوحة) (
(د) بينما تعبر خلايا IBA1 الإيجابية في CSA عن Mac2 في الضوابط المعالجة بـ PLX3397 عند P7، تراكمت أيضًا حول الآفات في الطفرات Spp1 المعالجة بـ PLX3397، مما يشير إلى أن تعطيل Spp1 لم يمنع التعبير عن علامات ATM المختارة (
تظهر الرسوم البيانية المتوسطات
أم، اللوزة؛ CSA، حدود القشرة-المخطط-اللوزة؛ Ncx، القشرة الجديدة؛ Str، المخطط.
انظر أيضًا الشكل S7.
النقاش
بالخرف والأورام.
قيود الدراسة
نعترف بعدة قيود في بحثنا. أولاً، تم تقييم الضغط التشكلي بشكل غير مباشر من خلال التلاعبات الجينية التي تشوه تشكيل الدماغ. ومع ذلك، نعتقد أن هذه الملاحظة تعوض من خلال الاستفادة من نموذجين يزيدان ويقللان بشكل انتقائي من القيود التشكيلية. ثانيًا، لم يكن من الممكن إجراء تلاعبات محلية أو محددة للحالة لـ CSA وCSB MG. على الرغم من عدة محاولات للتلاعب بشكل انتقائي في هذه الحالة، لم نتمكن من القضاء بكفاءة وانتقائية على هذه المجموعة الخلوية العابرة، كما تم الإبلاغ عنه بالنسبة لـ ATM بعد الولادة،
طرق STAR*
- جدول الموارد الرئيسية
- توفر الموارد
- جهة الاتصال الرئيسية
- توفر المواد
- توفر البيانات والرموز
- نموذج تجريبي وتفاصيل المشاركين في الدراسة
- سلالات الفئران
- الأجنة البشرية
- تفاصيل الطريقة
- إعادة تحليل النسخ الجيني
- تحليل النسخ الجيني في الضوابط والطفرات Spp1
- نقص الخلايا الدبقية الصغيرة
- تنشيط المناعة الأمومية
- التلوين المناعي على الشرائح
- تنظيف الأنسجة
- تحضير الأنسجة لميكروسكوب الإلكترون الناقل (TEM)
- مسحات التصوير بالرنين المغناطيسي
- تحفيز الآفات القشرية داخل الرحم
- اختبار بلعمي خارج الجسم
- تحضير شرائح الدماغ وتسجيلات كهربائية فسيولوجية
- اكتساب الصور وتحليلها
- تصوير ميكروسكوب الإلكترون الناقل (TEM)
- الكمية والتحليل الإحصائي
معلومات إضافية
الشكر والتقدير
مساهمات المؤلفين
إعلان المصالح
تمت المراجعة: 30 سبتمبر 2023
تم القبول: 10 يناير 2024
نُشر: 2 فبراير 2024
REFERENCES
- Colonna, M., and Butovsky, O. (2017). Microglia Function in the Central Nervous System During Health and Neurodegeneration. Annu. Rev. Immunol. 35, 441-468.
- Li, Q., and Barres, B.A. (2018). Microglia and macrophages in brain homeostasis and disease. Nat. Rev. Immunol. 18, 225-242.
- Hammond, T.R., Robinton, D., and Stevens, B. (2018). Microglia and the Brain: Complementary Partners in Development and Disease. Annu. Rev. Cell Dev. Biol. 34, 523-544.
- Thion, M.S., Ginhoux, F., and Garel, S. (2018). Microglia and early brain development: An intimate journey. Science 362, 185-189.
- Sierra, A., Paolicelli, R.C., and Kettenmann, H. (2019). Cien Anos de Microglia: Milestones in a Century of Microglial Research. Trends Neurosci. 42, 778-792.
- Prinz, M., Jung, S., and Priller, J. (2019). Microglia Biology: One Century of Evolving Concepts. Cell 179, 292-311.
- Prinz, M., Masuda, T., Wheeler, M.A., and Quintana, F.J. (2021). Microglia and Central Nervous System-Associated Macrophages-From Origin to Disease Modulation. Annu. Rev. Immunol. 39, 251-277.
- Cserép, C., Pósfai, B., and Dénes, Á. (2021). Shaping Neuronal Fate: Functional Heterogeneity of Direct Microglia-Neuron Interactions. Neuron 109, 222-240.
- Badimon, A., Strasburger, H.J., Ayata, P., Chen, X., Nair, A., Ikegami, A., Hwang, P., Chan, A.T., Graves, S.M., Uweru, J.O., et al. (2020). Negative feedback control of neuronal activity by microglia. Nature 586, 417-423.
- McNamara, N.B., Munro, D.A.D., Bestard-Cuche, N., Uyeda, A., Bogie, J.F.J., Hoffmann, A., Holloway, R.K., Molina-Gonzalez, I., Askew, K.E., Mitchell, S., et al. (2023). Microglia regulate central nervous system myelin growth and integrity. Nature 613, 120-129.
- Thion, M.S., Mosser, C.A., Férézou, I., Grisel, P., Baptista, S., Low, D., Ginhoux, F., Garel, S., and Audinat, E. (2019). Biphasic Impact of Prenatal Inflammation and Macrophage Depletion on the Wiring of Neocortical Inhibitory Circuits. Cell Rep. 28, 1119-1126.e4.
- Scott-Hewitt, N., Perrucci, F., Morini, R., Erreni, M., Mahoney, M., Witkowska, A., Carey, A., Faggiani, E., Schuetz, L.T., Mason, S., et al. (2020). Local externalization of phosphatidylserine mediates developmental synaptic pruning by microglia. EMBO J. 39, e105380.
- Favuzzi, E., Huang, S., Saldi, G.A., Binan, L., Ibrahim, L.A., FernándezOtero, M., Cao, Y., Zeine, A., Sefah, A., Zheng, K., et al. (2021). GABAreceptive microglia selectively sculpt developing inhibitory circuits. Cell 184, 5686.
- Cserép, C., Schwarcz, A.D., Pósfai, B., László, Z.I., Kellermayer, A., Környei, Z., Kisfali, M., Nyerges, M., Lele, Z., Katona, I., and Adam, D. (2022). Microglial control of neuronal development via somatic purinergic junctions. Cell Rep. 40, 111369.
- Gallo, N.B., Berisha, A., and Van Aelst, L. (2022). Microglia regulate chandelier cell axo-axonic synaptogenesis. Proc. Natl. Acad. Sci. USA 119, e2114476119.
- Bisht, K., Sharma, K.P., Lecours, C., Sánchez, M.G., El Hajj, H., Milior, G., Olmos-Alonso, A., Gómez-Nicola, D., Luheshi, G., Vallières, L., et al. (2016). Dark microglia: A new phenotype predominantly associated with pathological states. Glia 64, 826-839.
- Krasemann, S., Madore, C., Cialic, R., Baufeld, C., Calcagno, N., El Fatimy, R., Beckers, L., O’Loughlin, E., Xu, Y., Fanek, Z., et al. (2017). The TREM2-APOE Pathway Drives the Transcriptional Phenotype of Dysfunctional Microglia in Neurodegenerative Diseases. Immunity 47, 566-581.e9.
- Keren-Shaul, H., Spinrad, A., Weiner, A., Matcovitch-Natan, O., DvirSzternfeld, R., Ulland, T.K., David, E., Baruch, K., Lara-Astaiso, D., Toth, B., et al. (2017). A Unique Microglia Type Associated with Restricting Development of Alzheimer’s Disease. Cell 169, 1276-1290.e17.
- Deczkowska, A., Keren-Shaul, H., Weiner, A., Colonna, M., Schwartz, M., and Amit, I. (2018). Disease-Associated Microglia: A Universal Immune Sensor of Neurodegeneration. Cell 173, 1073-1081.
- Stratoulias, V., Venero, J.L., Tremblay, M.E., and Joseph, B. (2019). Microglial subtypes: diversity within the microglial community. EMBO J. 38, e101997.
- Li, Q., Cheng, Z., Zhou, L., Darmanis, S., Neff, N.F., Okamoto, J., Gulati, G., Bennett, M.L., Sun, L.O., Clarke, L.E., et al. (2019). Developmental Heterogeneity of Microglia and Brain Myeloid Cells Revealed by Deep Single-Cell RNA Sequencing. Neuron 101, 207-223.e10.
- Hammond, T.R., Dufort, C., Dissing-Olesen, L., Giera, S., Young, A., Wysoker, A., Walker, A.J., Gergits, F., Segel, M., Nemesh, J., et al. (2019). Single-Cell RNA Sequencing of Microglia throughout the Mouse Lifespan and in the Injured Brain Reveals Complex Cell-State Changes. Immunity 50, 253-271.e6.
- Masuda, T., Sankowski, R., Staszewski, O., Böttcher, C., Amann, L., Sagar, S., Scheiwe, C., Nessler, S., Kunz, P., van Loo, G., et al. (2019). Spatial and temporal heterogeneity of mouse and human microglia at sin-gle-cell resolution. Nature 566, 388-392.
- Sala Frigerio, C., Wolfs, L., Fattorelli, N., Thrupp, N., Voytyuk, I., Schmidt, I., Mancuso, R., Chen, W.T., Woodbury, M.E., Srivastava, G., et al. (2019). The Major Risk Factors for Alzheimer’s Disease: Age, Sex, and Genes Modulate the Microglia Response to Abeta Plaques. Cell Rep. 27, 1293-1306.e6.
- Kracht, L., Borggrewe, M., Eskandar, S., Brouwer, N., Chuva de Sousa Lopes, S.M., Laman, J.D., Scherjon, S.A., Prins, J.R., Kooistra, S.M., and Eggen, B.J.L. (2020). Human fetal microglia acquire homeostatic im-mune-sensing properties early in development. Science 369, 530-537.
- Bian, Z., Gong, Y., Huang, T., Lee, C.Z.W., Bian, L., Bai, Z., Shi, H., Zeng, Y., Liu, C., He, J., et al. (2020). Deciphering human macrophage development at single-cell resolution. Nature 582, 571-576.
- Masuda, T., Sankowski, R., Staszewski, O., and Prinz, M. (2020). Microglia Heterogeneity in the Single-Cell Era. Cell Rep. 30, 1271-1281.
- Marschallinger, J., Iram, T., Zardeneta, M., Lee, S.E., Lehallier, B., Haney, M.S., Pluvinage, J.V., Mathur, V., Hahn, O., Morgens, D.W., et al. (2020). Lipid-droplet-accumulating microglia represent a dysfunctional and proinflammatory state in the aging brain. Nat. Neurosci. 23, 194-208.
- Safaiyan, S., Besson-Girard, S., Kaya, T., Cantuti-Castelvetri, L., Liu, L., Ji, H., Schifferer, M., Gouna, G., Usifo, F., Kannaiyan, N., et al. (2021). White matter aging drives microglial diversity. Neuron 109, 11001117.e10.
- La Manno, G., Siletti, K., Furlan, A., Gyllborg, D., Vinsland, E., Mossi Albiach, A., Mattsson Langseth, C., Khven, I., Lederer, A.R., Dratva, L.M., et al. (2021). Molecular architecture of the developing mouse brain. Nature 596, 92-96.
- Silvin, A., Uderhardt, S., Piot, C., Da Mesquita, S., Yang, K., Geirsdottir, L., Mulder, K., Eyal, D., Liu, Z., Bridlance, C., et al. (2022). Dual ontogeny of disease-associated microglia and disease inflammatory macrophages in aging and neurodegeneration. Immunity 55, 1448-1465.e6.
- Stogsdill, J.A., Kim, K., Binan, L., Farhi, S.L., Levin, J.Z., and Arlotta, P. (2022). Pyramidal neuron subtype diversity governs microglia states in the neocortex. Nature 608, 750-756.
- Paolicelli, R.C., Sierra, A., Stevens, B., Tremblay, M.E., Aguzzi, A., Ajami, B., Amit, I., Audinat, E., Bechmann, I., Bennett, M., et al. (2022). Microglia states and nomenclature: A field at its crossroads. Neuron 110, 3458-3483.
- Stratoulias, V., Ruiz, R., Kanatani, S., Osman, A.M., Keane, L., Armengol, J.A., Rodríguez-Moreno, A., Murgoci, A.N., García-Domínguez, I., Alonso-Bellido, I., et al. (2023). ARG1-expressing microglia show a distinct molecular signature and modulate post-natal development and function of the mouse brain. Nat. Neurosci. 26, 1008-1020.
- Dolan, M.J., Therrien, M., Jereb, S., Kamath, T., Gazestani, V., Atkeson, T., Marsh, S.E., Goeva, A., Lojek, N.M., Murphy, S., et al. (2023). Exposure of iPSC-derived human microglia to brain substrates enables the generation and manipulation of diverse transcriptional states in vitro. Nat. Immunol. 24, 1382-1390.
- Park, M.D., Silvin, A., Ginhoux, F., and Merad, M. (2022). Macrophages in health and disease. Cell 185, 4259-4279.
- Thion, M.S., and Garel, S. (2020). Microglial ontogeny, diversity and neurodevelopmental functions. Curr. Opin. Genet. Dev. 65, 186-194.
- Menassa, D.A., Muntslag, T.A.O., Martin-Estebané, M., Barry-Carroll, L., Chapman, M.A., Adorjan, I., Tyler, T., Turnbull, B., Rose-Zerilli, M.J.J., Nicoll, J.A.R., et al. (2022). The spatiotemporal dynamics of microglia across the human lifespan. Dev. Cell 57, 2127-2139.e6.
- Cossart, R., and Garel, S. (2022). Step by step: cells with multiple functions in cortical circuit assembly. Nat. Rev. Neurosci. 23, 395-410.
- Squarzoni, P., Oller, G., Hoeffel, G., Pont-Lezica, L., Rostaing, P., Low, D., Bessis, A., Ginhoux, F., and Garel, S. (2014). Microglia modulate wiring of the embryonic forebrain. Cell Rep. 8, 1271-1279.
- Thion, M.S., and Garel, S. (2017). On place and time: microglia in embryonic and perinatal brain development. Curr. Opin. Neurobiol. 47, 121-130.
- Wlodarczyk, A., Holtman, I.R., Krueger, M., Yogev, N., Bruttger, J., Khorooshi, R., Benmamar-Badel, A., de Boer-Bergsma, J.J., Martin, N.A., Karram, K., et al. (2017). A novel microglial subset plays a key role in myelinogenesis in developing brain. EMBO J. 36, 3292-3308.
- Hagemeyer, N., Hanft, K.M., Akriditou, M.A., Unger, N., Park, E.S., Stanley, E.R., Staszewski, O., Dimou, L., and Prinz, M. (2017). Microglia contribute to normal myelinogenesis and to oligodendrocyte progenitor maintenance during adulthood. Acta Neuropathol. 134, 441-458.
- Ueno, M., Fujita, Y., Tanaka, T., Nakamura, Y., Kikuta, J., Ishii, M., and Yamashita, T. (2013). Layer V cortical neurons require microglial support for survival during post-natal development. Nat. Neurosci. 16, 543-551.
- Nemes-Baran, A.D., White, D.R., and DeSilva, T.M. (2020). FractalkineDependent Microglial Pruning of Viable Oligodendrocyte Progenitor Cells Regulates Myelination. Cell Rep. 32, 108047.
- Hankin, M.H., Schneider, B.F., and Silver, J. (1988). Death of the subcallosal glial sling is correlated with formation of the cavum septi pellucidi. J. Comp. Neurol. 272, 191-202.
- Erblich, B., Zhu, L., Etgen, A.M., Dobrenis, K., and Pollard, J.W. (2011). Absence of colony stimulation factor-1 receptor results in loss of microglia, disrupted brain development and olfactory deficits. PLoS One 6, e26317.
- Pridans, C., Raper, A., Davis, G.M., Alves, J., Sauter, K.A., Lefevre, L., Regan, T., Meek, S., Sutherland, L., Thomson, A.J., et al. (2018). Pleiotropic Impacts of Macrophage and Microglial Deficiency on Development in Rats with Targeted Mutation of the Csf1r Locus. J. Immunol. 201, 2683-2699.
- Hoeffel, G., Wang, Y., Greter, M., See, P., Teo, P., Malleret, B., Leboeuf, M., Low, D., Oller, G., Almeida, F., et al. (2012). Adult Langerhans cells derive predominantly from embryonic fetal liver monocytes with a minor contribution of yolk sac-derived macrophages. J. Exp. Med. 209, 1167-1181.
- Elmore, M.P., Najafi, A.R., Koike, M.A., Dagher, N.N., Spangenberg, E.E., Rice, R.A., Kitazawa, M., Matusow, B., Nguyen, H., West, B.L., and Green, K.N. (2014). Colony-stimulating factor 1 receptor signaling is necessary for microglia viability, unmasking a microglia progenitor cell in the adult brain. Neuron 82, 380-397.
- Green, K.N., Crapser, J.D., and Hohsfield, L.A. (2020). To Kill a Microglia: A Case for CSF1R Inhibitors. Trends Immunol. 41, 771-784.
- Back, J., Dierich, A., Bronn, C., Kastner, P., and Chan, S. (2004). PU. 1 determines the self-renewal capacity of erythroid progenitor cells. Blood 103, 3615-3623.
- Rojo, R., Raper, A., Ozdemir, D.D., Lefevre, L., Grabert, K., WollscheidLengeling, E., Bradford, B., Caruso, M., Gazova, I., Sánchez, A., et al. (2019). Deletion of a Csf1r enhancer selectively impacts CSF1R expression and development of tissue macrophage populations. Nat. Commun. 10, 3215.
- Munro, D.A.D., Bradford, B.M., Mariani, S.A., Hampton, D.W., Vink, C.S., Chandran, S., Hume, D.A., Pridans, C., and Priller, J. (2020). CNS macrophages differentially rely on an intronic Csf1r enhancer for their development. Development 147, dev194449.
- Kiani Shabestari, S., Morabito, S., Danhash, E.P., McQuade, A., Sanchez, J.R., Miyoshi, E., Chadarevian, J.P., Claes, C., Coburn, M.A., Hasselmann, J., et al. (2022). Absence of microglia promotes diverse pathologies and early lethality in Alzheimer’s disease mice. Cell Rep. 39, 110961.
- Esteban, H., Blondiaux, E., Audureau, E., Sileo, C., Moutard, M.L., Gelot, A., Jouannic, J.M., Ducou le Pointe, H., and Garel, C. (2015). Prenatal features of isolated subependymal pseudocysts associated with adverse pregnancy outcome. Ultrasound in Obstet. Gyne. 46, 678-687.
- Belle, M., Godefroy, D., Dominici, C., Heitz-Marchaland, C., Zelina, P., Hellal, F., Bradke, F., and Chédotal, A. (2014). A simple method for 3D analysis of immunolabeled axonal tracts in a transparent nervous system. Cell Rep. 9, 1191-1201.
- Renier, N., Wu, Z., Simon, D.J., Yang, J., Ariel, P., and Tessier-Lavigne, M. (2014). iDISCO: a simple, rapid method to immunolabel large tissue samples for volume imaging. Cell 159, 896-910.
- Kaur, C., and Ling, E.A. (2017). Transitory cystic cavities in the developing mammalian brain – normal or anomalous? J. Anat. 230, 197-202.
- Saito, K., Okamoto, M., Watanabe, Y., Noguchi, N., Nagasaka, A., Nishina, Y., Shinoda, T., Sakakibara, A., and Miyata, T. (2019). Dorsal-toVentral Cortical Expansion Is Physically Primed by Ventral Streaming of Early Embryonic Preplate Neurons. Cell Rep. 29, 1555-1567.e5.
- Van Essen, D.C. (2020). A 2020 view of tension-based cortical morphogenesis. Proc. Natl. Acad. Sci. USA 117, 32868-32879.
- Das, J.M., and Dossani, R.H. (2022). Cavum Septum Pellucidum. In StatPearls (StatPearls Publishing).
- Cappello, S., Böhringer, C.J., Bergami, M., Conzelmann, K.K., Ghanem, A., Tomassy, G.S., Arlotta, P., Mainardi, M., Allegra, M., Caleo, M., et al. (2012). A radial glia-specific role of RhoA in double cortex formation. Neuron 73, 911-924.
- Deck, M., Lokmane, L., Chauvet, S., Mailhes, C., Keita, M., Niquille, M., Yoshida, M., Yoshida, Y., Lebrand, C., Mann, F., et al. (2013). Pathfinding of corticothalamic axons relies on a rendezvous with thalamic projections. Neuron 77, 472-484.
- Liaw, L., Birk, D.E., Ballas, C.B., Whitsitt, J.S., Davidson, J.M., and Hogan, B.L. (1998). Altered wound healing in mice lacking a functional osteopontin gene (spp1). J. Clin. Invest. 101, 1468-1478.
- Rosmus, D.D., Lange, C., Ludwig, F., Ajami, B., and Wieghofer, P. (2022). The Role of Osteopontin in Microglia Biology: Current Concepts and Future Perspectives. Biomedicines 10, 840.
- Shen, X., Qiu, Y., Wight, A.E., Kim, H.J., and Cantor, H. (2022). Definition of a mouse microglial subset that regulates neuronal development and proinflammatory responses in the brain. Proc. Natl. Acad. Sci. USA 119, e2116241119.
- De Schepper, S., Ge, J.Z., Crowley, G., Ferreira, L.S.S., Garceau, D., Toomey, C.E., Sokolova, D., Rueda-Carrasco, J., Shin, S.H., Kim, J.S., et al. (2023). Perivascular cells induce microglial phagocytic states and synaptic engulfment via SPP1 in mouse models of Alzheimer’s disease. Nat. Neurosci. 26, 406-415.
- Bonnans, C., Chou, J., and Werb, Z. (2014). Remodelling the extracellular matrix in development and disease. Nat. Rev. Mol. Cell Biol. 15, 786-801.
- Patten, J., and Wang, K. (2021). Fibronectin in development and wound healing. Adv. Drug Deliv. Rev. 170, 353-368.
- Moretti, L., Stalfort, J., Barker, T.H., and Abebayehu, D. (2022). The interplay of fibroblasts, the extracellular matrix, and inflammation in scar formation. J. Biol. Chem. 298, 101530.
- Li, Y., He, X., Kawaguchi, R., Zhang, Y., Wang, Q., Monavarfeshani, A., Yang, Z., Chen, B., Shi, Z., Meng, H., et al. (2020). Microglia-organized scar-free spinal cord repair in neonatal mice. Nature 587, 613-618.
- Meisner, O.C., Nair, A., and Chang, S.W.C. (2022). Amygdala connectivity and implications for social cognition and disorders. Handb. Clin. Neurol. 187, 381-403.
- Varghese, M., Keshav, N., Jacot-Descombes, S., Warda, T., Wicinski, B., Dickstein, D.L., Harony-Nicolas, H., De Rubeis, S., Drapeau, E., Buxbaum, J.D., et al. (2017). Autism spectrum disorder: neuropathology and animal models. Acta Neuropathol. 134, 537-566.
- Amaral, D.G., Schumann, C.M., and Nordahl, C.W. (2008). Neuroanatomy of autism. Trends Neurosci. 31, 137-145.
- Paré, D., Quirk, G.J., and Ledoux, J.E. (2004). New vistas on amygdala networks in conditioned fear. J. Neurophysiol. 92, 1-9.
- Tovote, P., Fadok, J.P., and Lüthi, A. (2015). Neuronal circuits for fear and anxiety. Nat. Rev. Neurosci. 16, 317-331.
- Asede, D., Doddapaneni, D., and Bolton, M.M. (2022). Amygdala Intercalated Cells: Gate Keepers and Conveyors of Internal State to the Circuits of Emotion. J. Neurosci. 42, 9098-9109.
- Paolicelli, R.C., Bolasco, G., Pagani, F., Maggi, L., Scianni, M., Panzanelli, P., Giustetto, M., Ferreira, T.A., Guiducci, E., Dumas, L., et al.
(2011). Synaptic pruning by microglia is necessary for normal brain development. Science 333, 1456-1458. - Schafer, D.P., Lehrman, E.K., Kautzman, A.G., Koyama, R., Mardinly, A.R., Yamasaki, R., Ransohoff, R.M., Greenberg, M.E., Barres, B.A., and Stevens, B. (2012). Microglia sculpt post-natal neural circuits in an activity and complement-dependent manner. Neuron 74, 691-705.
- Miyamoto, A., Wake, H., Ishikawa, A.W., Eto, K., Shibata, K., Murakoshi, H., Koizumi, S., Moorhouse, A.J., Yoshimura, Y., and Nabekura, J. (2016). Microglia contact induces synapse formation in developing somatosensory cortex. Nat. Commun. 7, 12540.
- Weinhard, L., di Bartolomei, G., Bolasco, G., Machado, P., Schieber, N.L., Neniskyte, U., Exiga, M., Vadisiute, A., Raggioli, A., Schertel, A., et al. (2018). Microglia remodel synapses by presynaptic trogocytosis and spine head filopodia induction. Nat. Commun. 9, 1228.
- Allen, N.J., and Lyons, D.A. (2018). Glia as architects of central nervous system formation and function. Science 362, 181-185.
- Nguyen, P.T., Dorman, L.C., Pan, S., Vainchtein, I.D., Han, R.T., NakaoInoue, H., Taloma, S.E., Barron, J.J., Molofsky, A.B., Kheirbek, M.A., and Molofsky, A.V. (2020). Microglial Remodeling of the Extracellular Matrix Promotes Synapse Plasticity. Cell 182, 388-403.e15.
- Frangogiannis, N.G. (2014). The inflammatory response in myocardial injury, repair, and remodelling. Nat. Rev. Cardiol. 11, 255-265.
- Pellicoro, A., Ramachandran, P., Iredale, J.P., and Fallowfield, J.A. (2014). Liver fibrosis and repair: immune regulation of wound healing in a solid organ. Nat. Rev. Immunol. 14, 181-194.
- Vannella, K.M., and Wynn, T.A. (2017). Mechanisms of Organ Injury and Repair by Macrophages. Annu. Rev. Physiol. 79, 593-617.
- Shin, Y.J., Kim, H.L., Choi, J.S., Choi, J.Y., Cha, J.H., and Lee, M.Y. (2011). Osteopontin: correlation with phagocytosis by brain macrophages in a rat model of stroke. Glia 59, 413-423.
- Rentsendorj, A., Sheyn, J., Fuchs, D.T., Daley, D., Salumbides, B.C., Schubloom, H.E., Hart, N.J., Li, S., Hayden, E.Y., Teplow, D.B., et al. (2018). A novel role for osteopontin in macrophage-mediated amyloidbeta clearance in Alzheimer’s models. Brain Behav. Immun. 67, 163-180.
- Lyons, D.A., and Talbot, W.S. (2014). Glial cell development and function in zebrafish. Cold Spring Harb. Perspect. Biol. 7, a020586.
- Sharma, K., Bisht, K., and Eyo, U.B. (2021). A Comparative Biology of Microglia Across Species. Front. Cell Dev. Biol. 9, 652748.
- Teissier, N., Fallet-Bianco, C., Delezoide, A.L., Laquerrière, A., Marcorelles, P., Khung-Savatovsky, S., Nardelli, J., Cipriani, S., Csaba, Z., Picone, O., et al. (2014). Cytomegalovirus-induced brain malformations in fetuses. J. Neuropathol. Exp. Neurol. 73, 143-158.
- Nunes, R.H., Pacheco, F.T., and da Rocha, A.J. (2014). Magnetic resonance imaging of anterior temporal lobe cysts in children: discriminating special imaging features in a particular group of diseases. Neuroradiology 56, 569-577.
- Tomasello, E., Desmoulins, P.O., Chemin, K., Guia, S., Cremer, H., Ortaldo, J., Love, P., Kaiserlian, D., and Vivier, E. (2000). Combined natural killer cell and dendritic cell functional deficiency in KARAP/DAP12 loss-of-function mutant mice. Immunity 13, 355-364.
- Jackson, B., Peyrollier, K., Pedersen, E., Basse, A., Karlsson, R., Wang, Z., Lefever, T., Ochsenbein, A.M., Schmidt, G., Aktories, K., et al. (2011). RhoA is dispensable for skin development, but crucial for contraction and directed migration of keratinocytes. Mol. Biol. Cell 22, 593-605.
- Jung, S., Aliberti, J., Graemmel, P., Sunshine, M.J., Kreutzberg, G.W., Sher, A., and Littman, D.R. (2000). Analysis of fractalkine receptor CX(3)CR1 function by targeted deletion and green fluorescent protein reporter gene insertion. Mol. Cell. Biol. 20, 4106-4114.
- Lindquist, R.L., Shakhar, G., Dudziak, D., Wardemann, H., Eisenreich, T., Dustin, M.L., and Nussenzweig, M.C. (2004). Visualizing dendritic cell networks in vivo. Nat. Immunol. 5, 1243-1250.
- van Spriel, A.B., Leusen, J.H.W., van Egmond, M., Dijkman, H.B.P.M., Assmann, K.J.M., Mayadas, T.N., and van de Winkel, J.G.J. (2001).
99. Hao, Y., Hao, S., Andersen-Nissen, E., Mauck, W.M., 3rd, Zheng, S., Butler, A., Lee, M.J., Wilk, A.J., Darby, C., Zager, M., et al. (2021). Integrated analysis of multimodal single-cell data. Cell 184, 3573-3587.e29.
100. Hafemeister, C., and Satija, R. (2019). Normalization and variance stabilization of single-cell RNA-seq data using regularized negative binomial regression. Genome Biol. 20, 296.
101. Langmead, B., and Salzberg, S.L. (2012). Fast gapped-read alignment with Bowtie 2. Nat. Methods 9, 357-359.
102. Ahlmann-Eltze, C., and Huber, W. (2021). glmGamPoi: fitting GammaPoisson generalized linear models on single cell count data. Bioinformatics 36, 5701-5702.
103. Zappia, L., and Oshlack, A. (2018). Clustering trees: a visualization for evaluating clusterings at multiple resolutions. GigaScience 7, giy083.
104. Genescu, I., Aníbal-Martínez, M., Kouskoff, V., Chenouard, N., MailhesHamon, C., Cartonnet, H., Lokmane, L., Rijli, F.M., López-Bendito, G., Gambino, F., and Garel, S. (2022). Dynamic interplay between thalamic activity and Cajal-Retzius cells regulates the wiring of cortical layer 1. Cell Rep. 39, 110667.
105. de Frutos, C.A., Bouvier, G., Arai, Y., Thion, M.S., Lokmane, L., Keita, M., Garcia-Dominguez, M., Charnay, P., Hirata, T., Riethmacher, D., et al. (2016). Reallocation of Olfactory Cajal-Retzius Cells Shapes Neocortex Architecture. Neuron 92, 435-448.
106. Schafer, D.P., Lehrman, E.K., Heller, C.T., and Stevens, B. (2014). An engulfment assay: a protocol to assess interactions between CNS phagocytes and neurons. JoVE. 51482.
طرق النجوم
جدول الموارد الرئيسية
| كاشف أو مورد | المصدر | معرف |
| الأجسام المضادة | ||
| مضاد CD68 من الجرذان | بايو راد | القطعة# MCA1957; RRID:AB_322219 |
| أرنب مضاد-FN1 | ميلليبور | القطعة# AB2033؛ RRID:AB_2105702 |
| جلوبيولين مضاد لـ FOXP2 من الماعز | سانتا كروز للتكنولوجيا الحيوية | القطعة# sc-21069; RRID:AB_2107124 |
| دجاج مضاد لـ GFP | أفيز لابز | القطعة# GFP-1020؛ RRID:AB_10000240 |
| أرنب مضاد-IBA1 | فوجي فيلم واكو شباياجي | القطعة# 019-19741; RRID:AB_839504 |
| أرنب مضاد-IBA1 (بشري) | أبكام | القطعة# ab178846; RRID:AB_2636859 |
| دجاج مضاد-IBA1 | الأنظمة المشبكية | رقم المنتج: 234009؛ RRID:AB_2891282 |
| مضاد ل-Lgals3 من الجرذان (MAC2) | سيدارلين | رقم المنتج: CL8942AP؛ RRID:AB_10060357 |
| مضاد L1 من الجرذان | ميلبورو | القطعة# MAB5272; RRID:AB_2133200 |
| الجرذان المضادة لـ LYVE1 الموصلة بالبيوتين | ثيرمو فيشر ساينتيفيك | قط# 13-0443-82; RRID:AB_1724157 |
| مضاد بروتين المايلين الأساسي (MBP) من الجرذان | ميلبورو | القط# MAB386; RRID:AB_94975 |
| مضاد الفأر لـ mDectin-1 (CLEC7A) | إنفيفوجين | قط# mabg-mdect; RRID:AB_2753143 |
| علامة الفيلامين العصبي المضاد للفأر SMI-312 | بايو ليجند | الرقم التعريفي# 837904؛ RRID:AB_2566782 |
| الأجسام المضادة الماعز ضد أوستيوأكتيفين الفأر (GPNMB) | أنظمة البحث والتطوير | القطعة# AF2330؛ RRID:AB_2112934 |
| أرنب مضاد لمستقبل P2Y12 | أنا سبيك؛ مجموعة EGT | رقم الكات: 55043A؛ RRID:AB_2298886 |
| جلوبيولين مضاد لـ SPP1 من الماعز | أنظمة البحث والتطوير | القط# AF808; RRID:AB_2194992 |
| الأجسام المضادة للدجاج من نوع دونكي Alexa 10 Fluor® 488 المرتبطة | مختبرات جاكسون إيمونوريسيرش | القطعة# 703-545-155؛ RRID:AB_2340375 |
| الألكسا 10 فلور® 488 المرتبطة بمضاد الحمار ضد الماعز | مختبرات جاكسون إيمونوريسيرش | القطعة # 705-545-147؛ RRID:AB_2336933 |
| مضاد حيواني ضد الجرذان أليكس 10 فلور® 488-مقترن | مختبرات جاكسون إيمونوريسيرش | القطعة # 712-545-150؛ RRID:AB_2340683 |
| الأرنب المضاد للحمير أليكس 10 فلور® 488-المترافق | مختبرات جاكسون إيمونوريسيرش | القطعة# 711-545-152; RRID:AB_2313584 |
| الأجسام المضادة للأغنام المربوطة بـ Cy3 | مختبرات جاكسون إيمونوريسيرش | القطعة# 705-165-147؛ RRID:AB_2307351 |
| الأجسام المضادة للأرانب المربوطة بـ Cy3 من نوع الحمار | مختبرات جاكسون إيمونوريسيرش | القطعة# 711-165-152; RRID:AB_2307443 |
| مضاد حيواني من نوع حمار وحشي مترافق مع Cy3 | مختبرات جاكسون إيمونوريسيرش | القطعة رقم 712-165-150؛ RRID:AB_2340666 |
| الألكسا 10 فلور® 647 المرتبط بمضاد الحمار ضد الماعز | مختبرات جاكسون إيمونوريسيرش | القطعة# 705-605-147؛ RRID:AB_2340437 |
| مضاد حيواني للماعز مترافق مع Cy5 | مختبرات جاكسون إيمونوريسيرش | القطعة# 705-175-147; RRID:AB_2340415 |
| مضاد حيوي من نوع دونكي مدمج مع Cy5 للفئران | مختبرات جاكسون إيمونوريسيرش | القطعة # 712-175-150؛ RRID:AB_2340671 |
| عينات بيولوجية | ||
| نسيج دماغ الجنين البشري | قسم النساء والتوليد، مستشفى جان دو فلاندر، ليل، فرنسا | غير متوفر |
| المواد الكيميائية، الببتيدات، والبروتينات المؤتلفة | ||
| ليبوبوليسكاريد | إنفيفوجين | القط# tlrl-pelps; CAS: 93572-42-0 |
| بيكسيدارتينيب (PLX3397) | بليكسكون | CAS: 1029044-16-3 |
| الأجسام المضادة أحادية النسيلة المضادة لـ CSF1R
|
مختبر فلوران جينهoux | غير متوفر |
| ترايتون 100X | يوروبيو | قطعة# GAUTTR00-07 |
| هوخست | سيغما ألدريتش | القط# 33342 |
| بارافورمالدهيد | سيغما ألدريتش | القط# P6148 |
| جيلاتين | كيماويات VWR | القط# 24350.262 |
| ديبنزيل إيثر | سيغما ألدريتش | القط# 33630 |
| ثنائي كلورو ميثان | سيغما ألدريتش | القط# 270997 |
| ميثانول | سيغما ألدريتش | القط# 34860 |
| اختبارات تجارية حاسمة | ||
| بي دي
|
بي دي بيوساينس | القط# 633793 |
| مستمر | |||||
| كاشف أو مورد | المصدر | معرف | |||
|
بي دي بيوساينس | القط# 633801 | |||
|
بي دي بيوساينس | القط# 665915 | |||
|
ثيرمو فيشر ساينتيفيك | قط# P35361 | |||
| البيانات المودعة | |||||
| تسلسل RNA أحادي الخلية لميكروغليا الجنين (C57BL/6) | لا مانو وآخرون
|
http://mousebrain.org/ التطوير (“dev_all.loom”) | |||
| تسلسل RNA أحادي الخلية لميكروغليا ما بعد الولادة (C57BL/6) | هاموند وآخرون
|
جي إس إي: 121654 | |||
| تسلسل RNA أحادي الخلية لميكروغليا ما بعد الولادة (C57BL/6) | لي وآخرون
|
جي إس إي: 123025 | |||
| تسلسل RNA أحادي الخلية لـ Spp1-/
|
هذه الدراسة |
|
|||
| نماذج تجريبية: الكائنات/السلالات | |||||
| فأر: Cx3cr1
|
مختبر جاكسون | RRID:IMSR_JAX:005582 | |||
| فأر: بو.
|
باك وآخرون
|
غير متوفر | |||
| فأر: Cd11c-eYFP | مختبر جاكسون | RRID:IMSR_JAX:007567 | |||
| فأر: Spp1-/- | مختبر جاكسون | RRID:IMSR_JAX:004936 | |||
| فأر: Csf1r
|
روخو وآخرون
|
RRID:IMSR_JAX:032783 | |||
| فأر: Cd11b
|
مختبر جاكسون | RRID:IMSR_JAX:003991 | |||
| فأر: Dap12/TyroBP
|
توماسيليو وآخرون
|
RRID:MGI:3818477 | |||
| فأر:
|
جاكسون وآخرون
|
غير متوفر | |||
| فأر: Emx1
|
كابيلو وآخرون
|
غير متوفر | |||
| فأر: WntA3
|
ديك وآخرون
|
غير متوفر | |||
| فأر: C57BL/6J | مختبر جاكسون |
|
|||
| البرمجيات والخوارزميات | |||||
| فيجي (ImageJ) 1.50 غ | المعهد الوطني للصحة | https://fiji.sc/; https://imagej.nih.gov/ ij/index.html; RRID: SCR_003070 | |||
| لاس إيه إف 4.0 | لايكا ميكروسستمز | https://www.leica-microsystems.com/; RRID: SCR_013673 | |||
| جراب باد بريزم 9.5 | برنامج جراف باد | RRID: SCR_000306 | |||
| أدوبي فوتوشوب CS6 | أدوبي سيستمز | RRID: SCR_014199 | |||
| أدوبي إليستريتور CS6 | أدوبي سيستمز | RRID: SCR_010279 | |||
| برنامج R الإصدار 4.2.2 | مشروع جنو | https://www.r-project.org/; RRID:SCR_001905 | |||
| حزمة R: Metascape 3.5.20230501 | فريق ميتاسكيب | http://metascape.org/gp/ index.html#/main/step1; RRID:SCR_016620 | |||
| حزمة R: Seurat 4.3.0.1 | غير متوفر | https://satijalab.org/seurat/ get_started.html; RRID:SCR_016341 | |||
| حزمة R: Tidyverse 2.0.0 | غير متوفر | https://CRAN.R-project.org/ package=tidyverse ; RRID:SCR_019186 | |||
| حزمة R: فيريديس 0.6.4 | غير متوفر | https://cran.r-project.org/web/ packages/viridis/vignettes/ intro-to-viridis.html ; RRID:SCR_016696 | |||
| حزمة R: Clustree 0.5.0 | غير متوفر | https://CRAN.R-project.org/ package=clustree ; RRID:SCR_016293 | |||
| مستمر | ||
| كاشف أو مورد | المصدر | معرف |
| حزمة R: EnhancedVolcano 1.16.0 | غير متوفر | https://bioconductor.org/ packages/EnhancedVolcano/ ; RRID:SCR_018931 |
| حزمة R: Paletteer 1.5.0 | غير متوفر | https://CRAN.R-project.org/ package=paletteer |
| حزمة R: Ggplot2 3.4.3 | غير متوفر | https://cran.r-project.org/web/ packages/ggplot2/index.html ; RRID:SCR_014601 |
| حزمة R: Sctransform 0.3.5 | غير متوفر | https://github.com/satijalab/sctransform ; RRID:SCR_022146 |
| حزمة R: GlmGamPoi 1.10.2 | غير متوفر | https://bioconductor.org/ packages/glmGamPoi/ |
| باوتي 2 | غير متوفر | http://bowtie-bio.sourceforge.net/ bowtie2/index.shtml ; RRID:SCR_016368 |
| نظام إيلومينا هاي سيك 4000 | إلومينا | https://www.illumina.com/ systems/sequencing-platforms/ hiseq-3000-4000.html ; RRID:SCR_020127 |
| خط أنابيب تحليل الرابسودي | بي دي بيوساينس | https://www.bdbiosciences.com |
| t-SNE | جيت هاب | https://github.com/jkrijthe/Rtsne |
| يوماپ | جيت هاب | https://github.com/Imcinnes/umap |
| برنامج إيماريس x64 الإصدار 10.0 | بيت بلين | RRID:SCR_007370 |
| برنامج إيمسبيكتور برو | ميلتيني بيوتيك | https://www.miltenyibiotec.com |
| برنامج جاتان ديجيتال مايكروغرافس | غاتان | https://www.gatan.com |
| برنامج pClamp 10.3 | الأجهزة الجزيئية | https://support.moleculardevices.com |
| آخر | ||
| ميكروسكوب لايكا TCS-SP8 الفلوري | لايكا | https://www.leica-microsystems.com/ |
| ميكروسكوب لايكا TCS SP5 الفلوري | لايكا | https://www.leica-microsystems.com/ |
| ميكروسكوب أولتراميكروسكوب II بميكروسكوب شريحة ضوئية | ميلتيني بيوتيك | https://www.miltenyibiotec.com |
| ميكروسكوب الفلورسنت لايكا DMi8 | لايكا | https://www.leica-microsystems.com/ |
| ميكروسكوب الإلكترون الناقل فيليبس تيكني 12 | فيليبس/في إي آي | https://nano.tau.ac.il |
| كريوستات لايكا CM 3050S | لايكا | https://www.leica-microsystems.com/ |
| ميكروسكوب أوليمبوس BX51WIF | أوليمبوس | https://www.olympus-lifescience.com |
| طعام الفئران القياسي ssniff | شركة ssniff للأنظمة الغذائية الخاصة | https://www.ssniff.com |
توافر الموارد
جهة الاتصال الرئيسية
توفر المواد
توفر البيانات والشيفرة
- تم إيداع مجموعة بيانات تسلسل RNA أحادي الخلية في ArrayExpress برقم الوصول E-MTAB-13581 وهي متاحة للجمهور اعتبارًا من تاريخ النشر. البيانات المولدة في الجداول S1 و S3 و S4 متاحة للتنقيب. سيتم مشاركة بيانات المجهر الواردة في هذه الورقة من قبل جهة الاتصال الرئيسية عند الطلب.
- هذه الورقة لا تقدم كودًا أصليًا.
- أي معلومات إضافية مطلوبة لإعادة تحليل البيانات المبلغ عنها في هذه الورقة العمل متاحة من جهة الاتصال الرئيسية عند الطلب.
تفاصيل النموذج التجريبي وشارك الدراسة
خطوط الفأر
الأجنة البشرية
تفاصيل الطريقة
إعادة تحليل النسخ الجيني
إعادة تحليل بيانات تسلسل RNA أحادي الخلية
تحليل التعبير التفاضلي
تحليل إثراء مجموعة الجينات
تحليل النسخ الجيني في الشهادات والطفرات Spp1 تسلسل RNA أحادي الخلية كامل النسخ باستخدام Rhapsody
محاذاة ومعالجة مسبقة لبيانات تسلسل RNA أحادي الخلية
معالجة وتحليل بيانات تسلسل RNA أحادي الخلية
نقص الخلايا الدبقية الصغيرة
تنشيط المناعة الأمومية
التلوين المناعي النسيجي على الشرائح
تنظيف الأنسجة
تحضير الأنسجة لميكروسكوب الإلكترون الناقل (TEM)
فحوصات الرنين المغناطيسي
تحفيز آفات قشرية داخل الرحم
كما هو معتاد في عملية التحفيز الكهربائي داخل الرحم أو العدوى الفيروسية.
اختبار البلعمة خارج الجسم
تحضير شرائح الدماغ والتسجيلات الكهربية الفسيولوجية
اكتساب الصورة وتحليلها
تصوير الشرائح
تصوير ومعالجة iDISCO ثلاثي الأبعاد
تصوير ثلاثي الأبعاد ومعالجة صبغة الخلايا الدبقية الصغيرة وصبغة الفيبروكتين 1
تصوير المجهر الإلكتروني الناقل (TEM)
القياس والتحليل الإحصائي
مقالة الخلايا
خلية
مقالة
الرسوم التوضيحية التكميلية
خلية
مقالة
مقالة خلوية
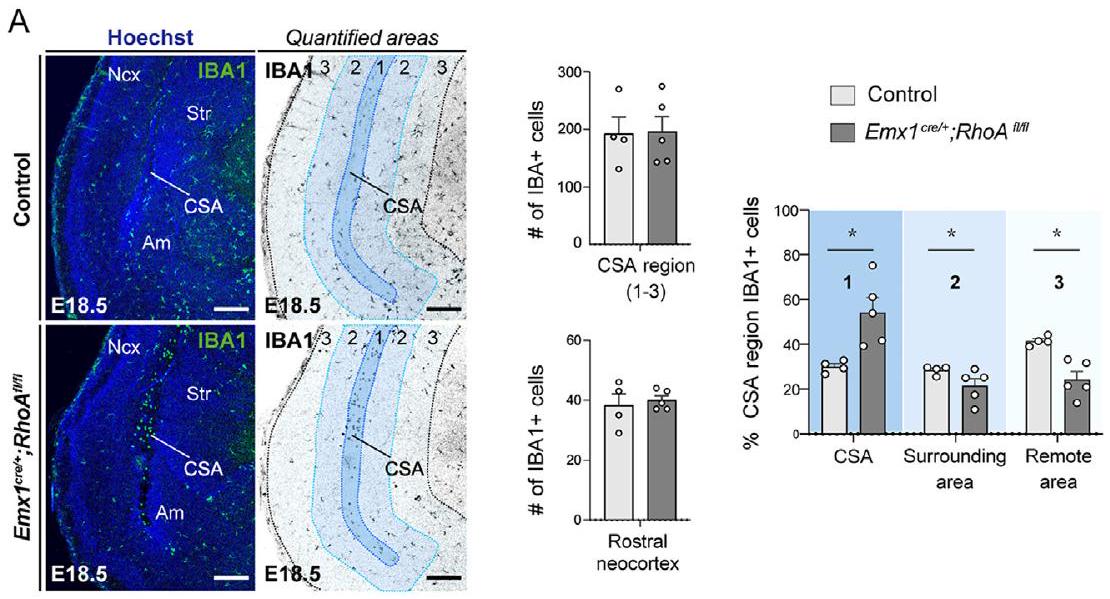
تظهر علامات IBA1 المناعية في المقاطع التاجية توزيع الخلايا الدبقية الصغيرة في المجموعة الضابطة و
(ب) قياسات خلايا IBA1+ في جميع منطقة CSA، القشرة الجديدة الأمامية وداخل المناطق الفرعية لـ CSA (1-3).
تظهر الرسوم البيانية المتوسطات
أم، اللوزة الدماغية؛ CSA، حدود القشرة المخية-المخططية-اللوزية؛ Ncx، القشرة الجديدة؛ Str، المخطط.
مقالة خلوية
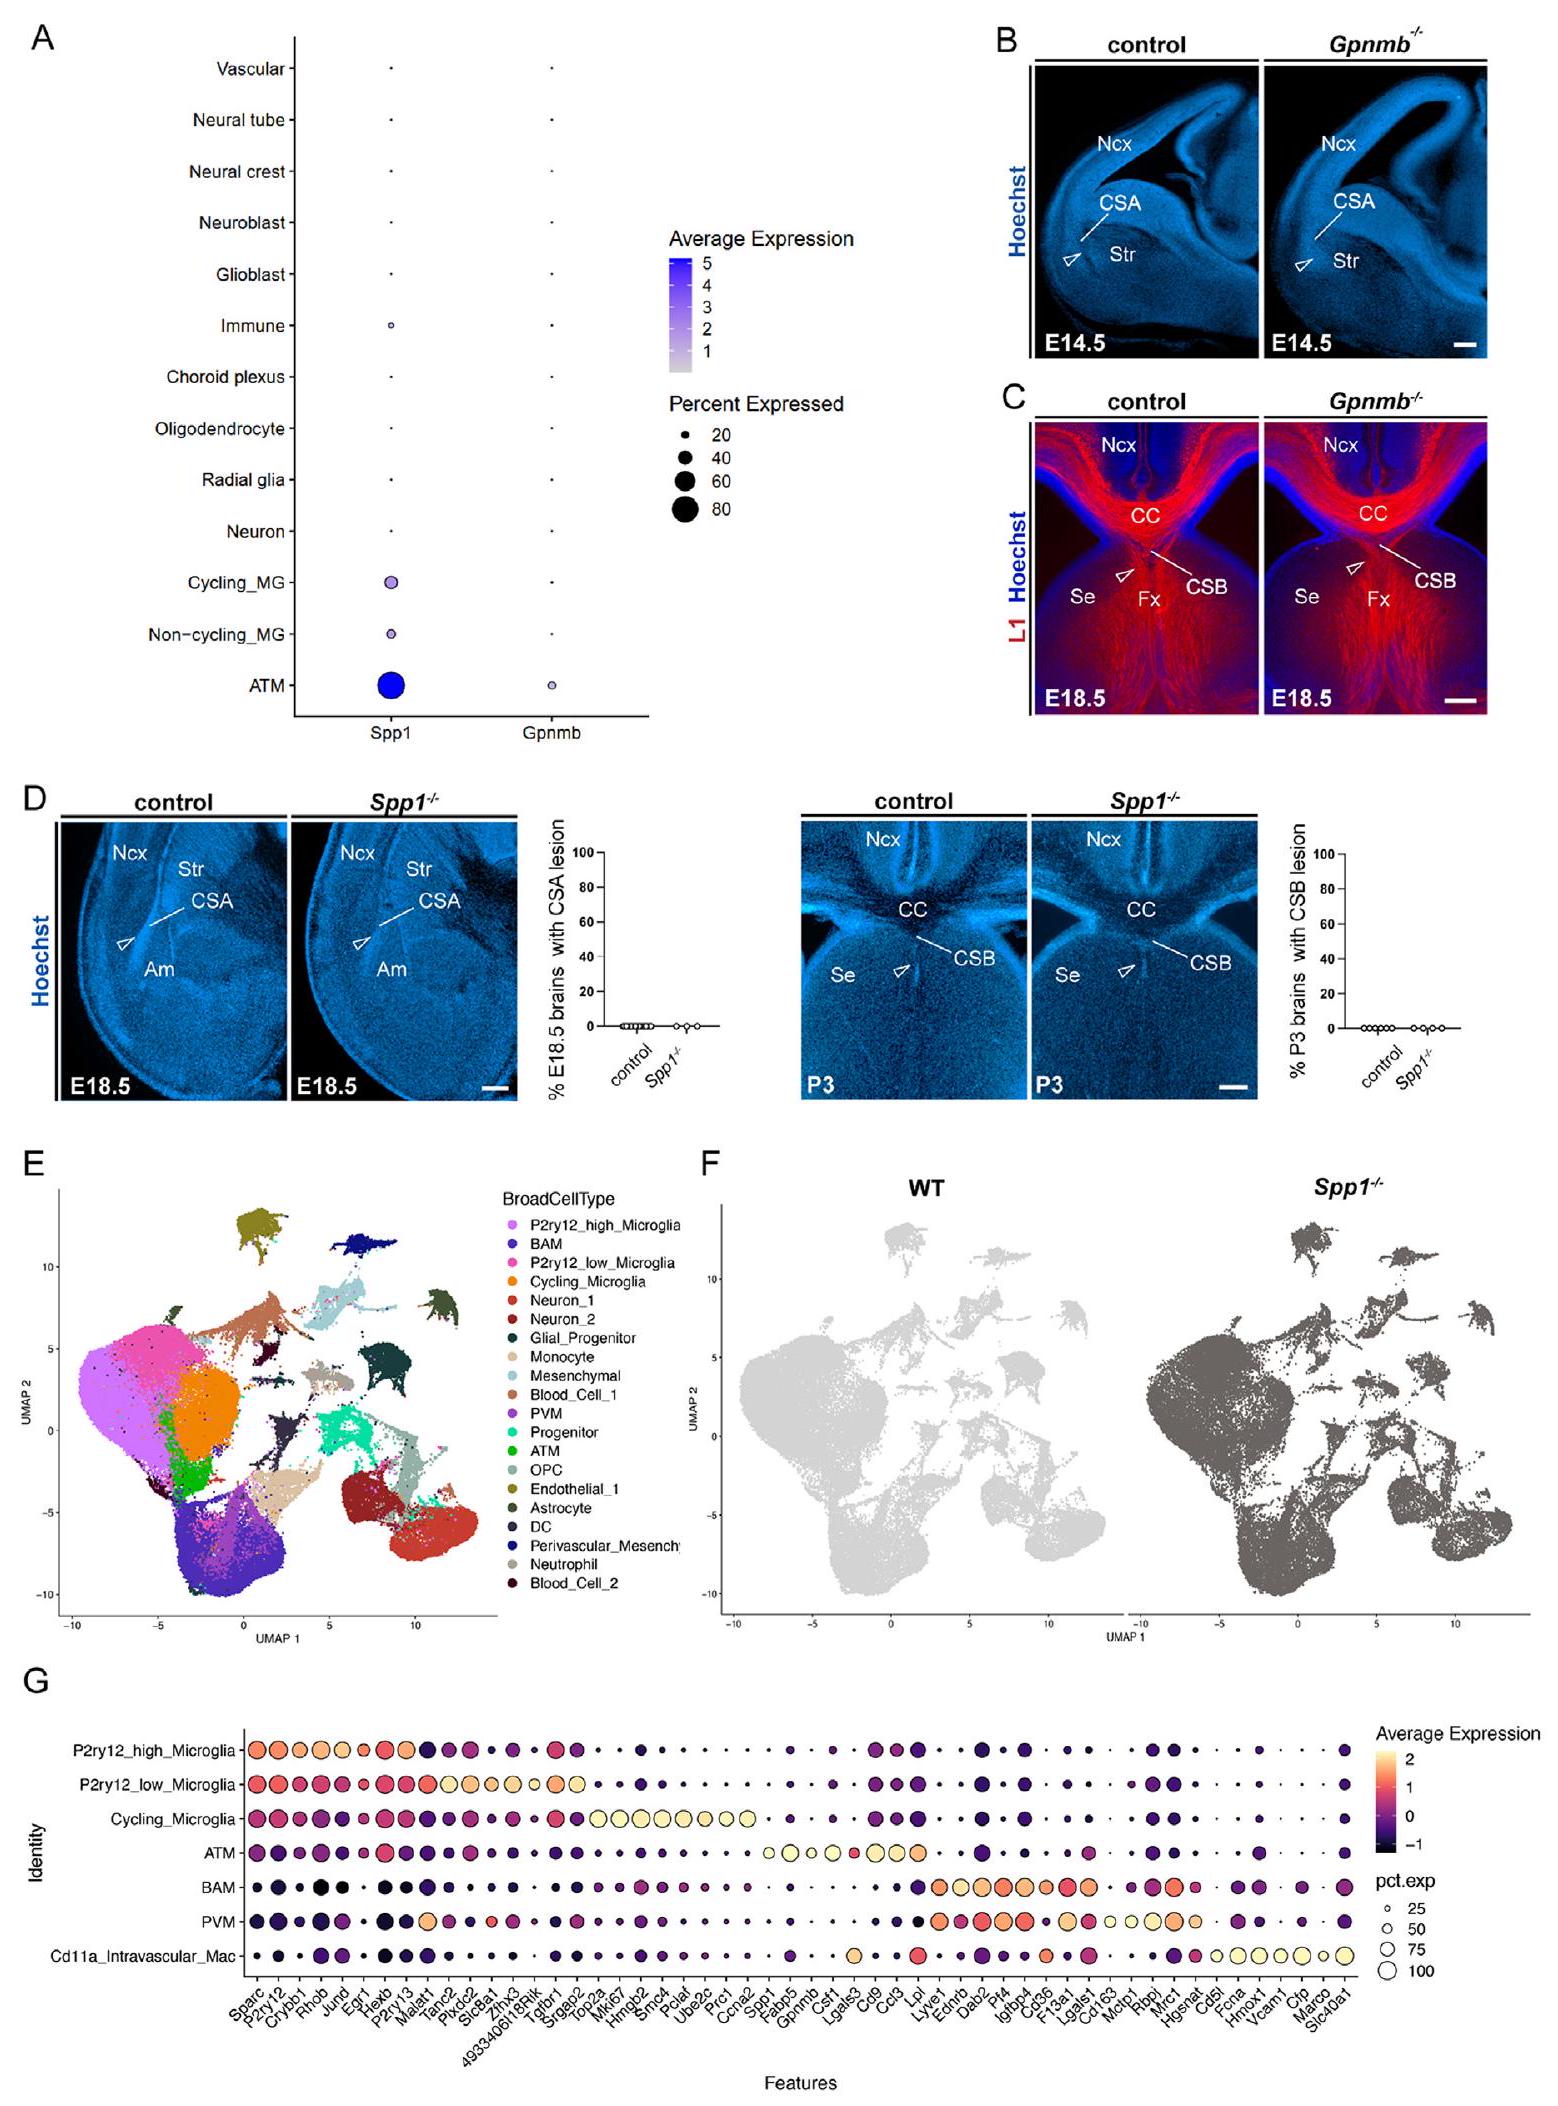
(أ) رسم نقطي يوضح مستوى التعبير المتوسط لـ Spp1 و Gpnmb في أنواع خلايا مختلفة من La Manno وآخرون.
(ب) E14.5 نصف مقطع كورونالي ملون بصبغة هوشت، يظهر سلامة CSA في الفئران الضابطة و Gpnmb
(C) تمييز المناعية L1 يظهر سلامة CSB في الفئران الضابطة و Gpnmb
(د) آفات CSA و CSB في الطفرات Spp1-/- مؤقتة وقد تم امتصاصها، على التوالي، بحلول E18.5
تصوير UMAP لجميع الخلايا المرتبة (من الأجنة البرية [WT] و Spp1-/- في عمر 14.5 و 18.5 يومًا) ملونة حسب المجموعات المعلنة (نوع الخلية العريض).
(F) خريطة UMAP لجميع الخلايا المرتبة مقسمة وملونة حسب ظروف WT (رمادي فاتح) و Spp1-/- (رمادي داكن).
(G) رسم نقطي للتعبير المتوسط المقاس ونسبة أعلى 5 جينات معبرة بشكل مختلف (DEGs) حسب مجموعات البلعميات المعلنة (RefinedCellType). شريط القياس،
ATM، الميكروغليا المرتبطة بالألياف المحورية؛ BAM، البلعميات المرتبطة بالحدود؛ CC، الجسم الجاسئ؛ CSA، حدود القشرة المخية-المخططة-اللوزية؛ CSB، حدود القشرة-الحاجز؛ Fx، الحُصين؛ Ncx، القشرة الجديدة؛ MG، الميكروغليا؛ PVM، البلعميات المحيطية للأوعية؛ Se، الحاجز؛ Str، المخطط؛ WT، النوع البري.
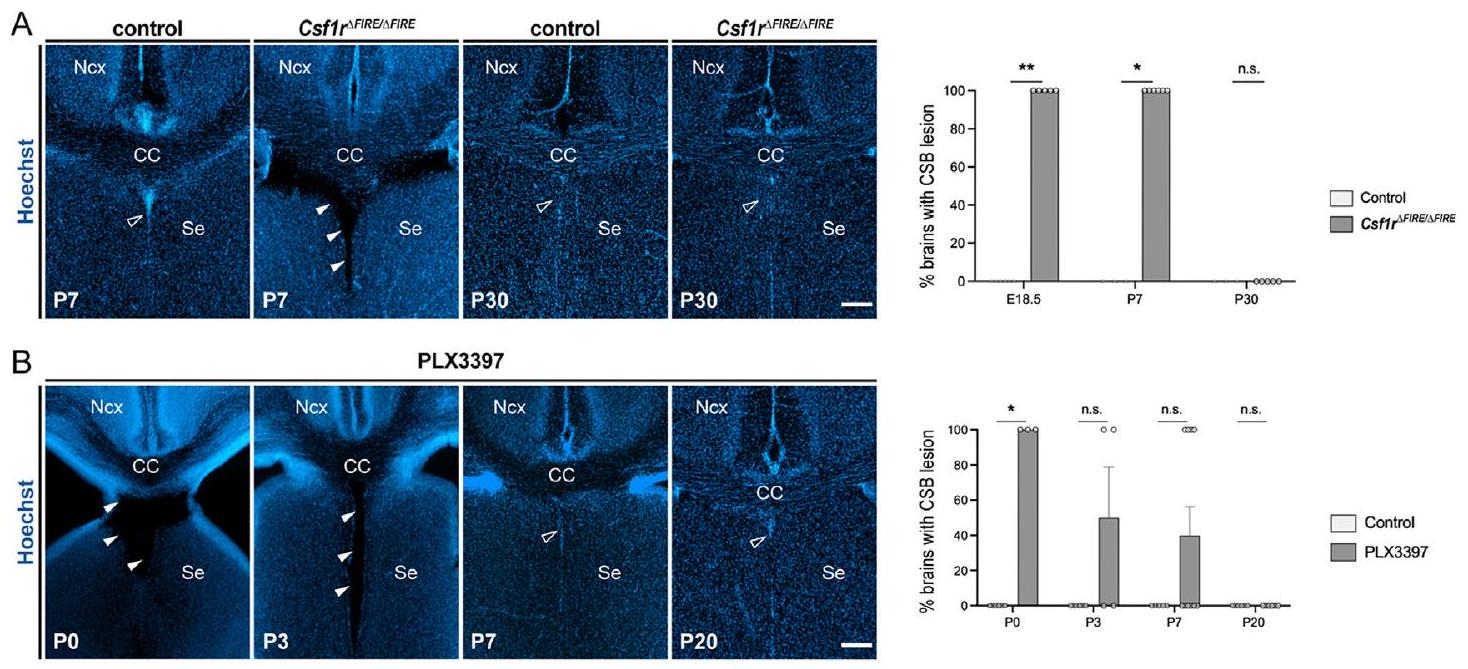
(أ) مقاطع كورونالية ملونة بعكس باستخدام هوشت تظهر منطقة CSB في Csf1r
(ب) مقاطع كورونالية تظهر منطقة CSB (رؤوس الأسهم المفتوحة) في الجراء المعرضة مسبقًا لـ PLX3397 في P0 وP3 وP7 وP20. تم امتصاص الآفات التجويفية (رؤوس الأسهم الصلبة) بشكل تدريجي خلال الأسبوع الأول بعد الولادة، مع جدول زمني مشابه لـ CSA.
تظهر الرسوم البيانية النسب المئوية للدماغ مع الآفات، لكن النقاط الفردية تمثل أدمغة بها آفة (100) أو بدون آفة (0) لتوضيح التباين. تم إجراء اختبار فيشر الدقيق للمقارنة الإحصائية.
CC، الجسم الثفني؛ Ncx، القشرة الجديدة؛ Se، الحاجز.
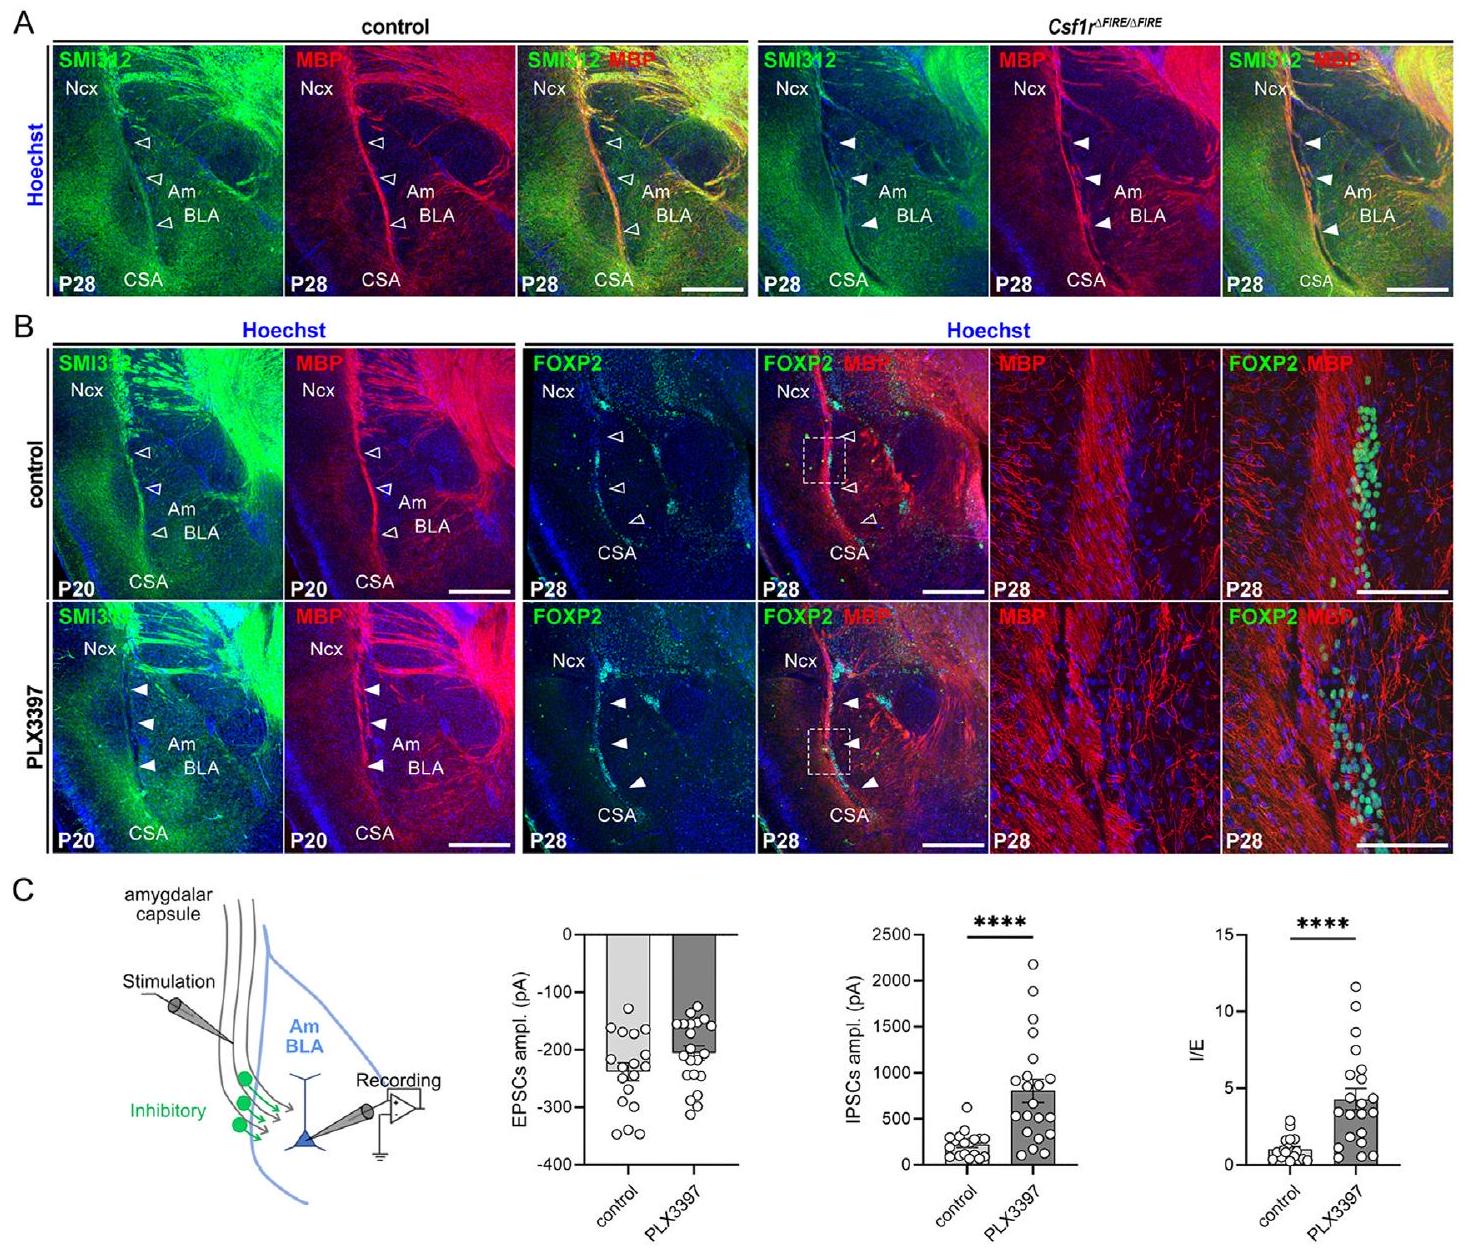
(أ) مقاطع نصفية تاجية من 28 دماغًا ملونة بمؤشر الألياف العصبية الشامل SMI-312 وبروتين المايلين الأساسي (MBP) وHoechst تكشف عن تغييرات في منطقة CSA في Csf1r
(ب) تظهر مقاطع نصفية من أدمغة الفئران تم تلطيخها مناعياً باستخدام علامة الألياف العصبية المحورية SMI-312 وبروتين المايلين الأساسي (MBP) (يسار) أو باستخدام MBP و FOXP2 (يمين) تغييرات في منطقة CSA للفئران المعرضة قبل الولادة لـ PLX3397 (رؤوس الأسهم الصلبة) مقارنةً بالمجموعة الضابطة (رؤوس الأسهم المفتوحة). إن المسارات المحورية للكبسولة اللوزية والخلية العصبية المثبطة الإيجابية لـ FOXP2 غير منظمة، مما يبرز العواقب الشكلية طويلة الأمد لغياب الميكروغليا المبكر وآفات CSA المؤقتة.
(C) تمثيل تخطيطي للنهج التجريبي (يسار) المستخدم لتسجيل كل من التيارات ما بعد المشبكية المثيرة (EPSCs) والتيارات ما بعد المشبكية المثبطة (IPSCs) من خلايا هرمية في اللوزة الدماغية استجابةً لتحفيز الكبسولة اللوزية. من المهم أن تحفيز الكبسولة اللوزية تم تصميمه لتحفيز EPSCs بجهد يتراوح بين -150 و -350 pA في كل من الطفرات الجينية والفئران المعرضة لـ PLX3397 قبل الولادة، وتم قياس IPSCs لاحقًا عن طريق تغيير الجهد الثابت لتقييم نسبة التثبيط/الإثارة (I/E). تظهر سعة EPSCs وIPSCs ونسبة I/E (يمين) توازنًا متغيرًا في الأجنة المعرضة لـ PLX3397، مقارنةً بالضوابط عند P60.
مقاييس الرسم،
أم، اللوزة الدماغية؛ أمبل، السعة؛ BLA، النواة القاعدية الجانبية من اللوزة الدماغية؛ CSA، حدود القشرة-المخيخ-اللوزة؛ EPSCs، تيارات ما بعد المشبك المثيرة؛ I/E، نسبة التثبيط/الإثارة؛ IPSCs، تيارات ما بعد المشبك المثبطة؛ Ncx، القشرة الجديدة.
خلية
مقالة
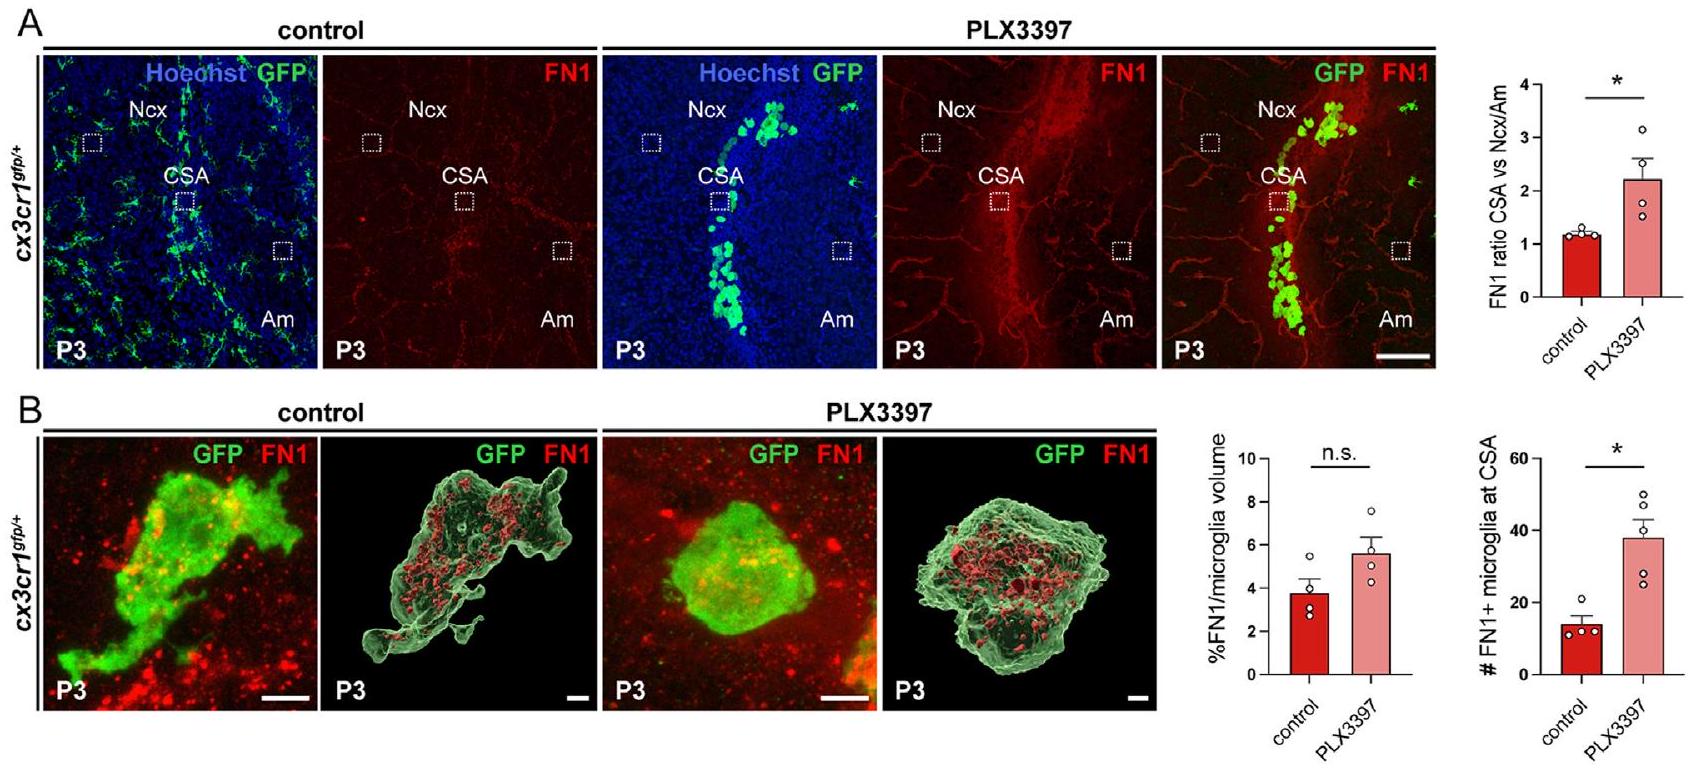
(أ) إشارة الفيبروكتين 1 (FN1) بعد صبغة المناعة تتجمع عند CSA P 3 القابض في Cx3cr1
(ب) تكبير عالي وإعادة بناء ثلاثية الأبعاد لميكروغليا CSA المحددة كـ Cx3cr1
أم، اللوزة الدماغية؛ CSA، حدود القشرة المخية-المخططية-اللوزية؛ Ncx، القشرة الجديدة.
- الشكل 2. الخلايا الدبقية الصغيرة ضرورية لسلامة الأنسجة في CSA و CSB الجنيني
(أ) صبغة هوكست لشرائح الدماغ نصفية التاج من الأجنة في عمر E14.5 أو E15.5، تظهر سلامة CSA في الشهادات (سهم مفتوح) وآفات تجويفية في غياب الخلايا الدبقية الصغيرة (أسهم صلبة)); ومن الأجنة E18.5، تظهر توطين آفات التجاويف CSA، المحاذية للقشرة الجديدة (Ncx)، والسترياتوم (Str)، واللوزة (Am) ( ١١، ).
(ب) تلوين L1 المناعي يلون الجسم الثفني (CC) والقرن (Fx)، مما يبرز سلامة CSB في الضوابط (رؤوس الأسهم المفتوحة) والآفات التجويفية (رؤوس الأسهم الصلبة) في نماذج مختلفة تعطل استعمار الخلايا الدبقية.).
(C) إعادة بناء التجويف (باللون الأصفر) بعد تنظيف نصف الدماغ بالكامل باستخدام iDISCO، مما يبرز غياب التجاويف في العينات الضابطة والتجاويف الموجودة بشكل نمطي في نموذجين من النقص.وتمكين القياس الثلاثي الأبعاد لحجوم الآفات (برنامج إيماريس).
(د) صور الرنين المغناطيسي للدماغ بالكامل لفئران E15.5 أو P0، تظهر إشارات منخفضة الكثافة تؤكد تشكيل آفات في منطقة CSA للأجنة المعالجة بـ PLX3397 (رؤوس الأسهم الصفراء المملوءة) بالمقارنة مع الشهادات (رؤوس الأسهم الصفراء المفتوحة) ().
(E) صور الرنين المغناطيسي للدماغ بالكامل لفئران E15.5 أو E18.5، تظهر إشارات منخفضة الكثافة تؤكد تشكيل آفات في منطقة CSA من Csf1rالأجنة (رؤوس الأسهم الصلبة الصفراء) بالمقارنة مع الضوابط (رؤوس الأسهم المفتوحة الصفراء؛ ).
(F) صور الرنين المغناطيسي للدماغ بالكامل لفئران E18.5، تظهر إشارات منخفضة الكثافة تؤكد تشكيل آفات في CSB لـ Csf1rالأجنة (رؤوس الأسهم الصلبة الصفراء) بالمقارنة مع الشواهد (رؤوس الأسهم المفتوحة الصفراء) ).
تظهر الرسوم البيانية المتوسطاتSEM. مان-ويتني تم إجراء اختبارات للمقارنة الإحصائية، **ص < 0.01. شريط القياس: في (أ) و (ب)؛ في (C)؛ و .
أم، اللوزة؛ CC، الجسم الثفني؛ CSA، حدود القشرة-المخاطية-اللوزية؛ CSB، حدود القشرة-الحاجز؛ Fx، الحُصين؛ Ncx، القشرة الجديدة؛ OB، البصلة الشمية؛ Se، الحاجز؛ Str، العقدة.
انظر أيضًا الشكل S2 ومقاطع الفيديو S1-S4. - (C و D) E14.5 (C) و E18.5 (D) مقاطع نصفية إكليلية تظهر عدم وجود اختلافات في الميكروغليا التي تعبر عن Mac2 و GPNMB في CSA و CSB من الضوابط (سهام مفتوحة) والأجنة Spp1-/- (
، في كل مرحلة من مرحلتين على الأقل من سلالتين متميزتين).
تصوير UMAP لبيانات تسلسل RNA أحادي الخلية (scRNA-seq) التي تمثل مجموعات الماكروفاج المستخرجة من الأجنة البرية (WT) و Spp1-/- في مراحل E14.5 و E18.5 ملونة حسب المجموعات المعلنة (RefinedCellType).
رسم بياني على شكل كمان يعرض تعبير Spp1 المعاير والمقاس عبر المجموعات المعلنة بين الفئران من النوع البري (WT) (رمادي فاتح) وSpp1-/- (KO) (رمادي داكن) مما يظهر أن تعبير Spp1 مقصور إلى حد كبير على ATM من النوع البري (المجموعة 5).
مخطط البركان للجينات المعبر عنها بشكل مختلف (DEGs) بين ظروف WT و Spp1-/- في خلايا ATM (معدل الاكتشاف الخاطئ [FDR] المعدلوالمتوسط_ تظهر الجينات التي تم تقليل تعبيرها في الأجنة Spp1-/- باللون البرتقالي، بينما تظهر الجينات التي تم زيادة تعبيرها باللون الأخضر، وتمت إضافة بعض الجينات يدويًا.
(H) مخططات الأعمدة لتغنيت مجموعة الجينات في Metascape للـ DEGs (G) في كل من ظروف WT أو Spp1-/-, مع تسليط الضوء على المسارات المرتفعة (باللون الأخضر) والمخفضة (باللون البرتقالي) في الأجنة Spp1-/- مقابل الضوابط، مع تسليط الضوء على المسارات المتعلقة بالبلعمة بواسطة رأس سهم أحمر.
(I) مقاطع دماغية من E15 Cx3cr1فئران تظهر وسمًا محددًا للفبرونيكتين 1 (FN1) داخل الميكروغليا ATM الإيجابية لـ GFP و Mac2 في CSA (تمت على مقاطع دماغية من ثلاثة فئران على الأقل من ولادتين مختلفتين).
(ج) الحصول على صور مجهرية عالية التكبير وإعادة بناء ثلاثية الأبعاد للخلايا (برنامج إيماريس) من مقاطع معلمة مناعياً من أدمغة الأجنة في عمر 14.5 يومًا تظهر Cx3cr1-الخلايا الدبقية الصغيرة الإيجابية لـ CSA مع إشارة FN1 داخل أجسام الخلايا (تمت على مقاطع دماغية من ثلاثة فئران على الأقل من ولادتين مختلفتين).
(ك) مقارنة نسبة حجم FN1 المقاس (برنامج إيماريس) داخل الميكروغليا الفردية تظهر انخفاضًا في طفرات Spp1 مقارنةً بالتحكمات، من على الأقل اثنين من القمامات المتميزة).
تظهر الرسوم البيانية النسب فيو ويعني تم إجراء اختبار فيشر الدقيق لمقارنة توزيعات الحالات التي تحتوي على آفات في الضوابط، والأجنة المعرضة لـ Spp1-/- و PLX3397 (A و B)، وتم إجراء اختبارات مان-ويتني U للمقارنة الإحصائية في جميع الرسوم البيانية الأخرى. ; غير ذي دلالة ). قضبان القياس: (A، B تكبير منخفض، و D)؛ (C و F) ; (ج، يسار)؛ و (خلايا معاد بناؤها ثلاثية الأبعاد في F و G).
ATM، الميكروغليا المرتبطة بالألياف المحورية؛ BAM، البلعميات المرتبطة بالحدود؛ CC، الجسم الجاسئ؛ CSA، حدود القشرة المخية-المخططية-اللوزة؛ CSB، حدود القشرة-الحاجز؛ DEGs، الجينات المعبر عنها بشكل مختلف؛ Fx، الحُصين؛ Intravasc mac، البلعميات الوعائية؛ Ncx، القشرة الجديدة؛ PVM، البلعميات المحيطية للأوعية؛ Se، الحاجز؛ Str، المخطط؛ WT، النوع البري.
انظر أيضًا الشكل S4 والجداول S3-S6. - الشكل S1. تشبه خلايا ATM الشبيهة بالجنين خلايا ATM بعد الولادة، المتعلقة بالشكل 1
(أ) رسم نقطي يوضح مستويات التعبير النسبية لجينات ATM الأساسية في الخلايا الدبقية الشبيهة بـ ATM في الأجنة مقارنة بالخلايا الدبقية غير المتكررة أو المتكررة في مجموعة بيانات تسلسل RNA أحادي الخلية La Manno.يمثل اللون مستوى التعبير الطبيعي عبر جميع الخلايا داخل مجموعة، بينما تشير حجم النقطة إلى نسبة الخلايا التي تعبر عن كل جين في تلك المجموعة.
(ب) إسقاط توقيع PAM بعد الولادة من مجموعة بيانات Liعلى مخطط UMAP من الشكل 1A الذي يظهر خلايا شبيهة بـ ATM جنينية.
(C) مخطط فين يبرز التداخل بين الجينات المعبر عنها بشكل مختلف (DEGs) في دماغ الجنين ATM التي تم تحديدها في مجموعة بيانات لا مانو،الصندوق الآلي بعد الولادة في مجموعة بيانات هاموند، وما بعد الولادة PAM في مجموعة بيانات Li.
(د) رسم بياني tSNE المعاد إنتاجه لـ 76,149 خلية تم تمييزها بواسطة scRNA-seq في مجموعة بيانات لا مانو.
(E و F) إسقاطات توقيع ATM الجنيني المحدد في مجموعة بيانات لا مانووتوقيع PAM المحدد في مجموعة بيانات Li ، مما يظهر التداخل مع مجموعة أجهزة الصراف الآلي هاموند 4.
(G) تكبير منخفض لشرائح الدماغ من الفئران الجنينية في E15.0 و E18.5 يظهر تراكمات من الميكروغليا التي تعبر عن SPP1، والتي تم تحديدها على أنها Cx3cr1الخلايا البرانشيمية الإيجابية لـ IBA1 أو الإيجابية، مقصورة على CSA و CSB.
(H) وسم المناعة لشريحة دماغ الجنين E15.0 CD11c-EYFP تظهر الميكروغليا الإيجابية لـ IBA1 التي تعبر عن YFP) وعلامة الصراف الآلي CLEC7A ( ) في CSA.
(I) مقارنة تعبير علامة ATM بين الخلايا الدبقية الصغيرة الموجودة في القشرة الجديدة و CSA في E15.0 CD11c-EYFP و Cx3cr1-أدمغة إيجابية، تظهر أمثلة على CSA والمناطق القشرية الجديدة المستخدمة للتquantification؛ تم إجراء وسم المناعية على مقاطع الدماغ من 3 فئران على الأقل من 2 من سلالات مختلفة.
(J) تم إجراء اختبار pHrodo على شرائح الدماغ خارج الجسم (على الأقلمن 2 فضلات متميزة) تظهر تلوينًا مكثفًا في الخلايا الدبقية الصغيرة في CSA عند E14.5.
(ك) وسم المناعة لـ CD68 يظهر تصبغًا كثيفًا داخل الخلايا الدبقية الصغيرة CSA في E14.5 في ظروف فسيولوجية ومقارنة بين متوسط تغطية CD68 للخلايا الدبقية المتفرعة السلبية لـ SPP1 والخلايا الدبقية الصغيرة CSA الإيجابية لـ SPP1.خلايا في 4 فئران من 2 من سلالات مختلفة).
(L) وسم المناعة لشرائح الدماغ العرضية البشرية GW9 و GW14 تظهر التعبير المشترك لعلامات ATM مع IBA1 في CSA.الرسوم البيانية (تعبير علامات ATM وتغطية CD68) تظهر المتوسطاتتم إجراء اختبار مان-ويتني U للمقارنة الإحصائية، ; شريط المقياس: في (G يسار) و (L يمين)؛ في (G، اليمين)؛ في (I)-(K)؛ في (H); في (L، أعلى اليسار)؛ و في (L، أسفل اليسار).
ATM، الميكروغليا المرتبطة بالألياف المحورية؛ CC، الجسم الثفني؛ CSA، حدود القشرة القشرية-المخططية-اللوزة؛ DEGs، الجينات المعبر عنها بشكل مختلف؛ GW، أسبوع الحمل؛ MG، الميكروغليا؛ Ncx، القشرة الجديدة؛ PAM، الميكروغليا المرتبطة بالمنطقة التكاثرية؛ Se، الحاجز؛ Str، المخطط. - الشكل S2. نماذج استنفاد البلعميات والتغير الوظيفي، المتعلقة بالشكل 2
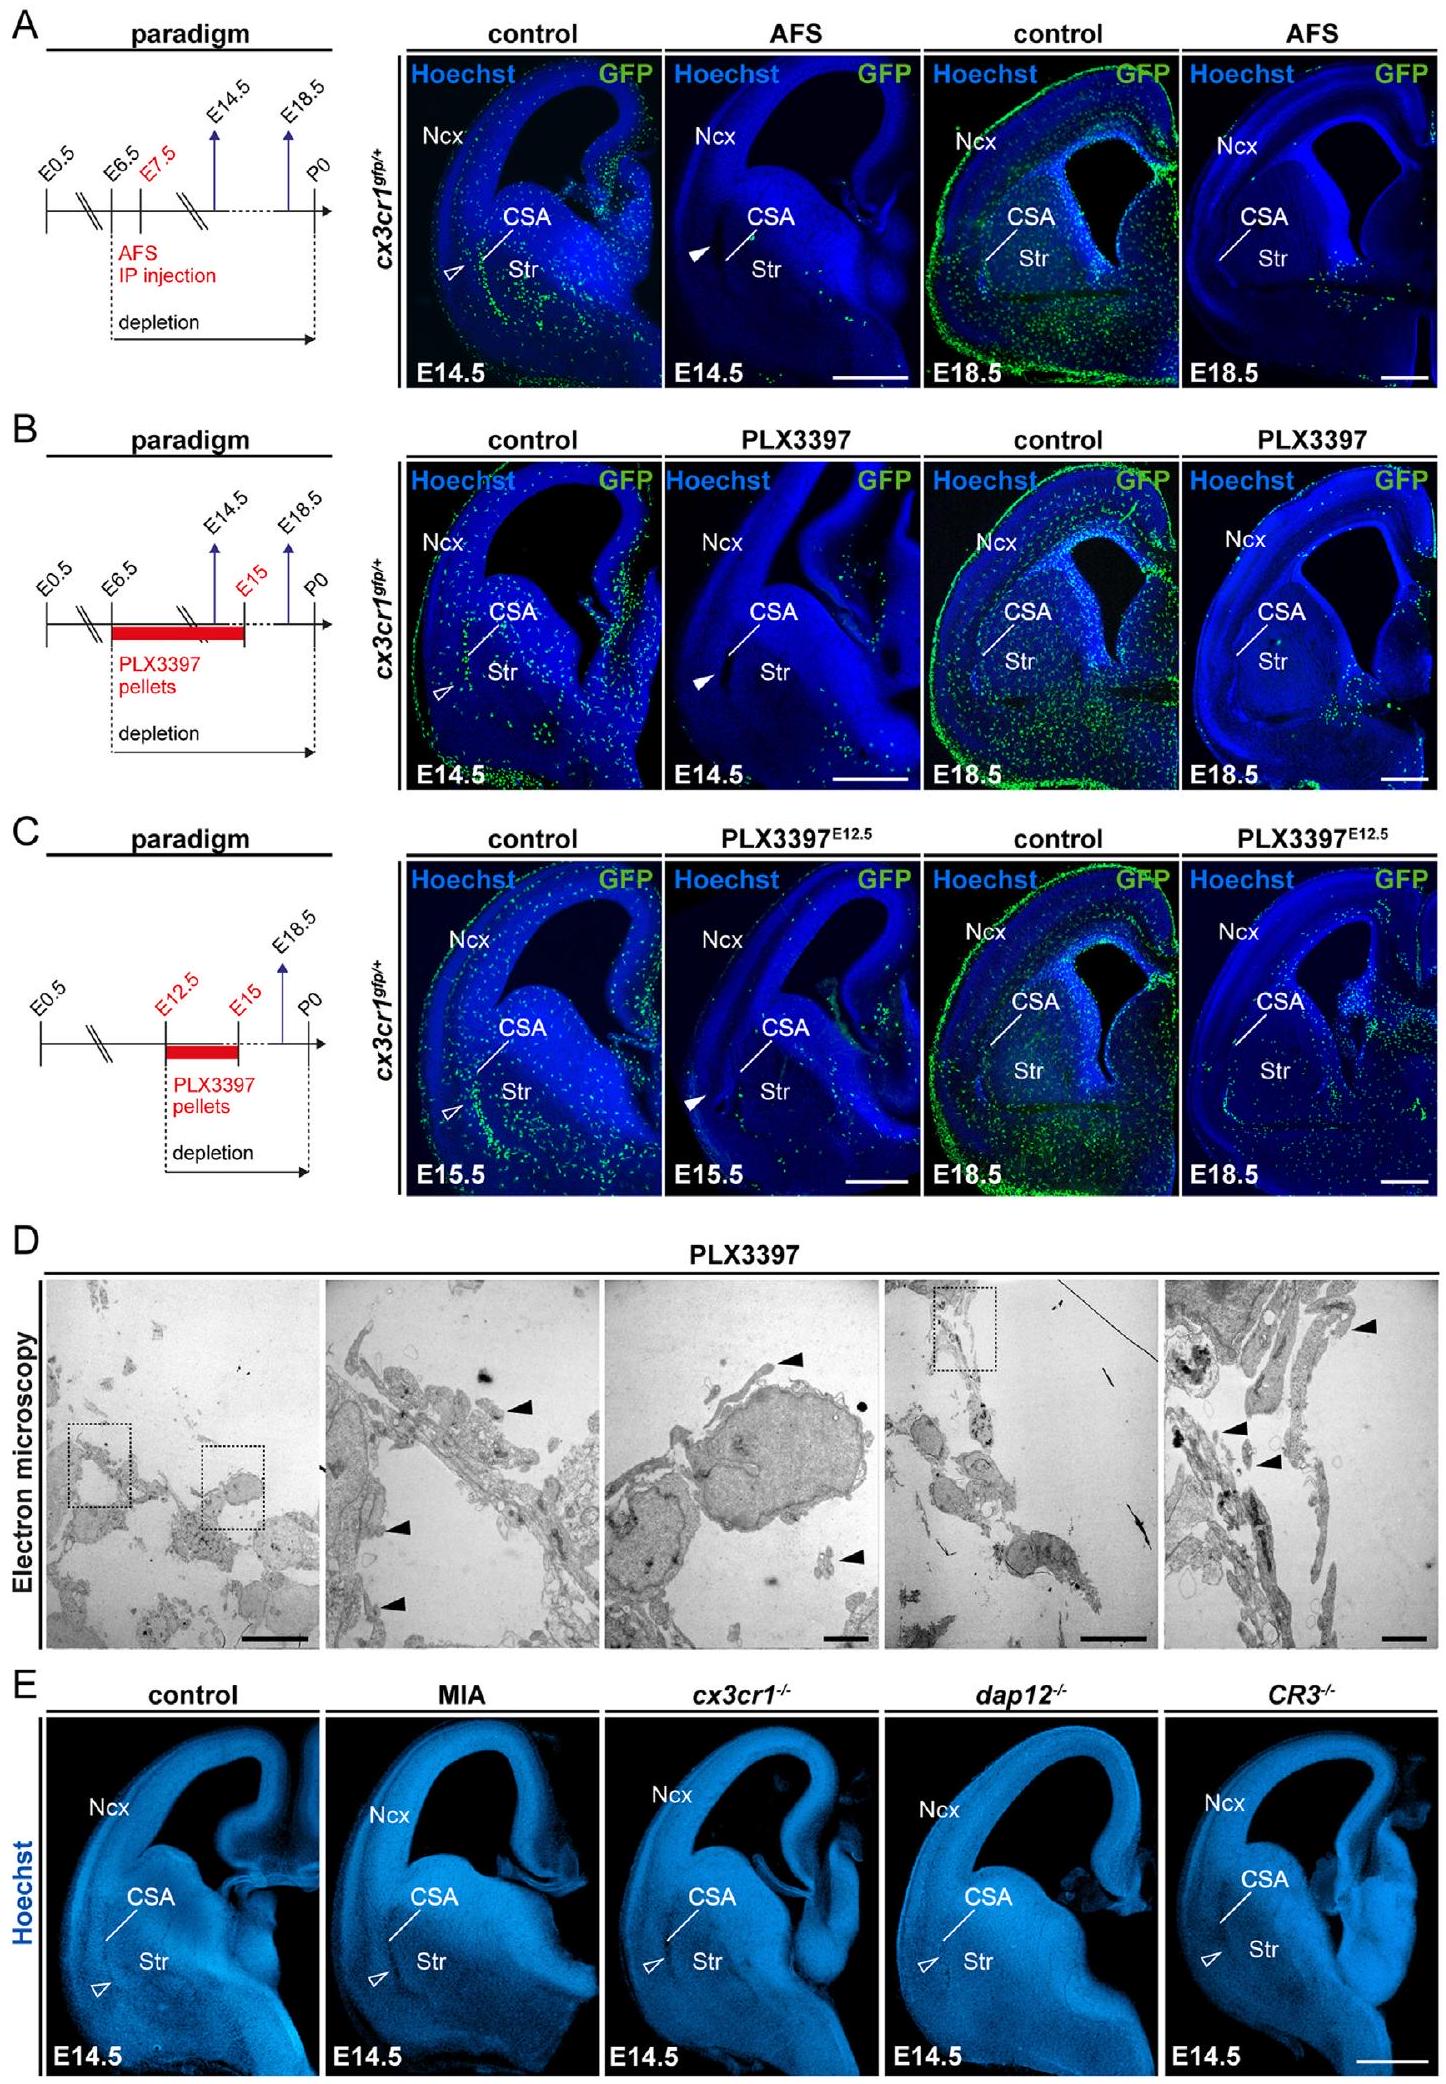
(A-C) تأكيد استنفاد الميكروغليا في أدمغة Cx3cr1 الجنينيةالفئران في E14.5 و E18.5، حيث تم تعريض الأمهات الحوامل لـ (A) حقن داخل البطن لجسم مضاد مثبط لـ CSF1R (AFS) في E6.5 و E7.5 (E14.5، ); (B) التغذية بـ PLX3397، وهو مثبط دوائي لمسار CSF1R، من E6.5 إلى E15.0 (E14.5، ; E18.5، ); و (C) التغذية بـ PLX3397 من E12.5 إلى E15.0 (E15.5، تشير رؤوس الأسهم المفتوحة والصلبة إلى تراكم خلايا إيجابية GFP في CSA وآفة الأنسجة المحلية في CSA في غياب خلايا إيجابية GFP، على التوالي.
(د) صورة مجهر إلكتروني ناقل لآفة CSA في دماغ الأجنة في عمر E14.5 من الأمهات المعالجات بـ PLX3397، تظهر وجود حطام خلوي (رؤوس الأسهم الصلبة) ولكن غياب الغشاء القاعدي.).
(هـ) مقاطع كورونالية عبر نصف دماغ الأجنة E14.5 من الفئران البرية؛ تلك المعرضة لتنشيط المناعة الأمومية الخفيف (MIA)؛ وCx3cr1-/-, Dap12/ Tyro, و الأجنة الطافرة التي تظهر غياب آفات CSA (رؤوس الأسهم المفتوحة) (على الأقل لكل حالة).
أشرطة القياس:في (A)-(C)، و(E)؛ في (D، تكبير منخفض)؛ و في (D، تكبير عالي).
CSA، حدود القشرة القشرية-المخططية-اللوزة؛ Ncx، القشرة الجديدة؛ Str، المخطط.
DOI: https://doi.org/10.1016/j.cell.2024.01.012
PMID: https://pubmed.ncbi.nlm.nih.gov/38309258
Publication Date: 2024-02-01
Cell
Microglia maintain structural integrity during fetal brain morphogenesis
Graphical abstract
Highlights
- Embryonic ATM-like microglia accumulate at key cortical boundaries
- Microglia prevent the formation of cavitary lesions due to morphogenetic stress
- ATM-core factor Spp1 contributes to neuroprotective roles of microglia
- Microglia and Spp1 contribute to the rapid repair of cavitary lesions
Authors
Correspondence
In brief
Microglia maintain structural integrity during fetal brain morphogenesis
Abstract
SUMMARY Microglia (MG), the brain-resident macrophages, play major roles in health and disease via a diversity of cellular states. While embryonic MG display a large heterogeneity of cellular distribution and transcriptomic states, their functions remain poorly characterized. Here, we uncovered a role for MG in the maintenance of structural integrity at two fetal cortical boundaries. At these boundaries between structures that grow in distinct directions, embryonic MG accumulate, display a state resembling post-natal axon-tract-associated microglia (ATM) and prevent the progression of microcavities into large cavitary lesions, in part via a mechanism involving the ATM-factor Spp1. MG and Spp1 furthermore contribute to the rapid repair of lesions, collectively highlighting protective functions that preserve the fetal brain from physiological morphogenetic stress and injury. Our study thus highlights key major roles for embryonic MG and Spp1 in maintaining structural integrity during morphogenesis, with major implications for our understanding of MG functions and brain development.
INTRODUCTION
RESULTS
ATM-like MG accumulate at two embryonic cortical boundaries
MG maintain structural integrity at ATM-dense cortical boundaries
development of myelin, both of which have been associated with post-natal ATM functions. To investigate the potential role of MG in the development of the CSA and CSB, we examined various established and novel models of macrophage and MG depletions by mainly targeting the colony-stimulating factor 1 receptor (CSF1R) signaling pathway, which is required for microglial survival.
(A) Single-cell transcriptomic uniform manifold approximation and projection (UMAP) plot of embryonic microglial cells
(B) Projection of the post-natal ATM signature (top-enriched differentially expressed genes [DEGs]) from the Hammond dataset
(C) Proportion of cycling (orange), non-cycling (purple), and embryonic ATM-like MG (green) at different embryonic stages.
(D) Venn diagram showing the overlap between embryonic and post-natal ATM DEGs, respectively, identified from La Manno
(E) Immunolabeling of brain sections from E14.5 or E15 Cx3cr1
(F) Immunolabeling of coronal brain sections from E18.5 Cx3cr1
Graphs show means
ATM, axon-tract-associated microglia; ATM-like, axon-tract-associated-like microglia; CC, corpus callosum; CSA, cortico-striato-amygdalar boundary; CSB, cortico-septal boundary; DEGs, differentially expressed genes; MG, microglia; Ncx, neocortex; Se, Septum; Str, striatum.
See also Figure S1 and Table S1.
MG limit the formation of cavitary lesions due to morphogenetic stress
(A) IBA1, Spp1, and Mac2 immunostaining findings indicate that ATM line microcavities (solid arrowheads), visible by Hoechst counterstaining at E14.5 (
(B) Transmitted electron microscopy (EM) also reveals the presence of microcavities (solid arrowheads), lined with amoeboid microglia (green pseudo-color), and containing membrane fragments (open arrowheads) (
(C and D) Coronal hemisections (C) from control and
(E) Coronal hemisections of E15.5 brains from Brn4
(F and G) Coronal hemisections (F) of E15. 5 brains from control and Brn4
Graphs show means
Am, amygdala; CSA, cortico-striato-amygdalar boundary; PVNH, periventricular nodular heterotopia; Ncx, neocortex; Str, striatum; Th, thalamus.
See also Figure S3.
ATM-like MG are induced by morphogenetic stress and tissue lesions
ATM-factor Spp1 contributes to structural integrity at cortical boundaries
(A and B) Coronal E18.5 brain hemisections immunostained with IBA1 and Spp1 showing a marked recruitment of Spp1-expressing microglia at the CSA of Emx1
(C and D) Coronal E15.5 brain hemisections immunostained for IBA1 and Spp1 showing a significantly diminished percentage of CSA microglia expressing Spp1 in E15.5 Brn4
(E) Schematic representation of in utero lesion (IUL) procedure induced by mechanical poking of the neocortex using a glass capillary.
(F) Coronal sections through the E14.5 neocortex of control and IUL embryos collected 2.5 h after lesion induction, showing amoeboid Cx3cr1
Graphs show means
(A) Coronal hemisections of E14.5 brains stained with Hoechst reveal CSA disruption in 50% of Spp1-/- mutants (solid arrowheads) compared to controls (open arrowheads) and in
(B) L1 immunolabeling enables axon visualization (open arrowheads) and midline lesions (solid arrowheads) in approximately
MG and Spp1 contribute to the rapid repair of cavitary lesions
ations in adults,
(A) Coronal sections showing the CSA region in controls and Csf1r
( B and C ) Coronal sections of brains prenatally exposed to PLX 3397 showing the CSA region (solid arrowheads) at
(D) Repopulating microglia numbers are comparable at the CSA of controls and PLX3397-exposed embryos at P3, even if microglia numbers remain lower in the surrounding area of resorbing brains (
Fisher’s exact test
Am, amygdala; CSA, cortico-striato-amygdalar boundary; Ncx, neocortex; Str, striatum.
See also Figures S5 and S6.
(A) Cx3cr1
(B) Extracellular Spp1 signal, delineated by immunostaining and Hoechst labeling, accumulates at the resorbing CSA at P3. Graphs show the increased signal intensity at the CSA (dotted lines) compared with a mean between signal intensity measured in the surrounding neocortex (dotted lines) and amygdala (dotted lines) in PLX3397-exposed pups versus controls (
(C) In contrast to controls, Spp1-/- mutants, and PLX3397-exposed controls, PLX3397-exposed Spp1-/- mutants reproducibly displayed lesions visible by Hoechst staining (solid versus open arrowheads) (
(D) While CSA IBA1-positive cells co-expressed Mac2 in resorbed PLX3397-treated controls at P7, they also accumulated around the lesions in PLX3397-treated Spp1 mutants, indicating that Spp1 inactivation did not prevent the expression of selected ATM markers (
Graphs show means
Am, amygdala; CSA, cortico-striato-amygdalar boundary; Ncx, neocortex; Str, striatum.
See also Figure S7.
DISCUSSION
associated with neurodegeneration and tumors.
Limitations of the study
acknowledge several limitations of our research. First, morphogenetic stress was indirectly assessed through genetic manipulations that distort brain morphogenesis. However, we believe that this caveat is compensated by leveraging two models that selectively increase and reduce morphogenetic constraints. Second, it was not possible to conduct local or state-specific manipulations of CSA and CSB MG. Despite several attempts to selectively manipulate this state, we were unable to efficiently and selectively eliminate this transient cell population, as reported for post-natal ATM,
STAR*METHODS
- KEY RESOURCES TABLE
- RESOURCE AVAILABILITY
- Lead contact
- Materials availability
- Data and code availability
- EXPERIMENTAL MODEL AND STUDY PARTICIPANT DETAILS
- Mouse Lines
- Human fetuses
- METHOD DETAILS
- Transcriptomic reanalysis
- Transcriptomic analysis in controls and Spp1 mutants
- Microglial Depletion
- Maternal Immune activation
- Immunohistochemistry on sections
- Tissue Clearing
- Tissue preparation for transmission electron microscopy (TEM)
- MRI scans
- Induction of in utero cortical lesions
- Ex vivo phagocytic assay
- Preparation of brain slices and electrophysiological recordings
- Image acquisition and analysis
- Transmission electron microscopy (TEM) imaging
- QUANTIFICATION AND STATISTICAL ANALYSIS
SUPPLEMENTAL INFORMATION
ACKNOWLEDGMENTS
AUTHOR CONTRIBUTIONS
DECLARATION OF INTERESTS
Revised: September 30, 2023
Accepted: January 10, 2024
Published: February 2, 2024
REFERENCES
- Colonna, M., and Butovsky, O. (2017). Microglia Function in the Central Nervous System During Health and Neurodegeneration. Annu. Rev. Immunol. 35, 441-468.
- Li, Q., and Barres, B.A. (2018). Microglia and macrophages in brain homeostasis and disease. Nat. Rev. Immunol. 18, 225-242.
- Hammond, T.R., Robinton, D., and Stevens, B. (2018). Microglia and the Brain: Complementary Partners in Development and Disease. Annu. Rev. Cell Dev. Biol. 34, 523-544.
- Thion, M.S., Ginhoux, F., and Garel, S. (2018). Microglia and early brain development: An intimate journey. Science 362, 185-189.
- Sierra, A., Paolicelli, R.C., and Kettenmann, H. (2019). Cien Anos de Microglia: Milestones in a Century of Microglial Research. Trends Neurosci. 42, 778-792.
- Prinz, M., Jung, S., and Priller, J. (2019). Microglia Biology: One Century of Evolving Concepts. Cell 179, 292-311.
- Prinz, M., Masuda, T., Wheeler, M.A., and Quintana, F.J. (2021). Microglia and Central Nervous System-Associated Macrophages-From Origin to Disease Modulation. Annu. Rev. Immunol. 39, 251-277.
- Cserép, C., Pósfai, B., and Dénes, Á. (2021). Shaping Neuronal Fate: Functional Heterogeneity of Direct Microglia-Neuron Interactions. Neuron 109, 222-240.
- Badimon, A., Strasburger, H.J., Ayata, P., Chen, X., Nair, A., Ikegami, A., Hwang, P., Chan, A.T., Graves, S.M., Uweru, J.O., et al. (2020). Negative feedback control of neuronal activity by microglia. Nature 586, 417-423.
- McNamara, N.B., Munro, D.A.D., Bestard-Cuche, N., Uyeda, A., Bogie, J.F.J., Hoffmann, A., Holloway, R.K., Molina-Gonzalez, I., Askew, K.E., Mitchell, S., et al. (2023). Microglia regulate central nervous system myelin growth and integrity. Nature 613, 120-129.
- Thion, M.S., Mosser, C.A., Férézou, I., Grisel, P., Baptista, S., Low, D., Ginhoux, F., Garel, S., and Audinat, E. (2019). Biphasic Impact of Prenatal Inflammation and Macrophage Depletion on the Wiring of Neocortical Inhibitory Circuits. Cell Rep. 28, 1119-1126.e4.
- Scott-Hewitt, N., Perrucci, F., Morini, R., Erreni, M., Mahoney, M., Witkowska, A., Carey, A., Faggiani, E., Schuetz, L.T., Mason, S., et al. (2020). Local externalization of phosphatidylserine mediates developmental synaptic pruning by microglia. EMBO J. 39, e105380.
- Favuzzi, E., Huang, S., Saldi, G.A., Binan, L., Ibrahim, L.A., FernándezOtero, M., Cao, Y., Zeine, A., Sefah, A., Zheng, K., et al. (2021). GABAreceptive microglia selectively sculpt developing inhibitory circuits. Cell 184, 5686.
- Cserép, C., Schwarcz, A.D., Pósfai, B., László, Z.I., Kellermayer, A., Környei, Z., Kisfali, M., Nyerges, M., Lele, Z., Katona, I., and Adam, D. (2022). Microglial control of neuronal development via somatic purinergic junctions. Cell Rep. 40, 111369.
- Gallo, N.B., Berisha, A., and Van Aelst, L. (2022). Microglia regulate chandelier cell axo-axonic synaptogenesis. Proc. Natl. Acad. Sci. USA 119, e2114476119.
- Bisht, K., Sharma, K.P., Lecours, C., Sánchez, M.G., El Hajj, H., Milior, G., Olmos-Alonso, A., Gómez-Nicola, D., Luheshi, G., Vallières, L., et al. (2016). Dark microglia: A new phenotype predominantly associated with pathological states. Glia 64, 826-839.
- Krasemann, S., Madore, C., Cialic, R., Baufeld, C., Calcagno, N., El Fatimy, R., Beckers, L., O’Loughlin, E., Xu, Y., Fanek, Z., et al. (2017). The TREM2-APOE Pathway Drives the Transcriptional Phenotype of Dysfunctional Microglia in Neurodegenerative Diseases. Immunity 47, 566-581.e9.
- Keren-Shaul, H., Spinrad, A., Weiner, A., Matcovitch-Natan, O., DvirSzternfeld, R., Ulland, T.K., David, E., Baruch, K., Lara-Astaiso, D., Toth, B., et al. (2017). A Unique Microglia Type Associated with Restricting Development of Alzheimer’s Disease. Cell 169, 1276-1290.e17.
- Deczkowska, A., Keren-Shaul, H., Weiner, A., Colonna, M., Schwartz, M., and Amit, I. (2018). Disease-Associated Microglia: A Universal Immune Sensor of Neurodegeneration. Cell 173, 1073-1081.
- Stratoulias, V., Venero, J.L., Tremblay, M.E., and Joseph, B. (2019). Microglial subtypes: diversity within the microglial community. EMBO J. 38, e101997.
- Li, Q., Cheng, Z., Zhou, L., Darmanis, S., Neff, N.F., Okamoto, J., Gulati, G., Bennett, M.L., Sun, L.O., Clarke, L.E., et al. (2019). Developmental Heterogeneity of Microglia and Brain Myeloid Cells Revealed by Deep Single-Cell RNA Sequencing. Neuron 101, 207-223.e10.
- Hammond, T.R., Dufort, C., Dissing-Olesen, L., Giera, S., Young, A., Wysoker, A., Walker, A.J., Gergits, F., Segel, M., Nemesh, J., et al. (2019). Single-Cell RNA Sequencing of Microglia throughout the Mouse Lifespan and in the Injured Brain Reveals Complex Cell-State Changes. Immunity 50, 253-271.e6.
- Masuda, T., Sankowski, R., Staszewski, O., Böttcher, C., Amann, L., Sagar, S., Scheiwe, C., Nessler, S., Kunz, P., van Loo, G., et al. (2019). Spatial and temporal heterogeneity of mouse and human microglia at sin-gle-cell resolution. Nature 566, 388-392.
- Sala Frigerio, C., Wolfs, L., Fattorelli, N., Thrupp, N., Voytyuk, I., Schmidt, I., Mancuso, R., Chen, W.T., Woodbury, M.E., Srivastava, G., et al. (2019). The Major Risk Factors for Alzheimer’s Disease: Age, Sex, and Genes Modulate the Microglia Response to Abeta Plaques. Cell Rep. 27, 1293-1306.e6.
- Kracht, L., Borggrewe, M., Eskandar, S., Brouwer, N., Chuva de Sousa Lopes, S.M., Laman, J.D., Scherjon, S.A., Prins, J.R., Kooistra, S.M., and Eggen, B.J.L. (2020). Human fetal microglia acquire homeostatic im-mune-sensing properties early in development. Science 369, 530-537.
- Bian, Z., Gong, Y., Huang, T., Lee, C.Z.W., Bian, L., Bai, Z., Shi, H., Zeng, Y., Liu, C., He, J., et al. (2020). Deciphering human macrophage development at single-cell resolution. Nature 582, 571-576.
- Masuda, T., Sankowski, R., Staszewski, O., and Prinz, M. (2020). Microglia Heterogeneity in the Single-Cell Era. Cell Rep. 30, 1271-1281.
- Marschallinger, J., Iram, T., Zardeneta, M., Lee, S.E., Lehallier, B., Haney, M.S., Pluvinage, J.V., Mathur, V., Hahn, O., Morgens, D.W., et al. (2020). Lipid-droplet-accumulating microglia represent a dysfunctional and proinflammatory state in the aging brain. Nat. Neurosci. 23, 194-208.
- Safaiyan, S., Besson-Girard, S., Kaya, T., Cantuti-Castelvetri, L., Liu, L., Ji, H., Schifferer, M., Gouna, G., Usifo, F., Kannaiyan, N., et al. (2021). White matter aging drives microglial diversity. Neuron 109, 11001117.e10.
- La Manno, G., Siletti, K., Furlan, A., Gyllborg, D., Vinsland, E., Mossi Albiach, A., Mattsson Langseth, C., Khven, I., Lederer, A.R., Dratva, L.M., et al. (2021). Molecular architecture of the developing mouse brain. Nature 596, 92-96.
- Silvin, A., Uderhardt, S., Piot, C., Da Mesquita, S., Yang, K., Geirsdottir, L., Mulder, K., Eyal, D., Liu, Z., Bridlance, C., et al. (2022). Dual ontogeny of disease-associated microglia and disease inflammatory macrophages in aging and neurodegeneration. Immunity 55, 1448-1465.e6.
- Stogsdill, J.A., Kim, K., Binan, L., Farhi, S.L., Levin, J.Z., and Arlotta, P. (2022). Pyramidal neuron subtype diversity governs microglia states in the neocortex. Nature 608, 750-756.
- Paolicelli, R.C., Sierra, A., Stevens, B., Tremblay, M.E., Aguzzi, A., Ajami, B., Amit, I., Audinat, E., Bechmann, I., Bennett, M., et al. (2022). Microglia states and nomenclature: A field at its crossroads. Neuron 110, 3458-3483.
- Stratoulias, V., Ruiz, R., Kanatani, S., Osman, A.M., Keane, L., Armengol, J.A., Rodríguez-Moreno, A., Murgoci, A.N., García-Domínguez, I., Alonso-Bellido, I., et al. (2023). ARG1-expressing microglia show a distinct molecular signature and modulate post-natal development and function of the mouse brain. Nat. Neurosci. 26, 1008-1020.
- Dolan, M.J., Therrien, M., Jereb, S., Kamath, T., Gazestani, V., Atkeson, T., Marsh, S.E., Goeva, A., Lojek, N.M., Murphy, S., et al. (2023). Exposure of iPSC-derived human microglia to brain substrates enables the generation and manipulation of diverse transcriptional states in vitro. Nat. Immunol. 24, 1382-1390.
- Park, M.D., Silvin, A., Ginhoux, F., and Merad, M. (2022). Macrophages in health and disease. Cell 185, 4259-4279.
- Thion, M.S., and Garel, S. (2020). Microglial ontogeny, diversity and neurodevelopmental functions. Curr. Opin. Genet. Dev. 65, 186-194.
- Menassa, D.A., Muntslag, T.A.O., Martin-Estebané, M., Barry-Carroll, L., Chapman, M.A., Adorjan, I., Tyler, T., Turnbull, B., Rose-Zerilli, M.J.J., Nicoll, J.A.R., et al. (2022). The spatiotemporal dynamics of microglia across the human lifespan. Dev. Cell 57, 2127-2139.e6.
- Cossart, R., and Garel, S. (2022). Step by step: cells with multiple functions in cortical circuit assembly. Nat. Rev. Neurosci. 23, 395-410.
- Squarzoni, P., Oller, G., Hoeffel, G., Pont-Lezica, L., Rostaing, P., Low, D., Bessis, A., Ginhoux, F., and Garel, S. (2014). Microglia modulate wiring of the embryonic forebrain. Cell Rep. 8, 1271-1279.
- Thion, M.S., and Garel, S. (2017). On place and time: microglia in embryonic and perinatal brain development. Curr. Opin. Neurobiol. 47, 121-130.
- Wlodarczyk, A., Holtman, I.R., Krueger, M., Yogev, N., Bruttger, J., Khorooshi, R., Benmamar-Badel, A., de Boer-Bergsma, J.J., Martin, N.A., Karram, K., et al. (2017). A novel microglial subset plays a key role in myelinogenesis in developing brain. EMBO J. 36, 3292-3308.
- Hagemeyer, N., Hanft, K.M., Akriditou, M.A., Unger, N., Park, E.S., Stanley, E.R., Staszewski, O., Dimou, L., and Prinz, M. (2017). Microglia contribute to normal myelinogenesis and to oligodendrocyte progenitor maintenance during adulthood. Acta Neuropathol. 134, 441-458.
- Ueno, M., Fujita, Y., Tanaka, T., Nakamura, Y., Kikuta, J., Ishii, M., and Yamashita, T. (2013). Layer V cortical neurons require microglial support for survival during post-natal development. Nat. Neurosci. 16, 543-551.
- Nemes-Baran, A.D., White, D.R., and DeSilva, T.M. (2020). FractalkineDependent Microglial Pruning of Viable Oligodendrocyte Progenitor Cells Regulates Myelination. Cell Rep. 32, 108047.
- Hankin, M.H., Schneider, B.F., and Silver, J. (1988). Death of the subcallosal glial sling is correlated with formation of the cavum septi pellucidi. J. Comp. Neurol. 272, 191-202.
- Erblich, B., Zhu, L., Etgen, A.M., Dobrenis, K., and Pollard, J.W. (2011). Absence of colony stimulation factor-1 receptor results in loss of microglia, disrupted brain development and olfactory deficits. PLoS One 6, e26317.
- Pridans, C., Raper, A., Davis, G.M., Alves, J., Sauter, K.A., Lefevre, L., Regan, T., Meek, S., Sutherland, L., Thomson, A.J., et al. (2018). Pleiotropic Impacts of Macrophage and Microglial Deficiency on Development in Rats with Targeted Mutation of the Csf1r Locus. J. Immunol. 201, 2683-2699.
- Hoeffel, G., Wang, Y., Greter, M., See, P., Teo, P., Malleret, B., Leboeuf, M., Low, D., Oller, G., Almeida, F., et al. (2012). Adult Langerhans cells derive predominantly from embryonic fetal liver monocytes with a minor contribution of yolk sac-derived macrophages. J. Exp. Med. 209, 1167-1181.
- Elmore, M.P., Najafi, A.R., Koike, M.A., Dagher, N.N., Spangenberg, E.E., Rice, R.A., Kitazawa, M., Matusow, B., Nguyen, H., West, B.L., and Green, K.N. (2014). Colony-stimulating factor 1 receptor signaling is necessary for microglia viability, unmasking a microglia progenitor cell in the adult brain. Neuron 82, 380-397.
- Green, K.N., Crapser, J.D., and Hohsfield, L.A. (2020). To Kill a Microglia: A Case for CSF1R Inhibitors. Trends Immunol. 41, 771-784.
- Back, J., Dierich, A., Bronn, C., Kastner, P., and Chan, S. (2004). PU. 1 determines the self-renewal capacity of erythroid progenitor cells. Blood 103, 3615-3623.
- Rojo, R., Raper, A., Ozdemir, D.D., Lefevre, L., Grabert, K., WollscheidLengeling, E., Bradford, B., Caruso, M., Gazova, I., Sánchez, A., et al. (2019). Deletion of a Csf1r enhancer selectively impacts CSF1R expression and development of tissue macrophage populations. Nat. Commun. 10, 3215.
- Munro, D.A.D., Bradford, B.M., Mariani, S.A., Hampton, D.W., Vink, C.S., Chandran, S., Hume, D.A., Pridans, C., and Priller, J. (2020). CNS macrophages differentially rely on an intronic Csf1r enhancer for their development. Development 147, dev194449.
- Kiani Shabestari, S., Morabito, S., Danhash, E.P., McQuade, A., Sanchez, J.R., Miyoshi, E., Chadarevian, J.P., Claes, C., Coburn, M.A., Hasselmann, J., et al. (2022). Absence of microglia promotes diverse pathologies and early lethality in Alzheimer’s disease mice. Cell Rep. 39, 110961.
- Esteban, H., Blondiaux, E., Audureau, E., Sileo, C., Moutard, M.L., Gelot, A., Jouannic, J.M., Ducou le Pointe, H., and Garel, C. (2015). Prenatal features of isolated subependymal pseudocysts associated with adverse pregnancy outcome. Ultrasound in Obstet. Gyne. 46, 678-687.
- Belle, M., Godefroy, D., Dominici, C., Heitz-Marchaland, C., Zelina, P., Hellal, F., Bradke, F., and Chédotal, A. (2014). A simple method for 3D analysis of immunolabeled axonal tracts in a transparent nervous system. Cell Rep. 9, 1191-1201.
- Renier, N., Wu, Z., Simon, D.J., Yang, J., Ariel, P., and Tessier-Lavigne, M. (2014). iDISCO: a simple, rapid method to immunolabel large tissue samples for volume imaging. Cell 159, 896-910.
- Kaur, C., and Ling, E.A. (2017). Transitory cystic cavities in the developing mammalian brain – normal or anomalous? J. Anat. 230, 197-202.
- Saito, K., Okamoto, M., Watanabe, Y., Noguchi, N., Nagasaka, A., Nishina, Y., Shinoda, T., Sakakibara, A., and Miyata, T. (2019). Dorsal-toVentral Cortical Expansion Is Physically Primed by Ventral Streaming of Early Embryonic Preplate Neurons. Cell Rep. 29, 1555-1567.e5.
- Van Essen, D.C. (2020). A 2020 view of tension-based cortical morphogenesis. Proc. Natl. Acad. Sci. USA 117, 32868-32879.
- Das, J.M., and Dossani, R.H. (2022). Cavum Septum Pellucidum. In StatPearls (StatPearls Publishing).
- Cappello, S., Böhringer, C.J., Bergami, M., Conzelmann, K.K., Ghanem, A., Tomassy, G.S., Arlotta, P., Mainardi, M., Allegra, M., Caleo, M., et al. (2012). A radial glia-specific role of RhoA in double cortex formation. Neuron 73, 911-924.
- Deck, M., Lokmane, L., Chauvet, S., Mailhes, C., Keita, M., Niquille, M., Yoshida, M., Yoshida, Y., Lebrand, C., Mann, F., et al. (2013). Pathfinding of corticothalamic axons relies on a rendezvous with thalamic projections. Neuron 77, 472-484.
- Liaw, L., Birk, D.E., Ballas, C.B., Whitsitt, J.S., Davidson, J.M., and Hogan, B.L. (1998). Altered wound healing in mice lacking a functional osteopontin gene (spp1). J. Clin. Invest. 101, 1468-1478.
- Rosmus, D.D., Lange, C., Ludwig, F., Ajami, B., and Wieghofer, P. (2022). The Role of Osteopontin in Microglia Biology: Current Concepts and Future Perspectives. Biomedicines 10, 840.
- Shen, X., Qiu, Y., Wight, A.E., Kim, H.J., and Cantor, H. (2022). Definition of a mouse microglial subset that regulates neuronal development and proinflammatory responses in the brain. Proc. Natl. Acad. Sci. USA 119, e2116241119.
- De Schepper, S., Ge, J.Z., Crowley, G., Ferreira, L.S.S., Garceau, D., Toomey, C.E., Sokolova, D., Rueda-Carrasco, J., Shin, S.H., Kim, J.S., et al. (2023). Perivascular cells induce microglial phagocytic states and synaptic engulfment via SPP1 in mouse models of Alzheimer’s disease. Nat. Neurosci. 26, 406-415.
- Bonnans, C., Chou, J., and Werb, Z. (2014). Remodelling the extracellular matrix in development and disease. Nat. Rev. Mol. Cell Biol. 15, 786-801.
- Patten, J., and Wang, K. (2021). Fibronectin in development and wound healing. Adv. Drug Deliv. Rev. 170, 353-368.
- Moretti, L., Stalfort, J., Barker, T.H., and Abebayehu, D. (2022). The interplay of fibroblasts, the extracellular matrix, and inflammation in scar formation. J. Biol. Chem. 298, 101530.
- Li, Y., He, X., Kawaguchi, R., Zhang, Y., Wang, Q., Monavarfeshani, A., Yang, Z., Chen, B., Shi, Z., Meng, H., et al. (2020). Microglia-organized scar-free spinal cord repair in neonatal mice. Nature 587, 613-618.
- Meisner, O.C., Nair, A., and Chang, S.W.C. (2022). Amygdala connectivity and implications for social cognition and disorders. Handb. Clin. Neurol. 187, 381-403.
- Varghese, M., Keshav, N., Jacot-Descombes, S., Warda, T., Wicinski, B., Dickstein, D.L., Harony-Nicolas, H., De Rubeis, S., Drapeau, E., Buxbaum, J.D., et al. (2017). Autism spectrum disorder: neuropathology and animal models. Acta Neuropathol. 134, 537-566.
- Amaral, D.G., Schumann, C.M., and Nordahl, C.W. (2008). Neuroanatomy of autism. Trends Neurosci. 31, 137-145.
- Paré, D., Quirk, G.J., and Ledoux, J.E. (2004). New vistas on amygdala networks in conditioned fear. J. Neurophysiol. 92, 1-9.
- Tovote, P., Fadok, J.P., and Lüthi, A. (2015). Neuronal circuits for fear and anxiety. Nat. Rev. Neurosci. 16, 317-331.
- Asede, D., Doddapaneni, D., and Bolton, M.M. (2022). Amygdala Intercalated Cells: Gate Keepers and Conveyors of Internal State to the Circuits of Emotion. J. Neurosci. 42, 9098-9109.
- Paolicelli, R.C., Bolasco, G., Pagani, F., Maggi, L., Scianni, M., Panzanelli, P., Giustetto, M., Ferreira, T.A., Guiducci, E., Dumas, L., et al.
(2011). Synaptic pruning by microglia is necessary for normal brain development. Science 333, 1456-1458. - Schafer, D.P., Lehrman, E.K., Kautzman, A.G., Koyama, R., Mardinly, A.R., Yamasaki, R., Ransohoff, R.M., Greenberg, M.E., Barres, B.A., and Stevens, B. (2012). Microglia sculpt post-natal neural circuits in an activity and complement-dependent manner. Neuron 74, 691-705.
- Miyamoto, A., Wake, H., Ishikawa, A.W., Eto, K., Shibata, K., Murakoshi, H., Koizumi, S., Moorhouse, A.J., Yoshimura, Y., and Nabekura, J. (2016). Microglia contact induces synapse formation in developing somatosensory cortex. Nat. Commun. 7, 12540.
- Weinhard, L., di Bartolomei, G., Bolasco, G., Machado, P., Schieber, N.L., Neniskyte, U., Exiga, M., Vadisiute, A., Raggioli, A., Schertel, A., et al. (2018). Microglia remodel synapses by presynaptic trogocytosis and spine head filopodia induction. Nat. Commun. 9, 1228.
- Allen, N.J., and Lyons, D.A. (2018). Glia as architects of central nervous system formation and function. Science 362, 181-185.
- Nguyen, P.T., Dorman, L.C., Pan, S., Vainchtein, I.D., Han, R.T., NakaoInoue, H., Taloma, S.E., Barron, J.J., Molofsky, A.B., Kheirbek, M.A., and Molofsky, A.V. (2020). Microglial Remodeling of the Extracellular Matrix Promotes Synapse Plasticity. Cell 182, 388-403.e15.
- Frangogiannis, N.G. (2014). The inflammatory response in myocardial injury, repair, and remodelling. Nat. Rev. Cardiol. 11, 255-265.
- Pellicoro, A., Ramachandran, P., Iredale, J.P., and Fallowfield, J.A. (2014). Liver fibrosis and repair: immune regulation of wound healing in a solid organ. Nat. Rev. Immunol. 14, 181-194.
- Vannella, K.M., and Wynn, T.A. (2017). Mechanisms of Organ Injury and Repair by Macrophages. Annu. Rev. Physiol. 79, 593-617.
- Shin, Y.J., Kim, H.L., Choi, J.S., Choi, J.Y., Cha, J.H., and Lee, M.Y. (2011). Osteopontin: correlation with phagocytosis by brain macrophages in a rat model of stroke. Glia 59, 413-423.
- Rentsendorj, A., Sheyn, J., Fuchs, D.T., Daley, D., Salumbides, B.C., Schubloom, H.E., Hart, N.J., Li, S., Hayden, E.Y., Teplow, D.B., et al. (2018). A novel role for osteopontin in macrophage-mediated amyloidbeta clearance in Alzheimer’s models. Brain Behav. Immun. 67, 163-180.
- Lyons, D.A., and Talbot, W.S. (2014). Glial cell development and function in zebrafish. Cold Spring Harb. Perspect. Biol. 7, a020586.
- Sharma, K., Bisht, K., and Eyo, U.B. (2021). A Comparative Biology of Microglia Across Species. Front. Cell Dev. Biol. 9, 652748.
- Teissier, N., Fallet-Bianco, C., Delezoide, A.L., Laquerrière, A., Marcorelles, P., Khung-Savatovsky, S., Nardelli, J., Cipriani, S., Csaba, Z., Picone, O., et al. (2014). Cytomegalovirus-induced brain malformations in fetuses. J. Neuropathol. Exp. Neurol. 73, 143-158.
- Nunes, R.H., Pacheco, F.T., and da Rocha, A.J. (2014). Magnetic resonance imaging of anterior temporal lobe cysts in children: discriminating special imaging features in a particular group of diseases. Neuroradiology 56, 569-577.
- Tomasello, E., Desmoulins, P.O., Chemin, K., Guia, S., Cremer, H., Ortaldo, J., Love, P., Kaiserlian, D., and Vivier, E. (2000). Combined natural killer cell and dendritic cell functional deficiency in KARAP/DAP12 loss-of-function mutant mice. Immunity 13, 355-364.
- Jackson, B., Peyrollier, K., Pedersen, E., Basse, A., Karlsson, R., Wang, Z., Lefever, T., Ochsenbein, A.M., Schmidt, G., Aktories, K., et al. (2011). RhoA is dispensable for skin development, but crucial for contraction and directed migration of keratinocytes. Mol. Biol. Cell 22, 593-605.
- Jung, S., Aliberti, J., Graemmel, P., Sunshine, M.J., Kreutzberg, G.W., Sher, A., and Littman, D.R. (2000). Analysis of fractalkine receptor CX(3)CR1 function by targeted deletion and green fluorescent protein reporter gene insertion. Mol. Cell. Biol. 20, 4106-4114.
- Lindquist, R.L., Shakhar, G., Dudziak, D., Wardemann, H., Eisenreich, T., Dustin, M.L., and Nussenzweig, M.C. (2004). Visualizing dendritic cell networks in vivo. Nat. Immunol. 5, 1243-1250.
- van Spriel, A.B., Leusen, J.H.W., van Egmond, M., Dijkman, H.B.P.M., Assmann, K.J.M., Mayadas, T.N., and van de Winkel, J.G.J. (2001).
99. Hao, Y., Hao, S., Andersen-Nissen, E., Mauck, W.M., 3rd, Zheng, S., Butler, A., Lee, M.J., Wilk, A.J., Darby, C., Zager, M., et al. (2021). Integrated analysis of multimodal single-cell data. Cell 184, 3573-3587.e29.
100. Hafemeister, C., and Satija, R. (2019). Normalization and variance stabilization of single-cell RNA-seq data using regularized negative binomial regression. Genome Biol. 20, 296.
101. Langmead, B., and Salzberg, S.L. (2012). Fast gapped-read alignment with Bowtie 2. Nat. Methods 9, 357-359.
102. Ahlmann-Eltze, C., and Huber, W. (2021). glmGamPoi: fitting GammaPoisson generalized linear models on single cell count data. Bioinformatics 36, 5701-5702.
103. Zappia, L., and Oshlack, A. (2018). Clustering trees: a visualization for evaluating clusterings at multiple resolutions. GigaScience 7, giy083.
104. Genescu, I., Aníbal-Martínez, M., Kouskoff, V., Chenouard, N., MailhesHamon, C., Cartonnet, H., Lokmane, L., Rijli, F.M., López-Bendito, G., Gambino, F., and Garel, S. (2022). Dynamic interplay between thalamic activity and Cajal-Retzius cells regulates the wiring of cortical layer 1. Cell Rep. 39, 110667.
105. de Frutos, C.A., Bouvier, G., Arai, Y., Thion, M.S., Lokmane, L., Keita, M., Garcia-Dominguez, M., Charnay, P., Hirata, T., Riethmacher, D., et al. (2016). Reallocation of Olfactory Cajal-Retzius Cells Shapes Neocortex Architecture. Neuron 92, 435-448.
106. Schafer, D.P., Lehrman, E.K., Heller, C.T., and Stevens, B. (2014). An engulfment assay: a protocol to assess interactions between CNS phagocytes and neurons. JoVE. 51482.
STAR*METHODS
KEY RESOURCES TABLE
| REAGENT or RESOURCE | SOURCE | IDENTIFIER |
| Antibodies | ||
| Rat anti-CD68 | Bio-Rad | Cat# MCA1957; RRID:AB_322219 |
| Rabbit anti-FN1 | Millipore | Cat# AB2033; RRID:AB_2105702 |
| Goat anti-FOXP2 | Santa Cruz Biotechnology | Cat# sc-21069; RRID:AB_2107124 |
| Chicken anti-GFP | Aves Labs | Cat# GFP-1020; RRID:AB_10000240 |
| Rabbit anti-IBA1 | FUJIFILM Wako Shibayagi | Cat# 019-19741; RRID:AB_839504 |
| Rabbit anti-IBA1 (human) | Abcam | Cat# ab178846; RRID:AB_2636859 |
| Chicken anti-IBA1 | Synaptic Systems | Cat# 234009; RRID:AB_2891282 |
| Rat anti-Lgals3 (MAC2) | CEDARLANE | Cat# CL8942AP; RRID:AB_10060357 |
| Rat anti-L1 | Millipore | Cat# MAB5272; RRID:AB_2133200 |
| Biotinylated rat anti-LYVE1 | Thermo Fisher Scientific | Cat# 13-0443-82; RRID:AB_1724157 |
| Rat anti-Myelin Basic Protein (MBP) | Millipore | Cat# MAB386; RRID:AB_94975 |
| Rat anti-mDectin-1 (CLEC7A) | InvivoGen | Cat# mabg-mdect; RRID:AB_2753143 |
| Mouse anti-neurofilament marker SMI-312 | BioLegend | Cat# 837904; RRID:AB_2566782 |
| Goat anti-mouse Osteoactivin (GPNMB) | R and D Systems | Cat# AF2330; RRID:AB_2112934 |
| Rabbit anti-P2Y12 receptor | AnaSpec; EGT Group | Cat# 55043A; RRID:AB_2298886 |
| Goat anti-SPP1 | R and D Systems | Cat# AF808; RRID:AB_2194992 |
| Donkey anti-chicken Alexa 10 Fluor® 488-conjugated | Jackson ImmunoResearch Labs | Cat# 703-545-155; RRID:AB_2340375 |
| Donkey anti-goat Alexa 10 Fluor® 488-conjugated | Jackson ImmunoResearch Labs | Cat# 705-545-147; RRID:AB_2336933 |
| Donkey anti-rat Alexa 10 Fluor® 488-conjugated | Jackson ImmunoResearch Labs | Cat# 712-545-150; RRID:AB_2340683 |
| Donkey anti-rabbit Alexa 10 Fluor® 488-conjugated | Jackson ImmunoResearch Labs | Cat# 711-545-152; RRID:AB_2313584 |
| Donkey anti-goat Cy3-conjugated | Jackson ImmunoResearch Labs | Cat# 705-165-147; RRID:AB_2307351 |
| Donkey anti-rabbit Cy3-conjugated | Jackson ImmunoResearch Labs | Cat# 711-165-152; RRID:AB_2307443 |
| Donkey anti-rat Cy3-conjugated | Jackson ImmunoResearch Labs | Cat# 712-165-150; RRID:AB_2340666 |
| Donkey anti-goat Alexa 10 Fluor® 647-conjugated | Jackson ImmunoResearch Labs | Cat# 705-605-147; RRID:AB_2340437 |
| Donkey anti-goat Cy5-conjugated | Jackson ImmunoResearch Labs | Cat# 705-175-147; RRID:AB_2340415 |
| Donkey anti-rat Cy5-conjugated | Jackson ImmunoResearch Labs | Cat# 712-175-150; RRID:AB_2340671 |
| Biological samples | ||
| Human fetal brain tissue | Gynaecology Department, Jeanne de Flandre Hospital, Lille, France | N/A |
| Chemicals, peptides, and recombinant proteins | ||
| Lipopolysaccharide | InvivoGen | Cat# tlrl-pelps; CAS: 93572-42-0 |
| Pexidartinib (PLX3397) | Plexxikon | CAS: 1029044-16-3 |
| Anti-CSF1R mAb (
|
Florent Ginhoux laboratory | N/A |
| Triton 100X | Eurobio | Cat# GAUTTR00-07 |
| Hoechst | Sigma Aldrich | Cat# 33342 |
| Paraformaldehyde | Sigma Aldrich | Cat# P6148 |
| Gelatin | VWR chemical | Cat# 24350.262 |
| Dibenzylether | Sigma Aldrich | Cat# 33630 |
| Dichloromethane | Sigma Aldrich | Cat# 270997 |
| Methanol | Sigma Aldrich | Cat# 34860 |
| Critical commercial assays | ||
| BD
|
BD Biosciences | Cat# 633793 |
| Continued | |||||
| REAGENT or RESOURCE | SOURCE | IDENTIFIER | |||
|
BD Biosciences | Cat# 633801 | |||
|
BD Biosciences | Cat# 665915 | |||
|
Thermo Fisher Scientific | Cat# P35361 | |||
| Deposited data | |||||
| scRNA-seq for embryonic microglia (C57BL/6) | La Manno et al.
|
http://mousebrain.org/ development (“dev_all.loom”) | |||
| scRNA-seq for postnatal microglia (C57BL/6) | Hammond et al.
|
GSE: 121654 | |||
| scRNA-seq for postnatal microglia (C57BL/6) | Li et al.
|
GSE: 123025 | |||
| scRNA-seq for Spp1-/
|
This study |
|
|||
| Experimental models: Organisms/strains | |||||
| Mouse: Cx3cr1
|
The Jackson Laboratory | RRID:IMSR_JAX:005582 | |||
| Mouse: Pu.
|
Back et al.
|
N/A | |||
| Mouse: Cd11c-eYFP | The Jackson Laboratory | RRID:IMSR_JAX:007567 | |||
| Mouse: Spp1-/- | The Jackson Laboratory | RRID:IMSR_JAX:004936 | |||
| Mouse: Csf1r
|
Rojo et al.
|
RRID:IMSR_JAX:032783 | |||
| Mouse: Cd11b
|
The Jackson Laboratory | RRID:IMSR_JAX:003991 | |||
| Mouse: Dap12/TyroBP
|
Tomasello et al.
|
RRID:MGI:3818477 | |||
| Mouse:
|
Jackson et al.
|
N/A | |||
| Mouse: Emx1
|
Cappello et al.
|
N/A | |||
| Mouse: WntA3
|
Deck et al.
|
N/A | |||
| Mouse: C57BL/6J | The Jackson Laboratory |
|
|||
| Software and algorithms | |||||
| FIJI (ImageJ) 1.50 g | National Institute of Health | https://fiji.sc/; https://imagej.nih.gov/ ij/index.html; RRID: SCR_003070 | |||
| LAS AF 4.0 | Leica Microsystems | https://www.leica-microsystems.com/; RRID: SCR_013673 | |||
| GraphPad Prism 9.5 | GraphPad Software | RRID: SCR_000306 | |||
| Adobe Photoshop CS6 | Adobe Systems | RRID: SCR_014199 | |||
| Adobe Illustrator CS6 | Adobe Systems | RRID: SCR_010279 | |||
| R software 4.2.2 | GNU Project | https://www.r-project.org/; RRID:SCR_001905 | |||
| R package: Metascape 3.5.20230501 | Metascape Team | http://metascape.org/gp/ index.html#/main/step1; RRID:SCR_016620 | |||
| R package: Seurat 4.3.0.1 | N/A | https://satijalab.org/seurat/ get_started.html; RRID:SCR_016341 | |||
| R package: Tidyverse 2.0.0 | N/A | https://CRAN.R-project.org/ package=tidyverse ; RRID:SCR_019186 | |||
| R package: Viridis 0.6.4 | N/A | https://cran.r-project.org/web/ packages/viridis/vignettes/ intro-to-viridis.html ; RRID:SCR_016696 | |||
| R package: Clustree 0.5.0 | N/A | https://CRAN.R-project.org/ package=clustree ; RRID:SCR_016293 | |||
| Continued | ||
| REAGENT or RESOURCE | SOURCE | IDENTIFIER |
| R package: EnhancedVolcano 1.16.0 | N/A | https://bioconductor.org/ packages/EnhancedVolcano/ ; RRID:SCR_018931 |
| R package: Paletteer 1.5.0 | N/A | https://CRAN.R-project.org/ package=paletteer |
| R package: Ggplot2 3.4.3 | N/A | https://cran.r-project.org/web/ packages/ggplot2/index.html ; RRID:SCR_014601 |
| R package: Sctransform 0.3.5 | N/A | https://github.com/satijalab/sctransform ; RRID:SCR_022146 |
| R package: GlmGamPoi 1.10.2 | N/A | https://bioconductor.org/ packages/glmGamPoi/ |
| Bowtie 2 | N/A | http://bowtie-bio.sourceforge.net/ bowtie2/index.shtml ; RRID:SCR_016368 |
| Illumina HiSeq 4000 system | Ilumina | https://www.illumina.com/ systems/sequencing-platforms/ hiseq-3000-4000.html ; RRID:SCR_020127 |
| Rhapsody analysis pipeline | BD Biosciences | https://www.bdbiosciences.com |
| t-SNE | GitHub | https://github.com/jkrijthe/Rtsne |
| UMAP | GitHub | https://github.com/Imcinnes/umap |
| Imaris x64 software version 10.0 | Bitplane | RRID:SCR_007370 |
| Imspector Pro software | Miltenyi BioTec | https://www.miltenyibiotec.com |
| Gatan DigitalMicrograph software | Gatan | https://www.gatan.com |
| pClamp 10.3 software | Molecular devices | https://support.moleculardevices.com |
| Other | ||
| Leica TCS-SP8 confocal microscope | Leica | https://www.leica-microsystems.com/ |
| Leica TCS SP5 confocal microscope | Leica | https://www.leica-microsystems.com/ |
| Ultramicroscope II lightsheet microscope | Miltenyi BioTec | https://www.miltenyibiotec.com |
| Leica DMi8 fluorescence microscope | Leica | https://www.leica-microsystems.com/ |
| Philips Tecnai 12 Transmission Electron Microscope | Philips/FEI | https://nano.tau.ac.il |
| Leica CM 3050S cryostat | Leica | https://www.leica-microsystems.com/ |
| Olympus BX51WIF microscope | Olympus | https://www.olympus-lifescience.com |
| ssniff standard mouse chow | ssniff Spezialdiäten GmbH | https://www.ssniff.com |
RESOURCE AVAILABILITY
Lead contact
Materials availability
Data and code availability
- Single-cell RNA-seq dataset have been deposited into ArrayExpress with accession number E-MTAB-13581 and are publicly available as of the date of publication. Data generated in Tables S1, S3, and S4 is available for mining. Microscopy data reported in this paper will be shared by the lead contact upon request.
- This paper does not report original code.
- Any additional information required to reanalyze the data reported in this work paper is available from the lead contact upon request.
EXPERIMENTAL MODEL AND STUDY PARTICIPANT DETAILS
Mouse Lines
Human fetuses
METHOD DETAILS
Transcriptomic reanalysis
Single-cell RNA-seq data reanalysis
Differential expression analysis
Gene set enrichment analysis
Transcriptomic analysis in controls and Spp1 mutants scRNA-sequencing Whole Transcriptome using Rhapsody
Alignment and pre-processing of single-cell RNA sequencing data
Processing and analysis of single-cell RNA sequencing data
Microglial Depletion
Maternal Immune activation
Immunohistochemistry on sections
Tissue Clearing
Tissue preparation for transmission electron microscopy (TEM)
MRI scans
Induction of in utero cortical lesions
as usually done for in utero electroporation or viral infection.
Ex vivo phagocytic assay
Preparation of brain slices and electrophysiological recordings
Image acquisition and analysis
Slice imaging
iDISCO 3D Imaging and Processing
3D Imaging and processing of microglia and Fibronectin 1 staining
Transmission electron microscopy (TEM) imaging
QUANTIFICATION AND STATISTICAL ANALYSIS
Cell Article
Cell
Article
Supplemental figures
Cell
Article
Cell Article
(A) IBA1 immunolabeling in coronal sections shows the distribution of microglia in control and
(B) Quantifications of the IBA1+ cells in all the CSA region, rostral neocortex and within CSA subregions (1-3).
Graphs show means
Am, amygdala; CSA, cortico-striato-amygdalar boundary; Ncx, neocortex; Str, striatum.
Cell Article
(A) Dot plot reporting the average expression level of Spp1 and Gpnmb in various cell types of La Manno et al.
(B) E14.5 coronal hemisection stained with Hoechst, showing the integrity of the CSA in control mice and Gpnmb
(C) L1 immunolabeling showing the integrity at the CSB in control mice and Gpnmb
(D) CSA and CSB lesions in Spp1-/- mutants are transient and have resorbed, respectively, by E18.5 (
(E) UMAP visualization of all sorted cells (from wild-type [WT] and Spp1-/- E14.5 and E18.5 embryos) colored by annotated clusters (BroadCellType).
(F) UMAP of all sorted cells split and colored by WT (light gray) and Spp1-/- (dark gray) conditions.
(G) Dot plot of scaled average expression and percentage of top 5 differentially expressed genes (DEGs) by annotated macrophage clusters (RefinedCellType). Scale bars,
ATM, axon-tract associated microglia; BAM, border associated macrophages; CC, corpus callosum; CSA, cortico-striato-amygdalar boundary; CSB, corticoseptal boundary; Fx, fornix; Ncx, neocortex; MG, microglia; PVM, perivascular macrophages; Se, septum; Str, striatum; WT, wild-type.
(A) Coronal sections counterstained with Hoechst showing the CSB region in Csf1r
(B) Coronal sections showing the CSB region (open arrowheads) in pups prenatally exposed to PLX3397 at P0, P3, P7, and P20. Cavitary lesions (solid arrowheads) progressively resorbed during the first post-natal week, with a similar timeline to the CSA (
Graphs show the percentages of brain with lesions, but individual dots represent brains with lesion (100) or no lesion (0) to illustrate variability. Fisher’s exact test was performed for statistical comparison,
CC, corpus callosum; Ncx, neocortex; Se, septum.
(A) P28 coronal hemisections of brains immunostained with the pan axonal neurofilament marker SMI-312 and myelin basic protein (MBP) and Hoechst reveal alterations in the CSA region in Csf1r
(B) P20 coronal hemisections of brains immunostained with the pan axonal neurofilament marker SMI-312 and myelin basic protein (MBP) (left) or with MBP and FOXP2 (right) reveal alterations in the CSA region of mice prenatally exposed to PLX3397 (solid arrowheads) compared with controls (open arrowheads). Axonal tracts of the amygdalar capsule and associated FOXP2-positive inhibitory interneurons are disorganized, highlighting long-term morphological consequences of early microglial absence and transient CSA lesions (
(C) Schematic representation of the experimental approach (left) used to record in P60 slices both excitatory post-synaptic currents (EPSCs) and inhibitory postsynaptic currents (IPSCs) from BLA pyramidal neurons in response to stimulation of the amygdalar capsule. Importantly, amygdalar capsule stimulation was designed to trigger EPSCs with an amplitude between -150 and -350 pA in both mutants and PLX3397-prenatally exposed mice, and IPSCs were subsequently measured by changing the holding potential in order to evaluate the inhibition/excitation ratio (I/E). EPSCs and IPSCs amplitude and I/E ratio (right) show an altered balance in PLX3397-exposed embryos, compared with controls at P60 (
Scale bars,
Am, amygdala; ampl, amplitude; BLA, basolateral nucleus of the amygdala; CSA, cortico-striato-amygdalar boundary; EPSCs, excitatory post-synaptic currents; I/E, inhibition/excitation ratio; IPSCs, inhibitory post-synaptic currents; Ncx, neocortex.
Cell
Article
(A) Fibronectin 1 (FN1) signal after immunostaining accumulates at the P 3 resorbing CSA in Cx3cr1
(B) High magnification and 3D reconstruction of CSA microglia identified as Cx3cr1
Am, amygdala; CSA, cortico-striato-amygdalar boundary; Ncx, neocortex.
- Figure 2. Microglia are required for tissue integrity at the embryonic CSA and CSB
(A) Hoechst staining of hemibrain coronal sections from E14.5 or E15.5 embryos, showing CSA integrity in controls (open arrowhead) and cavitary lesions in the absence of microglia (solid arrowheads) (); and from E18.5 embryos, showing the localization of CSA cavitary lesions, bordering the neocortex (Ncx), striatum (Str), and amygdala (Am) ( 11, ).
(B) L1-immunolabeling stains the corpus callosum (CC) and fornix (Fx), highlighting CSB integrity in controls (open arrowheads) and cavitary lesions (solid arrowheads) in various models disrupting microglial colonization ().
(C) Cavity reconstruction (yellow) after whole hemibrain clearing using iDISCO, highlighting the absence of cavities in controls and stereotypically located cavities in two depletion models () and enabling 3D quantification of lesion volumes (Imaris Software).
(D) Whole-head MRI scans of E15.5 or P0 mice, showing low-intensity signals confirming the formation of lesions at the CSA of PLX3397-treated embryos (yellow solid arrowheads) in contrast to controls (yellow open arrowheads) ().
(E) Whole-head MRI scans of E15.5 or E18.5 mice, showing low-intensity signals confirming the formation of lesions at the CSA of Csf1rembryos (yellow solid arrowheads) in contrast to controls (yellow open arrowheads; ).
(F) Whole-head MRI scans of E18.5 mice, showing low-intensity signals confirming the formation of lesions at the CSB of Csf1rembryos (yellow solid arrowheads) in contrast to controls (yellow open arrowheads) ( ).
Graphs show meansSEM. Mann-Whitney tests were performed for statistical comparison, **p < 0.01. Scale bars: in (A) and (B); in (C); and .
Am, amygdala; CC, corpus callosum; CSA, cortico-striato-amygdalar boundary; CSB, cortico-septal boundary; Fx, fornix; Ncx, neocortex; OB, olfactory bulb; Se, Septum; Str, striatum.
See also Figure S2 and Videos S1-S4. - (C and D) E14.5 (C) and E18.5 (D) coronal hemisections showing no differences in Mac2 and GPNMB co-expressing microglia at the CSA and CSB of controls (open arrowheads) and Spp1-/- embryos (
, at each stage from at least two distinct litters).
(E) UMAP visualization of single-cell RNA sequencing (scRNA-seq) data representing macrophage subsets extracted from wild-type (WT) and Spp1-/- E14.5 and E18.5 embryos colored by annotated clusters (RefinedCellType).
(F) Violin plot of normalized and scaled Spp1 expression across annotated clusters between wild-type (WT) (light gray) and Spp1-/- (KO)(dark gray) mice showing that Spp1 expression is largely restricted to WT ATM (cluster 5).
(G) Volcano plot of differentially expressed genes (DEGs) between WT and Spp1-/- conditions in ATM cells (false discovery rate[FDR]-adjustedand avgerage_ ). Genes downregulated in Spp1-/- embryos are displayed in orange, while the upregulated ones are shown in green, and some genes were manually annotated.
(H) Bar plots of top Metascape gene set enrichment of DEGs (G) in both WT or Spp1-/- conditions, highlighting upregulated (green) and downregulated pathways (orange) in Spp1-/- embryos versus controls, with pathways related to phagocytosis highlighted by a red arrowhead.
(I) Brain sections from E15 Cx3cr1mice showing specific fibronectin 1 (FN1) labeling within GFP- and Mac2-positive ATM microglia at the CSA (performed on brain sections of at least three mice from two distinct litters).
(J) High magnification confocal acquisition and 3D cell reconstructions (Imaris software) of immunolabeled sections from E14.5 embryonic brains showing Cx3cr1-positive CSA microglia with FN1 signal inside cell bodies (performed on brain sections of at least three mice from two distinct litters).
(K) Comparison of the percentage of FN1 volume measured (Imaris software) inside individual CSA microglia shows a reduction in Spp1 mutants versus controls (, from at least two distinct litters).
Graphs show percentages inand and means SEM for all others. Fisher’s exact test was performed to compare distributions of cases with lesions in controls, Spp1-/- and PLX3397-exposed embryos (A and B), and Mann-Whitney U tests were performed for statistical comparison in all other graphs, ; , non significant ( ). Scale bars: (A, B low magnification, and D); (C and F ); (G, left); and (3D reconstructed cells in F and G).
ATM, axon-tract-associated microglia; BAM, border associated macrophages; CC, corpus callosum; CSA, cortico-striato-amygdalar boundary; CSB, corticoseptal boundary; DEGs, differentially expressed genes; Fx, fornix; Intravasc mac, intravascular macrophages; Ncx, neocortex; PVM, perivascular macrophages; Se, Septum; Str, striatum; WT, wild type.
See also Figure S4 and Tables S3-S6. - Figure S1. Embryonic ATM-like cells resemble post-natal ATM, related to Figure 1
(A) Dot plot showing the relative expression levels of core ATM genes in embryonic ATM-like microglia (MG) compared with non-cycling or cycling embryonic MG in the La Manno scRNA-seq dataset.The color represents the normalized expression level across all cells within a cluster, while the dot size indicates the percentage of cells expressing each gene in that cluster.
(B) Projection of the post-natal PAM signature from the Li datasetonto the UMAP plot from Figure 1A showing embryonic ATM-like cells.
(C) Venn diagram highlighting the overlap between embryonic brain ATM differentially expressed genes (DEGs) identified in the La Manno dataset,post-natal ATM in the Hammond dataset, and post-natal PAM in the Li dataset.
(D) Reproduced tSNE plot of the 76,149 cells characterized by scRNA-seq in the La Manno dataset.
(E and F) Projections of the embryonic ATM signature defined in the La Manno datasetand the PAM signature defined in the Li dataset , showing the overlap with the Hammond ATM cluster 4.
(G) Low magnification of brain sections from embryonic mice at E15.0 and E18.5 showing that accumulations of SPP1-expressing microglia, identified as Cx3cr1-positive or IBA1-positive parenchymal cells, are restricted to the CSA and CSB.
(H) Immunolabeling of embryonic E15.0 CD11c-EYFP brain section showing IBA1-positive microglia expressing YFP () and ATM marker CLEC7A ( ) at the CSA.
(I) Comparison of ATM marker expression between microglia located in the neocortex and CSA in E15.0 CD11c-EYFP and Cx3cr1-positive brains, showing examples of CSA and neocortical areas used for quantification; immunolabeling was performed on brain sections from at least 3 mice from 2 different litters.
(J) pHrodo assay conducted on ex vivo brain slices (at leastfrom 2 distinct litters) showing intense staining in CSA microglia at E14.5.
(K) Immunolabeling for CD68 showing intense staining inside CSA microglia at E14.5 in physiological conditions and comparison between mean CD68 coverage of SPP1-negative ramified microglia and SPP1-positive CSA ATM (cells in 4 mice from 2 distinct litters).
(L) Immunolabeling of human GW9 and GW14 human brain transverse sections showing co-expression of ATM markers with IBA1 at the CSA.Graphs (ATM markers co-expression and CD68 coverage) show meansSEM. Mann-Whitney U test were performed for statistical comparison, ; . Scale bars: in (G left) and (L right); in (G, right); in (I)-(K); in (H); in (L, upper left); and in (L, lower left).
ATM, axon-tract-associated microglia; CC, corpus callosum; CSA, cortico-striato-amygdalar boundary; DEGs, differentially expressed genes; GW, gestational week; MG, microglia; Ncx, neocortex; PAM, proliferative-region associated microglia; Se, septum; Str, striatum. - Figure S2. Models of macrophage depletion and functional alteration, related to Figure 2
(A-C) Confirmation of the depletion of microglia in brains of embryonic Cx3cr1mice at E14.5 and E18.5, where pregnant dams were subjected to (A) intraperitoneal injection of a CSF1R blocking antibody (AFS) at E6.5 and E7.5 (E14.5, ); (B) feeding with PLX3397, a pharmacological inhibitor of the CSF1R pathway, from E6.5 to E15.0 (E14.5, ; E18.5, ); and (C) feeding with PLX3397 from E12.5 to E15.0 (E15.5, ). Open and solid arrowheads indicate the accumulation of GFP-positive cells at the CSA and local CSA tissue lesion in the absence of GFP-positive cells, respectively.
(D) Transmission electron microscopy image of the CSA lesion in the brain of E14.5 embryos from PLX3397-treated dams, showing the presence of cell debris (solid arrowheads) but the absence of basal membrane ().
(E) Coronal sections through hemibrains of E14.5 embryos from wild-type mice; those exposed to mild maternal immune activation (MIA); and Cx3cr1-/-, Dap12/ Tyro, and mutant embryos showing the absence of CSA lesions (open arrowheads) (at least for each condition).
Scale bars:in (A)-(C), and (E); in (D, low magnification); and in (D, high magnification).
CSA, cortico-striato-amygdalar boundary; Ncx, neocortex; Str, striatum.