تحديد الطبقات السطحية لهيكل الماء الواجهى في محاليل الإلكتروليت البسيطة Surface stratification determines the interfacial water structure of simple electrolyte solutions

المجلة: Nature Chemistry
DOI: https://doi.org/10.1038/s41557-023-01416-6
PMID: https://pubmed.ncbi.nlm.nih.gov/38225269
تاريخ النشر: 2024-01-15

تحديد الطبقات السطحية لهيكل الماء الواجهى في محاليل الإلكتروليت البسيطة

تاريخ الاستلام: 20 سبتمبر 2022
تم القبول: 7 ديسمبر 2023
نُشر على الإنترنت: 15 يناير 2024
(أ) التحقق من التحديثات

يار ليتمان (1) كيو-يانغ تشيانغ (1) تاكازاكو سيكي، يuki ناغاتا وميشا بون (1)

الملخص

توزيع الأيونات عند واجهة الهواء/الماء يلعب دورًا حاسمًا في العديد من العمليات الطبيعية. وقد أفادت عدة دراسات أن الأيونات الأكبر تميل إلى أن تكون نشطة على السطح، مما يعني أن الأيونات تقع على سطح الماء، مما يؤدي إلى توليد مجالات كهربائية تحدد بنية الماء عند الواجهة. هنا نتحدى هذه الرؤية من خلال دمج تقنية الكشف عن الترددات الاهتزازية المحددة للسطح مع محاكاة الديناميكا الجزيئية من أولى المبادئ المدعومة بالشبكات العصبية. تظهر نتائجنا أن الأيونات في محاليل الإلكتروليت النموذجية تقع في الواقع في منطقة تحت السطح، مما يؤدي إلى تقسيم هذه الواجهات إلى طبقتين مائيتين متميزتين. السطح الخارجي خالٍ من الأيونات، بينما الطبقة تحت السطح غنية بالأيونات. هذا التقسيم السطحي هو عنصر رئيسي في تفسير إعادة تنظيم الماء الناتجة عن الأيونات عند الواجهة الخارجية للهواء/الماء.

حوالي تغطي مياه المحيطات جزءًا من سطح الأرض. تلعب عملية التبخر وتكوين الهباء الجوي غير المتجانس لمثل هذه المحاليل الغنية بالإلكتروليت دورًا مهمًا في الكيمياء الجوية وعلوم المناخ. تحدد العمليات الفيزيائية الكيميائية التي تحدث على سطح محاليل الإلكتروليت في النهاية من خلال التركيب الجزيئي لهذه المحاليل عند واجهات الهواء/السائل. وبالتالي، فإن المعرفة المجهرية بتوزيعات الأيونات والتوجه الجزيئي عند أبسط واجهة هواء/محلول تعتبر ذات أهمية قصوى لتطوير النماذج البيئية. وهو أيضًا نقطة انطلاق لفهم واجهات السوائل الأكثر تعقيدًا عند تلامسها مع الأقطاب الكهربائية أو الأغشية أو المعادن. .
تستند الصورة الجزيئية الواسعة الانتشار لسطح محاليل الإلكتروليت المائية إلى النتائج التي تم الحصول عليها باستخدام تقنيات الطيفية المحددة للسطح ومحاكاة الديناميكا الجزيئية المعتمدة على مجالات القوة. باختصار، الأيونات الثقيلة القابلة للاستقطاب، مثل و تتجمع في المنطقة الواجهة، بينما الأيونات الأقل قطبية، مثل و تُستنفد من الواجهة وتبقى مدفونة في المحلول. يُفترض أن هذا التوزيع التفاضلي للأنيونات والكاتيونات يخلق ما يُعرف باسم الطبقة الكهربائية المزدوجة (EDL)، وهي بنية طبقة مزدوجة أيونية أو ببساطة طبقة مزدوجة. . الافتراض
لقد لعب تشكيل طبقة مزدوجة كهربائية عند واجهات الهواء/السائل دورًا أساسيًا في وصف أسطح الإلكتروليتات المائية. .
من الصعب الحصول على رؤى على المستوى الجزيئي حول توزيع الأيونات المحلي وبنية الماء على سطح محاليل الإلكتروليت. تعتبر تقنية توليد الترددات الاهتزازية المجمعة (VSFG) تقنية محددة للسطح تستكشف مباشرة الاستجابة من اهتزازات الجزيئات عند الواجهات. الأيونات الذرية لا تدعم أي اهتزازات، لذا يمكن استنتاج سلوكها فقط بشكل غير مباشر من استجابة VSFG للماء، مما يستدعي عادةً صورة طبقة مزدوجة كهربائية (EDL). تتغير شدة إشارة VSFG في تمت نسبة المنطقة عند إضافة الملح إلى تراكم زائد للكاتيونات أو الأنيونات عند الواجهة . ومع ذلك، أصبحت الفجوات واضحة مؤخرًا، والصورة الموحدة غائبة في الأدبيات. على سبيل المثال، على الرغم من أن معظم الحسابات المعتمدة على مجالات القوة القابلة للاستقطاب تتنبأ بزيادة قوية في الـ التركيز عند الواجهة ، بما يتماشى مع الطاقة الحرة الزائدة السطحية المقاسة القياسات التي أبلغ عنها رايموند وزملاؤه استنتج عدم وجود تعزيز سطحي قابل للكشف للأنيونات القابلة للاستقطاب من خلال تصميم دقيق لتجارب تخفيف النظائر، بما يتماشى مع المحاكاة الحديثة من النوع الأول. .
الشكل 1| طيف HD-VSFG التجريبي عند واجهة الهواء/محاليل الإلكتروليت. طيف HD-VSFG لمحلول 1 م HCl (برتقالي؛ 1.5 م حل CsF (وردي؛ ب)، 1.5 م حل NaCl (أحمر؛ ج) و 1.0 م حل NaOH (أزرق؛ د). يتم تقديم البيانات كقيم متوسطة على مدى ثلاثة ثلاثة أربعة وتسعة مجموعات بيانات مستقلة. تمثل أشرطة الخطأ فترة الثقة 95% المقابلة بافتراض توزيع ستودنت ثنائي الجانب. الروابط الحرة والهيدروجينية تتغير الأطياف بالنسبة لمرجع الماء النقي في حالة HCl (أ)، بينما في حالات CsF و NaCl، تتعلق فقط الهيدروجين-
تم تعديل الأشرطة المرتبطة. في جميع اللوحات، يتم عرض طيف VSFG للماء (باللون الأسود) للمقارنة. يتم تسليط الضوء على اتجاه التغيرات الطيفية بالأسهم، وتظهر المستطيلات الرمادية التغيرات الطيفية الضئيلة. اعتماد السعة على التركيز في HD-VSFG، معبرًا عنه كنسبة بين إشارات محلول الإلكتروليت والماء )، عند 3,200 (هـ)، 3,450 (و) و ، مما يظهر أن هيكل الماء عند هذه الواجهات بين الهواء والكهارل مختلف نوعياً. تمثل الخطوط ملاءمة متعددة الحدود تستخدم لتوجيه العين دون معنى فيزيائي.
تقييد التقدم في هذا المجال بعدة تحديات: (1) مستويات إشارة SFG المنخفضة من هذه الأنواع من الواجهات؛ (2) ضرورة تحديد طور الإشارة (عن طريق الكشف الهتيروديني) لتسجيل بيانات غير غامضة؛ (3) عدم كفاية البيانات التجريبية وحدها لفك تشابك المكونات الطيفية في المحاليل المائية بشكل غير غامض، حيث إن استجابة VSFG للماء غالبًا ما تكون واسعة وبدون ميزات. .
في هذه المقالة نتغلب على هذه التحديات من خلال دمج بيانات VSFG المكتشفة بتقنية التداخل العالي (HD-VSFG) مع محاكاة الديناميكا الجزيئية من أولى المبادئ المدعومة بالشبكات العصبية (AIMD) ومن أجل الحصول على صورة موحدة، ندرس بنية واجهة عشرة محاليل إلكتروليت، وهي ، و . يوفر HD-VSFG وصولاً مباشراً إلى ويسمح بفك تشابك الخلفية غير الرنانة في طيف HD-VSFG، مما يكشف عن تفاصيل دقيقة ولكنها أساسية في الطيف الرنان الفعلي. من خلال تغيير تركيز الملح بشكل منهجي ومقارنة أطياف HD-VSFG مع الأطياف المحاكاة، نظهر أن تشكيل طبقة مزدوجة كهربائية لا يمكن أن يفسر أطياف HD-VSFG لأملاح هاليد الصوديوم والكهارل الأخرى، الاستثناءات الوحيدة بين الكهارل المدروسة هي HCl و ، حيث أن البروتون المائي و البيركلورات لهما ميل سطحي مرتفع جداً. تثبت البيانات التجريبية المجمعة والمحاكاة ذات الجودة الأولى أن تراكم الأيونات تحت السطح على بعد بضع أنغستروم من الهواء/محلول الإلكتروليت يحدد التركيب المائي على الواجهة. توفر هذه الصورة فهماً أكثر دقة للتركيب الواجهوي لمعظم حلول الإلكتروليت النموذجية، مما يبرز أن التصنيفات التقليدية لميل الأيونات السطحية كـ ‘مركزة على السطح’ أو ‘مستنفدة من السطح’ هي فقط سيناريوهين محدودين ضمن نطاق أوسع من السلوكيات.

النتائج والمناقشة

نقاط الضعف في نموذج EDL لواجهات الهواء/الإلكتروليت

تظهر الشكل 1 طيف الماء ومحلولات الإلكتروليت المختلفة (الشكل 1أ-د). نركز أولاً على الطيف عند واجهة الماء والهواء. يظهر طيف الماء النقي قمة إيجابية حادة مركزة عند وإشارة سلبية حول . الـ الذروة تنشأ من الحر مجموعة من أعلى المياه السطحية، و تنبثق الفرقة من
مرتبط بروابط هيدروجينية مجموعة من الماء الواجهاتي. الإشارة الإيجابية (السلبية) لـ وضع التمدد يشير إلى أن الـ نقاط المجموعة إلى الهواء (إلى الكتلة).
عند مقارنتها ببيانات الماء النقي، يظهر طيف محلول HCl انخفاضًا في الحرية حزام الشد (أقل إيجابية) وانخفاض حزام الشد المرتبط بالهيدروجين (أكثر سلبية). انخفاض الذروة هي إشارة واضحة على أن البروتونات تتواجد في الطبقة العليا عن طريق تغطية الحرة المجموعات التي تحتوي على أيونات الهيدرونيوم. لقد تم تأكيد ميل السطح للبروتونات تجريبيًا ونظريًا في الماضي. على عكس حالة محلول HCl، طيف لـ تظهر حلول CsF أن هذه الأيونات تعدل نطاق الروابط الهيدروجينية من خلال تعزيز و/أو تقليل سعاتها، ولكن الحرة تظل الفرقة غير متأثرة إلى حد كبير. الحرية غير المتغيرة ذروة تظهر أن الحرية مجموعات جزيئات الماء الواجهة ليست مغطاة بهذه الأيونات.
شكل يظهر اعتماد التركيز على و السعات (الحرّة الذروة، والجانبين العالي والمنخفض التردد من الروابط الهيدروجينية أشرطة التمدد، على التوالي). و الأيونات لا تؤثر بشكل كبير على سعة قمة O-H الحرة ضمن نطاق التركيز المدروس، على عكس أيونات الهيدرونيوم. بالمقابل، فإن الروابط الهيدروجينية تتغير سعات النطاق بشكل ملحوظ لجميع الأيونات، على الرغم من اختلافها في الحجم والإشارات. هذه النتائج تثير تساؤلات حول استخدام نموذج واحد فريد لوصف السلوك المتنوع للأيونات عند الواجهة.
يرجى ملاحظة أن طيف محاليل NaCl و NaOH، بالإضافة إلى الماء النقي، يختلف عن البيانات المبلغ عنها، لا سيما في منطقة أدت عدم دقة الطور في القياسات المبكرة إلى إنشاء قمة إيجابية اصطناعية أدنى بفضل الإجراء الأخير لتحديد الطور بدقة، تمكنا من الحصول على الطور بدقة في طيف HD-VSFG الخاص بنا. في الواقع، تتفق بيانات واجهة الهواء/الماء لدينا مع التقارير الحديثة. .

حالة واجهة الهواء/ NaOH (مائي)

لاستكشاف سبب المجاني القمة لم تتغير، لكن نطاق الروابط الهيدروجينية قد تغير، عند إضافة الملح، قمنا بإجراء
الشكل 2 | طيف VSFG التجريبي والنظري لمحلولات NaOH المائية عند درجة حرارة الغرفة. أ، الجزء التخيلي التجريبي من الطيف الذي تم الحصول عليه للماء، و 5.00 م محلول مائي من NaOH. ب، التنبؤ النظري استنادًا إلى منهجية ssVVCF تُستخرج التركيزات من منطقة الكتلة في اللوح. تُعرض البيانات التجريبية المقياس خطيًا بخطوط متقطعة لتسهيل المقارنة. ج، مساهمة جزيئات الماء في الطيف النظري في الجوار من
الأيونات. د، المساهمة في الطيف النظري بواسطة روابط OH المنسقة أنيونات. و فك الارتباط بين الآليات المتعارضة للتغيرات الطيفية والسماح بتحديد أصلها الجزيئي. يتم عرض طيف الماء النقي في جميع اللوحات باللون الأسود كمرجع. تم تصحيح الأطياف النظرية بواسطة الاعتماد على تردد ثنائي القطب الانتقالي ولحظات الاستقطاب. تم إضافة خط مرجعي صفري باللون الرمادي.
الحسابات النظرية لطيف VSFG. من بين و NaOH، قررنا دراسة طيف NaOH بمزيد من التفصيل من خلال محاكاة أطياف HD-VSFG الخاصة به، لأن NaOH يمثل الإلكتروليتات التي لا تؤثر على الحرية. الفرقة، ويظهر التغيير الأكثر دراماتيكية في ميزات HD-VSFG. حساب طيف VSFG للماء يكلف على الأقل عشرة أضعاف الطيف الكتلي مثل طيف رامان أو الطيف تحت الأحمر (IR) لأن الإشارة تأتي من عدد قليل جداً من طبقات الماء، ويجب أن يتم متوسط الإشارة الناتجة عن الكتلة بشكل صحيح إلى الصفر. علاوة على ذلك، فإن وصف أحداث كسر الروابط وتشكيلها، بالإضافة إلى الحاجة إلى طيف دقيق، يتطلب تجاوز الحقول القوة الكلاسيكية وإجراء حسابات من أول المبدأ. . يتطلب الأخير جهدًا حسابيًا أكبر بكثير، مما يفسر سبب ندرة حسابات ab initio لطيف SFG في الأدبيات. للتغلب على هذه التكلفة الحسابية الكبيرة، قمنا بإجراء محاكاة NN-AIMD مما أتاح لنا إجراء المحاكاة المطلوبة بتكلفة حسابية منخفضة، مع الحفاظ على الدقة الكمية الأساسية.
تظهر الشكل 2أ، ب البيانات التجريبية والنظرية لـ HD-VSFG، على التوالي. تُظهر المقارنة بين التجربة والمحاكاة أن محاكياتنا تلتقط التغيرات الطيفية الرئيسية بشكل صحيح. بالنسبة لمجموعتي الطيف، فإن إضافة أيونات NaOH تؤدي إلى انخفاض في الإشارة السلبية المرتبطة بالهيدروجين. و يصبح أقل سلبية – وظهور إشارة سلبية واسعة النطاق في المنطقة. المجاني يبقى غير متأثر. تلتقط المحاكاة الاتجاهات الرئيسية التي لوحظت تجريبيًا وتعيد إنتاج التغيرات الطيفية الموصوفة مع زيادة تركيز القاعدة. كما أنها تفتقر إلى الكتف عند
الناشئة من وضع الشد غير المتناظر في جزيئات الماء، التي تتبرع برابطي هيدروجين وتقبل واحدًا “نظرًا للقيود المعروفة لوظيفة الارتباط بين السرعة والسرعة المحددة على السطح (ssVVCF)”. على عكس المحاكيات السابقة المعتمدة على مجالات القوة الكلاسيكية ، نتائج NN-AIMD لدينا تتنبأ بشكل صحيح بعدم وجود إشارة SFG للماء النقي تحت تم توفير اختبارات التحقق الإضافية في المعلومات التكميلية.
بعد التحقق من إطارنا النظري، نتابع بتحليل الطيف المحاكى. الشكل 2c و d يقدم الطيف الذي ساهمت به جزيئات الماء المختارة في الجوار من و ، على التوالي. جزيئات الماء المنسقة إلى تساهم الأيونات في إشارة إيجابية بين 3200 و ، و الـ روابط جزيئات الماء المنسقة إلى الأنيونات مسؤولة عن السلبية الاستمرارية. المهمة الأخيرة تتماشى مع الدراسات السابقة ل NaOH في الكتلة ومجموعات الماء ، حيث يُنسب أيضًا نطاق الاستمرارية إلى الإذابة لـ الأنواع. لاحظ أن الاستمرارية التي تمتد أسفل لا ينشأ من الكتلة المساهمات، لأن الجزء الأكبر المساهمات لها فقط مساهمة صغيرة أدناه ، على عكس الطيف الموضح في الشكل 2د المرجع 40،41.
هذا التحليل الطيفي يشير بقوة إلى أن طيف HD-VSFG عند واجهة الهواء/المحلول في الإلكتروليت يمكن وصفه بأنه مجموع طيف VSFG للماء (غير المضطرب) عند واجهة الهواء/الماء )، من الماء الموجه بواسطة الكاتيون ( ) ، وتلك الخاصة بالماء الموجه بواسطة الأنيون ( ):
الشكل 3 | التحليل المجهري لـ . ملفات الكثافات (أ) وزاوية المتوسط قاطع جزيئات الماء و محور الرابطة بالنسبة للعمودي على السطح (ب) لمحلول NaOH بتركيز 2.3 م. يتم تعريف نقطة الأصل على أنها موضع واجهة السائل الفورية. في (أ)، ذرات الأكسجين من جزيئات الماء، و مُرسَمة باللون الأسود والأزرق والأحمر، على التوالي. في جزيئات الماء بدون أيونات في جوارها باللون الأسود، باللون الأحمر، جزيئات الماء في الجوار من الأيونات باللون الأزرق وجزيئات الماء في الجوار من أيونات في البرتقالي. سالب (موجب) تشير إلى اتجاه صافي نحو الجزء الأكبر من المحلول (اتجاه لأعلى نحو الهواء). يتم قياس القيم بالنسبة لكثافة الماء. تم تعديل بعض المنحنيات لمزيد من الوضوح. ج، لقطة تمثيلية لمحاكاة الديناميكا الجزيئية. و مُظَلَّلَة باللونين الأزرق والبرتقالي، على التوالي. كما تم تسليط الضوء على جزيئات الماء المختارة المنسقة مع الأيونات المسؤولة عن التغيرات الملحوظة في طيف HD-VSFG. يتم تصوير واجهة الهواء/السائل الفورية بواسطة سطح رمادي، وتمثل الخطوط المتقطعة الواجهات بين الماء النقي ومحلول الإلكتروليت الكثيف. و جزيئات الماء التي تؤدي إلى التغيرات في طيف VSFG لها استقطاب معكوس وتقع في منطقة سطحية تفتقر إلى الأيونات. للتوضيح، و تم تمييز جزيئات الماء التي تؤدي إلى التغيرات في طيف VSFG بمناطق زرقاء فاتحة وبرتقالية، على التوالي.
أين هو معامل يتناسب مع تركيز الملح، وقد قمنا بتعريف مساهمة الإلكتروليت، ، لسهولة الاستخدام لاحقًا. لاحظ أن يشمل أيضًا التأثيرات الناتجة عن إزاحة الماء، وعلى الرغم من أن تشكيل أزواج الأيونات لم يتم تضمينه بشكل صريح، إلا أنه يمكن، من حيث المبدأ، إضافته كمساهمات إضافية إلى أو تم امتصاصه في .
تختلف هذه التفسير عن نموذج طبقة مزدوجة كهربائية التقليدي حيث تكون المساهمات الكاتيونية والأنيونية متشابكة. ضمن صورة طبقة مزدوجة كهربائية، يُفترض أن المجال الكهربائي المحلي الناتج عن فصل الشحنات عند الواجهة يحفز توجيهًا متوسطًا صافيًا لـ لحظات ثنائي القطب الانتقالي لجزيئات الماء في الطبقات العليا. ومع ذلك، لا يمكن لمثل هذا السيناريو أن يفسر الانخفاض والزيادة المتزامنين في الإشارة حول 3000 و يتطلب تغييران طيفيان بعلامات متعاكسة محاذاة مع اتجاهات متعاكسة، وهو سيناريو لا يمكن وصفه في إطار صورة EDL.
لاستكشاف توزيع الأيونات بالقرب من الواجهات بشكل أعمق، قمنا بحساب ملفات الكثافة للأنواع المختلفة، والتي تظهر في الشكل 3a. كلاهما و تُدفع الأيونات بعيدًا عن الواجهة، مما يؤدي إلى إثراء تحت السطح. الشكل 3ب يعرض ملف الاتجاه للماء، وجزيئات الماء المنسقة إلى و تظهر منحنى توجيه الماء توجهاً سلبياً قليلاً، بما يتماشى مع الأدبيات. .
القليل أنيونات داخل Åلواجهة الماء الفورية تظهر اتجاهًا واضحًا مع توجيه ذرات الهيدروجين نحو مرحلة البخار. ومع ذلك، فإن المساهمة في الإشارة العامة ضئيلة، لأن عددًا قليلاً جدًا فقط المجموعات موجودة في هذا العمق. في الواقع، معظم الأنيونات أكثر من Åأسفل واجهة الماء الفورية، دون توجيه صافي. يتماشى توجيه الماء المنسق مع طيف VSFG المتوقع: تشير الجزيئات، في المتوسط، إلى الأسفل نحو المحلول، بينما تتجه جزيئات الماء لأعلى، نحو الواجهة. من المهم أن معظم الاتجاه الصافي المنسق يتجمع داخل منطقة خالية من و أيونات.
مع وضع جميع الملاحظات السابقة في الاعتبار، نقترح نموذج التصنيف التالي، كما هو موضح في الشكل 3c (لقطة MD). إن نقص الأيونات في الطبقة العليا يخلق طبقة داخلية رقيقة من الماء ‘النقي’. تظهر جزيئات الماء داخل هذه الطبقة الرقيقة، التي تكون بجوار الأيونات، اتجاهًا محددًا على طول العمود الفقري للسطح، مما يتسبب في التغيرات الملحوظة في الـ الطيف. من ناحية، في حالة الأيونات، بسبب التناظر الكروي للكاتيون، تفضل اتجاهًا واحدًا فقط، حيث تتواجد ذرات الأكسجين الأقرب إلى الكاتيون. من ناحية أخرى، وكما ذُكر سابقًا، فإن معظم الأيونات تقع على بعد 3.5 Å أسفل واجهة الهواء/الماء الفورية. ذرة الهيدروجين من الموتيف لا يعمل كمانح لرابطة الهيدروجين ويعمل ذرة الأكسجين كمتقبل قوي لروابط الهيدروجين، قادرة على قبول ما بين ثلاثة إلى خمسة روابط هيدروجين لكل ذرة. . وبالتالي، في المتوسط، تتAlign الأيونات المزيد من جزيئات الماء نحو المحلول بدلاً من الواجهة. وأخيرًا، داخل منطقة الكتلة، تصبح التوجهات الجزيئية عشوائية، مما ينتج عنه اختفاء التوجه الصافي وبالتالي عدم وجود إشارة SFG إضافية. في القسم التكميلي 4، نقدم نموذجًا بسيطًا أحادي الأبعاد يوضح كيف يمكن أن يؤدي غياب الأيونات في منطقة معينة من الفضاء إلى محاذاة مائية مميزة، كما نقترح هنا.

تعميم صورة التدرج إلى الإلكتروليتات البسيطة

حتى هذه النقطة، قمنا بتقييد تركيزنا على محلول NaOH المائي. إذا كانت الصورة المقترحة عامة وظاهرة ذات صلة بالنسبة للكهارل الأخرى، فيجب أن يكون من الممكن العثور على دليل طيفي. وبالتالي، للتحقق من تفسيرنا المجهري، قمنا بإجراء قياسات HD-VSFG لسلسلة من أملاح الهالوجين ذات قوى تفاعل مختلفة بين الماء والأنيون.
نظهر طيف HD-VSFG لـ وواجهات NaI المائية في الشكل 4أ. لأن التغيرات الطيفية الناتجة عن إضافة الأيونات تتناسب مع تركيزها (القسم التكميلي 1)، يمكن تحليل الإشارة الكلية إلى تركيبة خطية من الماء، و كما هو موضح في المعادلة (1) (أي، ). تشير الخطية الملحوظة مع التركيز إلى أن أزواج الأيونات لا تتشكل بكميات ملحوظة. ومع ذلك، نتوقع أن يحدث انحراف ملحوظ عن النموذج الحالي عند تركيزات أكبر بكثير من 1 م، اعتمادًا على الألفة السطحية للكهارل المحدد، وميوله لتشكيل أزواج الأيونات، وفي النهاية، قابليته للذوبان. يجب أن تنشأ الشكل 4 ب، من حيث المبدأ، من تراكب إشارة إيجابية تنشأ من الماء الموجه نحو الواجهة بسبب تفاعله مع أيونات ( )، مع إشارة سلبية ناتجة عن محاذاة الماء التي تسببها الأنيونات ( بالنسبة لـ NaOH، فإن هذه المساهمات المختلفة مفصولة بشكل جيد، وذلك بفضل الفصل الأكبر في التردد بين جزيئات الماء المختلفة القريبة من الكاتيونات وأنيونات الهاليد.
لاختبار هذا الافتراض، نقوم بتقريب ، حيث و تمثل شدة الأشعة تحت الحمراء وشدة رامان، على التوالي . يتم التحقق من صحة هذه التقريب من خلال التشابه بين ما تم بناؤه الطيف والطيف الموضح في الشكل 2c (وأيضًا الشكل التكميلي 13) ويدعمه المنطق التالي. في السيناريوهات التي تحتوي على كهرباء ثابتة
الشكل 4 | تحليل تفكيك HD-VSFG إلى مساهمات طيفية ناتجة عن الكاتيونات والأنيونات. أ، الجزء التخيلي من طيف HD-VSFG، ، تم الحصول عليه لـ محاليل مائية 1 م من NaF (أسود)، 1 م من NaCl (وردي)، 1 م من NaBr (أحمر)، 1 م من NaI (أزرق)، و1 م من HCl (بني). المساهمات الكهربية في الاستجابة من الدرجة الثانية المحسوبة من . يتم تطبيع الإشارات إلى القيمة القصوى. المتوسط الهندسي لرامان و
إشارات الأشعة تحت الحمراء لـ ، يتم تصويره بواسطة خط متقطع رمادي. ج، المساهمات السلبية المقدرة المحسوبة من ، حيث هو عامل مقياس. يتم عرض التناسبات الغاوسية لإرشاد العين كخطوط منقطة. الاتجاه الترددي الملحوظ للمساهمات السالبة يتماشى مع قوة الروابط الهيدروجينية المتوقعة لسلسلة الهاليدات ويتفق مع توقعات صورة الطبقات.
مجال استقطاب الماء أو تفاعل جزيئات الماء مع الكاتيونات، ولكنها مرتبطة بالهيدروجين بجزيئات ماء أخرى، فإن طيف تمدد O-H في الماء يتحكم فيه التفاعلات بين جزيئات الماء. لذا، يجب أن تشبه استجابة الماء بالقرب من الكاتيونات أو الخاضع لمجال ثابت الميزات الطيفية الموجودة في الماء الكتلي. وقد تم استخدام هذه المقارنة مؤخرًا بنجاح لتحليل واجهة السيليكا/الماء، مما يثبت صحة مثل هذا التقريب في الحالات التي يُتوقع فيها استجابة تشبه الماء الكتلي. .
ال مساهمات الطيف، تم الحصول عليها كـ ، كما هو موضح في الشكل 4c. تسير المساهمة السلبية وفق الاتجاه المتوقع وتتحول نحو الأحمر على طول السلسلة ، الذي يتبع زيادة القوة النسبية لروابط الهيدروجين المقابلة وفقًا للنموذج المقترح، فإن التفاعلات الأقوى بين الأنيونات والماء تؤدي إلى مساهمة سلبية نسبياً أقوى. مشابه لما يُلاحظ في الكتل الغازية. ، الـ الأنيون يشكل رابطة هيدروجينية قوية بشكل ملحوظ تؤدي إلى انزياح أزرق لـ تمديد الطيف بأكثر من مقارنةً بالهاليدات الأخرى.
نؤكد أن تفسير EDL، الذي ينسب المحاذاة إلى المجال المحلي الناتج عن فصل الأيونات ويتجاهل التفاعلات المباشرة بين الماء والأيونات، لا يمكنه تفسير التغيرات الملحوظة في الطيف التفاضلي لهذه الإلكتروليتات (الشكل 4ب).
تظهر الشكل 4 بيانات من محلول HCl. كما ذُكر سابقًا، فإن يظهر الطيف تغيرًا أحادي الاتجاه يتميز بانخفاض الإشارة في الروابط الهيدروجينية منطقة التمدد أدناه . جنبًا إلى جنب مع حقيقة أن المجاني الإشارة تنخفض بشكل ملحوظ مع التركيز (الشكل 1g والشكل التكميلي 12)، نعتقد أنه في هذا النظام، يتم تشكيل طبقة مزدوجة كهربائية، وأن المجال الناتج عن فصل الشحنات يحدد فعليًا الهيكل الواجهوي. على الرغم من أننا نشك في أن الماء المنسق مع يجب أن يخلق الأنيون، من حيث المبدأ، مساهمة سلبية، كما هو الحال في الحالات الأخرى، لكن الإشارة القوية الناتجة عن المحاذاة الناتجة عن البروتونات تخفيه تمامًا.
في المعلومات التكميلية، نبلغ أيضًا عن البيانات التي تم الحصول عليها لـ و الإلكتروليتات. في جميع هذه الحالات باستثناء سعة الحركة الحرة يبقى النطاق، ضمن عدم اليقين التجريبي، غير متأثر حتى 1 م، مما يظهر نقص الأيونات في الطبقة العليا من الماء (الشكل التكميلي 12). تم تحديد لـ CsF تظهر مناطق إيجابية وسلبية، تشبه حالات NaOH و NaF. على الرغم من أن افتراض تشكيل طبقة مزدوجة كهربائية يفشل مرة أخرى في تفسير التغيرات الطيفية المتزامنة ذات العلامات المختلفة، فإن الصورة المستندة إلى تدرج السطح توفر تفسيرًا مباشرًا: الإيجابية و
تظهر القمم السلبية من الماء المنسق مع الكاتيونات والأنيونات، على التوالي. إن فك التداخل لـ لـ أنيون CsF يتفق مع الأنيون الذي تم الحصول عليه لـ NaF (الشكل التكميلي 14) وبطريقة مشابهة، مساهمة في تم الحصول عليه من البيانات تتفق بشكل جيد مع تلك الخاصة بـ NaCl (الشكل التكميلي 15). وهذا يدل على قوة التحليل المقترح. نتائج و تم تقديمها في الشكل التكميلي 16، وعلى عكس الحالات السابقة، فإن الإشارة تعتمد على هوية الكاتيون. لأن شكل الطيف يشير إلى الاتصال بالروابط الهيدروجينية حول الكبريتات ، تشير هذه النتيجة إلى أن الفرق الملحوظ ناتج عن تكوين أزواج الأيونات (المفصولة بالمذيب) في (المرجع 50). تظهر الحلول أقوى اضطراب في إشارة VSFG، ومثل HCl، انخفاض سريع في إشارة الحرة مع إضافة الإلكتروليت. لذلك نستنتج أن محلي على سطح الماء، ويشكل بالفعل EDL. من المتوقع سلوك مشابه لـ وأيونات عضوية أخرى .
أخيرًا، للتحقق من الصورة الناشئة، قمنا أيضًا بإجراء محاكاة MD من البداية لأملاح هاليد الصوديوم وحساب ملفات الكثافة المقابلة. كما هو موضح في الشكل التكميلي 22، فإن واجهة الهواء/السائل لـ و NaBr المحاليل تفتقر إلى الأيونات، مما يؤدي إلى إثراء تحت السطح والتصنيف السطحي المذكور أعلاه. هذا التأثير أقل وضوحًا بالنسبة لمحلول NaI، الذي يبدو أنه حالة وسيطة بين بقية الهاليدات والبروتون. نلاحظ أن ملفات الكثافة MD المقدمة من البداية تتفق إلى حد كبير مع المحاكاة المبلغ عنها في المرجع 22، مع محاكاة كلاسيكية مع مجالات قوة متسقة حراريًا كما هو مذكور في المرجع 53، ومع حسابات تعتمد على نماذج الاستمرارية . الإشارة الحرة غير المضطربة لـ ، على الرغم من وجود NaI، تكشف أن أيون اليود، على عكس البركلورات والبروتون المائي، ليس نشطًا جدًا على السطح (الشكل التكميلي 12). علاوة على ذلك، فإن التغيرات الطيفية كدالة لتركيز NaI خطية (الشكل التكميلي 11)، على عكس الاستجابة غير الخطية التي لوحظت لأيونات نشطة على السطح ( و ). مجتمعة، تشير هذه الملاحظات بقوة إلى أن المجال المحلي الافتراضي الناتج عن فصل الشحنات وفقًا لصورة EDL يلعب دورًا ضئيلًا. وبالتالي، نقوم بتحليل NaI بنفس الطريقة التي نقوم بها مع الهاليدات القلوية الأخرى (أيضًا القسم التكميلي V).
باختصار، أثبتت تقنية HD-VSFG عالية المستوى، بالاشتراك مع محاكاة من البداية، في هذه الحالة، بدعم من NN، أنها أداة لا تقدر بثمن للمساهمة في الفهم على المستوى الجزيئي لأسطح السوائل. على عكس التقنيات الأخرى، مثل مطيافية الإلكترون وتوليد التوافقي الثاني ، التي توفر رؤية خشنة نسبيًا، فإن HD-VSFG لديها دقة اهتزازية. النتائج التجريبية الكمية المبلغ عنها في هذه المقالة لمجموعة كبيرة ومتنوعة من
الإلكتروليتات، جنبًا إلى جنب مع الدقة العالية للقياسات (الشكل التكميلي 26)، مكنت من ملاحظة تفاصيل تفاعلات الماء والأيونات، ومكنت من مراجعة نقدية لنطاق تطبيق صورة EDL المعتمدة. بشكل أكثر تحديدًا، بافتراض تكوين EDL، من المتوقع أن تستقطب جزيئات الماء داخل EDL في اتجاه واحد – إما لأعلى أو لأسفل. على الرغم من أنه من الممكن التمييز بين تأثيرات الماء المتفاعل مع الأيونات ذات الشحنات المتنوعة، فإن هذه المساهمات ستظهر باستمرار نفس القطبية. في المقابل، يأخذ النموذج الطبقي في الاعتبار الاستقطاب المزدوج، حيث يمكن للماء أن يتجه في نفس الوقت لأعلى ولأسفل، بما يتماشى مع الملاحظات التجريبية. توسيع صورة التصنيف وأهمية تفاعلات الماء والأيونات التي تم توضيحها في هذه المقالة بشكل كبير على الأوصاف الحالية في الكتب الدراسية، مما يوفر رؤى قوية نحو حل لغز واجهة الهواء/الماء وفهم التفاعلية الكيميائية عند هذه الواجهة الشائعة .

المحتوى عبر الإنترنت

أي طرق، مراجع إضافية، ملخصات تقارير Nature Portfolio، بيانات المصدر، بيانات موسعة، معلومات تكملية، شكر وتقدير، معلومات مراجعة الأقران؛ تفاصيل مساهمات المؤلفين والمصالح المتنافسة؛ وبيانات توفر البيانات والرموز متاحة على https://doi.org/10.1038/s41557-023-01416-6.

References

  1. Oum, K. W., Lakin, M. J., DeHaan, D. O., Brauers, T. & Finlayson-Pitts, B. J. Formation of molecular chlorine from the photolysis of ozone and aqueous sea-salt particles. Science 279, 74-76 (1998).
  2. Knipping, E. M. et al. Experiments and simulations of ion-enhanced interfacial chemistry on aqueous NaCl aerosols. Science 288, 301-306 (2000).
  3. Andreae, M. O. & Crutzen, P. J. Atmospheric aerosols: biogeochemical sources and role in atmospheric chemistry. Science 276, 1052-1058 (1997).
  4. Geiger, F. M. Second harmonic generation, sum frequency generation and : dissecting environmental interfaces with a nonlinear optical Swiss army knife. Annu. Rev. Phys. Chem. 60, 61-83 (2009).
  5. Björneholm, O. et al. Water at interfaces. Chem. Rev. 116, 7698-7726 (2016).
  6. Laage, D., Elsaesser, T. & Hynes, J. T. Water dynamics in the hydration shells of biomolecules. Chem. Rev. 117, 10694-10725 (2017).
  7. Gonella, G. et al. Water at charged interfaces. Nat. Rev. Chem. 5, 466-485 (2021).
  8. Shultz, M. J., Schnitzer, C., Simonelli, D. & Baldelli, S. Sum frequency generation spectroscopy of the aqueous interface: ionic and soluble molecular solutions. Int. Rev. Phys. Chem. 19, 123-153 (2000).
  9. Jungwirth, P. & Tobias, D. J. Molecular structure of salt solutions: a new view of the interface with implications for heterogeneous atmospheric chemistry. J. Phys. Chem. B 105, 10468-10472 (2001).
  10. Jungwirth, P. & Tobias, D. J. Specific ion effects at the air/water interface. Chem. Rev. 106, 1259-1281 (2006).
  11. Petersen, P. B. & Saykally, R. J. On the nature of ions at the liquid water surface. Annu. Rev. Phys. Chem. 57, 333-364 (2006).
  12. Ishiyama, T. & Morita, A. Molecular dynamics study of gas-liquid aqueous sodium halide interfaces. I. Flexible and polarizable molecular modeling and interfacial properties. J. Phys. Chem. C 111, 721-737 (2007).
  13. Liu, D., Ma, G., Levering, L. M. & Allen, H. C. Vibrational spectroscopy of aqueous sodium halide solutions and air-liquid interfaces: observation of increased interfacial depth. J. Phys. Chem. B 108, 2252-2260 (2004).
  14. Hua, W., Verreault, D., Huang, Z., Adams, E. M. & Allen, H. C. Cation effects on interfacial water organization of aqueous chloride solutions. I. Monovalent cations: and . J. Phys. Chem. B 118, 8433-8440 (2014).
  15. Garrett, B. C. Ions at the air/water interface. Science 303, 1146-1147 (2004).
  16. Tian, C., Ji, N., Waychunas, G. A. & Shen, Y. R. Interfacial structures of acidic and basic aqueous solutions. J. Am. Chem. Soc. 130, 13033-13039 (2008).
  17. Tian, C., Byrnes, S. J., Han, H.-L. & Shen, Y. R. Surface propensities of atmospherically relevant ions in salt solutions revealed by phase-sensitive sum frequency vibrational spectroscopy. J. Phys. Chem. Lett. 2, 1946-1949 (2011).
  18. Verreault, D. & Allen, H. C. Bridging the gap between microscopic and macroscopic views of air/aqueous salt interfaces. Chem. Phys. Lett. 586, 1-9 (2013).
  19. Brown, E. C., Mucha, M., Jungwirth, P. & Tobias, D. J. Structure and vibrational spectroscopy of salt water/air interfaces: predictions from classical molecular dynamics simulations. J. Phys. Chem. B 109, 7934-7940 (2005).
  20. Petersen, P. B., Johnson, J. C., Knutsen, K. P. & Saykally, R. J. Direct experimental validation of the Jones-Ray effect. Chem. Phys. Lett. 397, 46-50 (2004).
  21. Raymond, E. A. & Richmond, G. L. Probing the molecular structure and bonding of the surface of aqueous salt solutions. J. Phys. Chem. B 108, 5051-5059 (2004).
  22. Baer, M. D. & Mundy, C. J. Toward an understanding of the specific ion effect using density functional theory. J. Phys. Chem. Lett. 2, 1088-1093 (2011).
  23. Tang, F. et al. Molecular structure and modeling of water-air and ice-air interfaces monitored by sum-frequency generation. Chem. Rev. 120, 3633-3667 (2020).
  24. Das, S. et al. Nature of excess hydrated proton at the water-air interface. J. Am. Chem. Soc. 142, 945-952 (2020).
  25. Chiang, K.-Y., Dalstein, L. & Wen, Y.-C. Affinity of hydrated protons at intrinsic water/vapor interface revealed by ion-induced water alignment. J. Phys. Chem. Lett. 11, 696-701 (2020).
  26. Tse, Y.-L. S., Chen, C., Lindberg, G. E., Kumar, R. & Voth, G. A. Propensity of hydrated excess protons and hydroxide anions for the air-water interface. J. Am. Chem. Soc. 137, 12610-12616 (2015).
  27. Ji, N., Ostroverkhov, V., Tian, C. S. & Shen, Y. R. Characterization of vibrational resonances of water-vapor interfaces by phase-sensitive sum-frequency spectroscopy. Phys. Rev. Lett. 100, 96102 (2008).
  28. Nihonyanagi, S., Yamaguchi, S. & Tahara, T. Ultrafast dynamics at water interfaces studied by vibrational sum frequency generation spectroscopy. Chem. Rev. 117, 10665-10693 (2017).
  29. Nihonyanagi, S. et al. Accurate determination of complex spectrum of the air/water interface. J. Chem. Phys. 143, 124707 (2015).
  30. Ohto, T., Usui, K., Hasegawa, T., Bonn, M. & Nagata, Y. Toward ab initio molecular dynamics modeling for sum-frequency generation spectra; an efficient algorithm based on surface-specific velocity-velocity correlation function. J. Chem. Phys. 143, 124702 (2015).
  31. Behler, J. & Parrinello, M. Generalized neural-network representation of high-dimensional potential-energy surfaces. Phys. Rev. Lett. 98, 146401 (2007).
  32. Behler, J. First principles neural network potentials for reactive simulations of large molecular and condensed systems. Angew. Chem. Int. Ed. 56, 12828-12840 (2017).
  33. Stiopkin, I. V. et al. Hydrogen bonding at the water surface revealed by isotopic dilution spectroscopy. Nature 474, 192-195 (2011).
  34. Imamura, T., Ishiyama, T. & Morita, A. Molecular dynamics analysis of NaOH aqueous solution surface and the sum frequency generation spectra: is surface detected by SFG spectroscopy? J. Phys. Chem. C 118, 29017-29027 (2014).
  35. Mandal, A., Ramasesha, K., de Marco, L. & Tokmakoff, A. Collective vibrations of water-solvated hydroxide ions investigated with broadband 2DIR spectroscopy. J. Chem. Phys. 140, 204508 (2014).
  36. Hellstróm, M. & Behler, J. Structure of aqueous NaOH solutions: insights from neural-network-based molecular dynamics simulations. Phys. Chem. Chem. Phys. 19, 82-96 (2017).
  37. Chen, B. et al. First-principles study of aqueous hydroxide solutions. J. Am. Chem. Soc. 124, 8534-8535 (2002).
  38. Crespo, Y. & Hassanali, A. Unveiling the Janus-like properties of . J. Phys. Chem. Lett. 6, 272-278 (2015).
  39. Crespo, Y. & Hassanali, A. Characterizing the local solvation environment of in water clusters with AIMD. J. Chem. Phys. 144, 74304 (2016).
  40. Wen, Y.-C. et al. Unveiling microscopic structures of charged water interfaces by surface-specific vibrational spectroscopy. Phys. Rev. Lett. 116, 16101 (2016).
  41. Ohno, P. E., Wang, H., Paesani, F., Skinner, J. L. & Geiger, F. M. Second-order vibrational lineshapes from the air/water interface. J. Phys. Chem. A 122, 4457-4464 (2018).
  42. Nagata, Y., Pool, R. E., Backus, E. H. G. & Bonn, M. Nuclear quantum effects affect bond orientation of water at the water-vapor interface. Phys. Rev. Lett. 109, 226101 (2012).
  43. Schaefer, J., Backus, E. H. G., Nagata, Y. & Bonn, M. Both inter- and intramolecular coupling of O-H groups determine the vibrational response of the water/air interface. J. Phys. Chem. Lett. 7, 4591-4595 (2016).
  44. Wei, F., Urashima, S., Nihonyanagi, S. & Tahara, T. Elucidation of the pH -dependent electric double layer structure at the silica/ water interface using heterodyne-detected vibrational sum frequency generation spectroscopy. J. Am. Chem. Soc. 145, 8833-8846 (2023).
  45. Max, J.-J. & Chapados, C. IR spectroscopy of aqueous alkali halide solutions: pure salt-solvated water spectra and hydration numbers. J. Chem. Phys. 115, 2664-2675 (2001).
  46. Robertson, W. H. & Johnson, M. A. Molecular aspects of halide ion hydration: the cluster approach. Annu. Rev. Phys. Chem. 54, 173-213 (2003).
  47. Robertson, W. H., Diken, E. G., Price, E. A., Shin, J.-W. & Johnson, M. A. Spectroscopic determination of the solvation shell in the clusters. Science 299, 1367-1372 (2003).
  48. Knorke, H., Li, H., Warneke, J., Liu, Z.-F. & Asmis, K. R. Cryogenic ion trap vibrational spectroscopy of the microhydrated sulfate dianions . Phys. Chem. Chem. Phys. 22, 27732-27745 (2020).
  49. Thaunay, F. et al. Hydration of the sulfate dianion in size-selected water clusters: From to . Int. J. Mass Spectrom. 418, 15-23 (2017).
  50. Tielrooij, K. J., Garcia-Araez, N., Bonn, M. & Bakker, H. J. Cooperativity in ion hydration. Science 328, 1006-1009 (2010).
  51. Seki, T. et al. Ions speciation at the water-air interface. J. Am. Chem. Soc. 145, 10622-10630 (2023).
  52. Devlin, S. W., Benjamin, I. & Saykally, R. J. On the mechanisms of ion adsorption to aqueous interfaces: air-water vs. oil-water. Proc. Natl Acad. Sci. USA 119, e2210857119 (2022).
  53. Netz, R. R. & Horinek, D. Progress in modeling of ion effects at the vapor/water interface. Annu. Rev. Phys. Chem. 63, 401-418 (2012).
  54. Duignan, T. T., Parsons, D. F. & Ninham, B. W. Ion interactions with the air-water interface using a continuum solvent model. J. Phys. Chem. B 118, 8700-8710 (2014).
  55. Levin, Y., dos Santos, A. P. & Diehl, A. lons at the air-water interface: an end to a hundred-year-old mystery? Phys. Rev. Lett. 103, 257802 (2009).
  56. Ghosal, S. et al. Electron spectroscopy of aqueous solution interfaces reveals surface enhancement of halides. Science 307, 563-566 (2005).
  57. Petersen, P. B. & Saykally, R. J. Confirmation of enhanced anion concentration at the liquid water surface. Chem. Phys. Lett. 397, 51-55 (2004).
  58. Kusaka, R., Nihonyanagi, S. & Tahara, T. The photochemical reaction of phenol becomes ultrafast at the air-water interface. Nat. Chem. 13, 306-311 (2021).
  59. Lesnicki, D., Wank, V., Cyran, J. D., Backus, E. H. G. & Sulpizi, M. Lower degree of dissociation of pyruvic acid at water surfaces than in bulk. Phys. Chem. Chem. Phys. 24, 13510-13513 (2022).
  60. Auer, B. M. & Skinner, J. L. IR and Raman spectra of liquid water: theory and interpretation. J. Chem. Phys. 128, 224511 (2008).
  61. Corcelli, S. A. & Skinner, J. L. Infrared and Raman line shapes of dilute HOD in liquid and from 10 to . J. Phys. Chem. A 109, 6154-6165 (2005).
Publisher’s note Springer Nature remains neutral with regard to jurisdictional claims in published maps and institutional affiliations.
Open Access This article is licensed under a Creative Commons Attribution 4.0 International License, which permits use, sharing, adaptation, distribution and reproduction in any medium or format, as long as you give appropriate credit to the original author(s) and the source, provide a link to the Creative Commons license, and indicate if changes were made. The images or other third party material in this article are included in the article’s Creative Commons license, unless indicated otherwise in a credit line to the material. If material is not included in the article’s Creative Commons license and your intended use is not permitted by statutory regulation or exceeds the permitted use, you will need to obtain permission directly from the copyright holder. To view a copy of this license, visit http://creativecommons. org/licenses/by/4.0/.
© The Author(s) 2024

طرق

محاكاة من البداية

تم إجراء حسابات نظرية دالة الكثافة باستخدام حزمة CP2K عند مستوى نظرية revPBE-D3(0). لقد أظهر هذا الاختيار أنه يوفر تسوية ممتازة من حيث جودة الوصف للماء السطحي والتكلفة الحسابية المطلوبة . استخدمنا مجموعات أساس TZV2P. تم وصف الإلكترونات الأساسية بواسطة نموذج Goedecker-Teter-Hutter الزائف، وتم تعيين قطع كثافة الفضاء الحقيقي إلى 320 Ry. استخدمنا خلية محاكاة بأبعاد . تم نمذجة و 4.5 M و 7.5 M من محلول NaOH بواسطة خلية محاكاة تحتوي على شريحة مصنوعة من و 152 جزيء ماء و و 12 جزيء NaOH، على التوالي. تتوافق هذه الشرائح من NaOH (aq.) مع تركيزات اسمية من و 3.75 M، على التوالي. وُجد أن سمك الشريحة هو في جميع الحالات. تم إجراء المحاكاة لـ و NaI في خلايا محاكاة أكبر بأبعاد وتم نمذجتها بواسطة شريحة مصنوعة من 248 جزيء ماء وستة جزيئات هاليد الصوديوم. في هذه الحالات، وُجد أن سمك الشريحة هو . تم إجراء محاكاة MD لأملاح هاليد الصوديوم باستخدام حزمة CP2K. لكل ملح، قمنا بإعداد عشرة إحداثيات أولية مختلفة وأجرينا ما مجموعه 400 ps في مجموعة (NVT) الكانونية التي تتحكم فيها ترموستات إعادة تسريع السرعة العشوائية ( ) مع درجة حرارة مستهدفة تبلغ 300 كلفن لضمان التوازن الصحيح لتوزيع الأيونات.

تدريب NN

تم تدريب الشبكة العصبية عالية الأبعاد Behler-Parinello باستخدام وفقًا لاستراتيجية التعلم النشط الموضحة في المرجع 66. تم الحصول على بيانات المرجع من مسارين مستقلين بطول 20 ps لكل تركيز، تم تسخينهما مسبقًا عند 300 كلفن. قمنا بتدريب أربع شبكات عصبية مختلفة تتوافق مع الماء النقي و NaOH (aq.) مع تركيزات اسمية من و 3.75 M. حاولنا أيضًا الحصول على شبكة عصبية لتركيزات أعلى، وهي 5.0 M NaOH، لكن لم نتمكن من الحصول على نموذج مستقر يمكنه العمل لأكثر من 100 ps. تم إجراء المحاكاة لـ 0.675 M NaOH (aq.) باستخدام الشبكة العصبية المدربة على بيانات 1.25 M NaOH (aq.) دون أي مشكلة في الاستقرار. يمكن تلخيص إجراء التدريب كما يلي. بدأنا التدريب بـ 40 هيكلًا مختارًا عشوائيًا وقمنا بتدريب ستة نماذج شبكة عصبية مختلفة لتشكيل نموذج لجنة . تم استخدام الاختلاف بين نماذج الشبكة العصبية لتحديد التكوينات الأكثر صلة، والتي تمت إضافتها على دفعات من 20، حتى لا يمكن تحسين الاختلاف أكثر. في المجموع، جمعنا حوالي 300 هيكل، وحصلنا على أخطاء جذر متوسط المربعات للطاقة والقوة لكل من مجموعات التدريب والاختبار أقل من 1 ميلي إلكترون فولت لكل ذرة و ، على التوالي. من المعروف أن هذه التقديرات العامة للدقة تعطي تمثيلًا دقيقًا لسطح الطاقة المرجعية . تم تقديم منحنيات التدريب ومخططات ارتباط القوة-القوة في المعلومات التكملية. من الجدير بالذكر أن بنية الشبكة العصبية المستخدمة في هذه المقالة لا تشمل التأثيرات بعيدة المدى بشكل صريح . ومع ذلك، نظرًا لأننا استخدمنا شريحة صغيرة نسبيًا وقطع 6 Å لوصف البيئات الذرية، والتي تصبح فعليًا في حسابات القوة ، يمكن وصف معظم أجزاء التفاعلات الكهروستاتيكية بشكل كافٍ . في الواقع، تم استخدام بنية مماثلة لنمذجة محاليل NaOH المائية الكثيفة وحصلت على توافق جيد جدًا مع النتائج التجريبية .

محاكاة MD لـ NN

تم إجراء عمليات الإنتاج لمحلول NaOH باستخدام برنامج i-PI المتصل بحزمة LAMMPS . لكل تركيز، قمنا بإعداد 40 إحداثية أولية مختلفة وأجرينا ما مجموعه 1 نانوثانية في مجموعة NVT التي تتحكم فيها ترموستات إعادة تسريع السرعة العشوائية مع درجة حرارة مستهدفة تبلغ 300 كلفن لضمان التوازن الصحيح لتوزيع الأيونات. تم حساب الواجهات الفورية باستخدام طريقة Willard-Chandler . تم حساب ssVVCF باستخدام نافذة Hahn لمدة 1 ps
وتم الحصول عليها من خلال متوسط 40 مسارًا مستقلًا بمدة 200 بيكوثانية تم تنفيذها من إحداثيات أولية غير مترابطة مستخرجة من مسارات NVT. كانت خطوة الزمن المستخدمة في تكامل معادلة الحركة في جميع الحالات 0.5 فيكوتانية. ما لم يُذكر خلاف ذلك، فإن التصنيف كـ تم إجراء دراسة لجزيء الماء من خلال افتراض أن كل ذرة هيدروجين مرتبطة تساهميًا حصريًا بأقرب ذرة أكسجين لها. . لقد لاحظنا حوالي نقل الأحداث لكل نمط في مسارات NVE النموذجية بمدة 200 بيكوثانية (الشكل التوضيحي 25). أخيرًا، اعتبرنا جزيء الماء مرتبطًا بـ أو إلى إذا كانت المسافة بين الأكسجين والأكسجين أقل من Åأو إذا كانت المسافة بين الأكسجين والصوديوم أقل من Åعلى التوالي. لقد تحققنا من أن المسافات القصوى المختلفة قليلاً لم تؤثر نوعياً على النتائج المبلغ عنها.

تحضير العينة

تم الحصول عليه من ألفا أيسر. , ( ) ، ( ) ، ( ) و ( ) تم الحصول عليها من سيغما ألدريتش. هذه المواد الكيميائية، باستثناء وتم استخدام NaBr دون مزيد من التنقية في الدراسة. وتم خبز NaBr في فرن لمدة 8 ساعات قبل التجارب لإزالة الملوثات العضوية. تم الحصول على ماء نقي من نظام ميلي-كيو (مقاومة من خلال إذابة الملح في الماء النقي، حصلنا على تركيزات مختلفة من محاليل الملح. تم تحضير محلول NaI حديثًا قبل ساعة من القياس لتجنب أكسدة أيونات اليوديد. قبل القياسات، تم تغطية جميع المحاليل بورق الألمنيوم لمنع التفاعل الضوئي من الضوء. تم إجراء جميع القياسات تحت ظروف تطهير النيتروجين.

طيفية SFG عالية الدقة

لعينات محلول NaOH المائي، نستخدم هندسة شعاع غير متعامد مع نظام ليزر مضخم تكراري Ti:sapphire (Spitfire Ace، Spectra-Physics، مركّز عند -مدة نبضة fs، طاقة النبض معدل التكرار). تم توجيه جزء من الناتج إلى شكل نبضة عدسة أسطوانية شبكية لإنتاج نبضة مرئية ضيقة النطاق ( طاقة النبضة عند موضع العينة، العرض الكامل عند نصف الحد الأقصى (FWHM) لـ )، بينما تم استخدام الجزء الآخر لتوليد نبضة IR عريضة النطاق ( طاقة النبضة عند موضع العينة، عرض النبضة الكامل عند نصف الحد الأقصى ) من خلال مضخم بصري برامترى (OPA؛ تحويل الضوء TOPAS-C) مع ثنائي كبريتيد الفضة والغاليوم بلورة. تم تركيز الأشعة تحت الحمراء والمرئية أولاً على طبقة من ZnO بسماكة 200 نانومتر على طبقة بسماكة 1 مم نافذة لتوليد إشارة المذبذب المحلي (LO) بطريقة مشابهة للمرجع 77. تم تجميع ثلاثة أشعة باستخدام مرآة بارابولية غير محورية. تم وضع لوحة زجاجية من السيليكا المنصهرة (بسماكة 1.5 مم) في المسار البصري لإشارة LO، مما يسمح بتعديل الطور لإشارة LO. ثم، تم إعادة تركيز الأشعة المرئية وLO وIR بواسطة مرآة بارابولية غير محورية عند زوايا سقوط و في واجهة عينة الحل، على التوالي. تداخل إشارة SFG من العينة مع إشارة SFG من LO، مما أدى إلى توليد تداخل SFG. ثم تم تفريق تداخل SFG إلى مطياف (Shamrock 303i، Andor Technology) وتم الكشف عنه بواسطة كاميرا جهاز مرتبط بالشحن (Newton، Andor Technology). لمراقبة تغير ارتفاع سطح العينة بسبب تبخر الماء، استخدمنا مستشعر إزاحة الارتفاع (CL-3000، Keyence).
بالنسبة لبقية محاليل الإلكتروليت (أي، ، و عينات مائية)، قمنا بقياس طيف HD-VSFG باستخدام هندسة شعاع متوازٍ مع مكبر مضخم تي: ياقوت (Spitfire Ace، Spectra-Physics، مركّز عند مدة النبضة طاقة النبض معدل التكرار). تم استخدام جزء من الناتج لتوليد نبضة IR عريضة النطاق في OPA مع كريستال طاقة النبضة عند موضع العينة، عرض النبضة الكامل عند نصف الحد الأقصى ). الجزء الآخر من المخرجات تم توجيهه من خلال شكل نبضي يتكون من نظام مرآة أسطوانية شبكية لتوليد نبضة مرئية ضيقة النطاق مع
عرض نطاق ( طاقة النبض عند موضع العينة). تم تركيز شعاع الأشعة تحت الحمراء والضوء المرئي أولاً في 20 – بسمك -لوح كوارتز مقطوع كـ LO. ثم تم تمرير هذه الأشعة بشكل متوازي من خلال سمك 2 مم لوحة لتعديل الطور ومركزة على سطح العينة بزاويا سقوط . تداخل إشارة SFG من العينة مع إشارة LO، مما أدى إلى توليد تداخل SFG. تم تفريق تداخل SFG إلى جهاز مطياف (Teledyne Princeton Instruments, HRS-300) وتم الكشف عنه بواسطة كاميرا متصلة بالشحن مبردة بالنيتروجين السائل (Teledyne Princeton Instruments, PyLoN).
طيف التعقيد للنفاذية غير الخطية من الدرجة الثانية ) تم الحصول عليها من خلال تحليل فورييه لتداخل SFG وتم تطبيعها بواسطة كريستال كوارتز مقطوع. ما لم يُذكر خلاف ذلك، تم إجراء جميع القياسات باستخدام (تشير إلى – و تركيبة الاستقطاب (استقطاب SFG، الأشعة المرئية والأشعة تحت الحمراء، على التوالي). لاستخدامنا في التحليل، استخدمنا بيانات بدون تصحيح عامل فريسنل.

توفر البيانات

البيانات المتعلقة بالأرقام وملفات الإدخال لإعادة إنتاج محاكاة ab initio وNN متاحة علىhttps://gitlab.com/lit-man90/electrolytesolutions-siالمسارات الأولية المرجعية المستخدمة لتدريب نماذج الشبكات العصبية متاحة للجمهور على زينودوhttps://doi.org/10.5281/zenodo.10214530). تم توفير بيانات المصدر مع هذه الورقة.

توفر الشيفرة

جميع الأكواد المستخدمة في هذا العمل متاحة مجانًا ويمكن العثور عليها في المراجع المقابلة المقدمة في الطرق.

References

  1. Kühne, T. D. et al. CP2K: an electronic structure and molecular dynamics software package-Quickstep: efficient and accurate electronic structure calculations. J. Chem. Phys. 152, 194103 (2020).
  2. Ohto, T. et al. Accessing the accuracy of density functional theory through structure and dynamics of the water-air interface. J. Phys. Chem. Lett. 10, 4914-4919 (2019).
  3. Singraber, A., Morawietz, T., Behler, J. & Dellago, C. Parallel multistream training of high-dimensional neural network potentials. J. Chem. Theory Comput. 15, 3075-3092 (2019).
  4. Singraber, A., Behler, J. & Dellago, C. Library-based LAMMPS implementation of high-dimensional neural network potentials. J. Chem. Theory Comput. 15, 1827-1840 (2019).
  5. Schran, C. et al. Machine learning potentials for complex aqueous systems made simple. Proc. Natl Acad. Sci. USA 118, e2110077118 (2021).
  6. Schran, C., Brezina, K. & Marsalek, O. Committee neural network potentials control generalization errors and enable active learning. J. Chem. Phys. 153, 104105 (2020).
  7. Niblett, S. P., Galib, M. & Limmer, D. T. Learning intermolecular forces at liquid-vapor interfaces. J. Chem. Phys. 155, 164101 (2021).
  8. Gao, A. & Remsing, R. C. Self-consistent determination of long-range electrostatics in neural network potentials. Nat. Commun. 13, 1572 (2022).
  9. Cox, S. J. Dielectric response with short-ranged electrostatics. Proc. Natl Acad. Sci. USA 117, 19746-19752 (2020).
  10. Hellström, M. & Behler, J. Concentration-dependent proton transfer mechanisms in aqueous NaOH Solutions: from acceptor-driven to donor-driven and back. J. Phys. Chem. Lett. 7, 3302-3306 (2016).
  11. Hellström, M., Ceriotti, M. & Behler, J. Nuclear quantum effects in sodium hydroxide solutions from neural network molecular dynamics simulations. J. Phys. Chem. B 122, 10158-10171 (2018).
  12. Kapil, V. et al. i-PI 2.0: a universal force engine for advanced molecular simulations. Comput. Phys. Commun. 236, 214-223 (2019).
  13. Thompson, A. P. et al. LAMMPS-a flexible simulation tool for particle-based materials modeling at the atomic, meso and continuum scales. Comput. Phys. Commun. 271, 108171 (2022).
  14. Bussi, G., Donadio, D. & Parrinello, M. Canonical sampling through velocity rescaling. J. Chem. Phys. 126, 14101 (2007).
  15. Willard, A. P. & Chandler, D. Instantaneous liquid interfaces. J. Phys. Chem. B 114, 1954-1958 (2010).
  16. Vanselous, H. & Petersen, P. B. Extending the capabilities of heterodyne-detected sum-frequency generation spectroscopy: probing any interface in any polarization combination. J. Phys. Chem. C 120, 8175-8184 (2016).

شكر وتقدير

نشكر C.-C. Yu على الدعم التجريبي، وM. Grechko وS. J. Cox على المناقشات البصيرة والتعليقات المفيدة على الورقة، ومبادرة MaxWater التابعة لجمعية ماكس بلانك على الدعم المالي. تم تمويل Y.L. جزئيًا من قبل مشروع Deutsche Forschungsgemeinschaft (DFG، مؤسسة البحث الألمانية) رقم 467724959، الممول من الاتحاد الأوروبي (ERC، n-AQUA، 101071937). الآراء والأفكار المعبر عنها هي آراء المؤلفين فقط ولا تعكس بالضرورة آراء الاتحاد الأوروبي أو الوكالة التنفيذية لمجلس البحث الأوروبي. لا يمكن تحميل الاتحاد الأوروبي أو الجهة المانحة المسؤولية عنها.

مساهمات المؤلفين

صمم Y.L. و K.-Y.C. و T.S. و Y.N. و M.B. البحث. قام Y.L. بإجراء المحاكاة، وقام K.-Y.C. و T.S. بإجراء القياسات التجريبية وتحليل البيانات. ناقش جميع المؤلفين النتائج وكتب Y.L. النسخة الأولية من الورقة. قام جميع المؤلفين بمراجعة والمساهمة في وتدقيق الورقة النهائية والمعلومات التكميلية.

تمويل

تم توفير تمويل الوصول المفتوح من قبل جمعية ماكس بلانك.

المصالح المتنافسة

يعلن المؤلفون عدم وجود مصالح متنافسة.

معلومات إضافية

معلومات إضافية النسخة الإلكترونية تحتوي على مواد إضافية متاحة علىhttps://doi.org/10.1038/s41557-023-01416-6.
يجب توجيه المراسلات والطلبات للحصول على المواد إلى يائير ليتمان أو ميشا بون.
تُعرب مجلة ناتشر كيميستري عن شكرها للمراجعين المجهولين على مساهمتهم في مراجعة هذا العمل.
معلومات إعادة الطباعة والتصاريح متاحة علىwww.nature.com/reprints.

  1. معهد ماكس بلانك لبحوث البوليمرات، ماينز، ألمانيا. قسم الكيمياء يوسف حامد، جامعة كامبريدج، كامبريدج، المملكة المتحدة.
    ساهم هؤلاء المؤلفون بالتساوي: يائير ليتمان، كوو-يانغ تشيانغ. البريد الإلكتروني: yl899@cam.ac.uk; bonn@mpip-mainz.mpg.de

Journal: Nature Chemistry
DOI: https://doi.org/10.1038/s41557-023-01416-6
PMID: https://pubmed.ncbi.nlm.nih.gov/38225269
Publication Date: 2024-01-15

Surface stratification determines the interfacial water structure of simple electrolyte solutions

Received: 20 September 2022
Accepted: 7 December 2023
Published online: 15 January 2024
(A) Check for updates

Yair Litman (1) , Kuo-Yang Chiang (1) , Takakazu Seki’, Yuki Nagata® & Mischa Bonn (1)

Abstract

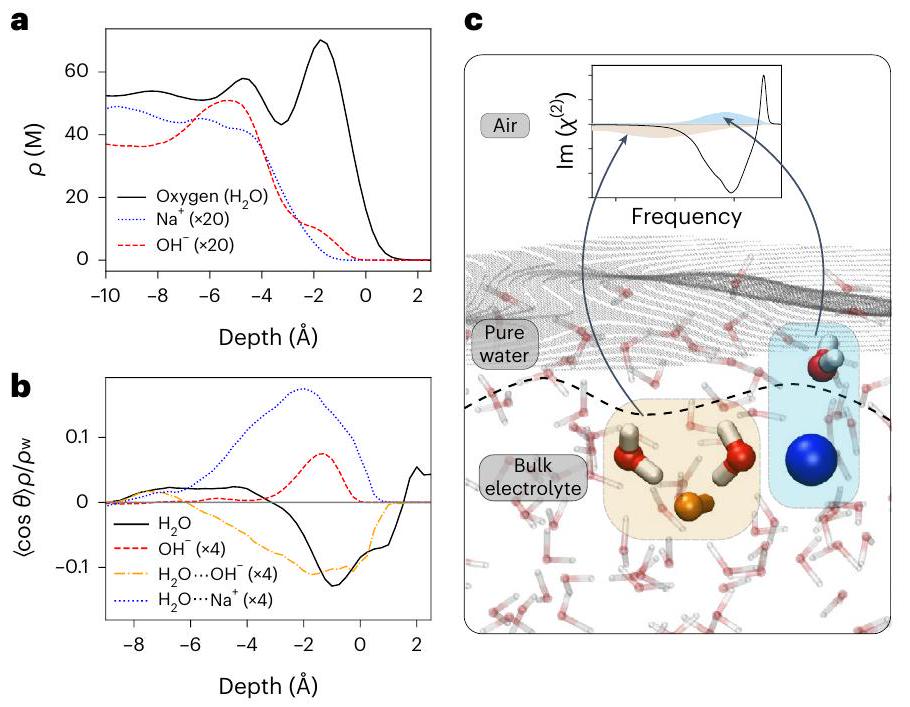
The distribution of ions at the air/water interface plays a decisive role in many natural processes. Several studies have reported that larger ions tend to be surface-active, implying ions are located on top of the water surface, thereby inducing electric fields that determine the interfacial water structure. Here we challenge this view by combining surface-specific heterodyne-detected vibrational sum-frequency generation with neural network-assisted ab initio molecular dynamics simulations. Our results show that ions in typical electrolyte solutions are, in fact, located in a subsurface region, leading to a stratification of such interfaces into two distinctive water layers. The outermost surface is ion-depleted, and the subsurface layer is ion-enriched. This surface stratification is a key element in explaining the ion-induced water reorganization at the outermost air/water interface.

Around of the Earth’s surface is covered by ocean water. The evaporation and heterogeneous aerosol formation of such electrolyte-rich solutions play an important role in atmospheric chemistry and climate science . The physicochemical processes occurring on the surface of electrolyte solutions are ultimately determined by the molecular structure of such solutions at the air/liquid interfaces. Thus, a microscopic knowledge of the ion distributions and molecular orientation at the arguably simplest air/solution interface is of paramount importance for the development of environmental models , and also serves as a starting point for understanding more complex interfaces of liquid solutions in contact with electrodes, membranes or minerals .
A widespread molecular picture of the surface of aqueous electrolyte solutions is based on results obtained with surface-specific spectroscopic techniques and force-field-based molecular dynamics (MD) simulations . In brief, polarizable heavy ions, such as and , accumulate at the interfacial region, while less polarizable ions, such as and , are depleted from the interface and remain buried in the solution. This differential distribution of anions and cations is presumed to create the so-called electric double layer (EDL), an ionic double-layer structure or simply a double layer . The assumption
of the formation of an EDL at air/liquid interfaces has played a fundamental role in describing aqueous electrolyte surfaces .
It is challenging to obtain molecular-level insights into the local ion distribution and water structure at the surface of electrolyte solutions. Vibrational sum-frequency generation (VSFG) is a surface-specific technique that directly probes the response from molecular vibrations interfaces. Atomic ions support no vibrations, so their behaviour can only be inferred indirectly from the VSFG response of the water, typically invoking the EDL picture. VSFG signal intensity variations in the region upon adding salt have been attributed to excess accumulation of cations or anions at the interface . Yet, discrepancies have recently become evident, and a unifying picture is absent in the literature. For example, although most polarizable force field-based calculations predict a strong enhancement of the concentration at the interface , in agreement with measured surface excess free energy , measurements reported by Raymond and colleagues concluded a lack of detectable surface enhancement of polarizable anions through a careful design of isotopic dilution experiments, in agreement with more recent ab initio simulations .
Fig. 1|Experimental HD-VSFG spectra at the air/electrolyte solutions interface. , HD-VSFG spectra for 1 M HCl solution (orange; ), 1.5 M CsF solution (pink; b), 1.5 M NaCl solution (red; c) and 1.0 M NaOH solution (blue; d). Data are presented as mean values over three , three , four and nine independent datasets. Error bars represent the corresponding 95% confidence interval assuming a two-sided Student’s distribution. The free and hydrogen-bond bands are altered with respect to the pure water reference for the HCl case (a), whereas for the CsF and NaCl cases, only the hydrogen-
bonded bands are modified. In all panels, the water VSFG spectra of water (black) are shown for comparison. The direction of the spectral changes is highlighted with arrows, and grey rectangles depict negligible spectral changes. , Concentration dependence of the HD-VSFG amplitudes, expressed as the ratio of electrolyte solution and water signals ( ), at 3,200(e), 3,450 (f) and , showing that the water structure at these air/ electrolyte interfaces is qualitatively different. Lines represent a polynomial fit used to guide the eye without physical meaning.
Progress in this area is restricted by several challenges: (1) low SFG signal levels from these types of interface; (2) the necessity for determining the signal phase (by heterodyne detection) to record unambiguous data; (3) the insufficiency of experimental data alone to disentangle spectral components in aqueous solutions unambiguously, as the water VSFG response is often broad and featureless .
In this Article we overcome these challenges by combining high-level heterodyne-detected VSFG (HD-VSFG) data with neural network (NN)-aided ab initio MD (AIMD) simulations and, to obtain a unifying picture, we study the structure of the interface of ten electrolyte solutions, namely , and . HD-VSFG gives direct access to and allows disentangling the non-resonant background in the HD-VSFG spectra, thereby revealing subtle but essential details in the actual resonant spectra. By systematically changing the salt concentration and comparing HD-VSFG spectra with simulated spectra, we show that the formation of an EDL cannot account for the HD-VSFG spectra of the sodium halide salts and other electrolytes, the only exceptions among the considered electrolytes being HCl and , for which the hydrated proton and the perchlorate have very high surface propensity. Combined experimental data and simulations with ab initio quality prove that subsurface enrichment of ions a few angstroms below the air/electrolyte solution dictates the interfacial aqueous structure. This depiction provides a more accurate understanding of the interfacial structure of most typical electrolyte solutions, highlighting that the conventional classifications of ions’ surface propensity as ‘surface enriched’ or ‘surface depleted’ are only two limiting scenarios within a broader range of behaviours.

Results and discussion

Shortcomings of the EDL model for air/electrolyte interfaces

Figure 1 shows the spectra for water and different electrolytes solutions (Fig. 1a-d). We first focus on the spectrum at the water-air interface. The spectrum of pure water shows a sharp positive peak centred at and a negative signal around . The peak arises from the free group of the topmost interfacial water, and the band arises from the
hydrogen-bonded group of the interfacial water. The positive (negative) sign of the stretch mode indicates that the group points up to the air (down to the bulk).
When compared to the data of pure water, the spectrum of the HCl solution shows a decrease in the free stretch band (less positive) and a decrease of the hydrogen-bonded stretch band (more negative). The decrease of the free peak is an unambiguous indication that protons reside on the topmost layer by capping the free groups with hydronium ions. The surface propensity of protons has been confirmed experimentally and theoretically in the past. In contrast to the HCl solution case, the spectra for the and CsF solutions show that these ions modify the hydrogen-bonded band by enhancing and/or reducing their amplitudes, but the free band remains largely unaffected. The unchanged free peak manifests that the free groups of the interfacial water molecules are not capped by these ions.
Figure shows the concentration dependence of the and amplitudes (the free peak, and the high- and low-frequency sides of the hydrogen-bonded stretch bands, respectively). and ions do not affect the free O-H peak amplitude significantly within the considered concentration range, unlike the hydronium ions. In contrast, the hydrogen-bonded band amplitudes change significantly for all the ions, although with different magnitudes and signs. These results question the use of one unique model to describe the diverse behaviour of ions at the interface.
Note that our spectra of the NaCl and NaOH solutions, as well as the pure water, differ from the reported data, particularly in the region . Phase inaccuracies in the early measurement created an artificial positive peak below . Thanks to the recent procedure of accurate phase determination, we could obtain the phase accurately in our HD-VSFG spectra. Indeed, our air/water interface data agree with recent reports .

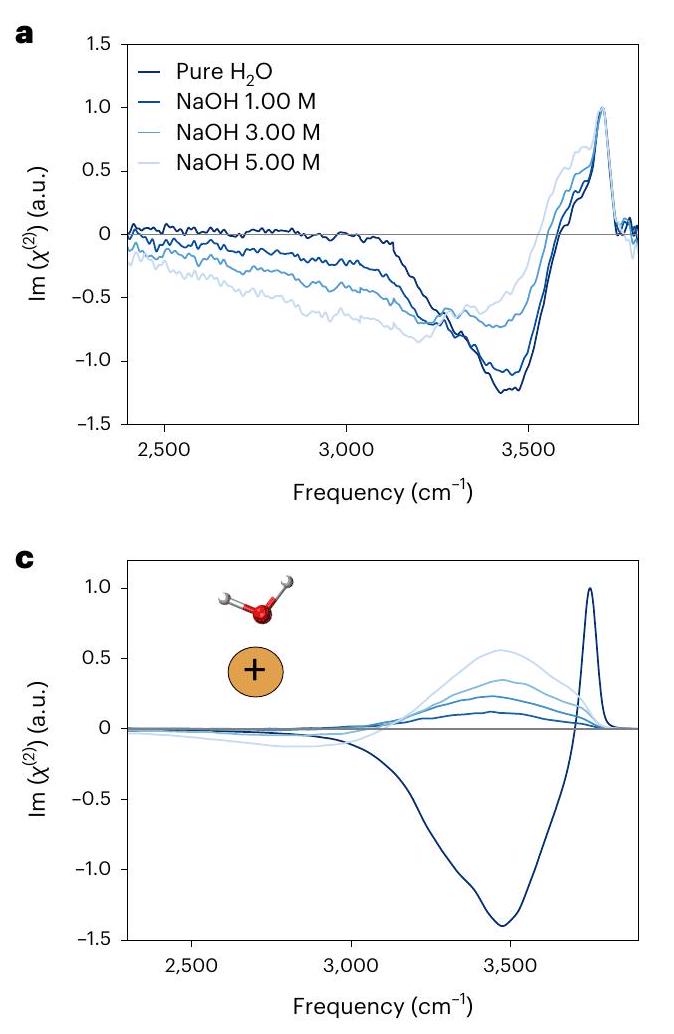
The case of the air/ NaOH (aq.) interface

To explore why the free peak is unchanged, but the hydrogenbonded band is changed, upon the addition of salt, we carried out
Fig. 2 | Experimental and theoretical VSFG spectra of NaOH aqueous solutions at room temperature. a, Experimental imaginary part of spectra obtained for water, and 5.00 M NaOH aqueous solutions. b, Theoretical prediction based on the ssVVCF methodology . Concentrations are obtained from the bulk region of the slab. Linearly scaled experimental data are depicted with dashed lines to ease comparison. c, Contribution to the theoretical spectra by the water molecules in the vicinity of
ions. d, Contribution to the theoretical spectra by the OH bonds coordinating anions. and disentangle the opposing mechanisms of the spectral changes and allow identification of their molecular origin. The pure water spectrum is shown in all panels in black as a reference. The theoretical spectra have been corrected by the frequency dependence of the transition dipole and polarizability moments . A reference zero line has been added in grey.
theoretical calculations of the VSFG spectra. Among and NaOH , we decided to investigate the NaOH spectrum in more detail by simulating its HD-VSFG spectra, because NaOH serves as a representative of the electrolytes that do not perturb the free band, and it shows the most drastic change of the HD-VSFG features. Calculation of the VSFG spectra for water is at least ten times more expensive than bulk spectroscopies such as Raman or infrared (IR) spectroscopy , because the signal comes from only very few water layers, and the signal arising from bulk should correctly be averaged to zero. Moreover, the description of bond-breaking and -formation events, as well as the need for accurate spectra, demand going beyond classical force fields and performing ab initio calculations . The latter demands a considerably greater computational effort, which explains why ab initio calculations of SFG spectra are scarce in the literature. To overcome this daunting computational cost, we carried out NN-AIMD simulations , which allowed us to perform the required simulations at a fraction of the computational cost, while preserving the underlying quantum-mechanical accuracy.
Figure 2a,b shows the experimental and theoretical HD-VSFG data, respectively. Comparison of experiment and simulation shows that our simulations capture the two main spectral changes correctly. For both sets of spectra, the addition of NaOH ions triggers a decrease in the hydrogen-bonded negative signal between and it becomes less negative-and the emergence of a broad-continuum negative signal in the region. The free remains unperturbed. The simulations capture the main trends observed experimentally and reproduce the described spectral changes with increasing base concentration. They also lack the shoulder at
arising from the asymmetric stretching mode in water molecules, which donate two hydrogen bonds and accept one , due to the well-known limitations of the surface-specific velocity-velocity correlation function (ssVVCF) approximation . Unlike previous simulations based on classical force fields , our NN-AIMD results correctly predict no SFG signal for pure water below . Further validation tests are provided in Supplementary Information.
Having validated our theoretical framework, we proceed with an analysis of the simulated spectra. Figure 2c,d present the spectra contributed by selected water molecules in the proximity of and , respectively. Water molecules coordinated to ions contribute to a positive signal between 3,200 and , and the bonds of water molecules coordinated to anions are responsible for the negative continuum. The latter assignment is consistent with previous studies of NaOH in bulk and water clusters , where the continuum band is also attributed to the solvation of species. Note that the continuum that extends below does not arise from the bulk contributions, because the bulk contributions have only a small contribution below , unlike the spectra shown in Fig. 2d ref. 40,41.
This spectral decomposition strongly indicates that the HD-VSFG spectra at the electrolyte air/solution interface ( ) can be described as the sum of the VSFG spectrum of (unperturbed) water at the air/water interface ( ), of water oriented by the cation ( ), and that of water oriented by the anion ( ):
Fig. 3 | Microscopic analysis of the . profiles of the densities (a) and the average angle of the bisector of water molecules and bond axis with respect to the surface normal (b) for the 2.3 M NaOH solution. The origin point is defined as the position of the instantaneous liquid interface. In a, oxygen atoms of the water molecules, and are plotted in black, blue and red, respectively. In , water molecules without ions in their vicinity are in black, in red, water molecules in the vicinity of ions in blue and water molecules in the vicinity of ions in orange. A negative (positive) indicates a net down-orientation towards the bulk of the solution (up-orientation towards the air). Values are scaled by the density relative to the water density. Some curves are further scaled for clarity. c, A representative snapshot of the MD simulations. and are highlighted in blue and orange, respectively. Selected water molecules coordinated to the ions that are responsible for the observed changes in the HD-VSFG spectrum are also highlighted. The instantaneous air/liquid interface is depicted by a grey surface and the dashed lines represent the interfaces between pure water and bulk electrolyte solution. The and water molecules that give rise to the changes in the VSFG spectra have opposite polarization and lie in an interfacial region depleted of ions. For clarity, and water molecules giving rise to the changes in the VSFG spectra are marked with lightblue and orange areas, respectively.
where is a parameter proportional to the salt concentration, and we have defined the electrolyte contribution, , for later convenience. Note that also includes effects due to water displacement, and although the formation of ion pairs has not been explicitly included, it could, in principle, be added as additional contributions to or absorbed into .
This interpretation differs from the conventional EDL in which cationic and anionic contributions are entangled. Within the EDL picture, it is assumed that the local electric field created by the charge separation at the interface induces a net average orientation of the transition dipole moments of the water molecules in the topmost layers. However, such a scenario cannot account for the simultaneous decrease and increase in the signal around 3,000 and , respectively. Two spectral changes with contrary signs require alignment with opposite orientations, a scenario that cannot be described in the framework of the EDL picture.
To further explore the ion distribution near the interfaces, we computed the density profiles for the different species, which are displayed in Fig. 3a. Both and ions are repelled from the interface, giving rise to subsurface enrichment. Figure 3b presents the orientation profile for water, and water molecules coordinated to and . The water orientation curve shows a slightly negative orientation, in agreement with the literature .
The few anions within of the instantaneous water interface show a clear net orientation with their hydrogen atoms pointing towards the vapour phase. However, the contribution to the overall signal is minor, because only very few groups are present at this depth. Indeed, most anions are over below the instantaneous water interface, without a net orientation. The orientation of the coordinated water is consistent with the predicted VSFG spectra: molecules point, on average, down to the solution, whereas water molecules are oriented upwards, towards the interface. Importantly, most of the net orientation of the coordinated builds up within a region void of and ions.
With all the previous observations in mind, we propose the following stratification model, as depicted in Fig.3c (MD snapshot). The lack of ions on the topmost layer creates a thin internal layer of ‘pure’ water. The water molecules inside this thin layer, which are next to ions, show a specific orientation along the surface normal in accordance, causing the observed changes in the spectra. On the one hand, in the case of ions, due to the spherical symmetry of the cation, only one orientation, in which the oxygen atoms reside closest to the cation, is favoured. On the other hand, and as mentioned earlier, most ions are located 3.5 Å below the instantaneous air/water interface. The hydrogen atom of the motif does not act as hydrogen-bond donor , and the oxygen atom serves as a strong hydrogen-bond acceptor, able to accept between three and five hydrogen bonds per atom . Thus, on average, ions align more water molecules pointing towards the solution than to the interface. Last but not least, inside the bulk region, the molecular orientations become randomized, producing a vanishing net orientation and therefore no additional SFG signal. In Supplementary Section 4 we present a simple one-dimensional model that showcases how the absence of ions in one region of space can lead to a distinct water alignment, as we propose here.

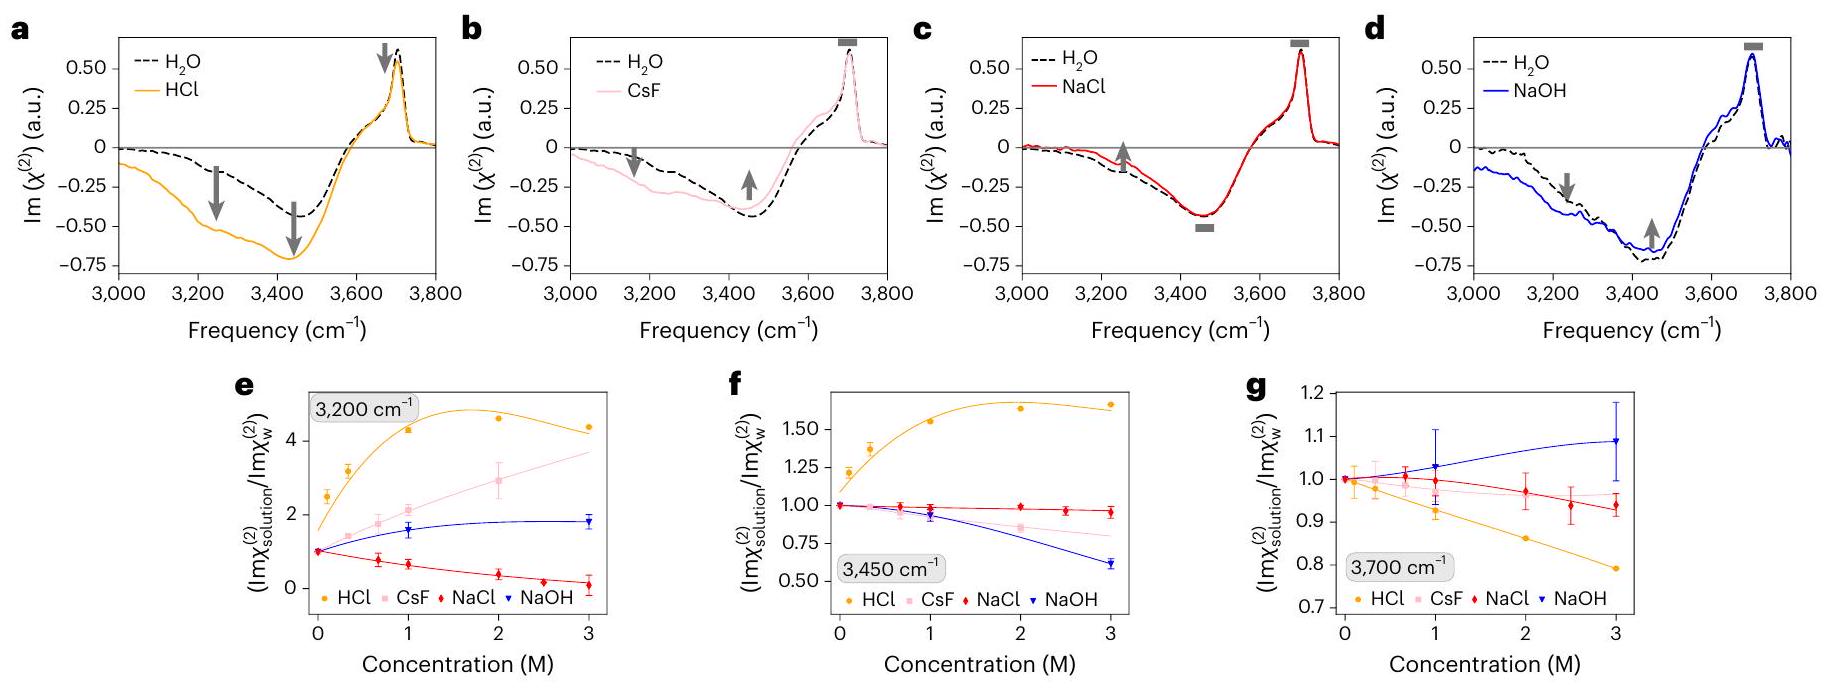
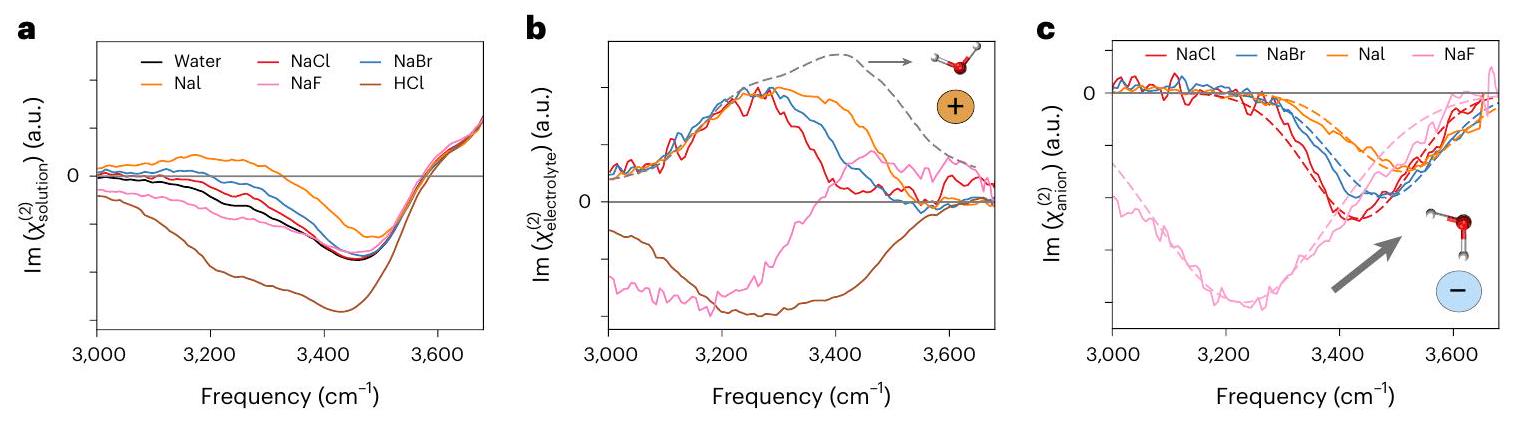
Generalization of the stratification picture to simple electrolytes

Until this point, we have restricted our focus to the aqueous NaOH solution. If the proposed picture were general and a relevant phenomenon for other electrolytes, it should be possible to find spectroscopic evidence. Thus, to verify our microscopic interpretation, we carried out HD-VSFG measurements for a series of halogen salts with varying strengths of the water-anion interaction.
We show the HD-VSFG spectra for and NaI aqueous interfaces in Fig. 4a. Because the spectral changes induced by the addition of ions are proportional to their concentration (Supplementary Section1), the total signal can be decomposed into a linear combination of the water, and , as shown in equation (1) (that is, ). The observed linearity with concentration suggests that ion pairs do not form in an appreciable amount. However, we anticipate that a notable departure from the present model at concentrations much greater than 1 M might occur depending on the specific electrolyte’s surface affinity, its tendency to form ion pairs and, ultimately, its solubility. Figure 4 b should, in principle, originate from a superposition of a positive signal emerging from the water aligned towards the interface due to its interaction with ions ( ), with a negative signal arising from the water alignment induced by the anions ( ). For NaOH , these different contributions are nicely separated, owing to the greater frequency separation between the different water molecules near cations and halide anions.
To test this assumption, we approximate , where and represent the IR and Raman intensities, respectively . This approximation is validated by the resemblance between the constructed spectrum and the spectra shown in Fig. 2c (also Supplementary Fig. 13) and is supported by the following reasoning. In scenarios with a static electric
Fig. 4 | Deconvolution of HD-VSFG into cationic- and anionic-induced spectral contributions. a, Imaginary part of the HD-VSFG spectra, , obtained for (black), 1 M NaF (pink), 1 M NaCl (red), 1 M NaBr (blue), 1 M NaI (orange) and 1 M HCl (brown) aqueous solutions. , Electrolyte contributions to the second-order response computed from . The signals are normalized to the maximum value. The geometric mean of Raman and
IR signals for , is depicted by grey dashed line. c, Estimated anionic contributions computed from , where is a scaling factor. Gaussian fits to guide the eye are shown as dashed lines. The frequency trend observed for the anionic contributions is consistent with the hydrogen-bond strength expected for the halide series and agrees with the predictions of the stratification picture.
field polarizing water or water molecules interacting with cations, but hydrogen-bonded to other water molecules, the water O-H stretch spectrum is governed by the intermolecular water-water interactions . Thus, the response of water near cations or subject to a static field should resemble the spectral features present in bulk water. This comparison has recently been used successfully to analyse the silica/water interface, demonstrating the validity of such an approximation in situations where a bulk-like response is expected .
The spectra contributions, obtained as , are displayed in Fig. 4c. The negative contribution follows the expected trend and is redshifted along the series , which follows the increase of the relative strength of the corresponding hydrogen bonds . In accordance with the proposed modelling, stronger anion-water interactions give rise to a relatively stronger negative contribution. Similar to what is observed in gas-phase clusters , the anion forms a remarkably strong hydrogen bond that blueshifts the stretch spectrum by more than compared to the other halides.
We stress that the EDL interpretation, which attributes the alignment to the local field generated by the ion separations and disregards explicit water-ion interactions, cannot explain the changes observed in the differential spectra for these electrolytes (Fig. 4b).
Figure 4 shows data from the HCl solution. As mentioned earlier, its spectrum shows a monotonic change characterized by a decrease of the signal in the hydrogen-bonded stretch region below . Together with the fact that the free signal decreases markedly with concentration (Fig. 1g and Supplementary Fig. 12), we believe that, in this system, an EDL is indeed formed, and the field induced by the charge separation actually determines the interfacial structure. Although we suspect that the water coordinated to the anion should, in principle, create a negative contribution, as it does for the other cases, the strong signal arising from proton-induced alignment masks it entirely.
In Supplementary Information, we also report the data obtained for and electrolytes. In all these cases except for , the amplitude of the free band remains, within experimental uncertainty, unaffected up to 1 M , showing a lack of ions at the topmost water layer (Supplementary Fig. 12). The determined for CsF shows positive and negative regions, which resemble the NaOH and NaF cases. Although the assumption of the formation of an EDL again fails to rationalize simultaneous spectral changes with different signs, the picture based on the surface stratification provides a straightforward interpretation: the positive and
negative peaks arise from water coordinated to the cations and anions, respectively. The deconvolution of the for the anion of CsF agrees with the one obtained for NaF (Supplementary Fig. 14) and, in a similar way, the contribution of obtained from the data is in good agreement with that of NaCl (Supplementary Fig. 15). This demonstrates the robustness of the proposed analysis. The results of and are presented in Supplementary Fig. 16, and, unlike the previous cases, the signal depends on the cation identity. Because the spectral shape reports on the hydrogen-bonding connectivity around the sulfate , this result suggests that the observed difference is due to the formation of (solvent-separated) ion pairs in (ref. 50). The solutions show the strongest perturbation of the VSFG signal, and, similar to HCl , a rapid decrease in the free signal with the addition of electrolyte. We therefore conclude that the is localized on top of the water and, indeed, forms an EDL. Similar behaviour is expected for and other organic ions .
Finally, to verify the emerging picture, we also performed ab initio MD simulations for the sodium halide salts and computed the corresponding density profiles. As shown in Supplementary Fig. 22, the air/ liquid interface of the and NaBr solutions is depleted of ions, leading to a subsurface enrichment and the aforementioned interfacial stratification. This effect is less pronounced for the NaI solution, which appears to be an intermediate situation between the rest of the halides and the proton. We note that the presented ab initio MD density profiles are largely in agreement with the simulations reported in ref. 22, with classical simulations with thermodynamically consistent force fields as reported in ref. 53, and with calculations based on continuum models . The unperturbed free signal, despite the presence of NaI, reveals that the iodide ion, as opposed to the perchlorate and the hydrated proton, is not very surface-active (Supplementary Fig.12). Moreover, the spectral changes as a function of NaI concentration are linear (Supplementary Fig. 11), as opposed to the nonlinear response observed for surface-active ( and ) ions. Combined, these observations strongly suggest that the hypothetical local field created by the charge separation according to the EDL picture plays a minimal role. Thus, we analyse NaI in the same way as the other alkali halides (also Supplementary Section V).
In summary, high-level HD-VSFG, in combination with ab initio simulations, in this case, aided by NN, has proven to be an invaluable tool to contribute to the molecular-level understanding of liquid surfaces. Unlike other techniques, such as electron spectroscopy and second harmonic generation , which provide a relatively coarse-grained view, HD-VSFG has vibrational resolution. The quantitative experimental results reported in this Article for such a large and diverse set
of electrolytes, together with the high accuracy of the measurements (Supplementary Fig. 26), enabled the observation of the subtleties of the water-ion interactions, and enabled a critical revision of the domain of applicability of the established EDL picture. More specifically, assuming the formation of an EDL, water molecules within the EDL are predicted to polarize in a single direction-either pointing upwards or downwards. Although it is possible to differentiate the effects of water interacting with ions of varying charges, these contributions would consistently exhibit the same polarity. In contrast, the stratified model accounts for dual polarization, where water can simultaneously orient both upwards and downwards, in alignment with the experimental observations. The stratification picture and the importance of water-ion interactions demonstrated in this Article substantially expand on current textbook descriptions, providing powerful insights towards resolving the air/water interface puzzle and understanding chemical reactivity at this ubiquitous interface .

Online content

Any methods, additional references, Nature Portfolio reporting summaries, source data, extended data, supplementary information, acknowledgements, peer review information; details of author contributions and competing interests; and statements of data and code availability are available at https://doi.org/10.1038/s41557-023-01416-6.

References

  1. Oum, K. W., Lakin, M. J., DeHaan, D. O., Brauers, T. & Finlayson-Pitts, B. J. Formation of molecular chlorine from the photolysis of ozone and aqueous sea-salt particles. Science 279, 74-76 (1998).
  2. Knipping, E. M. et al. Experiments and simulations of ion-enhanced interfacial chemistry on aqueous NaCl aerosols. Science 288, 301-306 (2000).
  3. Andreae, M. O. & Crutzen, P. J. Atmospheric aerosols: biogeochemical sources and role in atmospheric chemistry. Science 276, 1052-1058 (1997).
  4. Geiger, F. M. Second harmonic generation, sum frequency generation and : dissecting environmental interfaces with a nonlinear optical Swiss army knife. Annu. Rev. Phys. Chem. 60, 61-83 (2009).
  5. Björneholm, O. et al. Water at interfaces. Chem. Rev. 116, 7698-7726 (2016).
  6. Laage, D., Elsaesser, T. & Hynes, J. T. Water dynamics in the hydration shells of biomolecules. Chem. Rev. 117, 10694-10725 (2017).
  7. Gonella, G. et al. Water at charged interfaces. Nat. Rev. Chem. 5, 466-485 (2021).
  8. Shultz, M. J., Schnitzer, C., Simonelli, D. & Baldelli, S. Sum frequency generation spectroscopy of the aqueous interface: ionic and soluble molecular solutions. Int. Rev. Phys. Chem. 19, 123-153 (2000).
  9. Jungwirth, P. & Tobias, D. J. Molecular structure of salt solutions: a new view of the interface with implications for heterogeneous atmospheric chemistry. J. Phys. Chem. B 105, 10468-10472 (2001).
  10. Jungwirth, P. & Tobias, D. J. Specific ion effects at the air/water interface. Chem. Rev. 106, 1259-1281 (2006).
  11. Petersen, P. B. & Saykally, R. J. On the nature of ions at the liquid water surface. Annu. Rev. Phys. Chem. 57, 333-364 (2006).
  12. Ishiyama, T. & Morita, A. Molecular dynamics study of gas-liquid aqueous sodium halide interfaces. I. Flexible and polarizable molecular modeling and interfacial properties. J. Phys. Chem. C 111, 721-737 (2007).
  13. Liu, D., Ma, G., Levering, L. M. & Allen, H. C. Vibrational spectroscopy of aqueous sodium halide solutions and air-liquid interfaces: observation of increased interfacial depth. J. Phys. Chem. B 108, 2252-2260 (2004).
  14. Hua, W., Verreault, D., Huang, Z., Adams, E. M. & Allen, H. C. Cation effects on interfacial water organization of aqueous chloride solutions. I. Monovalent cations: and . J. Phys. Chem. B 118, 8433-8440 (2014).
  15. Garrett, B. C. Ions at the air/water interface. Science 303, 1146-1147 (2004).
  16. Tian, C., Ji, N., Waychunas, G. A. & Shen, Y. R. Interfacial structures of acidic and basic aqueous solutions. J. Am. Chem. Soc. 130, 13033-13039 (2008).
  17. Tian, C., Byrnes, S. J., Han, H.-L. & Shen, Y. R. Surface propensities of atmospherically relevant ions in salt solutions revealed by phase-sensitive sum frequency vibrational spectroscopy. J. Phys. Chem. Lett. 2, 1946-1949 (2011).
  18. Verreault, D. & Allen, H. C. Bridging the gap between microscopic and macroscopic views of air/aqueous salt interfaces. Chem. Phys. Lett. 586, 1-9 (2013).
  19. Brown, E. C., Mucha, M., Jungwirth, P. & Tobias, D. J. Structure and vibrational spectroscopy of salt water/air interfaces: predictions from classical molecular dynamics simulations. J. Phys. Chem. B 109, 7934-7940 (2005).
  20. Petersen, P. B., Johnson, J. C., Knutsen, K. P. & Saykally, R. J. Direct experimental validation of the Jones-Ray effect. Chem. Phys. Lett. 397, 46-50 (2004).
  21. Raymond, E. A. & Richmond, G. L. Probing the molecular structure and bonding of the surface of aqueous salt solutions. J. Phys. Chem. B 108, 5051-5059 (2004).
  22. Baer, M. D. & Mundy, C. J. Toward an understanding of the specific ion effect using density functional theory. J. Phys. Chem. Lett. 2, 1088-1093 (2011).
  23. Tang, F. et al. Molecular structure and modeling of water-air and ice-air interfaces monitored by sum-frequency generation. Chem. Rev. 120, 3633-3667 (2020).
  24. Das, S. et al. Nature of excess hydrated proton at the water-air interface. J. Am. Chem. Soc. 142, 945-952 (2020).
  25. Chiang, K.-Y., Dalstein, L. & Wen, Y.-C. Affinity of hydrated protons at intrinsic water/vapor interface revealed by ion-induced water alignment. J. Phys. Chem. Lett. 11, 696-701 (2020).
  26. Tse, Y.-L. S., Chen, C., Lindberg, G. E., Kumar, R. & Voth, G. A. Propensity of hydrated excess protons and hydroxide anions for the air-water interface. J. Am. Chem. Soc. 137, 12610-12616 (2015).
  27. Ji, N., Ostroverkhov, V., Tian, C. S. & Shen, Y. R. Characterization of vibrational resonances of water-vapor interfaces by phase-sensitive sum-frequency spectroscopy. Phys. Rev. Lett. 100, 96102 (2008).
  28. Nihonyanagi, S., Yamaguchi, S. & Tahara, T. Ultrafast dynamics at water interfaces studied by vibrational sum frequency generation spectroscopy. Chem. Rev. 117, 10665-10693 (2017).
  29. Nihonyanagi, S. et al. Accurate determination of complex spectrum of the air/water interface. J. Chem. Phys. 143, 124707 (2015).
  30. Ohto, T., Usui, K., Hasegawa, T., Bonn, M. & Nagata, Y. Toward ab initio molecular dynamics modeling for sum-frequency generation spectra; an efficient algorithm based on surface-specific velocity-velocity correlation function. J. Chem. Phys. 143, 124702 (2015).
  31. Behler, J. & Parrinello, M. Generalized neural-network representation of high-dimensional potential-energy surfaces. Phys. Rev. Lett. 98, 146401 (2007).
  32. Behler, J. First principles neural network potentials for reactive simulations of large molecular and condensed systems. Angew. Chem. Int. Ed. 56, 12828-12840 (2017).
  33. Stiopkin, I. V. et al. Hydrogen bonding at the water surface revealed by isotopic dilution spectroscopy. Nature 474, 192-195 (2011).
  34. Imamura, T., Ishiyama, T. & Morita, A. Molecular dynamics analysis of NaOH aqueous solution surface and the sum frequency generation spectra: is surface detected by SFG spectroscopy? J. Phys. Chem. C 118, 29017-29027 (2014).
  35. Mandal, A., Ramasesha, K., de Marco, L. & Tokmakoff, A. Collective vibrations of water-solvated hydroxide ions investigated with broadband 2DIR spectroscopy. J. Chem. Phys. 140, 204508 (2014).
  36. Hellstróm, M. & Behler, J. Structure of aqueous NaOH solutions: insights from neural-network-based molecular dynamics simulations. Phys. Chem. Chem. Phys. 19, 82-96 (2017).
  37. Chen, B. et al. First-principles study of aqueous hydroxide solutions. J. Am. Chem. Soc. 124, 8534-8535 (2002).
  38. Crespo, Y. & Hassanali, A. Unveiling the Janus-like properties of . J. Phys. Chem. Lett. 6, 272-278 (2015).
  39. Crespo, Y. & Hassanali, A. Characterizing the local solvation environment of in water clusters with AIMD. J. Chem. Phys. 144, 74304 (2016).
  40. Wen, Y.-C. et al. Unveiling microscopic structures of charged water interfaces by surface-specific vibrational spectroscopy. Phys. Rev. Lett. 116, 16101 (2016).
  41. Ohno, P. E., Wang, H., Paesani, F., Skinner, J. L. & Geiger, F. M. Second-order vibrational lineshapes from the air/water interface. J. Phys. Chem. A 122, 4457-4464 (2018).
  42. Nagata, Y., Pool, R. E., Backus, E. H. G. & Bonn, M. Nuclear quantum effects affect bond orientation of water at the water-vapor interface. Phys. Rev. Lett. 109, 226101 (2012).
  43. Schaefer, J., Backus, E. H. G., Nagata, Y. & Bonn, M. Both inter- and intramolecular coupling of O-H groups determine the vibrational response of the water/air interface. J. Phys. Chem. Lett. 7, 4591-4595 (2016).
  44. Wei, F., Urashima, S., Nihonyanagi, S. & Tahara, T. Elucidation of the pH -dependent electric double layer structure at the silica/ water interface using heterodyne-detected vibrational sum frequency generation spectroscopy. J. Am. Chem. Soc. 145, 8833-8846 (2023).
  45. Max, J.-J. & Chapados, C. IR spectroscopy of aqueous alkali halide solutions: pure salt-solvated water spectra and hydration numbers. J. Chem. Phys. 115, 2664-2675 (2001).
  46. Robertson, W. H. & Johnson, M. A. Molecular aspects of halide ion hydration: the cluster approach. Annu. Rev. Phys. Chem. 54, 173-213 (2003).
  47. Robertson, W. H., Diken, E. G., Price, E. A., Shin, J.-W. & Johnson, M. A. Spectroscopic determination of the solvation shell in the clusters. Science 299, 1367-1372 (2003).
  48. Knorke, H., Li, H., Warneke, J., Liu, Z.-F. & Asmis, K. R. Cryogenic ion trap vibrational spectroscopy of the microhydrated sulfate dianions . Phys. Chem. Chem. Phys. 22, 27732-27745 (2020).
  49. Thaunay, F. et al. Hydration of the sulfate dianion in size-selected water clusters: From to . Int. J. Mass Spectrom. 418, 15-23 (2017).
  50. Tielrooij, K. J., Garcia-Araez, N., Bonn, M. & Bakker, H. J. Cooperativity in ion hydration. Science 328, 1006-1009 (2010).
  51. Seki, T. et al. Ions speciation at the water-air interface. J. Am. Chem. Soc. 145, 10622-10630 (2023).
  52. Devlin, S. W., Benjamin, I. & Saykally, R. J. On the mechanisms of ion adsorption to aqueous interfaces: air-water vs. oil-water. Proc. Natl Acad. Sci. USA 119, e2210857119 (2022).
  53. Netz, R. R. & Horinek, D. Progress in modeling of ion effects at the vapor/water interface. Annu. Rev. Phys. Chem. 63, 401-418 (2012).
  54. Duignan, T. T., Parsons, D. F. & Ninham, B. W. Ion interactions with the air-water interface using a continuum solvent model. J. Phys. Chem. B 118, 8700-8710 (2014).
  55. Levin, Y., dos Santos, A. P. & Diehl, A. lons at the air-water interface: an end to a hundred-year-old mystery? Phys. Rev. Lett. 103, 257802 (2009).
  56. Ghosal, S. et al. Electron spectroscopy of aqueous solution interfaces reveals surface enhancement of halides. Science 307, 563-566 (2005).
  57. Petersen, P. B. & Saykally, R. J. Confirmation of enhanced anion concentration at the liquid water surface. Chem. Phys. Lett. 397, 51-55 (2004).
  58. Kusaka, R., Nihonyanagi, S. & Tahara, T. The photochemical reaction of phenol becomes ultrafast at the air-water interface. Nat. Chem. 13, 306-311 (2021).
  59. Lesnicki, D., Wank, V., Cyran, J. D., Backus, E. H. G. & Sulpizi, M. Lower degree of dissociation of pyruvic acid at water surfaces than in bulk. Phys. Chem. Chem. Phys. 24, 13510-13513 (2022).
  60. Auer, B. M. & Skinner, J. L. IR and Raman spectra of liquid water: theory and interpretation. J. Chem. Phys. 128, 224511 (2008).
  61. Corcelli, S. A. & Skinner, J. L. Infrared and Raman line shapes of dilute HOD in liquid and from 10 to . J. Phys. Chem. A 109, 6154-6165 (2005).
Publisher’s note Springer Nature remains neutral with regard to jurisdictional claims in published maps and institutional affiliations.
Open Access This article is licensed under a Creative Commons Attribution 4.0 International License, which permits use, sharing, adaptation, distribution and reproduction in any medium or format, as long as you give appropriate credit to the original author(s) and the source, provide a link to the Creative Commons license, and indicate if changes were made. The images or other third party material in this article are included in the article’s Creative Commons license, unless indicated otherwise in a credit line to the material. If material is not included in the article’s Creative Commons license and your intended use is not permitted by statutory regulation or exceeds the permitted use, you will need to obtain permission directly from the copyright holder. To view a copy of this license, visit http://creativecommons. org/licenses/by/4.0/.
© The Author(s) 2024

Methods

Ab initio simulations

Density functional theory calculations were carried out with the CP2K package at the revPBE-D3(0) level of theory. This choice has been shown to provide an excellent compromise in terms of the description quality of interfacial water and the required computational cost . We employed the TZV2P basis sets. The core electrons were described by the Goedecker-Teter-Hutter pseudopotential, and the real-space density cutoff was set to 320 Ry. We used a simulation cell with dimensions of . The and 4.5 M and 7.5 M NaOH solutions were modelled by a simulation cell containing a slab made of and 152 water molecules and and 12 NaOH molecules, respectively. These NaOH (aq.) slabs correspond to nominal concentrations of and 3.75 M , respectively. The slab thickness was found to be in all cases. The simulations for and NaI were performed in larger simulation cells with dimensions of and were modelled by a slab made of 248 water molecules and six sodium halide molecules. In these cases, the slab thickness was found to be . The MD simulations for the sodium halide salts were performed with the CP2K package. For each salt, we prepared ten different initial coordinates and carried out a total of 400 ps in the canonical (NVT) ensemble controlled by a stochastic velocity rescaling thermostat ( ) with a target temperature of 300 K to ensure the correct equilibration of the ion distribution.

NN training

The training of the Behler-Parinello high-dimensional NN was performed using the following the active-learning strategy outlined in ref. 66. The reference data were obtained from two independent 20-ps-long microcanonical (NVE) trajectories for each concentration, previously thermalized at 300 K . We trained four different NNs corresponding to pure water, and NaOH (aq.) with nominal concentrations of and 3.75 M . We also tried to obtain a NN for higher concentrations, namely 5.0 M NaOH , but could not get a stable model that could run for more than 100 ps . The simulations for 0.675 M NaOH (aq.) were performed with the NN trained on 1.25 M NaOH (aq.) data without any stability problem. The training procedure can be summarized as follows. We started the training with 40 randomly picked structures and trained six different NN models to form a committee model . The disagreement among the NN models was used to identify the most relevant configurations, which were added by batches of 20, until the disagreement across could not be improved further. In total, we collected around 300 structures, obtaining energy and force root-mean-square errors for both training and test sets below 1 meV per atom and , respectively. These overall accuracy estimates are known to yield an accurate representation of the reference potential energy surface . Training curves and force-force correlation plots are presented in Supplementary Information. It is noteworthy to mention that the NN architecture employed in this Article does not include long-range effects explicitly . However, because we used a rather small slab and a 6 -Å cutoff to describe the atomic environments, which effectively becomes in the force calulations , most parts of the electrostatic interactions can be described adequately . Indeed, a similar architecture has been used to model bulk aqueous NaOH solutions and obtained very good agreement with experimental results .

NN MD simulations

The production runs for the NaOH solutions were performed with the i-PI program connected to the LAMMPS package . For each concentration, we prepared 40 different initial coordinates and carried out a total of 1 ns in the NVT ensemble controlled by a stochastic velocity rescaling thermostat with a target temperature of 300 K to ensure the correct equilibration of the ion distribution. The instantaneous interfaces were calculated using the Willard-Chandler method . The ssVVCF were calculated using a Hahn window of 1 ps
and obtained by averaging 40 independent 200-ps trajectories carried out from uncorrelated initial coordinates extracted from the NVT trajectories. The time step employed for the integration of the equation of motions was in all cases 0.5 fs. Unless stated otherwise, the classification as either or water molecule was performed by assuming that each hydrogen was covalently bound exclusively to its nearest oxygen atom . We observed around transfer events per motif in typical 200-ps NVE trajectories (Supplementary Fig. 25). Finally, we considered a water molecule to be coordinated to or to if the oxygen-oxygen distance was below or if the oxygen-sodium distance was below , respectively. We verified that slightly different cutoff distances did not qualitatively affect the reported results.

Sample preparation

was obtained from Alfa Aesar. , ( ), ( ), ( ) and ( ) were obtained from Sigma Aldrich. These chemicals, except and NaBr , were used without further purification in the study. and NaBr were baked in an oven for 8 hat before the experiments to remove organic contaminants. Pure water was obtained from a Milli-Q system (resistance of ). By dissolving the salt with pure water, we obtained various concentrations of salt solutions. NaI solution was freshly prepared 1 h before measurement to avoid oxidation of iodide ions. Before measurements, all solutions were covered with aluminium foil to prevent photochemical reaction from light. All measurements were performed under nitrogen purge conditions.

HD SFG spectroscopy

For NaOH aqueous solution samples, we use a non-collinear beam geometry with a Ti:sapphire regenerative amplifier laser system (Spitfire Ace, Spectra-Physics, centred at -fs pulse duration, pulse energy, repetition rate). A part of the output was directed to a grating-cylindrical lens pulse-shaper to produce a narrowband visible pulse ( pulse energy at the sample position, full-width at half-maximum (FWHM) of ), while the other part was used to generate a broadband IR pulse ( pulse energy at the sample position, FWHM of ) through an optical parametric amplifier (OPA; Light Conversion TOPAS-C) with a silver gallium disulfide crystal. The IR and visible beams were first focused onto 200 -nm-thick ZnO on a 1 -mm-thick window to generate a local oscillator (LO) signal in a similar manner to ref. 77. Three beams were collimated with an off-axis parabolic mirror. A fuse-silica glass plate (thickness, 1.5 mm ) was placed in the optical path for the LO signal, allowing phase modulation for the LO signal. Then, visible, LO and IR beams were re-focused by an off-axis parabolic mirror at incident angles of and at the sample solution interface, respectively. The SFG signal from the sample interfered with the SFG signal from the LO, generating the SFG interferogram. The SFG interferogram was then dispersed into a spectrometer (Shamrock 303i, Andor Technology) and detected by a charge-coupled device camera (Newton, Andor Technology). To monitor the height change of the sample surface due to water evaporation, we used a height displacement sensor (CL-3000, Keyence).
For the other electrolyte solutions (that is, , and aqueous samples), we measured the HD-VSFG spectra on a collinear beam geometry using a Ti:sapphire regenerative amplifier (Spitfire Ace, Spectra-Physics, centred at pulse duration, pulse energy, repetition rate). A part of the output was used to generate a broadband IR pulse in an OPA with an crystal ( pulse energy at the sample position, FWHM of ). The other part of the output was directed through a pulse-shaper consisting of a gratingcylindrical mirror system to generate a narrowband visible pulse with
a bandwidth of ( pulse energy at the sample position). The IR and visible beam were first focused into a 20 – m-thick -cut quartz plate as the LO. These beams were then collinearly passed through a 2 -mm-thick plate for the phase modulation and focused onto the sample surface at angles of incidence of . The SFG signal from the sample interfered with the LO signal, generating the SFG interferogram. The SFG interferogram was dispersed into a spectrometer (Teledyne Princeton Instruments, HRS-300) and detected by a liquid-nitrogen-cooled charge-coupled device camera (Teledyne Princeton Instruments, PyLoN).
The complex spectra of second-order nonlinear susceptibility ( ) were obtained via Fourier analysis of the SFG interferogram and normalized by a -cut quartz crystal. Unless stated otherwise, all measurements were performed with an (denoting – and -polarized SFG, visible and IR beams, respectively) polarization combination. For our analysis, we used data without Fresnel factor correction.

Data availability

The data corresponding to the figures and input files to reproduce the ab initio and NN simulations are available at https://gitlab.com/lit-man90/electrolytesolutions-si. Reference ab initio trajectories used to train the NN models are publicly available at Zenodo (https://doi.org/ 10.5281/zenodo.10214530). Source data are provided with this paper.

Code availability

All the codes used in this work are freely available and can be found in the corresponding references provided in Methods.

References

  1. Kühne, T. D. et al. CP2K: an electronic structure and molecular dynamics software package-Quickstep: efficient and accurate electronic structure calculations. J. Chem. Phys. 152, 194103 (2020).
  2. Ohto, T. et al. Accessing the accuracy of density functional theory through structure and dynamics of the water-air interface. J. Phys. Chem. Lett. 10, 4914-4919 (2019).
  3. Singraber, A., Morawietz, T., Behler, J. & Dellago, C. Parallel multistream training of high-dimensional neural network potentials. J. Chem. Theory Comput. 15, 3075-3092 (2019).
  4. Singraber, A., Behler, J. & Dellago, C. Library-based LAMMPS implementation of high-dimensional neural network potentials. J. Chem. Theory Comput. 15, 1827-1840 (2019).
  5. Schran, C. et al. Machine learning potentials for complex aqueous systems made simple. Proc. Natl Acad. Sci. USA 118, e2110077118 (2021).
  6. Schran, C., Brezina, K. & Marsalek, O. Committee neural network potentials control generalization errors and enable active learning. J. Chem. Phys. 153, 104105 (2020).
  7. Niblett, S. P., Galib, M. & Limmer, D. T. Learning intermolecular forces at liquid-vapor interfaces. J. Chem. Phys. 155, 164101 (2021).
  8. Gao, A. & Remsing, R. C. Self-consistent determination of long-range electrostatics in neural network potentials. Nat. Commun. 13, 1572 (2022).
  9. Cox, S. J. Dielectric response with short-ranged electrostatics. Proc. Natl Acad. Sci. USA 117, 19746-19752 (2020).
  10. Hellström, M. & Behler, J. Concentration-dependent proton transfer mechanisms in aqueous NaOH Solutions: from acceptor-driven to donor-driven and back. J. Phys. Chem. Lett. 7, 3302-3306 (2016).
  11. Hellström, M., Ceriotti, M. & Behler, J. Nuclear quantum effects in sodium hydroxide solutions from neural network molecular dynamics simulations. J. Phys. Chem. B 122, 10158-10171 (2018).
  12. Kapil, V. et al. i-PI 2.0: a universal force engine for advanced molecular simulations. Comput. Phys. Commun. 236, 214-223 (2019).
  13. Thompson, A. P. et al. LAMMPS-a flexible simulation tool for particle-based materials modeling at the atomic, meso and continuum scales. Comput. Phys. Commun. 271, 108171 (2022).
  14. Bussi, G., Donadio, D. & Parrinello, M. Canonical sampling through velocity rescaling. J. Chem. Phys. 126, 14101 (2007).
  15. Willard, A. P. & Chandler, D. Instantaneous liquid interfaces. J. Phys. Chem. B 114, 1954-1958 (2010).
  16. Vanselous, H. & Petersen, P. B. Extending the capabilities of heterodyne-detected sum-frequency generation spectroscopy: probing any interface in any polarization combination. J. Phys. Chem. C 120, 8175-8184 (2016).

Acknowledgements

We thank C.-C. Yu for experimental support, M. Grechko and S. J. Cox for insightful discussions and helpful comments on the paper, and the MaxWater Initiative of the Max Planck Society for financial support. Y.L. was partially funded by Deutsche Forschungsgemeinschaft (DFG, German Research Foundation) project no. 467724959, funded by the European Union (ERC, n-AQUA, 101071937). Views and opinions expressed are those of the authors only and do not necessarily reflect those of the European Union or the European Research Council Executive Agency. Neither the European Union nor the granting authority can be held responsible for them.

Author contributions

Y.L., K.-Y.C., T.S., Y.N. and M.B. designed the research. Y.L. performed the simulations, and K.-Y.C. and T.S. performed the experimental measurements and analysed the data. All authors discussed the results and Y.L. wrote the initial version of the paper. All authors revised, contributed and proofread the final paper and the Supplementary Information.

Funding

Open access funding provided by Max Planck Society.

Competing interests

The authors declare no competing interests.

Additional information

Supplementary information The online version contains supplementary material available at https://doi.org/10.1038/s41557-023-01416-6.
Correspondence and requests for materials should be addressed to Yair Litman or Mischa Bonn.
Peer review information Nature Chemistry thanks the anonymous reviewers for their contribution to the peer review of this work.
Reprints and permissions information is available at www.nature.com/reprints.

  1. Max Planck Institute for Polymer Research, Mainz, Germany. Yusuf Hamied Department of Chemistry, University of Cambridge, Cambridge, UK.
    These authors contributed equally: Yair Litman, Kuo-Yang Chiang. e-mail: yl899@cam.ac.uk; bonn@mpip-mainz.mpg.de