المجلة: Scientific Reports، المجلد: 15، العدد: 1
DOI: https://doi.org/10.1038/s41598-025-98731-4
PMID: https://pubmed.ncbi.nlm.nih.gov/40325128
تاريخ النشر: 2025-05-05
DOI: https://doi.org/10.1038/s41598-025-98731-4
PMID: https://pubmed.ncbi.nlm.nih.gov/40325128
تاريخ النشر: 2025-05-05
افتح
تحسين اكتشاف سرطان الرئة غير صغير الخلايا باستخدام الشبكات العصبية التلافيفية والتعزيز التفاضلي
يظل سرطان الرئة واحدًا من الأسباب الرئيسية للوفيات المرتبطة بالسرطان في جميع أنحاء العالم، حيث إن الكشف المبكر يعد أمرًا حاسمًا لتحسين نتائج المرضى. أظهرت التقدمات الأخيرة في التعلم العميق وعدًا في تعزيز دقة التشخيص، لا سيما من خلال استخدام الشبكات العصبية التلافيفية (CNNs). تقترح هذه الدراسة دمج التعزيز التفاضلي (DA) مع الشبكات العصبية التلافيفية لمعالجة التحدي الحاسم المتمثل في الإفراط في التكيف مع الذاكرة، وهو قيد يعيق تعميم النماذج على البيانات غير المرئية. من خلال تقديم استراتيجيات تعزيز مستهدفة، مثل التعديلات في اللون، والسطوع، والتشبع، والتباين، يقوم نموذج CNN + DA بتنويع بيانات التدريب وتعزيز قوته. استخدمت الدراسة مجموعات بيانات متعددة، بما في ذلك مجموعة بيانات IQ-OTH/NCCD، لتقييم النموذج المقترح مقابل الأساليب المتقدمة الحالية. تم إجراء ضبط المعلمات باستخدام البحث العشوائي لتحسين المعلمات، مما أدى إلى تحسين الأداء بشكل أكبر. كشفت النتائج أن نموذج CNN + DA حقق دقة تبلغ 98.78%، متفوقًا على نماذج متقدمة مثل DenseNet وResNet وEfficientNetB0، بالإضافة إلى الأساليب الهجينة بما في ذلك النماذج التجميعية. بالإضافة إلى ذلك، أكدت التحليلات الإحصائية، بما في ذلك اختبارات Tukey’s HSD بعد الاختبار، على أهمية الأداء المتفوق للنموذج. تشير هذه النتائج إلى أن نموذج CNN + DA يعالج بفعالية قيود الأعمال السابقة من خلال تقليل الإفراط في التكيف وضمان تعميم موثوق عبر مجموعات بيانات متنوعة. تختتم الدراسة بأن بنية CNN + DA الجديدة توفر إطارًا قويًا ودقيقًا وفعالًا حسابيًا لكشف سرطان الرئة، مما يضعها كأداة قيمة للتطبيقات السريرية ويمهد الطريق للبحوث المستقبلية في تشخيص الصور الطبية.
الكلمات الرئيسية: توقع سرطان الرئة، الشبكات العصبية التلافيفية، زيادة الاختلاف (DA)، الإفراط في التذكر، التصوير الطبي، متانة التشخيص، EfficientNetB0
يعتمد التنبؤ المبتكر بسرطان الرئة على خوارزميات التعلم الآلي المتطورة المطبقة على ثروة من بيانات المرضى. من خلال دمج عناصر متنوعة مثل التصوير، والوراثة، والسجلات الطبية، يظهر هذا النموذج دقة ملحوظة في توقع الحوادث المحتملة. من خلال تحسين التدخل المبكر وتخصيص العلاجات، يحمل هذا النموذج القدرة على رفع نتائج المرضى في المجال الصعب لسرطان الرئة. الكشف المبكر أمر حيوي لعلاج ناجح.
تطوير نموذج CNN أحادي الأبعاد متقدم لتصنيف ودرجات سرطان الرئة غير صغير الخلايا، مستفيدًا من الرؤى المستخلصة من مجموعة TCIA لعلم الجينوم الإشعاعي لسرطان الرئة غير صغير الخلايا. نموذج MSER-SURF الهجين يدمج ميزات الورم مع البيانات السريرية لتحليل شامل.
من خلال الاستفادة من اكتشاف الأمراض بواسطة الشبكات العصبية التلافيفية، تستكشف هذه الدراسة دمج تقنية البلوكشين لتأمين البيانات في تعزيز سلامة الغذاء وتوقع سرطان الرئة.
تقديم نهج مبتكر، يستخدم شبكة عصبية تلافيفية ثنائية الأبعاد مع تحسين تاجوتشي للتعرف التلقائي على سرطان الرئة من صور الأشعة المقطعية، كما هو موضح في المرجع
يتكشف هيكل البحث مع القسم الأول الذي يتناول المقدمة. يقوم قسم “مراجعة الأدبيات” بالتنقل في المشهد الأكاديمي في مراجعة الأدبيات. يكشف قسم “المنهجية المقترحة” عن تعقيدات المنهجية المقترحة، مقدماً خريطة طريق مفصلة. يكشف قسم “النتائج والمناقشة” عن النتائج، مما يشعل مناقشات ثاقبة حول تداعياتها. يلخص قسم “الخاتمة” رؤى عميقة، مما يؤدي إلى إغلاق شامل يجمع بين نتائج الدراسة ويبرز أهميتها في السياق الأوسع لمجال البحث.
مراجعة الأدبيات
في عام 2024، إسلام وآخرون.
في عام 2024، سها وآخرون
في عام 2024، ريكو كلين وآخرون
في عام 2024، S. Kukreja وM. Sabharwa وآخرون.
في عام 2024، Zhang وآخرون.
قدم طريقة تحسين جديدة للتفكيك النادر (PSD) لاكتساب ميزات نادرة من الصور الطبية، مما عزز أيضًا تحسين النموذج.
قدم طريقة تحسين جديدة للتفكيك النادر (PSD) لاكتساب ميزات نادرة من الصور الطبية، مما عزز أيضًا تحسين النموذج.
في عام 2023، Lulu Gai وآخرون.
في عام 2023، Syeda Reeha وآخرون.
نظرًا للبيانات والموارد المتاحة، تقدم هذه الدراسة استجابة معقولة من خلال إظهار إمكانيات الطرق الجماعية كأداة قوية لتعزيز دقة وكفاءة تشخيص سرطان الرئة.
في عام 2023، R. Raza وآخرون.
في عام 2023، Nandita Gautam وآخرون.
في عام 2022، Dritsas وTrigka وآخرون.
في عام 2021، Tsou وآخرون.
بينما تركز الدراسات السابقة على التعزيز وتحسين النموذج، تتناول هذه البحث بشكل فريد مشكلة الإفراط في الذاكرة باستخدام التعزيز التفاضلي، مما يظهر أداءً متفوقًا في اكتشاف سرطان الرئة.
بيان المشكلة
تتركز مشكلة البحث على تعزيز دقة وكفاءة اكتشاف سرطان الرئة باستخدام تقنيات التعلم العميق. على الرغم من التحسينات، تكافح النماذج الحالية مع التعميم، وتنوع البيانات، وقابلية التفسير عبر طرق التصوير. من الصعب تحسين أداء النموذج، خاصة في الكشف المبكر، مع معالجة تنوع مجموعة البيانات وحدود التعزيز.
تحديات التعميم
على الرغم من أن نموذج CNN + DA يؤدي بشكل جيد على مجموعة البيانات المسيطر عليها، إلا أن قابليته للتعميم على السيناريوهات الواقعية لا تزال بحاجة إلى التحقق. تشمل التحديات التباينات غير المرئية في بروتوكولات التصوير، وخصائص المرضى، والعيوب في مجموعات البيانات السريرية. ستستكشف الدراسات المستقبلية استراتيجيات مثل التعلم بالنقل والتعديل الدقيق على مجموعات البيانات متعددة المراكز للتخفيف من هذه التحديات وضمان القابلية للتطبيق في بيئات سريرية متنوعة. لزيادة مرونة نماذج تحليل الصور الطبية، وقابليتها للتوسع، وفائدتها السريرية، يجب استكشاف دمج البيانات، والحوسبة على حافة الهاتف المحمول، وطرق التجميع. تلخص الجدول 1 الأهداف والقيود للأبحاث السابقة، مع تسليط الضوء على أهدافها ونقاط ضعفها.
فجوة البحث
بينما أحدث التعلم العميق ثورة في العديد من المجالات، بما في ذلك التصوير الطبي لاكتشاف سرطان الرئة، لا تزال هناك فجوة بحثية مستمرة تتعلق بالتحيز في الذاكرة. على الرغم من الجهود المختلفة لمعالجة التحيز العام، إلا أن التحدي الدقيق المتمثل في نماذج حفظ بيانات التدريب بدلاً من التعلم للتعميم لم يتم معالجته بشكل شامل. تركز العديد من الحلول الحالية على قضايا التحيز الأوسع، وغالبًا ما تتجاهل الجانب الدقيق ولكنه حاسم من التحيز في الذاكرة. تؤكد هذه الفجوة على الحاجة إلى بحث مخصص في استراتيجيات ومنهجيات مكافحة التحيز في الذاكرة، لضمان بقاء النماذج قوية وموثوقة، خاصة في التطبيقات الحرجة مثل التشخيص الطبي.
| المؤلف | الطريقة | الهدف | العيب | ||
| إسلام وآخرون.
|
مناقشة حول تطبيق خوارزميات التعلم العميق المختلفة في توليد وتطبيق تعزيز البيانات. قد تشمل هذه الطرق مثل الشبكات التنافسية التوليدية (GANs) أو هياكل الشبكات العصبية الأخرى التي تخلق تباينات واقعية في الصور الطبية. | تحديد الصعوبات الميدانية يشمل القيود في التقنيات الحالية أو مشاكل جودة البيانات والمسارات البحثية المستقبلية المقترحة للتعامل مع هذه الصعوبات. | يمكن أن ترفع تقنيات تعزيز البيانات المتقدمة من تعقيد النموذج وعملية التدريب، مما قد يجعل من الصعب التحقق من توقعات النموذج. يمكن أن تتسبب التعزيزات الأوسع والأكثر تعقيدًا في إطالة عملية التدريب وزيادة استهلاك الموارد، مما يؤثر بالتالي على الكفاءة العامة لتطوير النموذج. | ||
| ساها وآخرون.
|
تقدم الورقة نموذج تعلم نقل جديد يسمى VER-Net، الذي يجمع بين ثلاثة نماذج مختلفة من التعلم بالنقل لتحسين تشخيص سرطان الرئة من صور الأشعة المقطعية. | استخدام فوائد التعلم بالنقل ودمج عدة نماذج يساعد على زيادة دقة تصنيف سرطان الرئة. كما يسعى العمل إلى إظهار أن VER-Net يمكن أن يكون مفيدًا لمهام التصوير الطبي الأخرى بالإضافة إلى تجاوز النماذج الحالية في الأداء. | يمكن أن يؤدي تجميع عدة نماذج تعلم نقل تحت نموذج VER-Net إلى تعقيد النظام. قد يجعل هذا التعقيد من صعوبة تفسير النموذج ويزيد من الاحتياجات الحاسوبية. | ||
| ريكو كلين وآخرون.
|
تم تدريب شبكة عصبية تلافيفية (CNN) لتصنيف الصور الطبية إلى فئتين: حالات متأثرة وغير متأثرة وطرق التعزيز. | تقييم تأثير طرق تعزيز الصور المختلفة على دقة شبكة عصبية تلافيفية (CNN) تم تدريبها لتصنيف الصور الطبية إلى فئتين. تحديد أكثر طرق التعزيز فعالية لمختلف أنماط التصوير الطبي (الأشعة السينية، الموجات فوق الصوتية، التصوير المقطعي بالإصدار البوزيتروني، التصوير بالرنين المغناطيسي) لتعزيز دقة التصنيف. | يمكن أن تختلف فعالية طرق التعزيز بشكل كبير اعتمادًا على طبيعة بيانات التصوير الطبي. قد لا تكون نتائج الدراسة قابلة للتطبيق عالميًا عبر جميع أنماط التصوير الطبي أو عبر حالات سريرية مختلفة. | ||
| س. كوكريجا و م. ساباروا وآخرون.
|
يستخدم العمل بنية CNN لتصنيف صور سرطان الرئة النسيجية إلى حميدة، أدينوكارسينوما، وسرطان الخلايا الحرشفية. | لتقسيم الصور النسيجية لسرطان الرئة إلى ثلاثة أنواع: حميدة، أدينوكارسينوما، وسرطان الخلايا الحرشفية بدقة. نموذج CNN. | يركز هذا العمل على CNN ولا يقارن أدائها مع طيف أوسع من أساليب التعلم الآلي أو التعلم العميق خارج تلك التي تم النظر فيها بالفعل. | ||
| تشانغ وآخرون.
|
شبكة عصبية تلافيفية (CNN) مع DenseNet لتحسين القدرة على استخراج الميزات والتعلم لغرض تصنيف سرطان الرئة. | تطوير وتقييم نظام متقدم يعد الهدف الرئيسي للكشف وتصنيف سرطان الرئة. الإطار المقترح يدمج الشبكات العصبية التلافيفية (CNN) مع DenseNet من خلال دمج البيانات والحوسبة على حافة الهاتف المحمول لتحقيق أهدافه. الهدف الأساسي هو الحصول على مستوى عالٍ من الدقة في التمييز بين الأنسجة الرئوية الطبيعية، الحميدة، وأشكال مختلفة من الأنسجة الخبيثة. تهدف التكنولوجيا التشخيصية إلى تحسين تخطيط العلاج والكشف المبكر، وهو ما يسعى هذا المشروع إلى تحقيقه من خلال تحسين الأساليب التشخيصية. | بينما يؤدي النموذج بشكل جيد في الاختبارات المسيطر عليها، قد تكون هناك تحديات عند التعميم على بيانات العالم الحقيقي المختلفة، خاصة إذا كانت بيانات التدريب لا تلتقط جميع الاختلافات في حالات سرطان الرئة بشكل كافٍ. | ||
| لولو جاي وآخرون.
|
شبكة عصبية تلافيفية (CNN) مع DenseNet لتحسين القدرة على استخراج الميزات والتعلم لغرض تصنيف سرطان الرئة. |
|
بينما يؤدي النموذج بشكل جيد في الاختبارات المسيطر عليها، قد تكون هناك تحديات عند التعميم على بيانات العالم الحقيقي المختلفة، خاصة إذا كانت بيانات التدريب لا تلتقط جميع الاختلافات في حالات سرطان الرئة بشكل كافٍ. | ||
| سيدة ريهة وآخرون.
|
نماذج التجميع: تجمع هذه الدراسة بين نماذج مختلفة لتحديد وتصنيف سرطان الرئة. BEiT: نموذج محول بصري يستخدم لقدرته القوية على استخراج الميزات. DenseNet هو نوع من الشبكات العصبية التلافيفية العميقة المعروفة بتدفق التدرج الفعال والدقة الاستثنائية. CNN التسلسلي: نموذج شبكة عصبية تلافيفية مصمم بهيكل تسلسلي. | الهدف من المشروع هو تحسين دقة تحديد وتصنيف سرطان الرئة من خلال دمج العديد من نماذج التعلم الآلي المتقدمة باستخدام طرق تجميع متنوعة. يهدف المشروع إلى تعزيز الأداء العام لتشخيص سرطان الرئة من خلال استخدام قدرات نماذج مثل BEiT وDenseNet وCNN التسلسلي. | قد تطرح طرق التجميع تحديات في فك شفرة المساهمات المحددة لكل نموذج فردي. يمكن أن تعيق غياب الشفافية الفهم بشأن المنطق وراء توقعات معينة. | ||
| ر. رضا وآخرون.
|
Lung-EffNet، نموذج جديد قائم على التعلم بالنقل تم تقديمه في الورقة، يستخدم بنية EfficientNet. | الهدف من العمل هو بناء وتقييم نموذج تصنيف سرطان الرئة بدقة وفعالية عالية بالاعتماد على بنية EfficientNet والتعلم بالنقل بناءً عليها. الهدف هو تقديم طريقة قوية وآلية لتشخيص سرطان الرئة يمكن أن تحقق دقة وكفاءة عالية، وبالتالي معالجة حدود تحليل الأشعة المقطعية اليدوي وتكون مناسبة للنشر السريري الكبير. | قد يؤدي الاعتماد على طرق تعزيز البيانات لمعالجة عدم توازن الفئات إلى تشوهات أو عيوب يمكن أن تضر بقدرة النموذج على التعميم. | ||
| نانديتا غوتام وآخرون.
|
تستخدم تقنية التجميع نماذج CNN. ResNet-152 هو شبكة عميقة متبقية معروفة للتعامل مع الهياكل العميقة جدًا. DenseNet-169: مصممة لتعزيز انتشار الميزات عبر الاتصالات الكثيفة، هذه شبكة تلافيفية كثيفة. EfficientNet-B7: تعظيم حجم النموذج والدقة، هذه شبكة CNN سريعة للغاية. | قم بالتحقيق واستخدام نموذج التجميع، أي، تركيبات من عدة نماذج متميزة، لتوليد التوقعات، وبالتالي الاستفادة من نقاط قوتها المشتركة لرفع الأداء. | يتطلب تدريب وتقييم مجموعة من نماذج التعلم العميق موارد حسابية كبيرة، بما في ذلك الذاكرة وقدرة المعالجة، والتي قد لا تكون متاحة بسهولة في كل بيئة سريرية. | ||
| دريستاس وترغكا وآخرون
|
تمت معالجة مجموعة البيانات لتحقيق توازن الفئات وتصنيف الميزات. تم تقييم أداء نماذج التعلم الآلي المختلفة وقياساتها، مما يضمن تحليلًا قويًا. | تم توسيع الدراسة باستخدام طرق التعلم العميق مثل LSTM و CNN. تم تضمين تقييم قوي لنماذج التصنيف من خلال عملية إعادة التقدير للتحقق. | قد تتأثر دقة توقعات النموذج بعوامل غير مدرجة في مجموعة البيانات، مما يؤثر على التقييم الشامل للمخاطر. | ||
| تسوا وآخرون
|
لتحسين التحليل، تم استخدام طريقة تعزيز التدرج القوي (XGBoost) بالتزامن مع مطيافية الكتلة بتدفق الأيونات المختارة. | تحقيق في المركبات العضوية المتطايرة في التنفس لتوقع سرطان الرئة، وتطوير نموذج تصنيف دقيق من خلال التعلم الآلي لزيادة القدرات التنبؤية القوية. | أجريت دراسة حالة وشاهد في مركز واحد، مع الاعتراف بفروق العمر ومعالجة التحيزات المتأصلة في تصاميم دراسات الحالة والشاهد من أجل تحليل شامل. |
الجدول 1. هدف وعيوب البحث السابق.
المنهجية المقترحة
EfficientNetB0
EfficientNetB0
عملية الالتفاف في كتلة MBConv
عملية الالتفاف هي جوهر EfficientNetB0، خاصة داخل كتل MBConv كما هو موضح في المعادلة (1)
أين:
الت convolutions العمودية في كتلة MBConv
في كتلة MBConv، يتم تطبيق الالتفاف العمقي على كل قناة إدخال بشكل منفصل، مما يقلل من تكلفة الحساب كما هو موضح في المعادلة (2)
أين:
كتلة الضغط والتحفيز (SE)
تقوم نماذج كتلة SE بنمذجة الاعتمادات حسب القناة باستخدام عمليتين رئيسيتين: الضغط والإثارة كما هو موضح في المعادلتين (3) و (4).
عملية الضغط:
أين:
H و W هما ارتفاع وعرض خريطة المميزات.
عملية الإثارة:
H و W هما ارتفاع وعرض خريطة المميزات.
عملية الإثارة:
أين:
إعادة المعايرة:
إعادة المعايرة:
أين
التجميع العالمي المتوسط
يتم تقليل الأبعاد المكانية لخريطة المميزات إلى قيمة واحدة لكل قناة من خلال استخدام التجميع المتوسط العالمي كما هو موضح في المعادلة (6).
أين:
H و W هما الارتفاع والعرض لخريطة المميزات.
H و W هما الارتفاع والعرض لخريطة المميزات.
طريقة التحجيم المركب
تستخدم EfficientNet طريقة التحجيم المركب لتغيير عمق الشبكة d ، وعرضها w ، ودقة الإدخال r كما هو موضح في المعادلة (7).
أين:
توفر هذه المعادلات إطارًا رياضيًا لفهم كيفية معالجة وتحويل بنية EfficientNetB0 للبيانات المدخلة، مع التركيز على استخراج الميزات والكفاءة من خلال تصميمها المبتكر.
توفر هذه المعادلات إطارًا رياضيًا لفهم كيفية معالجة وتحويل بنية EfficientNetB0 للبيانات المدخلة، مع التركيز على استخراج الميزات والكفاءة من خلال تصميمها المبتكر.
تجنب الحفظ الزائد باستخدام الشبكات العصبية التلافيفية مع خوارزمية DA
لقد أظهر التعلم العميق، بشكل رئيسي من خلال الشبكات العصبية التلافيفية، إمكانيات تحويلية في تطبيقات متنوعة، تتراوح من معالجة اللغة الطبيعية إلى التصوير الطبي. ومع ذلك، كما هو الحال مع أي أداة قوية، لا تزال التحديات قائمة. إحدى القضايا الرئيسية التي ظهرت في تطبيقات التعلم العميق هي الإفراط في التكيف، حيث يظهر الإفراط في التكيف في مجال التعلم الآلي عندما تتفوق النماذج على بيانات التدريب لكنها تتعثر عند مواجهة حالات غير مألوفة. “الإفراط في التكيف الذاكري”، وهو تجلٍ خاص، يحدث عندما يقوم النموذج بت memorizing حالات التدريب بدلاً من تمييز الأنماط الأساسية للبيانات. هذه الظاهرة، التي تشكل خطرًا خاصًا في مجالات مثل التشخيص الطبي، تطرح مخاطر كبيرة بسبب الهامش الضئيل للخطأ.
معالجة هذه الفجوة البحثية لا تقتصر على تحسين النماذج الحالية فحسب، بل تتطلب استراتيجيات مبتكرة تغير ديناميات التدريب بشكل جذري. إحدى الطرق الواعدة هي دمج الشبكات العصبية التلافيفية مع التعزيز التفاضلي. التعزيز التفاضلي (DA) يطبق تحويلات مثل تعديلات اللون العشوائية.
تستكشف هذه البحث التآزر الناتج عن دمج الشبكات العصبية التلافيفية مع التحليل التمييزي، بهدف التخفيف من فرط التكيف في الذاكرة. من خلال هذا النهج التكاملي، فإن الطموح هو تطوير نماذج ليست دقيقة فحسب، بل أيضًا قوية وقابلة للتعميم، مما يضمن موثوقيتها في سيناريوهات التشخيص في العالم الحقيقي.
استنادًا إلى الفهم الأساسي لزيادة الذاكرة وآثارها، فإن الخطوة المنطقية التالية هي تطوير وتنقيح خوارزمية جديدة تدمج بسلاسة الشبكات العصبية التلافيفية مع التعزيز التفاضلي. إن التعرف على نقاط القوة الفردية لكل من الشبكات العصبية التلافيفية والتعزيز التفاضلي يوفر وجهة نظر فريدة.
يتطلب تطوير شبكة عصبية تلافيفية جديدة مع خوارزمية DA نهجًا متعدد الجوانب. في البداية، يجب أن تكون بنية الشبكة العصبية التلافيفية مصممة لتكون قادرة على استيعاب التعديلات الديناميكية. وهذا يعني أنه يجب تحسين الطبقات والعقد ليس فقط لاستخراج الميزات، ولكن أيضًا لتحمل التباين. يجب أن تكون الخوارزمية مصممة لتكون قابلة للتكيف، تتعلم ليس فقط من ميزات بيانات التدريب ولكن أيضًا من التغيرات التي تقدمها DA.
علاوة على ذلك، مكون DA
تطوير شبكة CNN جديدة مع خوارزمية DA يمثل حدودًا مثيرة في أبحاث التعلم العميق. من خلال معالجة التحدي المستمر المتمثل في الإفراط في التكيف مع الذاكرة بشكل مباشر، يعد هذا الجهد بوضع معايير جديدة في الدقة والموثوقية والعمومية في نماذج التعلم العميق.
لتطوير شبكة CNN جديدة مع خوارزمية تعزيز تفاضلي (DA) للتخفيف من الإفراط في التكيف مع الذاكرة، من المهم فهم الأساس الرياضي وراء كل من CNN و DA.
عمليات الطبقة التلافيفية
تستند الشبكة العصبية التلافيفية (CNN) بشكل أساسي إلى عملية التلافيف، التي تستخرج الميزات من بيانات الإدخال كما هو موضح في المعادلة (8)
عملية التلافيف:
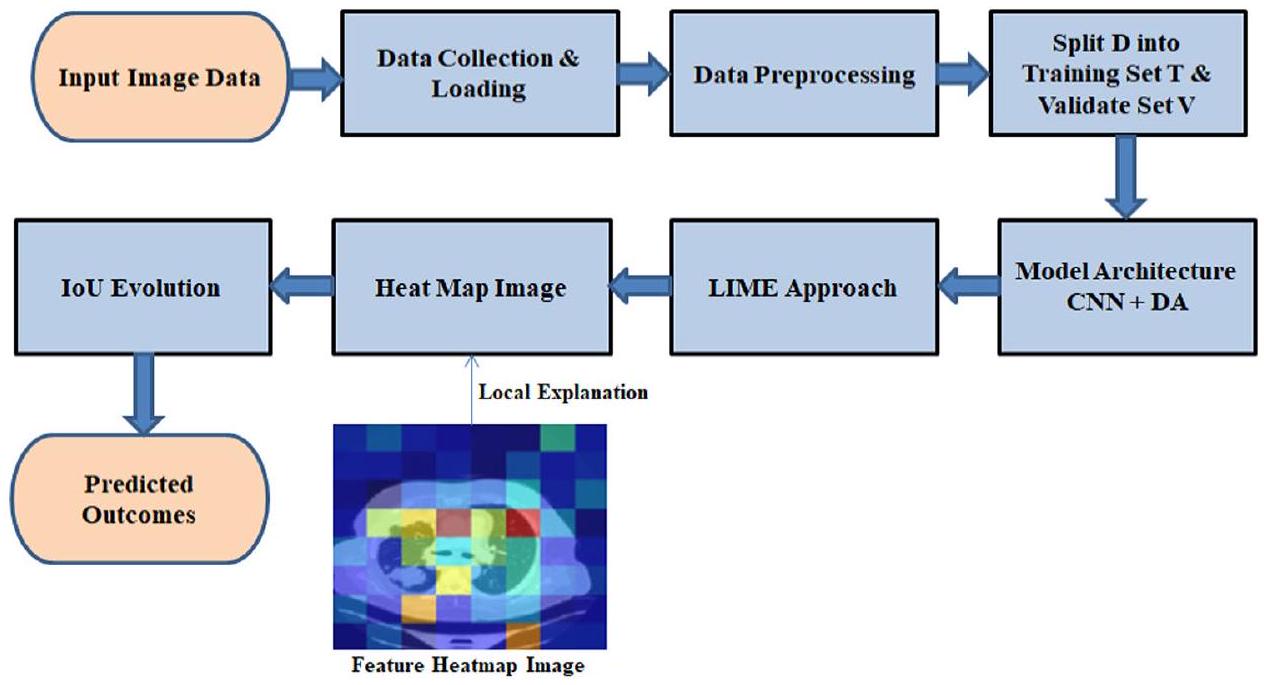
الشكل 1. مخطط تدفق لـ CNN مع DA.
حيث:
X هو خريطة الميزات المدخلة.
W هو نواة التلافيف (المرشح) بحجم MXN.
X هو خريطة الميزات المدخلة.
W هو نواة التلافيف (المرشح) بحجم MXN.
دالة التنشيط
تستخدم دالة التنشيط لإضافة عدم الخطية بعد التلافيف. الدوال المستخدمة بشكل شائع هي ReLU كما هو موضح في المعادلة (9).
دالة تنشيط ReLU:
عملية التجميع
تقلل طبقات التجميع من أبعاد خرائط الميزات، عادة باستخدام التجميع الأقصى كما هو موضح في المعادلة (10).
التجميع الأقصى:
التجميع الأقصى:
حيث:
s هو حجم مرشح التجميع.
s هو حجم مرشح التجميع.
الطبقة المتصلة بالكامل
تستقبل طبقة أو أكثر من الطبقات المتصلة بالكامل المخرجات المسطحة من الطبقات التلافيفية وطبقات التجميع كما هو موضح في المعادلة (11).
عملية الطبقة المتصلة بالكامل:
حيث:
W هي مصفوفة الأوزان.
x هو متجه الإدخال.
b هو الانحياز.
W هي مصفوفة الأوزان.
x هو متجه الإدخال.
b هو الانحياز.
دالة Softmax
للمهام التصنيفية، غالبًا ما تستخدم الطبقة الناتجة دالة softmax لتحويل اللوغيتات إلى احتمالات كما هو موضح في المعادلة (12).
دالة Softmax:
حيث:
K هو عدد الفئات.
K هو عدد الفئات.
دالة الخسارة
للمهام التصنيفية، تُستخدم عادةً دالة خسارة الانتروبيا المتقاطعة كما هو موضح في المعادلة (13).
خسارة الانتروبيا المتقاطعة:
خسارة الانتروبيا المتقاطعة:
حيث:
التعزيز التفاضلي (DA)
تم تصميم تقنية التعزيز التفاضلي (DA) لتحسين قدرة النموذج على التعميم من خلال تقديم تحويلات متنوعة، مثل تعديلات اللون، والسطوع، والتشبع، والتباين. هذا يحاكي التغيرات الواقعية في ظروف التصوير، والتي تكون شائعة في البيئات السريرية.
يمكن استخدام دالة التعزيز كما هو موضح في المعادلة (14)
حيث:
X هي بيانات الإدخال الأصلية.
X هي بيانات الإدخال الأصلية.
مصطلحات التنظيم
لمكافحة الإفراط في التكيف، يمكن استخدام تقنيات التنظيم مثل تنظيم L2 كما هو موضح في المعادلة (15).
تنظيم L2:
تنظيم L2:
حيث:
آلية التغذية الراجعة لدمج DA-CNN
لضمان حلقة تغذية راجعة بين أداء CNN واستراتيجيات DA:
يمكن عرض تعديل تغذية الأداء في المعادلة (16):
يمكن عرض تعديل تغذية الأداء في المعادلة (16):
حيث:
من خلال دمج هذه المكونات الرياضية، يمكن تطوير خوارزمية CNN-DA تتكيف ديناميكيًا مع تغيرات البيانات، مما يقلل من الإفراط في التكيف مع الذاكرة ويعزز متانة النموذج.
من خلال دمج هذه المكونات الرياضية، يمكن تطوير خوارزمية CNN-DA تتكيف ديناميكيًا مع تغيرات البيانات، مما يقلل من الإفراط في التكيف مع الذاكرة ويعزز متانة النموذج.
جمع البيانات وتحميلها
يعد جمع البيانات وتحميلها بكفاءة مكونات حاسمة في أي جهد للتعلم الآلي. يتضمن ذلك جمع مجموعات البيانات ذات الصلة من مصادر متنوعة، وضمان سلامة البيانات، واستخدام آليات تحميل فعالة. تشمل الطرق المتقدمة دمج البث المباشر في الوقت الحقيقي والمعالجة التلقائية للحفاظ على جودة البيانات وتسهيل الدمج السلس في خطوط أنابيب التعلم الآلي، مما يحسن أداء النموذج.
معالجة البيانات
تشمل معالجة البيانات خطوات حيوية مثل التطبيع وترميز التسمية. تم تغيير حجم الصور إلى
| الخطوة | الوصف |
| تغيير الحجم | تم تغيير حجم جميع الصور إلى
|
| التطبيع | تمت مقاييس قيم البكسل إلى النطاق
|
| ترميز التسمية | تم تحويل التسميات الفئوية إلى متجهات بنمط واحد |
الجدول 2. يلخص خطوات المعالجة المطبقة في هذه الدراسة من أجل تعزيز القابلية للتكرار.
التطبيع
التطبيع هو تقنية معالجة بيانات محورية تعمل على توحيد الميزات العددية، مما يضمن مقياسًا متسقًا عبر المتغيرات. من خلال إعادة قياس البيانات إلى نطاق مشترك، غالبًا ما يكون بين 0 و 1، يقلل التطبيع من تأثير الأحجام المختلفة، مما يعزز المقارنات العادلة وتقارب النموذج الأمثل في تطبيقات التعلم الآلي.
ترميز التسمية
يعد ترميز التسمية خطوة حاسمة في معالجة البيانات، خاصة للمتغيرات الفئوية في التعلم الآلي. يتضمن ذلك تعيين قيم عددية للتسميات الفئوية، مما يمكّن الخوارزميات من تفسيرها ومعالجتها بفعالية. تعزز هذه التحويلات أداء النموذج من خلال تحويل المعلومات غير العددية إلى تنسيق مناسب للحسابات الرياضية والتحليل.
معمارية نموذج CNN
الطبقة التلافيفية
في التعلم العميق، وخاصة في الشبكات العصبية التلافيفية، تعتبر الطبقة التلافيفية هي الطبقة الأساسية. تستخدم هذه الطبقة مرشحات أو نوى، للانزلاق فوق بيانات الإدخال واستخراج الميزات المحلية المتكررة، مع الحفاظ في الوقت نفسه على الاتصال المكاني. يحلل كل مرشح هياكل معينة داخل الصورة، مما يحسن الاحتمالية العامة لاكتشاف أنماط أكثر تعقيدًا في الشبكة. من خلال التقاط الميزات الهرمية، تكون الطبقات التلافيفية فعالة في معالجة الصور، مما يمكّن النموذج من التعرف على الحواف، والملمس، والتمثيلات ذات المستوى الأعلى. تتحكم الخطوات والحشو في الأبعاد المكانية، مما يؤثر على مجال الاستقبال للطبقة. تساهم الطبقات التلافيفية بشكل كبير في نجاح المهام مثل التعرف على الصور، واكتشاف الكائنات، والتجزئة الدلالية في تطبيقات التعلم الآلي المختلفة.
طبقة التجميع الأقصى
أساسية في CNNs، تقوم طبقة التجميع الأقصى بتقليل العينات واستخراج الميزات من خلال تقسيم الإدخال إلى مناطق غير متداخلة، واختيار القيمة القصوى من كل خريطة ميزات. يحتفظ هذا الإجراء بالمعلومات الأساسية مع تقليل الأبعاد المكانية، مما يساعد على الكفاءة الحاسوبية ويخفف من الإفراط في التكيف. من خلال تحسين عدم التباين في الترجمة، يعزز التجميع الأقصى مقاومة الشبكة للتغيرات في الاتجاه المكاني. أثناء تقليل العينات، يحتفظ بالميزات السائدة، مما يساهم في تعلم الميزات الهرمية. تعتبر طبقات التجميع الأقصى أداة مهمة في إنشاء الهياكل المكانية، مما يحسن قدرة الشبكة على التعرف على الأنماط المعقدة وتعميمها في بيانات متنوعة، خاصة في المهام المتعلقة بالصور.
طبقة التسطيح
طبقة التسطح هي جزء أساسي من العديد من الشبكات العصبية وتأتي بعد طبقات الالتفاف وطبقات التجميع. دورها الرئيسي هو تغيير بيانات الإدخال إلى مصفوفة واحدة أو دمج المعلومات كوسيلة للطبقات المتصلة بالكامل. تعتبر عملية التسطح هذه محورية في الانتقال من التسلسلات الهرمية المكانية إلى تنسيق مناسب لهياكل الشبكات العصبية التقليدية. من خلال تحويل البيانات متعددة الأبعاد إلى هيكل خطي، تسهل طبقة التسطح تعلم الميزات الشامل والتجريد. تلعب دورًا حاسمًا في مهام مثل تصنيف الصور، مما يمكّن الشبكة العصبية من استخراج ومعالجة الأنماط المعقدة لتحقيق توقعات دقيقة واتخاذ قرارات.
طبقة كثيفة
تعتبر الطبقة الكثيفة، التي تُعرف غالبًا بالطبقة المتصلة بالكامل، جزءًا أساسيًا من الشبكات العصبية، حيث تشكل حجر الزاوية في هيكلها. تتصل الخلايا العصبية في هذه الطبقة ببعضها البعض، مما يشكل مصفوفة كثيفة تسمح لكل خلية عصبية بالاتصال بكل خلية عصبية في الطبقات السابقة واللاحقة. تتيح هذه الاتصالات الواسعة تعلم الميزات بشكل شامل وتجريدها. تكون هذه الأمور مهمة جدًا عندما تكون هناك أنماط معقدة تحتاج إلى التعلم ضمن البيانات التي يتم إدخالها إلى النموذج. تعتبر الطبقات الكثيفة مهمة جدًا خاصة في المهام مثل تصنيف الصور وكذلك توليد الصور ومعالجة اللغة الطبيعية. في الطبقات الكثيفة، يتم تدريب الأوزان والانحياز لتحسين كفاءة إجراء التنبؤات الدقيقة بناءً على أكثر الأنماط تطورًا.
طبقة التفعيل
طبقة التفعيل هي عنصر حيوي في الشبكات العصبية لإدخال عدم الخطية، مما يعزز تعقيد النموذج وقوة التعبير. تتبع كل مخرجات الخلايا العصبية في طبقة الشبكة العصبية، حيث تطبق دالة تفعيل مثل ReLU أو Sigmoid أو Tanh. هذه التحويلات غير الخطية تقدم سلوكًا ديناميكيًا كما هو موضح في الشكل 2، مما يمكّن الشبكة من فهم الأنماط والعلاقات المعقدة الكامنة في البيانات، مما يسهل عمليات التعلم الأكثر دقة وتفصيلاً. تتيح طبقات التفعيل للنموذج التقاط ميزات معقدة وأداء مهام متقدمة مثل التعرف على الصور أو فهم اللغة الطبيعية، مما يضمن قدرة الشبكة على تقديم تمثيلات أكثر دقة وقوة.
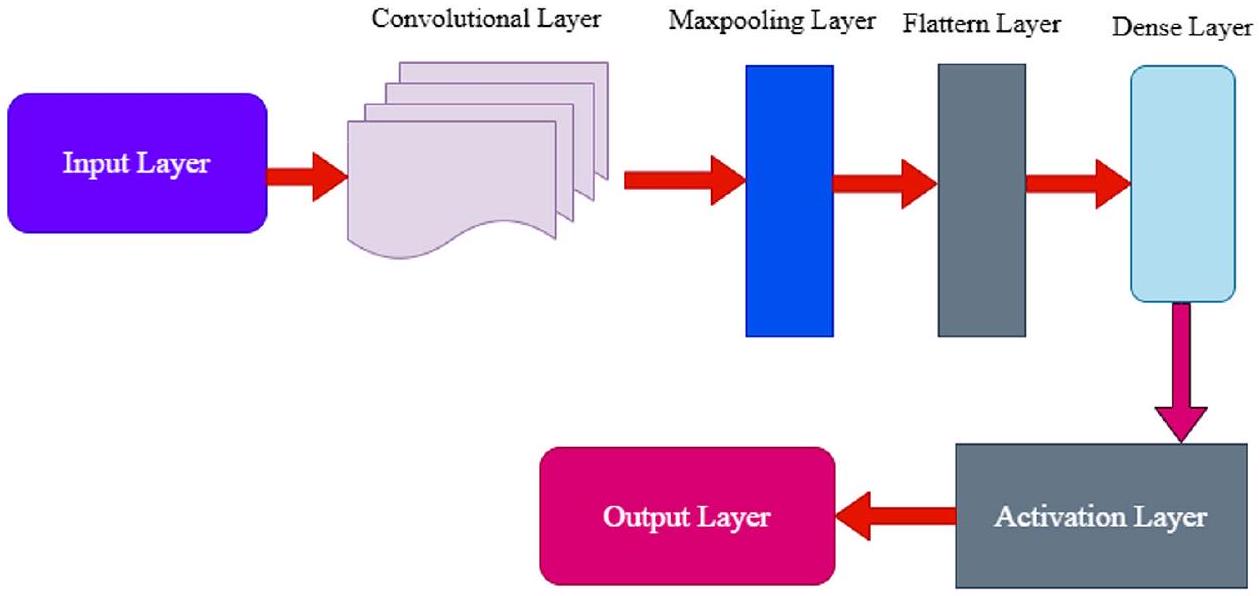
الشكل 2. هيكل نموذج الشبكة العصبية التلافيفية.
زيادة التمايز
تشمل زيادة التمايز (DA) اللون، التشبع، السطوع، والتباين، والتي عند دمجها في البيانات تساعد في تعزيز أداء النموذج من خلال إنشاء تنوعات واقعية ومتنوعة في بيانات التدريب. تغيير اللون يعني تحريك الألوان لأعلى أو لأسفل في الطيف، وتغيير ظروف الإضاءة بالإضافة إلى تدريب النموذج تحت نغمة لونية مختلفة، على الرغم من أن التحولات المفرطة قد تشوه الميزات المهمة المعتمدة على اللون. تعديل التشبع يأخذ اللون إلى مستوى آخر من خلال زيادة أو تقليل قدرة النموذج على التمييز بين الألوان في الظروف الساطعة أو الأقل سطوعًا، ولكن الإفراط في ذلك قد ينتج عنه نتائج غير واقعية. تغييرات التباين تحاكي مستويات مختلفة من التعرض، مما يفيد تدريب النموذج في الميزات مع ضمان التكيف مع البيئات ذات التباين العالي أو المنخفض؛ ومع ذلك، فإن التصحيحات المتطرفة مثل السطوع الشديد أو الظلام الشديد تقلل من فعالية التدريب. تساعد هذه التأثيرات بشكل كبير في تحسين التعرف على الميزات في ظروف الإضاءة المنخفضة وت stabilizing أداء الجهاز في كل من إعدادات التباين العالي والمنخفض، ولكن يمكن أن تتسبب في إخفاء التفاصيل الدقيقة المهمة بسبب التغيير في التباين. بشكل عام، تُثري هذه الطرق بيانات التدريب، وتوفر رؤية أكثر عمومية لتوزيعات البيانات، وتقلل من الإفراط في التكيف، وبالتالي تحسن جميع المهام القابلة للتعلم في حالة التطبيق الحذر للتعزيزات للحفاظ على واقعية البيانات.
تعديل اللون
في معالجة الصور
ضبط التشبع
تعديل التشبع هو عملية رئيسية في معالجة الصور تتضمن تغيير شدة الألوان. من خلال التلاعب بمستويات التشبع، يمكن تعزيز أو تقليل تشبع الألوان في الصورة. هذا التعديل ذو قيمة لتعديل التأثير البصري للصور، مما يساهم في التعديلات الفنية وعمليات تصحيح الألوان.
ضبط السطوع
تتطلب عمليات معالجة الصور ضبط السطوع لتغيير مستوى الإضاءة بالكامل في الصورة. يمكن تحسين الرؤية أثناء معالجة مشاكل التعرض أو إنشاء تأثيرات فنية من خلال تعديل مستويات سطوع الصورة. تعمل هذه العملية بشكل أساسي على تحسين الجودة البصرية إلى جانب وضوح الصورة عبر منصات تطبيقات مختلفة.
ضبط التباين
تعديل التباين هو عملية معالجة صور حيوية تتضمن تعديل الفرق في السطوع بين المناطق الفاتحة والداكنة في الصورة. من خلال تعزيز أو تقليل التباين، يمكن إبراز التفاصيل، وتحسين الرؤية، أو تحقيق تأثيرات فنية. يساهم هذا التعديل في تحسين جودة الصورة والأثر البصري.
الخوارزمية: شبكة عصبية تلافيفية مع تعزيز تفاضلي (DA) لجمع بيانات الكشف عن سرطان الرئة وتحميلها.
اختر مجلد مجموعة البيانات D الذي يحتوي على الصور المعلّمة.
معالجة البيانات المسبقة.
لكل صورة Ii في D:
معالجة البيانات المسبقة.
لكل صورة Ii في D:
- تطبيع: Ii norm
. - ترميز التسمية:
حيث li هو التسمية لـ Ii.
قم بتقسيم D إلى مجموعة تدريب T ومجموعة تحقق V بنسبة (مثل 80:20).
هيكل النموذج.
قم بإنشاء نموذج CNN M مع الطبقات:
- التفاف (
حيث f هو عدد الفلاتر و k هو حجم النواة. - تجميع الحد الأقصى:
حيث k هو حجم التجميع. - تسطيح: F() .
- كثيف:
حيث n هو عدد الخلايا العصبية. - التفعيل: استخدم ReLU للطبقات المخفية وSoftmax للإخراج.
دالة الخسارة
تعزيز قابل للاشتقاق.
بالنسبة للصورة أنا:
- ضبط اللون:
لون (I, h) حيث هو عامل لون عشوائي. - ضبط التشبع:
التشبع (I، smin، smax) حيث smin و smax هما عوامل تشبع عشوائية. - ضبط السطوع:
حيث b هو عامل سطوع عشوائي. - ضبط التباين:
التباين (I، cmin، cmax) حيث cmin و cmax هما عوامل تباين عشوائية.
التدريب.
- قم بتدريب M باستخدام T مع تطبيق DA. لكل عصر:
- لكل دفعة B في T.
- طبق DA على B للحصول على B’.
- تحديث M باستخدام
لتقليل L.
تقييم.
قم بتقييم M باستخدام V لحساب الدقة والخسارة.
التعاريف
- د: مجموعة البيانات الكاملة.
- Ii: الصورة عند الفهرس i.
- li: علامة الصورة Ii.
- ت: مجموعة بيانات التدريب.
- V: مجموعة بيانات التحقق.
- نموذج CNN.
- ل: دالة الخسارة.
-
: التسمية المتوقعة بواسطة النموذج. - y: التسمية الحقيقية.
التدريب
الزيادة التفاضلية هي تقنية تطبق تحولات متنوعة على حالات فردية ضمن دفعات الصور أثناء التدريب. الأسباب الرئيسية لاعتمادها هي:
تنوع في بيانات التدريب: يقدم DA تنوعات في عينات التدريب، مما يثري مجموعة البيانات. هذا يضمن أن النماذج تتعرض لوجهات نظر بيانات متنوعة، مما يحسن التعميم.
أين
تم تطبيق تعزيز تفاضلي التحولات التالية: تعديلات اللون ضمن
تم تطبيق تعزيز تفاضلي التحولات التالية: تعديلات اللون ضمن
تخفيف الإفراط في التكيف: من خلال إدخال العشوائية والتنوع في عملية التدريب، يقلل DA من خطر نماذج حفظ بيانات التدريب بدقة، وهو ظاهرة تعرف بالإفراط في التكيف بالذاكرة.
الاستخدام الفعال للبيانات المحدودة: خاصة في مجالات مثل التصوير الطبي، حيث يمكن أن تكون البيانات نادرة، يقوم DA بتوسيع مجموعة البيانات بشكل مصطنع، مما يوفر المزيد من عينات التدريب دون الحاجة لجمع بيانات جديدة.
أثر DA على وقت الحساب
بينما يقدم DA تنوعًا في بيانات التدريب، فإنه يضيف أيضًا عبئًا حسابيًا بسبب عملية التعزيز. ومع ذلك، غالبًا ما يتم تعويض هذا العبء من خلال تقليل عدد دورات التدريب المطلوبة لتحقيق التقارب، بفضل مجموعة البيانات الأكثر ثراءً وتنوعًا.
دعونا نعتبر الوقت الحسابي بدون DA ومع DA:
- بدون DA: لا-DA
دورة Tno – DA Tepoch. - مع DA: DATDA
Tepoch + Taug .
حيث E هو عدد الدورات، دورة Tepoch هو الوقت المستغرق لكل دورة،
في العديد من السيناريوهات، DA<no-DATDA< Tno – DA، مما يجعل DA فعالًا من الناحية الحسابية على المدى الطويل.
عمل الشبكة العصبية مع DA
عندما يتم تدريب الشبكات العصبية، وخاصة CNNs، باستخدام DA، فإنها تتعلم التعرف على الميزات غير المتغيرة بالنسبة للتعزيزات المطبقة. وهذا يعني أنها تصبح بارعة في تحديد الميزات ذات الصلة بغض النظر عن التغيرات في اللون، السطوع، التباين، أو أي تحسينات أخرى تم إدخالها بواسطة DA.
رياضيًا، إذا تم الإشارة إلى مستخرج الميزات في الشبكة العصبية بـ F، فإن:
تشير هذه المعادلة إلى أن الميزات الأساسية المستخرجة من الصور الأصلية والمعززة يجب أن تكون قابلة للمقارنة.
تقييم الشبكات العصبية مع DA
عادةً ما يتضمن تقييم أداء الشبكات العصبية المدربة باستخدام DA اختبار النموذج على بيانات غير معززة (أو أحيانًا بيانات معززة بشكل طفيف) لضمان قابلية التطبيق في العالم الحقيقي. تقدم مقاييس الأداء مثل الدقة، الدقة، الاسترجاع، وF1-score تقييمًا شاملًا لفعالية النموذج وقدراته.
الدقة
في جوهرها، يعمل DA كتنظيم، مما يعزز من قوة الشبكات العصبية وقدراتها على التعميم، مما يجعلها أكثر ملاءمة لتطبيقات العالم الحقيقي المتنوعة.
في جوهرها، يعمل DA كتنظيم، مما يعزز من قوة الشبكات العصبية وقدراتها على التعميم، مما يجعلها أكثر ملاءمة لتطبيقات العالم الحقيقي المتنوعة.
نظام الكشف عن سرطان الرئة، المصمم لإحداث ثورة في عملية التشخيص، يتميز بشكل بارز بشبكة عصبية تلافيفية (CNN) متكاملة مع تعزيز تفاضلي. عندما تدخل مجموعة جديدة من مسحات الرئة إلى النظام، تخضع لسلسلة من خطوات المعالجة المسبقة. تضمن هذه الخطوات تطبيع الصورة لقيم شدة متسقة، وإعادة الحجم إلى أبعاد موحدة تناسب CNN، وترميز التسميات إلى قيم عددية للتدريب المراقب. بمجرد المعالجة المسبقة، يتم توجيه البيانات إلى قلب النظام: نموذج CNN مع DA. يتكون هيكل هذا النموذج المتطور من طبقات تلافيفية مصممة لاستخراج الميزات الهرمية، وطبقات تجميع لتقليل الأبعاد مع الاحتفاظ بالمعلومات الأساسية، وطبقات كثيفة تم ضبطها بدقة للتصنيف.
دور DA، الذي يعد حاسمًا في مرحلة التدريب، هو تطبيق تحويلات عشوائية ولكن ذات مغزى على الصور في كل دورة تدريبية. يضمن هذا التعزيز الديناميكي أن يواجه CNN باستمرار تمثيلات متنوعة من البيانات، مما يمنع الاعتماد المفرط على عينات تدريب معينة ويعزز التعرف الحقيقي على الميزات. بعد التدريب المكثف، يخضع النموذج لتقييم دقيق باستخدام مجموعة بيانات اختبار مستقلة. تقيم المقاييس الرئيسية، بما في ذلك الحساسية، الخصوصية، الدقة وF1-score، فعاليته التشخيصية.
بمجرد التأكد من كفاءته وموثوقيته، يتم دمج النموذج في بيئة التشغيل الخاصة بالنظام. هنا، يتفاعل المتخصصون في الرعاية الصحية مع واجهة تركز على المستخدم، حيث يقومون بتحميل مسحات الرئة، وبدء التقييمات التشخيصية، واستلام التنبؤات المدعومة بنقاط الثقة. تم تصميم النظام للتعلم المستمر للحفاظ على ملاءمة النموذج وقابليته للتكيف. مع ظهور اكتشافات طبية جديدة وتوفر بيانات إضافية، يخضع النموذج لإعادة تدريب دورية، مما يضمن توافقه مع أحدث تشخيصات سرطان الرئة. من خلال دمج قوى CNN وDA، يقف هذا النظام كمنارة أمل للكشف عن سرطان الرئة في الوقت المناسب، بدقة وكفاءة، بهدف تحسين نتائج المرضى وتبسيط عمليات الرعاية الصحية.
XAI باستخدام نهج LIME
تقدم هذه الدراسة طريقة جديدة تهدف إلى تعزيز موثوقية تصنيف صور سرطان الرئة من خلال تطبيق تقنيات الذكاء الاصطناعي القابل للتفسير (XAI). يستخدم التحليل LIME للصورة
LIME (تفسيرات نموذجية محلية قابلة للتفسير)
في المرحلة الثانية من منهجيتنا، يتم استخدام LIME لتصور وتفسير عملية اتخاذ القرار للنموذج على مستوى محلي. يتم ذلك من خلال تسليط الضوء على المناطق أو الميزات الرئيسية داخل الصورة التي تساهم بشكل كبير في تنبؤات النموذج. طبقنا تقنية LIME لتحليل الميزات ذات الأولوية التي كشف عنها النموذج في تفسير صورة اختبار محددة. بعد ذلك، استخدمنا خرائط حرارة الميزات التي تم إنشاؤها بواسطة LIME لتغطية الصور، كاشفين فقط عن الأكثر أهمية
تحدث مقارنة شاملة للنماذج في المرحلة النهائية من الدراسة التي تتضمن كل من التنبؤات الناجحة من المرحلة الأولية والاستخراج الفعال للميزات المعتمد على LIME من المرحلة الثانية. تستخدم منهجية التقييم لملاءمة ميزات النموذج في صور سرطان الرئة مقياس التشابه Intersection over Union (IoU). يمكن للمستخدمين الوصول إلى تصورات LIME لكشف الميزات المميزة التي يعتمد عليها كل نموذج عند اتخاذ نتائج التنبؤ. يراقب تحليل الكفاءة الاستخراجية مدى توافق الميزات التي حددها النموذج مع الميزات الحقيقية الموجودة في البيانات. يتم استخدام درجة IoU كمقياس كمي لمقارنة الصورة الممسوحة ثنائيًا التي أنشأها النموذج مع الصورة الحقيقية، مما يتيح تقييم درجة التداخل بين الميزات المختارة. تقيس هذه الطريقة التقييمية مدى جودة اختيار النموذج للميزات المناسبة التي تؤدي إلى الكشف الصحيح عن سرطان الرئة.
يقيم مقياس IoU تشابه مجموعتين من خلال قسمة منطقة تقاطع الصورة الحقيقية (GT) على منطقة الصورة الثنائية الممسوحة (MB) مقارنة بمناطقها المجمعة. يتراوح المقياس الكمي لقياس تداخل الميزات من 0 إلى 1 من خلال هذا المقياس. يتواجد مقياس قياس مقياس IoU بين 0 لعدم وجود تشابه و1 للتداخل المثالي. يمكن عرض صيغة حساب قيمة IoU من خلال هذه المصطلحات في المعادلة (17):
كلاهما
النتيجة والمناقشة
تتناول هذه الورقة تصميم وتنفيذ نظام متقدم لتوقع سرطان الرئة باستخدام بايثون وأطر التعلم العميق القوية مثل TensorFlow وKeras. تُعرف TensorFlow، وهي مكتبة مفتوحة المصدر للتعلم الآلي، بمرونتها وقابليتها للتوسع، مما يجعلها مناسبة للتعامل مع المهام المعقدة مثل تحليل الصور الطبية. توفر Keras، وهي واجهة برمجة تطبيقات الشبكات العصبية عالية المستوى، واجهة بديهية لبناء وتدريب نماذج التعلم العميق، مما يسهل العملية دون المساس بالقدرة. تهدف هذه الدراسة إلى إنشاء نظام قوي لتوقع سرطان الرئة من خلال دمج هذه التقنيات. الهدف من الجمع بين الشبكات العصبية التلافيفية وتقنيات تعزيز البيانات المبتكرة هو تحقيق دقة لا مثيل لها في اكتشاف وتصنيف سرطان الرئة من الصور الطبية. ستسلط هذه الورقة الضوء على رحلة التطوير، بدءًا من معالجة البيانات وتصميم هيكل النموذج إلى التدريب والتقييم والنشر. بالإضافة إلى ذلك، ستؤكد على أهمية دمج الذكاء الاصطناعي في الرعاية الصحية، موضحة كيف أن بايثون وTensorFlow وKeras تمثل الأعمدة التي تدعم هذا الجهد التحويلي.
مجموعة البيانات
لهذه الدراسة، تم استخدام مجموعة بيانات سرطان الرئة من مستشفى العراق التعليمي للأورام/المركز الوطني لأمراض السرطان (IQ-OTH/NCCD)، المتاحة للجمهور على كاجل.
تتكون مجموعة البيانات من 1,097 صورة مقطعية تم تنظيمها في ثلاث مجموعات متميزة وهي مجموعة الأورام الحميدة، والأورام الخبيثة، والمجموعة الطبيعية لأمراض سرطان الرئة. تحتوي فئة الأورام الحميدة على 120 صورة، بينما تمتلك فئة الأورام الخبيثة 561 صورة بالإضافة إلى 416 صورة في الفئة الطبيعية. يتم تقسيم أورام الرئة إلى أنواع حميدة غير سرطانية وأنواع خبيثة سرطانية مع تمييز إضافي بين الأورام والأورام الكتلية. مرت مجموعة البيانات بعمليات تدريب لـ
النقاش حول قيود مجموعة البيانات، وخاصة الحجم النسبي الصغير لمجموعة بيانات IQ-OTH/NCCD والانحيازات المحتملة في توزيع الفئات، هو أمر حاسم لفهم تداعيات النتائج التي تم الحصول عليها من نموذج CNN + DA. تتكون مجموعة بيانات IQ-OTH/NCCD، على الرغم من توفيرها لصور مقطعية عالية الجودة من مجموعة متنوعة من مرضى سرطان الرئة، من 1,097 صورة فقط. قد يحد هذا الحجم المحدود من العينة من قدرة النموذج على التقاط الطيف الكامل لتنوعات الأورام وتعقيداتها الموجودة في مجموعة سكانية أوسع. وبالتالي، قد تتأثر أداء النموذج بالخصائص المحددة لبيانات التدريب، مما قد يؤدي إلى الإفراط في التكيف مع الأمثلة المحدودة التي واجهها.
علاوة على ذلك، فإن توزيع الفئات داخل مجموعة البيانات يقدم طبقة أخرى من التعقيد. تتضمن مجموعة البيانات 561 صورة للأورام الخبيثة، و120 صورة للأورام الحميدة، و416 صورة للرئتين السليمتين، مما يؤدي إلى تمثيل غير متوازن للفئات. يمكن أن تؤدي مثل هذه الاختلالات إلى انحراف عملية تعلم النموذج، حيث قد يصبح متحيزًا نحو الفئة الأكثر انتشارًا (الأورام الخبيثة) بينما يتم تمثيل الفئات الأقل تكرارًا (الأورام الحميدة والرئتين السليمتين) بشكل غير كافٍ. يمكن أن يؤدي هذا التحيز إلى معدل أعلى من النتائج السلبية الكاذبة للحالات الحميدة، وهو أمر مقلق بشكل خاص في البيئات السريرية حيث يكون التمييز الدقيق بين الحالات الحميدة والخبيثة أمرًا حاسمًا لإدارة المرضى.
لتخفيف هذه التحديات، يجب أن تأخذ الدراسات المستقبلية في الاعتبار زيادة مجموعة البيانات من خلال إضافة صور إضافية من مصادر متنوعة لتعزيز حجمها وتوازنها. ستساهم طرق توليد البيانات الاصطناعية مع التعلم الانتقالي من مصادر أكبر وأكثر تنوعًا في تحسين كل من قوة النموذج وأداء التعميم. علاوة على ذلك، ستوفر التحليلات الدقيقة لمقاييس الأداء الخاصة بالفئات رؤى أعمق حول مدى أداء النموذج عبر فئات مختلفة، مما يسمح للعلماء بفهم أفضل لقدرات التشخيص. يجب على الباحثين تنفيذ طرق لمعالجة قيود مجموعة البيانات، مما سيجعل نتائجهم قابلة للتطبيق في السيناريوهات السريرية ويعزز موثوقية نموذج CNN+DA لتشخيص سرطان الرئة.
استخدم هذا العمل مجموعة بيانات LC25000
سرطان الرئة الغدي هو نوع من سرطان الرئة الذي يشمل الخلايا الغدية ويحدث في الرئتين والحويصلات الهوائية، مما يشكل أكثر من
عملت مع مجموعة البيانات التي تشترك في العديد من الميزات مع “مجموعة بيانات التصوير المقطعي المحوسب والتصوير المقطعي بالإصدار البوزيتروني الكبيرة لتشخيص سرطان الرئة (Lung-PET-CT-Dx)” من أرشيف تصوير السرطان (TCIA). TCIA هو مشروع مفتوح الوصول تم تطويره لتسهيل أبحاث السرطان من خلال مشاركة بيانات تصوير السرطان المفتوحة الوصول للباحثين.
NLST
تم فحص 26,732 مشاركًا في مجموعة التصوير المقطعي المحوسب بجرعة منخفضة، وتم التحقق من سرطان الرئة في 1,083 مريضًا.
يوفر الجدول 3 مقارنة بين مجموعات البيانات، موضحًا نقاط قوتها وقيودها. يبرز الميزات الرئيسية ومدى ملاءمتها لتطبيقات محددة، مما يوفر رؤى حول استخدامها الأمثل في سيناريوهات مختلفة.
توضح الشكل 3 صورة عينة جنبًا إلى جنب مع نسختها المعززة باستخدام تقنيات DA. تبرز هذه المقارنة التحولات المطبقة لتعزيز تنوع البيانات وقوة النموذج.
يظهر الشكل 4 منحنيات خسارة التدريب والتحقق بعد تدريب النموذج باستخدام صور سرطان الرئة. يبرز انخفاض الخسارة على مر العصور، مما يشير إلى تحسين الأداء والتعميم.
تدريب وتقييم نموذج CNN مع DA.
تقييم CNN باستخدام خوارزمية التعزيز التفاضلي (DA)
الرسم البياني المقدم يقيم بشكل شامل نموذج CNN المعزز بالتعزيز التفاضلي (DA) عبر عدة عصور تدريب. يقارن الرسم البياني أداء التدريب والتحقق، مما يعطي رؤى حول ديناميات تعلم النموذج وقدرته على التعميم.
منحنيات التدريب مقابل التحقق: يعرض الرسم البياني مجموعتين من المنحنيات، واحدة تمثل أداء النموذج على بيانات التدريب والأخرى على بيانات التحقق. يسمح هذا التمييز لنا بتقييم تقدم النموذج من حيث التعلم وقدرته على الأداء على البيانات غير المرئية.
اتجاهات الدقة: ملاحظة ملحوظة هي مسار منحنيات الدقة لكل من مجموعات بيانات التدريب والتحقق. مع تقدم العصور، تميل الدقة إلى الزيادة، مما يشير إلى تحسين النموذج
| مجموعة البيانات | نقاط القوة | القيود | |||||||
| IQ-OTH/NCCD (مجموعة البيانات المختارة) |
|
|
|||||||
| LC25000 (مجموعة البيانات النسيجية) |
|
|
|||||||
| Lung-PET-CT-Dx (CT/PET على نطاق واسع) |
|
|
|||||||
| NLST (التجربة الوطنية لفحص الرئة) |
|
|
الجدول 3. مقارنة مجموعات البيانات: نقاط القوة والقيود.
الشكل 3. صورة عينة والصورة مع DA.
الشكل 4. بعد تدريب النموذج باستخدام صور سرطان الرئة، يظهر الرسم البياني خسارة التدريب وخسارة التحقق.
القدرة على تصنيف صور سرطان الرئة بشكل صحيح. أي انحراف كبير بين هذه المنحنيات قد يشير إلى الإفراط في التكيف أو نقص التكيف، وهي جوانب حاسمة يجب مراقبتها في تقييم النموذج.
اتجاهات الخسارة: تكمل منحنيات الخسارة الدقة، حيث توضح كيف تنحرف توقعات النموذج عن التسميات الفعلية عبر العصور. تشير الاتجاهات المتناقصة في الخسارة إلى أن النموذج يقوم بتحسين توقعاته، مما يجعلها تتماشى عن كثب مع العلامات الحقيقية. قرب منحنيات خسارة التدريب والتحقق هو مؤشر على أداء النموذج المتسق عبر كلا مجموعتي البيانات.
دور DA: من المحتمل أن يساهم دمج التعزيز التفاضلي (DA) في الاتجاهات الملحوظة. من خلال تقديم تمثيلات متنوعة من صور التدريب بشكل مستمر، يضمن DA أن النموذج لا يعتمد بشكل مفرط على أنماط معينة، مما يؤدي إلى تحسين التعميم. يتضح ذلك من التقدم المتزامن لمنحنيات التدريب والتحقق، مما يشير إلى تقليل الميل للإفراط في التكيف.
ملاحظات ختامية: الرسم البياني هو شهادة على فعالية دمج DA مع CNN لتصنيف صور سرطان الرئة. تشير الاتجاهات المتسقة عبر العصور والتوافق الوثيق لمقاييس التدريب والتحقق إلى نموذج مدرب جيدًا وقوي جاهز للتطبيقات في العالم الحقيقي.
تشير دقة نموذج CNN + DA العالية وحساسيته وخصوصيته إلى إمكانات قوية للتطبيقات السريرية. ومع ذلك، فإن فائدته في الإعدادات الواقعية تتطلب مزيدًا من التحقق باستخدام مجموعات بيانات متنوعة واختبار في سير العمل السريري. بالإضافة إلى ذلك، يجب ضمان القوة ضد عيوب التصوير وأنواع الماسحات المختلفة.
لتوقع الأمراض بدقة بناءً على المدخلات المعروضة في الشكل 5، من المحتمل أن يقوم النموذج بتحليل الأنماط في البيانات باستخدام تقنيات التعلم الآلي. يعالج ميزات متنوعة لتحديد النتائج المحتملة للأمراض، مما يعزز دقة التشخيص.
توقع سرطان الرئة باستخدام نموذج CNN مع DA
تمرير النموذج للأمام: يتم تمرير الصورة المعالجة مسبقًا عبر CNN. بينما تنتقل عبر الطبقات التلافيفية، يتم استخراج الميزات الأساسية التي تشير إلى حالات الرئة. تتم معالجة هذه الميزات الهرمية، التي تتراوح من الحواف الأساسية إلى الأنماط المعقدة، بواسطة الطبقات التالية.
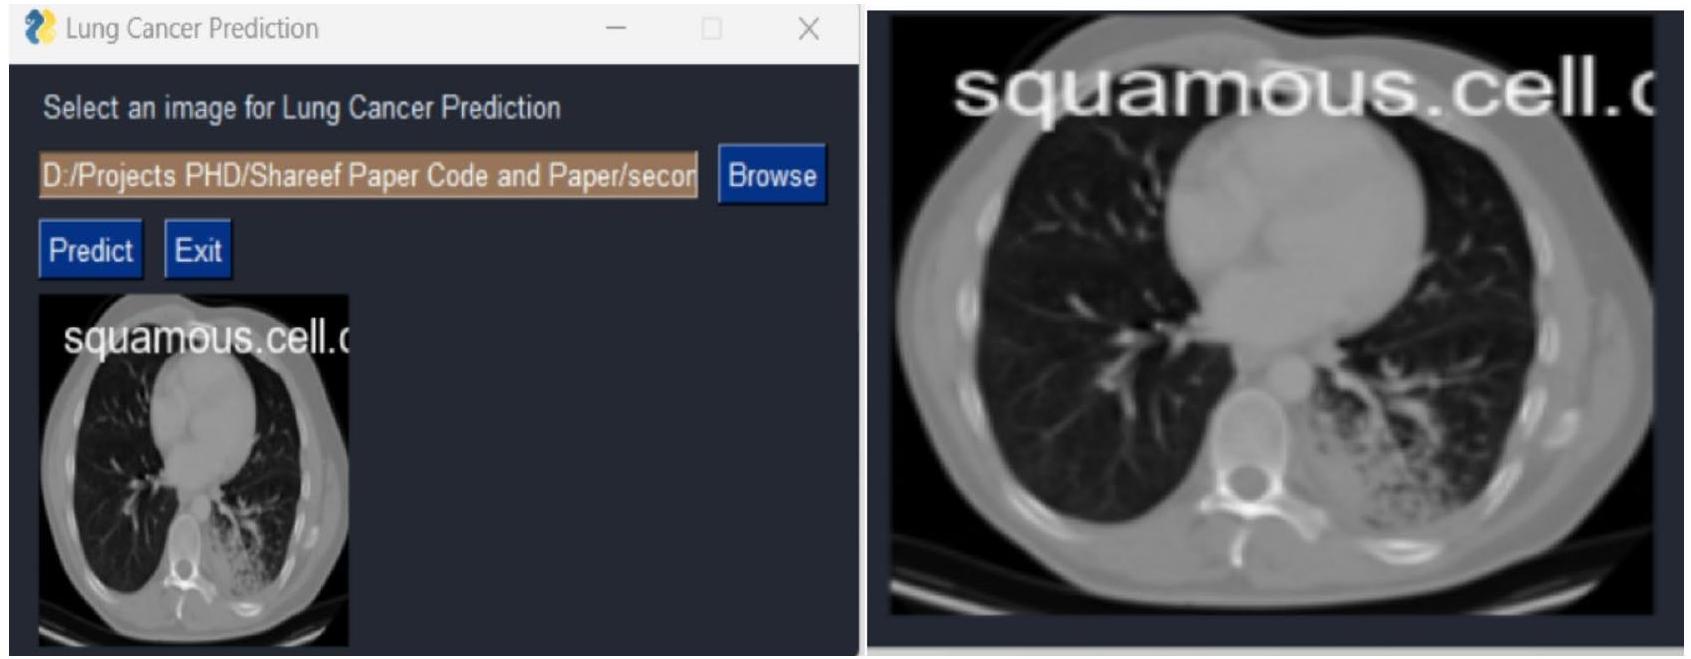
الشكل 5. بمجرد إدخال البيانات، يتوقع النموذج الأمراض بدقة.
| اسم الوظيفة | القيمة |
| معدل التعلم | 0.001 |
| حجم الدفعة | 32 |
| معدل التسرب | 0.3 |
الجدول 4. معلمات التدريب.
توليد التوقعات: تأخذ الطبقات النهائية من CNN، عادةً الطبقات الكثيفة أو المتصلة بالكامل، الميزات المستخرجة وتولد توقعًا. قد يكون هذا في شكل احتمالات الفئات، خاصة إذا كانت المهمة هي تصنيف حالة الرئة. تصبح الفئة ذات أعلى فرصة هي توقع النموذج للصورة المدخلة.
المعالجة اللاحقة: قد يتم تطبيق المعالجة اللاحقة بمجرد الحصول على التوقع الخام. قد يتضمن ذلك تحويل التسميات العددية إلى نظيراتها الفئوية (مثل ‘سرطان الغدد الصماء’، ‘طبيعي’) أو تطبيق عتبة لتحديد التشخيص النهائي.
عرض المخرجات: يتم تقديم التوقع وأي درجات ثقة أو احتمالات مرتبطة للمستخدم. في بيئة الرعاية الصحية، تساعد هذه المعلومات المتخصصين الطبيين في اتخاذ قرارات مستنيرة بشأن حالة المريض والعلاج اللاحق.
تعديل المعلمات باستخدام البحث العشوائي
تعديل المعلمات باستخدام البحث العشوائي
تم تعيين معلمات التدريب الأولية للنماذج كما يلي: معدل تعلم قدره 0.001، حجم دفعة قدره 32، ومعدل تسرب قدره 0.3. بعد تطبيق البحث العشوائي لضبط المعلمات، تم تحسين هذه القيم لتحسين أداء كل نموذج. تم ضبط معدل التعلم إلى قيم تتراوح بين 0.0001 و 0.0005، حيث أثبتت المعدلات المنخفضة للتعلم فعاليتها أكثر بالنسبة لـ ResNet و EfficientNetB0. تم تعديل حجم الدفعة إلى 32 لـ CNN مع DA و ResNet، بينما حققت DenseNet و EfficientNetB0 نتائج مثالية مع حجم الدفعة الأصلي البالغ 32. وبالمثل، تم تحسين معدل التسرب إلى 0.2 لنموذج Hybrid CNN، بينما تطلبت ResNet معدلًا أعلى قليلاً قدره 0.4 لمنع الإفراط في التكيف، واحتفظت DenseNet و EfficientNetB0 بمعدل تسرب متوازن قدره 0.3. هذه المعلمات المضبوطة حسنت بشكل كبير من الدقة ودرجة F1 لكل نموذج.
يوضح الجدول 4 معلمات التدريب المستخدمة للنموذج. يوفر تفاصيل مثل معدل التعلم، حجم الدفعة، ومعدل التسرب، وهي ضرورية لإعادة إنتاج عملية التدريب.
قارن بين مقاييس أداء CNN مع DA (نموذج هجين جديد)، DenseNet، ResNet و EfficientNetB0.
تظهر النتائج عبر مجموعات البيانات المختلفة أن نموذج CNN + DA (الجديد) يتفوق باستمرار على النماذج الأخرى، خاصة عند تقييمه على مجموعة البيانات الرئيسية IQ-OTH/NCCD (الجدول 5). تبرز هذه المجموعة قوة CNN + DA، حيث تحقق أعلى المقاييس في الدقة (
| مقاييس الأداء | سي إن إن + دي إيه (رواية) | دينس نت | ريزنت | EfficientNetB0 |
| دقة | ٩٧.٥٧ | 93.80 | 92.50 | 91.87 |
| استدعاء | ٩٧.٦٧ | 94.00 | 93.10 | 91.78 |
| درجة f1 | ٩٨.٧٨ | 94.20 | 92.70 | 91.21 |
| دقة | ٩٨.٧٨ | 94.10 | 93.00 | 92.64 |
| رُخ | ٩٧.٢٣ | 93.90 | 92.40 | 91.24 |
| نسبة الخطأ (%) | 1.22 | ٥.٩٠ | ٧.٠٠ | 7.36 |
الجدول 5. نماذج المقارنة مع مقاييس الأداء مع تدابير إحصائية داعمة باستخدام مجموعة بيانات IQ-OTH/ NCCD.
| المجموعة 1 | المجموعة 2 | فرق المتوسط |
|
أخفض | علوي | رفض |
| سي إن إن + دا | دينس نت | -4.61 | 0.0000 | -5.24 | -3.98 | صحيح |
| سي إن إن + دا | EfficientNetB0 | -5.97 | 0.0000 | -6.60 | -5.34 | صحيح |
| سي إن إن + دا | ريزنت | -5.58 | 0.0000 | -6.21 | -4.95 | صحيح |
| دينس نت | EfficientNetB0 | -1.36 | 0.0000 | -1.99 | -0.73 | صحيح |
| دينس نت | ريزنت | -0.97 | 0.0006 | -1.59 | -0.34 | صحيح |
| EfficientNetB0 | ريزنت | 0.39 | 0.3655 | -0.23 | 1.02 | كاذب |
الجدول 6. اختبار توكي HSD بعد التحليل لمقارنات دقة النموذج باستخدام مجموعة بيانات IQ-OTH/NCCD.
| مجموعة بيانات | سي إن إن + دا | دينس نت | ريزنت | EfficientNetB0 |
| دقة | 93.02 | 92.03 | 91.42 | 90.01 |
| استدعاء | 94.16 | 93.12 | 92.15 | 90.26 |
| درجة F1 | ٩٤.٠١ | 93.16 | 91.22 | 90.26 |
| دقة | 95.02 | 93.22 | 91.99 | 91.14 |
| رُخ | 93.69 | 91.26 | 91.32 | 90.20 |
| نسبة الخطأ (%) | ٤.٩٨ | 6.78 | 8.01 | 8.86 |
الجدول 7. نماذج المقارنة مع مقاييس الأداء مع تدابير إحصائية داعمة باستخدام LC25000.
نماذج أخرى مثل DenseNet وResNet وEfficientNetB0، تظهر CNN + DA هيمنة واضحة، خاصة في هذه المجموعة الأساسية من البيانات.
لتقييم دقة أربعة نماذج هي CNN + DA (جديد)، DenseNet، ResNet، و EfficientNetB0، تم إجراء تحليل لاحق باستخدام اختبار توكي HSD كما هو موضح في الجدول 6. أظهر التحليل وجود اختلافات كبيرة في الدقة بين معظم النماذج. أظهر نموذج CNN + DA تفوقًا ذا دلالة إحصائية على جميع النماذج الأخرى، مع اختلافات متوسطة في الدقة قدرها
عند الاختبار على مجموعة بيانات LC25000 (الجدول 7)، يقدم CNN + DA أيضًا نتائج جديرة بالثناء، محققًا أعلى دقة (
| المجموعة 1 | المجموعة 2 | فرق المتوسط (meandiff) |
|
حد الثقة الأدنى | الحد الأعلى لفترة الثقة | رفض الفرضية الصفرية |
| سي إن إن + دا | دينس نت | 1.80 | 0.02 | 0.56 | ٣.٠٤ | نعم |
| سي إن إن + دا | EfficientNetB0 | 3.03 | 0.005 | 1.44 | ٤.٦١ | نعم |
| سي إن إن + دا | ريزنت | 3.88 | 0.001 | 2.07 | ٥.٦٩ | نعم |
| دينس نت | EfficientNetB0 | 1.22 | 0.14 | -0.19 | 2.63 | لا |
| دينس نت | ريزنت | 2.08 | 0.03 | 0.15 | ٤.٠٠ | نعم |
| EfficientNetB0 | ريزنت | 0.87 | 0.22 | – 0.46 | 2.20 | لا |
الجدول 8. اختبار توكي HSD بعد التحليل لمقارنات دقة النموذج باستخدام مجموعة بيانات LC25000.
| مجموعة بيانات | سي إن إن + دا | دينس نت | ريزنت | EfficientNetB0 |
| دقة | ٩٧.٥٧ | 93.80 | 92.50 | 91.87 |
| استدعاء | ٩٧.٦٧ | 94.00 | 93.10 | 91.78 |
| درجة F1 | ٩٨.٧٨ | 94.20 | 92.70 | 91.21 |
| دقة | ٩٨.٧٨ | 94.10 | 93.00 | 92.64 |
| رُخ | ٩٧.٢٣ | 93.90 | 92.40 | 91.24 |
| معدل الخطأ (%) | 1.22 | ٥.٩٠ | ٧.٠٠ | 7.36 |
الجدول 9. نماذج المقارنة مع مقاييس الأداء مع تدابير إحصائية داعمة باستخدام التصوير المقطعي المحوسب واسع النطاق والتصوير المقطعي بالإصدار البوزيتروني/التصوير المقطعي المحوسب.
| المجموعة 1 | المجموعة 2 | فرق المتوسط (meandiff) |
|
حد الثقة الأدنى | حد الثقة العلوي | رفض الفرضية الصفرية |
| سي إن إن + دا | دينس نت | ٤.٦٨ | 0.001 | 3.90 | 5.47 | نعم |
| سي إن إن + دا | ريزنت | ٥.٧٨ | 0.0005 | ٤.٩٨ | 6.58 | نعم |
| سي إن إن + دا | EfficientNetB0 | 6.14 | 0.0002 | 5.33 | 6.95 | نعم |
| دينس نت | ريزنت | 1.10 | 0.14 | -0.12 | 2.32 | لا |
| دينس نت | EfficientNetB0 | 1.46 | 0.09 | -0.01 | 2.93 | لا |
| ريزنت | EfficientNetB0 | 0.36 | 0.42 | -1.12 | 1.84 | لا |
الجدول 10. اختبار توكي HSD بعد التجربة لمقارنات دقة النموذج باستخدام مجموعة بيانات كبيرة النطاق من التصوير المقطعي المحوسب (CT) والتصوير المقطعي بالإصدار البوزيتروني (PET/CT).
أكثر تشابهًا. تسلط هذه النتائج الضوء على القدرة الفائقة لنموذج CNN + DA على التعميم عبر مجموعة البيانات، على الأرجح بسبب الجمع بين بنية CNN القوية وزيادة البيانات، مما يعزز التعلم والصلابة.
وبالمثل، يتفوق نموذج CNN + DA على مجموعة بيانات التصوير المقطعي المحوسب (CT) والتصوير المقطعي بالإصدار البوزيتروني (PET/CT) الكبيرة (الجدول 9)، محققًا أعلى الدرجات عبر جميع المقاييس، بما في ذلك درجة F1.
اختبار توكي HSD بعد الاختبار لمقارنات دقة النموذج على مجموعة بيانات التصوير المقطعي المحوسب واسع النطاق و PET/CT (الجدول 10) يكشف أن CNN + DA يتفوق بشكل كبير على DenseNet و ResNet و EfficientNetB0، مع اختلافات في متوسط الدقة تبلغ
في مجموعة بيانات تجربة الفحص الوطني للرئة (NLST) (الجدول 11)، تظل أداء CNN + DA قويًا، مع أعلى دقة (
تظهر النتائج من اختبار Tukey’s HSD بعد الاختبار ومقاييس الأداء على مجموعة بيانات التجربة الوطنية لفحص الرئة (NLST) أن CNN + DA يتفوق بشكل كبير على DenseNet و ResNet، مع اختلافات في الدقة المتوسطة تبلغ 2.24 و 3.27 على التوالي، وكلاهما بقيم p أقل من 0.05، مما يؤكد رفض الفرضية الصفرية كما هو موضح في الجدول 12. ومع ذلك، لم يتم العثور على فرق كبير في الدقة بين CNN + DA و EfficientNetB0 (فرق متوسط من
| مجموعة البيانات | CNN + DA | DenseNet | ResNet | EfficientNetB0 |
| الدقة | 94.23 | 94.12 | 92.56 | 90.20 |
| استرجاع | 95.22 | 94.12 | 92.06 | 90.22 |
| f1score | 96.56 | 94.12 | 94.63 | 90.22 |
| الدقة | 96.36 | 94.12 | 93.09 | 96.23 |
| Roc | 97.02 | 93.56 | 93.45 | 94.23 |
| معدل الخطأ (%) | 3.64 | 5.88 | 6.91 | 3.77 |
الجدول 11. مقارنة النماذج مع مقاييس الأداء مع تدابير إحصائية داعمة باستخدام مجموعة بيانات التجربة الوطنية لفحص الرئة (NLST).
| المجموعة 1 | المجموعة 2 | فرق المتوسط (meandiff) |
|
حد CI السفلي | حد CI العلوي | رفض الفرضية الصفرية |
| CNN + DA | DenseNet | 2.24 | 0.001 | 1.56 | 2.92 | نعم |
| CNN + DA | ResNet | 3.27 | 0.0002 | 2.49 | 4.05 | نعم |
|
|
EfficientNetB0 | 0.13 | 0.85 | -1.08 | 1.34 | لا |
| DenseNet | ResNet | 1.02 | 0.18 | -0.16 | 2.19 | لا |
| DenseNet | EfficientNetB0 | -2.11 | 0.01 | -3.25 | -0.97 | نعم |
| ResNet | EfficientNetB0 | -3.13 | 0.0003 | -4.34 | -1.91 | نعم |
الجدول 12. اختبار Tukey’s HSD لمقارنة دقة النماذج باستخدام مجموعة بيانات التجربة الوطنية لفحص الرئة (NLST).
تم اختيار مجموعة بيانات IQ-OTH/NCCD لهذا البحث بسبب قوتها الفريدة في توفير صور CT عالية الجودة لمرضى سرطان الرئة عبر الفئات الحميدة، الخبيثة، والعادية. وهذا يجعلها مناسبة تمامًا لتطوير نماذج تعمم بشكل فعال عبر مجموعات سكانية متنوعة من المرضى. على عكس مجموعات البيانات الأخرى مثل LC25000، التي تركز على الصور النسيجية، أو Lung-PET-CT-Dx، التي تركز على أنواع سرطان الرئة، توفر مجموعة بيانات IQ-OTH/NCCD تمثيلًا واقعيًا لحالات الرئة. تعزز التعليقات الواضحة وتوزيع الفئات المتوازن من ملاءمتها لتشخيص سرطان الرئة.
على الرغم من حجمها النسبي الصغير المكون من 1,097 صورة، تعوض مجموعة البيانات عن ذلك بتصوير عالي الجودة (سماكة شريحة CT تبلغ 1 مم) وتمثيل ديموغرافي متنوع، مما يسمح بالكشف التفصيلي عن الأورام وتحسين القابلية للتعميم. بالإضافة إلى ذلك، فإن الأداء المتفوق لنموذج CNN + DA على هذه المجموعة من البيانات يبرز ملاءمته لتقييم نماذج توقع سرطان الرئة. هذه العوامل مجتمعة تؤسس IQ-OTH/NCCD كأفضل خيار لهذا البحث.
الجدول 5 يقارن أداء نماذج مختلفة، بما في ذلك CNN + DA (جديد)، DenseNet، ResNet، و EfficientNetB0، باستخدام مجموعة بيانات IQ-OTH/NCCD. يبرز الجدول مقاييس الأداء الرئيسية مع تدابير إحصائية داعمة، مما يظهر فعالية كل نموذج.
الشكل 6 يوضح مقاييس الأداء المقارنة لـ CNN + DA و DenseNet و ResNet و EfficientNetB0. تسلط النتائج الضوء على تفوق النموذج المقترح عبر مقاييس التقييم الرئيسية.
تظهر منحنيات الدقة والاسترجاع (PR) الموضحة في الشكل 7 أداء النماذج المختلفة (CNN + DA و DenseNet و ResNet و EfficientNetB0) عبر مجموعات بيانات متنوعة (IQ-OTH/NCCD و LC25000 و CT/PET-CT و NLST). يظهر نموذج CNN + DA باستمرار دقة واسترجاع متفوقين، مما ينعكس في منحنياته التي تكون أقرب إلى الزاوية العليا اليمنى لجميع مجموعات البيانات. تظهر DenseNet و ResNet و EfficientNetB0 أداءً أقل تدريجيًا، حيث ينتج EfficientNetB0 عادةً أدنى قيم للدقة والاسترجاع. تعزز هذه الاتجاهات من قوة وعمومية نموذج CNN+DA عبر مجموعات بيانات متنوعة.
تم تقييم نموذج CNN المقترح مع زيادة البيانات (CNN+DA) من خلال تقنيات تحليلية متعددة، بما في ذلك خرائط الحرارة للتوافق، وتحليل المتبقيات، وتقييم التماثل، ومخططات Q-Q. توفر هذه التقييمات رؤى عميقة حول أداء النموذج التنبؤي، وتوزيعات الأخطاء، وقدرة التعميم.
تم تقييم أداء النموذج باستخدام مقاييس مختلفة، بما في ذلك الدقة، والاسترجاع، وF1-score، والدقة، وROC. تكشف خريطة الحرارة للتوافق عن درجة عالية من التوافق (قريبة من 1) بين جميع مقاييس الأداء، مما يشير إلى أداء متسق عبر جوانب التقييم المختلفة كما هو موضح في الشكل 8. تشير هذه العلاقة الإيجابية القوية إلى أن النموذج يلتقط بفعالية الأنماط الأساسية في البيانات ويظهر أداءً متوازنًا.
يعرض المدرج التكراري للمتبقيات توزيعًا قريبًا من الطبيعي، مما يشير إلى أن متبقيات النموذج موزعة عشوائيًا ولا تظهر أي أنماط منهجية. يتماشى هذا الملاحظة مع فرضية الطبيعية لتحليل المتبقيات، مما يوفر مزيدًا من الأدلة على كفاية النموذج كما هو موضح في الشكل 9.
يظهر مخطط المتبقيات مقابل القيم الملائمة، والذي يستخدم عادةً للتحقق من التماثل، توزيعًا متفرقًا للنقاط دون أي اتجاه أو نمط واضح. يشير هذا إلى أن تباين المتبقيات متسق عبر قيم ملائمة مختلفة، مما يدعم فرضية التماثل كما هو موضح في الشكل 10.
علاوة على ذلك، يعرض مخطط Q-Q للدقة علاقة خطية بين القيم المرتبة والكمية النظرية، مما يشير إلى أن توزيع قيم الدقة قريب من توزيع طبيعي.
مقارنة أداء النموذج عبر مجموعات البيانات
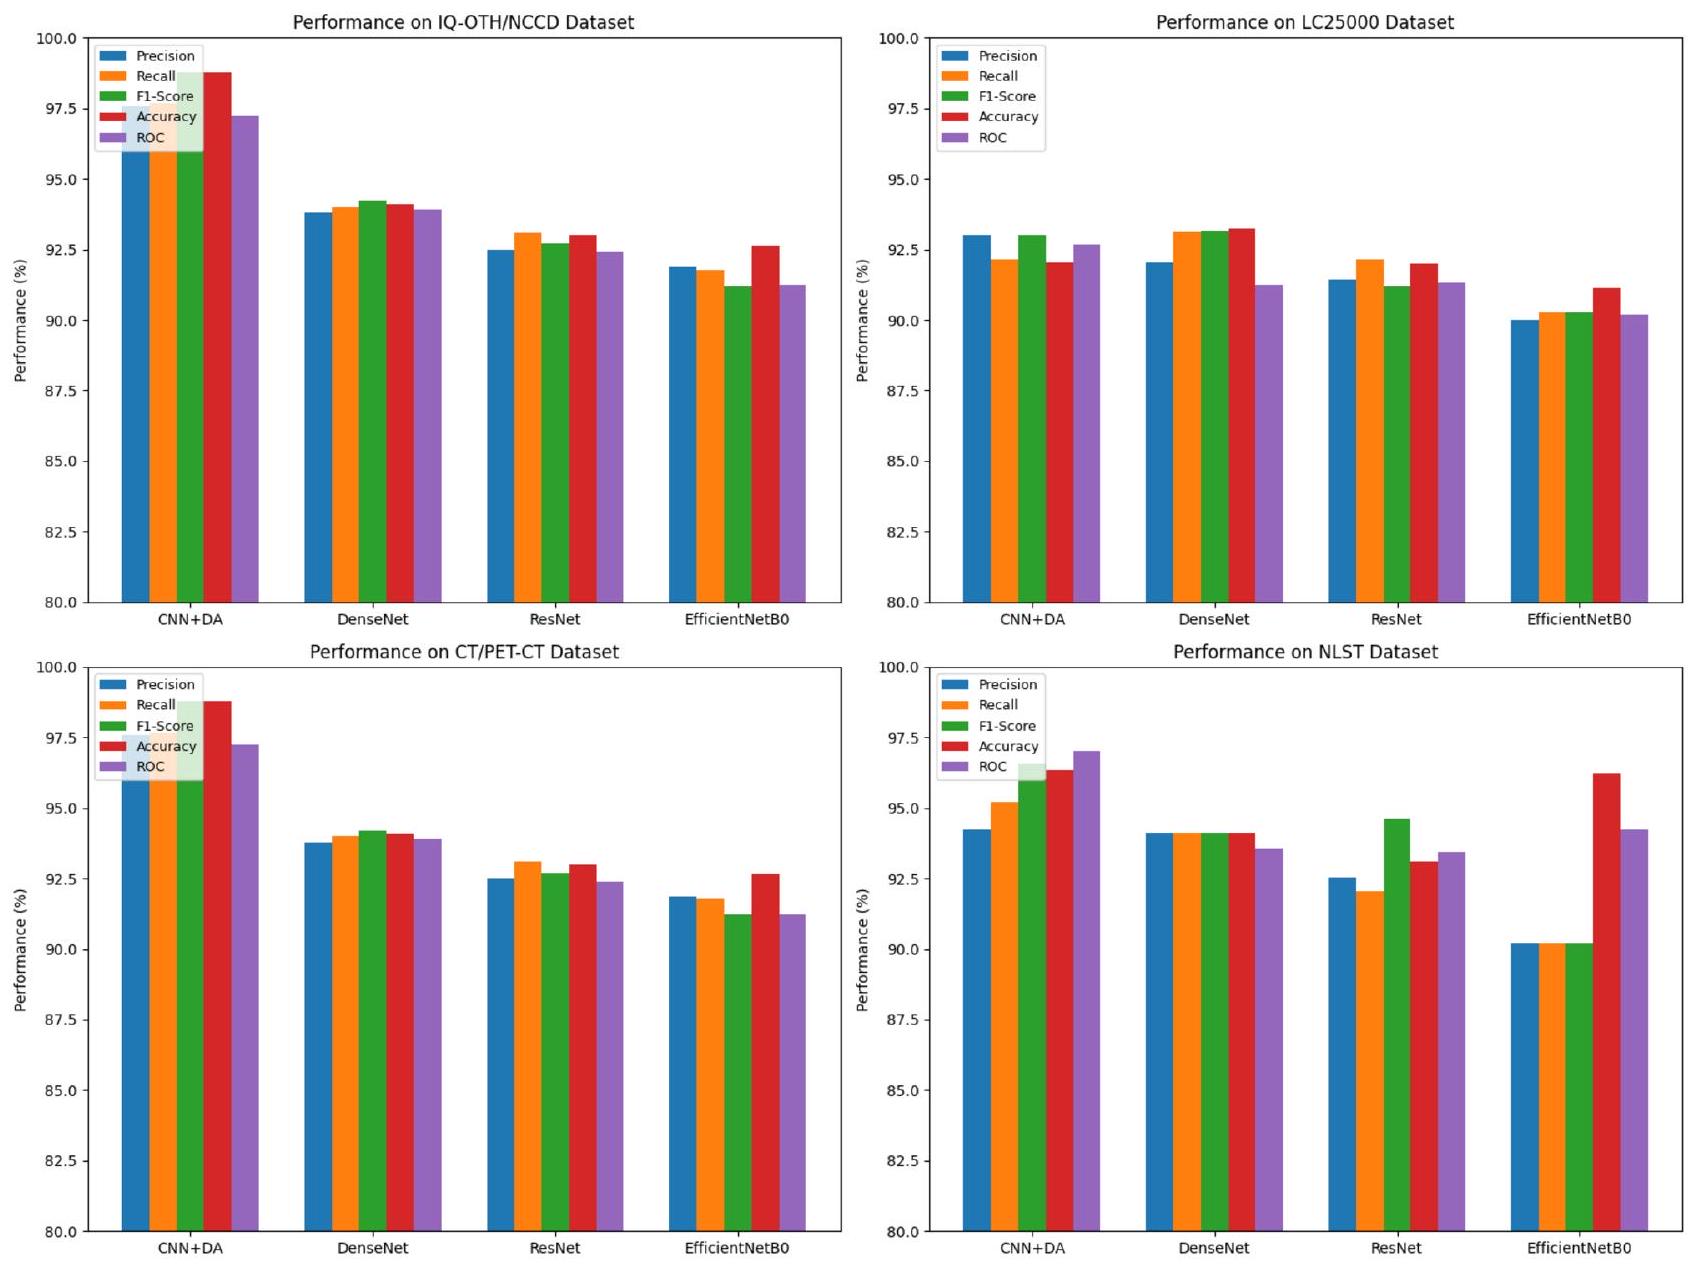
الشكل 6. مقاييس الأداء المقارنة لـ
كما هو موضح في الشكل 11. تشير هذه النتيجة إلى أن أداء النموذج متسق ولا يظهر انحرافات كبيرة عن الطبيعية.
كما هو موضح في الشكل 11. تشير هذه النتيجة إلى أن أداء النموذج متسق ولا يظهر انحرافات كبيرة عن الطبيعية.
بشكل عام، تشير تحليل هذه المخططات والمقاييس إلى أن النموذج يعمل بشكل جيد، ويظهر درجات أداء عالية، ومتبيعات موزعة بشكل طبيعي، وأداء متسق عبر جوانب التقييم المختلفة. تشير هذه النتائج إلى أن النموذج يمكن أن يكشف بنجاح عن الأنماط الأساسية في البيانات ويولد توقعات دقيقة.
يظهر نموذج CNN المقترح مع زيادة البيانات التفاضلية (CNN + DA) أداءً متفوقًا مقارنةً بالهياكل المعروفة مثل DenseNet و EfficientNetB0، ويرجع ذلك أساسًا إلى نهجه المبتكر في التخفيف من الإفراط في حفظ الذاكرة وتعزيز القوة ضد تباين البيانات. يحدث الإفراط في حفظ الذاكرة، وهو تحدٍ شائع في التعلم العميق، عندما تتذكر النماذج بيانات التدريب بدلاً من التعميم منها. يعالج نموذج CNN + DA هذه المشكلة بفعالية من خلال دمج زيادة البيانات التفاضلية (DA)، التي تطبق تحولات متنوعة مثل تعديل اللون، والسطوع، والتشبع، وتعديلات التباين أثناء التدريب. هذا التعرض لطيف أوسع من تباينات البيانات يثبط الحفظ ويعزز التعلم الحقيقي، مما يؤدي إلى تحسين قدرات التعميم. علاوة على ذلك، فإن الطبيعة الديناميكية لـ DA تسمح لنموذج CNN + DA بالتكيف مع التباينات الواقعية في ظروف التصوير، مما يعزز قوته وأدائه عبر مجموعات سكانية متنوعة من المرضى وبروتوكولات التصوير. تم تصميم هيكل نموذج CNN+DA للاستفادة من استخراج الميزات الهرمية، مما يمكّنه من تحديد الميزات الحرجة التي تشير إلى سرطان الرئة، بغض النظر عن التباينات التي قدمتها DA. تؤكد التحقق عبر مجموعات بيانات متعددة، بما في ذلك مجموعة بيانات IQ-OTH/NCCD و LC25000 و مجموعة بيانات CT و PET/CT الكبيرة، قدرة النموذج على التعميم بفعالية، محققًا دقة قدرها
منحنيات الدقة والاسترجاع لجميع النماذج ومجموعات البيانات
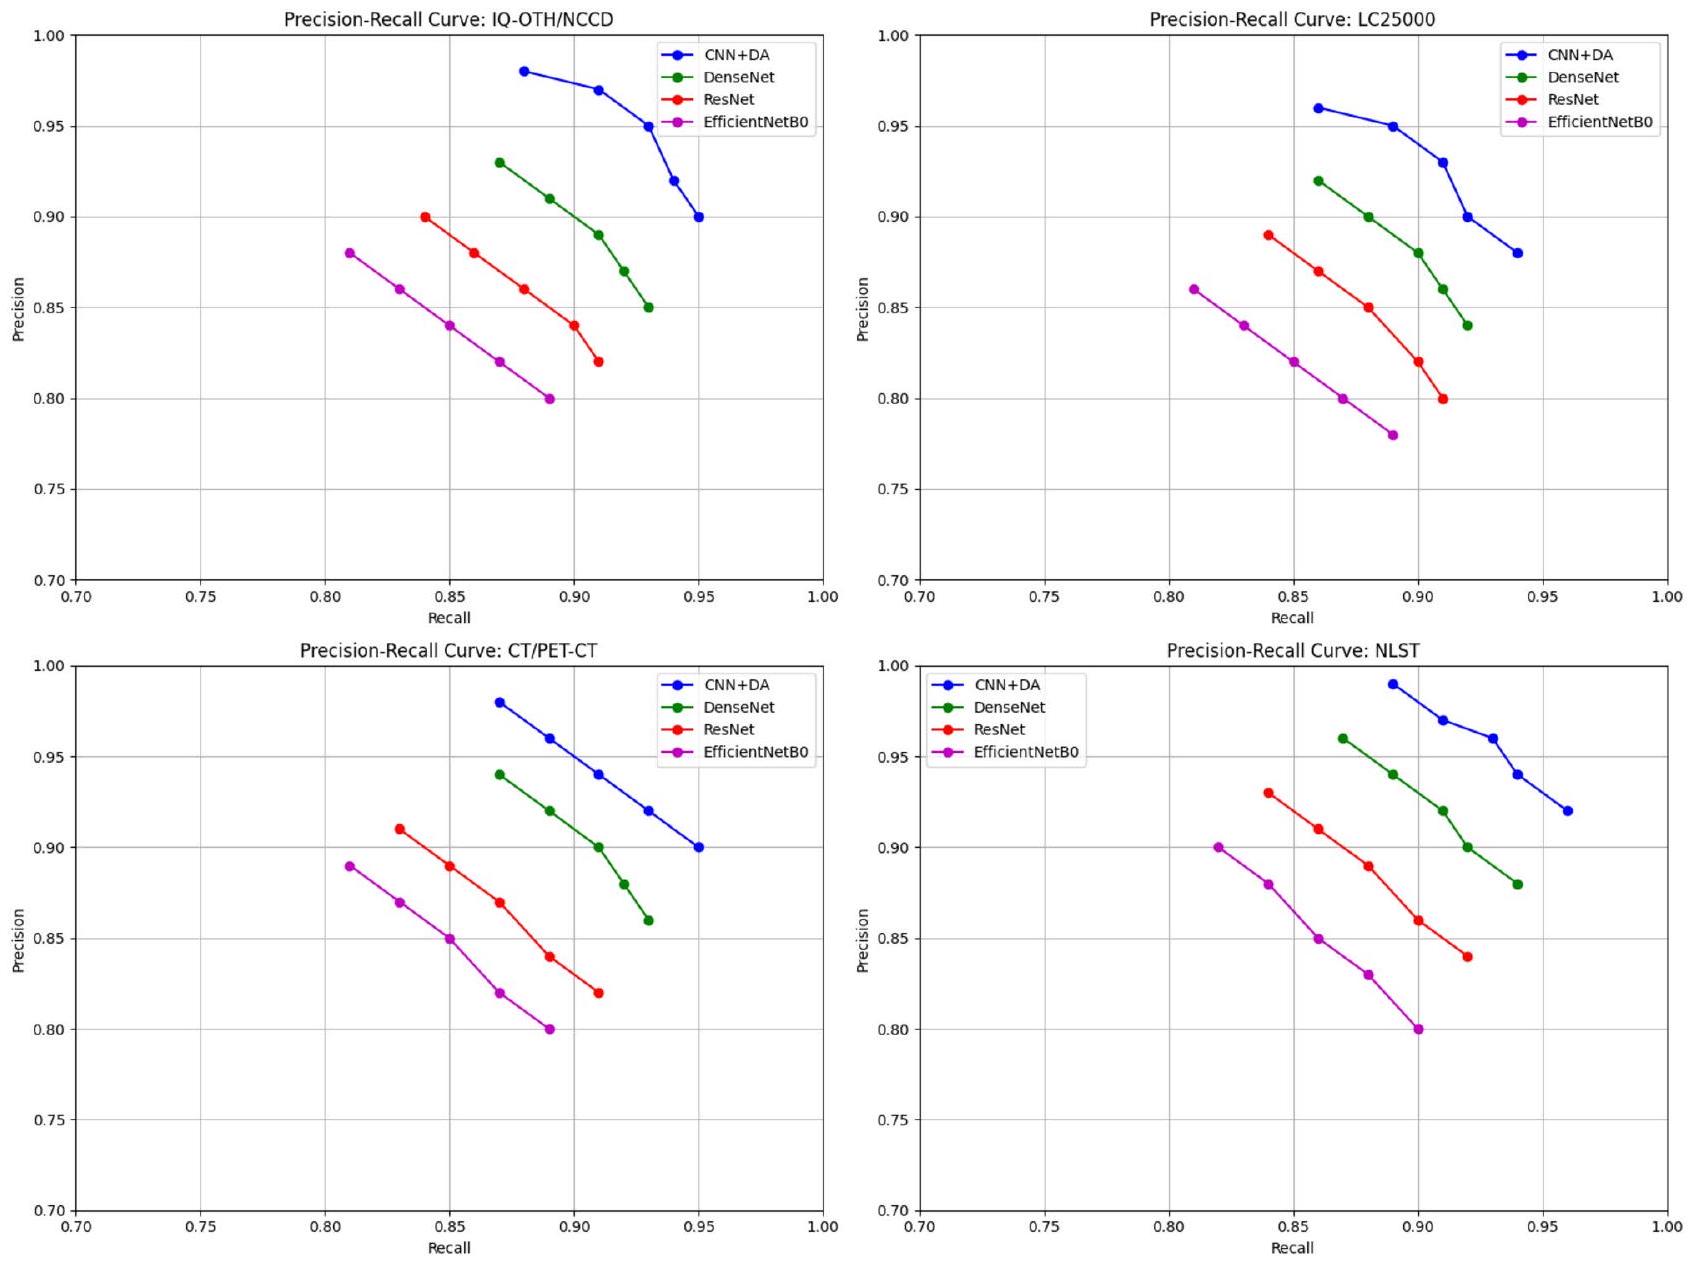
الشكل 7. منحنيات الدقة والاسترجاع مقارنة بين CNN + DA و DenseNet و ResNet و EfficientNetB0، تظهر توازنًا أفضل بين الدقة والاسترجاع في النموذج المقترح.
الشكل 8. خريطة حرارة ارتباط الميزات لتحليل اعتماد السمات.
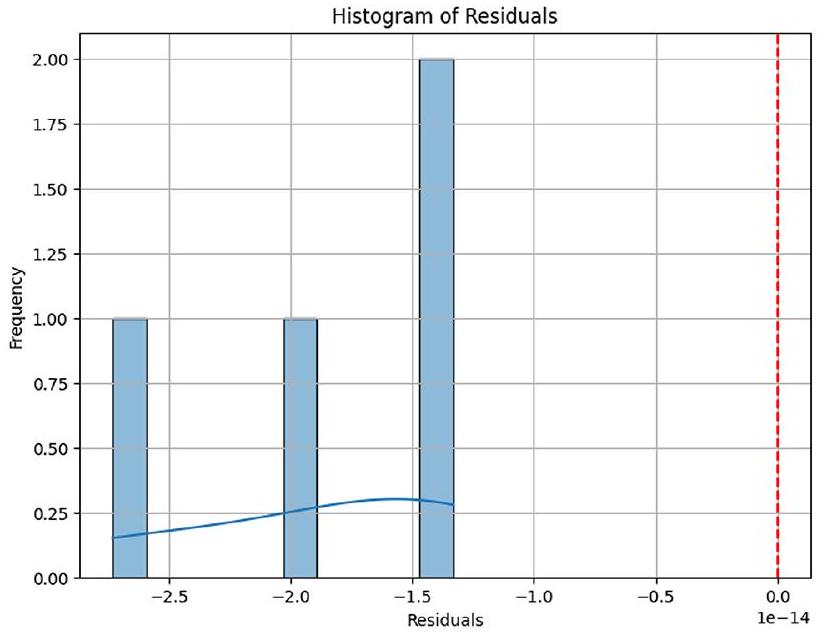
الشكل 9. هيستوجرام المتبقي لتقييم كفاية النموذج.
الشكل 10. رسم المتبقيات مقابل القيم الملائمة لفحص التماثل.
الشكل 11. رسم Q-Q للدقة لتقييم الطبيعية.
| نماذج CNN | درجة التقاطع على الاتحاد (IoU) | ||||
| 6 ميزات | 8 ميزات | 10 ميزات | 12 ميزة | متوسط درجة IoU | |
| DenseNet | 0.33 | 0.36 | 0.39 | 0.43 | 0.37 |
| ResNet | 0.29 | 0.31 | 0.35 | 0.39 | 0.33 |
| EfficientNetB0 | 0.31 | 0.37 | 0.41 | 0.43 | 0.38 |
| CNN + DA | 0.35 | 0.40 | 0.43 | 0.47 | 0.41 |
الجدول 13. درجة IoU للنماذج المدربة مسبقًا المختارة لحالة البنجين.
| نماذج CNN | درجة التقاطع على الاتحاد (IoU) | ||||
| 6 ميزات | 8 ميزات | 10 ميزات | 12 ميزة | متوسط درجة IoU | |
| DenseNet | 0.28 | 0.32 | 0.35 | 0.38 | 0.33 |
| ResNet | 0.25 | 0.28 | 0.31 | 0.34 | 0.29 |
| EfficientNetB0 | 0.27 | 0.30 | 0.33 | 0.36 | 0.31 |
| CNN + DA | 0.33 | 0.37 | 0.40 | 0.44 | 0.38 |
الجدول 14. درجة IoU للنماذج المدربة مسبقًا المختارة لحالة الخبيث.
تحليل الأخطاء على أربع مجموعات بيانات
يمكن أيضًا تصنيف الأخطاء المحتملة من خلال التصنيفات الخاطئة من حيث معدل الخطأ، مما يعطي فهمًا واضحًا لنقاط الضعف في النموذج. الآخرون الذين لديهم معدلات خطأ أعلى نسبيًا في تجاربنا (على سبيل المثال،
الآثار الأخلاقية والعملية
يأتي استخدام نموذج CNN مع التعزيز التفاضلي (DA) للكشف عن سرطان الرئة مع بعض القضايا الأخلاقية والعملية. تعتبر خصوصية البيانات وأمانها عاملًا مهمًا يجب مراعاته حيث يجب مشاركة هذه البيانات، وتشفيرها، وما إلى ذلك. لتقليل التحيز وعدم العدالة تجاه المرضى، يتم منع التحيز من مجموعات بيانات متعددة؛ يعزز التخفيف من التحيز من خلال مجموعات بيانات متنوعة العدالة، بينما تعزز الذكاء الاصطناعي القابل للتفسير الشفافية للأطباء. تعتبر الاعتبارات الفنية هي التحقق من الأداء الفعلي للنموذج المقترح في مجموعات بيانات العالم الحقيقي المختلفة والتعامل مع الاختلافات في التصوير للحصول على تطبيقات عامة. يعد الدمج السلس في سير العمل السريري مع واجهات سهلة الاستخدام أمرًا حاسمًا للتبني. تعمل هذه الخطوات كأمور حاسمة حتى يمكن تحويل نموذج CNN + DA المدمج إلى أداة تشخيص موثوقة ودقيقة ستساعد في التشخيص المبكر وعلاج أفضل، مع محاولة منع القضايا الأخلاقية والعملية في تنفيذه.
النتائج لـ XAI باستخدام LIME
يتم تقديم تقييم نماذج الشبكة العصبية التلافيفية (CNN) باستخدام مقياس التقاطع على الاتحاد (IoU) في سياقين: حالات البنجين والخبيث. يقارن الجدول 13 (لحالة البنجين) والجدول 14 (لحالة الخبيث) أداء أربعة نماذج: DenseNet و ResNet و EfficientNetB0 و CNN + DA (CNN مع تعزيز البيانات). في الجدول 13، يحقق CNN + DA أعلى متوسط درجة IoU قدرها 0.41، مما يشير إلى أداء متفوق في تحديد الميزات ذات الصلة عبر مجموعات ميزات مختلفة (
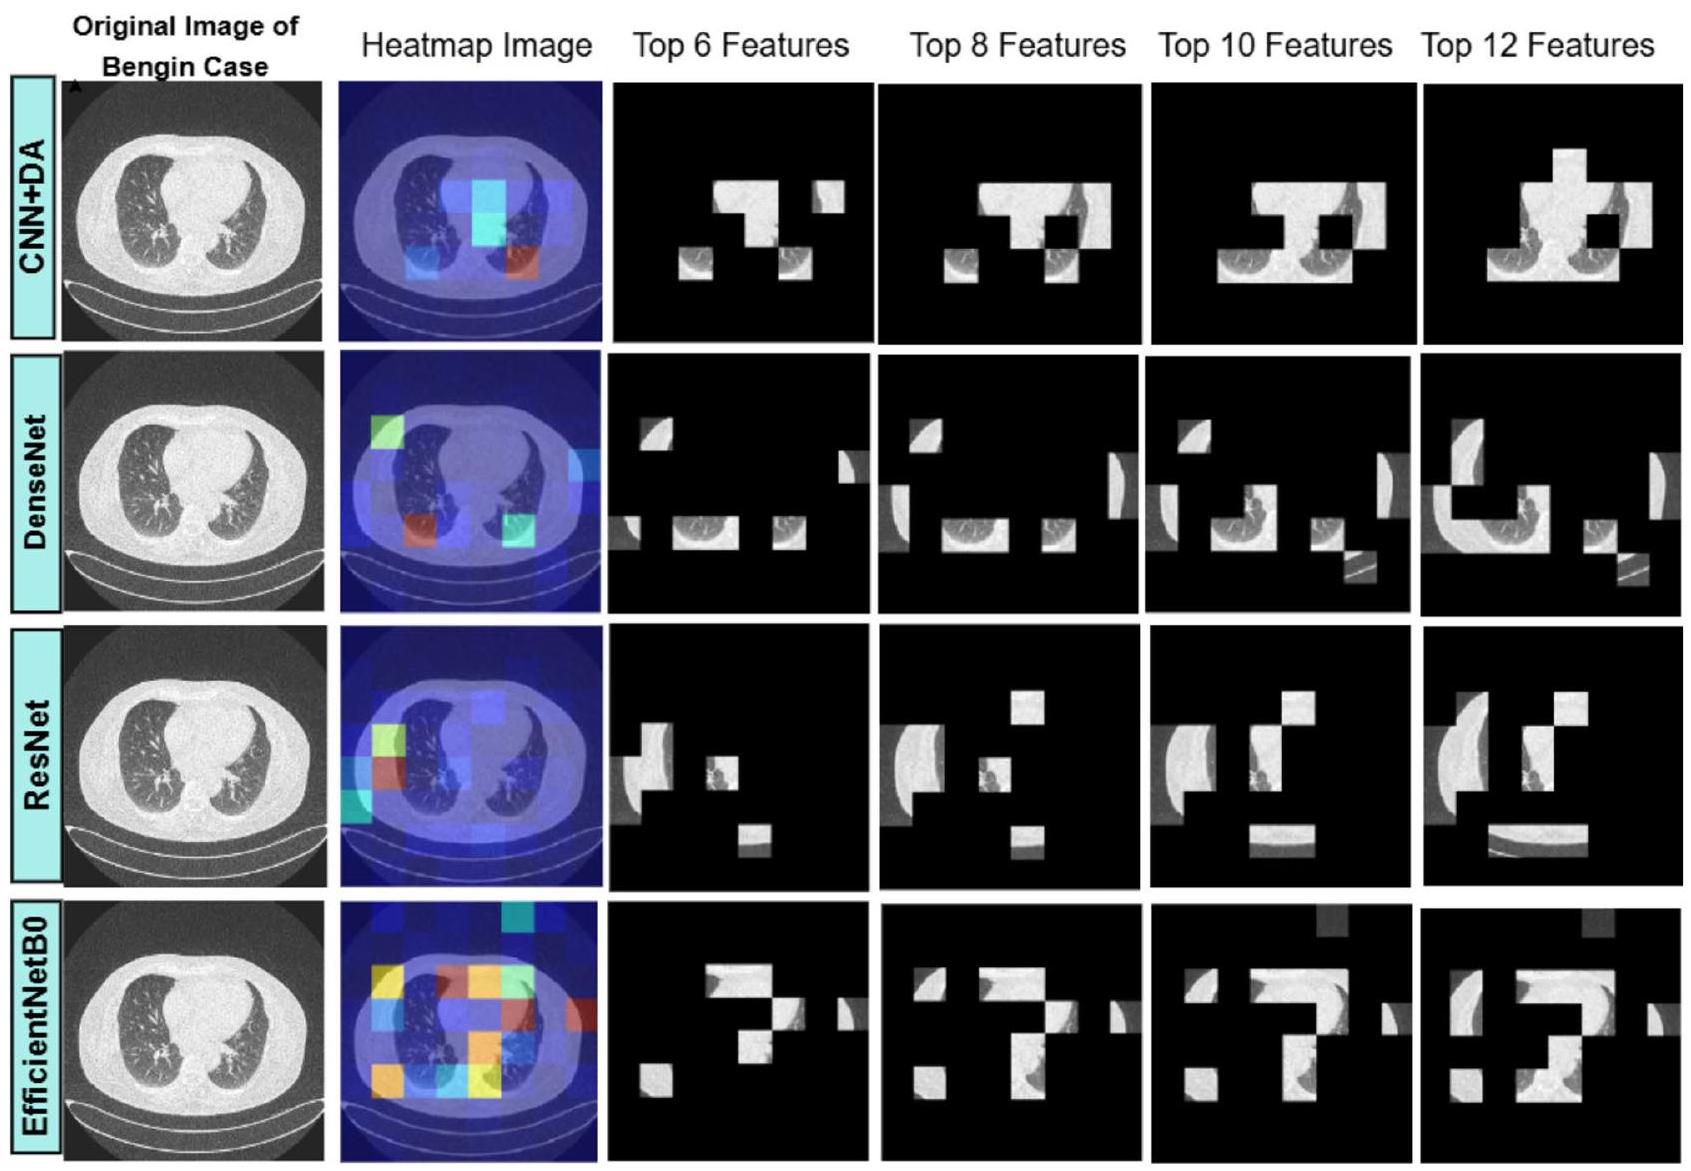
الشكل 12. تصور تحليل صورة الرئة: الصورة الأصلية لحالة البنجين، خرائط حرارة LIME، والتغطية المعتمدة على الميزات لـ 6 و 8 و 10 و 12 ميزة مهمة.
مقارنة أداء الأعمال الحالية مع العمل المقترح
يحقق نموذج CNN مع التعزيز التفاضلي (CNN + DA) دقة رائدة تبلغ 98.78%، متفوقًا على الأساليب الحالية الرائدة في تشخيص سرطان الرئة. استكشفت الأعمال السابقة نماذج التعلم العميق وتقنيات التعزيز المختلفة، ومع ذلك لا تزال هناك فجوات في معالجة الإفراط في الذاكرة وتحقيق تعميم قوي. بشكل حاسم، أظهرت دراسة أجراها إسلام وآخرون (2024)
أظهرت الشبكات العصبية التلافيفية التقليدية (CNNs) من راينيو وكلين (2024)
أظهرت النماذج المتقدمة المجمعة والهجينة وعدًا، حيث حقق كوازار وآخرون (2023)
على النقيض من ذلك، يدمج نموذج CNN + DA التعزيز التفاضلي لتقديم تحولات متنوعة، مثل تعديل اللون والسطوع والتباين، مما يعالج مباشرة الإفراط في التكيف ويعزز التعميم. مقارنة بالأعمال الأخرى، يظهر نموذج CNN + DA دقة متفوقة، مما يثبت موثوقيته وقوته للتطبيقات السريرية في الكشف عن سرطان الرئة. يربط نهجه المبتكر الفجوات التي تركتها النماذج السابقة، مما يعزز مساهمته كأداة تشخيص جديدة وفعالة للغاية. يقارن الجدول 15 أداء الأساليب الحالية مع النهج المقترح، مسلطًا الضوء على التحسينات في الدقة أو الكفاءة أو غيرها من المقاييس الرئيسية.
القيود
مجموعة البيانات الأساسية المستخدمة (IQ-OTH/NCCD)، التي تتكون من 1,097 صورة فقط، صغيرة نسبيًا لتدريب نماذج التعلم العميق، مما يحد من قدرة النموذج على التعميم عبر طيف أوسع من تنوعات سرطان الرئة وخصائص المرضى. توزيع الفئات في هذه المجموعة غير متوازن أيضًا، مع وجود حالات خبيثة أكثر من الحالات الحميدة أو العادية، مما قد يؤدي إلى تحيز النموذج نحو الفئة الغالبة. بينما نموذج CNN + DA
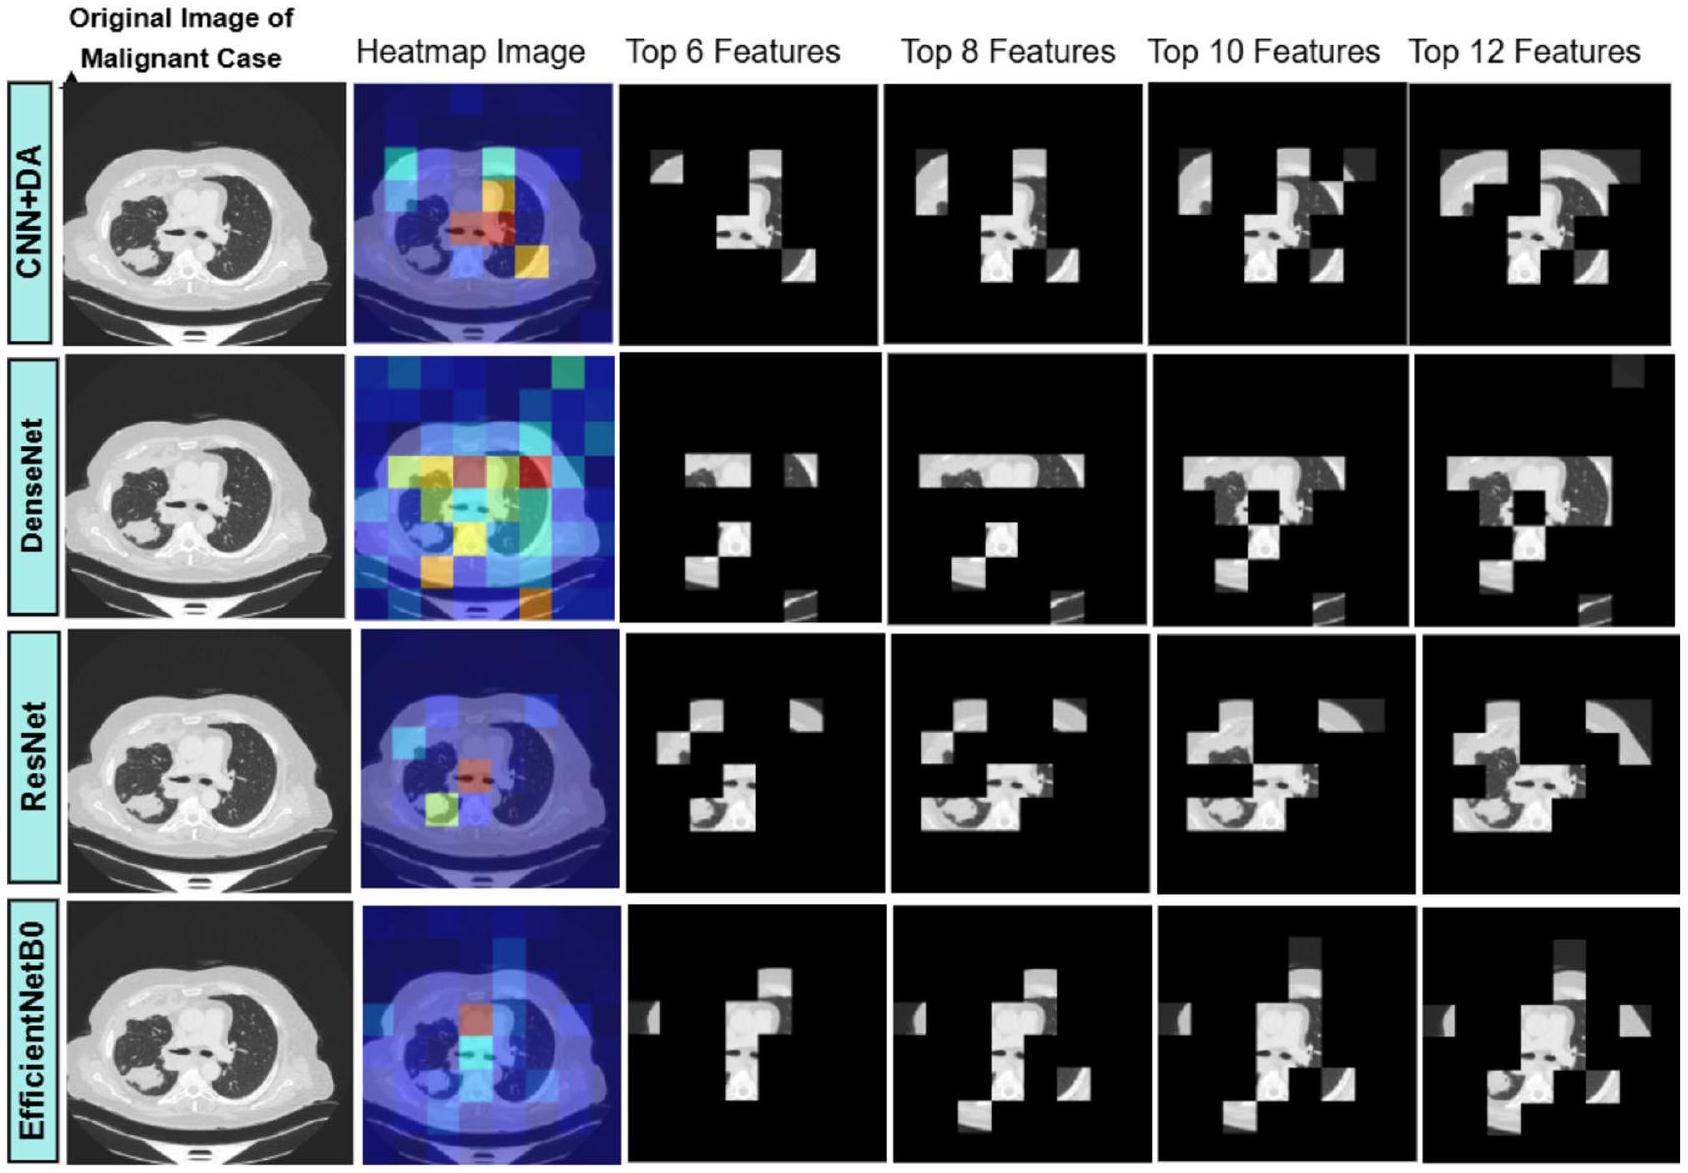
الشكل 13. تصور تحليل صورة الرئة: الصورة الأصلية لحالة خبيثة، خرائط حرارة LIME، وقناع قائم على الميزات لـ 6 و 8 و 10 و 12 ميزة مهمة.
| المؤلف(ون) | النموذج المقترح | الدقة |
| إسلام وآخرون (2024)
|
الشبكات التنافسية التوليدية (GANs) والترميز التلقائي التبايني (VAEs) | 94% |
| سها وآخرون (2024)
|
VER-Net | 91% |
| راينيو وكلين (2024)
|
شبكة الأعصاب التلافيفية (CNN) | 92.6% |
| كوكريجا وساباروال (2024)
|
شبكة الأعصاب التلافيفية (CNN) | 96.11% |
| تشانغ وآخرون (2024)
|
دمج DenseNet-CNN | 96% |
| غاي وآخرون (2023)
|
شبكات الأعصاب التلافيفية (CNNs) ومحولات الرؤية (ViTs) | 93.4% |
| كوازار وآخرون (2023)
|
نموذج تجميعي (BEiT، DenseNet، CNN تسلسلي مع طرق تجميع) | 96.34% |
| رازآ وآخرون (2023)
|
Lung-EffNet (EfficientNet مع طبقات علوية معدلة) | 96.10% |
| غوتام وآخرون (2023)
|
تجميع (ResNet-152، DenseNet-169، EfficientNet-B7 مع تحسين الوزن) | 97.23% |
| دريستاس وترغكا (2022)
|
غابة الدوران | 97.1% |
| تسوا وآخرون (2021)
|
تعزيز التدرج المتطرف (XGBoost) | 92% |
| عملنا | CNN مع DA | 98.78% |
الجدول 15. مقارنة أداء الأعمال الحالية مع العمل المقترح.
يؤدي بشكل جيد على مجموعة البيانات المسيطر عليها، لكن أداؤه في البيئات السريرية الواقعية، التي تتضمن بروتوكولات تصوير متنوعة، وخصائص المرضى، والآثار المحتملة، لم يتم التحقق منه بعد. قد يواجه النموذج صعوبة في التعامل مع التغيرات غير المرئية في ظروف التصوير الشائعة في الإعدادات السريرية. بالإضافة إلى ذلك، فإن دمج التعزيز التفاضلي (DA) أثناء التدريب يقدم عبئًا حسابيًا إضافيًا، مما يزيد من وقت التدريب ومتطلبات الموارد، مما قد يكون تحديًا في البيئات ذات الموارد المحدودة. أخيرًا، يعتمد أداء النموذج بشكل كبير على جودة بيانات الإدخال؛ الصور المزعجة أو ذات الجودة المنخفضة قد تؤدي إلى تصنيفات خاطئة، خاصة عند التمييز بين الأورام الحميدة والخبيثة.
الخاتمة
يظل سرطان الرئة تحديًا صحيًا عالميًا كبيرًا، يتطلب حلولًا مبتكرة لتحسين دقة التشخيص. تتناول هذه الدراسة المشكلة المستمرة للإفراط في التكيف في نماذج التعلم العميق، مما يعيق قدرتها على التعميم عبر مجموعات بيانات متنوعة. كجهد لتحسين جودة نماذج اكتشاف سرطان الرئة، تسعى هذه البحث إلى تصميم طريقة جديدة تتضمن دمج تقنية التعزيز التفاضلي مع شبكة الأعصاب التلافيفية.
تم إثبات فعالية نموذج CNN + DA المقترح، حيث حقق دقة توقع
كما هو موضح في هذا البحث، فإن دمج التعزيز التفاضلي مع الشبكات العصبية التلافيفية هو حل جيد للمشكلات الموجودة في النماذج التقليدية. وبالتالي، تشير الاستنتاجات إلى الحاجة إلى تطوير نماذج لا تحل المشكلات بدقة فحسب، بل تكون أيضًا محصنة ضد الاضطرابات المعادية ويمكن توسيعها بسهولة لمعالجة مجموعة أوسع من المشكلات. يمكن أن تستكشف الأعمال المستقبلية المزيد من قابلية تكيف هذا النهج مع مجالات ومجموعات بيانات أخرى، مما يوسع من فائدته في تعزيز أبحاث التعلم العميق للمهام التشخيصية المعقدة.
توفر البيانات
البيانات المستخدمة لدعم نتائج مجموعة البيانات الجديدة التي تم إنشاؤها، هذه الدراسة متاحة من المؤلف المراسل عند الطلب.
تاريخ الاستلام: 24 سبتمبر 2024؛ تاريخ القبول: 14 أبريل 2025
تم النشر عبر الإنترنت: 05 مايو 2025
تم النشر عبر الإنترنت: 05 مايو 2025
References
- Jaksik, R., Szumała, K., Dinh, K. N. & Śmieja, J. Multiomics-Based feature extraction and selection for the prediction of lung Cancer survival. Int. J. Mol. Sci. 25 (7 (March 25), 3661. https://doi.org/10.3390/ijms25073661 (2024).
- Lasrado, S. A. & Babu, G. N. K. S. Fused feature reduction and selection system for early lung Cancer detection (April 4). https:// doi.org/10.1109/iconstem60960.2024.10568801 (2024).
- Aggarwal, P., Marwah, N., Kaur, R. & Mittal, A. Lung Cancer Survival Prognosis Using a Two-Stage Modeling Approach. Multimedia Tools and Applications (January 31). https://doi.org/10.1007/s11042-024-18280-2 (2024).
- Hussain, L., Almaraashi, M. S., Aziz, W., Habib, N. & Abbasi, S. U. R. S. Machine learning-based lungs cancer detection using reconstruction independent component analysis and sparse filter features. Waves Random Complex. Media 34, 226-251. https://d oi.org/10.1080/17455030.2021.1905912 (2021).
- Mamun, M., Mahmud, M. I. & Meherin, M. & Abdelgawad, A. LCDctCNN: lung Cancer diagnosis of CT scan images using CNN based model. ArXiv (Cornell University). (2023). https://doi.org/10.48550/arxiv.2304.04814
- Moitra, D. & Mandal, R. K. Classification of non-small cell lung cancer using one-dimensional convolutional neural network. Expert Syst. Appl. 159, 113564 (2020).
- Perez, G. & Arbelaez, P. Automated Lung cancer Diagnosis Using three-dimensional Convolutional Neural Networks, 1803-1815 (Medical & Biological Engineering & Computing, 2020).
- Moitra, D. & Mandal, R. K. Automated AJCC staging of non-small cell lung cancer (NSCLC) using deep convolutional neural network (CNN) and recurrent neural network (RNN). Health Inform. Sci. Syst. 7, 1-12 (2019).
- Doppalapudi, S., Qiu, R. G. & Badr, Y. Lung cancer survival period prediction and understanding: deep learning approaches. Int. J. Med. Informatics. 148, 104371 (2021).
- Faruqui, N. et al. LungNet: A hybrid deep-CNN model for lung cancer diagnosis using CT and wearable sensor-based medical IoT data. Comput. Biol. Med. 139, 104961. (2021).
- Aboamer, M. A. et al. An investigation in analyzing the food quality well-being for lung cancer using blockchain through cnn. J. Food Qual. (2022).
- Kirienko, M. et al. Convolutional neural networks promising in lung cancer T-parameter assessment on baseline FDG-PET/CT. Contrast Media Mol. Imaging (2018).
- Lin, C. J., Jeng, S. Y. & Chen, M. K. Using 2D CNN with Taguchi parametric optimization for lung cancer recognition from CT images. Appl. Sci. 10 (7), 2591 (2020).
- Moitra, D. & Mandal, R. K. Prediction of non-small cell lung cancer histology by a deep ensemble of convolutional and bidirectional recurrent neural network. J. Digit. Imaging. 33, 895-902 (2020).
- Zhan, X. et al. A convolutional neural network-based intelligent medical system with sensors for assistive diagnosis and decisionmaking in non-small cell lung cancer. Sensors, 21(23), p.7996. (2021).
- Islam, Tauhidul, M. S., Hafiz, J. R., Jim & Mridha, M. F. Md. Mohsin Kabir, and A systematic review of deep learning data augmentation in medical imaging: Recent advances and future research directions. Healthcare Analytics 5June 1, : 100340. (2024). https://doi.org/10.1016/j.health.2024.100340
- Saha, A. et al. VER-Net: A hybrid transfer learning model for lung cancer detection using CT scan images. BMC Med. Imaging 24. https://doi.org/10.1186/s12880-024-01238-z (2024).
- Rainio, O. & Klén, R. Comparison of simple augmentation transformations for a convolutional neural network classifying medical images. Signal Image Video Process. https://doi.org/10.1007/s11760-024-02998-5 (2024).
- Kukreja, S. & Sabharwal, M. An effective lung Cancer diagnosis model using the CNN algorithm. EAI Endorsed Trans. Pervasive Health Technol. 10 https://doi.org/10.4108/eetpht.10.6805 (2024).
- Zhang, C. et al. Enhancing lung cancer diagnosis with data fusion and mobile edge computing using DenseNet and CNN. J. Cloud Comput. Adv. Syst. Appl. 13. https://doi.org/10.1186/s13677-024-00597-w (2024).
- Gai, L., Xing, M., Chen, W., Zhang, Y. & Qiao, X. Comparing CNN-based and transformer-based models for identifying lung cancer: which is more effective? Multim. Tools Appl. 83, 59253-59269. https://doi.org/10.1007/s11042-023-17644-4 (2023).
- Quasar, S. et al. Ensemble methods for computed tomography scan images to improve lung cancer detection and classification. Multimedia Tools Appl. 83 (17), 52867-52897. https://doi.org/10.1007/s11042-023-17616-8 (2023).
- Raza, R. et al. Lung-EffNet: lung cancer classification using EfficientNet from CT-scan images. Eng. Appl. Artif. Intell. 126 (1), 106902. https://doi.org/10.1016/j.engappai.2023.106902 (2023).
- Gautam, N., Basu, A. & Sarkar, R. Lung cancer detection from thoracic CT scans using an ensemble of deep learning models. Neural Comput. Appl. 36, 2459-2477. https://doi.org/10.1007/s00521-023-09130-7 (2023).
- Dritsas, E. & Trigka, M. Lung cancer risk prediction with machine learning models. Big Data Cogn. Comput. 6 (4), 139. (2022).
- Tsou, P. H. et al. Exploring volatile organic compounds in breath for high-accuracy prediction of lung cancer. Cancers 13 (6), 1431 (2021).
- Muniasamy, A., Alquhtani, S. A. S., Bilfaqih, S. M., Balaji, P. & Karunakaran, G. Lung cancer histopathology image classification using transfer learning with Convolution neural network model. Technol. Health Care November. 9, 1-12. https://doi.org/10.3233 /thc-231029 (2023).
- Jothi, J., Sathiya & Chinnadurai, M. A combined deep CNN with a chimp optimization approach for lung cancer diagnosis. J. Intell. Fuzzy Syst. 46 (2), 4681-4696. https://doi.org/10.3233/jifs-237339 (2024).
- Garcea, F., Serra, A., Lamberti, F. & Morra, L. Data augmentation for medical imaging: A systematic literature review. Comput. Biol. Med. 152 (January 1), 106391. https://doi.org/10.1016/j.compbiomed.2022.106391 (2023).
- Mathworks Understand Network Predictions Using LIME – MATLAB & Simulink – MathWorks India-in.mathworks.com. (2024). https://in.mathworks.com/help/deeplearning/ug/understand-network-predictions-using-lime.html. Accessed 28 May 2024.
- Kumar, S. V. & Kondaveeti, H. K. Towards transparency in AI: explainable bird species image classification for ecological research. Ecol. Ind. 169, 112886. https://doi.org/10.1016/j.ecolind.2024.112886 (2024).
- Ribeiro, M. T., Singh, S. & Guestrin, C. Why should i trust you? Explaining the predictions of any classifier. In Proceedings of the 22nd ACM SIGKDD International Conference on Knowledge Discovery and Data Mining, 1135-1144. (2016).
- Zafar, M. R. & Khan, N. Deterministic local interpretable model-agnostic explanations for stable explainability. Mach. Learn. Knowl. Extr. 3 (3), 525-541 (2021).
- Hamdalla, F. The & IQ-OTH/NCCD Lung Cancer Dataset. Kaggle. (2020). https://www.kaggle.com/datasets/hamdallak/the-iqoth nccd-lung-cancer-dataset. Accessed 3 Jan 2023.
- Lung and Colon Cancer Histopathological Images. https://www.kaggle.com/datasets/andrewmvd/lung-and-colon-cancer-histopa thological-images. Accessed 7 Dec 2024.
- Clark, K. et al. The Cancer imaging archive (TCIA): maintaining and operating a public information repository. J. Digit. Imaging. 26, 1045-1057. https://doi.org/10.1007/s10278-013-9622-7 (2013).
- Team, N. L. S. T. R. The National lung screening trial: overview and study design. Radiology 258 (1), 243-253. https://doi.org/10.1 148/radiol. 10091808 (2011).
- Tirumanadham, N. Improving predictive performance in e-learning through hybrid 2-tier feature selection and hyper parameteroptimized 3-tier ensemble modeling. Int. J. Inf. Tecnol. 16, 5429-5456. https://doi.org/10.1007/s41870-024-02038-y (2024).
الشكر والتقدير
يقول المؤلفون شكرًا لدعمهم في إكمال هذا العمل البحثي.
مساهمات المؤلفين
راجع جميع المؤلفين المخطوطة.
التمويل
أعلن المؤلف أنه لم يتم تلقي أي تمويل لهذا البحث والنشر.
الإعلانات
المصالح المتنافسة
يعلن المؤلفون عدم وجود مصالح متنافسة.
الموافقة الأخلاقية
لا يحتوي هذا المقال على أي دراسات مع مشاركين بشريين أو حيوانات أجراها المؤلف.
معلومات إضافية
يجب توجيه المراسلات والطلبات للحصول على المواد إلى V.S.
معلومات إعادة الطبع والأذونات متاحة علىwww.nature.com/reprints.
ملاحظة الناشر تظل Springer Nature محايدة فيما يتعلق بالمطالبات القضائية في الخرائط المنشورة والانتماءات المؤسسية.
معلومات إعادة الطبع والأذونات متاحة علىwww.nature.com/reprints.
ملاحظة الناشر تظل Springer Nature محايدة فيما يتعلق بالمطالبات القضائية في الخرائط المنشورة والانتماءات المؤسسية.
الوصول المفتوح هذا المقال مرخص بموجب ترخيص المشاع الإبداعي النسب-غير التجاري-بدون اشتقاقات 4.0 دولي، الذي يسمح بأي استخدام غير تجاري، ومشاركة، وتوزيع وإعادة إنتاج في أي وسيلة أو صيغة، طالما أنك تعطي الائتمان المناسب للمؤلف(ين) الأصليين والمصدر، وتوفر رابطًا إلى ترخيص المشاع الإبداعي، وتوضح إذا قمت بتعديل المادة المرخصة. ليس لديك إذن بموجب هذا الترخيص لمشاركة المواد المعدلة المشتقة من هذا المقال أو أجزاء منه. الصور أو المواد الأخرى من طرف ثالث في هذا المقال مشمولة في ترخيص المشاع الإبداعي للمقال، ما لم يُذكر خلاف ذلك في سطر ائتمان للمادة. إذا لم تكن المادة مشمولة في ترخيص المشاع الإبداعي للمقال واستخدامك المقصود غير مسموح به بموجب اللوائح القانونية أو يتجاوز الاستخدام المسموح به، ستحتاج إلى الحصول على إذن مباشرة من صاحب حقوق الطبع والنشر. لعرض نسخة من هذا الترخيص، قم بزيارةhttp://creativecommo ns.org/licenses/by-nc-nd/4.0/.
© المؤلف(ون) 2025
© المؤلف(ون) 2025
قسم علوم الحاسوب والهندسة، UCEK، جامعة جواهر لال نهرو التكنولوجية كاكينادا، كاكينادا، أندرا براديش-533003، الهند. قسم علوم الحاسوب والهندسة، معهد أمارا ساي للعلوم والتكنولوجيا، باتينابادو، باريتالا، أندرا براديش-521180، الهند. البريد الإلكتروني:shariff.v@gmail.com
Journal: Scientific Reports, Volume: 15, Issue: 1
DOI: https://doi.org/10.1038/s41598-025-98731-4
PMID: https://pubmed.ncbi.nlm.nih.gov/40325128
Publication Date: 2025-05-05
DOI: https://doi.org/10.1038/s41598-025-98731-4
PMID: https://pubmed.ncbi.nlm.nih.gov/40325128
Publication Date: 2025-05-05
OPEN
Optimizing non small cell lung cancer detection with convolutional neural networks and differential augmentation
Lung cancer remains one of the leading causes of cancer-related deaths worldwide, with early detection being critical to improving patient outcomes. Recent advancements in deep learning have shown promise in enhancing diagnostic accuracy, particularly through the use of Convolutional Neural Networks (CNNs). This study proposes the integration of Differential Augmentation (DA) with CNNs to address the critical challenge of memory overfitting, a limitation that hampers the generalization of models to unseen data. By introducing targeted augmentation strategies, such as adjustments in hue, brightness, saturation, and contrast, the CNN + DA model diversifies training data and enhances its robustness. The research utilized multiple datasets, including the IQ-OTH/NCCD dataset, to evaluate the proposed model against existing state-of-the-art methods. Hyperparameter tuning was performed using Random Search to optimize parameters, further improving performance. The results revealed that the CNN + DA model achieved an accuracy of 98.78%, outperforming advanced models like DenseNet, ResNet, and EfficientNetB0, as well as hybrid approaches including ensemble models. Additionally, statistical analyses, including Tukey’s HSD post-hoc tests, confirmed the significance of the model’s superior performance. These findings suggest that the CNN + DA model effectively addresses the limitations of prior works by reducing overfitting and ensuring reliable generalization across diverse datasets. The study concludes that the novel CNN + DA architecture provides a robust, accurate, and computationally efficient framework for lung cancer detection, positioning it as a valuable tool for clinical applications and paving the way for future research in medical image diagnostics.
Keywords Lung Cancer prediction, Convolutional neural networks, Differential augmentation (DA), Memorization overfitting, Medical imaging, Diagnostic robustness, EfficientNetB0
Innovative lung cancer prognosis relies on cutting-edge machine learning algorithms applied to a wealth of patient data. By incorporating various elements like imaging, genetics, and medical records, this model demonstrates remarkable precision in anticipating potential occurrences. Optimizing early intervention and customizing treatments, it holds the potential to elevate patient outcomes in the challenging realm of lung cancer. Early detection is vital for successful treatment
Developing a cutting-edge 1D CNN model for NSCLC staging and grading, leveraging insights from the latest TCIA NSCLC Radio genomics Collection. Hybrid MSER-SURF model integrates tumor features with clinical data for comprehensive analysis
Leveraging CNN’s disease detection, this research explores the fusion of blockchain for secure data in enhancing food safety and lung cancer prediction
Introducing an innovative approach, employs a 2D CNN with Taguchi optimization for automated lung cancer recognition from CT images, as outlined in reference
The research structure unfolds with Section 1delvering into the introduction. Section “Literature review” navigates the scholarly landscape in the literature review. Section “Proposed methodology” intricately unfolds the intricacies of the proposed methodology, offering a detailed roadmap. Section “Result and discussion” unveils the results, igniting insightful discussions around their implications. The “conclusion” section encapsulates profound insights, culminating in a comprehensive closure that synthesizes the study’s findings and underscores their significance in the broader context of the research domain.
Literature review
In 2024, Islam et al.
In 2024, Saha et al.
In 2024, Riku Klén et al.
In 2024, S. Kukreja and M. Sabharwa et al.
In 2024, Zhang et al.
introduced an enhanced predictive sparse decomposition (PSD) method to acquire sparse feature from medical images, which also promoted the improvement of the model.
introduced an enhanced predictive sparse decomposition (PSD) method to acquire sparse feature from medical images, which also promoted the improvement of the model.
In 2023, Lulu Gai et al.
In 2023, Syeda Reeha et al.
In view of the available data and resources, this study provides a reasonable response by demonstrating the potential of ensemble methods as a potent tool for enhancing the precision and efficiency of lung cancer diagnosis.
In 2023, R. Raza et al.
In 2023, Nandita Gautam et al.
In 2022, Dritsas and Trigka et al.
In 2021, Tsou et al.
While prior studies focus on augmentation and model optimization, this research uniquely addresses memory overfitting using Differential Augmentation, demonstrating superior performance in lung cancer detection.
Problem statement
The research problem focuses on enhancing the accuracy and efficiency of lung cancer detection using deep learning techniques. Although improved, current models struggle with generalisation, data variability, and interpretability across imaging modalities. Optimising model performance, especially early detection, while addressing dataset variety and augmentation limits is difficult.
Generalizability challenges
Although the CNN + DA model performs well on the controlled dataset, its generalizability to real-world scenarios remains to be validated. Challenges include unseen variations in imaging protocols, patient demographics, and artifacts in clinical datasets. Future studies will explore strategies such as transfer learning and fine-tuning on multi-center datasets to mitigate these challenges and ensure applicability in diverse clinical settings. To increase medical image analysis models’ resilience, scalability, and clinical utility, data fusion, mobile edge computing, and ensemble methods must be explored. Table 1 summarizes the objectives and limitations of previous research, highlighting both their goals and shortcomings.
Research gap
While deep learning has revolutionized numerous domains, including medical imaging for lung cancer detection, a persistent research gap remains concerning memory overfitting. Despite various efforts to address general overfitting, the nuanced challenge of models memorizing training data rather than learning to generalize has not been comprehensively addressed. Many existing solutions focus on broader overfitting issues, often overlooking the subtle yet critical aspect of memory overfitting. This gap underscores the need for dedicated research into strategies and methodologies to combat memory overfitting, ensuring that models remain robust and reliable, especially in critical applications like medical diagnostics.
| Author | Method | Aim | Drawback | ||
| Islam et al.
|
Discussion on the application of various deep learning algorithms in generating and applying data augmentations. This may involve methods like Generative Adversarial Networks (GANs) or other neural network architectures that create realistic variations in medical images. | Identification of field-based difficulties includes constraints in present techniques or problems with data quality and suggested future research paths to handle these difficulties. | Advanced data augmentation techniques can raise the complexity of the model and the training process, thereby perhaps making it more difficult to validate the predictions of the model. More broad and sophisticated augmentations can cause the training process to lengthen and become more resource-intensive, therefore affecting the general efficiency of model development. | ||
| Saha et al.
|
The paper introduces a new transfer learning model called VER-Net, which combines three distinct transfer learning models to improve the diagnosis of lung cancer from CT scan pictures. | Using the benefits of transfer learning and combining several models helps one to increase the accuracy of lung cancer classification. The work also seeks to show that VER-Net can be useful for other medical imaging chores in addition to surpassing current models in performance. | Stackering several transfer learning models under the VER-Net model can complicate the system. This complexity might make model interpretability difficult and raise computational needs. | ||
| Riku Klén et al.
|
A convolutional neural network (CNN) was trained to classify medical images into two categories: impacted, non-affected instances and Augmentation Methods. | Evaluate the influence of various image augmentation methods on the accuracy of a Convolutional Neural Network (CNN) trained to classify medical images into two categories. Identify the most efficacious augmentation methods for various medical imaging modalities (X-rays, ultrasound, positron emission tomography, magnetic resonance imaging) to enhance classification accuracy. | The efficacy of augmentation approaches can vary considerably depending on the nature of the medical imaging data. The study’s findings may not have universal applicability across all modalities of medical imaging or across various clinical states. | ||
| S. Kukreja and M. Sabharwa et al.
|
The work uses CNN architecture to categorise lung cancer histological pictures into bengin, adenocarcinoma, and squamous cell carcinoma. | To divide histological pictures of lung cancer into three types: bengin, adenocarcinoma, and squamous cell carcinoma with accuracy. CNN Model. | This work focuses on CNN and does not compare its performance with a greater spectrum of machine learning or deep learning approaches outside of those already looked at. | ||
| Zhang et al.
|
Convolutional Neural Network (CNN) with DenseNet to improve the ability to extract features and learn for the purpose of classifying lung cancer. | Developing and assessing an advanced system stands as the main goal to detect and categorising lung cancer. The proposed framework integrates Convolutional Neural Networks (CNN) with DenseNet through data fusion and mobile edge computing for achieving its objectives. The primary goal is to obtain a high level of accuracy in discriminating between Normal, Bengin, and different forms of Malignant lung tissues. Diagnostic technology has treatment planning and early detection goals which this project aims to enhance through better diagnostic methods. | While the model performs well in controlled tests, there may be challenges when generalising to different real-world data, particularly if the training data does not adequately capture all differences in lung cancer cases. | ||
| Lulu Gai et al.
|
Convolutional Neural Network (CNN) with DenseNet to improve the ability to extract features and learn for the purpose of classifying lung cancer. |
|
While the model performs well in controlled tests, there may be challenges when generalising to different real-world data, particularly if the training data does not adequately capture all differences in lung cancer cases. | ||
| Syeda Reeha et al.
|
Ensemble Models: This study combines various models to identify and classify lung cancer. BEiT: A Vision Transformer model utilised for its robust feature extraction capabilities. DenseNet is a type of deep convolutional neural network that is recognised for its effective gradient flow and exceptional accuracy. Sequential CNN: A convolutional neural network model designed with a sequential architecture. | The objective of the project is to improve the precision of identifying and categorising lung cancer by combining many advanced machine learning models using diverse ensemble methods. The project aims to enhance the overall performance of lung cancer diagnosis by using the capabilities of models such as BEiT, DenseNet, and Sequential CNN. | Ensemble approaches might pose challenges in deciphering the specific contributions of each individual model. The absence of transparency can impede comprehension regarding the rationale behind specific predictions. | ||
| R. Raza et al.
|
Lung-EffNet, a new transfer learning-based model presented in the paper, uses the EfficientNet architecture. | The goal of the work is to build and assess a very accurate and effective lung cancer classification model leveraging EfficientNet architecture and transfer learning based on it. The objective is to provide a strong, automated method for lung cancer diagnosis that can achieve high accuracy and efficiency, thereby addressing the limits of manual CT scan analysis and fit for major clinical deployment. | Dependency on data augmentation methods to address class imbalance may cause distortions or artefacts that can compromise the generalising capability of the model. | ||
| Nandita Gautam et al.
|
The ensemble technique uses CNN models. ResNet-152 is a deep residual network well-known for handling quite deep structures. DenseNet-169: Designed to enhance feature propagation via dense connections, this dense convolutional network. EfficientNet-B7: Maximising model size and accuracy, this extremely fast CNN | Investigate and use ensemble model, that is, combinations of several distinct models, to generate forecasts, therefore utilising their combined strengths to raise performance. | Training and evaluating an ensemble of deep learning models calls for significant computational resources, including memory and processing capability, which might not be readily available in every clinical environment. | ||
| Dritsas and Trigka et al.
|
Dataset underwent class balancing and feature ranking. Various machine learning models and metrics assessed performance, ensuring robust analysis. | Study expanded using deep learning methods like LSTM and CNN. Robust evaluation of classification models incorporated a bootstrapping process for validation. | The model’s predictive accuracy may be influenced by factors not included in the dataset, affecting comprehensive risk assessment. | ||
| Tsou et al.
|
For improved analysis, the powerful eXtreme Gradient Boosting (XGBoost) method was used in conjunction with Selected Ion Flow Tube Mass Spectrometry. | Investigate breath VOCs for lung cancer prediction, developing a precise classification model through machine learning for robust predictive capabilities. | Conducted a single-center case-control study, acknowledging age mismatches and addressing biases inherent in case-control study designs for comprehensive analysis. |
Table 1. Aim and drawback of the previous research.
Proposed methodology
EfficientNetB0
EfficientNetB0
Convolutional operation in MBConv block
The convolutional operation is the core of EfficientNetB0, especially within the MBConv blocks are shown in Eq. (1)
Where:
Depthwise Convolution in MBConv block
In the MBConv block, depthwise convolution is applied to each input channel separately, reducing the computational cost is shown in Eq. (2)
Where:
Squeeze-and-excitation (SE) block
The SE block models channel-wise dependencies using two main operations: Squeeze and Excite shown in Eqs. (3) and (4).
Squeeze Operation:
Where:
H and W are the height and width of the feature map.
Excite Operation:
H and W are the height and width of the feature map.
Excite Operation:
Where:
Recalibration:
Recalibration:
Where,
Global average pooling
The feature map’s spatial dimensions are minimized to one value per channel through the use of global average pooling is shown in Eq. (6)
Where:
H and W are the height and width of the feature map.
H and W are the height and width of the feature map.
Compound scaling method
EfficientNet uses a compound scaling method to scale the depth d , width w , and input resolution r of the network is shown in Eq. (7)
Where:
These equations provide a mathematical framework for understanding how the EfficientNetB0 architecture processes and transforms input data, emphasizing both feature extraction and efficiency through its innovative design.
These equations provide a mathematical framework for understanding how the EfficientNetB0 architecture processes and transforms input data, emphasizing both feature extraction and efficiency through its innovative design.
Avoid memorization over fitting using CNN with the DA algorithm
Deep learning, mainly through Convolutional Neural Networks, has exhibited transformative potential in diverse applications, ranging from natural language processing to medical imaging. However, as with any powerful tool, challenges persist. A primary concern that has emerged in deep learning applications is overfitting, in the realm of machine learning, overfitting emerges when models excel on training data but stumble when confronted with unfamiliar instances. “Memory overfitting,” a particular manifestation, occurs when a model memorizes training instances rather than discerning underlying data patterns. This phenomenon, especially perilous in domains like medical diagnostics, poses significant risks due to the minimal margin for error.
Addressing this research gap is not merely refining existing models but calls for innovative strategies that fundamentally alter the training dynamics. One promising avenue is the integration of CNNs with Differential Augmentation. Differential Augmentation (DA) applies transformations such as random hue adjustments
This research explores the synergies of combining CNN with DA, aiming to mitigate memory overfitting. Through this integrative approach, the aspiration is to develop models that are not only accurate but also robust and generalizable, ensuring their reliability in real-world diagnostic scenarios.
Building on the foundational understanding of memory overfitting and its implications, the next logical step is developing and refining a novel algorithm that seamlessly integrates CNNs with Differential Augmentation. Recognizing the individual strengths of both CNNs and DA provides a unique vantage point
The development of a new CNN with DA algorithm requires a multi-faceted approach. Initially, the architecture of the CNN must be tailored to be receptive to dynamic augmentations. This means layers and nodes must be optimized not just for feature extraction, but also for variability tolerance. The algorithm should be designed to be adaptive, learning not just from the features of the training data but also from the variations introduced by DA.
Furthermore, the DA component
Developing a new CNN with a DA algorithm represents an exciting frontier in deep learning research. By addressing the persistent challenge of memory overfitting head-on, this endeavour promises to set new benchmarks in accuracy, reliability, and generalizability in deep learning models.
To develop a new CNN with a Differential Augmentation (DA) algorithm to mitigate memory overfitting, it’s important to understand the mathematical foundation behind both CNNs and DA.
Convolutional layer operations
The Convolutional Neural Network (CNN) is primarily based on the convolution operation, which extracts features from the input data is shawn in Eq. (8)
Convolution Operation:
Fig. 1. Flow diagram for CNN with DA .
Where:
X is the input feature map.
W is the convolution kernel (filter) of size MXN.
X is the input feature map.
W is the convolution kernel (filter) of size MXN.
Activation function
An activation function is used to add non-linearity after convolution. Commonly used functions are ReLU is shown in Eq. (9).
ReLU Activation Function:
Pooling operation
Pooling layers reduce the dimensionality of the feature maps, typically using max pooling is shown in Eq. (10).
Max Pooling:
Max Pooling:
Where:
s is the size of the pooling filter.
s is the size of the pooling filter.
Fully connected layer
One or more fully connected layers receive the flattened output from the convolutional and pooling layers is shown in Eq. (11).
Fully Connected Layer Operation:
Where:
W is the weight matrix.
x is the input vector.
b is the bias.
W is the weight matrix.
x is the input vector.
b is the bias.
Softmax function
For classification tasks, the output layer often uses a softmax function to convert logits into probabilities is shown in Eq. (12).
Softmax Function:
Where:
K is the number of classes.
K is the number of classes.
Loss function
For classification tasks, the cross-entropy loss is typically used is shown in Eq. (13).
Cross-Entropy Loss:
Cross-Entropy Loss:
Where:
Differential augmentation (DA)
The Differential Augmentation (DA) technique is designed to improve the model’s ability to generalize by introducing diverse transformations, such as hue, brightness, saturation, and contrast adjustments. This simulates real-world variations in imaging conditions, which are common in clinical environments.
Augmentation Function can be employed is shown in Eq. (14)
Where:
X is the original input data.
X is the original input data.
Regularization terms
To combat overfitting, regularization techniques like L2 regularization can be employed is shown in Eq. (15).
L2 Regularization:
L2 Regularization:
Where:
Feedback mechanism for DA-CNN integration
To ensure a feedback loop between CNN performance and DA strategie:
Performance Feedback Adjustment can be shown in Eq. (16):
Performance Feedback Adjustment can be shown in Eq. (16):
Where:
By integrating these mathematical components, a CNN-DA algorithm can be developed that dynamically adapts to data variations, reducing memory overfitting and enhancing model robustness.
By integrating these mathematical components, a CNN-DA algorithm can be developed that dynamically adapts to data variations, reducing memory overfitting and enhancing model robustness.
Data collection and loading
Efficient data collection and loading are crucial components in any machine learning endeavour. This involves gathering relevant datasets from diverse sources, ensuring data integrity, and employing effective loading mechanisms. Advanced methods include real-time streaming integration and automated preprocessing to maintain data quality and facilitate seamless integration into machine learning pipelines, optimizing model performance.
Data preprocessing
Data preprocessing involves vital steps such as normalization and label encoding. Images were resized to
| Step | Description |
| Resizing | Resized all images to
|
| Normalization | Scaled pixel values to the range
|
| Label encoding | Converted categorical labels to one-hot vectors |
Table 2. Summarizes the preprocessing steps applied in this study for enhanced reproducibility.
Normalization
Normalization is a pivotal data preprocessing technique that standardizes numerical features, ensuring a consistent scale across variables. By rescaling data to a common range, often between 0 and 1 , normalization mitigates the influence of disparate magnitudes, promoting fair comparisons and optimal model convergence in machine learning applications.
Encode label
Label encoding is a crucial step in data preprocessing, particularly for categorical variables in machine learning. It involves assigning numerical values to categorical labels, enabling algorithms to interpret and process them effectively. This transformation enhances model performance by converting non-numeric information into a format suitable for mathematical computations and analysis.
CNN- model architecture
Convolutional layer
In deep learning, and more especially in convolutional neural networks, the convolutional layer is the primary layer. This layer makes use of filters or kernels, to slide over the input data and extract repeated local features, while at the same time maintaining spatial connection. Every filter analyzes certain structures within the picture, which improves the overall possibility to detect more complex patterns in the network. By capturing hierarchical features, convolutional layers are effective in image processing, enabling the model to identify edges, textures, and higher-level representations. Strides and padding control spatial dimensions, influencing the layer’s receptive field. Convolutional layers contribute significantly to the success of tasks like image recognition, object detection, and semantic segmentation in various machine learning applications.
Max pooling layer
Essential in CNNs, the max-pooling layer crucially down samples and extracts features by partitioning input into non-overlapping regions, selecting the maximum value from each feature map. This process retains essential information while reducing spatial dimensions, aiding computational efficiency and mitigating overfitting. By improving translation invariance, max-pooling strengthens the network’s resistance to changes in spatial orientation. While down sampling, it preserves dominant features, contributing to hierarchical feature learning. Max-pooling layers are instrumental in creating spatial hierarchies, improving the network’s capacity to recognize and generalize complex patterns in diverse data, particularly in image-related tasks.
Flatten layer
The flatten layer is an essential part of many neural networks and comes after the convolution and the pooling layers. Its main role is to change the input data to a single array or combine information as a way for fully connected layers. This flattening process is pivotal in transitioning from spatial hierarchies to a format suitable for traditional neural network architectures. By converting multidimensional data into a linear structure, the flatten layer facilitates comprehensive feature learning and abstraction. It plays a crucial role in tasks like image classification, enabling the neural network to extract and process intricate patterns for accurate predictions and decision-making.
Dense layer
Integral to neural networks, the dense layer, often termed fully connected, stands as a foundational building block in their architecture. Neurons in this layer are interconnected, forming a dense matrix that allows each neuron to connect to every neuron in the preceding and succeeding layers. This extensive connectivity enables comprehensive feature learning and abstraction. These typically are very important when there are complex patterns that need to be learned within the data that is being fed to model Dense layers are very important especially in tasks like image classification as well image generation and natural language processing. In dense layers the weights and the bias are trained to improve the efficiency of making accurate prediction based on most developed patterns.
Activation layer
The activation layer is pivotal in neural networks for introducing non-linearity, enhancing model complexity and expressive power. It follows each neuron’s output in a neural network layer, applying an activation function like ReLU, Sigmoid, or Tanh. This non-linear transformation introduces dynamic behaviour shows in Fig. 2, Enabling the network to grasp intricate patterns and relationships inherent in the data, facilitating more nuanced and accurate learning processes. Activation layers enable the model to capture complex features and perform sophisticated tasks such as image recognition or natural language understanding, ensuring the network’s capacity for more nuanced and powerful representations.
Fig. 2. CNN model Architecture.
Differentiation augmentation
Differentiation Augmentation (DA) includes, hue, saturation, brightness, contrast which when incorporated into the data helps in enhancing model performance by creating diverse and realistic variations in training data. Changing the hue means moving colors up or down the spectrum, changing lighting conditions as well as training the model under different color tone, though excessive shifts may distort important color-based features. Saturation adjustment takes color to the next level by increasing or reducing the model’s ability to distinguish between colors in bright or less bright situations, but overdoing it may produce unrealistic results. Contrast changes mimic different levels of exposure, which benefits the model’s training in features with ensuring adaptability to high or low-contrast environments; yet, having too extreme corrections such as very bright or very dark diminishes training efficacy. This influence strongly helps improve the identification of features within low brightness conditions and stabilize the device’s performance in both high and low contrast settings but can cause important fine details to be obscured by the change in contrast. In aggregate, these methods enrich training data, provide a more general view of data distributions, and reduce over-fitting and thus improve all learnable tasks in the case of careful application of augmentations to preserve the realism of the data.
Adjust Hue
In image processing
Adjust saturation
Saturation adjustment is a key image processing operation that involves altering the intensity of colors. By manipulating the saturation levels, one can enhance or desaturate the colors in an image. This adjustment is valuable for fine-tuning the visual impact of images, contributing to artistic modifications and color correction processes.
Adjust brightness
Image processing operations require brightness adjustment to alter the entire luminance level throughout an image. One can improve visibility while resolving exposure issues or create artistic effects through modifications of image brightness levels. The operation functions inherently to enhance the visual quality alongside image clarity across different application platforms.
Adjust contrast
Contrast adjustment is a vital image processing operation that involves modifying the difference in brightness between the light and dark areas of an image. By enhancing or reducing contrast, one can bring out details, improve visibility, or achieve artistic effects. This adjustment contributes to optimizing image quality and visual impact.
Algorithm: CNN with Differential Augmentation (DA) for Lung Cancer Detection Data Collection and Loading.
Select dataset folder D containing labelled images.
Data Preprocessing.
For each image Ii in D:
Data Preprocessing.
For each image Ii in D:
- Normalize: Ii norm
. - Encode label:
where li is the label of Ii .
Split D into training set T and validation set V with a ratio (e.g., 80:20).
Model Architecture.
Construct a CNN model M with layers:
- Convolution (
) where f is the number of filters and k is the kernel size. - Max-pooling:
where k is the pooling size. - Flatten: F() .
- Dense:
, where n is the number of neurons. - Activation: Use ReLU for hidden layers and Softmax for output.
Loss function
Differentiable Augmentation.
For the image I:
- Adjust hue:
Hue(I, h) where is a random hue factor. - Adjust saturation:
Saturation(I, smin, smax) where smin and smax are random saturation factors. - Adjust brightness:
where b is a random brightness factor. - Adjust contrast:
Contrast(I, cmin, cmax) where cmin and cmax are random contrast factors.
Training.
- Train M using T with DA applied. For each epoch:
- For each batch B in T.
- Apply DA to B to get B’.
- Update M using
to minimize L .
Evaluation.
Evaluate M using V to compute accuracy and loss.
Definitions
- D: Entire dataset.
- Ii: Image at index i.
- li: Label of image Ii.
- T: Training dataset.
- V: Validation dataset.
- M: CNN model.
- L: Loss function.
-
: Predicted label by model. - y: True label.
Training
Differential Augmentation is a technique that applies varied transformations to individual instances within image batches during training. The primary reasons for its adoption are:
Diversity in Training Data: DA introduces variations in training samples, thereby enriching the dataset. This ensures that models are exposed to various data perspectives, improving generalization.
Where
Differential Augmentation applied the following transformations: hue adjustments within
Differential Augmentation applied the following transformations: hue adjustments within
Mitigation of Overfitting: By introducing randomness and variability in the training process, DA minimizes the risk of models memorizing exact training data, a phenomenon known as memory overfitting.
Effective Utilization of Limited Data: Especially in domains like medical imaging, where data can be scarce, DA artificially expands the dataset, providing more training samples without collecting new data.
DA’s impact on computational time
While DA introduces variability in the training data, it also adds a computational overhead due to the augmentation process. However, this overhead is often offset by the reduction in training epochs required to achieve convergence, thanks to the more prosperous and more diverse dataset.
Let’s consider the computational time without and with DA:
- Without DA: no-DA
epoch Tno – DA Tepoch. - With DA: DATDA
Tepoch + Taug .
Where E is the number of epochs, epoch Tepoch is the time taken per epoch,
In many scenarios, DA<no-DATDA< Tno – DA, making DA computationally efficient in the long run.
Neural network functioning with DA
When neural networks, particularly CNNs, are trained with DA, they learn to recognize features invariant to the augmentations applied. This means they become adept at identifying pertinent features regardless of changes in hue, brightness, contrast, or other boosts introduced by DA.
Mathematically, if a feature extractor in a neural network is denoted by F , then:
This equation signifies that the essential features extracted from the original and augmented images should be comparable.
Evaluating neural networks with DA
Evaluating the performance of neural networks trained with DA usually involves testing the model on nonaugmented data (or sometimes mildly augmented data) to ensure real-world applicability. Performance metrics such as accuracy, precision, recall, and F1-score collectively offer a holistic assessment of the model’s effectiveness and capabilities.
Accuracy
In essence, DA acts as a regularized, enhancing neural networks’ robustness and generalization capabilities, making them more suitable for diverse real-world applications.
In essence, DA acts as a regularized, enhancing neural networks’ robustness and generalization capabilities, making them more suitable for diverse real-world applications.
The lung cancer detection system, designed to revolutionize the diagnostic process, prominently features an integrated Convolutional Neural Network (CNN) augmented with Differential Augmentation. When a new set of lung scans enters the system, they undergo a series of pre-processing steps. These steps ensure image normalization for consistent intensity values, resizing to a uniform dimension fit for the CNN, and encoding labels into numerical values for supervised training. Once pre-processed, the data is directed into the system’s heart: the CNN with DA model. This model’s sophisticated architecture comprises convolutional layers designed for hierarchical feature extraction, pooling layers for dimensionality reduction while retaining pivotal information, and dense layers fine-tuned for classification.
DA’s role, crucial in the training phase, is to apply random yet meaningful transformations to images in each training epoch. This dynamic augmentation guarantees that the CNN consistently encounters varied representations of data, preventing over-reliance on specific training samples and promoting genuine feature recognition. Following intensive training, the model undergoes meticulous evaluation with an independent test dataset. Key metrics, including sensitivity, specificity, accuracy and F1-score, assess its diagnostic efficacy.
Once its efficiency and reliability are ascertained, the model is integrated into the system’s operational environment. Here, healthcare professionals interact with a user-centric interface, uploading lung scans, initiating diagnostic assessments, and receiving predictions complemented by confidence scores. The system is designed for continuous learning to maintain the model’s relevance and adaptability. As new medical findings emerge and additional data becomes available, the model undergoes periodic retraining, ensuring its alignment with the latest lung cancer diagnostics. By melding the powers of CNN and DA, this system stands as a beacon of hope for timely, accurate, and efficient lung cancer detection, aiming for better patient outcomes and streamlined healthcare processes.
XAI using LIME approach
This research introduces a new method designed to boost lung cancer image classification reliability through the application of Explainable AI (XAI) technologies. The analysis uses Image LIME
LIME (Local Interpretable Model-agnostic Explanations)
In the second stage of our methodology, LIME is employed to visualize and interpret the model’s decisionmaking process at a local level. This is done by highlighting the key regions or features within an image that significantly contribute to the model’s predictions. Our experiment applied LIME technology to analyze the priority features revealed by the model in interpreting a specific test image Subsequently, we used LIMEgenerated feature heatmaps to mask the images, revealing only the most critical
A thorough comparison of models occurs in the final study stage which incorporates both successful predictions from the initial phase and effective LIME-based feature extraction from the second phase. The evaluation methodology for model feature relevance in lung cancer images uses the Intersection over Union (IoU) similarity metric. Users access LIME visualizations to uncover which distinct features each model depends on when making its prediction outcomes. The analysis of extractive efficiency monitors how well model-determined features match with genuine image features present in the data. The IoU score is used as a quantitative measure to compare the binary masked image generated by the model with the ground truth image, enabling the evaluation of the degree of overlap between the selected features. This evaluation method measures how well the model selects appropriate features which lead to correct lung cancer detection.
The IoU metric assesses two set similarities by dividing the ground truth image (GT) intersection area with the masked binary image (MB) area compared to their aggregated regions. The quantitative scale for measuring feature overlap ranges from 0 to 1 through this metric. The measurement scale of the IoU metric exists between 0 for no similarity and 1 for perfect overlap. The formula for calculating the IoU value consists of these terms can be shown in Eq. (17):
Both
Result and discussion
This paper delves into designing and implementing a state-of-the-art lung cancer prediction system using Python and the powerful deep learning frameworks TensorFlow and Keras. TensorFlow, an open-source machine learning library, is renowned for its flexibility and scalability, making it apt for handling complex tasks such as medical image analysis. Keras, a high-level neural networks API, provides an intuitive interface for building and training deep learning models, streamlining the process without compromising capability. This research aims to create a robust lung cancer prediction system by intertwining these technologies. The goal of combining Convolutional Neural Networks and innovative data augmentation techniques is to achieve unparalleled accuracy in detecting and classifying lung cancer from medical images This paper will shed light on the development journey, from data preprocessing and model architecture design to training, evaluation, and deployment. Additionally, it will underscore the significance of integrating AI into healthcare, elucidating how Python, TensorFlow, and Kera stand as the pillars supporting this transformative endeavour.
Dataset
For this study, the lung cancer dataset from the Iraq-Oncology Teaching Hospital/National Center for Cancer Diseases (IQ-OTH/NCCD), publicly available on Kaggle
The dataset comprises 1,097 CT images are organized into three distinct groups which bengin, malignant, and normal groups of lung cancer diseases. The bengin class contains 120 images but the malignant class possesses 561 images together with 416 images in the normal class. Lung tumors are divided into bengin non-cancerous and malignant cancerous types with additional differentiation between tumour and mass forming tumours. The data set went through training operations for
The discussion surrounding dataset limitations, particularly the relatively small size of the IQ-OTH/NCCD dataset and potential biases in class distribution, is crucial for understanding the implications of the results obtained from the CNN + DA model. The IQ-OTH/NCCD dataset, while providing high-quality CT scans from a diverse cohort of lung cancer patients, consists of only 1,097 images. This limited sample size may restrict the model’s ability to capture the full spectrum of tumor variations and complexities present in a broader population. Consequently, the model’s performance may be influenced by the specific characteristics of the training data, potentially leading to overfitting on the limited examples it has encountered.
Moreover, the class distribution within the dataset presents another layer of complexity. The dataset includes 561 images of malignant tumors, 120 images of bengin tumors, and 416 images of normal lungs, resulting in an imbalanced representation of classes. Such imbalances can skew the model’s learning process, as it may become biased towards the more prevalent class (malignant tumors) while underrepresenting the nuances of less frequent classes (bengin tumors and normal lungs). This bias can lead to a higher rate of false negatives for bengin cases, which is particularly concerning in clinical settings where accurate differentiation between bengin and malignant conditions is critical for patient management.
To mitigate these Challenges, Further study should consider augmenting the dataset with additional images from diverse sources to enhance its size and balance. Synthetic data generation methods together with transfer learning among bigger diverse sources would improve both robustness and generalization performance of the model. Furthermore, conducting thorough analyses of class-specific performance metrics will provide deeper insights into how well the model performs across different categories, allowing scientists better diagnostic capability understanding. Researchers should implement methods to remedy data set limitations which will make their findings applicable for clinical scenarios and enhance the reliability of the CNN+DA model for lung cancer diagnosis.
This work used the LC25000 dataset
Lung adenocarcinoma is a type of lung cancer that involves glandular cells and occurs in the lungs and alveoli, making up more than
Worked with the dataset that shares many features with the “A Large-Scale CT and PET/CT Dataset for Lung Cancer Diagnosis (Lung-PET-CT-Dx)” from The Cancer Imaging Archive (TCIA). TCIA is an open-access project developed to facilitate cancer research through sharing open-access cancer imaging data for researchers
The NLST
The low-dose CT arm screened 26,732 participants, and lung cancer was validated in 1,083 patients (
Table 3 provides a comparison of datasets, outlining their strengths and limitations. It highlights key features and suitability for specific applications, offering insights into their optimal use in various scenarios.
Figure 3 illustrates a sample image alongside its augmented version using DA techniques. This comparison highlights the transformations applied to enhance data diversity and model robustness.
Figure 4 shows the training and validation loss curves after training the model with lung cancer images. It highlights the loss reduction over epochs, indicating improved performance and generalization.
Train and Evaluate model CNN with DA.
Evaluation of the CNN with differential augmentation (DA) algorithm
The presented graph comprehensively evaluates the CNN model augmented with Differential Augmentation (DA) across multiple training epochs. The graph juxtaposes the training and validation performance, giving insights into the model’s learning dynamics and ability to generalize.
Training vs. Validation Curves: The graph showcases two sets of curves one representing the model’s performance on the training data and the other on the validation data. This distinction allows us to gauge the model’s progression in terms of learning and its capacity to perform on unseen data.
Accuracy Trends: A noticeable observation is the trajectory of the accuracy curves for both training and validation datasets. As the epochs progress, the accuracy tends to increase, indicating the model’s improving
| Dataset | Strengths | Limitations | |||||||
| IQ-OTH/NCCD (Selected Dataset) |
|
|
|||||||
| LC25000 (Histopathological Dataset) |
|
|
|||||||
| Lung-PET-CT-Dx (Large-Scale CT/PET) |
|
|
|||||||
| NLST (National Lung Screening Trial) |
|
|
Table 3. Comparison of datasets: strengths and limitations.
Fig. 3. Sample Image and the image with DA .
Fig. 4. After the model train with lung cancer images graph shows train loss validation loss.
capability to classify lung cancer images correctly. Any significant divergence between these curves might hint at overfitting or underfitting, crucial aspects to monitor in model evaluation.
Loss Trends: Complementing the accuracy, the loss curves depict how the model’s predictions deviate from the actual labels across epochs. A declining trend in the loss signifies that the model is refining its predictions, aligning them closely with the true tags. The proximity of the training and validation loss curves is an indicator of the model’s consistent performance across both datasets.
Role of DA: Integrating Differential Augmentation (DA) likely contributes to the observed trends. By continuously introducing varied representations of the training images, DA ensures the model does not overrely on specific patterns, leading to enhanced generalization. This is evident from the synchronized progression of training and validation curves, indicating a reduced propensity for overfitting.
Concluding Remarks: The graph is a testament to the efficacy of integrating DA with CNN for lung cancer image classification. The consistent trends across epochs and the close alignment of training and validation metrics indicate a well-trained, robust model poised for real-world applications.
The CNN + DA model’s high accuracy, sensitivity, and specificity suggest strong potential for clinical applications. However, its utility in real-world settings requires further validation using diverse datasets and testing in clinical workflows. Additionally, robustness against imaging artifacts and varying scanner types must be ensured.
To predict diseases accurately based on the input shown in Fig. 5, the model likely analyzes patterns in data using machine learning techniques. It processes various features to identify potential disease outcomes, enhancing diagnosis precision.
Lung cancer prediction using CNN with DA model
Model Forward Pass: The pre-processed image is passed through the CNN. As it traverses through the convolutional layers, essential features indicative of lung conditions are extracted. These hierarchical features, ranging from basic edges to complex patterns, are then processed by the subsequent layers.
Fig. 5. Once the input the predict the accurately model diseases.
| Function name | Value |
| Learning rate | 0.001 |
| Batch size | 32 |
| Dropout rate | 0.3 |
Table 4. Training parameters.
Prediction Generation: The final layers of the CNN, typically dense or fully connected layers, take the extracted features and generate a prediction. This could be in-class probabilities, especially if the task is to categorize the lung condition. The class with the highest chance becomes the model’s prediction for the input image.
Post-processing: Post-processing might be applied once the raw prediction is obtained. This could involve converting numerical labels to their categorical counterparts (e.g., ‘Adenocarcinoma’, ‘Normal’) or applying a threshold to determine the final diagnosis.
Output Display: The prediction and any associated confidence scores or probabilities are then presented to the user. In a healthcare setting, this information assists medical professionals in making informed decisions about the patient’s condition and subsequent treatment.
Hyperparameter tuning using random search
Hyperparameter Tuning using Random Search
The initial training parameters for the models were set as follows: a learning rate of 0.001 , a batch size of 32, and a dropout rate of 0.3 . After applying Random Search for hyperparameter tuning, these values were optimized to improve the performance of each model. The learning rate was fine-tuned to values between 0.0001 and 0.0005 , with lower learning rates proving more effective for ResNet and EfficientNetB0. The batch size was adjusted to 32 for CNN with DA and ResNet, while DenseNet and EfficientNetB0 achieved optimal results with the original batch size of 32 . Similarly, the dropout rate was optimized to 0.2 for the Hybrid CNN model, while ResNet required a slightly higher rate of 0.4 to prevent overfitting, and DenseNet and EfficientNetB0 retained a balanced dropout of 0.3 . These tuned parameters significantly enhanced the accuracy and F1-score for each model.
Table 4 outlines the training parameters used for the model. It provides details such as learning rate, batch size, and Dropout rate, essential for reproducing the training process.
Compare the performance metrics CNN with DA (Hybrid novel Model), DenseNet, ResNet and EfficientNetB0 Algorithm
The results across different datasets demonstrate that the CNN + DA (Novel) model consistently outperforms other models, particularly when evaluated on the primary IQ-OTH/NCCD dataset (Table 5). This dataset highlights the strength of CNN + DA, achieving the highest metrics in Precision (
| Performance metrics | CNN + DA(Novel) | DenseNet | ResNet | EfficientNetB0 |
| Precision | 97.57 | 93.80 | 92.50 | 91.87 |
| Recall | 97.67 | 94.00 | 93.10 | 91.78 |
| f1-score | 98.78 | 94.20 | 92.70 | 91.21 |
| Accuracy | 98.78 | 94.10 | 93.00 | 92.64 |
| Roc | 97.23 | 93.90 | 92.40 | 91.24 |
| Error rate (%) | 1.22 | 5.90 | 7.00 | 7.36 |
Table 5. Comparison models with performance metrics with supporting statistical measures using IQ-OTH/ NCCD dataset.
| Group 1 | Group 2 | Mean Diff |
|
Lower | Upper | Reject |
| CNN + DA | DenseNet | -4.61 | 0.0000 | -5.24 | -3.98 | True |
| CNN + DA | EfficientNetB0 | -5.97 | 0.0000 | -6.60 | -5.34 | True |
| CNN + DA | ResNet | -5.58 | 0.0000 | -6.21 | -4.95 | True |
| DenseNet | EfficientNetB0 | -1.36 | 0.0000 | -1.99 | -0.73 | True |
| DenseNet | ResNet | -0.97 | 0.0006 | -1.59 | -0.34 | True |
| EfficientNetB0 | ResNet | 0.39 | 0.3655 | -0.23 | 1.02 | False |
Table 6. Tukey’s HSD Post-Hoc test for model accuracy comparisons using IQ-OTH/NCCD dataset.
| Dataset | CNN + DA | DenseNet | ResNet | EfficientNetB0 |
| Precision | 93.02 | 92.03 | 91.42 | 90.01 |
| Recall | 94.16 | 93.12 | 92.15 | 90.26 |
| f1score | 94.01 | 93.16 | 91.22 | 90.26 |
| Accuracy | 95.02 | 93.22 | 91.99 | 91.14 |
| Roc | 93.69 | 91.26 | 91.32 | 90.20 |
| Error rate (%) | 4.98 | 6.78 | 8.01 | 8.86 |
Table 7. Comparison models with performance metrics with supporting statistical measures using LC25000.
other models like DenseNet, ResNet, and EfficientNetB0, CNN + DA demonstrates clear dominance, particularly in this primary dataset.
To evaluate the accuracy of four models are CNN + DA (Novel), DenseNet, ResNet, and EfficientNetB0, a post-hoc analysis was conducted using Tukey’s HSD test shown in Table 6. The analysis revealed significant differences in accuracy between most models. The CNN + DA model demonstrated statistically significant superiority over all other models, with mean accuracy differences of
When tested on the LC25000 dataset (Table 7), CNN + DA also delivers commendable results, achieving the highest Precision (
| Group 1 | Group 2 | Mean Difference (meandiff) |
|
Lower CI Bound | Upper CI Bound | Reject Null Hypothesis |
| CNN + DA | DenseNet | 1.80 | 0.02 | 0.56 | 3.04 | Yes |
| CNN + DA | EfficientNetB0 | 3.03 | 0.005 | 1.44 | 4.61 | Yes |
| CNN + DA | ResNet | 3.88 | 0.001 | 2.07 | 5.69 | Yes |
| DenseNet | EfficientNetB0 | 1.22 | 0.14 | -0.19 | 2.63 | No |
| DenseNet | ResNet | 2.08 | 0.03 | 0.15 | 4.00 | Yes |
| EfficientNetB0 | ResNet | 0.87 | 0.22 | – 0.46 | 2.20 | No |
Table 8. Tukey’s HSD Post-Hoc test for model accuracy comparisons using LC25000 Datset.
| Dataset | CNN + DA | DenseNet | ResNet | EfficientNetB0 |
| Precision | 97.57 | 93.80 | 92.50 | 91.87 |
| Recall | 97.67 | 94.00 | 93.10 | 91.78 |
| f1score | 98.78 | 94.20 | 92.70 | 91.21 |
| Accuracy | 98.78 | 94.10 | 93.00 | 92.64 |
| Roc | 97.23 | 93.90 | 92.40 | 91.24 |
| Error rate (%) | 1.22 | 5.90 | 7.00 | 7.36 |
Table 9. Comparison models with performance metrics with supporting statistical measures using A LargeScale CT and PET/CT.
| Group 1 | Group 2 | Mean difference (meandiff) |
|
Lower CI bound | Upper CI bound | Reject null hypothesis |
| CNN + DA | DenseNet | 4.68 | 0.001 | 3.90 | 5.47 | Yes |
| CNN + DA | ResNet | 5.78 | 0.0005 | 4.98 | 6.58 | Yes |
| CNN + DA | EfficientNetB0 | 6.14 | 0.0002 | 5.33 | 6.95 | Yes |
| DenseNet | ResNet | 1.10 | 0.14 | -0.12 | 2.32 | No |
| DenseNet | EfficientNetB0 | 1.46 | 0.09 | -0.01 | 2.93 | No |
| ResNet | EfficientNetB0 | 0.36 | 0.42 | -1.12 | 1.84 | No |
Table 10. Tukey’s HSD post-hoc test for model accuracy comparisons using a large-scale CT and PET/CT dataset.
more similar. These results highlight CNN + DA’s superior ability to generalize across the dataset, likely due to the combination of powerful CNN architecture and data augmentation, which enhances learning and robustness.
Similarly, the CNN + DA model excels on the Large-Scale CT and PET/CT dataset (Table 9), achieving the highest scores across all metrics, including F1-Score (
The Tukey’s HSD post-hoc test for model accuracy comparisons on the Large-Scale CT and PET/CT dataset (Table 10) reveals that CNN + DA significantly outperforms DenseNet, ResNet, and EfficientNetB0, with mean accuracy differences of
On the National Lung Screening Trial (NLST) dataset (Table 11), the performance of CNN + DA remains strong, with the highest Precision (
The results from the Tukey’s HSD post-hoc test and performance metrics on the National Lung Screening Trial (NLST) dataset reveal that CNN + DA outperforms DenseNet and ResNet significantly, with mean accuracy differences of 2.24 and 3.27 , respectively, both with p -values below 0.05 , confirming the null hypothesis is rejected shown in Table 12. However, no significant difference in accuracy was found between CNN + DA and EfficientNetB0 (mean difference of
| Dataset | CNN + DA | DenseNet | ResNet | EfficientNetB0 |
| Precision | 94.23 | 94.12 | 92.56 | 90.20 |
| Recall | 95.22 | 94.12 | 92.06 | 90.22 |
| f1score | 96.56 | 94.12 | 94.63 | 90.22 |
| Accuracy | 96.36 | 94.12 | 93.09 | 96.23 |
| Roc | 97.02 | 93.56 | 93.45 | 94.23 |
| Error rate (%) | 3.64 | 5.88 | 6.91 | 3.77 |
Table 11. Comparison models with performance metrics with supporting statistical measures using the National lung screening trial (NLST) dataset.
| Group 1 | Group 2 | Mean difference (meandiff) |
|
Lower CI bound | Upper CI bound | Reject null hypothesis |
| CNN + DA | DenseNet | 2.24 | 0.001 | 1.56 | 2.92 | Yes |
| CNN + DA | ResNet | 3.27 | 0.0002 | 2.49 | 4.05 | Yes |
|
|
EfficientNetB0 | 0.13 | 0.85 | -1.08 | 1.34 | No |
| DenseNet | ResNet | 1.02 | 0.18 | -0.16 | 2.19 | No |
| DenseNet | EfficientNetB0 | -2.11 | 0.01 | -3.25 | -0.97 | Yes |
| ResNet | EfficientNetB0 | -3.13 | 0.0003 | -4.34 | -1.91 | Yes |
Table 12. Tukey’s HSD post-hoc test for model accuracy comparisons using the National lung screening trial (NLST) dataset.
The IQ-OTH/NCCD dataset was selected for this research due to its unique strengths in providing highquality CT scans of lung cancer patients across bengin, malignant, and normal categories. This makes it wellsuited for developing models that generalize effectively across diverse patient populations. Unlike other datasets such as LC25000, which focuses on histopathological images, or Lung-PET-CT-Dx, which emphasizes lung cancer subtypes, the IQ-OTH/NCCD dataset offers a real-world representation of lung conditions. Its clear annotations and balanced class distribution further enhance its suitability for lung cancer diagnosis.
Despite its relatively small size of 1,097 images, the dataset compensates with high-quality imaging ( 1 mm CT slice thickness) and diverse demographic representation, allowing for detailed tumor detection and improved generalizability. Additionally, the superior performance of the CNN + DA model on this dataset underscores its appropriateness for evaluating lung cancer prediction models. These factors collectively establish IQ-OTH/ NCCD as the optimal choice for this research.
Table 5 compares the performance of various models, including CNN + DA (Novel), DenseNet, ResNet, and EfficientNetB0, using the IQ-OTH/NCCD dataset. The table highlights key performance metrics along with supporting statistical measures, showcasing the effectiveness of each model.
Figure 6 illustrates the comparative performance metrics of CNN + DA, DenseNet, ResNet, and EfficientNetB0. The results highlight the superiority of the proposed model across key evaluation metrics.
The Precision-Recall (PR) curves shown in Fig. 7. highlight the performance of different models (CNN + DA, DenseNet, ResNet, and EfficientNetB0) across various datasets (IQ-OTH/NCCD, LC25000, CT/PET-CT, and NLST). The CNN + DA model consistently demonstrates superior precision and recall, reflected in its curves being positioned closest to the top-right corner for all datasets. DenseNet, ResNet, and EfficientNetB0 exhibit progressively lower performance, with EfficientNetB0 typically yielding the lowest precision-recall values. These trends reinforce the robustness and generalizability of the CNN+DA model across diverse datasets.
The evaluation of the proposed CNN model with Data Augmentation (CNN+DA) is conducted through multiple analytical techniques, including correlation heatmaps, residual analysis, homoscedasticity assessment, and Q-Q plots. These evaluations provide deep insights into the model’s predictive performance, error distributions, and generalization capability.
The model’s performance was evaluated using various metrics, including precision, recall, F1-score, accuracy, and ROC. The correlation heatmap reveals a high degree of correlation (close to 1) between all performance metrics, indicating a consistent performance across different evaluation aspects shown in Fig. 8. This strong positive correlation suggests that the model is effectively capturing the underlying patterns in the data and exhibiting a balanced performance.
The histogram of residuals displays a near-normal distribution, suggesting that the model’s residuals are randomly distributed and do not exhibit any systematic patterns. This observation aligns with the assumption of normality for residual analysis, providing further evidence of model adequacy shown in Fig. 9.
The plot of residuals against fitted values, commonly used for homoscedasticity check, shows a scattered distribution of points without any discernible trend or pattern. This indicates that the variance of the residuals is consistent across different fitted values, supporting the assumption of homoscedasticity shown in Fig. 10.
Furthermore, the Q-Q plot of accuracy showcases a linear relationship between the ordered values and the theoretical quantiles, indicating that the distribution of the accuracy values is close to a normal distribution
Comparison of Model Performance Across Datasets
Fig. 6. Comparative performance metrics for
shown in Fig. 11. This finding suggests that the model’s performance is consistent and does not exhibit significant deviations from normality.
shown in Fig. 11. This finding suggests that the model’s performance is consistent and does not exhibit significant deviations from normality.
Overall, the analysis of these plots and metrics indicates that the model is performing well, exhibiting high performance scores, normally distributed residuals, and a consistent performance across different evaluation aspects. These results suggest that the model could successfully uncover the underlying patterns in the data and generate predictions that are accurate.
The proposed CNN with Differential Augmentation (CNN + DA) model demonstrates superior performance compared to established architectures such as DenseNet and EfficientNetB0, primarily due to its innovative approach to mitigating memory overfitting and enhancing robustness against data variability. Memory overfitting, a common challenge in deep learning, occurs when models memorize training data rather than generalizing from it. The CNN + DA model effectively addresses this issue by integrating Differential Augmentation (DA), which applies diverse transformations such as hue, brightness, saturation, and contrast adjustments during training. This exposure to a broader spectrum of data variations discourages memorization and promotes genuine learning, leading to improved generalization capabilities. Furthermore, the dynamic nature of DA allows the CNN + DA model to adapt to real-world variations in imaging conditions, enhancing its robustness and performance across diverse patient populations and imaging protocols. The architecture of the CNN+DA model is designed to leverage hierarchical feature extraction, enabling it to identify critical features indicative of lung cancer, regardless of the variations introduced by DA. Validation across multiple datasets, including the IQ-OTH/NCCD dataset, LC25000, and the Large-Scale CT and PET/CT dataset, underscores the model’s ability to generalize effectively, achieving an accuracy of
Precision-Recall Curves for All Models and Datasets
Fig. 7. Precision-recall curves comparing CNN + DA, DenseNet, ResNet and EfficientNetB0, showing better balance between precision and recall in the proposed model.
Fig. 8. Feature correlation heatmap for attribute dependency analysis.
Fig. 9. Residual histogram for model adequacy assessment.
Fig. 10. Residuals vs. fitted values plot for homoscedasticity check.
Fig. 11. Q-Q plot of accuracy for normality assessment.
| CNN models | Intersection over union (IoU) score | ||||
| 6 features | 8 features | 10 features | 12 features | Average IoU score | |
| DenseNet | 0.33 | 0.36 | 0.39 | 0.43 | 0.37 |
| ResNet | 0.29 | 0.31 | 0.35 | 0.39 | 0.33 |
| EfficientNetB0 | 0.31 | 0.37 | 0.41 | 0,43 | 0.38 |
| CNN + DA | 0.35 | 0.40 | 0.43 | 0.47 | 0.41 |
Table 13. IoU score of the selected pretrained models for Bengin case.
| CNN models | Intersection over union (IoU) score | ||||
| 6 features | 8 features | 10 features | 12 features | Average IoU score | |
| DenseNet | 0.28 | 0.32 | 0.35 | 0.38 | 0.33 |
| ResNet | 0.25 | 0.28 | 0.31 | 0.34 | 0.29 |
| EfficientNetB0 | 0.27 | 0.30 | 0.33 | 0.36 | 0.31 |
| CNN + DA | 0.33 | 0.37 | 0.40 | 0.44 | 0.38 |
Table 14. IoU score of the selected pretrained models for maligant case.
Error analysis on four datasets
Possible errors are also characterized by misclassifications in terms of error rate, which gives a clear understanding of the weak sides of the model. Others with relatively higher error rates in our experiments (e.g.,
Ethical and practical implications
The use of CNN with Differential Augmentation (DA) model for the detection of lung cancer comes with some certain unethical and practical issues. Data privacy and security is an important factor to consider since such data needs to be shared, encrypted etc. To reduce bias and unfairness to patients, bias from multiple sets of data is prevented; Mitigating bias through diverse datasets promotes fairness, while explainable AI enhances transparency for clinicians. Technical considerations are checking the actual performance of the proposed model in different real-world datasets and handling the differences in imaging to have general applications. eamless integration into clinical workflows with user-friendly interfaces is crucial for adoption. These steps acts as crucial so that the integrated CNN + DA model can be transformed into a reliable and accurate diagnosis tool which would assist in early diagnosis and better treatment, all the while, trying to prevent ethical and practical issues in its implementation.
Results for XAI using LIME
The evaluation of Convolutional Neural Network (CNN) models using the Intersection over Union (IoU) metric is presented in two contexts: bengin and malignant cases. Table 13 (for the bengin case) and Table 14 (for the malignant case) compare the performance of four models: DenseNet, ResNet, EfficientNetB0, and CNN + DA (CNN with Data Augmentation). In Table 13, CNN + DA achieves the highest average IoU score of 0.41 , indicating superior performance in identifying relevant features across different feature sets (
Fig. 12. Visualization of lung image analysis: original image of bengin case, LIME heatmaps, and feature-based masking for 6, 8, 10, and 12 important features.
Performance comparison of existing works with proposed work
The proposed CNN with Differential Augmentation (CNN + DA) model achieves a groundbreaking accuracy of 98.78%, outperforming existing state-of-the-art approaches in lung cancer diagnosis. Prior works have explored various deep learning models and augmentation techniques, yet gaps in addressing memory overfitting and achieving robust generalization remain. Critically, a study by Islam et al. (2024)
Traditional Convolutional Neural Networks (CNNs) by Rainio and Klén (2024)
Advanced ensemble and hybrid models have shown promise, with Quasar et al. (2023)
In contrast, the CNN + DA model integrates Differential Augmentation to introduce diverse transformations, such as hue, brightness, and contrast adjustments, directly addressing overfitting and enhancing generalization. Compared to other works, the CNN + DA model exhibits superior accuracy, proving its reliability and robustness for clinical applications in lung cancer detection. Its innovative approach bridges the gaps left by prior models, solidifying its contribution as a novel and highly effective diagnostic tool. Table 15 compares the performance of existing methods with the proposed approach, highlighting improvements in accuracy, efficiency, or other key metrics.
Limitations
The primary dataset used (IQ-OTH/NCCD), consisting of only 1,097 images, is relatively small for training deep learning models, which limits the model’s ability to generalize across a broader spectrum of lung cancer variations and patient demographics. This dataset’s class distribution is also imbalanced, with more malignant cases than bengin or normal ones, potentially biasing the model toward the majority class. While the CNN + DA model
Fig. 13. Visualization of Lung Image Analysis: Original image of Malignant case, LIME Heatmaps, and Feature-Based Masking for 6, 8, 10, and 12 Important Features.
| Author(s) | Proposed model | Accuracy |
| Islam et al. (2024)
|
Generative adversarial networks (GANs) and Variational Autoencoders (VAEs) | 94% |
| Saha et al. (2024)
|
VER-Net | 91% |
| Rainio and Klén (2024)
|
Convolutional Neural Network (CNN) | 92.6% |
| Kukreja and Sabharwal (2024)
|
Convolutional Neural Network (CNN) | 96.11% |
| Zhang et al. (2024)
|
DenseNet-CNN Integration | 96% |
| Gai et al. (2023)
|
Convolutional Neural Networks (CNNs) and Vision Transformers (ViTs) | 93.4% |
| Quasar et al. (2023)
|
Ensemble Model (BEiT, DenseNet, Sequential CNN with ensemble methods) | 96.34% |
| Raza et al. (2023)
|
Lung-EffNet (EfficientNet with modified top layers) | 96.10% |
| Gautam et al. (2023)
|
Ensemble (ResNet-152, DenseNet-169, EfficientNet-B7 with weight optimization) | 97.23% |
| Dritsas and Trigka (2022)
|
Rotation Forest | 97.1% |
| Tsou et al. (2021)
|
eXtreme Gradient Boosting (XGBoost) | 92% |
| Our Work | CNN with DA | 98.78% |
Table 15. Performance comparison of existing works with proposed work.
performs well on the controlled dataset, its performance in real-world clinical environments, which involve diverse imaging protocols, patient demographics, and potential artifacts, has yet to be validated. The model might struggle to handle unseen variations in imaging conditions common in clinical settings. Additionally, the integration of Differential Augmentation (DA) during training introduces extra computational overhead, increasing both training time and resource requirements, which could be a challenge in resource-constrained environments. Finally, the model’s performance is highly dependent on the quality of input data; noisy or lowquality images could lead to misclassifications, particularly when distinguishing between bengin and malignant tumors.
Conclusion
Lung cancer remains a significant global health challenge, requiring innovative solutions to improve diagnostic accuracy. This study addresses the persistent problem of memory overfitting in deep learning models, which impairs their ability to generalize across diverse datasets As an effort to improve the quality of lung cancer detection models, this research seeks to design a new method that involves the merge of a Differential Augmentation technique with a Convolutional Neural Network.
The effectiveness of the proposed CNN + DA model has been demonstrated, attaining the prediction accuracy of
As shown in this research, incorporating Differential Augmentation with CNNs is a good solution to the problems existing in traditional models. Thus, the conclusions point out the need of developing models that do not only solve the problems precisely, but also are immune to adversarial perturbations and can be easily scaled to tackle a wider range of problems. Future work can further explore the adaptability of this approach to other domains and datasets, expanding its utility in advancing deep learning research for complex diagnostic tasks.
Data availability
The data used to support the findings of created new data set, this study is available from the corresponding author upon request.
Received: 24 September 2024; Accepted: 14 April 2025
Published online: 05 May 2025
Published online: 05 May 2025
References
- Jaksik, R., Szumała, K., Dinh, K. N. & Śmieja, J. Multiomics-Based feature extraction and selection for the prediction of lung Cancer survival. Int. J. Mol. Sci. 25 (7 (March 25), 3661. https://doi.org/10.3390/ijms25073661 (2024).
- Lasrado, S. A. & Babu, G. N. K. S. Fused feature reduction and selection system for early lung Cancer detection (April 4). https:// doi.org/10.1109/iconstem60960.2024.10568801 (2024).
- Aggarwal, P., Marwah, N., Kaur, R. & Mittal, A. Lung Cancer Survival Prognosis Using a Two-Stage Modeling Approach. Multimedia Tools and Applications (January 31). https://doi.org/10.1007/s11042-024-18280-2 (2024).
- Hussain, L., Almaraashi, M. S., Aziz, W., Habib, N. & Abbasi, S. U. R. S. Machine learning-based lungs cancer detection using reconstruction independent component analysis and sparse filter features. Waves Random Complex. Media 34, 226-251. https://d oi.org/10.1080/17455030.2021.1905912 (2021).
- Mamun, M., Mahmud, M. I. & Meherin, M. & Abdelgawad, A. LCDctCNN: lung Cancer diagnosis of CT scan images using CNN based model. ArXiv (Cornell University). (2023). https://doi.org/10.48550/arxiv.2304.04814
- Moitra, D. & Mandal, R. K. Classification of non-small cell lung cancer using one-dimensional convolutional neural network. Expert Syst. Appl. 159, 113564 (2020).
- Perez, G. & Arbelaez, P. Automated Lung cancer Diagnosis Using three-dimensional Convolutional Neural Networks, 1803-1815 (Medical & Biological Engineering & Computing, 2020).
- Moitra, D. & Mandal, R. K. Automated AJCC staging of non-small cell lung cancer (NSCLC) using deep convolutional neural network (CNN) and recurrent neural network (RNN). Health Inform. Sci. Syst. 7, 1-12 (2019).
- Doppalapudi, S., Qiu, R. G. & Badr, Y. Lung cancer survival period prediction and understanding: deep learning approaches. Int. J. Med. Informatics. 148, 104371 (2021).
- Faruqui, N. et al. LungNet: A hybrid deep-CNN model for lung cancer diagnosis using CT and wearable sensor-based medical IoT data. Comput. Biol. Med. 139, 104961. (2021).
- Aboamer, M. A. et al. An investigation in analyzing the food quality well-being for lung cancer using blockchain through cnn. J. Food Qual. (2022).
- Kirienko, M. et al. Convolutional neural networks promising in lung cancer T-parameter assessment on baseline FDG-PET/CT. Contrast Media Mol. Imaging (2018).
- Lin, C. J., Jeng, S. Y. & Chen, M. K. Using 2D CNN with Taguchi parametric optimization for lung cancer recognition from CT images. Appl. Sci. 10 (7), 2591 (2020).
- Moitra, D. & Mandal, R. K. Prediction of non-small cell lung cancer histology by a deep ensemble of convolutional and bidirectional recurrent neural network. J. Digit. Imaging. 33, 895-902 (2020).
- Zhan, X. et al. A convolutional neural network-based intelligent medical system with sensors for assistive diagnosis and decisionmaking in non-small cell lung cancer. Sensors, 21(23), p.7996. (2021).
- Islam, Tauhidul, M. S., Hafiz, J. R., Jim & Mridha, M. F. Md. Mohsin Kabir, and A systematic review of deep learning data augmentation in medical imaging: Recent advances and future research directions. Healthcare Analytics 5June 1, : 100340. (2024). https://doi.org/10.1016/j.health.2024.100340
- Saha, A. et al. VER-Net: A hybrid transfer learning model for lung cancer detection using CT scan images. BMC Med. Imaging 24. https://doi.org/10.1186/s12880-024-01238-z (2024).
- Rainio, O. & Klén, R. Comparison of simple augmentation transformations for a convolutional neural network classifying medical images. Signal Image Video Process. https://doi.org/10.1007/s11760-024-02998-5 (2024).
- Kukreja, S. & Sabharwal, M. An effective lung Cancer diagnosis model using the CNN algorithm. EAI Endorsed Trans. Pervasive Health Technol. 10 https://doi.org/10.4108/eetpht.10.6805 (2024).
- Zhang, C. et al. Enhancing lung cancer diagnosis with data fusion and mobile edge computing using DenseNet and CNN. J. Cloud Comput. Adv. Syst. Appl. 13. https://doi.org/10.1186/s13677-024-00597-w (2024).
- Gai, L., Xing, M., Chen, W., Zhang, Y. & Qiao, X. Comparing CNN-based and transformer-based models for identifying lung cancer: which is more effective? Multim. Tools Appl. 83, 59253-59269. https://doi.org/10.1007/s11042-023-17644-4 (2023).
- Quasar, S. et al. Ensemble methods for computed tomography scan images to improve lung cancer detection and classification. Multimedia Tools Appl. 83 (17), 52867-52897. https://doi.org/10.1007/s11042-023-17616-8 (2023).
- Raza, R. et al. Lung-EffNet: lung cancer classification using EfficientNet from CT-scan images. Eng. Appl. Artif. Intell. 126 (1), 106902. https://doi.org/10.1016/j.engappai.2023.106902 (2023).
- Gautam, N., Basu, A. & Sarkar, R. Lung cancer detection from thoracic CT scans using an ensemble of deep learning models. Neural Comput. Appl. 36, 2459-2477. https://doi.org/10.1007/s00521-023-09130-7 (2023).
- Dritsas, E. & Trigka, M. Lung cancer risk prediction with machine learning models. Big Data Cogn. Comput. 6 (4), 139. (2022).
- Tsou, P. H. et al. Exploring volatile organic compounds in breath for high-accuracy prediction of lung cancer. Cancers 13 (6), 1431 (2021).
- Muniasamy, A., Alquhtani, S. A. S., Bilfaqih, S. M., Balaji, P. & Karunakaran, G. Lung cancer histopathology image classification using transfer learning with Convolution neural network model. Technol. Health Care November. 9, 1-12. https://doi.org/10.3233 /thc-231029 (2023).
- Jothi, J., Sathiya & Chinnadurai, M. A combined deep CNN with a chimp optimization approach for lung cancer diagnosis. J. Intell. Fuzzy Syst. 46 (2), 4681-4696. https://doi.org/10.3233/jifs-237339 (2024).
- Garcea, F., Serra, A., Lamberti, F. & Morra, L. Data augmentation for medical imaging: A systematic literature review. Comput. Biol. Med. 152 (January 1), 106391. https://doi.org/10.1016/j.compbiomed.2022.106391 (2023).
- Mathworks Understand Network Predictions Using LIME – MATLAB & Simulink – MathWorks India-in.mathworks.com. (2024). https://in.mathworks.com/help/deeplearning/ug/understand-network-predictions-using-lime.html. Accessed 28 May 2024.
- Kumar, S. V. & Kondaveeti, H. K. Towards transparency in AI: explainable bird species image classification for ecological research. Ecol. Ind. 169, 112886. https://doi.org/10.1016/j.ecolind.2024.112886 (2024).
- Ribeiro, M. T., Singh, S. & Guestrin, C. Why should i trust you? Explaining the predictions of any classifier. In Proceedings of the 22nd ACM SIGKDD International Conference on Knowledge Discovery and Data Mining, 1135-1144. (2016).
- Zafar, M. R. & Khan, N. Deterministic local interpretable model-agnostic explanations for stable explainability. Mach. Learn. Knowl. Extr. 3 (3), 525-541 (2021).
- Hamdalla, F. The & IQ-OTH/NCCD Lung Cancer Dataset. Kaggle. (2020). https://www.kaggle.com/datasets/hamdallak/the-iqoth nccd-lung-cancer-dataset. Accessed 3 Jan 2023.
- Lung and Colon Cancer Histopathological Images. https://www.kaggle.com/datasets/andrewmvd/lung-and-colon-cancer-histopa thological-images. Accessed 7 Dec 2024.
- Clark, K. et al. The Cancer imaging archive (TCIA): maintaining and operating a public information repository. J. Digit. Imaging. 26, 1045-1057. https://doi.org/10.1007/s10278-013-9622-7 (2013).
- Team, N. L. S. T. R. The National lung screening trial: overview and study design. Radiology 258 (1), 243-253. https://doi.org/10.1 148/radiol. 10091808 (2011).
- Tirumanadham, N. Improving predictive performance in e-learning through hybrid 2-tier feature selection and hyper parameteroptimized 3-tier ensemble modeling. Int. J. Inf. Tecnol. 16, 5429-5456. https://doi.org/10.1007/s41870-024-02038-y (2024).
Acknowledgements
Authors are saying to thanks for supporting of completion of this research work.
Author contributions
All authors reviewed the manuscript.
Funding
Author declared that no funding was received for this Research and Publication.
Declarations
Competing interests
The authors declare no competing interests.
Ethical approval
This article does not contain any studies with human participant and Animals performed by author.
Additional information
Correspondence and requests for materials should be addressed to V.S.
Reprints and permissions information is available at www.nature.com/reprints.
Publisher’s note Springer Nature remains neutral with regard to jurisdictional claims in published maps and institutional affiliations.
Reprints and permissions information is available at www.nature.com/reprints.
Publisher’s note Springer Nature remains neutral with regard to jurisdictional claims in published maps and institutional affiliations.
Open Access This article is licensed under a Creative Commons Attribution-NonCommercial-NoDerivatives 4.0 International License, which permits any non-commercial use, sharing, distribution and reproduction in any medium or format, as long as you give appropriate credit to the original author(s) and the source, provide a link to the Creative Commons licence, and indicate if you modified the licensed material. You do not have permission under this licence to share adapted material derived from this article or parts of it. The images or other third party material in this article are included in the article’s Creative Commons licence, unless indicated otherwise in a credit line to the material. If material is not included in the article’s Creative Commons licence and your intended use is not permitted by statutory regulation or exceeds the permitted use, you will need to obtain permission directly from the copyright holder. To view a copy of this licence, visit http://creativecommo ns.org/licenses/by-nc-nd/4.0/.
© The Author(s) 2025
© The Author(s) 2025
Department of Computer Science and Engineering, UCEK, Jawaharlal Nehru Technological University Kakinada, Kakinada, Andhra Pradesh-533003, India. Department of Computer Science and Engineering, Amrita Sai Institute of Science and Technology, Bathinapadu, Paritala, Andhra Pradesh-521180, India. email: shariff.v@gmail.com