المجلة: Scientific Reports، المجلد: 15، العدد: 1
DOI: https://doi.org/10.1038/s41598-025-85660-5
PMID: https://pubmed.ncbi.nlm.nih.gov/39824900
تاريخ النشر: 2025-01-17
DOI: https://doi.org/10.1038/s41598-025-85660-5
PMID: https://pubmed.ncbi.nlm.nih.gov/39824900
تاريخ النشر: 2025-01-17
فتح
تحقيق في العوامل الفيزيائية والكيميائية التي تؤثر على الهضم في المختبر ومؤشرات السكر في الدم لطرز الأرز الهندي المحلية
الأرز (Oryza sativa) هو محصول غذائي حيوي ونظام غذائي أساسي لمعظم سكان العالم. لقد كان للاختيارات الغذائية السيئة دور كبير في تطور مرض السكري من النوع الثاني في السكان الذين يعتمدون على الأرز والأطعمة المعتمدة على نشا الأرز. لذلك، درست دراستنا الهضم في المختبر ومؤشرات السكر في الدم لبعض أصناف الأرز المحلية والعوامل المؤثرة على هذه المؤشرات. تم تقدير خصائص الطهي لأصناف الأرز. علاوة على ذلك، تم تقدير التحقيقات الكيميائية الحيوية مثل محتوى الأميلوز ومحتوى النشا المقاوم باستخدام طريقة معقد اليود الأزرق ومجموعة ميغازايم على التوالي. تم تقدير مؤشر السكر في الدم في المختبر باستخدام طريقة GOPOD. تم تصنيف أصناف الأرز التي تم النظر فيها في دراستنا إلى أصناف أرز منخفضة ومتوسطة وعالية الأميلوز. تم إخضاع أصناف الأرز للتوصيف الفيزيائي الكيميائي باستخدام تقنيات مطيافية الأشعة تحت الحمراء بتحويل فورييه (FTIR) وقياس المسح الحراري التفاضلي (DSC). كشفت تحليل طيف FTIR عن وجود نطاقات بارزة عند 3550-3200، 2927-2935، 1628-1650، 1420-1330، و1300-1000 سم-1 والتي تت correspond إلى مجموعات -OH،
الكلمات الرئيسية: الهضم في المختبر، مؤشر السكر في الدم، محتوى الأميلوز، النشا المقاوم، قوة الانتفاخ، امتصاص الماء، خصائص الطهي
الأرز (Oryza sativa) هو أحد أهم المحاصيل الغذائية في العالم، وهو نظام غذائي أساسي لنحو نصف سكان العالم. إنتاج الأرز واستهلاكه هو الأعلى بين السكان الآسيويين، وخاصة بين الهنود
(
المواد والطرق
جمع العينات
تم جمع أصناف الأرز من المزارعين المحليين في ولاية كارناتاكا (بانانثي آكي، غاندا سال، بيلي راجامودي، بيتا سانا، سالم سانا، تانو، بيلي موغوثي، كيمبو راجامودي، كاجي ثالي، كافيري) ومنطقة آسام (نيولي، ثانغام تشامبا، تيل بورا، كونونكوروفاي، جوم بيجي، تشاكاو، آد باو، كوتكوتي سالي، بسمتي، بار) في الهند. تم إزالة القشرة من العينات للحصول على حبوب الأرز. تم طحن 10 جرام من حبوب الأرز بشكل ناعم باستخدام خلاط (750 وات، بريستيج ديلايت، الهند) وتم غربلتها من خلال
الخصائص الفيزيائية لحبوب الأرز
تمت دراسة الخصائص الظاهرية لحبوب الأرز المقشور. تم قياس المعايير الفيزيائية، مثل الطول والعرض والسماكة لحبوب الأرز، باستخدام أدوات قياس رقمية.
تحديد وقت الطهي، نسبة امتصاص الماء، نسبة إطالة الحبة، ونسبة توسع الحجم
وقت الطهي
تم تقدير وقت الطهي بواسطة طريقة الطهي في الوعاء المفتوح. تم طهي حبات الأرز (5 جرام) في 100 مل من الماء المقطر. في هذه الأثناء، تم بدء ساعة العد التنازلي. كل 5 دقائق، تم إزالة بعض حبات الأرز من وعاء الطهي ووضعها بين شريحتين زجاجيتين للتحقق من عدم وجود نوى بيضاء في الأرز.
تتوقف ساعة العد التنازلي بمجرد الانتهاء من الطهي، ويتم تسجيل الوقت النهائي كوقت الطهي المحدد.
تتوقف ساعة العد التنازلي بمجرد الانتهاء من الطهي، ويتم تسجيل الوقت النهائي كوقت الطهي المحدد.
امتصاص الماء (WU)
الحد الأدنى من كمية الماء التي تمتصها حبات الأرز خلال عملية الطهي يُشار إليه باسم امتصاص الماء. تم وزن جرامين من الأرز وطهيهما في 10 مل من الماء حتى نضج الأرز تمامًا. تم إزالة حبات الأرز الفردية ووضعها بين شريحتين زجاجيتين بحيث لا يوجد نواة بيضاء، مما يضمن الطهي الكامل. ثم تم تصفية الأرز المطبوخ، وتم قياس الماء الزائد. يتم حساب كمية الماء الممتص عن طريق طرح كمية الماء المصرف من كمية الماء الأولية المضافة. ثم تم التعبير عن امتصاص الماء لمختلف أصناف الأرز كـ 100 جرام من الأرز.
نسبة إطالة الحبة (ER) ونسبة توسع الحجم (VER)
تم قياس طول الحبة الأولي (L0) باستخدام جهاز قياس رقمي قبل الطهي، وتم تسجيل طول الحبة النهائي (L1) بعد الطهي.
طيف الأشعة تحت الحمراء بواسطة تحويل فورييه (FTIR) لأنواع الأرز
تم استخدام مطيافية FTIR لفحص التغيرات في التركيب الكيميائي لدقيق الأرز من أصناف مختلفة من الأرز. تم خلط عينات دقيق الأرز مع KBr وتثبيتها على بروميد البوتاسيوم.
التحليل الحراري التفاضلي (DSC) لأنواع الأرز
تم تحديد معلمات الجيلاتنة باستخدام جهاز المسح الحراري التفاضلي (DSC60 من شيمادزو). تم إعداد العينة عن طريق تغليف حوالي
تحديد محتوى الأميلوز في أصناف الأرز
لتحديد محتوى الأميلوز في حبيبات النشا، تم وزن 100 ملغ من دقيق الأرز في flask حجمي سعة 100 مل، وتم إضافة 1 مل من
تحديد قوة الانتفاخ لأنواع الأرز
تم وزن غرام واحد من دقيق الأرز ونقله إلى 40 مل من الماء المقطر. تم تحضين الخليط في حمام مائي عند درجات حرارة مختلفة تتراوح من 55 إلى
تحديد النشا المقاوم (RS) والنشا الكلي (TS)
تم تقدير محتوى RS من عينات الأرز باستخدام مجموعة اختبار RS من ميجازايم (ميجازايم إنترناشيونال أيرلندا المحدودة، براى، أيرلندا) وفقًا لبروتوكول الشركة المصنعة. تم هضم مائة ملليجرام من دقيق الأرز مع 4 مل من عصارة البنكرياس.
تحديد مؤشر نسبة السكر في الدم (GI) في المختبر لأنواع الأرز
تم تحديد مؤشر نسبة السكر في الدم (GI) لأنواع الأرز وفقًا للطريقة الموضحة من قبل غوني وآخرون.
ت kinetics تحلل النشا اتبعت حركيات من الدرجة الأولى الزائفة
التحليل الإحصائي
تم حساب المتوسط والانحراف المعياري للبيانات الثلاثية من التجارب باستخدام Microsoft Excel 2019. تم حساب تحليل التباين باستخدام GraphPad Prism 8.0.2 من خلال تطبيق اختبار توكي لتحديد الأهمية الإحصائية للقيم التي تم الحصول عليها. النتائج مع
النتائج والمناقشة
توصيف الظواهر وتحديد معايير الطهي
كان لبسمتي أعلى نسبة استطالة
طيف الأشعة تحت الحمراء بواسطة تحويل فورييه (FTIR) لأسلاف الأرز
كشفت طيف الأشعة تحت الحمراء (FTIR) لأسلاف الأرز من كارناتاكا وآسام عن روابط كيميائية متعددة موضوعة هيكليًا في الجزيء. قمنا بمسح دقيق لدقيق الأرز في نطاق
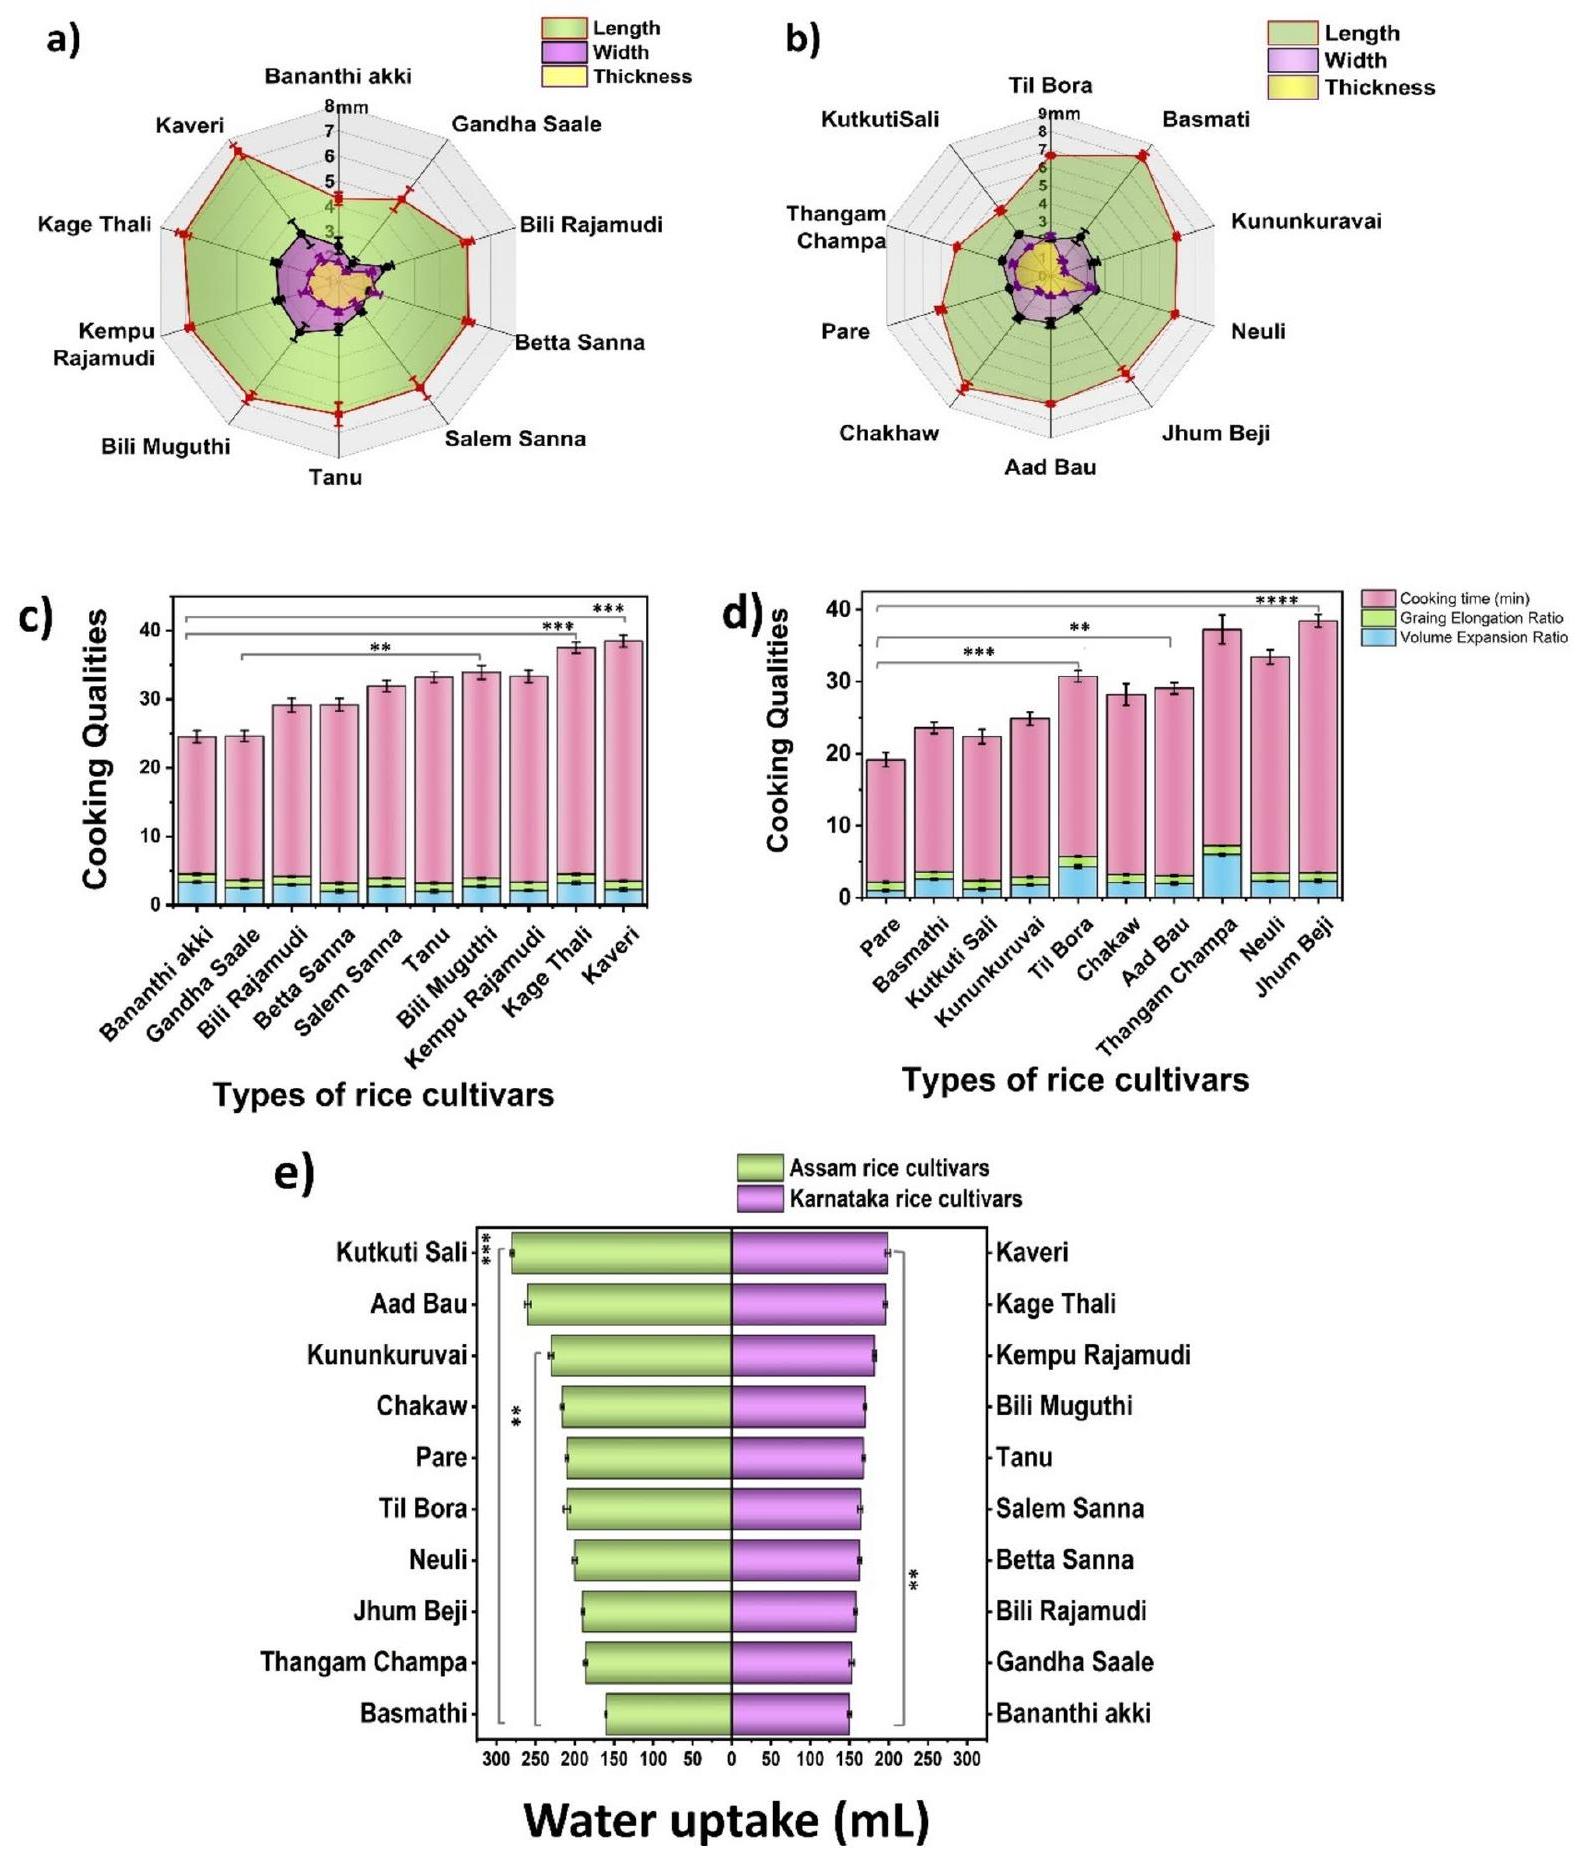
الشكل 1. تمثيل بياني لبارامترات الطهي لـ (أ) أصناف الأرز من كارناتاكا (ب) أصناف الأرز من آسام، و (ج) رسم بياني عمودي يوضح امتصاص الماء لأصناف الأرز
في
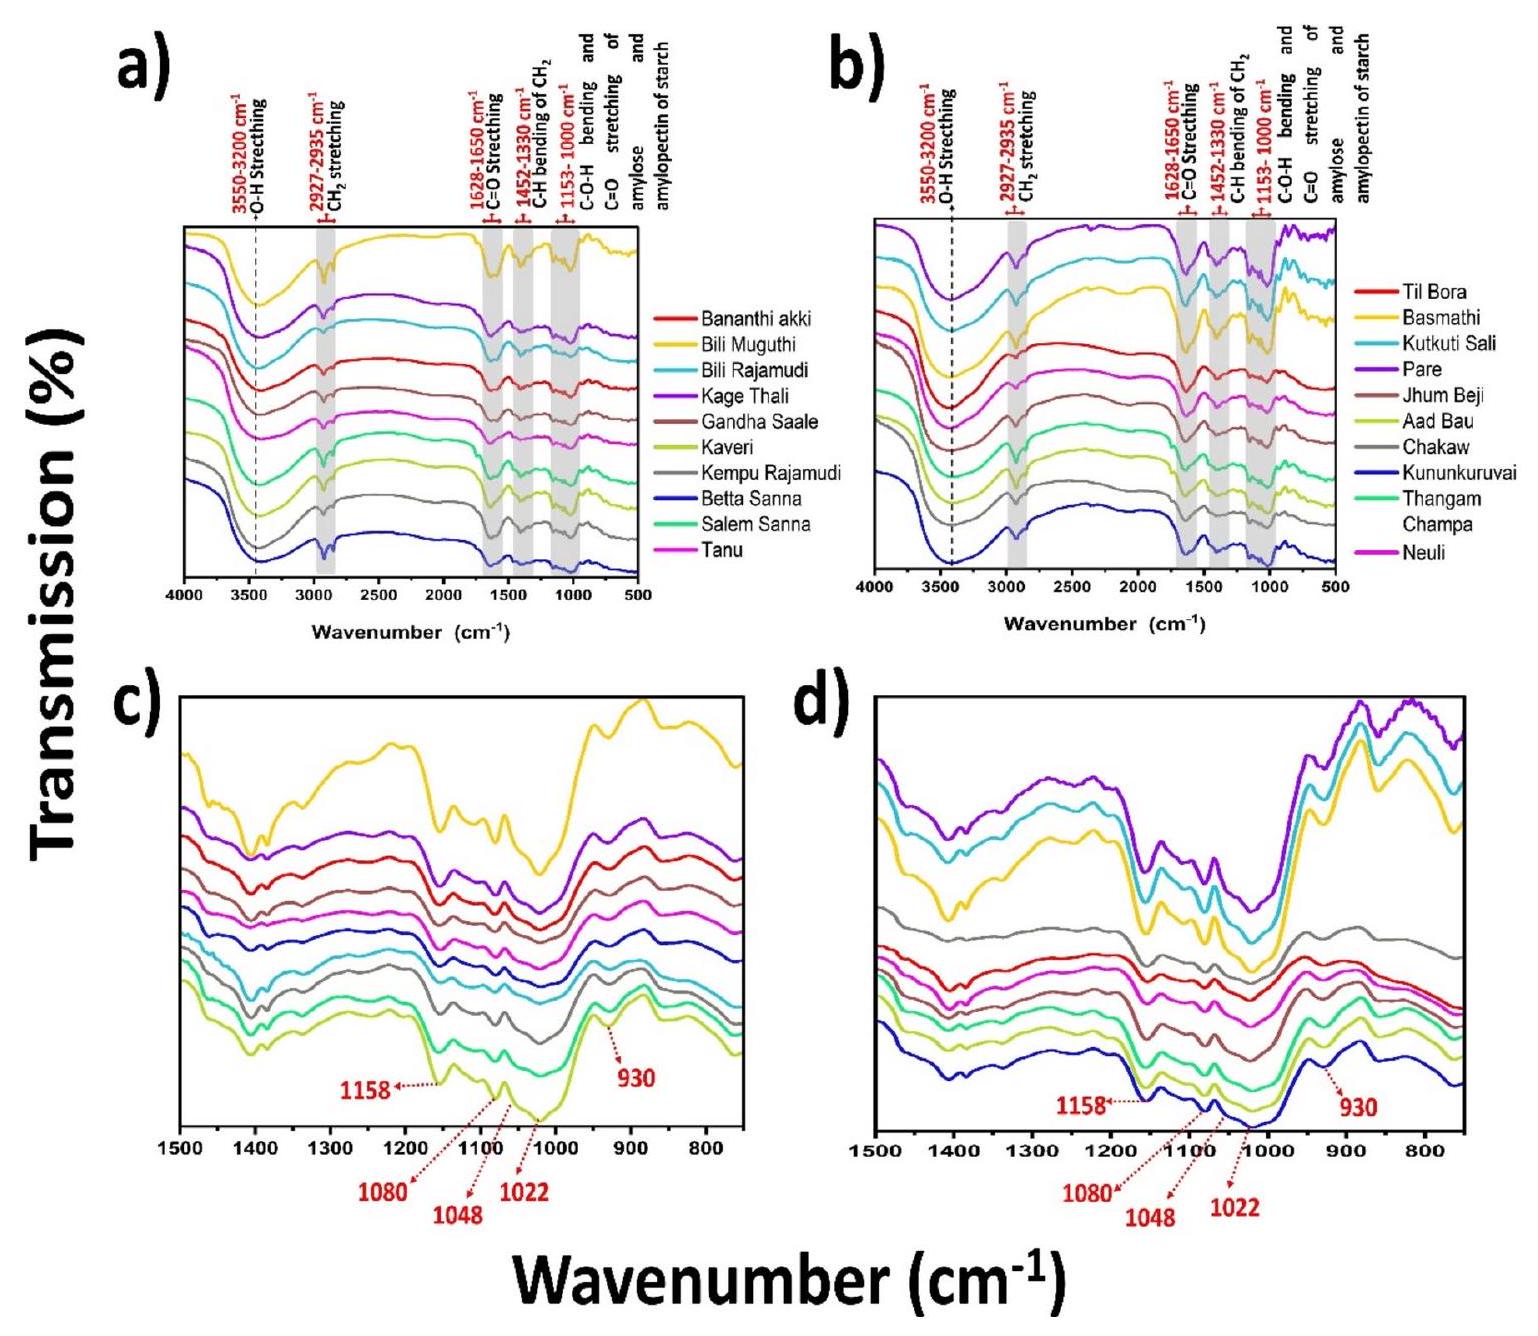
الشكل 2. طيف FTIR لـ (أ) و (ج) أرز كارناتاكا؛ (ب) و (د) أصناف أرز آسام؛ (ج) و (د) منطقة بصمة طيف FTIR لأصناف أرز كارناتاكا وآسام، على التوالي.
| عدد الموجات (
|
تعيينات الفرق | تنبؤ | المراجع | |||||
| 3550-3200
|
اهتزاز الشد لـ O-H | البوليسكاريدات | 43 | |||||
| ٢٩٢٧-٢٩٣٥
|
|
الدهون غير المشبعة بشكل رئيسي ومساهمة صغيرة من البروتينات والكربوهيدرات والأحماض النووية | ٤٤ | |||||
|
|
|
|
44,45 | |||||
|
|
|
الألكينات الموزعة بشكل متساوي | ٤٦،٤٧ | |||||
|
|
|
الدهون والبروتينات وجود روابط جليكوسيدية | ٤٨، ٤٦، ٤٧ | |||||
|
|
|
نشا | ٤٩ | |||||
|
|
|
سلسلة بوليمر | ٤٦ | |||||
| 1048 | الطيف المميز للمنطقة البلورية للنشا | سلاسل الأميلوبكتين | 50 | |||||
|
|
سمة للمنطقة غير المتبلورة،
|
سلاسل الأميلوز | ٥١,٥٠ | |||||
| 930 | اهتزازات وضعية الهيكل العظمي لـ
|
وجود روابط جليكوسيدية قوية ويشير إلى المحبة للماء للنشا | ٥٢,٤٧ | |||||
|
|
منطقة بصمة الإصبع | حلقة الجلوكوبيرانووز من النشا | 53 |
الجدول 1. جدول يوضح تخصيصات نطاق FTIR لأسلاف الأرز: ب-عريض، و-ضعيف، س-قوي، م-متوسط.
تشير الاختلافات بين أصناف الأرز المختلفة إلى اختلافات في قدرة امتصاص الماء، وسلوك الانتفاخ، واحتباس الرطوبة. علاوة على ذلك، فإن اهتزازات الوضع الهيكلي لـ
التحليل الحراري التفاضلي (DSC) لحبيبات النشا
تم تحديد الخصائص الحرارية لدقيق الأرز باستخدام DSC. بداية (
تحديد محتوى الأميلوز في أصناف الأرز
محتوى الأميلوز هو معلمة مهمة تحدد خصائص الطهي والأكل للأرز. كما أن محتوى الأميلوز يحدد ملاءمة النشا للاستخدام الصناعي. اختلفت محتويات الأميلوز في أصناف الأرز التي تم النظر فيها في هذه الدراسة بشكل ملحوظ.
| أصناف الأرز في كارناتاكا | أصناف أرز آسام | ||
| اسم أصناف الأرز | R 1047/1022 | أسماء أصناف الأرز | R 1047/1022 |
| بانانثي آكي | 1.01 | تيل بورا | 1.00 |
| بيلي موغوثي | 1.18 | بسمتي | 1.28 |
| بيتا سنا | 1.10 | كونكوروفاي | 1.10 |
| بيع غاندا | 1.00 | نويلي | 1.12 |
| كافيري | 1.25 | جهم بيجي | 1.14 |
| كيمبو راجامودي | 1.00 | عاد باو | 1.05 |
| كاجي ثالي | 1.15 | تشاكاو | 1.10 |
| سلام سنة | 1.23 | قشر | 1.20 |
| تانُو | 1.01 | ثانغام تشامبا | 1.02 |
| بيلي راجامودي | 1.02 | كتكوتي سالي | 1.19 |
الجدول 2. جدول يوضح R1047/1022 لمختلف أصناف الأرز الهندي:
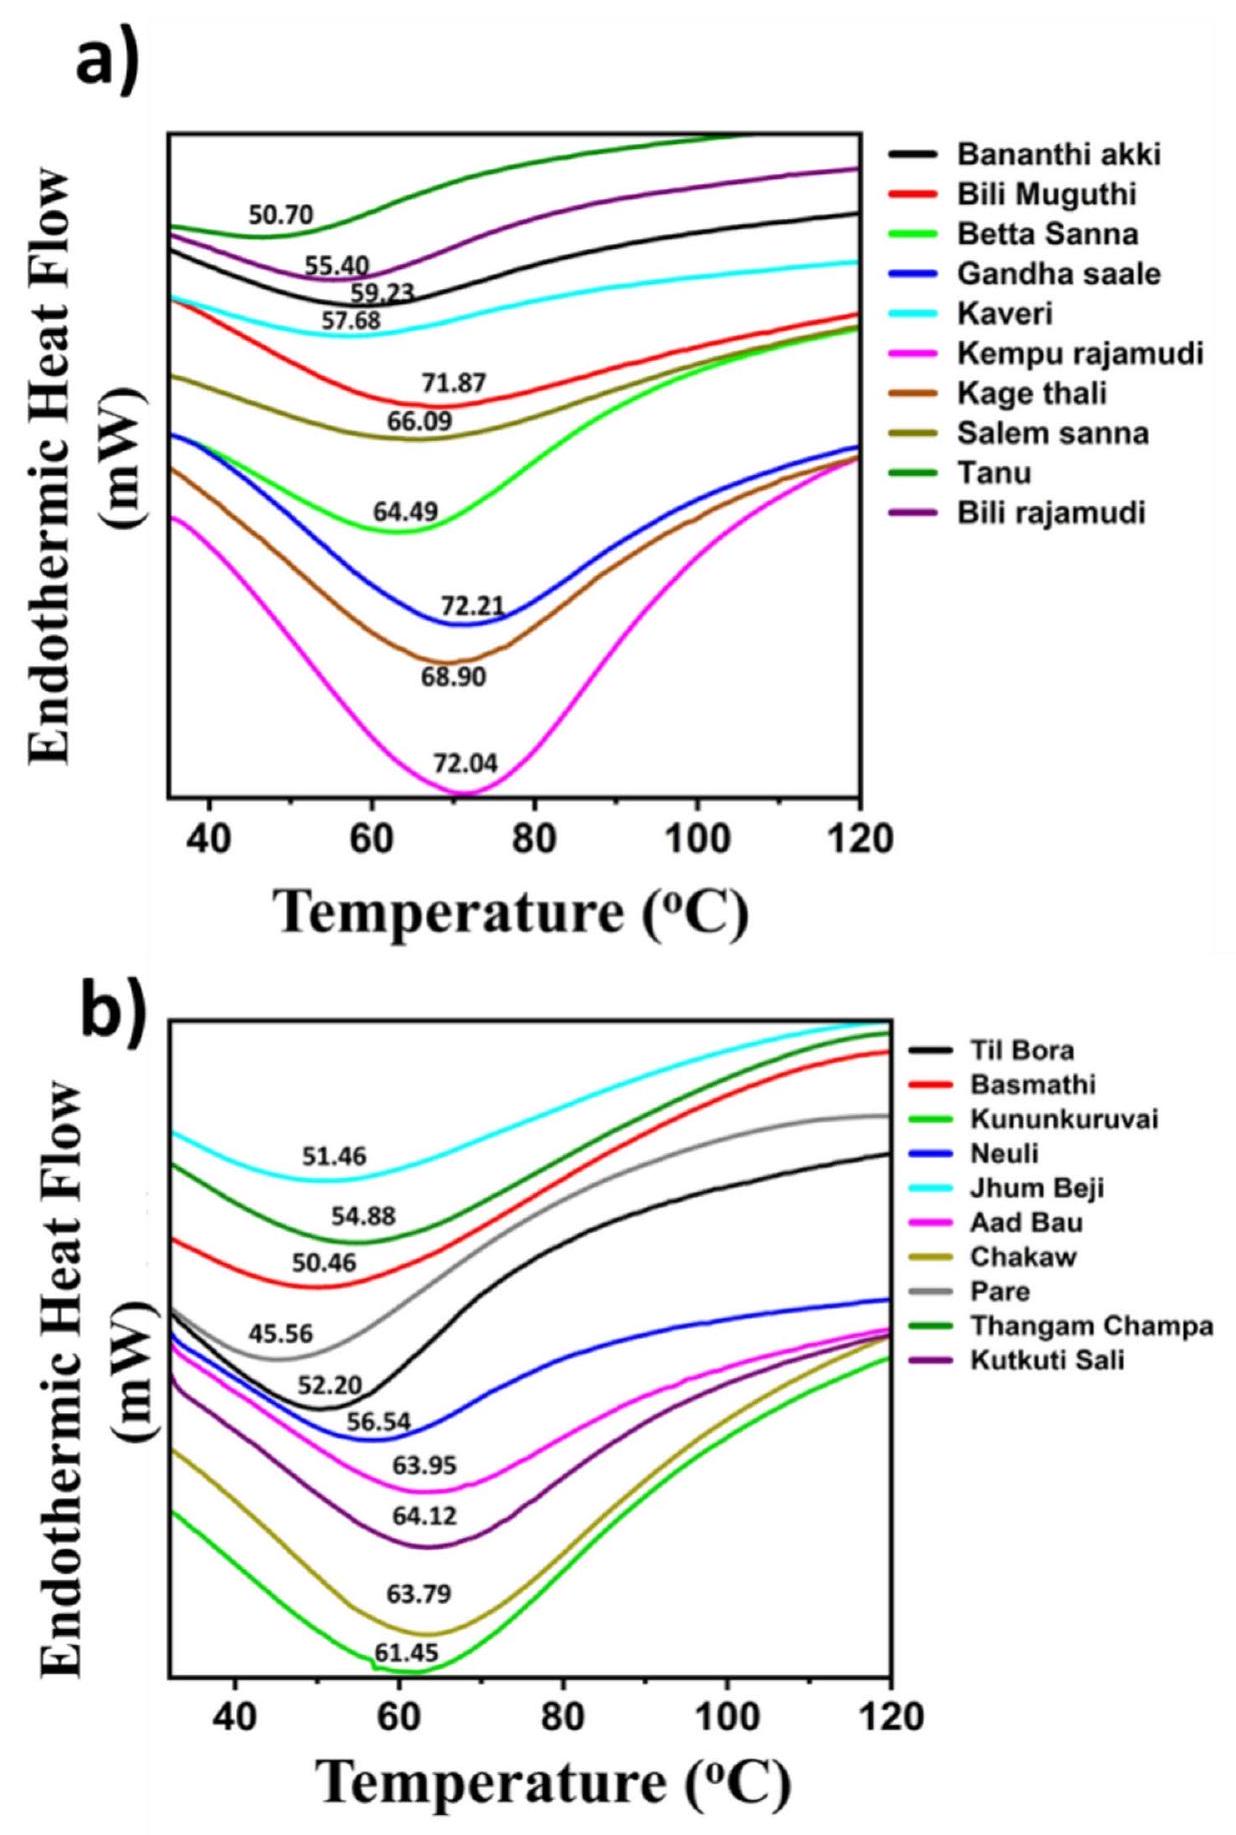
الشكل 3. مخططات DSC توضح درجات حرارة الجيلاتينية القصوى لعينات الأرز من (أ) كارناتاكا و(ب) آسام.
نظرًا لأن بعض الإنزيمات المسؤولة عن تخليق النشا حساسة للحرارة، فإن درجات الحرارة الجوية التي تزيد عن أو تقل عن المستوى الأمثل يمكن أن تؤثر بشكل كبير على وظيفتها أثناء تخليق النشا على المستوى الجزيئي، أي تشكيل سلاسل الأميلوز والأميلوبكتين وتفرعاتها.
تحديد قوة الانتفاخ لأنواع الأرز
قوة الانتفاخ هي نسبة الرواسب الرطبة من دقيق الأرز إلى الرواسب الجافة. تحدد سعة احتباس الماء لدقيق الأرز وبالتالي تحدد قابليته للاستخدام في مختلف الصناعات الغذائية. تراوحت قوة الانتفاخ لنشويات الأرز من 12.42 إلى
| رقم السجل | أصناف الأرز | AUC | HI | GI |
|
k (دقيقة
|
| أصناف الأرز من آسام | ||||||
| 1 | نويلي | 485.62 |
|
|
|
|
| 2 | ثانغام تشامبا | 450.05 |
|
|
|
|
| 3 | تيل بورا | 438.28 |
|
|
|
|
| 4 | كونونكوروفاي | 427.13 |
|
|
|
|
| 5 | جهوم بيجي | 439.37 |
|
|
|
|
| 6 | تشاكاو | 440.43 |
|
|
|
|
| 7 | عاد باو | 396.3 |
|
|
|
|
| 8 | كوتكوتي سالي | 384.91 |
|
|
|
|
| 9 | باسماثي | 355.18 |
|
|
|
|
| 10 | بار | 358.88 |
|
|
|
|
| أصناف الأرز من كارناتاكا | ||||||
| 1 | بانانثي آكي | 392.63 |
|
|
|
|
| 2 | غاندها سالي | 379.59 |
|
|
|
|
| 3 | بيلي راجامودي | 366.83 |
|
|
|
|
| 4 | بيتا سنا | 362.85 |
|
|
|
|
| 5 | سالم سنا | 357.79 |
|
|
|
|
| 6 | تانوا | 355.78 |
|
|
|
|
| 7 | بيلي موغوثي | 356.14 |
|
|
|
|
| 8 | كيمبو راجامودي | 357.7 |
|
|
|
|
| 9 | كاجي ثالي | 343.155 |
|
|
|
|
| 10 | كافيري | 362.98 |
|
|
|
|
| خبز طازج | 503.37 |
|
|
|
|
|
الجدول 3. معلمات حركية الهضم في المختبر لأصناف الأرز المختلفة من آسام وكارناتاكا.
أصناف الأرز تشامبا من آسام وأصناف الأرز بانانثي آكي وغاندها سالي من كارناتاكا أظهرت انتفاخًا أكبر من الأصناف الأخرى. قد يكون ذلك بسبب انخفاض محتوى الأميلوز. بالإضافة إلى ذلك، أظهرت أصناف الأرز من آسام وكارناتاكا ذات المحتوى العالي من الأميلوز أقل انتفاخ. علاوة على ذلك، كان هناك ارتباط سلبي قوي (
تحديد النشا المقاوم (RS)، النشا غير المقاوم (NRS)، وإجمالي النشا (TS)
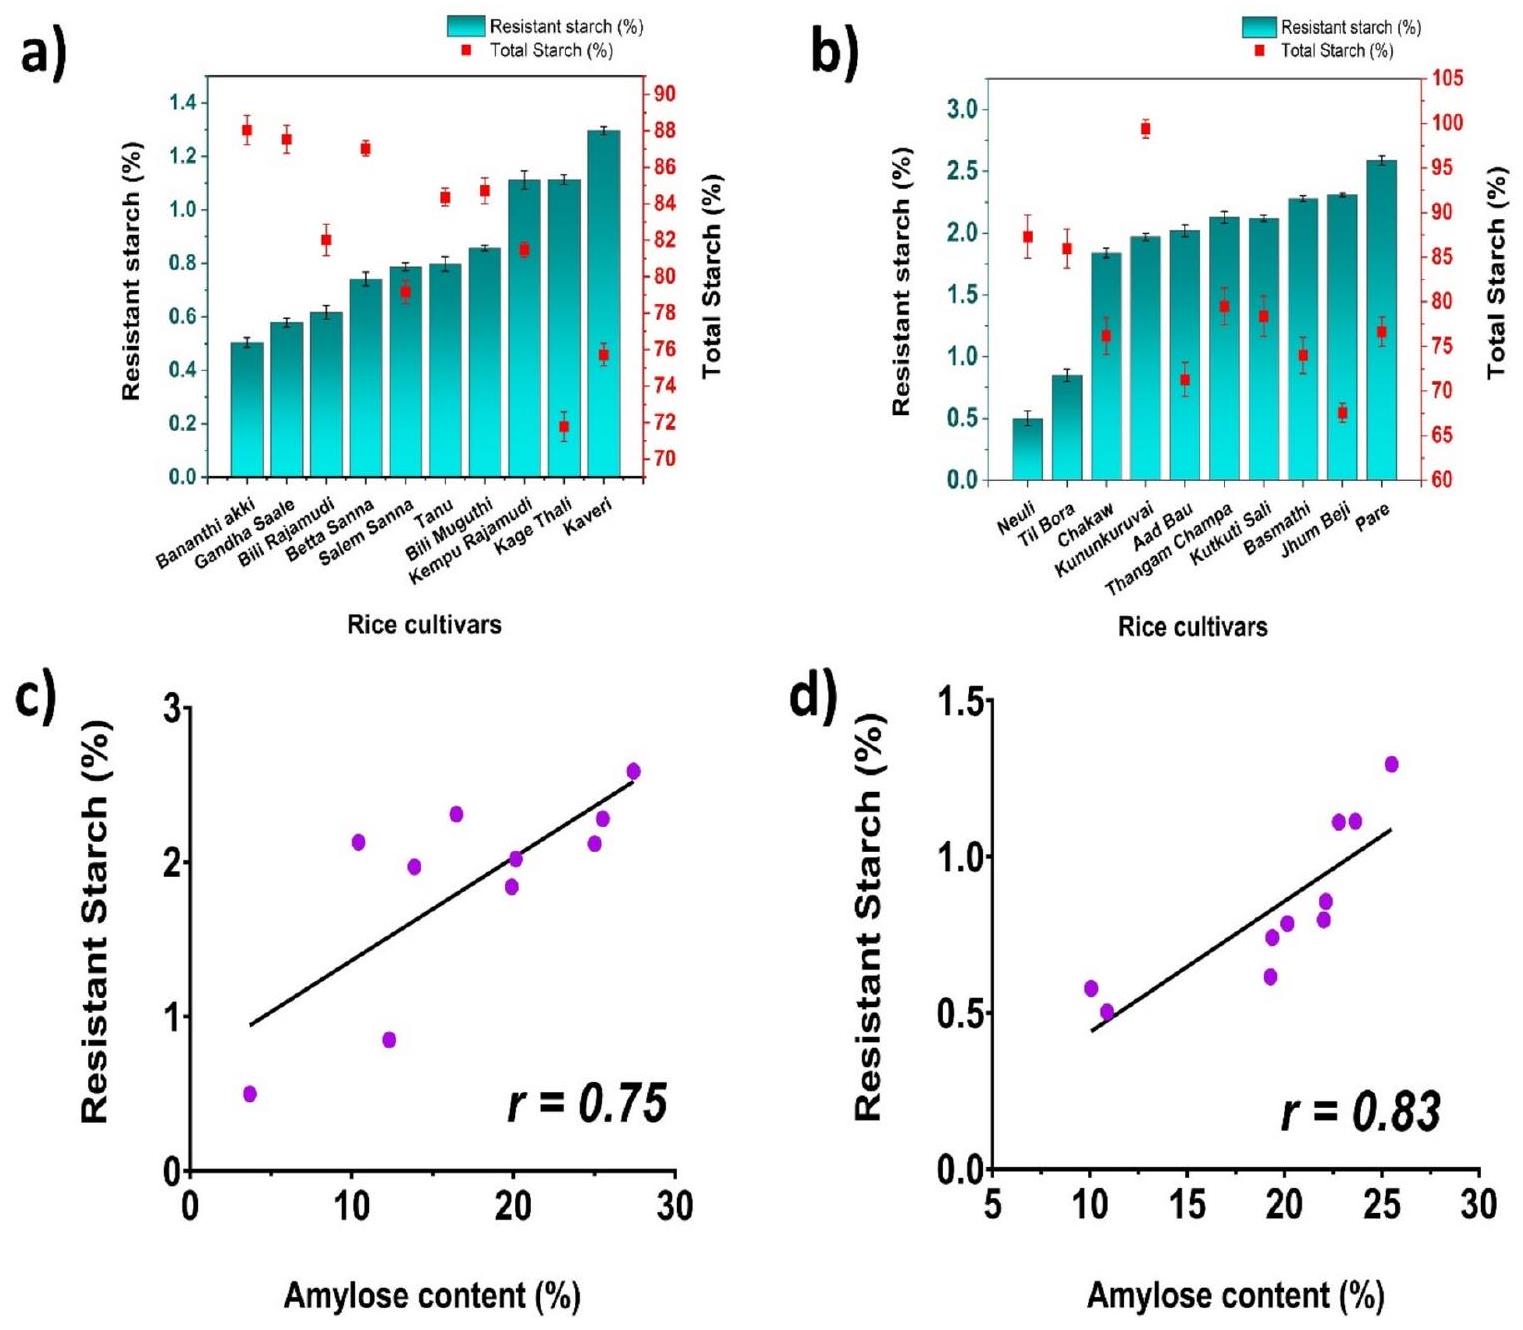
أظهرت أصناف الأرز من كارناتاكا وآسام مجموعة واسعة من الاختلافات في محتويات RS وNRS وTS. في حالة صنف الأرز من كارناتاكا، تم الحصول على أعلى قيمة RS لصنف كافيري (
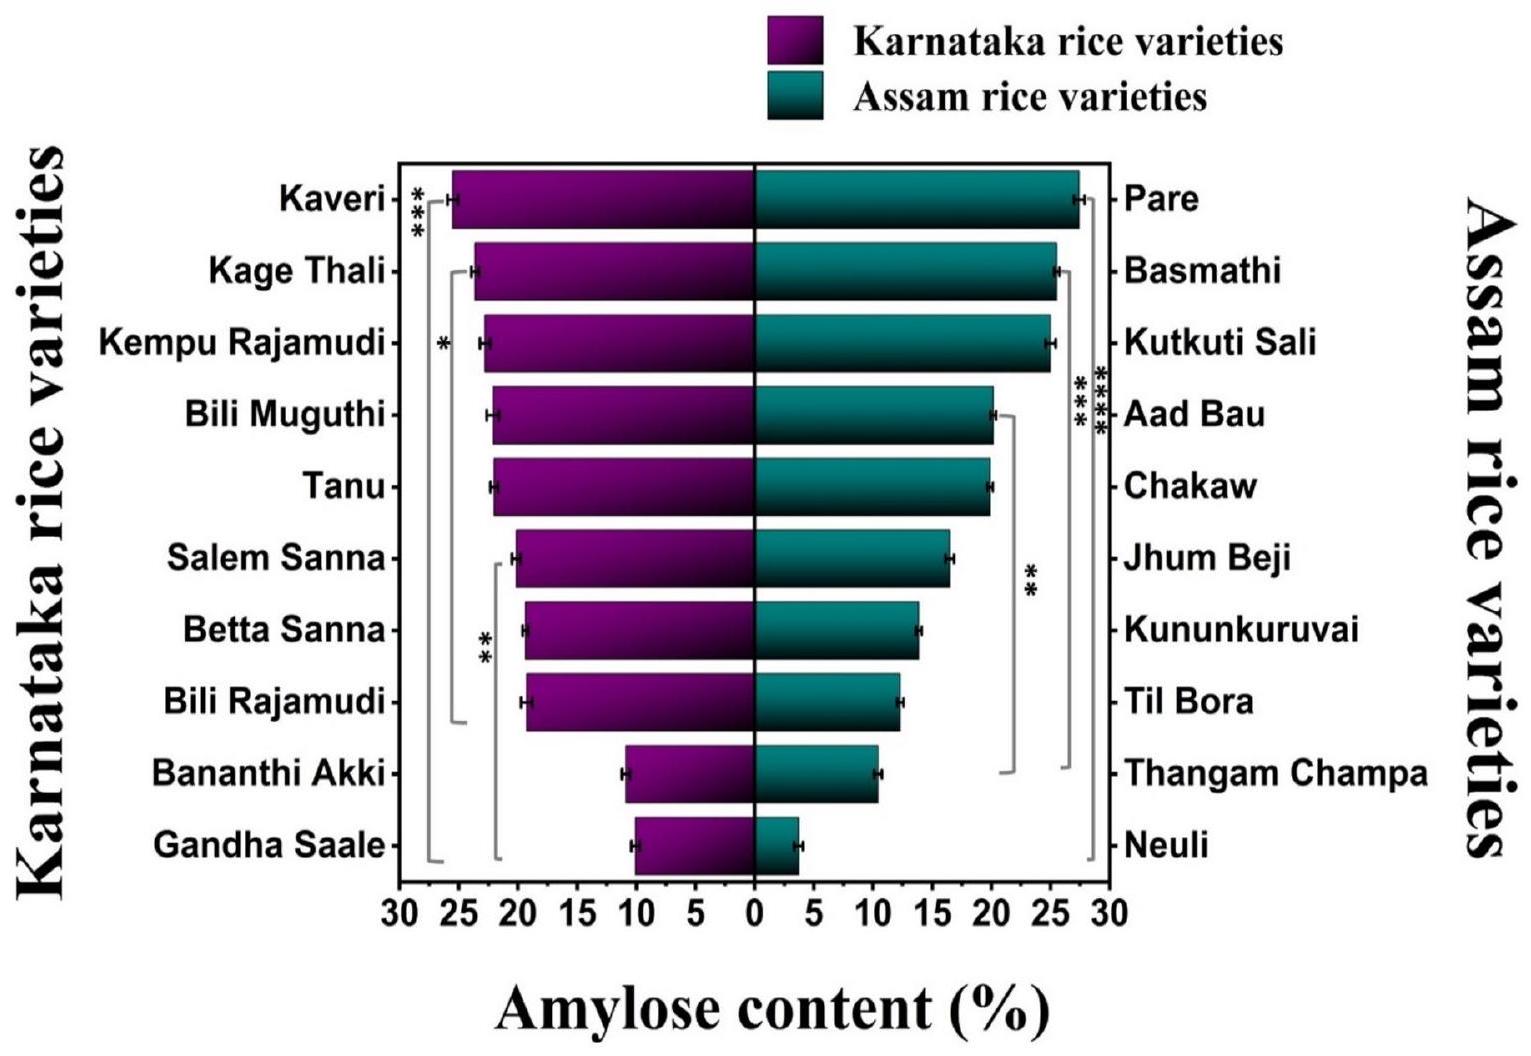
الشكل 4. رسم بياني أفقي يوضح محتوى الأميلوز لأصناف الأرز من كارناتاكا وآسام (
أصناف الأرز، مما يشير إلى أن سلاسل الأميلوز مسؤولة عن وجود RS في أصناف الأرز المختلفة. قد يكون هذا الاختلاف بسبب ترتيب سلاسل الأميلوز داخل حبيبات النشا. وجود المزيد من سلاسل الأميلوز يقلل من المساحة السطحية المتاحة للإنزيمات الهاضمة لهضم حبيبات النشا. ومع ذلك، نظرًا لأن الأميلوبكتين متفرع إلى حد كبير، فإنه يوفر مساحة سطح أكبر ويجعل حبيبات النشا أقل مقاومة للهضم. الحاجز الرئيسي لوصول الأميلاز هو الهيكل الحلزوني المفرد للأميلوز. بالإضافة إلى ذلك، فإن الإطار الملتوي بإحكام للأميلوز يحمي الروابط الهيدروجينية الداخلية للنشا، مما يمنع اختراق الأميلاز
تحديد المؤشرات الجلايسيمية في المختبر لأصناف الأرز
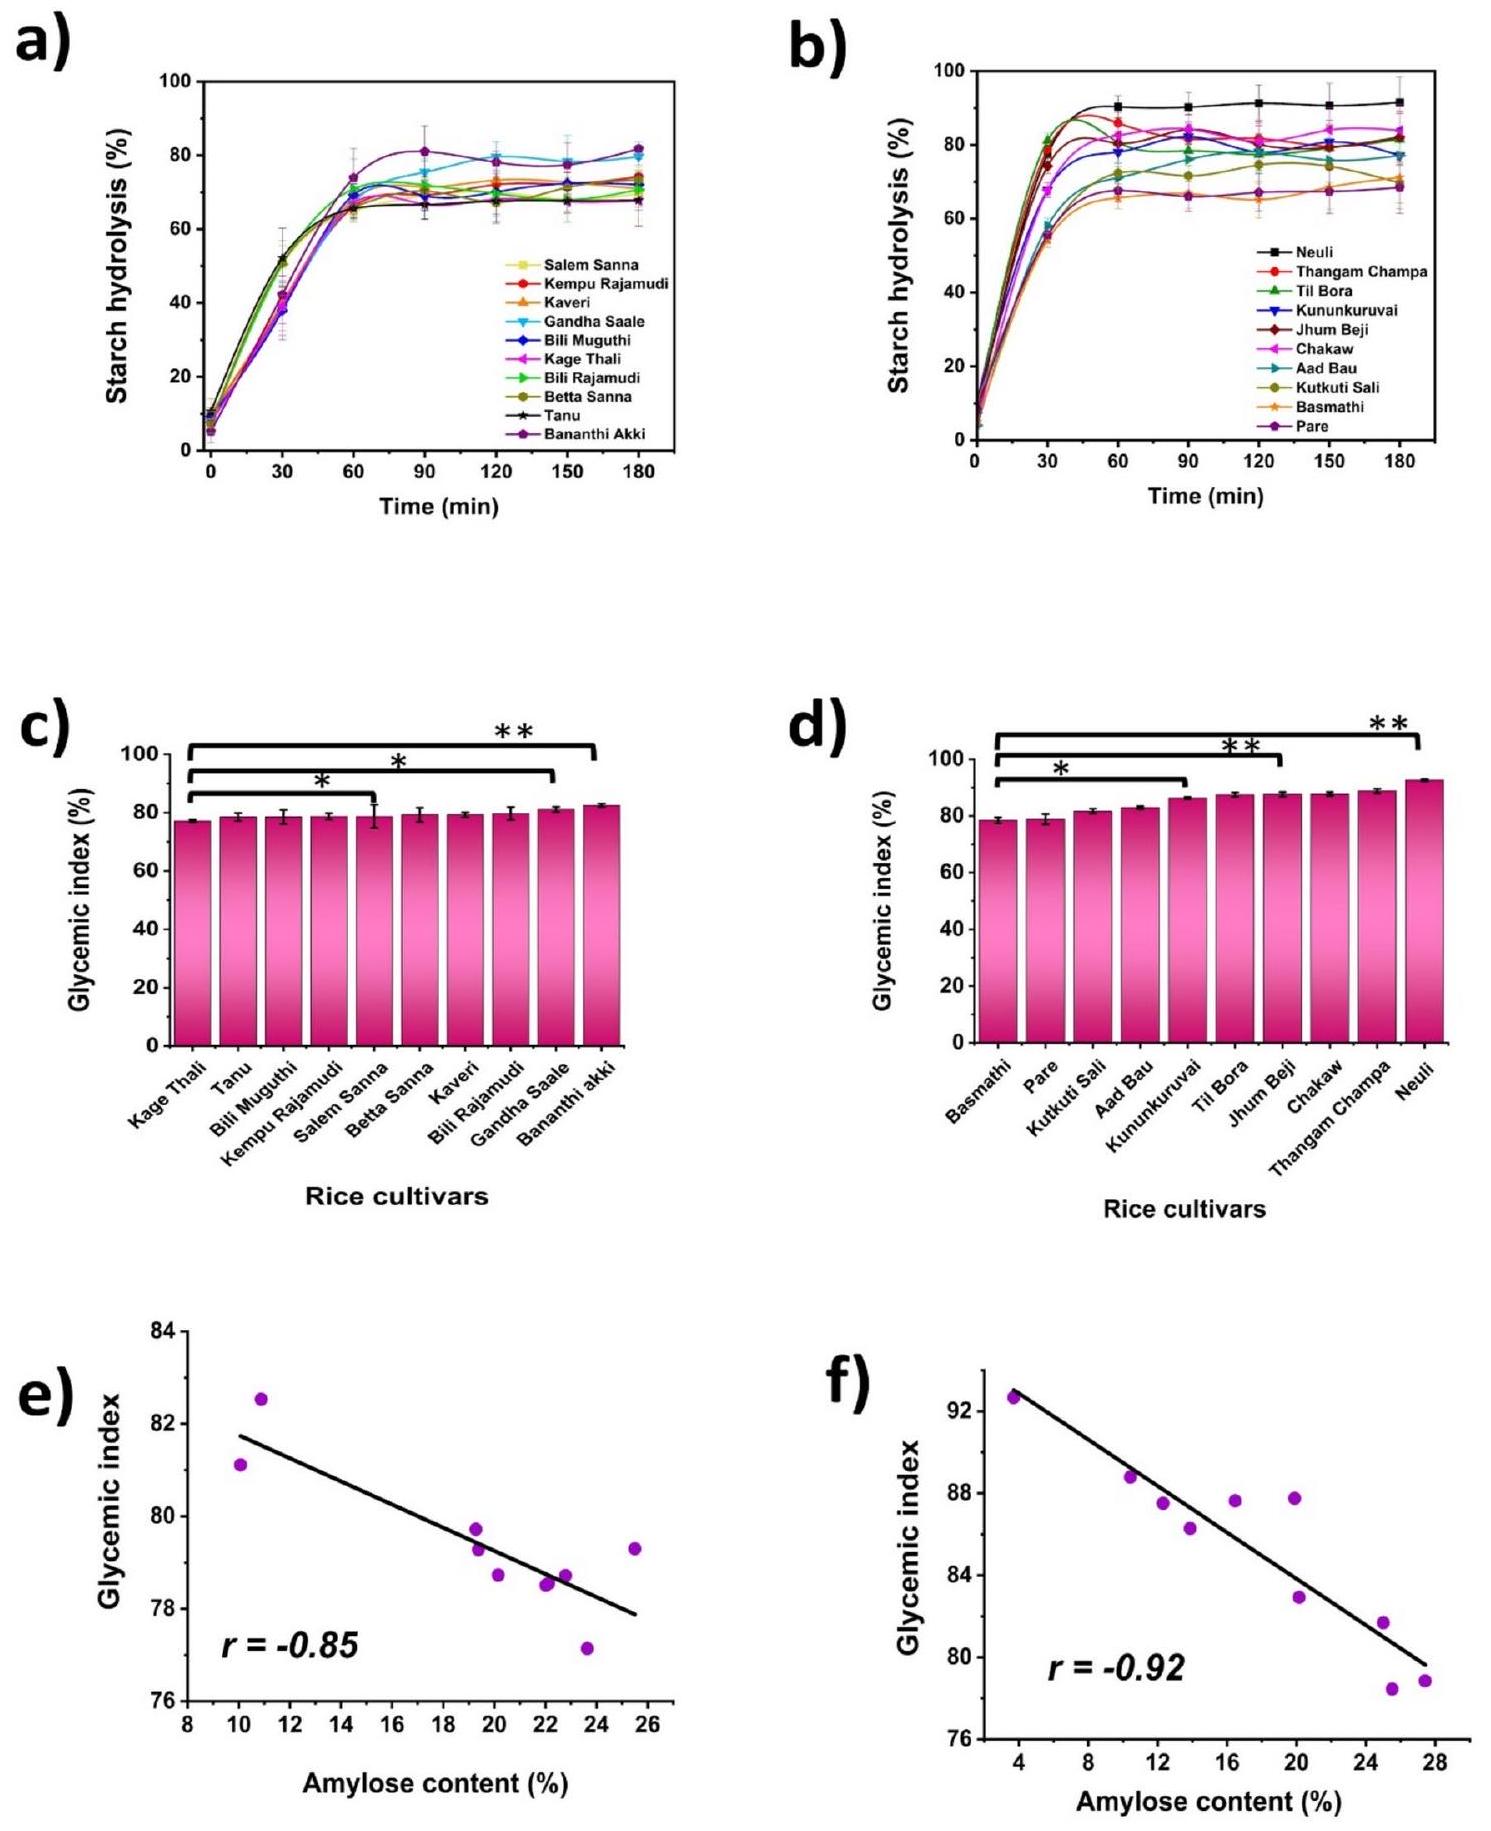
بين أصناف الأرز من كارناتاكا، كان لدى بانانثي آكي (
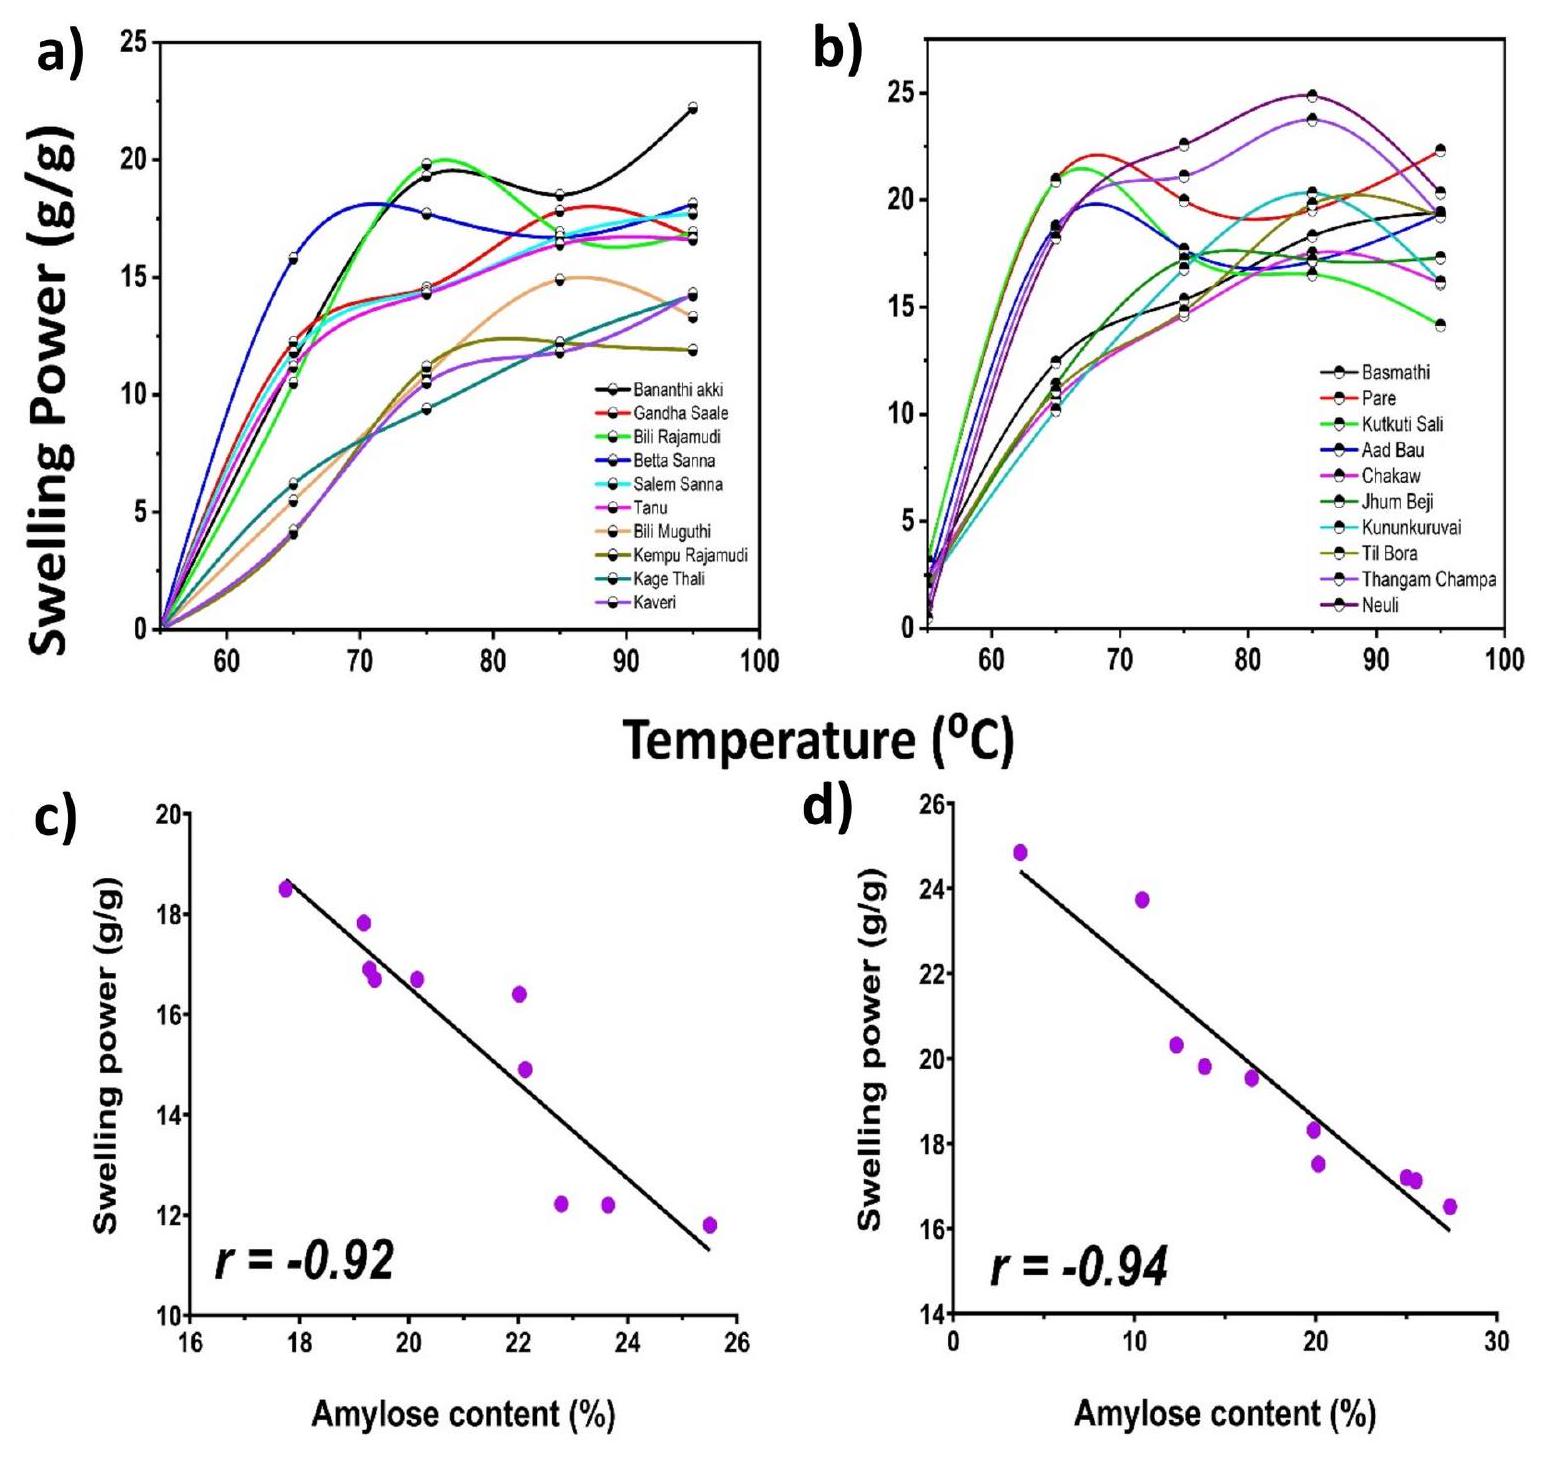
الشكل 5. رسم بياني يوضح قدرة الانتفاخ لـ (أ) أصناف الأرز من كارناتاكا؛ (ب) أصناف الأرز من آسام العلاقة بين قدرة الانتفاخ ومحتوى الأميلوز لـ (ج) أصناف الأرز من كارناتاكا؛ (د) أصناف الأرز من آسام.
في
تحليل إحصائي
كشف تحليل ارتباط بيرسون عن وجود ارتباط سلبي بين محتوى الأميلوز، محتوى النشا المقاوم، ومؤشر نسبة السكر في أصناف الأرز. كانت معاملات ارتباط بيرسون
الشكل 6. رسم بياني يوضح إجمالي النشا والنشا المقاوم لـ (أ) أصناف الأرز من كارناتاكا؛ (ب) أصناف الأرز من آسام العلاقة بين النشا المقاوم ومحتوى الأميلوز لـ (ج) أصناف الأرز من كارناتاكا؛ (د) أصناف الأرز من آسام.
استنتاج
في دراستنا، بحثنا في العوامل التي تؤثر على قابلية هضم أصناف الأرز الهندي من أصل كارناتاكا وآسام. من خلال تجارب الهضم في المختبر، قمنا بفحص الاختلافات في معدلات وأنماط الهضم بين أصناف الأرز. تسلط هذه النتائج الضوء على قدرتها على زيادة مستوى السكر في الدم بعد الوجبة، وبالتالي، يتم تصنيف جميع أصناف الأرز على أنها أصناف أرز ذات مؤشر سكر مرتفع. على الرغم من أن العينات التي تم النظر فيها في هذه الدراسة كانت من نفس المصدر النباتي (O. sativa indica)، إلا أن الخصائص المحددة لقابلية هضم الأرز، مثل النشا المقاوم، إجمالي النشا، وأهمها تحلل النشا، ومؤشر السكر، اختلفت بشكل كبير. تُعزى هذه الاختلافات بشكل رئيسي إلى طبيعة وحدات البناء من البوليسكاريد الموجودة في هذه الأصناف من الأرز، أي الأميلوز والأميلوبكتين من النشا. العامل الرئيسي المحدد لقابلية هضم الأرز هو الهيكل الجزيئي لمحتوى النشا، حيث يلعب نسبة الأميلوز إلى الأميلوبكتين دورًا حيويًا. على الرغم من أن جميع أصناف الأرز التي تم النظر فيها في دراستنا تم تصنيفها كأصناف أرز ذات مؤشر سكر مرتفع، فإن الاختلافات الطفيفة في قيم مؤشر السكر قد تكون بسبب اختلافات في طول سلسلة الأميلوبكتين، درجة البلمرة، البروتينات المرتبطة بالسطح، وتكوين مركبات الأميلوز-الدهون أثناء عملية الطهي. كشفت مخططات DSC عن اختلافات في معلمات الجيلاتينية، وأكدت النطاق الواسع من بداية، ذروة، نهاية، وحرارة الجيلاتينية الإطار الهيكلي المعدل للأميلوبكتين بين أصناف الأرز. قيد دراستنا هو أن الاختبارات في المختبر لا يمكن أن تعكس بدقة العمليات المعقدة لهضم الإنسان وامتصاصه. يمكن أن تؤثر عوامل مثل معدل إفراغ المعدة، نشاط الإنزيمات الهضمية، وامتصاص الجلوكوز في الأمعاء على مؤشر السكر للغذاء بطرق قد لا يتم التقاطها بدقة في نموذج في المختبر. بينما يمكن أن توفر اختبارات مؤشر السكر في المختبر معلومات مفيدة حول التأثير المحتمل لمؤشر السكر للأطعمة المختلفة، يجب تفسير النتائج بحذر بسبب القيود المحتملة للمنهجية. هناك حاجة إلى مزيد من البحث لتوحيد بروتوكولات اختبار مؤشر السكر في المختبر ولتفهم بشكل أفضل كيف ترتبط قيم مؤشر السكر في المختبر بقيم مؤشر السكر في الجسم واستجابات السكر الفعلية للمستهلكين البشر. تظهر نتائج دراستنا الخصائص الغذائية للأرز التقليدي الذي يستهلكه السكان المحليون في كارناتاكا وآسام، مما يساعد المستهلكين المهتمين بالصحة. علاوة على ذلك، فإن صنف الأرز الذي يتمتع بأفضل خصائص حبة هو الأكثر أهمية في التنبؤ بدرجة السوق وخصائص الاستخدام النهائي. وبالتالي، يمكن دمج أنواع الأرز التقليدية
الشكل 7. تمثيل بياني لديناميات الإنزيمات في المختبر تظهر تحلل النشا وقيم مؤشر السكر المقدرة لـ (أ) و (ج) أصناف الأرز من كارناتاكا، (ب) و (د) أصناف الأرز من آسام (
مع أصناف الأرز البيضاء لإنتاج أرز جديد ومنتجات غذائية قائمة على نشا الأرز مثل نودلز الأرز وكعك الأرز. ستساعد هذه المعلومات أيضًا في تحسين الرفاهية الغذائية للسكان المتزايدين في العالم ومكافحة الاضطرابات المرتبطة بنمط الحياة المتعلقة بتمثيل الكربوهيدرات الغذائية وستساعد في زيادة القدرة التنافسية للسوق العالمية وتعزيز زراعة أصناف الأرز التقليدية.
توفر البيانات
يعلن المؤلفون أن جميع البيانات التي تدعم نتائج هذه الدراسة متاحة ضمن الورقة. تتوفر بيانات إضافية تدعم نتائج هذه الدراسة من المؤلف المراسل عند الطلب.
تاريخ الاستلام: 11 سبتمبر 2024؛ تاريخ القبول: 6 يناير 2025
تم النشر عبر الإنترنت: 17 يناير 2025
تم النشر عبر الإنترنت: 17 يناير 2025
References
- Muthayya, S., Sugimoto, J. D., Montgomery, S. & Maberly, G. F. An overview of global rice production, supply, trade, and consumption. Ann. N. Y. Acad. Sci. 1324(1), 7-14. https://doi.org/10.1111/nyas. 12540 (2014).
- Harishnaika, N., Shilpa, N. & Ahmed, S. A. Detection of spatiotemporal patterns of rainfall trends, using non-parametric statistical techniques, in Karnataka state, India. Environ. Monit. Assess. 195(7), 909. https://doi.org/10.1007/s10661-023-11466-5 (2023).
- Deka, R. L., Mahanta, C., Pathak, H., Nath, K. K. & Das, S. Trends and fluctuations of rainfall regime in the Brahmaputra and Barak basins of Assam, India. Theor. Appl. Climatol. 114(1-2), 61-71. https://doi.org/10.1007/s00704-012-0820-x (2013).
- Bhat, S. S. & Rajanna, L. Plant diversity studies and role of halakki community in agroforestry homegardens of Uttara Kannada District, Karnataka, India. CRDEEP J. Int. J. Life Sci. Bhat & Rajanna 5(2), 54 (2015).
- Kk, A. Millets: Nutritional importance, health benefits, and bioavailability: A review. Energy 12(8), 223-227 (2023).
- Lal, M. K., Singh, B., Sharma, S., Singh, M. P. & Kumar, A. Glycemic index of starchy crops and factors affecting its digestibility: A review. Trends Food Sci. Technol. 111, 741-755. https://doi.org/10.1016/j.tifs.2021.02.067 (2021).
- Singh, M., Manickavasagan, A., Shobana, S. & Mohan, V. Glycemic index of pulses and pulse-based products: A review. Crit. Rev. Food Sci. Nutr. 61(9), 1567-1588. https://doi.org/10.1080/10408398.2020.1762162 (2021).
- Gayin, J. et al. Physical, cooking and thermal properties of African rice (Oryza glaberrima) and its starch digestibility in vitro. LWT 75, 481-487. https://doi.org/10.1016/j.lwt.2016.09.023 (2017).
- Mohapatra, D. & Bal, S. Cooking quality and instrumental textural attributes of cooked rice for different milling fractions. J. Food Eng. 73(3), 253-259. https://doi.org/10.1016/j.jfoodeng.2005.01.028 (2006).
- Lahkar, L. & Tanti, B. Morpho-physicochemical and cooking characteristics of traditional aromatic Joha rice (Oryza sativa L.) of Assam, India. Biocatal. Agric. Biotechnol. 16, 644-654. https://doi.org/10.1016/j.bcab.2018.10.001 (2018).
- Govindaraju, I. et al. Investigation of structural and physico-chemical properties of rice starch with varied amylose content: A combined microscopy, spectroscopy, and thermal study. Food Hydrocoll. 122, 107093. https://doi.org/10.1016/j.foodhyd.2021.107 093 (2022).
- Juliano, B. O. et al. International cooperative testing on the amylose content of milled rice. Starch – Stärke 33(5), 157-162. https:// doi.org/10.1002/star. 19810330504 (1981).
- He, M., Qiu, C., Liao, Z., Sui, Z. & Corke, H. Impact of cooking conditions on the properties of rice: Combined temperature and cooking time. Int. J. Biol. Macromol. 117, 87-94. https://doi.org/10.1016/j.ijbiomac.2018.05.139 (2018).
- Goñi, I., Garcia-Alonso, A. & Saura-Calixto, F. A starch hydrolysis procedure to estimate glycemic index. Nutr. Res. 17(3), 427-437. https://doi.org/10.1016/S0271-5317(97)00010-9 (1997).
- Corales, M., Nguyen, N. T. A., Abiko, T. & Mochizuki, T. Mapping quantitative trait loci for water uptake of rice under aerobic conditions. Plant Prod. Sci. 23(4), 436-451. https://doi.org/10.1080/1343943X.2020.1766361 (2020).
- Bhat, F. M. & Riar, C. S. Cultivars effect on the physical characteristics of rice (rough and milled) (Oryza Sativa L.) of temperate region of Kashmir (India). J. Food Sci. Technol. 53(12), 4258-4269. https://doi.org/10.1007/s13197-016-2420-8 (2016).
- Duchenne-Moutien, R. A. & Neetoo, H. Climate change and emerging food safety issues: A review. J. Food Prot. 84(11), 18841897. https://doi.org/10.4315/JFP-21-141 (2021).
- Ding, Y. et al. Effects of endogenous proteins and lipids on structural, thermal, rheological, and pasting properties and digestibility of adlay seed (Coix lacryma-jobi L.) starch. Food Hydrocoll. 111, 106254. https://doi.org/10.1016/j.foodhyd.2020.106254 (2021).
- Ma, M., Zhu, H., Liu, Z., Sui, Z. & Corke, H. Removal of starch granule-associated proteins alters the physicochemical properties of diverse small granule starches. Food Hydrocoll. 124, 107318. https://doi.org/10.1016/j.foodhyd.2021.107318 (2022).
- Vamadevan, V. & Bertoft, E. Observations on the impact of amylopectin and amylose structure on the swelling of starch granules. Food Hydrocoll. 103, 105663. https://doi.org/10.1016/j.foodhyd. 2020.105663 (2020).
- Farooq, M. A. et al. Investigating the structural properties and in vitro digestion of rice flours. Food Sci. Nutr. 9(5), 2668-2675. https://doi.org/10.1002/fsn3.2225 (2021).
- Zhao, Y., Dai, X., Mackon, E., Ma, Y. & Liu, P. Impacts of protein from high-protein rice on gelatinization and retrogradation properties in high- and low-amylose reconstituted rice flour. Agronomy 12(6), 1431. https://doi.org/10.3390/agronomy12061431 (2022).
- Chen, H. et al. Effects of nitrogen and phosphorus fertilizer on the eating quality of indica rice with different amylose content.
. Food Compos. Anal. 118, 105167. https://doi.org/10.1016/j.jfca.2023.105167 (2023). - Duan, H., Tong, H., Zhu, A., Zhang, H. & Liu, L. Effects of heat, drought and their combined effects on morphological structure and physicochemical properties of rice (Oryza sativa L.) starch. J. Cereal Sci. 95, 103059. https://doi.org/10.1016/j.jcs.2020.103059 (2020).
- Fan, X. et al. The interaction between amylose and amylopectin synthesis in rice endosperm grown at high temperature. Food Chem. 301, 125258. https://doi.org/10.1016/j.foodchem.2019.125258 (2019).
- Okpala, N. E. et al. Low temperature increased the biosynthesis of 2-AP, cooked rice elongation percentage and amylose content percentage in rice. J. Cereal Sci. 93, 102980. https://doi.org/10.1016/j.jcs.2020.102980 (2020).
- Prathap, V. et al. Starch accumulation in rice grains subjected to drought during grain filling stage. Plant Physiol. Biochem. 142, 440-451. https://doi.org/10.1016/j.plaphy.2019.07.027 (2019).
- Zhu, F. Relationships between amylopectin internal molecular structure and physicochemical properties of starch. Trends Food Sci. Technol. 78, 234-242. https://doi.org/10.1016/j.tifs.2018.05.024 (2018).
- Li, G. & Zhu, F. Physicochemical properties of quinoa flour as affected by starch interactions. Food Chem. 221, 1560-1568. https:/ /doi.org/10.1016/j.foodchem.2016.10.137 (2017).
- Zhang, G., Ao, Z. & Hamaker, B. R. Slow digestion property of native cereal starches. Biomacromolecules 7(11), 3252-3258. https:/ /doi.org/10.1021/bm060342i (2006).
- Berry, C. S. Resistant starch: Formation and measurement of starch that survives exhaustive digestion with amylolytic enzymes during the determination of dietary fibre. J. Cereal Sci. 4(4), 301-314. https://doi.org/10.1016/S0733-5210(86)80034-0 (1986).
- Englyst, H. N., Kingman, S. M., Hudson, G. J. & Cummings, J. H. Measurement of resistant starch in vitro and in vivo. Br. J. Nutr. 75(5), 749-755. https://doi.org/10.1079/BJN19960178 (1996).
- Tovar, J., Bjoerck, I. M. & Asp, N. G. Starch content and. alpha.-amylolysis rate in precooked legume flours. J. Agric. Food Chem. 38(9), 1818-1823. https://doi.org/10.1021/jf00099a007 (1990).
- Fonseca, L. M., El Halal, S. L. M., Dias, A. R. G. & da Zavareze, E. R. Physical modification of starch by heat-moisture treatment and annealing and their applications: A review. Carbohydr. Polym. 274, 118665. https://doi.org/10.1016/j.carbpol.2021.118665 (2021).
- Atkinson, F. S., Brand-Miller, J. C., Foster-Powell, K., Buyken, A. E. & Goletzke, J. International tables of glycemic index and glycemic load values 2021: A systematic review. Am. J. Clin. Nutr. 114(5), 1625-1632. https://doi.org/10.1093/ajcn/nqab233 (2021).
- Edwards, C. H., Cochetel, N., Setterfield, L., Perez-Moral, N. & Warren, F. J. A single-enzyme system for starch digestibility screening and its relevance to understanding and predicting the glycaemic index of food products. Food Funct. 10(8), 4751-4760. https://doi.org/10.1039/C9FO00603F (2019).
- Tian, Y. et al. Interfacial catalysis during amylolytic degradation of starch granules: Current understanding and kinetic approaches. Molecules 28(9), 3799. https://doi.org/10.3390/molecules28093799 (2023).
- Van Hung, P., Chau, H. T. & Phi, N. T. L. In vitro digestibility and in vivo glucose response of native and physically modified rice starches varying amylose contents. Food Chem. 191, 74-80. https://doi.org/10.1016/j.foodchem.2015.02.118 (2016).
- Dhital, S., Butardo, V. M., Jobling, S. A. & Gidley, M. J. Rice starch granule amylolysis-Differentiating effects of particle size, morphology, thermal properties and crystalline polymorph. Carbohyd. Polym. 115, 305-316. https://doi.org/10.1016/j.carbpol. 20 14.08.091 (2015).
- Bao, J., Zhou, X., Xu, F., He, Q. & Park, Y. Genome-wide association study of the resistant starch content in rice grains. Starch Stärke https://doi.org/10.1002/star.201600343 (2017).
- Kumar, A. et al. Effect of Drought stress on Resistant starch content and Glycemic index of rice ( Oryza sativa L.). Starch – Stärke 72(11-12), 1900229. https://doi.org/10.1002/star. 201900229 (2020).
- Yamakawa, H., Hirose, T., Kuroda, M. & Yamaguchi, T. Comprehensive expression profiling of rice grain filling-related genes under high temperature using DNA microarray. Plant Physiol. 144(1), 258-277. https://doi.org/10.1104/pp.107.098665 (2007).
- Lu, X., Ma, R., Qiu, H., Sun, C. & Tian, Y. Mechanism of effect of endogenous/exogenous rice protein and its hydrolysates on rice starch digestibility. Int. J. Biol. Macromol. 193, 311-318. https://doi.org/10.1016/j.ijbiomac.2021.10.140 (2021).
- Qadir, N. & Wani, I. A. Functional properties, antioxidant activity and in-vitro digestibility characteristics of brown and polished rice flours of Indian temperate region. Grain Oil Sci. Technol. 6(1), 43-57. https://doi.org/10.1016/j.gaost.2022.12.001 (2023).
- Sahoo, B. et al. Rice starch phase transition and detection during resistant starch formation. Food Rev. Int. 40(1), 158-184. https:// doi.org/10.1080/87559129.2022.2163498 (2024).
- Fan, D. et al. Determination of structural changes in microwaved rice starch using Fourier transform infrared and Raman spectroscopy. Starch – Stärke 64(8), 598-606. https://doi.org/10.1002/star. 201100200 (2012).
- Yao, Y., Zhang, J. & Ding, X. Structure-retrogradation relationship of rice starch in purified starches and cooked rice grains: A statistical investigation. J. Agric. Food Chem. 50(25), 7420-7425. https://doi.org/10.1021/jf020643t (2002).
- Dogan, A., Siyakus, G. & Severcan, F. FTIR spectroscopic characterization of irradiated hazelnut (Corylus avellana L.). Food Chem.
- Khatoon, S., Sreerama, Y. N., Raghavendra, D., Bhattacharya, S. & Bhat, K. K. Properties of enzyme modified corn, rice and tapioca starches. Food Res. Int. 42(10), 1426-1433. https://doi.org/10.1016/j.foodres.2009.07.025 (2009).
- Ma, Z. et al. Structural characterization of resistant starch isolated from Laird lentils (Lens culinaris) seeds subjected to different processing treatments. Food Chem. 263, 163-170. https://doi.org/10.1016/j.foodchem.2018.04.122 (2018).
- Hoover, R. Starch retrogradation. Food Rev. Int. 11(2), 331-346. https://doi.org/10.1080/87559129509541044 (1995).
- Kačuráková, M. & Mathlouthi, M. FTIR and laser-Raman spectra of oligosaccharides in water: Characterization of the glycosidic bond. Carbohydr. Res. 284(2), 145-157. https://doi.org/10.1016/0008-6215(95)00412-2 (1996).
- Matmin, J., Affendi, I., Ibrahim, S. & Endud, S. Additive-free rice starch-assisted synthesis of spherical nanostructured hematite for degradation of dye contaminant. Nanomaterials 8(9), 702. https://doi.org/10.3390/nano8090702 (2018).
الشكر والتقدير
نشكر أيضًا مدرسة مانيبال لعلوم الحياة، أكاديمية مانيبال للتعليم العالي، مانيبال، كارناتاكا، الهند على توفير البنية التحتية والمرافق.
مساهمات المؤلفين
IG: التصور، التجريب، تمثيل البيانات، كتابة المسودة الأصلية ARD: التجريب، تمثيل البيانات IC: التجريب، تنسيق البيانات BS & VJB: جمع العينات SSM: التجريب NM: إدارة المشروع، المراجعة والتحرير، الإشراف، الحصول على التمويل.
التمويل
تم توفير تمويل الوصول المفتوح من قبل أكاديمية مانيبال للتعليم العالي، مانيبال. نشكر بصدق المجلس الهندي للبحوث الطبية (ICMR)، حكومة الهند، الهند على منحة زمالة البحث العليا (SRF) أمر الموافقة رقم 3/1/2/297/2021-Nut. نشكر قسم التكنولوجيا الحيوية (DBT)، حكومة الهند، الهند (رقم المنحة BT/PR25099/NER/95/1014/2017) على الدعم المالي.
الإعلانات
المصالح المتنافسة
يعلن المؤلفون عدم وجود مصالح متنافسة.
معلومات إضافية
يجب توجيه المراسلات والطلبات للحصول على المواد إلى N.M.
معلومات إعادة الطبع والتصاريح متاحة علىwww.nature.com/reprints.
ملاحظة الناشر تظل Springer Nature محايدة فيما يتعلق بالمطالبات القضائية في الخرائط المنشورة والانتماءات المؤسسية.
معلومات إعادة الطبع والتصاريح متاحة علىwww.nature.com/reprints.
ملاحظة الناشر تظل Springer Nature محايدة فيما يتعلق بالمطالبات القضائية في الخرائط المنشورة والانتماءات المؤسسية.
الوصول المفتوح. هذه المقالة مرخصة بموجب رخصة المشاع الإبداعي النسب 4.0 الدولية، التي تسمح بالاستخدام والمشاركة والتكيف والتوزيع وإعادة الإنتاج بأي وسيلة أو صيغة، طالما أنك تعطي الائتمان المناسب للمؤلفين الأصليين والمصدر، وتوفر رابطًا لرخصة المشاع الإبداعي، وتوضح ما إذا تم إجراء تغييرات. الصور أو المواد الأخرى من طرف ثالث في هذه المقالة مشمولة في رخصة المشاع الإبداعي الخاصة بالمقالة، ما لم يُشار إلى خلاف ذلك في سطر الائتمان للمواد. إذا لم تكن المادة مشمولة في رخصة المشاع الإبداعي الخاصة بالمقالة وكان استخدامك المقصود غير مسموح به بموجب اللوائح القانونية أو يتجاوز الاستخدام المسموح به، فستحتاج إلى الحصول على إذن مباشرة من صاحب حقوق الطبع والنشر. لعرض نسخة من هذه الرخصة، قم بزيارة http://creativecommons.org/licenses/by/4.0/.
© المؤلف(ون) 2025
© المؤلف(ون) 2025
قسم الفيزياء الحيوية، مدرسة مانيبال لعلوم الحياة، أكاديمية مانيبال للتعليم العالي، مانيبال، كارناتاكا 576104، الهند. مختبر المواد والتحفيز، قسم الكيمياء، المعهد الوطني للتكنولوجيا كارناتاكا، سوراثكال، كارناتاكا 575025، الهند. قسم تربية النباتات وعلم الوراثة، جامعة أسام الزراعية، جورهات، أسام 785001، الهند. مركز التكنولوجيا الحيوية والمعلوماتية الحيوية، جامعة ديبروجره، أسام 786004، الهند. البريد الإلكتروني: nirmal.mazumder@manipal.edu
Journal: Scientific Reports, Volume: 15, Issue: 1
DOI: https://doi.org/10.1038/s41598-025-85660-5
PMID: https://pubmed.ncbi.nlm.nih.gov/39824900
Publication Date: 2025-01-17
DOI: https://doi.org/10.1038/s41598-025-85660-5
PMID: https://pubmed.ncbi.nlm.nih.gov/39824900
Publication Date: 2025-01-17
OPEN
Investigation of the physicochemical factors affecting the in vitro digestion and glycemic indices of indigenous indica rice cultivars
Rice (Oryza sativa) is a vital food crop and staple diet for most of the world’s population. Poor dietary choices have had a significant role in the development of type-2 diabetes in the population that relies on rice and rice-starch-based foods. Hence, our study investigated the in vitro digestion and glycemic indices of certain indigenous rice cultivars and the factors influencing these indices. Cooking properties of rice cultivars were estimated. Further, biochemical investgations such as amylose content, resistant starch content were estimated using iodine-blue complex method and megazyme kit respectively. The in vitro glycemic index was estimated using GOPOD method. The rice cultivars considered in our study were classified into low-, intermediate-, and high-amylose rice varieties. The rice cultivars were subjected to physicochemical characterization by using Fourier transform infrared (FTIR) spectroscopy and differential scanning calorimetry (DSC) techniques. FTIR spectral analysis revealed prominent bands at 3550-3200, 2927-2935, 1628-1650, 1420-1330, and 1300-1000 cm-1 which correspond to -OH groups,
Keywords In vitro digestion, Glycemic index, Amylose content, Resistant starch, Swelling power, Water uptake, Cooking qualities
Rice (Oryza sativa) is one of the world’s most important food crops, and it is a staple diet for almost half of the world’s population. Rice production and consumption are the highest among the Asian population, especially among Indians
(
Materials and methods
Sample collection
The rice cultivars were collected from the local farmers of Karnataka (Bananthi akki, Gandha Saale, Bili Rajamudi, Betta Sanna, Salem Sanna, Tanu, Bili Muguthi, Kempu Rajamudi, Kage Thali, Kaveri) and Assam (Neuli, Thangam Champa, Til Bora, Kununkuruvai, Jhum Beji, Chakaw, Aad Bau, Kutkuti Sali, Basmathi, Pare) regions of India. The samples were dehusked to obtain rice grains. A 10 g of rice grains were finely ground using a mixer ( 750 Watts, Prestige Delight, India) and sieved through through a
Physical characteristics of the rice grains
The phenotypical characteristics of dehusked rice grains are characterized. The physical parameters, such as the length, width, and thickness of the rice grains, were measured using digital Vernier calipers.
Determination of cooking time, water uptake ratio, grain elongation ratio, and volume expansion ratio
Cooking time
The cooking time was estimated by the open vessel cooking method. Rice kernels ( 5 g ) were cooked in 100 mL of distilled water. Meanwhile, a countdown clock was started. For every 5 min , a few rice kernels were removed from the cooking vessel and sandwiched between glass slides to check for the absence of white cores in the rice
kernels to ensure complete cooking. The countdown clock is stopped once the cooking is completed, and the final time is recorded as the established cooking time
kernels to ensure complete cooking. The countdown clock is stopped once the cooking is completed, and the final time is recorded as the established cooking time
Water uptake (WU)
The minimum quantity of water taken by rice kernels during the process of cooking is referred to as water uptake. Two grams of rice was weighed and cooked in 10 mL of water until the rice was completely cooked. Individual rice kernels were removed and sandwiched between glass slides so that there was no white core, which ensures complete cooking. The cooked rice was then drained, and the excess water was measured. The amount of water absorbed is calculated by subtracting the amount of drained water from the amount of initial water added. Then, the water uptake of the different rice cultivars was expressed as 100 g of rice
Grain elongation ratio (ER) and volume expansion ratio (VER)
The initial grain length (L0) was measured using digital Vernier calipers before cooking, and the final grain length (L1) was recorded after cooking
Fourier transform infrared (FTIR) spectroscopy of the rice varieties
FTIR spectroscopy was used to examine alterations in the chemical composition of rice flour from different varieties of rice. The rice flour samples were blended with KBr and mounted onto a potassium bromide
Differential scanning calorimetry (DSC) of rice varieties
The gelatinization parameters were determined using a differential scanning calorimeter (Shimadzu’s DSC60). The sample preparation was performed by coating approximately
Determination of amylose content in the rice varieties
To determine the amylose content of the starch granules, 100 mg of rice flour was weighed into a 100 mL volumetric flask, and 1 mL of
Determination of the swelling power of the rice varieties
One gram of rice flour was weighed and transferred to 40 mL of distilled water. The mixture was incubated in a water bath at different temperatures ranging from 55 to
Determination of resistant starch (RS) and total starch (TS)
The RS content of the rice samples was estimated using a megazyme RS assay kit (Megazyme International Ireland Ltd., Bray, Ireland) according to the manufacturer’s protocol. One hundred milligrams of rice flour was digested with 4 mL of pancreatic
Determination of the in vitro glycemic index (GI) of the rice varieties
The estimated GI of the rice varieties was determined according to the method described by Goñi et al.
The kinetics of starch hydrolysis followed pseudo-first-order kinetics
Statistical analysis
The mean and standard deviation of triplicate data from the experiments were calculated using Microsoft Excel 2019. Analysis of variance was calculated using GraphPad Prism 8.0.2 by applying Tukey’s test to determine the statistical significance of the values obtained. The results with
Results and discussion
Phenotypic characterization and determination of cooking parameters
Basmathi had the greatest elongation ratio (
Fourier transform infrared (FTIR) spectroscopy of the rice cultivars
The FTIR spectra of the Karnataka and Assam rice cultivars revealed multiple chemical bonds that are structurally positioned in the molecule. We scanned rice flours in the range of
Fig. 1. Graphical representation of the cooking parameters of (a) Karnataka (b) Assam rice cultivars, and (c) Bar graph showing the water uptake of rice cultivars (
at
Fig. 2. FTIR spectra of (a) & (c) Karnataka; (b) & (d) Assam rice cultivars; (c) & (d) fingerprint region of the FTIR spectra of the Karnataka and Assam rice cultivars, respectively.
| Wavenumber (
|
Band assignments | Prediction | References | |||||
| 3550-3200
|
Stretching vibration of O-H | Polysaccharides | 43 | |||||
| 2927-2935
|
|
Mainly unsaturated lipids and a small contribution from proteins, carbohydrates, nucleic acids | 44 | |||||
|
|
|
|
44,45 | |||||
|
|
|
Cis distributed alkenes | 46,47 | |||||
|
|
|
Lipids and proteins Presence of glycosidic linkages | 48,46,47 | |||||
|
|
|
Starch | 49 | |||||
|
|
|
Polymer chain | 46 | |||||
| 1048 | Characteristic band of crystalline region of starch | Amylopectin chains | 50 | |||||
|
|
Characteristic to region amorphous,
|
Amylose chains | 51,50 | |||||
| 930 | Skeletal mode vibrations of
|
Presence of strong glycosidic linkages and indicates the hydrophilicity of starch | 52,47 | |||||
|
|
Fingerprint region | Glucopyranose ring of starch | 53 |
Table 1. Table showing FTIR band assignments for the rice cultivars: b-broad, w-weak, s-strong, m-medium.
among different rice cultivars indicate differences in water absorption capacity, swelling behavior, and moisture retention. Furthermore, the skeletal mode vibrations of the
Differential scanning calorimetry (DSC) of starch granules
The thermal properties of the rice flour were determined using DSC. The onset (
Determination of amylose content in the rice varieties
The amylose content is an important parameter that determines the cooking and eating qualities of rice. The amylose content also determines the suitability of starch for industrial use. The amylose contents of the rice cultivars considered in this study significantly differed (
| Karnataka rice cultivars | Assam Rice cultivars | ||
| Name of the rice cultivars | R 1047/1022 | Name of the rice cultivars | R 1047/1022 |
| Bananthi akki | 1.01 | Til bora | 1.00 |
| Bili muguthi | 1.18 | Basmathi | 1.28 |
| Betta sanna | 1.10 | kunkuruvai | 1.10 |
| Gandha Sale | 1.00 | Neuli | 1.12 |
| Kaveri | 1.25 | Jhum beji | 1.14 |
| Kempu Rajamudi | 1.00 | Aad bau | 1.05 |
| Kage Thali | 1.15 | Chakaw | 1.10 |
| Salem Sanna | 1.23 | Pare | 1.20 |
| Tanu | 1.01 | Thangam Champa | 1.02 |
| Bili rajamudi | 1.02 | Kutkuti sali | 1.19 |
Table 2. Table showing R1047/1022 for different indica rice cultivars:
Fig. 3. DSC thermograms depicting the peak gelatinization temperatures of (a) Karnataka and (b) Assam rice cultivars.
Since some of the enzymes responsible for starch biosynthesis are heat labile, atmospheric temperatures greater than or less than optimal can have a significant impact on their function during starch synthesis at the molecular level, i.e., the formation of amylose and amylopectin chains and their branching
Determination of the swelling power of the rice varieties
The swelling power is the ratio of wet sediment from rice flour to dry sediment. It determines the water holding capacity of rice flour and hence determines its applicability in various food industries. The swelling power of the rice starches ranged from 12.42 to
| Sl. No | Rice varieties | AUC | HI | GI |
|
k ( min
|
| Assam rice cultivars | ||||||
| 1 | Neuli | 485.62 |
|
|
|
|
| 2 | Thangam Champa | 450.05 |
|
|
|
|
| 3 | Til Bora | 438.28 |
|
|
|
|
| 4 | Kununkuruvai | 427.13 |
|
|
|
|
| 5 | Jhum Beji | 439.37 |
|
|
|
|
| 6 | Chakaw | 440.43 |
|
|
|
|
| 7 | Aad Bau | 396.3 |
|
|
|
|
| 8 | Kutkuti Sali | 384.91 |
|
|
|
|
| 9 | Basmathi | 355.18 |
|
|
|
|
| 10 | Pare | 358.88 |
|
|
|
|
| Karnataka rice cultivars | ||||||
| 1 | Bananthi akki | 392.63 |
|
|
|
|
| 2 | Gandha Saale | 379.59 |
|
|
|
|
| 3 | Bili Rajamudi | 366.83 |
|
|
|
|
| 4 | Betta Sanna | 362.85 |
|
|
|
|
| 5 | Salem Sanna | 357.79 |
|
|
|
|
| 6 | Tanu | 355.78 |
|
|
|
|
| 7 | Bili Muguthi | 356.14 |
|
|
|
|
| 8 | Kempu Rajamudi | 357.7 |
|
|
|
|
| 9 | Kage Thali | 343.155 |
|
|
|
|
| 10 | Kaveri | 362.98 |
|
|
|
|
| Fresh Bread | 503.37 |
|
|
|
|
|
Table 3. In vitro digestion kinetics parameters for different rice cultivars of Assam and Karnataka.
Champa rice varieties of Assam and the Bananthi Akki and Gandhasaale rice varieties of Karnataka showed greater swelling than the other rice cultivars. This could be due to their low amylose content. Additionally, both the Assam and Karnataka rice varieties with high amylose contents showed the least swelling. Furthermore, there was a strong negative correlation (
Determination of resistant starch (RS), nonresistant starch (NRS), and total starch (TS)
The rice varieties Karnataka and Assam showed a wide range of differences in their RS, NRS, and TS contents. In the case of the Karnataka rice variety, the highest RS value was obtained for Kaveri (
Fig. 4. Horizontal bar graph depicting the amylose content of the Karnataka and Assam rice cultivars (
rice cultivars, indicating that amylose chains are responsible for the presence of RS in different rice cultivars. This difference may be due to the arrangement of the amylose chains inside the starch granules. The presence of more amylose chains reduces the surface area available for the amylases to digest the starch granules. However, because amylopectin is largely branched, it provides a larger surface area and makes the starch granules least resistant to digestion. The primary barrier to amylase access is the single helix structure of amylose. Additionally, the tightly coiled amylose framework shields the internal hydrogen bonds of starch, preventing amylase penetration
Determination of the in vitro glycemic indices of the rice varieties
Among the Karnataka rice cultivars, Bananthi Akki (
Fig. 5. Graph depicting the swelling power of (a) Karnataka; (b) Assam rice cultivars relationship between swelling power and amylose content of (c) Karnataka; (d) Assam rice cultivars.
in
Statistical analysis
Pearson correlation analysis revealed a negative correlation among the amylose content, resistant starch content, and glycemic index of the rice cultivars. The Pearson correlation coefficients were
Fig. 6. Graph depicting the total starch and resistant starch of (a) Karnataka; (b) Assam rice cultivars relationship between resistant starch and amylose content of (c) Karnataka; (d) Assam rice cultivars.
Conclusion
In our study, we investigated the factors affecting the digestibility of Indica rice cultivars of Karnataka and Assam origin. Through in vitro digestion experiments, we examined the differences in digestion rates and patterns among the rice cultivars. This finding sheds light on their potential to increase postmeal blood sugar, and hence, all the rice cultivars are classified as high glycemic index rice cultivars. Although the samples considered in this study were from the same botanical source (O. sativa indica), the digestibility-determining characteristics of rice, such as resistant starch, total starch, most predominantly starch hydrolysis, and glycemic index, varied significantly. These variations are mainly attributed to the nature of the building blocks of polysaccharides present in these rice cultivars, i.e., the amylose and amylopectin of starch. The major determinant of rice digestibility is the molecular structure of the starch content, in which the ratio of amylose to amylopectin plays a vital role. Although all the rice varieties considered in our study were categorized as high-GI rice varieties, the slight variations in the GI values may be due to differences in the amylopectin chain length, degree of polymerization, surface-bound proteins, and formation of amylose-lipid complexes during the cooking process. DSC thermograms revealed variations in the gelatinization parameters, and the wide range of onset, peak, endset, and gelatinization enthalpies confirmed the altered structural framework of amylopectin among the rice cultivars. The limitation of our study is, In vitro tests cannot perfectly replicate the complex processes of human digestion and absorption. Factors such as the rate of gastric emptying, the activity of digestive enzymes, and the absorption of glucose in the intestines can all influence the GI of a food in ways that may not be accurately captured in an in vitro model. while in vitro GI testing can provide useful information about the potential glycemic impact of different foods, the results should be interpreted with caution due to the potential limitations of the methodology. Further research is needed to standardize in vitro GI testing protocols and to better understand how in vitro GI values relate to in vivo GI values and to the actual glycemic responses of human consumers. The findings of our study demonstrate the nutritional qualities of traditional rice consumed by the local populations of Karnataka and Assam, which is helpful for health-conscious consumers. Furthermore, the rice variety with the best grain characteristics is the most significant predictor of market grade and end use attributes. Thus, traditional rice types can be combined
Fig. 7. Graphical representation of in vitro enzymatic kinetics showing starch hydrolysis and estimated glycemic index values of (a) & (c) Karnataka, (b) & (d) Assam rice cultivars (
with white rice varieties to produce novel rice and rice starch-based food items such as rice noodles and rice cakes. This information will also aid in improving the nutritional well-being of the world’s growing population and combating lifestyle disorders associated with the metabolism of dietary carbohydrates and will aid in increasing the competitiveness of the global market and promoting the cultivation of traditional rice varieties.
Data availability
The authors declare that all the data supporting the findings of this study are available within the paper. Further data supporting the findings of this study are available from the corresponding author upon request.
Received: 11 September 2024; Accepted: 6 January 2025
Published online: 17 January 2025
Published online: 17 January 2025
References
- Muthayya, S., Sugimoto, J. D., Montgomery, S. & Maberly, G. F. An overview of global rice production, supply, trade, and consumption. Ann. N. Y. Acad. Sci. 1324(1), 7-14. https://doi.org/10.1111/nyas. 12540 (2014).
- Harishnaika, N., Shilpa, N. & Ahmed, S. A. Detection of spatiotemporal patterns of rainfall trends, using non-parametric statistical techniques, in Karnataka state, India. Environ. Monit. Assess. 195(7), 909. https://doi.org/10.1007/s10661-023-11466-5 (2023).
- Deka, R. L., Mahanta, C., Pathak, H., Nath, K. K. & Das, S. Trends and fluctuations of rainfall regime in the Brahmaputra and Barak basins of Assam, India. Theor. Appl. Climatol. 114(1-2), 61-71. https://doi.org/10.1007/s00704-012-0820-x (2013).
- Bhat, S. S. & Rajanna, L. Plant diversity studies and role of halakki community in agroforestry homegardens of Uttara Kannada District, Karnataka, India. CRDEEP J. Int. J. Life Sci. Bhat & Rajanna 5(2), 54 (2015).
- Kk, A. Millets: Nutritional importance, health benefits, and bioavailability: A review. Energy 12(8), 223-227 (2023).
- Lal, M. K., Singh, B., Sharma, S., Singh, M. P. & Kumar, A. Glycemic index of starchy crops and factors affecting its digestibility: A review. Trends Food Sci. Technol. 111, 741-755. https://doi.org/10.1016/j.tifs.2021.02.067 (2021).
- Singh, M., Manickavasagan, A., Shobana, S. & Mohan, V. Glycemic index of pulses and pulse-based products: A review. Crit. Rev. Food Sci. Nutr. 61(9), 1567-1588. https://doi.org/10.1080/10408398.2020.1762162 (2021).
- Gayin, J. et al. Physical, cooking and thermal properties of African rice (Oryza glaberrima) and its starch digestibility in vitro. LWT 75, 481-487. https://doi.org/10.1016/j.lwt.2016.09.023 (2017).
- Mohapatra, D. & Bal, S. Cooking quality and instrumental textural attributes of cooked rice for different milling fractions. J. Food Eng. 73(3), 253-259. https://doi.org/10.1016/j.jfoodeng.2005.01.028 (2006).
- Lahkar, L. & Tanti, B. Morpho-physicochemical and cooking characteristics of traditional aromatic Joha rice (Oryza sativa L.) of Assam, India. Biocatal. Agric. Biotechnol. 16, 644-654. https://doi.org/10.1016/j.bcab.2018.10.001 (2018).
- Govindaraju, I. et al. Investigation of structural and physico-chemical properties of rice starch with varied amylose content: A combined microscopy, spectroscopy, and thermal study. Food Hydrocoll. 122, 107093. https://doi.org/10.1016/j.foodhyd.2021.107 093 (2022).
- Juliano, B. O. et al. International cooperative testing on the amylose content of milled rice. Starch – Stärke 33(5), 157-162. https:// doi.org/10.1002/star. 19810330504 (1981).
- He, M., Qiu, C., Liao, Z., Sui, Z. & Corke, H. Impact of cooking conditions on the properties of rice: Combined temperature and cooking time. Int. J. Biol. Macromol. 117, 87-94. https://doi.org/10.1016/j.ijbiomac.2018.05.139 (2018).
- Goñi, I., Garcia-Alonso, A. & Saura-Calixto, F. A starch hydrolysis procedure to estimate glycemic index. Nutr. Res. 17(3), 427-437. https://doi.org/10.1016/S0271-5317(97)00010-9 (1997).
- Corales, M., Nguyen, N. T. A., Abiko, T. & Mochizuki, T. Mapping quantitative trait loci for water uptake of rice under aerobic conditions. Plant Prod. Sci. 23(4), 436-451. https://doi.org/10.1080/1343943X.2020.1766361 (2020).
- Bhat, F. M. & Riar, C. S. Cultivars effect on the physical characteristics of rice (rough and milled) (Oryza Sativa L.) of temperate region of Kashmir (India). J. Food Sci. Technol. 53(12), 4258-4269. https://doi.org/10.1007/s13197-016-2420-8 (2016).
- Duchenne-Moutien, R. A. & Neetoo, H. Climate change and emerging food safety issues: A review. J. Food Prot. 84(11), 18841897. https://doi.org/10.4315/JFP-21-141 (2021).
- Ding, Y. et al. Effects of endogenous proteins and lipids on structural, thermal, rheological, and pasting properties and digestibility of adlay seed (Coix lacryma-jobi L.) starch. Food Hydrocoll. 111, 106254. https://doi.org/10.1016/j.foodhyd.2020.106254 (2021).
- Ma, M., Zhu, H., Liu, Z., Sui, Z. & Corke, H. Removal of starch granule-associated proteins alters the physicochemical properties of diverse small granule starches. Food Hydrocoll. 124, 107318. https://doi.org/10.1016/j.foodhyd.2021.107318 (2022).
- Vamadevan, V. & Bertoft, E. Observations on the impact of amylopectin and amylose structure on the swelling of starch granules. Food Hydrocoll. 103, 105663. https://doi.org/10.1016/j.foodhyd. 2020.105663 (2020).
- Farooq, M. A. et al. Investigating the structural properties and in vitro digestion of rice flours. Food Sci. Nutr. 9(5), 2668-2675. https://doi.org/10.1002/fsn3.2225 (2021).
- Zhao, Y., Dai, X., Mackon, E., Ma, Y. & Liu, P. Impacts of protein from high-protein rice on gelatinization and retrogradation properties in high- and low-amylose reconstituted rice flour. Agronomy 12(6), 1431. https://doi.org/10.3390/agronomy12061431 (2022).
- Chen, H. et al. Effects of nitrogen and phosphorus fertilizer on the eating quality of indica rice with different amylose content.
. Food Compos. Anal. 118, 105167. https://doi.org/10.1016/j.jfca.2023.105167 (2023). - Duan, H., Tong, H., Zhu, A., Zhang, H. & Liu, L. Effects of heat, drought and their combined effects on morphological structure and physicochemical properties of rice (Oryza sativa L.) starch. J. Cereal Sci. 95, 103059. https://doi.org/10.1016/j.jcs.2020.103059 (2020).
- Fan, X. et al. The interaction between amylose and amylopectin synthesis in rice endosperm grown at high temperature. Food Chem. 301, 125258. https://doi.org/10.1016/j.foodchem.2019.125258 (2019).
- Okpala, N. E. et al. Low temperature increased the biosynthesis of 2-AP, cooked rice elongation percentage and amylose content percentage in rice. J. Cereal Sci. 93, 102980. https://doi.org/10.1016/j.jcs.2020.102980 (2020).
- Prathap, V. et al. Starch accumulation in rice grains subjected to drought during grain filling stage. Plant Physiol. Biochem. 142, 440-451. https://doi.org/10.1016/j.plaphy.2019.07.027 (2019).
- Zhu, F. Relationships between amylopectin internal molecular structure and physicochemical properties of starch. Trends Food Sci. Technol. 78, 234-242. https://doi.org/10.1016/j.tifs.2018.05.024 (2018).
- Li, G. & Zhu, F. Physicochemical properties of quinoa flour as affected by starch interactions. Food Chem. 221, 1560-1568. https:/ /doi.org/10.1016/j.foodchem.2016.10.137 (2017).
- Zhang, G., Ao, Z. & Hamaker, B. R. Slow digestion property of native cereal starches. Biomacromolecules 7(11), 3252-3258. https:/ /doi.org/10.1021/bm060342i (2006).
- Berry, C. S. Resistant starch: Formation and measurement of starch that survives exhaustive digestion with amylolytic enzymes during the determination of dietary fibre. J. Cereal Sci. 4(4), 301-314. https://doi.org/10.1016/S0733-5210(86)80034-0 (1986).
- Englyst, H. N., Kingman, S. M., Hudson, G. J. & Cummings, J. H. Measurement of resistant starch in vitro and in vivo. Br. J. Nutr. 75(5), 749-755. https://doi.org/10.1079/BJN19960178 (1996).
- Tovar, J., Bjoerck, I. M. & Asp, N. G. Starch content and. alpha.-amylolysis rate in precooked legume flours. J. Agric. Food Chem. 38(9), 1818-1823. https://doi.org/10.1021/jf00099a007 (1990).
- Fonseca, L. M., El Halal, S. L. M., Dias, A. R. G. & da Zavareze, E. R. Physical modification of starch by heat-moisture treatment and annealing and their applications: A review. Carbohydr. Polym. 274, 118665. https://doi.org/10.1016/j.carbpol.2021.118665 (2021).
- Atkinson, F. S., Brand-Miller, J. C., Foster-Powell, K., Buyken, A. E. & Goletzke, J. International tables of glycemic index and glycemic load values 2021: A systematic review. Am. J. Clin. Nutr. 114(5), 1625-1632. https://doi.org/10.1093/ajcn/nqab233 (2021).
- Edwards, C. H., Cochetel, N., Setterfield, L., Perez-Moral, N. & Warren, F. J. A single-enzyme system for starch digestibility screening and its relevance to understanding and predicting the glycaemic index of food products. Food Funct. 10(8), 4751-4760. https://doi.org/10.1039/C9FO00603F (2019).
- Tian, Y. et al. Interfacial catalysis during amylolytic degradation of starch granules: Current understanding and kinetic approaches. Molecules 28(9), 3799. https://doi.org/10.3390/molecules28093799 (2023).
- Van Hung, P., Chau, H. T. & Phi, N. T. L. In vitro digestibility and in vivo glucose response of native and physically modified rice starches varying amylose contents. Food Chem. 191, 74-80. https://doi.org/10.1016/j.foodchem.2015.02.118 (2016).
- Dhital, S., Butardo, V. M., Jobling, S. A. & Gidley, M. J. Rice starch granule amylolysis-Differentiating effects of particle size, morphology, thermal properties and crystalline polymorph. Carbohyd. Polym. 115, 305-316. https://doi.org/10.1016/j.carbpol. 20 14.08.091 (2015).
- Bao, J., Zhou, X., Xu, F., He, Q. & Park, Y. Genome-wide association study of the resistant starch content in rice grains. Starch Stärke https://doi.org/10.1002/star.201600343 (2017).
- Kumar, A. et al. Effect of Drought stress on Resistant starch content and Glycemic index of rice ( Oryza sativa L.). Starch – Stärke 72(11-12), 1900229. https://doi.org/10.1002/star. 201900229 (2020).
- Yamakawa, H., Hirose, T., Kuroda, M. & Yamaguchi, T. Comprehensive expression profiling of rice grain filling-related genes under high temperature using DNA microarray. Plant Physiol. 144(1), 258-277. https://doi.org/10.1104/pp.107.098665 (2007).
- Lu, X., Ma, R., Qiu, H., Sun, C. & Tian, Y. Mechanism of effect of endogenous/exogenous rice protein and its hydrolysates on rice starch digestibility. Int. J. Biol. Macromol. 193, 311-318. https://doi.org/10.1016/j.ijbiomac.2021.10.140 (2021).
- Qadir, N. & Wani, I. A. Functional properties, antioxidant activity and in-vitro digestibility characteristics of brown and polished rice flours of Indian temperate region. Grain Oil Sci. Technol. 6(1), 43-57. https://doi.org/10.1016/j.gaost.2022.12.001 (2023).
- Sahoo, B. et al. Rice starch phase transition and detection during resistant starch formation. Food Rev. Int. 40(1), 158-184. https:// doi.org/10.1080/87559129.2022.2163498 (2024).
- Fan, D. et al. Determination of structural changes in microwaved rice starch using Fourier transform infrared and Raman spectroscopy. Starch – Stärke 64(8), 598-606. https://doi.org/10.1002/star. 201100200 (2012).
- Yao, Y., Zhang, J. & Ding, X. Structure-retrogradation relationship of rice starch in purified starches and cooked rice grains: A statistical investigation. J. Agric. Food Chem. 50(25), 7420-7425. https://doi.org/10.1021/jf020643t (2002).
- Dogan, A., Siyakus, G. & Severcan, F. FTIR spectroscopic characterization of irradiated hazelnut (Corylus avellana L.). Food Chem.
- Khatoon, S., Sreerama, Y. N., Raghavendra, D., Bhattacharya, S. & Bhat, K. K. Properties of enzyme modified corn, rice and tapioca starches. Food Res. Int. 42(10), 1426-1433. https://doi.org/10.1016/j.foodres.2009.07.025 (2009).
- Ma, Z. et al. Structural characterization of resistant starch isolated from Laird lentils (Lens culinaris) seeds subjected to different processing treatments. Food Chem. 263, 163-170. https://doi.org/10.1016/j.foodchem.2018.04.122 (2018).
- Hoover, R. Starch retrogradation. Food Rev. Int. 11(2), 331-346. https://doi.org/10.1080/87559129509541044 (1995).
- Kačuráková, M. & Mathlouthi, M. FTIR and laser-Raman spectra of oligosaccharides in water: Characterization of the glycosidic bond. Carbohydr. Res. 284(2), 145-157. https://doi.org/10.1016/0008-6215(95)00412-2 (1996).
- Matmin, J., Affendi, I., Ibrahim, S. & Endud, S. Additive-free rice starch-assisted synthesis of spherical nanostructured hematite for degradation of dye contaminant. Nanomaterials 8(9), 702. https://doi.org/10.3390/nano8090702 (2018).
Acknowledgements
We also thank the Manipal School of Life Sciences, Manipal Academy of Higher Education, Manipal, Karnataka, India for providing the infrastructure and facilities.
Author contributions
IG: Conceptualization, Experimentation, Data representation, Writing Original Draft ARD: Experimentation, Data representation IC: Experimentation, Data Curation BS & VJB: Collection of Samples SSM: Experimentation NM: Project administration, Review and editing, supervision, funding acquisition.
Funding
Open access funding provided by Manipal Academy of Higher Education, Manipal. We sincerely thank the Indian Council for Medical Research (ICMR), Government of India, India for senior research fellowship (SRF) Sanction Order No. 3/1/2/297/2021-Nut. We thank Department of Biotechnology (DBT), Government of India, India (Grant No. BT/PR25099/NER/95/1014/2017) for the financial support.
Declarations
Competing interests
The authors declare no competing interests.
Additional information
Correspondence and requests for materials should be addressed to N.M.
Reprints and permissions information is available at www.nature.com/reprints.
Publisher’s note Springer Nature remains neutral with regard to jurisdictional claims in published maps and institutional affiliations.
Reprints and permissions information is available at www.nature.com/reprints.
Publisher’s note Springer Nature remains neutral with regard to jurisdictional claims in published maps and institutional affiliations.
Open Access This article is licensed under a Creative Commons Attribution 4.0 International License, which permits use, sharing, adaptation, distribution and reproduction in any medium or format, as long as you give appropriate credit to the original author(s) and the source, provide a link to the Creative Commons licence, and indicate if changes were made. The images or other third party material in this article are included in the article’s Creative Commons licence, unless indicated otherwise in a credit line to the material. If material is not included in the article’s Creative Commons licence and your intended use is not permitted by statutory regulation or exceeds the permitted use, you will need to obtain permission directly from the copyright holder. To view a copy of this licence, visit http://creativecommons.org/licenses/by/4.0/.
© The Author(s) 2025
© The Author(s) 2025
Department of Biophysics, Manipal School of Life Sciences, Manipal Academy of Higher Education, Manipal, Karnataka 576104, India. Materials and Catalysis Lab, Department of Chemistry, National Institute of Technology Karnataka, Surathkal, Karnataka 575025, India. Department of Plant Breeding and Genetics, Assam Agricultural University, Jorhat, Assam 785001, India. Centre for Biotechnology and Bioinformatics, Dibrugarh University, Assam 786004, India. email: nirmal.mazumder@manipal.edu