كمال كيرتاجغيدو جيرمانوقسم علوم الحاسوب، كلية جامعة لندن، 66-72 شارع غاور، لندن WC1E 6EA، المملكة المتحدةمركز المخاطر النظامية، كلية لندن للاقتصاد والعلوم السياسية، شارع هاوتون، لندن WC2A 2AE، المملكة المتحدة
معلومات المقال
تصنيف JEL:
C53 G10 G11 G12 G14 G17
الكلمات المفتاحية:
معالجة اللغة الطبيعية (NLP) نماذج اللغة الكبيرة المحول المدرب مسبقًا التوليدي (GPT) تعلم الآلة في توقع عوائد الأسهم استراتيجيات استثمار الذكاء الاصطناعي
الملخص
نحلل أداء نماذج اللغة الكبيرة (LLMs) OPT وBERT وFinBERT، جنبًا إلى جنب مع قاموس لوغرن-ماكدونالد التقليدي، في تحليل المشاعر لـ 965,375 مقالة إخبارية مالية أمريكية من 2010 إلى 2023. تكشف نتائجنا أن نموذج OPT المستند إلى GPT-3 يتفوق بشكل كبير على الآخرين، حيث يتنبأ بعوائد سوق الأسهم بدقةاستراتيجية طويلة وقصيرة تعتمد على OPT، تأخذ في الاعتبار 10 نقاط أساس (bps) في تكاليف المعاملات، تحقق نسبة شارب استثنائية تبلغ 3.05. من أغسطس 2021 إلى يوليو 2023، تنتج هذه الاستراتيجية نتائج مثيرة للإعجابتحقيق مكاسب، متفوقًا على استراتيجيات أخرى ومحافظ السوق التقليدية. وهذا يبرز الإمكانيات التحويلية لنماذج اللغة الكبيرة في توقعات الأسواق المالية وإدارة المحافظ، وضرورة استخدام نماذج اللغة المتطورة لتطوير استراتيجيات استثمار فعالة تعتمد على مشاعر الأخبار.
1. المقدمة
تهدف العديد من النصوص إلى فهم وتوقع الأحداث الاقتصادية والمالية. في العقود الأخيرة، تحولت الأدبيات المالية إلى مصادر متنوعة من بيانات النصوص، مثل مقالات الأخبار المالية، والتقارير التنظيمية، ومنشورات وسائل التواصل الاجتماعي، لاستخراج رؤى قيمة. ومع ذلك، لا يزال دمج تنقيب النصوص في النماذج المالية في مراحله الأولى. حتى الآن، استكشفت معظم الأبحاث جزءًا صغيرًا فقط من بيانات النصوص المتعلقة بالأسواق المالية، وغالبًا ما تركز على مصدر بيانات واحد. عادةً ما تستخدم هذه الدراسات طرقًا بسيطة، مثل تحديد درجات المشاعر من القواميس (لوغراند وماكدونالد، 2011؛ مالو وآخرون، 2014). قاموس شائع خاص بالمالية يُستخدم في تحليل المشاعر هو القاموس الرئيسي لوغراند وماكدونالد (لوغراند وماكدونالد، 2022).
استخدام المعلومات الاقتصادية والمالية في بيانات النصوص يواجه صعوبات. على عكس البيانات العددية، تفتقر بيانات النصوص إلى هيكل متسق، مما يجعل من الصعب التعامل معها وتفسيرها. اللغة نفسها معقدة بطبيعتها. لذلك، هناك حاجة إلى نماذج متطورة لاكتشاف الرؤى المخفية من النصوص. ومع ذلك، يمكن أن تشكل هذه النماذج المتقدمة تحديات، خاصة للباحثين الذين يفتقرون إلى الخبرة التقنية أو الموارد الحاسوبية أو التمويل الكافي. في هذا السياق، يتضح أن الجهود الحالية في تحليل النصوص ضمن المالية والاقتصاد لا تزال في بدايات استكشاف الإمكانيات. هناك إمكانيات كبيرة غير مستغلة في بيانات النصوص يمكن استغلالها للحصول على فهم أعمق لأسواق الأصول. مع ظهور التحديات في تحليل النصوص، تشير إلى طريق مثير لمزيد من البحث. من المتوقع أنه في المستقبل، سيقوم الاقتصاديون بتوسيع مجموعات بيانات النصوص الخاصة بهم وتحسين تقنياتهم لاستخراج رؤى قيمة (أسيموغلو وآخرون، 2022).
الهدف الرئيسي من هذه الورقة هو التعمق في هذا الاستكشاف. نهدف إلى إنشاء تمثيلات أكثر دقة لنصوص الأخبار باستخدام نماذج اللغة الكبيرة (LLMs) واستغلال هذه التمثيلات لتطوير نماذج للتنبؤ بعوائد الأسهم. لفهم قيمة نماذج اللغة الكبيرة، من الضروري فهم المشهد الحالي لتعدين النصوص المالية. معظم الطرق المستخدمة حالياً
تعتمد على التعلم الآلي الخاضع للإشراف ومصممة لأهداف محددة، مثل التنبؤ بالعوائد أو التقلبات أو المتغيرات الاقتصادية الكلية (جيغاديش وو، 2013؛ بيكر وآخرون، 2016؛ مانيلّا ومورييرا، 2017). تتضمن هذه الطرق عادةً خطوتين رئيسيتين: تحويل النص إلى تمثيل عددي ثم نمذجته. في العديد من الحالات، يختار الباحثون نهج القاموس، الذي يحول كل وثيقة إلى متجه يأخذ في الاعتبار تكرار المصطلحات (لوغرن وماكدونالد، 2011؛ مالو وآخرون، 2014). أحيانًا، يتم تحسين هذا التمثيل بشكل أكبر لإنشاء درجات ملخصة تمثل النص وفقًا لقاموس كلمات محدد للمجال (تيتلوك، 2007). الناتج من الخطوة الأولية هو مصفوفة، يتم إدخالها بعد ذلك في النموذج الاقتصادي في الخطوة التالية لوصف ظواهر اقتصادية أو مالية متنوعة. وقد أبرزت دراسات مثل بيكر وورغلر (2006)، ليمون وني (2014) وشابيرو وآخرون (2022) تأثير مشاعر المستثمرين على أسعار الأصول من خلال الاستفادة من مؤشرات المشاعر على المستوى الكلي أو السوقي. ومع ذلك، لا تتعامل هذه المساهمات مع ديناميات المشاعر على مستوى الأسهم الفردية، وهو ما تهدف أبحاثنا إلى القيام به من خلال استخدام نماذج اللغة الكبيرة لتحليل المشاعر بشكل دقيق. لا يعزز هذا النهج فهمنا لدور المشاعر في الأسواق المالية فحسب، بل يقدم أيضًا بعدًا جديدًا لتحليل المشاعر من خلال التركيز على القوة التنبؤية لدرجات المشاعر المستمدة من نماذج اللغة الكبيرة لأداء الأسهم الفردية.
تتمتع الطرق الحالية لتمثيل بيانات النصوص المالية بحدود جوهرية. بدءًا من طريقة القاموس، حيث تبسط النص بشكل مفرط من خلال اعتبار تكرار المصطلحات فقط وتجاهل جوانب مهمة مثل ترتيب الكلمات والعلاقات السياقية بين المصطلحات (مالو وآخرون، 2014). بالإضافة إلى ذلك، يمكن أن تؤدي الأبعاد العالية للقاموس إلى عدم كفاءة إحصائية، مما يتطلب العديد من المعلمات في مرحلة النمذجة اللاحقة، حتى عندما قد تكون العديد من المصطلحات غير ذات صلة. يمكن أن تساعد تقنيات تقليل الأبعاد مثل تخصيص ديريشليت الكامن (LDA)، لكنها لا تزال تعتمد على قاموس ولا تعالج المشكلة الأساسية لفقدان المعلومات (بايبي وآخرون، 2019). علاوة على ذلك، فإن هذه التمثيلات المخفضة محددة لمصدر نصي في مجال معين، على الرغم من أن دمج مصادر نصية متعددة قد يوفر رؤى أفضل (ديفلين وآخرون، 2019).
يمكن أن يلعب نموذج اللغة الكبير (LLM) دورًا حاسمًا في تحليل النصوص. يتم تدريب نموذج اللغة الكبير على مجموعة واسعة من النصوص التي تغطي مواضيع مختلفة (ديفلين وآخرون، 2019). يتطلب إنشاء نموذج لغة كبير فريقًا متخصصًا يقوم ببناء نموذج لغوي متعدد الاستخدامات. يتم تدريب هذا النموذج على كمية هائلة من النصوص، بما في ذلك الكتب الكاملة، ومقالات ويكيبيديا، والمزيد. بمجرد تطويرها، يتم جعل نماذج اللغة الكبيرة متاحة لأغراض البحث الأوسع (هوجينغ فيس، 2023).
في بحثنا، نستخدم نموذجين مختلفين من نماذج اللغة الكبيرة (LLMs) لتحليلنا: تمثيلات الترميز ثنائية الاتجاه من المحولات (BERT) التي طورتها جوجل (Devlin et al.، 2019) والمحولات المدربة مسبقًا المفتوحة (OPT) التي طورتها ميتا (Zhang et al.، 2022). لقد تفوقت نماذج اللغة الكبيرة المتطورة باستمرار في مهام معالجة اللغة الطبيعية (NLP) المختلفة، ويرجع ذلك أساسًا إلى نطاقها الواسع. وغالبًا ما تكون متاحة مدربة مسبقًا على منصات مثل Hugging Face (Hugging Face، 2023). تعتبر Hugging Face مستودعًا رائدًا مفتوح المصدر يقدم مجموعة واسعة من نماذج معالجة اللغة الطبيعية والذكاء الاصطناعي المتقدمة، مما يجعل تقنيات التعلم الآلي المتطورة متاحة وقابلة للتطبيق لأغراض أكاديمية وبحثية. قمنا ببناء نماذجنا التحليلية من خلال الاستفادة من مكتبة المحولات الخاصة بـ Hugging Face (Wolf et al.، 2020) واستخدام بايثون.
اخترنا BERT لابتكاره في فهم اللغة، وهو أمر حاسم لتحليل النصوص المالية المعقدة. قدرة BERT على تحليل سياق النص من جميع الجوانب تحسن من كيفية تفسيرنا للوثائق المالية (Devlin et al., 2019). كنا نود أيضًا استخدام GPT-4 كنموذج لغوي كبير في بحثنا. ومع ذلك، لم نتمكن من استخدام أحدث نماذج GPT لأنها غير متاحة للجمهور. بدلاً من ذلك، استخدمنا OPT كبديل. OPT مشابه لنماذج GPT، ولكنه مفتوح للجمهور (Radford et al., 2018). استخدمنا إصدارات أصغر من OPT بسبب مواردنا الحاسوبية المحدودة. لتحليلنا، اخترنا نماذج BERT وOPT مع 345 مليون و2.7 مليار معلمة (Hugging Face, 2023). يوفر لنا اختيارنا لـ OPT وBERT أدوات نماذج لغوية كبيرة قوية لفهم الأسواق المالية بشكل أفضل وتوقع تحركاتها. علاوة على ذلك، يتضمن تحليلنا FinBERT، وهو نسخة متخصصة من نموذج BERT، تم تدريبه مسبقًا بشكل خاص للسياقات المالية. يعد FinBERT مثالًا على كيفية تعديل نماذج BERT مفتوحة المصدر لمهام مميزة في المالية. أظهر Huang et al. (2023) هذه القابلية للتكيف من خلال تحسين نموذج BERT لمهام التصنيف باستخدام مجموعة بيانات Financial PhraseBank، التي تم تجميعها في البداية بواسطة Malo et al. (2014). أخيرًا، استخدمنا أيضًا قاموس Loughran وMcDonald (Loughran and Mcdonald, 2011; Loughran and McDonald, 2022) لتسهيل تقييم مقارن عبر أساليب النمذجة المختلفة، أي FinBERT وإصداراتنا المحسّنة من BERT وOPT.
تحليلنا هو عملية من خطوتين: أولاً، نقوم بتحويل النص إلى أرقام، ثم نستخدم هذه الأرقام لنمذجة الأنماط الاقتصادية. في الجزء الأول، نختار كيفية تمثيل بيانات النص رقميًا للنموذج في الجزء الثاني. إحدى الطرق الشائعة هي نهج القاموس، الذي يمثل كل نص كقائمة بجميع الكلمات وعدد مرات ظهورها. أحيانًا، تكون هذه القائمة الأساسية كل ما نستخدمه (لوغراند وماكدونالد، 2011؛ جاجاديش وو، 2013). في أحيان أخرى، نستخدم قدرات LLM المتقدمة لتحليل الأخبار. نتيجة هذه الخطوة الأولى هي جدول من الأرقام حيث يمثل كل صف نصًا إخباريًا ويمثل كل عمود درجة شعور. في الخطوة الثانية، نستخدم هذا الجدول لمساعدتنا في فهم النتائج المالية مثل عوائد الأسهم أو اتجاهات السوق. استخدام LLMs في المرحلة الأولية يحسن تمثيلات النص مقارنة بأساليب القاموس الحالية. يأتي هذا التحسين من الفضاء الواسع للمعلمات في LLMs وتدريبها على مجموعة متنوعة من عينات اللغة (ديفلين وآخرون، 2019). من خلال تمكين استخدام LLMs، تصبح ثروة من المعرفة متاحة للبحث المالي (هوانغ وآخرون، 2023). يركز بحثنا بشكل أساسي على إظهار فائدة تمثيلات LLM في نمذجة عوائد الأسهم.
لتحقيق ذلك، نقوم بإجراء دراستين اقتصاديتين منفصلتين تستفيدان من تحليل النصوص للحصول على رؤى حول السوق المالية. أولاً، نقوم بتقييم العلاقة بين مشاعر الأخبار المالية وعوائد الأسهم باستخدام تقنيات تحليل المشاعر. يتضمن ذلك تصنيف مشاعر الأخبار بناءً على العوائد الزائدة المجمعة لمدة 3 أيام للأسهم، مما يوفر انعكاسًا أكثر ديناميكية ودقة لاستجابة السوق للأخبار. ثانيًا، نقوم بإجراء تحليل انحدار لتحديد مدى فعالية درجات المشاعر المستمدة من نماذج اللغة الكبيرة في التنبؤ بعوائد الأسهم في اليوم التالي. نستخدم نماذج الانحدار الخطي مع تأثيرات ثابتة خاصة بالشركات وتواريخ محددة، مما يتيح تقييمًا مفصلًا لدقة التنبؤ لنماذج اللغة الكبيرة، بما في ذلك OPT وBERT وFinBERT، مقارنةً بالنماذج التقليدية المعتمدة على القواميس. أخيرًا، نستكشف التطبيقات العملية من خلال تطوير استراتيجيات تداول متميزة تعتمد على درجات المشاعر المستمدة من نماذج اللغة الكبيرة. تشمل هذه الاستراتيجيات إنشاء محافظ طويلة وقصيرة وطويلة-قصيرة، مسترشدين بدرجات المشاعر من OPT وBERT وFinBERT ونماذج قواميس لوغرن-ماكدونالد. يأخذ تصميمنا المنهجي في الاعتبار العالم الحقيقي. شروط التداول من خلال دمج تكاليف المعاملات وتوافق تنفيذ الصفقات مع توقيتات إصدار الأخبار. هذه المقاربة الشاملة لا تبرز فقط قدرات تحليل المشاعر الدقيقة لنماذج اللغة الكبيرة، بل تظهر أيضًا قيمتها العملية في صياغة استراتيجيات تداول فعالة في السوق المالية.
تُكمل هذه التحقيقات وتوسع نطاق الأعمال الأكاديمية الحالية التي تجمع بين معالجة النصوص وطرق التعلم الآلي لمعالجة مجموعة من الأسئلة في البحث المالي (جيغاديش وو، 2013؛ غارسيا، 2013؛ هوبرغ وفيليبس، 2016؛ مانيلّا ومورييرا، 2017؛ هانسن وآخرون، 2018؛ كي وآخرون، 2020). بالإضافة إلى ذلك، تساهم في البحث المستمر الذي يركز على العلاقة بين مشاعر الأخبار وأداء سوق الأسهم الجماعي (تيتلوك، 2007؛ كامبل وآخرون، 2014؛ بيكر وآخرون، 2016؛ كالميريس ومامايسكي، 2019؛ فرانكل وآخرون، 2022). يكمن جانب فريد من دراستنا في استكشاف قدرات نماذج اللغة الكبيرة. نفترض أن هذه النماذج المتطورة لديها القدرة على اكتشاف رؤى أعمق، وربما غير معترف بها سابقًا، من البيانات النصية، مما يؤدي إلى تحسين الدقة في توقع ردود فعل سوق الأسهم.
الورقة منظمة على النحو التالي: القسم 2 يصف البيانات والأساليب التي استخدمناها في دراستنا. القسم 3 يعرض نتائج الدراسة ويناقشها. القسم 4 يحتوي على الاستنتاجات.
2. البيانات والأساليب
2.1. البيانات
في بحثنا، نستخدم بشكل أساسي مجموعتين من البيانات: واحدة من مركز أبحاث أسعار الأوراق المالية (CRSP) التي تتضمن عوائد الأسهم اليومية، وأخرى من رفينيتيف تحتوي على أخبار عالمية. تتضمن بيانات الأخبار من رفينيتيف مقالات مفصلة وتنبيهات سريعة، تركز على الشركات التي تتخذ من الولايات المتحدة مقراً لها. توفر بيانات CRSP معلومات عن العوائد اليومية للشركات التي تتداول في البورصات الأمريكية الكبرى. وتشمل تفاصيل مثل أسعار الأسهم، وأحجام التداول، والقيمة السوقية. نستخدم هذه البيانات لتحليل العلاقة بين عوائد سوق الأسهم ودرجات المشاعر المستمدة من نماذج اللغة الكبيرة.
تحليلنا يشمل الشركات المدرجة في بورصة أمريكا (AMEX) ورابطة تجار الأوراق المالية الآلية (NASDAQ) وبورصة نيويورك (NYSE) التي تظهر في مقال إخباري واحد على الأقل. نحن نطبق فلاتر لضمان جودة بياناتنا. نحن نعتبر فقط المقالات الإخبارية المتعلقة بالأسهم الفردية التي تتوفر لها عوائد لمدة ثلاثة أيام. علاوة على ذلك، نتجنب التكرار من خلال استخدام درجة الجدة بناءً على التشابه بين المقالات: إذا كان مقال جديد مشابهًا جدًا لمقال قديم نُشر خلال العشرين يومًا الماضية وفقًا لدرجة تشابه كوساين تبلغ 0.8 أو أكثر، فإننا نستبعده. تساعدنا هذه الطريقة على التركيز على المعلومات الفريدة المهمة لتحليلنا.
تشمل دراستنا الفترة من 1 يناير 2010 إلى 30 يونيو 2023. قمنا بمطابقةأخبار عن 6214 شركة فريدة. بعد تطبيق مرشحنا، تبقى لدينا 965,375 مقالة. تم تلخيص مجموعة بياناتنا في الجدول 1.
الجدول 1 إحصائيات ملخص مجموعة بيانات مقالات الأخبار الأمريكية لدينا بعد تطبيق الفلاتر. ‘جميع الأخبار’ هو العدد الإجمالي لعناصر الأخبار من Refinitiv. ‘أخبار الأسهم الفردية’ هو العدد بعد الفلترة للمقالات المرتبطة حصريًا بالأسهم الفردية. ‘أخبار فريدة’ هو العدد المتبقي بعد استبعاد المقالات ذات درجة عالية من التشابه (درجة تشابه كوساين أعلى من 0.8) مع أي محتوى آخر تم نشره خلال الأيام الخمسة التجارية السابقة، مما يضمن مجموعة بيانات خالية من المعلومات المكررة.
جميع الأخبار
أخبار الأسهم الفردية
أخبار فريدة
٩٦٥,٣٧٥
تقدم الجدول 2 إحصائيات وصفية لمجموعة البيانات الخاصة بنا. نجد أن متوسط العائد اليومي هوبانحراف معياري قدرهتظهر درجات المشاعر المستمدة من نماذج OPT وBERT وFinBERT توزيعًا طبيعيًا حول الوسيط 0.5، مع اختلافات طفيفة في المتوسط والانحراف المعياري. بالمقابل، يظهر درجة قاموس لوغرن-ماكدونالد توزيعًا مائلًا بشكل إيجابي أكثر مع متوسط 0.68 وانحراف معياري أعلى يبلغ 0.32، مما يشير إلى ميل نحو درجات مشاعر أكثر إيجابية في مجموعة البيانات الخاصة بنا.
الجدول 2 إحصائيات وصفية لعوائد الأسهم اليومية المعبر عنها بالنقاط المئوية ودرجات المشاعر المستمدة من نماذج OPT وBERT وFinBERT، بالإضافة إلى قاموس لوغراند-ماكدونالد (LM). توفر الجدول المتوسط والانحراف المعياري (StdDev) والحد الأدنى والوسيط والحد الأقصى وإجمالي عدد الملاحظات.لكل متغير يتعلق بعوائد الأسهم ودرجات المشاعر من النماذج والقاموس المذكور.
معنى
الانحراف المعياري
حد أدنى
الوسيط
الحد الأقصى
العائد اليومي (%)
0.37
0.18
-64.97
-0.02
٢٣٧.١١
٩٦٥,٣٧٥
درجة BERT
0.48
0.25
0
0.5
1
٩٦٥,٣٧٥
درجة OPT
0.53
0.24
0
0.5
1
٩٦٥,٣٧٥
درجة فينبرتو
0.51
0.24
0
0.5
1
٩٦٥,٣٧٥
درجة قاموس LM
0.68
0.32
0
0.5
1
٩٦٥,٣٧٥
2.2. الطرق
تبدأ هذه الدراسة بضبط النماذج اللغوية المدربة مسبقًا، وبالتحديد BERT وOPT، المستمدة من Hugging Face، لتكييف قدراتها لتحليل مالي متخصص (Hugging Face، 2023). تتطلب النماذج اللغوية الكبيرة، التي تم تصميمها في الأصل لفهم اللغة بشكل عام، تكييفًا كبيرًا لأداء مهام متخصصة مثل إنتاج مؤشر المشاعر من خلال التحليل النصي. لأخبار المالية بهدف التنبؤ بعوائد الأسهم. تفرض هذه الضرورة مرحلة التكيف، حيث يتم إعادة معايرة النماذج بعد تدريبها الأصلي على بيانات واسعة لتحضيرها لوظائف تحليلية محددة (رادفورد وآخرون، 2018).
بالإضافة إلى نماذج OPT وBERT، تتضمن تحليلاتنا FinBERT، وهو نسخة من BERT تم تدريبها مسبقًا خصيصًا للنصوص المالية، ومعجم لوغراند وماكدونالد. ومن الجدير بالذكر أن FinBERT ومعجم لوغراند وماكدونالد لا يتطلبان عملية التخصيص، حيث إنهما مصممان بالفعل لتحليل النصوص المالية. يستفيد FinBERT من بنية BERT ولكنه تم تخصيصه على النصوص المالية، مما يوفر فهمًا دقيقًا في هذا المجال (هوانغ وآخرون، 2023). يساعد معجم لوغراند وماكدونالد، وهو معجم متخصص للنصوص المالية، في التحليل النصي التقليدي دون تعقيد نماذج التعلم الآلي (لوغراند وماكدونالد، 2022).
مستندين إلى المنهجيات التي قدمها ألان وبنغيو (2016)، تعتمد طريقتنا على تقنية الاستكشاف، وهي شكل من أشكال استخراج الميزات. تعتمد هذه الطريقة على المعلمات الموجودة مسبقًا في النماذج، مستغلة إياها لإنشاء ميزات تتعلق ببيانات النص، مما يسهل المهمة اللاحقة لتحليل المشاعر. لتعزيز دقة نماذج اللغة الكبيرة لدينا، قمنا بتكييف وتعديل المنهجية المقترحة من قبل كي وآخرون (2020). في منهجيتنا، تتضمن عملية تحسين نماذج اللغة المدربة مسبقًا OPT وBERT تركيزًا محددًا على العائد الزائد المجمع لمدة 3 أيام المرتبط بكل سهم. يتم حساب هذا العائد الزائد من اليوم الذي يتم فيه نشر مقال إخباري لأول مرة ويمتد على مدى اليومين التاليين. للتوضيح، يتم تعريف العائد الزائد على أنه الفرق بين عائد سهم معين والعائد العام للسوق في نفس اليوم. لا تقتصر هذه الحسابات على اليوم الذي يتم فيه نشر الخبر؛ بل تجمع العوائد للأيام التالية أيضًا، مما يوفر نظرة شاملة لمدة ثلاثة أيام.
تُخصص تسميات المشاعر لكل مقال إخباري بناءً على إشارة العائد الزائد المجمع على مدى ثلاثة أيام. يؤدي العائد الزائد المجمع الإيجابي إلى تسمية مشاعر ‘1’، مما يشير إلى مشاعر إيجابية. وعلى العكس، فإن العائد الزائد المجمع غير الإيجابي يؤدي إلى تسمية مشاعر ‘0’، مما يوحي بمشاعر سلبية. تلعب طريقتنا في استخدام العائد الزائد المجمع على مدى ثلاثة أيام لتسمية المشاعر دورًا حاسمًا في تحسين تحليلنا. تتبع هذه الطريقة الممارسة الشائعة في الاقتصاد والمالية لدراسة الأحداث التي تمتد على مدى عدة أيام (MacKinlay، 1997). تتضمن هذه الطريقة تقييم العوائد التي تمتد من يوم نشر المقال إلى اليومين التاليين. هذه التقنية مفيدة بشكل خاص في فهم العلاقة بين المشاعر في الأخبار المالية والحركات المقابلة في أسعار الأسهم. لقد خصصنامن البيانات بشكل عشوائي للاختبار، ومن مجموعة البيانات المتبقية، تم تخصيص أخرىعشوائيًا لأغراض التحقق، مما أسفر عن مجموعة تدريبية تتكون من 193,070 مقالة.
بعد الانتهاء من ضبط نموذج اللغة، تستمر تحليلاتنا بتقييم تجريبي لهذه النماذج في سياق مشاعر الأخبار المالية في الولايات المتحدة. مجموعة فرعية منتم تخصيص عينة اختبار من هذه المقالات، مما يسمح بتقييم غير متحيز لدقة نماذج التنبؤ. ركز تحليلنا على قدرة OPT وBERT وFinBERT وقاموس LoughranMcDonald على التنبؤ بدقة باتجاه عوائد الأسهم بناءً على مشاعر الأخبار، لا سيما على مدى فترة ثلاثة أيام بعد النشر. لتقييم أداء النماذج، قمنا بحساب هذه المقاييس الإحصائية: الدقة، الدقة الإيجابية، الاسترجاع، الخصوصية، ودرجة F1. الدقة هي نسبة النتائج الصحيحة (كلا من الإيجابيات الحقيقية والسلبيات الحقيقية) من إجمالي عدد الحالات التي تم فحصها. الدقة (قيمة التنبؤ الإيجابية) هي نسبة التعريفات الإيجابية التي كانت صحيحة بالفعل. الاسترجاع (الحساسية) هو نسبة الإيجابيات الفعلية التي تم التعرف عليها بشكل صحيح. الخصوصية هي نسبة السلبيات الفعلية التي تم التعرف عليها بشكل صحيح. درجة F1 هي المتوسط التوافقي للدقة والاسترجاع، مما يوفر مقياسًا واحدًا يوازن بين الكميتين.
قمنا بعد ذلك بإجراء تحليل انحدار بهدف دراسة تأثير درجات نموذج اللغة على عوائد الأسهم في اليوم التالي. تم نمذجة الانحدار على النحو التالي
أينهو عائد الأسهمفي يوم التداول التالي هو متجه من الدرجات من نماذج اللغة، و و هي التأثيرات الثابتة للشركة والتاريخ. نحن نستخدم التجميع المزدوج للأخطاء المعيارية حسب الشركة والتاريخ، مما يعالج المخاوف المحتملة المتعلقة بالهتروسكداستيك والارتباط الذاتي. يسهل هذا الإطار الانحداري مقارنة متعمقة للفعالية التنبؤية لنماذج اللغة الكبيرة المختلفة، بما في ذلك OPT وBERT وFinBERT ونسخ قاموس لوغرن-ماكدونالد فيما يتعلق بعوائد الأسهم.
اختيارنا لنموذج الانحدار الخطي يتوافق مع نهج الانحدار اللوحي القياسي حيث ميزات المقالةتُترجم مباشرةً إلى العائد المتوقعمن الأسهم المقابلة في اليوم التالي. تم اختيار بساطة الانحدار الخطي لتسليط الضوء على أهمية التمثيلات المعتمدة على النص في التحليل المالي. من خلال استخدام النماذج الخطية، يمكننا التركيز على تأثير هذه التمثيلات دون التعقيد الإضافي للنمذجة غير الخطية. يبرز هذا النهج التأثير المباشر للبيانات النصية على التنبؤات المالية، مما يضمن فهمًا واضحًا لدور وفعالية الميزات المعتمدة على النص في تحليل المشاعر المالية.
استنادًا إلى تحليلنا التنبؤي، تمتد دراستنا لتقييم النتائج العملية من خلال تنفيذ استراتيجيات تداول متميزة باستخدام درجات المشاعر المستمدة من نماذج OPT وBERT وFinBERT وLoughran-McDonald. لتقييم هذه الاستراتيجيات بشكل شامل، نقوم بإنشاء محافظ متنوعة مع التركيز بشكل خاص على الأساليب المعتمدة على القيمة السوقية. لكل نموذج لغوي، نقوم بإنشاء ثلاثة أنواع من المحافظ: طويلة، قصيرة، وطويلة-قصيرة. تعتمد تركيبة هذه المحافظ على درجات المشاعر المخصصة للأسهم الفردية كل يوم. على وجه التحديد، تتكون المحافظ الطويلة من الأسهم ذات أعلىدرجات المشاعر، بينما تتكون المحافظ القصيرة من الأسهم ذات الأدنىدرجات المشاعر. علاوة على ذلك، فإن محافظ الشراء والبيع القصير هي استراتيجيات تمويل ذاتي تتضمن في الوقت نفسه اتخاذ مراكز شراء في الأسهم ذات أعلىدرجات المشاعر والمراكز القصيرة في الأسهم ذات الأدنىدرجات المشاعر. نلاحظ العوائد التراكمية لهذه استراتيجيات التداول مع الأخذ في الاعتبار تكاليف المعاملات. نقوم بتحديث هذه المحافظ المعتمدة على وزن القيمة السوقية للمشاعر بشكل يومي استجابةً للتغيرات في درجات المشاعر. وهذا يعني أنه في كل يوم، نقوم بإعادة تقييم وتعديل المحافظ. من خلال النظر في أحدث بيانات المشاعر. من خلال القيام بذلك، نهدف إلى التقاط أحدث ظروف السوق وتعزيز فعالية استراتيجياتنا التجارية.
تتيح لنا هذه الطريقة اختبار التطبيق الواقعي لنتائج تحليل المشاعر دون تأثير تحركات السوق العامة. نحن نستند في اختياراتنا للأسهم إلى قيمتها السوقية، مع تفضيل الشركات الأكبر والأكثر استقرارًا، حيث تمثل هذه الشركات غالبًا استثمارات أكثر أمانًا وموثوقية، وتساعد في تقليل تكاليف التداول. نحن نزامن قراراتنا التجارية مع توقيت إصدار الأخبار. بالنسبة للأخبار التي يتم الإبلاغ عنها قبل الساعة 6 صباحًا، نبدأ التداول عند افتتاح السوق في ذلك اليوم، مستغلين فرص رد الفعل الفوري ونغلق الصفقة في نفس التاريخ. بالنسبة للأخبار التي تظهر بين الساعة 6 صباحًا و4 مساءً، نبدأ صفقة بأسعار الإغلاق لنفس اليوم ونخرج من الصفقة في يوم التداول التالي. أي أخبار تصل بعد الساعة 4 مساءً تُستخدم للتداول في بداية يوم التداول التالي، متكيفين مع ساعات عمل السوق. لجعل محاكاتنا أكثر توافقًا مع ظروف التداول الفعلية، قمنا بتضمين تكلفة معاملات قدرها 10 نقاط أساس لكل صفقة، مما يعكس التكاليف النموذجية التي قد يواجهها المتداولون في السوق.
3. النتائج
3.1. دقة تحليل المشاعر في الأخبار المالية الأمريكية
في هذه الدراسة، استخدمنا نماذج اللغة الكبيرة لتحليل المشاعر في الأخبار المالية الأمريكية. قمنا بمعالجة مجموعة بيانات تتكون من 965,375 مقالة من رفينيتيف، تمتد من 1 يناير 2010 إلى 30 يونيو 2023. استخدمنامن هذه المقالات كمجموعة اختبار. قمنا بقياس دقة كل نموذج في التنبؤ باتجاه عوائد الأسهم بناءً على مشاعر الأخبار. تشير هذه الدقة إلى مدى ارتباط النموذج بالمشاعر في الأخبار المالية مع عوائد الأسهم على مدى فترة ثلاثة أيام. قمنا بتقييم أربعة نماذج: OPT وBERT وFinBERT وقاموس لوغراند-ماكدونالد. يتم عرض أدائهم في تحليل المشاعر في الجدول 3.
الجدول 3 مقاييس أداء نموذج اللغة: الدقة، الدقة الإيجابية، الاسترجاع، الخصوصية، ودرجة F1 لكل نموذج. نموذج OPT هو الأكثر دقة، يليه عن كثب نموذج BERT وFinBERT.
مقياس
OPT
بيرت
فينبيرت
لوغرن-ماكدونالد
دقة
0.744
0.725
0.722
0.501
دقة
0.732
0.711
0.708
0.505
استدعاء
0.781
0.761
0.755
0.513
خصوصية
0.711
0.693
0.685
0.٥٢٢
درجة F1
0.754
0.734
0.731
0.508
تظهر النتائج أن نموذج OPT هو الأكثر دقة، يليه عن كثب نموذج BERT وFinBERT. قاموس لوغرن-ماكدونالد، وهو أداة تقليدية لتحليل نصوص المالية، لديه دقة أقل بكثير. وهذا يشير إلى أن نماذج اللغة مثل OPT وBERT وFinBERT أفضل في فهم وتحليل الأخبار المالية المعقدة. تدعم قيم الدقة والاسترجاع تفوق نموذج OPT؛ كما أن درجة F1 الخاصة به، التي تجمع بين الدقة والاسترجاع، تؤكد أيضًا فعاليته في تحليل المشاعر. تؤكد هذه النتائج أن نماذج اللغة، وخاصة OPT، هي أدوات قيمة لتحليل الأخبار المالية والتنبؤ باتجاهات سوق الأسهم.
3.2. التنبؤ بالعوائد باستخدام درجات LLM
يقيم هذا القسم قدرة نماذج اللغة الكبيرة المختلفة على توقع عوائد الأسهم لليوم التالي باستخدام نماذج الانحدار. يستخدم انحدارنا مع المعادلة (1) الدرجات التي تم إنشاؤها بواسطة نماذج اللغة الكبيرة من عناوين الأخبار كمؤشرات رئيسية. لأخذ التغيرات غير المرصودة في الاعتبار، تتضمن هذه الانحدارات تأثيرات ثابتة لكل من الشركات والزمن، ونقوم بتجميع الأخطاء المعيارية حسب التاريخ والشركة لزيادة القوة. تقدم الجدول 4 نتائج انحدارنا، مع التركيز على كيفية ارتباط عوائد الأسهم بالدرجات التنبؤية من نماذج اللغة الكبيرة المتقدمة، وبالتحديد OPT وBERT وFinBERT ونماذج قاموس لوغرن-ماكدونالد.
تكشف نتائجنا عن القدرات التنبؤية للنماذج اللغوية المتقدمة. يُظهر نموذج OPT، على وجه الخصوص، ارتباطًا قويًا بعوائد الأسهم في اليوم التالي، كما يتضح من المعاملات الكبيرة في مواصفات النماذج المختلفة. يتبع نموذج FinBERT عن كثب، حيث يُظهر قوته التنبؤية القوية. بينما تُظهر درجات BERT، على الرغم من كونها أكثر تواضعًا في قوتها التنبؤية، علاقة ذات دلالة إحصائية مع عوائد الأسهم. نلاحظ أيضًا أن القوة التنبؤية تزداد عندما يتم استخدام كلا النموذجين كمتغيرات مستقلة في نفس الانحدار. بالمقابل، يُظهر نموذج قاموس لوهيران-ماكدونالد أقل قوة تنبؤية بين النماذج التي تم فحصها.
تحليلنا يشير إلى أن عدة عوامل تساهم في تفسير الأداء المختلف بين OPT وBERT وFinBERT، لا سيما تصميم النموذج، حجم المعلمات، وخصوصية بيانات التدريب. من المحتمل أن يتسبب اتساع مساحة المعلمات في OPT، التي تتجاوز تلك الخاصة بـ BERT وFinBERT، إلى جانب منهجيات التدريب المتقدمة، في دقة توقعاته المتفوقة في عوائد الأسهم وإدارة المحافظ. علاوة على ذلك، فإن الأداء الدقيق لـ FinBERT، على الرغم من تخصصه في المجال المالي، يثير اعتبارات مثيرة للاهتمام. استكشافنا المفصل في القسم 3.3 يفترض أن تنوع بيانات ما قبل التدريب الأوسع لـ BERT وإمكانية الإفراط في التخصيص في النماذج المتخصصة للغاية مثل FinBERT قد يفسر هذه النتيجة غير المتوقعة. هذه الرؤى تؤكد مجتمعة على التوازن المعقد بين خصوصية النموذج، الحجم، ونظام التدريب في تحسين الأداء التنبؤي ضمن تحليل المشاعر المالية.
تُعزز قوة نماذج الانحدار لدينا من خلال تضمين عدد كبير من الملاحظات، مما يضمن تحليلًا شاملاً وتمثيليًا. بالإضافة إلى ذلك، فإن التعديلتشير قيم R-squared، على الرغم من كونها معتدلة، إلى مستوى معقول من القوة التفسيرية داخل النماذج. تساعد قيم AIC و BIC المبلغ عنها في تقييم ملاءمة النموذج وتعقيده، مما يعزز تحليلنا المقارن عبر نماذج LLMs المختلفة.
الجدول 4 نتائج الانحدار لعوائد الأسهم على درجات مشاعر LLM التي تم تنفيذها باستخدام المعادلة (1)، والتي تشمل تأثيرات ثابتة للشركة والزمن (FE) ممثلة بـ و المتغير المستقليتضمن درجات التنبؤ من نماذج اللغة. تقارن هذه التحليل الدرجات من نماذج OPT وBERT وFinBERT ونماذج قاموس Loughran-McDonald، مما يوفر رؤى حول قدراتها التنبؤية لحركات سوق الأسهم بناءً على مشاعر الأخبار. تشمل هذه التحليل جميع الأسهم العادية الأمريكية التي لديها على الأقل عنوان خبر واحد عن الشركة.-تُعرض الإحصائيات بين قوسين. تشمل الانحدارات 1 و 2 درجتين، بينما تشمل الانحدارات 3-6 درجة واحدة فقط. *. ** . *** .
الانحدار
1
2
٣
٤
٥
٦
درجة OPT
0.274*** (5.367)
0.254*** (4.871)
درجة BERT
0.142** (2.632)
0.091* (1.971)
0.129* (2.334)
درجة فينبرتو
0.257*** (5.121)
0.181*** (4.674)
درجة قاموس LM
0.083 (1.871)
ملاحظات
٩٦٥,٣٧٥
٩٦٥,٣٧٥
٩٦٥,٣٧٥
٩٦٥,٣٧٥
٩٦٥,٣٧٥
٩٦٥,٣٧٥
R2
0.221
0.217
0.195
0.145
0.174
0.087
R2 المعدل
0.183
0.184
0.195
0.145
0.174
0.087
R2 داخل
0.021
0.022
0.017
0.009
0.016
0.002
R2 ضمن المعدل
0.020
0.020
0.017
0.009
0.016
0.002
إيه آي سي
٦٤٣٧٨
٧٧,٨٨٤
62,345
٩٧٤٧٣
67,345
١٣٥,٧٨٣
بيك
١١٧,٢٣١
١٣٢,٢١٢
١١٥,٦٥٥
١١٤,٧٤٦
١٠٩,٢٧٢
123,382
جذر متوسط مربع الخطأ
5.32
11.12
٤.٢١
14.12
9.75
٢٣.٥٤
FE: التاريخ
إكس
إكس
إكس
إكس
إكس
إكس
FE: شركة
إكس
إكس
إكس
إكس
إكس
إكس
3.3. أداء المحافظ المعتمدة على المشاعر
بعد ذلك، نقيم فعالية تحليل المشاعر في إدارة المحافظ من خلال بناء محافظ مختلفة تعتمد على المشاعر، بما في ذلك المحافظ الموزونة بقيمة السوق. تم تطوير هذه المحافظ باستخدام درجات المشاعر المستمدة من نماذج لغوية مختلفة: OPT وBERT وFinBERT ونموذج قاموس لوغراند-ماكدونالد. يمكن وصف استراتيجيات الاستثمار المستخدمة في تحليلنا كما يلي: يتم استخدام كل نموذج لغوي لإنشاء ثلاث محافظ متميزة، واحدة تتكون من الأسهم ذات أعلى 20 بالمئة من درجات المشاعر الإيجابية (طويلة)، وأخرى تتكون من الأسهم ذات أعلى 20 بالمئة من درجات المشاعر السلبية (قصيرة)، ومحفظة طويلة-قصيرة ذات تمويل ذاتي (L-S) تعتمد على كل من الدرجات السلبية والإيجابية في أعلى 20 بالمئة. بالإضافة إلى ذلك، نقوم بتضمين مقارنات مرجعية مع محافظ السوق الموزونة بالقيمة والموزونة بالتساوي دون النظر في درجات المشاعر. توزع المحافظ الموزونة بالقيمة الاستثمارات بناءً على القيمة السوقية لكل سهم، بينما توزع المحافظ الموزونة بالتساوي الاستثمارات بالتساوي على جميع الأسهم، بغض النظر عن القيمة السوقية. تم اختيار المحافظ الموزونة بالقيمة والموزونة بالتساوي لتتوافق مع استراتيجيات التداول السلبية، وهي طريقة معترف بها على نطاق واسع في البحث المالي (فاما وفرينش، 1993؛ كارهارت، 1997). نقيم هذه الاستراتيجيات باستخدام مقاييس مالية رئيسية، بما في ذلك نسبة شارب، ومتوسط العوائد اليومية، والانحراف المعياري للعوائد اليومية، وأقصى انخفاض.
تظهر استراتيجية OPT الطويلة والقصيرة أفضل أداء من حيث المخاطر المعدلة، كما يتضح من نسبة شارب المتفوقة المشار إليها في الجدول 5. تتخلف استراتيجية نموذج قاموس لوغرن-ماكدونالد (L-S LM dictionary) عن الركب، خاصة عند مقارنتها بمحفظة السوق ذات الوزن القيمي. وهذا يبرز الفعالية المتفاوتة لنماذج تحليل المشاعر المختلفة في توجيه قرارات الاستثمار ويؤكد على أهمية اختيار النموذج في التداول القائم على المشاعر.
الجدول 5 إحصائيات وصفية لاستراتيجيات التداول. تقدم الجدول نسبة شارب، ومتوسط العائد اليومي (MDR)، والانحراف المعياري اليومي (StdDev) وأقصى انخفاض يومي (MDD) لاستراتيجيات التداول المستندة إلى نماذج تحليل المشاعر OPT وBERT وFinBERT وLoughran-McDonald dictionary (قاموس LM)، حيث تتكون كل منها من محافظ طويلة (L) وقصيرة (S) وطويلة-قصيرة (L-S). تم وزن المحافظ حسب القيمة للمقارنة مع محفظة السوق الموزونة بالقيمة (VW)، والتي تم توفيرها كمرجع، بالإضافة إلى محفظة موزونة بالتساوي (EW). يشير قاموس LM إلى نهج تحليل المشاعر الذي يستخدم قاموسًا من المصطلحات المالية المحددة التي طورها لوغرن وماكدونالد.
OPT
بيرت
فينبيرت
طويل
قصير
L-S
طويل
قصير
ال-س
طويل
قصير
L-S
نسبة شارب
1.81
1.42
٣.٠٥
1.59
1.28
2.11
1.51
1.19
2.07
معدل MDR (%)
0.32
0.25
0.55
0.25
0.21
0.45
0.22
0.18
0.39
الانحراف المعياري (%)
2.18
2.91
٢.٤٩
٢.٤٩
3.19
2.68
٢.٥٩
3.31
2.81
نسبة MDD (%)
-14.76
-24.69
-18.57
-17.89
-27.95
-21.95
-19.71
-29.94
-23.82
قاموس LM
يُو
فولكس فاجن
طويل
قصير
L-S
طويل
قصير
L-S
طويل
قصير
ال-س
نسبة شارب
0.87
0.66
1.23
1.25
1.05
1.40
1.28
1.08
1.45
معدل MDR (%)
0.12
0.13
0.22
0.18
0.15
0.33
0.19
0.16
0.35
الانحراف المعياري (%)
٣.٥٤
٤.١٣
3.74
٢.٩٠
٣.٧٠
٣.٢٠
٢.٩٥
٣.٧٥
٣.٢٥
نسبة MDD (%)
-35.47
-45.39
-٣٨.٢٩
-31.13
-42.21
-32.87
-28.76
-٣٨.٩٥
-31.87
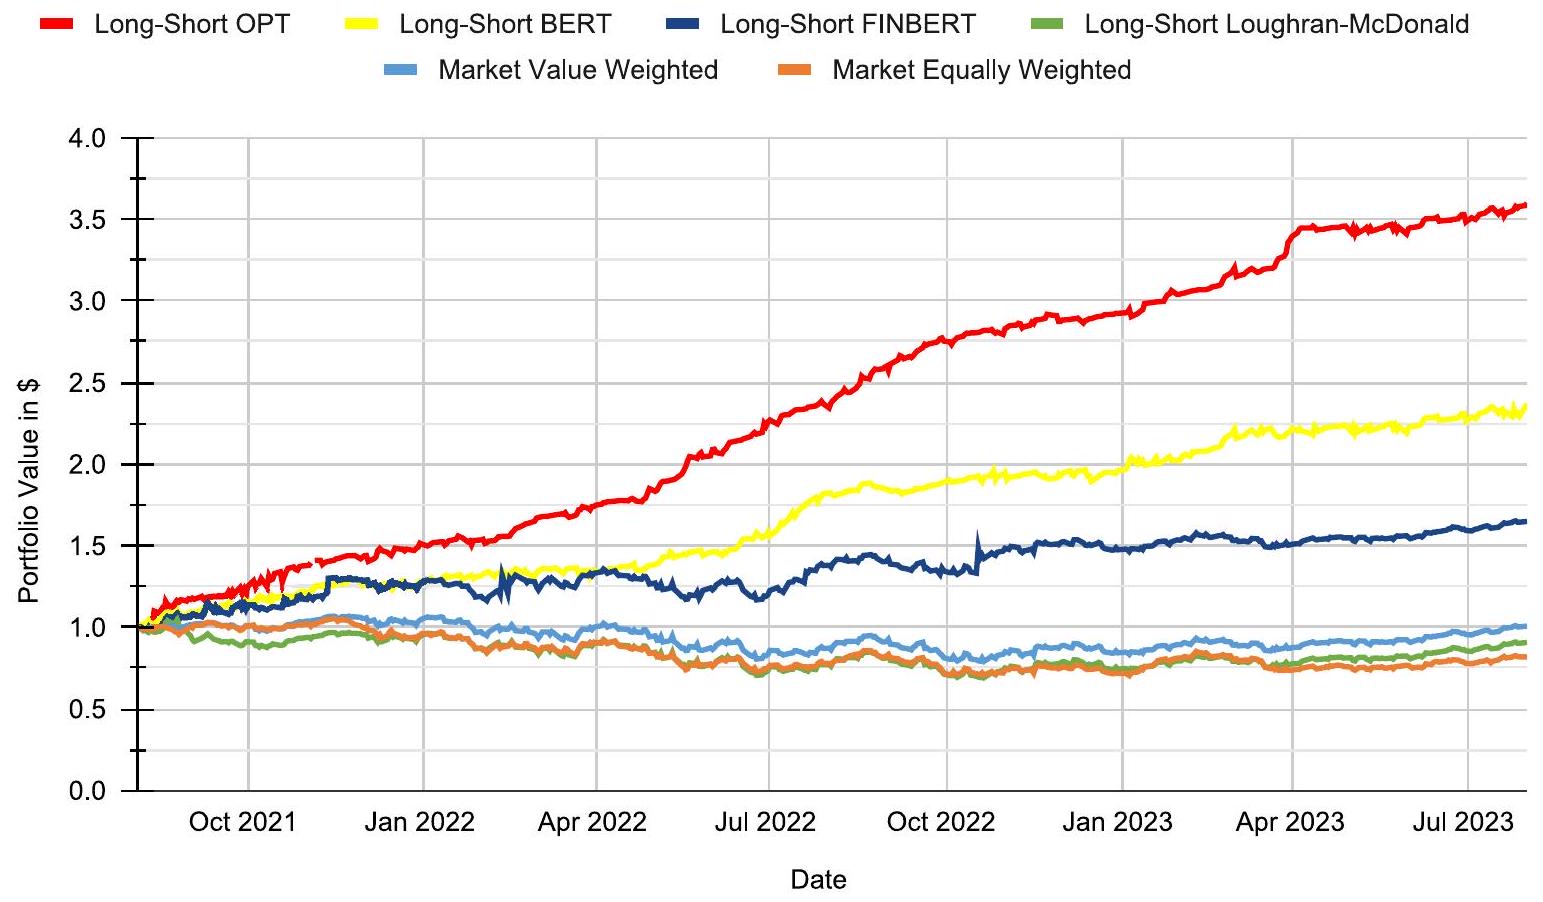
الشكل 1. العوائد التراكمية من الاستثمارمع محافظ طويلة وقصيرة الوزن بالقيمة، بدون تكلفة، تعتمد على OPT (أحمر)، BERT (أصفر)، FinBERT (أزرق داكن) وقاموس لوهاران-ماكدونالد (أخضر)، يتم إعادة توازنها يوميًا مع تكلفة معاملات تبلغ 10 نقاط أساس. للمقارنة، نعرض أيضًا محفظة سوقية موزونة بالقيمة (أزرق فاتح) ومحفظة سوقية موزونة بالتساوي (برتقالي)، كلاهما بدون تكاليف معاملات.
أخيرًا، نقوم بدراسة نتائج استراتيجيات التداول المستندة إلى مشاعر الأخبار بما في ذلك تكلفة تداول تبلغ 10 نقاط أساس من أغسطس 2021 إلى يوليو 2023. توضح الشكل 1 أداء استراتيجيات مختلفة، مع تسليط الضوء بشكل خاص على استراتيجية OPT الطويلة القصيرة بأداء مثير للإعجاب.هذا يبرز القدرة التنبؤية القوية لنماذج اللغة المتقدمة في التنبؤ بحركات السوق. استراتيجيات أخرى، مثل BERT الطويل والقصير وFinBERT الطويل والقصير، تسجل أيضًا مكاسب كبيرة من و ، في تناقض صارخ مع محافظ السوق التقليدية، التي بالكاد تتجاوز. على العكس، فإن نموذج قاموس لوغرن-ماكدونالد، الذي يُستخدم على نطاق واسع في أبحاث المالية، تمكن فقط من العودة. تشير هذه الفجوة الملحوظة إلى أن النماذج المعتمدة على القواميس لا تفسر بشكل فعال المشاعر الدقيقة الموجودة في الأخبار المالية المعاصرة كما تفعل النماذج اللغوية الأكثر تقدمًا. تدعم هذه التحليل أهمية استخدام نماذج لغوية متطورة في تطوير استراتيجيات الاستثمار بناءً على مشاعر الأخبار.
4. الخاتمة
لدراستنا آثار بعيدة المدى على الصناعة المالية، حيث تقدم رؤى يمكن أن تعيد تشكيل توقعات السوق وطرق اتخاذ قرارات الاستثمار. من خلال إظهار تطبيق نماذج OPT وBERT، نعزز فهم تطبيقات LLM في الاقتصاد المالي. وهذا يشجع على مزيد من البحث في دمج الذكاء الاصطناعي وLLMs في الأسواق المالية.
من الجدير بالذكر أن القدرات المتقدمة لنماذج اللغة الكبيرة تتجاوز الطرق التقليدية لتحليل المشاعر في التنبؤ بعوائد الأسهم وشرحها. قمنا بمقارنة أداء درجات OPT وBERT وFinBERT مع درجات المشاعر المستمدة من الطرق التقليدية مثل درجة المشاعر المقدمة من نموذج قاموس لوغرن-ماكدونالد. تكشف تحليلاتنا أن النموذج الأساسي الأخير يظهر قدرات محدودة في توقع الأسهم، مع وجود ارتباط إيجابي ضئيل أو معدوم بين درجات مشاعرهم وعوائد الأسهم اللاحقة. بالمقابل، تظهر النماذج المعقدة مثل OPT أعلى قوة في التنبؤ. على سبيل المثال، تحقق استراتيجية التمويل الذاتي المستندة إلى درجات OPT، التي تشتري الأسهم ذات الدرجات الإيجابية وتبيع الأسهم ذات الدرجات السلبية بعد إعلانات الأخبار، نسبة شارب ملحوظة تبلغ 3.05 خلال فترة عيّنتنا، مقارنةً بنسبة شارب تبلغ 1.23 للاستراتيجية المستندة إلى نموذج القاموس.
تتجاوز تداعيات بحثنا الصناعة المالية لتوجيه المنظمين وصانعي السياسات. يعزز بحثنا معرفتنا بالمزايا والمخاطر المرتبطة بالزيادة المتزايدة في استخدام نماذج اللغة الكبيرة في الاقتصاد المالي. مع توسع استخدام نماذج اللغة الكبيرة، يصبح من الضروري التركيز على تأثيرها على سلوك السوق، ونشر المعلومات، وتشكيل الأسعار. تضيف نتائجنا رؤى إلى الحوار المحيط بالسياسات التنظيمية التي تشرف على استخدام الذكاء الاصطناعي في المالية، مما يساعد في إقامة ممارسات مثلى لدمج نماذج اللغة الكبيرة في عمليات الأسواق المالية.
تقدم أبحاثنا فوائد ملموسة لمديري الأصول والمستثمرين المؤسسيين، حيث تقدم بيانات تجريبية توضح نقاط قوة نماذج اللغة الكبيرة في التنبؤ باتجاهات سوق الأسهم. في تحليلنا الذي يغطي الفترة من أغسطس 2021 إلى يوليو 2023، لاحظنا أن الاستراتيجيات استخدام مشاعر الأخبار مع نماذج اللغة المتقدمة، ولا سيما استراتيجية OPT الطويلة والقصيرة، حقق مكاسب ملحوظة، مع أداء مثير للإعجابالعائد. يتناقض هذا بشكل حاد مع الأداء المتواضع لمحافظ السوق التقليدية ونموذج قاموس لوغرانوماكدونالد، الذي تمكن فقط منتُظهر هذه النتائج الميزة الكبيرة لاستخدام نماذج اللغة المتطورة في تطوير استراتيجيات استثمار فعالة، مما يمثل تحولًا محوريًا بعيدًا عن طرق تحليل المشاعر التقليدية. تتيح هذه الأدلة لهؤلاء المحترفين اتخاذ قرارات أكثر وعيًا بشأن دمج نماذج اللغة الكبيرة في استراتيجياتهم الاستثمارية. قد لا يحسن ذلك أدائهم فحسب، بل يقلل أيضًا من اعتمادهم على طرق التحليل التقليدية.
تساهم دراستنا في النقاش حول دور الذكاء الاصطناعي في المالية، لا سيما من خلال تحقيقنا في مدى دقة نماذج اللغة الكبيرة في توقع عوائد سوق الأسهم. من خلال التحقيق في كل من الإمكانيات والحدود لنماذج اللغة الكبيرة في مجال الاقتصاد المالي، نفتح الطريق لمزيد من الأبحاث التي تهدف إلى إنشاء نماذج لغة كبيرة أكثر تقدمًا مصممة خصيصًا لتلبية الاحتياجات المميزة لقطاع المالية. هدفنا من تسليط الضوء على الأدوار المحتملة لنماذج اللغة الكبيرة في الاقتصاد المالي هو تعزيز البحث المستمر والابتكار في مجال المالية المدفوع بالذكاء الاصطناعي.
بيان مساهمة المؤلفين
كمال كيرتاج: الكتابة – المسودة الأصلية، التصور، المنهجية، تنظيم البيانات، البرمجيات، التحقيق، التحليل الرسمي.
غيدو جيرمانو: الكتابة – المراجعة والتحرير، التحقق، الإشراف.
إعلان عن تضارب المصالح
يعلن المؤلفون أنهم ليس لديهم أي مصالح مالية متنافسة معروفة أو علاقات شخصية قد تؤثر على العمل المبلغ عنه في هذه الورقة.
توفر البيانات
لا يملك المؤلفون إذنًا لمشاركة البيانات.
References
Acemoglu, D., Autor, D., Hazell, J., Restrepo, P., 2022. Artificial intelligence and jobs: Evidence from online vacancies. J. Labor Econ. 40 (S1), S293-S340. http://dx.doi.org/10.1086/718327.
Alain, G., Bengio, Y., 2016. Understanding intermediate layers using linear classifier probes. arXiv:1610.01644. http://dx.doi.org/10.48550/arXiv.1610.01644. Baker, S.R., Bloom, N., Davis, S.J., 2016. Measuring economic policy uncertainty. Q. J. Econ. 131 (4), 1593-1636. http://dx.doi.org/10.1093/qje/qjw024.
Baker, M., Wurgler, J., 2006. Investor sentiment and the cross-section of stock returns. J. Finance 61 (4), 1645-1680. http://dx.doi.org/10.1111/j.15406261.2006.00885.x.
Bybee, L., Kelly, B.T., Manela, A., Xiu, D., 2019. The structure of economic news. SSRN 3446225. http://dx.doi.org/10.2139/ssrn.3446225.
Calomiris, C.W., Mamaysky, H., 2019. How news and its context drive risk and returns around the world. J. Financ. Econ. 133 (2), 299-336. http: //dx.doi.org/10.1016/j.jfineco.2018.11.009.
Campbell, J.L., Chen, H., Dhaliwal, D.S., Lu, H.-m., Steele, L.B., 2014. The information content of mandatory risk factor disclosures in corporate filings. Rev. Account. Stud. 19 (1), 396-455. http://dx.doi.org/10.1007/s11142-013-9258-3.
Carhart, M.M., 1997. On persistence in mutual fund performance. J. Finance 52 (1), 57-82. http://dx.doi.org/10.1111/j.1540-6261.1997.tb03808.x.
Devlin, J., Chang, M.-W., Lee, K., Toutanova, K., 2019. BERT: Pre-training of deep bidirectional transformers for language understanding. In: Burstein, J., Doran, C., Solorio, T. (Eds.), Proceedings of the 2019 Conference of the North American Chapter of the Association for Computational Linguistics: Human Language Technologies, Volume 1 (Long and Short Papers). Association for Computational Linguistics, Minneapolis, Minnesota, pp. 4171-4186. http://dx.doi.org/10.18653/v1/N19-1423.
Fama, E.F., French, K.R., 1993. Common risk factors in the returns on stocks and bonds. J. Financ. Econ. 33 (1), 3-56. http://dx.doi.org/10.1016/0304-405X(93)90023-5.
Frankel, R., Jennings, J., Lee, J., 2022. Disclosure sentiment: Machine learning vs. dictionary methods. Manage. Sci. 68 (7), 5514-5532. http://dx.doi.org/10. 1287/mnsc.2021.4156.
Garcia, D., 2013. Sentiment during recessions. J. Finance 68 (3), 1267-1300. http://dx.doi.org/10.1111/jofi.12027.
Hansen, S., McMahon, M., Prat, A., 2018. Transparency and deliberation within the FOMC: A computational linguistics approach. Q. J. Econ. 133 (2), 801-870. http://dx.doi.org/10.1093/qje/qjx045.
Hoberg, G., Phillips, G., 2016. Text-based network industries and endogenous product differentiation. J. Polit. Econ. 124 (5), 1423-1465. http://dx.doi.org/10. 1086/688176.
Huang, A.H., Wang, H., Yang, Y., 2023. FinBERT: A large language model for extracting information from financial text. Contemp. Account. Res. 40 (2), 806-841. http://dx.doi.org/10.1111/1911-3846.12832.
Hugging Face, 2023. Hugging face’s transformer models. URL: https://huggingface.co.
Jegadeesh, N., Wu, D., 2013. Word power: A new approach for content analysis. J. Financ. Econ. 110 (3), 712-729. http://dx.doi.org/10.1016/j.jfineco.2013. 08.018.
Ke, Z., Kelly, B.T., Xiu, D., 2020. Predicting returns with text data. SSRN 3389884. http://dx.doi.org/10.2139/ssrn.3389884.
Lemmon, M., Ni, S.X., 2014. The impact of investor sentiment on the market’s reaction to stock splits. Rev. Financ. Stud. 27 (5), 1367-1401. http: //dx.doi.org/10.1093/rfs/hhu006.
Loughran, T., Mcdonald, B., 2011. When is a liability not a liability? Textual analysis, dictionaries, and 10-ks. J. Finance 66 (1), 35-65. http://dx.doi.org/10. 1111/j.1540-6261.2010.01625.x.
Loughran, T., McDonald, B., 2022. Master Loughran-MacDonald word dictionary. URL: https://sraf.nd.edu/loughranmcdonald-master-dictionary.
MacKinlay, A.C., 1997. Event studies in economics and finance. J. Econ. Lit. 35 (1), 13-39, URL: http://www.jstor.org/stable/2729691.
Malo, P., Sinha, A., Korhonen, P., Wallenius, J., Takala, P., 2014. Good debt or bad debt: Detecting semantic orientations in economic texts. J. Assoc. Inf. Sci. Technol. 65 (4), 782-796. http://dx.doi.org/10.1002/asi.23062.
Wolf, T., Debut, L., Sanh, V., Chaumond, J., Delangue, C., Moi, A., Cistac, P., Rault, T., Louf, R., Funtowicz, M., Davison, J., Shleifer, S., von Platen, P., Ma, C., Jernite, Y., Plu, J., Xu, C., Scao, T.L., Gugger, S., Drame, M., Lhoest, Q., Rush, A., 2020. Transformers: State-of-the-art natural language processing. In: Liu, Q., Schlangen, D. (Eds.), Proceedings of the 2020 Conference on Empirical Methods in Natural Language Processing: System Demonstrations. Association for Computational Linguistics, Minneapolis, Minnesota, pp. 38-45. http://dx.doi.org/10.18653/v1/2020.emnlp-demos.6.
Zhang, S., Roller, S., Goyal, N., Artetxe, M., Chen, M., Chen, S., Dewan, C., Diab, M., Li, X., Lin, X.V., Mihaylov, T., Ott, M., Shleifer, S., Shuster, K., Simig, D., Koura, P.S., Sridhar, A., Wang, T., Zettlemoyer, L., 2022. OPT: Open pre-trained transformer language models. arXiv:2205.01068. http: //dx.doi.org/10.48550/arXiv.2205.01068.
Kemal Kirtac , Guido Germano Department of Computer Science, University College London, 66-72 Gower Street, London WC1E 6EA, United Kingdom Systemic Risk Centre, London School of Economics and Political Science, Houghton Street, London WC2A 2AE, United Kingdom
ARTICLE INFO
JEL classification:
C53
G10
G11
G12
G14
G17
Keywords:
Natural language processing (NLP)
Large language models
Generative pre-trained transformer (GPT)
Machine learning in stock return prediction
Artificial intelligence investment strategies
Abstract
We analyse the performance of the large language models (LLMs) OPT, BERT, and FinBERT, alongside the traditional Loughran-McDonald dictionary, in the sentiment analysis of 965,375 U.S. financial news articles from 2010 to 2023. Our findings reveal that the GPT-3-based OPT model significantly outperforms the others, predicting stock market returns with an accuracy of . A long-short strategy based on OPT, accounting for 10 basis points (bps) in transaction costs, yields an exceptional Sharpe ratio of 3.05. From August 2021 to July 2023, this strategy produces an impressive gain, outperforming other strategies and traditional market portfolios. This underscores the transformative potential of LLMs in financial market prediction and portfolio management and the necessity of employing sophisticated language models to develop effective investment strategies based on news sentiment.
1. Introduction
Many texts aim to understand and predict economic and financial events. In recent decades, the financial literature has turned to various sources of text data, such as financial news articles, regulatory filings, and social media posts, to extract valuable insights. However, the integration of text mining into financial models is still in its early stages. So far, most research has only explored a small portion of text data related to financial markets, often focusing on a single data source. Typically, these studies use straightforward methods, such as determining sentiment scores from dictionaries (Loughran and Mcdonald, 2011; Malo et al., 2014). A common finance-specific dictionary used in sentiment analysis is the Loughran-McDonald master dictionary (Loughran and McDonald, 2022).
Utilizing economic and financial information in text data poses difficulties. Unlike numerical data, text data lacks consistent structure, making it more complex to handle and interpret. Language itself is inherently intricate. Therefore, sophisticated models are necessary to uncover concealed insights from text. However, these advanced models can pose challenges, particularly for researchers who lack the technical expertise, computational resources, or sufficient funding. Given this context, it becomes apparent that current efforts in textual analysis within finance and economics are only beginning to explore the possibilities. There is a significant untapped potential in textual data that can be harnessed to gain a deeper understanding of asset markets. As challenges in text analysis emerge, they signal an exciting avenue for further research. It is expected that, in the future, economists will expand their text datasets and refine their techniques to extract valuable insights (Acemoglu et al., 2022).
The primary goal of this paper is to get deeper into this exploration. We aim to create more refined representations of news text using large language models (LLMs) and leverage these representations to develop models for predicting stock returns. To appreciate the value of LLMs, it is essential to understand the current landscape of financial text mining. Most methods in current use
rely on supervised machine learning and are tailored for specific objectives, such as predicting returns, volatility, or macroeconomic variables (Jegadeesh and Wu, 2013; Baker et al., 2016; Manela and Moreira, 2017). These methods typically involve two main steps: converting text into a numerical representation and then modelling it. In many cases, researchers opt for the dictionary approach, which transforms each document into a vector that accounts for term frequency (Loughran and Mcdonald, 2011; Malo et al., 2014). Sometimes, this representation is further refined to create summarized scores that represent the text according to a domain-specific word dictionary (Tetlock, 2007). The outcome of the initial step is a matrix, which is then input into the econometric model in the subsequent step to describe various economic or financial phenomena. Studies such as Baker and Wurgler (2006), Lemmon and Ni (2014) and Shapiro et al. (2022) have highlighted the impact of investor sentiment on asset prices leveraging macro- or market-level sentiment indicators. However, these contributions do not deal with sentiment dynamics at the individual stock level, which our research aims to do by employing LLMs for a granular sentiment analysis. This approach not only enhances our understanding of sentiment’s role in financial markets, but also introduces a novel dimension to sentiment analysis by focusing on the predictive power of LLM-derived sentiment scores for individual stock performances.
Current methods for representing financial text data have inherent limitations. Starting with the dictionary method, it oversimplifies text by solely considering term frequency and overlooking important aspects like word order and contextual relationships between terms (Malo et al., 2014). Additionally, the high dimensionality of a dictionary can lead to statistical inefficiencies, requiring many parameters in the subsequent modelling phase, even when many terms might be irrelevant. Dimensionality reduction techniques like latent Dirichlet allocation (LDA) can help, but are still based on a dictionary and do not address the fundamental issue of information loss (Bybee et al., 2019). Moreover, these reduced representations are specific to a text source in a particular domain, even though incorporating multiple text sources might provide better insights (Devlin et al., 2019).
A LLM can play a crucial role in text analysis. A LLM is trained on a wide variety of texts that cover different topics (Devlin et al., 2019). Creating an LLM involves a specialized team that builds a versatile language model. This model is trained on a vast amount of text, including entire books, Wikipedia articles, and more. Once developed, LLMs are made accessible for broader research purposes (Hugging Face, 2023).
In our research, we utilize two distinct LLMs for our analysis: Bidirectional Encoder Representations from Transformers (BERT) developed by Google (Devlin et al., 2019) and Open Pre-trained Transformers (OPT) developed by Meta (Zhang et al., 2022). State-of-the-art LLMs have consistently outperformed in various natural language processing (NLP) tasks, primarily due to their extensive scale. They are often available pre-trained on platforms like Hugging Face (Hugging Face, 2023). Hugging Face is a leading opensource repository that offers a plethora of advanced NLP and AI models, making state-of-the-art machine learning techniques readily available and deployable for academic and research purposes. We constructed our analytical models by leveraging the Hugging Face transformers library (Wolf et al., 2020) and utilizing Python.
We chose BERT for its innovation in language understanding, which is critical for analysing complex financial texts. BERT’s ability to analyse the context of text from all sides improves how we interpret financial documents (Devlin et al., 2019). We would have liked to use also GPT-4 as a LLM in our research. However, we could not use the most advanced GPT models because they are not publicly available. Instead, we used OPT as a substitute. OPT is similar to the GPT models, but is open to the public (Radford et al., 2018). We used smaller versions of OPT due to our limited computer resources. For our analysis we chose BERT and OPT models with 345 million and 2.7 billion parameters (Hugging Face, 2023). Our choice of OPT and BERT provides us with powerful LLM tools to better understand financial markets and predict their movements. Furthermore, our analysis includes FinBERT, a specialized variant of the BERT LLM, specifically pre-trained for financial contexts. FinBERT is an example of how open-source BERT models can be adapted for distinct tasks in finance. Huang et al. (2023) demonstrated this adaptability by fine-tuning a BERT model for classification tasks using the Financial PhraseBank dataset, initially compiled by Malo et al. (2014). Last, we employed also the Loughran and McDonald dictionary (Loughran and Mcdonald, 2011; Loughran and McDonald, 2022) to facilitate a comparative assessment across different modelling approaches, i.e. FinBERT and our fine-tuned versions of BERT and OPT.
Our analysis is a two-step process: first, we turn text into numbers, and then we use those numbers to model economic patterns. In the first part, we choose how to represent text data numerically for the model in the second part. A popular method is the dictionary approach, which represents each text as a list of all the words and how often they appear. Sometimes, this basic list is all we use (Loughran and Mcdonald, 2011; Jegadeesh and Wu, 2013). Other times, we use the advanced LLM capabilities to analyse the news. The result of this first step is a table of numbers where each row represents a news text and each column represents a sentiment score. In the second step, we use this table to help us understand financial outcomes like stock returns or market trends. Using LLMs in the initial phase improves text representations compared to existing dictionary methods. This improvement comes from the extensive parameter space of LLMs and their training on a diverse range of language samples (Devlin et al., 2019). By enabling the use of LLMs, a wealth of knowledge becomes accessible for financial research (Huang et al., 2023). Our research primarily focuses on demonstrating the usefulness of LLM representations in modelling stock returns.
To achieve this, we conduct two separate econometric studies that leverage text mining to gain insights into the financial market. Firstly, we assess the relationship between financial news sentiment and stock returns using sentiment analysis techniques. This involves categorizing news sentiment based on the aggregated 3-day excess returns of stocks, providing a more dynamic and precise reflection of market response to news. Secondly, we conduct a regression analysis to determine how effectively LLM-derived sentiment scores predict stock returns on the following day. We utilize linear regression models with firm-specific and date-specific fixed effects, enabling a detailed evaluation of the predictive accuracy of LLMs, including OPT, BERT, and FinBERT, against traditional dictionary models. Finally, we explore practical applications through the development of distinct trading strategies based on LLM-derived sentiment scores. These strategies encompass creating long, short, and long-short portfolios, guided by sentiment scores from OPT, BERT, FinBERT and the Loughran-McDonald dictionary models. Our methodological design accounts for real-world
trading conditions by incorporating transaction costs and aligning trade execution with news release timings. This comprehensive approach not only highlights the nuanced sentiment analysis capabilities of LLMs, but also demonstrates their practical value in formulating effective trading strategies in the financial market.
This investigation both complements and extends the scope of existing scholarly works that combine text processing and machine learning approaches to tackle a range of questions in financial research (Jegadeesh and Wu, 2013; Garcia, 2013; Hoberg and Phillips, 2016; Manela and Moreira, 2017; Hansen et al., 2018; Ke et al., 2020). Additionally, it contributes to the ongoing research focused on the correlation between news sentiment and collective stock market performance (Tetlock, 2007; Campbell et al., 2014; Baker et al., 2016; Calomiris and Mamaysky, 2019; Frankel et al., 2022). A unique aspect of our study lies in exploring the capabilities of LLMs. We hypothesize that these sophisticated LLMs have the potential to unearth more profound, and perhaps previously unrecognized, insights from textual data, leading to enhanced accuracy in predicting stock market reactions.
The paper is organized as follows: Section 2 describes the data and methods we used for our study. Section 3 reports the study’s results and discusses them. Section 4 contains the conclusions.
2. Data and methods
2.1. Data
In our research, we primarily use two datasets: one from the Center for Research in Security Prices (CRSP) that includes daily stock returns, and another from Refinitiv with global news. The news data from Refinitiv comprises detailed articles and quick alerts, focusing on companies based in the U.S. The CRSP data provides daily return information for companies that trade on major U.S. stock exchanges. It includes details like stock prices, trading volumes and market capitalisation. We use this data to analyse the link between stock market returns and sentiment scores derived from LLMs.
Our analysis includes companies from the American Stock Exchange (AMEX), National Association of Securities Dealers Automated Quotations (NASDAQ) and New York Stock Exchange (NYSE) that appear in at least one news article. We apply filters to ensure the quality of our data. We only consider news articles related to individual stocks with available three-day returns. Moreover, we avoid redundancy by using a novelty score based on the similarity between articles: if a new article is too similar to an older article published within the past 20 days according to a cosine similarity score of 0.8 or more, we exclude it. This approach helps us to focus on unique information significant for our analysis.
Our study covers the period from January 1, 2010, to June 30, 2023. We matched news about 6214 unique companies. After applying our filters, we were left with 965,375 articles. Our sample dataset is summarized in Table 1.
Table 1
Summary statistics of our U.S. news articles dataset after we applied filters. “All news” is the total count of news items from Refinitiv. “News for single stock” is the post-filtering count for articles exclusively associated with individual stocks. “Unique news” is the remaining count after excluding articles with a high degree of similarity (cosine similarity score higher than 0.8 ) to any other content published within the prior five business days, ensuring a dataset without redundant information.
All news
News for single stock
Unique news
965,375
Table 2 presents descriptive statistics of our dataset. We find that the mean daily return is with a standard deviation of . The sentiment scores derived from the OPT, BERT, and FinBERT models show a normal distribution around the median of 0.5 , with slight variations in mean and standard deviation. In contrast, the Loughran-McDonald dictionary score exhibits a more positively skewed distribution with a mean of 0.68 and a higher standard deviation of 0.32 , indicating a tendency towards more positive sentiment scores in our dataset.
Table 2
Descriptive statistics for daily stock returns expressed in percentage points and sentiment scores derived from the OPT, BERT, and FinBERT models, as well as the Loughran-McDonald (LM) dictionary. The table provides the mean, standard deviation (StdDev), minimum, median, maximum, and the total count of observations for each variable related to stock returns and sentiment scores from the mentioned models and dictionary.
Mean
StdDev
Minimum
Median
Maximum
Daily return (%)
0.37
0.18
-64.97
-0.02
237.11
965,375
BERT score
0.48
0.25
0
0.5
1
965,375
OPT score
0.53
0.24
0
0.5
1
965,375
FinBERT score
0.51
0.24
0
0.5
1
965,375
LM dictionary score
0.68
0.32
0
0.5
1
965,375
2.2. Methods
This study commences with the fine-tuning of pre-trained language models, specifically BERT and OPT, sourced from Hugging Face, to tailor their capabilities for specialized financial analysis (Hugging Face, 2023). LLMs, originally designed for broad linguistic comprehension, require significant adaptation to perform niche tasks such as producing a sentiment index through textual analysis
of financial news with the ultimate aim of forecasting stock returns. This necessity enforces the adaptation phase, where the models are recalibrated after their original training on extensive data to prepare them for specific analytical functions (Radford et al., 2018).
In addition to the OPT and BERT LLMs, our analysis includes FinBERT, a variant of BERT pre-trained specifically for financial texts, and the Loughran and McDonald dictionary. Notably, FinBERT and the Loughran and McDonald dictionary do not necessitate the fine-tuning process, as they are already tailored for financial text analysis. FinBERT leverages BERT’s architecture but is finetuned on financial texts, providing nuanced understanding in this domain (Huang et al., 2023). The Loughran and McDonald dictionary, a specialized lexicon for financial texts, aids in traditional textual analysis without the complexity of machine learning models (Loughran and McDonald, 2022).
Guided by the methodologies introduced by Alain and Bengio (2016), our approach adopts a probing technique, which is a form of feature extraction. This method builds on the models’ pre-existing parameters, harnessing them to create features pertinent to text data, thereby facilitating the downstream task of sentiment analysis. To enhance the precision of our LLMs, we adapted and modified the methodology proposed by Ke et al. (2020). In our methodology, the process of fine-tuning the pre-trained OPT and BERT language models involves a specific focus on the aggregated 3-day excess return associated with each stock. This excess return is calculated from the day a news article is first published and extends over the two subsequent days. To elaborate, excess return is defined as the difference between the return of a particular stock and the overall market return on the same day. This calculation is not limited to the day the news is published; instead, it aggregates the returns for the following two days as well, providing a comprehensive three-day outlook.
Sentiment labels are assigned to each news article based on the sign of this aggregated three-day excess return. A positive aggregated excess return leads to a sentiment label of ‘ 1 ‘, indicating a positive sentiment. Conversely, a non-positive aggregated excess return results in a sentiment label of ‘0’, suggesting a negative sentiment. Our approach of using a 3-day aggregated excess return for sentiment labelling plays a crucial role in refining our analysis. It follows the common practice in economics and finance of studying events that span multiple days (MacKinlay, 1997). This approach entails evaluating returns spanning from the day of the article’s publication through the two following days. This technique is particularly beneficial in understanding the relationship between the sentiment in financial news and the corresponding movements in stock prices. We allocated of the data randomly for testing and, from the remaining data pool, allocated another randomly for validation purposes, resulting in a training set of 193,070 articles.
After completing the language model fine-tuning, our analysis continues with an empirical evaluation of these models in the context of U.S. financial news sentiment. A subset of of these articles was set aside as a test sample, allowing for an unbiased evaluation of the models’ predictive accuracy. Our analysis focused on the ability of OPT, BERT, FinBERT, and the LoughranMcDonald dictionary to accurately forecast the direction of stock returns based on news sentiment, particularly over a three-day period post-publication. To assess the models’ performance, we calculated these statistical measures: accuracy, precision, recall, specificity, and the F1 score. Accuracy is the proportion of true results (both true positives and true negatives) among the total number of cases examined. Precision (positive predictive value) is the proportion of positive identifications that were actually correct. Recall (sensitivity) is the proportion of actual positives that were identified correctly. Specificity is the proportion of actual negatives that were correctly identified. The F1 score is the harmonic mean of precision and recall, providing a single metric that balances both quantities.
We subsequently conducted a regression analysis with the objective of investigating the influence of language model scores on the subsequent day’s stock returns. The regression is modelled as
where is the return of stock on the subsequent trading day is a vector of scores from language models, and and are the fixed effects for firm and date. We employ double clustering for standard errors by firm and date, addressing potential concerns related to heteroscedasticity and autocorrelation. This regression framework facilitates an in-depth comparison of the predictive efficacy of different LLMs, including OPT, BERT, FinBERT and Loughran-McDonald dictionary variants with respect to stock returns.
Our choice of the linear regression model corresponds to a standard panel regression approach where article features are directly translated into the expected return of the corresponding stock on the next day. The simplicity of linear regression is chosen to emphasize the importance of text-based representations in financial analysis. By using linear models, we can focus on the impact of these representations without the added complexity of nonlinear modelling. This approach highlights the direct influence of textual data on financial predictions, ensuring a clear understanding of the role and effectiveness of text-based features in financial sentiment analysis.
Following our predictive analysis, our study extends to assess practical outcomes through the implementation of distinct trading strategies utilizing sentiment scores derived from OPT, BERT, FinBERT and the Loughran-McDonald dictionary models. To comprehensively evaluate these strategies, we construct various portfolios with a specific focus on market value-weighted approaches. For each language model, we create three types of portfolios: long, short, and long-short. The composition of these portfolios is contingent on the sentiment scores assigned to individual stocks every day. Specifically, the long portfolios comprise stocks with the highest sentiment scores, while the short portfolios consist of stocks with the lowest sentiment scores. Moreover, the long-short portfolios are self-financing strategies that simultaneously involve taking long positions in stocks with the highest sentiment scores and short positions in stocks with the lowest sentiment scores. We observe cumulative returns of these trading strategies considering transaction costs. We dynamically update these market value-weighted sentiment portfolios on a daily basis in response to changes in sentiment scores. This means that each day, we reevaluate and adjust the portfolios
by considering the latest sentiment data. By doing so, we aim to capture the most current market conditions and enhance the effectiveness of our trading strategies.
This method allows us to test the real-world application of sentiment analysis findings without the influence of overall market movements. We base our stock choices on their market value, giving preference to larger, more stable companies, as these often represent safer, more reliable investments, and help reduce trading costs. We synchronize our trading decisions with the timing of news releases. For news reported before 6 am , we initiate trades at the market opening on that day, exploiting immediate reaction opportunities and close the position at the same date. For news appearing between 6 am and 4 pm , we initiate a trade with closing prices of the same day and exit the trade the next trading day. Any news coming in after 4 pm was used for trades at the start of the next trading day, adapting to market operating hours. To make our simulation more aligned with actual trading conditions, we included a transaction cost of 10 basis points for each trade, accounting for the typical costs traders would encounter in the market.
3. Results
3.1. Sentiment analysis accuracy in U.S. financial news
In this study, we used LLMs to analyse sentiment in U.S. financial news. We processed a dataset of 965,375 articles from Refinitiv, spanning from January 1, 2010, to June 30, 2023. We used of these articles as a test set. We measured the accuracy of each model in predicting the direction of stock returns based on news sentiment. This accuracy indicates how well the model links the sentiment in financial news with stock returns over a three-day period. We evaluated four models: OPT, BERT, FinBERT and the Loughran-McDonald dictionary. Their performance in sentiment analysis is shown in Table 3.
Table 3
Language model performance metrics: accuracy, precision, recall, specificity, and the F1 score for each model. The OPT model is the most accurate, followed closely by BERT and FinBERT.
Metric
OPT
BERT
FinBERT
Loughran-McDonald
Accuracy
0.744
0.725
0.722
0.501
Precision
0.732
0.711
0.708
0.505
Recall
0.781
0.761
0.755
0.513
Specificity
0.711
0.693
0.685
0.522
F1 score
0.754
0.734
0.731
0.508
The results show that the OPT model is the most accurate, followed closely by BERT and FinBERT. The Loughran-McDonald dictionary, a traditional finance text analysis tool, has significantly lower accuracy. This indicates that language models like OPT, BERT, and FinBERT are better at understanding and analysing complex financial news. The precision and recall values further support the superiority of the OPT model; its F1 score, which combines precision and recall, also confirms its effectiveness in sentiment analysis. These findings confirm that language models, particularly OPT, are valuable tools for analysing financial news and predicting stock market trends.
3.2. Predicting returns with LLM scores
This section assesses the ability of various LLMs to predict stock returns for the next day using regression models. Our regression with Eq. (1) uses LLM-generated scores from news headlines as the main predictors. To account for unobserved variations, these regressions include fixed effects for both firms and time, and we cluster standard errors by date and firm for added robustness. Table 4 provides our regression findings, focusing on how stock returns correlate with predictive scores from advanced LLMs, specifically OPT, BERT, FinBERT and the Loughran-McDonald dictionary models.
Our findings reveal the predictive capabilities of the advanced LLMs. The OPT model, in particular, demonstrates a strong correlation with next-day stock returns, as indicated by significant coefficients in different model specifications. The FinBERT model follows closely, showcasing its own robust predictive power. BERT scores, while more modest in their predictive strength, still show a statistically significant relationship with stock returns. We also observe that the predictive strength increases when both LLMs are used as independent variables in the same regression. In contrast, the Loughran-McDonald dictionary model exhibits the least predictive power among the models examined.
Our analysis suggests that several factors contribute to explain the different performance among OPT, BERT and FinBERT, notably model design, parameter scale, and the specificity of training data. OPT’s expanded parameter space, exceeding that of BERT and FinBERT, alongside its advanced training methodologies, is likely to cause its superior forecasting accuracy in stock returns and portfolio management. Furthermore, the nuanced performance of FinBERT, despite its financial domain specialization, raises intriguing considerations. Our exploration detailed in Section 3.3 posits that the broader pre-training data diversity of BERT and the potential for overfitting in highly specialized models such as FinBERT might explain this unexpected outcome. These insights collectively emphasize the intricate balance between model specificity, scale, and training regimen in optimizing predictive performance within financial sentiment analysis.
The robustness of our regression models is further underscored by the inclusion of a substantial number of observations, ensuring a comprehensive and representative analysis. Additionally, the adjusted -squared values, while moderate, indicate a reasonable level of explanatory power within the models. The reported AIC and BIC values aid in assessing model fit and complexity, further enriching our comparative analysis across different LLMs.
Table 4
Regression results of stock returns on LLM sentiment scores done with Eq. (1), which includes firm and time fixed effects (FE) represented by and . The independent variable includes prediction scores from the language models. This analysis compares scores from OPT, BERT, FinBERT and Loughran-McDonald dictionary models, providing insights into their predictive abilities for stock market movements based on news sentiment. This analysis encompasses all U.S. common stocks with at least one news headline about the firm. -statistics are presented in parentheses. Regressions 1 and 2 include two scores, regressions 3-6 only one. * . ** . *** .
Regression
1
2
3
4
5
6
OPT score
0.274*** (5.367)
0.254*** (4.871)
BERT score
0.142** (2.632)
0.091* (1.971)
0.129* (2.334)
FinBERT score
0.257*** (5.121)
0.181*** (4.674)
LM dictionary score
0.083 (1.871)
Observations
965,375
965,375
965,375
965,375
965,375
965,375
R2
0.221
0.217
0.195
0.145
0.174
0.087
R2 adjusted
0.183
0.184
0.195
0.145
0.174
0.087
R2 within
0.021
0.022
0.017
0.009
0.016
0.002
R2 within adjusted
0.020
0.020
0.017
0.009
0.016
0.002
AIC
64,378
77,884
62,345
97,473
67,345
135,783
BIC
117,231
132,212
115,655
114,746
109,272
123,382
RMSE
5.32
11.12
4.21
14.12
9.75
23.54
FE: date
X
X
X
X
X
X
FE: firm
X
X
X
X
X
X
3.3. Performance of sentiment-based portfolios
Next, we assess the effectiveness of sentiment analysis in portfolio management by constructing various sentiment-based portfolios, including market value-weighted portfolios. These portfolios are developed using sentiment scores derived from different language models: OPT, BERT, FinBERT, and the Loughran-McDonald dictionary model. The investment strategies employed in our analysis can be described as follows: each LLM is utilised to create three distinct portfolios, one composed of stocks with top 20 percentile positive sentiment scores (long), another comprising stocks with top 20 percentile negative sentiment scores (short), and a self-financing long-short portfolio (L-S) based on both top 20 percentile negative and positive scores. Additionally, we include benchmark comparisons with value-weighted and equal-weighted market portfolios without considering sentiment scores. Valueweighted portfolios distribute investments based on the market capitalisation of each stock, while equal-weighted portfolios allocate investments equally to all stocks, regardless of market capitalisation. The selection of value-weighted and equal-weighted market portfolios was made to align with passive trading strategies, a widely acknowledged method in financial research (Fama and French, 1993; Carhart, 1997). We evaluate these strategies using key financial metrics, including the Sharpe ratio, mean daily returns, standard deviation of daily returns, and maximum drawdown.
The long-short OPT strategy demonstrates the most robust risk-adjusted performance, as evidenced by its superior Sharpe ratio indicated in Table 5. The Loughran-McDonald dictionary model-based strategy (L-S LM dictionary) laggs behind, particularly when compared to the value-weighted market portfolio. This highlights the varying effectiveness of different sentiment analysis models in guiding investment decisions and underscores the significance of model selection in sentiment-based trading.
Table 5
Descriptive statistics of trading strategies. The table presents the Sharpe ratio, mean daily return (MDR), daily standard deviation (StdDev) and the maximum daily drawdown (MDD) for the trading strategies based on the sentiment analysis models OPT, BERT, FinBERT, and Loughran-McDonald dictionary (LM dictionary), each comprising long (L), short (S), and long-short (L-S) portfolios. The portfolios are value-weighted for comparison to a value-weighted (VW) market portfolio, which is provided for benchmarking, as well as an equal-weighted (EW) portfolio. LM dictionary refers to a sentiment analysis approach that uses a dictionary of finance-specific terms developed by Loughran and McDonald.
OPT
BERT
FinBERT
Long
Short
L-S
Long
Short
L-S
Long
Short
L-S
Sharpe ratio
1.81
1.42
3.05
1.59
1.28
2.11
1.51
1.19
2.07
MDR (%)
0.32
0.25
0.55
0.25
0.21
0.45
0.22
0.18
0.39
StdDev (%)
2.18
2.91
2.49
2.49
3.19
2.68
2.59
3.31
2.81
MDD (%)
-14.76
-24.69
-18.57
-17.89
-27.95
-21.95
-19.71
-29.94
-23.82
LM dictionary
EW
VW
Long
Short
L-S
Long
Short
L-S
Long
Short
L-S
Sharpe ratio
0.87
0.66
1.23
1.25
1.05
1.40
1.28
1.08
1.45
MDR (%)
0.12
0.13
0.22
0.18
0.15
0.33
0.19
0.16
0.35
StdDev (%)
3.54
4.13
3.74
2.90
3.70
3.20
2.95
3.75
3.25
MDD (%)
-35.47
-45.39
-38.29
-31.13
-42.21
-32.87
-28.76
-38.95
-31.87
Fig. 1. Cumulative returns from investing with value-weighted, zero-cost long-short portfolios based on OPT (red), BERT (yellow), FinBERT (dark blue) and the Loughran-McDonald dictionary (green), rebalanced daily with a 10 bps transaction cost. For comparison, we also show a value-weighted market portfolio (light blue) and an equal-weighted market portfolio (orange), both without transaction costs.
Finally, we examine the outcomes of trading strategies based on news sentiment including a 10 bps trading cost from August 2021 to July 2023. Fig. 1 illustrates the performance of various strategies, notably highlighting the long-short OPT strategy with an impressive gain. This underscores the powerful predictive capability of advanced language models in forecasting market movements. Other strategies, such as long-short BERT and long-short FinBERT, also register significant gains of and , in stark contrast to traditional market portfolios, which barely exceed . Conversely, the Loughran-McDonald dictionary model, extensively employed in finance research, managed only a return. This pronounced disparity suggests that dictionary-based models do not effectively interpret the nuanced sentiments present in contemporary financial news as efficiently as more advanced language models. This analysis substantiates the importance of employing sophisticated language models in developing investment strategies based on news sentiment.
4. Conclusion
Our study has far-reaching implications for the financial industry, offering insights that could reshape market prediction and investment decision-making methodologies. By demonstrating the application of OPT and BERT models, we enhance the understanding of LLM applications in financial economics. This encourages further research into integrating artificial intelligence and LLMs in financial markets.
Notably, the advanced capabilities of LLMs surpass traditional sentiment analysis methods in predicting and explaining stock returns. We compared the performance of OPT, BERT and FinBERT scores to sentiment scores derived from conventional methods such as the sentiment score provided by the Loughran-McDonald dictionary model. Our analysis reveals that the latter basic model exhibits limited stock forecasting capabilities, with little to no significant positive correlation between their sentiment scores and subsequent stock returns. In contrast, complex models like OPT demonstrate the highest prediction power. For instance, a selffinancing strategy based on OPT scores, buying stocks with positive scores and selling stocks with negative scores after news announcements, achieves a remarkable Sharpe ratio of 3.05 over our sample period, compared to a Sharpe ratio of 1.23 for the strategy based on the dictionary model.
The implications of our research reach beyond the financial industry to inform regulators and policymakers. Our research enhances our knowledge of the advantages and risks linked to the increasing use of LLMs in financial economics. As LLM usage expands, it becomes crucial to focus on their impact on market behaviour, information dissemination, and price formation. Our results add insights to the dialogue surrounding regulatory policies that oversee the use of AI in finance, thereby aiding in the establishment of optimal practices for incorporating LLMs into the operations of financial markets.
Our research offers tangible benefits to asset managers and institutional investors, presenting empirical data that demonstrates the strengths of LLMs in forecasting stock market trends. In our analysis covering August 2021 to July 2023, we observed that strategies
utilizing news sentiment with advanced language models, notably the long-short OPT strategy, achieved remarkable gains, with an impressive return. This starkly contrasts with the modest performance of traditional market portfolios and the LoughranMcDonald dictionary model, which only managed a return. These findings highlight the significant advantage of employing sophisticated language models in developing effective investment strategies, marking a pivotal shift away from traditional sentiment analysis methods. Such evidence enables these professionals to make more informed choices regarding the integration of LLMs into their investment strategies. This could not only improve their performance but also decrease their dependence on traditional methods of analysis.
Our study contributes to the debate about the role of AI in finance, particularly through our investigation into how well LLMs predict stock market returns. By investigating both the possibilities and the boundaries of LLMs in the domain of financial economics, we open the way for further research aimed at creating more advanced LLMs specifically designed for the distinctive needs of the finance sector. Our goal in highlighting the potential roles of LLMs in financial economics is to foster ongoing research and innovation in the field of finance that is driven by artificial intelligence.
CRediT authorship contribution statement
Kemal Kirtac: Writing – original draft, Conceptualization, Methodology, Data Curation, Software, Investigation, Formal analysis.
Guido Germano: Writing – review & editing, Validation, Supervision.
Declaration of competing interest
The authors declare that they have no known competing financial interests or personal relationships that could have appeared to influence the work reported in this paper.
Data availability
The authors do not have permission to share data.
References
Acemoglu, D., Autor, D., Hazell, J., Restrepo, P., 2022. Artificial intelligence and jobs: Evidence from online vacancies. J. Labor Econ. 40 (S1), S293-S340. http://dx.doi.org/10.1086/718327.
Alain, G., Bengio, Y., 2016. Understanding intermediate layers using linear classifier probes. arXiv:1610.01644. http://dx.doi.org/10.48550/arXiv.1610.01644. Baker, S.R., Bloom, N., Davis, S.J., 2016. Measuring economic policy uncertainty. Q. J. Econ. 131 (4), 1593-1636. http://dx.doi.org/10.1093/qje/qjw024.
Baker, M., Wurgler, J., 2006. Investor sentiment and the cross-section of stock returns. J. Finance 61 (4), 1645-1680. http://dx.doi.org/10.1111/j.15406261.2006.00885.x.
Bybee, L., Kelly, B.T., Manela, A., Xiu, D., 2019. The structure of economic news. SSRN 3446225. http://dx.doi.org/10.2139/ssrn.3446225.
Calomiris, C.W., Mamaysky, H., 2019. How news and its context drive risk and returns around the world. J. Financ. Econ. 133 (2), 299-336. http: //dx.doi.org/10.1016/j.jfineco.2018.11.009.
Campbell, J.L., Chen, H., Dhaliwal, D.S., Lu, H.-m., Steele, L.B., 2014. The information content of mandatory risk factor disclosures in corporate filings. Rev. Account. Stud. 19 (1), 396-455. http://dx.doi.org/10.1007/s11142-013-9258-3.
Carhart, M.M., 1997. On persistence in mutual fund performance. J. Finance 52 (1), 57-82. http://dx.doi.org/10.1111/j.1540-6261.1997.tb03808.x.
Devlin, J., Chang, M.-W., Lee, K., Toutanova, K., 2019. BERT: Pre-training of deep bidirectional transformers for language understanding. In: Burstein, J., Doran, C., Solorio, T. (Eds.), Proceedings of the 2019 Conference of the North American Chapter of the Association for Computational Linguistics: Human Language Technologies, Volume 1 (Long and Short Papers). Association for Computational Linguistics, Minneapolis, Minnesota, pp. 4171-4186. http://dx.doi.org/10.18653/v1/N19-1423.
Fama, E.F., French, K.R., 1993. Common risk factors in the returns on stocks and bonds. J. Financ. Econ. 33 (1), 3-56. http://dx.doi.org/10.1016/0304-405X(93)90023-5.
Frankel, R., Jennings, J., Lee, J., 2022. Disclosure sentiment: Machine learning vs. dictionary methods. Manage. Sci. 68 (7), 5514-5532. http://dx.doi.org/10. 1287/mnsc.2021.4156.
Garcia, D., 2013. Sentiment during recessions. J. Finance 68 (3), 1267-1300. http://dx.doi.org/10.1111/jofi.12027.
Hansen, S., McMahon, M., Prat, A., 2018. Transparency and deliberation within the FOMC: A computational linguistics approach. Q. J. Econ. 133 (2), 801-870. http://dx.doi.org/10.1093/qje/qjx045.
Hoberg, G., Phillips, G., 2016. Text-based network industries and endogenous product differentiation. J. Polit. Econ. 124 (5), 1423-1465. http://dx.doi.org/10. 1086/688176.
Huang, A.H., Wang, H., Yang, Y., 2023. FinBERT: A large language model for extracting information from financial text. Contemp. Account. Res. 40 (2), 806-841. http://dx.doi.org/10.1111/1911-3846.12832.
Hugging Face, 2023. Hugging face’s transformer models. URL: https://huggingface.co.
Jegadeesh, N., Wu, D., 2013. Word power: A new approach for content analysis. J. Financ. Econ. 110 (3), 712-729. http://dx.doi.org/10.1016/j.jfineco.2013. 08.018.
Ke, Z., Kelly, B.T., Xiu, D., 2020. Predicting returns with text data. SSRN 3389884. http://dx.doi.org/10.2139/ssrn.3389884.
Lemmon, M., Ni, S.X., 2014. The impact of investor sentiment on the market’s reaction to stock splits. Rev. Financ. Stud. 27 (5), 1367-1401. http: //dx.doi.org/10.1093/rfs/hhu006.
Loughran, T., Mcdonald, B., 2011. When is a liability not a liability? Textual analysis, dictionaries, and 10-ks. J. Finance 66 (1), 35-65. http://dx.doi.org/10. 1111/j.1540-6261.2010.01625.x.
Loughran, T., McDonald, B., 2022. Master Loughran-MacDonald word dictionary. URL: https://sraf.nd.edu/loughranmcdonald-master-dictionary.
MacKinlay, A.C., 1997. Event studies in economics and finance. J. Econ. Lit. 35 (1), 13-39, URL: http://www.jstor.org/stable/2729691.
Malo, P., Sinha, A., Korhonen, P., Wallenius, J., Takala, P., 2014. Good debt or bad debt: Detecting semantic orientations in economic texts. J. Assoc. Inf. Sci. Technol. 65 (4), 782-796. http://dx.doi.org/10.1002/asi.23062.
Wolf, T., Debut, L., Sanh, V., Chaumond, J., Delangue, C., Moi, A., Cistac, P., Rault, T., Louf, R., Funtowicz, M., Davison, J., Shleifer, S., von Platen, P., Ma, C., Jernite, Y., Plu, J., Xu, C., Scao, T.L., Gugger, S., Drame, M., Lhoest, Q., Rush, A., 2020. Transformers: State-of-the-art natural language processing. In: Liu, Q., Schlangen, D. (Eds.), Proceedings of the 2020 Conference on Empirical Methods in Natural Language Processing: System Demonstrations. Association for Computational Linguistics, Minneapolis, Minnesota, pp. 38-45. http://dx.doi.org/10.18653/v1/2020.emnlp-demos.6.
Zhang, S., Roller, S., Goyal, N., Artetxe, M., Chen, M., Chen, S., Dewan, C., Diab, M., Li, X., Lin, X.V., Mihaylov, T., Ott, M., Shleifer, S., Shuster, K., Simig, D., Koura, P.S., Sridhar, A., Wang, T., Zettlemoyer, L., 2022. OPT: Open pre-trained transformer language models. arXiv:2205.01068. http: //dx.doi.org/10.48550/arXiv.2205.01068.