ترابط الأيض بين الخلايا الدبقية قليلة التغصن والمحاور يتم بواسطة البوتاسيوم الخارجي K+ ويحافظ على صحة المحاور Oligodendrocyte–axon metabolic coupling is mediated by extracellular K+ and maintains axonal health
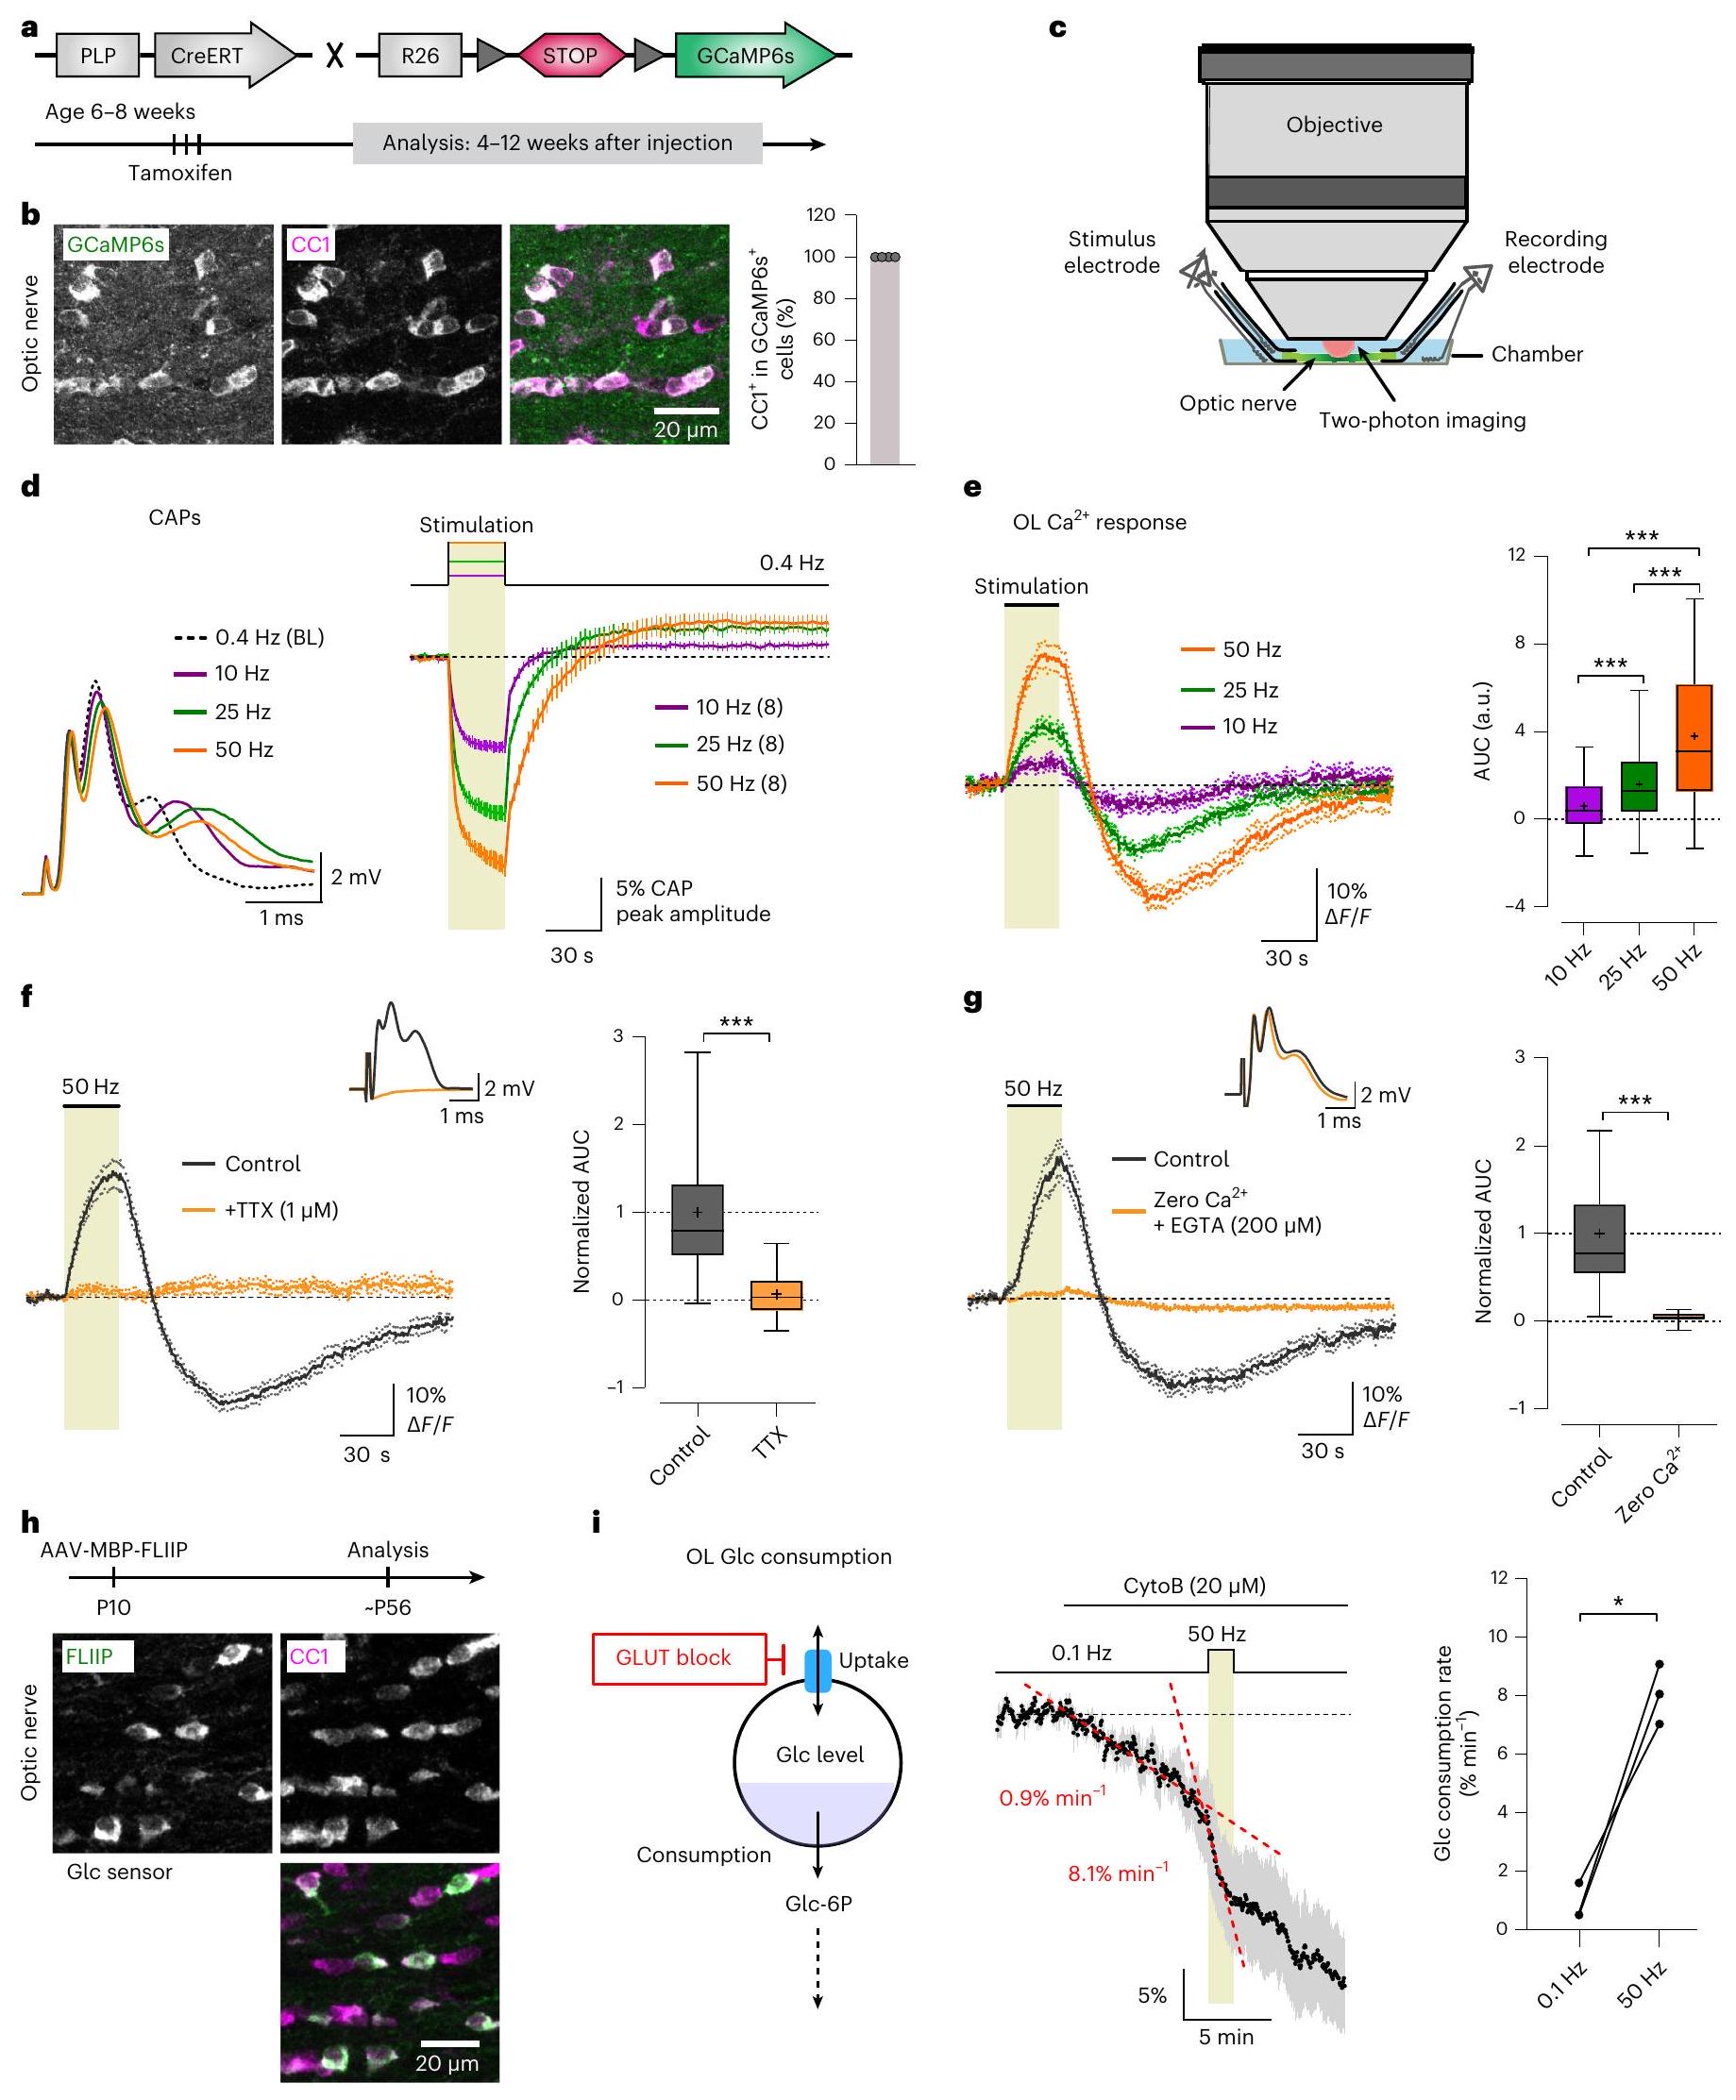
تعتمد سلامة المحاور الميالينية على الدعم الهوموستاتيكي من الخلايا الدبقية قليلة التغصن (OLs). لتحديد كيفية اكتشاف الخلايا الدبقية قليلة التغصن للنبضات المحورية وكيفية تنظيم الاقتران الأيضي السريع بين المحاور والخلايا الدبقية قليلة التغصن في المادة البيضاء، درسنا الكالسيوم المعتمد على النشاط ( ) وتدفقات المستقلبات في العصب البصري للفأر. نوضح أن النبضات السريعة في المحاور العصبية تحفز الإشارات والجليكوليز في خلايا الدبق. تكتشف خلايا الدبق النشاط المحوري من خلال الزيادات في البوتاسيوم خارج الخلوي (تركيزات وتفعيل قنوات Kir4.1، مما ينظم إمداد المستقلبات إلى المحاور. كل من تثبيط الأدوية والتعطيل المحدد للأوليغوديندروغليا لـ Kir4.1 يقلل من الزيادة في اللاكتات المحورية الناتجة عن النشاط. الفئران التي تفتقر إلى Kir4.1 الأوليغوديندروغليا تظهر مستويات لاكتات resting أقل وتغيرات في استقلاب الجلوكوز في المحاور. هذه العجز المبكر في استقلاب الطاقة المحورية مرتبط بظهور متأخر للآفة المحورية. تكشف نتائجنا أن الأوليغوديندروغليا تكتشف النبضات السريعة في المحاور من خلالالإشارة، مما يجعل الربط الأيضي الحاد ممكنًا ويضبط وحدة الأيض بين المحور العصبي وخلايا الدبق لتحسين صحة المحور العصبي.
تنتج الخلايا الدبقية قليلة التغصن (OLs) وتحافظ على أغشية المايلين حول المحاور، مما يجعل التواصل السريع والاقتصادي بين الخلايا العصبية البعيدة ممكنًا. صحة المحاور أمر حاسم لوظيفة الدماغ، وتعتبر إصابة المحاور سمة من سمات الشيخوخة والعديد من الاضطرابات العصبية.تشير الأدلة المتزايدة إلى أنه، بالإضافة إلى تنظيم سرعة الإشارات المحورية، تلعب خلايا الدبق العصبي دورًا مهمًا في الحفاظ على الدوائر العصبية وسلامة الخلايا العصبية على المدى الطويل.في السنوات الأخيرة، أظهرت عدة دراسات أن خلايا الدبق (OLs) تساهم في دعم عملية الأيض الطاقي المحوري.يمكن لخلايا الدبق (OLs) الحفاظ على وظائفها من خلال التحلل الجليكولي الهوائي فقط، نظرًا للحفاظ على سلامة المادة البيضاء في الفئران الطافرة Cox10، حيث يتم تعطيل التنفس الميتوكوندري بشكل خاص في خلايا الدبق.نتيجة ضرورية من التحلل الجليكولي الهوائي هي إنتاج اللاكتات، التي يمكن أن تعمل كمصدر للطاقة للمحاور العصبية.. في الواقع، الحذف المحدد لـ OL يؤدي نقص ناقل أحادي الكربوكسيلات 1 (MCT1) إلى اعتلال المحاور المتأخر، مما يعني أن إفراز اللاكتات و/أو البيروفات من الخلايا الدبقية قليلة التغصن له دور في صحة المحاور.لقد أظهرت الإشارات الغلوتاماترية أنها تحفز التعبير السطحي لناقل الجلوكوز 1 (GLUT1) في الخلايا الدبقية قليلة التغصن، مما يشير إلى أن النشاط المحوري قد ينظم الدعم الأيضي الذي تقدمه الخلايا الدبقية قليلة التغصن للمحاور.يمكن تسهيل إمداد المستقلبات من خلال قنوات سيتوسولية داخل غمد المايلينوقد ارتبطت الاضطرابات في نظام القنوات المايلينية هذا بتلف المحاور العصبيةعلاوة على ذلك، فإن الفئران التي تفتقر إلى بروتين الدهون البروتينية المايلينية (PLP)، وهو نموذج للفئران يعاني من الشلل النصفي التشنجي، تتطور لديها كريات محورية شديدة مع التقدم في العمر.ربما بسبب العجز في النقل المحوريتغيرات في وظيفة الميتوكوندرياوخلل في توازن الطاقةتشمل الوظائف الأخرى التي تقوم بها الخلايا الدبقية الزيتونية دعم مضادات الأكسدة و تخزين مؤقت.
على الرغم من الفكرة السائدة بأن الخلايا الدبقية قليلة التغصن تدعم الأيض الطاقي المحوري، إلا أن الأحداث الجزيئية والخلوية المعنية في الربط الأيضي لا تزال غامضة. لا يزال غير واضح ما إذا كانت النشاطات العصبية تؤثر على الخلايا الدبقية قليلة التغصن لدفع الدعم الأيضي. قد يكون الإشارات الغلوتاماتية هي الوسيط في التكيف طويل الأمد لقدرة امتصاص الجلوكوز من قبل الخلايا الدبقية قليلة التغصن.لكن ما يتحكم في توصيل سريع وعند الطلب للمواد الأيضية إلى المحاور لا يزال غير مستكشف.
بغض النظر عن نوع الخلايا العصبية، فإن مؤشرًا رئيسيًا لنشاط المحاور هو الزيادات العابرة في السائل خارج الخليةتركيزات ( )، التي تقوم بإزالة الاستقطاب للغشاء البلازمي لـ . هنا، افترضنا أن النشاط المدفوعتشير الإشارات إلى ارتباط سريع في الأيض بين الخلايا الدبقية (OLs) والمحاور العصبية. تناولنا هذا السؤال من خلال علم كهربائية الأعصاب البصرية وتصوير الفوتونين، وهو مزيج تم استخدامه سابقًا لدراسة ديناميات ATP في المحاور العصبية.وجدنا أن النبضات المحورية عالية التردد تحفزت surge وتسرع على الفور استهلاك الجلوكوز في OLs. يتم اكتشاف النشاط المحوري بواسطة OLs بشكل أساسي من خلال الزيادات فيوتفعيل قنوات Kir4.1. كل من التحفيز عالي التردد وارتفاعيستحث زيادة في اللاكتات في المحاور العصبية، والتي تقلل بواسطة تثبيط كيميائي لـ Kir4.1. علاوة على ذلك، فإن حجب Kir4.1 يعيق استعادة إطلاق المحاور العصبية بعد التحفيز عالي التردد. باستخدام فئران knockout الخاصة بـ OL والتي تفتقر إلى Kir4.1 (Kir4.1;MOGiCre، المشار إليه فيما بعد بـ Kir4.1cKO)، نوضح أن ديناميات اللاكتات المحورية يتم التحكم فيها بواسطة Kir4.1 في الخلايا الدبقية، وأن الخلايا الدبقية هي الخلايا الرئيسية المعنية في الاعتماد على النشاطالتخليص. علاوة على ذلك، فإن امتصاص الجلوكوز في المحاور واستهلاكه ينخفض في فئران Kir4.1 cKO، مما يكشف أن خلايا الدبق (OLs) تنظم أيضًا استقلاب الجلوكوز في المحاور. يمكن أن تؤثر هذه العجز المبكر في استقلاب الطاقة في المحاور على النقل الحويصلي والقدرة المضادة للأكسدة، مما يؤدي إلى تلف المحاور الذي يظهر في وقت متأخر والذي تم اكتشافه في فئران Kir4.1 cKO. تشير نتائجنا إلى أن الزيادة فيأثناء النبضات السريعة في المحاور، يحفز التفاعل الأيضي بين المحور والخلايا الدبقية قليلة التغصن، وأن الخلايا الدبقية قليلة التغصنتوازن الحالة الداخلية ينظم استقلاب الطاقة المحورية، الوظيفة والبقاء.
النتائج
إطلاق النبضات المحوريةالإشارات والجليكوليز في الخلايا الدهنية
للتحقيقديناميات في OLs الناضجة كدالة للنشاط الكهربائي، استخدمنا فئران PLP-CreERTتزاوجت مع فئران Ai96 التي تعبر عن السيتوسولمؤشر GCaMP6s بطريقة تعتمد على Cre (RCL-GCaMP6s)درسنا الفئران من نوع PLP-CreERT;RCL-GCaMP6s التي تتراوح أعمارها بين 3 إلى 5 أشهر والتي تم علاجها بالتاموكسيفين في عمر 6-8 أسابيع (الشكل 1أ). أكدنا من خلال الكيمياء المناعية (الجدول 1) أن تعبير GCaMP6s كان مقصورًا على الخلايا الدبقية الناضجة (الإيجابية لمؤشر CC1) (الشكل 1ب). ركزنا على العصب البصري، وهو مسار من المادة البيضاء الميالينية المثالي لتسجيل إمكانات العمل المركبة (CAPs) ولتصوير المستشعرات باستخدام الفوتونات الثنائية. (الشكل 1ج). لتحديد ما إذا كانت الخلايا الدبقية الناضجة تكتشف النبضات المحورية، قمنا بتحفيز الأعصاب البصرية بتردد 10 أو 25 أو 50 هرتز. لمدة 30 ثانية. قبل وبعد هذه الفترة، تلقت الأعصابنبضات كهربائية لمراقبة تغييرات CAP جنبًا إلى جنب مع OL التصوير. انخفضت سعة ذروة CAP خلال التحفيز عالي التردد (الشكل 1d). ومن الجدير بالذكر أن التحفيز المحوري أدى إلى استجابة ثنائية الطور استجابة في OL سومات، تتميز بـ زيادة خلال التحفيز وانخفاض مؤقت بعد التحفيز (الشكل 1e والفيديو التكميلي 1). الـ كانت الاستجابة أكبر بكثير عند الترددات العالية (الشكل 1e). التيتروتوكسين (TTX، ) التطبيق ألغى التحفيز الناتج عن زيادة في OLs (الشكل 1f)، مما يؤكد ضرورة النبضات المحورية. إزالة خارج الخليةكما قلل من OLاستجابة (الشكل 1 ج)، مما يشير إلى آلية تتضمنتدفق.
مع الاعتراف بأن خلايا الدبق (OLs) تكتشف النشاط الكهربائي المحوري، تساءلنا بعد ذلك عما إذا كان النشاط المحوري المتزايد يؤثر على تدفق الأيض داخل خلايا الدبق. بالنظر إلى أن خلايا الدبق قد تزود المحاور بمنتجات تحلل السكر مثل البيروفات أو اللاكتات، فإن زيادة النشاط الكهربائي المحوري قد تعزز استهلاك الجلوكوز في خلايا الدبق. لدراسة ذلك، قمنا بتعبير مستشعر الجلوكوز FLII12Pglu700. (FLIIP) في خلايا الدبق العصبي في العصب البصري للفئران من النوع البري من خلال توصيل الفيروس المرتبط بالعدوى (AAV) (الشكل 1h,i). أكدت تلوين CC1 المناعي تعبير المستشعر في خلايا الدبق الناضجة (الشكل 1h). قمنا أولاً بتقييم استجابة المستشعر لتقلبات الجلوكوز. أدى إزالة الجلوكوز خارج الخلوي إلى خفض مستويات الجلوكوز السيتوزولي في خلايا الدبق، بينما أدى حجب التحلل السكري باستخدام 1 مللي مول من اليودوأسيتات (IA) في سائل الدماغ الشوكي الاصطناعي (ACSF) الذي يحتوي على 10 مللي مول من الجلوكوز إلى زيادة مستويات الجلوكوز (الشكل الممتد 1a,b)، مما يؤكد وظيفة المستشعر لدراسة استقلاب الجلوكوز في خلايا الدبق. لتحليل تدفق التحلل السكري، قمنا بتثبيط ناقلات الجلوكوز باستخدامالسيتوكالاسين ب (CytoB) وقمنا بقياس معدل انخفاض الجلوكوز (الشكل 1i)، كما تم توضيحه سابقًابشكل ملحوظ، عابرأدى تحفيز المحاور العصبية إلى تسريع استهلاك الجلوكوز من قبل الخلايا الدبقية قليلة التغصن بحوالي تسع مرات مقارنة بمعدل الأساس عند تحفيز 0.1 هرتز (الشكل 1i). وبالتالي، تستجيب الخلايا الدبقية قليلة التغصن لنبضات المحاور العصبية من خلال زيادة نشاطها الجليكوليتي بسرعة.
تكتشف الخلايا الدبقية الشوكية النبضات المحورية من خلالوقنوات Kir4.1
بعد ذلك، سعينا لتحديد الآلية التي من خلالها تكتشف خلايا الدبق النخاعي (OLs) النبضات المحورية. تعبر خلايا الدبق النخاعي عنمستقبلات -ميثيل-د-أسبارتات (NMDA) التي تنظم استيراد الجلوكوز من قبل الخلايا الدبقية قليلة التغصنووساطةزيادة في المايلين عند التحفيز الكهربائي للأكسوناتأو نقص التروية الكيميائية. تم اقتراح أن مستقبلات حمض الأحماض الأمينية-3-هيدروكسي-5-ميثيل-4-إيزوكسازول بروبيونيك (AMPA) تؤثر أيضًا على المايلين.ديناميات“. لذلك، قمنا بفحص مساهمة الإشارات الغلوتاماتية. تم حجب مستقبلات AMPA باستخدام 2،3-ديأوكسي-6-ن نيترو-7-سلفامويل-بنزو[كوينوكساين (NBQX؛ ) لم يحدث أي تغيير في استجابة (الشكل البياني الموسع 2أ)، مما يشير إلى أن مستقبلات AMPA قد لا تكون متورطة. التثبيط الإضافي لمستقبلات NMDA باستخدام حمض 7-كلوروكينورينيك (7-CKA؛ ) و D-2-أمينو-5-فوسفونوبيبتانوات (D-AP5؛ )، مما يمنع مواقع ارتباط مستقبلات NMDA الغليسينرجيك والغليتامات، قلل
الشكل 1|النشاط المحوري المستحثالإشارات وتدفق الجليكوليز في خلايا الدبق البصري. أ، توليد وعلاج التاموكسيفين لفئران PLP-CreERT؛ RCL-GCaMP6s في عمر 6-8 أسابيع؛ تم إجراء التجارب بعد 4-12 أسبوعًا من الحقن. ب، يسارًا، صور المناعية الكيميائية للتعبير عن GCaMP6s في خلايا الدبق (أجسام مضادة مضادة للبروتين الفلوري الأخضر (anti-GFP)، باللون الأخضر؛ أجسام مضادة مضادة لـ CC1، باللون الأرجواني). يمينًا، نسبة الخلايا الإيجابية لـ GCaMP6s التي هي أيضًا إيجابية لـ CC1.الفئران، دوائر رمادية). ج، تحضير العصب البصري للاختبارات الكهربائية والتصوير. د، يسار، مثال على CAPs عند 0.4 هرتز (الخط الأساسي (BL)) وبعدتحفيز عند 10 و 25 أو 50 هرتز. اليمين، مسار الزمن (المتوسطالانحراف المعياري (s.e.m.) لسعة قمة CAP 2 بالنسبة للخط الأساسي (فئران). هـ، استجابات (تعني s.e.m.) لتحفيزات محورية مختلفة. على اليمين، مخططات الصندوق تظهر منطقة الاستجابة تحت المنحنى (AUC؛ خلايا من ثمانية فئران). الترددات الأعلى أدت إلى زيادة أكبر الذروات (50 مقابل 25 هرتز، *** ضد ضد “; تحليل التباين أحادي الاتجاه (ANOVA)، اختبار المقارنات المتعددة لتوكاي). ف، اليسار، TTX (ألغى الـOL الناتج عناستجابة. تم تقليل CAP بواسطة TTX. اليمين، استجابات AUC المعيارية قبل وبعد TTX (خلايا من ستة فئران) يظهر انخفاض بنسبة (*** مزدوج الجوانب المقترناختبار). ج، اليسار، إزالة خارج الخلية ( قلل M EGTA من OLاستجابة. إدراج، استجابة CAP في الصفر. صحيح، استجابات AUCs العادية تظهر تقليل (خلايا من ثلاثة فئران،مزدوج الجوانب المقترناختبار). تعبير مستشعر FRET للجلوكوز (Glc) المعتمد على AAV (FLIIP) في خلايا الدبق البصري الناضجة بعد الحقن داخل البطين. أكدت صبغة المناعة باستخدام CC1 (ماجنتا) تعبير FLIIP (أجسام مضادة مضادة لـ GFP، أخضر) في خلايا الدبق الناضجة (تمت ملاحظته في ثلاثة فئران). MBP، بروتين المايلين الأساسي؛ P10، اليوم العاشر بعد الولادة؛ P56، تقريبًا يوم ما بعد الولادةيسار، مخطط لاستهلاك الجلوكوز بعد تثبيط امتصاص الجلوكوز باستخدام مثبط ناقل الجلوكوز (GLUT) CytoB. Glc-6P، جلوكوز 6-فوسفات. في المنتصف، مسار الزمن لانخفاض الجلوكوز خلال حاضنة CytoB عند 0.1 هرتز وعند حدوث مؤقت.تحفيز (يعنيمعدل الانخفاض المتوسط (الخطوط الحمراء المتقطعة) زاد منعند 0.1 هرتز إلىعند 50 هرتز. صحيح، الرسم البياني يوضح معدلات استهلاك الجلوكوز (فئرانمزدوج الجوانباختبار). تُظهر الرسوم البيانية الصندوقية الوسيط (الخط المركزي)، والرباعيات (حدود الصندوق)، والمتوسط ( + ) والنسب المئوية من 5 إلى 95 (الشعيرات). الاستجابة بنسبة تقارب 20% (الشكل البياني 2b). ثم قمنا بفحص الإشارات البورينية، نظرًا لأن ATP قد يعمل كجزيء إشارة في المادة البيضاء وتعبّر خلايا OL عن مستقبلات P2X/P2Y.مضادات مستقبلات P2X/P2Y غير الانتقائية واسعة الطيف حمض البيريدوكسايل فوسفات-6-أزو فينيل-2’،4′-ثنائي السلفونيك (PPADS; ) وسورامين ( ) خفضت الـ استجابة من (الشكل البياني الموسع 2c، d). وبالتالي، تساهم كل من الإشارات البورينرجية والغلوتاماترية بشكل معتدل في OLاستجابة.
نظرًا لأن جهد الفعل المحوري يزدادفي المادة البيضاء، اختبرنا ما إذا كانهو الإشارة الرئيسية المسؤولة عن OL
الجدول 1 | معلومات الأجسام المضادة
أجسام مضادة
نوع المضيف، النوع
الطريقة، التخفيف
المصدر، رقم الكتالوج.
مضاد-CC1
فأر، وحيد النسيلة
إتش آي سي، 1:100
كالبيوكيم، رقم الكات. OP80 (نسخة 5.24)
مضاد GFP
دجاج، متعدد النسائل
إتش آي سي، 1:1,000
أفيز لابز، رقم الكاتالوج GFP-1020
مضاد-GFAP
دجاج، متعدد النسائل
إتش آي سي، 1:2000
أبكام، رقم الكات. ab4674
مضاد IBA1
أرنب، متعدد النسائل
إتش آي سي، 1:1,000
فوجي فيلم واكو كيميكالز، رقم الكاتالوج 019-19741
مضاد كير4.1
أرنب، متعدد النسائل
IB، 1:1,000
ألومون، رقم الكاتالوج APC-035
مضاد MCT1/SLC16A1
أرنب، متعدد النسائل
IB، 1:500
من إنتاج كاثرين كوش
مضاد GLUT1
أرنب، متعدد النسائل
IB، 1:500
من إنتاج كاثرين كوش
مضاد-CNP
فأر، وحيد النسيلة
IB، 1:1,000
سيغما، رقم الكاتالوج C 5922 (استنساخ 11-5B)
مناهض لـ PLP
أرنب، متعدد النسائل
IB، 1:5,000
A431 (مرجع 118)
مضاد MOG
فأر، وحيد النسيلة
IB، 1:5,000
كرياتيف بايولابز، رقم الكاتالوج PABZ-152 (النسخة 8-18C5)
مضاد ATP1
فأر، وحيد النسيلة
IB، 1:1,000
أبكام، رقم الكات. ab7671 (نسخة 464.6)
مضاد ATP1
فأر، وحيد النسيلة
IB، 1:1,000
أبكام، رقم الكات. ab2826 (النسخة XVIF9- G10)
أجسام مضادة للفأر IgG HRP
ماعز، متعدد النسائل
IB، 1:10,000
جاكسون إيمونوريسيرش، رقم الكاتالوج 115-035-003
أجسام مضادة ضد الأرانب IgG HRP
ماعز، متعدد النسائل
IB، 1:10,000
جاكسون إيمونوريسيرش، رقم الكاتالوج 111-035-003
مضاد الفأر Cy3
حمار، متعدد النسائل
إتش سي، 1:700
جاكسون إيمونوريسيرش، رقم الكاتالوج 715-165-151
مضاد الأرنب Cy3
حمار، متعدد النسائل
إتش سي، 1:700
جاكسون إيمونوريسيرش، رقم الكاتالوج 711-165-152
أنتي دجاج أليكسا 488
حمار، متعدد النسائل
إتش سي، 1:700
جاكسون إيمونوريسيرش، رقم الكاتالوج 711-545-152
IgG، الغلوبولين المناعي G؛ HRP، بيروكسيداز الفجل؛ IHC، الكيمياء المناعية النسيجية؛ IB، المناعية الغربية. تحفيز. زيادات مؤقتة في الحمامأدى إلىاستجابة في OLs، والتي كانت أكثر وضوحًا عند مستويات أعلىالمستويات (الشكل 2أ). استبعدنا أن زيادةقد تحفز بشكل غير مباشر إطلاق الألياف المحورية وإمكانية إفراز الناقلات العصبية، حيث أظهرت الخلايا الدبقية الأولية نفس الشيء في وجود TTX.استدعىاستجابة (الشكل 2ب). تعبر خلايا OL عن Kir4.1 (المراجع 23، 24، 43)، المرتبطة بـالتوازن الداخلي واستقطاب OLمن اللافت للنظر، أن حجب قنوات Kir4.1 بـالباريوم ) قلل بشكل عكسي من OL المستحثة استجابة من (الشكل 2ج). أيضًا مثبطًا لـاستدعىاستجابة في خلايا OLs (الشكل 2d)، مما يوحي بأن إزالة الاستقطاب التي يسببها Kir4.1 تؤدي إلىزيادة. ثم قمنا بفحص ما إذا كانيؤثر على المحاور العصبية الديناميات. لهذا، قمنا بتوصيل AAV المحتوي على Cre داخل الجسم الزجاجي في فئران RCL-GCaMP6s، تلا ذلك تصوير ثنائي الفوتون لمحاور الأعصاب البصرية التي تعبر عن GCaMP6s بعد 3-6 أسابيع من الحقن (الشكل البياني الممتد 3a). أثار التحفيز الكهربائي استجابة قوية زيادة في المحاور (الشكل الإضافي 3ب والفيديو التوضيحي 2)، والتي كانت أكبر عند الترددات الأعلى (الشكل الإضافي 3ج). من المهم،لم يؤثر على المحور العصبيارتفاع (الشكل 3d من البيانات الموسعة)، مما يبرز أن-تقليل بوساطة الاستجابة (الشكل 2ج) لم تكن نتيجة تثبيط غير محدد للأكسونات الإشارة. ومع ذلك،أثر على تعافي المحاور العصبية إطلاق النار بعدالتحفيز، كما يتضح من تأخر استعادة سعة ذروة CAP (الشكل البياني الممتد 3e، f).
قد يؤدي إزالة الاستقطاب في OL إلى تنشيط قنوات الصوديوم المعتمدة على الجهد قنوات الكالسيوم المعتمدة على الجهد (VGCCs). قمنا باختبار مجموعة متنوعة من مثبطات قنوات الكالسيوم المعتمدة على الجهد، بما في ذلك الكادميوم ( النيكل )، نيفيديبين، بينيديبين وريد الروديوم (RuR؛ الشكل البياني الموسع 4a-e)، من بينها فقط وكان للنيفيديبين تأثيرات طفيفة (الشكل البياني الممتد. ). على النقيض، لم يؤثر علىزيادة (الشكل 4a من البيانات الموسعة) ولكنها قللت بوضوح من الاستجابة المحفزة للأكسوناستجابة (الشكل البياني الموسع 3g، h). وهذا يشير إلى أن المحور العصبيالزيادة خلال النشاط الكهربائي يتم توسيعها بواسطة قنوات الكالسيوم المعتمدة على الجهد، على عكس OLاستجابة. علاوة على ذلك، كانت استعادة موصلية CAP المتأخرة بعد التحفيز عالي التردد محددة لـ (الشكل 3f من البيانات الموسعة) وليس متأثراً بـ (الشكل 3i، j من البيانات الموسعة).
تعبيرات OLsالمبادلات (NCX)الذي قد يسمحدخول في وضع عكسي عند إزالة استقطاب الغشاءتثبيط مضخات الصوديوم بـأوبين تسبب فيزيادة في OLs، والتي تم تقليلها عن طريق حجب نشاط الوضع العكسي لـ NCX بـKB-R7943 (الشكل البياني الموسع 5a، b)، مما يؤكد وظيفة NCX في خلايا الدبق العصبي في العصب البصري. علاوة على ذلك، قلل KB-R7943 من-استجابة OLاستجابة من (الشكل 2e)، نتيجة تعكس
الشكل 2 | الآلية التي تتوسطها قناة Kir4.1 والتي تستند إلى التحفيزالإشارة في OLs. أ، OLالمستويات زادت من خلال الزيادةمع 5 و 10 و(تطبيق الحمام لمدة 30 ثانية: ). اليسار، متوسط OL Ca آثار (تعنيس.م.). صحيح، قياس amplitudes of the evoked signal خلايا من أربعة فئران؛خلايا من خمسة فئران؛ 5 مللي مولار :خلايا من أربعة فئران؛ 5 مقابل 10 مللي مول مقابل 30 مللي مول ضد “; تحليل التباين الأحادي مع اختبار المقارنات المتعددة لتوكاي). ب، اليسار،-استدعىاستجابة مستقلة عن نشاط النبضات المحورية، تظهر ارتفاعات مماثلة مع TTX. اليمين، مخططات الصندوق تظهر المساحات تحت المنحنى للاستجابة المنضبطة.خلايا من خمسة فئران؛مزدوج الجوانباختبار؛ NS، غير ذي دلالة). ج، يسار، باريوم ( ) تم تثبيطها بشكل عكسي OL الناتج عنزيادة بمقدار. صحيح، مخططات الصندوق تظهر استجابة AUCs المعايرة (خلايا من أربعة فئران؛ ***مزدوج الجوانب المقترناختبار). د، يسار،قلل من-استجابة OLاستجابة من. صحيح، مخططات الصندوق تظهر استجابة AUCs المعايرة (خلايا من ثلاثة فئران؛***مزدوج الجوانب المقترناختبار).هـ،ف،
مثبط NCX في وضع العكس KB-R7943 ) خفضت الـ -المُحفَززيادة (e) بـخلايا من خمسة فئران؛ متزاوجةاختبار، و الـ -استدعىاستجابة (ف) بواسطة ( خلايا من ثلاثة فئران؛ مزدوجة الجوانب مرتبطةاختبار، ). تُظهر الرسوم البيانية الصندوقية على اليمين استجابات AUC المُعَيارَة. ج، ملخص للأدوية التي تم اختبارها وتأثيراتها المثبطة على -استجابة OLالارتفاعات (تُعرض البيانات أيضًا كرسوم بيانية صندوقية تشمل المعنية)القيم في ج و هـ، الشكل 1f، g، والأشكال الإضافية 2، 4 و 5): TTX (صفر كا، نيفيديبينبيني ديبين ) ، بوميتانيد ), PPADS ( سورامين ), NBQX ( ) و +DAP-5/7-CKA ( ). AMPAR، مستقبل AMPA؛ NMDAR، مستقبل NMDA. h، مخطط لنشاط المحور العصبي المدعوم بـالتفعيل: زيادة النشاط المحوري عالي الترددإزالة الاستقطاب (Depol.) OLs من خلال Kir4.1 وزيادةالدخول من خلال NCX. يتم توضيح المساهمات الطفيفة لقنوات الكالسيوم المعتمدة على الجهد، وم receptors P2X، ومستقبلات NMDA. الرسوم البيانية الصندوقية فيعرض الوسيط (الخط المركزي)، الربعيات (حدود الصندوق)، المتوسط (+) والنسب المئوية من 5 إلى 95 (الشعيرات). بواسطةSEA0400، مثبط آخر لـ NCX (الشكل 5c من البيانات الموسعة). كما أن KB-R7943 قلل مناستدعىاستجابة في OLs (الشكل 2f)، مما يشير إلى أنالاستقطاب الناتج عن التحفيز في خلايا OLs يؤدي إلىالدخول من خلال وضع العكس لـ NCX. يتم التعبير عن الناقل المشترك 1 (NKCC1) في الخلايا الدبقية الناضجة.وقد تلعب دورًا في تنظيم حجم اللسان الداخلي المواجه للمحوار. لقد اختبرنا ما إذا كان تشارك الناقلات المشتركة في تحفيز OLزيادة باستخدام بوميتانيد، مثبط محدد لـ NKCC1. ومع ذلك،لم يؤثر بوميتانيد علىOL Ca الناتج عنزيادة (الشكل 5d من البيانات الموسعة)، مما يشير إلى أن التغيرات في الحجم التي يسببها NKCC1 في خلايا OL البالغة ليست متورطة خلال إطلاق النار المحوري عالي التردد.
باختصار، تشير نتائجنا الصيدلانية (المختصرة في الشكل 2g) إلى أن الخلايا الدبقية النجمية تكتشف النشاط المحوري عالي التردد من خلال زيادة، مما يؤدي إلى إزالة الاستقطاب من خلال قنوات Kir4.1 والدخول بشكل رئيسي عن طريق تنشيط NCX بطريقة عكسية (الشكل 2h).
تنظم خلايا أوليجوديندروغليا Kir4.1 ديناميات اللاكتات المحورية
نظرًا لأن الخلايا الدبقية النجمية تستجيب للنبضات السريعة في المحاور العصبية من خلال تنشيط قنوات Kir4.1، فقد افترضنا أن هذايمكن أن تنظم التحفيز المدفوع إمداد المستقلبات إلى المحاور (على سبيل المثال، توصيل اللاكتات عند الطلب). لاختبار ذلك، قمنا بالتعبير عن مستشعر اللاكتات لاكونيكفي محاور العصب البصري باستخدام توصيل AAV داخل الجسم الزجاجي (الشكل 3أ). أظهرت الاختبارات الأولية في الأعصاب من النوع البري أن زيادة مستويات اللاكتات خارج الخلية زادت من مستويات اللاكتات في المحاور (الشكل 3أ، ب)، مما يؤكد تعبير الناقلات الخاصة باللاكتات في المحاور. أدى إزالة الجلوكوز واللاكتات من محلول ACSF إلى تقليل كبير في مستويات اللاكتات في المحاور (الشكل 3أ، ب). وبالتالي، فإن جهاز الاستشعار Laconic ليس مشبعًا في الحالة الأساسية، ونطاقه الديناميكي يسمح بدراسة ديناميات اللاكتات في المحاور. ومن الجدير بالذكر أن مستويات اللاكتات في المحاور زادت خلال النبضات عالية التردد، بشكل أكثر وضوحًا عند ترددات التحفيز الأعلى (الشكل 3ج، د). لمعرفة ما إذا كانت الزيادةيمكن أن يزيد بمفرده من اللاكتات المحورية بشكل مستقل عن النشاط الكهربائي، استخدمنا TTX لتثبيط النشاط المحوري وزيادة عبء العمل المرتبط. في الواقع، زادت التحفيزات من مستويات اللاكتات المحورية، والتي كانت بوساطة نشاط Kir4.1 (الشكل 5e من البيانات الموسعة). من المهم أن تثبيط Kir4.1 مع تقلص بشكل محدد الاستجابة الناتجة عن التحفيز OLاستجابة ولكن لم تؤثر على المحور العصبيالزيادة (الشكل 2c والشكل الإضافي 3d) وبالتالي عبء العمل المحوري عند حدوث الطلقات. ومع ذلك،قلل الزيادة الناتجة عن النشاط في مستويات اللاكتات المحورية بـ (الشكل 3e، f). هذا يعني أن الإشارات المتوسطة بواسطة المحاور – خلايا الدبق تسهل إمداد اللاكتات إلى المحاور أثناء النشاط الكهربائي.
للتحقيق فيما إذا كانت خلايا أوليجودينروغليا Kir4.1 تتحكم بشكل محدد في ديناميات اللاكتات المحورية، استخدمنا فئران Kir4.1 cKO. (الشكل 3g والشكل الإضافي 6). أولاً، قمنا بفحص الأعصاب البصرية من فئران Kir4.1 cKO التي تبلغ من العمر -شهرًا وأقرانها من نفس السلالة (Kir4.لم نجد أي اختلافات في أوقات ذروة CAP أو قابلية العصب للإثارة (الشكل 6 أ-ج في البيانات الموسعة). بالإضافة إلى ذلك، لم نلاحظ أي تغييرات واضحة في سمك غلاف المايلين وتوزيع قطر المحاور المايلينية (الشكل 6 د-و في البيانات الموسعة). في هذا العمر، لم تُلاحظ أي علامات على تلف المحاور أو الالتهاب العصبي (الشكل 6 د، ز، ح في البيانات الموسعة). التأثير الوسيط على تأخير تعافي ذروة CAP (الشكل 3f من البيانات الموسعة) قد يتضمن الوساطة بواسطة Kir4.1إزالة بواسطة الخلايا العصبية الدبقية و/أو الخلايا النجميةمن الجدير بالذكر أن أعصاب Kir4.1cKO أظهرت تعافيًا أبطأ بشكل ملحوظ في ذروة CAP بعد التحفيز عالي التردد مقارنةً بالتحكمات من نفس السلالة (الشكل 6i,j في البيانات الموسعة)، مما يؤكد النتائج السابقة.. من المثير للاهتمام، أن الأعصاب من النوع البري المعالجة بـأظهرت تأخيرات التعافي نفسها كما في أعصاب Kir4.1 cKO (الشكل 6i,j من البيانات الموسعة)، مما يوحي بأن Kir4.1 في الخلايا الدبقية قليلة التغصن متورط بشكل أساسي فيالتخزين في المادة البيضاء البالغة، مع مساهمة قليلة أو معدومة من كير4.1 الأستروسيتية أو غيرها-قنوات كير الحساسة. كما تأثرت ديناميات استعادة زمن ذروة CAP في أعصاب Kir4.1 cKO (الشكل التوضيحي الممتد 7a-d). كانت عيوب استعادة CAP بعد التحفيز مرئية أيضًا عند 25 و 10 هرتز (الشكل التوضيحي الممتد 7e-p)، مما يوضح أن Kir4.1 في الخلايا الدبقية قليلة التغصن تتحكم أيضًا في الاعتماد على النشاط.إزالة عند الترددات المنخفضة.
ثم قمنا بفحص ديناميات اللاكتات المحورية ووجدنا أن مستويات اللاكتات في حالة الراحة (عندتم تقليل الزيادة في اللاكتات المستحثة بترددات عالية بشكل ملحوظ في أعصاب Kir4.1 cKO مقارنةً بالتحكم (الشكل 3h-j). تم مقارنة مستويات اللاكتات المحورية الأساسية بعد تطبيع نسب نقل الطاقة رينس (FRET) إلى الحد الأدنى من مستويات اللاكتات بعد حرمان الجلوكوز (GD؛ الشكل 3h,i). قد تنشأ مستويات اللاكتات المنخفضة في محاور Kir4.1 cKO من انخفاض إمداد اللاكتات من خلايا الدبق، أو تغير في تحلل الجلوكوز المحوري أو زيادة في 
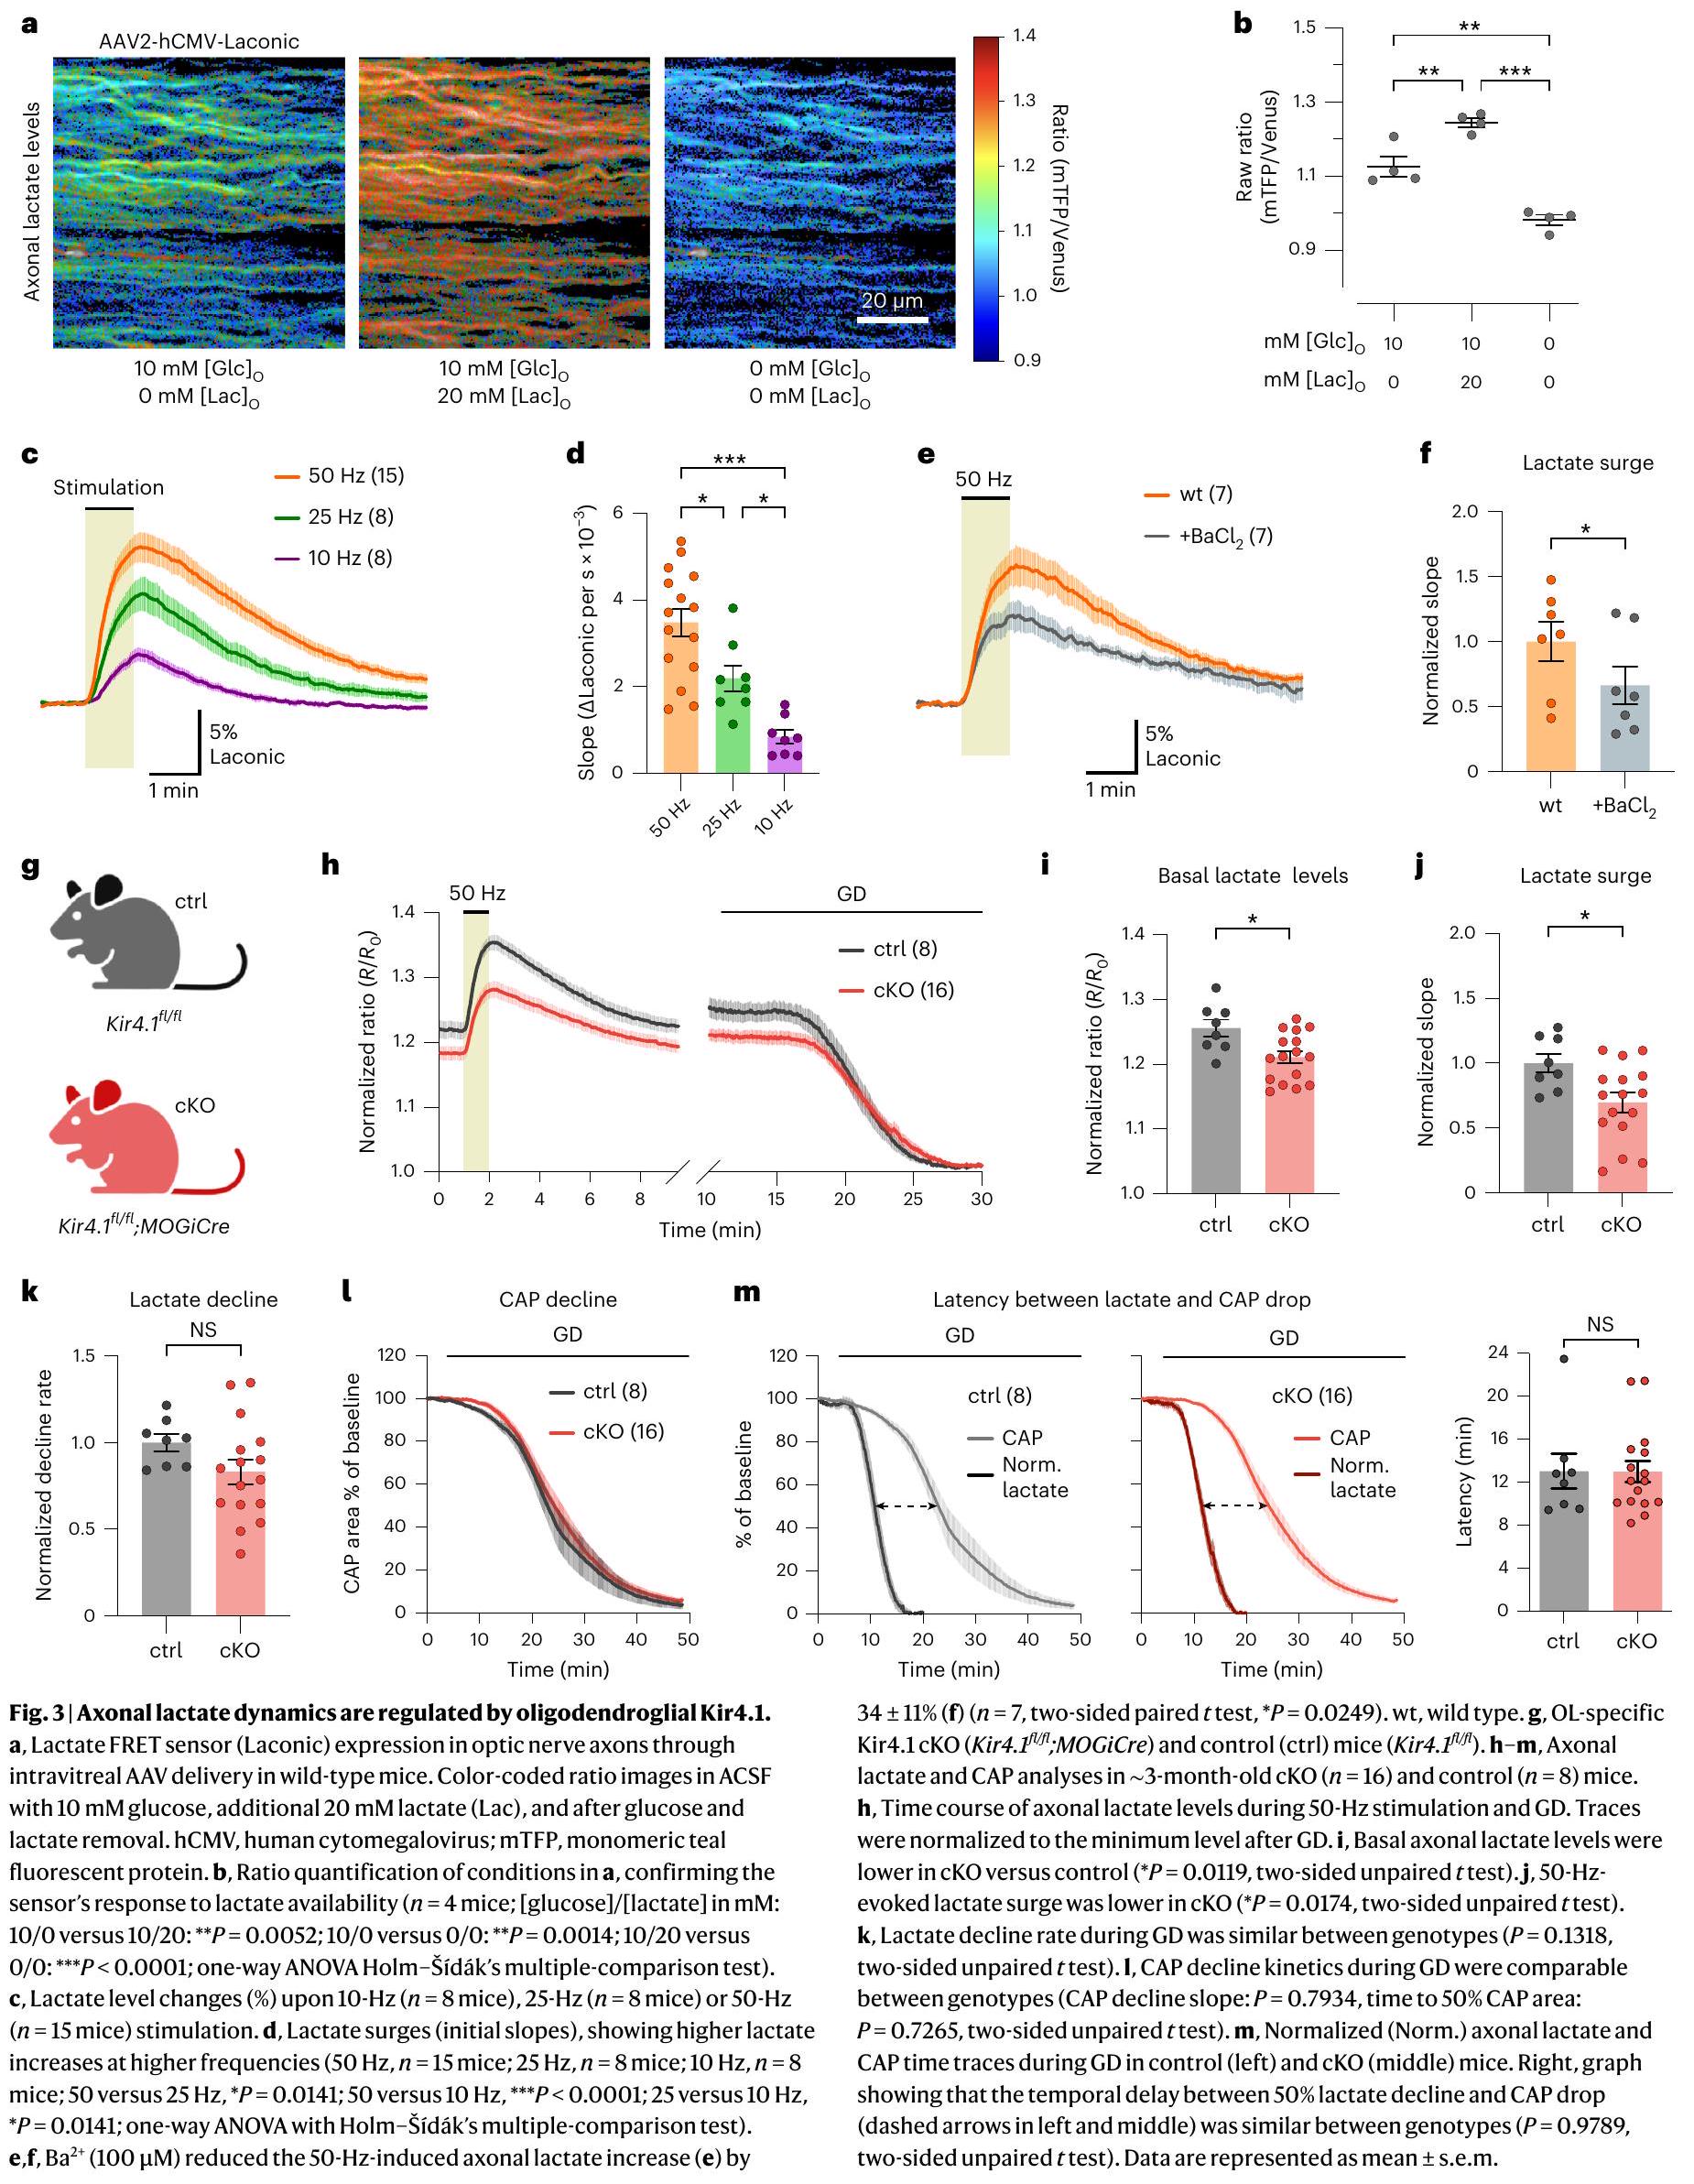
استهلاك اللاكتات. يبدو أن هذا غير محتمل، حيث أن تدهور اللاكتات خلال GD لم يكن أسرع ولكن كان أبطأ قليلاً في الفئران المعدلة وراثياً cKO مقارنةً بالتحكم (الشكل 3h، k). وهذا يت corroborated بمعدل انخفاض CAP المماثل خلال GD (الشكل 3l). أظهرت الجينوتيباتان نفس التأخير بين استنفاد اللاكتات وانخفاض CAP (الشكل 3m). من الجدير بالذكر أن انخفاض CAP لوحظ فقط عندما اقترب اللاكتات المحوري من الاستنفاد (الشكل 3m). بالنظر إلى الانخفاض المتزامن لمستويات CAP و ATP خلال GD، هذا يشير إلى أن اللاكتات المحورية تغذي ATP من أجل جهد الفعل وتتوقف المحاور عن إطلاق النار مع تراجع إمدادات اللاكتات، مما يؤدي إلى انخفاض CAP (الشكل 3م). وهذا يعني أيضًا أن هناك تنفس ميتوكوندري مماثل في المحاور بين الأنماط الجينية.
انخفاض MCT1 وGLUT1 في المايلين في الجهاز العصبي المركزي لفئران Kir4.1 cKO
فقدان كير4.1 في الخلايا الدبقية قد يؤثر على سلامة المحاور مع التقدم في العمرأظهر المجهر الإلكتروني (EM) في عمر 3 أشهر عدم وجود علامات على تلف سلامة المحاور في فئران Kir4.1cKO، مع سمك طبيعي للميالين وأقطار محورية (الشكل التمديدي 6d-f). ومع ذلك، بحلول 7-8 أشهر، كان هناك زيادة ملحوظة في ملفات المحاور/الميالين تشير إلى تنكس المحاور، بما في ذلك انتفاخات محورية عملاقة (الشكل التمديدي 8a-c). حدثت اعتلال المحاور المعتمد على العمر في فئران cKO دون وجود شذوذات ملحوظة في الميالين أو ترقق (الشكل التمديدي 8d,e). بالإضافة إلى ذلك، لوحظ زيادة في تلوين بروتين الألياف الدبقية الحمضية (GFAP)، مما يتماشى مع رد فعل ثانوي للأستروسيت؛ ومع ذلك، لم يكن هناك زيادة في إيجابية الأجسام المضادة لجزيء ربط الكالسيوم المؤين 1 (IBA1)، مما يشير إلى عدم وجود ميكروغليوز (الشكل التمديدي 8f,g).
“يبدو أن غياب كير4.1 في الخلايا الدبقية قليلة التغصن في الفئران الصغيرة يؤثر على استقلاب الطاقة المحوري قبل ظهور أمراض المحاور. يتماشى هذا مع انخفاض مستويات اللاكتات المحورية الملحوظة في أعصاب الفئران الصغيرة cKO، التي لم تظهر أي ضرر محوري أو التهاب عصبي. أثر كل من تثبيط الأدوية والتعطيل الجيني لكير4.1 على الزيادة المفاجئة في اللاكتات المحورية المستحثة بالتحفيز، لكن مستوى اللاكتات الأساسي المنخفض كان سمة إضافية لفئران cKO. بالإضافة إلى تنظيم الاقتران الأيضي الحاد، قد يساهم كير4.1 في الخلايا الدبقية قليلة التغصن أيضًا في ضبط وحدة الأيض بين المحور والخلايا الدبقية. لاستكشاف التغيرات الأيضية الناتجة عن نقص كير4.1 بشكل أكبر، قمنا بإجراء بروتيوميات كمية تعتمد على علامة الكتلة المتسلسلة (TMT) على مستخلصات العصب البصري من فئران كير4.1 cKO البالغة من العمر 2.5 شهرًا ومجموعة التحكم (الشكل 4أ، الشكل التمديدي 9أ والبيانات التكميلية 1). كما هو متوقع، كانت مستويات بروتين كير4.1 (Kcnj1O) أقل في مجموعة cKO (الشكل 4ب والشكل التمديدي 9ب). من بين أفضل 50 بروتينًا مرتبة حسب معدل الاكتشاف الخاطئ (FDR)، أظهرت البروتينات المرتبطة بالنقل الحويصلي واستقلاب الطاقة مستويات منخفضة (الشكل 4ب). كشفت تحليلات إثراء مجموعة الجينات والمسارات عن انخفاض في نشاط الناقلات عبر الغشاء، والنقل الحويصلي ومسارات الفسفرة التأكسدية (الشكل 4ج، د). لوحظ انخفاض في وفرة MCT1 (Slc16a1؛ الشكل 4ب والشكل التمديدي 9ج) وGLUT1 (Slc2a1؛ الشكل التمديدي 9د)، لكن لم يكن هناك تغيير في ناقل الجلوكوز GLUT3 (Slc2a3؛ الشكل التمديدي 9هـ). أشار تحليل qPCR الإضافي إلى انخفاض طفيف في mRNA الخاص بـ Slc2a1 ولكن ليس في mRNA الخاص بـ Slc16a1 (الشكل التمديدي 8ف)، مما يوحي بأن التغيرات في وفرة الناقلات قد لا تكون ناتجة فقط عن تغييرات في التعبير الجيني. أظهر التحليل المناعي للميالين المستخلص من أدمغة cKO انخفاضًا بنسبة حوالي 50% في وفرة كل من GLUT1 وMCT1 (الشكل 4هـ). وبالتالي، أثر فقدان كير4.1 على الوفرة النسبية لناقلات المستقويمكن أن تؤثر الإشارات التي تتوسطها Kir4.1 على تعبير الجينات، وتخليق البروتين، ونقل السطح، و/أو دوران الناقلات الأيضية في خلايا الدبق. قد يؤدي ذلك إلى تكيفات تتماشى مع دعم الآلات في خلايا الدبق لمستويات نشاط المحاور.
تغييرات طفيفة في ديناميات ATP المحورية في فئران Kir4.1 cKO
أشارت تحليلات البروتيوميات إلى تغييرات في مسارات الفسفرة التأكسدية، مما جعلنا نتساءل عما إذا كانت الفئران المعدلة وراثيًا (cKO) تظهر أيضًا تغييرات في توازن ATP المحوري. للتحقيق في ذلك، قمنا بالتعبير عن
الشكل 4 | مستويات MCT1 وGLUT1 منخفضة في المايلين في الجهاز العصبي المركزي لفئران Kir4.1 cKO. أ، تحليل البروتيوميات المعتمد على TMT في الأعصاب البصرية من فئران عمرها 2.5 شهر.و التحكم في الأشقاءالفئران. المخطط (الذي تم إنشاؤه بواسطة BioRender) يوضح الاستخراج، والهضم، ووضع علامة TMT والتجميع لكروماتوغرافيا السائل-مطيافية الكتلة (LC-MS/MS). ب، أفضل 50 بروتينًا مختلفًا تم تنظيمها (مرتبة حسب FDR) مدرجة مع أسماء الجينات. خريطة الحرارة توضح الزيادة (بالأحمر) أو النقص (بالأزرق) في cKO مقابل التحكم مرتبة حسب (تغيير الطي)، بما في ذلك فقط البروتينات ذات تغيير الطي أو . صف تم حساب الدرجات من الكثافات المعيارية. ج، د، أظهرت تحليلات إثراء مجموعة الجينات (GSEAs) للفئات وظيفة الجين الجزيئية (GO) (ج) ومسار موسوعة جينات كيوتو (KEGG) (د) انخفاضات في نشاط الناقلات عبر الغشاء، والنقل الحويصلي، وعمليات الأيض للطاقة (FDR < 0.05). تم إجراء التحليل. 
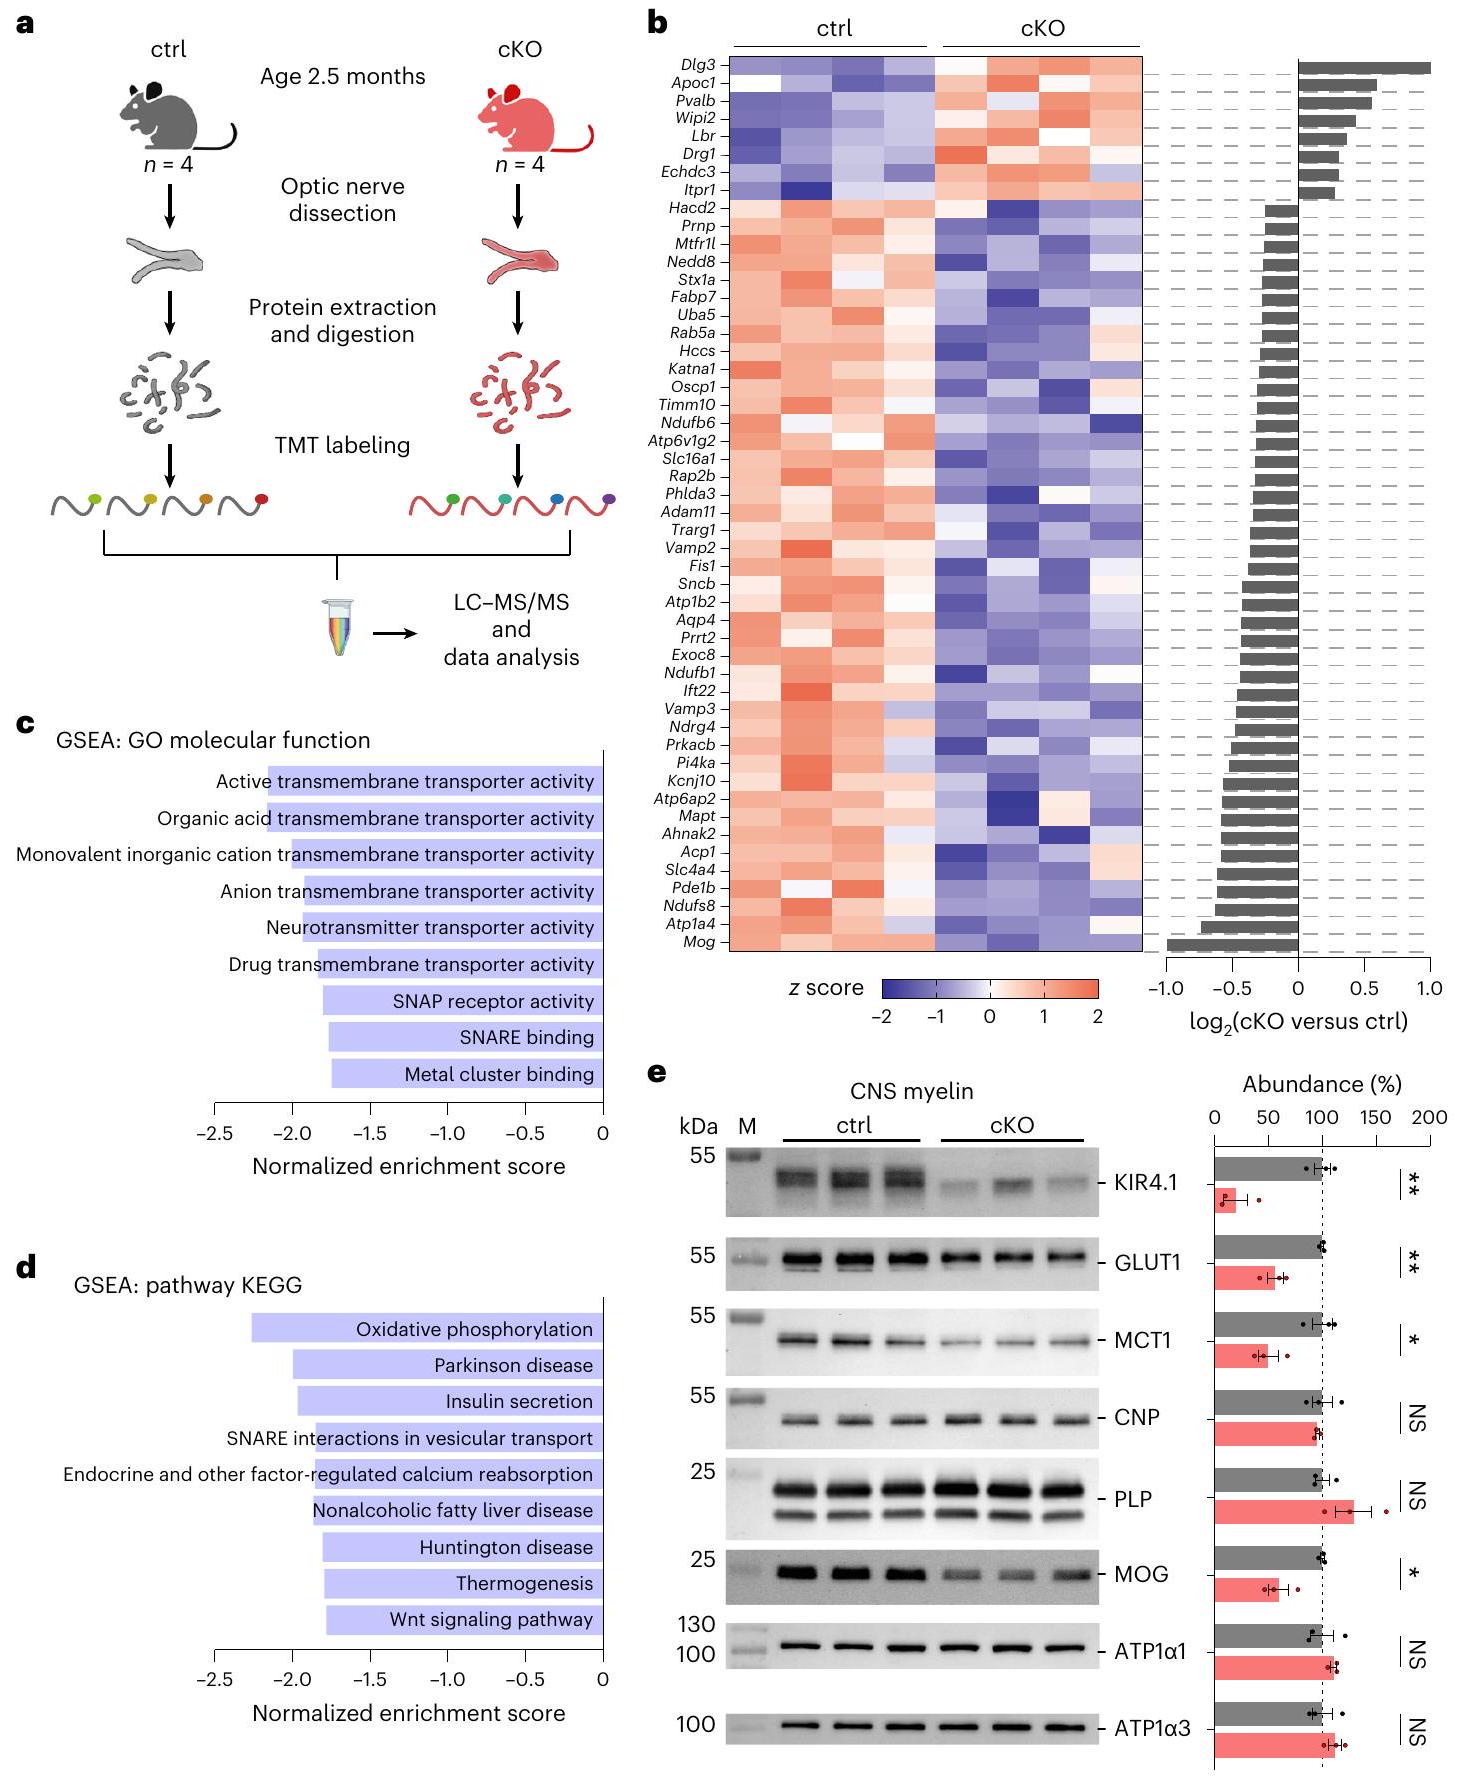
من خلالويب جستالت.أورغ، مع تصنيف البروتينات حسب (تغيير الطي). SNAP، قابل للذوبان-بروتين مرتبط بعامل حساس للإيثيلماليميد؛ SNARE، مستقبل SNAP. e، يسار، تحليل المناعية للكير 4.1، MCT1 و GLUT1 في المايلين المنقى كيميائيًا من أدمغة الفئران الضابطة بعمر 2.5 شهر ( ) و الفئران. M، علامة الوزن الجزيئي. على اليمين، مقارنةً بالضوابط (الرمادي)، أظهرت فئران cKO (الأحمر) وفرة أقل من Kir4.1 بواسطةGLUT1 بواسطة و MCT1 بواسطة غير متطابق ذو وجهيناختبار). بروتينات المايلين المعروفة PLP، 2’،3′-سايكلينوكليوتيد 3′-فوسفوستيراز (CNP)، بروتين جليكوبروتين المايلين الأوليغوديندروسيت (MOG)، ATPaseوحدة النقل (ATP1 ) و ATP1 تم اكتشافها كعلامات. لاحظ أن وفرة MOG قد انخفضت بواسطة ( غير متزاوج ذو وجهيناختبار)، المنسوب إلى إدخال Cre تحت محفز MOG في فئران MOGiCre المتغايرة الزيجوت والتي تعطل أليل mog واحد. تم تمثيل البيانات كمتوسطس.م. مستشعر ATP ATeam1.03 (المرجع 52) في المحاور من خلال توصيل AAV داخل الجسم الزجاجي. أولاً، قمنا بتقييم مستويات ATP المحورية الأساسية من خلال تطبيع نسب FRET عندتحفيز في 10 مللي مولار من الجلوكوز مقابل النسب بعد
تثبيط GD والتنفس الميتوكوندري باستخدام 5 مللي مول من نترات الصوديوملتقليل مستويات ATP المحورية (الشكل 5أ-ج). لم يُلاحظ أي فرق في الجينات في مستويات ATP المحورية الأساسية (الشكل 5ج). الـ ATP
الشكل 5| تغييرات طفيفة في ديناميات ATP المحورية في غياب Kir4.1 من الخلايا الدبقية. أ، تعبير مستشعر ATP FRET المعتمد على AAV (ATeam1.03) في محاور الأعصاب البصرية. تظهر صور النسبة الملونة من الأعصاب الضابطة (الأعلى) و cKO (الأسفل) مستويات ATP في ACSF مع 10 مللي مول من الجلوكوز وبعد GD + MI مع. hSyn1، السيناپسين البشري 1؛ mseCFP، بروتين فلوري أزرق ساطع أحادي. ب، مسار الزمن لمستويات ATP المحورية في-شهر من العمر cKO ( ) والتحكم ( الفئران التي تم تحديها بـ GD + MI، تم تطبيعها إلى الحد الأدنى من مستوى ATP ). إدراج، الديناميات الأولية لاستعادة ATP بعد إعادة التروية مع 10 مللي مول من الجلوكوز.كانت مستويات ATP المحورية الأساسية متشابهة بين الأنماط الجينيةفئرانغير متطابق ذو وجهيناختبار). د، لا يوجد فرق في معدل انخفاض ATP بين الأنماط الجينية عند GD + MI (فئرانغير متزاوج ذو وجهيناختبار). e، معدلات استعادة ATP الأولية المماثلة
بين الأنماط الجينية بعد GD +MIفئرانغير متطابق ذو وجهيناختبار).ف، بداية استعادة ATP (انظر الأسهم المتقطعة في الإطار الداخلي في ) اختلفت بين الأعصاب الضابطة وأعصاب cKO ( فئرانغير متطابق ذو وجهيناختبار). ج، استعادة مستوى ATP المحوري المنخفض في cKO مقارنةً بالتحكمات بعد GD +MI (فئران، *غير متطابق ذو وجهيناختبار). h، تغييرات مستوى ATP المحوري (%) عندتحفيز بالنسبة للخط الأساسي. أنا، ج، معدلات انخفاض مستوى ATP المماثلة (أنا) خلالتحفيزفئرانغير متزاوج ذو وجهيناختبار) ومعدلات استعادة ATP الأولية المتساوية ( ) بعد التحفيز ( غير متزاوج ذو وجهيناختبار). ك، استعادة مستوى ATP المحوري أقل قليلاً بعد التحفيز في cKO مقارنةً بالضوابط (فئرانغير متزاوج ذو وجهيناختبار). يتم تمثيل البيانات كمتوسطس.م. 
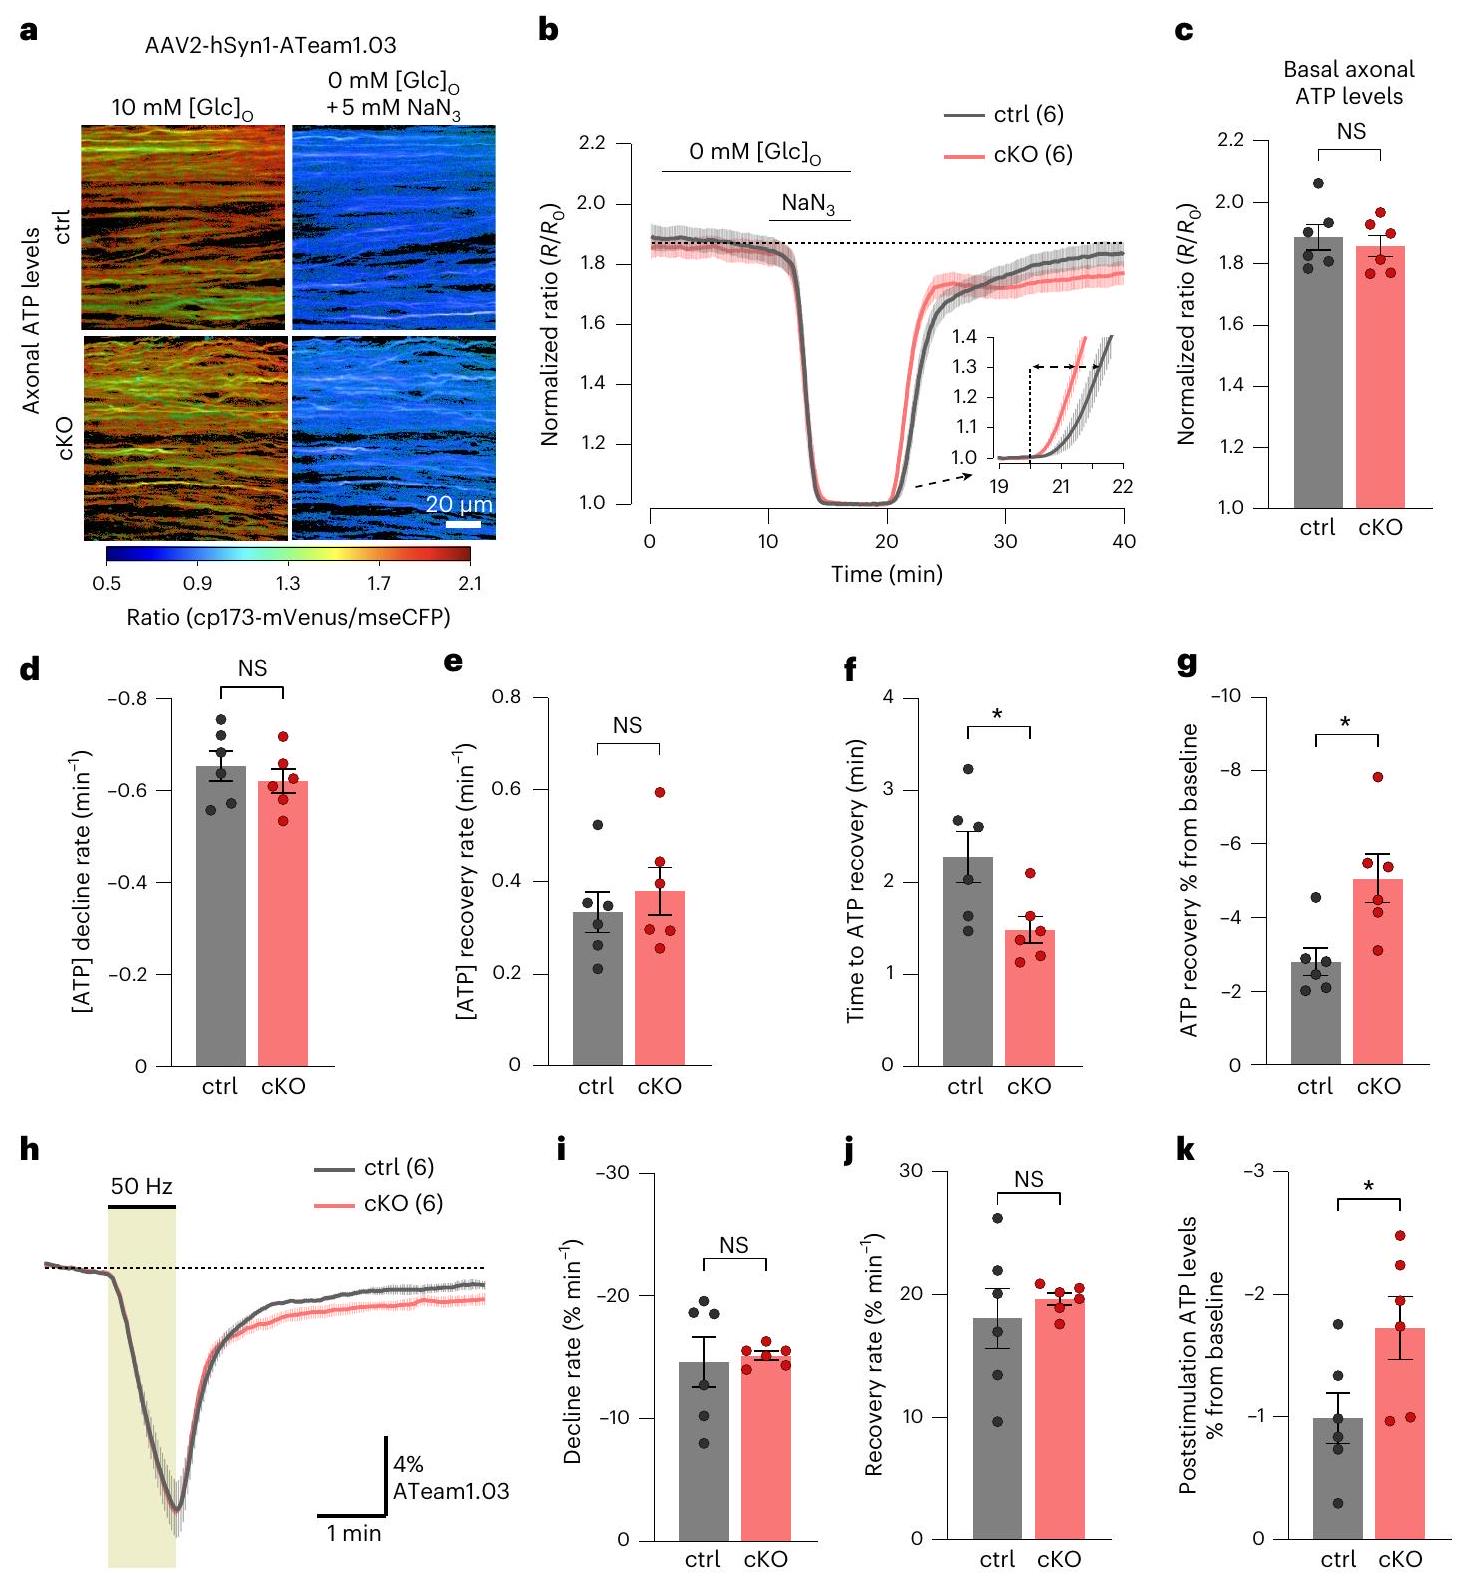
معدل الانخفاض خلال GD + MI كان أيضًا قابلًا للمقارنة بين الأنماط الجينية (الشكل 5b، d)، ومعدل استعادة ATP بعدلم يتأثر الغسل وإعادة التروية بمستوى 10 مللي مول من الجلوكوز (الشكل 5e). ومن المثير للاهتمام أن الأعصاب المعدلة وراثيًا أظهرت بداية أسرع قليلاً في استعادة ATP مقارنةً بالتحكم (الشكل 5b,f)؛ ومع ذلك، بعد 15-20 دقيقة، عادت مستويات ATP في الأعصاب الضابطة تقريبًا إلى مستوياتها الأساسية، في حين كانت استعادة الأعصاب المعدلة وراثيًا غير مكتملة (الشكل 5b,g).
النقص الطفيف في استعادة ATP دفعنا إلى فحص استعادة إطلاق المحاور في الفئران المعدلة وراثيًا بشكل أعمق. الانخفاض السريع في مساحة CAP بعد GD + MI، كان حظر التوصيل المحوري مشابهًا بين الأنماط الجينية، وبدت بداية واستعادة حركية إطلاق المحاور غير متغيرة (الشكل البياني الممتد 10a). تحليل مساحة CAP الجزئي (pCAP)، الذي يعكس ديناميات ذروتي CAP الأولى والثانيةأظهرت معدلات الانخفاض المماثلة عند GD + MI، في حين اختلفت ديناميات تعافي pCAP بين الأنماط الجينية (الشكل البياني الممتد 10b). كشفت الفحص الدقيق لموجات CAP عن اختلاف ملحوظ في حركيات التعافي لزمن الذروة (الشكل البياني الممتد 10c). في الضوابط، زادت سعة ذروة CAP تدريجياً مع الذروة
الشكل 6 | نقص كير4.1 في الخلايا الدبقية القليلة يعيق استقلاب الجلوكوز المحوري. 
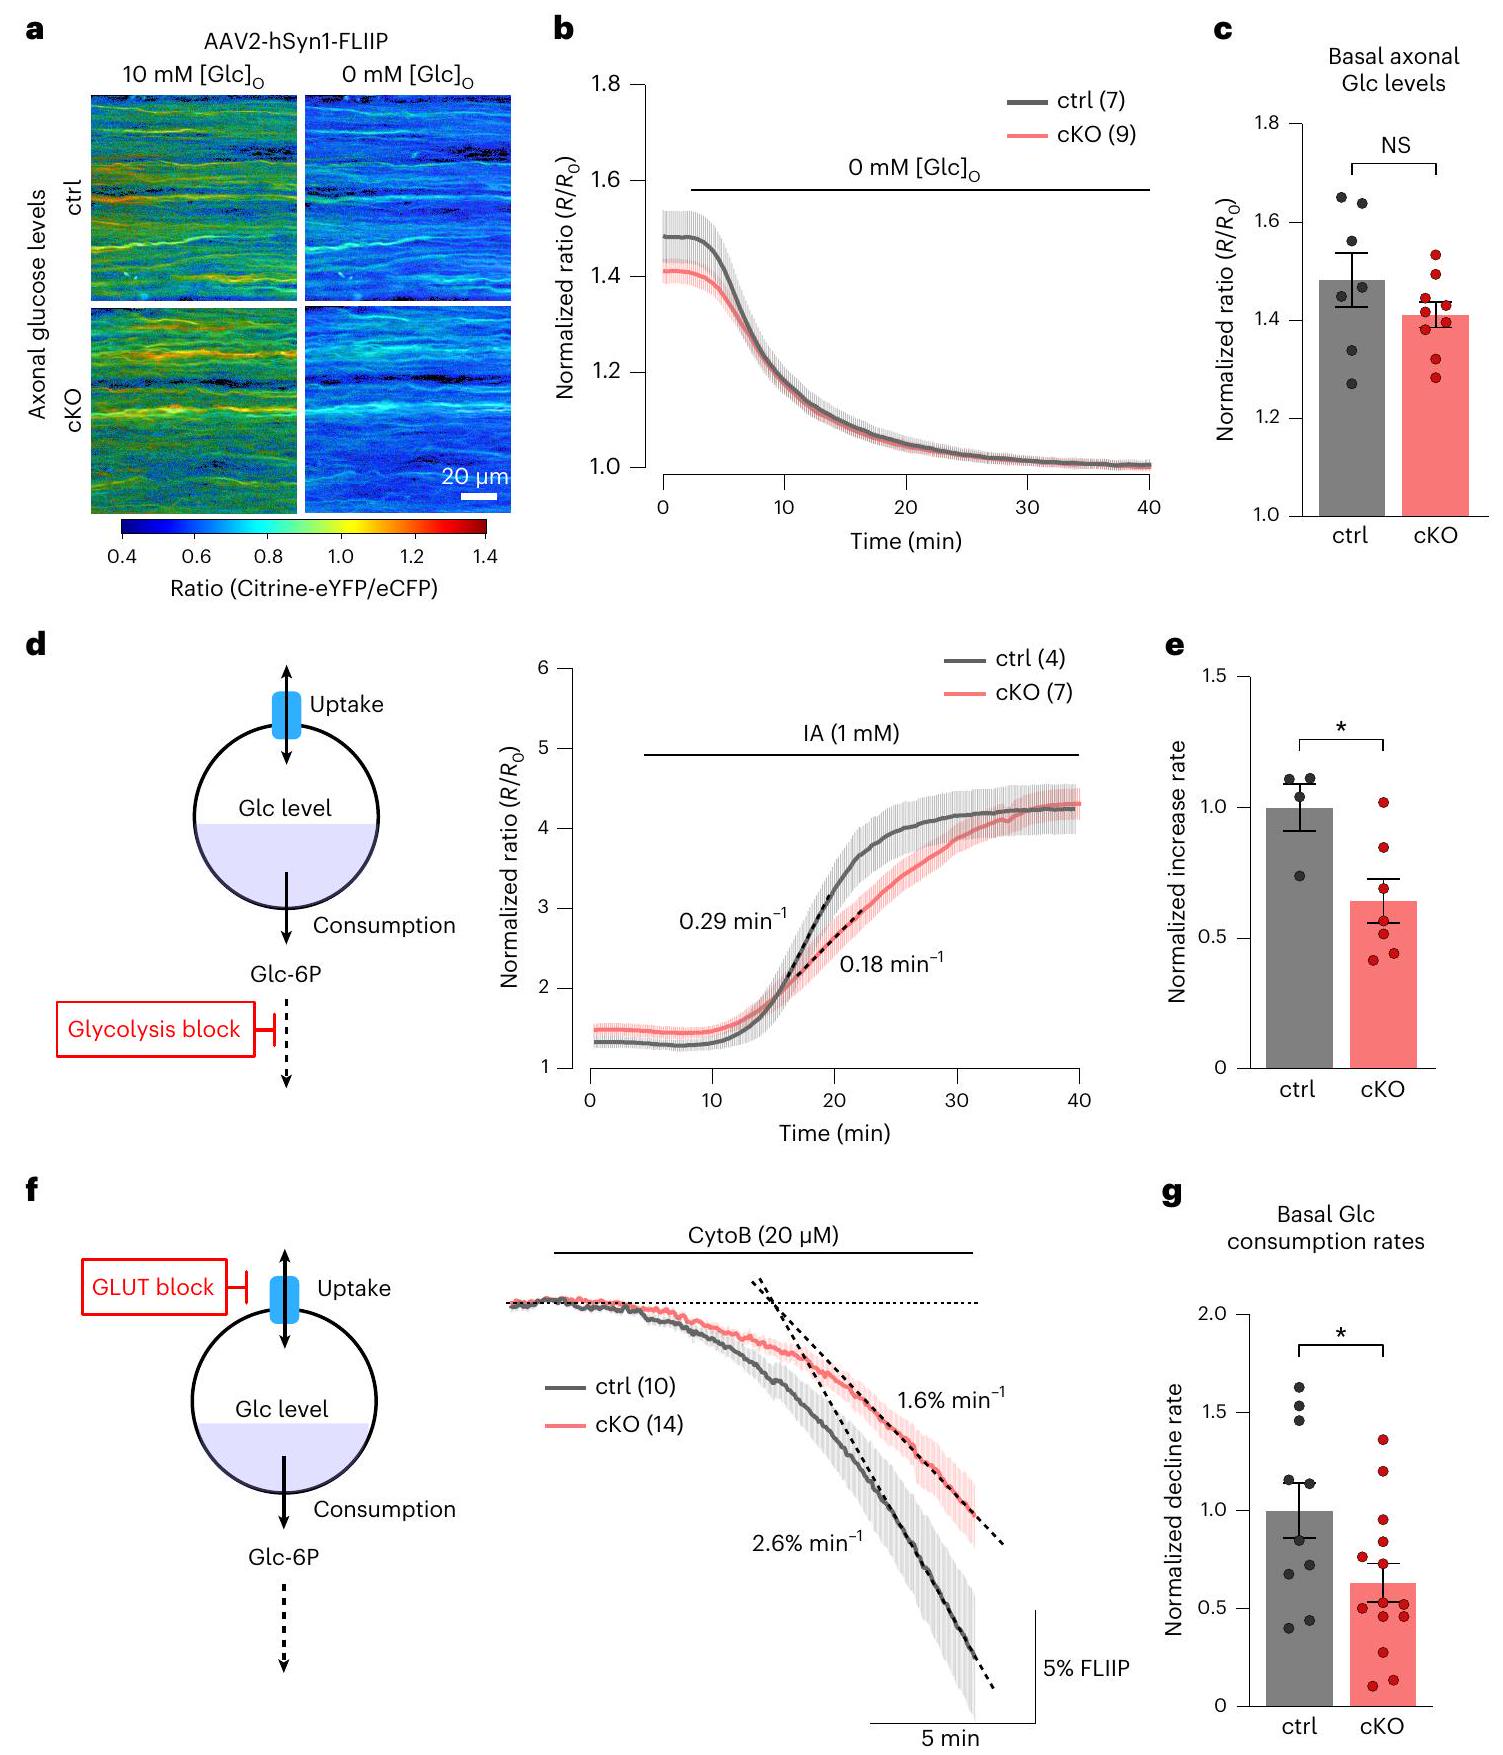
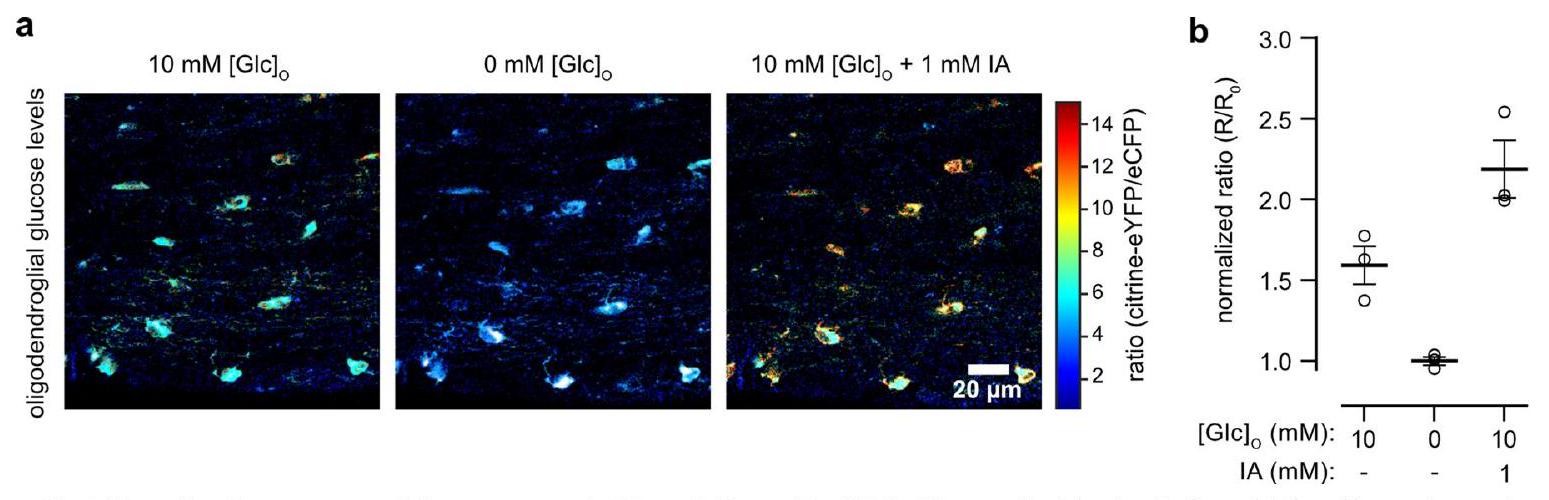
تعبير مستشعر FRET للجلوكوز المعتمد على AAV (FLIIP) في محاور الأعصاب البصرية. تظهر صور النسبة الملونة من الأعصاب الضابطة (الأعلى) و cKO (الأسفل) مستويات الجلوكوز في ACSF مع 10 مللي مول من الجلوكوز وبعد GD. eYFP، بروتين فلوري أصفر معزز؛ eCFP، بروتين فلوري أزرق معزز. ب، مسار الزمن لمستويات الجلوكوز في المحاور.شهر والتحكم ( الفئران أثناء التروية بمحلول ACSF العادي وبدون جلوكوز، مع 10 مللي مول من اللاكتات للحفاظ على CAPs. تم تطبيع التتبع إلى الحد الأدنى بعد GD. ج، مستويات الجلوكوز المحورية القاعدية المتشابهة بين الأنماط الجينية (التحكمcKOغير متزاوج ذو وجهيناختبار). تثبيط التحلل السكري (د، يسار) مع
زيادة مستويات الجلوكوز المحورية ( 1 مليمول ) في محلول ACSF مع 10 مليمول من الجلوكوز.، صحيح). كانت نسبة زيادة الجلوكوز (الخطوط المتقطعة في د) عند IA أقل في cKO (الفئران) بواسطة مقارنةً بالتحكمات فئران؛غير متزاوج ذو وجهيناختبار).f,g، استهلاك الجلوكوز تم تقييمه باستخدام CytoB ( ) خلال تحفيز. الشكل (يسار) ومسار الزمن (يمين) لانخفاض مستوى الجلوكوز عند معالجة CytoB للمجموعة الضابطة ( ) و الفئران، مع معدلات انخفاض متوسطة (الخطوط المتقطعة) لـ و “، على التوالي. ج، معدل استهلاك الجلوكوز المحوري القاعدي في الفئران المعدلة وراثيًا ( cKO) ) تم تقليله بواسطة مقارنةً بالتحكمات فئران؛غير متزاوج ذو وجهيناختبار). يتم تمثيل البيانات كمتوسطس.م. 
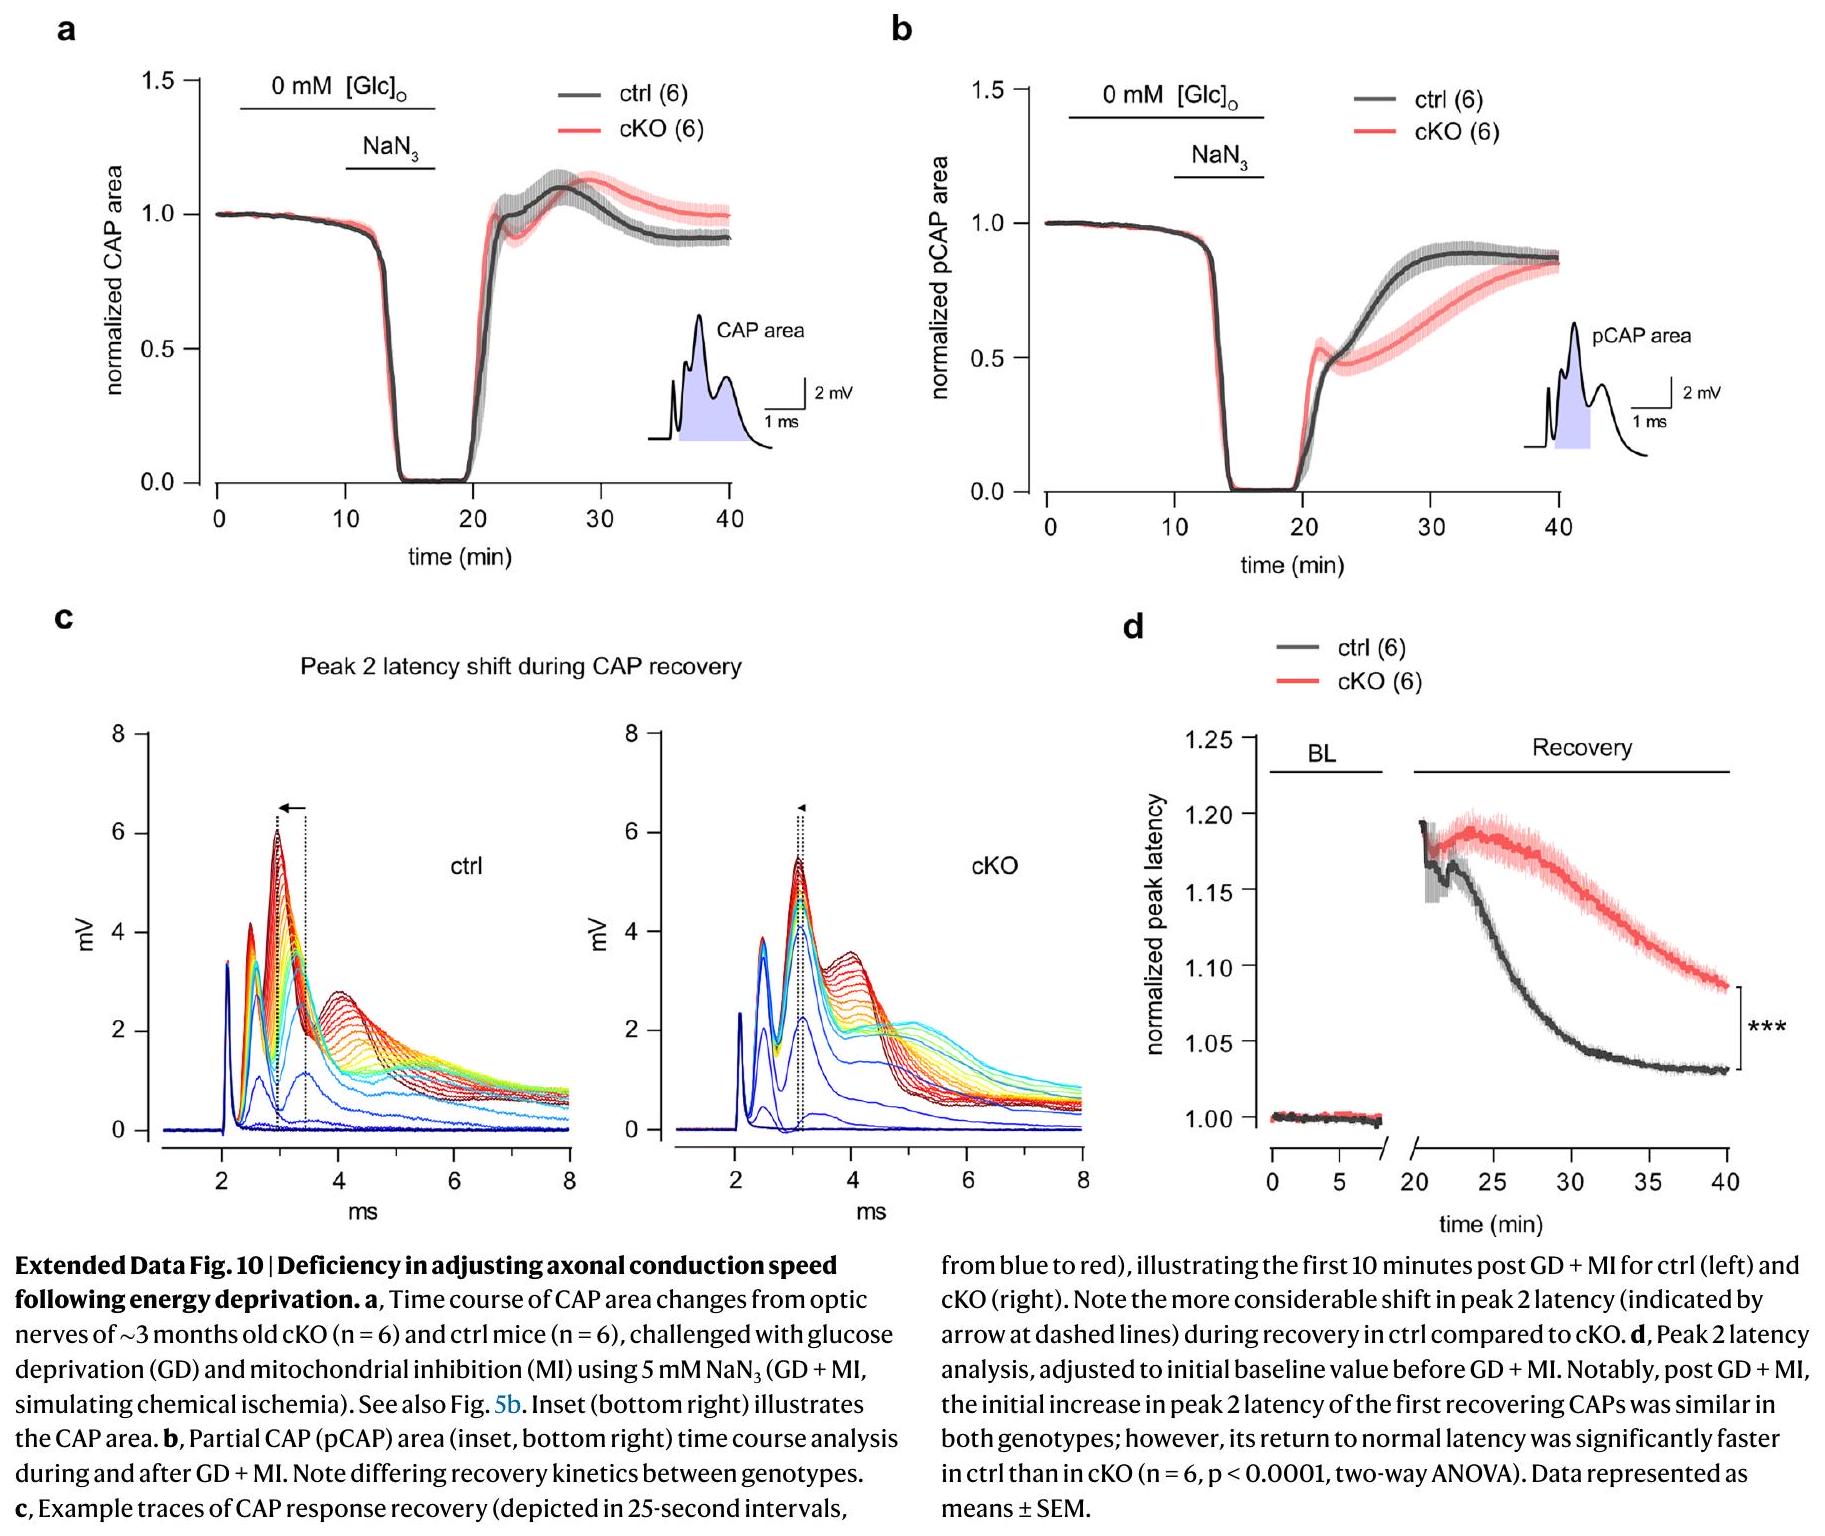
انخفضت الكمون؛ ومع ذلك، تم تقليل هذا التحول في الكمون الذروي (زيادة في سرعة التوصيل) بشكل ملحوظ في أعصاب cKO (الشكل 10d من البيانات الموسعة)، مما يشير إلى عجز في ضبط سرعة التوصيل بعد الحرمان الحاد من الطاقة. نظرًا لأن نقص التروية الكيميائية يزيدويؤثر على الخلايا الدبقية قليلة التغصنموصليةإزالة بواسطة OLs عند إعادة تنشيط المحور العصبي قد تكون حاسمة لـ تعديل سرعات التوصيل. قد تسهم هذه القدرة المحدودة على تعديل السرعة في تقليل استعادة ATP في المحاور العصبية cKO بعد نقص التروية الكيميائية (الشكل 5b,g).
نظرًا لأن استعادة أوقات الذروة لـ CAP بعد التحفيز عالي التردد كانت منخفضة في الفئران المعدلة وراثيًا (الشكل 7 من البيانات الموسعة)، تساءلنا عما إذا كان هذا يتوافق أيضًا مع استعادة ATP المحوري. لذلك
الشكل 7|معدل استهلاك الجلوكوز المحوري الناتج عن النشاط يقل في فئران Kir4.1 cKO. أ، تتبع زمني لـديناميات الجلوكوز المحفزة في المحاور العصبية تظهر اختلافات في تغييرات مستوى الجلوكوز بين cKO ) والتحكم ( الفئران.خلال التحفيز، انخفضت مستويات الجلوكوز بمعدل في التحكم ( ) لكنها ظلت مستقرة ( ) في cKO ( غير متزاوج ذو وجهيناختبار). ج، بعد التحفيز، زادت مستويات الجلوكوز فوق القيم الأساسية الأولية في كلا النمطين الجينيين ولكنها كانت أعلى بشكل ملحوظ في cKO ( ) من الضوابط ( غير متطابق ذو وجهيناختبار). د-ج، تقييم معدل استهلاك الجلوكوز
التغييرات من 0.1 إلىتحفيزات في السيطرة ) و الفئران. د، تم الإشارة إلى منحدرات الانخفاض بواسطة خطوط منقطة. هـ، زادت معدلات استهلاك الجلوكوز المحوري بشكل كبير عندتحفيز (تحفيز 50 هرتز) في الضوابط (0.1 مقابلمزدوج الجوانب مقترناختبار) وفي cKO (0.1 مقابل 50 هرتز،مزدوج الجوانب مقترناختبار). ف، معدل استهلاك الجلوكوز خلالتحفيز كانأقل في cKO مقارنةً بالتحكمات (غير متزاوج ذو وجهيناختبار). كان التغير في استهلاك الجلوكوز من 0.1 إلى 50 هرتز مشابهًا بين الأنماط الجينية (في التحكمات وفيغير متطابق ذو وجهيناختبار). يتم تمثيل البيانات كمتوسطس.م. قياس ديناميات ATP خلال وبعدتحفيز (شكل. كانت نسبة ومدى الانخفاضات في مستويات ATP المحورية خلال التحفيز عالي التردد متشابهة بين الأنماط الجينية (الشكل 5h,i). كما أن معدل استعادة ATP الأولي بعد التحفيز لم يتغير أيضًا (الشكل 5h,j). ومع ذلك، في مرحلة التعافي، أظهرت المحاور العصبية cKO انتعاشًا أقل قليلاً في مستوى ATP مقارنة بالقيم الأساسية الأولية (الشكل 5h، k). ومن ثم، فإن غياب Kir4.1 وانخفاض Kقد يزيد معدل الإزالة من العبء الطاقي على المحاور العصبية بعد النشاط عالي التردد أو نقص التروية الكيميائية.
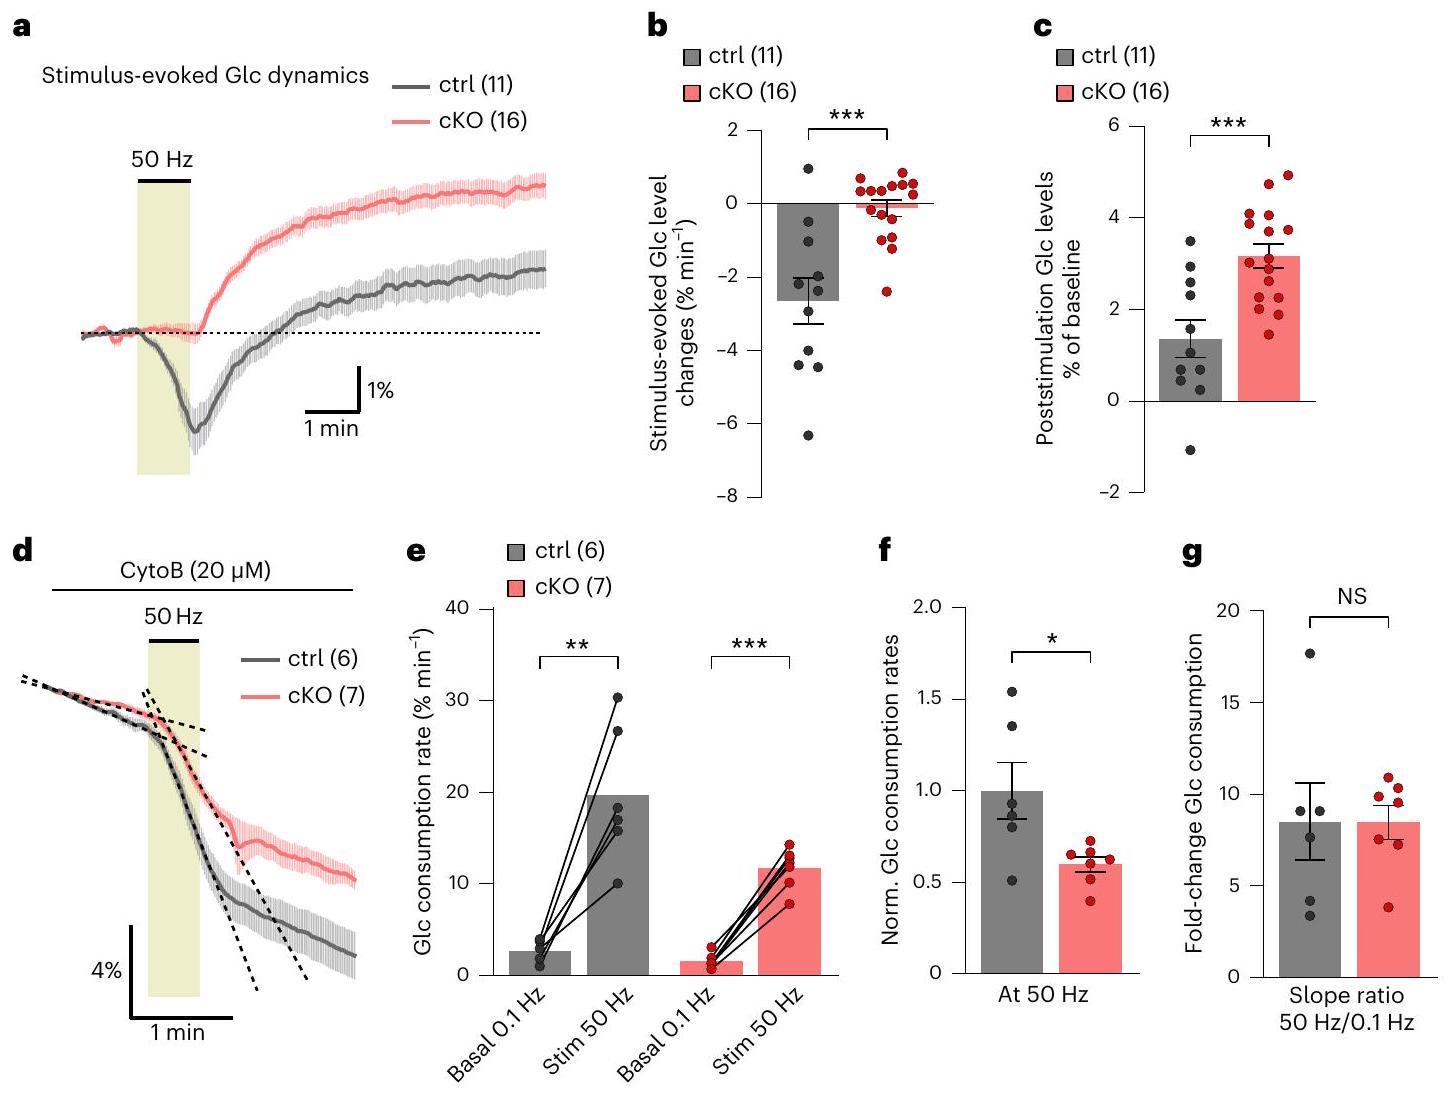
انخفاض في استقلاب الجلوكوز المحوري في فئران Kir4.1 cKO
تعكس مستويات اللاكتات المحورية المنخفضة وارتفاعات اللاكتات الناتجة عن النشاط في فئران Kir4.1 cKO الدعم الأيضي المنخفض من الخلايا الدبقية قليلة التغصن. تشير النتائج الأخيرة إلى أنه، بالإضافة إلى اللاكتات، قد تزود الخلايا الدبقية قليلة التغصن المحاور بالجلوكوز.. ومع ذلك، فإن تنظيم امتصاص الجلوكوز والجليكوليز في المحاور الميالينية والمساهمة المحتملة للخلايا الدبقية قليلة التغصن لا يزال غير واضح. لدراسة ديناميات الجلوكوز، قمنا بالتعبير عن مستشعر الجلوكوز FLIIPفي محاور الأعصاب البصرية من خلال توصيل AAV داخل الجسم الزجاجي (الشكل 6أ). مستويات الجلوكوز المحورية الأساسية (عندكانت مستويات التحفيز قابلة للمقارنة بين الأنماط الجينية، مع مستويات أساسية تم الحصول عليها من خلال تطبيع نسب FRET في ACSF مع 10 مللي مول من الجلوكوز مقابل الحد الأدنى من المستويات بعد GD (الشكل 6a-c). لتقييم نطاق المستشعر، قمنا بتطبيق IA لتثبيط التحلل السكري، مما أدى إلى زيادة في مستويات الجلوكوز في كلا النمطين الجينيين (الشكل 6د). ومع ذلك، فإن معدل زيادة الجلوكوز المحوري كانأبطأ في أعصاب cKO مقارنةً بالتحكم (الشكل 6d,e)، مما يشير إلى انخفاض في امتصاص الجلوكوز أو نشاط الهيكسوكيناز. عند قياس تدفق الجليكوليز باستخدام CytoB، وجدنا انخفاضًا بنسبة 37% في استهلاك الجلوكوز المحوري في أعصاب cKO (الشكل 6f,g). وهذا يعني انخفاضًا مماثلاً في امتصاص الجلوكوز في المحاور cKO للحفاظ على مستويات الجلوكوز الأساسية المتساوية كما في التحكم (الشكل 6c)، مما يفسر الزيادة الأبطأ في الجلوكوز مع علاج IA (الشكل 6d,e).
أثناء اختبار ما إذا كانت ديناميات الجلوكوز المحوري تختلف خلالعند التحفيز، لاحظنا أن مستويات الجلوكوز انخفضت في المحاور الضابطة لكنها ظلت ثابتة في المحاور cKO (الشكل 7أ، ب). وهذا يشير إلى تنشيط أقوى للجليكوليز مقارنةً بامتصاص الجلوكوز في المحاور الضابطة، بينما كانت متوازنة في المحاور cKO. بعد التحفيز، زادت مستويات الجلوكوز فوق المستوى الأساسي في كلا المجموعتين (الشكل 7أ، ج)، مما يوحي باستمرار تنشيط امتصاص الجلوكوز بعد انتهاء التحفيز. قد تكون الفروق في ديناميات الجلوكوز خلال النشاط عالي التردد ناتجة عن انخفاض تنشيط استهلاك الجلوكوز في cKO مقارنةً بالضوابط. في الواقع، زاد التحفيز من استهلاك الجلوكوز المحوري مقارنةً بالأساسي (عندتحفيز) النشاط الجليكولي (الشكل 7د، هـ)، لكن هذه الزيادة كانت أقل في محاور cKO (الشكل 7f). من المثير للاهتمام أن كل من الأعصاب الضابطة و cKO أظهرت زيادة بمقدار ثمانية أضعاف في معدل استهلاك الجلوكوز تحت التحفيز (الشكل 7g). لذلك، على الرغم من أن آلية تنشيط التحلل السكري تظل سليمة في محاور cKO، إلا أن معدل استقلاب الجلوكوز العام لديهم ينخفض بحواليكلاهما في حالة الراحة وأثناء النشاط.
الشكل 8| نموذج ارتباط الأكسون-OL المدعوم بالنشاط. يوضح المخطط نموذجًا عمليًا حيث يتم التحكم في التواصل بين الأكسون وOL والارتباط الأيضي في المادة البيضاء بواسطةوت signaling المعتمد على Kir4.1. يؤدي النبض السريع في المحاور العصبية إلى زيادة سريعة فيوتحلل السكر. تكتشف OLs بشكل أساسي النشاط المحوري من خلال الارتفاع فيوتفعيل قنوات Kir4.1. هذا-الإشارات المتوسطة تسهل إمداد الأكسونات باللاكتات (أو البيروفات). بالإضافة إلى تنظيم الاقتران الأيضي الحاد، يقوم Kir4.1 في الخلايا الدبقية الضامة بضبط مستويات MCT1 وGLUT1 المايلينية. بالإضافة إلى اللاكتات، قد تزود الخلايا الدبقية الضامة الأكسونات بالجلوكوز و/أو تعدل الأكسون. امتصاص الجلوكوز عند عقد رانفييه. الخلايا الدبقية قليلة التغصنتؤثر التوازن الداخلي أيضًا على تحلل الجلوكوز المحوري، والذي من المحتمل أن يكون حاسمًا للحفاظ على سلامة المحاور من خلال عمليات مختلفة تعتمد على استقلاب الجلوكوز، مثل الحماية المضادة للأكسدة من خلال مسار الفوسفات البنتوز (PPP)، وتخليق الجزيئات المطلوبة للهيكل والوظيفة، وتنظيم حالة الأكسدة والاختزال، والنقل الحويصلي. لم يتم تصوير المساهمة المحتملة للخلايا النجمية كمصدر لللاكتات (أو البيروفات) المشتقة من الجليكوجين للمحاور في هذا المخطط، في انتظار الدراسات المستقبلية. Nav، قناة الصوديوم المعتمدة على الجهد؛ Kv، قناة البوتاسيوم المعتمدة على الجهد.
وبالتالي، نستنتج أن خلايا الدبق (OLs) تنظم امتصاص الجلوكوز واستهلاكه في المحاور العصبية، وهي تفاعل استقلابي فريد بين خلايا الدبق والمحاور العصبية يتطلب وظيفة Kir4.1.
نقاش
قد ينتج فقدان سلامة المحور العصبي عن خلل في وحدة المحور – الخلايا الدبقية.. هذه الدراسة تبرز الدور الحاسم للخلايا الدبقية قليلة التغصن في الحفاظ على صحة المحاور العصبية. لقد كشفنا أن الخلايا الدبقية قليلة التغصن تستجيب للنبضات السريعة في المحاور العصبية من خلال بدء الإشارات والجليكوليز. تكتشف الخلايا الدهنية المحورية النبضات المحورية بشكل أساسي من خلالوتفعيل قناة Kir4.1. تسهل هذه الآلية الإشارية بين المحاور والخلايا الدبقية النخاعية إمداد المحاور بالمواد الأيضية. أدت الاضطرابات في Kir4.1، سواء من خلال تثبيط دوائي أو تعطيل محدد للخلايا الدبقية النخاعية، إلى إضعاف الارتفاعات الناتجة عن النشاط في مستويات اللاكتات في المحاور. أدى نقص Kir4.1 في الخلايا الدبقية النخاعية إلى تقليل وفرة GLUT1 وMCT1 المايلينية، مما أدى إلى انخفاض مستويات اللاكتات في المحاور وعمليات الأيض للجلوكوز. ترتبط هذه العجز الأيضي المبكر في المحاور بأضرار المحاور التي تظهر في وقت لاحق. نقدم نموذج عمل حيثالإشارة من خلال كير4.1 في الخلايا الدبقية القليلة يوجه الاقتران الأيضي في المادة البيضاء (الشكل 8)، مما يؤثر على الأيض الطاقي المحوري، والوظيفة، والبقاء.
زيادات مؤقتة فيتعتبر علامة مميزة للنشاط المحوري. OLs، قابلة للاختراق بشكل كبير إلىتخفيف الاستقطاب مع الارتفاعات في (المرجع 25) وإطلاق النبضات المحورية، التي تم تسهيلها بواسطةقنوات كير الحساسةالذي يتم التعبير عنه بشكل رئيسي بواسطة خلايا الدبق (OLs) هو Kir4.1تشير نتائجنا إلى أن الوساطة بواسطة Kir4.1الامتصاص هو أمر حاسم في تحفيزتدفق في السومات OL، يسهل بواسطة إزالة استقطاب الغشاء وتنشيط وضعية العكس لـ NCX. هذاالإشارات المدفوعة تنظم الربط الأيضي بين خلايا الدبقية oligodendrocytes والمحاور. قد تؤدي إشارات النشاط الأخرى، مثل الغلوتامات، إلىالنشاط في الميكرو دومينات على طول العقدربما المساعدة في تمايز خلايا OL خلال التطوروتعبير GLUT1 على السطحفي سمك الزرد، تُظهر الأغماد المايلينية للخلايا الدبقية الجديدةإشارات استجابةً للنشاط العصبي. ومع ذلك، في تطوير خلايا OLs الفأرية، تم الإبلاغ عن حدوث التغيرات بشكل مستقل عن نشاط الخلايا العصبية القشريةوجدنا أنه، في أعصاب الفئران البصرية،الإشارات في الخلايا الدهنية الناضجة يتم استحثاثها بشكل رئيسي من خلالتزداد خلال إطلاق النار المحوري عالي التردد.يتم إفرازه عند عقد رانفييهوعلى طول المجالات الجانبية المجاورة للعقد تحت غلاف المايلينمُعَزَّز بالنشاطالتراكم حول خلايا الدبق النخاعي (OLs) قد يكون أكثر وضوحًا في المادة البيضاء البالغة الميالين بالكامل مقارنةً بالمناطق القشرية الميالين بشكل نادر، مما يستدعي مزيدًا من التحقيق. عند اكتشاف نشاط محوري مرتفع، تقوم خلايا الدبق النخاعي بسرعة بزيادة استهلاك الجلوكوز وتوفير اللاكتات أو البيروفات عند الطلب (الشكل 8). من المحتمل أن يتم تحفيز هذه العملية بواسطةوتفعيل Kir4.1. إن تثبيط Kir4.1، الذي يعطل بشكل محدد الإشارات بين المحاور والخلايا الدبقية، قلل من التحفيز و-زيادة اللاكتات المستحثة في المحاور. ومن الجدير بالذكر أن الطرق الدوائية المستخدمة لتقييم ديناميات اللاكتات لم تؤثر على نشاط المحاور أو عبء العمل، مما قد يؤثر على استقلاب المحاور. وبالتالي، فإن زيادات اللاكتات في المحاور تتضمن دعمًا استقلابيًا من الخلايا الدبقية، كما يتضح أكثر من خلال الانخفاض في الزيادات المستحثة للاكتات في الفئران المعدلة وراثيًا التي تفتقر إلى بروتين Kir4.1 الخاص بالخلايا الدبقية.يمكن أن تسرع الزيادات من عملية التحلل السكريوتعزيز إفراز اللاكتات من خلال ناقلات أحادية الكربوكسيلات المرتبطة بالبروتونات. ومن ثم، زيادة البروتونات في OLs، المرتبطة بـ (المرجع 53) ونشاط Kir4.1 قد يسهل إفراز اللاكتات. هناك حاجة لمزيد من البحث لتوضيحآلية إفراز اللاكتات أو البيروفات المدفوعة في خلايا الدبقية. بالإضافة إلى ذلك، الدور المساهم للخلايا النجمية، تحديدًا في المادة البيضاءيتطلب المزيد من الاستكشاف. يؤدي الحذف الجنيني لـ Kir4.1 من كل من الخلايا الدبقية وخلايا سلالة الخلايا الدهنية إلى حدوث أمراض شديدة في المادة البيضاء، بما في ذلك تكوين الفجوات المايلينية..
ومع ذلك، فإن الحذف المحدد لسلالة OL لجين Kir4.1 خالٍ من الشذوذات المايلينية.الذي تم تأكيده جزئيًا من خلال هذه الدراسة. وبالتالي، فإن كير4.1 الأستروسيتية والسحب، من المحتمل أن يتضمن ارتباط الفجواتتكون حاسمة خلال تطوير المادة البيضاء. ومع ذلك، في المادة البيضاء البالغة، يبدو أن السنكتيوم الدبقي أقل أهمية لـالتوازن الداخليتشير تسجيلات CAP في هذه الدراسة إلى أن OLs قد تتعامل بشكل مستقل مع النشاط المحفزإزالة في الأعصاب البصرية للبالغين. بالإضافة إلى الاقتران الأيضي الحاد، قد يقوم كير4.1 من الخلايا الدبقية قليلة التغصن أيضًا بضبط آلية الدعم للخلايا الدبقية قليلة التغصن، كما يتضح من انخفاض مستويات GLUT1 وMCT1 المايلينية في فئران Kir4.1 cKO. كشفت تحليل بروتينات العصب البصري عن انخفاض في البروتينات الأساسية لنقل الأغشية داخل الخلايا، بما في ذلك بروتين الأغشية المرتبط بالحويصلات 2 (VAMP2)، VAMP3، بروتين راب المرتبط بالراص 2B (RAB2B) وRAB5A، والتي تم الإبلاغ عن تعبيرها بواسطة الخلايا الدبقية قليلة التغصن الناضجة.مما ي implicating Kir4.1 في تنظيم نقل الناقلات الأيضيةربطت الأبحاث السابقة انخفاضًا بنسبة 50-80% في مستويات MCT1 أو GLUT1 المياليني بظهور أمراض المحاور المتأخرة في الفئران، والتي تظهر عادةً بين 8 و 24 شهرًا من العمر.في هذه الدراسة، أظهرت فئران Kir4.1 cKO علامات اعتلال المحاور العصبية في عمر 7-8 أشهر، تسبقها انخفاض بنسبة 50% في مستويات GLUT1 وMCT1 في عمر 2-3 أشهر. علاوة على ذلك، يرتبط هذا بنقص مبكر في استقلاب الطاقة المحورية. في فئران Kir4.1 cKO الصغيرة، أظهرت المحاور العصبية مستويات منخفضة من اللاكتات الأساسية وانخفاض في امتصاص واستهلاك الجلوكوز. من المحتمل أن تكون هذه العيوب ناتجة عن ضعف إمداد المستقلبات من الخلايا الدبقية واستقلاب الجلوكوز في المحاور العصبية. على الرغم من هذه التغيرات الأيضية، بدا أن توازن ATP في المحاور العصبية لم يتأثر. ومن الجدير بالذكر أن استقلاب الجلوكوز ضروري لمجموعة متنوعة من الوظائف الخلوية بخلاف إنتاج ATP.بما في ذلك الحماية المضادة للأكسدة من خلال مسار الفوسفات الخماسيوتوفير الوسائط الجليكولية للجزيئات الهيكلية والوظيفية الحيوية (الشكل 8). بالإضافة إلى ذلك، فإن الجليكوليز المحوري أساسي للحفاظ على النقل المحوري السريع.. وبالتالي، قد يؤثر ضعف استقلاب الجلوكوز المحوري على النقل المحوري ويزيد من القابلية للإجهاد التأكسدي، مما قد يؤدي إلى تلف المحاور مع التقدم في العمر. من غير المحتمل أن تكون التغيرات الأيضية في المحاور لدى فئران Kir4.1cKO ناتجة عن ضعفإزالة. خارج الخليةالتراكم، الناتج عن ضعف الإزالة، يجب أن يزيد من عبء العمل المحوري ويحفز عملية الأيض للجلوكوز.ومع ذلك، أظهرت محاور كير4.1cKO انخفاضًا في استقلاب الجلوكوز. التأثير الرئيسي للإصابة بـتمت ملاحظة الوضوح في سرعة تعافي ذروة CAP بعد التحفيز عالي التردد، وليس عند مستويات النشاط القاعدي. وبالتالي، فإن انخفاض مستويات اللاكتات وعمليات الأيض للجلوكوز في المحاور عند النشاط القاعدي من المرجح أن يكون بسبب العجز في وحدة الأيض بين المحور والخلايا الدبقية. علاوة على ذلك، تشير الديناميات غير المتغيرة لأدينوسين ثلاثي الفوسفات (ATP) في الفئران المعدلة وراثيًا (cKO) إلى طلب طاقة محوري مستقر أثناء النشاط الكهربائي. ونتيجة لذلك، لم تتأثر الديناميات المنخفضة للاكتات والجلوكوز المستحثة بالتحفيز بالتغيرات الحادة في عبء العمل المحوري. كما وجدنا تنفسًا ميتوكوندريًا طبيعيًا في المحاور لدى الفئران المعدلة وراثيًا Kir4.1cKO، دون أي علامات على الالتهاب أو تنشيط الخلايا الدبقية تؤثر على الأيض المحوري في سن مبكرة. ومن الجدير بالذكر أن هذه الدراسة كشفت أن الخلايا الدبقية (OLs) تلعب دورًا حاسمًا في تنظيم الأيض الجلوكوز المحوري، بما في ذلك كل من الامتصاص والاستهلاك. أظهرت التجارب في شرائح الجسم الثفني أن تحميل الجلوكوز في الخلايا الدبقية يمكن أن يدعم CAPs الثفنية في ظروف نقص الجلوكوز، مما يشير إلى قدرة الخلايا الدبقية على نقل الجلوكوز إلى المحاور.إن انخفاض وفرة GLUT1 المايلينية، جنبًا إلى جنب مع انخفاض امتصاص الجلوكوز في المحاور العصبية cKO، يشير إلى أن الخلايا الدبقية (OLs) والمايلين يؤثران على توصيل الجلوكوز إلى المحاور. يحتاج تأثير الخلايا الدبقية على تحلل الجلوكوز في المحاور إلى مزيد من التحقيق. يمكن أن تؤثر الخلايا الدبقية على توازن الطاقة في المحاور من خلال إشارات الإكسوزوم.. ومع ذلك، سواء كانت وتشارك وظائف Kir4.1 في إفراز الإكسوزومات، مشابهة لإشارات الغلوتامات، يبقى أن نرى. بالنظر إلى دور الـمضخة في تنظيم استقلاب الطاقة العصبيةالتكيفات في المحاور العصبيةقد تؤثر المضخات على تحلل الجلوكوز المحوري. وبناءً عليه، يبرز هذه الدراسة التفاعلات الأيضية المعقدة بين الخلايا الدبقية (OLs) والمحاور، مما يدعو إلى مزيد من الاستكشاف في تنظيم استقلاب الجلوكوز المحوري، والذي قد يكون له تداعيات على تدهور المحاور في الشيخوخة والأمراض التنكسية العصبية.
المحتوى عبر الإنترنت
أي طرق، مراجع إضافية، ملخصات تقارير Nature Portfolio، بيانات المصدر، بيانات موسعة، معلومات إضافية، شكر وتقدير، معلومات مراجعة الأقران؛ تفاصيل مساهمات المؤلفين والمصالح المتنافسة؛ وبيانات توفر البيانات والرموز متاحة فيhttps://doi.org/10.1038/s41593-023-01558-3.
References
Salvadores, N., Sanhueza, M., Manque, P. & Court, F. A. Axonal degeneration during aging and its functional role in neurodegenerative disorders. Front. Neurosci. 11, 451 (2017).
Medana, I. M. & Esiri, M. M. Axonal damage: a key predictor of outcome in human CNS diseases. Brain 126, 515-530 (2003).
Saab, A. S., Tzvetanova, I. D. & Nave, K.-A. The role of myelin and oligodendrocytes in axonal energy metabolism. Curr. Opin. Neurobiol. 23, 1065-1072 (2013).
Nave, K.-A. Myelination and the trophic support of long axons. Nat. Rev. Neurosci. 11, 275-283 (2010).
Philips, T. & Rothstein, J. D. Oligodendroglia: metabolic supporters of neurons. J. Clin. Invest. 127, 3271-3280 (2017).
Duncan, G. J., Simkins, T. J. & Emery, B. Neuron-oligodendrocyte interactions in the structure and integrity of axons. Front. Cell Dev. Biol. 9, 653101 (2021).
Xin, W. & Chan, J. R. Myelin plasticity: sculpting circuits in learning and memory. Nat. Rev. Neurosci. 21, 682-694 (2020).
Fünfschilling, U. et al. Glycolytic oligodendrocytes maintain myelin and long-term axonal integrity. Nature 485, 517-521 (2012).
Lee, Y. et al. Oligodendroglia metabolically support axons and contribute to neurodegeneration. Nature 487, 443-448 (2012).
Saab, A. S. et al. Oligodendroglial NMDA receptors regulate glucose import and axonal energy metabolism. Neuron 91, 119-132 (2016).
Trevisiol, A. et al. Monitoring ATP dynamics in electrically active white matter tracts. eLife 6, e24241 (2017).
Tekkök, S. B., Brown, A. M., Westenbroek, R., Pellerin, L. & Ransom, B. R. Transfer of glycogen-derived lactate from astrocytes to axons via specific monocarboxylate transporters supports mouse optic nerve activity. J. Neurosci. Res. 81, 644-652 (2005).
Philips, T. et al. MCT1 deletion in oligodendrocyte lineage cells causes late-onset hypomyelination and axonal degeneration. Cell Rep. 34, 108610 (2021).
Edgar, J. M. et al. Río-Hortega’s drawings revisited with fluorescent protein defines a cytoplasm-filled channel system of CNS myelin. J. Anat. 239, 1241-1255 (2021).
Saab, A. S. & Nave, K.-A. Myelin dynamics: protecting and shaping neuronal functions. Curr. Opin. Neurobiol. 47, 104-112 (2017).
Snaidero, N. et al. Antagonistic functions of MBP and CNP establish cytosolic channels in CNS myelin. Cell Rep. 18, 314-323 (2017).
Griffiths, I. et al. Axonal swellings and degeneration in mice lacking the major proteolipid of myelin. Science 280, 1610-1613 (1998).
Lüders, K. A. et al. Maintenance of high proteolipid protein level in adult central nervous system myelin is required to preserve the integrity of myelin and axons. Glia 67, 634-649 (2019).
Edgar, J. M. et al. Oligodendroglial modulation of fast axonal transport in a mouse model of hereditary spastic paraplegia. J. Cell Biol. 166, 121-131 (2004).
Steyer, A. M. et al. Pathology of myelinated axons in the PLP-deficient mouse model of spastic paraplegia type 2 revealed by volume imaging using focused ion beam-scanning electron microscopy. J. Struct. Biol. 210, 107492 (2020).
Trevisiol, A. et al. Structural myelin defects are associated with low axonal ATP levels but rapid recovery from energy deprivation in a mouse model of spastic paraplegia. PLoS Biol. 18, e3000943 (2020).
Mukherjee, C. et al. Oligodendrocytes provide antioxidant defense function for neurons by secreting ferritin heavy chain. Cell Metab. 32, 259-272 (2020).
Larson, V. A. et al. Oligodendrocytes control potassium accumulation in white matter and seizure susceptibility. eLife 7, e34829 (2018).
Schirmer, L. et al. Oligodendrocyte-encoded Kir4.1 function is required for axonal integrity. eLife 7, e36428 (2018).
Kettenmann, H., Sonnhof, U. & Schachner, M. Exclusive potassium dependence of the membrane potential in cultured mouse oligodendrocytes. J. Neurosci. 3, 500-505 (1983).
Yamazaki, Y. et al. Modulatory effects of oligodendrocytes on the conduction velocity of action potentials along axons in the alveus of the rat hippocampal CA1 region. Neuron Glia Biol. 3, 325-334 (2007).
Battefeld, A., Klooster, J. & Kole, M. H. P. Myelinating satellite oligodendrocytes are integrated in a glial syncytium constraining neuronal high-frequency activity. Nat. Commun. 7, 11298 (2016).
Looser, Z. J., Barrett, M. J. P., Hirrlinger, J., Weber, B. & Saab, A. S. Intravitreal AAV-delivery of genetically encoded sensors enabling simultaneous two-photon imaging and electrophysiology of optic nerve axons. Front. Cell. Neurosci. 12, 377 (2018).
Doerflinger, N. H., Macklin, W. B. & Popko, B. Inducible site-specific recombination in myelinating cells. Genesis 35, 63-72 (2003).
Madisen, L. et al. Transgenic mice for intersectional targeting of neural sensors and effectors with high specificity and performance. Neuron 85, 942-958 (2015).
Chen, T.-W. et al. Ultrasensitive fluorescent proteins for imaging neuronal activity. Nature 499, 295-300 (2013).
Takanaga, H., Chaudhuri, B. & Frommer, W. B. GLUT1 and GLUT9 as major contributors to glucose influx in HepG2 cells identified by a high sensitivity intramolecular FRET glucose sensor. Biochim. Biophys. Acta 1778, 1091-1099 (2008).
Bittner, C. X. et al. High resolution measurement of the glycolytic rate. Front. Neuroenergetics 2, 26 (2010).
Bittner, C. X. et al. Fast and reversible stimulation of astrocytic glycolysis by and a delayed and persistent effect of glutamate. J. Neurosci. 31, 4709-4713 (2011).
Micu, I. et al. The molecular physiology of the axo-myelinic synapse. Exp. Neurol. 276, 41-50 (2016).
Micu, I. et al. NMDA receptors mediate calcium accumulation in myelin during chemical ischaemia. Nature 439, 988-992 (2006).
James, G. & Butt, A. M. P2X and P2Y purinoreceptors mediate ATP-evoked calcium signalling in optic nerve glia in situ. Cell Calcium 30, 251-259 (2001).
Kirischuk, S., Scherer, J., Kettenmann, H. & Verkhratsky, A. Activation of P2-purinoreceptors triggered release from InsP3-sensitive internal stores in mammalian oligodendrocytes. J. Physiol. 483, 41-57 (1995).
Matute, C. et al. P2X(7) receptor blockade prevents ATP excitotoxicity in oligodendrocytes and ameliorates experimental autoimmune encephalomyelitis. J. Neurosci. 27, 9525-9533 (2007).
Stevens, B., Porta, S., Haak, L. L., Gallo, V. & Fields, R. D. Adenosine: a neuron-glial transmitter promoting myelination in the CNS in response to action potentials. Neuron 36, 855-868 (2002).
Ransom, C. B., Ransom, B. R. & Sontheimer, H. Activity-dependent extracellular accumulation in rat optic nerve: the role of glial and axonal pumps. J. Physiol. 522, 427-442 (2000).
Bay, V. & Butt, A. M. Relationship between glial potassium regulation and axon excitability: a role for glial Kir4.1 channels. Glia 60, 651-660 (2012).
Olsen, M. L. & Sontheimer, H. Functional implications for Kir4.1 channels in glial biology: from buffering to cell differentiation. J. Neurochem. 107, 589-601 (2008).
Boscia, F. et al. Silencing or knocking out the exchanger-3 (NCX3) impairs oligodendrocyte differentiation. Cell Death Differ. 19, 562-572 (2012).
Casamassa, A. et al. Ncx3 gene ablation impairs oligodendrocyte precursor response and increases susceptibility to experimental autoimmune encephalomyelitis. Glia 64, 1124-1137 (2016).
Spencer, S. A., Suárez-Pozos, E., Escalante, M., Myo, Y. P. & Fuss, B. Sodium-calcium exchangers of the SLC8 family in oligodendrocytes: functional properties in health and disease. Neurochem. Res. 45, 1287-1297 (2020).
Friess, M. et al. Intracellular ion signaling influences myelin basic protein synthesis in oligodendrocyte precursor cells. Cell Calcium 60, 322-330 (2016).
Moyon, S. et al. TET1-mediated DNA hydroxymethylation regulates adult remyelination in mice. Nat. Commun. 12, 3359 (2021).
Yamazaki, Y., Abe, Y., Fujii, S. & Tanaka, K. F. Oligodendrocytic co-transporter 1 activity facilitates axonal conduction and restores plasticity in the adult mouse brain. Nat. Commun. 12, 5146 (2021).
San Martín, A. et al. A genetically encoded FRET lactate sensor and its use to detect the Warburg effect in single cancer cells. PLoS ONE 8, e57712 (2013).
Djukic, B., Casper, K. B., Philpot, B. D., Chin, L.-S. & McCarthy, K. D. Conditional knock-out of leads to glial membrane depolarization, inhibition of potassium and glutamate uptake, and enhanced short-term synaptic potentiation. J. Neurosci. 27, 11354-11365 (2007).
Imamura, H. et al. Visualization of ATP levels inside single living cells with fluorescence resonance energy transfer-based genetically encoded indicators. Proc. Natl Acad. Sci. USA 106, 15651-15656 (2009).
Hamilton, N. B., Kolodziejczyk, K., Kougioumtzidou, E. & Attwell, D. Proton-gated -permeable TRP channels damage myelin in conditions mimicking ischaemia. Nature 529, 523-527 (2016).
Meyer, N. et al. Oligodendrocytes in the mouse corpus callosum maintain axonal function by delivery of glucose. Cell Rep. 22, 2383-2394 (2018).
Zhang, X. et al. Oligodendroglial glycolytic stress triggers inflammasome activation and neuropathology in Alzheimer’s disease. Sci. Adv. 6, eabb8680 (2020).
Mot, A. I., Depp, C. & Nave, K.-A. An emerging role of dysfunctional axon-oligodendrocyte coupling in neurodegenerative diseases. Dialogues Clin. Neurosci. 20, 283-292 (2018).
Kenigsbuch, M. et al. A shared disease-associated oligodendrocyte signature among multiple CNS pathologies. Nat. Neurosci. 25, 876-886 (2022).
Kaya, T. et al. cells induce interferon-responsive oligodendrocytes and microglia in white matter aging. Nat. Neurosci. 25, 1446-1457 (2022).
Brasko, C., Hawkins, V., De La Rocha, I. C. & Butt, A. M. Expression of Kir4.1 and Kir5.1 inwardly rectifying potassium channels in oligodendrocytes, the myelinating cells of the CNS. Brain Struct. Funct. 222, 41-59 (2017).
Papanikolaou, M., Butt, A. M. & Lewis, A. A critical role for the inward rectifying potassium channel Kir7.1 in oligodendrocytes of the mouse optic nerve. Brain Struct. Funct. 225, 925-934 (2020).
Almeida, R. G. et al. Myelination induces axonal hotspots of synaptic vesicle fusion that promote sheath growth. Curr. Biol. 31, 3743-3754 (2021).
Micu, I., Plemel, J. R., Caprariello, A. V., Nave, K. A. & Stys, P. K. Axo-myelinic neurotransmission: a novel mode of cell signalling in the central nervous system. Nat. Rev. Neurosci. 19, 49-58 (2018).
Hines, J. H., Ravanelli, A. M., Schwindt, R., Scott, E. K. & Appel, B. Neuronal activity biases axon selection for myelination in vivo. Nat. Neurosci. 18, 683-689 (2015).
Wake, H., Lee, P. R. & Fields, R. D. Control of local protein synthesis and initial events in myelination by action potentials. Science 333, 1647-1651 (2011).
Mensch, S. et al. Synaptic vesicle release regulates myelin sheath number of individual oligodendrocytes in vivo. Nat. Neurosci. 18, 628-630 (2015).
Kukley, M., Capetillo-Zarate, E. & Dietrich, D. Vesicular glutamate release from axons in white matter. Nat. Neurosci. 10, 311-320 (2007).
Ziskin, J. L., Nishiyama, A., Rubio, M., Fukaya, M. & Bergles, D. E. Vesicular release of glutamate from unmyelinated axons in white matter. Nat. Neurosci. 10, 321-330 (2007).
Krasnow, A. M., Ford, M. C., Valdivia, L. E., Wilson, S. W. & Attwell, D. Regulation of developing myelin sheath elongation by oligodendrocyte calcium transients in vivo. Nat. Neurosci. 21, 24-28 (2018).
Baraban, M., Koudelka, S. & Lyons, D. A. activity signatures of myelin sheath formation and growth in vivo. Nat. Neurosci. 21, 19-23 (2018).
Battefeld, A., Popovic, M. A., de Vries, S. I. & Kole, M. H. P. High-frequency microdomain transients and waves during early myelin internode remodeling. Cell Rep. 26, 182-191 (2019).
Kanda, H. et al. TREK-1 and TRAAK are principal channels at the nodes of Ranvier for rapid action potential conduction on mammalian myelinated afferent nerves. Neuron 104, 960-971 (2019).
Brohawn, S. G. et al. The mechanosensitive ion channel TRAAK is localized to the mammalian node of Ranvier. eLife 8, e50403 (2019).
Rash, J. E. Molecular disruptions of the panglial syncytium block potassium siphoning and axonal saltatory conduction: pertinence to neuromyelitis optica and other demyelinating diseases of the central nervous system. Neuroscience 168, 982-1008 (2010).
Cohen, C. C. H. et al. Saltatory conduction along myelinated axons involves a periaxonal nanocircuit. Cell 180, 311-322 (2020).
Ruminot, I., Schmälzle, J., Leyton, B., Barros, L. F. & Deitmer, J. W. Tight coupling of astrocyte energy metabolism to synaptic activity revealed by genetically encoded FRET nanosensors in hippocampal tissue. J. Cereb. Blood Flow Metab. 39, 513-523 (2019).
Wang, N. et al. Potassium channel regulates oligodendrocyte differentiation via intracellular pH regulation. Glia 70, 2093-2107 (2022).
Fernández-Moncada, I. et al. Bidirectional astrocytic GLUT1 activation by elevated extracellular K. Glia 69, 1012-1021 (2021).
Zuend, M. et al. Arousal-induced cortical activity triggers lactate release from astrocytes. Nat. Metab. 2, 179-191 (2020).
Sotelo-Hitschfeld, T. et al. Channel-mediated lactate release by -stimulated astrocytes. J. Neurosci. 35, 4168-4178 (2015).
Köhler, S. et al. Gray and white matter astrocytes differ in basal metabolism but respond similarly to neuronal activity. Glia 71, 229-244 (2023).
Menichella, D. M. et al. Genetic and physiological evidence that oligodendrocyte gap junctions contribute to spatial buffering of potassium released during neuronal activity. J. Neurosci. 26, 10984-10991 (2006).
Neusch, C., Rozengurt, N., Jacobs, R. E., Lester, H. A. & Kofuji, P. Kir4.1 potassium channel subunit is crucial for oligodendrocyte development and in vivo myelination. J. Neurosci. 21, 5429-5438 (2001).
Orthmann-Murphy, J. L., Abrams, C. K. & Scherer, S. S. Gap junctions couple astrocytes and oligodendrocytes. J. Mol. Neurosci. 35, 101-116 (2008).
Hösli, L. et al. Decoupling astrocytes in adult mice impairs synaptic plasticity and spatial learning. Cell Rep. 38, 110484 (2022).
Jahn, O. et al. The CNS myelin proteome: deep profile and persistence after post-mortem delay. Front. Cell. Neurosci. 14, 239 (2020).
Zhang, Y. et al. An RNA-sequencing transcriptome and splicing database of glia, neurons, and vascular cells of the cerebral cortex. J. Neurosci. 34, 11929-11947 (2014).
Gargareta, V.-I. et al. Conservation and divergence of myelin proteome and oligodendrocyte transcriptome profiles between humans and mice. eLife 11, e77019 (2022).
Lam, M. et al. CNS myelination requires VAMP2/3-mediated membrane expansion in oligodendrocytes. Nat. Commun. 13, 5583 (2022).
Leto, D. & Saltiel, A. R. Regulation of glucose transport by insulin: traffic control of GLUT4. Nat. Rev. Mol. Cell Biol. 13, 383-396 (2012).
Martin, L. B., Shewan, A., Millar, C. A., Gould, G. W. & James, D. E. Vesicle-associated membrane protein 2 plays a specific role in the insulin-dependent trafficking of the facilitative glucose transporter GLUT4 in 3T3-L1 adipocytes. J. Biol. Chem. 273, 1444-1452 (1998).
Lodhi, I. J. et al. Gapex-5, a Rab31 guanine nucleotide exchange factor that regulates Glut4 trafficking in adipocytes. Cell Metab. 5, 59-72 (2007).
Dienel, G. A. Brain glucose metabolism: integration of energetics with function. Physiol. Rev. 99, 949-1045 (2019).
Barros, L. F. et al. Fluid brain glycolysis: limits, speed, location, moonlighting, and the fates of glycogen and lactate. Neurochem. Res. 45, 1328-1334 (2020).
Herrero-Mendez, A. et al. The bioenergetic and antioxidant status of neurons is controlled by continuous degradation of a key glycolytic enzyme by APC/C-Cdh1. Nat. Cell Biol. 11, 747-752 (2009).
Zala, D. et al. Vesicular glycolysis provides on-board energy for fast axonal transport. Cell 152, 479-491 (2013).
Baeza-Lehnert, F. et al. Non-Canonical Control of Neuronal Energy Status by the Pump. Cell Metab. 29, 668-680.e4 (2019).
Meyer, D. J., Díaz-García, C. M., Nathwani, N., Rahman, M. & Yellen, G. The pump dominates control of glycolysis in hippocampal dentate granule cells. eLife 11, e81645 (2022).
Frühbeis, C. et al. Oligodendrocytes support axonal transport and maintenance via exosome secretion. PLoS Biol. 18, e3000621 (2020).
Chamberlain, K. A. et al. Oligodendrocytes enhance axonal energy metabolism by deacetylation of mitochondrial proteins through transcellular delivery of SIRT2. Neuron 109, 3456-3472 (2021).
Frühbeis, C. et al. Neurotransmitter-triggered transfer of exosomes mediates oligodendrocyte-neuron communication. PLoS Biol. 11, e1001604 (2013).
Publisher’s note Springer Nature remains neutral with regard to jurisdictional claims in published maps and institutional affiliations.
تمت الموافقة على جميع التجارب الحيوانية من قبل السلطات البيطرية المحلية في زيورخ، بما يتماشى مع إرشادات قانون حماية الحيوانات السويسري، المكتب البيطري، كانتون زيورخ (قانون رفاهية الحيوان، 16 ديسمبر 2005، واللائحة الخاصة برفاهية الحيوان، 23 أبريل 2008). تم إنتاج فئران PLP-CreERT;RCL-GCaMP6s عن طريق تهجين فئران PLP-CreERT (RRID:IMSRJAX:005975).مع فئران ROSA26-floxed-STOP-GCaMP6s (Ai96؛ RRID:IMSRJAX:024106)تم استخدام فئران RCL-GCaMP6s (Ai96) غير المتجانسة للتعبير عن GCaMP6s في محاور الأعصاب البصرية بعد توصيل AAV-Cre عن طريق الحقن داخل الجسم الزجاجي. فئران Kir4.1 cKOتم الحصول عليها من تزاوجات الفئران الحاملة للجين المقطوعالأليل مع فئران MOGiCre. كير4.تم استخدام الفئران كضوابط من نفس القمامة. تم الحفاظ على سلالات الفئران المعدلة وراثيًا على خلفية C57BL/6. بالنسبة للتجارب على الأنواع البرية، استخدمنا فئران C57BL/6 من تشارلز ريفر. تم استخدام كل من الفئران الذكور والإناث في التجارب. تم الاحتفاظ بالفئران في دورة ضوء/ظلام مقلوبة مدتها 12 ساعة. و الرطوبة. كانت المواد الغذائية والماء متاحة بحرية.
علاج التاموكسيفين
تم علاج فئران PLP-CreERT;RCL-GCaMP6s، التي تتراوح أعمارها بين 6-8 أسابيع، بالتاموكسيفين (سيغما-ألدريتش، T5648). تم تحضير التاموكسيفين حديثًا في زيت الذرة (سيغما-ألدريتش، C8267) بتركيزلكل مجموعة تجريبية. تلقت الفئران حقنًا داخل الصفاق بجرعة 100 ملغ من التاموكسيفين لكل كيلوغرام من وزن الجسم يوميًا لمدة 3 أيام. بدأت التجارب بعد 4 أسابيع من الحقنة الأولى للتاموكسيفين.
حقن AAV
تم إجراء الحقن داخل الجسم الزجاجي وفقًا للبروتوكولات المنشورة سابقًاتضمن التخدير إعطاء الفنتانيل عن طريق البطن.ميدازولام ) و ميديتوميدين فيتم تحقيق اتساع الحدقة من خلال التطبيق الموضعي للسيكلوبنتولات ) وفينيل إفرين ( )، وPrevented Viscotears gel السائل (CIBA Vision) جفاف العين. تم الحفاظ على الفئران في على وسادة تدفئة. تحت مجهر SteREO Discovery V20 (زايس)، تم استخدام إبرة قياس 30 (حقنة أنسولين، أومنيكان 50، براون) لإنشاء شق في الصلبة، من خلاله تم توصيل حقنة هاملتون قياس 34.من تعليق AAV في الجسم الزجاجي عندبعد الحقن، تم إعطاء قطرات العين أوفلوكساسين (فلوكسال، باوش + لامب)، تلتها بوبرينورفين. ) العلاج بعد عكس التخدير باستخدام أتيباميزول ( ) وفلومازينيل ( تمت مراقبة الفئران في ضوء منخفض بسبب اتساع حدقة العين لفترة طويلة. شملت حقن AAV داخل البطينات في الجراء في اليوم العاشر من العمر تخدير الإيزوفلوران وإطار ستيريوتاكسي مدفأ.شملت المسكنات قبل الجراحة البوبرينورفين (المُعطاة تحت الجلد)، ليدوكائين ( ) وبوبيفاكائين ( تم استخدام حقنة هاملتون بعيار 32 لتقديممن AAV لكل نصف كرة إلى البطين، مع إحداثيات – 2.0 مم أمامي-خلفي، 0.8 مم وسطي-جانبي و -2.0 مم ظهري-بطني من البريغما، عندظل الإبرة في مكانها لمدة دقيقتين قبل إزالتها. بعد الجراحة، حصل الجراء على بيوبرينورفين ( ) وخياطة باستخدام خيوط فيكرل القابلة للامتصاص والمضفرة، مع مراقبة دقيقة خلال فترة التعافي.
ناقلات AAV
تم إنتاج وتPurified وقياس المتجهات الفيروسية أحادية السلسلة (ss) أو ذات التكميل الذاتي (sc) المستخدمة في هذه الدراسة بواسطة منشأة المتجهات الفيروسية في مركز الأعصاب في زيورخ، كما تم وصفه سابقًا.تم إجراء حقن AAV داخل الجسم الزجاجي باستخدام ناقلات AAV غير المخففة المختلطة بصبغة الفلورسئين.في PBS). تم إضافة صبغة الفلورسئين الخضراء لمراقبة الحقن الناجح في الجسم الزجاجي. تم استخدام AAVs التالية وعناوينها الفيزيائية (بالجزيئات الناقلة لكل مليلتر (vg لكل مل)): لتحفيز تعبير GCaMP6s في محاور الأعصاب البصرية، استخدمنا فئران RCL-GCaMP6s (Ai96) التي تم حقنها بـ scAAV-DJ/2-hCMV-chl-Cre-SV4Op(A) (ملغرام لكل ملليلتر). لدراسة لديناميكا ATP المحورية، استخدمنا مستشعر FRET ATeam1.03 (المرجع 52) المعبأ في ssAAV-2/2-hSyn1-ATeam1.03-WPRE-hGHp(A)تمت دراسة ديناميات اللاكتات باستخدام مستشعر FRET لاكونيكمعبأ في ssAAV-2/2-hCMV-chl-Laconic-WPRE-SV40p(A)تمت دراسة ديناميات الجلوكوز باستخدام النسخة المحسّنة من كودون مستشعر FRET FLIIPمعبأ في ssAAV-2/2-hSyn1-FLIIP-WPRE-hGHp(A)” vg لكل مل” أو في ssAAV لكل ملالأخيرة تحتوي علىتم استخدام محفز MBP سابقًا لتحفيز تعبير جين التقرير في.
الكهربائية العصبية للعصب البصري وتصوير الفوتونين
تم إجراء تحضيرات حادة لعصب البصر من أجل علم الكهرباء الحيوي المتزامن وتصوير الفوتونين كما تم وصفه سابقًا.بعد التخدير باستخدام الإيزوفلوران وقطع الرأس، تم استئصال الأعصاب البصرية ووضعها في غرفة ضخ معدلة (Haas Top، Harvard Apparatus)، وتم ضخها بمحلول ACSF عندباستخدام نظام التحكم في درجة الحرارة TC-10 (NPI Electronic)، ومؤكسد باستمرار بنسبة 95% و تم إدخال نهايات الأعصاب في أقطاب شفط مصنوعة خصيصًا مملوءة بسائل ACSF. تم دمج هذا الإعداد مع ميكروسكوب ثنائي الفوتون مصمم خصيصًا.تتميز بليزر كاميليون ألترا II Ti:sapphire (كوهيرنت) وهدف غمر الماء (XLPLN WMP2، أوليمبوس)، تعمل بواسطة برنامج ScanImage (الإصدار 3.8.1، حرم جانليا للبحوثتم السماح للعصب بالتوازن في غرفة التروية تحت العدسة لمدة لا تقل عن 30 دقيقة، لضمان الاستقرار. تم استخدام مشغل منطق الترانزستور-الترانزستور مدفوعًا بمولد المحفز (STG4002-1.6mA، أنظمة متعددة القنوات) لمزامنة جمع بيانات كل من electrophysiology وبيانات التصوير.
الحلول
تمت تغذية الأعصاب البصرية بمحلول ACSF المحتوي على و 10 مللي مول من الجلوكوز ( pH 7.4 )، مضغوط بـ و للتدخلات الدوائية، تم إضافة الأدوية بالتركيزات المذكورة في النص إلى محلول ACSF قبل التجارب بفترة قصيرة. تم تحضير محاليل مخزنة (1,000×) من الأدوية التالية: TTX (ab120054، Abcam)، D-AP5 (0106، Tocris)، PPADS (ab120009، Abcam)، سورامين (1472، Tocris)، أواباين (O3125، Sigma-Aldrich)، RuR (1439، Tocris)، (342920، سيغما-ألدريتش)، (202908، سيغما-ألدريتش)، (339350، سيغما-ألدريتش)، IA (I2512، سيغما-ألدريتش)، (S2002، سيغما-ألدريتش)، NBQX (ab120045، أبكام)، 7-CKA (ab120024، أبكام)، نيفيديبين (1075، توكريس)، بينيديبين (3934، توكريس)، بوميتانيد (3108، توكريس)، SEA0400 (6164، توكريس)، KB-R7943 (ab120284، أبكام) و CytoB (5474، توكريس). عند الاقتضاء، تم حماية الأدوية من الضوء أثناء التحضير والتجارب. لتحليل الاستجابة الناتجة عن التحفيز تم علاج الأعصاب البصرية بالأدوية لـقبل التجربة. من أجل الصفر-التجارب، كانت تحتوي ACSF علىEGTA وللحفاظ على تركيزات ثابتة من الكاتيونات الثنائية القيمة.تم تعديل NaCl في ACSF للحفاظ على تركيزات الكاتيونات الأحادية. بالنسبة لتجارب GD، تم استبدال الجلوكوز بالسكروز. تم إجراء تعديلات مماثلة في الصوديوم والأسمولارية عند استخدام الصوديوم.تم إضافة -لاكتات (سيغما-ألدريتش) إلى محلول ACSF.
تسجيلات وتحليل CAP
تم تحفيز الأعصاب البصرية باستخدام مولد التحفيز STG4002-1.6mA (أنظمة متعددة القنوات) الذي تم التحكم فيه بواسطة برنامج MC_Stimulus. استخدمنا “نبضات الموجة المربعة لاستحضار CAPs، تم تسجيلها بواسطة نظام USB-ME16-FAI (أنظمة متعددة القنوات) معمضخم الصوت ذو الكسب. تم جمع البيانات عند 50 كيلو هرتز بواسطة برنامج MC_Rack وتم تحليلها باستخدام سكربت مخصص بلغة MATLAB متاح على GitHub (https://github. com/EIN-lab/CAP-analysis). تستجيب CAP، التي تتميز بثلاثة قمم تشير إلى سرعات توصيل محورية مختلفةتقليل سعة الذروة وزيادة الكمون خلال التحفيز عالي الترددركز التحليل على الذروة الثانية لـ CAP، مع قياس الكمون من بداية التحفيز إلى الذروة. تم استخدام منطقة pCAP لدمج التغيرات في السعة والزمن في الذروتين الأوليين، والتي تعكس المحاور الكبيرة والمتوسطة الحجم. تضمنت بروتوكولات التحفيز بدايةتحفيز لمدة دقيقة واحدة للحصول على القيم الأساسية، تليها 30 ثانية أو دقيقة واحدة عند 10 أو 25 أو 50 هرتز، ثمالاسترداد عند 0.4 هرتز. تم تسجيل CAPs عالية التردد كل ثانية. استخدمت تجارب GD و MI بروتوكول التحفيز. تم تقييم قابلية العصب من خلال تغيير شدة التحفيز من 0.1 إلى 1 مللي أمبير، مع قياس AUC لـ CAPs المتدرجة، مع التعبير عن مساحة CAP كنسبة مئوية من الحد الأقصى لمساحة CAP عند 1 مللي أمبير.
تصوير الكالسيوم والتحليل
تضمن تصوير GCaMP6s تحفيز المستشعر عند 940 نانومتر بقوى ليزر تتراوح بين 5 و 10 مللي واط. تم التقاط انبعاثات الفلورسنت باستخدام أنبوب مضاعف ضوئي GaAsP (هاماماتسو فوتونيكس) وفلتر تمرير نطاق 520/70 نانومتر (سيمروك). تم التقاط صور نظرة عامة عند دقة مع زمن بقاء بكسل. بالنسبة لـ التصوير في OLs أو المحاور، تم استخدام مجال الرؤية المحدد، أسفل سطح العصب، مع تكبير رقمي 7-8 ، والتقاط الصور بمعدل 2.96 هرتز و دقة مع زمن بقاء بكسل. تم إجراء تحليل البيانات باستخدام MATLAB (MathWorks، R2015b) مع مجموعة أدوات CHIPS (https:// github.com/EIN-lab/CHIPS)، كما تم وصفه سابقًا . تم رسم مناطق الاهتمام (ROIs) حول أجسام OL يدويًا في ImageJ، مع إدخال أقنعة ROI في خط أنابيب CHIPS. بالنسبة للمحاور، تم تحليل الإطارات الكاملة. خضعت تسلسلات الصور لتصحيح الحركة، وتقليل الضوضاء باستخدام فلتر غاوسي مكاني ثنائي الأبعاد () وفلتر متوسط متحرك زمني (عرض )، وطرح الضوضاء الخلفية (المعرفة كقيمة بكسل في النسبة المئوية الأولى السفلية). تم حساب متجهات الإشارة () من كل ROI أو إطار باستخدام عشرة إطارات قبل بدء التحفيز كخط أساسي. تم قياس الاستجابات من خلال AUC خلال فترة تحفيز مدتها 30 ثانية. تم تقييم التأثيرات الدوائية من خلال تحليل مزدوج يقارن الاستجابات قبل وبعد تطبيق الدواء، مع متوسط على جلستين إلى ثلاث جلسات لتقليل التباين. تم تفصيل أعداد الفئران والخلايا في أساطير الشكل.
تصوير وتحليل المستقلبات
تم تحفيز مستشعرات المستقلبات المعتمدة على FRET (Laconic، ATeam1.03، FLIIP) عند 870 نانومتر باستخدام قوى ليزر من . تم جمع إشارات الفلورسنت للمانح والمستقبل في نفس الوقت باستخدام أنبوبين مضاعفين ضوئيين، ومقسم شعاعي ثنائي اللون بحدود 560 نانومتر (BrightLine، Semrock)، ومرشحات تمرير نطاق من (قناة صفراء) و (قناة زرقاء). تم التقاط الصور عند دقة مع زمن بقاء بكسل، كل 2 أو 10 ثوانٍ. استخدم تحليل FRET نص MATLAB مخصص، متاح على https://gitlab.com/einlabzurich/fretanalysis. تم تنعيم تسلسلات صور الصورة باستخدام متوسط متحرك من خمس صور، مع تحديد عدد الصور بعد اختبار نوافذ زمنية مختلفة للحفاظ على الديناميات الزمنية. تم تحقيق إزالة الخلفية من خلال تحديد العتبة، مع استخراج متوسط كثافات الإطارات الكاملة لكل قناة. تم حساب نسب المانح إلى المستقبل (Laconic) أو المستقبل إلى المانح (ATeam1.03 و FLIIP) وتم تطبيعها إلى الخطوط الأساسية أو نقاط الزمن شبه الصفرية. لتصور هياكل OL أو المحاور مع الحفاظ على بيانات نسبة FRET الكمية، تم تطبيق مقياس لوني على صور النسبة التي تم الحصول عليها من خلال قسمة بكسل على بكسل لقناتين على متوسط 20 إطارًا. تم تحويل صور RGB إلى مساحة لون YCbCr، حيث تمثل Cb و Cr اللون و Y تمثل السطوع. تم استبدال الإحداثي بجذر مجموع صور المانح والمستقبل، وتم إعادة تحويل الصورة إلى RGB.
الكيمياء المناعية
تم تخدير الفئران باستخدام البنتوباربيتال وتم ضخها بمحلول 2% من البارافورمالدهيد (PFA) في PBS. تم تثبيت الأعصاب البصرية لمدة ساعة واحدة في 4% PFA، وتم تضمينها في وسط مقطع مجمد (Thermo Fisher Scientific) وقطعها إلى مقاطع طولية
باستخدام مجمد ليكا CM3050 S. تم وضع المقاطع على شرائح SuperFrost Plus (Thermo Fisher Scientific). بالنسبة للكيمياء المناعية، تم معالجة الشرائح أولاً بـ 0.3% Triton X-100 في محلول تريس 50 مليمول (pH 7.4) مع مصل حيوانات المنغو العادي لمدة ساعة واحدة في درجة حرارة الغرفة. تم حضانة الأجسام المضادة الأولية (الجدول 1) طوال الليل عند في نفس المحلول. تم تطبيق الأجسام المضادة الثانوية، المختلطة مع 0.05% تريس-ترايتون و4% مصل، لمدة ساعة واحدة في درجة حرارة الغرفة. تمت إضافة DAPI لتلوين النواة. تم الحصول على صور مجهرية متداخلة و z stacks () باستخدام مجهر ليزر مسح ضوئي متداخل ZeissLSM 700 أو Zeiss LSM 800 مزودًا بعدسة (Plan-Apochromat، فتحة عددية 1.4، زيت DIC (UV) VIS-IR). تم إجراء تحليل الصورة باستخدام ImageJ (إصدار Fiji 1.52p). بالنسبة لتحليل GFAP و IBA1، تم تحويل أقصى كثافة إلى ثنائية وتم تحديد مساحة الجسيمات الفلورية. بالنسبة للتقديرات، تم تحليل صورتين لكل مقطع وأربعة مقاطع لكل حيوان.
EM والتحليل
تم تخدير الفئران باستخدام الإيزوفلوران قبل قطع الرأس واستخراج العصب البصري. تم نقل الأعصاب البصرية على الفور إلى محلول مثبت (4% PFA، 2.5% جلوتارالدهيد في محلول فوسفات مع ) وتم تثبيتها طوال الليل عند . تم إعداد الأنسجة و EM كما تم وصفه سابقًا . باختصار، بعد التثبيت الإضافي باستخدام (خدمات العلوم) في محلول فوسفات 0.1 م (pH 7.3) وتجفيف الأسيتون، تم تضمين قطع الأنسجة في EPON (Serva). تم قطع مقاطع رقيقة جدًا باستخدام مجهر ليزر ليكا UC7 (ليكا) ثم تم صبغها باستخدام UranyLess (خدمات العلوم). تم التقاط صور EM باستخدام مجهر إلكتروني Zeiss EM912 (Zeiss) مزود بكاميرا CCD مرتبطة بمحور 2k (TRS). تم إجراء تحليل صور EM باستخدام ImageJ (Fiji، الإصدار 1.52p). تم تحليل أقطار المحاور و النسب (نسبة قطر المحور إلى القطر بما في ذلك غلاف المايلين) باستخدام خمس صور EM عامة عشوائية (عند تكبير)، مع تقييم 250 محورًا لكل حيوان. كانت الحسابات تستند إلى مناطق دائرية تعادل المناطق المقاسة. لتقييم علم الأمراض المحورية، تم تحليل ثمانية إلى عشرة صور EM لكل حيوان. كان الباحثون غير مدركين للجينات.
البروتيوميات والتحليل
تم استخراج الأعصاب البصرية من فئران Kir4.1 cKO البالغة من العمر 2.5 شهرًا ومن ضوابط من نفس القمامة بعد تخدير عميق بالإيزوفلوران. بالنسبة لتجانس الأنسجة، استخدمنا محلول تحلل PreOmics مع كرات أكسيد الزركونيوم (ZROB05، Next Advance) في خلاط Bullet (BBX24، Next Advance)، مع دورتين لمدة 15 ثانية تم تعيينهما على سرعة 10. تم إجراء تحليل البروتيوميات الكمي المعتمد على TMT في مركز الجينوم الوظيفي في زيورخ. تم قياس تركيزات البروتين باستخدام مطياف UV-Vis Lunatic (Unchained Labs). شمل المعالجة مجموعة iST (PreOmics) وتضمنت معالجة بمحلول ‘Lyse’، والغليان، والهضم والطرد المركزي. تم غسل الببتيدات الملتقطة بواسطة فلتر iST، وإخراجها، وتجفيفها، ووضع علامة عليها باستخدام كاشف TMT10plex (Thermo Fisher Scientific، 90110) في الأسيتونيتريل (Sigma-Aldrich) و50 مليمول TEAB (pH 8.5)، تلاها التوقف. شكلت كميات قنوات TMT المتساوية العينة المجمعة، وتم فصلها مسبقًا باستخدام كروماتوغرافيا عكسية عالية الرقم الهيدروجيني على عمود XBridge Peptide BEH C18 (Waters). بالنسبة لـ MS، تم تحليل العينات على جهاز Orbitrap Fusion Lumos (Thermo Fisher Scientific)، مع إعدادات اكتساب تعتمد على البيانات تم تحسينها لطيف MS وتسجيلات MS/MS في Orbitrap. تم التعامل مع بيانات البروتيوميات باستخدام نظام إدارة معلومات المختبر المحلي . قام Proteome Discoverer (الإصدار 2.4) بمعالجة بيانات MS الخام، مع تحديد البروتين من خلال محرك Sequest HT ضد البروتيوم المرجعي Mus musculus (UniProt، 20190709). تم تعيين الكرباميدوميثيليشن و TMT (+229.163 Da، نهاية الببتيد N -terminus و K) كتحويرات ثابتة، بينما تم تعيين أكسدة الميثيونين وأسيتيل بروتين نهاية N كتحويرات متغيرة. تم تعيين خصوصية الإنزيم إلى التربسين، مما يسمح بطول ببتيد أدنى من ستة أحماض أمينية وحد أقصى من اثنين
الانفصالات المفقودة. تم تعيين الحد الأقصى لـ FDR للببتيدات إلى 0.01. تم حساب تغييرات طي البروتين بناءً على قيم الكثافة. تم استخدام مجموعة من الوظائف المطبقة في حزمة R prolfqua لتصفية البروتينات التي تحتوي على ببتيدين أو أكثر. استخدمت تطبيع البيانات تحويلًا قويًا معدلًا لـ -score، مع الحفاظ على تباين البيانات الأصلية. بالنسبة للتحليل التفاضلي، قمنا بتناسب النموذج الخطي لكل بروتين، وحساب التباينات، وتعديل التباين، إحصائيات و قيم . تم تحديد FDRs من القيم باستخدام تعديل بنجاميني هوشبرغ. تم إجراء GSEA باستخدام WebGestalt.org.
تنقية المايلين والتحليل المناعي
تم تنقية جزء غشاء خفيف الوزن غني بالميالين من أدمغة فئران Kir4.1cKO البالغة من العمر 2.5 شهرًا والشهود، باستخدام الطرد المركزي بكثافة السكروز والصدمات الأسموزية كما تم وصفه سابقًا.تم استخراج نسيج الدماغ بعد قطع الرأس بعد التخدير العميق باستخدام الإيزوفلوران. تم تحديد تركيزات البروتين في مستخلصات الدماغ وكسور المايلين باستخدام مجموعة اختبار بروتين DC (بايو راد) وفقًا لتعليمات الشركة المصنعة وتم قياسها باستخدام مقياس الطيف الضوئي عالي الأداء Eon (بايو تك). تم إجراء التحليل المناعي كما هو موضح سابقًا.تم تخفيف عينات نسبة المايلين فيمحلول عينة SDS (جلسرين)ترس- HCl (pH 6.8) 240 مللي مولار، SDS (وزن/حجم)، بروموفينول أزرق (w/v))، مع إضافة 5% ديثيوثريتال كعامل مختزل. قبل الاستخدام، تم تسخين العينات عندلمدة 10 دقائق. تم استخدام نظام Mini-PROTEAN Handcast (Bio-Rad) لفصل البروتين بواسطة SDSPAGE مع هلام الأكريلاميد المصنوع ذاتيًا. ). تم تحميل العينات في لكل بئر (اعتمادًا على البروتين المعني) بجوار من سلم البروتين المثبت مسبقًا (PageRuler، ثيرمو فيشر ساينتيفيك). تم فصل البروتينات بواسطة تيار ثابت (200 فولت) لمدةتم إجراء التحليل المناعي باستخدام جهاز نقل شبه جاف من نوفكس (إنفيتروجين)، وتم نقل البروتينات إلى غشاء مفعل (الإيثانول، 1 دقيقة؛ تليها خطوتان غسلتان بالماء) غشاء بولي فينيليدين فلوريد (روش دياغنوستكس، رقم الكاتالوج 03010040001) عند 20 فولت لمدة 40 دقيقة. بعد التلطيخ، تم حجب الأغشية فيمحلول TBS يحتوي على 5% حليب جاف خالي من الدسم (فريما) وتمت معالجة Tween-20 لمدة ساعة واحدة في درجة حرارة الغرفة. تم تخفيف الأجسام المضادة الأولية في 5 مل من محلول الحجب وتمت حضانتها طوال الليل في مع دوران أفقي. تم غسل الأغشية ثلاث مرات باستخدام TBS-T لمدة 5-10 دقائق لكل منها وتم تحضينها لمدة ساعة مع أجسام مضادة ثانوية HRP مخففة في محلول حجب. تم غسل الأغشية ثلاث مرات باستخدام TBS-T من أجل تم إجراء الكشف باستخدام الكشف الكيميائي المعزز (ECL) وفقًا لتعليمات الشركة المصنعة (Western Lightning Plus-ECL أو SUperSignal West Femto Maximum Sensitivity Substrate، Thermo Fisher Scientific). تم مسح المناعية باستخدام جهاز تصوير ECL Chemostar (Intas Science Imaging). تم إجراء التوحيد باستخدام صبغة البروتين الكلي Fast Green. لمعلومات الأجسام المضادة، انظر الجدول 1.
تفاعل البوليميراز المتسلسل الكمي في الوقت الحقيقي
تم تخدير الفئران بعمق باستخدام الإيزوفلوران ثم تم قطع رؤوسها. بعد ذلك، تم تشريح الأعصاب البصرية بسرعة. تم تجانس الأنسجة فيمحلول تحليل RNeasy (RLT، كياجين) معكرات أكسيد الزركونيوم (ZROB05، نكست أدفانس) في جهاز هوموجينيزر الأنسجة Bullet Blender (BBX24، نكست أدفانس؛ دورتان من 15 ثانية على السرعة 10). لاستخراج RNA وتخليق cDNA، تم استخدام مجموعة RNeasy Micro (Qiagen) ومجموعة تخليق cDNA SensiFAST (Bioline) وفقًا لتعليمات الشركة المصنعة. تم إجراء qPCR في الوقت الحقيقي باستخدام EvaGreen (HOT FIREPol، Solis BioDyne) ونظام PCR سريع في الوقت الحقيقي 7900HT (Applied Biosystems، البرنامج SDS 2.4). لتحليل تعبير mRNA، تم استخدام البرايمرات التالية: لـ Kir4.1 (Kcnj1O) (5′-TCT GTT CAT CTG TCC CGC TGC-3’،-GAC GTC ATC TTG GCT CGA AGG3′)، لجين MCT1 (Slc16a1) (-ATT GTG GAA TGC TGC CCT GT-3’، 5′-TAC CCG CGA TGA TGA GGA TC-3′)، لجين GLUT1 (Slc2a1) (-ATC TTC GAG AAG GCA GGT GTG-3′-CGC TCT ACA ACA AAC AGC GAC-3′) ولـ GLUT3 (Slc2a3) (-جي تي جي أي سي تي جي سي تي جي غاغ سي تي سي تي-3′-CCG CGT CCT TGA AGA TTC CT-3′). كانت جين Actb بمثابة التحكم الجيني الداخلي (-CTT CCT CCC TGG AGA AGA GC-3′-ATG CCA CAG GAT TCC ATA CC-3′). تم حساب متوسط ثلاث تكرارات فنية لكل تفاعل لكل حيوان.
التحليلات الإحصائية
تم إجراء مقارنات بين المجموعات باستخدام اختبار مزدوج الجوانب.اختبار أو طالباختبار، كما هو موضح في أساطير الأشكال. بالنسبة للتحليلات التي تتضمن مقارنات متعددة، تم إخضاع البيانات إما لتحليل التباين الأحادي أو الثنائي. تم إجراء جميع التحليلات الإحصائية باستخدام GraphPad Prism 9 أو R (الإصدار 3.2.2، فريق R الأساسي، 2015). كان يجب أن تمر مجموعات البيانات باختبار شابيرو-ويلك للتماثل قبل أن تخضع لاختبار الطالب.تم اختبار ANOVA أو الخضوع لاختبارات غير معلمية لتحديد الدلالة الإحصائية. تم افتراض تساوي التباينات ولكن لم يتم اختبارها. تم تعريف مستويات الدلالة على النحو التالي:، تُعرض البيانات كقيم فردية مع المتوسط s.e.m. أو كما هو موضح في مخططات الصندوق والشعيرات. في مخططات الصندوق والشعيرات، يمثل رمز ‘+’ المتوسط؛ والخط المركزي يشير إلى الوسيط؛ ويمتد الصندوق من النسبة المئوية 25 إلى 75؛ وتمتد الشعيرات من النسبة المئوية 5 إلى 95.تم ذكر القيم وأحجام العينات في أساطير الأشكال. لم يتم تحديد أحجام العينات مسبقًا حيث كانت مقيدة بتوافر مجموعات الفئران المعدلة وراثيًا المتطابقة في العمر. حيثما كان ذلك مناسبًا، كان الباحثون غير مدركين لنوع الجين.
ملخص التقرير
معلومات إضافية حول تصميم البحث متاحة في ملخص تقارير مجموعة نيتشر المرتبط بهذه المقالة.
توفر البيانات
تم إيداع بيانات بروتيوميات قياس الطيف الكتلي المبلغ عنها في هذه الدراسة (انظر أيضًا البيانات التكميلية 1، التي تحتوي على بيانات بروتيوميات خامة ومُعَيارَة) في قاعدة بيانات ProteomeXchange PRIDE مع معرف مجموعة البيانات PXD046207. تتوفر بيانات وموارد إضافية عند الطلب من المؤلف المراسل.
Hövelmeyer, N. et al. Apoptosis of oligodendrocytes via Fas and TNF-R1 is a key event in the induction of experimental autoimmune encephalomyelitis. J. Immunol. 175, 5875-5884 (2005).
Fleischmann, T., Jirkof, P., Henke, J., Arras, M. & Cesarovic, N. Injection anaesthesia with fentanyl-midazolam-medetomidine in adult female mice: importance of antagonization and perioperative care. Lab. Anim. 50, 264-274 (2016).
Paterna, J.-C., Feldon, J. & Büeler, H. Transduction profiles of recombinant adeno-associated virus vectors derived from serotypes 2 and 5 in the nigrostriatal system of rats. J. Virol. 78, 6808-6817 (2004).
Snaidero, N. et al. Myelin replacement triggered by single-cell demyelination in mouse cortex. Nat. Commun. 11, 4901 (2020).
Mezydlo, A. et al. Remyelination by surviving oligodendrocytes is inefficient in the inflamed mammalian cortex. Neuron 111, 1748-1759 (2023).
Mayrhofer, J. M. et al. Design and performance of an ultra-flexible two-photon microscope for in vivo research. Biomed. Opt. Express 6, 4228-4237 (2015).
Pologruto, T. A., Sabatini, B. L. & Svoboda, K. Scanlmage: flexible software for operating laser scanning microscopes. Biomed. Eng. Online 2, 13 (2003).
Stys, P. K., Ransom, B. R. & Waxman, S. G. Compound action potential of nerve recorded by suction electrode: a theoretical and experimental analysis. Brain Res. 546, 18-32 (1991).
Barrett, M. J. P., Ferrari, K. D., Stobart, J. L., Holub, M. & Weber, B. CHIPS: an extensible toolbox for cellular and hemodynamic two-photon image analysis. Neuroinformatics 16, 145-147 (2018).
Glück, C. et al. Distinct signatures of calcium activity in brain mural cells. eLife 10, e70591 (2021).
Möbius, W. et al. Electron microscopy of the mouse central nervous system. Methods Cell Biol. 96, 475-512 (2010).
Türker, C. et al. B-Fabric: the Swiss army knife for life sciences. In Proceedings of the 13th International Conference on Extending Database Technology (eds Manolescu, I. et al.) 717-720 (ACM, 2010).
Wolski, W. E., Panse, C., Grossmann, J., D’Errico, M. & Nanni, P. prolfqua-an R package for proteomics label-free quantification. F1000Research https://doi.org/10.7490/f1000research.1118455.1 (2021).
Ritchie, M. E. et al. limma powers differential expression analyses for RNA-sequencing and microarray studies. Nucleic Acids Res. 43, e47 (2015).
Erwig, M. S. et al. Myelin: methods for purification and proteome analysis. Methods Mol. Biol. 1936, 37-63 (2019).
Stumpf, S. K. et al. Ketogenic diet ameliorates axonal defects and promotes myelination in Pelizaeus-Merzbacher disease. Acta Neuropathol. 138, 147-161 (2019).
Berghoff, S. A. et al. Blood-brain barrier hyperpermeability precedes demyelination in the cuprizone model. Acta Neuropathol. Commun. 5, 94 (2017).
Jung, M., Sommer, I., Schachner, M. & Nave, K. A. Monoclonal antibody O10 defines a conformationally sensitive cell-surface epitope of proteolipid protein (PLP): evidence that PLP misfolding underlies dysmyelination in mutant mice. J. Neurosci. 16, 7920-7929 (1996).
شكر وتقدير
نشكر جميع أعضاء المختبر على المناقشات المتكررة والمساهمات النقدية، ج. – س. باترنا ومرافق الناقلات الفيروسية في مركز الأعصاب في زيورخ على إنتاج AAV، أ. وايسمان على فئران MOGiCre، أ. ميزيدلو وم. كيرشينشتاينر على توفير البلازميدات التي تحتوي على مروج MBP، ومركز الجينوميات الوظيفية في زيورخ لدعم البروتيوميات. تم دعم D.E.B. و K.-A.N. من قبل مؤسسة أدلسون للبحوث الطبية. تم دعم L.F.B. من قبل فوندسيكت 1230145. تم دعم B.W. من قبل المؤسسة الوطنية السويسرية للعلوم (31003A_156965). تم دعم A.S.S. من خلال جائزة زمالة مهنية من سينابسيس، مركز علوم الأعصاب في زيورخ، مؤسسة كلويتا والمؤسسة الوطنية السويسرية للعلوم (Eccellenza 187000).
مساهمات المؤلفين
صمم Z.J.L. و A.S.S. الدراسة، خططا للتجارب، حللا البيانات وكتبا المخطوطة. ساهم Z.J.L. و Z.F. و L.R. و H.S.Z. و H.B.W. و W.M. و L.F.B. و B.W. و A.S.S. في المنهجية. قام Z.J.L. و Z.F. و R.B.J. و T.R. و A.S.S. بإجراء التجارب. قدم D.E.B و L.F.B. و K.-A.N. و B.W. و A.S.S. الموارد. ساهم جميع المؤلفين في تحرير المخطوطة. تم الإشراف على المشروع من قبل A.S.S.
الشكل البياني الممتد 1 | التقييم الوظيفي لمستشعر الجلوكوز في خلايا OLs. أ، تعبير مستشعر FRET للجلوكوز FLIIP بواسطة AAV في خلايا OLs في العصب البصري للفئران البرية. تم تصوير صور النسبة الملونة التمثيلية من العصب البصري في محلول ACSF يحتوي على 10 مللي مول من الجلوكوز (Glc)، بعد إزالة الجلوكوز خارج الخلية، وبعد تثبيط التحلل السكري بواسطة 1 مللي مول من اليودوأسيتات (IA) في محلول ACSF يحتوي على
10 مللي مول من الجلوكوز. الألوان الدافئة والباردة تشير إلى نسب عالية ومنخفضة أو مستويات الجلوكوز، على التوالي. شريط القياس. ب، قياس النسب المعيارية المستخلصة من الظروف المعروضة في أ. النسب ( تم تطبيع الفئران إلى الحد الأدنى المتوسط الذي تم الحصول عليه عندالبيانات المعروضة في المتوسطSEM.
الشكل 2 من البيانات الموسعة | مساهمة طفيفة للإشارات الغلوتاماتية والبيورينية في الاستجابة المحفزةاستجابة في خلايا OL. أ، 50 هرتز – استثارة جسم خلية OLتغيرات في حالة التحكم مع إضافة NBQX” ). قياسالزيادة (AUC خلال فترة التحفيز، مخططات الصندوق) لم تكشف عن أي فرق في الاستجابة المحفزةزيادةخلايا من 3 فئران،اختبار t المزدوج الجانبين.التغيرات مع NBQX ( ), DAP-5 ( )، و 7-CKA ( ) كشفت عن انخفاض في الاستجابة المحفزة زيادة بمقدار ( خلايا من 3 فئران،مزدوج الجوانب المقترن
اختبار t). ج، OLCaاستجابة مع PPADS ( ) كشفت عن انخفاض في الاستجابة المحفزة زيادة بمقدارخلايا من 3 فئران،اختبار t المزدوج الجانبين المقترن). د، OL Caاستجابة مع سورامين ) كشفت عن انخفاض في الاستجابة المحفزة زيادة بمقدار ( خلايا من فأرين،اختبار t المزدوج الجانبين). تمثل المخططات المتوسطSEM. تُظهر الرسوم البيانية الصندوقية الوسيط (الخط) ، والرباعيات (حدود الصندوق) ، والمتوسط (+) ، والنسب المئوية من 5-95 (الشعيرات).
الشكل 4 من البيانات الموسعة | بوابة الجهدالقنوات ليست محركات رئيسية للاستجابة الناتجة عن التحفيز OLاستجابة. أ، أولاستجابة في حالة التحكم ومعكشف عن زيادة طفيفة في استجابة 50 هرتزارتفاعخلايا من 4 فئران،اختبار t المزدوج الجانبين المزدوج.استجابة معكشف عن انخفاض طفيف في استجابة 50 هرتززيادة بمقدار ( خلايا من 4 فئران،اختبار t المزدوج الجانبين المزدوج.استجابة مع نيفيديبينكشف عن انخفاض طفيف في استجابة 50 هرتزارتفاع
بواسطةخلايا من 3 فئران،اختبار t المزدوج الجوانب المزدوج. ، OL استجابة مع بنيديبين ) لم تكشف عن أي تغيير واضح في استجابة 50 هرتز –زيادةخلايا من 3 فئران،اختبار t المزدوج الجانبين المقترن). هـ، أول كالاستجابة مع RuR ( ) لم تكشف عن تغييرات ملحوظة في الاستجابة المحفزة بتردد 50 هرتز زيادةخلايا من 4 فئران،اختبار t المزدوج الجانبين). تمثل الخطوط المتوسطSEM. تُظهر الرسوم البيانية الصندوقية الوسيط (الخط)، والرباعيات (حدود الصندوق)، والمتوسط (+)، والنسب المئوية من 5 إلى 95 (الشعيرات).
الشكل البياني الممتد 5 | تفعيل NCX بطريقة عكسية في OLاستجابة وخارج الخلية-زيادة اللاكتات الناتجة في المحاور. أ، مخطط لاختبار نشاط NCX في الوضع العكسي في خلايا OL: حجب مضخة الصوديوم باستخدام الأوابين يرفع من مستوى الداخل الخلويالتركيز، الذي يجب أن ينشط NCX لتبادلخارج لـفي. المستحث بواسطة الأوبيبينمن المتوقع أن يتم تقليله عن طريق حجب NCX باستخدام KB-R7943. ب، في الواقع،أدى تطبيق الأوبيب إلى زيادةالمستويات في OLs، انخفضت بشكل ملحوظ معم ك ب-7943 (خلايا من فأرين، p < 0.0001، اختبار t المزدوج المقترن). ج، 50 هرتز – استجابة OLاستجابة مع مثبط NCX SEA0400 ( ) كشفت عن انخفاض كبير في زيادة بمقدار ( خلايا من 4 فئران،اختبار t المزدوج الجانبين المقترن). د، OLاستجابة مع مثبط NKCC1 بوميتانيد ( ) لم تكشف عن أي فرق في الاستجابة المحفزة زيادةخلايا من 4 فئران،اختبار t المزدوج الجانبين المقترن). ب-د،تت代表 الوسائلSEM. تُظهر الرسوم البيانية الصندوقية الوسيط البياني كخط، والربع العلوي والسفلي كحدود للصندوق، والمتوسط كعلامة + والنسب المئوية من 5-95 كخيوط. e، مستويات اللاكتات المحورية بعد 30 مليمول/لتر خارج الخلية لفترة مؤقتة.زيادة عبر تطبيق حمام لمدة 30 ثانية. تم إجراء التجارب فيTTX لتثبيط النشاط المحوري. يتم تقديم مستويات اللاكتات كنسب مئوية من التغيرات (SEM)، ويتم مقارنة زيادة اللاكتات (دلتا AUC) مع الخط الأساسي (BL) قبلالتطبيق. الـزيادة اللاكتات المحورية الناتجة عن –الفئران) تم إلغاؤها في وجودفئراناختبار t لطالب ذو جانبين.
الشكل 6 من البيانات الموسعة | انظر الصفحة التالية للتعليق.
الشكل 6 من البيانات الموسعة | كير4.1 في الخلايا الدبقية الزيتونية حاسم للمواد البيضاءإزالة. أ، متوسط استجابة CAP لعصب البصر وكير4.1 فئران.زمن ذروة CAP مشابه بين الأنماط الجينية، للذروةللذروةللقمة 3، تحليل التباين الأحادي (ANOVA) مع اختبار المقارنات المتعددة هولم-شيداك). ج، علاقات مشابهة بين المحفز والاستجابة في كلا المجموعتين (تحليل ANOVA ثنائي الاتجاه). تم تطبيع مساحة CAP من كل شدة من المحفزات إلى أقصى تحفيز عند 1 مللي أمبير. د-و، تحليل مجهر إلكتروني (EM) للأعصاب البصرية من عمر 3 أشهر و الفئران: د، صور EM تمثيلية. هـ، سمك غمد المايلين (نسبة g) قابل للمقارنة بين الأنماط الجينية (اختبار t لطلبة ذو الجانبين). ف، توزيع حجم المحاور الممغنطة المشابهثنائي الاتجاه
تحليل التباين (ANOVA). و صور مجهرية متداخلة لوسم العصب البصري: ج، GFAP؛IBA1، في الفئران الضابطة و cKO التي تبلغ من العمر 2.5 شهر. لا توجد اختلافات في منطقة GFAP الإيجابية بين الأنماط الجينية.اختبار t لعينتين مستقلتين ذو الجانبين)، أو وسم IBA1 (تحكم،; cKO اختبار t لطلبة ذو جانبين). i، متوسط تغييرات سعة CAP (% من الخط الأساسي) عند تحفيز الأعصاب البصرية لمدة دقيقة واحدة بتردد 50 هرتز من cKO و ctrl و wildtype (wt) و wt المعالج بـوقت التعافي من ذروة CAP بعد تحفيز 50 هرتز: تعافي أبطأ في CKOالفئران) ومقارنة بـ و wt ( ) (ctrl مقابل cKO، ; الوزن مقابل الوزن ; التحكم مقابل الوزن، ; cKO مقابل wt “; تحليل التباين الأحادي مع اختبار المقارنات المتعددة لهولم-شيداك). البيانات ممثلة كمتوسطاتSEM.
الشكل البياني الممتد 8| اعتلال المحاور العصبية المرتبط بالعمر وعلامات التغيرات النجمية في فئران Kir4.1 cKO التي تتراوح أعمارها بين 7 إلى 8 أشهر. أ-ج، تحليل المجهر الإلكتروني للأعصاب البصرية من فئران cKO وctrl التي تتراوح أعمارها بين 7 إلى 8 أشهر: أ، صور مجهر إلكتروني تمثيلية تظهر محاور عصبية طبيعية (N) وعلامات اعتلال المحاور العصبية (A). مقياس الرسم. ب، الميزات فوق الهيكلية لإصابة المحاور والتنكس أكثر شيوعًا في cKO مقارنةً بـفئران لكل مجموعة، مع 10 صور مأخوذة عشوائيًا كل منها تغطي (مرجع 2); اختبار t لطلبة ذو الجانبين). ج، من الجدير بالذكر أن التورمات المحورية العملاقة كانت حصرية لأعصاب cKO في هذا العمر. مقياس الرسم. د، لا فرق في المايلين 
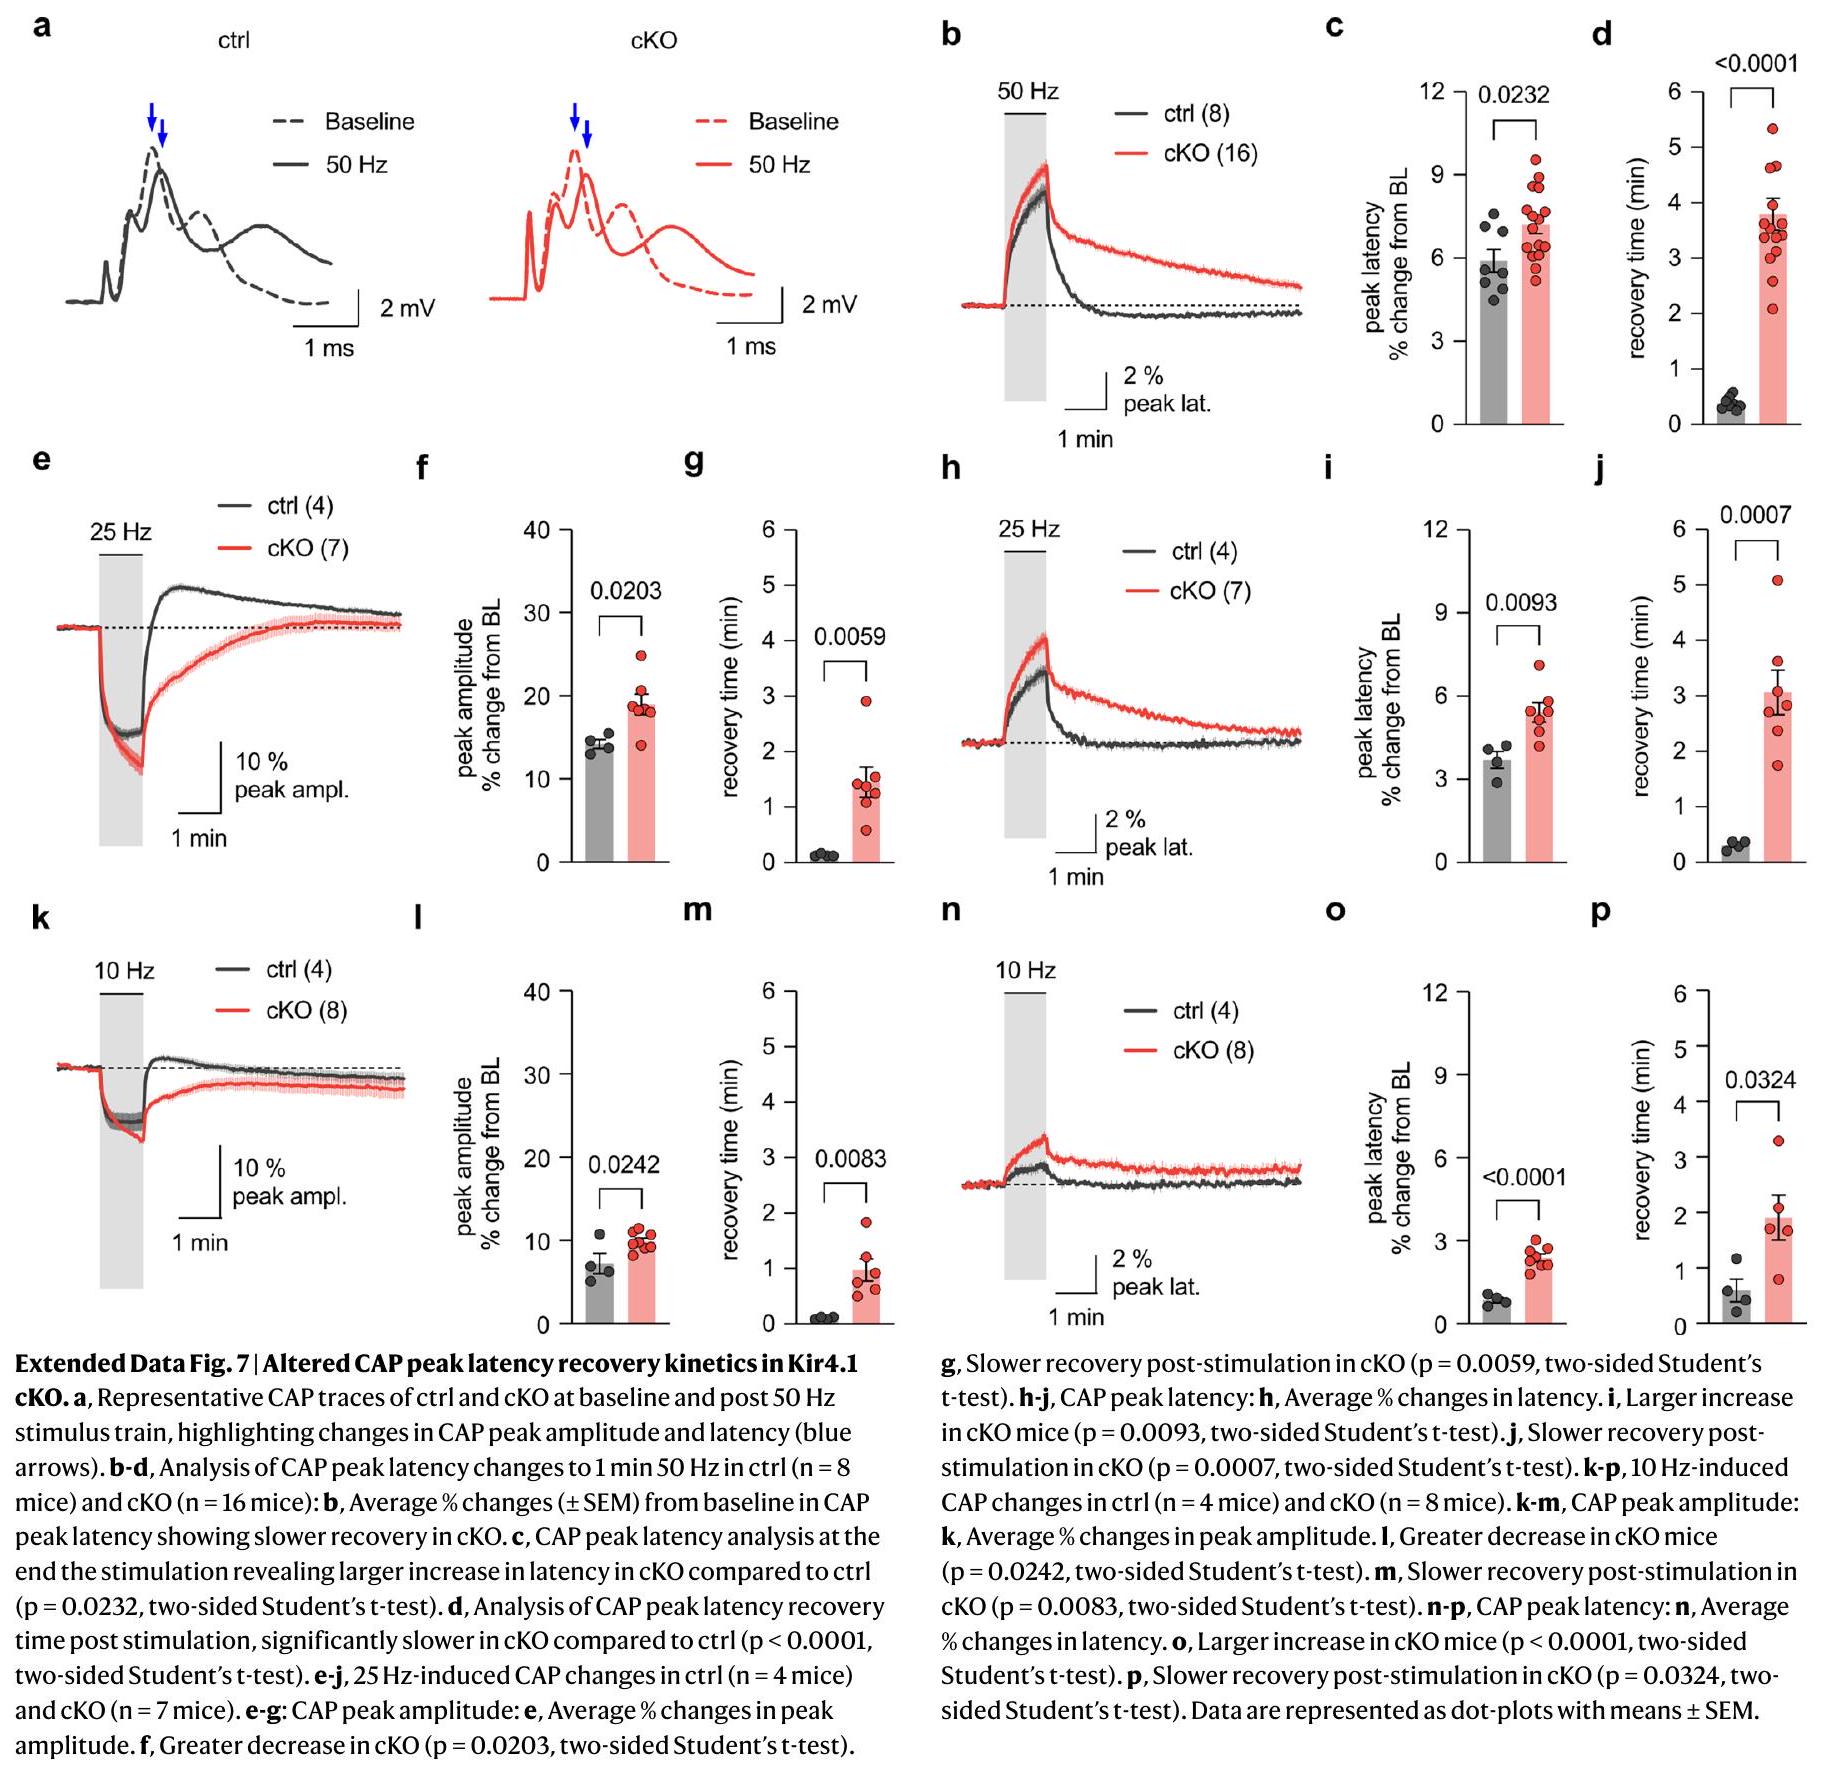
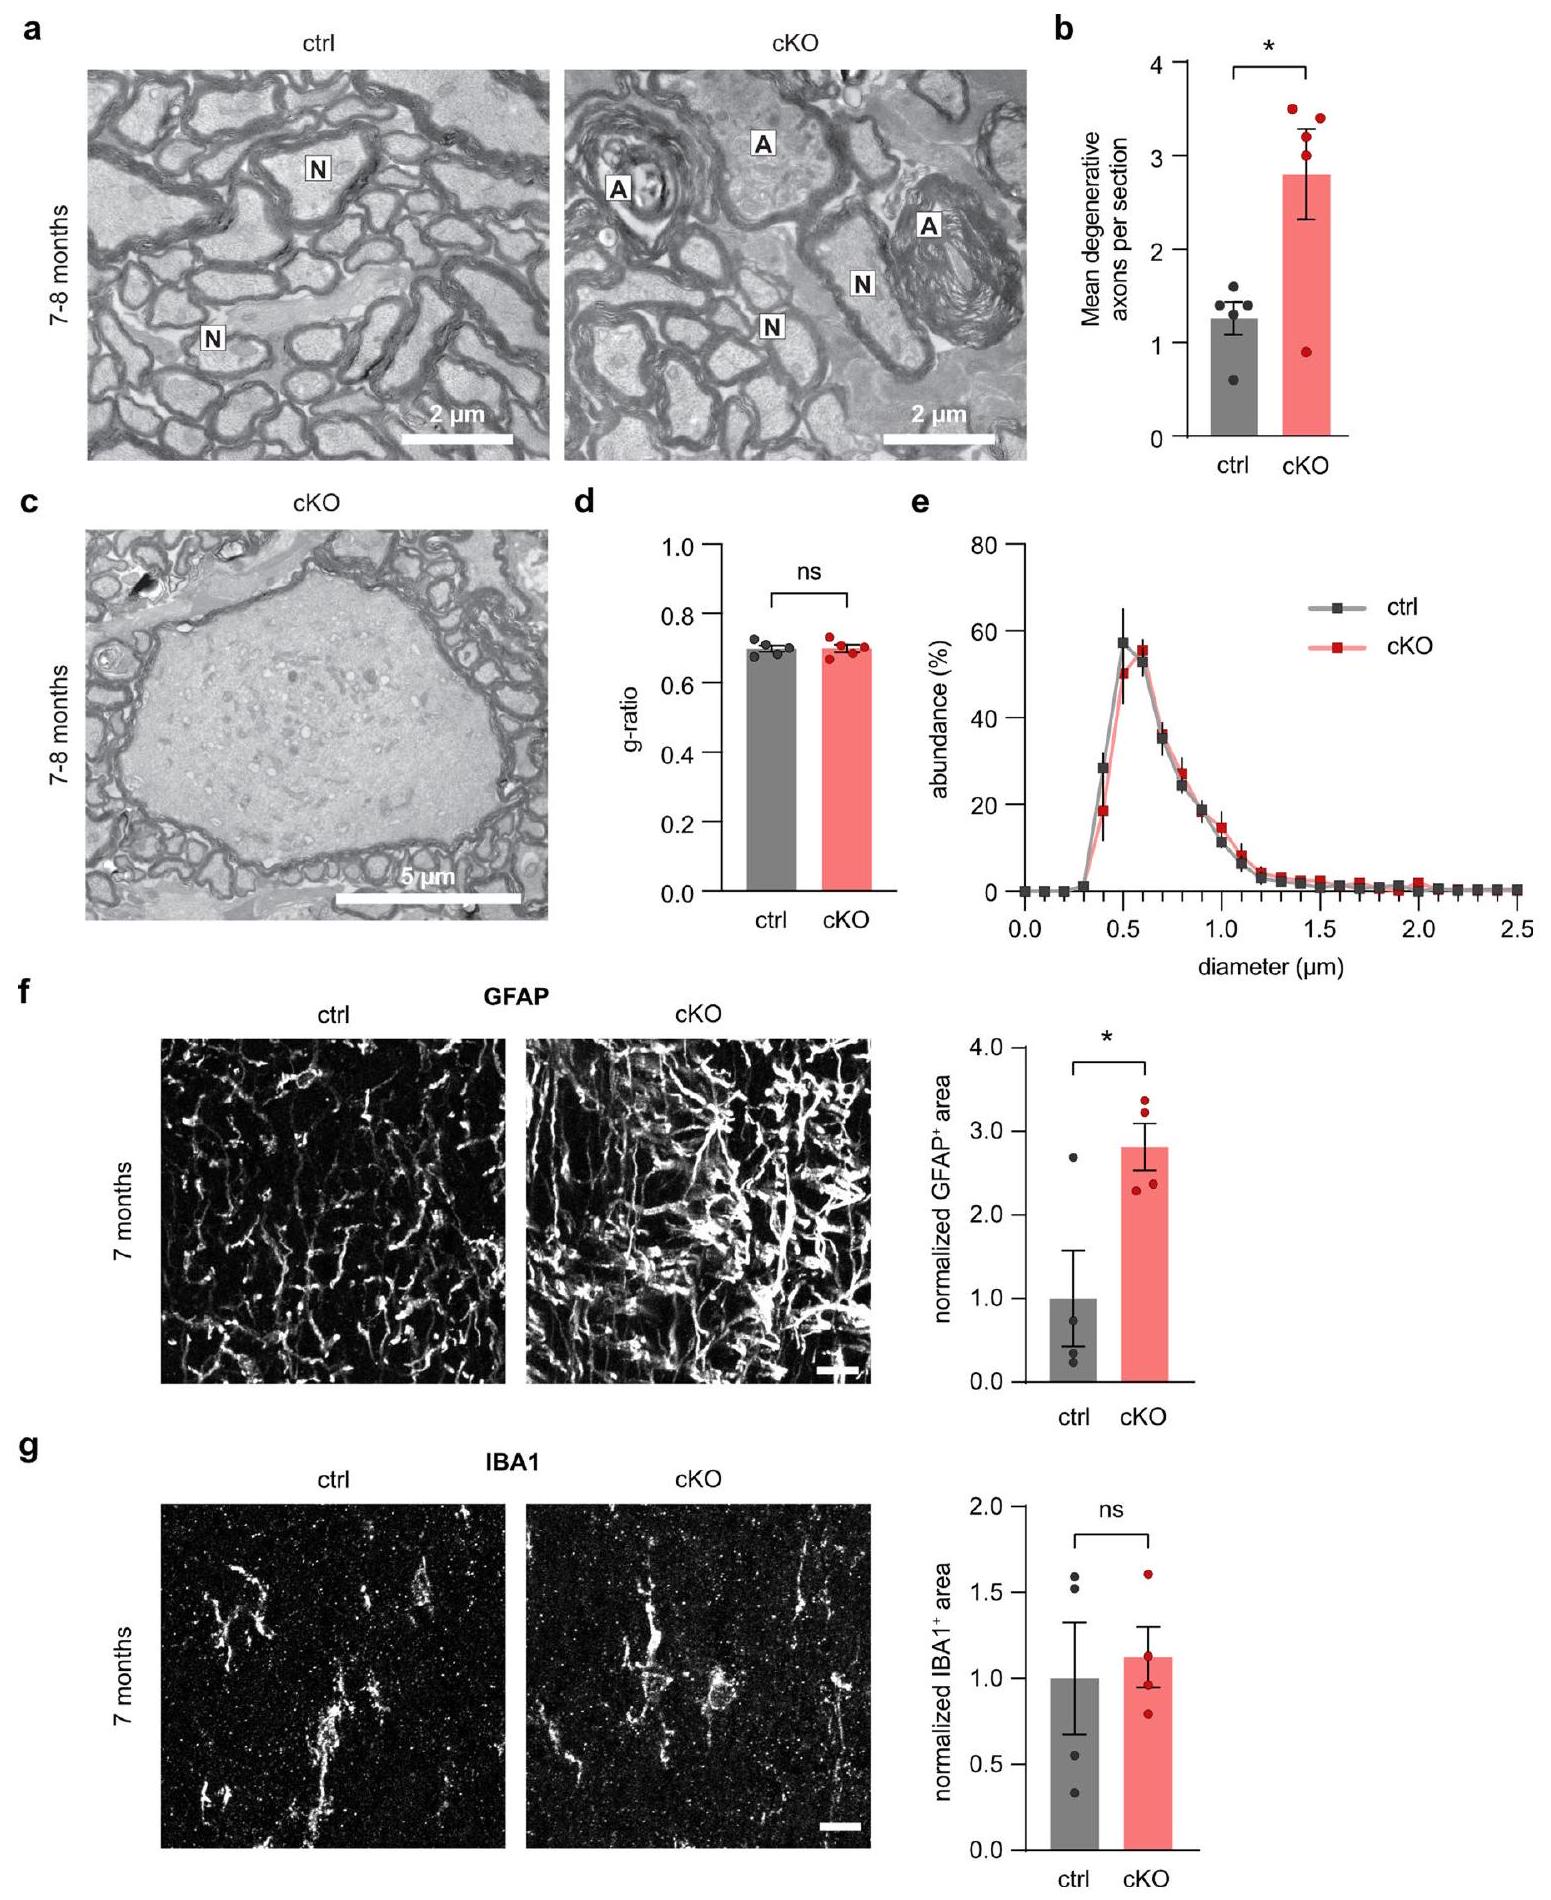
سماكة الغمد (نسبة g) بين الأنماط الجينيةفئران؛اختبار t لطلبة ذو جانبين). هـ، توزيع حجم المحاور المشابه للمحاور الميالينية (فئران؛زيادة ملحوظة في منطقة GFAP-الموجبة، تشير إلى الأستروغليوز، في الأعصاب البصرية من الفئران cKO مقارنةً بالتحكم عند 7 أشهر من العمر.فئران؛اختبار t لطالب ذو الجانبين). شريط القياسلا توجد اختلافات كبيرة في منطقة IBA1 الإيجابية بين الأنماط الجينيةفئران؛اختبار t للطلاب ذو الجانبين). شريط القياستم تمثيل البيانات كمتوسطاتSEM.
الشكل 9 من البيانات الموسعة | تحليل البروتيوميات و qPCR لمستخلصات العصب البصري من فئران Kir4.1 cKO الصغيرة. أ، منتم الكشف عن بروتينات من تحليل البروتيوميات المعتمد على TMT (انظر الشكل 4)، وتم تحديد 2665 منها بشكل لا لبس فيه إلى معرفات جينات Entrez الفريدة. باستخدام مصطلح عملية GO، توضح الرسوم البيانية الشريطية توضيح GO والتصنيف الوظيفي للبروتينات المحددة.ويب جستالت.أورغتم تقديم الملخص. ب، وفرة البروتين لـ Kir4.1 (الجين Kcnj10) تقل في العينات من cKO (الفئران) مقارنة بـ“، p = 0.0015، اختبار t المعتدل). ج، وفرة MCT1 (Slc16a1) تقل في cKO مقارنة بـاختبار t المعدل).يتم تقليل وفرة GLUT1 (Slc2a1) في cKO مقارنة بـ، معتدل 
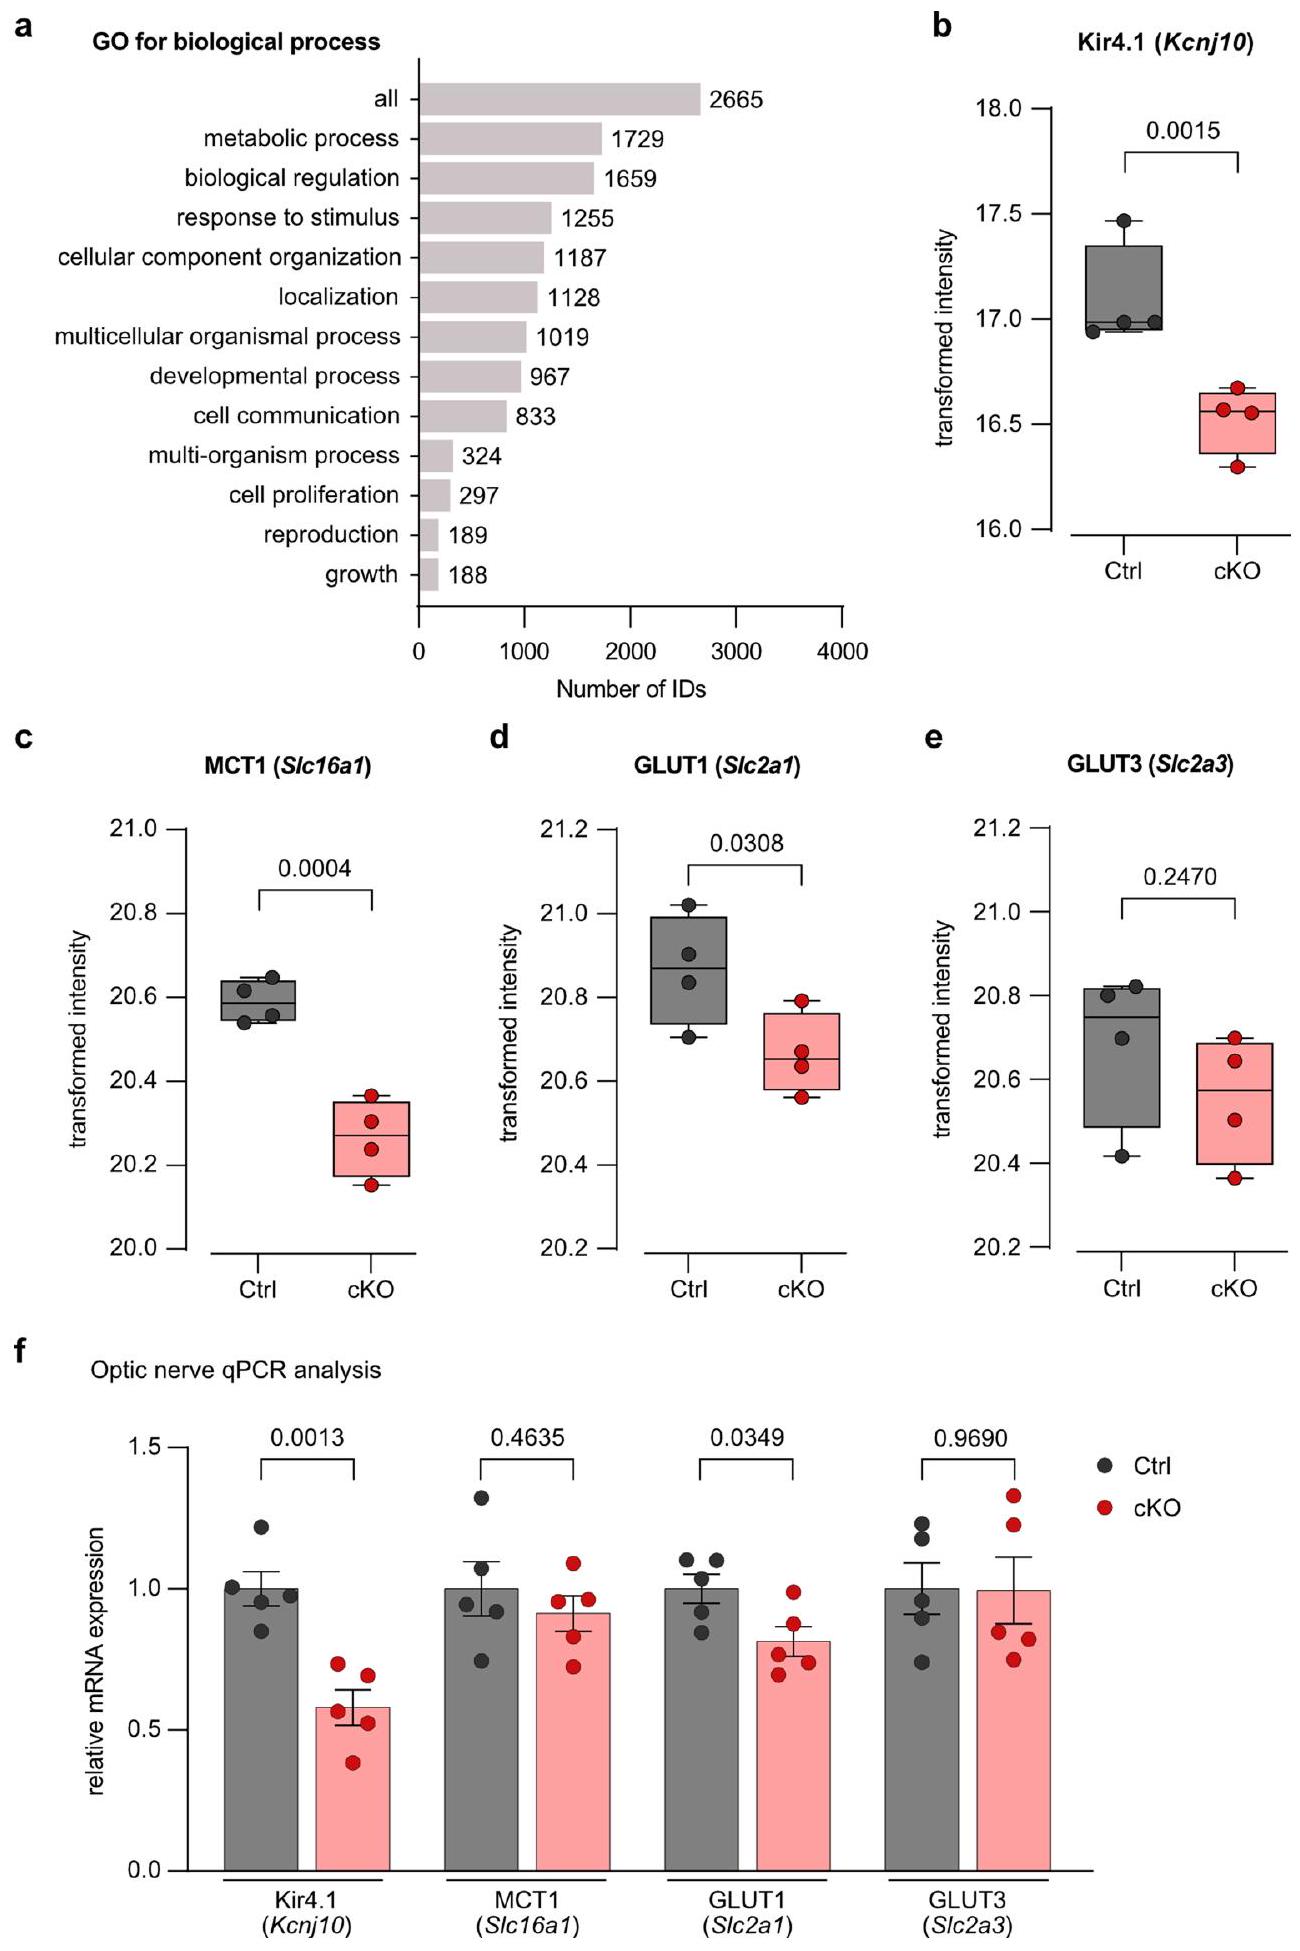
اختبار t). e، وفرة GLUT3 (Slc2a3) لا تتغير بين الأنماط الجينية (, اختبار t المعتدل). تُظهر الرسوم البيانية الصندوقية مع جميع النقاط الوسيط (الخط) والرباعيات (حدود الصندوق) والحد الأدنى إلى الحد الأقصى (الشعيرات). ف، وفرة mRNA النسبية في مستخلصات العصب البصري من cKO بعمر 3 أشهر ( ) وأقران القمامة ( ): مقارنةً بالتحكم، كانت مستويات mRNA لـ Kir4.1 منخفضة بـ ( ، تم تقليل مستويات mRNA لـ GLUT1 بواسطة اختبار t لعينتين مستقلتين ( اختبار t لعينتين مستقلتين ذو جانبين). لا توجد فروق ذات دلالة إحصائية في مستويات mRNA لـ MCT1 ( ) و GLUT3 ( ). البيانات ممثلة كرسوم نقطية مع المتوسطات SEM.
محفظة الطبيعة
المؤلف (المؤلفون) المراسلون: أيمن س. صعب آخر تحديث بواسطة المؤلفين: 20 نوفمبر 2023
ملخص التقرير
تسعى Nature Portfolio إلى تحسين إمكانية تكرار العمل الذي ننشره. يوفر هذا النموذج هيكلًا للاتساق والشفافية في الإبلاغ. لمزيد من المعلومات حول سياسات Nature Portfolio، يرجى الاطلاع على سياسات التحرير وقائمة مراجعة سياسة التحرير.
الإحصائيات
لجميع التحليلات الإحصائية، تأكد من أن العناصر التالية موجودة في أسطورة الشكل، أسطورة الجدول، النص الرئيسي، أو قسم الطرق.
تم التأكيد
حجم العينة بالضبطلكل مجموعة/شرط تجريبي، معطاة كرقم منفصل ووحدة قياس بيان حول ما إذا كانت القياسات قد أُخذت من عينات متميزة أو ما إذا كانت نفس العينة قد تم قياسها عدة مرات
اختبار(ات) الإحصاء المستخدمة وما إذا كانت أحادية الجانب أو ثنائية الجانب يجب أن تُوصف الاختبارات الشائعة فقط بالاسم؛ واصفًا التقنيات الأكثر تعقيدًا في قسم الطرق. وصف لجميع المتغيرات المشتركة التي تم اختبارها
وصف لأي افتراضات أو تصحيحات، مثل اختبارات الطبيعية والتعديل للمقارنات المتعددة
وصف كامل للمعلمات الإحصائية بما في ذلك الاتجاه المركزي (مثل المتوسطات) أو تقديرات أساسية أخرى (مثل معامل الانحدار) و التباين (مثل الانحراف المعياري) أو تقديرات مرتبطة بعدم اليقين (مثل فترات الثقة)
لاختبار الفرضية الصفرية، فإن إحصائية الاختبار (مثل F، ) مع فترات الثقة، أحجام التأثير، درجات الحرية وقيمة ملحوظة أعطِالقيم كقيم دقيقة كلما كان ذلك مناسبًا. لتحليل بايزي، معلومات حول اختيار القيم الأولية وإعدادات سلسلة ماركوف مونت كارلو للتصاميم الهرمية والمعقدة، تحديد المستوى المناسب للاختبارات والتقارير الكاملة عن النتائج تقديرات أحجام التأثير (مثل حجم تأثير كوهين)بيرسون )، مما يشير إلى كيفية حسابها تحتوي مجموعتنا على الإنترنت حول الإحصائيات لعلماء الأحياء على مقالات تتناول العديد من النقاط المذكورة أعلاه.
البرمجيات والشيفرة
معلومات السياسة حول توفر كود الكمبيوتر
جمع البيانات
تسجيلات CAP: غرفة التروية (Haas Top، Harvard Apparatus)؛ نظام اكتساب USB-ME16-FAI (Multichannel Systems) متصل بمضخم صوت USB-ME16-FAI (زيادة 4x؛ Multichannel Systems) والبيانات تم جمعها باستخدام برنامج الاكتساب MC_Rack (Multichannel Systems) تصوير ثنائي الفوتون: ميكروسكوب ثنائي الفوتون مصمم خصيصًا (Mayrhofer et al.، 2015)، مزود بليزر نبضي قابل للتعديل من نوع Ti:Sapphire (Chameleon Ultra II؛ Coherent) وهدف غمر الماء (XLPLNتم التحكم في المجهر بواسطة نسخة مخصصة من ScanImage (r3.8.1؛ حرم جانليا للبحوث، (Pologruto et al.، 2003)). تم الكشف عن انبعاث الفلورسنت باستخدام أنبوب مضاعف ضوئي GaAsP (PMT؛ هاماتسو فوتونيكس) باستخدام فلتر نطاق تمرير 520/70 نانومتر (Semrock) أو مقسم شعاعي ثنائي (حافة 560 نانومتر، BrightLine؛ Semrock) وفلترين نطاق تمرير. و (سيمروك). علم الأنسجة المناعية: تم الحصول على صور متداخلة باستخدام مجهر ليزر ماسح ضوئي متداخل من زيس LSM 700 أو زيس LSM 800 مزود بـعدسة (Plan-Apochromat، NA 1.4، زيت DIC (UV) VIS-IR). المجهر الإلكتروني (EM): تم التقاط صور EM باستخدام مجهر إلكتروني Zeiss EM912 (شركة كارل زيس للميكروسكوب، أوبيركوخن، ألمانيا) مزود بنظام على المحوركاميرا CCD (TRS، مورنفايس، ألمانيا). البروتيوميات: تم استخدام جهاز Orbitrap Fusion Lumos (Thermo Scientific) لتحليل مطيافية الكتلة، والذي كان مزودًا بمصدر Digital PicoView (New Objective) ومتصلاً بجهاز M-Class UPLC (Waters). التحليل المناعي: تم إجراء الكشف باستخدام الكشف الكيميائي المعزز بالضوء (ECL) وفقًا لتعليمات الشركة المصنعة (Western Lightning Plus-ECL أو SuperSignal West Femto Maximum Sensitive Substrate؛ Thermo Fisher Scientific، سان ليون-روت، ألمانيا). تم مسح المناعية باستخدام ECL Chemostar (Intas Science Imaging، غوتنغن، ألمانيا).
تحليل البيانات
تم تحليل تسجيلات CAP باستخدام برنامج MATLAB (MathWorks، R2015b، R2019a)، وImageJ (إصدار Fiji 1.52p)، وGraphPad Prism 9، وR (v.3.2.2، فريق R Core، 2015)؛ باستخدام نص برمجي مكتوب خصيصًا متاح على GitHub.https://github.com/EIN-lab/CAPanalysisتحليل الصور باستخدام صندوق الأدوات المخصص CHIPS (بارت وآخرون، 2018) المتاح على GITHUBhttps://github.com/EIN-lab/CHIPS). الشيفرة المستخدمة لتحليل صور FRET متاحة على GitHub (https://gitlab.com/einlabzurich/fretanalysisتم استخدام الوظائف المنفذة في حزمة R prolfqua لبيانات البروتيوميات جاري المعالجة.
بالنسبة للمخطوطات التي تستخدم خوارزميات أو برامج مخصصة تكون مركزية في البحث ولكن لم يتم وصفها بعد في الأدبيات المنشورة، يجب أن تكون البرمجيات متاحة للمحررين والمراجعين. نحن نشجع بشدة على إيداع الشيفرة في مستودع مجتمعي (مثل GitHub). راجع إرشادات مجموعة Nature لتقديم الشيفرة والبرمجيات لمزيد من المعلومات.
بيانات
معلومات السياسة حول توفر البيانات يجب أن تتضمن جميع المخطوطات بيانًا عن توفر البيانات. يجب أن يوفر هذا البيان المعلومات التالية، حيثما ينطبق:
رموز الانضمام، معرفات فريدة، أو روابط ويب لمجموعات البيانات المتاحة للجمهور
وصف لأي قيود على توفر البيانات
بالنسبة لمجموعات البيانات السريرية أو بيانات الطرف الثالث، يرجى التأكد من أن البيان يتماشى مع سياستنا
تم إيداع بيانات بروتينات طيف الكتلة المبلغ عنها في هذه الدراسة (انظر أيضًا الجدول S1 الذي يحتوي على بيانات البروتينات الخام والمعدلة) في ProteomeXchange PRIDE مع معرف مجموعة البيانات PXD046207. تم تنزيل بروتين المرجع mus musculus من UniProt، 20190709. تم إجراء GSEA باستخدام مجموعة أدوات تحليل مجموعة الجينات المستندة إلى الويب.ويب جستالت.أورغالمزيد من البيانات والموارد متاحة عند الطلب المعقول من المؤلف المراسل.
البحث الذي يتضمن مشاركين بشريين، بياناتهم، أو مواد بيولوجية
معلومات السياسة حول الدراسات التي تشمل مشاركين بشريين أو بيانات بشرية. انظر أيضًا معلومات السياسة حول الجنس، الهوية/التقديم الجنسي، والتوجه الجنسي والعرق، والعرقية والعنصرية.
التقارير عن الجنس والنوع الاجتماعي غير متوفر
التقارير عن العرق أو الإثنية أو غيرها من التجمعات الاجتماعية ذات الصلة
خصائص السكان
التوظيف الإشراف الأخلاقي
غير متوفر
غير متوفر غير متوفر غير متوفر
غير متوفر
غير متوفر غير متوفر
يرجى ملاحظة أنه يجب أيضًا تقديم معلومات كاملة حول الموافقة على بروتوكول الدراسة في المخطوطة.
التقارير الخاصة بالمجال
يرجى اختيار الخيار أدناه الذي يناسب بحثك بشكل أفضل. إذا لم تكن متأكدًا، اقرأ الأقسام المناسبة قبل اتخاذ قرارك. علوم الحياة العلوم السلوكية والاجتماعية العلوم البيئية والتطورية والإيكولوجية لنسخة مرجعية من الوثيقة بجميع الأقسام، انظرnature.com/documents/nr-reporting-summary-flat.pdf
تصميم دراسة العلوم الحياتية
يجب على جميع الدراسات الإفصاح عن هذه النقاط حتى عندما يكون الإفصاح سلبياً.
حجم العينة
إن توفير مجموعات من الفئران المعدلة وراثيًا المتطابقة في العمر حد من القدرة على تحديد أحجام العينات مسبقًا. لم تُستخدم أي طرق إحصائية لتحديد حجم العينة مسبقًا. أحجام العينات المستخدمة في هذه الدراسة تعادل المعايير المتبعة في هذا المجال.
استثناءات البيانات
في بعض الأحيان كانت تعبيرات المستشعر ضعيفة جدًا (على سبيل المثال، بسبب عدم كفاية التعبير الناتج عن كري المدعوم بالتاموكسيفين أو توصيل AAV)، تم استبعاد هذه الحيوانات من التجارب.
استنساخ
عدد التكرارات (نقاط البيانات الفردية من كل خلية و/أو حيوان) موضح في الأشكال أو أساطير الأشكال.
التوزيع العشوائي
تم اختيار الفئران بناءً على النمط الجيني أو تم طلب فئران من النوع البري من تشارلز ريفر. تم تعيين الفئران عشوائيًا إلى مجموعات تجريبية، اعتمادًا على توفر المجموعات المتحولة.
عمى
بشكل عام، خلال جمع البيانات لم يكن الباحثون معزولين عن الظروف. ومع ذلك، كان الباحث الذي جمع مجموعة بيانات EM معزولاً عن الظروف التجريبية. كلما كان ذلك ممكنًا، كان المحققون معزولين لتحليل البيانات، خاصةً لتحليل صور EM.
التقارير عن مواد وأنظمة وطرق محددة
نحتاج إلى معلومات من المؤلفين حول بعض أنواع المواد والأنظمة التجريبية والأساليب المستخدمة في العديد من الدراسات. هنا، يرجى الإشارة إلى ما إذا كانت كل مادة أو نظام أو طريقة مدرجة ذات صلة بدراستك. إذا لم تكن متأكدًا مما إذا كان عنصر القائمة ينطبق على بحثك، يرجى قراءة القسم المناسب قبل اختيار رد.
المواد والأنظمة التجريبية
طرق
غير متوفر
مشارك في الدراسة
غير متوفر
مشارك في الدراسة
الأجسام المضادة
علم الحفريات وعلم الآثار
الأجسام المضادة
الأجسام المضادة المستخدمة
معلومات الأجسام المضادة. IHC، الكيمياء المناعية النسيجية، IB، التحليل المناعي
-CC1 فأر، وحيد النسيلة (نسخة 5.24) IHC، 1:100 كالبيوكيم، رقم المنتج OP80
-دجاج GFP، IHC متعدد النسائل، 1:1000 مختبرات أفيز، رقم المنتج GFP-1020
-GFAP دجاج، متعدد النسائل IHC، 1:2000 أبكام، رقم الكاتالوج ab4674
-كنال 4.1 أرنب، بوليكلونال IB، 1:1000 ألومون، رقم الكاتالوج APC-035
-MCT1 / SLC16A1 أرنب، متعدد النسائل IB، 1:500 تم إنتاجه بواسطة كاثرين كوش (ستومبف وآخرون، 2019): الأجسام المضادة التي أنتجتها كاثرين كوش من قسم علم الوراثة العصبية، معهد ماكس بلانك للعلوم متعددة التخصصات، غوتينغن، ألمانيا.
-GLUT1 أرنب، متعدد النسائل IB، 1:500 من إنتاج كاثرين كوش (برغوف وآخرون، 2017): جسم مضاد تم إنتاجه بواسطة كاثرين كوش من قسم علم الوراثة العصبية، معهد ماكس بلانك للعلوم متعددة التخصصات، غوتنغن، ألمانيا.
-فأر CNP، وحيد النسيلة (نسخة 11-5B) IB، 1:1000 سيغما، رقم الكاتالوج C 5922
-أرنب PLP، متعدد النسائل IB، 1:5000 A431؛ (يونغ وآخرون، 1996): مقدمة من هاوك فيرنر من قسم علم الوراثة العصبية، معهد ماكس بلانك للعلوم متعددة التخصصات، غوتنغن، ألمانيا.
-MOG (نسخة 8-18C5) فأر، أحادي النسيلة IB، 1:5000 (Linnington et al. 1984)، Creative Biolabs، رقم المنتج PABZ-152
معلومات مراقبة الجودة والاستشهادات ذات الصلة متاحة على موقع الشركة المصنعة.
لـ-CC1: https://www.merckmillipore.com/CH/de/product/Anti-APC-Ab-7-Mouse-mAb-CC-1,EMD_BIO-OP80?ReferrerURL=https% 3A%2F%2Fwww.google.com%2F; من أجل -GFP: https://www.aveslabs.com/products/anti-green-fluorescent-protein-antibody-gfp; من أجل -GFAP: https://www.abcam.com/products/primary-antibodies/gfap-antibody-ab4674.html؛ لـ-IBA1: https://labchem-wako.fujifilm.com/us/product/detail/W01W0101-1974.html; لـ-كير4.1: https://www.alomone.com/p/anti-kir4-1/APC-035; لـ CNP: https://www.sigmaaldrich.com/CH/de/product/sigma/c5922; لـ -MOG: https://www.creativebiolabs.net/Anti-MOG-Recombinant-Antibody-clone-8-18C5-24503.htm; لـ-ATP2a1: https://www.abcam.com/products/primary-antibodies/alpha-1-sodium-potassium-atpase-antibody-4646-ab7671.html; لـ-ATP1a3: https://www.abcam.com/products/primary-antibodies/ atp1a3-antibody-xvif9-g10-ab2826.html; من أجل -أجسام مضادة IgG من الفأر HRP: https://www.jacksonimmuno.com/catalog/products/115-035-003; لـ-الأرنب IgG HRP: https://www.jacksonimmuno.com/catalog/products/111-035-003; لـ-فأر Cy3 من نوع حمار: https://www.jacksonimmuno.com/catalog/products/715-165-151؛ لـ-أرنب Cy3 حمار: https://www.jacksonimmuno.com/catalog/products/711-165-152; لـ-دجاج أليكسا 488 حمار: https://www.jacksonimmuno.com/catalog/products/711-545-152. تم تأكيد صحة الأجسام المضادة للاستخدام في التحليل المناعي من خلال المنشورات المذكورة لـ-MCT1 / SLC16A1 (Stumpf وآخرون، 2019)، لـ-GLUT1 (برغوف وآخرون، 2017) و لـPLP (يونغ وآخرون، 1996).
الحيوانات وغيرها من الكائنات البحثية
معلومات السياسة حول الدراسات التي تشمل الحيوانات؛بحث
الحيوانات المخبرية
تم إنشاء فئران PLP-CreERT;RCL-GCaMP6s عن طريق عبور فئران PLP-CreERT (RRID:IMSR_JAX:005975) (Doerflinger et al., 2003) مع فئران ROSA26-floxed-STOP-GCaMP6s (Ai96; RRID:IMSR_JAX:024106) (Madisen et al., 2015). العمر من 6 إلى 20 أسبوعًا.
تم الحصول على فئران Kir4.1fl/fl;MOGiCre (لارسون وآخرون، 2018) من تزاوج فئران تحمل الأليل Kcnj10 (Kir4.1fl/fl) (ديجوك وآخرون، 2007) مع فئران MOGi-Cre (هوفيلماير وآخرون، 2005). العمر من 6 أسابيع إلى 8 أشهر.
للتجارب في الفئران البرية، تم استخدام فئران تشارلز ريفر C57BL/6. العمر من 8 أسابيع إلى 5 أشهر.
الحيوانات البرية
لم يتم استخدام حيوانات برية في الدراسة
التقارير عن الجنس
تم استخدام كل من ذكور وإناث الفئران في التجارب
معهد علم الأدوية وعلم السموم، جامعة زيورخ، زيورخ، سويسرا.مركز علوم الأعصاب زيورخ، جامعة زيورخ والمعهد الفيدرالي للتكنولوجيا في زيورخ، زيورخ، سويسرا.قسم علم الوراثة العصبية، معهد ماكس بلانك للعلوم متعددة التخصصات، غوتنغن، ألمانيا.قسم علوم الأعصاب سولومون إتش. سنايدر، جامعة جونز هوبكنز، بالتيمور، ماريلاند، الولايات المتحدة الأمريكية.مركز الدراسات العلمية (CECs)، فالديبيا، تشيلي.كلية الطب والعلوم، جامعة سان سيباستيان، فالديبیا، تشيلي.البريد الإلكتروني: asaab@pharma.uzh.ch
يرجى ملاحظة أنه يجب أيضًا تقديم معلومات كاملة حول الموافقة على بروتوكول الدراسة في المخطوطة.
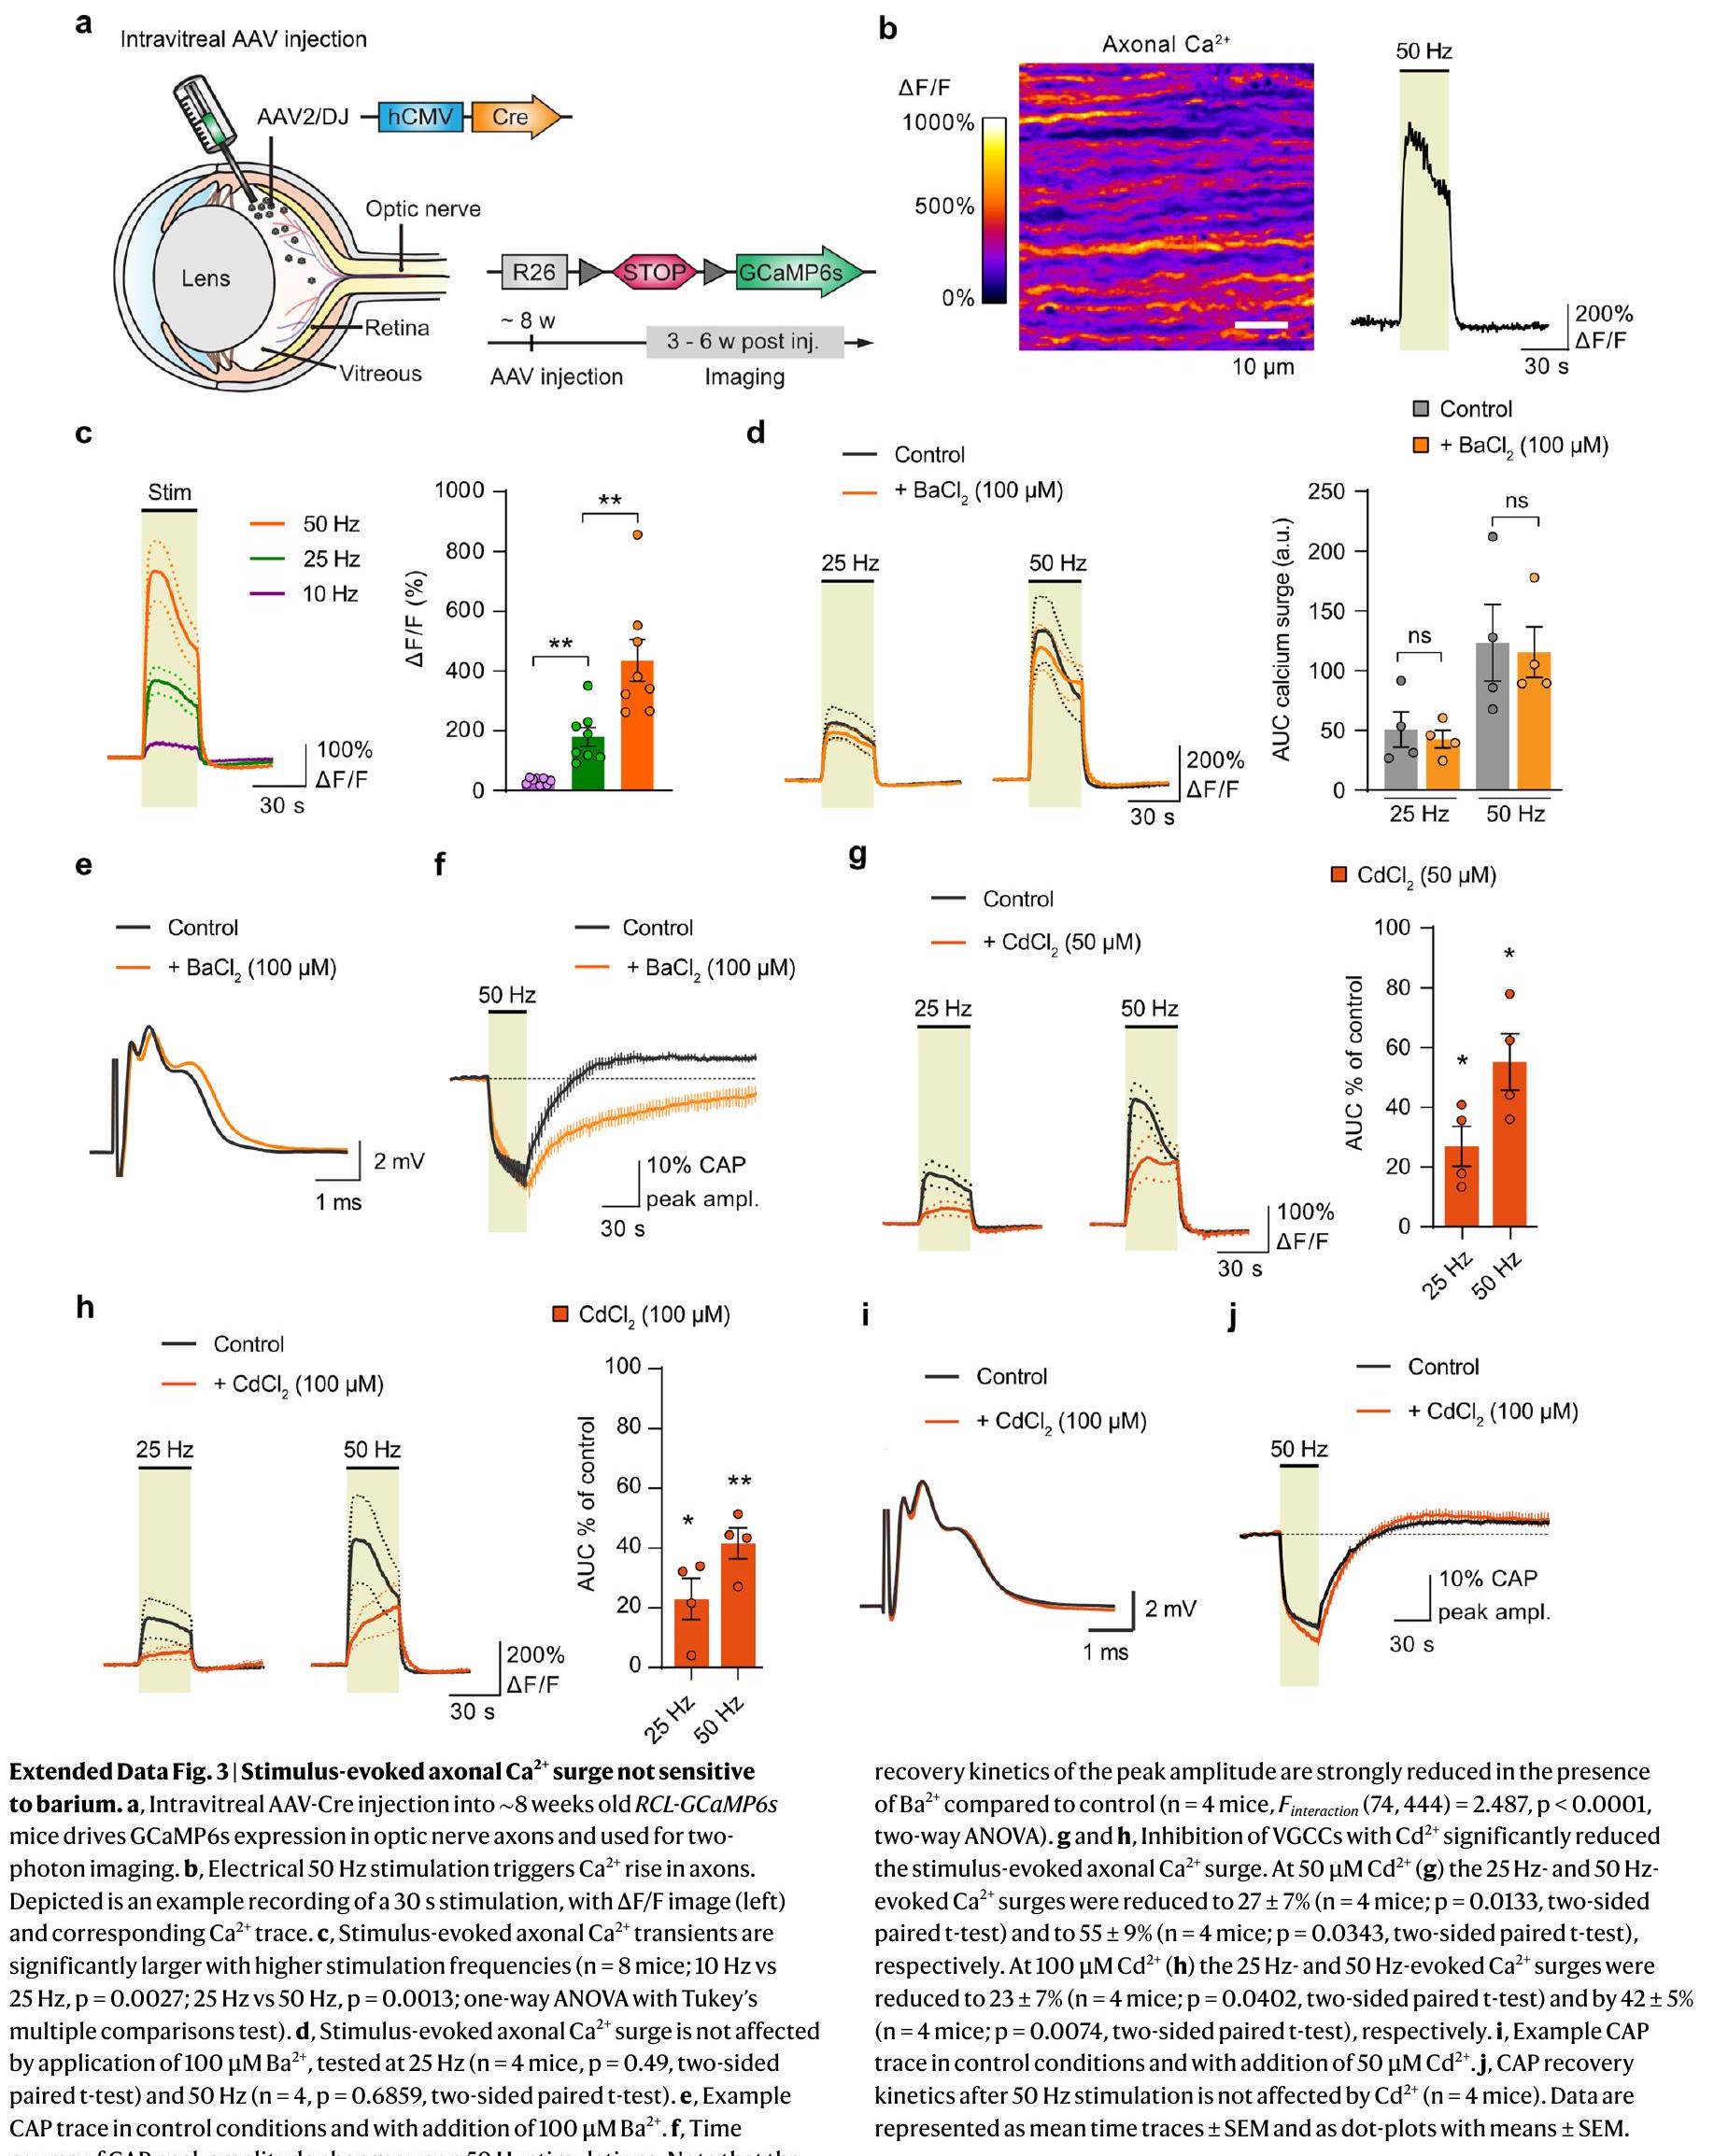
The integrity of myelinated axons relies on homeostatic support from oligodendrocytes (OLs). To determine how OLs detect axonal spiking and how rapid axon-OL metabolic coupling is regulated in the white matter, we studied activity-dependent calcium ( ) and metabolite fluxes in the mouse optic nerve. We show that fast axonal spiking triggers signaling and glycolysis in OLs. OLs detect axonal activity through increases in extracellular potassium ( ) concentrations and activation of Kir4.1 channels, thereby regulating metabolite supply to axons. Both pharmacological inhibition and OL-specific inactivation of Kir4.1 reduce the activity-induced axonal lactate surge. Mice lacking oligodendroglial Kir4.1 exhibit lower resting lactate levels and altered glucose metabolism in axons. These early deficits in axonal energy metabolism are associated with late-onset axonopathy. Our findings reveal that OLs detect fast axonal spiking through signaling, making acute metabolic coupling possible and adjusting the axon-OL metabolic unit to promote axonal health.
Oligodendrocytes(OLs) produce and maintain the myelin sheaths around axons, making fast and economical communication between distant neurons possible. Axonal health is crucial for brain function, and axonal damage is a feature of aging and various neurological disorders . Accumulating evidence reveals that, apart from orchestrating axonal signaling speed, OLs have an important role in preserving neural circuits and long-term neuronal integrity . In recent years, several studies have indicated that OLs contribute to supporting axonal energy metabolism . OLs can sustain their functions through aerobic glycolysis alone, given the preservation of white matter integrity in Cox10-mutant mice, in which mitochondrial respiration is specifically perturbed in OLs . One necessary outcome of aerobic glycolysis is the production of lactate, which could serve as an energy substrate for axons . Indeed, OL-specific deletion
of monocarboxylate transporter1(MCT1) leads to late-onset axonopathy, implying that lactate and/or pyruvate release from OLs has a role in axonal health . Glutamatergic signaling has been shown to stimulate the surface expression of glucose transporter1(GLUT1)in OLs, suggesting that axonal activity might regulate the metabolic support provided by OLs to axons . Metabolite supply could be facilitated by cytosolic channels within the myelin sheath , and a disruption in this myelinic channel system has been associated with axonal damage . Moreover, mice deficient in the myelin proteolipid protein (PLP), a mouse model of spastic paraplegia, develop severe axonal spheroids with age , possibly due to deficits in axonal transport , alterations in mitochondrial function and impaired energy homeostasis . Other homeostatic functions carried out by OLs include antioxidant support and buffering .
Despite the existing notion that OLs support axonal energy metabolism, the molecular and cellular events involved in metabolic coupling remain elusive. Whether neuronal activity influences OLs to drive metabolic support is still unclear. Glutamatergic signaling may mediate the long-term adjustment of oligodendroglial glucose uptake capacity , but what controls a rapid and on-demand delivery of metabolites to axons remains unexplored.
Independent of neuronal subtype, a key indicator of axonal activity is transient increases in extracellular concentrations ( ), which depolarize the plasma membrane of . Here, we hypothesized that activity-driven signaling triggers rapid metabolic coupling between OLs and axons. We addressed this question through optic nerve electrophysiology and two-photon imaging, a combination previously used to study axonal ATP dynamics . We found that high-frequency axonal spiking triggers a surge and immediately accelerates glucose consumption in OLs. Axonal activity is detected by OLs predominantly through increases in and activation of Kir4.1 channels. Both high-frequency stimulation and elevated evoke a lactate increase in axons, which is diminished by pharmacological inhibition of Kir4.1. Moreover, blocking Kir4.1 impairs the recovery of axonal firing from high-frequency stimulation. Using OL-specific Kir4.1-knockout mice (Kir4.1 ;MOGiCre, hereafter termed Kir4.1cKO), we demonstrate that axonal lactate dynamics are controlled by oligodendroglial Kir4.1 and that OLs are the primary cells involved in activity-dependent clearance. Furthermore, axonal glucose uptake and consumption are decreased in Kir4.1 cKO mice, revealing that OLs also regulate axonal glucose metabolism. These early deficits in axonal energy metabolism could affect vesicular transport and antioxidant capacity, leading to the late-onset axonal damage detected in Kir4.1 cKO mice. Our findings imply that increased during fast axonal spiking stimulates axon-OL metabolic coupling and that oligodendroglial homeostasis regulates axonal energy metabolism, function and survival.
Results
Axonal spiking triggers signaling and glycolysis in OLs
To investigate dynamics in mature OLs as a function of electrical activity, we used PLP-CreERT mice crossed with Ai96 mice expressing the cytosolic indicator GCaMP6s in a Cre-dependent manner (RCL-GCaMP6s) . We studied 3 – to 5 -month-old PLP-CreERT;RCL-GCaMP6s mice treated with tamoxifen at 6-8 weeks (Fig. 1a). We confirmed through immunohistochemistry (Table1) that GCaMP6s expression was restricted to mature (CC1-immunopositive) OLs (Fig. 1b). We focused on the optic nerve, a myelinated white matter tract ideal for recording compound action potentials (CAPs) and for two-photon sensor imaging (Fig. 1c). To determine whether mature OLs detect axonal spiking, we stimulated optic nerves at 10, 25 or 50 Hz
for 30 s . Before and after this period, nerves received electrical pulses to monitor CAP changes alongside OL imaging. CAP peak amplitude decreased during high-frequency stimulation (Fig.1d). Notably, axonal stimulation induced a biphasic response in OL somas, marked by an initial increase during stimulation and a transient undershoot after stimulation (Fig. 1e and Supplementary Video 1). The response was significantly larger at higher frequencies (Fig. 1e). Tetrodotoxin (TTX, ) application abrogated the stimulus-induced surge in OLs (Fig.1f), confirming the necessity of axonal spiking. Removal of extracellular also diminished the OL response (Fig. 1 g ), indicating a mechanism involving influx.
Recognizing that OLs detect axonal spiking, we next asked whether heightened axonal activity influences metabolic flux within OLs. Considering that OLs may supply axons with glycolytic products such as pyruvate or lactate, increased axonal spiking could enhance glucose consumption in OLs. To study this, we expressed the glucose sensor FLII12Pglu700 (FLIIP) in optic nerve OLs of wild-type mice through adeno-associated virus (AAV) delivery (Fig. 1h,i). CC1 immunolabeling confirmed sensor expression in mature OLs (Fig. 1h). We first assessed the sensor’s response to glucose fluctuations. Removing extracellular glucose lowered cytosolic glucose levels in OLs, whereas blocking glycolysis with 1 mM iodoacetate (IA) in artificial cerebrospinal fluid (ACSF) containing 10 mM glucose increased glucose levels (Extended Data Fig. 1a,b), confirming the sensor’s functionality for studying glucose metabolism in OLs. To analyze glycolytic flux, we inhibited glucose transporters with cytochalasin B (CytoB) and measured the glucose decline rate (Fig. 1i), as previously outlined . Remarkably, transient axonal stimulation accelerated oligodendroglial glucose consumption by approximately ninefold compared to the basal rate at 0.1-Hz stimulation (Fig. 1i). Thus, OLs respond to axonal spiking by promptly increasing their glycolytic activity.
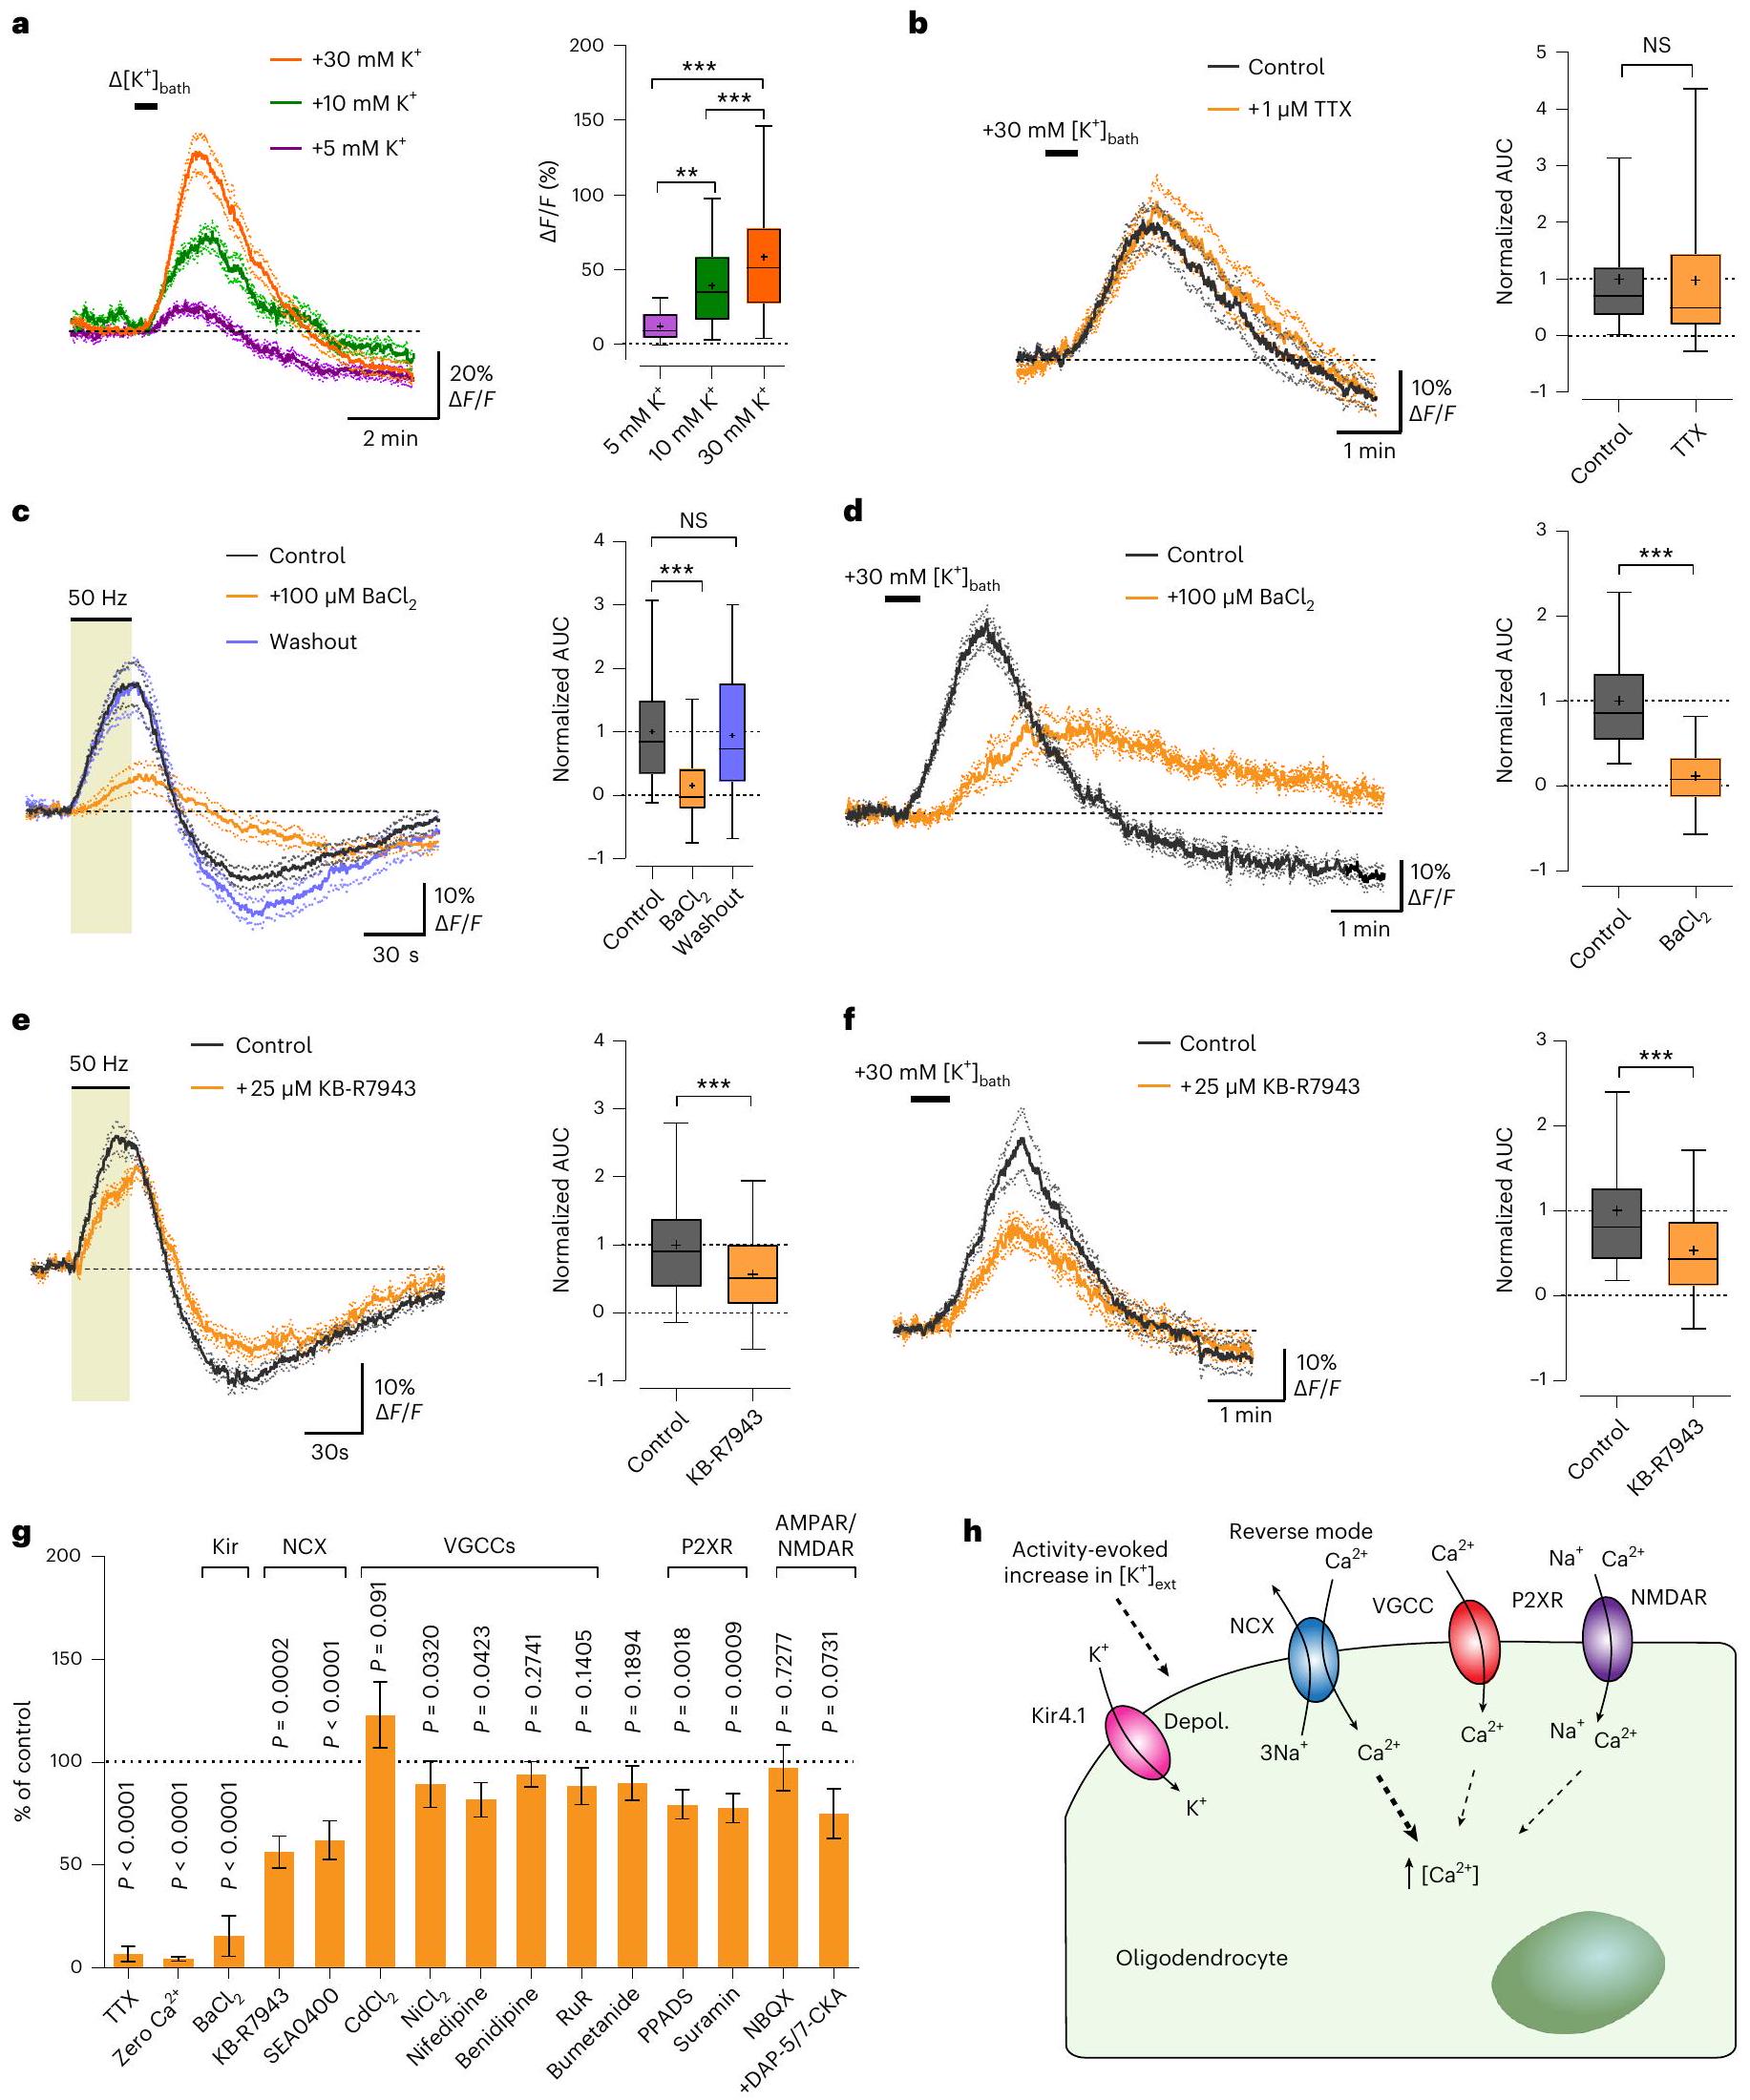
OLs detect axonal spiking through and Kir4.1 channels
Next, we sought to determine the mechanism by which OLs detect axonal spiking. OLs express -methyl-d-aspartate (NMDA) receptors, which regulate oligodendroglial glucose import and mediate increase in myelin upon electrical axonal stimulation or chemical ischemia . -Amino-3-hydroxy-5-methyl-4-isoxazolepropionic acid (AMPA) receptors were also suggested to influence myelinic dynamics . Therefore, we examined the contribution of glutamatergic signaling. Blocking AMPA receptors with 2,3-dioxo-6-n itro-7-sulfamoyl-benzo[ ]quinoxaline (NBQX; ) caused no change in the response (Extended Data Fig. 2a), indicating that AMPA receptors might not be involved. Additional inhibition of NMDA receptors with 7-chlorokynurenic acid (7-CKA; ) and D-2-amino-5-phosphonopentanoate (D-AP5; ), blocking both glycinergic and glutamatergic NMDA receptor binding sites, reduced
Fig. 1|Axonal activity-induced signaling and glycolytic flux in optic nerve OLs. a, Generation and tamoxifen treatment of PLP-CreERT;RCL-GCaMP6s mice at 6-8 weeks; experiments were performed 4-12 weeks after injection. b, Left, immunohistochemistry images of GCaMP6s expression in OLs (antigreen fluorescent protein (anti-GFP) antibody, green; anti-CC1 antibody, magenta). Right, percentage of GCaMP6s-positive cells that are also positive for CC1 ( mice, gray circles). c, Optic nerve preparation for electrophysiology and imaging. d, Left, example CAPs at 0.4 Hz (baseline (BL)) and after stimulation at 10,25 or 50 Hz . Right, time course (mean s.e.m.) of CAP peak 2 amplitude relative to baseline ( mice). e, responses (mean s.e.m.) to different axonal stimulations. Right, box plots showing the response area under the curve (AUC; cells from eight mice). Higher frequencies induced larger surges ( 50 versus 25 Hz , *** versus versus ; one-way analysis of variance (ANOVA), Tukey’s multiple-comparison test). f, Left, TTX ( ) abolished the -induced OL response. Inset, CAP diminished by TTX. Right, normalized response AUCs before and after TTX ( cells from six mice),
showing a reduction by (*** , two-sided paired test). g, Left, removal of extracellular ( M EGTA) diminished the OL response. Inset, CAP response in zero . Right, normalized response AUCs showing a reduction ( cells from three mice, , two-sided paired test). h, AAV-mediated glucose (Glc) FRET sensor (FLIIP) expression in adult optic nerve OLs following intracerebroventricular injection. Immunostaining with CC1 (magenta) confirmed FLIIP expression (anti-GFP antibody, green) in mature OLs (observed in three mice). MBP, myelin basic protein; P10, postnatal day10; P56, approximately postnatal day , Left, schematic of glucose consumption after inhibiting glucose uptake with the glucose transporter (GLUT) blocker CytoB. Glc-6P, glucose 6-phosphate. Middle, time course of glucose decline during CytoB incubation at 0.1 Hz and upon transient stimulation (mean s.e.m.). The mean decline rate (red dashed lines) increased from at 0.1 Hz to at 50 Hz . Right, graph showing the glucose consumption rates ( mice, , two-sided paired test). Box plots show the median (center line), quartiles (box bounds), mean ( + ) and 5th-95th percentiles (whiskers).
the response by approximately 20% (Extended Data Fig. 2b). We then examined purinergic signaling, given that ATP may act as a signaling molecule in the white matter and OLs express P2X/P2Y receptors . The broad-spectrum, nonselective P2X/P2Y receptor antagonists pyridoxalphosphate-6-azophenyl-2′,4′-disulfonic acid
(PPADS; ) and suramin ( ) reduced the response by (Extended Data Fig. 2c,d). Hence, both purinergic and glutamatergic signaling modestly contribute to the OL response.
Given that axonal action potentials increase in the white matter , we tested whether is the key signal responsible for OL
IgG, immunoglobulin G; HRP, horseradish peroxidase; IHC, immunohistochemistry; IB, immunoblot.
stimulation. Transient increases in the bath induced a response in OLs, which was more pronounced at higher levels (Fig. 2a). We ruled out that increasing may indirectly stimulate axonal firing and possible neurotransmitter release, as, in the presence of TTX, OLs showed the same evoked response (Fig. 2b). OLs express Kir4.1 (refs. 23,24,43), implicated in homeostasis and OL depolarization . Strikingly, blocking Kir4.1 channels with barium ( ) reversibly reduced the evoked OL response by (Fig. 2c). also inhibited the evoked response in OLs (Fig. 2d), implying that Kir4.1-mediated OL depolarization mediates the surge. We then examined whether influences axonal dynamics. For this, we performed intravitreal delivery of AAV containing Cre in RCL-GCaMP6s mice, followed by two-photon imaging of GCaMP6s-expressing optic nerve axons 3-6 weeks after injection (Extended Data Fig. 3a). Electrical stimulation elicited a strong increase in axons (Extended Data Fig. 3b and Supplementary Video 2), which was larger at higher frequencies (Extended Data Fig. 3c). Crucially, did not affect the axonal surge (Extended Data Fig. 3d), emphasizing that the -mediated reduction in the response (Fig. 2c) was not due to unspecific inhibition of axonal signaling. Yet, affected the recovery of axonal
firing after stimulation, as shown by the delayed recovery of the CAP peak amplitude (Extended Data Fig. 3e,f).
OL depolarization could activate voltage-gated channels (VGCCs). We tested various VGCC blockers, including cadmium ( ), nickel ( ), nifedipine, benidipine and ruthenium red (RuR; Extended Data Fig. 4a-e), of which only and nifedipine had minimal effects (Extended Data Fig. ). In contrast, did not affect the surge (Extended Data Fig. 4a) but clearly reduced the stimulus-evoked axonal response (Extended Data Fig. 3g,h). This suggests that the axonal increase during electrical activity is mediated by VGCCs, unlike the OL response. Moreover, the delayed recovery of CAP conductance after high-frequency stimulation was specific to (Extended Data Fig. 3f) and not influenced by (Extended Data Fig. 3i, j).
OLs express exchangers (NCX) , which could allow entry in reverse mode upon membrane depolarization . Inhibiting sodium pumps with ouabain caused a surge in OLs, which was reduced by blocking the reverse-mode activity of NCX with KB-R7943 (Extended Data Fig. 5a,b), confirming NCX functionality in optic nerve OLs. Further, KB-R7943 reduced the -evoked OL response by (Fig. 2e), a result mirrored
Fig. 2 | Kir4.1 channel-mediated mechanism underlying stimulus-evoked signaling in OLs. a, OL levels increased by increasing with 5, 10 and (30-s bath application: ). Left, average OL Ca traces (mean s.e.m.). Right, quantification of -evoked signal amplitudes ( cells from four mice; cells from five mice; 5 mM : cells from four mice; 5 versus 10 mM , versus 30 mM , versus ; one-way ANOVA with Tukey’s multiple-comparison test). b, Left, -evoked response independent of axonal spiking activity, showing comparable surges with TTX. Right, box plots showing the normalized response AUCs ( cells from five mice; , two-sided paired test; NS, not significant). c, Left, barium ( ) reversibly inhibited the -induced OL surge by . Right, box plots showing the normalized response AUCs ( cells from four mice; *** , two-sided paired test). d, Left, reduced the -evoked OL response by . Right, box plots showing the normalized response AUCs ( cells from three mice;*** , two-sided paired test).e,f,
Reverse-mode NCX blocker KB-R7943 ( ) reduced the -induced increase (e) by cells from five mice; paired test, and the -evoked response (f) by ( cells from three mice; twosided paired test, ). Box plots on the right show the normalized response AUCs. g, Summary of drugs tested and their inhibitory effects on -evoked OL surges (data are also shown as box plots including the respective values in c and e, Fig. 1f,g, and Extended Data Figs. 2, 4 and 5): TTX ( ), zero Ca , , nifedipine ( ), benidipine ( ), , bumetanide ( ), PPADS ( ), suramin ( ), NBQX ( ) and +DAP-5/7-CKA ( ). AMPAR, AMPA receptor; NMDAR, NMDA receptor. h, Schematic of axonal activity-mediated activation: high-frequency axonal activity increases , depolarizing (Depol.) OLs through Kir4.1 and enhancing entry through NCX. Minor contributions of VGCCs, P2XR and NMDA receptors are illustrated. Box plots in show the median (center line), quartiles (box bounds), mean (+) and 5th-95th percentiles (whiskers).
by SEA0400, another NCX blocker (Extended Data Fig. 5c). KB-R7943 also decreased the evoked response in OLs (Fig. 2f), suggesting that -induced depolarization of OLs leads to entry through reverse-mode NCX. cotransporter 1 (NKCC1) is expressed in developing OLs and may have a role in the volume regulation of the axon-facing inner tongue . We tested whether cotransporters are involved in the evoked OL surge by using bumetanide,
a specific NKCC1 blocker. However,
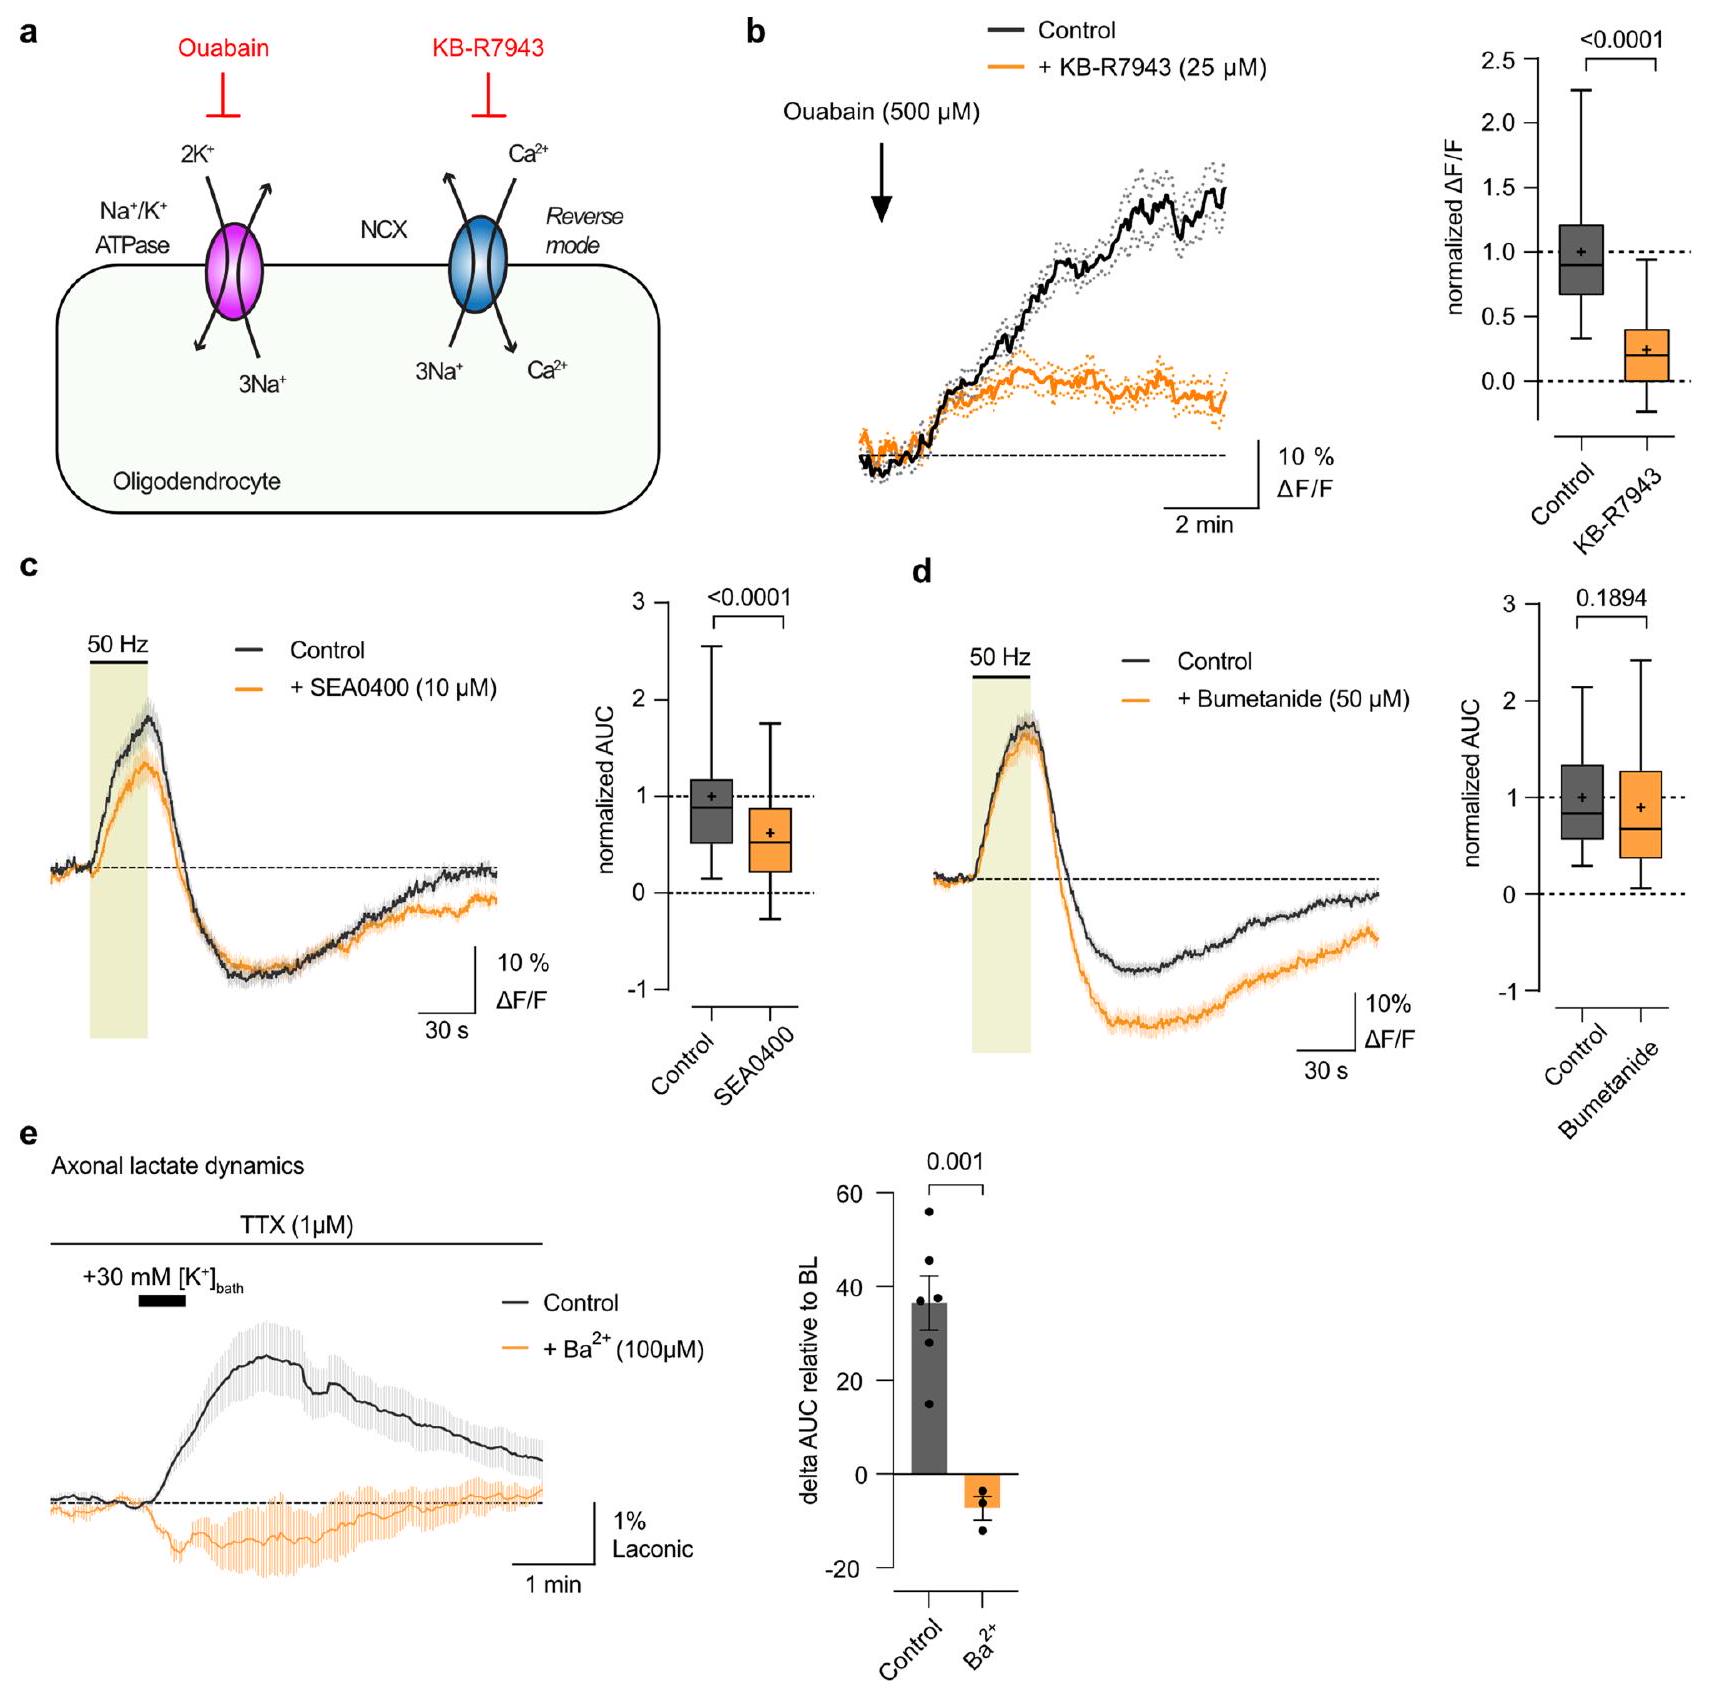
 bumetanide did not affect the -induced OL Ca increase (Extended Data Fig. 5d), suggesting that NKCC1-mediated volume changes in adult OLs are not involved during high-frequency axonal firing.
In summary, our pharmacological results (summarized in Fig. 2g) indicate that OLs detect high-frequency axonal activity through elevated , leading to depolarization through Kir4.1 channels and entry chiefly by reverse-mode activation of NCX (Fig. 2h).
Given that OLs respond to fast axonal spiking through Kir4.1 channel activation, we speculated that this -driven stimulation could regulate metabolite supply to axons (for example, on-demand lactate delivery). To test this, we expressed the lactate sensor Laconic in optic nerve axons using intravitreal AAV delivery (Fig. 3a). Initial tests in wild-type nerves showed that increasing extracellular lactate levels increased axonal lactate levels (Fig. 3a,b), confirming the expression of lactate transporters in axons. Removal of glucose and lactate from the ACSF significantly reduced axonal lactate levels (Fig. 3a,b). Hence, the Laconic sensor is not saturated at baseline, and its dynamic range allows for studying axonal lactate dynamics. Notably, axonal lactate levels increased during high-frequency spiking, more prominently at higher stimulation frequencies (Fig. 3c,d). To see whether elevated alone could increase axonal lactate independently of spiking, we used TTX to inhibit axonal activity and the associated workload increase. Indeed, stimulation increased axonal lactate levels, which was mediated by Kir4.1 activity (Extended Data Fig. 5e). Importantly, Kir4.1 inhibition with specifically diminished the stimulus-evoked OL response but did not affect the axonal surge (Fig. 2c and Extended Data Fig. 3d) and thus the axonal workload upon spiking. Yet, reduced the activity-induced increase in axonal lactate levels by (Fig. 3e,f). This implies that -mediated axon-OL signaling facilitates lactate supply to axons during active spiking.
To investigate whether oligodendroglial Kir4.1 specifically controls axonal lactate dynamics, we used Kir4.1 cKO mice (Fig. 3g and Extended Data Fig. 6). First, we inspected optic nerves from -month-old Kir4.1 cKO mice and littermate controls (Kir4. ). We found no differences in CAP peak latencies or nerve excitability (Extended Data Fig. 6a-c).Additionally, we observed no overt changes in myelin sheath thickness and the diameter distribution of myelinated axons (Extended Data Fig. 6d-f). At this age, no signs of axonal damage or neuroinflammation were observed (Extended Data Fig. 6d,g,h). The -mediated impact on delaying CAP peak recovery (Extended Data Fig. 3f) could involve Kir4.1-mediated clearance by OLs and/or astrocytes . Notably, Kir4.1cKO nerves showed significantly slower kinetics of CAP peak recovery after high-frequency stimulation compared to littermate controls (Extended Data Fig. 6i,j), confirming earlier results . Interestingly, wild-type nerves treated with showed the same recovery delays as Kir4.1 cKO nerves (Extended Data Fig. 6i,j), implying that oligodendroglial Kir4.1 is primarily involved in buffering in the adult white matter, with little to no contribution of astrocytic Kir4.1 or other -sensitive Kir channels. The recovery kinetics of CAP peak latency were also affected in Kir4.1 cKO nerves (Extended Data Fig. 7a-d). Poststimulation CAP recovery deficits were also visible at 25 and 10 Hz (Extended Data Fig. 7e-p), demonstrating that oligodendroglial Kir4.1 also governs activity-dependent clearance at lower frequencies.
We then examined axonal lactate dynamics and found that both the resting lactate levels (at stimulation) and the high-frequency-evoked lactate surge were notably reduced in Kir4.1 cKO nerves compared to controls (Fig. 3h-j). Basal axonal lactate levels were compared after normalizing the Förster resonance energy transfer (FRET) ratios to minimal lactate levels after glucose deprivation (GD; Fig. 3h,i). Lower lactate levels in Kir4.1 cKO axons might stem from decreased OL lactate supply, altered axonal glycolysis or heightened
lactate consumption. The latter seems unlikely, as lactate decay during GD was not faster but marginally slower in cKO mice than in controls (Fig. 3h,k). This is further corroborated by a similar CAP decline rate during GD (Fig. 3l). The two genotypes showed the same latency between lactate depletion and CAP decline (Fig.3m). Notably, the CAP drop was observed only when axonal lactate neared depletion (Fig.3m). Given the concurrent decline of CAP and ATP levels during GD , this suggests that axonal lactate fuels ATP for action potentials and axons cease firing as lactate supply dwindles, leading to CAP decline (Fig.3m). This also implies comparable axonal mitochondrial respiration between the genotypes.
Reduced MCT1 and GLUT1 in central nervous system myelin of Kir4.1 cKO mice
Loss of oligodendroglial Kir4.1 may affect axonal integrity with age . Electron microscopy (EM) at age 3 months revealed no signs of impaired axonal integrity in Kir4.1cKO mice, with normal myelin thickness and axonal diameters (Extended Data Fig. 6d-f). However, by 7-8 months, there was a significant increase in axon/myelin profiles indicative of axonal degeneration, including giant axonal swellings (Extended Data Fig. 8a-c). The age-dependent axonopathy in cKO mice occurred without noticeable myelin abnormalities or thinning (Extended Data Fig. 8d,e). Additionally, increased glial fibrillary acidic protein (GFAP) immunolabeling was observed, consistent with secondary astrocytic reactivity; however, there was no increase in ionized calcium-binding adaptor molecule1 (IBA1) immunopositivity, suggesting no microgliosis (Extended Data Fig. 8f,g).
The absence of oligodendroglial Kir4.1 in young mice appears to affect axonal energy metabolism before axonal pathology onset. This aligns with the lower axonal lactate levels observed in young cKO nerves, which did not show axonal damage or neuroinflammation. Both pharmacological inhibition and genetic inactivation of Kir4.1 affected the stimulus-evoked axonal lactate surge, but the lower basal lactate level was an additional feature of cKO mice. Besides regulating acute metabolic coupling, oligodendroglial Kir4.1 may also contribute to adjusting the axon-OL metabolic unit. To explore the metabolic changes from Kir4.1 deficiency further, we performed tandem mass tag (TMT)-based quantitative proteomics on optic nerve lysates from 2.5 -month-old Kir4.1 cKO mice and littermate controls (Fig. 4a, Extended Data Fig. 9a and Supplementary Data 1). Expectedly, Kir4.1 (Kcnj1O) protein levels were lower in the cKO group (Fig. 4b and Extended Data Fig. 9b). Among the top 50 proteins sorted by the false discovery rate (FDR), those associated with vesicular transport and energy metabolism showed reduced levels (Fig. 4b). Gene set enrichment and pathway analyses revealed declines in transmembrane transporter activity, vesicular transport and oxidative phosphorylation pathways (Fig. 4c,d). A lower abundance of MCT1 (Slc16a1; Fig. 4b and Extended Data Fig. 9c) and GLUT1 (Slc2a1; Extended Data Fig. 9d) was observed, but there was no change in the glucose transporter GLUT3 (Slc2a3; Extended Data Fig. 9e). Additional qPCR analysis indicated a slight decrease in Slc2a1 mRNA but not in Slc16a1 mRNA (Extended Data Fig. 8f), implying that changes in transporter abundance might not be solely due to gene expression alterations. Immunoblotting of myelin purified from cKO brains revealed an approximately 50% reduction in both GLUT1 and MCT1 abundance (Fig. 4e). Hence, Kir4.1 loss affected the relative abundance of metabolite transporters in OLs. and Kir4.1-mediated signaling could influence gene expression, protein synthesis, surface trafficking and/or turnover of metabolite transporters in OLs. This might result in adaptations aligning the support machinery of OLs to axonal activity levels.
Minor changes in axonal ATP dynamics in Kir4.1 cKO mice
Proteomics analysis indicated alterations in oxidative phosphorylation pathways, leading us to question whether cKO mice also exhibit changes in axonal ATP homeostasis. To investigate this, we expressed
Fig. 4 | MCT1 and GLUT1 levels are reduced in central nervous system myelin of Kir4.1 cKO mice. a, TMT-based proteomics analysis in optic nerves from 2.5 -month-old and littermate control mice. The scheme (generated by BioRender) shows extraction, digestion, TMT labeling and pooling for liquid chromatography-tandem mass spectrometry (LC-MS/MS). b, Top 50 (sorted by FDR) differentially regulated proteins listed with gene names. The heat map shows upregulation (red) or downregulation (blue) in cKO versus control ranked by (fold change), including only proteins with fold change or . Row scores were calculated from normalized intensities. c,d, Gene set enrichment analyses (GSEAs) for the categories Gene Ontology (GO) molecular function (c) and pathway Kyoto Encyclopedia of Genes and Genomes (KEGG) (d) showed decreases in transmembrane transporter activity, vesicular transport and energy metabolism (FDR < 0.05). Analysis was performed
through WebGestalt.org, with proteins ranked by (fold change). SNAP, soluble -ethylmaleimide-sensitive factor attachment protein; SNARE, SNAP receptor. e, Left, immunoblot analysis of Kir4.1, MCT1 and GLUT1 in myelin biochemically purified from the brains of 2.5 -month-old control ( ) and mice. M, molecular weight marker. Right, compared to controls (gray), cKO mice (red) showed a reduced abundance of Kir4.1 by , GLUT1 by and MCT1 by , two-sided unpaired test). Known myelin proteins PLP, 2′,3′-cyclic nucleotide 3′-phosphodiesterase (CNP), myelin oligodendrocyte glycoprotein (MOG), ATPase transporting subunit (ATP1 ) and ATP1 were detected as markers. Note that the MOG abundance was reduced by ( , two-sided unpaired test), attributed to Cre insertion under the MOG promoter in heterozygous MOGiCre mice inactivating one mog allele. Data are represented as mean s.e.m.
the ATP sensor ATeam1.03 (ref. 52) in axons through intravitreal AAV delivery . First, we assessed basal axonal ATP levels by normalizing the FRET ratios at stimulation in 10 mM glucose against ratios after
GD and mitochondrial respiration inhibition (MI) using 5 mM sodium azide to deplete axonal ATP levels (Fig. 5a-c). No genotype difference in basal axonal ATP levels was observed (Fig. 5c). The ATP
Fig. 5| Minor changes in axonal ATP dynamics in the absence of oligodendroglial Kir4.1. a, AAV-mediated ATP FRET sensor (ATeam1.03) expression in optic nerve axons. Color-coded ratio images from control (top) and cKO (bottom) nerves show ATP levels in ACSF with 10 mM glucose and after GD + MI with . hSyn1, human synapsin 1; mseCFP, monomeric superenhanced cyan fluorescent protein. b, Time course of axonal ATP levels in -month-old cKO ( ) and control ( ) mice challenged with GD + MI, normalized to the minimum ATP level ( ). Inset, initial ATP recovery dynamics following reperfusion with 10 mM glucose. , Basal axonal ATP levels were comparable between genotypes ( mice, , two-sided unpaired test). d, No difference in the ATP decline rate between genotypes upon GD + MI ( mice, , two-sided unpaired test). e, Similar initial ATP recovery rates
between genotypes after GD +MI ( mice, , two-sided unpaired test).f, Onset of ATP recovery (see dashed arrows in inset in ) differed between control and cKO nerves ( mice, , two-sided unpaired test). g, Lower axonal ATP level recovery in cKO than in controls following GD +MI ( mice, * , two-sided unpaired test). h, Axonal ATP level changes (%) at stimulation relative to baseline. i, j, Similar ATP level decline rates (i) during stimulation ( mice, , two-sided unpaired test) and equal initial ATP recovery rates ( ) after stimulation ( , two-sided unpaired test). k, Slightly lower axonal ATP level recovery after stimulation in cKO versus controls ( mice, , two-sided unpaired test). Data are represented as mean s.e.m.
decline rate during GD + MI was also comparable between genotypes (Fig. 5b,d), and the ATP recovery rate after washout and 10 mM glucose reperfusion was unaffected (Fig.5e). Interestingly, cKO nerves showed a marginally quicker onset of ATP recovery compared to controls (Fig. 5b,f); however, after 15-20 min, the ATP levels in control nerves almost completely returned to baseline levels, whereas cKO nerve recovery was incomplete (Fig. 5b,g).
The minor deficit in ATP recovery prompted us to examine axonal firing recovery in cKO mice further. The rapid decline in the CAP area
after GD + MI, indicating axonal conduction block, was comparable between genotypes, and the onset and recovery kinetics of axonal firing appeared unchanged (Extended Data Fig. 10a). The analysis of the partial CAP (pCAP) area, which reflects the dynamics of the first and second CAP peaks , showed comparable decline rates upon GD + MI, whereas pCAP recovery dynamics differed between genotypes (Extended Data Fig.10b). Closer inspection of CAP waveforms revealed a striking difference in the recovery kinetics of peak latency (Extended Data Fig.10c). In controls, the CAP peak amplitude increased gradually as the peak
Fig. 6 | Lack of oligodendroglial Kir4.1 impairs axonal glucose metabolism.
a, AAV-mediated glucose FRET sensor (FLIIP) expression in optic nerve axons. Color-coded ratio images from control (top) and cKO (bottom) nerves show glucose levels in ACSF with 10 mM glucose and after GD. eYFP, enhanced yellow fluorescent protein; eCFP, enhanced cyan fluorescent protein.b, Time course of axonal glucose levels in -month-old and control ( ) mice during perfusion with regular and zero-glucose ACSF, with 10 mM lactate to sustain CAPs. Traces were normalized to the minimum level after GD. c, Comparable basal axonal glucose levels between genotypes (control , cKO , two-sided unpaired test). d,e, Glycolysis inhibition (d, left) with
IA ( 1 mM ) in ACSF with 10 mM glucose increased axonal glucose levels ( , right). e, Glucose increase rate (dashed lines in d) upon IA was lower in cKO ( mice) by compared to controls ( mice; , two-sided unpaired test).f,g, Glucose consumption assessed with CytoB ( ) during stimulation. f, Scheme (left) and time course (right) of glucose level decline upon CytoB treatment for control ( ) and mice, with mean decline rates (dashed lines) of and , respectively. g, Basal axonal glucose consumption rate in cKO mice ( ) was reduced by compared to controls ( mice; , two-sided unpaired test). Data are represented as mean s.e.m.
latency decreased; however, this peak latency shift (increase in conduction velocity) was markedly reduced in cKO nerves (Extended Data Fig. 10d), indicating a deficit in adjusting conduction speed following acute energy deprivation. Given that chemical ischemia increases and affects oligodendroglial conductance clearance by OLs upon axon reenergization could be crucial for
adjusting conduction speeds. This impaired speed adjustment might contribute to the reduced ATP recovery in cKO axons after chemical ischemia (Fig. 5b,g).
As the recovery of CAP peak latencies after high-frequency stimulation was reduced in cKO mice (Extended Data Fig. 7), we wondered whether this also correlates with axonal ATP recovery. We thus
Fig. 7|Activity-induced axonal glucose consumption rate is reduced in Kir4.1 cKO mice. a, Time-course traces of -evoked axonal glucose dynamics showing differences in glucose level changes between cKO ( ) and control ( ) mice. , During stimulation, glucose levels decreased at a rate of in controls ( ) but remained stable ( ) in cKO ( , two-sided unpaired test). c, After stimulation, glucose levels increased above the initial baseline values in both genotypes but were significantly higher in cKO ( ) than in controls ( , two-sided unpaired test). d-g, Assessment of glucose consumption rate
changes from 0.1- to stimulations in control ( ) and mice. d, Decline slopes are indicated by dashed lines. e, Axonal glucose consumption rates significantly increased upon stimulation (Stim 50 Hz ) in controls ( 0.1 versus , two-sided paired test) and in cKO ( 0.1 versus 50 Hz , , two-sided paired test). f, Glucose consumption rate during stimulation was lower in cKO than in controls ( , two-sided unpaired test). g, Fold change in glucose consumption from 0.1 to 50 Hz was comparable between genotypes ( in controls and in , two-sided unpaired test). Data are represented as mean s.e.m.
measured ATP dynamics during and after stimulation (Fig. . The rate and extent of decreases in axonal ATP levels during high-frequency stimulation were comparable between genotypes (Fig. 5h,i). The initial ATP recovery rate after stimulation was also unchanged (Fig. 5h, j). However, into the recovery phase, cKO axons showed a slightly lower ATP rebound compared to initial baseline values (Fig. 5h,k). Hence, the absence of Kir4.1 and the lower K clearance rate might increase the energy burden on axons following high-frequency activity or chemical ischemia.
Reduced axonal glucose metabolism in Kir4.1 cKO mice
The lower axonal lactate levels and activity-induced lactate surges in Kir4.1 cKO mice reflect reduced oligodendroglial metabolic support. Recent findings indicate that, besides lactate, OLs may supply axons with glucose . However, the regulation of glucose uptake and glycolysis in myelinated axons and the potential contribution of OLs remain elusive. To study glucose dynamics, we expressed the glucose sensor FLIIP in optic nerve axons through intravitreal AAV delivery (Fig. 6a). The basal axonal glucose levels (at stimulation) were comparable between genotypes, with basal levels derived by normalizing FRET ratios in ACSF with 10 mM glucose against the minimum levels after GD (Fig. 6a-c). To assess the sensor’s range, we applied IA to inhibit glycolysis, leading to a increase in glucose levels in both genotypes (Fig. 6d). However, the rate of axonal glucose increase
was slower in cKO nerves than in controls (Fig. 6d,e), hinting at a lower glucose uptake or hexokinase activity. Measuring glycolytic flux using CytoB, we found a 37% reduction in axonal glucose consumption in cKO nerves (Fig. 6f,g). This implies a similarly decreased glucose uptake in cKO axons to maintain equal basal glucose levels as controls (Fig. 6c), explaining the slower glucose increase with IA treatment (Fig. 6d,e).
While testing whether axonal glucose dynamics differed during stimulation, we observed that glucose levels decreased in control axons but remained steady in cKO axons (Fig. 7a,b). This indicates a stronger activation of glycolysis relative to glucose uptake in control axons but being balanced in cKO axons. After stimulation, glucose levels increased above baseline in both groups (Fig. 7a,c), implying continued glucose uptake activation after stimulation ended. The difference in glucose dynamics during high-frequency activity may result from a lower activation of glucose consumption in cKO compared to controls. Indeed, stimulation increased axonal glucose consumption compared to basal (at stimulation) glycolytic activity (Fig. 7d,e), but this increase was less in cKO axons (Fig. 7f). Interestingly, both control and cKO nerves exhibited an eightfold increase in glucose consumption rate under stimulation (Fig. 7g). Therefore, although the glycolytic activation machinery remains intact in cKO axons, their overall glucose metabolism is reduced by approximately , both at rest and during activity.
Fig. 8|Activity-mediated model of axon-OL metabolic coupling. The scheme shows a working model in which axon-OL communication and metabolic coupling in the white matter are controlled by and Kir4.1-mediated signaling. Fast axonal spiking induces a rapid increase in and glycolysis. OLs primarily detect axonal activity through elevated and activation of Kir4.1 channels. This -mediated signaling facilitates the supply of lactate (or pyruvate) to axons. Apart from regulating acute metabolic coupling, oligodendroglial Kir4.1 adjusts the myelinic levels of MCT1 and GLUT1. In addition to lactate, OLs might supply axons with glucose and/or modulate axonal
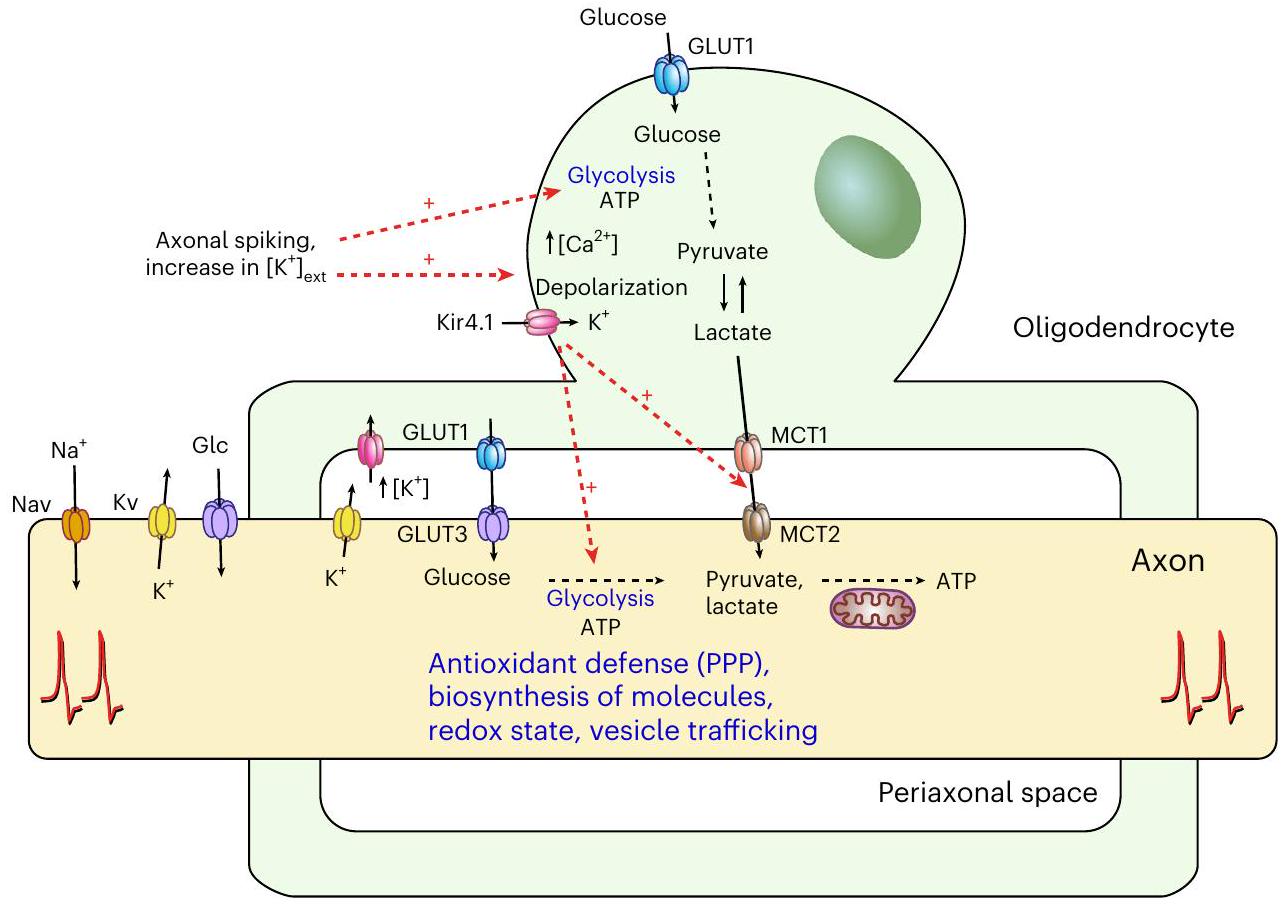
glucose uptake at the nodes of Ranvier. Oligodendroglial homeostasis also influences axonal glycolysis, which is likely critical for preserving axonal integrity through various glucose metabolism-dependent processes, such as antioxidant protection through the pentose phosphate pathway (PPP), biosynthesis of molecules required for structure and function, regulation of the redox state, and vesicular transport. The potential contribution of astrocytes as a source of (glycogen-derived) lactate (or pyruvate) for axons is not depicted in this scheme, pending future studies. Nav, voltage-gated sodium channel; Kv, voltage-gated potassium channel.
Consequently, we conclude that OLs regulate axonal glucose uptake and consumption, a unique metabolic OL-axon interaction that requires Kir4.1 function.
Discussion
Loss of axonal integrity may result from dysfunctions in the axon-OL unit . This study underscores the critical role of OLs in maintaining axonal health. We revealed that OLs respond to fast axonal spiking by initiating signaling and glycolysis. OLs detect axonal spiking predominantly through and Kir4.1 channel activation. This axon-OL signaling mechanism facilitates the supply of metabolites to axons. Disruptions in Kir4.1, whether through pharmacological inhibition or OL-specific inactivation, impaired the activity-induced lactate surges in axons. Lack of oligodendroglial Kir4.1 reduced the myelinic abundance of GLUT1 and MCT1, leading to decreased axonal lactate levels and glucose metabolism. These early metabolic deficits in axons are linked to late-onset axonal damage. We provide a working model in which signaling through oligodendroglial Kir4.1 governs metabolic coupling in the white matter (Fig.8), affecting axonal energy metabolism, function and survival.
Transient increases in are a hallmark of axonal activity. OLs, highly permeable to , depolarize with elevations in (ref. 25) and axonal spiking , facilitated by -sensitive Kir channels , of which Kir4.1 is predominantly expressed by OLs . Our results suggest that Kir4.1-mediated uptake is pivotal in triggering influx in OL somas, facilitated by membrane depolarization and reverse-mode NCX activation. This -driven signaling regulates metabolic coupling between OLs and axons. Other activity signals, such as glutamate, may induce activity in microdomains along internodes , probably
aiding in OL differentiation during development and GLUT1 surface expression . In zebrafish, myelin sheaths of new OLs show signals in response to neuronal activity . However, in developing mouse OLs, transients were reported to occur independent of cortical neuron activity . We found that, in mouse optic nerves, signaling in mature OLs is elicited chiefly through surges during high-frequency axonal firing. is released at the nodes of Ranvier and along juxtaparanodal domains under the myelin sheath . Activity-mediated accumulation around OLs is possibly more pronounced in fully myelinated adult white matter than in sparsely myelinated cortical regions, which merits further investigation. Upon detecting heightened axonal activity, OLs promptly enhance glucose consumption and provide lactate or pyruvate on demand (Fig.8). This process is likely triggered by and Kir4.1 activation. Inhibiting Kir4.1, which specifically disrupts axon-OL signaling, reduced the stimulus- and -evoked lactate surge in axons. Notably, the pharmacological methods used to evaluate lactate dynamics did not affect axonal activity or workload, which could affect axonal metabolism. Hence, axonal lactate surges involve OL metabolic support, as further evidenced by diminished stimulus-evoked lactate increases in OL-specific Kir4.1 knockouts. increases can accelerate glycolysis and promote lactate release through proton-linked monocarboxylate transporters . Hence, a proton increase in OLs, linked to (ref. 53) and Kir4.1 activity , may facilitate lactate release. Further research is required to clarify a -driven lactate or pyruvate release mechanism in OLs. Additionally, the contributing role of astrocytes , specifically in the white matter , needs more exploration. Embryonic deletion of Kir4.1 from both astrocytes and OL lineage cells causes severe white matter pathology, including myelin vacuole formation .
However, the OL lineage-specific deletion of Kir4.1 is devoid of myelin abnormalities , which is partly confirmed by this study. Consequently, astrocytic Kir4.1 and siphoning, likely involving gapjunction coupling to , are critical during white matter development. Yet, in the adult white matter, the glial syncytium appears less critical for homeostasis . The CAP recordings in this study suggest that OLs may independently handle the activity-induced clearance in adult optic nerves. Beyond acute metabolic coupling, oligodendroglial Kir4.1 may also adjust the support machinery of OLs, indicated by reduced myelinic GLUT1 and MCT1 levels in Kir4.1 cKO mice. Optic nerve proteome analysis revealed a decrease in proteins essential for intracellular membrane trafficking, including vesicle-associated membrane protein 2 (VAMP2), VAMP3, Ras-related protein Rab-2B (RAB2B) and RAB5A, reported to be expressed by mature OLs , implicating Kir4.1 in regulating metabolite transporter trafficking . Previous research has linked a 50-80% decrease in myelinic MCT1 or GLUT1 levels to late-onset axonal pathology in mice, typically emerging between 8 and 24 months of age . In this study, Kir4.1 cKO mice showed signs of axonopathy at 7-8 months, preceded by a 50% reduction in both GLUT1 and MCT1 levels at 2-3 months. Moreover, this is associated with early deficits in axonal energy metabolism. In young Kir4.1 cKO mice, axons exhibited lower basal lactate levels and reduced glucose uptake and consumption. These deficits likely result from impaired OL metabolite supply and axonal glucose metabolism. Despite these metabolic changes, axonal ATP homeostasis appeared unaffected. Notably, glucose metabolism is crucial for various cellular functions beyond ATP production , including antioxidant protection through the pentose phosphate pathway and providing glycolytic intermediates for vital structural and functional molecules (Fig. 8). Additionally, axonal glycolysis is key to sustaining fast axonal transport . Hence, impaired axonal glucose metabolism might affect axonal transport and increase vulnerability to oxidative stress, potentially leading to axonal damage with age. The metabolic alterations in the axons of Kir4.1cKO mice are unlikely due to impaired clearance. Extracellular accumulation, secondary to defective clearance, should increase axonal workload and stimulateglucose metabolism , yet Kir4.1cKO axons showed decreased glucose metabolism. The primary impact of impaired clearance was seen on the speed of CAP peak recovery following high-frequency stimulation, not at basal activity levels. Hence, the reduced lactate levels and glucose metabolism in axons at basal activity are more likely due to deficits in the axon-OL metabolic unit. Furthermore, the unchanged axonal ATP dynamics in cKO mice indicate stable axonal energy demand during spiking. Consequently, the reduced stimulus-evoked lactate and glucose dynamics were not influenced by acute changes in axonal workload. We also found normal mitochondrial respiration in the axons of Kir4.1cKO mice, with no signs of inflammation or glial activation affecting axonal metabolism at a young age. Notably, this study uncovered that OLs have a crucial role in regulating axonal glucose metabolism, including both uptake and consumption. Experiments in corpus callosum slices have shown that glucose loading in OLs could sustain callosal CAPs in aglycemia conditions, indicating OLs’ ability to transfer glucose to axons . The reduced myelinic GLUT1 abundance, along with reduced glucose uptake in cKO axons, suggests that OLs and myelin affect glucose delivery to axons. The influence of OLs on axonal glycolysis needs further investigation. OLs could affect axonal energy homeostasis through exosome signaling . Yet, whether and Kir4.1 functions are involved in exosome release, similar to glutamate signaling , remains to be seen. Considering the role of the pump in regulating neuronal energy metabolism , adaptations in axonal pumps might influence axonal glycolysis. Conclusively, this study underscores the intricate metabolic interactions between OLs and axons, inviting further exploration into the regulation of axonal glucose metabolism, which could have implications for axonal degeneration in aging and neurodegenerative disease.
Online content
Any methods, additional references, Nature Portfolio reporting summaries, source data, extended data, supplementary information, acknowledgements, peer review information; details of author contributions and competing interests; and statements of data and code availability are available at https://doi.org/10.1038/s41593-023-01558-3.
References
Salvadores, N., Sanhueza, M., Manque, P. & Court, F. A. Axonal degeneration during aging and its functional role in neurodegenerative disorders. Front. Neurosci. 11, 451 (2017).
Medana, I. M. & Esiri, M. M. Axonal damage: a key predictor of outcome in human CNS diseases. Brain 126, 515-530 (2003).
Saab, A. S., Tzvetanova, I. D. & Nave, K.-A. The role of myelin and oligodendrocytes in axonal energy metabolism. Curr. Opin. Neurobiol. 23, 1065-1072 (2013).
Nave, K.-A. Myelination and the trophic support of long axons. Nat. Rev. Neurosci. 11, 275-283 (2010).
Philips, T. & Rothstein, J. D. Oligodendroglia: metabolic supporters of neurons. J. Clin. Invest. 127, 3271-3280 (2017).
Duncan, G. J., Simkins, T. J. & Emery, B. Neuron-oligodendrocyte interactions in the structure and integrity of axons. Front. Cell Dev. Biol. 9, 653101 (2021).
Xin, W. & Chan, J. R. Myelin plasticity: sculpting circuits in learning and memory. Nat. Rev. Neurosci. 21, 682-694 (2020).
Fünfschilling, U. et al. Glycolytic oligodendrocytes maintain myelin and long-term axonal integrity. Nature 485, 517-521 (2012).
Lee, Y. et al. Oligodendroglia metabolically support axons and contribute to neurodegeneration. Nature 487, 443-448 (2012).
Saab, A. S. et al. Oligodendroglial NMDA receptors regulate glucose import and axonal energy metabolism. Neuron 91, 119-132 (2016).
Trevisiol, A. et al. Monitoring ATP dynamics in electrically active white matter tracts. eLife 6, e24241 (2017).
Tekkök, S. B., Brown, A. M., Westenbroek, R., Pellerin, L. & Ransom, B. R. Transfer of glycogen-derived lactate from astrocytes to axons via specific monocarboxylate transporters supports mouse optic nerve activity. J. Neurosci. Res. 81, 644-652 (2005).
Philips, T. et al. MCT1 deletion in oligodendrocyte lineage cells causes late-onset hypomyelination and axonal degeneration. Cell Rep. 34, 108610 (2021).
Edgar, J. M. et al. Río-Hortega’s drawings revisited with fluorescent protein defines a cytoplasm-filled channel system of CNS myelin. J. Anat. 239, 1241-1255 (2021).
Saab, A. S. & Nave, K.-A. Myelin dynamics: protecting and shaping neuronal functions. Curr. Opin. Neurobiol. 47, 104-112 (2017).
Snaidero, N. et al. Antagonistic functions of MBP and CNP establish cytosolic channels in CNS myelin. Cell Rep. 18, 314-323 (2017).
Griffiths, I. et al. Axonal swellings and degeneration in mice lacking the major proteolipid of myelin. Science 280, 1610-1613 (1998).
Lüders, K. A. et al. Maintenance of high proteolipid protein level in adult central nervous system myelin is required to preserve the integrity of myelin and axons. Glia 67, 634-649 (2019).
Edgar, J. M. et al. Oligodendroglial modulation of fast axonal transport in a mouse model of hereditary spastic paraplegia. J. Cell Biol. 166, 121-131 (2004).
Steyer, A. M. et al. Pathology of myelinated axons in the PLP-deficient mouse model of spastic paraplegia type 2 revealed by volume imaging using focused ion beam-scanning electron microscopy. J. Struct. Biol. 210, 107492 (2020).
Trevisiol, A. et al. Structural myelin defects are associated with low axonal ATP levels but rapid recovery from energy deprivation in a mouse model of spastic paraplegia. PLoS Biol. 18, e3000943 (2020).
Mukherjee, C. et al. Oligodendrocytes provide antioxidant defense function for neurons by secreting ferritin heavy chain. Cell Metab. 32, 259-272 (2020).
Larson, V. A. et al. Oligodendrocytes control potassium accumulation in white matter and seizure susceptibility. eLife 7, e34829 (2018).
Schirmer, L. et al. Oligodendrocyte-encoded Kir4.1 function is required for axonal integrity. eLife 7, e36428 (2018).
Kettenmann, H., Sonnhof, U. & Schachner, M. Exclusive potassium dependence of the membrane potential in cultured mouse oligodendrocytes. J. Neurosci. 3, 500-505 (1983).
Yamazaki, Y. et al. Modulatory effects of oligodendrocytes on the conduction velocity of action potentials along axons in the alveus of the rat hippocampal CA1 region. Neuron Glia Biol. 3, 325-334 (2007).
Battefeld, A., Klooster, J. & Kole, M. H. P. Myelinating satellite oligodendrocytes are integrated in a glial syncytium constraining neuronal high-frequency activity. Nat. Commun. 7, 11298 (2016).
Looser, Z. J., Barrett, M. J. P., Hirrlinger, J., Weber, B. & Saab, A. S. Intravitreal AAV-delivery of genetically encoded sensors enabling simultaneous two-photon imaging and electrophysiology of optic nerve axons. Front. Cell. Neurosci. 12, 377 (2018).
Doerflinger, N. H., Macklin, W. B. & Popko, B. Inducible site-specific recombination in myelinating cells. Genesis 35, 63-72 (2003).
Madisen, L. et al. Transgenic mice for intersectional targeting of neural sensors and effectors with high specificity and performance. Neuron 85, 942-958 (2015).
Chen, T.-W. et al. Ultrasensitive fluorescent proteins for imaging neuronal activity. Nature 499, 295-300 (2013).
Takanaga, H., Chaudhuri, B. & Frommer, W. B. GLUT1 and GLUT9 as major contributors to glucose influx in HepG2 cells identified by a high sensitivity intramolecular FRET glucose sensor. Biochim. Biophys. Acta 1778, 1091-1099 (2008).
Bittner, C. X. et al. High resolution measurement of the glycolytic rate. Front. Neuroenergetics 2, 26 (2010).
Bittner, C. X. et al. Fast and reversible stimulation of astrocytic glycolysis by and a delayed and persistent effect of glutamate. J. Neurosci. 31, 4709-4713 (2011).
Micu, I. et al. The molecular physiology of the axo-myelinic synapse. Exp. Neurol. 276, 41-50 (2016).
Micu, I. et al. NMDA receptors mediate calcium accumulation in myelin during chemical ischaemia. Nature 439, 988-992 (2006).
James, G. & Butt, A. M. P2X and P2Y purinoreceptors mediate ATP-evoked calcium signalling in optic nerve glia in situ. Cell Calcium 30, 251-259 (2001).
Kirischuk, S., Scherer, J., Kettenmann, H. & Verkhratsky, A. Activation of P2-purinoreceptors triggered release from InsP3-sensitive internal stores in mammalian oligodendrocytes. J. Physiol. 483, 41-57 (1995).
Matute, C. et al. P2X(7) receptor blockade prevents ATP excitotoxicity in oligodendrocytes and ameliorates experimental autoimmune encephalomyelitis. J. Neurosci. 27, 9525-9533 (2007).
Stevens, B., Porta, S., Haak, L. L., Gallo, V. & Fields, R. D. Adenosine: a neuron-glial transmitter promoting myelination in the CNS in response to action potentials. Neuron 36, 855-868 (2002).
Ransom, C. B., Ransom, B. R. & Sontheimer, H. Activity-dependent extracellular accumulation in rat optic nerve: the role of glial and axonal pumps. J. Physiol. 522, 427-442 (2000).
Bay, V. & Butt, A. M. Relationship between glial potassium regulation and axon excitability: a role for glial Kir4.1 channels. Glia 60, 651-660 (2012).
Olsen, M. L. & Sontheimer, H. Functional implications for Kir4.1 channels in glial biology: from buffering to cell differentiation. J. Neurochem. 107, 589-601 (2008).
Boscia, F. et al. Silencing or knocking out the exchanger-3 (NCX3) impairs oligodendrocyte differentiation. Cell Death Differ. 19, 562-572 (2012).
Casamassa, A. et al. Ncx3 gene ablation impairs oligodendrocyte precursor response and increases susceptibility to experimental autoimmune encephalomyelitis. Glia 64, 1124-1137 (2016).
Spencer, S. A., Suárez-Pozos, E., Escalante, M., Myo, Y. P. & Fuss, B. Sodium-calcium exchangers of the SLC8 family in oligodendrocytes: functional properties in health and disease. Neurochem. Res. 45, 1287-1297 (2020).
Friess, M. et al. Intracellular ion signaling influences myelin basic protein synthesis in oligodendrocyte precursor cells. Cell Calcium 60, 322-330 (2016).
Moyon, S. et al. TET1-mediated DNA hydroxymethylation regulates adult remyelination in mice. Nat. Commun. 12, 3359 (2021).
Yamazaki, Y., Abe, Y., Fujii, S. & Tanaka, K. F. Oligodendrocytic co-transporter 1 activity facilitates axonal conduction and restores plasticity in the adult mouse brain. Nat. Commun. 12, 5146 (2021).
San Martín, A. et al. A genetically encoded FRET lactate sensor and its use to detect the Warburg effect in single cancer cells. PLoS ONE 8, e57712 (2013).
Djukic, B., Casper, K. B., Philpot, B. D., Chin, L.-S. & McCarthy, K. D. Conditional knock-out of leads to glial membrane depolarization, inhibition of potassium and glutamate uptake, and enhanced short-term synaptic potentiation. J. Neurosci. 27, 11354-11365 (2007).
Imamura, H. et al. Visualization of ATP levels inside single living cells with fluorescence resonance energy transfer-based genetically encoded indicators. Proc. Natl Acad. Sci. USA 106, 15651-15656 (2009).
Hamilton, N. B., Kolodziejczyk, K., Kougioumtzidou, E. & Attwell, D. Proton-gated -permeable TRP channels damage myelin in conditions mimicking ischaemia. Nature 529, 523-527 (2016).
Meyer, N. et al. Oligodendrocytes in the mouse corpus callosum maintain axonal function by delivery of glucose. Cell Rep. 22, 2383-2394 (2018).
Zhang, X. et al. Oligodendroglial glycolytic stress triggers inflammasome activation and neuropathology in Alzheimer’s disease. Sci. Adv. 6, eabb8680 (2020).
Mot, A. I., Depp, C. & Nave, K.-A. An emerging role of dysfunctional axon-oligodendrocyte coupling in neurodegenerative diseases. Dialogues Clin. Neurosci. 20, 283-292 (2018).
Kenigsbuch, M. et al. A shared disease-associated oligodendrocyte signature among multiple CNS pathologies. Nat. Neurosci. 25, 876-886 (2022).
Kaya, T. et al. cells induce interferon-responsive oligodendrocytes and microglia in white matter aging. Nat. Neurosci. 25, 1446-1457 (2022).
Brasko, C., Hawkins, V., De La Rocha, I. C. & Butt, A. M. Expression of Kir4.1 and Kir5.1 inwardly rectifying potassium channels in oligodendrocytes, the myelinating cells of the CNS. Brain Struct. Funct. 222, 41-59 (2017).
Papanikolaou, M., Butt, A. M. & Lewis, A. A critical role for the inward rectifying potassium channel Kir7.1 in oligodendrocytes of the mouse optic nerve. Brain Struct. Funct. 225, 925-934 (2020).
Almeida, R. G. et al. Myelination induces axonal hotspots of synaptic vesicle fusion that promote sheath growth. Curr. Biol. 31, 3743-3754 (2021).
Micu, I., Plemel, J. R., Caprariello, A. V., Nave, K. A. & Stys, P. K. Axo-myelinic neurotransmission: a novel mode of cell signalling in the central nervous system. Nat. Rev. Neurosci. 19, 49-58 (2018).
Hines, J. H., Ravanelli, A. M., Schwindt, R., Scott, E. K. & Appel, B. Neuronal activity biases axon selection for myelination in vivo. Nat. Neurosci. 18, 683-689 (2015).
Wake, H., Lee, P. R. & Fields, R. D. Control of local protein synthesis and initial events in myelination by action potentials. Science 333, 1647-1651 (2011).
Mensch, S. et al. Synaptic vesicle release regulates myelin sheath number of individual oligodendrocytes in vivo. Nat. Neurosci. 18, 628-630 (2015).
Kukley, M., Capetillo-Zarate, E. & Dietrich, D. Vesicular glutamate release from axons in white matter. Nat. Neurosci. 10, 311-320 (2007).
Ziskin, J. L., Nishiyama, A., Rubio, M., Fukaya, M. & Bergles, D. E. Vesicular release of glutamate from unmyelinated axons in white matter. Nat. Neurosci. 10, 321-330 (2007).
Krasnow, A. M., Ford, M. C., Valdivia, L. E., Wilson, S. W. & Attwell, D. Regulation of developing myelin sheath elongation by oligodendrocyte calcium transients in vivo. Nat. Neurosci. 21, 24-28 (2018).
Baraban, M., Koudelka, S. & Lyons, D. A. activity signatures of myelin sheath formation and growth in vivo. Nat. Neurosci. 21, 19-23 (2018).
Battefeld, A., Popovic, M. A., de Vries, S. I. & Kole, M. H. P. High-frequency microdomain transients and waves during early myelin internode remodeling. Cell Rep. 26, 182-191 (2019).
Kanda, H. et al. TREK-1 and TRAAK are principal channels at the nodes of Ranvier for rapid action potential conduction on mammalian myelinated afferent nerves. Neuron 104, 960-971 (2019).
Brohawn, S. G. et al. The mechanosensitive ion channel TRAAK is localized to the mammalian node of Ranvier. eLife 8, e50403 (2019).
Rash, J. E. Molecular disruptions of the panglial syncytium block potassium siphoning and axonal saltatory conduction: pertinence to neuromyelitis optica and other demyelinating diseases of the central nervous system. Neuroscience 168, 982-1008 (2010).
Cohen, C. C. H. et al. Saltatory conduction along myelinated axons involves a periaxonal nanocircuit. Cell 180, 311-322 (2020).
Ruminot, I., Schmälzle, J., Leyton, B., Barros, L. F. & Deitmer, J. W. Tight coupling of astrocyte energy metabolism to synaptic activity revealed by genetically encoded FRET nanosensors in hippocampal tissue. J. Cereb. Blood Flow Metab. 39, 513-523 (2019).
Wang, N. et al. Potassium channel regulates oligodendrocyte differentiation via intracellular pH regulation. Glia 70, 2093-2107 (2022).
Fernández-Moncada, I. et al. Bidirectional astrocytic GLUT1 activation by elevated extracellular K. Glia 69, 1012-1021 (2021).
Zuend, M. et al. Arousal-induced cortical activity triggers lactate release from astrocytes. Nat. Metab. 2, 179-191 (2020).
Sotelo-Hitschfeld, T. et al. Channel-mediated lactate release by -stimulated astrocytes. J. Neurosci. 35, 4168-4178 (2015).
Köhler, S. et al. Gray and white matter astrocytes differ in basal metabolism but respond similarly to neuronal activity. Glia 71, 229-244 (2023).
Menichella, D. M. et al. Genetic and physiological evidence that oligodendrocyte gap junctions contribute to spatial buffering of potassium released during neuronal activity. J. Neurosci. 26, 10984-10991 (2006).
Neusch, C., Rozengurt, N., Jacobs, R. E., Lester, H. A. & Kofuji, P. Kir4.1 potassium channel subunit is crucial for oligodendrocyte development and in vivo myelination. J. Neurosci. 21, 5429-5438 (2001).
Orthmann-Murphy, J. L., Abrams, C. K. & Scherer, S. S. Gap junctions couple astrocytes and oligodendrocytes. J. Mol. Neurosci. 35, 101-116 (2008).
Hösli, L. et al. Decoupling astrocytes in adult mice impairs synaptic plasticity and spatial learning. Cell Rep. 38, 110484 (2022).
Jahn, O. et al. The CNS myelin proteome: deep profile and persistence after post-mortem delay. Front. Cell. Neurosci. 14, 239 (2020).
Zhang, Y. et al. An RNA-sequencing transcriptome and splicing database of glia, neurons, and vascular cells of the cerebral cortex. J. Neurosci. 34, 11929-11947 (2014).
Gargareta, V.-I. et al. Conservation and divergence of myelin proteome and oligodendrocyte transcriptome profiles between humans and mice. eLife 11, e77019 (2022).
Lam, M. et al. CNS myelination requires VAMP2/3-mediated membrane expansion in oligodendrocytes. Nat. Commun. 13, 5583 (2022).
Leto, D. & Saltiel, A. R. Regulation of glucose transport by insulin: traffic control of GLUT4. Nat. Rev. Mol. Cell Biol. 13, 383-396 (2012).
Martin, L. B., Shewan, A., Millar, C. A., Gould, G. W. & James, D. E. Vesicle-associated membrane protein 2 plays a specific role in the insulin-dependent trafficking of the facilitative glucose transporter GLUT4 in 3T3-L1 adipocytes. J. Biol. Chem. 273, 1444-1452 (1998).
Lodhi, I. J. et al. Gapex-5, a Rab31 guanine nucleotide exchange factor that regulates Glut4 trafficking in adipocytes. Cell Metab. 5, 59-72 (2007).
Dienel, G. A. Brain glucose metabolism: integration of energetics with function. Physiol. Rev. 99, 949-1045 (2019).
Barros, L. F. et al. Fluid brain glycolysis: limits, speed, location, moonlighting, and the fates of glycogen and lactate. Neurochem. Res. 45, 1328-1334 (2020).
Herrero-Mendez, A. et al. The bioenergetic and antioxidant status of neurons is controlled by continuous degradation of a key glycolytic enzyme by APC/C-Cdh1. Nat. Cell Biol. 11, 747-752 (2009).
Zala, D. et al. Vesicular glycolysis provides on-board energy for fast axonal transport. Cell 152, 479-491 (2013).
Baeza-Lehnert, F. et al. Non-Canonical Control of Neuronal Energy Status by the Pump. Cell Metab. 29, 668-680.e4 (2019).
Meyer, D. J., Díaz-García, C. M., Nathwani, N., Rahman, M. & Yellen, G. The pump dominates control of glycolysis in hippocampal dentate granule cells. eLife 11, e81645 (2022).
Frühbeis, C. et al. Oligodendrocytes support axonal transport and maintenance via exosome secretion. PLoS Biol. 18, e3000621 (2020).
Chamberlain, K. A. et al. Oligodendrocytes enhance axonal energy metabolism by deacetylation of mitochondrial proteins through transcellular delivery of SIRT2. Neuron 109, 3456-3472 (2021).
Frühbeis, C. et al. Neurotransmitter-triggered transfer of exosomes mediates oligodendrocyte-neuron communication. PLoS Biol. 11, e1001604 (2013).
Publisher’s note Springer Nature remains neutral with regard to jurisdictional claims in published maps and institutional affiliations.
All animal experiments were permitted by the local veterinary authorities in Zurich, in agreement with the guidelines of the Swiss Animal Protection Law, Veterinary Office, Canton Zurich (Animal Welfare Act, December 16, 2005, and Animal Welfare Ordinance, April 23, 2008). PLP-CreERT;RCL-GCaMP6s mice were generated by crossing PLP-CreERT mice (RRID:IMSRJAX:005975) with ROSA26-floxed-STOP-GCaMP6s mice (Ai96; RRID:IMSRJAX:024106) . Heterozygous RCL-GCaMP6s (Ai96) mice were used to express GCaMP6s in optic nerve axons following intravitreal delivery of AAV-Cre. Kir4.1 cKO mice were obtained from crosses of mice carrying the floxed allele with MOGiCre mice . Kir4. mice were used as littermate controls. Transgenic mouse lines were maintained on the C57BL/6 background. For experiments in wild types, we used Charles River C57BL/6 mice. Both male and female mice were used for experiments. Mice were kept in an inverted 12 -h light/dark cycle at and humidity. Food and water were available ad libitum.
Tamoxifen treatment
PLP-CreERT;RCL-GCaMP6s mice, aged 6-8 weeks, were treated with tamoxifen (Sigma-Aldrich, T5648). Tamoxifen was freshly prepared in corn oil (Sigma-Aldrich, C8267) at a concentration of for each experimental group. Mice received intraperitoneal injections of 100 mg tamoxifen per kilogram body weight daily for 3 days. Experiments commenced 4 weeks after the initial tamoxifen injection.
AAV injections
Intravitreal injections were performed following previously published protocols . Anesthesia involved intraperitoneal administration of fentanyl ( ), midazolam ( ) and medetomidine in . Pupil dilation was achieved with topical application of cyclopentolate ( ) and phenylephrine ( ), and Viscotears liquid gel (CIBA Vision) prevented eye dryness. Mice were maintained at on a heating pad. Under a SteREO Discovery V20 microscope (Zeiss), a 30-gauge needle (insulin syringe, Omnican 50, Braun) was used to create a scleral incision, through which a 34-gauge Hamilton syringe delivered of AAV suspension into the vitreous at . After injection, ofloxacinum eye drops (Floxal, Bausch + Lomb) were administered, followed by buprenorphine ( ) treatment after anesthesia reversal with atipamezole ( ) and flumazenil ( ). Mice were monitored in low light due to prolonged pupil dilation. Intracerebroventricular AAV injections in P10 pups involved isoflurane anesthesia and a heated stereotaxic frame at . Presurgical analgesia included buprenorphine ( , subcutaneously administered), lidocaine ( ) and bupivacaine ( ). A 32 -gauge Hamilton syringe was used to administer of AAV per hemisphere into the ventricle, with coordinates of – 2.0 mm anterior-posterior, 0.8 mm medial-lateral and -2.0 mm dorsal-ventral from the bregma, at . The needle remained in place for 2 min before removal. After surgery, pups received buprenorphine ( ) and suturing with absorbable, braided Vicryl sutures, with careful monitoring during recovery.
AAV vectors
The single-stranded (ss) or self-complementary (sc) AAV vectors used in this study were produced, purified and quantified by the viral vector facility of Neuroscience Center Zurich, as previously described . Intravitreal AAV injections were performed with undiluted AAV vectors mixed with fluorescein dye ( in PBS). The green fluorescein dye was added to monitor successful injections into the vitreous. The following AAVs and their physical titers (in vector genomes per milliliter (vg per ml)) were used: to induce GCaMP6s expression in optic nerve axons, we used RCL-GCaMP6s (Ai96) mice injected with scAAV-DJ/2-hCMV-chl-Cre-SV4Op(A) ( vg per ml). To study
axonal ATP dynamics, we used the FRET sensor ATeam1.03 (ref. 52) packaged in ssAAV-2/2-hSyn1-ATeam1.03-WPRE-hGHp(A) per ml ). Lactate dynamics were studied using the FRET sensor Laconic packaged in ssAAV-2/2-hCMV-chl-Laconic-WPRE-SV40p(A) ( per ml ). Glucose dynamics were studied using the codon-optimized version of the FRET sensor FLIIP packaged in ssAAV-2/2-hSyn1-FLIIP-WPRE-hGHp(A) ( vg per ml) or in ssAAV per ml, the latter containing the MBP promoter previously used to drive reporter gene expression in .
Optic nerve electrophysiology and two-photon imaging
Acute optic nerve preparations for concurrent electrophysiology and two-photon imaging were conducted as previously described . Following isoflurane anesthesia and decapitation, optic nerves were excised and placed in a modified interface perfusion chamber (Haas Top, Harvard Apparatus), perfused with ACSF at using a TC-10 temperature control system (NPI Electronic), and continuously oxygenated with 95% and . Nerve ends were inserted into custom-made suction electrodes filled with ACSF. This setup was integrated with a custom two-photon microscope featuring a Chameleon Ultra II Ti:sapphire laser (Coherent) and a water immersion objective (XLPLN WMP2, Olympus), operated by ScanImage software (r3.8.1, Janelia Research Campus ). The nerve was allowed to equilibrate in the perfusion chamber beneath the objective for at least 30 min , ensuring stability. A transistor-transistor logic trigger driven by a stimulus generator (STG4002-1.6mA, Multichannel Systems) was used to synchronize the acquisition of both electrophysiology and imaging data.
Solutions
Optic nerves were superfused with ACSF containing and 10 mM glucose ( pH 7.4 ), bubbled with and . For pharmacological interventions, drugs at the concentrations mentioned in the text were added to the ACSF shortly before the experiments. Stock solutions (1,000×) of the following drugs were prepared: TTX (ab120054, Abcam), D-AP5 (0106, Tocris), PPADS (ab120009, Abcam), suramin (1472, Tocris), ouabain (O3125, Sigma-Aldrich), RuR (1439, Tocris), (342920, Sigma-Aldrich), (202908, Sigma-Aldrich), (339350, Sigma-Aldrich), IA (I2512, Sigma-Aldrich), (S2002, Sigma-Aldrich), NBQX (ab120045, Abcam),7-CKA (ab120024, Abcam), nifedipine (1075, Tocris), benidipine (3934, Tocris), bumetanide (3108, Tocris), SEA0400 (6164, Tocris), KB-R7943 (ab120284, Abcam) and CytoB (5474, Tocris). When appropriate, drugs were protected from light during preparation and the experiments. For the analysis of stimulus-evoked responses, optic nerves were treated with the drugs for before the experiment. For zero- experiments, the ACSF contained EGTA and to maintain constant divalent cation concentrations. For stimulations, NaCl was adjusted in the ACSF to maintain monovalent cation concentrations. For GD experiments, glucose was substituted with sucrose. Similar sodium and osmolarity adjustments were made when sodium -lactate (Sigma-Aldrich) was added to the ACSF.
CAP recordings and analysis
Optic nerves were stimulated using an STG4002-1.6mA stimulus generator(Multichannel Systems) controlled by MC_Stimulus software. We used square-wave pulses to evoke CAPs, recorded by a USB-ME16-FAI system (Multichannel Systems) with a gain preamplifier. Data were collected at 50 kHz by MC_Rack software and analyzed using a custom MATLAB script available on GitHub (https://github. com/EIN-lab/CAP-analysis). CAP responses, characterized by three peaks indicating different axonal conduction speeds , decrease peak amplitude and increase latency during high-frequency stimulation . The analysis focused on the second CAP peak, measuring latency
from stimulus onset to peak. The pCAP area was used to integrate the amplitude and latency changes of the first two peaks, reflective of large and medium-sized axons. Stimulation protocols involved an initial stimulation for 1 min for baseline values, followed by 30 s or 1 min at 10,25 or 50 Hz , then recovery at 0.4 Hz . High-frequency CAPs were recorded every second. GD and MI experiments used a stimulation protocol. Nerve excitability was assessed by varying stimulus intensity from 0.1 to 1 mA , measuring the AUC of graded CAPs, with the CAP area expressed as a percentage of the maximum CAP area at 1 mA .
Calcium imaging and analysis
GCaMP6s imaging involved exciting the sensor at 940 nm with laser powers between 5 and 10 mW . Fluorescence emissions were captured using a GaAsP photomultiplier tube (Hamamatsu Photonics) and a 520/70-nm band-pass filter (Semrock). Overview images were taken at resolution with a s pixel dwell time. For imaging in OLs or axons, the selected field of view, below the nerve surface, used 7-8 digital zoom, capturing images at 2.96 Hz and resolution with a s pixel dwell time. Data analysis was conducted using MATLAB (MathWorks, R2015b) with the CHIPS toolbox (https:// github.com/EIN-lab/CHIPS), as previously described . Regions of interest (ROIs) around OL somas were manually outlined in ImageJ, with ROI masks inputted into the CHIPS pipeline. For axons, whole frames were analyzed. Image sequences underwent motion correction, noise reduction using a two-dimensional spatial Gaussian filter ( ) and a temporal moving-average filter (width ), and background noise (defined as the bottom first-percentile pixel value) subtraction. Signal vectors ( ) from each ROI or frame were computed using ten frames before stimulation onset as the baseline. responses were quantified by the AUC during a 30 -s stimulation period. Pharmacological effects were assessed through paired analysis comparing the responses before and after drug application, averaged over two to three sessions to minimize variability. The numbers of mice and cells are detailed in the figure legends.
Metabolite imaging and analysis
The FRET-based metabolite sensors (Laconic, ATeam1.03, FLIIP) were excited at 870 nm using laser powers of . Donor and acceptor fluorescence signals were simultaneously collected using two photomultiplier tubes, a 560 -nm edge dichroic beam splitter (BrightLine, Semrock), and band-pass filters of (yellow channel) and (blue channel). Images were captured at resolution with a pixel dwell time, every 2 or 10 s . FRET analysis used a custom MATLAB script, available at https://gitlab.com/einlabzurich/fretanalysis. Image time series were smoothed using a five-image moving average, with the number of images determined after testing various time windows to preserve temporal dynamics. Background removal was achieved by thresholding, with average whole-frame intensities extracted for each channel. Donor-to-acceptor (Laconic) or acceptor-to-donor (ATeam1.03 and FLIIP) ratios were calculated and normalized to baselines or quasi-zero time points. For visualizing OL or axonal structures while maintaining quantitative FRET ratio data, a color scale was applied to ratio images obtained by pixel-by-pixel division of two channels over an average of 20 frames. RGB images were converted to YCbCr color space, where Cb and Cr represent color and Y represents brightness. The coordinate was replaced with the square root of the sum of donor and acceptor images, and the image was reconverted to RGB.
Immunohistochemistry
Mice were anesthetized with pentobarbital and perfused with 2% paraformaldehyde (PFA) in PBS. Optic nerves were postfixed for 1 h in 4% PFA, embedded in frozen section medium (Thermo Fisher Scientific) and cut into longitudinal sections
using a Leica CM3050 S cryostat. Sections were placed on SuperFrost Plus slides (Thermo Fisher Scientific). For immunohistochemistry, slides were first treated with 0.3% Triton X-100 in 50 mM Tris buffer ( pH 7.4 ) with normal donkey serum for 1 h at room temperature. Primary antibodies (Table 1) were incubated overnight at in the same solution. Secondary antibodies, mixed with 0.05% Tris-Triton and 4% serum, were applied for 1 h at room temperature. DAPI was added for nuclear staining. Confocal images and z stacks ( ) were acquired with a ZeissLSM 700 or Zeiss LSM 800 confocal laser scanning microscope equipped with a objective (Plan-Apochromat, numerical aperture 1.4, Oil DIC (UV) VIS-IR). Image analysis was performed with ImageJ (Fiji version 1.52p). For GFAP and IBA1 analysis, maximum intensity projections were binarized and the fluorescent particle area was determined. For quantifications, two images per section and four sections per animal were analyzed.
EM and analysis
Mice were anesthetized using isoflurane before decapitation and optic nerve extraction. Optic nerves were immediately transferred to a fixative solution (4% PFA, 2.5% glutaraldehyde in phosphate buffer with ) and fixed overnight at . Tissue preparation and EM were carried out as previously described . Briefly, following postfixation with (Science Services) in 0.1 M phosphate buffer (pH 7.3) and acetone dehydration, tissue fragments were embedded in EPON (Serva). Ultrathin sections were cut with a Leica UC7 ultramicrotome (Leica) and then stained using UranyLess (Science Services). EM pictures were captured with a Zeiss EM912 electron microscope (Zeiss) equipped with an on-axis 2 k charge-coupled device camera (TRS). EM image analysis was performed using ImageJ (Fiji, version 1.52p). Axonal diameters and ratios (ratio of axon diameter to the diameter including the myelin sheath) were analyzed using five random overview EM pictures (at magnification), with 250 axons evaluated per animal. Calculations were based on circular areas equivalent to the measured areas. For axonal pathology assessment, eight to ten EM images per animal were analyzed. The experimenters were blinded to the genotypes.
Proteomics and analysis
Optic nerves from 2.5-month-old Kir4.1 cKO mice and littermate controls were extracted following deep isoflurane anesthesia. For tissue homogenization, we used PreOmics lysis buffer with zirconium oxide beads (ZROB05, Next Advance) in a Bullet Blender (BBX24, Next Advance), with two 15 -s cycles set at speed 10 . TMT-based quantitative proteomics analysis was performed at the Functional Genomics Center Zurich. Protein concentrations were measured using the Lunatic UV-Vis spectrophotometer (Unchained Labs). Processing involved the iST kit (PreOmics) and encompassed treatment with ‘Lyse’ buffer, boiling, digestion and centrifugation. Peptides captured by the iST filter were washed, eluted, dried and labeled with TMT10plex reagent (Thermo Fisher Scientific, 90110) in acetonitrile (Sigma-Aldrich) and 50 mM TEAB ( pH 8.5 ), followed by quenching. Equal TMT channel amounts formed the combined sample, prefractionated using high-pH reverse-phase chromatography on an XBridge Peptide BEH C18 column (Waters). For MS, samples were analyzed on an Orbitrap Fusion Lumos (Thermo Fisher Scientific), with data-dependent acquisition settings optimized for MS spectra and MS/MS recordings in the Orbitrap. Proteomics data were handled using the local laboratory information management system . Proteome Discoverer (version 2.4) processed the raw MS data, with protein identification through the Sequest HT engine against the Mus musculus reference proteome (UniProt, 20190709). Carbamidomethylation and TMT (+229.163 Da, peptide N -terminus and K ) were set as fixed modifications, whereas methionine oxidation and N -terminal protein acetylation were set as variable modifications. Enzyme specificity was set to trypsin, allowing a minimal peptide length of six amino acids and a maximum of two
missed cleavages. The maximum FDR for peptides was set to 0.01 . Protein fold changes were computed based on intensity values. A set of functions implemented in R package prolfqua was used to filter for proteins with two or more peptides. Data normalization used a modified robust -score transformation, preserving the original data variance. For differential analysis, we fitted the linear model to every protein, computed contrasts, and moderated the variance, statistics and values . FDRs were determined from values using BenjaminiHochberg adjustment. GSEA was conducted using WebGestalt.org.
Myelin purification and immunoblotting
A myelin-enriched lightweight membrane fraction was purified from the brains of 2.5 -month-old Kir4.1cKO mice and controls, using sucrose density centrifugation and osmotic shocks as previously described . Brain tissue was extracted after decapitation following deep anesthesia using isoflurane. Protein concentrations in brain lysates and myelin fractions were determined using the DC protein assay kit (Bio-Rad) following the manufacturer’s instructions and measured using the Eon high-performance microplate spectrophotometer (BioTek). Immunoblotting was carried out as previously outlined . Myelin fraction samples were diluted in SDS sample buffer (glycerol , Tris- HCl ( pH 6.8 ) 240 mM , SDS (w/v), bromophenol blue (w/v)), with 5% dithiothreitol added as a reducing agent. Before use, samples were heated at for 10 min . For protein separation by SDSPAGE, the Mini-PROTEAN Handcast system (Bio-Rad) was used with self-casted acrylamide gels ( ). Samples were loaded at per well (depending on the protein of interest) next to of prestained protein ladder (PageRuler, Thermo Fisher Scientific). Proteins were separated by constant current ( 200 V ) for . Immunoblotting was carried out with a Novex semi-dry blotter (Invitrogen), and proteins were transferred to an activated ( ethanol, 1 min ; followed by two washing steps with water) polyvinylidene fluoride membrane (Roche Diagnostics, cat. no. 03010040001 ) at 20 V for 40 min . After blotting, membranes were blocked in TBS containing 5% nonfat dry milk (Frema) and Tween-20 for 1 h at room temperature. Primary antibodies were diluted in 5 ml of blocking buffer and incubated overnight at with horizontal rotation. Membranes were washed three times with TBS-T for 5-10 min each and incubated for 1 h with secondary HRP antibodies diluted in a blocking buffer. Membranes were washed three times with TBS-T for . Detection was carried out using enhanced chemiluminescent detection (ECL) according to the manufacturer’s instructions (Western Lightning Plus-ECL or SUperSignal West Femto Maximum Sensitivity Substrate, Thermo Fisher Scientific). Immunoblots were scanned using the ECL imager Chemostar (Intas Science Imaging). Normalization was performed with Fast Green total protein stain. For antibody information, see Table 1.
Real-time qPCR
Mice were deeply anesthetized using isoflurane and then decapitated. Next, optic nerves were quickly dissected. The tissues were homogenized in RNeasy lysis buffer (RLT, Qiagen) with zirconium oxide beads (ZROB05, Next Advance) in a Bullet Blender tissue homogenizer (BBX24, Next Advance; two cycles of 15 s on speed 10). For RNA extraction and cDNA synthesis, the RNeasy Micro kit (Qiagen) and SensiFAST cDNA synthesis kit (Bioline) were used according to the manufacturer’s instructions. Real-time qPCR was performed using EvaGreen (HOT FIREPol, Solis BioDyne) and a 7900HT Fast Real-Time PCR System (Applied Biosystems, software SDS 2.4). For mRNA expression analysis, the following primers were used: for Kir4.1 (Kcnj1O) (5′-TCT GTT CAT CTG TCC CGC TGC-3′, -GAC GTC ATC TTG GCT CGA AGG3′), for MCT1 (Slc16a1) ( -ATT GTG GAA TGC TGC CCT GT-3′, 5′-TAC CCG CGA TGA TGA GGA TC-3′), for GLUT1 (Slc2a1) ( -ATC TTC GAG AAG GCA GGT GTG-3′, -CGC TCT ACA ACA AAC AGC GAC-3′) and for GLUT3 (Slc2a3) ( -GTG ACT GTG CTG GAG CTC TT-3′, -CCG CGT CCT TGA AGA TTC CT-3′). Actb served as an endogenous gene control
( -CTT CCT CCC TGG AGA AGA GC-3′, -ATG CCA CAG GAT TCC ATA CC-3′). Three technical replicates were averaged for each reaction for each animal.
Statistical analyses
Intergroup comparisons were performed by a two-sided paired test or Student’s test, as specified in the figure legends. For analyses involving multiple comparisons, data were subjected to either one-way or two-way ANOVA. All statistical analyses were conducted using GraphPad Prism 9 or R (v.3.2.2, R Core Team, 2015). Datasets had to pass the Shapiro-Wilk test for normality before being subjected to Student’s test and ANOVA or undergo nonparametric tests to determine statistical significance. Equal variances were assumed but not tested. Significance levels were defined as follows: , . Data are presented as individual values with mean s.e.m. or as box-and-whisker plots. In the box-and-whisker plots, the ‘+’ symbol represents the mean; the center line indicates the median; the box extends from the 25th to 75th percentile; and the whiskers extend from the 5th to 95th percentile. values and sample sizes are stated in the figure legends. Sample sizes were not determined in advance as they were constrained by the availability of age-matched transgenic mouse cohorts. Where applicable, experimenters were blinded to the genotype.
Reporting summary
Further information on research design is available in the Nature Portfolio Reporting Summary linked to this article.
Data availability
Mass spectrometry proteomics data reported in this study (see also Supplementary Data 1, containing raw and normalized proteomics data) are deposited at the ProteomeXchange PRIDE with dataset identifier PXD046207. Further data and resources are available upon request from the corresponding author.
Hövelmeyer, N. et al. Apoptosis of oligodendrocytes via Fas and TNF-R1 is a key event in the induction of experimental autoimmune encephalomyelitis. J. Immunol. 175, 5875-5884 (2005).
Fleischmann, T., Jirkof, P., Henke, J., Arras, M. & Cesarovic, N. Injection anaesthesia with fentanyl-midazolam-medetomidine in adult female mice: importance of antagonization and perioperative care. Lab. Anim. 50, 264-274 (2016).
Paterna, J.-C., Feldon, J. & Büeler, H. Transduction profiles of recombinant adeno-associated virus vectors derived from serotypes 2 and 5 in the nigrostriatal system of rats. J. Virol. 78, 6808-6817 (2004).
Snaidero, N. et al. Myelin replacement triggered by single-cell demyelination in mouse cortex. Nat. Commun. 11, 4901 (2020).
Mezydlo, A. et al. Remyelination by surviving oligodendrocytes is inefficient in the inflamed mammalian cortex. Neuron 111, 1748-1759 (2023).
Mayrhofer, J. M. et al. Design and performance of an ultra-flexible two-photon microscope for in vivo research. Biomed. Opt. Express 6, 4228-4237 (2015).
Pologruto, T. A., Sabatini, B. L. & Svoboda, K. Scanlmage: flexible software for operating laser scanning microscopes. Biomed. Eng. Online 2, 13 (2003).
Stys, P. K., Ransom, B. R. & Waxman, S. G. Compound action potential of nerve recorded by suction electrode: a theoretical and experimental analysis. Brain Res. 546, 18-32 (1991).
Barrett, M. J. P., Ferrari, K. D., Stobart, J. L., Holub, M. & Weber, B. CHIPS: an extensible toolbox for cellular and hemodynamic two-photon image analysis. Neuroinformatics 16, 145-147 (2018).
Glück, C. et al. Distinct signatures of calcium activity in brain mural cells. eLife 10, e70591 (2021).
Möbius, W. et al. Electron microscopy of the mouse central nervous system. Methods Cell Biol. 96, 475-512 (2010).
Türker, C. et al. B-Fabric: the Swiss army knife for life sciences. In Proceedings of the 13th International Conference on Extending Database Technology (eds Manolescu, I. et al.) 717-720 (ACM, 2010).
Wolski, W. E., Panse, C., Grossmann, J., D’Errico, M. & Nanni, P. prolfqua-an R package for proteomics label-free quantification. F1000Research https://doi.org/10.7490/f1000research.1118455.1 (2021).
Ritchie, M. E. et al. limma powers differential expression analyses for RNA-sequencing and microarray studies. Nucleic Acids Res. 43, e47 (2015).
Erwig, M. S. et al. Myelin: methods for purification and proteome analysis. Methods Mol. Biol. 1936, 37-63 (2019).
Stumpf, S. K. et al. Ketogenic diet ameliorates axonal defects and promotes myelination in Pelizaeus-Merzbacher disease. Acta Neuropathol. 138, 147-161 (2019).
Berghoff, S. A. et al. Blood-brain barrier hyperpermeability precedes demyelination in the cuprizone model. Acta Neuropathol. Commun. 5, 94 (2017).
Jung, M., Sommer, I., Schachner, M. & Nave, K. A. Monoclonal antibody O10 defines a conformationally sensitive cell-surface epitope of proteolipid protein (PLP): evidence that PLP misfolding underlies dysmyelination in mutant mice. J. Neurosci. 16, 7920-7929 (1996).
Acknowledgements
We thank all laboratory members for frequent discussions and critical input, J.-C. Paterna and the viral vector facility of Neuroscience Center Zurich for AAV production, A. Waisman for MOGiCre mice, A. Mezydlo and M. Kerschensteiner for providing plasmids containing
the MBP promoter, and the Functional Genomics Center Zurich for proteomics support. D.E.B. and K.-A.N. were supported by the Adelson Medical Research Foundation. L.F.B. was supported by Fondecyt 1230145. B.W. was supported by the Swiss National Science Foundation (31003A_156965). A.S.S. was supported by a Synapsis Career Fellowship Award, Neuroscience Center Zurich, the Cloëtta Foundation and the Swiss National Science Foundation (Eccellenza 187000).
Author contributions
Z.J.L. and A.S.S. designed the study, planned the experiments, analyzed the data and wrote the manuscript. Z.J.L., Z.F., L.R., H.S.Z., H.B.W., W.M., L.F.B., B.W. and A.S.S contributed to the methodology. Z.J.L., Z.F., R.B.J., T.R. and A.S.S. performed the experiments. D.E.B, L.F.B., K.-A.N., B.W. and A.S.S. provided resources. All authors contributed to editing the manuscript. Supervision of the project was conducted by A.S.S.
Funding
Open access funding provided by University of Zurich.
Extended Data Fig. 1 | Functional assessment of glucose sensor in OLs. a, AAVmediated glucose FRET sensor FLIIP expression in optic nerve OLs of wildtype mice. Depicted are representative color-coded ratio images from optic nerve in ACSF containing 10 mM glucose (Glc), after removal of extracellular Glc, and following inhibition of glycolysis by 1 mM iodoacetate (IA) in ACSF containing
10 mM Glc. Warm and cold colors indicate high and low ratios or glucose levels, respectively. Scalebar . b, Quantification of normalized ratios obtained from conditions presented in a. Ratios ( mice) were normalized to the averaged minimum obtained at . Data shown in mean SEM.
Extended Data Fig. 2 | Minor contribution of glutamatergic and purinergic signaling to stimulus-evoked response in OLs. a, 50 Hz -evoked OL soma changes in control condition and with addition of NBQX ( ). Quantification of surge (AUC during stimulation period, boxplots) revealed no difference in the stimulus-evoked increase ( cells from 3 mice, , two-sided paired t-test). changes with NBQX ( ), DAP-5 ( ), and 7-CKA ( ) revealed a decrease in the stimulus-evoked increase by ( cells from 3 mice, , two-sided paired
t-test). c, OLCa response with PPADS ( ) revealed a decrease in the stimulus-evoked increase by cells from 3 mice, , two-sided paired t-test). d, OL Ca response with Suramin ( ) revealed a decrease in the stimulus-evoked increase by ( cells from 2 mice, , two-sided paired t-test). Traces represent mean SEM. Boxplots show median (line), quartiles (box bounds), mean (+), and 5-95 percentiles (whiskers).
Extended Data Fig. 4 | Voltage-gated channels are no major drivers of stimulus-evoked OL response. a, OL response in control condition and with revealed a slight increase in the 50 Hz -evoked rise ( cells from 4 mice, two-sided paired t-test). response with revealed a slight decrease in the 50 Hz -evoked surge by ( cells from 4 mice, two-sided paired t -test). response with Nifedipine revealed a slight decrease in the 50 Hz -evoked surge
by cells from 3 mice, two-sided paired t -test . , OL response with Benidipine ( ) revealed no overt change in the 50 Hz -evoked surge ( cells from 3 mice, two-sided paired t-test). e, OL Ca response with RuR ( ) revealed no significant changes in the 50 Hz -evoked surge ( cells from 4 mice, two-sided paired t -test). Traces represent mean SEM. Boxplots show median (line), quartiles (box bounds), mean (+), and 5-95 percentiles (whiskers).
Extended Data Fig. 5 | Reverse-mode NCX activation in OL response and extracellular -induced lactate surge in axons. a, Schematic of reverse-mode NCX activity testing in OLs: Blocking the sodium pump with Ouabain raises intracellular concentration, which should activate NCX to exchange out for in. The ouabain-evoked is expected to be reduced by blocking NCX with KB-R7943. b, Indeed, ouabain application resulted in increased levels in OLs, significantly reduced with M KB-R7943 ( cells from 2 mice, p < 0.0001, two-sided paired t-test). c, 50 Hz -evoked OL response with NCX blocker SEA0400 ( ) revealed a significant decrease in surge by ( cells from 4 mice, , two-sided paired t -test). d, OL response
with NKCC1 blocker Bumetanide ( ) revealed no difference in the stimulusevoked surge ( cells from 4 mice, , two-sided paired t-test). b-d, traces represent means SEM. Boxplots show data median as line, upper and lower quartile as bounds of box, mean as + and 5-95 percentiles as whiskers. e, Axonal lactate levels following transient 30 mM extracellular increase via 30 s bath application. Experiments were conducted in TTX to inhibit axonal activity. Lactate levels are presented as % changes ( SEM), and the lactate surge (delta AUC) is compared to baseline (BL) before application. The -induced axonal lactate rise ( mice) was abolished in the presence of mice, , two-sided Student’s t-test).
Extended Data Fig. 6 | See next page for caption.
Extended Data Fig. 6 | Oligodendroglial Kir4.1 critical for white matter clearance. a, Average optic nerve CAP response of and Kir4.1 mice. , Similar CAP peak latencies between genotypes ( , for peak for peak for peak 3 , one-way ANOVA with Holm-Šídák’s -multiple comparisons test). c, Similar stimulus-response relationships in both groups ( , two-way ANOVA). CAP area from each stimulus intensity normalized to max stimulation at 1 mA . d-f, Electron microscopic (EM) analysis of optic nerves from 3-months-old and mice: d, Representative EM images. e, Myelin sheath thickness (g-ratio) comparable between genotypes ( , two-sided Student’s t-test). f, Similar axon size distribution of myelinated axons , two-way
ANOVA). and , Confocal images of optic nerve immunolabeling: g, GFAP; , IBA1, in 2.5-months-old ctrl and cKO mice. No differences in GFAPimmunopositive area between genotypes ( , two-sided Student’s t-test), or IBA1 labeling (ctrl, ; cKO , two-sided Student’s t-test). i, Averaged CAP amplitude changes (% from baseline) upon 1 min 50 Hz stimulation of optic nerves from cKO, ctrl, wildtype (wt) and wt treated with , CAP peak recovery time post 50 Hz stimulation: Slower recovery in CKO ( mice) and compared to and wt ( ) (ctrl vs cKO, ; wt vs wt ; ctrl vs wt, ; cKO vs wt ; one-way ANOVA with Holm-Šídák’s multiple comparisons test). Data represented as means SEM.
Extended Data Fig. 8|Age-related axonopathy and signs of astrogliosis in 7- to 8-months-old Kir4.1 cKO mice. a-c, EM analysis of optic nerves from 7- to 8-months-old cKO and ctrl mice: a, Representative EM images with normal (N) appearing axons and signs of axonopathy (A). Scalebar . b, Ultrastructural features of axonal injury and degeneration more frequent in cKO compared to mice per group, with 10 randomly taken images each covering (ref. 2); , two-sided Student’s t-test). c, Notably, giant axonal swellings were exclusive to cKO nerves at this age. Scalebar . d, No difference in myelin
sheath thickness ( g -ratio) between genotypes ( mice; , two-sided Student’s t-test). e, Similar axon size distribution of myelinated axons ( mice; , two-way ANOVA).f, Significant increase in GFAP-immunopositive area, indicative of astrogliosis, in optic nerves from cKO mice compared to ctrl at 7 months of age ( mice; , two-sided Student’s t-test). Scalebar , No significant differences in IBA1-immunopositive area between genotypes ( mice; , two-sided Student’s t-test). Scalebar . Data are represented as means SEM.
Extended Data Fig. 9|Proteomics and qPCR analysis of optic nerve lysates from young Kir4.1 cKO mice. a, Of the detected protein hits from the TMT-based proteomics analysis (see Fig. 4), 2665 were unambiguously mapped to unique Entrez gene IDs. Using the GO term biological process, bar charts depict the GO annotation and functional categorization of identified proteins. WebGestalt.org provided the summary. b, Protein abundance of Kir4.1 (gene Kcnj10) is reduced in samples from cKO ( mice) compared to , p = 0.0015, moderated t-test). c, Abundance of MCT1 (Slc16a1) is reduced in cKO compared to , moderated t -test). , Abundance of GLUT1 (Slc2a1) is reduced in cKO compared to , moderated
t-test). e, Abundance of GLUT3 (Slc2a3) is unchanged between genotypes ( , , moderated t -test). Boxplots with all points show median (line), quartiles (box bounds), and min to max (whiskers). f, Relative mRNA abundance in optic nerve lysates of 3-months-old cKO ( ) and littermate ctrls ( ): Compared to ctrl, Kir4.1 mRNA levels were reduced by ( , two-sided Student’s t-test) and GLUT1 mRNA levels were reduced by ( , two-sided Student’s t-test). No significant differences in mRNA levels of MCT1 ( ) and GLUT3 ( ). Data represented as dot-plots with means SEM.
natureportfolio
Corresponding author(s):
Aiman S. Saab
Last updated by author(s):
Nov 20, 2023
Reporting Summary
Nature Portfolio wishes to improve the reproducibility of the work that we publish. This form provides structure for consistency and transparency in reporting. For further information on Nature Portfolio policies, see our Editorial Policies and the Editorial Policy Checklist.
Statistics
For all statistical analyses, confirm that the following items are present in the figure legend, table legend, main text, or Methods section.
Confirmed
The exact sample size for each experimental group/condition, given as a discrete number and unit of measurement A statement on whether measurements were taken from distinct samples or whether the same sample was measured repeatedly
The statistical test(s) used AND whether they are one- or two-sided
Only common tests should be described solely by name; describe more complex techniques in the Methods section. A description of all covariates tested
A description of any assumptions or corrections, such as tests of normality and adjustment for multiple comparisons
A full description of the statistical parameters including central tendency (e.g. means) or other basic estimates (e.g. regression coefficient) AND variation (e.g. standard deviation) or associated estimates of uncertainty (e.g. confidence intervals)
For null hypothesis testing, the test statistic (e.g. F, ) with confidence intervals, effect sizes, degrees of freedom and value noted Give values as exact values whenever suitable.
For Bayesian analysis, information on the choice of priors and Markov chain Monte Carlo settings
For hierarchical and complex designs, identification of the appropriate level for tests and full reporting of outcomes
Estimates of effect sizes (e.g. Cohen’s , Pearson’s ), indicating how they were calculated
Our web collection on statistics for biologists contains articles on many of the points above.
Software and code
Policy information about availability of computer code
Data collection
CAP recordings: perfusion chamber (Haas Top, Harvard Apparatus); USB-ME16-FAI acquisition system (Multichannel Systems) connected to a USB-ME16-FAI preamplifier (gain 4x; Multichannel Systems) and data collected with the acquisition software MC_Rack (Multichannel Systems) Two-photon imaging: custom-built two-photon microscope (Mayrhofer et al., 2015), equipped with a tunable pulsed Ti:Sapphire laser (Chameleon Ultra II; Coherent) and a water immersion objective (XLPLN WMP2, Olympus). The microscope was controlled by a customized version of ScanImage (r3.8.1; Janelia Research Campus, (Pologruto et al., 2003)). Fluorescence emission was detected with a GaAsP photomultiplier tube (PMT; Hamamatsu Photonics) using band-pass filter 520/70 nm (Semrock) or a dichroic beam-splitter ( 560 nm edge, BrightLine; Semrock) and two band-pass filters and (Semrock).
Immunohistochemistry: Confocal images were acquired with a Zeiss LSM 700 or Zeiss LSM 800 confocal laser scanning microscope equipped with a objective (Plan-Apochromat, NA 1.4, Oil DIC (UV) VIS-IR).
Electron microscopy (EM): EM pictures were captured with a Zeiss EM912 electron microscope (Carl Zeiss Microscopy GmbH, Oberkochen, Germany) equipped with an on-axis CCD camera (TRS, Moorenweis, Germany).
Proteomics: For mass spectrometry analysis, an Orbitrap Fusion Lumos (Thermo Scientific) was used, which was equipped with a Digital PicoView source (New Objective) and coupled to a M-Class UPLC (Waters).
Immunoblotting: Detection was carried out using enhanced chemiluminescent detection (ECL) according to the manufacturer’s instructions (Western Lightning Plus-ECL or SUperSignal West Femto Maximum Sensitive Substrate; Thermo Fisher Scientific, St Leon-Rot, Germany). Immunoblots were scanned using ECL Chemostar (Intas Science Imaging, Göttingen, Germany).
Data analysis
MATLAB (MathWorks, R2015b, R2019a), ImageJ (Fiji version 1.52p), GraphPad Prism 9, R (v.3.2.2, R Core Team, 2015); CAP recordings were analyzed using a custom-written MATLAB script available at GitHub (https://github.com/EIN-lab/CAPanalysis); Image analysis using custom toolbox CHIPS (Barrett et al., 2018) available on GITHUB (https://github.com/EIN-lab/CHIPS). Code used for FRET image analysis is available at GitHub (https://gitlab.com/einlabzurich/fretanalysis). Functions implemented in the R package prolfqua were used for proteomics data
processing.
For manuscripts utilizing custom algorithms or software that are central to the research but not yet described in published literature, software must be made available to editors and reviewers. We strongly encourage code deposition in a community repository (e.g. GitHub). See the Nature Portfolio guidelines for submitting code & software for further information.
Data
Policy information about availability of data
All manuscripts must include a data availability statement. This statement should provide the following information, where applicable:
Accession codes, unique identifiers, or web links for publicly available datasets
A description of any restrictions on data availability
For clinical datasets or third party data, please ensure that the statement adheres to our policy
Mass spectrometry proteomics data reported in this study (see also Table S1 containing raw and normalized proteomics data) are deposited at the ProteomeXchange PRIDE with the dataset identifier PXD046207. The mus musculus reference proteome was downloaded from UniProt, 20190709. GSEA was carried out with the WEB-based GEne SeT AnaLysis Toolkit (WebGestalt.org). Further data and resources are available upon reasonable request from corresponding author.
Research involving human participants, their data, or biological material
Policy information about studies with human participants or human data. See also policy information about sex, gender (identity/presentation), and sexual orientation and race, ethnicity and racism.
Reporting on sex and gender
N/A
Reporting on race, ethnicity, or other socially relevant groupings
Population characteristics
Recruitment
Ethics oversight
N/A
N/A
N/A
N/A
N/A
N/A
N/A
Note that full information on the approval of the study protocol must also be provided in the manuscript.
Field-specific reporting
Please select the one below that is the best fit for your research. If you are not sure, read the appropriate sections before making your selection.
Life sciences
Behavioural & social sciences
Ecological, evolutionary & environmental sciences
For a reference copy of the document with all sections, see nature.com/documents/nr-reporting-summary-flat.pdf
Life sciences study design
All studies must disclose on these points even when the disclosure is negative.
Sample size
The provision of age-matched transgenic mouse cohorts limited the ability to determine sample sizes in advance. No statistical methods were used to predetermine sample size. Sample sizes used in this study are equivalent to the standard in the field.
Data exclusions
ometimes sensor expression was too weak (e.g. due to insufficient tamoxifen-induced Cre-mediated expression or AAV delivery), these animals were excluded from experiments.
Replication
Number of repetitions (individual data points from each cells and/or animal) are indicated in figures or figure legends.
Randomization
Selection of mice was based on genotype or wildtype mice were ordered from Charles River. Mice were randomly assigned to experimental groups, depending on availability of transgenic cohorts.
Blinding
Overall, during data collection experimenters were not blinded to the conditions. However, experimenter who collected EM dataset was blinded to the experimental conditions. Whenever possible, investigators were blinded for data analysis, especially for EM image analysis.
Reporting for specific materials, systems and methods
We require information from authors about some types of materials, experimental systems and methods used in many studies. Here, indicate whether each material, system or method listed is relevant to your study. If you are not sure if a list item applies to your research, read the appropriate section before selecting a response.
-MCT1 / SLC16A1 rabbit, polyclonal IB, 1:500 prod. by Kathrin Kusch (Stumpf et al., 2019): antibody produced by Kathrin Kusch from the Department of Neurogenetics, Max Planck Institute for Multidisciplinary Sciences, Göttingen, Germany.
-GLUT1 rabbit, polyclonal IB, 1:500 prod. by Kathrin Kusch (Berghoff et al., 2017): antibody produced by Kathrin Kusch from the Department of Neurogenetics, Max Planck Institute for Multidisciplinary Sciences, Göttingen, Germany.
-PLP rabbit, polyclonal IB, 1:5000 A431; (Jung et al., 1996): provided by Hauke Werner from the Department of Neurogenetics, Max Planck Institute for Multidisciplinary Sciences, Göttingen, Germany.
-mouse Cy3 donkey IHC, 1:700 Jackson ImmunoResearch, Cat# 715-165-151
-rabbit Cy3 donkey IHC, 1:700 Jackson ImmunoResearch, Cat# 711-165-152
-chicken Alexa 488 donkey IHC, 1:700 Jackson ImmunoResearch, Cat# 711-545-152
Validation
Quality control information and relevant citations are available at manufacturer’s website.
For -CC1: https://www.merckmillipore.com/CH/de/product/Anti-APC-Ab-7-Mouse-mAb-CC-1,EMD_BIO-OP80?ReferrerURL=https% 3A%2F%2Fwww.google.com%2F; For -GFP: https://www.aveslabs.com/products/anti-green-fluorescent-protein-antibody-gfp; for -GFAP: https://www.abcam.com/products/primary-antibodies/gfap-antibody-ab4674.html; for -IBA1: https://labchem-wako.fujifilm.com/us/product/detail/W01W0101-1974.html; for -Kir4.1: https://www.alomone.com/p/anti-kir4-1/APC-035; for CNP: https://www.sigmaaldrich.com/CH/de/product/sigma/c5922; for -MOG: https://www.creativebiolabs.net/Anti-MOG-Recombinant-Antibody-clone-8-18C5-24503.htm; for -ATP2a1: https://www.abcam.com/products/primary-antibodies/alpha-1-sodium-potassium-atpase-antibody-4646-ab7671.html; for -ATP1a3: https://www.abcam.com/products/primary-antibodies/ atp1a3-antibody-xvif9-g10-ab2826.html; for -mouse IgG HRP: https://www.jacksonimmuno.com/catalog/products/115-035-003; for -rabbit IgG HRP: https://www.jacksonimmuno.com/catalog/products/111-035-003; for -mouse Cy3 donkey: https:// www.jacksonimmuno.com/catalog/products/715-165-151; for -rabbit Cy3 donkey: https://www.jacksonimmuno.com/catalog/ products/711-165-152; for -chicken Alexa 488 donkey: https://www.jacksonimmuno.com/catalog/products/711-545-152. Antibody validation for use in immunoblotting were confirmed by cited publications for -MCT1 / SLC16A1 (Stumpf et al., 2019), for -GLUT1 (Berghoff et al., 2017) and for PLP (Jung et al., 1996).
Animals and other research organisms
Policy information about studies involving animals; Research
Laboratory animals
PLP-CreERT;RCL-GCaMP6s mice were generated by crossing PLP-CreERT mice (RRID:IMSR_JAX:005975) (Doerflinger et al., 2003) with ROSA26-floxed-STOP-GCaMP6s mice (Ai96; RRID:IMSR_JAX:024106) (Madisen et al., 2015). Age 6 to 20 weeks.
Kir4.1fl/fl;MOGiCre mice (Larson et al., 2018) were obtained from crosses of mice carrying the floxed Kcnj10 (Kir4.1fl/fl) (Djukic et al., 2007) allele with MOGi-Cre mice (Hövelmeyer et al., 2005). Age 6 weeks to 8 months.
For experiments in wildtype mice Charles River C57BL/6 mice were used. Age 8 weeks to 5 months.
Wild animals
no wild animals were used in the study
Reporting on sex
Both male and female mice were used for experiments
Institute of Pharmacology and Toxicology, University of Zurich, Zurich, Switzerland. Neuroscience Center Zurich, University and ETH Zurich, Zurich, Switzerland. Department of Neurogenetics, Max Planck Institute for Multidisciplinary Sciences, Göttingen, Germany. Solomon H. Snyder Department of Neuroscience, Johns Hopkins University, Baltimore, MD, USA. Centro de Estudios Científicos (CECs), Valdivia, Chile. Facultad de Medicina y Ciencia, Universidad San Sebastián, Valdivia, Chile. e-mail: asaab@pharma.uzh.ch
Note that full information on the approval of the study protocol must also be provided in the manuscript.