تزداد شذوذات العضلات سوءًا بعد التعب التالي للجهد في كوفيد طويل الأمد Muscle abnormalities worsen after post-exertional malaise in long COVID

المجلة: Nature Communications، المجلد: 15، العدد: 1
DOI: https://doi.org/10.1038/s41467-023-44432-3
PMID: https://pubmed.ncbi.nlm.nih.gov/38177128
تاريخ النشر: 2024-01-04

تزداد شذوذات العضلات سوءًا بعد التعب التالي للجهد في كوفيد طويل الأمد

تم الاستلام: 21 مارس 2023
تم القبول: 13 ديسمبر 2023
نُشر على الإنترنت: 04 يناير 2024
(ط) التحقق من التحديثات

الملخص

برنت أبلمان © ، برادن ت. تشارلتون ، ريتشي ب. جولدينغ ، توم ج. كيركهوف © ، إلين أ. بريدفيلد (1) ويندي نورت ، كارلا أوفرينغا ، فرانك دبليو. بلومرز ، ميشيل فان ويغيل (1) ، باوكي ف. شومكرز ، بيدرو كويلو ، ييلي ج. بوستهوما ، إليونورا أرونيكا © ، دبليو. جوست ويرسينغا © ، ميشيل فان فوجت روب سي. آي. فوست

الملخص

تظل مجموعة فرعية من المرضى المصابين بفيروس SARS-CoV-2 يعانون من أعراض مستمرة لأكثر من ثلاثة أشهر بعد الإصابة. من الأعراض المميزة للمرضى الذين يعانون من كوفيد طويل الأمد هو التعب بعد المجهود، والذي يرتبط بتفاقم أعراض التعب والألم بعد ممارسة التمارين الذهنية أو البدنية الحادة، لكن الآلية المرضية الكامنة وراء ذلك غير واضحة. من خلال هذه الدراسة الطولية ذات التصميم الحالة-الشاهد (NCT05225688)، نقدم رؤى جديدة حول الآلية المرضية للتعب بعد المجهود لدى مرضى كوفيد طويل الأمد. نُظهر أن بنية العضلات الهيكلية مرتبطة بانخفاض القدرة على ممارسة التمارين لدى المرضى، وأن الاضطرابات الأيضية المحلية والجهازية، والاعتلال العضلي الشديد الناتج عن التمارين، وتسلل الأنسجة لترسبات تحتوي على الأميلويد في عضلات الهيكل العظمي لدى مرضى كوفيد طويل الأمد تزداد سوءًا بعد تحفيز التعب بعد المجهود. تسلط هذه الدراسة الضوء على مسارات جديدة تساعد في فهم الآلية المرضية للتعب بعد المجهود لدى المرضى الذين يعانون من كوفيد طويل الأمد وأمراض ما بعد العدوى الأخرى.

التبعات المزمنة بعد العدوى الحادة تسهم في حالات منهكة تؤثر على ملايين الأشخاص حول العالم بعد الإصابة الحادة بفيروس SARS-CoV-2، يعاني مجموعة فرعية من المرضى من تبعات ما بعد الحادة لكوفيد-19 (PASC)، والتي تُسمى أيضًا كوفيد طويل الأمد. . تشمل الأعراض الأكثر شيوعًا لكوفيد طويل الأمد محدودية تحمل التمارين والتعب بعد
الإرهاق الناتج عن الجهد، والذي يمثل تفاقم الأعراض بعد الجهد الذهني أو البدني . الفرضيات الحالية، التي لم تثبت بعد، والتي تفسر تحمل التمرين والتعب بعد الجهد في كوفيد طويل الأمد تشمل خلل في الميتوكوندريا، وتراكم ترسبات تحتوي على الأميلويد في الأوعية الدموية مما يسبب نقص الأكسجة المحلية،
الالتهاب الجهازي والمحلي، اضطرابات الاستجابات المناعية، اختلال التوازن الهرموني، واستمرار الفيروس لا يزال مدى إمكانية فصل الفسيولوجيا الأساسية لانخفاض القدرة على ممارسة التمارين عن العوامل المتعلقة بظهور التعب بعد الجهد غير واضح إلى حد كبير، ويرجع ذلك أساسًا إلى التقييم غير المباشر للمعايير الطبية الحيوية والنفسية الأساسية، والطبيعة العرضية لمعظم الدراسات، وتنوع المرضى.
في هذه الدراسة، قمنا بتحفيز التعب بعد المجهود بشكل منهجي في مجموعة مكونة من 25 مريضًا محددين بدقة يعانون من كوفيد طويل الأمد ومجموعة ضابطة. حصلنا على عينات دم وعضلات هيكلية قبل وبعد اختبار تمرين أقصى (الشكل التوضيحي التكميلي 1) بهدف دراسة العوامل البيولوجية التي تسهم في القدرة المحدودة على التمرين والتعب بعد المجهود في كوفيد طويل الأمد. تمت مقارنة النتائج مع تلك التي تم الحصول عليها من 21 شخصًا ضابطًا مطابقين في العمر والجنس تعافوا تمامًا من عدوى خفيفة بفيروس SARS-CoV-2 (الجدول 1). قمنا بتوصيف كوفيد طويل الأمد بناءً على المعايير التي وضعتها منظمة الصحة العالمية، وكان من المعايير الهامة للإدراج وجود التعب بعد المجهود. كان كلا المجموعتين بصحة جيدة ونشطات اجتماعياً قبل الإصابة الأولية المؤكدة بواسطة اختبار PCR بفيروس SARS-CoV-2. لم يُدخل أي من المشاركين المستشفى بسبب عدوى SARS-CoV-2. أكدت استبيانات التعب وبيانات مقياس التسارع تأثير كوفيد طويل الأمد على الحياة اليومية (الشكل التكميلي 2). نُظهر أن بنية العضلات الهيكلية مرتبطة بانخفاض القدرة على ممارسة التمارين لدى المرضى، وأن الاضطرابات الأيضية المحلية والجهازية، والاعتلال العضلي الشديد الناتج عن التمارين، وتسلل الأنسجة لترسبات تحتوي على الأميلويد في عضلات الهيكل العظمي لدى مرضى كوفيد طويل الأمد تزداد سوءًا بعد تحفيز التعب بعد المجهود.

النتائج

القدرة المحدودة على ممارسة التمارين في كوفيد طويل الأمد

أجرى جميع المشاركين اختبار تمرين القلب والرئة على جهاز تمرين الدراجة. أقصى استهلاك للأكسجين ( ) وكان الحد الأقصى لإنتاج الطاقة أقل بكثير في مرضى كوفيد طويل الأمد (الشكل 1A، B)، على الرغم من التباين الكبير بين المرضى. كان لدى مرضى كوفيد طويل الأمد تهوية قصوى أقل وضغط جزئي نهائي للزفير أقل (PETCO2) مما يشير إلى ضعف وظيفة التهوية أثناء التمرين (الشكل التوضيحي التكميلي 3A-C) لم يتعرض الجهاز القلبي الوعائي للخطر في مرضى كوفيد طويل الأمد (الشكل التكميلي 3د، هـ)، مما يشير إلى أن هذا الجهاز لا يفسر القدرة المحدودة على ممارسة التمارين لدى مرضى كوفيد طويل الأمد. الحد الأقصى الأدنى النبض (أي ناتج حجم الضربة والحُجَير الشرياني الوريدي الفرق؛ الشكل التوضيحي التكميلي 3F)، عتبة تبادل الغازات (الشكل 1C)، والطرفي الاستخلاص (المحدد عبر التحليل الطيفي بالأشعة تحت الحمراء القريبة؛ الشكل 1د، هـ، الشكل التكميلي 3ط) أثناء التمرين أشار جميعها إلى الهيكل العظمي الطرفي
ضعف العضلات لدى المرضى. الجزء السفلي في المرضى لم يكن بسبب جهد دون الحد الأقصى أثناء اختبار التمرين، حيث كانت نسبة المشاركين الذين وصلوا إلى مرحلة الثبات في لم يختلف بين المجموعات، كان عتبة تبادل الغازات عند نسب مماثلة من ، وتم تحقيق المعايير الثانوية ([اللاكتيت]، أقصى نسبة تبادل غازي RER ومعدل ضربات القلب) في كلا المجموعتين (الشكل التوضيحي التكميلي 3E، G، H).
بعد ذلك، قمنا بتقييم بنية ووظيفة العضلات الهيكلية لشرح انخفاض القدرة على ممارسة التمارين لدى المرضى. لم يكن هناك اختلاف في كثافة الشعيرات الدموية ونسبة الشعيرات الدموية إلى الألياف بين المجموعات (الشكل 2أ، . ومع ذلك، أظهر المرضى اتجاهًا نحو انخفاض نسب الشعيرات الدموية إلى الألياف ( ، درجات الحرية 46)، ونسبة الشعيرات الدموية إلى الألياف ارتبطت بـ في كلا المجموعتين مع ميل وتقاطع متطابقين (الشكل 2ج). بالمقارنة مع الأصحاء، لاحظنا نسبة أعلى من الألياف الجليكوليتية شديدة التعب في عضلة الفخذ الوحشي لدى مرضى كوفيد طويل الأمد (الشكل 2د، الشكل التكميلي 4أ-ز)، إلى جانب مساحة مقطع عرضي أقل لألياف النوع الأول المقاومة للتعب لدى الإناث فقط (الشكل التكميلي 4د-و). كانت مساحة المقطع العرضي للألياف مرتبطة إيجابيًا بأقصى قدرة إنتاج طاقة في كلا المجموعتين (الشكل 2هـ)، رغم وجود تقاطع أقل بشكل ملحوظ للمرضى. بالنسبة لحجم العضلات الهيكلية المعطى، لم يحقق المرضى نفس ذروة إنتاج الطاقة، مما يشير إلى أن أداء التمرين لدى المرضى كان يفسر جزئيًا على الأقل بالتغيرات الجوهرية في قوة العضلات الهيكلية وخصائص التعب. ارتبط نشاط سكسينات ديهيدروجيناز (SDH) (علامة على محتوى الميتوكوندريا) بـ في الضوابط الصحية، ولكن ليس في المرضى (الشكل 2F). بينما كان لدى المرضى قدرة تنفس أكسدة الفسفرة أقل بشكل ملحوظ (الشكل 3A، ED 5A-H)، لم تُلاحظ فروق في نشاط SDH (الشكل 3B، C؛ الشكل التكميلي 5I، J)، مما يشير إلى انخفاض نوعي في التنفس الميتوكوندري بدلاً من انخفاض نشاط إنزيم الميتوكوندريا. مجتمعة، تشير بياناتنا إلى أن انخفاض القدرة على التمرين لدى مرضى كوفيد طويل الأمد مرتبط بنسبة أكبر من الألياف الجليكوليتية عالية التعب ووظيفة ميتوكوندرية أقل، مع احتمال وجود قيد إضافي يتمثل في انخفاض التروية الدموية ونظام التهوية.

الخلل الأيضي والتعب بعد المجهود

لفهم العوامل الطرفية التي تسهم في تطور التعب بعد الجهد، قمنا بأخذ خزعات من عضلة الفخذ الوحشية قبل وبعد يوم واحد من تحفيز التعب بعد الجهد. جميع مرضى كوفيد طويل الأمد عانوا من التعب بعد الجهد عقب التمرين الأقصى، على الرغم من التباين الكبير في القدرة على التمرين. شملت الأعراض ألم العضلات، وشدة أكبر للإرهاق، وأعراض معرفية استمرت حتى 7 أيام بعد التمرين الأقصى (الجدول 2، الشكل التكميلي 2A، B). لتقييم منهجي ما إذا كان الخلل الأيضي والميتوكوندري مرتبطًا بالفيزيولوجيا المرضية
الجدول 1 | خصائص المشاركين
المراقبون الأصحاء كوفيد طويل الأمد -القيمة
عدد المشاركين ٢١ ٢٥
التركيبة السكانية
العمر، المتوسط (الانحراف المعياري)، بالسنوات ٤٢ (١٠) ٤١ (١١) 0.82
الجنس، ذكر (%) 10 (47.6) 12 (48.0) >0.99
مؤشر كتلة الجسم، المتوسط (الانحراف المعياري)، ٢٤٫١٤ (٣٫٣٧) ٢٥٫٦٠ (٤٫٦٢) ٠٫٢٤
مؤشر تشارلسون للأمراض المصاحبة، الوسيط [المدى الربيعي] صفر، صفر [0, 0] المجموعة [0,1] ٠٫٧٦
الاستشفاء بسبب كوفيد-19 0 (0) (0) >0.99
التطعيم ضد فيروس كورونا المستجد (SARS-CoV-2) قبل المشاركة (%) ٢١ (١٠٠) ٢٤ (٩٦.٠) >0.99
ساعات العمل الأسبوعية قبل الإصابة الأولية بفيروس SARS-CoV-2، الوسيط [المدى الربيعي] ٣٦ [٣٢، ٤٠] ٣٦ [٣٢، ٤٥] 0.520
ساعات العمل الأسبوعية خلال الدراسة، الوسيط [المدى الربيعي] ٣٦ [٣٢، ٤٠] ٥ [٠،١٢] <0.001
المدة منذ الإصابة الأولية بفيروس SARS-CoV-2، الوسيط [المدى الربيعي]، بالأيام 142 [105، 405] 545 [455، 686] 0.001
المدة منذ آخر عدوى بفيروس SARS-CoV-2، الوسيط [المدى الربيعي]، بالأيام 135 [93، 197] 504 [329، 665] 0.002
الشكل 1 | انخفاض القدرة على ممارسة التمارين لدى مرضى كوفيد طويل الأمد. أقصى استهلاك للأكسجين الرئوي ( كوفيد طويل الأمد المجموعة الضابطة الصحية)، أقصى قدرة إنتاج طاقة (ب، كوفيد طويل الأمد المجموعة الضابطة الصحية) وعَتبة تبادل الغازات (ج، كوفيد طويل الأمد المجموعة الضابطة الصحية) كانت جميعها أقل ( و ، على التوالي) في المرضى الذين يعانون من كوفيد طويل مقارنةً بالمجموعة الضابطة السليمة. و استجابات العضلات لنقص الأكسجين [الهيم] (المتوسط) ) التي تم قياسها بواسطة التحليل الطيفي بالأشعة تحت الحمراء القريبة كانت أقل ( ) في كوفيد طويل الأمد ( )، مما يشير إلى انخفاض استخلاص الأكسجين المحيطي أثناء التمرين مقارنةً بالمجموعة الضابطة السليمة ( ; الأنسجة الدهنية الزائدة حالت دون تحليل البيانات في الباقي
المشاركون). تم تحليل البيانات البارامترية المستمرة باستخدام اختبار ثنائي الجانب -اختبار (اللوحات أ-ج). بيانات طولية معيارية مستمرة (المتوسط ألواح SD و ) تم تحليلها باستخدام نموذج خطي مختلط معمم. -القيم للوحة تم تحديدها باستخدام اختبار ANOVA ثنائي الاتجاه. الخط المنقط (D) يمثل نقطة البداية المتوسطة لاختبار التمرين. ; تُظهر مخططات الصندوق الوسيط (الخط الأوسط)، والربيعين الأول والثالث (الحد الأدنى والأعلى للصندوق)، وتُظهر الخطوط الجانبية نطاق الربيع بين الربعين. تم توفير بيانات المصدر في ملف بيانات المصدر.
من سوء الحالة بعد الجهد ، قمنا بقياس التنفس الميتوكوندري والتواقيع الأيضية في العضلات الهيكلية قبل وبعد يوم واحد من تحفيز التعب بعد المجهود. تم تقييم التنفس الميتوكوندري في ظروف فرط الأكسجين لتجنب تحديد الانتشار للأكسجين الذي قد يساهم في عدم تحمل التمرين في الجسم الحي. انخفضت قدرة الفسفرة التأكسدية بعد يوم واحد من التمرين الأقصى في كل من الضوابط والمرضى (الشكل 3أ). لم تنخفض نشاط SDH في الضوابط الصحية بعد يوم واحد من التمرين، لكنه انخفض في مرضى كوفيد طويل الأمد، مما يشير إلى أن الجمع بين انخفاض التنفس الميتوكوندري الأقصى وانخفاض محتوى الميتوكوندريا هو جزء من الفيزيولوجيا المرضية للتعب بعد المجهود.
لفهم أفضل لتمثيل العضلات الهيكلية في حالة الراحة خلال التعب بعد الجهد، قمنا بتعليق 116 مستقلبًا في العضلات الهيكلية و83 مستقلبًا في الدم الوريدي (الشكل 3D، E، الشكل التكميلي 6A، B). تم الحصول على خزعات من العضلات الهيكلية في حالة الراحة، وبينما أظهرت مستقلبات التحلل السكري في العضلات الهيكلية اختلافات قليلة بين المجموعات، كانت هناك اختلافات في المستقلبات الرئيسية لدورة حمض ثلاثي الكربوكسيل (TCA) بما في ذلك الجلوتامات، ، ألفا-كيتوجلوتارات وحمض الستريك) كانت أقل في عضلات الهيكل العظمي لمرضى كوفيد طويل الأمد (الشكل 3د). كانت نسبة حمض الستريك إلى اللاكتات في عضلات الهيكل العظمي أقل في مرضى كوفيد طويل الأمد، مما يشير إلى تحول بعيدًا عن الأيض التأكسدي في المرضى (الشكل التكميلي 6ج، د) كانت تركيزات الكرياتين في عضلات الهيكل العظمي أقل لدى المرضى الذين يعانون من كوفيد طويل الأمد (الشكل التوضيحي التكميلي 6أ)، مما يساهم على الأرجح في انخفاض الفسفرة التأكسدية.
القدرة في المرضى. كما لاحظنا انخفاض S-أدينوسيل ميثيونين (SAM) في المرضى، مما قد يرتبط بانخفاض التمثيل الميثيلي ونشاط دورة SAM في مرضى كوفيد طويل الأمد. تم تقليل ديوهيدروكسي أسيتون فوسفات، وهو وسيط مهم في تخليق الدهون والتحلل السكري، في عضلات الهيكل العظمي للمرضى بعد التعب الناتج عن الجهد (الشكل 3D). يرتبط انخفاض حمض الهيدروكسي فينيل أسيتيك في المرضى عادة بزيادة إنتاج الميتوكوندريا للجذور الحرة للأكسجين (الشكل التكميلي 6A، B). . المستقلبات المرتبطة بتخليق البيريميدين والبيورين (مثل ATP)، وهي عملية تتطلب طاقة أيضية عالية “، كانت أقل بين الضوابط الأصحاء ومرضى كوفيد طويل الأمد عند تحفيز التعب بعد الجهد (الشكل 3د، الشكل التكميلي 6أ). لم تختلف العديد من الأحماض الأمينية بين المجموعات في حالة الراحة، لكنها كانت أقل في المرضى عند تحفيز التعب بعد الجهد (الشكل التكميلي 6أ). كانت المستقلبات الجليكوليتية في الدم الوريدي أعلى بشكل ملحوظ، لكن البيروفات ومستقلبات دورة حمض الستريك الأخرى كانت أقل في المرضى مقارنة بالضوابط (الشكل 3هـ). أدى تحفيز التعب بعد الجهد إلى انخفاض في المستقلبات الجليكوليتية في الدم بعد أسبوع واحد، دون تغييرات في مستقلبات دورة حمض الستريك في مرضى كوفيد طويل الأمد. كانت مختلف المستقلبات الدموية ضمن مسار البيورين أقل في المرضى مقارنة بالضوابط (الشكل التكميلي 6ب) لكنها لم تتغير مع تحفيز التعب بعد الجهد. من هذه التحليلات، نستنتج أن مستقلبات دورة حمض الستريك كانت أقل في العضلات الهيكلية والدم في مرضى كوفيد طويل الأمد، لكنها لم تتغير أثناء التعب بعد الجهد. كانت المستقلبات الجليكوليتية في الدم الوريدي أعلى عند
الشكل 2 | التغيرات في العضلات الهيكلية مرتبطة بقدرة التمرين لدى مرضى كوفيد طويل الأمد. أ و ب أمثلة على شعيرات العضلات الهيكلية؛ لا توجد فروق بين المجموعات في كثافة الشعيرات الدموية ( ) أو نسبة الشعيرات الدموية إلى الألياف ( ) لوحظت ( كوفيد طويل الأمد المجموعة الضابطة الصحية). ج تم العثور على ارتباط معنوي بين نسبة الشعيرات الدموية إلى الألياف و لكلا المجموعتين ( كوفيد طويل الأمد -القيمة: المجموعة الضابطة السليمة -القيمة: 0.007 ). المرضى الذين يعانون من كوفيد طويل الأمد ( ) كان لديه نسبة أعلى ( -القيمة: 0.036) من النوع الجليكوليتي IIx مقارنة بالمجموعات الضابطة السليمة . هـ بالنسبة لمساحة المقطع العرضي للألياف (FCSA) المعطاة، المرضى الذين يعانون من كوفيد طويل الأمد ( ) كان لديه إنتاج طاقة ذروة أقل بشكل ملحوظ ( -القيمة: 0.045) مقارنة بالأفراد الأصحاء ( ). كان نشاط ديهيدروجيناز السكسينات (SDH) في المقاطع (انظر أيضًا الشكل 3) مرتبطًا بـ
الحد الأقصى لاستهلاك الأكسجين ) في الضوابط الصحية ( – القيمة: ، ولكن ليس في مرضى كوفيد طويل الأمد ( -القيمة: 0.66)، مع معاملات ارتباط مختلفة ذات دلالة إحصائية. تم تحليل البيانات البارامترية المستمرة باستخدام اختبار t ثنائي الجانب (B, D). تم حساب الارتباطات باستخدام اختبار بيرسون ثنائي الجانب (C, E, F). تم حساب الفرق في التقاطع باستخدام الانحدار الخطي مع تحليل التباين ثنائي الجانب (E). تم مقارنة معاملات الارتباط باستخدام حزمة R المسماة cocor. . بار تُظهر مخططات الصندوق الوسيط (الخط الأوسط)، والربيعين الأول والثالث (الحد الأدنى والأعلى للصندوق)، وتُظهر الخطوط الجانبية نطاق الربيع الربيعي. تم توفير بيانات المصدر في ملف بيانات المصدر.
الخط الأساسي وأثناء التعب بعد الجهد ولكن انخفض بعد أسبوع واحد من حدوث التعب بعد الجهد.

تراكم ترسبات تحتوي على الأميلويد ناتجة عن التمرين في العضلات الهيكلية

تم افتراض أن الترسبات التي تحتوي على الأميلويد في الدورة الدموية يمكن أن تعيق التروية المحلية في كوفيد طويل الأمد، مما يسبب إصابة نقص التروية وإعادة التروية. درسنا ما إذا كانت الترسبات التي تحتوي على الأميلويد موجودة في العضلات الهيكلية لمرضى كوفيد طويل الأمد وما إذا كانت دلالة التعب بعد الجهد تؤثر على التركيز. نُظهر أن تركيز الترسبات التي تحتوي على الأميلويد كان أعلى في العضلات الهيكلية لمرضى كوفيد طويل الأمد في البداية، وزاد بشكل مماثل في كلا المجموعتين بعد تحفيز التعب بعد الجهد (الشكل 4A، B). كمجموعة ضابطة إضافية، كانت خزعات العضلات الهيكلية التي تم الحصول عليها قبل تفشي فيروس SARS-CoV-2 تحتوي على كميات مماثلة من الترسبات التي تحتوي على الأميلويد مثل مجموعة الضوابط الصحية لدينا، مما يؤكد وجود كمية أساسية من الترسبات التي تحتوي على الأميلويد غير مرتبطة بفيروس SARS-CoV-2 في الضوابط الصحية. بعد ذلك درسنا موقع هذه الترسبات التي تحتوي على الأميلويد. أظهر تصور الترسبات التي تحتوي على الأميلويد مع الشعيرات الدموية أو الأوعية اللمفاوية أن الترسبات التي تحتوي على الأميلويد في الهيكل العظمي لم تكن موجودة داخل الشعيرات الدموية أو الأوعية اللمفاوية، بل كانت بجانب الشعيرات الدموية وفي المصفوفة خارج الخلوية بين ألياف العضلات (الشكل 4A، C، D). لم تتداخل الترسبات التي تحتوي على الأميلويد مع نوى الخلايا.
مما يشير إلى أن هذه الترسبات تقع خارج الخلايا المتسللة (المناعية). نستنتج أن الترسبات التي تحتوي على الأميلويد غير موجودة داخل الشعيرات الدموية. كما أننا لم نلاحظ أي علامات على نقص الأكسجة في نسيج العضلات الهيكلية، حيث لم يكن هناك اختلاف في نسبة الشعيرات الدموية إلى الألياف العضلية، وكثافة الشعيرات الدموية (الشكل 2ب)، وتركيزات اللاكتات داخل الخلايا وفي الدورة الدموية (الأشكال التكميلية 3ج، 6أ) بين مرضى كوفيد طويل الأمد والمجموعة الضابطة. لذلك، نستنتج أن التعب بعد الجهد لا يمكن تفسيره بالافتراض القائل بأن هذه الترسبات تسد تدفق الأوعية، مما يسبب نقص الأكسجة المحلية في الأنسجة. السبب الأساسي وراء زيادة تراكم الرواسب المحتوية على الأميلويد داخل العضلات أثناء التعب بعد الجهد لا يزال غامضًا.

اعتلال العضلات الناجم عن التمرين في كوفيد طويل الأمد

لتوضيح المزيد من الفيزيولوجيا المرضية لزيادة ضعف العضلات، والتعب، والألم بعد التمرين لدى مرضى كوفيد طويل الأمد، قمنا بتحديد ما إذا كانت هناك ميزات مرضية محددة موجودة في العضلات الهيكلية قبل وبعد تحفيز التعب بعد الجهد. نظرًا لأن حجم الخزعة كان متغيرًا بين المشاركين ونقاط الزمن، قمنا بتقييم الخزعات على أنها سلبية/إيجابية للمعايير المرضية والمناعية. أظهر نسبة أكبر من مرضى كوفيد طويل الأمد ألياف ضامرة صغيرة ونخر بؤري (الشكل 5A، B)، والتي زادت بشكل ملحوظ بعد التمرين، مما يشير إلى استجابة متفاقمة لتلف الأنسجة لدى مرضى كوفيد طويل الأمد. نظرًا لأن العضلات الهيكلية
أ
قدرة الفسفرة التأكسدية
ب
نشاط ديهيدروجيناز السكسينات
ج
صحي
د
هـ
التمثيل الغذائي للدم في كوفيد طويل الأمد مقارنة بالأصحاء
وقت القياس
الخط الأساسي
بعد يوم واحد بعد أسبوع واحد PEM PEM
حجم التأثير Hedges’ g
و <0.2
التوازن
<-0.2
<-0.5
<-0.8 غير مكتشف
العضلة هي نسيج بلاستيكي، وكانت علامات تجدد العضلات الهيكلية، مثل النوى المركزية (الشكل 5ج)، أكثر وضوحًا في مرضى كوفيد طويل الأمد، حتى قبل حدوث التعب بعد الجهد. تم رؤية الألياف المتجددة بشكل حاد، التي تظهر من خلال النوى المركزية والسيتوبلازم القاعدي، في خزعات من كلا المجموعتين (الشكل 5د)، وزاد التمرين المجهد من نسبة الألياف المتجددة في كل من الأصحاء والمرضى المصابين بكوفيد طويل الأمد دون فروق بين المجموعتين. نحن
نستنتج أن تلف العضلات الشديد الناتج عن التمرين والتجدد اللاحق مرتبطان بفيزيولوجيا مرض التعب بعد الجهد، وقد يفسران ألم العضلات والتعب والضعف لدى المرضى الذين يعانون من كوفيد طويل الأمد ويختبرون التعب بعد الجهد.
بعد ذلك، استكشفنا تسلل الخلايا المناعية (البلعميات، وخلايا T وB) في العضلات الهيكلية بعد التمرين الشاق. المزيد من الطول
الشكل 3 | الخلل الأيضي والميتوكوندري في مرضى كوفيد طويل الأمد يزداد سوءًا مع التعب بعد المجهود. أ قدرة الفسفرة التأكسدية (OXPHOS) كانت أقل بشكل ملحوظ في مرضى كوفيد طويل الأمد ( ) مقارنة بالمجموعة الضابطة السليمة ( )، وظل منخفضًا بعد يوم واحد من تحفيز التعب بعد الجهد (PEM) لدى المرضى (المجموعة: ، الوقت: ). لم تختلف نشاط ديهيدروجيناز السكسينات (SDH)، وهو علامة على كثافة الميتوكوندريا، بين المجموعات ( ) ومخفض فقط ( ) بعد تحفيز التعب بعد الجهد في مرضى كوفيد طويل الأمد ( ) مقارنة بالمجموعة الضابطة السليمة ( ). مثال نموذجي على نشاط SDH موضح في اللوحة تشير مسارات الأيض في العضلات الهيكلية (د) والأوردة (هـ) إلى مستويات أعلى قليلاً من المستقلبات المرتبطة بتحلل الجلوكوز، وانخفاض في وفرة المستقلبات المرتبطة بتخليق البيورين ودورة حمض ثلاثي الكربوكسيل (TCA)، مما يدل على وجود…
انخفاض الاعتماد على الأيض التأكسدي في المرضى الذين يعانون من كوفيد طويل الأمد ( ، كلا الوقتين) مقارنةً بالأصحاء ( ، كلا الوقتين). الأسماء الباهتة لم تُقاس ولم تُعرض للوضوح. يُظهر اللون الأحمر حجم تأثير أعلى في كوفيد طويل الأمد، واللون الأزرق حجم تأثير أقل. بيانات طولية معيارية مستمرة (اللوحات تم تحليلها باستخدام نموذج خطي مختلط مع تعميم وتحليل تباين ثنائي الجانب. تم إجراء اختبارات بعدية لمقارنة كل مجموعة عندما كانت قيمة التفاعل ذات دلالة إحصائية، وتم ذلك باستخدام emmeans مع تعديل BH (اللوحات) و ). أحجام التأثير ( و ) تم حسابها باستخدام هيدجز ; يشير إلى تأثير تفاعل كبير. الشريط: . التعب بعد الجهد في متلازمة التعب المزمن. تُظهر مخططات الصندوق الوسيط (الخط الأوسط)، والربيعين الأول والثالث (الحد الأدنى والأعلى للصندوق)، وتُظهر الخطوط المتفرعة نطاق الربيع الربيعي. تم توفير بيانات المصدر في ملف بيانات المصدر.
الجدول 2 | الأعراض التي أبلغ عنها المرضى قبل وأثناء التعب بعد الجهد
الأعراض الخط الأساسي بعد يوم واحد من بدء التعب بعد الجهد بعد أسبوع واحد من بدء التعب بعد المجهود -القيمة
الإرهاق ٢٥ (١٠٠.٠) ٢٥ (١٠٠.٠) 24 (96.0) 0.36
شدة التعب المبلغ عنها ذاتياً (1-10)، الوسيط [المدى الربيعي] ٦٫٠٠ [٤٫٠٠، ٧٫٠٠] ٧.٠٠ [٧.٠٠، ٨.٠٠] ٧٫٠٠ [٦٫٠٠، ٧٫٢٥] 0.001
مشاكل معرفية 20 (80.0) ٢١ (٨٤.٠) 23 (92.0) 0.47
شدة شدة الإدراك المبلغ عنها ذاتيًا (1-10)، الوسيط [المدى الربيعي] ٤.٠٠ [٣.٠٠، ٦.٢٥] ٦٫٠٠ [٥٫٠٠، ٨٫٠٠] ٦٫٠٠ [٤٫٠٠، ٧٫٠٠] ٠٫٠٦
ألم في العضلات أو المفاصل 16 (64.0) 20 (80.0) 15 (60.0) 0.276
ألم الصدر ٨ (٣٢٫٠) 11 (44.0) ٨ (٣٢٫٠) 0.59
ضيق التنفس ٦ (٢٤٫٠) ٤ (١٦٫٠) ٧ (٢٨٫٠) 0.59
فقدان حاسة الشم ٣ (١٢٫٠) ٣ (١٢٫٠) ٣ (١٢٫٠) >0.99
التهاب الحلق ٢ (٨.٠) ٥ (٢٠٫٠) ٣ (١٢٫٠) 0.45
أعراض تشبه البرد 1 (4.0) 0 (0.0) ٢ (٨٫٠) 0.35
سعال 0 (0.0) 1 (4.0) 1 (4.0) 0.60
الوسيط مع المدى الربيعي. لم يتم تصحيح قيم p للاختبارات المتعددة. تم توفير بيانات المصدر في ملف بيانات المصدر.
مرضى كوفيد كان لديهم تسلل البلاعم في العضلات الهيكلية مقارنةً بالمجموعات الضابطة السليمة (الشكل 5E). تسبب التمرين في زيادة مماثلة في البلاعم المتسللة في كلا المجموعتين. كانت خلايا T غائبة في الأشخاص الأصحاء، لكنها كانت موجودة في المرضى الذين يعانون من كوفيد طويل قبل تحفيز التعب بعد المجهود (الشكل 5F). أدى التمرين إلى تراكم… الخلايا التائية داخل نسيج العضلات الهيكلية، لكن هذا الاستجابة كانت مخففة لدى المرضى الذين يعانون من التعب بعد المجهود. -لم تختلف الخلايا بين المجموعات وكانت تميل إلى أن تكون أعلى بعد يوم واحد من التمرين (الشكل 5G).
استنتجنا أن الضرر الناجم عن التمرين وتسلل الخلايا المناعية قد يكون بسبب شظايا الحمض النووي الميتوكوندري (mtDNA) التي تدور في الدورة الدموية الجهازية، والتي تعمل كنمط جزيئي مرتبط بالضرر يحفز استجابة التهابية جهازية. ومع ذلك، لم نجد أي دليل على استجابة متزايدة لـ mtDNA الدائر في البلازما من المرضى مقارنة بالمجموعة الضابطة (الشكل التوضيحي التكميلي 7A-F). كما لم نلاحظ زيادة في منتجات تحلل العضلات، مثل الكرياتينين وكيناز الكرياتين، في بلازما كلا المجموعتين (الأشكال التوضيحية التكملية 6B و7G، H). لم تختلف تركيزات الكورتيزول الدائر، التي تعتبر حاسمة في التوسط في استجابات التوتر التوازنية، بين المجموعتين في وقت القياس، سواء مع أو بدون تعديل حسب الوقت منذ الاستيقاظ (الشكل التوضيحي التكميلي 7I).

وجود نوكليوكابسيد فيروس سارس-كوف-2 في العضلات الهيكلية

لتحديد ما إذا كانت بقايا الفيروس تلعب دورًا في الاستجابة المناعية التفاضلية في العضلات الهيكلية في حالة كوفيد طويل الأمد عند تحفيز التعب بعد الجهد ، قمنا بصبغ جميع مقاطع العضلات لـ SARS- بروتين الغلاف النووي. استنتجنا أنه إذا كان استمرار الفيروس يلعب
دور، يجب أن يكون بروتين النيوكليوكابسيد الخاص بـ SARS-CoV-2، والذي يختص بـ SARS-CoV-2 ولا يتأثر بالتطعيمات، موجودًا على الأقل. بينما لم نلاحظ أي تلوين إيجابي في العينات التي تم الحصول عليها قبل تفشي SARS-CoV-2 (الشكل 6A، B)، وجدنا بروتين النيوكليوكابسيد الخاص بـ SARS-CoV-2 في جميع المرضى تقريبًا وكذلك في الأشخاص الأصحاء (الشكل 6A، B). على الرغم من مرور فترة أطول منذ آخر عدوى لدى مرضى كوفيد طويل الأمد، لم يكن هناك اختلاف في كمية بروتين النيوكليوكابسيد بين المجموعات (الشكل 6A)، سواء قبل أو بعد تعديل الوقت منذ آخر عدوى. المشاركون الذين أصيبوا بالعدوى قبل أكثر من 6 أشهر من تسجيل الدراسة لم يظهروا فروقًا في وفرة بروتين النيوكليوكابسيد، لكن لا يمكننا استبعاد وجود عدوى إضافية غير معروفة بدون أعراض. لم يكن بروتين النيوكليوكابسيد الخاص بـ SARS-CoV-2 موجودًا داخل ألياف العضلات، بل في المصفوفة خارج الخلوية، ومع ذلك، لم يتداخل وجوده بشكل مستمر مع نوى الخلايا. لم يكن هناك ارتباط بين وجود بروتين النيوكليوكابسيد الخاص بـ SARS-CoV-2 والترسبات المحتوية على الأميلويد ( ). لم يتغير تركيز بروتين الكابسيد النووي لـ SARS-CoV-2 بعد تطور التعب بعد المجهود. تشير نتائجنا إلى أن وجود بروتين الكابسيد النووي المتبقي لـ SARS-CoV-2 مشابه بين المرضى والأشخاص الأصحاء، وبالتالي لا يفسر القدرة المحدودة على ممارسة التمارين أو تطور التعب بعد المجهود لدى المرضى المصابين بكوفيد طويل الأمد.

مناقشة

هدفنا إلى فك تشابك الفيزيولوجيا المرضية لانخفاض القدرة على ممارسة التمارين والتعب بعد الجهد لدى مرضى كوفيد طويل الأمد وكشف اضطرابات فيزيولوجية مرضية مميزة في العضلات الهيكلية والدم لدى مرضى كوفيد طويل الأمد باستخدام دراسة طولية محكمة الحالة،
الشكل 4 | المزيد من الترسبات المحتوية على الأميلويد في العضلات الهيكلية، ولكنها ليست موجودة داخل الشعيرات الدموية أو الأوعية اللمفاوية. أ مثال نموذجي لترسبات تحتوي على الأميلويد في العضلات الهيكلية. أظهرت مقاطع العضلات الهيكلية قبل جائحة SARS-CoV-2 المصبوغة بصبغة ثيوفلافين T مستويات مماثلة من الترسبات المحتوية على الأميلويد كما في الضوابط الصحية. ب تركيز الترسبات المحتوية على الأميلويد في العضلات الهيكلية لدى مرضى كوفيد طويل الأمد ( ) كان أعلى (المجموعة: ) مقارنة بالمجموعة الضابطة السليمة ( ) وزادت في مرضى كوفيد طويل الأمد والأشخاص الأصحاء عند ممارسة التمارين (الوقت: ). لم تُعثر على ترسبات تحتوي على الأميلويد داخل الخلايا البطانية، بل بجانب الخلايا البطانية، أو في الفراغ خارج الخلايا
المصفوفة بين الألياف. أجرينا تلوين الأميلويد على جميع المرضى ونُظهر مثالًا نموذجيًا في الأشكال. د لم تكن الترسبات المحتوية على الأميلويد موجودة داخل الأوعية اللمفاوية. تم تحليل البيانات الطولية البارامترية المستمرة (اللوحة ب) باستخدام نموذج خطي مختلط مع تحليل تباين ثنائي الاتجاه. الشريط: . التعب بعد الجهد في متلازمة التعب المزمن. تُظهر مخططات الصندوق الوسيط (الخط الأوسط)، والربيعين الأول والثالث (الحد الأدنى والأعلى للصندوق)، وتُظهر الخطوط المتفرعة نطاق الربيع بين الربعين. تم توفير بيانات المصدر في ملف بيانات المصدر.
تصميم الدراسة الجماعية. أظهر المرضى المصابون بكوفيد طويل الأمد قدرة تمرين منخفضة بشكل ملحوظ، والتي ارتبطت بتغيرات في أيض عضلات الهيكل العظمي وتحول نحو ألياف سريعة التعب. تشمل الفيزيولوجيا المرضية للإرهاق بعد المجهود انخفاضًا حادًا في نشاط إنزيمات الميتوكوندريا في عضلات الهيكل العظمي الناجم عن التمرين، وتراكمًا متزايدًا لترسبات تحتوي على الأميلويد في عضلات الهيكل العظمي، وعلامات على تلف شديد في نسيج العضلات، إلى جانب استجابة خلوية T ضعيفة ناتجة عن التمرين في عضلات الهيكل العظمي. مجتمعة، تساعد هذه النتائج في فك شفرة الفيزيولوجيا الكامنة وراء التعب والقدرة المحدودة على التمرين الناتجة عن تطور الإرهاق بعد المجهود لدى مرضى كوفيد طويل الأمد.
انخفاض القدرة على ممارسة التمارين هو أحد العلامات المميزة لكوفيد طويل الأمد، ويرتبط بعبء كبير على الحياة اليومية لم يحد الجهاز التنفسي والجهاز القلبي المركزي من قدرة التمرين لدى مرضى كوفيد طويل الأمد، لكن نتائجنا تؤكد الاقتراحات السابقة بوجود خلل طرفي في أيض العضلات الهيكلية لدى مرضى كوفيد طويل الأمد. . متسق مع الفرضيات السابقة “، نُظهر أن كوفيد طويل الأمد مرتبط بانخفاض قدرة الفسفرة التأكسدية في العضلات الهيكلية. يشير وجود المزيد من الألياف الهجينة من النوع IIA/X ونادرة من النوع I/IIA في مرضى كوفيد طويل الأمد إلى أن الفيزيولوجيا المرضية لكوفيد طويل الأمد تشمل تحول نوع الألياف نحو نمط أقل تأكسدًا وأكثر تحللًا للجلوكوز. التغيرات الأيضية والبنيوية مدعومة بمجموعات الأيض في الدم الوريدي والعضلات الهيكلية لمرضى كوفيد طويل الأمد، حيث كانت المستقلبات التحللية للجلوكوز أعلى ومستقلبات دورة حمض الستريك أقل. لاحظنا أن تحول نوع الألياف وانخفاض التنفس الميتوكوندري مرتبطان بانخفاض القدرة على التمرين لدى المرضى، لكن هذا لا يساهم بالضرورة في الفيزيولوجيا المرضية للإرهاق بعد المجهود، حيث تحدث تحولات نوع الألياف بوتيرة بطيئة جدًا وقد تكون موجودة قبل كوفيد طويل الأمد. أظهر مشاركونا تفاوتًا كبيرًا في تحمل التمرين ( وقوة الذروة)، نوع الألياف
التركيب، ونشاط إنزيمات الميتوكوندريا، ولكن على الرغم من هذا التباين الكبير، عانى جميع المرضى من التعب بعد الجهد في اليوم التالي لاختبار التمرين. وبناءً عليه، نستنتج أن الفيزيولوجيا المرضية للإرهاق وانخفاض القدرة على التمرين تختلف عن التطور السريع للتعب بعد الجهد لدى مرضى كوفيد طويل الأمد. ومع ذلك، قد يؤدي تطور التعب بعد الجهد إلى مزيد من الانخفاض في القدرة على التمرين لدى المرضى، حيث إن الانخفاض الحاد في نشاط إنزيم SDH الميتوكوندري، وحدوث نخر في الأنسجة، وربما تراكم رواسب تحتوي على الأميلويد داخل العضلات، قد يؤدي إلى تفاقم أيض العضلات الهيكلية وإنتاج القوة مع مرور الوقت، مما يسبب دائرة هبوطية ضارة.
نقص الأكسجة النسيجية، الناجم عن تراكم الترسبات المحتوية على الأميلويد في أصغر الشعيرات الدموية، يُعتقد أنه يساهم في أعراض كوفيد الطويلة، مثل التعب. وجدنا ضعفًا في استخلاص الأكسجين الطرفي (وانخفاضًا نسبيًا في إزالة الأكسجين) وتركيزًا أعلى من الترسبات المحتوية على الأميلويد في العضلات الهيكلية، لكننا لم نجد دليلًا على انسداد الشعيرات الدموية داخل العضلات الهيكلية. لذلك، لا تدعم نتائجنا فرضية نقص الأكسجة المزمن للنسيج بسبب انسداد الأوعية الدموية الذي يساهم في تطور الأعراض المتعلقة بالعضلات الهيكلية في حالات كوفيد الطويل أو التعب بعد الجهد. لقد قمنا فقط بتقييم وجود الأميلويد، وليس وظيفة البطانة أو تدفق الدم المحلي. وبناءً عليه، يبقى الارتباط المحتمل بين التهاب البطانة المزمن أو انخفاض تدفق الدم وتطور التعب بعد الجهد و/أو عدم تحمل التمارين في كوفيد الطويل أمرًا مفتوحًا. . دراسات إضافية حول تركيب هذه الترسبات التي تحتوي على الأميلويد والدور المحتمل للأجسام المضادة المحبوسة (الذاتية) فيما يتعلق بالإرهاق بعد الجهد وكوفيد طويل الأمد، هناك حاجة مبررة.
قدمت المجموعتان أليافًا متجددة أكثر بعد الخزعة الثانية، مما يشير إلى تأثير محتمل للخزعة الأولى. على الرغم من ذلك، كان لدى مرضى كوفيد طويل الأمد نوى داخلية أكثر، وضمور
يمكن للعدوى الفيروسية أن تغير وظيفة الميتوكوندريا، والعديد من
الألياف، والتنخر البؤري بعد تحفيز التعب بعد الجهد مقارنةً بالأشخاص الأصحاء. يمكن أن يحدث ضمور العضلات الهيكلية والتنخر البؤري أثناء الإصابة الحادة الشديدة بفيروس سارس-كوف-2. ، لكن هذه هي الدراسة الأولى التي تقدم دليلاً على تلف الأنسجة الشديد بعد التمرين الحاد في مرضى كوفيد طويل الأمد. الزيادة في تسلل العضلات الهيكلية لـ البلعميات الكبيرة و تشير خلايا T إلى استجابة مناعية محلية مضطربة في المرضى الذين يعانون من كوفيد طويل الأمد. أظهرت الدراسات أن وجود بروتينات فيروس SARS-CoV-2 المتبقية مرتبط بكوفيد طويل الأمد. أثناء العدوى الحادة بفيروس SARS-CoV-2، يرتفع مستوى بروتين النوكليوكابسيد الخاص بفيروس SARS-CoV-2 بشكل حاد. ، وعلى الرغم من أن مرضانا عانوا من اعتلال عضلي ناتج عن التمرين، لم تكن هناك علامات على وجود أعلى لبروتين الكابسيد النووي لـ SARS-CoV-2 في المرضى الذين يعانون من كوفيد طويل الأمد قبل أو بعد تحفيز ما بعد-
(الوقت: ). هـ: المزيد من المرضى الذين يعانون من كوفيد طويل الأمد كان لديهم تسلل خلايا T موجبة CD3 (المجموعة: ). وجود كان عدد البلعمات أكبر في مرضى كوفيد طويل الأمد (المجموعة: ). لم تكن خلايا B التي تحمل CD20+ موجودة بكثرة في العضلات الهيكلية. جميع اللوحات: كوفيد طويل الأمد المراقبون الأصحاء. تم تحليل البيانات الطولية الفئوية باستخدام الانحدار اللوجستي مع اعتبار “الزمن” كمتغير مرافق. تم إجراء المقارنات اللاحقة (E) باستخدام فروق المتوسطات التجريبية باستخدام حزمة R emmeans مع تعديل BH. الشريط: . الاختصار: PEM؛ التعب بعد الجهد. تم توفير بيانات المصدر في ملف بيانات المصدر.
الشكل 5 | الخصائص المرضية في العضلات الهيكلية لدى مرضى كوفيد طويل الأمد. ألياف ضامرة صغيرة جدًا وزاويّة كانت أكثر وفرة في مرضى كوفيد طويل الأمد وفي خزعة ما بعد التمرين في كلا المجموعتين (المجموعة: ). ب لوحظت مناطق واسعة من الألياف الميتة في من المرضى الذين يعانون من كوفيد طويل الأمد بعد التمرين الشاق (قيمة p للمجموعة: 0.09، مقارنة بالمجموعة الضابطة الصحية. ج النوى الداخلية، التي تشير إلى إصلاح الألياف، كانت أكثر وفرة بشكل ملحوظ (المجموعة: ) في عضلات الهيكل العظمي للمرضى الذين يعانون من كوفيد طويل الأمد، لكنها لم تزد خلال التعب بعد الجهد (PEM). د الألياف التجديدية لم تختلف بين المجموعات، لكنها كانت أكثر وفرة في خزعة ما بعد التمرين
الشكل 6 | تركيزات مماثلة لبروتين النوكليوكابسيد في العضلات الهيكلية لدى مرضى كوفيد طويل الأمد مقارنة بالمجموعة الضابطة. أظهر بروتين النوكليوكابسيد لفيروس SARS-CoV-2 وجوده في جميع المشاركين تقريبًا، لكنه لم يكن أكثر وفرة في كوفيد طويل الأمد ( ) مقارنة بالمجموعة الضابطة السليمة ( “). ب أمثلة نموذجية لبروتين النوكليوكابسيد لفيروس SARS-CoV-2، كمؤشر على استمرار الفيروس، في العضلات الهيكلية. لم تظهر خزعات العضلات الهيكلية التي أُخذت قبل جائحة SARS-CoV-2 أي إشارة عند تلوينها بأجسام مضادة متعددة النسائل IgG ضد بروتين النوكليوكابسيد لـ SARS-CoV-2، مما يشير إلى أن SARS-“.
لم يكن بروتين الكابسيد النووي لـ CoV-2 موجودًا في الأشخاص غير المصابين، مما أكد عدم وجود ارتباط غير محدد. تم تحليل البيانات الطولية المستمرة البارامترية (اللوحة أ) باستخدام نموذج خطي مختلط مع تحليل تباين ثنائي الاتجاه. الشريط: . التعب بعد الجهد في متلازمة التعب المزمن. تُظهر مخططات الصندوق الوسيط (الخط الأوسط)، والربيعين الأول والثالث (الحد الأدنى والأعلى للصندوق)، وتمثل الخطوط المتفرعة نطاق الربيع الربيعي. تم توفير بيانات المصدر في ملف بيانات المصدر.
الإرهاق الناتج عن الجهد. علاوة على ذلك، لم نلاحظ زيادة في تسلل خلايا B في العضلات الهيكلية للمرضى قبل وأثناء فترة الإرهاق الناتج عن الجهد. وجود بروتين الغلاف النووي لفيروس SARS-CoV-2 في العضلات الهيكلية ليس أمرًا مفاجئًا، حيث يمكن أن يتواجد بروتين الغلاف النووي حتى عام بعد الإصابة في الدم. ومع ذلك، من غير المعروف ما إذا كان الفيروس الكامل موجودًا، أو فقط بقايا البروتين. نظرًا لأن بروتين السنبلة يقع على سطح الفيروس الخارجي، فقد يكون لهذا البروتين تأثيرات مختلفة في الالتهاب والتخثر مقارنة ببروتين الغلاف النووي. يشير غياب الفروق الواضحة في كمية بروتين الغلاف النووي والوجود المتساوي لخلايا B وT بعد التمرين إلى أن عوامل أخرى غير استمرار الفيروس مرتبطة بالفسيولوجيا المرضية للإرهاق بعد الجهد لدى مرضى كوفيد طويل الأمد.
هذه الدراسة ذات طبيعة رصدية، ولذلك لا يمكننا إثبات السببية. لقد شملنا فقط الأفراد الذين يعانون من كوفيد طويل شديد، ولكن الشذوذات الملحوظة لا تعكس قلة النشاط البدني. أشارت بيانات مقياس التسارع إلى أن مرضى كوفيد طويل لم يكونوا طريح الفراش، وكان لديهم متوسط عدد خطوات يبلغ خطوات/يوم (الشكل التوضيحي التكميلي 2ج). بينما قد يكون مجموعتنا قد أظهرت سلوكًا خاملًا، فإن عدم النشاط البدني بحد ذاته لا يسبب التعب بعد الجهد ويرتبط بضمور العضلات وانخفاض نشاط SDH الميتوكوندري. ، وهو ما لم نلاحظه في تحليلنا العرضي. نظرًا لأن حجم عينة هذه الدراسة صغير نسبيًا، فإن نتائجنا تتطلب التكرار في مجموعات أخرى. دعمًا لعملنا، هناك تغييرات طرفية في الأيض الميتوكوندري والاعتلال العضلي لوحظ مؤخرًا في مرضى كوفيد طويل الأمد، ولكن كيفية تأثير التعب بعد الجهد على تغيرات العضلات الهيكلية تتطلب تأكيدًا إضافيًا. التعب بعد الجهد هو عرض خاص بفئات معينة من المرضى، بما في ذلك كوفيد طويل الأمد والتهاب الدماغ والنخاع العضلي/متلازمة التعب المزمن (ME/CFS). وعلى الرغم من أنه من غير المحتمل أن تكون الفيزيولوجيا المرضية للتعب بعد الجهد مختلفة تمامًا، يجب أن تبرز الأبحاث المستقبلية ما إذا كانت الأسباب الكامنة وراء ذلك…
الفيزيولوجيا المرضية متشابهة في جميع فئات المرضى، بما في ذلك الأطفال والمراهقين .
في الختام، تكشف هذه الدراسة أن الاضطرابات الأيضية المحلية والجهازية، والاعتلال العضلي الشديد الناجم عن التمرين، وتسلل الترسبات المحتوية على الأميلويد، والخلايا المناعية في عضلات الهيكل العظمي لدى مرضى كوفيد طويل الأمد هي من الخصائص الرئيسية للإرهاق بعد الجهد. وبينما تفسر هذه الخصائص أعراض الإرهاق بعد الجهد في كوفيد طويل الأمد، لا تزال المسارات الجزيئية الكامنة وراء هذه التغيرات في المرضى الذين يعانون من الإرهاق بعد الجهد بحاجة إلى التحديد.

طرق
مجتمع الدراسة

أجرينا دراسة حالة-شاهد مستقبلية في عيادة ما بعد كوفيد-19 بمراكز أمستردام الطبية الجامعية (UMC) وكلية العلوم السلوكية وحركة الجسم (جامعة فريجي أمستردام). تمت الموافقة على بروتوكول الدراسة من قبل لجنة الأخلاقيات الطبية في أمستردام UMC (NL78394.018.21) وتم تسجيلها فيwww.clinicaltrials.gov(NCT05225688). وقع جميع المشاركين على موافقة مستنيرة خطية قبل المشاركة. أُجريت الدراسة وفقًا لإعلان هلسنكي.
تم تشخيص مرضى كوفيد طويل الأمد بواسطة طبيبين ذوي خبرة لأعراض كوفيد طويل الأمد واستبعاد التشخيصات التفريقية المحتملة. تم تشخيص جميع مرضى كوفيد طويل الأمد بالإرهاق بعد الجهد (PEM) باستخدام استبيان DSQ-PEM. ، وكان لديهم فترة أدنى من الأعراض المرتبطة بكوفيد طويل الأمد لمدة ستة أشهر، وكان عمرهم بين 18 و65 سنة. لم تكن هناك أعراض قبل التشخيص المؤكد بفيروس سارس-كوف-2. استبيانات تتعلق بالإرهاق، ومقياس شدة الإرهاق (FSS) ، مقياس التعب متعدد الأبعاد (MFI) ، وتم الحصول على DSQPEM طوال فترة الدراسة. لم يُدخل أي من المشاركين المشمولين المستشفى خلال الإصابة الحادة بفيروس SARS-CoV-2 وكانوا بصحة جيدة قبل إجراء اختبار NAAT أو التأكد من الإصابة بفيروس SARS بواسطة التحاليل المصلية-
العدوى. كانت معايير الاستبعاد هي وجود تاريخ طبي لأمراض القلب/الرئة، داء السكري، العلاج المتزامن بأدوية تؤثر على الأيض أو التخثر خلال فترة الدراسة (الستاتينات، الكورتيكوستيرويدات، مثبطات SGLT2، منشطات مستقبلات GLP1، مثبطات تجمع الصفائح الدموية وأي مضادات تخثر)، السمنة ولكن ليس مؤشر كتلة الجسم (مما يحد من أخذ خزعة من عضلة الفخذ الجانبية)، الحمل، العدوى النشطة، الفشل الكلوي الشديد أو أي مرض مزمن سابق معروف بتأثيره على الأداء السريري أو وحدات الكحول في اليوم أو وحدات الكحول في الأسبوع. لم يكن التدخين من معايير الاستبعاد.
لم يكن لدى أي من الأشخاص الأصحاء المتحكمين أعراض متبقية بعد الإصابة بفيروس SARS-CoV-2. تم استبعاد مريض واحد يعاني من كوفيد طويل الأمد بسبب إعادة إصابة حديثة بفيروس SARS-CoV-2 (<7 أيام). انسحب الأشخاص الأصحاء المتحكمون بسبب الطبيعة الغازية للبروتوكول ( )، أعراض مرتبطة بالإرهاق النفسي ( )، وتشخيص جديد لارتفاع ضغط الدم غير المسيطر عليه ( ).

تصميم الدراسة

اتبع جميع المشاركين نفس بروتوكول الدراسة (الشكل التوضيحي التكميلي 1)، مع أربع زيارات على مدى فترة أسبوعين. وصل المشاركون إلى المختبر بعد مرور ساعتين على الأقل من تناول الطعام وتم توجيههم لتجنب الكافيين في يوم زيارة المختبر. تم تحفيز التعب بعد المجهود من خلال اختبار تمرين تصاعدي أقصى في اليوم السابع. تم أخذ خزعات من عضلة الفخذ الوحشية في اليوم الأول (قبل) واليوم الثامن (بعد يوم واحد من اختبار التمرين) باستخدام إبرة بيرغستروم المدعومة بالشفط (Pelomi، ألبرتوند، الدنمارك). تم أخذ كلتا الخزعتين من نفس الشق الذي يبلغ طوله 2 سم؛ تم أخذ الخزعة الأولى نحو الطرف القريب من العضلة وتم أخذ الخزعة الثانية نحو الطرف البعيد من العضلة. تم تخزين العينات في حتى التحليل اللاحق، أو تخزينه كما هو مذكور بخلاف ذلك. تم سحب الدم الوريدي في كل زيارة. تم الحصول على دم مضاد للتخثر باستخدام حمض الإيثيلين ديامين تترا أسيتك (EDTA) في كل زيارة، وتم تخزين البلازما عند خلال 4 ساعات. يمكن العثور على قائمة التحقق من الستروب في ملف البيانات التكميلية.

اختبار التمرين التدريجي المتزايد

لتقييم تحمل التمرين ولإحداث التعب بعد الجهد لدى مرضى كوفيد طويل الأمد، أجرينا اختبار تمرين تصاعدي على جهاز دراجة ثابتة مع تسجيل تخطيط القلب الكهربائي في الوقت نفسه، وقياسات تبادل الغازات الرئوية/التهوية ونقص تأكسج العضلات. تم إجراء جميع اختبارات التمرين على جهاز دراجة ثابتة مزود بكبح إلكتروني (لود إكسكاليبر سبورت، لود، خرونينغن، هولندا). سبق الاختبار فترة راحة هادئة لمدة دقيقتين على الدراجة. الركوب على الدراجة بمستوى منخفض من الشدة (بين 0 و20 واط حسب الطول وكتلة الجسم واللياقة المتوقعة). تلا ذلك زيادة خطية متدرجة في معدل العمل حتى فشل المهمة. تم اختيار معدلات العمل الأساسية الفردية وميل الزيادة بناءً على الخصائص الأنثروبومترية ومستويات النشاط البدني لكل مشارك، وصممت لتحفيز فشل المهمة خلال تم توجيه المشاركين للحفاظ على وتيرتهم بين 70 و90 دورة في الدقيقة، وتم تعريف فشل المهمة على أنه النقطة التي تنخفض فيها الوتيرة إلى أقل من 60 دورة في الدقيقة على الرغم من التشجيع اللفظي. تم تحديد تركيزات اللاكتات في الشعيرات الدموية أثناء الراحة قبل بدء الاختبار، وأثناء ركوب الدراجة في الحالة الأساسية، ومباشرة بعد فشل المهمة (Lactate Pro 2 LT-1730، ARKRAY Ltd.، المملكة المتحدة). تم قياس تبادل الغازات الرئوية والتهوية على أساس كل نفس (Cosmed Quark CPET؛ Cosmed، روما، إيطاليا).
التحليل الطيفي بالأشعة تحت الحمراء القريبة (NIRS). ارتدى المشاركون جهاز NIRS محمول ذو طول موجي مستمر ومحدد مكانياً (Portamon، Artinis Medical Systems، أرنهيم، هولندا) على سطح عضلة الفاستوس لاتراليس، في منتصف المسافة بين رأس عظم الفخذ والكونديل الجانبي. كان هذا بالقرب من موقع خزعة العضلة. تم إجراء القياسات للإجمالي ( الكلي [هيم])، غير مؤكسج ( ديأوكسي [هيم] وأوكسيجينيتيد [هيم] ( [هيم] [الهيموغلوبين +]
الميوغلوبين]، وكذلك تشبع العضلات ( ، أي، أوكسي[هيم]/إجمالي[هيم ) تم تطبيعها إلى قيمة قصوى ودنيا تم الحصول عليها أثناء انسداد تدفق الدم قرب جهاز NIRS باستخدام كفة قابلة للنفخ. باختصار، تم نفخ الكفة بين ، وظل منتفخًا حتى وصل إلى مستوى مستقر في المجموع[الهيم] ديوكسي[هيم]”، و تم الوصول إلى الإشارات، ثم تم تحريرها لاحقًا. الحد الأقصى والأدنى أظهرا النطاق الفسيولوجي لكل فرد، وتم تطبيع جميع القيم إلى هذا النطاق الفسيولوجي. نظرًا لأن أكبر مسافة فصل بين المصدر والكاشف في جهاز NIRS كانت 40 مم، كان المشاركون الذين لديهم سمك نسيج دهني (أو سمك الطية الجلدية ) تم استبعادهم من هذا التحليل. ونتج عن ذلك إدراج 18 من الضوابط و16 من المرضى في التحليل النهائي. فردي تم حساب متوسط بيانات الديوكسي[هيم] كدالة لمخرجات الطاقة المطلقة والنسبية. تم تحليل جميع بيانات NIRS المتعلقة بمعدلات العمل المطلقة والنسبية. تم تحليل معدلات العمل المطلقة بزيادات قدرها 25 واط بدءًا من 50 واط حتى 175 واط، وبعد ذلك لم يتمكن معظم المشاركين من الاستمرار في الاختبار. تم حساب متوسط بيانات NIRS للـ 5 واط أسفل وفوق كل زيادة لتقليل الضوضاء في مجموعة البيانات. وبالمثل، بالنسبة لمعدلات العمل النسبية، تم تحليل البيانات عند 0%، 20%، 40%، 60%، 80%، و100% من معدل العمل الأقصى. تم حساب متوسط البيانات لـ فوق وتحت كل زيادة. تم تحليل جميع البيانات لاحقًا باستخدام نموذج مختلط خطي.

مستوى النشاط البدني في الحياة اليومية

تم قياس النشاط اليومي العام بواسطة مقياس تسارع (Actigraph wGT3X-BT، بتردد أخذ عينات 60 هرتز) يُرتدى على الورك الأيمن (خط الإبط الأمامي) طوال فترة الدراسة، كما وُصف سابقًا. طُلب من المشاركين ارتداء مقياس التسارع من الصباح الباكر حتى وقت النوم. تم تحديد مستوى النشاط البدني اليومي بعدد الخطوات في اليوم. تم تسجيل وقت ذهاب المشاركين إلى النوم واستيقاظهم للسماح بضبط قياسات الكورتيزول.

قياسات العضلات الهيكلية

قياس التنفس في العضلات الهيكلية. تم تقييم وظيفة الميتوكوندريا في الألياف المثقبة كما وُصف سابقًا. . تم اختراق حزم صغيرة من الألياف المعزولة حديثًا باستخدام سابونين لمدة 20 دقيقة عند في محلول يتكون من (بالمليمول) CaEGTA (2.8)، EGTA (7.2)، ATP (5.8)، (6.6)، التورين (20)، الفوسفوكرياتين (15)، الإيميدازول (20)، DTT (0.5) وMES (50) (الرقم الهيدروجيني 7.1). تم غسل النسيج في محلول التنفس الذي يحتوي على EGTA (0.5)، (3)، ك -لاكتوبيونات (60)، التورين (20)، (10)، هيبس (20)، سكروز (110) و BSA خالي من الأحماض الدهنية (الرقم الهيدروجيني 7.1)، تم تجفيفه بسرعة باستخدام منديل، ووزنه ونقله إلى جهاز قياس التنفس (Oxygraph-2k؛ أجهزة أوروبيوروس، إنسبروك، النمسا) في محلول التنفس عند تم الحفاظ على تركيز الأكسجين فوق طوال التجربة لتجنب القيود في إمداد الأكسجين. تم تقييم التنفس الخلفي قبل إضافة الركائز وتم طرحه من جميع القيم اللاحقة. تم تقييم التنفس التسريبي بعد إضافة جلوتامات الصوديوم (10 مللي مول)، مالات الصوديوم (0.5 مللي مول)، وبيروفات الصوديوم (5 مللي مول). تم تقييم التنفس المرتبط بـ NADH (المجمع الأول) بعد إضافة 5 مللي مول من ADP، و السيتوكروم ج لتأكيد عدم وجود تلف في الغشاء الخارجي للميتوكندريا. تم قياس القدرة التأكسدية القصوى، مع الإدخال المتزامن عبر تنفس مرتبط بـ NADH والسكسينات، بعد إضافة 10 مللي مول من السكسينات. تم تحديد أقصى تنفس غير مرتبط عبر التدرج في تركيز كربونيلسيانيد-4-تريفلوورو-ميثوكسي فينيل هيدرازون (FCCP) في خطوات حتى لم يُلاحظ أي زيادة إضافية في استهلاك الأكسجين. تم قياس التنفس المرتبط بالسكسينات بعد حجب المعقد الميتوكوندري الأول باستخدام روتينون. تم إجراء قياسين لكل عينة في وقت واحد، وتم حساب المتوسط للنتائج. تم تطبيع قيم التنفس إلى الوزن الرطب والتعبير عنها بوحدة بيكومول . تم حساب عدة نسب بعد ذلك، وهي نسبة التحكم في الفسفرة التأكسدية/نظام نقل الإلكترون ( )، نظام نقل الإلكترون/الأكسدة
الجدول 3 | تفاصيل حول الأجسام المضادة، بما في ذلك التخفيفات والموردين
معامل الأجسام المضادة، التخفيف، البائع الأجسام المضادة الثانوية (التخفيف)، المورد معرّف RRID
نوع ألياف العضلات BA-D5 (MHC-I)، ، DSHB SC-71 (MHC-IIA)، ، DSHB 6 H 1 (MHC-IIX) ، DSHB (60 دقيقة) WGA 350، 1:25، TMO W11263 (30 دقيقة MHCI (BA-D5)، ، DSHBMHC IIA (SC71)، ، DSHB MHC IIX (6 H 1)، ، DSHB (60 دقيقة) WGA 350، ، TMO W11263 (30 دقيقة) ماعز مضاد للفأر IgG2b 555، 1:1000، إنفيتروجين A21147؛ ماعز مضاد للفأر IgG1 647، 1:1000، إنفيتروجين A21240؛ ماعز مضاد للفأر IgM 488، 1:1000، إنفيتروجين A21042 (60 دقيقة) AB_2235587AB_2147165; AB_1157897; AB_2535783; AB_2535809; AB_2535711
ترسبات تحتوي على الأميلويد ثيوفلافين تي ( المخزون)، 1:10، SigmaAldrich (30 دقيقة) WGA 555، 1:25، TMO W32464 (30 دقيقة) غير متوفر
الخلايا البطانية CD31، IgG1 فأر، 1:50، Abcam ab9498 (حضانة طوال الليل) WGA 350، 1:25، TMO W11263 (30 دقيقة) الأجسام المضادة من الماعز ضد IgG1 للفأر 647، 1:200، Invitrogen A21240 (60 دقيقة) AB_726362
الخلايا البطانية UEA-1 البيوتينيل، 1:100، B-1065، مختبرات فيكتور (30 دقيقة) مجموعة فيكتاستاين إيليت ABC PK-6100، مختبرات فيكتور (30 دقيقة)؛ مادة إيمباكت™ AMEC الحمراء لبيروكسيداز SK-4285، مختبرات فيكتور (10 دقائق) AB_2336766 AB_2336819 AB_2336519
الوعاء اللمفاوي LYVE1، أرنب IgG، 1:50 Abcam 10278 (حضانة طوال الليل) WGA 350، ، TMO W11263 (30 دقيقة) الأجسام المضادة للأرانب من الماعز IgG 647، 1:200، Invitrogen A32733 (60 دقيقة) AB_881387
بروتين الغلاف النووي لفيروس سارس-كوف-2 أجسام مضادة لبروتين النوكليوكابسيد لـ SARS-CoV-2، أرانب PAb، منقى بواسطة تقارب المستضد، 1:500؛ SinoBiological (60 دقيقة) WGA 555، 1:25، TMO W32464 (30 دقيقة) أليكسا فلور ماعز مضاد لأجسام الأرنب IgG 488 بنسبة 1:500، إنفيتروجين A27034 (60 دقيقة) AB_2892769
سي دي 3 SP7 (أرنب موآب)، 1:200، ثيرمو ساينتيفيك Rm-9107-S AB_149924
CD68 PG-M1 IgG 3، 1:200، DAKO M0876 AB_2074844
سي دي 20 L26 IgG 2a، 1:1000، DAKO/M0755 AB_2282030
معرفات موارد البحث RRID.
كفاءة التحكم في الفسفرة ( )، وكفاءة الربط الكيميائي الحيوي .
التلوين المناعي النسيجي. لتصوير مورفولوجيا ألياف العضلات، وعلامات المرض، ووجود ترسبات تحتوي على الأميلويد وجسيمات فيروسية، تم إجراء التلوين (المناعي) النسيجي على شرائح سميكة من خزعات عضلة الفاستوس لاتراليس. يمكن العثور على تفاصيل حول التخفيفات والبائعين في الجدول 1. تم تقييم الضمور والنخر في تلوين الهيماتوكسيلين والإيوزين بواسطة طبيبين مرضيين لم يكونا على علم بتوزيع المجموعات. تم تقييم تسلل الخلايا التائية (CD3) والخلايا البائية (CD20) في العضلات الهيكلية ) والبلعميات الكبيرة (CD68 ) تم تسجيله إيجابيًا أو سلبيًا (الجدول 3)
تركيب نوع الألياف. تم تقييم كمية ونوع ألياف العضلات الهيكلية وحجمها باستخدام تقنيات التألق المناعي باستخدام أجسام مضادة أولية ضد السلسلة الثقيلة للميوسين (MHC) النوع I (BA-D5)، النوع II (SC-71)، والنوع IIx (6H1). . تم تضمين عينة تحكم سلبية بدون وجود جسم مضاد أولي لتصحيح الخلفية. أولاً، تم تجفيف الشرائح بالهواء لمدة 10 دقائق ثم تم حجبها باستخدام مصل الماعز الطبيعي (NGS) لمدة 60 دقيقة. بعد ذلك، تم غسل الشرائح 3 مرات لمدة 5 دقائق لكل مرة في محلول فوسفات متوازن (PBS) بتركيز 1x، وتم حضانتها مع الأجسام المضادة الأولية لمدة 60 دقيقة في درجة حرارة الغرفة. مرة أخرى، تم غسل الشرائح ومن ثم حضانتها مع الأجسام المضادة الثانوية لمدة 60 دقيقة في الظلام عند درجة حرارة الغرفة. مرة أخرى، تم إجراء خطوة غسل تلتها حضانة الشرائح مع أجسام نبات جنين القمح (WGA) لمدة 30 دقيقة في الظلام عند درجة حرارة الغرفة، تلتها خطوة غسل نهائية وتركيب الشرائح باستخدام أغطية زجاجية مع Vectashield Vibrance. تم إجراء التحليل باستخدام ImageJ وصندوق أدوات Sandia Matlab AnalysiS Hierarchy (SMASH) (الإصدار 1.0) في Matlab (الإصدار 2022a). تم التعبير عن توزيع نوع الألياف باستخدام طريقتين: أولاً، بحساب نسبة الألياف التي تعبر عن كل نوع من MHC مقارنةً بإجمالي عدد الألياف الموجودة في العضلة.
القسم. سمح هذا بالتمييز بين الألياف التي تعبر عن كل من MHC-I و MHC-IIa، و MHC-IIa فقط، وكل من MHC-IIx و MHC-IIa. ثانيًا، تم التعبير عن توزيع الألياف كنسبة مئوية من المساحة المقطعية التي تشغلها كل نوع من الألياف من إجمالي المساحة المقطعية لجميع الألياف. سمح هذا بقياس التضخم/الضمور الذي قد يحدث مع تعبير معين لـ MHC.
نشاط ديهيدروجيناز السكسينات. تم تلوين المقاطع لنشاط ديهيدروجيناز السكسينات (SDH)، والذي استخدم كمؤشر على كثافة الميتوكوندريا، كما وُصف سابقًا. . فور القطع، تم تجفيف المقاطع بالهواء لمدة 15 دقيقة ثم غُمرت في محلول مسخن مسبقًا ( ) محلول يحتوي على عازل فوسفات الصوديوم ( 7.6)، سوكسينات الصوديوم (0.2 م)، أزيد الصوديوم (14 مللي مولار) وتترانيترو بلو تترازوليوم (TNBT، 0.55 مللي مولار، سيغما) لمدة 20 دقيقة في الظلام، وتم إيقاف التفاعل بواسطة فترة قصيرة التعرض قبل غسل المقاطع وتركيبها باستخدام الجلسرين-الجيلاتين. تم تخزين المقاطع في وصورت خلال عشرة أيام. تم الحصول على متوسط نشاط SDH من خلال تحديد ألياف العضلات الهيكلية الفردية وتم تقييم الامتصاصية باستخدام ImageJ (NIH، بيثيسدا، الولايات المتحدة الأمريكية). تم التعبير عن القيم كـ لكل سُمك النسيج لكل ثانية من وقت التلوين ( ).
التشعير الشعيري. تم تقييم التشعير الشعيري بواسطة التلوين باستخدام عدس اليوليكس الأوروبي 1 (UEA-1) . تم تجفيف المقاطع بالهواء لمدة 10 دقائق وتثبيتها في الأسيتون المثلج ( ) لمدة 15 دقيقة. بعد ذلك، تم غسل الشرائح 3 مرات لمدة دقيقتين في محلول PBS وتم حجبها بـ ألبومين مصل البقر لمدة 30 دقيقة. بعد ذلك، تم حضانة الشرائح مع UEA-1 لمدة 30 دقيقة في درجة حرارة الغرفة، تلتها خطوات الغسل والحضانة مع مجموعة Vectastain Elite ABC لمدة 30 دقيقة في درجة حرارة الغرفة. بعد الغسل، تم إجراء الحضانة مع ركيزة البيروكسيداز الحمراء لمدة 10 دقائق في درجة حرارة الغرفة، ثم غُسلت، وتم تركيب الشرائح باستخدام الجلسرين-الجيلاتين (مسخن عند ). من الشعيرات الدموية إلى الألياف
النسبة (C/F) وكثافة الشعيرات الدموية (CD) بعدد الشعيرات الدموية لكل تم تحديد نسيج العضلات في برنامج ImageJ.
ترسبات تحتوي على الأميلويد. لتصوير الترسبات التي تحتوي على الأميلويد، تم تعريض مقاطع العضلات الهيكلية لـ ثيوفلافين تي (ThT). تم تلطيخ مقاطع العضلات التي تحتوي على أكبر ترسبات من الأميلويد بالإضافة إلى ذلك باستخدام ThT بالاشتراك مع جسم مضاد محدد لـ CD31 لتصوير الخلايا البطانية وجسم مضاد محدد لـ LYVE-1 لتصوير الأوعية اللمفاوية. أولاً، جُففت المقاطع في الهواء لمدة 10 دقائق ثم ثُبتت في 4% بارافورمالدهيد (PFA) لمدة 5 دقائق فقط للتلوين المزدوج. بعد ذلك، غُسلت الشرائح 3 مرات لمدة 5 دقائق لكل مرة في محلول PBS Tween (PBST) وتم حجبها باستخدام NGS لمدة 60 دقيقة. ثم تم إجراء خطوة غسل مرة أخرى، تلتها حضانة مع الجسم المضاد الأولي (إما CD31 أو LYVE1) في 0.1% ألبومين مصل البقر (BSA) في PBS طوال الليل عند تم تضمين تحكم سلبي بدون الأجسام المضادة الأولية. تم غسل الشرائح في PBST ثم تم حضانتها مع الجسم المضاد الثانوي لمدة 60 دقيقة في الظلام عند درجة حرارة الغرفة. بعد ذلك، تم إجراء خطوة غسل تلتها حضانة في ThT في 0.1% BSA في PBS لمدة 30 دقيقة، تلتها خطوة غسل أخرى. وأخيرًا، تم حضانة الشرائح مع WGA لمدة 30 دقيقة في الظلام عند درجة حرارة الغرفة، تلتها خطوة غسل نهائية وتركيب الشرائح باستخدام أغطية زجاجية باستخدام Vectashield Vibrance.
فيروس كورونا المستجد 2 (SARS-CoV-2). لتحديد وجود الفيروس في خلايا العضلات، تم تلوين الشرائح للكشف عن SARS-CoV- بدأ التلوين بتجفيف المقاطع بالهواء لمدة 10 دقائق، تلاها خطوة الحجب باستخدام 10% مصل الخنزير الجديد (NGS) لمدة 60 دقيقة. تلتها خطوة الغسل ثلاث مرات. فترات في تبع ذلك غسل بـ PBS، ثم تم حضانة الشرائح مع الأجسام المضادة الأولية المضادة لـ N لمدة 60 دقيقة في درجة حرارة الغرفة. تلا ذلك خطوة غسل أخرى، ثم حضانة مع الأجسام المضادة الثانوية لمدة 60 دقيقة في الظلام عند درجة حرارة الغرفة. بعد ذلك، تم إجراء خطوة غسل مرة أخرى، تلتها حضانة مع WGA لمدة 30 دقيقة في الظلام عند درجة حرارة الغرفة. تم غسل الشرائح للمرة الأخيرة وتركيبها باستخدام غطاء زجاجي مع Vectashield صلب التثبيت مع DAPI.
اكتساب الصور. تم تجفيف الشرائح طوال الليل عند قبل التصوير. تم التقاط الصور لتحليل نوع الألياف والتغذية الدموية التكبير باستخدام جهاز مسح الشرائح البحثي VS200 (أوليمبوس) باستخدام برنامج Slideview 5.0. تم التقاط صور SDH باستخدام مجهر DMRB (ليكا، ويتزلار) باستخدام كاميرا CCD، ومرشحات رمادية معايرة، ومنحنى معايرة فردي عند 660 نانومتر. تم التقاط الصور لتلوين ThT المركب عند التكبير باستخدام المجهر الفلوري (Axiovert 200M؛ Zeiss) وبرنامج معالجة الصور Slidebook 5.0. تم التقاط حوالي خمسة عشر صورة لكل عينة، مع 5 صور لكل شريحة-مقطع. تم تقييم جميع الصور يدويًا لاستبعاد تلك التي تحتوي على مناطق خارج نطاق التركيز، أو شوائب، أو مناطق كبيرة من النسيج الضام. تم تصحيح الخلفية لـ CD31 و LYVE-1 بناءً على التحكم السلبي. بالنسبة لـ ThT، تم إجراء تصحيح الخلفية عن طريق تحديد العتبة للتحكم السلبي من أجل… . تم فك التداخل لجميع الأمثلة النموذجية باستخدام برنامج Huygens Professional الإصدار 22.40 (Scientific Volume Imaging، هولندا،http://svi.nl)، باستخدام خوارزمية CMLE، مع حدة: -90، 90 تكرارًا، والإعدادات الافتراضية لقيم نسبة الإشارة إلى الضوضاء والخلفية. بالنسبة لصبغة ThT، تم تطبيق تصحيح خلفية يدوي.
علم الأيض. تم إجراء تحليل الأيض على خزعات من العضلات الهيكلية وعينات الدم الوريدي كما هو موصوف سابقًا، مع بعض التعديلات الطفيفة. طريقتنا في الميتابولوميكس مصممة خصيصًا لتحليل المستقلبات القطبية الرئيسية لأهم المسارات الأيضية بثقة عالية، بدلاً من طريقة غير مستهدفة أوسع حيث تكون عمليات التعريف أقل يقينًا. تم إجراء قياسات التأين الإيجابي والسلبي بشكل منفصل. في أنبوب بسعة 2 مل، يحتوي إما على من البلازما أو متوسط 3.2 ملغ من نسيج العضلات المجفف بالتجميد، تم إضافة الكميات التالية من المعيار الداخلي المذاب في الماء إلى كل عينة: الأدينوزين-
أحادي الفوسفات (5 نانومول)، الأدينوزين. -تريفوسفات (5 نانومول)، ألانين (0.5 نانومول)، -أرجينين (0.5 نانومول)، – حمض الأسبارتيك (0.5 نانومول)، -كارنيتين (0.5 نانومول)، -حمض الستريك (0.5 نانومول)، -سيترولين (0.5 نانومول)، -فركتوز-1،6-ثنائي الفوسفات (1 نانومول)، -جليسين (5 نانومول)، جوانوزين -مونوفوسفات (5 نانومول)، جوانوزين- -تريفوسفات (5 نانومول)، -جلوكوز (10 نانومول)، -جلوكوز-6-فوسفات (1 نانومول)، -حمض الغلوتاميك (0.5 نانومول)، -جلوتامين (0.5 نانومول)، جلوتاثيون (1 نانومول) -إيزوليوسين (0.5 نانومول)، -حمض اللاكتيك (1 نانومول)، -ليوسين (0.5 نانومول)، -لايسين (0.5 نانومول)، – ميثيونين (0.5 نانومول)، -أورنيثين (0.5 نانومول)، -فينيل ألانين (0.5 نانومول)، -برولين (0.5 -بيروفات (0.5 نانومول)، -سيرين (0.5 نانومول)، -حمض السكسينيك (0.5 نانومول)، -ثيمين (1 نانومول)، -تريبتوفان (0.5 نانومول)، -تايروسين (0.5 نانومول)، -فالين (0.5 نانومول). بعد ذلك، أُضيفت المذيبات لتحقيق حجم إجمالي ماء الميثانول، و1 مل من الكلوروفورم. تم تجانس أنسجة العضلات قبل إضافة الكلوروفورم باستخدام جهاز Qiagen TissueLyser II لمدة 5 دقائق بسرعة 30 مرة/ثانية مع كرة فولاذية مقاومة للصدأ قطرها 5 مم من Qiagen في كل أنبوب. تم خلط جميع العينات جيدًا، قبل الطرد المركزي لمدة 10 دقائق عند .
تم نقل الطبقة العلوية التي تحتوي على الطور القطبي إلى أنبوب نظيف بسعة 1.5 مل وجُففت باستخدام مكثف فراغي عند تم إعادة تكوين العينات المجففة في 6:4 (حجم/حجم) ميثانول:ماء. تم تحليل المستقلبات باستخدام نظام كروماتوغرافيا سائلة عالي الأداء فائق السرعة من واترز أكويتي متصل بجهاز بروكر إمباكت II مطياف الكتلة عالي الدقة للغاية بتقنية وقت الطيران Qq. تم الاحتفاظ بالعينات عند أثناء التحليل، و تم حقن كل عينة. تم تحقيق الفصل الكروماتوغرافي باستخدام عمود Merck Millipore SeQuant ZIC-cHILIC (PEEK) (حجم الجسيمات). تم الحفاظ على درجة حرارة العمود عند تألف الطور المتحرك من (أ) 1:9 (حجم/حجم) أسيتونيتريل:ماء و (ب) أسيتونيتريل:ماء، كلاهما يحتوي على أسيتات الأمونيوم. باستخدام معدل تدفق قدره ، تضمن تدرج الكروماتوغرافيا السائلة: التوقف عند المذيب ب، من 0 إلى 2 دقيقة؛ زيادة إلى 54% من المذيب ب عند 13.5 دقيقة؛ تقليل إلى 0% من المذيب ب عند 13.51 دقيقة؛ التوقف عند المذيب ب، من 13.51 إلى 19 دقيقة؛ زيادة تدريجية إلى 100% ب عند 19.01 دقيقة؛ التوقف عند المذيب ب تمت معادلة العمود عن طريق زيادة معدل التدفق إلى في B 19.5-21 دقيقة. تم الحصول على بيانات MS باستخدام التأين السلبي والإيجابي في وضع المسح الكامل عبر النطاق تم تحليل البيانات باستخدام برنامج Bruker TASQ الإصدار 2.1.22.3. تم تطبيع جميع شدة المستقلبات المبلغ عنها إما إلى وزن الأنسجة المجففة بالتجميد أو حجم البلازما، وكذلك إلى المعايير الداخلية ذات أوقات الاحتفاظ والاستجابة المماثلة في جهاز الطيف الكتلي. تم تحديد المستقلبات بناءً على مزيج من الكتلة الدقيقة، وأوقات الاحتفاظ (النسبية)، وبيانات حركة الأيونات، وطيف التجزئة، مقارنةً بتحليل مكتبة المعايير. تم تعويض القياسات التي كانت أقل من الحد الأدنى للقياس بنصف أدنى قيمة. تم استبعاد المستقلبات من التحليل إذا احتوت على قيم مفقودة لأكثر من 5% من العينات. تم استبعاد أربع عينات من ميتابولوميات العضلات الهيكلية خلال مراقبة الجودة.

قياسات الدم الوريدي

تركيزات الهرمونات. تم قياس تركيزات الكورتيزول، كيناز الكرياتين، وكيناز الكرياتين-MB في المختبر السريري بمركز أمستردام الطبي الجامعي، والتفاصيل موضحة في الجدول 4.
الحمض النووي الميتوكوندري المتداول. تم إجراء قياسات الحمض النووي الميتوكوندري (mtDNA) باستخدام عينات البلازما. تم عزل الحمض النووي وفقًا لمجموعة BIOKE NucleoSpin® Tissue. باختصار، تم فصل البلازما عن الدم المجمّع في أنابيب مغطاة بحمض الإيثيلين ديامين تترا أسيتيك عن طريق الطرد المركزي عند لمدة 10 دقائق. بعد ذلك، تم تخفيف البلازما في محلول يحتوي على بي بي إس، بروتيناز K، و المخزن المؤقت B3. بعد الحضانة عند لـ من تمت إضافة الإيثانول إلى المحلول وتم طرده مركزياً لمدة دقيقة واحدة عند ، حيث مرت المحلول عبر عمود غشاء السيليكا. ثم وُضع العمود في أنبوب جمع جديد، وغُسل بـ تمت إضافة محلول العازلة BW وتم الطرد المركزي لمدة دقيقة واحدة
الجدول 4 | تفاصيل حول طرق تركيزات الدم الوريدي
معامل معدات طريقة حدود المرجع
الكورتيزول روش كوباس C8000 التحليل المناعي الكيميائي الضوئي الكهربائي “ECLIA” شركة روش للتشخيص
كرياتين كيناز c702 روش دياغنوستيكس نشط بواسطة NAC، روش دياغنوستيكس الذكور < 171 وحدة/لتر الإناث < 145 وحدة/لتر
كرياتين كيناز-إم بي e602 روش دياغنوستيكس تحليل مناعي ربطي ساندويتش معلم بالإنزيم من روش للتشخيص
في . تم غسله لاحقًا بـ من العازل B5 وتم طرده مركزيًا مرة أخرى لمدة دقيقة واحدة عند . أخيرًا، تمت إضافة من محلول العازل BE، وحُضن لمدة 3 دقائق، ثم تم طرده مركزياً للمرة الأخيرة لمدة دقيقة واحدة عند للحصول على الحمض النووي المعزول النهائي في المحلول. تم استخدام بادئات mtDNA لكل من ND1 وND6 لقياس عدد نسخ mtDNA، باستخدام -طريقة. كل بئر يحتوي على من الحمض النووي الميتوكوندري، من خليط البرايمر، و من Power Up SYBR Green Master mix. بعد ذلك، تم إجراء تفاعل PCR الكمي المزدوج باستخدام جهاز QuantStudio 3 لتفاعل PCR اللحظي لقياس تركيزات DNA الميتوكوندري نسبةً إلى المرجع النووي. تم تطبيع القيم إلى نقطة الوقت الأولى.

التحليل الإحصائي

تم تقييم التوزيعات باستخدام الرسوم البيانية التكرارية واختبارات شابيرو-ويلك. يتم تدوين القيم الفئوية بالأعداد المطلقة مع النسب المئوية بين قوسين. تُعرض المتغيرات الكمية البارامترية كمتوسطات. الانحراف المعياري (SD)، والمتغيرات الكمية غير المعلمية تُعرض كوسيط ونطاقات الربيع بين الربع الأول والربع الثالث (IQR؛ النسب المئوية 25 و75). تُعرض مخططات الصندوق مع الوسيط ونطاق الربيع بين الربع الأول والربع الثالث (النسب المئوية 25 و75) ما لم يُذكر خلاف ذلك. تمثل كل نقطة فردية مشاركًا.
تم تحويل البيانات غير الموزعة توزيعًا طبيعيًا باستخدام تحويل بوكس-كوكس من أجل الحصول على توزيع طبيعي للتحليل الإحصائي. تم تحليل البيانات الفئوية باستخدام اختبار فيشر الدقيق. تم تحليل البيانات المستمرة المعيارية باستخدام… -اختبار أو تحليل التباين، مع اختبار توكي HSD بعدي، حيثما كان ذلك مناسبًا. تم تحليل البيانات المستمرة غير المعلمية باستخدام اختبار مان-ويتني اختبار كروسكال-واليس اختبار، أو اختبار كروسكال-واليس الزوجي مع تصحيح بنجاميني-هوشبرغ (BH) حيثما كان ذلك مناسبًا. تم تحليل الارتباطات باستخدام معامل ارتباط بيرسون للعلاقات الخطية ومعامل ارتباط سبيرمان الرتبي للعلاقات غير الخطية. تم مقارنة معاملات الارتباط باستخدام حزمة R تم تحليل البيانات الطولية الفئوية باستخدام الانحدار اللوجستي مع الوقت (الخط الأساسي ويوم واحد بعد التمرين) كمتغير مرافق. تم تحليل البيانات الطولية المستمرة البارامترية والميتوبولوميات باستخدام نموذج خطي مختلط معمم مع الوقت (الخط الأساسي، يوم واحد، وأسبوع واحد بعد التمرين)، والمجموعة، وتأثيرات التفاعل. تم تعديل بيانات الميتوبولوميات بتصحيح BH ضمن مسار الميتوبولوم المحدد مسبقًا. تم إجراء المقارنات اللاحقة للبيانات الطولية، إذا كان مصطلح التفاعل ذا دلالة إحصائية، باستخدام فروق المتوسطات التجريبية باستخدام حزمة R المسماة emmeans. طرق مع تعديل BH. تم إجراء تحليل بيانات طولية غير معلمية مستمرة من خلال مقارنة دلتا ( ) بين نقاط الزمن. تم تصور بيانات الأيض الطولية مع حساب حجم التأثير باستخدام مقياس هيدجز -القيم < 0.05 (ذو الذيلين) اعتُبرت ذات دلالة إحصائية. تم تحليل جميع البيانات باستخدام استوديو مبني تحت الإصدار 4.0.3 (فريق R الأساسي 2013، فيينا، النمسا).

ملخص التقرير

مزيد من المعلومات حول تصميم البحث متاحة في ملخص تقرير مجموعة نيتشر المرتبط بهذا المقال.

توفر البيانات

ملف بيانات المصدر متاح أدناه. تم إيداع بيانات الميتابولوميات الخام التي تم توليدها في هذه الدراسة في منصة نشر البيانات بجامعة فريجي أمستردام، معhttps://doi.org/10. 48338/VU01-KPABVO. علم الأيض متاح على MetaboLights (برمز تعريف الدراسة: MTBLS9103). يتم توفير بيانات المصدر مع هذه الورقة.

توفر الشفرة البرمجية

رموز R متاحة علىhttps://doi.org/10.5281/zenodo.10171056.

References

  1. Davis, H. E., Mccorkell, L., Vogel, J. M. & Topol, E. J. Long COVID: major findings, mechanisms and recommendations. Nat. Rev. Microbiol. 21, 133-146 (2023).
  2. Hickie, I. et al. Post-infective and chronic fatigue syndromes precipitated by viral and non-viral pathogens: prospective cohort study. BMJ 333, 575-578 (2006).
  3. Ruiz-Pablos, M., Paiva, B., Montero-Mateo, R., Garcia, N. & Zabaleta, A. Epstein-Barr virus and the origin of myalgic encephalomyelitis or chronic fatigue syndrome. Front. Immunol. 12, 4637 (2021).
  4. Ursinus, J. et al. Prevalence of persistent symptoms after treatment for lyme borreliosis: a prospective observational cohort study. Lancet Reg. Health-Eur. 6, 100142 (2021).
  5. Herridge, M. S. & Azoulay, É. Outcomes after critical illness. N. Engl. J. Med. 388, 913-924 (2023).
  6. Subramanian, A. et al. Symptoms and risk factors for long COVID in non-hospitalized adults. Nat. Med. 28, 1706-1714 (2022).
  7. Kedor, C. et al. A prospective observational study of post-COVID-19 chronic fatigue syndrome following the first pandemic wave in Germany and biomarkers associated with symptom severity. Nat. Commun. 13, 1-13 (2022).
  8. Kerkhoff, T. J., Charlton, B. T., Appelman, B., van Vugt, M. & Wüst, R. C. I. Post COVID-19 condition: critical need for a clear definition and detailed pathophysiology. J. Cachexia Sarcopenia Muscle 13, 2754-2756 (2022).
  9. Chilunga, F. P. et al. Differences in incidence, nature of symptoms, and duration of long COVID among hospitalised migrant and nonmigrant patients in the Netherlands: a retrospective cohort study. Lancet Reg. Health Eur. 29, 100630 (2023).
  10. Al-Aly, Z., Bowe, B. & Xie, Y. Long COVID after breakthrough SARS-CoV-2 infection. Nat. Med. 28, 1461-1467 (2022).
  11. Klein, J. et al. Distinguishing features of Long COVID identified through immune profiling. Nature 1-3 (2023) https://doi.org/10. 1038/s41586-023-06651-y.
  12. Hejbøl, E. K. et al. Myopathy as a cause of fatigue in long-term post-COVID-19 symptoms: evidence of skeletal muscle histopathology. Eur. J. Neurol. 29, 2832-2841 (2022).
  13. Pretorius, E. et al. Persistent clotting protein pathology in Long COVID/Post-Acute Sequelae of COVID-19 (PASC) is accompanied by increased levels of antiplasmin. Cardiovasc. Diabetol. 20, 1-18 (2021).
  14. Muri, J. et al. Autoantibodies against chemokines post-SARS-CoV-2 infection correlate with disease course. Nat. Immunol. 1-8 (2023) https://doi.org/10.1038/s41590-023-01445-w.
  15. Wang, E. Y. et al. Diverse functional autoantibodies in patients with COVID-19. Nature 595, 283-288 (2021).
  16. Kruger, A. et al. Proteomics of fibrin amyloid microclots in long COVID/post-acute sequelae of COVID-19 (PASC) shows many entrapped pro-inflammatory molecules that may also contribute to a failed fibrinolytic system. Cardiovasc. Diabetol. 21, 1-23 (2022).
  17. Guo, L. et al. Prolonged indoleamine 2,3-dioxygenase-2 activity and associated cellular stress in post-acute sequelae of SARS-CoV-2 infection. EBioMedicine 94, 104729 (2023).
  18. Soares, M. N. et al. Skeletal muscle alterations in patients with acute Covid-19 and post-acute sequelae of Covid-19. J. Cachexia Sarcopenia Muscle 13, 11-22 (2022).
  19. World Health Organization. Post COVID-19 condition (Long COVID). https://www.who.int/europe/news-room/fact-sheets/item/post-covid-19-condition. (2023)
  20. Frésard, I. et al. Dysfunctional breathing diagnosed by cardiopulmonary exercise testing in ‘long COVID’ patients with persistent dyspnoea. BMJ Open Respir. Res. 9, e001126 (2022).
  21. Schwendinger, F., Knaier, R., Radtke, T. & Schmidt-Trucksäss, A. Low cardiorespiratory fitness post-COVID-19: a narrative review. Sports Med 53, 51-74 (2023).
  22. Skjørten, I. et al. Cardiopulmonary exercise capacity and limitations 3 months after COVID-19 hospitalisation. Eur. Respir. J. 58, 2100996 (2021).
  23. Singh, I. et al. Persistent exertional intolerance after COVID-19: insights from invasive cardiopulmonary exercise testing. Chest 161, 54-63 (2022).
  24. Germain, A. et al. Plasma metabolomics reveals disrupted response and recovery following maximal exercise in myalgic encephalomyelitis/chronic fatigue syndrome. JCI Insight 7, e157621 (2022).
  25. McGregor, N. R., Armstrong, C. W., Lewis, D. P. & Gooley, P. R. Postexertional malaise is associated with hypermetabolism, hypoacetylation and purine metabolism deregulation in ME/CFS cases. Diagnostics 9, 1-11 (2019).
  26. Missailidis, D. et al. An isolated complex V inefficiency and dysregulated mitochondrial function in immortalized lymphocytes from ME/CFS patients. Int. J. Mol. Sci. 21, 1074 (2020).
  27. Wüst, R. C. I. et al. The antibiotic doxycycline impairs cardiac mitochondrial and contractile function. Int. J. Mol. Sci. 22, 4100 (2021).
  28. Beloborodova, N. et al. Effect of phenolic acids of microbial origin on production of reactive oxygen species in mitochondria and neutrophils. J. Biomed. Sci. 19, 89 (2012).
  29. Pedley, A. M., Pareek, V. & Benkovic, S. J. The purinosome: a case study for a mammalian metabolon. Annu. Rev. Biochem. 91, 89-106 (2022).
  30. Kell, D. B., Laubscher, G. J. & Pretorius, E. A central role for amyloid fibrin microclots in long COVID/PASC: origins and therapeutic implications. Biochem. J. 479, 537-559 (2022).
  31. Charnley, M. et al. Neurotoxic amyloidogenic peptides in the proteome of SARS-COV2: potential implications for neurological symptoms in COVID-19. Nat. Commun. 13, 3387 (2022).
  32. Aschman, T. et al. Post-COVID exercise intolerance is associated with capillary alterations and immune dysregulations in skeletal muscles. acta neuropathol commun. 11, 193 (2023).
  33. Nakahira, K., Hisata, S. & Choi, A. M. K. The roles of mitochondrial damage-associated molecular patterns in diseases. Antioxid. Redox Signal. 23, 1329 (2015).
  34. Grazioli, S. & Pugin, J. Mitochondrial damage-associated molecular patterns: from inflammatory signaling to human diseases. Front. Immunol. 9, 1 (2018).
  35. Frere, J. J. et al. SARS-CoV-2 infection in hamsters and humans results in lasting and unique systemic perturbations after recovery. Sci. Transl. Med. 14, eabq3059 (2022).
  36. Littlefield, K. M. et al. SARS-CoV-2-specific T cells associate with inflammation and reduced lung function in pulmonary post-acute sequalae of SARS-CoV-2. PLoS Pathog. 18, e1010359 (2022).
  37. Iwasaki, A. & Putrino, D. Why we need a deeper understanding of the pathophysiology of long COVID. Lancet Infect. Dis. 23, 393-395 (2023).
  38. de Boer, E. et al. Decreased fatty acid oxidation and altered lactate production during exercise in patients with post-acute COVID19 syndrome. Am. J. Respir. Crit. Care Med. 205, 126-129 (2022).
  39. Colosio, M. et al. Structural and functional impairments of skeletal muscle in patients with postacute sequelae of SARS-CoV-2 infection. J. Appl. Physiol. 135, 902-917 (2023).
  40. Posthuma, J. J., van der Meijden, P. E. J., ten Cate, H. & Spronk, H. M. H. Short- and long-term exercise induced alterations in haemostasis: a review of the literature. Blood Rev. 29, 171-178 (2015).
  41. Charfeddine, S. et al. Long COVID 19 syndrome: is it related to microcirculation and endothelial dysfunction? Insights from TUNEndCOV study. Front. Cardiovasc. Med. 8, 745758 (2021).
  42. Turner, S. et al. Long COVID: pathophysiological factors and abnormalities of coagulation. Trends Endocrinol. Metab. 34, 321-344 (2023).
  43. Swank, Z. et al. Persistent circulating severe acute respiratory syndrome coronavirus 2 spike is associated with post-acute coronavirus disease 2019 sequelae. Clin. Infect. Dis. 76, e487-e490 (2023).
  44. Aschman, T. et al. Association between SARS-CoV-2 infection and immune-mediated myopathy in patients who have died. JAMA Neurol. 78, 948-960 (2021).
  45. Mageriu, V., Zurac, S., Bastian, A., Staniceanu, F. & Manole, E. Histological findings in skeletal muscle of SARS-CoV2 infected patient. J. Immunoass. Immunochem. 41, 1000-1009 (2020).
  46. Patterson, B. K. et al. Persistence of SARS CoV-2 S1 protein in CD16+ monocytes in post-acute sequelae of COVID-19 (PASC) up to 15 months post-infection. Front. Immunol. 12, 5526 (2022).
  47. Buonsenso, D. et al. Viral persistence in children infected with SARS-CoV-2: current evidence and future research strategies. Lancet Microbe 4, e745-e756 (2023).
  48. Appelman, B. et al. Time since SARS-CoV-2 infection and humoral immune response following BNT162b2 mRNA vaccination. EBioMedicine 72, 103561 (2021).
  49. Wang, Z. et al. Naturally enhanced neutralizing breadth against SARS-CoV-2 one year after infection. Nature 595, 426-431 (2021).
  50. Gallais, F. et al. Evolution of antibody responses up to 13 months after SARS-CoV-2 infection and risk of reinfection. EBioMedicine 71, 103561 (2021).
  51. Hendrickse, P. W. et al. Capillary rarefaction during bed rest is proportionally less than fibre atrophy and loss of oxidative capacity. J. Cachexia Sarcopenia Muscle 13, 2712-2723 (2022).
  52. Agergaard, J. et al. Myopathy as a cause of Long COVID fatigue: evidence from quantitative and single fiber EMG and muscle histopathology. Clin. Neurophysiol. 148, 65-75 (2023).
  53. Pizzuto, D. A. et al. Lung perfusion assessment in children with longCOVID: a pilot study. Pediatr. Pulmonol. 58, 2059-2067 (2023).
  54. Cotler, J., Holtzman, C., Dudun, C. & Jason, L. A. A brief questionnaire to assess post-exertional malaise. Diagnostics 8, 66 (2018).
  55. Krupp, L. B., Alvarez, L. A., Larocca, N. G. & Scheinberg, L. C. Fatigue in multiple sclerosis. Arch. Neurol. 45, 435-437 (1988).
  56. Smets, E. M. A., Garssen, B., Bonke, B. & De Haes, J. C. J. M. The multidimensional Fatigue Inventory (MFI) psychometric qualities of an instrument to assess fatigue. J. Psychosom. Res. 39, 315-325 (1995).
  57. Clevenger, K. A. et al. Effect of sampling rate on acceleration and counts of hip- and wrist-worn ActiGraph accelerometers in children. Physiol. Meas. 40, 095008 (2019).
  58. Gnaiger E. (2020) Mitochondrial pathways and respiratory control. An introduction to OXPHOS analysis. 5th ed. Bioenerg Commun 2:112 (2020).
  59. Gnaiger, E. Capacity of oxidative phosphorylation in human skeletal muscle: new perspectives of mitochondrial physiology. Int. J. Biochem. Cell Biol. 41, 1837-1845 (2009).
  60. Gnaiger, E. et al. Mitochondrial coupling and capacity of oxidative phosphorylation in skeletal muscle of Inuit and Caucasians in the arctic winter. Scand. J. Med. Sci. Sports 25, 126-134 (2015).
  61. Horwath, O. et al. Variability in vastus lateralis fiber type distribution, fiber size, and myonuclear content along and between the legs. J. Appl. Physiol. 131, 158-173 (2021).
  62. Wüst, R. C. I. et al. Region-specific adaptations in determinants of rat skeletal muscle oxygenation to chronic hypoxia. Am. J. Physiol. Heart Circ. Physiol. 297, H364-74 (2009).
  63. Van Der Zwaard, S. et al. Critical determinants of combined sprint and endurance performance: an integrative analysis from muscle fiber to the human body. FASEB J. 32, 2110-2123 (2018).
  64. Grootemaat, A. E. et al. Lipid and nucleocapsid N-protein accumulation in COVID-19 patient lung and infected cells. Microbiol. Spectr. 10, e0127121 (2022).
  65. Schomakers, B. V. et al. Polar metabolomics in human muscle biopsies using a liquid-liquid extraction and full-scan LC-MS. STAR Protoc. 3, 101302 (2022).
  66. Daimon, T. Box-Cox transformation. Int. Encycl. Stat. Sci. 1, 176-1781 (2011).
  67. Diedenhofen, B. & Musch, J. cocor: a comprehensive solution for the statistical comparison of correlations. PLoS ONE 10, e0121945 (2015).
  68. Searle, S. R., Speed, F. M. & Milliken, G. A. Estimated marginal means, aka least-squares means [ package emmeans version 1.8.5]. Am. Stat. 34, 216-221 (2023).
  69. Hedges, L. V. Distribution Theory for Glass’s estimator of effect size and related estimators. J. Educ. Stat. 6, 107-128 (1981).

الشكر والتقدير

نشكر بشكل خاص جميع المشاركين على وقتهم وتفانيهم في المشاركة في هذه الدراسة. كما نود أن نشكر جميع موظفي عيادة ما بعد كوفيد الخارجية في مستشفى أمستردام الجامعي، وبالأخص الدكتورة موجي-كالفيردا والدكتورة هويزمانس، على دعمهم خلال هذه الدراسة. كما نعترف بمساعدة الدكتور إريك فورن في جمع بيانات قياسات النشاط البدني، وأونو فان دريل في تحليل توزيع نوع الألياف، وجوس دي كونينغ في دعم جمع بيانات التمارين. تم تمويل هذه الدراسة من خلال التمويل الذاتي، وتعاون البحث بقيادة المرضى لمرض كوفيد طويل الأمد (رقم المنحة: C1، [MvV])، ومؤسسة تالود لصندوق أبحاث كورونا في مستشفى أمستردام الجامعي [WWJ]، ومؤسسة AMC [MvV]، ومؤسسة VU [RCIW]، وبرنامج أبحاث ZonMw لمرض ME/CVS [RCIW]، وبرنامج منح رامزي لعام 2022 [RCIW].

مساهمات المؤلفين

قدم كل من ب.أ.، ب.س.، م.ف.ف.، ور.و. مساهمات كبيرة في التصور، التصميم، الحصول على التمويل، تحليل وتفسير البيانات، صياغة العمل، ومراجعة المخطوطة. كما قدم كل من ر.ج.، ت.ك.، إ.ب.، و.ن.، و س.أ. مساهمات كبيرة في التصور، التصميم، تحليل وتفسير البيانات، وصياغة العمل، و…
قاموا بمراجعة المخطوطة بشكل جوهري. لقد قدم كل من F.B.، M.v.W.، B.S.، P.C.، J.P.، E.A.، وW.J.W. مساهمات كبيرة في التصور، التصميم، تحليل البيانات، صياغة ومراجعة المخطوطة. جميع المؤلفين قد وافقوا على النسخة المقدمة ويوافقون على تحمل المسؤولية الشخصية عن مساهماتهم الخاصة وضمان التحقيق المناسب في الأسئلة المتعلقة بدقة أو نزاهة أي جزء من العمل، حتى تلك التي لم يشارك فيها المؤلف شخصيًا، وحلها وتوثيق الحل في الأدبيات.

المصالح المتنافسة

يعلن المؤلفون عدم وجود مصالح متضاربة.

معلومات إضافية

معلومات إضافية النسخة الإلكترونية تحتوي على
المواد التكميلية متاحة على
https://doi.org/10.1038/s41467-023-44432-3.
يجب توجيه المراسلات وطلبات المواد إلى ميشيل فان فوجت أو روب سي. آي. فوست.
معلومات مراجعة الأقران تشكر مجلة نيتشر كوميونيكيشنز دانيلو بونسينسو، ومايكل دومين، والمراجع(ين) الآخر(ين) المجهول(ين) على مساهمتهم في مراجعة الأقران لهذا العمل. ملف مراجعة الأقران متاح.
معلومات إعادة الطبع والأذونات متاحة على
http://www.nature.com/reprints
ملاحظة الناشر: تظل Springer Nature محايدة فيما يتعلق بالمطالبات القضائية في الخرائط المنشورة والانتماءات المؤسسية.
الوصول المفتوح هذه المقالة مرخصة بموجب رخصة المشاع الإبداعي النسبة 4.0 الدولية، التي تسمح بالاستخدام والمشاركة والتكييف والتوزيع وإعادة الإنتاج بأي وسيلة أو صيغة، طالما أنك تعطي الائتمان المناسب للمؤلف(ين) الأصلي(ين) والمصدر، وتوفر رابطًا إلى رخصة المشاع الإبداعي، وتشير إلى ما إذا تم إجراء تغييرات. الصور أو المواد الأخرى التابعة لأطراف ثالثة في هذه المقالة مشمولة في رخصة المشاع الإبداعي للمقالة، ما لم يُذكر خلاف ذلك في سطر الائتمان الخاص بالمادة. إذا لم تكن المادة مشمولة في رخصة المشاع الإبداعي للمقالة وكان استخدامك المقصود غير مسموح به بموجب اللوائح القانونية أو يتجاوز الاستخدام المسموح به، فستحتاج إلى الحصول على إذن مباشرة من صاحب حقوق النشر. لعرض نسخة من هذه الرخصة، قم بزيارةhttp://creativecommons.org/التراخيص/by/4.0/.
© المؤلف(ون) 2024

  1. موقع مستشفى أمستردام الجامعي، جامعة أمستردام، مركز الطب التجريبي والجزيئي، ميبرجدريف 9، أمستردام، هولندا. معهد أمستردام للعدوى والمناعة، الأمراض المعدية، أمستردام، هولندا. قسم علوم حركة الإنسان، كلية العلوم السلوكية وعلوم الحركة، جامعة فريجيه أمستردام، أمستردام، هولندا. علوم الحركة بأمستردام، أمستردام، هولندا. قسم الفسيولوجيا، مركز أمستردام الطبي الجامعي، فرع جامعة فريه أمستردام، دي بولان 1117، أمستردام، هولندا. علوم القلب والأوعية الدموية في أمستردام، أمستردام، هولندا. قسم جراحة الصدمات، مركز أمستردام الطبي الجامعي، جامعة أمستردام، ميبيرجدريف 9، أمستردام، هولندا. مختبر الأمراض الوراثية الأيضية، مرفق التحليل الأيضي الأساسي، مستشفى أمستردام الجامعي، فرع جامعة أمستردام، ميبيرجدريف 9، أمستردام، هولندا. خدمة الأعصاب، قسم علوم الأعصاب والصحة النفسية، مستشفى سانتا ماريا، CHULN، لشبونة، البرتغال. كلية الطب، مركز دراسات إيجاس مونيز، جامعة لشبونة، لشبونة، البرتغال. قسم (علم الأمراض العصبي)، علوم الأعصاب بأمستردام، مركز أمستردام الطبي الجامعي، موقع جامعة أمستردام، ميبيرجدريف 9، أمستردام، هولندا. مستشفى فليفوزيكنهوس، قسم الجراحة، طريق المستشفى 1، ألميري، هولندا. قسم الأمراض المعدية، قسم الطب الباطني، مركز أمستردام الطبي الجامعي، موقع جامعة أمستردام، ميبرجدريف 9، أمستردام، هولندا. قسم الأمراض المعدية، الطب الاستوائي، قسم الطب، مركز أمستردام الطبي الجامعي، فرع جامعة أمستردام، ميبرجدريف 9، أمستردام، هولندا. ساهم هؤلاء المؤلفون بالتساوي: برنت أبلمان، بريدن تي. تشارلتون، ميشيل فان فوجت، روب سي. آي. فوست. البريد الإلكتروني:m.vanvugt@amsterdamumc.nl; r.wust@vu.nl
  2. الوسيط مع المدى الربيعي. -لم يتم تصحيح القيم الاحتمالية للاختبارات المتعددة. تم توفير بيانات المصدر في ملف بيانات المصدر.

Journal: Nature Communications, Volume: 15, Issue: 1
DOI: https://doi.org/10.1038/s41467-023-44432-3
PMID: https://pubmed.ncbi.nlm.nih.gov/38177128
Publication Date: 2024-01-04

Muscle abnormalities worsen after postexertional malaise in long COVID

Received: 21 March 2023
Accepted: 13 December 2023
Published online: 04 January 2024
(i) Check for updates

Abstract

Brent Appelman © , Braeden T. Charlton , Richie P. Goulding , Tom J. Kerkhoff © , Ellen A. Breedveld (1) , Wendy Noort , Carla Offringa , Frank W. Bloemers , Michel van Weeghel (1) , Bauke V. Schomakers , Pedro Coelho , Jelle J. Posthuma , Eleonora Aronica © , W. Joost Wiersinga © , Michèle van Vugt Rob C. I. Wüst

Abstract

A subgroup of patients infected with SARS-CoV-2 remain symptomatic over three months after infection. A distinctive symptom of patients with long COVID is post-exertional malaise, which is associated with a worsening of fatigue- and pain-related symptoms after acute mental or physical exercise, but its underlying pathophysiology is unclear. With this longitudinal casecontrol study (NCT05225688), we provide new insights into the pathophysiology of post-exertional malaise in patients with long COVID. We show that skeletal muscle structure is associated with a lower exercise capacity in patients, and local and systemic metabolic disturbances, severe exerciseinduced myopathy and tissue infiltration of amyloid-containing deposits in skeletal muscles of patients with long COVID worsen after induction of postexertional malaise. This study highlights novel pathways that help to understand the pathophysiology of post-exertional malaise in patients suffering from long COVID and other post-infectious diseases.

Chronic sequelae after acute infections contribute to debilitating conditions that affect millions worldwide . After an acute SARS-CoV-2 infection, a subgroup of patients suffers from post-acute sequelae of COVID-19 (PASC), also called long COVID . The most reported symptoms of long COVID include limited exercise tolerance and post-
exertional malaise, representing the worsening of symptoms after mental or physical exertion . Current, yet unproven hypotheses explaining exercise tolerance and post-exertional malaise in long COVID include mitochondrial dysfunction, amyloid-containing deposit accumulation in blood vessels causing local hypoxia,
systemic and local inflammation, disturbed immunological responses, hormonal imbalance, and viral persistence . The extent to which the underlying physiology of impaired exercise capacity can be separated from factors related to the onset of post-exertional malaise remains unclear, largely due to indirect assessment of the underlying biomedical and psychological parameters, the cross-sectional nature of most studies, and patient heterogeneity.
In this study, we systematically induced post-exertional malaise in a cohort of 25 well-defined patients with long COVID and controls. We obtained blood and skeletal muscle biopsies before and after a maximal exercise test (Supplemental Fig. 1) with the aim to study the biological factors contributing to the limited exercise capacity and postexertional malaise in long COVID. Results were compared with those obtained from 21 age- and sex-matched controls who fully recovered from a mild SARS-CoV-2 infection (Table 1). We characterized Long COVID based on the criteria established by the World Health Organization, and an important inclusion criterion was the presence of postexertional malaise . Both groups were healthy and socially active prior to the initial PCR-proven SARS-CoV-2 infection. No participants were hospitalized due to SARS-CoV-2 infection. Fatigue questionnaires and accelerometer data confirmed the impact of long COVID on daily life (Supplemental Fig. 2). We show that skeletal muscle structure is associated with a lower exercise capacity in patients and that local and systemic metabolic disturbances, severe exercise-induced myopathy and tissue infiltration of amyloid-containing deposits in skeletal muscles of patients with long COVID worsen after induction of postexertional malaise.

Results

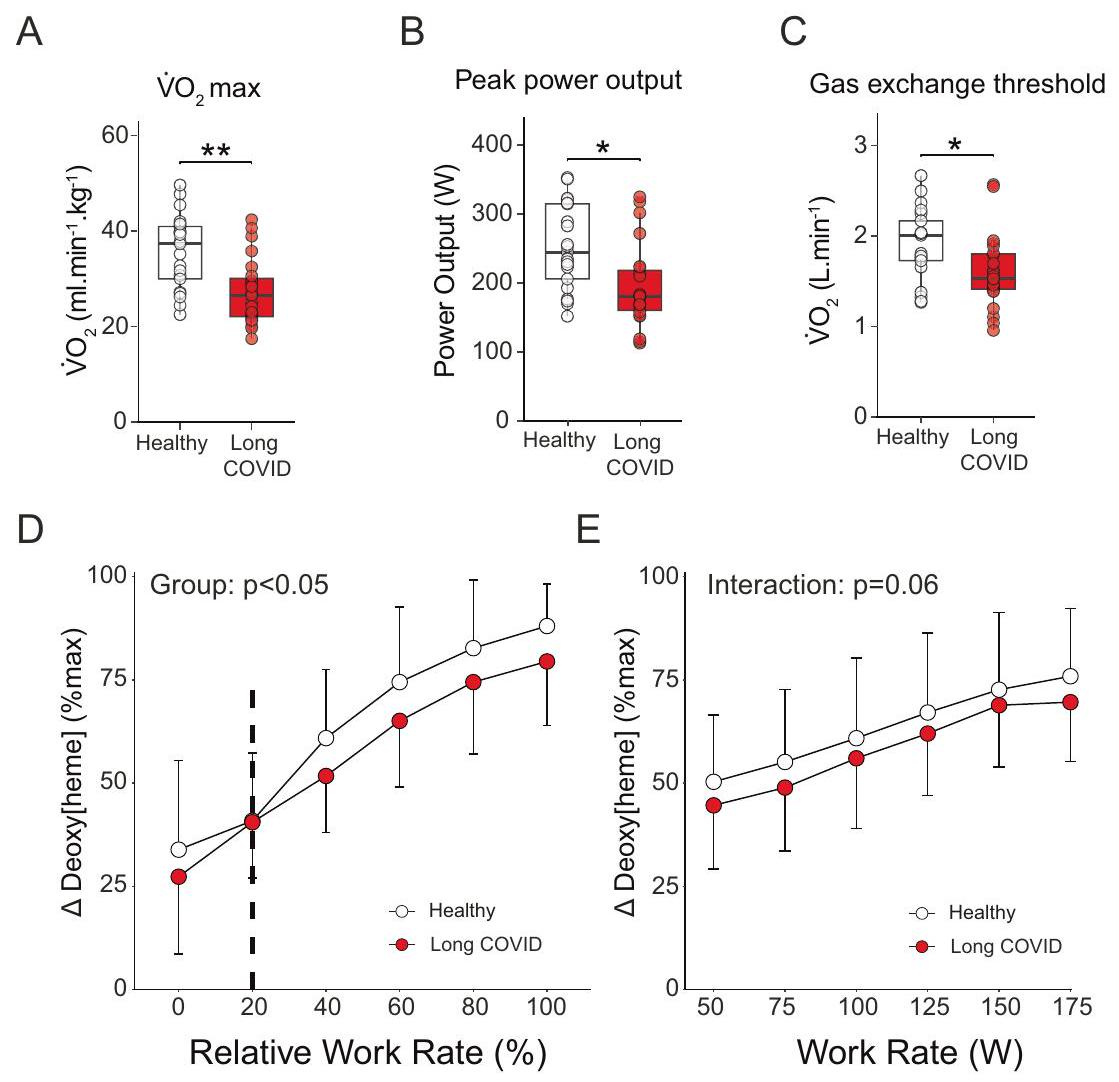
Limited exercise capacity in long COVID

All participants performed a cardiopulmonary exercise test on a cycle ergometer. Maximal oxygen uptake ( ) and peak power output were substantially lower in long COVID patients (Fig. 1A, B), despite marked inter-patient heterogeneity. Patients with long COVID had lower maximal ventilation and lower maximal end-tidal partial pressure of (PETCO2) implying poorer ventilatory function during exercise (Supplemental Fig. 3A-C) . The cardiovascular system was not compromised in long COVID patients (Supplemental Fig. 3D, E), suggesting that this system does not explain the limited exercise capacity in patients with long COVID. The lower maximal pulse (i.e. the product of stroke volume and arteriovenous difference; Supplemental Fig. 3F), gas exchange threshold (Fig. 1C), and peripheral extraction (determined via near-infrared spectroscopy; Fig.1D, E, Supplemental Fig. 3I) during exercise all indicated peripheral skeletal
muscle impairments in patients. The lower in patients was not due to submaximal effort during the exercise test, as the proportion of participants attaining a plateau in did not differ between groups, the gas exchange threshold was at similar percentages of , and secondary criteria ([lactate], maximal RER and heart rate) were attained in both groups (Supplemental Fig. 3E, G, H).
Next, we assessed skeletal muscle structure and function to explain the lower exercise capacity in patients. Capillary density and the capillary-to-fiber ratio were not different between groups (Fig. 2A, . However, patients exhibited a trend towards lower capillary-to-fiber ratios ( , degrees of freedom 46), and capillary-to-fiber ratio correlated to in both groups with identical slope and intercept (Fig. 2C). Compared to healthy controls, we observed a higher proportion of highly fatigable glycolytic fibers in the vastus lateralis muscle in long COVID patients (Fig. 2D, Supplemental Fig. 4A-G), along with a lower cross-sectional area of fatigue-resistant type I fibers in females only (Supplemental Fig. 4D-F). Fiber cross-sectional area was positively associated with maximal power output in both groups (Fig. 2E), albeit with a significantly lower intercept for patients. For a given skeletal muscle size, patients did not attain the same peak power output, suggesting that exercise performance in patients was at least partly explained by intrinsic alterations in skeletal muscle force and fatigue characteristics. Succinate dehydrogenase (SDH) activity (a marker for mitochondrial content) correlated with in healthy controls, but not in patients (Fig. 2F). While patients had a significantly lower oxidative phosphorylation capacity (Fig. 3A, ED 5A-H), no differences were observed in SDH activity (Fig. 3B, C; Supplemental Fig. 5I, J), suggestive of qualitatively lower mitochondrial respiration rather than a lower mitochondrial enzyme activity. Collectively, our data indicate that the lower exercise capacity in long COVID patients is associated with a greater proportion of high-fatigable glycolytic fibers and lower mitochondrial function, with a possible additional limitation of a lower capillarization and the ventilatory system.

Metabolic dysfunction and post-exertional malaise

To understand peripheral factors contributing to the development of post-exertional malaise, we obtained vastus lateralis muscle biopsies before and one day after the induction of post-exertional malaise. All long COVID patients experienced post-exertional malaise following maximal exercise, despite considerable heterogeneity in exercise capacity. Symptoms included muscle pain, greater severity of fatigue, and cognitive symptoms up to 7 days after maximal exercise (Table 2, Supplemental Fig. 2A, B). To systematically assess whether metabolic and mitochondrial dysfunction is associated with the pathophysiology
Table 1 | Participant characteristics
Healthy controls Long COVID -value
Number of participants 21 25
Demographics
Age, mean (SD), years 42 (10) 41 (11) 0.82
Sex, male (%) 10 (47.6) 12 (48.0) >0.99
BMI, mean (SD), 24.14 (3.37) 25.60 (4.62) 0.24
Charlson Comorbidity Index, median [IQR] O [0, 0] O [0,1] 0.76
Hospitalization for COVID-19 0 (0) (0) >0.99
SARS-CoV-2 vaccination before participation (%) 21 (100) 24 (96.0) >0.99
Weekly working hours before initial SARS-CoV-2 infection, median [IQR] 36 [32, 40] 36 [32, 45] 0.520
Weekly working hours during the study, median [IQR] 36 [32, 40] 5 [0,12] <0.001
Time since initial SARS-CoV-2 infection, median [IQR], days 142 [105, 405] 545 [455, 686] 0.001
Time since latest SARS-CoV-2 infection, median [IQR], days 135 [93, 197] 504 [329, 665] 0.002
Fig. 1 | Lower exercise capacity in patients with long COVID. Maximal pulmonary oxygen uptake ( long COVID, healthy control), peak power output (B, long COVID, healthy control) and gas exchange threshold (C, long COVID, healthy control) were all lower ( and , respectively)in patients with long COVID compared to healthy controls. and Muscle deoxygenated [heme] responses (mean ) measured by near-infrared spectroscopy were lower ( ) in long COVID ( ), indicative of lower peripheral oxygen extraction during exercise compared to healthy controls ( ; excessive adipose tissue precluded data analysis in remaining
participants). Continuous parametric data were analyzed using a two-sided -test (panels A-C). Continuous parametric longitudinal data (mean SD; panels and ) were analyzed with a generalized linear mixed model. -values for panel were determined with a two-sided ANOVA test. Dashed line (D) represents the average starting point of the exercise test. ; . Box plots show the median (centerline), the first and third quartiles (the lower and upper bound of the box), and the whiskers show the interquartile range. Source data are provided in the Source Data File.
of post-exertional malaise , we measured mitochondrial respiration and metabolomic signatures in skeletal muscle before and one day after the induction of post-exertional malaise. Mitochondrial respiration was assessed in hyperoxic conditions to avoid diffusion limitation for oxygen that could contribute to exercise intolerance in vivo. Oxidative phosphorylation capacity decreased one day following the maximal exercise in both controls and patients (Fig. 3A). SDH activity was not reduced in healthy controls one day after exercise, but was reduced in the long COVID patients, suggesting that the combination of a reduced maximal mitochondrial respiration and decreased mitochondrial content are part of the pathophysiology of post-exertional malaise.
To better understand the resting skeletal muscle metabolism during post-exertional malaise, we annotated 116 metabolites in skeletal muscle and 83 metabolites in venous blood (Fig. 3D, E, Supplemental Fig. 6A, B). Skeletal muscle biopsies were obtained at rest, and while skeletal muscle glycolytic metabolites displayed few group differences, key metabolites of the tricarboxylic acid (TCA) cycle (including glutamate, , alpha-ketoglutarate and citric acid) were lower in skeletal muscle of long COVID patients (Fig. 3D). The ratio of citric acid to lactate in skeletal muscle was lower in long COVID patients, indicative of a shift away from oxidative metabolism in patients (Supplemental Fig. 6C, D) . Skeletal muscle creatine concentrations were lower in patients with long COVID (Supplemental Fig. 6A), likely contributing to the lower oxidative phosphorylation
capacity in patients. We also observed lower S-adenosylmethionine (SAM) in patients, possibly linking to reduced methylation and SAM cycle activity in long COVID patients. Dihydroxyacetone phosphate, an important intermediate in lipid biosynthesis and glycolysis was reduced in patient skeletal muscle following post-exertional malaise (Fig. 3D). The lower hydroxyphenyl acetic acid in patients is typically associated with increased mitochondrial production of reactive oxygen species (Supplemental Fig. 6A, B) . Metabolites related to pyrimidine and purine synthesis (such as ATP), which is a metabolically demanding process , tended to be lower between healthy controls and long COVID patients upon the induction of post-exertional malaise (Fig. 3D, Supplemental Fig. 6A). Many amino acids were not different between groups at rest, but tended to be lower in patients upon the induction of post-exertional malaise (Supplemental Fig. 6A). Glycolytic metabolites in the venous blood were significantly higher, but pyruvate and other TCA cycle metabolites were lower in patients compared to controls (Fig. 3E). The induction of post-exertional malaise led to a reduction in blood glycolytic metabolites after one week, without changes in TCA cycle metabolites in long COVID patients. Various blood metabolites within the purine pathway were lower in patients compared to controls (Supplemental Fig. 6B) but did not change with the induction of post-exertional malaise. From these analyses, we conclude that TCA cycle metabolites were lower in skeletal muscle and blood in long COVID patients, but did not change during postexertional malaise. Venous blood glycolytic metabolites were higher at
Fig. 2 | Skeletal muscle alterations are associated with exercise capacity in patients with long COVID. A and B examples of skeletal muscle capillaries; no group-differences in capillary density ( ) or capillary:fiber ratio ( ) were observed ( long COVID, healthy control). C A significant association was found between capillary-to-fiber ratio and for both groups ( long COVID, -value: healthy control, -value: 0.007 ). Patients with long COVID ( ) had a higher percentage ( -value: 0.036 ) of glycolytic type IIx compared to healthy controls . E For a given fiber cross-sectional area (FCSA), patients with long COVID ( ) had a significantly lower peak power output ( -value: 0.045 ) as compared to healthy individuals ( ). F Succinate dehydrogenase (SDH) activity in sections (see also Fig. 3) was associated with
maximal oxygen uptake consumption ( ) in healthy controls ( -value: , but not in long COVID patients ( -value: 0.66 ), with significant different correlation coefficients. Continuous parametric data were analyzed using a two-sided t-test (B, D). Correlations were calculated using two-sided Pearson (C, E, F). The difference in intercept was calculated with a linear regression using a two-sided ANOVA (E). Correlation coefficients were compared using the R package cocor. . Bar: . Box plots show the median (centerline), the first and third quartiles (the lower and upper bound of the box), and the whiskers show the interquartile range. Source data are provided in the Source Data File.
baseline and during post-exertional malaise but decreased one week after the induction of post-exertional malaise.

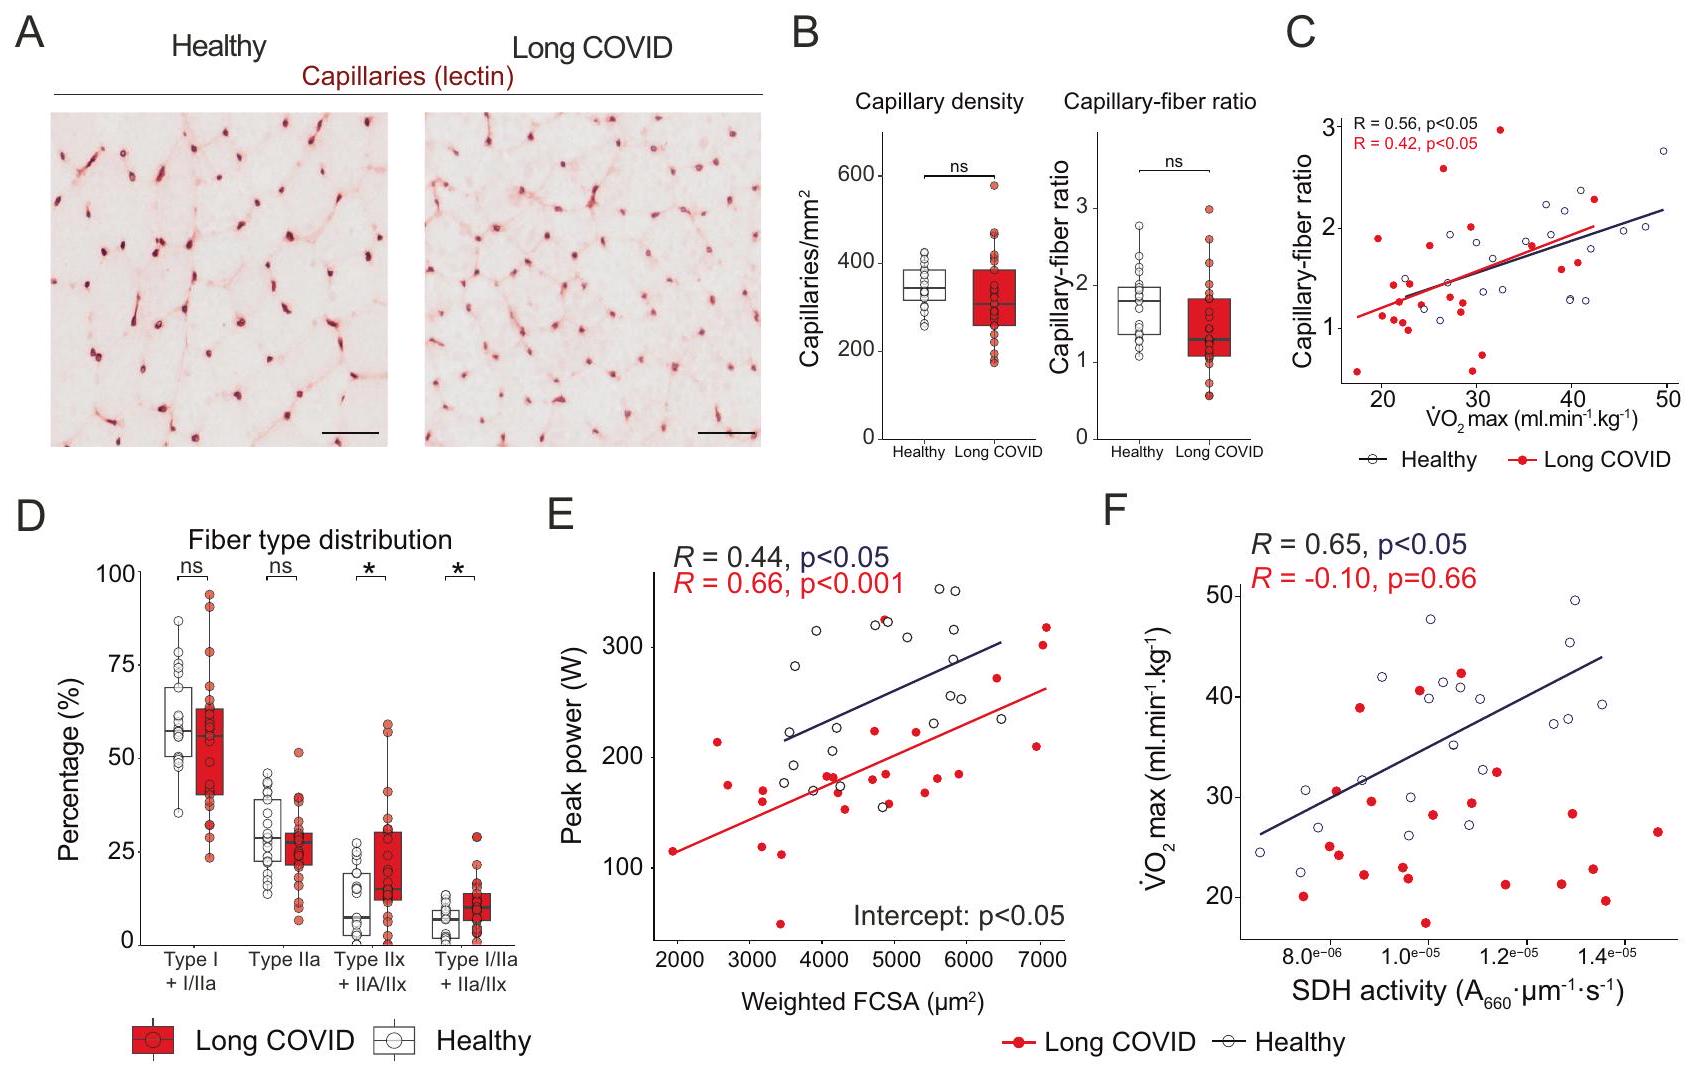
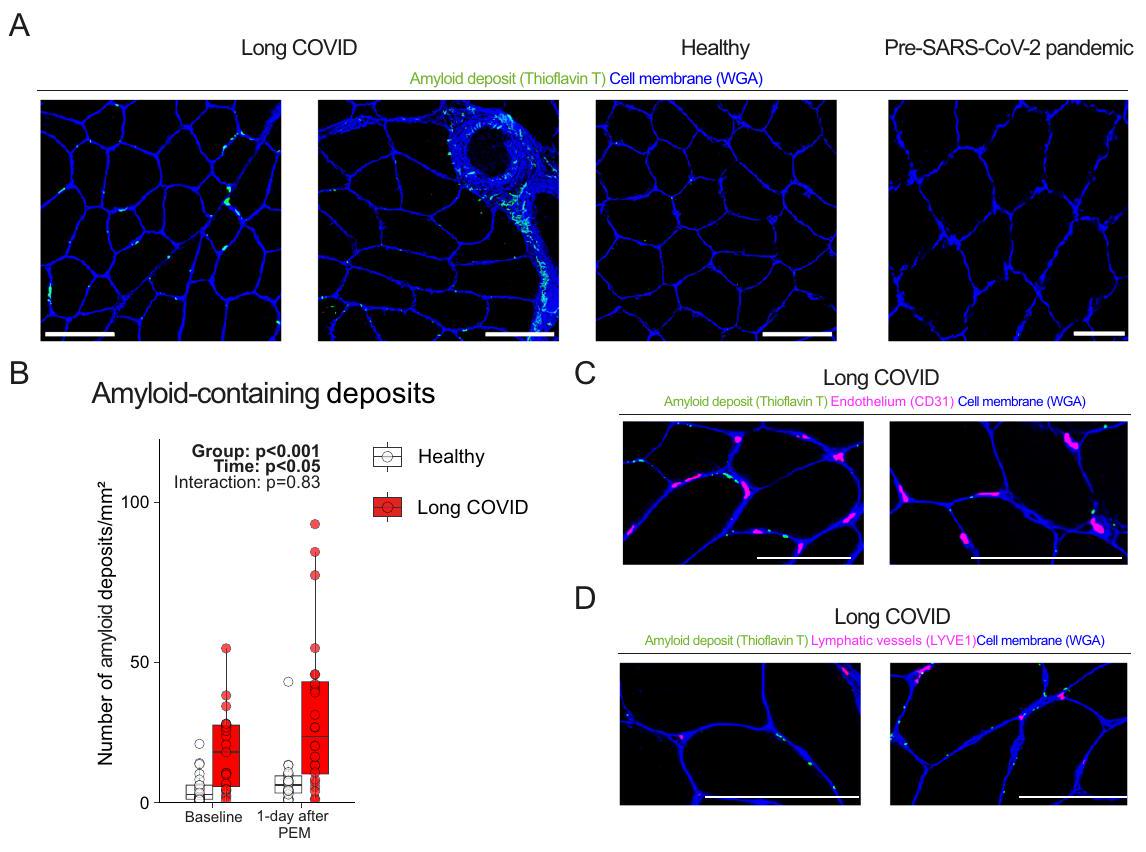
Exercise-induced amyloid-containing deposit accumulation in skeletal muscle

It has been hypothesized that amyloid-containing deposits in the circulation can block local perfusion in long COVID, causing ischemiareperfusion injury . We studied whether amyloid-containing deposits were present in the skeletal muscle of long COVID patients and whether the indication of post-exertional malaise changed the concentration. We demonstrate that the concentration of amyloidcontaining deposits was greater in the skeletal muscle of long COVID patients at baseline, and increased similarly in both groups after the induction of post-exertional malaise (Fig. 4A, B). As an additional control group, skeletal muscle biopsies obtained before the outbreak of SARS-CoV-2 had similar amounts of amyloid-containing deposits as our healthy control group, confirming a basal, non-SARS-CoV-2-specific abundance of amyloid-containing deposits in healthy controls . We next studied the location of these amyloid-containing deposits. Visualizing amyloid-containing deposits together with capillaries or lymph vessels revealed that the skeletal amyloid-containing deposits were not located in capillaries or lymphatic vessels, but rather next to capillaries and in the extracellular matrix between muscle fibers (Fig. 4A, C, D). Amyloid-containing deposits did not overlap with cell nuclei
suggesting that these deposits are located outside infiltrating (immune) cells. We conclude that amyloid-containing deposits are not present within capillaries. Neither did we observe any signs of skeletal muscle tissue hypoxia, as the skeletal muscle capillary-to-fiber ratio, capillary density (Fig. 2B), and intracellular and circulating lactate concentrations (Supplemental Figs. 3G, 6A) were not different between long COVID patients and controls. Therefore, we conclude that post-exertional malaise cannot be explained by the hypothesis that these deposits block vessel perfusion, causing local tissue hypoxia . The underlying reason for the increased intramuscular accumulation of amyloid-containing deposits during post-exertional malaise remains elusive.

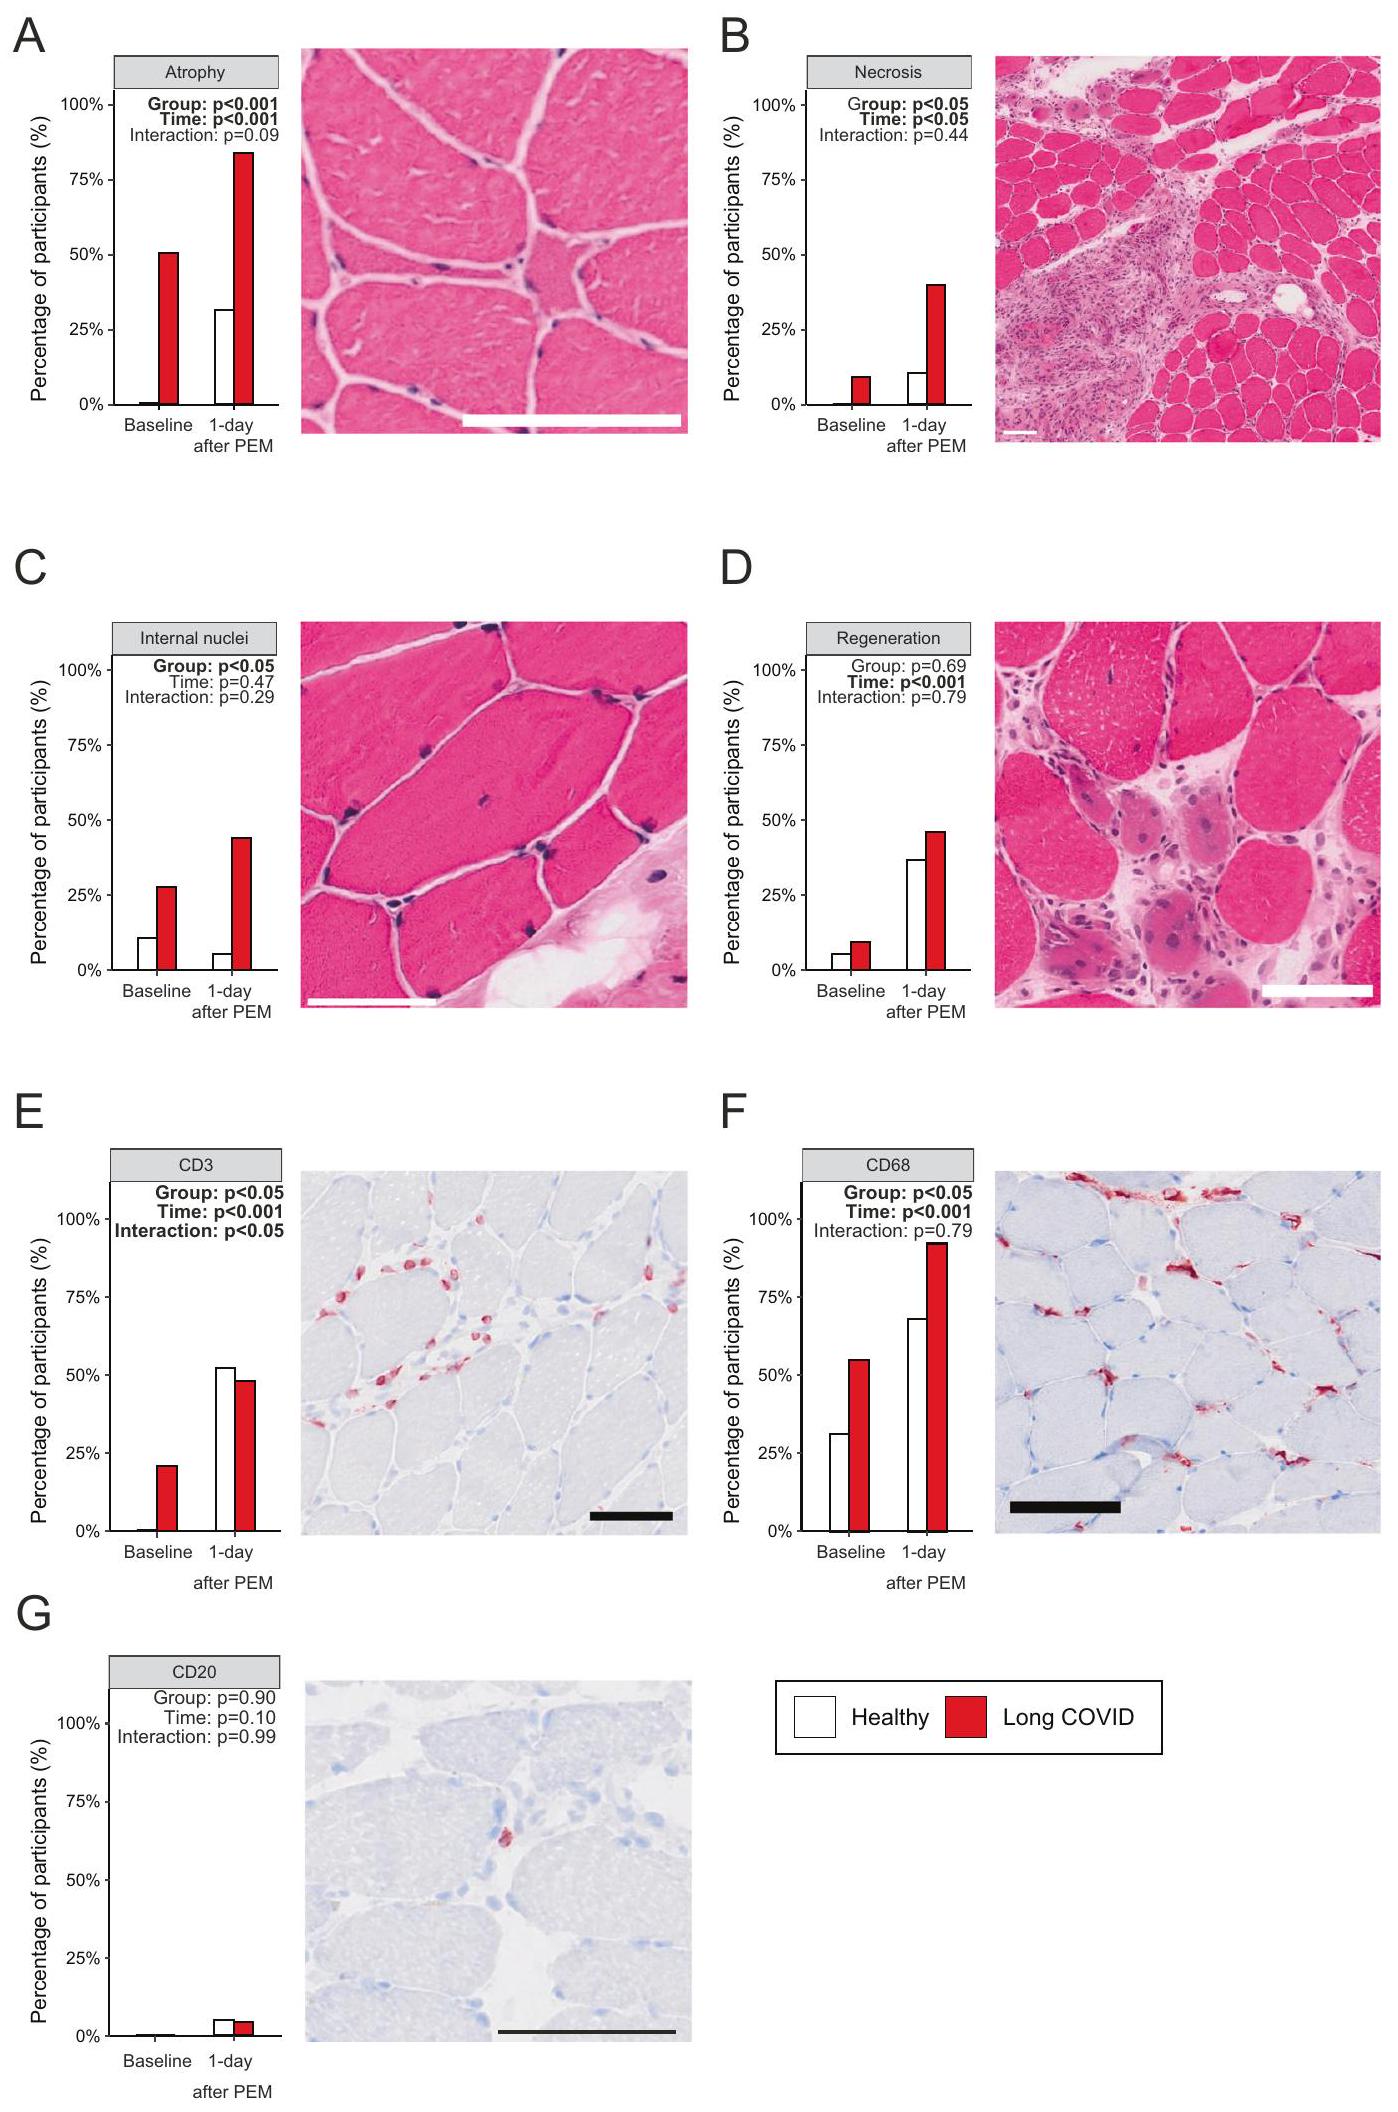
Exercise-induced myopathy in long COVID

To further elucidate the pathophysiology of increased muscle weakness, fatigue, and pain after exercise in long COVID patients, we determined whether specific pathological features were present in skeletal muscle before and after the induction of post-exertional malaise. As the biopsy size was variable between participants and timepoints, we scored biopsies negative/positive for pathological and immunological parameters. A larger percentage of long COVID patients displayed small atrophic fibers and focal necrosis (Fig. 5A, B), which increased significantly after exercise, indicating an exacerbated tissue damage response in patients with long COVID. Since skeletal
A
OXPHOS capacity
B
Succinate dehydrogenase activity
C
Healthy
D
E
Blood metabolomics long COVID compared to healthy
Time of measurement
Baseline
1-day after 1-week after PEM PEM
든응 Hedges’ g effect size
& <0.2
등응
<-0.2
<-0.5
<-0.8 Not detected
muscle is a plastic tissue, signs of skeletal muscle regeneration, such as centralized nuclei (Fig. 5C), were more evident in long COVID patients, also before the induction of post-exertional malaise. Acutely regenerating fibers, evidenced by central nuclei and a basophilic cytoplasm, were seen in biopsies from both groups (Fig. 5D), and exhaustive exercise increased the proportion of regenerating fibers in both healthy controls and long COVID patients without group differences. We
conclude that severe exercise-induced muscle damage and subsequent regeneration are associated with the pathophysiology of postexertional malaise, and can possibly explain muscle pain, fatigue, and weakness in patients with long COVID experiencing post-exertional malaise.
Next, we explored the infiltration of immune cells (macrophages, T – and B-cells) in skeletal muscle upon exhaustive exercise. More long
Fig. 3 | Metabolic and mitochondrial dysfunction in long COVID patients worsens with post-exertional malaise. A Oxidative phosphorylation (OXPHOS) capacity was significantly lower in patients with long COVID ( ) compared to healthy controls ( ), and remained lower one day after induction of postexertional malaise (PEM) in patients (Group: , Time: ). B Succinate dehydrogenase (SDH) activity, a marker for mitochondrial density, was not different between groups ( ) and only reduced ( ) after induction of post-exertional malaise in long COVID patients ( ) compared to healthy controls ( ). A typical example of the SDH activity is shown in panel . Skeletal muscle (D) and venous (E) metabolome pathways indicate slightly higher levels of metabolites related to glycolysis, and a lower abundance of metabolites related to purine synthesis and the tricarboxylic acid (TCA) cycle, indicative of a
lower reliance on oxidative metabolism in patients with long COVID ( , both timepoints) as compared to healthy ( , both timepoints). Faded names were not measured and shown for clarity. A higher effect size in long COVID is shown in red, lower effect size in blue. Continuous parametric longitudinal data (panels were analyzed with a generalized linear mixed model with a two-sided ANOVA. Post-hoc tests comparing each group were performed when the interaction term was significant and was performed using emmeans with BH adjustment (panels and ). Effect sizes ( and ) were calculated with Hedges ; indicates a significant interaction effect. Bar: . PEM postexertional malaise. Box plots show the median (centerline), the first and third quartiles (the lower and upper bound of the box), and the whiskers show the interquartile range. Source data are provided in the Source Data File.
Table 2 | Patient-reported symptoms before and during post-exertional malaise
Symptoms Baseline 1 day after induction of post-exertional malaise 1 week after induction of postexertional malaise -value
Fatigue 25 (100.0) 25 (100.0) 24 (96.0) 0.36
Self-reported fatigue severity intensity (1-10), median [IQR] 6.00 [4.00, 7.00] 7.00 [7.00, 8.00] 7.00 [6.00, 7.25] 0.001
Cognitive problems 20 (80.0) 21 (84.0) 23 (92.0) 0.47
Self-reported cognitive severity intensity (1-10), median [IQR] 4.00 [3.00, 6.25] 6.00 [5.00, 8.00] 6.00 [4.00, 7.00] 0.06
Muscle or joint pain 16 (64.0) 20 (80.0) 15 (60.0) 0.276
Chest pain 8 (32.0) 11 (44.0) 8 (32.0) 0.59
Dyspnea 6 (24.0) 4 (16.0) 7 (28.0) 0.59
Anosmia 3 (12.0) 3 (12.0) 3 (12.0) >0.99
Sore throat 2 (8.0) 5 (20.0) 3 (12.0) 0.45
Cold-like symptoms 1 (4.0) 0 (0.0) 2 (8.0) 0.35
Cough 0 (0.0) 1 (4.0) 1 (4.0) 0.60
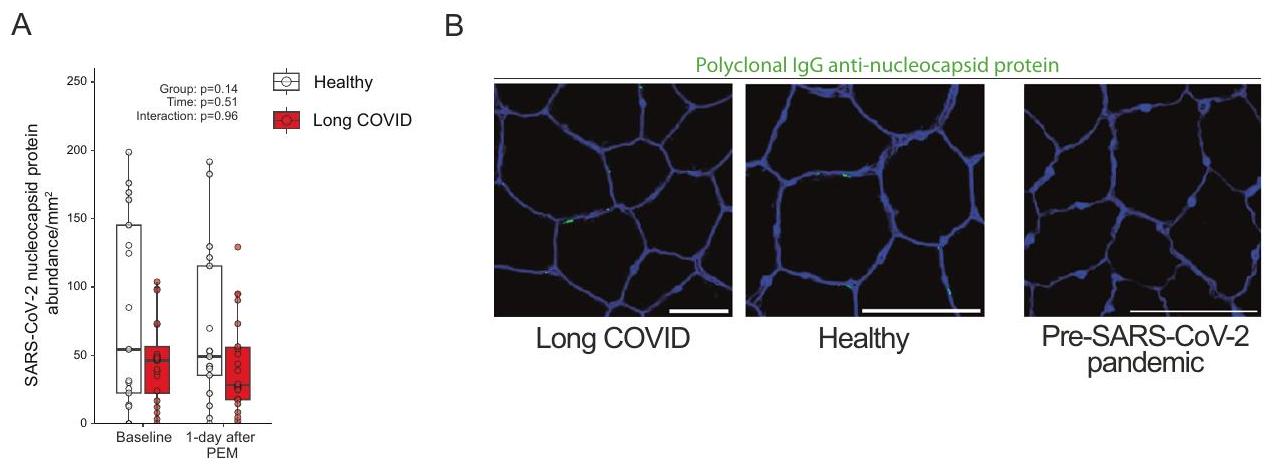
median with interquartile range. p-values were not corrected for multiple testing. Source data are provided in the Source Data File.
COVID patients had macrophage infiltration in skeletal muscle compared to healthy controls (Fig. 5E). Exercise caused a similar increase in infiltrating macrophages in both groups. T-cells were absent in healthy controls, but present in patients with long COVID before induction of post-exertional malaise (Fig. 5F). Exercise resulted in an accumulation of T-cells inside skeletal muscle tissue, but this response was blunted in patients experiencing post-exertional malaise. -cells were not different between groups and tended to be higher one day after exercise (Fig. 5G).
We reasoned that the exercise-induced damage and infiltration of immune cells might be due to mitochondrial DNA (mtDNA) fragments circulating in the systemic circulation, that act as a damage-associated molecular pattern triggering a systemic inflammatory response . However, we did not find any evidence of an exacerbated circulating mtDNA response in plasma from patients compared to controls (Supplemental Fig. 7A-F). Neither did we observe an increase in muscle breakdown products, such as creatinine and creatine kinase, in the plasma of both groups (Supplemental Figs. 6B and 7G, H). Circulating cortisol concentrations, critical for mediating homeostatic stress responses, were not different between groups at the time of measurement, with and without adjustments for time since waking (Supplemental Fig. 7I).

SARS-CoV-2 nucleocapsid presence in skeletal muscle

To determine whether viral remnants play a role in the differential immune response in skeletal muscle in long COVID upon induction of post-exertional malaise , we stained all muscle sections for SARS- nucleocapsid protein. We reasoned that if viral persistence plays
a role, then the SARS-CoV-2 nucleocapsid protein, which is specific to SARS-CoV-2 and not influenced by vaccinations, should be at least present. While we did not observe any positive staining in samples obtained before the outbreak of SARS-CoV-2 (Fig. 6A, B), we found SARS-CoV-2 nucleocapsid protein in almost all patients and healthy controls (Fig. 6A, B). Despite a greater duration since the latest infection in long COVID patients, the amount of SARS-CoV-2 nucleocapsid protein was not different between groups (Fig. 6A), before and after adjusting for time since the latest infection. Participants with an infection >6 months prior to study enrollment showed no differences in the abundance of SARS-CoV-2 nucleocapsid protein, but we cannot exclude additional unknown asymptomatic infections. The SARS-CoV2 nucleocapsid protein was not located inside muscle fibers, but rather in the extracellular matrix, however, its presence did not consistently overlap with cell nuclei. There was no correlation between the presence of SARS-CoV-2 nucleocapsid protein and amyloid-containing deposits ( ). The concentration of SARS-CoV-2 nucleocapsid protein was not altered after the development of post-exertional malaise. Our results suggest that the presence of residual SARS-CoV-2 nucleocapsid protein is similar between patients and healthy controls, and therefore does not explain the limited exercise capacity or development of post-exertional malaise in patients with long COVID.

Discussion

We aimed to disentangle the pathophysiology of a lower exercise capacity and post-exertional malaise in patients with long COVID and reveal distinct pathophysiological abnormalities in skeletal muscle and blood in long COVID patients using a longitudinal, case-controlled,
Fig. 4 | More amyloid-containing deposits in skeletal muscle, but not located inside capillaries or lymphatic vessels. A Typical example of amyloid-containing deposits in skeletal muscle. Pre-SARS-CoV-2 pandemic skeletal muscle sections stained with Thioflavin T showed similar levels of amyloid-containing deposits as healthy controls. B The concentration of amyloid-containing deposits in skeletal muscle in long COVID patients ( ) was higher (Group: ) than in healthy controls ( ) and increased in long COVID patients and healthy controls upon exercise (Time: ). C Amyloid-containing deposits were not found inside endothelial cells, but rather next to endothelial cells, or in the extracellular
matrix between fibers. We performed the amyloid stainings on all patients and show a typical example in the figures. D Amyloid-containing deposits were not located inside lymphatic vessels. Continuous parametric longitudinal data (panel B) were analyzed with a generalized linear mixed model with a two-sided ANOVA. Bar: . PEM post-exertional malaise. Box plots show the median (centerline), the first and third quartiles (the lower and upper bound of the box), and the whiskers show the interquartile range. Source data are provided in the Source Data File.
cohort design. Patients with long COVID displayed a markedly lower exercise capacity, which related to skeletal muscle metabolic alterations and a shift towards more fast-fatigable fibers. The pathophysiology of post-exertional malaise includes an acute exercise-induced reduction in skeletal muscle mitochondrial enzyme activity, an increased accumulation of amyloid-containing deposits in skeletal muscle, signs of severe muscle tissue damage, together with a blunted exercise-induced T-cell response in skeletal muscle. Collectively, these findings help to decipher the underlying physiology of fatigue and a limited exercise capacity from the development of post-exertional malaise in patients with long COVID.
A low exercise capacity is one of the hallmark signs of long COVID, associated with a substantial burden for daily life . The ventilatory and central cardiovascular system did not limit exercise capacity in long COVID patients, but our results confirm previous suggestions of a peripheral impairment in skeletal muscle metabolism in long COVID patients . Consistent with previous hypotheses , we demonstrate that long COVID is associated with a lower skeletal muscle oxidative phosphorylation capacity. The occurrence of more IIA/X hybrid fibers and rare I/IIA hybrid fibers in patients with long COVID suggests that the pathophysiology of long COVID includes a fiber-type shift towards a less oxidative, more glycolytic phenotype. Metabolic and structural alterations are supported by venous blood and skeletal muscle metabolomes of long COVID patients, in which glycolytic metabolites were higher and TCA cycle metabolites were lower. We observed that a fiber-type shift and lower mitochondrial respiration are associated with reduced exercise capacity in patients, but these do not necessarily contribute to the pathophysiology of post-exertional malaise, as fiber-type shifts occur at a very slow pace and could have been present before long COVID. Our participants showed large variability in exercise tolerance ( and peak power), fiber type
composition, and mitochondrial enzyme activity, but despite this large heterogeneity, all patients experienced post-exertional malaise one day after the exercise test. As such, we conclude that the pathophysiology of fatigue and a reduced exercise capacity is distinct from the rapid development of post-exertional malaise in long COVID patients. The development of post-exertional malaise could in turn, however, lead to a further reduction in exercise capacity in patients, as the acute reduction in mitochondrial SDH activity, occurrence of tissue necrosis, and possibly intramuscular accumulation of amyloid-containing deposits could worsen skeletal muscle metabolism and force production over time, causing a vicious downward circle.
Tissue hypoxia, induced by amyloid-containing deposit accumulation in the smallest capillaries has been suggested to contribute to long COVID symptoms, such as fatigue . We found an impaired peripheral oxygen extraction (and relatively lower deoxygenation) and a higher concentration of amyloid-containing deposits in skeletal muscle, but we did not find evidence of blocked capillaries within the skeletal muscle. Our findings therefore do not support the hypothesis of chronic tissue hypoxia due to vessel blockage contributing to the development of skeletal muscle-related symptoms in long COVID or post-exertional malaise. We only evaluated the presence of amyloid, but not the function of the endothelium, or local blood flow. As such, the possible association of chronic endotheliitis or reduced blood flow to the development of post-exertional malaise and/or exercise intolerance in long COVID remains open . Further studies into the composition of these amyloid-containing deposits and the possible role of entrapped (auto-)antibodies in relation to post-exertional malaise and long COVID are warranted.
Both groups presented with more regenerating fibers following the second biopsy, indicating a possible effect of the first biopsy. Despite this, long COVID patients had more internal nuclei, atrophic
Viral infections can alter mitochondrial function, and multiple
fibers, and focal necrosis after induction of post-exertional malaise compared to healthy controls. Skeletal muscle atrophy and focal necrosis can occur during severe acute SARS-CoV-2 infection , but this is the first study providing evidence of severe tissue damage upon acute exercise in long COVID patients. The higher skeletal muscle infiltration of macrophages and T-cells suggests a locally disturbed immune response in patients with long COVID. studies have shown that residual SARS-CoV-2 protein presence is associated with long COVID . During acute SARS-CoV-2 infection, the level of SARS-CoV-2 nucleocapsid protein rises sharply , and although our patients suffered from exercise-induced myopathy, there were no signs of a higher presence of SARS-CoV-2 nucleocapsid protein in patients with long COVID before or after induction of post-
(Time: ). E: More patients with long COVID had CD3+ T-cell infiltration (Group: ). The presence of macrophages was higher in long COVID patients (Group: ). CD20+ B-cells were not abundantly present in skeletal muscle. All panels: long COVID, healthy controls. Categorical longitudinal data were analyzed using logistic regression with “time” as a covariate. Post-hoc comparisons (E) were using the Empirical Mean Differences using R package emmeans with BH adjustment. Bar: . Abbreviation: PEM; postexertional malaise. Source data are provided in the Source Data File.
Fig. 5 | Pathological features in skeletal muscle in patients with long COVID. A Very small and angulated atrophic fibers were more abundant in patients with long COVID and in the post-exercise biopsy in both groups (Group: ). B Large areas of necrotic fibers were observed in of patients with long COVID after exhaustive exercise (Group p-value: 0.09, as compared to healthy controls. C Internal nuclei, indicative of fiber repair, were significantly more abundant (Group: ) in the skeletal muscle of patients with long COVID, but did not increase during post-exertional malaise (PEM). D Regenerative fibers were not different between groups, but were more abundant in the post-exercise biopsy
Fig. 6 | Similar concentrations of nucleocapsid protein in skeletal muscle in patients with long COVID as control. A The SARS-CoV-2 nucleocapsid protein was present in almost all participants, but not more abundant in long COVID ( ) compared to healthy controls ( ). B Typical examples of SARS-CoV-2 nucleocapsid protein, as a marker for viral persistence, in skeletal muscle. Skeletal muscle biopsies from before the SARS-CoV-2 pandemic showed no signal when stained with polyclonal IgG anti-SARS-CoV-2 nucleocapsid protein, indicating that SARS-
CoV-2 nucleocapsid protein was not present in uninfected people which confirmed there was no aspecific binding. Continuous parametric longitudinal data (panel A) were analyzed with a generalized linear mixed model with a two-sided ANOVA. Bar: . PEM post-exertional malaise. Box plots show the median (centerline), the first and third quartiles (the lower and upper bound of the box), and the whiskers show the interquartile range. Source data are provided in the Source Data File.
exertional malaise. Furthermore, we did not observe more B-cell infiltration in the skeletal muscle of patients before and during postexertional malaise. The mere presence of SARS-CoV-2 nucleocapsid protein in skeletal muscle is unsurprising, as nucleocapsid protein can be present up to a year after infection in blood . It is however unknown if the full virus is present, or only protein remnants. Because the spike protein is located on the exterior of the virus, this protein may have different proinflammatory/coagulatory effects compared with the nucleocapsid protein. The absence of clear distinctions in the quantity of nucleocapsid protein and the equal presence of B- and T-cells following exercise suggests that factors other than viral persistence are associated with the pathophysiology of post-exertional malaise in patients with long COVID.
This study is observational in nature, and therefore we cannot establish causality. We only included individuals with severe long COVID, but the observed abnormalities are not reflective of physical inactivity. Accelerometer data indicated that the long COVID patients were not bed-ridden, and had an average step-count of steps/ day (Supplemental Fig. 2C). While our cohort might have displayed sedentary behavior, physical inactivity itself does not cause postexertional malaise and is linked with muscle atrophy and a lower mitochondrial SDH activity , which we did not observe in our crosssectional analysis. As the sample size of this study is relatively small, our results require replication in other cohorts. In support of our work, peripheral alterations in mitochondrial metabolism and myopathy have recently been observed in patients with long COVID, but how post-exertional malaise alters skeletal muscle alterations requires further confirmation. Post-exertional malaise is a symptom that is specific for certain patient populations, including long COVID and myalgic encephalomyelitis/chronic fatigue syndrome (ME/CFS). While it is unlikely that the pathophysiology of post-exertional malaise is completely different, future work should highlight if the underlying
pathophysiology is similar in all patient populations, including children and adolescents .
In conclusion, this study reveals that local and systemic metabolic disturbances, severe exercise-induced myopathy, infiltration of amyloid-containing deposits, and immune cells in skeletal muscles of long COVID are key characteristics of post-exertional malaise. While these explain the symptomatology of post-exertional malaise in long COVID, the molecular pathways underlying these alterations in patients suffering from post-exertional malaise remain to be determined.

Methods
Study population

We performed a prospective case-control study in the post-COVID-19 clinic of the Amsterdam University Medical Centers (UMC) and the Faculty of Behavioral and Movement Sciences (Vrije Universiteit Amsterdam). The study protocol was approved by the medical ethics committee of the Amsterdam UMC (NL78394.018.21) and registered at www.clinicaltrials.gov (NCT05225688). All participants signed a written informed consent before participation. The study was conducted in accordance with the Declaration of Helsinki.
Long COVID patients were diagnosed by two experienced clinicians for long COVID symptomology and exclusion of potential differential diagnoses. All long COVID patients were diagnosed with postexertional malaise (PEM) by the DSQ-PEM , had a minimum period of long COVID-related symptoms of six months, and were between 18 and 65 years old. No symptoms were present before the confirmed diagnosis of SARS-CoV-2. Questionnaires regarding fatigue, fatigue severity score (FSS) , multidimensional fatigue inventory (MFI) , and DSQPEM were obtained throughout the study period. None of the included participants were admitted to the hospital during acute SARS-CoV-2 infection and were healthy prior to NAAT or serology-proven SARS-
infection. Exclusion criteria were a medical history of cardiovascular/pulmonary disease, diabetes mellitus, concurrent treatment with metabolism or coagulant-altering drugs during the study period (statins, corticosteroids, SGLT2 inhibitors, GLP1 receptor agonists, platelet aggregation blockers and any anticoagulants), adiposity but not BMI (limiting the biopsy of the musculus vastus lateralis), pregnancy, active infection, severe renal dysfunction or any other prior chronic illness known to impact clinical performance or alcohol units per day or alcohol units per week. Smoking was not an exclusion criteria.
None of the healthy controls had residual symptoms after the SARS-CoV-2 infection. One long COVID patient was excluded due to a recent SARS-CoV-2 re-infection (<7 days). Healthy controls withdrew because of the invasive nature of the protocol ( ), symptoms related to a burn-out ( ), and a novel diagnosis of uncontrolled hypertension ( ).

Study design

All participants followed the same study protocol (Supplemental Fig. 1), with four visits over a two-week period. Participants arrived at the laboratory at least two hours postprandial and were instructed to avoid caffeine on the day of the laboratory visit. Post-exertional malaise was induced by a maximal incremental ramp exercise test on day 7. Skeletal muscle biopsies were taken from the vastus lateralis on day 1 (before) and day 8 (1 day after exercise testing) using a suctionsupported Bergström needle (Pelomi, Albertlund, Denmark). Both biopsies were taken from the same -2 cm incision; the first biopsy was taken towards the proximal end of the muscle and the second biopsy was taken towards the distal part of the muscle. Samples were stored at until subsequent analysis, or stored as otherwise stated. Venous blood was drawn on every visit. Ethylenediaminetetraacetic acid (EDTA) anticoagulated blood was obtained at each visit, and plasma was stored at within 4 h . The strobe checklist can be found in the supplementary data file.

Incremental ramp exercise test

To assess exercise tolerance and to induce post-exertional malaise in long COVID patients, we conducted an incremental ramp exercise test on a cycle ergometer with simultaneous ECG, pulmonary gas exchange/ventilation and muscle deoxygenation measurements. All exercise tests were conducted on an electronically braked cycle ergometer (Lode Excalibur Sport, Lode, Groningen, The Netherlands). The test was preceded by 2 -min quiet rest on the ergometer and baseline cycling at low intensity (between 0 and 20 W depending on height, body mass and anticipated fitness). This was followed by a ramped, linear increase in work rate until task failure. The individual baseline work rates and ramp slopes were selected based on each participant’s anthropometric characteristics and physical activity levels and designed to elicit task failure within . Participants were instructed to maintain their cadence between 70 and 90 revolutions/min, and task failure was defined as the point at which cadence dropped <60 revolutions/min despite verbal encouragement. Capillary lactate concentrations were determined at rest prior to the onset of the test, during baseline cycling, and immediately following task failure (Lactate Pro 2 LT-1730, ARKRAY Ltd., United Kingdom). Pulmonary gas exchange and ventilation were measured on a breath-bybreath basis (Cosmed Quark CPET; Cosmed, Rome, Italy).
Near-infrared spectroscopy (NIRS). Participants wore a spatiallyresolved, continuous-wavelength portable NIRS device (Portamon, Artinis Medical Systems, Arnhem, The Netherlands) on the surface of the vastus lateralis muscle, halfway between the head of the femur and lateral condyle. This was around the location of the muscle biopsy. Measurements for total ( total[heme]), deoxygenated ( deoxy [heme]) and oxygenated [heme] ( [heme]) [hemoglobin +
myoglobin], as well as muscle saturation ( , i.e., oxy[heme]/total[heme ) were normalized to a maximal and minimal value obtained during blood flow occlusion proximally to the NIRS device using an inflatable cuff. Briefly, a cuff was inflated between , and remained inflated until a plateau in total[heme], deoxy[heme], and signals were reached, and then subsequently released. The maximum and minimum yielded the physiological range for each individual, and all values were normalized to this physiological range. As the greatest source-detector separation distance of the NIRS device was 40 mm , participants with an adipose tissue thickness (or skinfold thickness ) were excluded from this analysis. This resulted in the inclusion of 18 controls and 16 patients in the final analysis. Individual deoxy[heme] data were averaged as a function of absolute and relative power output. All NIRS data was analyzed related to both absolute and relative work rates. Absolute work rates were analyzed at 25 W increments from 50 W until 175 W , after which most participants could not continue the test. NIRS data was averaged for the 5 W below and above each increment to reduce noise in the data set. Similarly, for relative work rates, data was analyzed at 0%, 20%, 40%, 60%, 80%, and 100% of maximal work rate. Data was averaged for the above and below each increment. All data was subsequently analyzed using a linear mixed model.

Daily life physical activity level

General daily activity was measured by an accelerometer (Actigraph wGT3X-BT, 60 Hz sampling time) worn on the right hip (anterior axillary line) during the entire study period, as described previously . Participants were instructed to wear the accelerometer from early morning until bedtime. Daily physical activity level was determined by the number of steps per day. The time at which participants went to sleep and woke up was registered to allow adjustment of cortisol measurements.

Skeletal muscle measurements

Skeletal muscle respirometry. Mitochondrial function was assessed in permeabilized fibers as described previously . Small bundles of freshly isolated fibers were permeabilized with saponin for 20 min at in a solution consisting of (in mM) CaEGTA (2.8), EGTA (7.2), ATP (5.8), (6.6), taurine (20), phosphocreatine (15), imidazole (20), DTT (0.5) and MES (50) ( pH 7.1 ). Tissue was washed in respiration solution containing EGTA (0.5), (3), K -lactobionate (60), taurine (20), (10), HEPES (20), sucrose (110) and fatty acid-free BSA ( pH 7.1 ), quickly blotted dry, weighed and transferred to a respirometer (Oxygraph-2k; Oroboros Instruments, Innsbruck, Austria) in respiration solution at . Oxygen concentration was maintained above throughout the experiment to avoid limitations in oxygen supply. Background respiration was assessed before adding substrates and was subtracted from all subsequent values. Leak respiration was assessed after the addition of sodium glutamate ( 10 mM ), sodium malate ( 0.5 mM ), and sodium pyruvate ( 5 mM ). NADH (Complex I)-linked respiration was assessed after the addition of 5 mM ADP, and cytochrome c to confirm the absence of outer-mitochondrial membrane damage. Maximal oxidative capacity, with simultaneous input via NADH and succinatelinked respiration, was measured after the addition of 10 mM succinate. Maximum uncoupled respiration was determined via titration of carbonylcyanide-4-trifluoro-methoxyphenylhydrazone (FCCP) in steps until no further increase in oxygen consumption was observed. Succinate-linked respiration was measured after blocking mitochondrial complex I with rotenone. Two measurements per sample were performed simultaneously, and the results were averaged. Respiration values were normalized to wet weight and expressed in pmol . Several ratios were subsequently calculated, namely the oxidative phosphorylation/electron transport system control ratio ( ), the electron transport system/oxidative
Table 3 | Details about antibodies, including dilutions and vendors
Parameter Antibody, dilution, vendor Secondary antibody (dilution), vendor RRID
Muscle fiber type BA-D5 (MHC-I), , DSHB SC-71 (MHC-IIA), , DSHB 6 H 1 (MHC-IIX) , DSHB ( 60 min ) WGA 350, 1:25, TMO W11263 ( 30 min MHCI (BA-D5), , DSHBMHC IIA (SC71), , DSHB MHC IIX ( 6 H 1 ), , DSHB ( 60 min ) WGA 350, , TMO W11263 ( 30 min ) Goat-anti-mouse IgG2b 555, 1:1000, Invitrogen A21147; Goat anti-mouse IgG1 647, 1:1000, Invitrogen A21240; Goat anti-mouse IgM 488, 1:1000, Invitrogen A21042 (60 min) AB_2235587AB_2147165; AB_1157897; AB_2535783; AB_2535809; AB_2535711
Amyloidcontaining deposits Thioflavin T ( stock), 1:10, SigmaAldrich ( 30 min ) WGA 555, 1:25, TMO W32464 ( 30 min ) N.A.
Endothelial cells CD31, IgG1 mouse, 1:50, Abcam ab9498 (overnight incubation) WGA 350, 1:25, TMO W11263 ( 30 min ) Goat anti-mouse IgG1 647, 1:200, Invitrogen A21240 ( 60 min ) AB_726362
Endothelial cells Biotinylated UEA-1, 1:100, B-1065, Vector Laboratories ( 30 min ) Vectastain Elite ABC Kit PK-6100, Vector Laboratories ( 30 min ); ImmPACT™ AMEC Red Peroxidase Substrate SK-4285, Vector Laboratories ( 10 min ) AB_2336766 AB_2336819 AB_2336519
Lymphatic vessel LYVE1, IgG rabbit, 1:50 Abcam 10278 (overnight incubation) WGA 350, , TMO W11263 ( 30 min ) Goat anti-rabbit IgG 647, 1:200, Invitrogen A32733 ( 60 min ) AB_881387
SARS-CoV-2 nucleocapsid protein SARS-CoV-2 Nucleocapsid Antibody, Rabbit PAb, Antigen Affinity Purified, 1:500; SinoBiological ( 60 min ) WGA 555, 1:25, TMO W32464 ( 30 min ) Alexa fluor goat-anti rabbit IgG 488 1:500, Invitrogen A27034 (60 min) AB_2892769
CD3 SP7 (rabbit moab), 1:200, Thermo Sc. Rm-9107-S AB_149924
CD68 PG-M1 IgG 3, 1:200, DAKO M0876 AB_2074844
CD20 L26 IgG 2a, 1:1000,DAKO/M0755 AB_2282030
RRID research resource identifiers.
phosphorylation control efficiency ( ), and the biochemical coupling efficiency .
Immuno-histochemistry. To visualize muscle fiber morphology, signs of pathology, and the presence of amyloid-containing deposits and viral particles, (immuno-)histochemistry was carried out on thick sections from the vastus lateralis muscle biopsies. Details about dilutions and vendors can be found in Table 1. Atrophy and necrosis in hematoxylin and eosin staining were evaluated by two pathologists blinded to the group allocation. Skeletal muscle infiltration of T-cells (CD3), B-cells (CD20 ) and macrophages (CD68 ) was scored positively or negatively(Table 3)
Fiber-type composition. Skeletal muscle fiber type quantification and size were assessed using immunofluorescence techniques using primary antibodies against myosin heavy chain (MHC) I (BA-D5), MHC II (SC-71), and MHC IIx ( 6 H 1 ) . A negative control, without a primary antibody, was included for background correction. Firstly, sections were air-dried for 10 min and then blocked with normal goat serum (NGS) for 60 min . Subsequently, slides were washed 3 times for 5 min each in 1x phosphate-buffered saline (PBS) and incubated with the primary antibodies for 60 min at room temperature. Again, slides were washed and subsequently incubated with the secondary antibodies for 60 min in the dark at room temperature. Once more, a washing step was performed and subsequently incubation of the slides with Wheat Germ Agglutinin (WGA) for 30 minutes in the dark at room temperature, followed by a final washing step and mounting the sections with coverslips using Vectashield Vibrance. Analysis was performed with ImageJ and Sandia Matlab AnalysiS Hierarchy (SMASH) Toolbox (version 1.0) in Matlab (version 2022a). Fiber type distribution was expressed using two methods: first, by calculating the percentage of fibers expressing each MHC compared to the total number of fibers present in the muscle
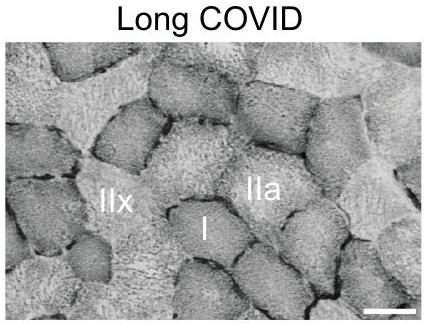
section. This allowed for differentiation between fibers expressing both MHC-I and MHC-IIa, MHC-IIa only, and both MHC-IIx and MHC-Ila. Second, fiber distribution was expressed as the cross-sectional area occupied by each fiber type as a percentage of the cross-sectional area of all fibers. This allowed for quantification of hypertrophy/atrophy that may be occurring with particular MHC expression.
Succinate dehydrogenase activity. Sections were stained for succinate dehydrogenase (SDH) activity, which was used as a proxy for mitochondrial density, as described previously . Immediately after cutting, sections were air-dried for 15 min and then immersed in a preheated ( ) solution containing sodium phosphate buffer ( 7.6), sodium succinate ( 0.2 M ), sodium azide ( 14 mM ) and tetranitro blue tetrazolium (TNBT, 0.55 mM , Sigma) for 20 min in the dark, and the reaction was stopped by brief exposure before sections were washed and mounted with glycerin-gelatin. Sections were stored at and imaged within ten days. The averaged SDH activity was obtained by outlining individual skeletal muscle fibers and absorbance was assessed using ImageJ (NIH, Bethesda, USA). Values were expressed as per tissue thickness per second of staining time ( ).
Capillarization. Capillarization was assessed by staining for Ulex Europaeus Agglutinin 1 lectin (UEA-1) . Sections were air-dried for 10 min and fixated in ice-cold acetone ( ) for 15 min . Subsequently, slides were washed 3 times for 2 min in PBS and blocked with bovine serum album for 30 min . Afterwards, slides were incubated with UEA-1 for 30 min at room temperature, followed by wash steps and incubation with Vectastain Elite ABC kit for 30 min at room temperature. After washing, incubation with Red Peroxidase substrate for 10 min at room temperature was performed, washed, and sections were mounted with glycerin-gelatin (heated at ). Capillary-to-fiber
ratio (C/F) and capillary density (CD) by capillaries per muscle tissue were determined in ImageJ.
Amyloid-containing deposits. To visualize amyloid-containing deposits, skeletal muscle sections were exposed to Thioflavin T (ThT). The muscle sections with the most amyloid-containing deposits were additionally stained with ThT in combination with a CD31-specific antibody to visualize endothelial cells and a LYVE-1-specific antibody to visualize lymph vessels. Firstly, sections were air dried for 10 min and then fixed in 4% paraformaldehyde (PFA) for 5 min only for the double staining. Subsequently, slides were washed 3 times for 5 min each in PBS Tween (PBST) and blocked with NGS for 60 min . Then, again a washing step was completed, followed by incubation with the primary antibody (either CD31 or LYVE1) in 0.1% bovine serum albumin (BSA) in PBS overnight at . A negative control, without a primary antibody, was included. Slides were washed in PBST and subsequently incubated with the secondary antibody for 60 min in the dark at room temperature. Subsequently, a washing step was performed and followed by incubation in ThT in 0.1% BSA in PBS for 30 min , followed by another washing step. Lastly, incubation of the slides with WGA for 30 min in the dark at room temperature, followed by a final washing step and mounting of the sections with coverslips using Vectashield Vibrance.
SARS-CoV-2. To determine viral presence in the muscle cells, the sections were stained for SARS-CoV- . Staining began with air drying the sections for 10 min , followed by a blocking step with 10% NGS for 60 min . A washing step consisting of 3 times intervals in PBS followed, after which the sections were incubated with the primary antibody anti-N for 60 minutes at room temperature. Another washing step followed, and then incubation with the secondary antibody for 60 min in the dark at room temperature. Afterward, a washing step was again performed, followed by incubation with WGA for 30 min in the dark at room temperature. Sections were washed a final time and mounted with a coverslip using a Vectashield hard set with DAPI.
Image acquisition. Slides were dried overnight at before imaging. Images for fiber type and capillarization analysis were taken at magnification with VS200 Research Slide Scanner (Olympus) using Slideview 5.0. SDH images were taken with a DMRB microscope (Leica, Wetzlar) using a CCD camera, calibrated gray filters, and an individual calibration curve at 660 nm . Images for the ThT combination staining were taken at magnification using the fluorescence microscope (Axiovert 200M; Zeiss) and image processing software Slidebook 5.0. Approximately fifteen images were taken per sample, with 5 images per slide-section. All images were manually evaluated to exclude those containing out-of-focus areas, artifacts, and large areas of connective tissue. Background correction for CD31 and LYVE-1 was done based on the negative control. For the ThT, background correction was performed by thresholding the negative control for . All typical examples were deconvolved with Huygens Professional version 22.40 (Scientific Volume Imaging, The Netherlands, http://svi.nl), using the CMLE algorithm, with Acuity: -90,90 iterations, and default settings for SNR and background values. For the ThT staining, a manual background correction was applied.
Metabolomics. Metabolomics was performed on skeletal muscle biopsies and venous blood samples as previously described, with minor adjustments . Our metabolomics method is specifically tailored to analyze key polar metabolites of the most fundamental metabolic pathways with high confidence, instead of a broader untargeted method where identifications are more uncertain. Positive and negative ionization measurements were performed separately. In a 2 mL tube, containing either of plasma or an average of 3.2 mg of freeze dried muscle tissue, the following amounts of internal standard dissolved in water were added to each sample: adenosine-
monophosphate ( 5 nmol ), adenosine. -triphosphate ( 5 nmol ), alanine ( 0.5 nmol ), -arginine ( 0.5 nmol ), -aspartic acid ( 0.5 nmol ), -carnitine ( 0.5 nmol ), -citric acid ( 0.5 nmol ), -citrulline ( 0.5 nmol ), -fructose-1,6-diphosphate ( 1 nmol ), -glycine ( 5 nmol ), guanosine -monophosphate ( 5 nmol ), guanosine- -triphosphate ( 5 nmol ), -glucose ( 10 nmol ), -glucose-6-phosphate ( 1 nmol ), -glutamic acid ( 0.5 nmol ), -glutamine ( 0.5 nmol ), glutathione ( 1 nmol ), -isoleucine ( 0.5 nmol ), -lactic acid ( 1 nmol ), -leucine ( 0.5 nmol ), -lysine ( 0.5 nmol ), -methionine ( 0.5 nmol ), -ornithine ( 0.5 nmol ), -phenylalanine ( 0.5 nmol ), -proline ( 0.5 -pyruvate ( 0.5 nmol ), -serine ( 0.5 nmol ), -succinic acid ( 0.5 nmol ), -thymine ( 1 nmol ), -tryptophan ( 0.5 nmol ), -tyrosine ( 0.5 nmol ), -valine ( 0.5 nmol ). Subsequently, solvents were added to achieve a total volume of water, methanol, and 1 mL chloroform. Muscle tissues were homogenized before the addition of chloroform using a Qiagen TissueLyser II for 5 min at 30 times/s with a 5 mm Qiagen Stainless Steel Bead in each tube. All samples were thoroughly mixed, before centrifugation for 10 min at .
The top layer, containing the polar phase, was transferred to a clean 1.5 mL tube and dried using a vacuum concentrator at . Dried samples were reconstituted in 6:4 (v/v) methanol:water. Metabolites were analyzed using a Waters Acquity ultra-high performance liquid chromatography system coupled to a Bruker Impact II Ultra-High Resolution Qq-Time-Of-Flight mass spectrometer. Samples were kept at during analysis, and of each sample was injected. Chromatographic separation was achieved using a Merck Millipore SeQuant ZIC-cHILIC column (PEEK particle size). The column temperature was held at . The mobile phase consisted of (A) 1:9 (v/v) acetonitrile:water and (B) acetonitrile:water, both containing ammonium acetate. Using a flow rate of , the LC gradient consisted of: Dwell at Solvent B, 0-2 min; Ramp to 54% Solvent B at 13.5 min ; Ramp to 0% Solvent B at 13.51 min ; Dwell at Solvent B, 13.51-19 min; Ramp to 100% B at 19.01 min ; Dwell at Solvent B, . Column equilibration was done by increasing the flow rate to at B 19.5-21 min. MS data were acquired using negative and positive ionization in full scan mode over the range of . Data were analyzed using Bruker TASQ software version 2.1.22.3. All reported metabolite intensities were normalized to either freeze-dried tissue weight or plasma volume, as well as to internal standards with comparable retention times and response in the MS. Metabolite identification has been based on a combination of accurate mass, (relative) retention times, ion mobility data and fragmentation spectra, compared to the analysis of a library of standards. Measurements below the lower limit of quantification were imputed as half the lowest value. Metabolites were excluded from analysis if they contained missing values for more than 5% of samples. Four samples from skeletal muscle metabolomics were excluded during quality control.

Venous blood measurements

Hormone concentrations. Venous concentrations of cortisol, creatine kinase and creatine kinase-MB were measured in the Amsterdam UMC clinical laboratory, and details are provided in Table 4.
Circulating mitochondrial DNA. Mitochondrial DNA (mtDNA) measurements were performed using plasma samples. DNA was isolated according to the BIOKE NucleoSpin® Tissue kit. Briefly, plasma was separated from blood collected in vials coated with ethylenediaminetetraacetic acid by centrifuging at for 10 min . Subsequently, of plasma was diluted in a solution containing PBS, proteinase K, and Buffer B3. After incubation at for of ethanol was added to the solution and centrifuged for 1 min at , where the solution passed through a silica membrane column. The column was then placed in a new collection tube, washed with Buffer BW and centrifuged for 1 min
Table 4 | Details about methods for venous blood concentrations
Parameter Equipment Method Reference limits
Cortisol Roche cobas C8000 Electro- chemiluminescence immunoassay “ECLIA” Roche Diagnostics
Creatine kinase c702 Roche diagnostics NAC-activated, Roche Diagnostics Male < 171 U/L Female < 145 U/L
Creatine kinase-MB e602 Roche Diagnostics Enzyme-labeled sandwich immunoassay Roche Diagnostics
at . This was subsequently washed with of buffer B5 and centrifuged again for 1 minute at . Lastly, of buffer BE was added, incubated for 3 min , and centrifuged a final time for 1 min at to yield the final isolated DNA in solution. Both ND1 and ND6 mtDNA primers were used to quantify the mtDNA copy number, using the -method. Each well contained of mtDNA, of primer mix, and of Power Up SYBR Green Master mix. Subsequently, qPCR in duplo was conducted using QuantStudio 3 realtime PCR to quantify concentrations of mtDNA relative to the nuclear reference. S. Values were normalized to the first time point.

Statistical analysis

Distributions were assessed with histograms and Shapiro-Wilk tests. Categorical values are noted in the absolute numbers with percentages in brackets. Parametric quantitative variables are presented as means standard deviation (SD), and nonparametric quantitative variables are presented as median and interquartile ranges (IQR; 25th and 75th percentiles). Boxplots are shown with the median and IQR (25th and 75th percentiles) unless otherwise specified. All individual points represent a participant.
Non-normally distributed data were transformed using Box-Cox transformation in order to obtain a normal distribution for statistical analysis . Categorical data were analyzed using a Fisher’s exact test. Continuous parametric data were analyzed using a -test or analysis of variance, with Tukey HSD post-hoc testing, where appropriate. Continuous nonparametric data were analyzed using the Mann-Whitney test, Kruskal-Wallis test, or pairwise Kruskal-Wallis test with Benjamini-Hochberg (BH) correction where appropriate. Correlations were analyzed using the Pearson correlation coefficient for linear relationships and the Spearman rank correlation coefficient for non-linear relationships. Correlation coefficients were compared using the R package . Categorical longitudinal data were analyzed using logistic regression with Time (baseline and 1-day after exercise) as a covariate. Continuous parametric longitudinal data and metabolomics were analyzed with a generalized linear mixed model with time (baseline, 1 day, and 1 week after exercise), group and interaction effects. Metabolomics data were adjusted with BH correction within the pre-specified metabolome pathway. Post-hoc comparisons of longitudinal data were, if the interaction term was significant, performed using the Empirical Mean Differences using R package emmeans methods with BH adjustment. Continuous nonparametric longitudinal data analysis was conducted by comparing the delta ( ) between the time points. Longitudinal metabolomic data were visualized with the effect size calculated using Hedges’ -values < 0.05 (two-tailed) were considered statistically significant. All data were analyzed using studio built under version 4.0.3 (R Core Team 2013, Vienna, Austria).

Reporting summary

Further information on research design is available in the Nature Portfolio Reporting Summary linked to this article.

Data availability

The source data file is available below. The raw metabolomics data generated in this study have been deposited in the data publication platform of the Vrije University Amsterdam, with https://doi.org/10. 48338/VU01-KPABVO. Metabolomics is available on MetaboLights (with study identification code: MTBLS9103). Source data are provided with this paper.

Code availability

R codes are available at https://doi.org/10.5281/zenodo.10171056.

References

  1. Davis, H. E., Mccorkell, L., Vogel, J. M. & Topol, E. J. Long COVID: major findings, mechanisms and recommendations. Nat. Rev. Microbiol. 21, 133-146 (2023).
  2. Hickie, I. et al. Post-infective and chronic fatigue syndromes precipitated by viral and non-viral pathogens: prospective cohort study. BMJ 333, 575-578 (2006).
  3. Ruiz-Pablos, M., Paiva, B., Montero-Mateo, R., Garcia, N. & Zabaleta, A. Epstein-Barr virus and the origin of myalgic encephalomyelitis or chronic fatigue syndrome. Front. Immunol. 12, 4637 (2021).
  4. Ursinus, J. et al. Prevalence of persistent symptoms after treatment for lyme borreliosis: a prospective observational cohort study. Lancet Reg. Health-Eur. 6, 100142 (2021).
  5. Herridge, M. S. & Azoulay, É. Outcomes after critical illness. N. Engl. J. Med. 388, 913-924 (2023).
  6. Subramanian, A. et al. Symptoms and risk factors for long COVID in non-hospitalized adults. Nat. Med. 28, 1706-1714 (2022).
  7. Kedor, C. et al. A prospective observational study of post-COVID-19 chronic fatigue syndrome following the first pandemic wave in Germany and biomarkers associated with symptom severity. Nat. Commun. 13, 1-13 (2022).
  8. Kerkhoff, T. J., Charlton, B. T., Appelman, B., van Vugt, M. & Wüst, R. C. I. Post COVID-19 condition: critical need for a clear definition and detailed pathophysiology. J. Cachexia Sarcopenia Muscle 13, 2754-2756 (2022).
  9. Chilunga, F. P. et al. Differences in incidence, nature of symptoms, and duration of long COVID among hospitalised migrant and nonmigrant patients in the Netherlands: a retrospective cohort study. Lancet Reg. Health Eur. 29, 100630 (2023).
  10. Al-Aly, Z., Bowe, B. & Xie, Y. Long COVID after breakthrough SARS-CoV-2 infection. Nat. Med. 28, 1461-1467 (2022).
  11. Klein, J. et al. Distinguishing features of Long COVID identified through immune profiling. Nature 1-3 (2023) https://doi.org/10. 1038/s41586-023-06651-y.
  12. Hejbøl, E. K. et al. Myopathy as a cause of fatigue in long-term post-COVID-19 symptoms: evidence of skeletal muscle histopathology. Eur. J. Neurol. 29, 2832-2841 (2022).
  13. Pretorius, E. et al. Persistent clotting protein pathology in Long COVID/Post-Acute Sequelae of COVID-19 (PASC) is accompanied by increased levels of antiplasmin. Cardiovasc. Diabetol. 20, 1-18 (2021).
  14. Muri, J. et al. Autoantibodies against chemokines post-SARS-CoV-2 infection correlate with disease course. Nat. Immunol. 1-8 (2023) https://doi.org/10.1038/s41590-023-01445-w.
  15. Wang, E. Y. et al. Diverse functional autoantibodies in patients with COVID-19. Nature 595, 283-288 (2021).
  16. Kruger, A. et al. Proteomics of fibrin amyloid microclots in long COVID/post-acute sequelae of COVID-19 (PASC) shows many entrapped pro-inflammatory molecules that may also contribute to a failed fibrinolytic system. Cardiovasc. Diabetol. 21, 1-23 (2022).
  17. Guo, L. et al. Prolonged indoleamine 2,3-dioxygenase-2 activity and associated cellular stress in post-acute sequelae of SARS-CoV-2 infection. EBioMedicine 94, 104729 (2023).
  18. Soares, M. N. et al. Skeletal muscle alterations in patients with acute Covid-19 and post-acute sequelae of Covid-19. J. Cachexia Sarcopenia Muscle 13, 11-22 (2022).
  19. World Health Organization. Post COVID-19 condition (Long COVID). https://www.who.int/europe/news-room/fact-sheets/item/post-covid-19-condition. (2023)
  20. Frésard, I. et al. Dysfunctional breathing diagnosed by cardiopulmonary exercise testing in ‘long COVID’ patients with persistent dyspnoea. BMJ Open Respir. Res. 9, e001126 (2022).
  21. Schwendinger, F., Knaier, R., Radtke, T. & Schmidt-Trucksäss, A. Low cardiorespiratory fitness post-COVID-19: a narrative review. Sports Med 53, 51-74 (2023).
  22. Skjørten, I. et al. Cardiopulmonary exercise capacity and limitations 3 months after COVID-19 hospitalisation. Eur. Respir. J. 58, 2100996 (2021).
  23. Singh, I. et al. Persistent exertional intolerance after COVID-19: insights from invasive cardiopulmonary exercise testing. Chest 161, 54-63 (2022).
  24. Germain, A. et al. Plasma metabolomics reveals disrupted response and recovery following maximal exercise in myalgic encephalomyelitis/chronic fatigue syndrome. JCI Insight 7, e157621 (2022).
  25. McGregor, N. R., Armstrong, C. W., Lewis, D. P. & Gooley, P. R. Postexertional malaise is associated with hypermetabolism, hypoacetylation and purine metabolism deregulation in ME/CFS cases. Diagnostics 9, 1-11 (2019).
  26. Missailidis, D. et al. An isolated complex V inefficiency and dysregulated mitochondrial function in immortalized lymphocytes from ME/CFS patients. Int. J. Mol. Sci. 21, 1074 (2020).
  27. Wüst, R. C. I. et al. The antibiotic doxycycline impairs cardiac mitochondrial and contractile function. Int. J. Mol. Sci. 22, 4100 (2021).
  28. Beloborodova, N. et al. Effect of phenolic acids of microbial origin on production of reactive oxygen species in mitochondria and neutrophils. J. Biomed. Sci. 19, 89 (2012).
  29. Pedley, A. M., Pareek, V. & Benkovic, S. J. The purinosome: a case study for a mammalian metabolon. Annu. Rev. Biochem. 91, 89-106 (2022).
  30. Kell, D. B., Laubscher, G. J. & Pretorius, E. A central role for amyloid fibrin microclots in long COVID/PASC: origins and therapeutic implications. Biochem. J. 479, 537-559 (2022).
  31. Charnley, M. et al. Neurotoxic amyloidogenic peptides in the proteome of SARS-COV2: potential implications for neurological symptoms in COVID-19. Nat. Commun. 13, 3387 (2022).
  32. Aschman, T. et al. Post-COVID exercise intolerance is associated with capillary alterations and immune dysregulations in skeletal muscles. acta neuropathol commun. 11, 193 (2023).
  33. Nakahira, K., Hisata, S. & Choi, A. M. K. The roles of mitochondrial damage-associated molecular patterns in diseases. Antioxid. Redox Signal. 23, 1329 (2015).
  34. Grazioli, S. & Pugin, J. Mitochondrial damage-associated molecular patterns: from inflammatory signaling to human diseases. Front. Immunol. 9, 1 (2018).
  35. Frere, J. J. et al. SARS-CoV-2 infection in hamsters and humans results in lasting and unique systemic perturbations after recovery. Sci. Transl. Med. 14, eabq3059 (2022).
  36. Littlefield, K. M. et al. SARS-CoV-2-specific T cells associate with inflammation and reduced lung function in pulmonary post-acute sequalae of SARS-CoV-2. PLoS Pathog. 18, e1010359 (2022).
  37. Iwasaki, A. & Putrino, D. Why we need a deeper understanding of the pathophysiology of long COVID. Lancet Infect. Dis. 23, 393-395 (2023).
  38. de Boer, E. et al. Decreased fatty acid oxidation and altered lactate production during exercise in patients with post-acute COVID19 syndrome. Am. J. Respir. Crit. Care Med. 205, 126-129 (2022).
  39. Colosio, M. et al. Structural and functional impairments of skeletal muscle in patients with postacute sequelae of SARS-CoV-2 infection. J. Appl. Physiol. 135, 902-917 (2023).
  40. Posthuma, J. J., van der Meijden, P. E. J., ten Cate, H. & Spronk, H. M. H. Short- and long-term exercise induced alterations in haemostasis: a review of the literature. Blood Rev. 29, 171-178 (2015).
  41. Charfeddine, S. et al. Long COVID 19 syndrome: is it related to microcirculation and endothelial dysfunction? Insights from TUNEndCOV study. Front. Cardiovasc. Med. 8, 745758 (2021).
  42. Turner, S. et al. Long COVID: pathophysiological factors and abnormalities of coagulation. Trends Endocrinol. Metab. 34, 321-344 (2023).
  43. Swank, Z. et al. Persistent circulating severe acute respiratory syndrome coronavirus 2 spike is associated with post-acute coronavirus disease 2019 sequelae. Clin. Infect. Dis. 76, e487-e490 (2023).
  44. Aschman, T. et al. Association between SARS-CoV-2 infection and immune-mediated myopathy in patients who have died. JAMA Neurol. 78, 948-960 (2021).
  45. Mageriu, V., Zurac, S., Bastian, A., Staniceanu, F. & Manole, E. Histological findings in skeletal muscle of SARS-CoV2 infected patient. J. Immunoass. Immunochem. 41, 1000-1009 (2020).
  46. Patterson, B. K. et al. Persistence of SARS CoV-2 S1 protein in CD16+ monocytes in post-acute sequelae of COVID-19 (PASC) up to 15 months post-infection. Front. Immunol. 12, 5526 (2022).
  47. Buonsenso, D. et al. Viral persistence in children infected with SARS-CoV-2: current evidence and future research strategies. Lancet Microbe 4, e745-e756 (2023).
  48. Appelman, B. et al. Time since SARS-CoV-2 infection and humoral immune response following BNT162b2 mRNA vaccination. EBioMedicine 72, 103561 (2021).
  49. Wang, Z. et al. Naturally enhanced neutralizing breadth against SARS-CoV-2 one year after infection. Nature 595, 426-431 (2021).
  50. Gallais, F. et al. Evolution of antibody responses up to 13 months after SARS-CoV-2 infection and risk of reinfection. EBioMedicine 71, 103561 (2021).
  51. Hendrickse, P. W. et al. Capillary rarefaction during bed rest is proportionally less than fibre atrophy and loss of oxidative capacity. J. Cachexia Sarcopenia Muscle 13, 2712-2723 (2022).
  52. Agergaard, J. et al. Myopathy as a cause of Long COVID fatigue: evidence from quantitative and single fiber EMG and muscle histopathology. Clin. Neurophysiol. 148, 65-75 (2023).
  53. Pizzuto, D. A. et al. Lung perfusion assessment in children with longCOVID: a pilot study. Pediatr. Pulmonol. 58, 2059-2067 (2023).
  54. Cotler, J., Holtzman, C., Dudun, C. & Jason, L. A. A brief questionnaire to assess post-exertional malaise. Diagnostics 8, 66 (2018).
  55. Krupp, L. B., Alvarez, L. A., Larocca, N. G. & Scheinberg, L. C. Fatigue in multiple sclerosis. Arch. Neurol. 45, 435-437 (1988).
  56. Smets, E. M. A., Garssen, B., Bonke, B. & De Haes, J. C. J. M. The multidimensional Fatigue Inventory (MFI) psychometric qualities of an instrument to assess fatigue. J. Psychosom. Res. 39, 315-325 (1995).
  57. Clevenger, K. A. et al. Effect of sampling rate on acceleration and counts of hip- and wrist-worn ActiGraph accelerometers in children. Physiol. Meas. 40, 095008 (2019).
  58. Gnaiger E. (2020) Mitochondrial pathways and respiratory control. An introduction to OXPHOS analysis. 5th ed. Bioenerg Commun 2:112 (2020).
  59. Gnaiger, E. Capacity of oxidative phosphorylation in human skeletal muscle: new perspectives of mitochondrial physiology. Int. J. Biochem. Cell Biol. 41, 1837-1845 (2009).
  60. Gnaiger, E. et al. Mitochondrial coupling and capacity of oxidative phosphorylation in skeletal muscle of Inuit and Caucasians in the arctic winter. Scand. J. Med. Sci. Sports 25, 126-134 (2015).
  61. Horwath, O. et al. Variability in vastus lateralis fiber type distribution, fiber size, and myonuclear content along and between the legs. J. Appl. Physiol. 131, 158-173 (2021).
  62. Wüst, R. C. I. et al. Region-specific adaptations in determinants of rat skeletal muscle oxygenation to chronic hypoxia. Am. J. Physiol. Heart Circ. Physiol. 297, H364-74 (2009).
  63. Van Der Zwaard, S. et al. Critical determinants of combined sprint and endurance performance: an integrative analysis from muscle fiber to the human body. FASEB J. 32, 2110-2123 (2018).
  64. Grootemaat, A. E. et al. Lipid and nucleocapsid N-protein accumulation in COVID-19 patient lung and infected cells. Microbiol. Spectr. 10, e0127121 (2022).
  65. Schomakers, B. V. et al. Polar metabolomics in human muscle biopsies using a liquid-liquid extraction and full-scan LC-MS. STAR Protoc. 3, 101302 (2022).
  66. Daimon, T. Box-Cox transformation. Int. Encycl. Stat. Sci. 1, 176-1781 (2011).
  67. Diedenhofen, B. & Musch, J. cocor: a comprehensive solution for the statistical comparison of correlations. PLoS ONE 10, e0121945 (2015).
  68. Searle, S. R., Speed, F. M. & Milliken, G. A. Estimated marginal means, aka least-squares means [ package emmeans version 1.8.5]. Am. Stat. 34, 216-221 (2023).
  69. Hedges, L. V. Distribution Theory for Glass’s estimator of effect size and related estimators. J. Educ. Stat. 6, 107-128 (1981).

Acknowledgements

We particularly thank all participants for their time and dedication in participating in this study. We also would like to thank all staff of the post-COVID outpatient clinic of the Amsterdam UMC, in particular, Drs. Mooij-Kalverda and Huismans, for their support during this study. We also acknowledge the help of Dr. Eric Voorn in the data acquisition of the physical activity measurements, Onno van Driel in the analysis of the fiber type distribution, and Jos de Koning in supporting exercise data collection. This study was funded by own funding, the Patient-Led Research Collaborative for Long COVID (Grant ID: C1, [MvV]), the Talud Foundation for the Amsterdam UMC Corona Research Fund [WWJ], AMC Foundation [MvV], VU Foundation [RCIW], ZonMw Onderzoeksprogramma ME/CVS [RCIW], and the 2022 Ramsay Grant Program [RCIW].

Author contributions

B.A., B.C., M.v.V., and R.W. have made substantial contributions to the conception, design, financial acquisition, analysis, and interpretation of the data, drafting of the work, and revised the manuscript. R.G., T.K., E.B., W.N., and C.O. have made substantial contributions to the conception, design, analysis, and interpretation of the data, drafting of the work, and
substantially revised the manuscript. F.B., M.v.W., B.S., P.C., J.P., E.A., and W.J.W. have made substantial contributions to the conception, design, analysis of the data, drafting, and revision of the manuscript. All authors have approved the submitted version and agree to be personally accountable for the author’s own contributions and to ensure that questions related to the accuracy or integrity of any part of the work, even ones in which the author was not personally involved, are appropriately investigated, resolved, and the resolution documented in the literature.

Competing interests

The authors declare no competing interests.

Additional information

Supplementary information The online version contains
supplementary material available at
https://doi.org/10.1038/s41467-023-44432-3.
Correspondence and requests for materials should be addressed to Michèle van Vugt or Rob C. I. Wüst.
Peer review information Nature Communications thanks Danilo Buonsenso, Michael Doumen, and the other, anonymous, reviewer(s) for their contribution to the peer review of this work. A peer review file is available.
Reprints and permissions information is available at
http://www.nature.com/reprints
Publisher’s note Springer Nature remains neutral with regard to jurisdictional claims in published maps and institutional affiliations.
Open Access This article is licensed under a Creative Commons Attribution 4.0 International License, which permits use, sharing, adaptation, distribution and reproduction in any medium or format, as long as you give appropriate credit to the original author(s) and the source, provide a link to the Creative Commons licence, and indicate if changes were made. The images or other third party material in this article are included in the article’s Creative Commons licence, unless indicated otherwise in a credit line to the material. If material is not included in the article’s Creative Commons licence and your intended use is not permitted by statutory regulation or exceeds the permitted use, you will need to obtain permission directly from the copyright holder. To view a copy of this licence, visit http://creativecommons.org/ licenses/by/4.0/.
© The Author(s) 2024

  1. Amsterdam UMC location University of Amsterdam, Center for Experimental and Molecular Medicine, Meibergdreef 9, Amsterdam, the Netherlands. Amsterdam Institute for Infection and Immunity, Infectious diseases, Amsterdam, the Netherlands. Department of Human Movement Sciences, Faculty of Behavioral and Movement Sciences, Vrije Universiteit Amsterdam, Amsterdam, the Netherlands. Amsterdam Movement Sciences, Amsterdam, the Netherlands. Department of Physiology, Amsterdam UMC location Vrije Universiteit Amsterdam, De Boelelaan 1117, Amsterdam, the Netherlands. Amsterdam Cardiovascular Sciences, Amsterdam, the Netherlands. Department of Trauma Surgery, Amsterdam UMC location University of Amsterdam, Meibergdreef 9, Amsterdam, the Netherlands. Laboratory Genetic Metabolic Diseases, Core Facility Metabolomics, Amsterdam UMC location University of Amsterdam, Meibergdreef 9, Amsterdam, the Netherlands. Serviço de Neurologia, Departamento de Neurociências e Saúde Mental, Hospital de Santa Maria, CHULN, Lisbon, Portugal. Faculdade de Medicina, Centro de Estudos Egas Moniz, University of Lisbon, Lisbon, Portugal. Department of (Neuro)pathology, Amsterdam Neuroscience, Amsterdam UMC location University of Amsterdam, Meibergdreef 9, Amsterdam, the Netherlands. Flevoziekenhuis, Division of Surgery, Hospitaalweg 1, Almere, the Netherlands. Division of Infectious Diseases, Department of Internal Medicine, Amsterdam UMC location University of Amsterdam, Meibergdreef 9, Amsterdam, the Netherlands. Division of Infectious Diseases, Tropical Medicine, Department of Medicine, Amsterdam UMC location University of Amsterdam, Meibergdreef 9, Amsterdam, the Netherlands. These authors contributed equally: Brent Appelman, Braeden T. Charlton, Michèle van Vugt, Rob C. I. Wüst. e-mail: m.vanvugt@amsterdamumc.nl; r.wust@vu.nl
  2. a median with an interquartile range. -values were not corrected for multiple testing. Source data are provided in the Source Data File.