DOI: https://doi.org/10.1007/s10916-023-02032-0
PMID: https://pubmed.ncbi.nlm.nih.gov/38252192
تاريخ النشر: 2024-01-22
تصنيف متعدد لصور الرنين المغناطيسي للدماغ لاضطراب طيف التوحد حسب العمر والجنس باستخدام التعلم العميق
© المؤلف(ون) 2024
الملخص
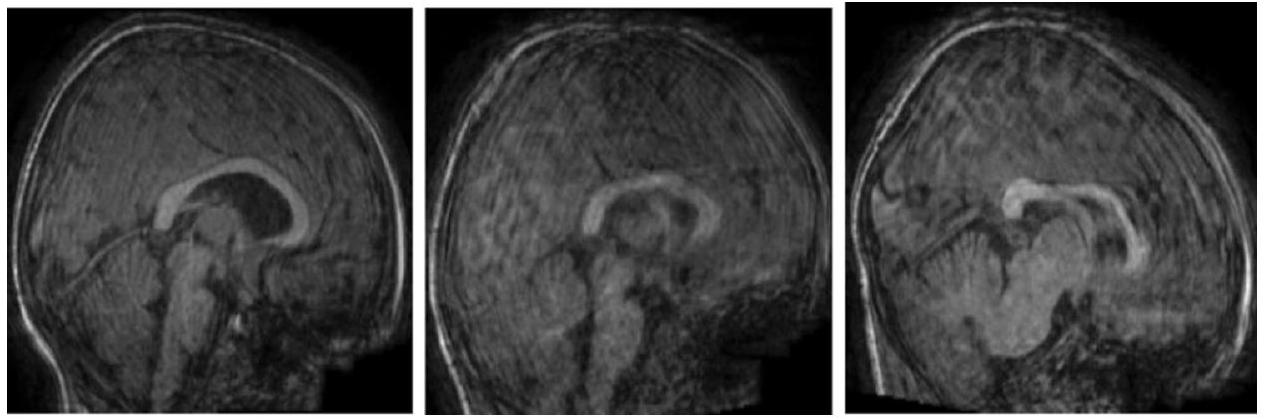
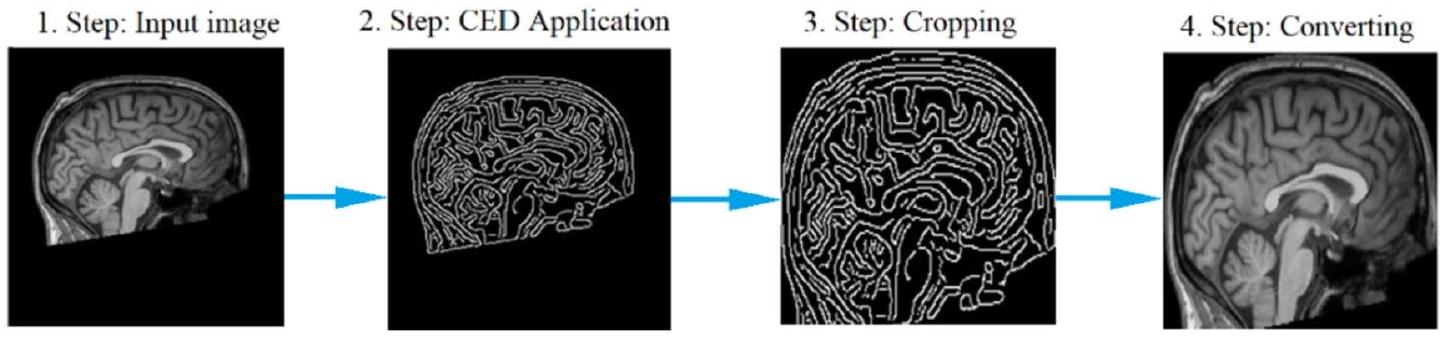
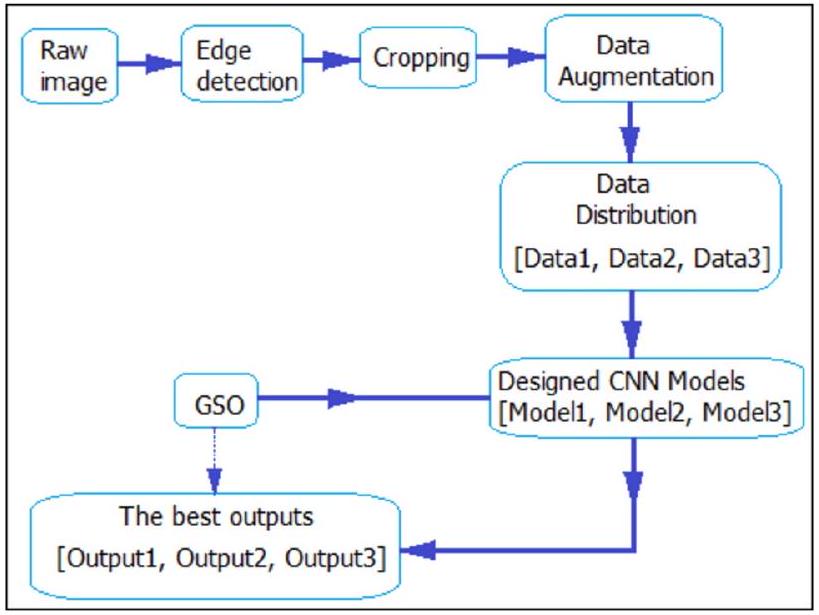
حقيقة أن التشخيص السريع والحاسم للتوحد لا يمكن إجراؤه اليوم وأن التوحد لا يمكن علاجه توفر دافعًا للبحث في حلول تكنولوجية جديدة. للمساهمة في حل هذه المشكلة من خلال تصنيفات متعددة تأخذ في الاعتبار عوامل العمر والجنس، تم في هذه الدراسة إجراء تصنيفين رباعيين وتصنيف ثماني باستخدام نهج التعلم العميق (DL). تم اعتبار الجنس في أحد التصنيفات الأربعة ومجموعات العمر في الآخر. في التصنيف الثماني، تم إنشاء الفئات مع الأخذ في الاعتبار الجنس ومجموعات العمر. بالإضافة إلى تشخيص اضطرابات طيف التوحد (ASD)، فإن هدفًا آخر من هذه الدراسة هو معرفة مساهمة عوامل الجنس والعمر في تشخيص ASD من خلال إجراء تصنيفات متعددة بناءً على العمر والجنس للمرة الأولى. تم معالجة صور الرنين المغناطيسي الهيكلي للدماغ (sMRI) للمشاركين الذين يعانون من ASD والتنمية النموذجية (TD) في النظام المصمم أصلاً لهذا الغرض. باستخدام خوارزمية كشف الحواف كاني (CED)، تم قص بيانات صورة sMRI في مرحلة معالجة البيانات، وتم تكبير مجموعة البيانات خمس مرات باستخدام تقنيات زيادة البيانات (DA). تم تطوير نماذج الشبكة العصبية التلافيفية (CNN) الأكثر مثالية باستخدام خوارزمية تحسين البحث الشبكي (GSO). تم اختبار نظام التنبؤ المقترح باستخدام تقنية التحقق المتقاطع بخمس طيات. تم تصميم ثلاثة نماذج CNN لاستخدامها في النظام. الأول من هذه النماذج هو نموذج التصنيف الرباعي الذي تم إنشاؤه مع الأخذ في الاعتبار الجنس (النموذج 1)، والثاني هو نموذج التصنيف الرباعي الذي تم إنشاؤه مع الأخذ في الاعتبار العمر (النموذج 2)، والثالث هو نموذج التصنيف الثماني الذي تم إنشاؤه مع الأخذ في الاعتبار كل من الجنس والعمر (النموذج 3). معدلات الدقة التي تم الحصول عليها لجميع النماذج الثلاثة المصممة هي
مقدمة
تم استخدامه في هذا البحث كأفضل طريقة للتشخيص السريع لاضطراب طيف التوحد.
الأعمال ذات الصلة
تصنيفات باستخدام طريقة مصنف الشبكة العصبية القائم على الأساس المتوسع (EMcRBFN)، الذي تم تدريبه واختباره باستخدام بيانات التصوير بالرنين المغناطيسي الهيكلي (sMRI). وجدوا أن اضطراب طيف التوحد يمكن اكتشافه بدقة أكبر لدى النساء (81%) مقارنة بالرجال (60%). في [65]، تم التحقيق في تأثير عوامل الجنس على تشخيص اضطراب طيف التوحد في تصنيفات ثنائية متعددة. في دراستهم باستخدام طريقة آلة الدعم الناقل (SVM)، حصلوا على معدل دقة توقع يبلغ 69% لمجموعة ASD-F (الإناث) و
المواد والمنهجية
مجموعة البيانات
معالجة البيانات المسبقة
| موقع | ASD | تي دي | كُلّ | ||
| عصور | |||||
| ٥-١٧ | 18-65 | 5-17 | 18-65 | ||
| ستانفورد | 20 | 0 | 20 | 0 | 40 |
| كي كي آي | 77 | 0 | 188 | 0 | ٢٦٥ |
| كُل | ٥ | 23 | 0 | 0 | ٢٨ |
| لوفين | 16 | ١٣ | 21 | 14 | 64 |
| UCD | 19 | 0 | 14 | 0 | ٣٣ |
| جامعة أوريغون للصحة والعلوم | 51 | 0 | 70 | 0 | 121 |
| ماكسمن | 9 | 15 | ٦ | 26 | ٥٦ |
| جامعة كاليفورنيا، لوس أنجلوس | 81 | 0 | 68 | 0 | 149 |
| بي إن آي | 2 | ٢٥ | 2 | ٢٧ | ٥٦ |
| كالتيك | 1 | ١٨ | 2 | 17 | ٣٨ |
| EMC | 27 | 0 | 27 | 0 | ٥٤ |
| جي يو | 51 | 0 | ٥٤ | 0 | ١٠٥ |
| عنوان بروتوكول الإنترنت | 17 | ٤ | 10 | 23 | ٥٤ |
| جامعة نيويورك | 134 | 20 | ١٠٤ | 31 | ٢٨٩ |
| بيت | ١٨ | 12 | 15 | 12 | ٥٧ |
| جامعة ولاية سان دييغو | ٤٦ | 0 | ٤٧ | 0 | 93 |
| الثالوث | 16 | ٨ | 15 | 10 | ٤٩ |
| أم | ٨٠ | 0 | 89 | ٣ | 172 |
| UPSM | 17 | 1 | 15 | 2 | ٣٥ |
| يال | ٢٨ | 0 | ٢٨ | 0 | ٥٦ |
| سو | 21 | 0 | 21 | 0 | 42 |
| أولين | 14 | ٦ | 10 | ٦ | ٣٦ |
| إيث | ٤ | ٧ | ٣ | 21 | ٣٥ |
| TCD | 18 | ٣ | 16 | ٥ | 42 |
| آي يو | 2 | 17 | 0 | 19 | ٣٨ |
| ONRC | ٥ | ١٨ | 1 | ٢٨ | 52 |
| USM | ٣٦ | ٣٨ | 26 | ٣٢ | 132 |
| CMU | 0 | 14 | 0 | ١٣ | 27 |
| SBL | 0 | 15 | 0 | 15 | 30 |
| جميع المواقع | 815 | 257 | 872 | ٣٠٤ | 2248 |
نماذج CNN المقترحة
اختيار المعلمات الفائقة المثلى
| مجموعات البيانات | رقم الصف | مجموعات | حجم | الحجم الكلي | جنس | نطاق العمر |
| بيانات1 | 1 | ASD + ف | 127 | 1831 | أنثى | – |
| ٢ | ASD + م | ٨١١ | ذكر | – | ||
| ٣ | TD + ف | ٢٠٩ | أنثى | |||
| ٤ | TD +م | 893 | ذكر | |||
| بيانات2 | 1 | ASD 5-17 | 648 | 1831 | – | 5-17 |
| 2 | ASD 18-65 | ٢٩٠ | – | 18-65 | ||
| ٣ | TD 5-17 | 594 | – | ٥-١٧ | ||
| ٤ | تي دي 18-65 | ٢٩٩ | – | 18-65 | ||
| بيانات3 | 1 | ASD 5-17 ف | 96 | 1831 | أنثى | 5-17 |
| ٢ | ASD
|
٥٥٢ | ذكر | 5-17 | ||
| ٣ | ASD 18-65 أنثى | 31 | أنثى | 18-65 | ||
| ٤ | ASD 18-65 م | 259 | ذكر | 18-65 | ||
| ٥ | TD 5-17 ف | 157 | أنثى | ٥-١٧ | ||
| ٦ | تي دي
|
٤٣٧ | ذكر | 5-17 | ||
| ٧ | TD 18-65 أنثى | 52 | أنثى | 18-65 | ||
| ٨ | TD 18-65 م | 247 | ذكر | 18-65 |
التلافيف والتجميع
padding. بالإضافة إلى ذلك، قبل عملية الالتفاف، يتم تنفيذ التجميع، وهو عملية فرعية من عملية الالتفاف، لتقليل الإفراط في التكيف. في معالجة التجميع، يتم تصفية مصفوفة الإدخال لطبقة التجميع بواسطة مصفوفة الفلتر المختارة على مبدأ القيم المتوسطة أو القصوى [72]. باستخدام المعادلة 2، يتم الحصول على حجم مصفوفة الإخراج كنتيجة للتصفية المستخدمة في كل من عمليات التجميع والالتفاف [72].
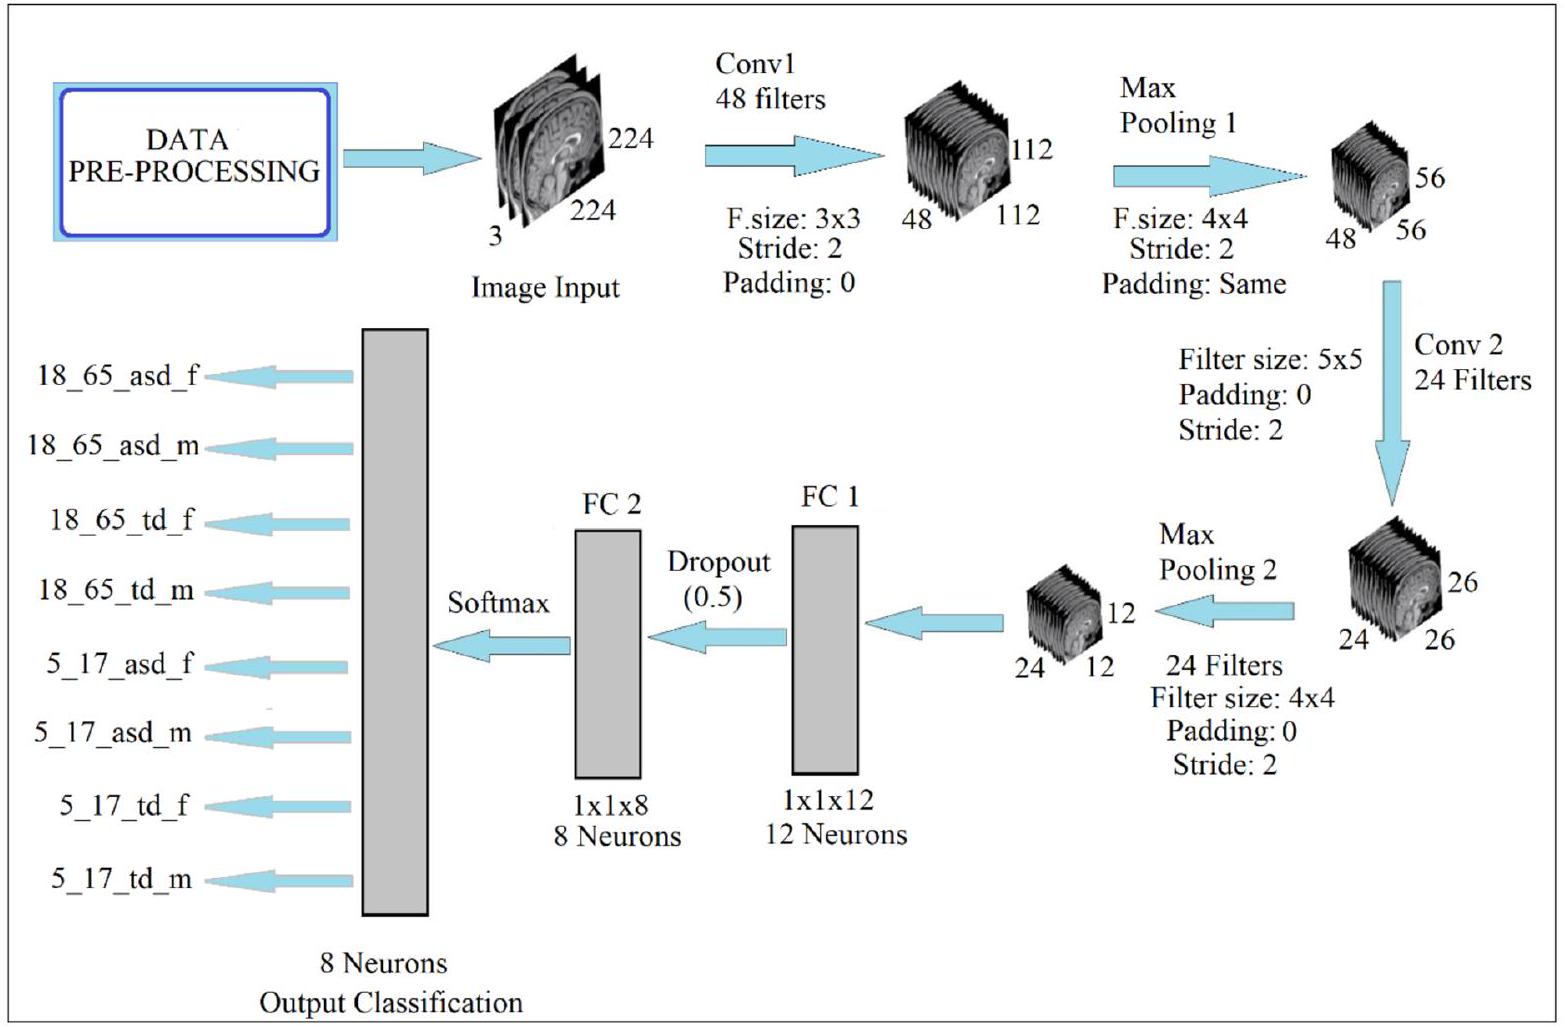
سوفتماكس والتصنيف
تصميم معالجة النماذج المقترحة
مقاييس الأداء
النتائج التجريبية
| البارامترات الفائقة التي يجب تحسينها | نطاقات القيمة | |
| 1 | عدد طبقات الالتفاف | [1,2,3,4,5,6,7,8] |
| 2 | عدد طبقة التجميع الأقصى | [1، 2، 3، 4، 5، 6، 7، 8] |
| ٣ | عدد طبقات FC | [1، 2، 3، 4] |
| ٤ | عدد الفلاتر | [16، 24، 32، 48، 64، 96] |
| ٥ | أحجام الفلاتر للتلافيف والتجمع | [٢, ٣, ٤, ٥, ٦, ٧] |
| ٦ | توسيع | [0, 1, نفس] |
| ٧ | خطوة | [1، 2، 3] |
| ٨ | تنظيم L2 | [0.0001، 0.0005، 0.001، 0.005] |
| 9 | زخم | [0.70، 0.75، 0.80، 0.85، 0.90، 0.95] |
| 10 | حجم الدفعة الصغيرة | [8، 16، 32، 64، 128] |
| 11 | معدل التعلم | [0.0001، 0.0003، 0.0005، 0.001، 0.003، 0.005] |
| 12 | دالة التنشيط | ري لو، ليكي ري لو، إي لو، إس إي لو |
للنفس الغرض، يُلاحظ أن أعلى نتيجة تم الحصول عليها هي مع النموذج 3. يمكن إجراء تعليقات مماثلة من خلال فحص القيم المفقودة. مع هذا النظام المصمم
| البارامترات الفائقة | قيمة | |||
| النموذج 1 (الجنس) | النموذج 2 (العمر) | النموذج 3 (كلاهما) | ||
| 1 | عدد طبقات الالتفاف | ٧ | ٦ | 2 |
| ٢ | عدد طبقة الماكس بولينغ | ٧ | ٦ | 2 |
| ٣ | عدد طبقات FC | 2 | 2 | 2 |
| ٤ | عدد الفلاتر [Conv1، Pool1، Conv2، Pool2، Conv3، Pool3، Conv4، Pool4، Conv5، Pool5، Conv6، Pool6، Conv7، Pool7…] | [٤٨، ٤٨، ٢٤، ٢٤، ٢٤، ٢٤، ٢٤، ٢٤، ١٦، ١٦، ١٦، ١٦، ١٦، ١٦] | [٤٨، ٤٨، ٣٢، ٣٢، ٢٤، ٢٤، ٢٤، ٢٤، ١٦، ١٦، ١٦، ١٦] | [٤٨، ٤٨، ٢٤، ٢٤] |
| ٥ | أحجام الفلاتر [Conv1، Pool1، Conv2، Pool2، Conv3، Pool3، Conv4، Pool4، Conv5، Pool5، Conv6، Pool6، Conv7، Pool7 …] | [٣، ٤، ٣، ٣، ٥، ٤، ٥، ٥، ٣، ٣، ٣، ٣، ٥، ٤] | [٤، ٣، ٤، ٣، ٥، ٤، ٣، ٥، ٤، ٤، ٤، ٤] | [٢, ٤, ٥, ٤] |
| ٦ | الحشو [التفاف1، تجميع1، الالتفاف2، تجميع2، الالتفاف3، تجميع3، الالتفاف4، تجميع4، الالتفاف5، تجميع5، الالتفاف6، تجميع6، الالتفاف7، تجميع7 …] |
|
|
[0، نفس، 0، 0] |
| ٧ | خطوة [التفاف1، تجميع1، الالتفاف2، تجميع2، الالتفاف3، تجميع3، الالتفاف4، تجميع4، الالتفاف5، تجميع5، الالتفاف6، تجميع6، الالتفاف7، تجميع7 …] | [1,1,2,1,1,1,1,1,2,2,2,1,2,1] | [١,١,١,١,١,١,١,١,٢,٢,٢,٢] | [٢, ٢, ٢, ٢] |
| ٨ | تنظيم L2 | 0.0001 | 0.0001 | 0.0001 |
| 9 | الزخم | 0.9000 | 0.9000 | 0.9000 |
| 10 | حجم الدفعة الصغيرة | 32 | ٣٢ | ٣٢ |
| 11 | معدل التعلم | 0.0001 | 0.0001 | 0.0002 |
| 12 | دالة التنشيط | ري لو | ري لو | ري لو |
| نماذج سي إن إن | النموذج 1 (الجنس) | النموذج 2 (العمر) | النموذج 3 (كلاهما) | |||
| الدقة (%) | خسارة | الدقة (%) | خسارة | الدقة (%) | خسارة | |
| أليكس نت | 78.13 | 0.9126 | 81.09 | 0.6631 | 62.73 | 1.8453 |
| جوجل نت | ٧٧.٦٨ | 1.2609 | 78.59 | 1.0999 | ٥٩.٣٢ | 1.9831 |
| ريزنت18 | 73.12 | 1.2083 | 82.46 | 0.8289 | 66.36 | 1.3508 |
| سكوينت | 72.67 | 1.3960 | 79.27 | 1.0946 | 64.55 | 1.7776 |
| مقترح | 80.94 | 0.4893 | 85.42 | 0.3785 | 67.94 | 0.8418 |
الاستنتاجات والمناقشة
الذي، بقدر ما نعلم، يختلف عما تم القيام به حتى الآن، والذي يُعتبر الأول من نوعه، يأخذ في الاعتبار عوامل العمر والجنس ويستخدم صور الدماغ بتقنية التصوير بالرنين المغناطيسي الهيكلي. تم توفير نجاح وموثوقية النظام المصمم من خلال مقارنته بشبكات Alexnet وGooglenet وResnet-18 وSqueezenet الشهيرة المدربة مسبقًا. النموذج الذي تم تطويره في هذا البحث يقدم أداءً أفضل من هذه النماذج المدربة مسبقًا. بالإضافة إلى ذلك، يتمتع النظام المصمم بميزة القابلية للتعميم حيث تم الحصول على مجموعة البيانات من قاعدة بيانات ABIDE التي تم إنشاؤها من 29 موقعًا مختلفًا، وتم توسيع مجموعة البيانات خمس مرات باستخدام تقنيات زيادة البيانات. نتيجة لذلك، تُظهر معدلات الدقة التي تم الحصول عليها نتيجة للاختبار الذي تم إجراؤه مع جميع نماذج CNN الثلاثة المصممة للاستخدام ضمن النظام أن النظام المصمم لديه ديناميكيات قوية تكفي لتحقيق أعلى معدلات دقة.
الملحق 1
| الموقع | التعريف |
| ستانفورد | جامعة ستانفورد |
| KKI | معهد كينيدي كريجر |
| KUL | جامعة لوفين الكاثوليكية |
| لوفين | جامعة لوفين |
| UCD | جامعة كاليفورنيا ديفيس |
| OHSU | جامعة أوريغون للصحة والعلوم |
| MAXMUN | جامعة لودفيغ ماكسيميليان في ميونيخ |
| UCLA | جامعة كاليفورنيا، لوس أنجلوس |
| BNI | معهد بارو العصبي |
| CALTECH | معهد كاليفورنيا للتكنولوجيا |
| EMC | مركز إيراسموس الطبي في روتردام |
| GU | جامعة جورجتاون |
| IP | معهد باستور ومستشفى روبرت ديبري |
| NYU | جامعة نيويورك مركز لانغون الطبي |
| PITT | جامعة بيتسبرغ |
| SDSU | جامعة ولاية سان دييغو |
| TRINITY | مركز ترينيتي لعلوم الصحة |
| UM | جامعة ميتشيغان |
| UPSM | كلية الطب بجامعة بيتسبرغ |
| YALE | مركز دراسة الأطفال بجامعة ييل |
| SU | جامعة ستانفورد (ABIDE II) |
| OLIN | مركز أبحاث الطب النفسي العصبي أولين (ABIDE I) |
| ETH | المدرسة الفيدرالية التقنية في زيورخ |
| TCD | كلية الطب بجامعة ترينيتي في دبلن |
| IU | جامعة إنديانا |
| ONRC | مركز أبحاث الطب النفسي العصبي أولين (ABIDE II) |
| USM | كلية الطب بجامعة يوتا |
| CMU | جامعة كارنيجي ميلون |
| SBL | مختبر الدماغ الاجتماعي. BCN NIC UMC غرونينجن والمعهد الهولندي لعلوم الأعصاب |
الإقرارات
المصالح المتنافسة يعلن المؤلفون عدم وجود مصالح متنافسة.
References
- Preet K, Shoba S, Shekhar PS, Satish CG, and John VSK (2017) Lost time: Need for more awareness in early intervention of autism spectrum disorder. Asian Journal of Psychiatry 25:13-15
- Constantino JN, Charman T (2016) Diagnosis of autism spectrum disorder: reconciling the syndrome, its diverse origins, and variation in expression www.thelancet.com/neurology 15
- Maenner, M.J., Shaw, K.A., Bakian, A.V., Bilder, D.A., Durkin, M.S., Esler, A.N., Furnier, S.M., Hallas, L., Hall-Lande, J., Hudson, A., Hughes, M.M., Patrick, M.E., Pierce, K.J., Poynter, J.N., Salinas, A., Shenouda, J., Vehorn, A.C., Warren, Z., Constantino, J.N., Dirienzo, M., Fitzgerald, R.T., Grzybowski, A., Spivey, M.H., Pettygrove, S., Zahorodny, W., Ali, A.R., Andrews, J.G., Baroud, T., Gutierrez, J., Hewitt, A.S., Lee, L.C., Lopez, M.L., Mancilla, K.C., McArthur, D., Schwenk, Y.D., Washington, A., Williams, S., & Cogswell, M.E. (2021). Prevalence and Characteristics of Autism Spectrum Disorder Among Children Aged 8 Years – Autism and Developmental Disabilities Monitoring Network, 11 Sites, United States, 2018. MMWR Surveillance Summaries 70: 1-16.
- Senn, M. CDC Estimate on Autism Prevalence Increases by Nearly
, to 1 in 54 Children in the U.S. (2020) Available online at: https://www.autismspeaks.org/press-release/cdc-estimate-autism-prevalence-increasesnearly-10-percent-1-54-children-us. Accessed April 26, 2020. - Jacob, S., Wolff, J.J., Steinbach, M.S., Doyle, C.B., Kumar, V., and Elison, J.T. (2019). Neurodevelopmental heterogeneity and computational approaches for understanding autism. Translational Psychiatry 9.
- Matson, J. L., Rieske R. D., Williams, L.W (2013) The relationship between autism spectrum disorders and attention-deficit/ hyperactivity disorder: an overview. Research in Developmental Disabilities 34: 2475-2484.
- Saito, M., Hirota, T., Sakamoto, Y., Adachi, M., Takahashi, M., Osato-Kaneda, A., Kim, Y.S., Leventhal, B.L., Shui, A.M., Kato, S., and Nakamura, K. (2020) Prevalence and cumulative incidence of autism spectrum disorders and the patterns of co-occurring neurodevelopmental disorders in a total population sample of 5-year-old children. Molecular Autism 11, 2020.
- Autism and Developmental Disabilities Monitoring Network Surveillance Year 2002 Principal Investigators (2007) Prevalence of autism spectrum disorders-Autism and Developmental Disabilities Monitoring Network, 14 sites, United States, 2002. MMWR Surveill Summ 56: No. SS-1
- Napolitano A, Schiavi S, La Rosa P, Rossi-Espagnet MC, Petrillo S, Bottino F, Tagliente E, Longo D, Lupi E, Casula L, Valeri G, Piemonte F, Trezza V and Vicari S. Sex (2022) Differences in Autism Spectrum Disorder: Diagnostic, Neurobiological, and Behavioral Features. Front. Psychiatry 13: 889636. doi: https:// doi.org/10.3389/fpsyt.2022.889636
- Horlin C., Falkmer M., Parsons R., Albrecht MA, Falkmer T (2014) The cost of autism spectrum disorders. PloS One 9 e106552
- Klin A., Klaiman, C., Jones, W (2015) Reducing age of autism diagnosis: developmental social neuroscience meets public health challenge. Revista de Neurologia 60(Suppl 1): 3-11
- Subbaraju V, Sundaram S, Narasimham S, Suresh, MB (2015) Accurate detection of autism spectrum disorder from structural MRI using extended metacognitive radial basis function network. Expert Systems with Applications 42: 8775-8790, 2015.
- Lemm S, Blankertz B, Dickhaus T, Müller KR (2011) Introduction to machine learning for brain imaging. NeuroImage 56: 387-399
- Hastie T, Tibshirani R, Friedman J (2009) The Elements of Statistical Learning. 2nd edition, Springer, New York.
- Lord C, Risi S, Lambrecht L, Cook EH, Leventhal BL, DiLavore PC Pickles A., Rutter M (2000) The autism diagnostic observation schedule-generic a standard measure of social and communication deficits associated with the spectrum of autism. J Autism Dev Disord 30: 205-223
- Lord C, Rutter M, Le Couteur A (1994) Autism diagnostic interview-revised: a revised version of a diagnostic interview for caregivers of individuals with possible pervasive developmental disorders. J Autism Dev Disord 24: 659-685
- Lord C, Petkova E, Hus V, Gan W, Lu F, Martin DM Ousley O, Guy L, Bernier R, Gerdts J. et al (2012) A multisite study of the clinical diagnosis of different autism spectrum disorders. Archives of General Psychiatry 69: 306-313
- O’Shea A, Ahmed R, Lightbody G, Mathieson SR, Pavlidis E, Lloyd RO Pisani F, Marnane WP, Boylan GB, & Temko A (2020) Deep Learning for EEG Seizure Detection in Preterm Infants. International journal of neural systems 2150008
- Peng P, Xie L, & Wei H (2021) A Deep Fourier Neural Network for Seizure Prediction Using Convolutional Neural Network and Ratios of Spectral Power. International journal of neural systems 2150022
- Yu Z, Albera L, Bouquin-Jeannès RL, Kachenoura A, Karfoul A, Yang C, & Shu H (2022) Epileptic Seizure Prediction Using Deep Neural Networks Via Transfer Learning and Multi-Feature Fusion. International journal of neural systems 2250032
- Bhattacharya A, Baweja T, & Karri SP (2021) Epileptic Seizure Prediction Using Deep Transformer Model. International journal of neural systems 2150058
- Thangavel P, Thomas J, Peh WY, Jing J, Yuvaraj R, Cash SS, Chaudhari R, Karia S, Rathakrishnan R, Saini V, Shah N, Srivastava R, Tan Y, Westover B, & Dauwels J (2021) TimeFrequency Decomposition of Scalp Electroencephalograms Improves Deep Learning-Based Epilepsy Diagnosis. International journal of neural systems 2150032
- Ozdemir M, Cura OK, and Akan A (2021) Epileptic EEG Classification by Using Time-Frequency Images for Deep Learning. International journal of neural systems 2150026.
- Bone D, Goodwin MS, Black MP, Lee C, Audhkhasi K, and Narayanan S (2015) Applying Machine Learning to Facilitate Autism Diagnostics: Pitfalls and promises. Journal of Autism
25. Ardakani HA, Taghizadeh M, and Shayegh F (2022) Diagnosis of Autism Disorder Based on Deep Network Trained by Augmented EEG Signals. International journal of neural systems 2250046.
26. Li S, Tang Z, Jin N, Yang Q, Liu G, Liu T, Hu J, Liu S, Wang P, Hao J, Zhang Z, Zhang X, Li J, Wang X, Li Z, Wang Y, Yang B, and Ma L (2022) Uncovering Brain Differences in Preschoolers and Young Adolescents with Autism Spectrum Disorder Using Deep Learning International journal of neural systems 2250044.
27. Rahman MM, Usman OL, Muniyandi RC, Sahran S, Mohamed S, & Razak RA (2020) A Review of Machine Learning Methods of Feature Selection and Classification for Autism Spectrum Disorder. Brain Sciences 10
28. Küçükoglu B, Rueckauer B, Ahmad N, de Ruyter van Steveninck J, Güçlü U, & van Gerven MA (2022) Optimization of Neuroprosthetic Vision via End-to-end Deep Reinforcement Learning. bioRxiv 32(11): 2250052 (16 pages)
29. Xu F, Dong G, Li J, Yang Q, Wang L, Zhao Y, Yan Y, Zhao J, Pang S, Guo D, Zhang Y, & Leng J (2022) Deep Convolution Generative Adversarial Network-Based Electroencephalogram Data Augmentation for Post-Stroke Rehabilitation with Motor Imagery. International journal of neural systems 32(9): 2250039, (15 pages)
30. Alexandridis G, Aliprantis J, Michalakis K, Korovesis K, Tsantilas P, & Caridakis G (2021) A Knowledge-Based Deep Learning Architecture for Aspect-Based Sentiment Analysis. International journal of neural systems 31(10): 2150046 (18 pages)
31. Olamat A, Ozel P, and Atasever S (2022) Deep Learning Methods for Multi-Channel EEG-based Emotion Recognition. International Journal of Neural Systems 32(5): 2250021 (17 pages)
32. Lope JD, & Graña M, (2022) A Hybrid Time-Distributed Deep Neural Architecture for Speech Emotion Recognition. International journal of neural systems 32(6): 2250024 (14 pages)
33. Hu T, Xie L, Zhang L, Li G, & Yi Z (2021) Deep Multimodal Neural Network Based on Data-Feature Fusion for Patient-Specific Quality Assurance. International journal of neural systems 32 (1): 2150055
34. Hashimoto H, Kameda S, Maezawa H, Oshino S, Tani N, Khoo HM, Yanagisawa T, Yoshimine T, Kishima H, & Hirata M (2020) A Swallowing Decoder Based on Deep Transfer Learning: AlexNet Classification of the Intracranial Electrocorticogram. International journal of neural systems 31(11): 2150056 (16 pages)
35. Ieracitano C, Morabito FC, Hussain A, & Mammone N (2021) A Hybrid-Domain Deep Learning-Based BCI For Discriminating Hand Motion Planning From EEG Sources. International journal of neural systems 31(9): 2150038 (20 pages)
36. Usman OL, Muniyandi RC, Omar KB, & Mohamad M (2021) Advance Machine Learning Methods for Dyslexia Biomarker Detection: A Review of Implementation Details and Challenges. IEEE Access 9 36879-36897
37. Usman OL, & Muniyandi RC (2020) CryptoDL: Predicting Dyslexia Biomarkers from Encrypted Neuroimaging Dataset Using Energy-Efficient Residue Number System and Deep Convolutional Neural Network. Symmetry 12, 836
38. Usman OL, Muniyandi RC, Omar KB, and Mohamad M (2021) Gaussian smoothing and modified histogram normalization methods to improve neural-biomarker interpretations for dyslexia classification mechanism. PLoS ONE 16.
39. Macias-Garcia E, Galeana-Perez D, Medrano-Hermosillo J, and Bayro-Corrochano E (2021) Multi-stage Deep Learning Perception System for Mobile Robots. Integrated Computer-Aided Engineering 28(2): 191-205
40. Gasienica-Józkowy J, Knapik M, and Cyganek B (2021) An ensemble deep learning method with optimized weights for
drone-based water rescue and surveillance. Integrated Com-puter-Aided Engineering 28(3): 221-235
41. Jiang K, Han Q, and Du X (2022) Lost Data Neural Semantic Recovery Framework for Structural Health Monitoring Based on Deep Learning. Computer-Aided Civil and Infrastructure Engineering 37(9): 1160-1187
42. Pan X, and Yang TT (2022) Image-based monitoring of bolt loosening through deep-learning-based integrated detection and tracking. Computer-Aided Civil and Infrastructure Engineering 37(10): 1207-1222
43. Chun PJ, Yamane T, and Maemura Y (2022) A deep learning based image captioning method to automatically generate comprehensive explanations of bridge damage. Computer-Aided Civil and Infrastructure Engineering 37(11): 1387-1401
44. Rad NM, and Furlanello C (2016) Applying Deep Learning to Stereotypical Motor Movement Detection in Autism Spectrum Disorders. 2016 IEEE 16th International Conference on Data Mining Workshops 16: 2375-9259, DOI https://doi.org/10. 1109/ICDMW.2016.184
45. Rad NM, Kia MS, Zarbo C, Laarhoven TV, Jurman G, Venuti P, Marchiori E, Furlanello C (2018) Deep Learning for Automatic Stereotypical Motor Movement Detection using Wearable Sensors in Autism Spectrum Disorder. Signal Processing 144: 180-191
46. Wang S, Jiang M, Duchesne XMM, Laugeson EAA, Kennedy DPP, Adolphs R, and Zhao Q (2015) Atypical visual saliency in autism spectrum disorder quantified through model-based eye tracking. Neuron 88(3): 604-616
47. Milièiæ J, Petkoviæ BZ, Boikov J (2003) Dermatoglyphs of Digito-Palmar Complex in Autistic Disorder: Family Analysis. Clinical Sciences 44(4): 469-476
48. Kazemi M, Bordbar MRF, Shahri NM (2017) Comparative Dermatoglyphic Study between Autistic Patients and Normal People in Iran. Iran J Med Sci 42(4)
49. Stošljeviü M, and Adamoviü M, (2013) Dermatoglyphic characteristics of digito-palmar complex in autistic boys in Serbia. Vojnosanit Pregl 70(4): 386-390
50. Peng G, Nourani M, Harvey J, & Dave H, (2021) Personalized EEG Feature Selection for Low-Complexity Seizure Monitoring. International journal of neural systems 31(8): 2150018 (16 pages)
51. Xue Y, Zhu H, and Neri F (2022) A Self-adaptive Multi-objective Genetic Algorithm for Feature Selection in Classification. Integrated Computer-Aided Engineering 29(1): 3-21
52. Tian Y, Ding X, Lin YF, Ma S, and Li L (2022) Automatic Feature Type Selection Network in Digital Photogrammetry of Piping. Computer-Aided Civil and Infrastructure Engineering 37(10): 1335-1348
53. Ad-Dab’bagh Y, Lyttelton O, Muehlboeck JS, et al (2006) The CIVET image processing environment: a fully automated comprehensive pipeline for anatomical neuroimaging research. In: Proceedings of the 12th Annual Meeting of the Organization for Human Brain Mapping Florence Italy 2266
54. Fischl B, Dale AM (2000) Measuring the thickness of the human cerebral cortex from magnetic resonance images. Proc Natl Acad Sci 97: 11050-11055
55. Yahata N, Kasai K, and Kawato M (2017) Computational neuroscience approach to biomarkers and treatments for mental disorders. Psychiatry and Clinical Neurosciences 71: 215-237
56. Ashburner J, and Friston KJ (2000) Voxel-based morphometrythe techniques. NeuroImage 11: 805-821
57. Mandl RC, Schnack HG, Zwiers MP, van der Schaaf A, Kahn RS, Pol HEH (2008) Functional diffusion tensor imaging: measuring task-related fractional anisotropy changes in the human brain along white matter tracts. PloS One 3 e3631
58. Iturria-Medina Y, Canales-Rodriguez EJ, Melie-Garcia L, Valdes-Hernandez PA, Martinez-Montes E, Alemán-Gómez Y,
59. Iturria-Medina Y (2013) Anatomical brain networks on the prediction of abnormal brain states. Brain connectivity 3: 1-21
60. Rubinov M, Sporns O (2010) Complex network measures of brain connectivity: uses and interpretations. NeuroImage 52: 1059-1069
61. Zeighami Y, Ulla M, Iturria-Medina Y, Dadar M, Zhang Y, Larcher KMH, Fonov V, Evans AC, Collins DL, Dagher A (2015) Network structure of brain atrophy in de novo Parkinson’s disease. Elife 4 e08440. https://doi.org/10.7554/eLife. 08440
62. Pereira F, Mitchell T, Botvinick M (2009) Machine learning classifiers and fMRI: a tutorial overview. NeuroImage 45: 199-209
63. Mirzaei G, and Adeli H (2016) Resting State Functional Magnetic Resonance Image Processing Techniques in Stroke Studies. Reviews in the Neurosciences 27(8): 871-885
64. Hassanpour A, Moradikia M, Adeli H, Khayami SR, and Shamsinejad P (2019) A Novel End-to-End Deep Learning Scheme For Classifying Multiclass Motor Imagery EEG Signals. Expert Systems 36(6).
65. Gorriz JM, Ramıırez J, Segovia F, Mart́ınez FJ, Lai MC, Lombardo MV, Baron-Cohen S, and Suckling J (2019) A Machine Learning Approach to Reveal the NeuroPhenotypes of Autisms. Int J Neural Sys 29(7)
66. Heinsfeld AS, Franco AR, Craddock C, Buchweitz A, & Meneguzzi F (2018) Identification of autism spectrum disorder using deep learning and the ABIDE dataset. NeuroImage: Clinical 17: 16-23. https://doi.org/10.1016/j.nicl.2017.08.017
67. Li G, Liu M, Sun Q, Shen D, Wang L (2018) Early Diagnosis of Autism Disease by Multi-channel CNNs. Mach Learn Med Imaging 11046, 303-309. https://doi.org/10.1007/978-3-030-00919-9_35
68. Aghdam MA, Sharifi A, & Pedram MM (2018) Combination of rs-fMRI and sMRI Data to Discriminate Autism Spectrum Disorders in Young Children Using Deep Belief Network. Journal of Digital Imaging 31: 895-903
69. Kong Y, Gao J, Xu Y, Pan Y, Wang J, Liu J (2019) Classification of autism spectrum disorder by combining brain connectivity and deep neural network classifier. Neurocomputing 324: 63-68
70. Di Martino A, Yan CG, Li Q, Denio E, Castellanos FX, Alaerts K, Anderson JS, Assaf M, Bookheimer SY, Dapretto M et al. (2014) The Autism Brain Imaging Data Exchange: towards large-scale evaluation of the intrinsic brain architecture in autism. Molecular Psychiatry 19(6): 659-667 https://doi.org/10.1038/mp. 2013.78
71. Irmak E, (2021) Multi-Classification of Brain Tumor MRI Images Using Deep Convolutional Neural Network with Fully Optimized Framework. Iranian Journal of Science and Technology Transactions of Electrical Engineering 45:1015-1036
72. Michelucci U (2019) Advanced Applied Deep Learning: Convolutional Neural Networks and Object Detection, 1st ed. Apress
73. Bishop CM (2006) Pattern Recognition and Machine Learning. Springer New York NY
74. Ahmadlou M, & Adeli H (2006) Enhanced probabilistic neural network with local decision circles: A robust classifier. Integr Comput Aided Eng 17: 197-210
75. Rafiei MH and Adeli H (2017) A New Neural Dynamic Classification Algorithm,” IEEE Transactions on Neural Networks and Learning Systems, 28(12): 3074-3083 https://doi.org/10.1109/ TNNLS.2017.2682102
- Hojjat Adeli
adeli.1@osu.edu
Hidir Selcuk Nogay
hsnogay@uludag.edu.tr
1 Electrical and Energy Department, Bursa Uludag University, Bursa, Turkey
2 Departments of Biomedical Informatics and Neuroscience, College of Medicine, The Ohio State University Neurology, 370 W. 9th Avenue, Columbus, OH 43210, USA
DOI: https://doi.org/10.1007/s10916-023-02032-0
PMID: https://pubmed.ncbi.nlm.nih.gov/38252192
Publication Date: 2024-01-22
Multiple Classification of Brain MRI Autism Spectrum Disorder by Age and Gender Using Deep Learning
© The Author(s) 2024
Abstract
The fact that the rapid and definitive diagnosis of autism cannot be made today and that autism cannot be treated provides an impetus to look into novel technological solutions. To contribute to the resolution of this problem through multiple classifications by considering age and gender factors, in this study, two quadruple and one octal classifications were performed using a deep learning (DL) approach. Gender in one of the four classifications and age groups in the other were considered. In the octal classification, classes were created considering gender and age groups. In addition to the diagnosis of ASD (Autism Spectrum Disorders), another goal of this study is to find out the contribution of gender and age factors to the diagnosis of ASD by making multiple classifications based on age and gender for the first time. Brain structural MRI (sMRI) scans of participators with ASD and TD (Typical Development) were pre-processed in the system originally designed for this purpose. Using the Canny Edge Detection (CED) algorithm, the sMRI image data was cropped in the data pre-processing stage, and the data set was enlarged five times with the data augmentation (DA) techniques. The most optimal convolutional neural network (CNN) models were developed using the grid search optimization (GSO) algorism. The proposed DL prediction system was tested with the five-fold cross-validation technique. Three CNN models were designed to be used in the system. The first of these models is the quadruple classification model created by taking gender into account (model 1), the second is the quadruple classification model created by taking into account age (model 2), and the third is the eightfold classification model created by taking into account both gender and age (model 3). ). The accuracy rates obtained for all three designed models are
Introduction
employed in this research as the most suitable method for rapid diagnosis of ASD.
Related works
classifications using by Extended Metacognitive Radial Basis Function Neural Classifier (EMcRBFN) method, which is trained and tested by sMRI data. They found that ASD can be detected more accurately in women (81%) than in men (60%). In [65], it investigated the impact of gender factors on the diagnosis of ASD in multiple binary classifications. In their study with the Support Vector Machine (SVM) method, they obtained an accurate prediction rate of 69% for the ASD-F (female) group and
Materials and methodology
Dataset
Data pre-processing
| SITE | ASD | TD | ALL | ||
| Ages | |||||
| 5-17 | 18-65 | 5-17 | 18-65 | ||
| STANDFORD | 20 | 0 | 20 | 0 | 40 |
| KKI | 77 | 0 | 188 | 0 | 265 |
| KUL | 5 | 23 | 0 | 0 | 28 |
| LEUVEN | 16 | 13 | 21 | 14 | 64 |
| UCD | 19 | 0 | 14 | 0 | 33 |
| OHSU | 51 | 0 | 70 | 0 | 121 |
| MAXMUN | 9 | 15 | 6 | 26 | 56 |
| UCLA | 81 | 0 | 68 | 0 | 149 |
| BNI | 2 | 25 | 2 | 27 | 56 |
| CALTECH | 1 | 18 | 2 | 17 | 38 |
| EMC | 27 | 0 | 27 | 0 | 54 |
| GU | 51 | 0 | 54 | 0 | 105 |
| IP | 17 | 4 | 10 | 23 | 54 |
| NYU | 134 | 20 | 104 | 31 | 289 |
| PITT | 18 | 12 | 15 | 12 | 57 |
| SDSU | 46 | 0 | 47 | 0 | 93 |
| TRINITY | 16 | 8 | 15 | 10 | 49 |
| UM | 80 | 0 | 89 | 3 | 172 |
| UPSM | 17 | 1 | 15 | 2 | 35 |
| YALE | 28 | 0 | 28 | 0 | 56 |
| SU | 21 | 0 | 21 | 0 | 42 |
| OLIN | 14 | 6 | 10 | 6 | 36 |
| ETH | 4 | 7 | 3 | 21 | 35 |
| TCD | 18 | 3 | 16 | 5 | 42 |
| IU | 2 | 17 | 0 | 19 | 38 |
| ONRC | 5 | 18 | 1 | 28 | 52 |
| USM | 36 | 38 | 26 | 32 | 132 |
| CMU | 0 | 14 | 0 | 13 | 27 |
| SBL | 0 | 15 | 0 | 15 | 30 |
| ALL Sites | 815 | 257 | 872 | 304 | 2248 |
Proposed CNN models
Optimal hyper-parameter selection
| Datasets | Class Number | Groups | Size | Total Size | Gender | Age range |
| Data1 | 1 | ASD + f | 127 | 1831 | Female | – |
| 2 | ASD + m | 811 | Male | – | ||
| 3 | TD + f | 209 | Female | |||
| 4 | TD +m | 893 | Male | |||
| Data2 | 1 | ASD 5-17 | 648 | 1831 | – | 5-17 |
| 2 | ASD 18-65 | 290 | – | 18-65 | ||
| 3 | TD 5-17 | 594 | – | 5-17 | ||
| 4 | TD 18-65 | 299 | – | 18-65 | ||
| Data3 | 1 | ASD 5-17 f | 96 | 1831 | Female | 5-17 |
| 2 | ASD
|
552 | Male | 5-17 | ||
| 3 | ASD 18-65 f | 31 | Female | 18-65 | ||
| 4 | ASD 18-65 m | 259 | Male | 18-65 | ||
| 5 | TD 5-17 f | 157 | Female | 5-17 | ||
| 6 | TD
|
437 | Male | 5-17 | ||
| 7 | TD 18-65 f | 52 | Female | 18-65 | ||
| 8 | TD 18-65 m | 247 | Male | 18-65 |
Convolution and pooling
padding. In addition, before the convolution operation, pooling, which is a sub-operation of the convolution operation, is performed to reduce overfitting. In the pooling processing, the input matrix of the pooling layer is filtered by the selected filter matrix on the principle of mean or maximum values [72]. With Eq. 2, the size of the output matrix is obtained as a result of the filtering used in both pooling and convolution operations [72].
Softmax and classification
Designing processing of the proposed models
Performance metrics
Experimental results
| Hyper-parameters to optimize | Value ranges | |
| 1 | Number of Convoluiton layer | [1,2,3,4,5,6,7,8] |
| 2 | Number of Maxpooling layer | [1, 2, 3, 4, 5, 6, 7, 8] |
| 3 | Number of FC layers | [1, 2, 3, 4] |
| 4 | Number of filters | [16, 24, 32, 48, 64, 96] |
| 5 | Filter sizes for conv and pooling | [2, 3, 4, 5, 6, 7] |
| 6 | Padding | [0, 1, Same] |
| 7 | Stride | [1, 2, 3] |
| 8 | L2 regularization | [0.0001, 0.0005, 0.001, 0.005] |
| 9 | Momentum | [0.70, 0.75, 0.80, 0.85, 0.9, 0.95] |
| 10 | Mini-batch size | [8, 16, 32, 64, 128] |
| 11 | Learning rate | [0.0001, 0.0003, 0.0005, 0.001, 0.003, 0.005] |
| 12 | Activation function | ReLu, Leaky Relu, ELU, SELU |
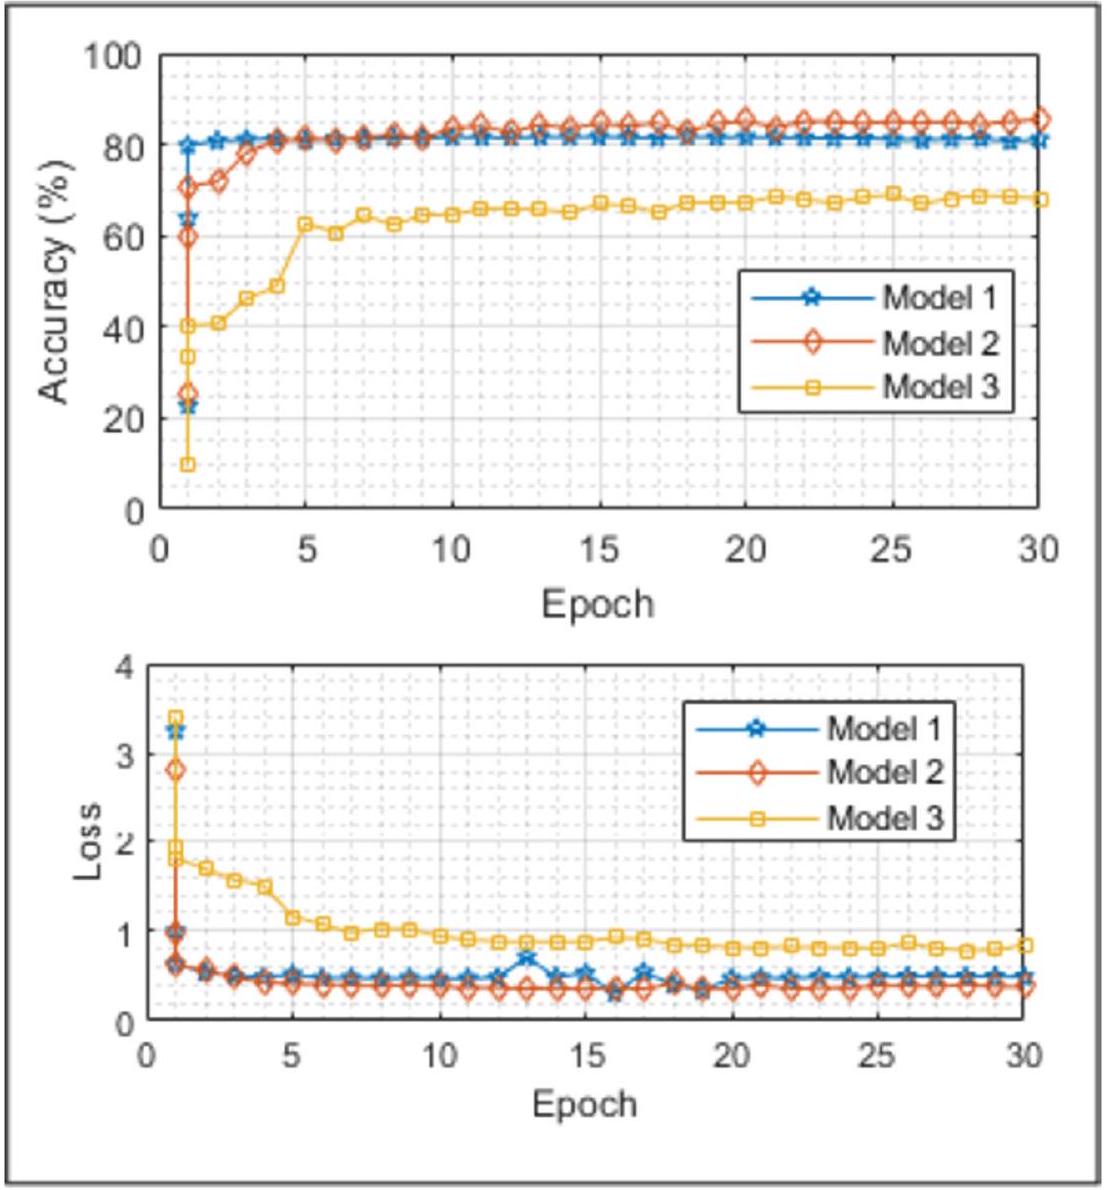
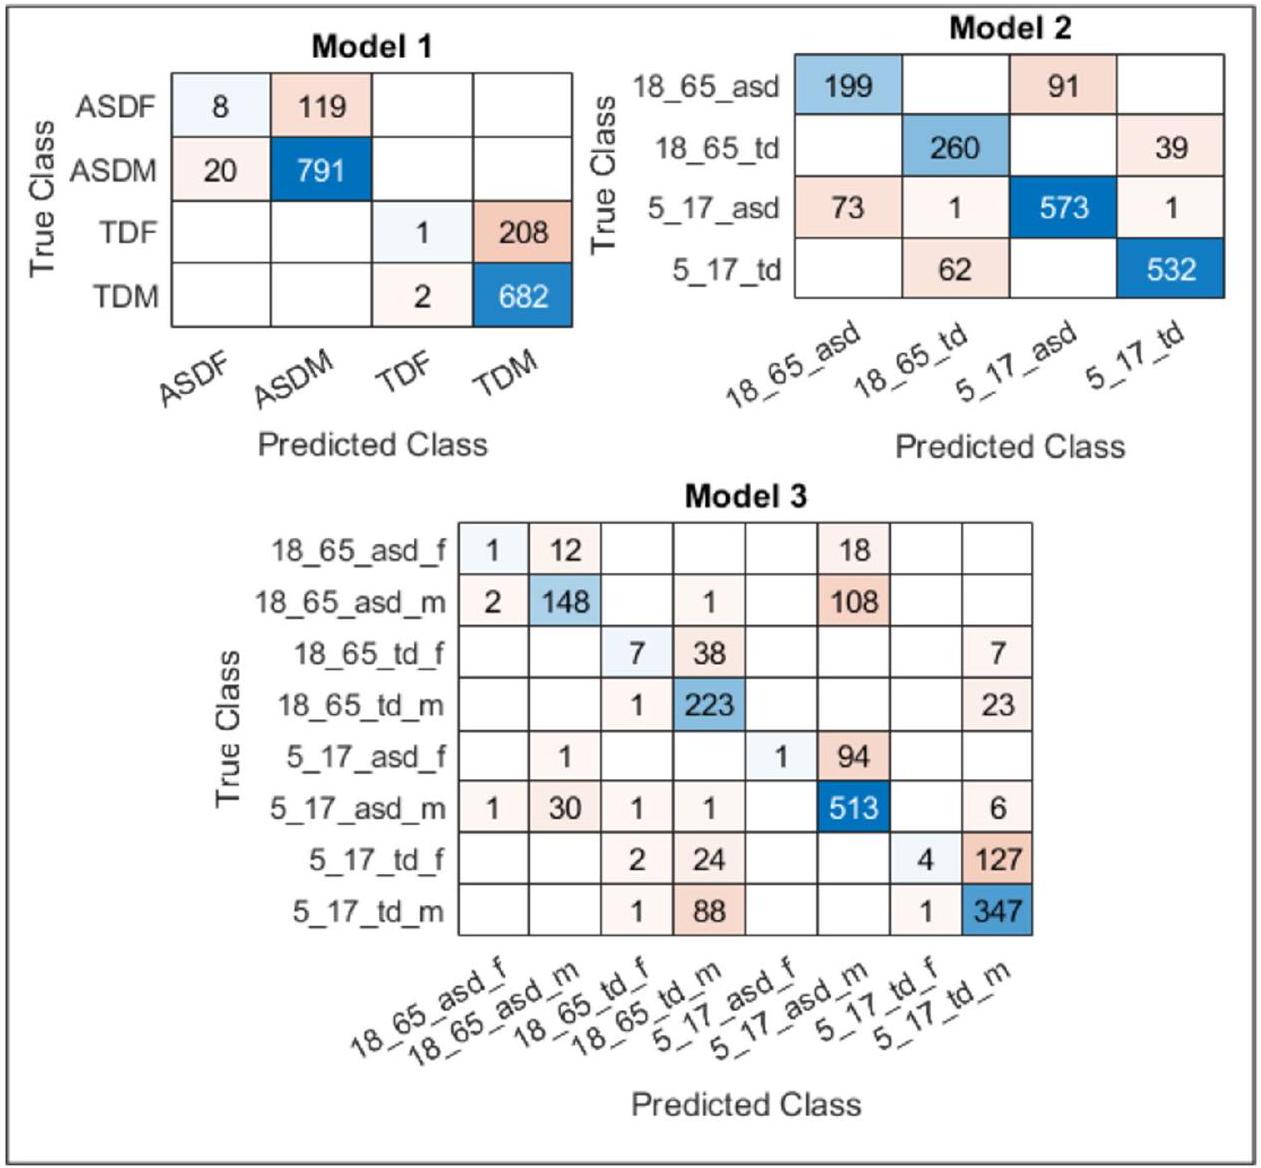
for the same purpose, it is seen that the highest result is obtained with Model 3. Similar comments can be made by examining missing values. With this system designed
| Hyper-parameters | Value | |||
| Model 1 (Gender) | Model 2 (Age) | Model 3 (Both) | ||
| 1 | Number of Convoluiton layer | 7 | 6 | 2 |
| 2 | Number of Maxpooling layer | 7 | 6 | 2 |
| 3 | Number of FC layers | 2 | 2 | 2 |
| 4 | Number of filters [Conv1, Pool1, Conv2, Pool2, Conv3, Pool3, Conv4, Pool4, Conv 5, Pool 5, Conv 6, Pool6, Conv7, Pool7…] | [48, 48, 24, 24, 24, 24, 24, 24, 16 16,16, 16, 16, 16] | [48, 48, 32, 32, 24, 24, 24, 24, 16, 16, 16, 16] | [48, 48, 24, 24] |
| 5 | Filter sizes [Conv1, Pool1, Conv2, Pool2, Conv3, Pool3, Conv4, Pool4, Conv 5, Pool 5, Conv 6, Pool6, Conv7, Pool7 …] | [3, 4, 3, 3, 5, 4, 5, 5, 3, 3, 3, 3, 5, 4] | [4, 3, 4, 3, 5, 4, 3, 5, 4, 4, 4, 4] | [2, 4, 5, 4] |
| 6 | Padding [Conv1, Pool1, Conv2, Pool2, Conv3, Pool3, Conv4, Pool4, Conv 5, Pool 5, Conv 6, Pool6, Conv7, Pool7 …] |
|
|
[0, same, 0, 0] |
| 7 | Stride [Conv1, Pool1, Conv2, Pool2, Conv3, Pool3, Conv4, Pool4, Conv 5, Pool 5, Conv 6, Pool6, Conv7, Pool7 …] | [1,1,2,1,1,1,1,1,2,2,2,1,2,1] | [1,1,1,1,1,1,1,1,2,2,2,2] | [2, 2, 2, 2] |
| 8 | L2 regularization | 0.0001 | 0.0001 | 0.0001 |
| 9 | Momentum | 0.9000 | 0.9000 | 0.9000 |
| 10 | Mini-batch size | 32 | 32 | 32 |
| 11 | Learning rate | 0.0001 | 0.0001 | 0.0002 |
| 12 | Activation function | ReLu | ReLu | ReLu |
| CNN Models | Model 1 (Gender) | Model 2 (Age) | Model 3 (Both) | |||
| Accuracy (%) | Loss | Accuracy (%) | Loss | Accuracy (%) | Loss | |
| Alexnet | 78.13 | 0.9126 | 81.09 | 0.6631 | 62.73 | 1.8453 |
| Googlenet | 77.68 | 1.2609 | 78.59 | 1.0999 | 59.32 | 1.9831 |
| Resnet18 | 73.12 | 1.2083 | 82.46 | 0.8289 | 66.36 | 1.3508 |
| Squeezenet | 72.67 | 1.3960 | 79.27 | 1.0946 | 64.55 | 1.7776 |
| Proposed | 80.94 | 0.4893 | 85.42 | 0.3785 | 67.94 | 0.8418 |
Conclusions and discussion
which, as far as we know, is different from what has been done so far, and which is a first, takes into account age and gender factors and utilizes sMRI brain images. The success and reliability of the designed system were provided by comparing it with the Alexnet, Googlenet, Resnet-18, and Squeezenet popular pre-trained networks. The model developed in this research performs better than these pre-trained models. In addition, the designed system has the feature of generalizability since the data set was acquired from the ABIDE database created by acquiring from 29 different locations, and the data set was enlarged five times by DA techniques. As a result, the accuracy rates acquired as a result of the test performed with all three CNN models designed to be utilized within the system show that the designed system has robust dynamics enough to give the highest accuracy rates.
Appendix 1
| SITE | DEFINITON |
| STANDFORD | Stanford University |
| KKI | Kennedy Krieger Institute |
| KUL | Katholieke Universiteit Leuven |
| LEUVEN | University of Leuven |
| UCD | University of California Davis |
| OHSU | Oregon Health and Science University |
| MAXMUN | Ludwig Maximilians University Munich |
| UCLA | University of California, Los Angeles |
| BNI | Barrow Neurological Institute |
| CALTECH | California Institute of Technology |
| EMC | Erasmus University Medical Center Rotterdam |
| GU | Georgetown University |
| IP | Institut Pasteur and Robert Debré Hospital |
| NYU | New York University Langone Medical Center |
| PITT | University of Pittsburgh |
| SDSU | San Diego State University |
| TRINITY | Trinity Centre for Health Sciences |
| UM | University of Michigan |
| UPSM | University of Pittsburgh School of Medicine |
| YALE | Yale Child Study Center |
| SU | Stanford University (ABIDE II) |
| OLIN | Olin Neuropsychiatry Research Center (ABIDE I) |
| ETH | Eidgenössische Technische Hochschule Zürich |
| TCD | Trinity College Dublin’s School of Medicine |
| IU | Indiana University |
| ONRC | Olin Neuropsychiatry Research Center (ABIDE II) |
| USM | University of Utah School of Medicine |
| CMU | Carnegie Mellon University |
| SBL | Social Brain Lab. BCN NIC UMC Groningen and Netherlands Institute for Neurosciences |
Declarations
Competing Interests The authors declare no competing interests.
References
- Preet K, Shoba S, Shekhar PS, Satish CG, and John VSK (2017) Lost time: Need for more awareness in early intervention of autism spectrum disorder. Asian Journal of Psychiatry 25:13-15
- Constantino JN, Charman T (2016) Diagnosis of autism spectrum disorder: reconciling the syndrome, its diverse origins, and variation in expression www.thelancet.com/neurology 15
- Maenner, M.J., Shaw, K.A., Bakian, A.V., Bilder, D.A., Durkin, M.S., Esler, A.N., Furnier, S.M., Hallas, L., Hall-Lande, J., Hudson, A., Hughes, M.M., Patrick, M.E., Pierce, K.J., Poynter, J.N., Salinas, A., Shenouda, J., Vehorn, A.C., Warren, Z., Constantino, J.N., Dirienzo, M., Fitzgerald, R.T., Grzybowski, A., Spivey, M.H., Pettygrove, S., Zahorodny, W., Ali, A.R., Andrews, J.G., Baroud, T., Gutierrez, J., Hewitt, A.S., Lee, L.C., Lopez, M.L., Mancilla, K.C., McArthur, D., Schwenk, Y.D., Washington, A., Williams, S., & Cogswell, M.E. (2021). Prevalence and Characteristics of Autism Spectrum Disorder Among Children Aged 8 Years – Autism and Developmental Disabilities Monitoring Network, 11 Sites, United States, 2018. MMWR Surveillance Summaries 70: 1-16.
- Senn, M. CDC Estimate on Autism Prevalence Increases by Nearly
, to 1 in 54 Children in the U.S. (2020) Available online at: https://www.autismspeaks.org/press-release/cdc-estimate-autism-prevalence-increasesnearly-10-percent-1-54-children-us. Accessed April 26, 2020. - Jacob, S., Wolff, J.J., Steinbach, M.S., Doyle, C.B., Kumar, V., and Elison, J.T. (2019). Neurodevelopmental heterogeneity and computational approaches for understanding autism. Translational Psychiatry 9.
- Matson, J. L., Rieske R. D., Williams, L.W (2013) The relationship between autism spectrum disorders and attention-deficit/ hyperactivity disorder: an overview. Research in Developmental Disabilities 34: 2475-2484.
- Saito, M., Hirota, T., Sakamoto, Y., Adachi, M., Takahashi, M., Osato-Kaneda, A., Kim, Y.S., Leventhal, B.L., Shui, A.M., Kato, S., and Nakamura, K. (2020) Prevalence and cumulative incidence of autism spectrum disorders and the patterns of co-occurring neurodevelopmental disorders in a total population sample of 5-year-old children. Molecular Autism 11, 2020.
- Autism and Developmental Disabilities Monitoring Network Surveillance Year 2002 Principal Investigators (2007) Prevalence of autism spectrum disorders-Autism and Developmental Disabilities Monitoring Network, 14 sites, United States, 2002. MMWR Surveill Summ 56: No. SS-1
- Napolitano A, Schiavi S, La Rosa P, Rossi-Espagnet MC, Petrillo S, Bottino F, Tagliente E, Longo D, Lupi E, Casula L, Valeri G, Piemonte F, Trezza V and Vicari S. Sex (2022) Differences in Autism Spectrum Disorder: Diagnostic, Neurobiological, and Behavioral Features. Front. Psychiatry 13: 889636. doi: https:// doi.org/10.3389/fpsyt.2022.889636
- Horlin C., Falkmer M., Parsons R., Albrecht MA, Falkmer T (2014) The cost of autism spectrum disorders. PloS One 9 e106552
- Klin A., Klaiman, C., Jones, W (2015) Reducing age of autism diagnosis: developmental social neuroscience meets public health challenge. Revista de Neurologia 60(Suppl 1): 3-11
- Subbaraju V, Sundaram S, Narasimham S, Suresh, MB (2015) Accurate detection of autism spectrum disorder from structural MRI using extended metacognitive radial basis function network. Expert Systems with Applications 42: 8775-8790, 2015.
- Lemm S, Blankertz B, Dickhaus T, Müller KR (2011) Introduction to machine learning for brain imaging. NeuroImage 56: 387-399
- Hastie T, Tibshirani R, Friedman J (2009) The Elements of Statistical Learning. 2nd edition, Springer, New York.
- Lord C, Risi S, Lambrecht L, Cook EH, Leventhal BL, DiLavore PC Pickles A., Rutter M (2000) The autism diagnostic observation schedule-generic a standard measure of social and communication deficits associated with the spectrum of autism. J Autism Dev Disord 30: 205-223
- Lord C, Rutter M, Le Couteur A (1994) Autism diagnostic interview-revised: a revised version of a diagnostic interview for caregivers of individuals with possible pervasive developmental disorders. J Autism Dev Disord 24: 659-685
- Lord C, Petkova E, Hus V, Gan W, Lu F, Martin DM Ousley O, Guy L, Bernier R, Gerdts J. et al (2012) A multisite study of the clinical diagnosis of different autism spectrum disorders. Archives of General Psychiatry 69: 306-313
- O’Shea A, Ahmed R, Lightbody G, Mathieson SR, Pavlidis E, Lloyd RO Pisani F, Marnane WP, Boylan GB, & Temko A (2020) Deep Learning for EEG Seizure Detection in Preterm Infants. International journal of neural systems 2150008
- Peng P, Xie L, & Wei H (2021) A Deep Fourier Neural Network for Seizure Prediction Using Convolutional Neural Network and Ratios of Spectral Power. International journal of neural systems 2150022
- Yu Z, Albera L, Bouquin-Jeannès RL, Kachenoura A, Karfoul A, Yang C, & Shu H (2022) Epileptic Seizure Prediction Using Deep Neural Networks Via Transfer Learning and Multi-Feature Fusion. International journal of neural systems 2250032
- Bhattacharya A, Baweja T, & Karri SP (2021) Epileptic Seizure Prediction Using Deep Transformer Model. International journal of neural systems 2150058
- Thangavel P, Thomas J, Peh WY, Jing J, Yuvaraj R, Cash SS, Chaudhari R, Karia S, Rathakrishnan R, Saini V, Shah N, Srivastava R, Tan Y, Westover B, & Dauwels J (2021) TimeFrequency Decomposition of Scalp Electroencephalograms Improves Deep Learning-Based Epilepsy Diagnosis. International journal of neural systems 2150032
- Ozdemir M, Cura OK, and Akan A (2021) Epileptic EEG Classification by Using Time-Frequency Images for Deep Learning. International journal of neural systems 2150026.
- Bone D, Goodwin MS, Black MP, Lee C, Audhkhasi K, and Narayanan S (2015) Applying Machine Learning to Facilitate Autism Diagnostics: Pitfalls and promises. Journal of Autism
25. Ardakani HA, Taghizadeh M, and Shayegh F (2022) Diagnosis of Autism Disorder Based on Deep Network Trained by Augmented EEG Signals. International journal of neural systems 2250046.
26. Li S, Tang Z, Jin N, Yang Q, Liu G, Liu T, Hu J, Liu S, Wang P, Hao J, Zhang Z, Zhang X, Li J, Wang X, Li Z, Wang Y, Yang B, and Ma L (2022) Uncovering Brain Differences in Preschoolers and Young Adolescents with Autism Spectrum Disorder Using Deep Learning International journal of neural systems 2250044.
27. Rahman MM, Usman OL, Muniyandi RC, Sahran S, Mohamed S, & Razak RA (2020) A Review of Machine Learning Methods of Feature Selection and Classification for Autism Spectrum Disorder. Brain Sciences 10
28. Küçükoglu B, Rueckauer B, Ahmad N, de Ruyter van Steveninck J, Güçlü U, & van Gerven MA (2022) Optimization of Neuroprosthetic Vision via End-to-end Deep Reinforcement Learning. bioRxiv 32(11): 2250052 (16 pages)
29. Xu F, Dong G, Li J, Yang Q, Wang L, Zhao Y, Yan Y, Zhao J, Pang S, Guo D, Zhang Y, & Leng J (2022) Deep Convolution Generative Adversarial Network-Based Electroencephalogram Data Augmentation for Post-Stroke Rehabilitation with Motor Imagery. International journal of neural systems 32(9): 2250039, (15 pages)
30. Alexandridis G, Aliprantis J, Michalakis K, Korovesis K, Tsantilas P, & Caridakis G (2021) A Knowledge-Based Deep Learning Architecture for Aspect-Based Sentiment Analysis. International journal of neural systems 31(10): 2150046 (18 pages)
31. Olamat A, Ozel P, and Atasever S (2022) Deep Learning Methods for Multi-Channel EEG-based Emotion Recognition. International Journal of Neural Systems 32(5): 2250021 (17 pages)
32. Lope JD, & Graña M, (2022) A Hybrid Time-Distributed Deep Neural Architecture for Speech Emotion Recognition. International journal of neural systems 32(6): 2250024 (14 pages)
33. Hu T, Xie L, Zhang L, Li G, & Yi Z (2021) Deep Multimodal Neural Network Based on Data-Feature Fusion for Patient-Specific Quality Assurance. International journal of neural systems 32 (1): 2150055
34. Hashimoto H, Kameda S, Maezawa H, Oshino S, Tani N, Khoo HM, Yanagisawa T, Yoshimine T, Kishima H, & Hirata M (2020) A Swallowing Decoder Based on Deep Transfer Learning: AlexNet Classification of the Intracranial Electrocorticogram. International journal of neural systems 31(11): 2150056 (16 pages)
35. Ieracitano C, Morabito FC, Hussain A, & Mammone N (2021) A Hybrid-Domain Deep Learning-Based BCI For Discriminating Hand Motion Planning From EEG Sources. International journal of neural systems 31(9): 2150038 (20 pages)
36. Usman OL, Muniyandi RC, Omar KB, & Mohamad M (2021) Advance Machine Learning Methods for Dyslexia Biomarker Detection: A Review of Implementation Details and Challenges. IEEE Access 9 36879-36897
37. Usman OL, & Muniyandi RC (2020) CryptoDL: Predicting Dyslexia Biomarkers from Encrypted Neuroimaging Dataset Using Energy-Efficient Residue Number System and Deep Convolutional Neural Network. Symmetry 12, 836
38. Usman OL, Muniyandi RC, Omar KB, and Mohamad M (2021) Gaussian smoothing and modified histogram normalization methods to improve neural-biomarker interpretations for dyslexia classification mechanism. PLoS ONE 16.
39. Macias-Garcia E, Galeana-Perez D, Medrano-Hermosillo J, and Bayro-Corrochano E (2021) Multi-stage Deep Learning Perception System for Mobile Robots. Integrated Computer-Aided Engineering 28(2): 191-205
40. Gasienica-Józkowy J, Knapik M, and Cyganek B (2021) An ensemble deep learning method with optimized weights for
drone-based water rescue and surveillance. Integrated Com-puter-Aided Engineering 28(3): 221-235
41. Jiang K, Han Q, and Du X (2022) Lost Data Neural Semantic Recovery Framework for Structural Health Monitoring Based on Deep Learning. Computer-Aided Civil and Infrastructure Engineering 37(9): 1160-1187
42. Pan X, and Yang TT (2022) Image-based monitoring of bolt loosening through deep-learning-based integrated detection and tracking. Computer-Aided Civil and Infrastructure Engineering 37(10): 1207-1222
43. Chun PJ, Yamane T, and Maemura Y (2022) A deep learning based image captioning method to automatically generate comprehensive explanations of bridge damage. Computer-Aided Civil and Infrastructure Engineering 37(11): 1387-1401
44. Rad NM, and Furlanello C (2016) Applying Deep Learning to Stereotypical Motor Movement Detection in Autism Spectrum Disorders. 2016 IEEE 16th International Conference on Data Mining Workshops 16: 2375-9259, DOI https://doi.org/10. 1109/ICDMW.2016.184
45. Rad NM, Kia MS, Zarbo C, Laarhoven TV, Jurman G, Venuti P, Marchiori E, Furlanello C (2018) Deep Learning for Automatic Stereotypical Motor Movement Detection using Wearable Sensors in Autism Spectrum Disorder. Signal Processing 144: 180-191
46. Wang S, Jiang M, Duchesne XMM, Laugeson EAA, Kennedy DPP, Adolphs R, and Zhao Q (2015) Atypical visual saliency in autism spectrum disorder quantified through model-based eye tracking. Neuron 88(3): 604-616
47. Milièiæ J, Petkoviæ BZ, Boikov J (2003) Dermatoglyphs of Digito-Palmar Complex in Autistic Disorder: Family Analysis. Clinical Sciences 44(4): 469-476
48. Kazemi M, Bordbar MRF, Shahri NM (2017) Comparative Dermatoglyphic Study between Autistic Patients and Normal People in Iran. Iran J Med Sci 42(4)
49. Stošljeviü M, and Adamoviü M, (2013) Dermatoglyphic characteristics of digito-palmar complex in autistic boys in Serbia. Vojnosanit Pregl 70(4): 386-390
50. Peng G, Nourani M, Harvey J, & Dave H, (2021) Personalized EEG Feature Selection for Low-Complexity Seizure Monitoring. International journal of neural systems 31(8): 2150018 (16 pages)
51. Xue Y, Zhu H, and Neri F (2022) A Self-adaptive Multi-objective Genetic Algorithm for Feature Selection in Classification. Integrated Computer-Aided Engineering 29(1): 3-21
52. Tian Y, Ding X, Lin YF, Ma S, and Li L (2022) Automatic Feature Type Selection Network in Digital Photogrammetry of Piping. Computer-Aided Civil and Infrastructure Engineering 37(10): 1335-1348
53. Ad-Dab’bagh Y, Lyttelton O, Muehlboeck JS, et al (2006) The CIVET image processing environment: a fully automated comprehensive pipeline for anatomical neuroimaging research. In: Proceedings of the 12th Annual Meeting of the Organization for Human Brain Mapping Florence Italy 2266
54. Fischl B, Dale AM (2000) Measuring the thickness of the human cerebral cortex from magnetic resonance images. Proc Natl Acad Sci 97: 11050-11055
55. Yahata N, Kasai K, and Kawato M (2017) Computational neuroscience approach to biomarkers and treatments for mental disorders. Psychiatry and Clinical Neurosciences 71: 215-237
56. Ashburner J, and Friston KJ (2000) Voxel-based morphometrythe techniques. NeuroImage 11: 805-821
57. Mandl RC, Schnack HG, Zwiers MP, van der Schaaf A, Kahn RS, Pol HEH (2008) Functional diffusion tensor imaging: measuring task-related fractional anisotropy changes in the human brain along white matter tracts. PloS One 3 e3631
58. Iturria-Medina Y, Canales-Rodriguez EJ, Melie-Garcia L, Valdes-Hernandez PA, Martinez-Montes E, Alemán-Gómez Y,
59. Iturria-Medina Y (2013) Anatomical brain networks on the prediction of abnormal brain states. Brain connectivity 3: 1-21
60. Rubinov M, Sporns O (2010) Complex network measures of brain connectivity: uses and interpretations. NeuroImage 52: 1059-1069
61. Zeighami Y, Ulla M, Iturria-Medina Y, Dadar M, Zhang Y, Larcher KMH, Fonov V, Evans AC, Collins DL, Dagher A (2015) Network structure of brain atrophy in de novo Parkinson’s disease. Elife 4 e08440. https://doi.org/10.7554/eLife. 08440
62. Pereira F, Mitchell T, Botvinick M (2009) Machine learning classifiers and fMRI: a tutorial overview. NeuroImage 45: 199-209
63. Mirzaei G, and Adeli H (2016) Resting State Functional Magnetic Resonance Image Processing Techniques in Stroke Studies. Reviews in the Neurosciences 27(8): 871-885
64. Hassanpour A, Moradikia M, Adeli H, Khayami SR, and Shamsinejad P (2019) A Novel End-to-End Deep Learning Scheme For Classifying Multiclass Motor Imagery EEG Signals. Expert Systems 36(6).
65. Gorriz JM, Ramıırez J, Segovia F, Mart́ınez FJ, Lai MC, Lombardo MV, Baron-Cohen S, and Suckling J (2019) A Machine Learning Approach to Reveal the NeuroPhenotypes of Autisms. Int J Neural Sys 29(7)
66. Heinsfeld AS, Franco AR, Craddock C, Buchweitz A, & Meneguzzi F (2018) Identification of autism spectrum disorder using deep learning and the ABIDE dataset. NeuroImage: Clinical 17: 16-23. https://doi.org/10.1016/j.nicl.2017.08.017
67. Li G, Liu M, Sun Q, Shen D, Wang L (2018) Early Diagnosis of Autism Disease by Multi-channel CNNs. Mach Learn Med Imaging 11046, 303-309. https://doi.org/10.1007/978-3-030-00919-9_35
68. Aghdam MA, Sharifi A, & Pedram MM (2018) Combination of rs-fMRI and sMRI Data to Discriminate Autism Spectrum Disorders in Young Children Using Deep Belief Network. Journal of Digital Imaging 31: 895-903
69. Kong Y, Gao J, Xu Y, Pan Y, Wang J, Liu J (2019) Classification of autism spectrum disorder by combining brain connectivity and deep neural network classifier. Neurocomputing 324: 63-68
70. Di Martino A, Yan CG, Li Q, Denio E, Castellanos FX, Alaerts K, Anderson JS, Assaf M, Bookheimer SY, Dapretto M et al. (2014) The Autism Brain Imaging Data Exchange: towards large-scale evaluation of the intrinsic brain architecture in autism. Molecular Psychiatry 19(6): 659-667 https://doi.org/10.1038/mp. 2013.78
71. Irmak E, (2021) Multi-Classification of Brain Tumor MRI Images Using Deep Convolutional Neural Network with Fully Optimized Framework. Iranian Journal of Science and Technology Transactions of Electrical Engineering 45:1015-1036
72. Michelucci U (2019) Advanced Applied Deep Learning: Convolutional Neural Networks and Object Detection, 1st ed. Apress
73. Bishop CM (2006) Pattern Recognition and Machine Learning. Springer New York NY
74. Ahmadlou M, & Adeli H (2006) Enhanced probabilistic neural network with local decision circles: A robust classifier. Integr Comput Aided Eng 17: 197-210
75. Rafiei MH and Adeli H (2017) A New Neural Dynamic Classification Algorithm,” IEEE Transactions on Neural Networks and Learning Systems, 28(12): 3074-3083 https://doi.org/10.1109/ TNNLS.2017.2682102
- Hojjat Adeli
adeli.1@osu.edu
Hidir Selcuk Nogay
hsnogay@uludag.edu.tr
1 Electrical and Energy Department, Bursa Uludag University, Bursa, Turkey
2 Departments of Biomedical Informatics and Neuroscience, College of Medicine, The Ohio State University Neurology, 370 W. 9th Avenue, Columbus, OH 43210, USA