المجلة: Humanities and Social Sciences Communications، المجلد: 11، العدد: 1
DOI: https://doi.org/10.1057/s41599-024-02807-x
تاريخ النشر: 2024-03-12
DOI: https://doi.org/10.1057/s41599-024-02807-x
تاريخ النشر: 2024-03-12
مقالة
تطبيق خوارزميات تعلم الآلة للتنبؤ باتجاه أسعار الأسهم في سوق الأسهم – حالة فيتنام
أهداف هذه الدراسة هي التنبؤ باتجاه أسعار الأسهم في سوق الأسهم في اقتصاد ناشئ. باستخدام خوارزمية الذاكرة طويلة وقصيرة الأجل (LSTM)، ومؤشرات التحليل الفني المقابلة لكل رمز سهم تشمل: المتوسط المتحرك البسيط (SMA)، ومتوسط التقارب والتباعد (MACD)، ومؤشر القوة النسبية (RSI)؛ وبيانات ثانوية من VN-Index و VN-30، أظهرت نتائج البحث أن نموذج التنبؤ لديه دقة عالية من
مقدمة
لقد كان التنبؤ بالاتجاه المستقبلي لأسعار الأسهم مجال اهتمام للباحثين والمستثمرين. العوامل ومصادر المعلومات التي يجب أخذها في الاعتبار متنوعة وواسعة. وهذا يجعل من الصعب جدًا التنبؤ بسلوك أسعار سوق الأسهم في المستقبل. من الواضح أن أسعار الأسهم لا يمكن التنبؤ بها بدقة. هناك الكثير من الأبحاث التي تسعى لمعالجة هذا التحدي، مقدمة مجموعة متنوعة من الأساليب لتحقيق الهدف (أبيل، 2005؛ براون وآخرون، 1998؛ النجار وآخرون، 2022؛ وفومليت، 2001).
تتبع الأبحاث التجريبية هذا النهج، تم دراسة سين وتشودهوري (2016) وسين (2017) باستخدام تحليل السلاسل الزمنية للتنبؤ بأسعار الأسهم وتقديم نتائج بدقة محتملة. بالإضافة إلى ذلك، أظهرت التنبؤات بأسعار الأسهم على المدى القصير من خلال تطبيق خوارزميات التعلم الآلي والتعلم العميق أيضًا نتائج عالية جدًا (سين وتشودهوري، 2016؛ سين & داتا تشودهوري، 2018). بالإضافة إلى ذلك، أكد مهتاب وسين (2019) على قدرة التنبؤ بأسعار الأسهم القوية والموثوقة لنماذج التعلم الآلي، سواء كانت انحدارية أو تصنيفية. مع بيانات تحليل مشاعر المستخدمين على الشبكات الاجتماعية، باستخدام خوارزمية الشبكة العصبية الضبابية الذاتية التنظيم (SOFNN)، أظهر المؤلفون درجة عالية من الدقة في القيم التنبؤية لمؤشر NIFTY. بالإضافة إلى ذلك، استخدم المؤلفون خوارزمية الشبكة العصبية المركبة (CNN) في التنبؤ ببيانات السلاسل الزمنية، وحققوا نتائج تنبؤية عالية الدقة (مهتاب وسين، 2020).
مع الاتجاهات البحثية الحديثة، فإن نهجًا شائعًا هو تطبيق خوارزميات التعلم الآلي للتعلم من بيانات الأسعار التاريخية، وبالتالي القدرة على التنبؤ بالأسعار المستقبلية. يظهر المقياس قوة التنبؤ على بيانات أسعار الأسهم التاريخية التي تتفوق على الطرق الأخرى بسبب ملاءمتها لهذا النوع من البيانات. تمتلك الشبكات العصبية الانحدارية ذاكرة قصيرة الأجل والفرضية التي سيتم استكشافها هنا هي أن هذه الميزة يمكن أن تكون مفيدة من حيث النتائج عند مقارنتها بالطرق التقليدية (نيلسون وآخرون 2017).
على وجه الخصوص، تؤكد خوارزمية LSTM (الذاكرة طويلة وقصيرة الأجل) على الاستقرار والكفاءة في التنبؤ بأسعار الأسهم على المدى القصير. هذه خوارزمية عصبية انحدارية ذات خصائص مناسبة بفضل قدرتها على تمييز وتجميع تأثيرات العوامل قصيرة وطويلة الأجل، من خلال إعطاء أوزان مختلفة لكل معلمة مع تخطي الذاكرة التي تعتبر غير ذات صلة للتنبؤ بالمخرجات التالية. بهذه الطريقة، تكون خوارزمية LSTM قادرة على التعامل مع تسلسلات إدخال أطول مقارنة بالشبكات العصبية المتكررة الأخرى التي يمكنها فقط تذكر تسلسلات قصيرة (باهوا وآخرون 2017). LSTM هي واحدة من أنجح خوارزميات RNNs. تقدم LSTM خلية الذاكرة، وهي وحدة حسابية تحل محل الخلايا العصبية الاصطناعية التقليدية في الطبقة المخفية من الشبكة. بالإضافة إلى ذلك، يمكن للشبكات ربط الذكريات والإدخال بكفاءة في الوقت المناسب، مما يجعلها مناسبة لالتقاط هياكل البيانات الزمنية المرنة ذات القابلية العالية للتنبؤ (تشين وآخرون 2015).
مع طبيعة التحليل التنبؤي قصير الأجل القائم على بيانات السلاسل الزمنية، يتم تطبيق الجمع بين التعلم الآلي والتحليل الفني في التنبؤ بأسعار الأسهم على المدى القصير على نطاق واسع. علاوة على ذلك، تقترح بعض الدراسات أنماط التحليل الفني لأسعار الأسهم حيث الهدف هو اكتشاف أنماط تقلب أسعار الأسهم التي تؤدي إلى عوائد للمستثمرين. لهذا الغرض، تم اقتراح مؤشرات مختلفة لأسعار الأسهم والتحليل الفني، مثل نطاق بولينجر، ومتوسط التقارب والتباعد (MACD)، ومؤشر القوة النسبية (RSI)، والمتوسط المتحرك (MA)، والزخم العشوائي (MS)، وموجة الساين الميتا (MSW). بالإضافة إلى هذه المؤشرات، تعتبر بعض الأنماط المعروفة في تحركات أسعار الأسهم، مثل الرأس والكتفين، والمثلث، والعلم، ومروحة فيبوناتشي، ومجرفة أندرو، إلخ، أيضًا واحدة من المؤشرات المهمة للاستثمار في سوق الأسهم (نيلسون وآخرون 2017؛ بوروفكوفا وتسياماس، 2019). هذه الأساليب
تقدم المزيد من الفعالية للمستثمرين المحتملين في اتخاذ قرارات الاستثمار.
تقدم المزيد من الفعالية للمستثمرين المحتملين في اتخاذ قرارات الاستثمار.
احتمال آخر، يمكن دراسة السلاسل الزمنية بواسطة العديد من التقنيات، ربما باستخدام طريقة DID (الفرق في الفرق) كما تم مناقشته في دراسة ترينه وآخرون (2021)، أو يمكنك استخدام طرق أخرى مثل الانحدار الذاتي غير الخطي الموزع المتأخر لـ لي وآخرون (2022). ومع ذلك، فإن نموذج LSTM أكثر ملاءمة في التنبؤ بأسعار الأسهم على المدى القصير في مجال التعلم الآلي. بالإضافة إلى ذلك، لم يتم استخدام هذه الطريقة على نطاق واسع في السوق الفيتنامية. علاوة على ذلك، تم تأسيس سوق الأسهم الفيتنامية في عام 2000، لكنها تطورت بسرعة ولديها قيمة سوقية تبلغ
يمكن تقسيم بقية الدراسة على النحو التالي: القسم “الأساس النظري” يناقش الأساس النظري، بينما القسم “جمع البيانات ومنهجية البحث” مخصص لجمع البيانات ومنهجية البحث. بالإضافة إلى ذلك، يناقش القسم “نتائج البحث والمناقشات” نتائج البحث والمناقشات. أخيرًا، يصور القسم “الاستنتاجات” الاستنتاجات.
الأساس النظري
نظرية الأساس. عند مناقشة سوق الأسهم، مع تعقيداته الفطرية، كانت قابلية التنبؤ بعوائد الأسهم دائمًا موضوع نقاش يجذب الكثير من الأبحاث. يفترض فاما (1970) فرضية السوق الفعالة التي تحدد أن السعر الحالي لأصل ما يعكس دائمًا جميع المعلومات السابقة المتاحة له على الفور. بالإضافة إلى ذلك، تنص فرضية المشي العشوائي على أن تغيرات سعر السهم مستقلة عن تاريخه، بعبارة أخرى، سيعتمد سعر الغد فقط على معلومات الغد بغض النظر عن سعر اليوم (برتون، 2018). تؤسس هاتان الفرضيتان أنه لا توجد وسيلة للتنبؤ بدقة بأسعار الأسهم.
من ناحية أخرى، هناك مؤلفون آخرون يجادلون بأنه، في الواقع، يمكن التنبؤ بأسعار الأسهم على الأقل إلى حد ما. وقد كانت مجموعة متنوعة من الأساليب للتنبؤ ونمذجة سلوك الأسهم موضوع بحث في العديد من التخصصات المختلفة، مثل الاقتصاد، والإحصاء، والفيزياء، وعلوم الكمبيوتر (لو وماكينلاي، 1999).
مؤشر التحليل الفني. تعتبر طريقة التحليل الفني، وهي طريقة تعتمد على البيانات التاريخية من السوق، وخاصة السعر والحجم، وسيلة شائعة لنمذجة وتوقع سوق الأسهم. يتبع التحليل الفني عدة افتراضات: (1) يتم تحديد الأسعار حصريًا من خلال علاقات العرض والطلب؛ (2) تتغير الأسعار مع الاتجاه؛ (3) تسبب التغيرات في العرض والطلب في عكس الاتجاه؛ (4) يمكن تحديد التغيرات في العرض والطلب على الرسم البياني؛ و(5) تميل الأنماط على الرسم البياني إلى التكرار. بعبارة أخرى، لا يأخذ التحليل الفني في الاعتبار أي عوامل خارجية مثل السياسية أو الاجتماعية أو الاقتصادية الكلية (كيركباتريك ودالهكويست، 2010). تظهر أبحاث بيوندو وآخرون (2013) أن استراتيجيات التداول قصيرة الأجل المستندة إلى التحليل الفني
الشكل 1 هيكل شبكة عصبية متكررة (RNN). المصدر: لاي وآخرون (2019).
يمكن أن تعمل المؤشرات بشكل أفضل من بعض الطرق التقليدية، مثل تقارب وتباعد المتوسط المتحرك (MACD) ومؤشر القوة النسبية (RSI).
التحليل الفني هو وسيلة موثوقة للتنبؤ باتجاهات السوق المستقبلية من خلال توليد إشارات شراء أو بيع بناءً على معلومات محددة تم الحصول عليها من تلك الأسعار. لقد أصبح شيوع التحليل الفني وتطبيقه المستمر معترفًا به على نطاق واسع مع تقنيات لكشف أي نمط مخفي يتراوح من التحليل الأساسي جدًا للمتوسطات المتحركة إلى التعرف على أنماط السلاسل الزمنية المعقدة إلى حد ما. أظهر بروك وآخرون (1992) أن قواعد التداول البسيطة المستندة إلى حركة عوائد المتوسطات المتحركة قصيرة الأجل وطويلة الأجل لها قوة تنبؤية كبيرة مع بيانات يومية لأكثر من قرن على مؤشر داو جونز الصناعي. قام فيفيلد وآخرون (2005) بالتحقيق في القوة التنبؤية لقاعدة ‘الفلتر’ وقاعدة ‘مؤشر المتوسط المتحرك’ في 11 سوقًا أوروبية للأسهم، بما في ذلك تغطية الفترة من يناير 1991 إلى ديسمبر 2000. تشير نتائجهم الرئيسية إلى أن أربعة أسواق ناشئة: اليونان، المجر، البرتغال وتركيا، غير فعالة من حيث المعلومات، مقارنةً بسبعة أسواق أخرى أكثر تقدمًا. تدعم النتائج التجريبية السابقة التحليل الفني (فيفيلد وآخرون 2005)؛ ومع ذلك، يمكن انتقاد مثل هذه الأدلة بسبب تحيز البيانات (بروك وآخرون 1992).
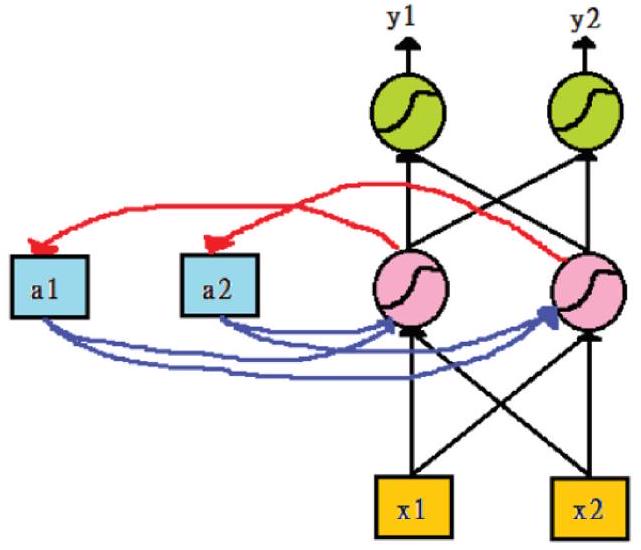
خوارزمية الذاكرة طويلة وقصيرة المدى (LSTM). اقترح إلمان (1990) شبكة عصبية متكررة (RNN). بشكل أساسي، تحل RNN مشكلة معالجة بيانات التسلسل، مثل النصوص، الصوت، والفيديو. هناك علاقة تسلسلية بين عينات هذا النوع من البيانات، وكل عينة مرتبطة بعينتها السابقة. على سبيل المثال، في النص، يرتبط الكلمة بالكلمة التي تسبقها. في البيانات المناخية، يتم دمج درجة حرارة يوم واحد مع درجة حرارة الأيام القليلة السابقة. يتم تعريف مجموعة من الملاحظات كسلسلة يمكن من خلالها ملاحظة تسلسلات متعددة. هذه الميزة من خوارزمية RNN مناسبة جدًا لخصائص بيانات السلاسل الزمنية في تحليل الأسهم كما هو موضح في الشكل 1:
تظهر الشكل 1 هيكل شبكة عصبية متكررة (RNN)، حيث يتم تخزين مخرجات الطبقة المخفية في الذاكرة. يمكن اعتبار الذاكرة كمدخل آخر. السبب الرئيسي لصعوبة تدريب الشبكات العصبية المتكررة هو تمرير معلمة الطبقة المخفية.
الشكل 2 هيكل وحدة LSTM. المصدر: دينغ وآخرون (2015).
توجد هذه المشكلة في أي شبكة عصبية عميقة، لكنها تتضح بشكل خاص بسبب الهيكل التكراري لشبكات RNN. علاوة على ذلك، تختلف شبكات RNN عن الشبكات التقليدية في أنها لا تحتوي فقط على اتصالات عصبية في اتجاه واحد، بمعنى آخر، يمكن للخلايا العصبية نقل البيانات إلى طبقة سابقة أو نفس الفئة. عدم تخزين المعلومات في اتجاه واحد هو ميزة عملية لوجود الذاكرة قصيرة المدى، بالإضافة إلى الذاكرة طويلة المدى التي اكتسبتها الشبكات العصبية من خلال التدريب.
تهدف خوارزمية الذاكرة طويلة المدى (LSTM) التي قدمها بحث هوخرتر وشميدهوبر (1997) إلى تحسين الأداء من خلال حل مشكلة تلاشي التدرج التي تعاني منها الشبكات المتكررة عند التعامل مع سلاسل طويلة من البيانات. في LSTM، كل خلية عصبية هي “خلية ذاكرة” تربط المعلومات السابقة بالمهمة الحالية. شبكة LSTM هي نوع خاص من الشبكات العصبية المتكررة (RNN). يمكن لـ LSTM التقاط الخطأ، بحيث يمكن نقله عبر الطبقات مع مرور الوقت. يحتفظ LSTM بالخطأ عند حد أقصى معين، مما يعني أن شبكة LSTM قد تستغرق وقتًا طويلاً للتدريب، وتفتح الباب لتعيين تصحيح المعلمات في الخوارزمية (ليو وآخرون 2018). LSTM هي طوبولوجيا شبكة خاصة تحتوي على ثلاث هياكل “بوابة” (موضحة في الشكل 2). يتم وضع ثلاثة موانئ في وحدة LSTM، والتي تُسمى موانئ الإدخال والنسيان والإخراج. بينما تدخل المعلومات إلى شبكة LSTM، يمكن اختيارها وفقًا للقواعد. فقط المعلومات التي تتطابق مع الخوارزمية سيتم تمريرها، والمعلومات التي لا تتطابق سيتم نسيانها من خلال بوابة النسيان.
تسمح هذه البنية المعتمدة على البوابات بنقل المعلومات بشكل انتقائي إلى الوحدة التالية بناءً على مبدأ دالة التنشيط لشبكة LSTM. تُستخدم شبكات LSTM على نطاق واسع وقد حققت بعض النتائج الإيجابية عند مقارنتها بأساليب أخرى (غريفز، 2012)، خاصة من حيث معالجة اللغة الطبيعية، وخاصة في التعرف على الكتابة اليدوية (غريفز وآخرون، 2008). لقد تفرع خوارزم LSTM إلى عدد من التعديلات، ولكن عند مقارنته بالأصلي، لا يبدو أنها قد حققت أي تحسينات ملحوظة حتى الآن (غريف وآخرون، 2016).
دراسة تجريبية. البيانات المتعلقة بسوق الأسهم كبيرة جداً وغير خطية في طبيعتها. لنمذجة هذا النوع من البيانات، من الضروري استخدام نماذج يمكنها تحليل الأنماط على الرسم البياني. خوارزميات التعلم العميق قادرة على تحديد واستغلال المعلومات المخفية داخل البيانات من خلال عملية التعلم الذاتي. على عكس الخوارزميات الأخرى، يمكن لنماذج التعلم العميق نمذجة هذا النوع من البيانات بكفاءة (أغراوال وآخرون 2019).
تدرس الأبحاث التي تحلل بيانات السلاسل الزمنية المالية باستخدام نماذج الشبكات العصبية العديد من أنواع المتغيرات المدخلة المختلفة للتنبؤ بعوائد الأسهم. في بعض الدراسات، تتضمن البيانات المدخلة المستخدمة لبناء النموذج سلسلة زمنية واحدة فقط (جيا،
2016). تشمل بعض الدراسات الأخرى كلا من المؤشرات التي تظهر معلومات السوق والمتغيرات الاقتصادية الكلية (وايت، 1988). بالإضافة إلى ذلك، هناك العديد من الاختلافات في تطبيق نماذج الشبكات العصبية على تحليل بيانات السلاسل الزمنية: يجمع دينغ وآخرون (2015) بين تحليل السلاسل الزمنية المالية ومعالجة بيانات اللغة الطبيعية، بينما يستخدم رومان وجميل (1996) وهيتون وآخرون (2016) بنية التعلم العميق لنمذجة السلاسل الزمنية المالية متعددة المتغيرات. تقدم دراسة تشان وآخرون (2000) نموذج شبكة عصبية باستخدام متغيرات التحليل الفني التي تم تنفيذها للتنبؤ بسوق الأسهم في شنغهاي، وقارنت أداء خوارزميتين وطريقتين مختلفتين لتهيئة الأوزان. تظهر النتائج أن كفاءة الانتشار العكسي يمكن أن تزداد من خلال تعلم التدرج المترافق مع تهيئة أوزان الانحدار الخطي المتعدد.
2016). تشمل بعض الدراسات الأخرى كلا من المؤشرات التي تظهر معلومات السوق والمتغيرات الاقتصادية الكلية (وايت، 1988). بالإضافة إلى ذلك، هناك العديد من الاختلافات في تطبيق نماذج الشبكات العصبية على تحليل بيانات السلاسل الزمنية: يجمع دينغ وآخرون (2015) بين تحليل السلاسل الزمنية المالية ومعالجة بيانات اللغة الطبيعية، بينما يستخدم رومان وجميل (1996) وهيتون وآخرون (2016) بنية التعلم العميق لنمذجة السلاسل الزمنية المالية متعددة المتغيرات. تقدم دراسة تشان وآخرون (2000) نموذج شبكة عصبية باستخدام متغيرات التحليل الفني التي تم تنفيذها للتنبؤ بسوق الأسهم في شنغهاي، وقارنت أداء خوارزميتين وطريقتين مختلفتين لتهيئة الأوزان. تظهر النتائج أن كفاءة الانتشار العكسي يمكن أن تزداد من خلال تعلم التدرج المترافق مع تهيئة أوزان الانحدار الخطي المتعدد.
مع الطبيعة المناسبة وعالية الأداء لنموذج الشبكة العصبية الانحدارية (RNN)، تم إجراء الكثير من الأبحاث حول تطبيق RNN في مجال تحليل الأسهم والتنبؤ بها. استخدم رومان وجميل (1996) نماذج متتالية وRNNs للتنبؤ بمؤشرات الأسهم لخمسة أسواق أسهم مختلفة. طبق سعد وبروخوروف وونش (1998) نماذج الشبكات العصبية ذات التأخير الزمني والتكرار والاحتمالية للتنبؤ ببيانات الأسهم يوميًا. طبق حجازي وآخرون (2014) خوارزميات التعلم الآلي مثل PSO وLS-SVM للتنبؤ بسوق الأسهم S&P 500. مع ظهور LSTM، أصبح تحليل البيانات المعتمد على الوقت أكثر كفاءة. يتمتع خوارزم LSTM بقدرة على تخزين المعلومات التاريخية ويستخدم على نطاق واسع في التنبؤ بأسعار الأسهم (هيتون وآخرون 2016).
لقد تم تقدير أداء شبكة LSTM بشكل كبير عند دمجها مع معالجة اللغة الطبيعية (NLP)، التي تستخدم بيانات نص الأخبار كمدخلات للتنبؤ باتجاهات الأسعار. بالإضافة إلى ذلك، هناك أيضًا عدد من الدراسات التي تستخدم بيانات الأسعار للتنبؤ بحركات الأسعار (تشن وآخرون 2015)، باستخدام بيانات الأسعار التاريخية بالإضافة إلى مؤشرات الأسهم للتنبؤ بما إذا كانت أسعار الأسهم ستزيد أو تنقص أو تبقى كما هي خلال اليوم (دي بيرسيو وهونشار، 2016)، أو مقارنة أداء LSTM بأسلوبه المقترح بناءً على مجموعة من الخوارزميات المختلفة (باهوا وآخرون 2017).
يجمع زوغي وآخرون (2017) بين LSTM وطريقة بايزي الساذجة لاستخراج عوامل المشاعر السوقية لتحسين الأداء التنبؤي. يمكن استخدام هذه الطريقة للتنبؤ بالأسواق المالية على مقاييس زمنية مختلفة تمامًا عن المتغيرات الأخرى. يتم دمج نموذج تحليل المشاعر مع نموذج السلاسل الزمنية LSTM للتنبؤ بسعر افتتاح السهم وتظهر النتائج أن هذا النموذج يمكن أن يحسن دقة التنبؤ.
ناقش جيا (2016) فعالية LSTM في أبحاث التنبؤ بأسعار الأسهم وأظهر أن LSTM هو طريقة فعالة للتنبؤ بعوائد الأسهم. تم دمج تحويل الموجات اللحظية في الوقت الحقيقي مع شبكة LSTM للتنبؤ بمؤشر الأسهم في شرق آسيا، مما صحح بعض العيوب المنطقية في الدراسات السابقة. مقارنةً بالنموذج الذي يستخدم LSTM فقط، يمكن أن يحسن النموذج المدمج بشكل كبير من درجة التنبؤ ويكون خطأ الانحدار صغيرًا. بالإضافة إلى ذلك، اعتقد غولميز (2023) أن نموذج LSTM مناسب لبيانات السلاسل الزمنية في الأسواق المالية في سياق أسعار الأسهم التي تم إنشاؤها على أساس علاقات العرض والطلب. في البحث عن مؤشر داو جونز للأسهم، وهو سوق للأسهم والسندات والأوراق المالية الأخرى في الولايات المتحدة، قام المؤلفون أيضًا بتوقعات الأسهم للفترة من 2019 إلى 2023. بحث آخر من عثماني شمس (2023) حول أبحاث سوق الأسهم الباكستاني حول السوق العامة، والصناعة، وفئات الأخبار المتعلقة بالأسهم وتأثيرها على توقع أسعار الأسهم. هذا يؤكد أن نموذج LSTM يتم استخدامه بشكل أوسع في التنبؤ بأسعار الأسهم مؤخرًا.
جمع البيانات ومنهجية البحث
جمع البيانات. تطبق الأبحاث خوارزمية LSTM ومؤشرات التحليل الفني للتنبؤ باتجاهات الأسعار على
سوق الأسهم الفيتنامية. لتحقيق هدف البحث أعلاه، استخدم المؤلفون بيانات البحث، بما في ذلك تاريخ أسعار VN-Index والأسهم في مجموعة VN-30، التي تم جمعها من مصادر بيانات ثانوية على موقع الويبvietstock.vn. القائمة المحددة للأسهم التي سيتم جمعها هي كما يلي:
تظهر الجدول 1 أن الدراسة اختارت 31 شركة وجميعها حاليًا شركات كبيرة، بشكل رئيسي في مجموعة VN-30. في سوق الأسهم الفيتنامية، تعتبر VN-30 مجموعة من 30 ورقة مالية ذات قيمة سوقية كبيرة وسيولة عالية، وهي تمثل نموذجًا نموذجيًا لسوق الأسهم (هنا تمثل VN-Index). بالإضافة إلى ذلك، يبدأ وقت جمع بيانات الأسعار التاريخية من الوقت الذي يتم فيه إدراج الأسهم في البورصة حتى 1 أبريل 2021. هذه الفترة مرتبطة ارتباطًا وثيقًا بتأثير الوباء، لذا تقوم هذه الدراسة بإجراء تقييم للتنبؤ في تأثير الوباء. علاوة على ذلك، سيكون طول بيانات تاريخ الأسعار للأسهم مختلفًا لأن هذه الأسهم لها تواريخ بدء إدراج مختلفة. يتم استخدام طريقة التصنيف وفقًا لمعيار نظام تصنيف GICS.
يتم جمع البيانات في البداية أدناه، بما في ذلك المؤشرات التالية: سعر الإغلاق، سعر الافتتاح، أعلى سعر، أدنى سعر وحجم التداول المقابل لكل جلسة تداول من الأسهم في القائمة. تتم معالجة بيانات الأسعار التاريخية من خلال الخطوات المحددة التالية:
الخطوة 1: تحقق من البيانات، وتعامل مع عيوب البيانات مثل: البيانات الفارغة، انحراف البيانات. سيتم فحص الحالات التي تحتوي على بيانات معيبة وإضافتها.
الخطوة 2: حساب مؤشرات التحليل الفني المقابلة لكل سهم، بما في ذلك: المتوسط المتحرك البسيط (SMA)، المتوسط المتحرك للتقارب والتباعد (MACD)، ومؤشر القوة النسبية (RSI).
الخطوة 3: يتم تجميع بيانات الأسعار التاريخية مع مؤشر التحليل الفني المقابل، وسيتم استبعاد الملاحظات التي تفتقر إلى البيانات بسبب اختلافات في عملية حساب مؤشرات التحليل الفني.
الخطوة 4: يتم استخدام بيانات التجميع بما في ذلك تاريخ الأسعار ومؤشرات التحليل الفني كبيانات مدخلة لنموذج الذاكرة طويلة وقصيرة الأجل (LSTM) لإجراء توقعات أسعار الأسهم.
يستخدم المؤلف برنامج Microsoft Office Excel ولغة Python لحساب مؤشرات التحليل الفني، ومعالجة وتحليل البيانات. يتم بناء نموذج الذاكرة طويلة وقصيرة الأجل (LSTM) على أساس مكتبات الدعم Sklearn وKeras وTensorflow.
منهجية البحث. تستخدم هذه الدراسة نموذج الذاكرة طويلة وقصيرة الأجل (LSTM). بالإضافة إلى ذلك، يتم تقسيم البيانات إلى مجموعتين منفصلتين: التدريب والاختبار. تتضمن مجموعة التدريب بيانات من تاريخ بدء الإدراج حتى 31 ديسمبر 2020، بينما تتضمن مجموعة الاختبار بيانات من 1 يناير 2021 حتى 1 أبريل 2021. يتم استخدام بيانات مجموعة التدريب لنموذج LSTM وتستخدم بيانات مجموعة الاختبار لتقييم أداء النموذج. البيانات في مجموعتي التدريب والاختبار مستقلة تمامًا، لضمان الموضوعية في عملية تقييم أداء النموذج.
يمكن تأكيد ميزة طريقة LSTM أن هذه الطريقة تتم معالجتها على بيانات يومية، لذا من الممكن قياس تقلبات أسعار الأسهم اليومية، وفي نفس الوقت يمكن للدراسة التحكم في دقة التحليل من خلال دقة توقعات النموذج.
استخدم المؤلفون معامل الخطوة لنموذج LSTM كـ 60. أي أن نموذج LSTM سيستخدم بيانات الـ 60 يومًا السابقة للتنبؤ بسعر السهم في اليوم التالي. وفقًا لذلك، يتم بناء نموذج LSTM بهيكل مكون من 4 طبقات تشمل المعاملات المحددة التالية:
الطبقة 1: الوحدات
الجدول 1 قائمة رموز الأسهم المستخدمة في الدراسة.
| لا. | الرمز | اسم الشركة | الفرع | تاريخ الإدراج |
| 1 | VN-Index | VN-Index | N/A | 20/07/2000 |
| 2 | BID | بنك الاستثمار والتنمية في فيتنام | المالية | 24/01/2014 |
| 3 | BVH | مجموعة باو فيت | المالية | 25/06/2009 |
| 4 | CTG | بنك الصناعة والتجارة في فيتنام | المالية | 16/07/2009 |
| 5 | FPT | مجموعة FPT | التكنولوجيا | 13/12/2006 |
| 6 | GAS | شركة الغاز الفيتنامية | المرافق | 21/05/2012 |
| 7 | HDB | بنك التنمية التجارية في مدينة هو تشي منه | المالية | 05/01/2018 |
| 8 | HPG | شركة مجموعة هوا فات المساهمة | التصنيع | 15/11/2007 |
| 9 | KDH | شركة كهانغ ديان للتجارة والاستثمار المساهمة | البناء | 01/02/2010 |
| 10 | MBB | بنك التجارة العسكرية المساهمة | المالية | 01/11/2011 |
| 11 | MSN | شركة ماسان المساهمة | التصنيع | 05/11/2009 |
| 12 | MWG | شركة الاستثمار في عالم الهاتف المحمول المساهمة | التجزئة | 14/07/2014 |
| 13 | NVL | مجموعة نوفا للاستثمار العقاري المساهمة | البناء | 28/12/2016 |
| 14 | PDR | شركة فات دات لتطوير العقارات المساهمة | البناء | 30/07/2010 |
| 15 | PLX | شركة النفط الوطنية الفيتنامية | النفط والغاز | 21/04/2017 |
| 16 | PNJ | شركة فوه نوان للمجوهرات المساهمة | التصنيع | 23/03/2009 |
| 17 | POW | شركة بتروفيتنام للطاقة | المرافق | 14/01/2019 |
| 18 | REE | شركة التبريد والميكانيكا والكهرباء المساهمة | البناء | 28/07/2000 |
| 19 | SBT | شركة ثان ثان كونغ المساهمة – بين هوا | التصنيع | 25/02/2008 |
| 20 | SSI | شركة SSI. للأوراق المالية المساهمة | المالية | 29/10/2007 |
| 21 | STB | بنك سايغون ثوانغ تن التجارية المساهمة | المالية | 12/07/2006 |
| 22 | TCB | بنك التكنولوجيا والتجارة الفيتنامي المساهمة | المالية | 04/06/2018 |
| 23 | TCH | شركة هوang هوي للخدمات المالية والاستثمار المساهمة | بناء | 05/10/2016 |
| ٢٤ | TPB | بنك تيان فونغ التجاري المشترك | المالية | 19/04/2018 |
| ٢٥ | VCB | البنك التجاري المشترك للتجارة الخارجية في فيتنام | المالية | 30/06/2009 |
| ٢٦ | VHM | شركة فينهومز المساهمة | بناء | 17/05/2018 |
| 27 | فيك | شركة فيت جروب | بناء | 19/09/2007 |
| ٢٨ | VJC | شركة فيت جيت للطيران المساهمة | عربة | 28/02/2017 |
| ٢٩ | في إن إم | شركة فيتنام لمنتجات الألبان المساهمة | التصنيع | 19/01/2006 |
| 30 | VPB | بنك فيتنام للازدهار التجاري المشترك | المالية | 17/08/2017 |
| 31 | VRE | شركة فين كوم للتجزئة | بناء | 06/11/2017 |
ملاحظة: يمكن الرجوع إلى جميع الأشكال في الملحق لمزيد من المعلومات حول هذه الأسهم.
المصدر: تحليل المؤلفين.
المصدر: تحليل المؤلفين.
النموذج: “sequential_101”
| طبقة (نوع) | شكل المخرج | بارام # | |||
| 1stm_404 (LSTM) | (لا شيء، 60، 30) | ٤٨٠٠ | |||
| الطالب المتسرب_388 (التسرب) | (لا شيء، 60، 30) | 0 | |||
| 1stm_405 (LSTM) | (لا شيء، 60، 40) | ١١٣٦٠ | |||
| الطالب المتسرب_389 (التسرب الدراسي) | (لا شيء، 60، 40) | 0 | |||
| 1stm_406 (LSTM) | (لا شيء، 60، 50) | 18200 | |||
| انقطاع_390 (انقطاع) | (لا شيء، 60، 50) | 0 | |||
| 1stm_407 (LSTM) | (لا شيء، 60) | 26640 | |||
| التسرب_391 (التسرب) | (لا شيء، 60) | 0 | |||
| كثيف_101 (كثيف) | (لا شيء، 1) | 61 | |||
|
الشكل 3 نموذج LSTM. المصدر: تحليل المؤلفين.
الطبقة 2: الوحدات
الطبقة 3: الوحدات
الطبقة 4: الوحدات
تم بناء النموذج على منصة لغة بايثون المحددة في الشكل 3 كما يلي:
الطبقة 3: الوحدات
الطبقة 4: الوحدات
تم بناء النموذج على منصة لغة بايثون المحددة في الشكل 3 كما يلي:
تشير الشكل 3 إلى أن النموذج تم تجميعه مع المعاملات المحددة التالية: المحسن
“خطأ متوسط المربعات”. بعد ذلك، قم بتدريب النموذج باستخدام المعاملات التالية: العصور
“خطأ متوسط المربعات”. بعد ذلك، قم بتدريب النموذج باستخدام المعاملات التالية: العصور
بعد بناء نموذج LSTM باستخدام بيانات مجموعة التدريب، سيتنبأ نموذج LSTM بأسعار الأسهم للملاحظات المقابلة من مجموعة الاختبار، أي جلسات التداول من 1 يناير 2021 حتى 1 أبريل 2021. سيتم مقارنة سعر السهم المتوقع من النموذج مع سعر السهم الفعلي لجلسة التداول المعنية. يتم تقييم دقة توقعات النموذج بناءً على الصيغة التالية:
أين:
سيتم مقارنة دقة توقعات نموذج LSTM مع القيمة الأساسية لـ
خطأ هو
خطأ هو
نتائج البحث والمناقشات
عند تطبيق خوارزمية LSTM ومؤشرات التحليل الفني للتنبؤ باتجاهات الأسعار في سوق الأسهم الفيتنامي. في هذا القسم، سيقدم المؤلفون نتائج البيانات بعد إجراء التحليل وفقًا لعملية البحث والطريقة، بالإضافة إلى تقديم تعليقات ومناقشة نتائج البحث.
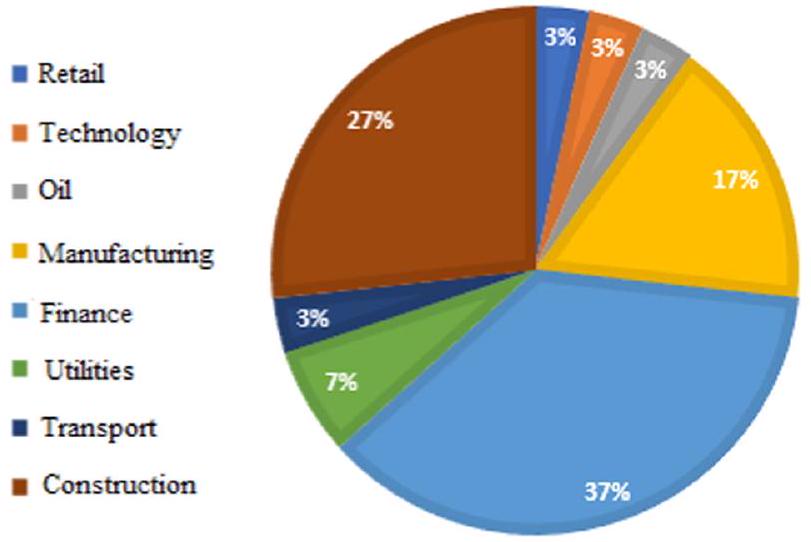
تظهر الشكل 4 قائمة الأسهم في مجموعة VN-30 التي تتركز بشكل رئيسي في مجموعات الصناعة: المالية، البناء والتصنيع. تشير الشكل 4 إلى أن الشركات في هذه المجموعات الصناعية تتمتع برأسمال سوقي مرتفع، وهو السبب في ظهور العديد من الشركات في هذه المجموعات الصناعية في قائمة الأسهم المختارة للدراسة.
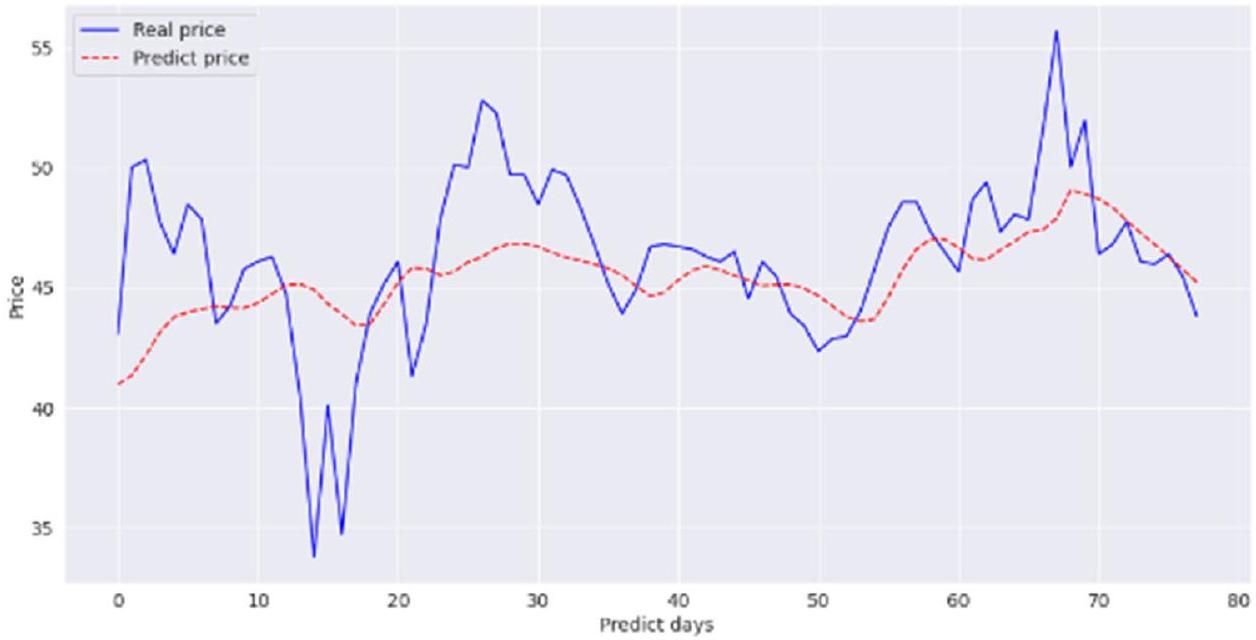
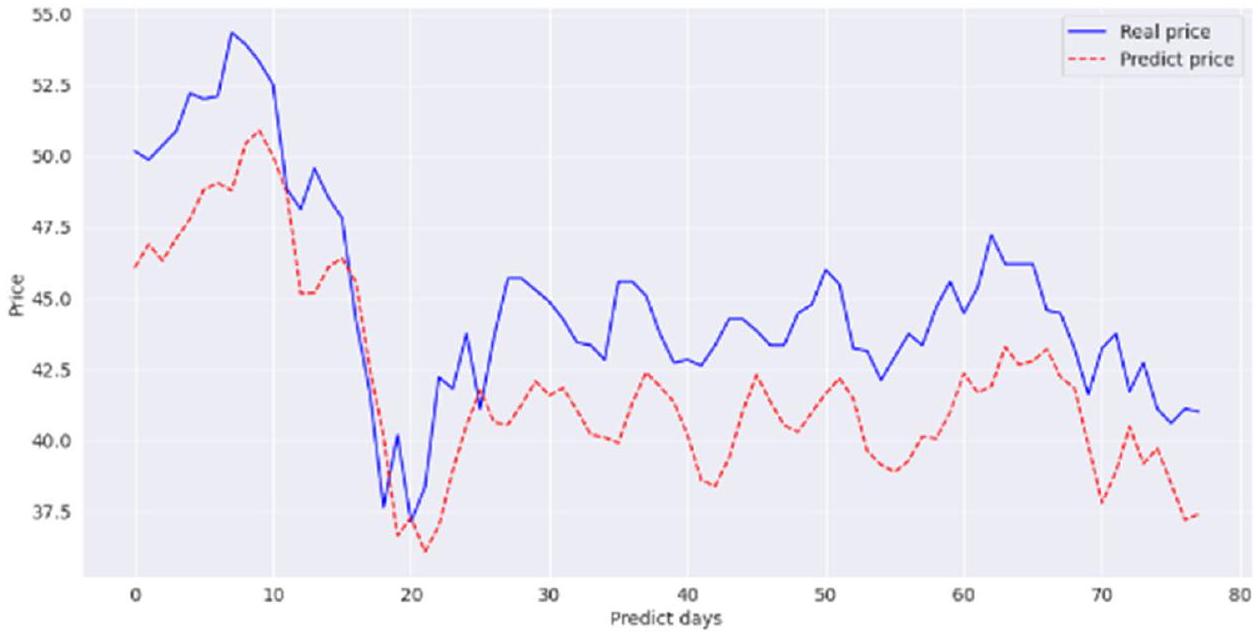
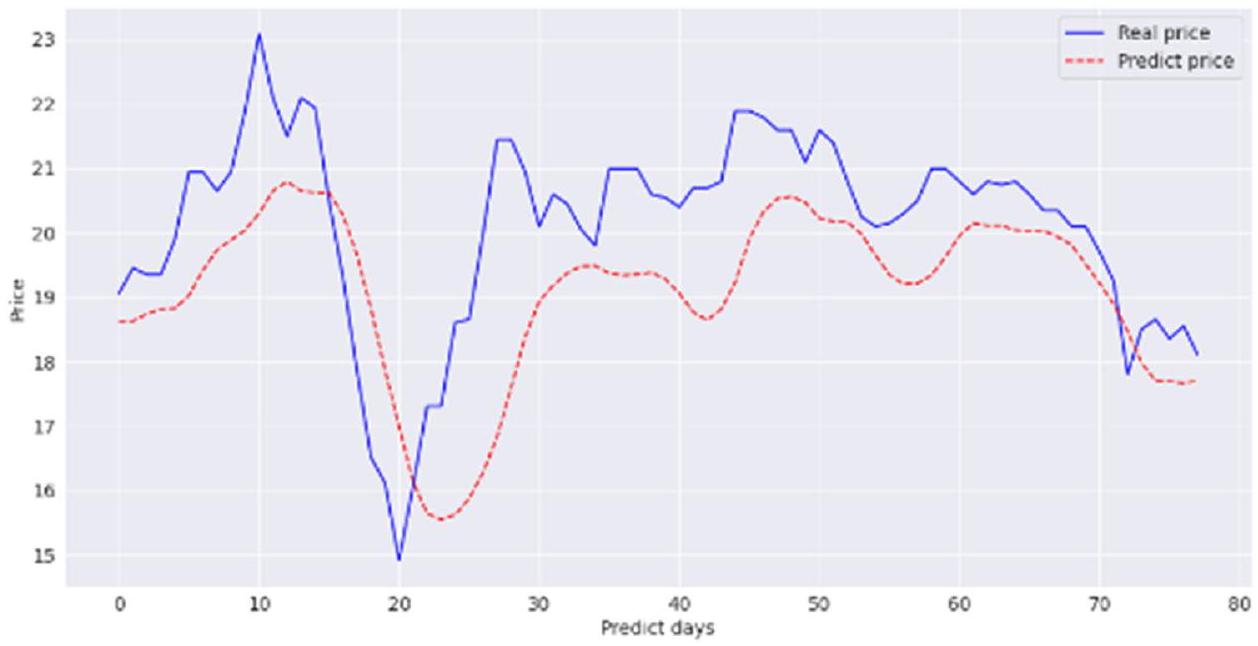
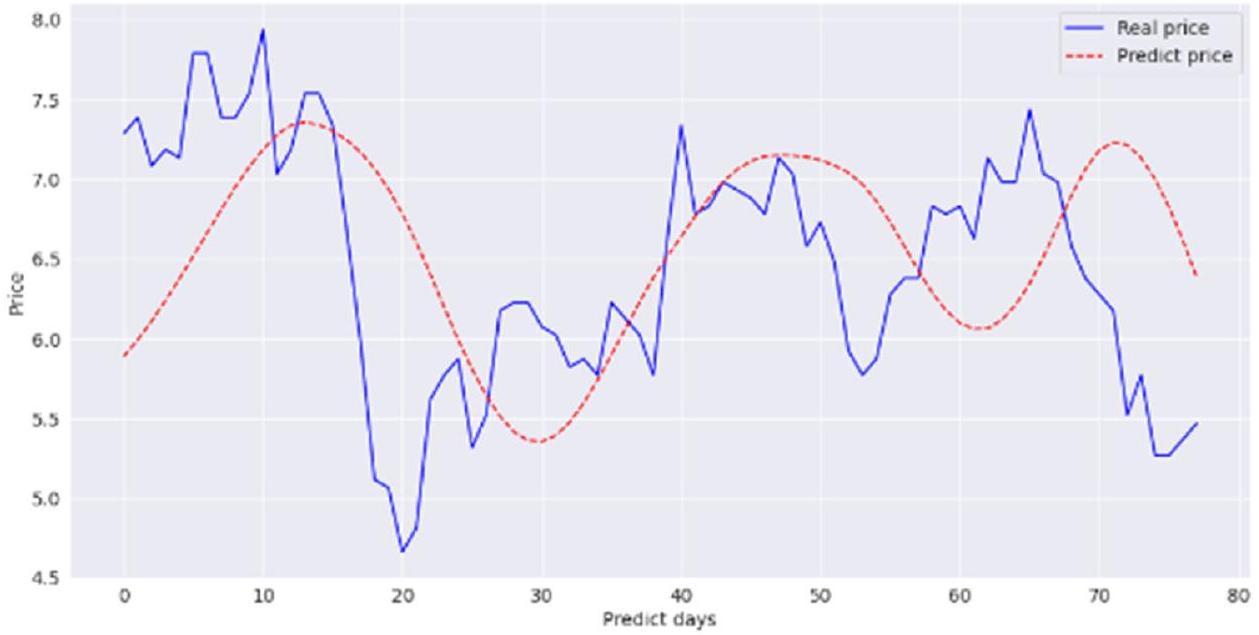
يتنبأ نموذج LSTM بأسعار الأسهم التي تتوافق مع جلسات التداول في مجموعة الاختبار. تتضمن مدة بيانات مجموعة الاختبار ملاحظات من 1 يناير 2021 إلى 1 أبريل 2021. وبالتالي، هناك 78 جلسة تداول تم ملاحظتها في مجموعة الاختبار. بالنسبة لكل رمز سهم مختلف، فإن أداء التنبؤ للنموذج المبني يختلف أيضًا. توضح الشكل 5 نتائج التنبؤ لنموذج LSTM لمؤشر VN على مجموعة البيانات.
يمكن ملاحظة أن توقع السعر من نموذج LSTM يميل إلى أن يكون مشابهًا جدًا لاتجاه تغير السعر الفعلي.
الشكل 4 تصنيف الشركات المدرجة في VN30 حسب الصناعة. المصدر: تحليل المؤلفين.
على بيانات مجموعة الاختبار. بالإضافة إلى ذلك، فإن الفرق بين السعر المتوقع والسعر الفعلي ليس كبيرًا. لاحظ أنه بالنسبة لكل بيانات الأسهم المختلفة، سيكون هناك فرق في دقة توقعات نموذج LSTM، وهناك رسم بياني محدد يقارن بين السعر المتوقع والسعر الفعلي لجميع الأسهم. تم تقديم رموز الأسهم التي تم تنفيذها في الدراسة في الملحق.
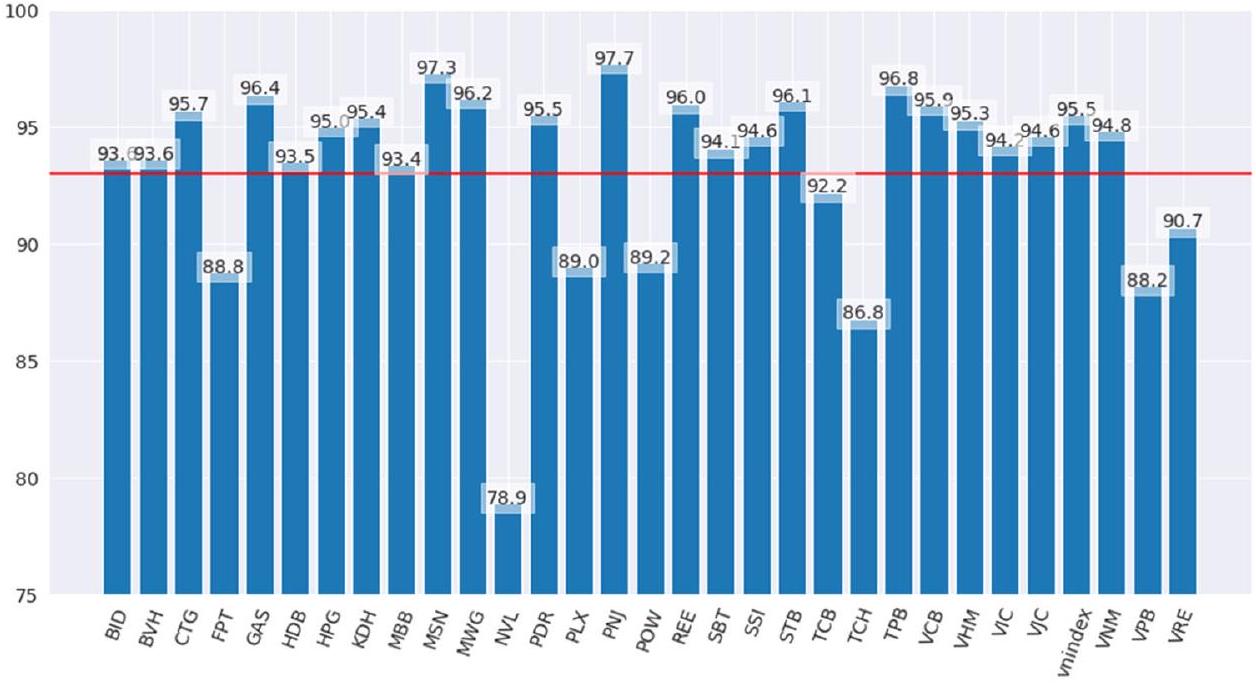
تظهر الشكل 6 مستوى الدقة في توقع سعر السهم على مجموعة الاختبار لنموذج LSTM المرتبط بكل سهم في قائمة البحث. تمثل الخط الأحمر الأفقي الخط الأساسي عند
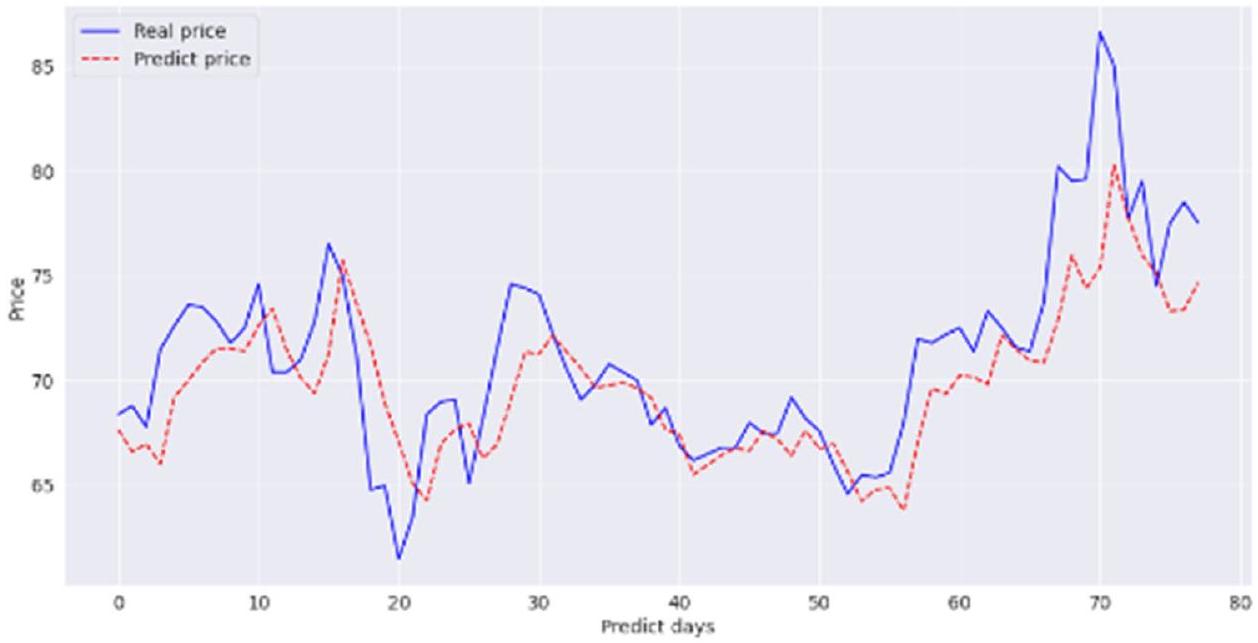
حيث حقق رمز السهم PNJ أعلى دقة في التوقعات عند
تظهر نتائج التنبؤ لنموذج LSTM مع بيانات رمز السهم PNJ تشابهًا كبيرًا بين سعر التنبؤ والسعر الفعلي في مجموعة الاختبار، مع عدم وجود فرق تقريبًا. وهذا يفسر معامل الدقة التنبؤية العالي جدًا لنموذج LSTM لـ PNJ.
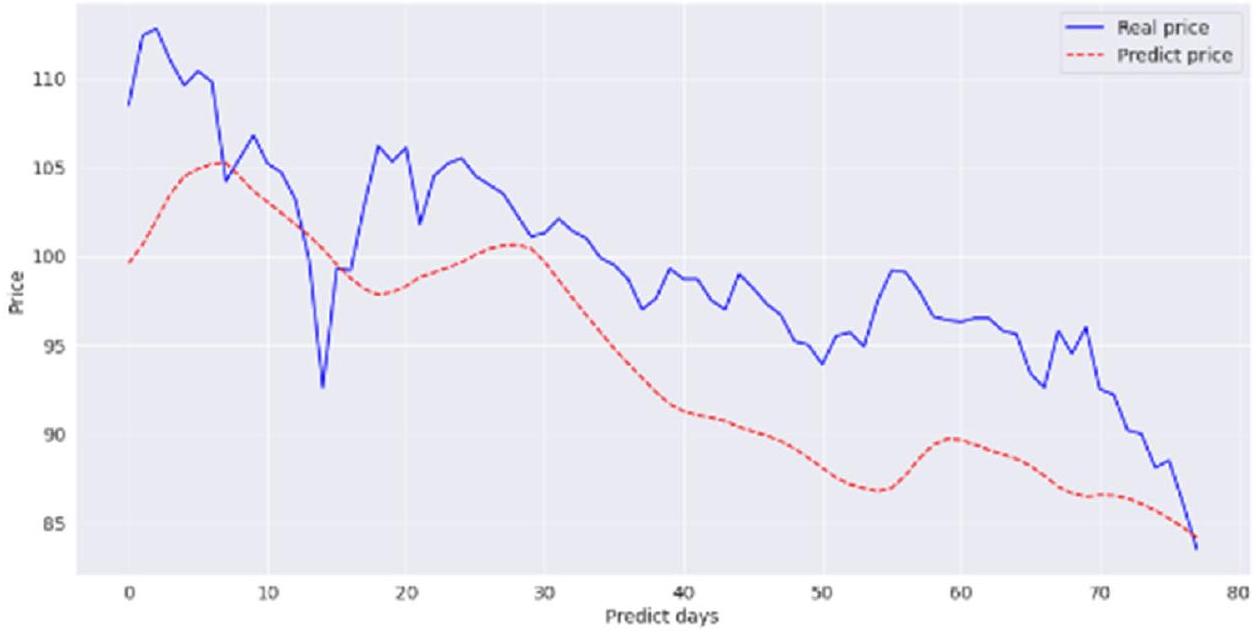
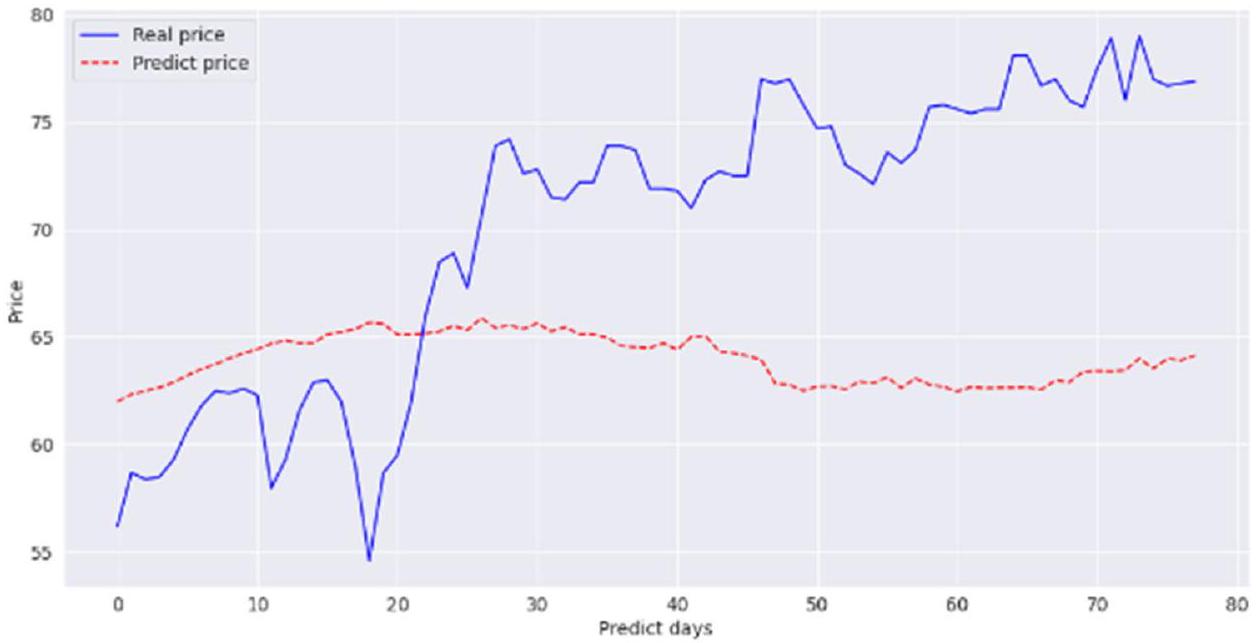
ومع ذلك، فإن نموذج LSTM لا يزال يقدم نتائج توقع بدقة ليست عالية كما
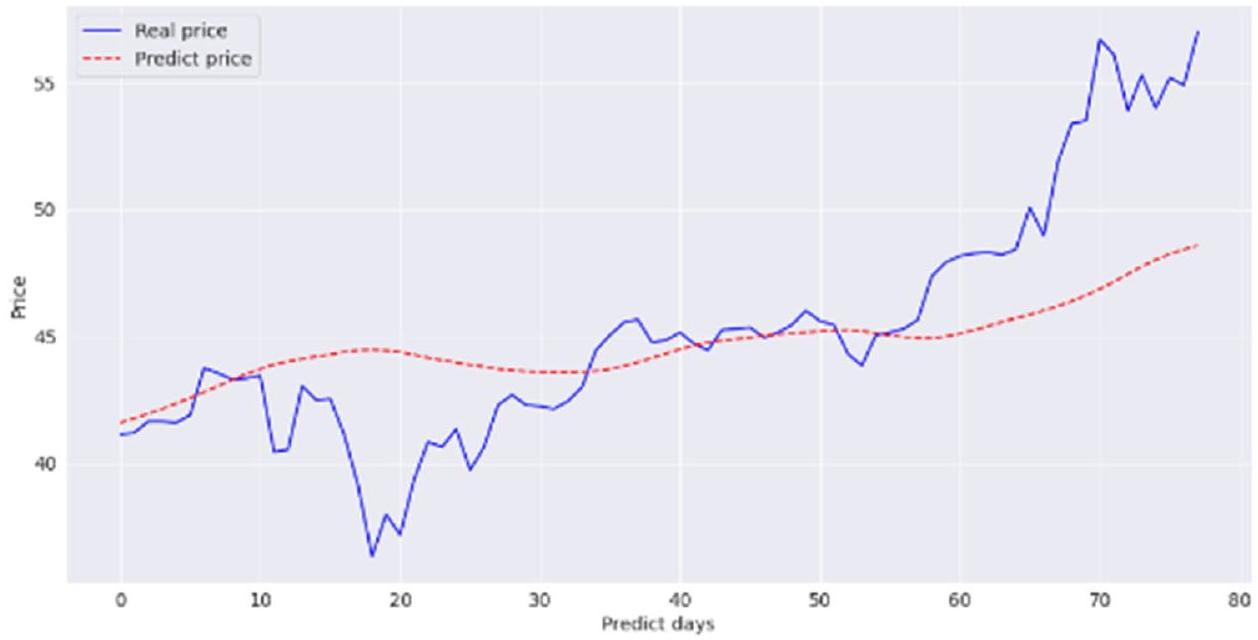
تظهر نتائج التنبؤ لنموذج LSTM لرمز NVL نتائج متجانسة نسبيًا في الفترة الأولى (حوالي أول 20 ملاحظة) من مجموعة الاختبار. ومع ذلك، في المرحلة التالية، هناك فرق كبير بين نتائج التنبؤ والبيانات الفعلية في مجموعة الاختبار. وهذا يؤدي إلى نتيجة أن التنبؤ العام لرمز NVL في مجموعة الاختبار ليس جيدًا. وتظهر نتائج مشابهة لعدد من الرموز الأخرى ذات التنبؤات غير العالية مثل TCH و FPT و PLX و POW و VPB و VRE. الرسم البياني المقارن
الشكل 5 نتائج التوقعات والأسعار الفعلية في مجموعة الاختبار – مؤشر VN. المصدر: تحليل المؤلفين.
الشكل 6 مستوى دقة نموذج LSTM. المصدر: تحليل المؤلفين.
الشكل 7 مقارنة بين السعر المتوقع والسعر الفعلي لسهم PNJ. المصدر: تحليل المؤلفين.
الشكل 8 مقارنة بين السعر المتوقع والسعر الفعلي لسهم NVL. المصدر: تحليل المؤلفين.
الشكل 9 مقارنة بين سعر التوقع وسعر السهم الفعلي BID. المصدر: تحليل المؤلفين.
الشكل 10 مقارنة بين سعر التوقع وسعر السهم الفعلي BVH. المصدر: تحليل المؤلفين.
الشكل 11 مقارنة بين سعر التوقع والسعر الفعلي لسهم CTG. المصدر: تحليل المؤلفين.
الشكل 12 مقارنة بين سعر التوقع وسعر السهم الفعلي FPT. المصدر: تحليل المؤلفين.
الشكل 13 مقارنة بين سعر التوقع وسعر السهم الفعلي لشركة GAS. المصدر: تحليل المؤلفين.
الشكل 14 مقارنة بين سعر التوقع وسعر السهم الفعلي HDB. المصدر: تحليل المؤلفين.
الشكل 15 مقارنة بين سعر التوقع وسعر السهم الفعلي HPG. المصدر: تحليل المؤلفين.
الشكل 16 مقارنة السعر المتوقع والسعر الفعلي لسهم KDH. المصدر: تحليل المؤلفين.
الشكل 17 مقارنة السعر المتوقع والسعر الفعلي لسهم MBB. المصدر: تحليل المؤلفين.
الشكل 18 مقارنة السعر المتوقع والسعر الفعلي لسهم MSN. المصدر: تحليل المؤلفين.
الشكل 19 مقارنة السعر المتوقع والسعر الفعلي لسهم MWG. المصدر: تحليل المؤلفين.
الشكل 20 مقارنة السعر المتوقع والسعر الفعلي لسهم PDR. المصدر: تحليل المؤلفين.
تم تقديم الأسعار المتوقعة والفعلية لهذه الأسهم بالتفصيل في الشكل 31-36.
تظهر الدقة التنبؤية العالية لمعظم بيانات الأسهم المستخدمة ملاءمة نموذج LSTM في تحليل وتوقع تحركات أسعار الأسهم. هذه النتيجة متسقة
مع دراسات سين وتشودري (2016)، سين (2017)، سين وتشودري (2016) ومهتاب وسين (2019). بالإضافة إلى ذلك، تستخدم الدراسة مزيجًا من تاريخ الأسعار ومؤشرات التحليل الفني لبناء نموذج LSTM. هذا يؤكد أيضًا على إمكانيات مؤشرات التحليل الفني في توقع الأسهم.
مع دراسات سين وتشودري (2016)، سين (2017)، سين وتشودري (2016) ومهتاب وسين (2019). بالإضافة إلى ذلك، تستخدم الدراسة مزيجًا من تاريخ الأسعار ومؤشرات التحليل الفني لبناء نموذج LSTM. هذا يؤكد أيضًا على إمكانيات مؤشرات التحليل الفني في توقع الأسهم.
الشكل 21 مقارنة السعر المتوقع والسعر الفعلي لسهم PLX. المصدر: تحليل المؤلفين.
الشكل 22 مقارنة السعر المتوقع والسعر الفعلي لسهم POW. المصدر: تحليل المؤلفين.
الشكل 23 مقارنة السعر المتوقع والسعر الفعلي لسهم REE. المصدر: تحليل المؤلفين.
تحركات الأسعار. في الوقت نفسه، يظهر التوافق والدعم المتبادل عند دمج التحليل الفني ونماذج تحليل البيانات المالية على منصة تعلم الآلة، وبشكل خاص خوارزمية LSTM في هذه الدراسة.
خوارزمية LSTM ومؤشرات التحليل الفني لتوقع اتجاهات الأسعار في سوق الأسهم الفيتنامية، مضيفًا استنتاجات حول أداء التوقع ومستوى تطبيق LSTM. نموذج LSTM لتحليل وتوقع اتجاهات أسعار الأسهم في
الشكل 24 مقارنة السعر المتوقع والسعر الفعلي لسهم SBT. المصدر: تحليل المؤلفين.
الشكل 25 مقارنة السعر المتوقع والسعر الفعلي لسهم SSI. المصدر: تحليل المؤلفين.
الشكل 26 مقارنة السعر المتوقع والسعر الفعلي لسهم STB. المصدر: تحليل المؤلفين.
سوق الأسهم الفيتنامية من حيث التطبيقات الأكاديمية والعملية. يمكن أن تستخدم الدراسات الإضافية الاستنتاجات من هذه الدراسة كمرجع ومقارنة، وتقييم النتائج، وتعزيز قوة الاستنتاجات الأكاديمية. علاوة على ذلك،
تتمتع الأبحاث وتطبيق بيانات سوق الأسهم الحقيقية والمحدثة بملاءمة عملية عالية. يمكن أن تُطبق الاستنتاجات من هذه الدراسة على نطاق واسع من قبل المستثمرين والمؤسسات المالية والجهات التنظيمية الحكومية.
تتمتع الأبحاث وتطبيق بيانات سوق الأسهم الحقيقية والمحدثة بملاءمة عملية عالية. يمكن أن تُطبق الاستنتاجات من هذه الدراسة على نطاق واسع من قبل المستثمرين والمؤسسات المالية والجهات التنظيمية الحكومية.
الشكل 27 مقارنة السعر المتوقع والسعر الفعلي لسهم TCB. المصدر: تحليل المؤلفين.
الشكل 28 مقارنة السعر المتوقع والسعر الفعلي لسهم TCH. المصدر: تحليل المؤلفين.
الشكل 29 مقارنة السعر المتوقع والسعر الفعلي لسهم TPB. المصدر: تحليل المؤلفين.
الاستنتاجات
بحث يهدف إلى تقييم تطبيق خوارزمية LSTM ومؤشرات التحليل الفني لتوقع اتجاهات الأسعار في سوق الأسهم الفيتنامية، باستخدام بيانات أسعار تاريخية
لمؤشر VN-Index وأسهم مجموعة VN-30، بالاشتراك مع مؤشرات التحليل الفني لبناء نموذج ذاكرة طويلة وقصيرة الأجل. تظهر نتائج التوقعات لنموذج LSTM مستوى تنبؤ جيد لمعظم بيانات الأسهم المدروسة. مع
لمؤشر VN-Index وأسهم مجموعة VN-30، بالاشتراك مع مؤشرات التحليل الفني لبناء نموذج ذاكرة طويلة وقصيرة الأجل. تظهر نتائج التوقعات لنموذج LSTM مستوى تنبؤ جيد لمعظم بيانات الأسهم المدروسة. مع
الشكل 30 مقارنة السعر المتوقع والسعر الفعلي لسهم VIC. المصدر: تحليل المؤلفين.
الشكل 31 مقارنة السعر المتوقع والسعر الفعلي لسهم VJC. المصدر: تحليل المؤلفين.
الشكل 32 مقارنة السعر المتوقع والسعر الفعلي لسهم VNM. المصدر: تحليل المؤلفين.
الشكل 33 مقارنة السعر المتوقع والسعر الفعلي لسهم VPB. المصدر: تحليل المؤلفين.
الشكل 34 مقارنة السعر المتوقع والسعر الفعلي لسهم VRE. المصدر: تحليل المؤلفين.
الشكل 35 مقارنة السعر المتوقع والسعر الفعلي لسهم VCB. المصدر: تحليل المؤلفين.
الشكل 36 مقارنة السعر المتوقع والسعر الفعلي لسهم VHM. المصدر: تحليل المؤلفين.
بفضل خصائص الهيكل والطريقة التحليلية، يتم تقييم نموذج LSTM وملاءمته العالية لبيانات السلاسل الزمنية مثل تاريخ أسعار الأسهم. لذلك، يعتبر تطبيق خوارزمية LSTM لتحليل وتوقع أسعار الأسهم مناسبًا، كما أن نتائج هذه الدراسة تتماشى مع الاستنتاجات المذكورة أعلاه. ومع ذلك، فإن خوارزميات تعلم الآلة التي تم تطويرها بقوة في الآونة الأخيرة لها العديد من التطبيقات في المجال المالي، وبشكل خاص بعض الخوارزميات الشائعة المستخدمة في المجال المالي مثل الغابة العشوائية، وآلة الدعم الناقل. هذه الخوارزميات أيضًا لديها إمكانيات كبيرة للتطبيق على موضوع تحليل وتوقع أسعار الأسهم. قد تأخذ الدراسات الإضافية حول هذا الموضوع في الاعتبار استخدام خوارزميات تعلم آلة أخرى في التحليل والبحث.
اتجاه شائع في تطبيق خوارزميات تعلم الآلة على المشكلات الاقتصادية (أو بشكل أكثر تحديدًا المالية) هو دمج العديد من خوارزميات تعلم الآلة المختلفة لإنشاء نموذج بدرجة تعقيد أعلى ولكن أداء محتمل أعلى. يمكن أن يكمل دمج خوارزميات تعلم الآلة المختلفة ويعزز الأداء التنبؤي للنموذج. هذه الدراسة تطبق فقط خوارزمية تعلم آلة واحدة (وهي خوارزمية LSTM). ومع ذلك، يمكن أن تأخذ الاتجاهات البحثية الممتدة لهذا الموضوع في الاعتبار دمج العديد من خوارزميات تعلم الآلة لتحسين الأداء التنبؤي للنموذج.
بالإضافة إلى ذلك، البيانات المستخدمة في الدراسة تضمنت فقط أنواع البيانات الهيكلية والحسابية. مع الاتجاه نحو تطبيق طرق تحليل البيانات في اتجاه تعلم الآلة، فإن البيانات غير الهيكلية مثل البيانات في شكل نصوص، صوت، صور، إلخ، تظهر جدوى التطبيقات التحليلية في فيتنام. هذه أيضًا مصدر محتمل للبيانات لتحليل مالي متعمق لم يتم استخدامه حتى الآن. يمكن أن تأخذ الاتجاهات البحثية الواسعة حول موضوع تقييم أسعار الأسهم وتوقعها من خلال تطبيق خوارزميات تعلم الآلة في الاعتبار استخدام أنواع البيانات غير الهيكلية لاستكشاف هذه المنطقة المحتملة من البيانات. ومع ذلك، بسبب تأثير القيود الموضوعية، لا تزال هذه الدراسة تعاني من بعض القيود. البيانات المستخدمة في الدراسة محدودة بسوق الأسهم في مدينة هو تشي منه (VN-Index). لذلك، لا تزال هناك بعض القيود التي تجعل التوقع صعبًا، خاصة في حالة التقلبات الشديدة في أسعار الأسهم. السبب يعود في الأصل إلى القضايا الداخلية في سوق الأسهم. بشكل محدد، لا تزال الأسهم صغيرة، لذا فإن أسعار الأسهم لا تتبع حقًا العلاقة بين العرض والطلب. مؤخرًا، واجهت فيتنام أيضًا بعض المشكلات المتعلقة بالتلاعب في السوق والمخاطر القانونية في سوق الأسهم. قد توسع الدراسات الإضافية
قاعدة البيانات، باستخدام بيانات من بورصات أخرى في فيتنام لتعزيز يقين تقييم أداء النموذج وتوقعه.
قاعدة البيانات، باستخدام بيانات من بورصات أخرى في فيتنام لتعزيز يقين تقييم أداء النموذج وتوقعه.
توفر البيانات
المجموعات البيانية المستخدمة و/أو التي تم تحليلها متاحة من المؤلف عند الطلب المعقول. جميع البيانات متاحة على https:// zenodo.org/uploads/10418013.
تاريخ الاستلام: 15 يونيو 2023؛ تاريخ القبول: 9 فبراير 2024؛
نُشر على الإنترنت: 12 مارس 2024
نُشر على الإنترنت: 12 مارس 2024
References
Agrawal M, Khan AU, Shukla PK (2019) Stock price prediction using technical indicators: A predictive model using optimal deep learning. Int J Recent Technol Eng 8(2):2297-2305
Appel, G (2005) Technical analysis: power tools for active investors: FT Press
Biondo AE, Pluchino A, Rapisarda A, Helbing D (2013) Are random trading strategies more successful than technical ones? PloS one 8(7):e68344
Borovkova S, Tsiamas I (2019) An ensemble of LSTM neural networks for highfrequency stock market classification. J Forecast 38(6):600-619
Brock W, Lakonishok J, LeBaron B (1992) Simple technical trading rules and the stochastic properties of stock returns. J Financ 47(5):1731-1764
Brown SJ, Goetzmann WN, Kumar A (1998) The Dow theory: William Peter Hamilton’s track record reconsidered. J Financ 53(4):1311-1333
Burton, N (2018.) An Analysis of Burton G. Malkiel’s A Random Walk Down Wall Street, 1st edition, ISBN 9781912128822, routledge. Available at https://www. routledge.com/An-Analysis-of-Burton-G-Malkiels-A-Random-Walk-Down-Wall-Street/Burton/p/book/9781912128822, accessed on 30th Oct, 2023
Chan, MC, Wong, CC, & Lam, CC (2000) Financial time series forecasting by neural network using conjugate gradient learning algorithm and multiple linear regression weight initialization. Available at https://citeseerx.ist.psu. edu/document?repid=rep1&type=pdf&doi=5853eb9035a62449c39f2137 68a60603352bcf05, accessed on 30th Oct, 2023
Chen, K, Zhou, Y, & Dai, F (2015) A LSTM-based method for stock returns prediction: A case study of China stock market. 2015 IEEE International Conference on Big Data (Big Data), 2823-2824. https://doi.org/10.1109/ BigData.2015.7364089
Di Persio L, Honchar O (2016) Artificial neural networks approach to the forecast of stock market price movements. Int J Econ Manag Syst 1:158-162
Ding, X, Zhang, Y, Liu, T, & Duan, J (2015) Deep learning for event-driven stock prediction. Proceedings of the Twenty-Fourth International Joint Conference on Artificial Intelligence (IJCAI 2015), 2327-2333. Available at https://www. ijcai.org/Proceedings/15/Papers/329.pdf, accessed on 30th Oct, 2023
Elman JL (1990) Finding structures in time. Cogn Sci 14(2):179-211
El-Nagar AM, Zaki AM, Soliman FAS, El-Bardini M (2022) Hybrid deep learning diagonal recurrent neural network controller for nonlinear systems. Neural
Comput Appl 34(24):22367-22386. https://doi.org/10.1007/s00521-022-07673-9
Fama EF (1970) Efficient Capital Markets: A Review of Theory and Empirical Work. J Financ 25(2):383-417. https://doi.org/10.2307/2325486
Fifield SG, Power DM, Donald Sinclair C (2005) An analysis of trading strategies in eleven European stock markets. Eur J Financ 11(6):531-548
Fromlet, H (2001) Behavioral finance-theory and practical application: Systematic analysis of departures from the homo oeconomicus paradigm are essential for realistic financial research and analysis. Business Economics, 63-69
Graves A, Liwicki M, Fernández S, Bertolami R, Bunke H, Schmidhuber J (2008) A novel connectionist system for unconstrained handwriting recognition. IEEE Trans pattern Anal Mach Intell 31(5):855-868
Graves, A (2012) Supervised sequence labeling. In Supervised sequence labeling with recurrent neural networks (pp. 5-13): Springer
Greff K, Srivastava RK, Koutník J, Steunebrink BR, Schmidhuber J (2016) LSTM: A search space odyssey. IEEE Trans neural Netw Learn Syst 28(10):2222-2232
Gülmez B (2023) Stock price prediction with optimized deep LSTM network with artificial rabbits optimization algorithm. Expert Syst Appl 227:120346. https://doi.org/10.1016/j.eswa.2023.120346
Heaton JB, Polson N, Witte J (2016) Deep Learning for Finance: Deep Portfolios. Appl Stoch Models Bus Ind 33(1):3-12
Hegazy O, Soliman OS, Salam MA (2014) A machine learning model for stock market prediction. Int J Comput Sci Telecommun 4(12):17-23
Hoang, M (2023) Vietnam’s stock market capitalization is equivalent to
Hochreiter S, Schmidhuber J (1997) Long Short-Term Memory. Neural Comput 9:1735-1780. https://doi.org/10.1162/neco.1997.9.8.1735
Jia, H (2016) Investigation into the effectiveness of long short term memory networks for stock price prediction. Retrieved from https://ui.adsabs.harvard. edu/abs/2016arXiv160307893J/abstract, accessed on
Kirkpatrick CD, Dahlquist JR (2010) Technical Analysis: The Complete Resource for Financial Market Technicians. 2 Edn, FT Press, 2010
Lai, CY, Chen, RC, & Caraka, RE (2019) Prediction Stock Price Based on Different Index Factors Using LSTM. 2019 International Conference on Machine Learning and Cybernetics (ICMLC), 1-6
Le TTH, Nguyen VC, Phan THN (2022) Foreign Direct Investment, Environmental Pollution and Economic Growth-An Insight from Non-Linear ARDL Co-Integration Approach. Sustainability 14(13):8146. https://doi.org/ 10.3390/su14138146. Retrieved from
Liu S, Graham SL, Schulz A, Kalloniatis M, Zangerl B, Cai W, Gao Y, Chua B, Arvind H, Grigg J, Chu D, Klistorner A, You Y (2018) A Deep LearningBased Algorithm Identifies Glaucomatous Discs Using Monoscopic Fundus Photographs. Ophthalmol Glaucoma 1(1):15-22
Lo, AW, & MacKinlay, AC (1999) A Non-Random Walk Down Wall Street. Princeton University Press. http://www.jstor.org/stable/j.ctt7tccx
Mehtab S, Sen J (2020) Stock Price Prediction Using Convolutional Neural Networks on a Multivariate Time Series. Proceedings of the 3rd National Conference on Machine Learning and Artificial Intelligence. New Delhi, INDIA, https://ssrn.com/abstract=3665363
Mehtab, S, Sen, J (2019) A Robust Predictive Model for Stock Price Prediction Using Deep Learning and Natural Language Processing. Available at SSRN: https://ssrn.com/abstract=3502624
Nelson, DM, Pereira, AC, & de Oliveira, RA (2017) Stock market’s price movement prediction with LSTM neural networks. Paper presented at the 2017 International joint conference on neural networks (IJCNN)
Pahwa N, Khalfay N, Soni V, Vora D (2017) Stock prediction using machine learning a review paper. Int J Computer Appl 163(5):36-43
Roman J, Jameel A (1996) Backpropagation and recurrent neural networks in financial analysis of multiple stock market returns. Proc HICSS-29: 29th Hawaii Int Conf Syst Sci 2:454-460 vol.2. https://doi.org/10.1109/HICSS. 1996.495431
Saad E, Prokhorov E, Wunsch D (1998) Comparative Study of Stock Trend Prediction Using Time Delay, Recurrent and Probabilistic Neural Networks. IEEE Trans Neural Netw 9:1456-1470. https://doi.org/10.1109/72.728395
Sen J (2017) A Robust Analysis and Forecasting Framework for the Indian Mid Cap Sector Using Times Series Decomposition Approach. J Insurance Financ Manag 3(4):1-32
Sen J, Datta Chaudhuri D (2018) Understanding the sectors of Indian economy for portfolio choice. Int J Bus Forecast Market Intel 4(2):178-222.https://doi.org/ 10.1504/IJBFMI.2018.090914
Sen J, Datta Chaudhuri D (2018) Understanding the sectors of Indian economy for portfolio choice. Int J Bus Forecast Market Intel 4(2):178-222.https://doi.org/ 10.1504/IJBFMI.2018.090914
Sen J, Chaudhuri TD (2016) An alternative framework for time series decomposition and forecasting and its relevance for portfolio choice: a comparative study of the Indian consumer durable and small cap sectors. J Econ Libr 3(2):303-326
Trinh HH, Nguyen CP, Hao W, Wongchoti U (2021) Does stock liquidity affect bankruptcy risk? DID analysis from Vietnam. Pac-Basin Financ J 69:101634. https://doi.org/10.1016/j.pacfin.2021.101634
Usmani S, Shamsi JA (2023) LSTM based stock prediction using weighted and categorized financial news. PLoS ONE 18(3):e0282234
White (1988) Economic prediction using neural networks: the case of IBM daily stock returns. IEEE 1988 Int Conf Neural Netw 2:451-458. https://doi.org/10. 1109/ICNN.1988.23959
Zhuge Q, Xu L, Zhang G (2017) LSTM Neural Network with Emotional Analysis for prediction of stock price. Eng Lett 25(2):25-32
مساهمات المؤلفين
التصور: TP، PTKA، PHT، NCV؛ المنهجية: TP، PTK.A، PHT، NCV؛ تحليل الشكل والتحقيق: TP، PTK.A، PHT، NCV؛ الكتابة – المراجعة والتحرير: TP، P.T.K.A، PHT، NCV؛ الموارد: TP؛ الإشراف: NCV.
المصالح المتنافسة
يعلن المؤلفون عدم وجود مصالح متنافسة
الموافقة الأخلاقية
لا تتطلب موافقة أخلاقية من جامعاتنا. لذلك، لم يتم تقديم الموافقة الأخلاقية.
الموافقة المستنيرة
لا تحتوي هذه المقالة على أي دراسات مع مشاركين بشريين أجراها أي من المؤلفين.
معلومات إضافية
يجب توجيه المراسلات والطلبات للحصول على المواد إلى تشين ف. نغوين.
معلومات إعادة الطبع والإذن متاحة علىhttp://www.nature.com/reprints
ملاحظة الناشر تظل Springer Nature محايدة فيما يتعلق بالمطالبات القضائية في الخرائط المنشورة والانتماءات المؤسسية.
معلومات إعادة الطبع والإذن متاحة علىhttp://www.nature.com/reprints
ملاحظة الناشر تظل Springer Nature محايدة فيما يتعلق بالمطالبات القضائية في الخرائط المنشورة والانتماءات المؤسسية.
الوصول المفتوح. هذه المقالة مرخصة بموجب رخصة المشاع الإبداعي النسب 4.0 الدولية، التي تسمح بالاستخدام والمشاركة والتكيف والتوزيع وإعادة الإنتاج بأي وسيلة أو صيغة، طالما أنك تعطي الائتمان المناسب للمؤلفين الأصليين والمصدر، وتوفر رابطًا لرخصة المشاع الإبداعي، وتوضح ما إذا كانت هناك تغييرات قد أُجريت. الصور أو المواد الأخرى من طرف ثالث في هذه المقالة مشمولة في رخصة المشاع الإبداعي الخاصة بالمقالة، ما لم يُشار إلى خلاف ذلك في سطر الائتمان للمواد. إذا لم تكن المادة مشمولة في رخصة المشاع الإبداعي الخاصة بالمقالة وكان استخدامك المقصود غير مسموح به بموجب اللوائح القانونية أو يتجاوز الاستخدام المسموح به، ستحتاج إلى الحصول على إذن مباشرة من صاحب حقوق الطبع والنشر. لعرض نسخة من هذه الرخصة، قم بزيارة http://creativecommons.org/licenses/by/4.0/.
© المؤلف(ون) 2024
© المؤلف(ون) 2024
مدينة هو تشي منه، جامعة صناعة المواد الغذائية، 140 لي ترونغ تان، منطقة تان فوه، هو تشي منه، فيتنام. كلية المالية والمحاسبة، جامعة هو تشي منه للصناعة والتجارة، مدينة هو تشي منه، فيتنام. جامعة الاقتصاد والقانون، مدينة هو تشي منه، فيتنام. الجامعة الوطنية في فيتنام، مدينة هو تشي منه، فيتنام. معهد الدراسات العليا، جامعة ثو داو موت، مدينة ثو داو موت، محافظة بينه دونغ، فيتنام.
chiennv@tdmu.edu.vn
Journal: Humanities and Social Sciences Communications, Volume: 11, Issue: 1
DOI: https://doi.org/10.1057/s41599-024-02807-x
Publication Date: 2024-03-12
DOI: https://doi.org/10.1057/s41599-024-02807-x
Publication Date: 2024-03-12
ARTICLE
Applying machine learning algorithms to predict the stock price trend in the stock market – The case of Vietnam
The aims of this study are to predict the stock price trend in the stock market in an emerging economy. Using the Long Short Term Memory (LSTM) algorithm, and the corresponding technical analysis indicators for each stock code include: simple moving average (SMA), convergence divergence moving average (MACD), and relative strength index (RSI); and the secondary data from VN-Index and VN-30 stocks, the research results showed that the forecasting model has a high accuracy of
Introduction
Predicting the future direction of stock prices has been an interest sector of researchers and investors. The factors and sources of information to be considered are varied and wide. This makes it very difficult to predict future stock market price behavior. It is evident that stock prices cannot be accurately predicted. There is quite a bit of research that seeks to address that challenge, offering a variety of approaches to achieving the goal (Appel, 2005; Brown et al., 1998; El-Nagar et al., 2022; and Fromlet, 2001).
Follow experimental research this approach, there were studied of Sen and Chaudhuri (2016) and Sen (2017) using time series decomposition to forecast stock prices and gives results with a potential accuracy. In addition, forecasting stock prices in the short term by applying machine learning and deep learning algorithms also show very high results (Sen and Chaudhuri, 2016; Sen & Datta Chaudhuri, 2018). Besides, Mehtab and Sen (2019) confirmed the strong and reliable stock price prediction ability of machine learning models, both regression and classification. Together with data from analyzing user’s emotions on social networks, using self-organizing fuzzy neural network (SOFNN) algorithm, the authors demonstrated a high degree of accuracy in predictive values of NIFTY index. In addition, the authors used an compound neural network (CNN) algorithm in forecasting for time series data, and achieved high-accuracy prediction results (Mehtab and Sen, 2020).
With recent research trends, a popular approach is to apply machine learning algorithms to learn from historical price data, thereby being able to predict future prices. The scale demonstrates predictive power on historical stock price data that outperforms other methods due to its suitability for this data type. Regressive neural networks have short-term memory and the hypothesis to be explored here is that this feature can be beneficial in terms of results when compared with more traditional methods (Nelson et al. 2017).
In particular, the LSTM algorithm (Long Short- Term Memory) confirms the stability and efficiency in short-term stock price forecasting. This is a regressive neural algorithm with suitable properties thanks to its ability to distinguish and synthesize the effects of short-term and long-term factors, by giving different weights to each parameter while skipping the memory it considers irrelevant to predict the next output. That way, the LSTM algorithm is capable of handling longer input sequences when compared to other repeating neural networks that can only memorize short sequences (Pahwa et al. 2017). LSTM is one of the most successful RNNs algorithms. LSTM introduces the memory cell, a unit of computation that replaces traditional artificial neurons in the hidden layer of the network. In addition, networks can efficiently link memories and input just-in-time, thus making it suitable for capturing time-flexible data structures with high predictability (Chen et al. 2015).
With the nature of short-term predictive analysis based on time series data, the combination of machine learning and technical analysis in forecasting stock prices in the short term is widely applied. Further, a few studies suggest stock price technical analysis patterns where the goal is to detect stock volatility patterns that lead to returns for investors. For this purpose, different stock price and technical analysis indicators have been proposed, such as Bollinger Band, moving average convergence divergence (MACD), relative strength index (RSI)), moving average (MA), stochastic momentum (MS), meta sine wave (MSW). In addition to these indicators, some well-known patterns in stock price movements, such as head and shoulders, triangle, flag, Fibonacci fan, Andrew’s pitchfork, etc., are also considered as one of the important indicators for investing in the stock market (Nelson et al. 2017; Borovkova and Tsiamas, 2019). These approaches
provide more effectiveness for potential investors in making investment decisions.
provide more effectiveness for potential investors in making investment decisions.
Another possibility, a time-series can be studied by many techniques, possibly using the DID (difference in difference) method as discussed in the study of Trinh et al. (2021), or you can use other methods such as the non-linear autoregressive distributed lag of Le et al. (2022). However, LSTM model is more appropriate in short-term stock price forecasting in the field of machine learning. In addition, this method has not been widely used in the Vietnamese market. Furthermore, Vietnam’s stock market was established in 2000, but it has developed rapidly and has a market capitalization of
The remainder of the study can be divided as follows: Section “Theoretical basis” discusses the theoretical basis, while Section “Data collection and research Methodology” is for Data collection and research Methodology. In addition, Section “Research results and discussions” discusses the research results and discussions. Finally, Section “Conclusions” depicts the conclusions.
Theoretical basis
Foundation theory. When discussing the stock market, with its inherent and complexity, the predictability of stock returns has always been a subject of debate that attracts much research. Fama (1970) postulates the efficient market hypothesis that determines that the current price of an asset always reflects all prior information available to it immediately. In addition, the random walk hypothesis states that a stock’s price changes independently of its history, in other words, tomorrow’s price will depend only on tomorrow’s information regardless of today’s price (Burton, 2018). These two hypotheses establish that there is no means of accurately predicting stock prices.
On the other hand, there are other authors who argue that, in fact, stock prices can be predicted at least to some extent. And a variety of methods for predicting and modeling stock behavior have been the subject of research in many different disciplines, such as economics, statistics, physics, and computer science (Lo and MacKinlay, 1999).
Technical analysis indicator. A popular method for modeling and predicting the stock market is technical analysis, which is a method based on historical data from the market, primarily price and volume. Quantity. Technical analysis follows several assumptions: (1) prices are determined exclusively by supply and demand relationships; (2) prices change with the trend; (3) changes in supply and demand cause the trend to reverse; (4) changes in supply and demand can be identified on the chart; And (5) the patterns on the chart tend to repeat. In other words, technical analysis does not take into account any external factors such as political, social or macroeconomic (Kirkpatrick & Dahlquist, 2010). Research by Biondo et al. (2013) shows that short-term trading strategies based on technical analysis
Fig. 1 Structure of a recurrent neural network (RNN). Source: Lai et al. (2019).
indicators can work better than some traditional methods, such as the moving average convergence divergence (MACD) and the relative strength index (RSI).
Technical analysis is a well method of forecasting future market trends by generating buy or sell signals based on specific information obtained from those prices. The popularity and continued application of technical analysis has become widely recognized with techniques for uncovering any hidden pattern ranging from the very rudimentary analysis of the moving averages to the recognition of rather complex time series patterns. Brock et al. (1992) show that simple trading rules based on the movement of short-term and long-term moving average returns have significant predictive power with daily data for more than a century on the Dow Jones Industrial Average. Fifield et al. (2005) went on to investigate the predictive power of the ‘filter’ rule and the ‘moving average oscillator’ rule in 11 European stock markets, including covering the period from January 1991 to December 2000. Their key findings indicate that four emerging markets: Greece, Hungary, Portugal and Turkey, are information inefficient, compared with seven more advanced other markets. Past empirical results support technical analysis (Fifield et al. 2005); however, such evidence can be criticized because of data bias (Brock et al. 1992).
Long short term memory LSTM algorithm. Elman (1990) proposed a Recurrent Neural Network (RNN). Basically, RNN solves the problem of processing sequence data, such as text, voice, and video. There is a sequential relationship between samples of this data type and each sample is associated with its previous sample. For example, in text, a word is related to the word that precedes it. In meteorological data, the temperature of one day is combined with the temperature of the previous few days. A set of observations is defined as a sequence from which multiple sequences can be observed. This feature of the RNN algorithm is very suitable for the properties of time series data in stock analysis as the Fig. 1:
Figure 1 shows the structure of an RNN, in which the output of the hidden layer is stored in memory. Memory can be thought of as another input. The main reason for the difficulty of RNN training is the passing of the hidden layer parameter
Fig. 2 Structure of an LSTM unit. Source: Ding et al. (2015).
this problem exists in any deep neural network, but it is especially evident due to the recursive structure of the RNN. Further, RNNs differ from traditional relay networks in that they not only have neural connections in one direction, in other words, neurons can transmit data to a previous layer or same class. Not storing information in a single direction, this is a practical feature of the existence of short-term memory, in addition to the long-term memory that neural networks have acquired through training.
The Long Short Term Memory (LSTM) algorithm introduced by the research of Hochreiter and Schmidhuber (1997) aims to provide better performance by solving the Gradient Vanishing problem that repeated networks will suffer when dealing with long strings of data. In LSTM, each neuron is a “memory cell” that connects previous information to the current task. An LSTM network is a special type of RNN. The LSTM can capture the error, so that it can be moved back through the layers over time. LSTM keeps the error at a certain maximum constant, so the LSTM network can take a long time to train, and opens the door to setting the correction of parameters in the algorithm (Liu et al. 2018). The LSTM is a special network topology with three “gateway” structures (shown in Fig. 2). Three ports are placed in an LSTM unit, which are called input, forget, and output ports. While the information enters the network of the LSTM, it can be selected according to the rules. Only information that matches the algorithm will be forwarded, and information that does not match will be forgotten through the forget gate.
This gate-based architecture allows information to be selectively forwarded to the next unit based on the principle of the activation function of the LSTM network. LSTM networks are widely used and achieved some positive results when compared with other methods (Graves, 2012), especially in terms of Natural Language Processing, and especially for handwriting recognition (Graves et al. 2008). The LSTM algorithm has branched out into a number of variations, but when compared to the original they do not seem to have made any significant improvements to date (Greff et al. 2016).
Experimental study. Data on the stock market is very large and non-linear in nature. To model this type of data, it is necessary to use models that can analyze the patterns on the chart. Deep learning algorithms are capable of identifying and exploiting information hidden within data through the process of selflearning. Unlike other algorithms, deep learning models can model this type of data efficiently (Agrawal et al. 2019).
The research studies analyzing financial time series data using neural network models using many different types of input variables to predict stock returns. In some studies, the input data used to build the model includes only a single time series (Jia,
2016). Some other studies include both indicators showing market information and macroeconomic variables (White, 1988). In addition, there are many different variations in the application of neural network models to time series data analysis: Ding et al. (2015) combine financial time series analysis and processing natural language data, Roman and Jameel (1996) and Heaton et al. (2016) use deep learning architecture to model multivariable financial time series. The study of Chan et al. (2000) introduces a neural network model using technical analysis variables that has been performed to predict the Shanghai stock market, compared the performance of two algorithms and two different weight initialization methods. The results show that the efficiency of back-propagation can be increased by learning the conjugate gradient with multiple linear regression weight initializations.
2016). Some other studies include both indicators showing market information and macroeconomic variables (White, 1988). In addition, there are many different variations in the application of neural network models to time series data analysis: Ding et al. (2015) combine financial time series analysis and processing natural language data, Roman and Jameel (1996) and Heaton et al. (2016) use deep learning architecture to model multivariable financial time series. The study of Chan et al. (2000) introduces a neural network model using technical analysis variables that has been performed to predict the Shanghai stock market, compared the performance of two algorithms and two different weight initialization methods. The results show that the efficiency of back-propagation can be increased by learning the conjugate gradient with multiple linear regression weight initializations.
With the suitable and high-performance nature of the regression neural network (RNN) model, a lot of research has been done on the application of RNN in the field of stock analysis and forecasting. Roman and Jameel (1996) used back-to-back models and RNNs to predict stock indexes for five different stock markets. Saad, Prokhorov, and Wunsch (1998) apply delay time, recurrence, and probability neural network models to predict stock data by day. Hegazy et al. (2014) applied machine learning algorithms such as PSO and LS-SVM to forecast the S&P 500 stock market. With the advent of LSTM, data analysis became dependent on time becomes more efficient. The LSTM algorithm has the ability to store historical information and is widely used in stock price prediction (Heaton et al. 2016).
For stock price prediction, LSTM network performance has been greatly appreciated when combined with NLP, which uses news text data as input to predict price trends. In addition, there are also a number of studies that use price data to predict price movements (Chen et al. 2015), using historical price data in addition to stock indices to predict whether stock prices will increase, decrease or stay the same during the day (Di Persio and Honchar, 2016), or compare the performance of the LSTM with its own proposed method based on a combination of different algorithms (Pahwa et al. 2017).
Zhuge et al. (2017) combine LSTM with Naiev Bayes method to extract market emotional factors to improve predictive performance. This method can be used to predict financial markets on completely different time scales from other variables. The sentiment analysis model is integrated with the LSTM time series model to predict the stock’s opening price and the results show that this model can improve the prediction accuracy.
Jia (2016) discussed the effectiveness of LSTM in stock price prediction research and showed that LSTM is an effective method to predict stock returns. The real-time wavelet transform was combined with the LSTM network to predict the East Asian stock index, which corrected some logic defects in previous studies. Compared with the model using only LSTM, the combined model can greatly improve the prediction degree and the regression error is small. In addition, Gülmez (2023) believed that the LSTM model is suitable for time series data on financial markets in the context of stock prices established on supply and demand relationships. Researching on the Down Jones stock index, which is a market for stocks, bonds and other securities in USA, the authors also did the stock forecasts for the period 2019 to 2023. Another research by Usmani Shamsi (2023) on Pakistan stock market research on general market, industry and stock related news categories and its influence on stock price forecast. This confirms that the LSTM model is being used more widely in stock price forecasting recently.
Data collection and research methodology
Data collection. The research apply LSTM algorithm and technical analysis indicators to forecast price trends on the
Vietnamese stock market. To accomplish the above research objective, the authors used research data, including price history of VN-Index and stocks in group VN-30, collected from secondary data sources at website vietstock.vn. The specific list of stocks to be collected is as follows:
Table 1 shows that the study selected 31 enterprises and all are currently large enterprises, mainly in the VN-30 group. On the Vietnamese stock market, VN-30 is a group of 30 securities with large market capitalization and high liquidity, and is a typical representative of the stock market (here representing VN-Index). In addition, the time to collect historical price data starts from the time the shares are listed on the stock exchange to April 1, 2021. This period is closely related to the impact of the pandemic, so this study conducts a forecast assessment in the impact of the pandemic. Further, the price history data length of the stocks will be different because these stocks have different listing start dates. The classification method is used according to the GICS classification system standard.
Data is initially collected below, including the following indexes: closing price, opening price, highest price, lowest price and trading volume corresponding to each trading session of the stocks in the list. This historical price data is processed through the following specific steps:
Step 1: check the data, handle the defects of the data such as: empty data, data deviation. Instances with defective data will be checked and supplemented.
Step 2: Calculate the corresponding technical analysis indicators for each stock, including: simple moving average (SMA), convergence divergence moving average (MACD), and relative strength index (RSI).
Step 3: Historical price data is aggregated with the corresponding technical analysis indicator, observations that lack data due to differences in the calculation process of technical analysis indicators will be eliminated.
Step 4: Aggregate data including price history and technical analysis indicators are used as input data for the Long Short Term Memory (LSTM) model to make stock price forecasts.
The author uses Microsoft Office Excel software and Python language to calculate technical analysis indicators, process and analyze data. The Long Short Term Memory (LSTM) model is built on the basis of the Sklearn, Keras and Tensorflow support libraries.
Research methodology. This study uses the Model of Long Short Term Memory (LSTM). In addition, the data is divided into two separate sets: training and testing. The training set includes data from the listing start date to December 31, 2020, the test set includes data from January 1, 2021 to April 1, 2021. The training set data is used to LSTM model and the test set data is used to evaluate the model’s performance. The data in the training and testing sets are completely independent, to ensure objectivity in the process of evaluating the performance of the model.
The advantage of the LSTM method can be confirmed that this method is processed on daily data, so it is possible to measure daily stock price fluctuations, and at the same time study can control the accuracy of analysis through the accuracy of the model’s prediction.
Authors used the step coefficient of the LSTM model as 60. That is, the LSTM model will use the data of the previous 60 days to forecast the stock price at the next day. Accordingly, the LSTM model is built with a structure of 4 layers including the following specific coefficients:
Layer 1: units
Table 1 List of stock codes used in the study.
| No. | Code | Company’s name | Branch | Listing date |
| 1 | VN-Index | VN-Index | N/A | 20/07/2000 |
| 2 | BID | Bank for Investment and Development of Vietnam | Finance | 24/01/2014 |
| 3 | BVH | Bao Viet Group | Finance | 25/06/2009 |
| 4 | CTG | Bank of Industry and Trade of Vietnam | Finance | 16/07/2009 |
| 5 | FPT | FPT Corporation | Technology | 13/12/2006 |
| 6 | GAS | Vietnam Gas Corporation | Utilities | 21/05/2012 |
| 7 | HDB | Ho Chi Minh City Development Commercial Bank | Finance | 05/01/2018 |
| 8 | HPG | Hoa Phat Group Joint Stock Company | Manufacturing | 15/11/2007 |
| 9 | KDH | Khang Dien House Trading and Investment Joint Stock Company | Build | 01/02/2010 |
| 10 | MBB | Military Commercial Joint Stock Bank | Finance | 01/11/2011 |
| 11 | MSN | Masan Group Joint Stock Company | Manufacturing | 05/11/2009 |
| 12 | MWG | Mobile World Investment Joint Stock Company | Retail | 14/07/2014 |
| 13 | NVL | Nova Real Estate Investment Group JSC | Build | 28/12/2016 |
| 14 | PDR | Phat Dat Real Estate Development Joint Stock Company | Build | 30/07/2010 |
| 15 | PLX | Vietnam National Petroleum Corporation | Oil and Gas | 21/04/2017 |
| 16 | PNJ | Phu Nhuan Jewelry Joint Stock Company | Manufacturing | 23/03/2009 |
| 17 | POW | PetroVietnam Power Corporation | Utilities | 14/01/2019 |
| 18 | REE | Refrigeration Mechanical and Electrical Joint Stock Company | Build | 28/07/2000 |
| 19 | SBT | Thanh Thanh Cong Joint Stock Company – Bien Hoa | Manufacturing | 25/02/2008 |
| 20 | SSI | SSI. Securities JSC | Finance | 29/10/2007 |
| 21 | STB | Saigon Thuong Tin Commercial Joint Stock Bank | Finance | 12/07/2006 |
| 22 | TCB | Vietnam Technological and Commercial Joint Stock Bank | Finance | 04/06/2018 |
| 23 | TCH | Hoang Huy Financial Services Investment Joint Stock Company | Build | 05/10/2016 |
| 24 | TPB | Tien Phong Commercial Joint Stock Bank | Finance | 19/04/2018 |
| 25 | VCB | Joint Stock Commercial Bank for Foreign Trade of Vietnam | Finance | 30/06/2009 |
| 26 | VHM | Vinhomes Joint Stock Company | Build | 17/05/2018 |
| 27 | VIC | Vingroup company | Build | 19/09/2007 |
| 28 | VJC | Vietjet Aviation Joint Stock Company | Carriage | 28/02/2017 |
| 29 | VNM | Vietnam Dairy Products Joint Stock Company | Manufacturing | 19/01/2006 |
| 30 | VPB | Vietnam Prosperity Joint Stock Commercial Bank | Finance | 17/08/2017 |
| 31 | VRE | Vincom Retail JSC | Build | 06/11/2017 |
Note: More information of these stocks can be referred to all Figure of the Appendix.
Source: The authors’ analysis.
Source: The authors’ analysis.
Model: “sequential_101”
| Layer (type) | Output Shape | Param # | |||
| 1stm_404 (LSTM) | (None, 60, 30) | 4800 | |||
| dropout_388 (Dropout) | (None, 60, 30) | 0 | |||
| 1stm_405 (LSTM) | (None, 60, 40) | 11360 | |||
| dropout_389 (Dropout) | (None, 60, 40) | 0 | |||
| 1stm_406 (LSTM) | (None, 60, 50) | 18200 | |||
| dropout_390 (Dropout) | (None, 60, 50) | 0 | |||
| 1stm_407 (LSTM) | (None, 60) | 26640 | |||
| dropout_391 (Dropout) | (None, 60) | 0 | |||
| dense_101 (Dense) | (None, 1) | 61 | |||
|
Fig. 3 LSTM model. Source: The authors’ analysis.
Layer 2: units
Layer 3: units
Layer 4: units
The model is built on the specific Python language platform in the Fig. 3 as follows:
Layer 3: units
Layer 4: units
The model is built on the specific Python language platform in the Fig. 3 as follows:
Figure 3 indicates that the model is compiled with the following specific coefficients: optimizer
mean_squared_error’. Next, fit the model with the following coefficients: epochs
mean_squared_error’. Next, fit the model with the following coefficients: epochs
After building the LSTM model with the training set data, the LSTM model will forecast stock prices for the corresponding observations of the test set, that is, the trading sessions from January 1, 2021 until April 1, 2021. The stock price forecasted from the model will be compared with the actual stock price of the respective trading session. The accuracy of the model’s prediction is evaluated based on the following formula:
Where:
The prediction accuracy of the LSTM model will be compared with the baseline value of
error is
error is
Research results and discussions
When apply LSTM algorithm and technical analysis indicators to forecast price trends on the Vietnamese stock market. In this section, authors will present the results of the data after performing the analysis according to the research process and method, as well as make comments and discuss the research results.
Figure 4 shows the list of stocks in the VN-30 group has mainly in the industry groups: finance, construction and manufacturing. Figure 4 indicates that companies in these industry groups have high corporate capitalization, which is why many companies in these industry groups appear in the list of stocks selected for the study.
The LSTM model predicts stock prices corresponding to the trading sessions in the test set. The test set data length includes observations from January 1, 2021 to April 1, 2021. Thus, there are all 78 trading sessions observed in the test set. For each different stock ticker, the forecast performance of the built model is also different. Figure 5 shows the forecast results of the LSTM model for the VN-Index on the data set.
It can be seen that the price forecast from the LSTM model tends to be very similar to the variation trend of the actual price
Fig. 4 Classification of VN30 listed companies by industry. Source: The authors’ analysis.
on the data of the test set. In addition, the difference between the forecast price and the actual price is not significant. Note that for each data of different stocks, the accuracy of the LSTM model’s forecast will have a difference, a specific comparison chart between the forecast price and the actual price of all stocks. Stock codes carried out in the study are presented in the appendix.
Figure 6 shows the level of accuracy in stock price forecast on the test set of the LSTM model corresponding to each stock in the research list. The red horizontal line represents the baseline at
In which, stock ticker PNJ achieved the highest forecast accuracy at
The forecast results of the LSTM model with the stock ticker data of PNJ have a very high similarity between the forecast price and the actual price on the test set, with almost no difference. This explains the very high coefficient of predictive accuracy of the LSTM model for PNJ.
However, the LSTM model still gave forecast results with an accuracy not as high as
The prediction results of the LSTM model for the NVL code have relatively uniform results in the first period (about the first 20 observations) of the test set. However, at the next stage, there is a significant difference between the forecast results and the actual data in the test set. This leads to the result that the summary prediction for NVL code on the test set is not good. Similar results for a number of other not-so-high forecast codes such as TCH, FPT, PLX, POW, VPB and VRE. The chart comparing
Fig. 5 Forecast results and actual prices in the test set – VN-Index. Source: The authors’ analysis.
Fig. 6 Accuracy level of LSTM model. Source: The authors’ analysis.
Fig. 7 Comparison of forecast price and actual price of stock ticker PNJ. Source: The authors’ analysis.
Fig. 8 Comparison of forecast price and actual price of stock ticker NVL. Source: The authors’ analysis.
Fig. 9 Compare forecast price and actual price of share BID. Source: The authors’ analysis.
Fig. 10 Compare forecast price and actual price of share BVH. Source: The authors’ analysis.
Fig. 11 Compare forecast price and actual price of share CTG. Source: The authors’ analysis.
Fig. 12 Compare forecast price and actual price of share FPT. Source: The authors’ analysis.
Fig. 13 Compare forecast price and actual price of share GAS. Source: The authors’ analysis.
Fig. 14 Compare forecast price and actual price of share HDB. Source: The authors’ analysis.
Fig. 15 Compare forecast price and actual price of share HPG. Source: The authors’ analysis.
Fig. 16 Compare forecast price and actual price of share KDH. Source: The authors’ analysis.
Fig. 17 Compare forecast price and actual price of share MBB. Source: The authors’ analysis.
Fig. 18 Compare forecast price and actual price of share MSN. Source: The authors’ analysis.
Fig. 19 Compare forecast price and actual price of share MWG. Source: The authors’ analysis.
Fig. 20 Compare forecast price and actual price of share PDR. Source: The authors’ analysis.
forecast and actual prices of these stocks is presented in detail in Fig. 31-36.
The high predictive accuracy for most of the stock data used demonstrates the suitability of the LSTM model in analyzing and forecasting stock price movements. This conclusion is consistent
with the studies of Sen and Chaudhuri (2016), Sen (2017), Sen and Chaudhuri (2016) and Mehtab and Sen (2019). In addition, the study uses a combination of price history and technical analysis indicators to build an LSTM model. This also confirms the potential of technical analysis indicators in forecasting stock
with the studies of Sen and Chaudhuri (2016), Sen (2017), Sen and Chaudhuri (2016) and Mehtab and Sen (2019). In addition, the study uses a combination of price history and technical analysis indicators to build an LSTM model. This also confirms the potential of technical analysis indicators in forecasting stock
Fig. 21 Compare forecast price and actual price of share PLX. Source: The authors’ analysis.
Fig. 22 Compare forecast price and actual price of share POW. Source: The authors’ analysis.
Fig. 23 Compare forecast price and actual price of share REE. Source: The authors’ analysis.
price movements. At the same time, it shows the compatibility and mutual support when combining technical analysis and financial data analysis models on a machine learning platform, specifically the LSTM algorithm in this study.
LSTM algorithm and technical analysis indicators to forecast price trends in Vietnam’s stock market, adding conclusions about forecasting performance and application level of LSTM. LSTM model for analyzing and forecasting stock price trends in
Fig. 24 Compare forecast price and actual price of share SBT. Source: The authors’ analysis.
Fig. 25 Compare forecast price and actual price of share SSI. Source: The authors’ analysis.
Fig. 26 Compare forecast price and actual price of share STB. Source: The authors’ analysis.
Vietnam’s stock market in terms of both academic and practical applications. Further studies can use the conclusions from this study to reference and compare, evaluate the results, and supplement the robustness of the academic conclusions. Moreover,
the research and application of real and updated stock market data has high practical applicability. The conclusions from this study can be widely applied by investors, financial institutions, and government market regulators.
the research and application of real and updated stock market data has high practical applicability. The conclusions from this study can be widely applied by investors, financial institutions, and government market regulators.
Fig. 27 Compare forecast price and actual price of share TCB. Source: The authors’ analysis.
Fig. 28 Compare forecast price and actual price of share TCH. Source: The authors’ analysis.
Fig. 29 Compare forecast price and actual price of share TPB. Source: The authors’ analysis.
Conclusions
Research with the aim of evaluating the application of LSTM algorithm and technical analysis indicators to forecast price trends on the Vietnamese stock market, using historical price data
of the VN-Index and stocks of VN-30 group, combined with technical analysis indicators to build a Long Short Term Memory model. The forecast results of the LSTM model show a good predictive level for most data of the stocks studied. With the
of the VN-Index and stocks of VN-30 group, combined with technical analysis indicators to build a Long Short Term Memory model. The forecast results of the LSTM model show a good predictive level for most data of the stocks studied. With the
Fig. 30 Compare forecast price and actual price of share VIC. Source: The authors’ analysis.
Fig. 31 Compare forecast price and actual price of share VJC. Source: The authors’ analysis.
Fig. 32 Compare forecast price and actual price of share VNM. Source: The authors’ analysis.
Fig. 33 Compare forecast price and actual price of share VPB. Source: The authors’ analysis.
Fig. 34 Compare forecast price and actual price of share VRE. Source: The authors’ analysis.
Fig. 35 Compare forecast price and actual price of share VCB. Source: The authors’ analysis.
Fig. 36 Compare forecast price and actual price of share VHM. Source: The authors’ analysis.
characteristics of the structure and analytical method, the LSTM model is evaluated and highly suitable for time series data such as stock price history. Therefore, the application of the LSTM algorithm to analyze and forecast stock prices is considered appropriate, the results of this study are also consistent with the above conclusions. However, the machine learning algorithms that have been developed strongly in recent times have many applications in the financial field, specifically a few popular algorithms applied in the financial field such as Random Forest, Support Vector Machine. These algorithms also have great potential for application to the topic of stock price analysis and forecasting. Further studies on this topic may consider using other machine learning algorithms in analysis and research.
A common trend in the application of machine learning algorithms to economic (or more specifically financial) problems is to combine many different machine learning algorithms to create a model with a degree of higher complexity but potentially higher performance. Combining various machine learning algorithms can complement and enhance the predictive performance of the model. This study only applies a single machine learning algorithm (that is, the LSTM algorithm). However, the extended research direction of this topic can consider combining many machine learning algorithms to improve the predictive performance of the model.
In addition, the data used in the study included only structured, arithmetical data types. With the trend of applying data analysis methods in the direction of machine learning, unstructured data such as data in the form of text, audio, images, etc., demonstrate the feasibility of analytical applications in Vietnam. This is also a potential source of data for indepth financial analysis that has not been used so far. Extensive research directions on the topic of stock price assessment and forecasting by applying machine learning algorithms can consider using unstructured data types to explore this potential data area. However, due to the influence of objective limitations, this study still has certain limitations. The data used in the study is limited to the stock market of Ho Chi Minh City (VN-Index). Therefore, the research still has some limitations that make forecasting difficult, especially in the case of strong fluctuations in stock prices. The reason is originally from the internal issues in the stock market. Specifically, the shares are still small, so stock prices do not really follow the relationship between supply and demand. Recently, Vietnam has also encountered some problems about market manipulation and legal risks in the stock market. Further studies may expand the
database, using data from other stock exchanges in Vietnam to enhance the certainty of the model’s performance evaluation and forecast.
database, using data from other stock exchanges in Vietnam to enhance the certainty of the model’s performance evaluation and forecast.
Data availability
The datasets used and/or analyzed are available from the author upon reasonable request. All data are available on the https:// zenodo.org/uploads/10418013.
Received: 15 June 2023; Accepted: 9 February 2024;
Published online: 12 March 2024
Published online: 12 March 2024
References
Agrawal M, Khan AU, Shukla PK (2019) Stock price prediction using technical indicators: A predictive model using optimal deep learning. Int J Recent Technol Eng 8(2):2297-2305
Appel, G (2005) Technical analysis: power tools for active investors: FT Press
Biondo AE, Pluchino A, Rapisarda A, Helbing D (2013) Are random trading strategies more successful than technical ones? PloS one 8(7):e68344
Borovkova S, Tsiamas I (2019) An ensemble of LSTM neural networks for highfrequency stock market classification. J Forecast 38(6):600-619
Brock W, Lakonishok J, LeBaron B (1992) Simple technical trading rules and the stochastic properties of stock returns. J Financ 47(5):1731-1764
Brown SJ, Goetzmann WN, Kumar A (1998) The Dow theory: William Peter Hamilton’s track record reconsidered. J Financ 53(4):1311-1333
Burton, N (2018.) An Analysis of Burton G. Malkiel’s A Random Walk Down Wall Street, 1st edition, ISBN 9781912128822, routledge. Available at https://www. routledge.com/An-Analysis-of-Burton-G-Malkiels-A-Random-Walk-Down-Wall-Street/Burton/p/book/9781912128822, accessed on 30th Oct, 2023
Chan, MC, Wong, CC, & Lam, CC (2000) Financial time series forecasting by neural network using conjugate gradient learning algorithm and multiple linear regression weight initialization. Available at https://citeseerx.ist.psu. edu/document?repid=rep1&type=pdf&doi=5853eb9035a62449c39f2137 68a60603352bcf05, accessed on 30th Oct, 2023
Chen, K, Zhou, Y, & Dai, F (2015) A LSTM-based method for stock returns prediction: A case study of China stock market. 2015 IEEE International Conference on Big Data (Big Data), 2823-2824. https://doi.org/10.1109/ BigData.2015.7364089
Di Persio L, Honchar O (2016) Artificial neural networks approach to the forecast of stock market price movements. Int J Econ Manag Syst 1:158-162
Ding, X, Zhang, Y, Liu, T, & Duan, J (2015) Deep learning for event-driven stock prediction. Proceedings of the Twenty-Fourth International Joint Conference on Artificial Intelligence (IJCAI 2015), 2327-2333. Available at https://www. ijcai.org/Proceedings/15/Papers/329.pdf, accessed on 30th Oct, 2023
Elman JL (1990) Finding structures in time. Cogn Sci 14(2):179-211
El-Nagar AM, Zaki AM, Soliman FAS, El-Bardini M (2022) Hybrid deep learning diagonal recurrent neural network controller for nonlinear systems. Neural
Appel, G (2005) Technical analysis: power tools for active investors: FT Press
Biondo AE, Pluchino A, Rapisarda A, Helbing D (2013) Are random trading strategies more successful than technical ones? PloS one 8(7):e68344
Borovkova S, Tsiamas I (2019) An ensemble of LSTM neural networks for highfrequency stock market classification. J Forecast 38(6):600-619
Brock W, Lakonishok J, LeBaron B (1992) Simple technical trading rules and the stochastic properties of stock returns. J Financ 47(5):1731-1764
Brown SJ, Goetzmann WN, Kumar A (1998) The Dow theory: William Peter Hamilton’s track record reconsidered. J Financ 53(4):1311-1333
Burton, N (2018.) An Analysis of Burton G. Malkiel’s A Random Walk Down Wall Street, 1st edition, ISBN 9781912128822, routledge. Available at https://www. routledge.com/An-Analysis-of-Burton-G-Malkiels-A-Random-Walk-Down-Wall-Street/Burton/p/book/9781912128822, accessed on 30th Oct, 2023
Chan, MC, Wong, CC, & Lam, CC (2000) Financial time series forecasting by neural network using conjugate gradient learning algorithm and multiple linear regression weight initialization. Available at https://citeseerx.ist.psu. edu/document?repid=rep1&type=pdf&doi=5853eb9035a62449c39f2137 68a60603352bcf05, accessed on 30th Oct, 2023
Chen, K, Zhou, Y, & Dai, F (2015) A LSTM-based method for stock returns prediction: A case study of China stock market. 2015 IEEE International Conference on Big Data (Big Data), 2823-2824. https://doi.org/10.1109/ BigData.2015.7364089
Di Persio L, Honchar O (2016) Artificial neural networks approach to the forecast of stock market price movements. Int J Econ Manag Syst 1:158-162
Ding, X, Zhang, Y, Liu, T, & Duan, J (2015) Deep learning for event-driven stock prediction. Proceedings of the Twenty-Fourth International Joint Conference on Artificial Intelligence (IJCAI 2015), 2327-2333. Available at https://www. ijcai.org/Proceedings/15/Papers/329.pdf, accessed on 30th Oct, 2023
Elman JL (1990) Finding structures in time. Cogn Sci 14(2):179-211
El-Nagar AM, Zaki AM, Soliman FAS, El-Bardini M (2022) Hybrid deep learning diagonal recurrent neural network controller for nonlinear systems. Neural
Comput Appl 34(24):22367-22386. https://doi.org/10.1007/s00521-022-07673-9
Fama EF (1970) Efficient Capital Markets: A Review of Theory and Empirical Work. J Financ 25(2):383-417. https://doi.org/10.2307/2325486
Fifield SG, Power DM, Donald Sinclair C (2005) An analysis of trading strategies in eleven European stock markets. Eur J Financ 11(6):531-548
Fromlet, H (2001) Behavioral finance-theory and practical application: Systematic analysis of departures from the homo oeconomicus paradigm are essential for realistic financial research and analysis. Business Economics, 63-69
Graves A, Liwicki M, Fernández S, Bertolami R, Bunke H, Schmidhuber J (2008) A novel connectionist system for unconstrained handwriting recognition. IEEE Trans pattern Anal Mach Intell 31(5):855-868
Graves, A (2012) Supervised sequence labeling. In Supervised sequence labeling with recurrent neural networks (pp. 5-13): Springer
Greff K, Srivastava RK, Koutník J, Steunebrink BR, Schmidhuber J (2016) LSTM: A search space odyssey. IEEE Trans neural Netw Learn Syst 28(10):2222-2232
Gülmez B (2023) Stock price prediction with optimized deep LSTM network with artificial rabbits optimization algorithm. Expert Syst Appl 227:120346. https://doi.org/10.1016/j.eswa.2023.120346
Heaton JB, Polson N, Witte J (2016) Deep Learning for Finance: Deep Portfolios. Appl Stoch Models Bus Ind 33(1):3-12
Hegazy O, Soliman OS, Salam MA (2014) A machine learning model for stock market prediction. Int J Comput Sci Telecommun 4(12):17-23
Hoang, M (2023) Vietnam’s stock market capitalization is equivalent to
Hochreiter S, Schmidhuber J (1997) Long Short-Term Memory. Neural Comput 9:1735-1780. https://doi.org/10.1162/neco.1997.9.8.1735
Jia, H (2016) Investigation into the effectiveness of long short term memory networks for stock price prediction. Retrieved from https://ui.adsabs.harvard. edu/abs/2016arXiv160307893J/abstract, accessed on
Kirkpatrick CD, Dahlquist JR (2010) Technical Analysis: The Complete Resource for Financial Market Technicians. 2 Edn, FT Press, 2010
Lai, CY, Chen, RC, & Caraka, RE (2019) Prediction Stock Price Based on Different Index Factors Using LSTM. 2019 International Conference on Machine Learning and Cybernetics (ICMLC), 1-6
Le TTH, Nguyen VC, Phan THN (2022) Foreign Direct Investment, Environmental Pollution and Economic Growth-An Insight from Non-Linear ARDL Co-Integration Approach. Sustainability 14(13):8146. https://doi.org/ 10.3390/su14138146. Retrieved from
Fama EF (1970) Efficient Capital Markets: A Review of Theory and Empirical Work. J Financ 25(2):383-417. https://doi.org/10.2307/2325486
Fifield SG, Power DM, Donald Sinclair C (2005) An analysis of trading strategies in eleven European stock markets. Eur J Financ 11(6):531-548
Fromlet, H (2001) Behavioral finance-theory and practical application: Systematic analysis of departures from the homo oeconomicus paradigm are essential for realistic financial research and analysis. Business Economics, 63-69
Graves A, Liwicki M, Fernández S, Bertolami R, Bunke H, Schmidhuber J (2008) A novel connectionist system for unconstrained handwriting recognition. IEEE Trans pattern Anal Mach Intell 31(5):855-868
Graves, A (2012) Supervised sequence labeling. In Supervised sequence labeling with recurrent neural networks (pp. 5-13): Springer
Greff K, Srivastava RK, Koutník J, Steunebrink BR, Schmidhuber J (2016) LSTM: A search space odyssey. IEEE Trans neural Netw Learn Syst 28(10):2222-2232
Gülmez B (2023) Stock price prediction with optimized deep LSTM network with artificial rabbits optimization algorithm. Expert Syst Appl 227:120346. https://doi.org/10.1016/j.eswa.2023.120346
Heaton JB, Polson N, Witte J (2016) Deep Learning for Finance: Deep Portfolios. Appl Stoch Models Bus Ind 33(1):3-12
Hegazy O, Soliman OS, Salam MA (2014) A machine learning model for stock market prediction. Int J Comput Sci Telecommun 4(12):17-23
Hoang, M (2023) Vietnam’s stock market capitalization is equivalent to
Hochreiter S, Schmidhuber J (1997) Long Short-Term Memory. Neural Comput 9:1735-1780. https://doi.org/10.1162/neco.1997.9.8.1735
Jia, H (2016) Investigation into the effectiveness of long short term memory networks for stock price prediction. Retrieved from https://ui.adsabs.harvard. edu/abs/2016arXiv160307893J/abstract, accessed on
Kirkpatrick CD, Dahlquist JR (2010) Technical Analysis: The Complete Resource for Financial Market Technicians. 2 Edn, FT Press, 2010
Lai, CY, Chen, RC, & Caraka, RE (2019) Prediction Stock Price Based on Different Index Factors Using LSTM. 2019 International Conference on Machine Learning and Cybernetics (ICMLC), 1-6
Le TTH, Nguyen VC, Phan THN (2022) Foreign Direct Investment, Environmental Pollution and Economic Growth-An Insight from Non-Linear ARDL Co-Integration Approach. Sustainability 14(13):8146. https://doi.org/ 10.3390/su14138146. Retrieved from
Liu S, Graham SL, Schulz A, Kalloniatis M, Zangerl B, Cai W, Gao Y, Chua B, Arvind H, Grigg J, Chu D, Klistorner A, You Y (2018) A Deep LearningBased Algorithm Identifies Glaucomatous Discs Using Monoscopic Fundus Photographs. Ophthalmol Glaucoma 1(1):15-22
Lo, AW, & MacKinlay, AC (1999) A Non-Random Walk Down Wall Street. Princeton University Press. http://www.jstor.org/stable/j.ctt7tccx
Mehtab S, Sen J (2020) Stock Price Prediction Using Convolutional Neural Networks on a Multivariate Time Series. Proceedings of the 3rd National Conference on Machine Learning and Artificial Intelligence. New Delhi, INDIA, https://ssrn.com/abstract=3665363
Mehtab, S, Sen, J (2019) A Robust Predictive Model for Stock Price Prediction Using Deep Learning and Natural Language Processing. Available at SSRN: https://ssrn.com/abstract=3502624
Nelson, DM, Pereira, AC, & de Oliveira, RA (2017) Stock market’s price movement prediction with LSTM neural networks. Paper presented at the 2017 International joint conference on neural networks (IJCNN)
Pahwa N, Khalfay N, Soni V, Vora D (2017) Stock prediction using machine learning a review paper. Int J Computer Appl 163(5):36-43
Roman J, Jameel A (1996) Backpropagation and recurrent neural networks in financial analysis of multiple stock market returns. Proc HICSS-29: 29th Hawaii Int Conf Syst Sci 2:454-460 vol.2. https://doi.org/10.1109/HICSS. 1996.495431
Lo, AW, & MacKinlay, AC (1999) A Non-Random Walk Down Wall Street. Princeton University Press. http://www.jstor.org/stable/j.ctt7tccx
Mehtab S, Sen J (2020) Stock Price Prediction Using Convolutional Neural Networks on a Multivariate Time Series. Proceedings of the 3rd National Conference on Machine Learning and Artificial Intelligence. New Delhi, INDIA, https://ssrn.com/abstract=3665363
Mehtab, S, Sen, J (2019) A Robust Predictive Model for Stock Price Prediction Using Deep Learning and Natural Language Processing. Available at SSRN: https://ssrn.com/abstract=3502624
Nelson, DM, Pereira, AC, & de Oliveira, RA (2017) Stock market’s price movement prediction with LSTM neural networks. Paper presented at the 2017 International joint conference on neural networks (IJCNN)
Pahwa N, Khalfay N, Soni V, Vora D (2017) Stock prediction using machine learning a review paper. Int J Computer Appl 163(5):36-43
Roman J, Jameel A (1996) Backpropagation and recurrent neural networks in financial analysis of multiple stock market returns. Proc HICSS-29: 29th Hawaii Int Conf Syst Sci 2:454-460 vol.2. https://doi.org/10.1109/HICSS. 1996.495431
Saad E, Prokhorov E, Wunsch D (1998) Comparative Study of Stock Trend Prediction Using Time Delay, Recurrent and Probabilistic Neural Networks. IEEE Trans Neural Netw 9:1456-1470. https://doi.org/10.1109/72.728395
Sen J (2017) A Robust Analysis and Forecasting Framework for the Indian Mid Cap Sector Using Times Series Decomposition Approach. J Insurance Financ Manag 3(4):1-32
Sen J, Datta Chaudhuri D (2018) Understanding the sectors of Indian economy for portfolio choice. Int J Bus Forecast Market Intel 4(2):178-222.https://doi.org/ 10.1504/IJBFMI.2018.090914
Sen J, Datta Chaudhuri D (2018) Understanding the sectors of Indian economy for portfolio choice. Int J Bus Forecast Market Intel 4(2):178-222.https://doi.org/ 10.1504/IJBFMI.2018.090914
Sen J, Chaudhuri TD (2016) An alternative framework for time series decomposition and forecasting and its relevance for portfolio choice: a comparative study of the Indian consumer durable and small cap sectors. J Econ Libr 3(2):303-326
Trinh HH, Nguyen CP, Hao W, Wongchoti U (2021) Does stock liquidity affect bankruptcy risk? DID analysis from Vietnam. Pac-Basin Financ J 69:101634. https://doi.org/10.1016/j.pacfin.2021.101634
Usmani S, Shamsi JA (2023) LSTM based stock prediction using weighted and categorized financial news. PLoS ONE 18(3):e0282234
White (1988) Economic prediction using neural networks: the case of IBM daily stock returns. IEEE 1988 Int Conf Neural Netw 2:451-458. https://doi.org/10. 1109/ICNN.1988.23959
Zhuge Q, Xu L, Zhang G (2017) LSTM Neural Network with Emotional Analysis for prediction of stock price. Eng Lett 25(2):25-32
Trinh HH, Nguyen CP, Hao W, Wongchoti U (2021) Does stock liquidity affect bankruptcy risk? DID analysis from Vietnam. Pac-Basin Financ J 69:101634. https://doi.org/10.1016/j.pacfin.2021.101634
Usmani S, Shamsi JA (2023) LSTM based stock prediction using weighted and categorized financial news. PLoS ONE 18(3):e0282234
White (1988) Economic prediction using neural networks: the case of IBM daily stock returns. IEEE 1988 Int Conf Neural Netw 2:451-458. https://doi.org/10. 1109/ICNN.1988.23959
Zhuge Q, Xu L, Zhang G (2017) LSTM Neural Network with Emotional Analysis for prediction of stock price. Eng Lett 25(2):25-32
Author contributions
Conceptualization: TP, PTKA, PHT, NCV; Methodology: TP, PTK.A, PHT, NCV; Format analysis and investigation: TP, PTK.A, PHT, NCV; Writing- review and editing: TP, P.T.K.A, PHT, NCV; Resources: TP; Supervision: NCV.
Competing interests
The authors declare no competing interests
Ethical approval
Ethical approval is not required by our universities. Ethical approval was therefore not provided.
Informed consent
This article does not contain any studies with human participants performed by any of the authors.
Additional information
Correspondence and requests for materials should be addressed to Chien V. Nguyen.
Reprints and permission information is available at http://www.nature.com/reprints
Publisher’s note Springer Nature remains neutral with regard to jurisdictional claims in published maps and institutional affiliations.
Reprints and permission information is available at http://www.nature.com/reprints
Publisher’s note Springer Nature remains neutral with regard to jurisdictional claims in published maps and institutional affiliations.
Open Access This article is licensed under a Creative Commons Attribution 4.0 International License, which permits use, sharing, adaptation, distribution and reproduction in any medium or format, as long as you give appropriate credit to the original author(s) and the source, provide a link to the Creative Commons licence, and indicate if changes were made. The images or other third party material in this article are included in the article’s Creative Commons licence, unless indicated otherwise in a credit line to the material. If material is not included in the article’s Creative Commons licence and your intended use is not permitted by statutory regulation or exceeds the permitted use, you will need to obtain permission directly from the copyright holder. To view a copy of this licence, visit http://creativecommons.org/ licenses/by/4.0/.
© The Author(s) 2024
© The Author(s) 2024
Ho Chi Minh City of University of Food Industry, 140 Le Trong Tan, Tan Phu District, Ho Chi Minh, Vietnam. Faculty of Finance and Accounting, Hochiminh City University of Industry and Trade, Ho Chi Minh City, Vietnam. University of Economics and Law, Ho Chi Minh City, Vietnam. Vietnam National University, Ho Chi Minh City, Vietnam. Institute of Graduate Studies, Thu Dau Mot University, Thu Dau Mot City Binh Duong provinceVietnam.
chiennv@tdmu.edu.vn