المجلة: Scientific Reports، المجلد: 14، العدد: 1
DOI: https://doi.org/10.1038/s41598-024-64664-7
PMID: https://pubmed.ncbi.nlm.nih.gov/38877097
تاريخ النشر: 2024-06-14
DOI: https://doi.org/10.1038/s41598-024-64664-7
PMID: https://pubmed.ncbi.nlm.nih.gov/38877097
تاريخ النشر: 2024-06-14
تطوير نظام للكشف عن عرج الماشية في الوقت الحقيقي باستخدام كاميرا جانبية واحدة
تحليل الفيديو ونموذج الانتباه السيامي (Siam-AM) يوفران حلاً محتملاً لتتبع جميع أرجل الماشية الأربعة وكشف العرج في قطعان الألبان. تتضمن العملية استخراج الميزات، وتطبيق وزن الانتباه، ومقارنة التشابهات لتحقيق تتبع دقيق للأرجل
أظهرت الدراسات التي تبحث في موثوقية تقييم العرج في الماشية باستخدام درجات الحركة، سواء كانت حية أو من الفيديو، أن المقيمين ذوي الخبرة يظهرون موثوقية أعلى عند التقييم
من الفيديو. وهذا يشير إلى أن الملاحظة بالفيديو هي طريقة مقبولة لتقييم العرج، بغض النظر عن خبرة المراقب
يؤثر العرج السريري سلبًا على إنتاج الحليب والأداء التناسلي في الماشية
ومع ذلك، قد يسبب هذا النهج القائم على الاتصال توترًا أوليًا للماشية غير المعتادة على المعدات. كما أن تطبيقه على نطاق واسع سيزيد أيضًا من تكاليف العمالة والمعدات. للتغلب على هذه القيود، يقترح بعض الباحثين طرقًا غير تلامسية باستخدام كاميرات المراقبة في المزارع. من خلال نمذجة الوقت والمساحة لتتبع الماشية، حققوا نتائج دقيقة نسبيًا. ومع ذلك، كانت هذه الطريقة تفتقر إلى القوة البيئية، حيث يمكن أن تؤثر التغيرات في الظروف سلبًا على أداء الخوارزمية وتؤدي إلى نتائج دون المستوى في الكشف على المدى الطويل
يسمح استخدام قياسات وضع الظهر التلقائية في الروتين اليومي بتصنيفات فردية للعرج. اقترحت دراسة أخرى طريقة تعتمد على تسجيلات الفيديو ثلاثية الأبعاد المتتالية للكشف التلقائي عن العرج
(ط) لا تزال عملية الكشف الدقيق وتقسيم الكائنات للحيوانات الموجودة خلف الإطار أو في المناطق المغطاة تمثل تحديات حاسمة. يسعى هذا العمل إلى معالجة هذه التعقيدات.
(ii) لتقييم فعالية نموذج Mask R-CNN المدرب خصيصًا لدينا، قمنا بإجراء تحليل مقارن مع خوارزمية YOLOv8 المتطورة.
(iii) لتتبع الماشية، قمنا بتطوير خوارزمية خفيفة ومخصصة تستفيد من حسابات IoU مع آليات تثبيت الإطار وفتح المدخل.
(رابعاً) يقترح هذا العمل نهجاً جديداً لتقييم عرج الماشية من خلال تحليل التباين في أنماط الحركة. نحقق ذلك من خلال حساب النقاط الثلاث الرئيسية على انحناء ظهر الماشية، مما يوفر مقياساً جديداً لتقييم العرج.
(v) مقارنة درجات العرج الفردية للماشية مباشرة تفتقر إلى القوة. بدلاً من ذلك، فإن حساب الاحتمالات عبر جميع الإطارات من كل مجلد نتائج (المستمدة من مرحلة تتبع الماشية) يوفر نهجًا أكثر قوة.
(vi) يتيح دمج اكتشاف الماشية، وتتبعها، واستخراج الميزات، وحساب العرج الكشف عن عرج الماشية في الوقت الحقيقي.
(٧) لا يزال الكشف المبكر عن العرج في الماشية تحديًا كبيرًا، حيث يركز معظم البحث على التمييز بين الحيوانات غير العرجاء (المستوى ١) والحيوانات العرجاء بشكل خفيف (المستويات ٢ و ٣).
الأعمال ذات الصلة
في معلوماتنا البصرية التي تركز على رفاهية الحيوانات والتقدم التكنولوجي، يشارك مختبر المعلومات البصرية في جامعة ميازاكي حاليًا في البحث والتطوير المستمر لعدة مجالات رئيسية تتعلق بإدارة الماشية. على وجه التحديد، يتركز اهتمامنا على الأنظمة الثلاثة التالية: نظام تصنيف مستوى العرج في الماشية، نظام تصنيف حالة جسم الماشية، نظام كشف التزاوج في الماشية. تشمل جهودنا البحثية لكل من هذه الأنظمة تطوير منهجيات قوية للكشف والتتبع والتعريف.
يعد الكشف المبكر والدقيق عن العرج أمرًا ضروريًا لضمان التدخل في الوقت المناسب والعلاج المناسب للحيوانات المتأثرة. في السنوات الأخيرة، حظيت تصنيف عرج الماشية باهتمام كبير في مجال الزراعة الحيوانية الدقيقة. استكشف الباحثون طرقًا مختلفة لتحقيق التعرف الدقيق وفي الوقت المناسب على عرج الماشية باستخدام تقنيات متقدمة وطرق مبتكرة. ساهمت العديد من الجهود البحثية بشكل كبير في مجال الكشف عن عرج الماشية وتنوع حركة الجسم. في سياق الكشف عن العرج في الأبقار الحلوب، استكشفت عدة دراسات بحثية طرقًا ذكية استندت إلى تقنيات رؤية الكمبيوتر المتقدمة، وبالتحديد Mask-RCNN، لاستخراج منطقة الاهتمام التي تشمل الأبقار الحلوب. من خلال الاستفادة من الميزات المستمدة من أنماط حركة الرأس، تمكن المؤلفون من تحديد علامات محتملة للعرج في حركة الأبقار.
لكشف العرج في الماشية،
ال
هذا البحث
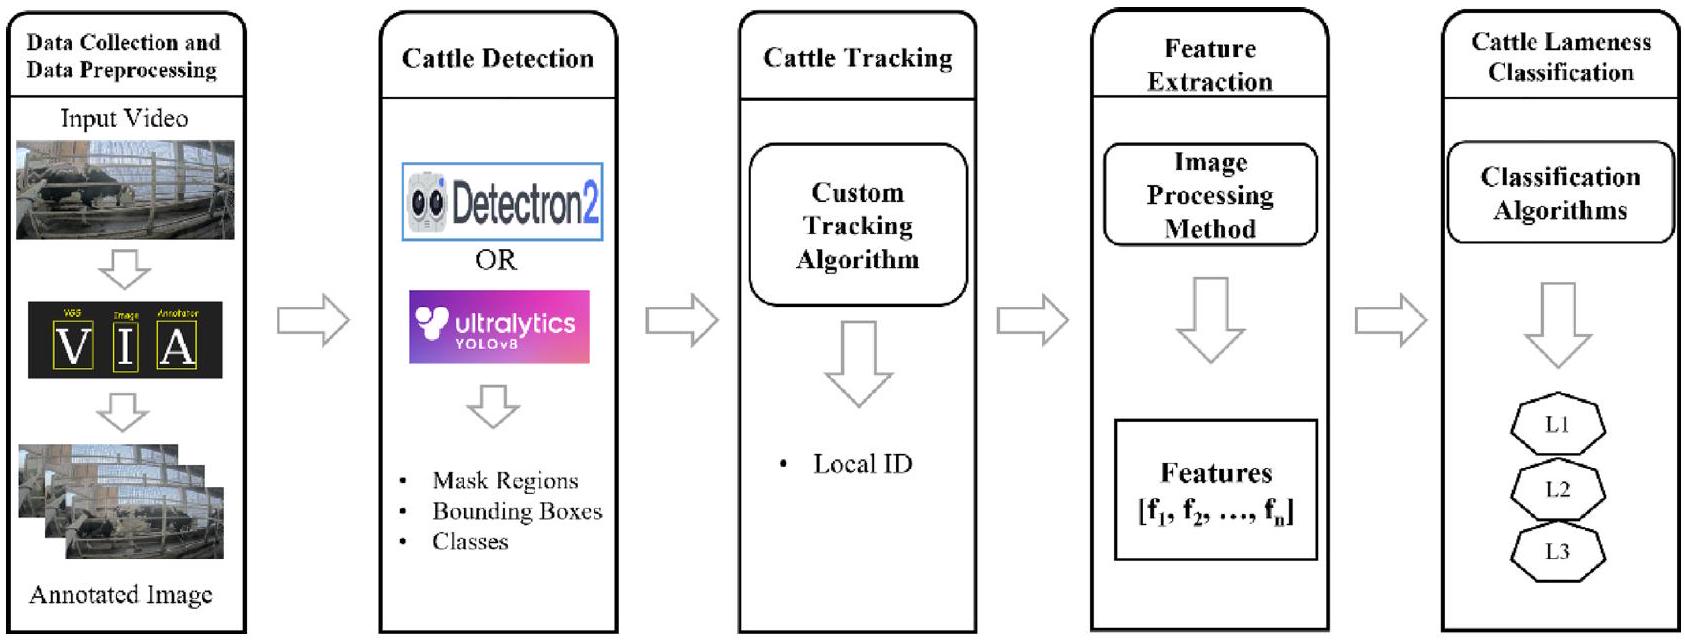
الشكل 1. الخط العام لنظام تصنيف عرج الماشية المقترح: (1) جمع البيانات ومعالجة البيانات (2) اكتشاف الماشية (3) تتبع الماشية (4) استخراج الميزات (5) تصنيف عرج الماشية.

الشكل 2. النموذج المفاهيمي لتخطيط وتنظيم المزرعة: تشمل المناطق الرئيسية ذات الاهتمام داخل منشأة الماشية صالات الحلب، والممرات المخصصة (الممر A والممر B)، ومنطقة الانتظار، وحظيرة الماشية.
نقطة كل ممر، مما يتيح المراقبة الشاملة وتحليل سلوك وحركة الماشية على طول المسارات. الشكل 3أ، ب يصور الممر A والممر B، على التوالي.
جمع البيانات
استخدمت هذه الدراسة كاميرتين AXIS P 1448-LE 4K (الشكل 4) تم وضعهما بشكل استراتيجي عند نقاط انطلاق ممرات الماشية التي تربط حظيرة الماشية بغرفة الحلب (الشكل 5أ، ب). قامت هذه الكاميرات بتسجيل مقاطع الفيديو بمعدل 25 إطارًا في الثانية ودقة صورة تبلغ
معالجة البيانات المسبقة
لإعداد البيانات في كشف مناطق الماشية، استخدمنا مُعَلِّم صور VGG (VIA)
لإعداد مجموعة بيانات تدريب كشف الماشية، قمنا بتعليق يدوي على 5458 حالة عبر ثلاثة تواريخ مميزة: 4 يوليو، 30 سبتمبر، و19 نوفمبر، ومن أجل مجموعة بيانات الاختبار جمعنا 247,250 حالة من 3 يناير، 5، 6، 7، 10، 11، 12، 13، 14، 23، 24، 25، 26، 27، 28 و29 كما هو موضح في الجدول 1. قدمت مجموعة بيانات يناير أكبر تحدٍ لكشف الماشية بسبب الجمع بين
الشكل 3. صورة عينة من مزرعة الماشية (أ) ممر الماشية A (ب) ممر الماشية B.

الشكل 4. تكوين الكاميرا لمراقبة الممر A في مزرعة الماشية ونوع الكاميرا المستخدمة من نوع 4K في مزرعة الماشية.
الشكل 5. تركيب الكاميرا (أ) كاميرا 4K على المسار A (ب) عرض أمامي من كاميرا 4K المثبتة.
الشكل 6. (أ)، (ب) عينات من التعليقات التوضيحية لمنطقة الماشية باستخدام أداة التعليق التوضيحي لصورة VGG.
آثار فصل الشتاء وبيئة إعداد الكاميرا. على وجه الخصوص، كانت وجود الدخان في البيئة وقرب الماشية التي تبحث عن الدفء خلال درجات الحرارة المنخفضة تعيق الكشف الدقيق. إدراكًا للدور الحاسم لجودة البيانات في أداء النموذج، قمنا بتنفيذ نهج متعدد الخطوات لتحسين مجموعة البيانات: (1) إزالة التكرارات: قمنا بتحديد وإزالة الصور المكررة بدقة، مما يقلل من التكرار ويخفف من الضغط الحسابي غير الضروري أثناء التدريب. (2) التخفيف من الضبابية: إدراكًا للتأثير الضار للصور الضبابية على دقة الكشف، قمنا بتصفية أي صور تظهر ضبابية ملحوظة بدقة.
| نوع التدريب | تاريخ | مدة | عدد الحالات |
| تدريب | 4 يوليو 2022 | صباح، مساء | ٣٠٠٠ |
| 30 سبتمبر 2022 | صباح، مساء | ٤٨٠ | |
| 19 نوفمبر 2022 | صباح، مساء | 1978 | |
| اختبار | 3 يناير 2023 | صباح، مساء | ١٧٣٢٢ |
| 5 يناير 2023 | صباح، مساء | ٢٢,١٩٤ | |
| 6 يناير 2023 | صباح الخير | 5059 | |
| 7 يناير 2023 | صباح الخير | 5106 | |
| 10 يناير 2023 | صباح، مساء | ٢٠٧٢٠ | |
| 11 يناير 2023 | صباح، مساء | ١١,٢٥٧ | |
| 12 يناير 2023 | صباح، مساء | ١٦٢٧٤ | |
| 13 يناير 2023 | صباح، مساء | ٢٤,٥٣٨ | |
| 14 يناير 2023 | صباح الخير | 6074 | |
| 23 يناير 2023 | صباح، مساء | 18,579 | |
| 24 يناير 2023 | صباح، مساء | ٢٣,٦٨٤ | |
| 25 يناير 2023 | صباح، مساء | 15,596 | |
| 26 يناير 2023 | صباح، مساء | 14,998 | |
| 27 يناير 2023 | صباح، مساء | ١٢,٩٣٤ | |
| 28 يناير 2023 | صباح الخير | 15,619 | |
| 29 يناير 2023 | صباح، مساء | 17,296 |
الجدول 1. مجموعة البيانات المستخدمة لتدريب واختبار كشف الماشية.
وبذلك يتم تعزيز مجموعة البيانات ذات الجودة المحسنة. (3) تقليل الضوضاء: تم استبعاد الصور المتأثرة بالضوضاء المفرطة، مثل التمويه أو التشويه، بدقة، مما يضمن تضمين الصور الخالية من الضوضاء التي تعزز قوة النموذج. (4) استخراج البيانات ذات الصلة: نظرًا لأن تركيزنا كان على اكتشاف الماشية، تم استبعاد الصور التي تفتقر إلى ممرات مرور الماشية أو التي تفتقر إلى معلومات ذات صلة بالماشية بدقة، مما يضمن أن تتكون مجموعة بيانات التدريب فقط من صور عالية الجودة ومتنوعة وذات صلة، مما يؤدي في النهاية إلى تحسين أداء وفعالية نموذج الاكتشاف.
كشف الماشية
في السنوات الأخيرة، حظيت تقنية اكتشاف الأجسام باهتمام كبير في مجال البحث، ويرجع ذلك أساسًا إلى التقدم الذي أحرزته خوارزميات التعلم الآلي والتعلم العميق. يتضمن اكتشاف الأجسام تحديد مواقع وتصنيف الأجسام ذات الأهمية بدقة داخل الصور أو مقاطع الفيديو. لتحقيق ذلك، يتم تحديد مواقع وحدود الأجسام ووضع علامات عليها وفقًا لذلك. حاليًا، يمكن تصنيف طرق اكتشاف الأجسام المتطورة بشكل عام إلى نوعين رئيسيين: طرق المرحلة الواحدة وطرق المرحلتين. تعطي طرق المرحلة الواحدة الأولوية لسرعة وكفاءة النموذج، مما يجعلها مناسبة تمامًا للتطبيقات في الوقت الحقيقي. تشمل بعض طرق المرحلة الواحدة البارزة كاشف الصندوق المتعدد للطلقة الواحدة (SSD).
تم تطوير Detectron2 بواسطة فيسبوك، وهو مكتبة رؤية متقدمة مصممة لتبسيط إنشاء واستخدام نماذج اكتشاف الكائنات، وتقسيم الكائنات، واكتشاف النقاط الرئيسية، وتقسيم عام. بشكل خاص، بالنسبة لاكتشاف الكائنات، تقدم مكتبة Detectron2 مجموعة متنوعة من النماذج، بما في ذلك RCNN وMask R-CNN وFaster R-CNN. يقوم RCNN بإنشاء مقترحات المناطق، واستخراج ميزات ثابتة الطول من كل منطقة مرشحة، وأداء تصنيف الكائنات. ومع ذلك، يمكن أن تكون هذه العملية بطيئة بسبب مرور CNN المستقل على كل منطقة اهتمام (ROI). تتغلب بنية Faster R-CNN على هذه القيود من خلال دمج شبكة مقترحات المناطق (RPN) ومراحل كاشف Fast R-CNN. إنها تحصل على تسميات الفئات وصناديق الحدود
للكائنات بشكل فعال. تشترك Mask R-CNN في نفس المرحلتين مثل Faster R-CNN، وتوسع قدراتها من خلال توليد تسميات الفئات وصناديق الحدود والأقنعة للكائنات. من الجدير بالذكر أن Mask R-CNN تظهر دقة أعلى في اكتشاف الماشية، كما تشير الأبحاث السابقة. لذلك، يعتمد النظام المقترح على Mask R-CNN لاستخراج ميزات القناع خصيصًا للماشية، كما هو موضح في الشكل 7. خلال مرحلة الكشف، يتم استخدام المتنبئ الافتراضي، COCO-Instance Segmentation، وMask R-CNN مع قيمة عتبة 0.7 (MODEL. ROI_HEADS.SCORE_THRESH_TEST). تستخدم عملية التدريب صورًا موضوعة، بينما يتم إدخال مقاطع الفيديو في Detectron2 للحصول على صور قناع ملون وصور قناع ثنائي ونتائج الكشف بما في ذلك صناديق الحدود، وقيمة القناع لمنطقة الماشية، ودرجة ثقة الماشية. يتم استخدام صورة القناع بعد ذلك في حسابات اكتشاف الماشية. بشكل عام، من خلال الاستفادة من قدرات Mask R-CNN من Detectron2، يهدف النظام المقترح إلى تحقيق اكتشاف دقيق وفعال للماشية، مما يوفر رؤى قيمة لمراقبة صحة الماشية وإدارتها.
للكائنات بشكل فعال. تشترك Mask R-CNN في نفس المرحلتين مثل Faster R-CNN، وتوسع قدراتها من خلال توليد تسميات الفئات وصناديق الحدود والأقنعة للكائنات. من الجدير بالذكر أن Mask R-CNN تظهر دقة أعلى في اكتشاف الماشية، كما تشير الأبحاث السابقة. لذلك، يعتمد النظام المقترح على Mask R-CNN لاستخراج ميزات القناع خصيصًا للماشية، كما هو موضح في الشكل 7. خلال مرحلة الكشف، يتم استخدام المتنبئ الافتراضي، COCO-Instance Segmentation، وMask R-CNN مع قيمة عتبة 0.7 (MODEL. ROI_HEADS.SCORE_THRESH_TEST). تستخدم عملية التدريب صورًا موضوعة، بينما يتم إدخال مقاطع الفيديو في Detectron2 للحصول على صور قناع ملون وصور قناع ثنائي ونتائج الكشف بما في ذلك صناديق الحدود، وقيمة القناع لمنطقة الماشية، ودرجة ثقة الماشية. يتم استخدام صورة القناع بعد ذلك في حسابات اكتشاف الماشية. بشكل عام، من خلال الاستفادة من قدرات Mask R-CNN من Detectron2، يهدف النظام المقترح إلى تحقيق اكتشاف دقيق وفعال للماشية، مما يوفر رؤى قيمة لمراقبة صحة الماشية وإدارتها.
Ultralytics YOLOv8 هو نموذج قوي ومتعدد الاستخدامات لاكتشاف الكائنات وتقسيم الكائنات مصمم ليكون سريعًا ودقيقًا وسهل الاستخدام. يبني على نجاح إصدارات YOLO السابقة ويقدم ميزات جديدة وتحسينات لتعزيز الأداء والمرونة. ينطبق على مجموعة واسعة من المهام، بما في ذلك اكتشاف الكائنات، والتتبع، وتقسيم الكائنات، وتصنيف الصور، وتقدير الوضع. هناك خمسة نماذج مدربة مسبقًا بأحجام مختلفة متاحة لتقسيم الكائنات: yolov8n (Nano)، yolov8s (Small)، yolov8m (Medium)، yolov81 (Large)، وyolov8x (Extra Large). يذهب تقسيم الكائنات خطوة أبعد من اكتشاف الكائنات من خلال تحديد الكائنات الفردية في الصورة وتقسيمها عن بقية الصورة. يعد تقسيم الكائنات مفيدًا عندما تحتاج إلى معرفة ليس فقط مكان الكائنات في الصورة، ولكن أيضًا ما هو شكلها الدقيق. في هذا البحث، نستخدم نموذج YOLOv8x-seg لاكتشاف وتقسيم الماشية. على عكس الطرق التقليدية، لا نعتمد على التوصيف اليدوي أو التدريب المخصص المحدد للماشية. بدلاً من ذلك، يتم تطبيق YOLOv8x-seg مباشرة على مهمة اكتشاف الماشية، مستفيدًا من قدراته المتقدمة وميزاته المدربة مسبقًا. تتيح لنا هذه الطريقة، كما هو موضح في الشكل 8، تحقيق اكتشاف دقيق وفعال للماشية دون الحاجة إلى عمليات توصيف كثيفة العمالة أو تدريب متخصص. من خلال الاستفادة من قدرات التقسيم القوية لـ YOLOv8x-seg، يمكننا تحديد وتحديد مناطق الماشية في الصور أو مقاطع الفيديو بشكل فعال، مما يساهم في النجاح العام للدراسة.
تتبع الماشية
في هذه الدراسة، يتطلب حركة الماشية عبر الممرات الفردية تتبعًا دقيقًا لكل فرد لتمكين حساب العرج بدقة. إن ضمان تحديد الماشية بدقة وتخزينها هو أمر بالغ الأهمية. تتضمن بساطة مجموعة البيانات عبور ماشية واحدة أو اثنتين فقط عبر الممرات. يستخدم النظام منطقة اهتمام محددة، محددة بالخطوط في الشكل 9، متوافقة مع إعدادات الكاميرا. تتضمن عملية التتبع خطين أحمرين متقاطعين عموديًا داخل الإطار. يمثل الخط الأيسر العتبة اليسرى، ويعمل الخط الأيمن المقابل كعتبة يمينية. لقد حقق دمج رؤية الكمبيوتر، والتعلم الآلي، والتعلم العميق في السنوات الأخيرة تقدمًا ملحوظًا في خوارزميات التتبع، مما أدى إلى تحسينات كبيرة في الدقة.

الشكل 7. بنية لاكتشاف الماشية باستخدام Detectron2: خط أنابيب تدريب مخصص لمجموعة البيانات الخاصة بنا.

الشكل 8. بنية لاكتشاف الماشية باستخدام نموذج YOLOv8 الأساسي.
الشكل 9. منطق تتبع الماشية (صندوق الحدود:
Input: Bounding Boxes of detected cattle region from Detectron2-Detection
Output: Local ID for each detected cattle region
    For each bounding box:
    Calculate the aspect ratio of bounding box ( $a_{text {bbox }}$ ) the following formula:
        $a mathrm{bbox}=frac{w}{h}$
    If $a_{mathrm{bbox}} geq$ Tha $a_{mathrm{a}}$ then,
        If $x_{1} leq T h a_{text {left }}$ then,
            Assign New ID
            Assign MAX_LIFE to Lifetime ${ }_{mathrm{ID}}$
        else then:
            If $x_{1} geq T h a_{text {left }}$ and $x_{2} leq T h a_{text {right }}$ then:
                $I o U=frac{text { Area of Overlap }}{text { Area of Union }}$
                If $I o Uleft(mathrm{f}_{mathrm{t}-1}, mathrm{f}_{mathrm{t}}right)>0.6$ then:
                    Assign $operatorname{ID}left(mathrm{f}_{mathrm{t}}right)=operatorname{ID}left(mathrm{f}_{mathrm{t}-1}right)$
                    Assign MAX_LIFE to Lifetime ${ }_{mathrm{ID}}$
                else then:
                    Move to next frame: $mathrm{f}_{mathrm{t}}=mathrm{f}_{mathrm{t}+1}$
            else then:
                If $x_{2} geq$ Tha ${ }_{text {right }}$ then:
                    Remove ID
                else then:
                    Update Lifetime $_{text {ID }}$
                    If Lifetime ${ }_{text {ID }} leq$ MIN_LIFE then:
                        Remove ID
                    else then:
                        Move to next frame: $mathrm{f}_{mathrm{t}}=mathrm{f}_{mathrm{t}+1}$
الخوارزمية 1 خوارزمية تتبع مخصصة (CTA).
في سعيها لتحقيق فعالية من حيث التكلفة وكفاءة الوقت، استخدمت الدراسة حسابات التقاطع على الاتحاد (IoU) للتتبع، مدعومة بدمج أعمار معرفات فردية. تعزز هذه الاستراتيجية،
في سعيها لتحقيق فعالية من حيث التكلفة وكفاءة الوقت، استخدمت الدراسة حسابات التقاطع على الاتحاد (IoU) للتتبع، مدعومة بدمج أعمار معرفات فردية. تعزز هذه الاستراتيجية،

الشكل 10. مخطط تدفق عملية تتبع الماشية الآلي.
| الرموز | الوصف |
|
|
الإطار الحالي |
|
|
نسبة عرض صندوق الحدود |
| ثا
|
عتبة نسبة العرض |
|
|
عتبة الحدود اليسرى |
|
|
عتبة الحدود اليمنى |
| معرف(
|
معرف الإطار الحالي |
| MAX_LIFE | أقصى عمر لوقت الاحتفاظ بالإطار |
| MIN_LIFE | أدنى عمر لوقت الاحتفاظ بالإطار |
| العمر
|
عمر المعرف |
الجدول 2. تعريفات المتغيرات الرئيسية لتحليل تتبع الماشية.
الشكل 10، يتناول تحديات مثل الكشف المفقود وغيرها من تعقيدات الكشف. ويشرح الجدول 2 استخدام المتغيرات في مخطط تدفق التتبع. تقف هذه الطريقة في تناقض مع خوارزميات تتبع الماشية التقليدية، حيث تقدم بساطة وسهولة في المعالجة ووقت استنتاج minimal. يبدأ التتبع عندما يسبق موقع الماشية العتبة اليسرى وينتهي عند تجاوز الجانب الأيمن من صندوق حدود الماشية العتبة اليمنى. ضمن هذه المرحلة من التتبع، يتم تعيين معرف محلي للماشية قبل عبور العتبة اليسرى، مع تخزين معرف المحلي الناتج في قاعدة البيانات الزمنية. تضمن هذه الطريقة الدقيقة في التتبع الدقة والكفاءة، مما يساهم في أهداف المراقبة والتحليل الشاملة للدراسة.
الخوارزمية المقدمة 1 توضح نهجًا شاملاً لتعيين معرفات محلية لمناطق الماشية المكتشفة بناءً على الصناديق المحيطة التي تم الحصول عليها من عملية الكشف باستخدام Detectron2. تركز الخوارزمية على تتبع دقيق وموثوق للأفراد من الماشية أثناء مرورهم عبر الممرات. تبدأ بحساب نسبة العرض إلى الارتفاع لكل صندوق محيط، وتطبق الخوارزمية شروطًا محددة لتحديد التعيين المناسب لمعرفات محلية. تأخذ في الاعتبار عوامل مثل موقع الصناديق المحيطة بالنسبة للعتبات المحددة وتستخدم تقنيات مثل حسابات التقاطع على الاتحاد (IoU) لضمان الاتساق في عملية التتبع. علاوة على ذلك، تقدم الخوارزمية مفهوم العمر الافتراضي (LifetimeID) لكل معرف معين، مما يسمح بإدارة محسنة لتتبع الماشية.
من خلال دمج هذه الاستراتيجيات، تسهم الخوارزمية في تعزيز دقة وفعالية تتبع الماشية، مما يمكّن من مراقبة سلوك وصحة الماشية في سياقات مختلفة. يتم إدارة المعرف المحلي المرتبط بمعلومات تتبع الماشية بشكل منهجي لضمان سجلات دقيقة ومحدثة. تتضمن هذه العملية إزالة المعرف المحلي من قاعدة البيانات في ظل ظروف معينة. على وجه التحديد، عندما يتماشى الموقع الأفقي (
عند انتهاء عملية التتبع، يتم تنظيم الماشية بشكل منهجي بناءً على معرفات الماشية الفريدة الخاصة بها، مما ينشئ مجلدات متميزة كما هو موضح في الشكل 11. يحتوي كل من هذه المجلدات على مجموعة من الصور الأساسية والأقنعة الثنائية. تشمل هذه الصور الثنائية التي تبرز تحديد الماشية، وصور الأقنعة الملونة التي تبرز ميزات معينة، والأقنعة الثنائية الأصلية التي تلتقط الخصائص الخام، والصور الأصلية غير المعدلة للماشية. تضمن هذه التنظيم الدقيق أن تكون بيانات كل ماشية متاحة بسهولة.

الشكل 11. ملخص تتبع الماشية: المعرفات المحلية والنتائج المرتبطة.
والمحافظة عليها، مما يسهم في التحليل الفعال واسترجاع المعلومات ذات الصلة لمزيد من البحث والفحص.
استخراج الميزات
تم التقاط تسلسل من الإطارات
لعبت هذه الأقنعة الثنائية دورًا محوريًا في استخراج الميزات ذات الصلة لعملية تصنيف العرج اللاحقة. يقدم الشكل 11 تمثيلًا بصريًا لصور الأقنعة الثنائية النموذجية، كل منها مرتبط بدرجات عرج مختلفة. تكمن السمة المميزة في شكل ظهر الماشية. بينما تظهر الماشية الطبيعية هيكل ظهر مسطح، تظهر الماشية العرجاء درجات متفاوتة من الظهر المقوس، تتراوح من خفيفة إلى مقوسة بشكل بارز. لاستخراج ميزات ذات مغزى، تم إخضاع تسلسل فيديو القناع الثنائي في البداية لعملية تسمية لتحديد مناطق الماشية. من هذه الصور الثنائية، تم استخراج ميزتين رئيسيتين
وفقًا للورقة
في هذه الدراسة، حددنا بعناية ثلاث نقاط محددة على انحناء ظهر الماشية داخل الصورة الثنائية المقصوصة. تم تعيين هذه النقاط كما يلي: النقطة 1 (P1): تقع عند

الشكل 12. تقسيم الماشية في الإطارات المتتالية لاستخراج الميزات (

الشكل 13. استخراج الميزات: (أ) الميزة
يسهل هذا التوزيع التحليلات المستهدفة والاستخراج الدقيق للميزات ضمن الدراسة. لا تأخذ هذه الطريقة المبتكرة في الاعتبار فقط التوزيع المكاني لهذه النقاط، ولكن أيضًا التدرجات التي تميز الانتقالات بين هذه النقاط. من المتوقع أن يوفر هذا النهج الشامل رؤى أكثر دقة حول انحناء الماشية، مما يسهم في فهم أكثر دقة لتشريح الماشية.
تصنيف عرج الماشية
في مرحلة تصنيف العرج، حيث يحتاج النظام إلى مجموعة بيانات صحيحة كحقيقة أرضية، قمنا بتكليف مجموعة من خبراء الماشية لفحص جميع الماشية من المزرعة يدويًا وتخزين الهوية العالمية ومستوى العرج الخاص بهم مرتبين حسب الإطار الزمني الذي يمرون من خلاله في الممر المحدد. يقوم خبراء الماشية بفحص مستوى عرج الماشية للتواريخ التالية كما هو موضح في الجدول 3.
طرق تقييم الأداء
| مستوى العرج | لام 1 | لام 2 | لام 3 | لام 4 |
| عدد الماشية | 84 | ٢٤ | ٧ | 1 |
الجدول 3. عدد الماشية في كل مستوى من مستويات العرج.
أين
إعلانات الأخلاق
تم إعفاء الدراسة من المراجعة والموافقة الأخلاقية، نظرًا لعدم وجود قيود مفروضة أو غير مريحة على الحيوانات خلال فترة الدراسة. تم جمع بيانات الصور لعملية الولادة المستخدمة في التحليل في هذه الدراسة بواسطة كاميرا مثبتة دون إزعاج سلوك الولادة الطبيعي للحيوانات وإدارة المزرعة الروتينية.
النتائج التجريبية
في مجال رؤية الكمبيوتر وتعلم الآلة، تم استخدام بايثون بشكل أساسي كلغة برمجة؛ تم استخدام إطار عمل PyTorch لبناء مكونات التعلم العميق، بما في ذلك تقسيم الكائنات لـ Detectron2؛ تم استخدام Scikit-learn لتصنيف العرج لمختلف المصنفات التي تم استخدامها لتنفيذ البيانات. بالإضافة إلى ذلك، تم تنفيذ مهام معالجة البيانات باستخدام OpenCV، بينما تم إجراء تحليل البيانات والتصور باستخدام NumPy وPandas وMatplotlib. تغطي هذه الدراسة اكتشاف الماشية، والتتبع، وتصنيف العرج كعمليات منفصلة، ويتم حساب مقاييس الأداء والنتائج كما يلي.
كشف الماشية
خلال مرحلة اكتشاف الماشية، استخدم نظامنا مجموعة بيانات توضيحية تم إنشاؤها أثناء مرور الماشية عبر الممر وفقًا لعملية إنتاج الحليب، التي تحدث مرتين يوميًا لكل ماشية. لتسهيل تدريب اكتشاف الماشية، اخترنا بشكل محدد ثلاثة أيام مختلفة من مجموعة البيانات المقدمة في الجدول 1. من إجمالي مجموعة البيانات، قمنا باستخراج 3176 صورة بشكل عشوائي.
في عملية التقييم لدينا، نقوم بتقييم أداء نموذج الكشف باستخدام ثلاثة أنواع رئيسية من قيم الدقة المتوسطة (AP)، وهي AP وAP50 وAP75، كما هو موضح في الجدول 5. توفر هذه المقاييس رؤى حول دقة كل من توقعات الصندوق والقناع. لضمان تقييم شامل، نقوم بحساب الدقة المتوسطة عبر جميع عتبات تقاطع الاتحاد (IoU) (AP). بالإضافة إلى ذلك، نركز على قيم AP عند عتبات IoU تبلغ 0.5 (AP50) و0.75 (AP75)، ملتزمين بمعيار COCO. توفر هذه المقاييس فهماً قوياً لقدرة النموذج على التنبؤ بدقة بحالات الماشية، مع مراعاة مستويات مختلفة من الدقة وعتبات IoU. في الجدول 6، يتم تقديم دقة نتائج الكشف الاختباري لكل من بيانات الصباح والمساء التي تمتد من يناير. تكشف النتائج الاختبارية المجمعة عن دقة عامة جديرة بالثناء من
يمكن أن تقدم سيناريوهات الكشف عن الماشية في العالم الحقيقي تحديات، خاصة في البيئات ذات الإضاءة المنخفضة. ومن بين هذه التحديات هو عندما تكون الماشية متقاربة، مما يؤدي إلى تداخل الحالات. القياسية
| #صور (100%) | #صور التدريب (80%) | #صور التحقق (20%) |
| 5458 | ٤٣٦٦ | ١٠٩٢ |
الجدول 4. صور التدريب والتحقق للكشف.
| صندوق
|
صندوق
|
صندوق
|
قناع
|
قناع
|
قناع
|
| 94.31 | 99.53 | 99.534 | ٨٧.٧٥ | 99.53 | 99.53 |
الجدول 5. التقييم المقارن لأداء اكتشاف الماشية على مجموعة بيانات التحقق باستخدام مقاييس الدقة المتوسطة (AP) لصناديق الحدود (BOX) وأقنعة التجزئة (Mask).
| تاريخ | #الحالات | #الحالات الصحيحة (TP) | #الحالات غير الصحيحة (FP) | #حالات مفقودة (FN) | استرجاع (%) | الدقة (%) | الدقة (%) |
| 3 يناير 2023 (م) | 9247 | 8855 | ٣٩٢ | 0 | 100.00 | 95.76 | 95.76 |
| 3 يناير 2023 (هـ) | ٨٠٧٥ | ٨٠٠٠ | 75 | 0 | 100.00 | 99.07 | 99.07 |
| 5 يناير 2023 (م) | ١٣,٦٣١ | 13,552 | ٥٦ | 23 | 99.83 | 99.59 | 99.59 |
| 5 يناير 2023 (هـ) | 8563 | 8511 | ٣٥ | 17 | 99.80 | 99.59 | 99.59 |
| 6 يناير 2023 (م) | 5059 | 4982 | 77 | 0 | 100.00 | ٩٨.٤٨ | ٩٨.٤٨ |
| 7 يناير 2023 (م) | 5106 | 5106 | 0 | 0 | 100.00 | 100.00 | 100.00 |
| 10 يناير 2023 (م) | 10,418 | ١٠٠٩٧ | ٣٢١ | 0 | 100.00 | ٩٦.٩٢ | ٩٦.٩٢ |
| 10 يناير 2023 (هـ) | 10,302 | 10,228 | 74 | 0 | 100.00 | 99.28 | 99.28 |
| 11 يناير 2023 (م) | ٤٤٧٦ | ٤٤٠٨ | 68 | 0 | 100.00 | ٩٨.٤٨ | ٩٨.٤٨ |
| 11 يناير 2023 (هـ) | 6781 | 6770 | 11 | 0 | 100.00 | 99.84 | 99.84 |
| 12 يناير 2023 (م) | 5422 | 5405 | 17 | 0 | 100.00 | 99.69 | 99.69 |
| 12 يناير 2023 (هـ) | 10,852 | 10,814 | ٣٨ | 0 | 100.00 | 99.65 | 99.65 |
| 13 يناير 2023 (م) | 9170 | 9001 | 169 | 0 | 100.00 | 98.16 | 98.16 |
| 13 يناير 2023 (هـ) | 15,368 | 14,797 | 571 | 0 | 100.00 | ٩٦.٢٨ | ٩٦.٢٨ |
| 14 يناير 2023 (م) | 6074 | 6012 | 62 | 0 | 100.00 | 98.98 | 98.98 |
| 23 يناير 2023 (م) | 6668 | 6611 | ٥٧ | 0 | 100.00 | 99.15 | 99.15 |
| 23 يناير 2023 (هـ) | 11,911 | 11,867 | ٤٤ | 0 | 100.00 | 99.63 | 99.63 |
| 24 يناير 2023 (م) | 12,546 | 12,450 | 96 | 0 | 100.00 | 99.23 | 99.23 |
| 24 يناير 2023 (هـ) | 11,138 | ١٠,٩٩٦ | 142 | 0 | 100.00 | ٩٨.٧٣ | ٩٨.٧٣ |
| 25 يناير 2023 (م) | 7624 | 7587 | 37 | 0 | 100.00 | 99.51 | 99.51 |
| 25 يناير 2023 (هـ) | 7972 | 7940 | ٣٢ | 0 | 100.00 | 99.60 | 99.60 |
| 26 يناير 2023 (م) | 6031 | 5963 | 68 | 0 | 100.00 | ٩٨.٨٧ | ٩٨.٨٧ |
| 26 يناير 2023 (هـ) | 8967 | 8942 | ٢٥ | 0 | 100.00 | 99.72 | 99.72 |
| 27 يناير 2023 (م) | 11,064 | 11,032 | 32 | 0 | 100.00 | 99.71 | 99.71 |
| 27 يناير 2023 (هـ) | 1870 | 1864 | ٦ | 0 | 100.00 | 99.68 | 99.68 |
| 28 يناير 2023 (م) | 15,619 | 15,422 | ١٩٧ | 0 | 100.00 | ٩٨.٧٤ | ٩٨.٧٤ |
| 29 يناير 2023 (م) | 8168 | 8168 | 0 | 0 | 100.00 | 100.00 | 100.00 |
| 29 يناير 2023 (هـ) | 9128 | 9065 | 63 | 0 | 100.00 | 99.31 | 99.31 |
الجدول 6. مقاييس التقييم على مجموعة بيانات يناير لاكتشاف الماشية باستخدام Detectron2
قد تواجه خوارزميات التقسيم صعوبة في التمييز بين الماشية الفردية في هذه السيناريوهات، مما يؤدي إلى منطقة مدمجة واحدة بدلاً من منطقتين متميزتين كما هو موضح في الشكل 14أ، ب. يمكن أن تؤدي هذه المنطقة المدمجة إلى خطأين محتملين، مثل أن النظام قد يفسر المنطقة المدمجة على أنها ماشية كبيرة بشكل غير طبيعي، مما يؤدي إلى اكتشاف غير صحيح للعرج، وإذا كانت عرض المنطقة المدمجة أقل من حد الحجم الأدنى المحدد للماشية الفردية، فقد يتم استبعادها تمامًا. سيؤدي ذلك إلى تفويت اكتشافات الماشية الفردية وحالات العرج المحتملة. لمعالجة تحدي تداخل الماشية وتحسين دقة

الشكل 14. نتيجة تقسيم كشف الماشية (أ) مناطق مميزة (ب) منطقة متداخلة.
نظام، نحن نستفيد من مفهوم الحد الأدنى والحد الأقصى لعرض مناطق الماشية. نقوم بتحديد قيم الحد الأدنى والحد الأقصى بناءً على تحليل سابق لأبعاد الماشية ضمن مجموعة بيانات التدريب لدينا (الموصوفة في الجدول 1). يتيح لنا هذا التحليل تحديد أحجام الماشية الواقعية ضمن السلالة والبيئة المحددة التي تمثلها مجموعة البيانات. بعد مرحلة الكشف الأولية عن مناطق الماشية، يتم تحليل عرض كل منطقة تم الكشف عنها. يتمdiscard مناطق الماشية التي تتجاوز عتبة الحد الأقصى للعرض كأخطاء محتملة ناتجة عن تداخل الماشية. هذا يقضي على مناطق الماشية الكبيرة بشكل غير واقعي، المدمجة التي من المحتمل أن تمثل عدة ماشية.
قمنا بتقييم مكون اكتشاف الماشية في نظامنا باستخدام بيانات من مزرعة أخرى، “سومييوشي.” يُظهر هذا الاختبار عبر مزارع مختلفة قدرة النظام على التعامل مع التباينات في مظهر الماشية وبيئة المزرعة. تُظهر الشكل 15a نتائج اكتشاف الماشية على مزرعتنا، بينما يبرز الشكل 15b النتائج على مجموعة بيانات من مزرعة “سومييوشي”، مما يُظهر قابلية تعميم النظام على التباينات غير المرئية. يُبرز هذا المستوى العالي من الدقة فعالية وموثوقية قدرات الكشف في النظام عبر حالات وأطر زمنية مختلفة. عند مقارنة تقييم أداء خوارزمية اكتشاف الماشية الرئيسية لدينا مع نموذج الكشف عن الكائنات في الوقت الحقيقي الأكثر شعبية حاليًا ونموذج تقسيم الصور YOLOv8 في الجدول 7 باستخدام مجموعة بيانات مساء 14 مارس 2023، وجدنا أن YOLOv8 حقق دقة أعلى من
لذلك، نوصي باستخدام خوارزمية الكشف الرئيسية لدينا، detectron2، حيث إنها تزيل المناطق البشرية التي تم اكتشافها بشكل خاطئ من خلال حساب مساحة الكائن المكتشف ومقارنتها بعتبة ثابتة. تظهر بعض نتائج الكشف في الشكل 16. يتم وصف الكشف باستخدام detectron2 في الشكل 16a، بينما يتم تصوير الكشف باستخدام YOLOv8x في الشكل 16b.
الشكل 15. نتيجة اكتشاف الماشية من مزارع متعددة (أ) مجموعة بيانات من هوكورين كونيبّو (ب) مجموعة بيانات من سومييوشي.
| نموذج | #الحالات | #صحيح (TP) | #خطأ (FP) | (TN) | (FN) | استرجاع (%) | الدقة (%) | الدقة (%) |
| YOLOv8x | 15,305 | 15,224 | 12 | 0 | 69 | 99.92 | 99.55 | 99.92 |
| ديتكتورون2 | 15,305 | ١٤٤٦٦ | 839 | 0 | 0 | 94.52 | 100.00 | 94.52 |
الجدول 7. مقارنة تقييم الأداء بين YOLOv8x و Detectron2

الشكل 16. نتيجة اكتشاف الماشية (أ) باستخدام Detectron2 (ب) باستخدام YOLOv8.
تتبع الماشية
كانت عملية التتبع تقنية متطورة تستفيد من صناديق الحدود، التي تم إنشاؤها خلال مرحلة الكشف. كانت هذه المرحلة ذات أهمية قصوى لأنها تتعلق بفصل الماشية بناءً على معرفها المحلي المميز، وهي عملية موضحة بوضوح في الشكل 10. بمجرد الانتهاء من ذلك، يتم الحفاظ على كل إطار بدقة وتخزينه في مجلد منفصل، وهي خطوة حاسمة لحسابات العرج المستقبلية، كما هو موضح في الشكل 11. يوفر الجدول 8 تحليلًا متعمقًا لنتائج تتبع الماشية للبيانات الشاملة التي تم تجميعها في شهر يناير. خوارزمية التتبع المخصصة لدينا
| تاريخ | #المواشي | #صحيح (TP) | #خطأ (FP) | الدقة (%) |
| 3 يناير 2023 (م) | 62 | 62 | 0 | 100.00 |
| 3 يناير 2023 (هـ) | ٥٦ | ٥٦ | 0 | 100.00 |
| 5 يناير 2023 (م) | 64 | 63 | 1 | ٩٨.٤٤ |
| 5 يناير 2023 (هـ) | 65 | 64 | 1 | ٩٨.٤٦ |
| 6 يناير 2023 (م) | 64 | 64 | 0 | 100.00 |
| 7 يناير 2023 (م) | 42 | 41 | 1 | 97.62 |
| 10 يناير 2023 (م) | ٥٦ | ٥٥ | 1 | 98.21 |
| 10 يناير 2023 (هـ) | ٥٦ | ٥٦ | 0 | 100.00 |
| 11 يناير 2023 (م) | ٥٦ | ٥٦ | 0 | 100.00 |
| 11 يناير 2023 (هـ) | 63 | 63 | 0 | 100.00 |
| 12 يناير 2023 (م) | ٥٦ | ٥٦ | 0 | 100.00 |
| 12 يناير 2023 (هـ) | ٥٨ | ٥٧ | 1 | ٩٨.٢٨ |
| 13 يناير 2023 (م) | 66 | 65 | 1 | ٩٨.٤٨ |
| 13 يناير 2023 (هـ) | ٥٤ | 54 | 0 | 100.00 |
| 14 يناير 2023 (م) | 64 | 64 | 0 | 100.00 |
| 23 يناير 2023 (م) | 63 | 63 | 0 | 100.00 |
| 23 يناير 2023 (هـ) | 64 | 64 | 0 | 100.00 |
| 24 يناير 2023 (م) | ٥٥ | ٥٤ | 1 | ٩٨.١٨ |
| 24 يناير 2023 (هـ) | ٥٦ | ٥٦ | 0 | 100.00 |
| 25 يناير 2023 (م) | ٥٨ | ٥٨ | 0 | 100.00 |
| 25 يناير 2023 (هـ) | ٥٨ | ٥٨ | 0 | 100.00 |
| 26 يناير 2023 (م) | 52 | 52 | 0 | 100.00 |
| 26 يناير 2023 (هـ) | 62 | 62 | 0 | 100.00 |
| 27 يناير 2023 (م) | 27 | 27 | 0 | 100.00 |
| 27 يناير 2023 (هـ) | 62 | 62 | 0 | 100.00 |
| 28 يناير 2023 (م) | 41 | 41 | 0 | 100.00 |
| 29 يناير 2023 (م) | 62 | 61 | 1 | ٩٨.٣٨ |
| 29 يناير 2023 (هـ) | 62 | 62 | 0 | 100.00 |
الجدول 8. مقاييس التقييم على مجموعة بيانات يناير لتتبع الماشية باستخدام خوارزمية تتبع مخصصة
(CTA) يظهر كحل فعال للغاية، حيث يوفر بديلاً جذابًا عن خوارزميات التتبع الشائعة الأخرى من حيث وقت التشغيل والتعقيد. تم توضيح تفاصيل عمل هذه الخوارزمية في الخوارزمية 1. لقد قمنا بتحسين CTA لمعالجة والتغلب على التحديات المختلفة المرتبطة بالتتبع بشكل فعال. نتائج هذه الجهود واضحة في أدائه، حيث حقق معدل دقة ملحوظ قدره
استخراج الميزات
تُربط بيانات الحقيقة الأرضية، التي تم جمعها من تقييمات المزرعة بواسطة خبير في العرج، مستوى عرج كل بقرة بمعرف علامة الأذن الفريد لها. تُستخدم هذه البيانات كمعيار لتقييم أداء النموذج المقترح. يوضح الجدول 9 توزيع مستويات العرج داخل سكان الماشية. كما هو موضح، تم تصنيف 84 بقرة على أنها من المستوى 1 (بدون عرج)، بينما تمثل المستويات 2 و 3 مراحل العرج المبكر. ومن الجدير بالذكر أن نظامنا حدد بقرة واحدة فقط تظهر عرج المستوى 4. لقد استخرجنا أربع ميزات.
اختيار وتقييم الميزات المعلوماتية يمثل تحديًا كبيرًا لنظامنا المقترح. يتم تقييم كل ميزة مستخرجة من مجموعة البيانات (الجدول 10) باستخدام مصنف آلة الدعم الشعاعي (SVM). يتم تقديم نتائج تصنيف مجموعة التدريب في الشكل 17a-d. كما لوحظ، تظهر كل ميزة فردية مستوى معين من الفعالية في تصنيف العرج. ومن الجدير بالذكر أن الشكل 17e يوضح أن دمج جميع الميزات في متجه ميزة يؤدي إلى أداء أفضل مقارنة باستخدام الميزات الفردية. يتم التحقق من صحة هذا النهج المدمج للميزات بشكل أكبر على مجموعة البيانات الاختبارية باستخدام مصنف SVM، كما هو موضح في الشكل 18a-d للميزات الفردية والشكل 18e لمتجه الميزات المدمج. تؤكد النتائج أن استخدام جميع الميزات بشكل جماعي يؤدي إلى عملية تصنيف أكثر كفاءة مقارنة بالاعتماد على الميزات الفردية. بناءً على
| مستوى العرج | لام 1 | لام 2 | لام 3 | لام 4 |
| عدد الماشية | 84 | ٢٤ | ٧ | 1 |
الجدول 9. الحقيقة الأرضية لمستوى العرج.
| #إجمالي الصور | #صور التدريب | #اختبار الصور |
| ١٠٣١ | 690 | ٣٤١ |
الجدول 10. صور التدريب والاختبار لاستخراج الميزات.

الشكل 17. نتائج التدريب باستخدام SVM مع مجموعات ميزات مختلفة (أ) الميزة 1 (ب) الميزة 2 (ج) الميزة 3 (د) الميزة 4 (هـ) من خلال دمج جميع الميزات الأربع
الشكل 18. نتائج الاختبار باستخدام SVM مع مجموعات ميزات مختلفة (أ) الميزة 1 (ب) الميزة 2 (ج) الميزة 3 (د) الميزة 4 (هـ) من خلال دمج جميع الميزات الأربع
| تاريخ | SVM | RF | دي تي | أدا بوست | دولار سنغافوري |
| 3 يناير 2023 (م) | 75.81 | 67.74 | 70.97 | 80.65 | ٤٥.١٦ |
| 3 يناير 2023 (هـ) | 78.57 | ٧٦.٧٩ | 78.57 | 82.14 | ٥١.٧٩ |
| 5 يناير 2023 (م) | 71.88 | 71.88 | 60.94 | 73.44 | 42.19 |
| 5 يناير 2023 (هـ) | 78.46 | 81.54 | ٨٣.٠٨ | 81.54 | ٤١.٥٤ |
| 6 يناير 2023 (م) | 78.12 | 68.75 | ٧٦.٥٦ | 73.44 | ٤٠.٦٢ |
| 7 يناير 2023 (م) | 71.43 | 69.05 | ٥٩.٥٢ | 69.05 | 42.86 |
| 10 يناير 2023 (م) | ٨٣.٩٣ | 78.57 | ٨٥.٧١ | 80.36 | 50.00 |
| 10 يناير 2023 (هـ) | 80.36 | 71.43 | 75.00 | 78.57 | ٥١.٧٩ |
| 11 يناير 2023 (م) | 69.64 | 67.86 | ٧٦.٧٩ | 75.00 | 44.64 |
| 11 يناير 2023 (هـ) | 71.43 | 73.21 | 71.43 | ٧٦.٧٩ | ٥١.٧٩ |
| 12 يناير 2023 (م) | 71.43 | ٧٩.٣٧ | ٧٩.٣٧ | ٧٩.٣٧ | ٤٦.٠٣ |
| 12 يناير 2023 (هـ) | 80.36 | 80.36 | 78.57 | 80.36 | ٥١.٧٩ |
| 23 يناير 2023 (م) | 71.43 | ٧٦.١٩ | 80.95 | 80.95 | 50.79 |
| 23 يناير 2023 (هـ) | 75.00 | 78.12 | ٧٦.٥٦ | 75.00 | 50.00 |
| 24 يناير 2023 (م) | ٧١.٧ | 73.58 | ٧٧.٣٦ | ٧٧.٣٦ | ٥٦.٦٠ |
| 24 يناير 2023 (هـ) | 67.86 | 73.21 | 67.86 | 73.21 | ٥٨.٩٣ |
| 25 يناير 2023 (م) | 73.21 | 71.43 | ٧٦.٧٩ | 78.57 | ٣٥.٧١ |
| 25 يناير 2023 (هـ) | 81.36 | 81.36 | ٧٦.٢٧ | 79.66 | ٤٧.٤٦ |
| 26 يناير 2023 (هـ) | ٧٦.٩٢ | 82.69 | 78.85 | 84.62 | ٥١.٩٢ |
الجدول 11. تحليل الأداء المقارن لمصنفات التعلم الآلي في اكتشاف عرج الماشية على مجموعة بيانات يناير
تحليل الميزات، ستستخدم القسم التالي حول “تصنيف عرج الماشية” جميع الميزات الأربعة (
تصنيف عرج الماشية
غالبًا ما يعتمد تقييم العرج التقليدي على الفحص البصري الذاتي من قبل الخبراء، وهي عملية عرضة للاختلافات وتأخيرات زمنية. تقدم خوارزميات التعلم الآلي (ML) بديلاً جذابًا من خلال الاستفادة من الميزات المستخرجة من تسجيلات الفيديو لتحليل أنماط حركة الماشية بشكل موضوعي. تستكشف هذه الدراسة فعالية ثلاثة خوارزميات ML معروفة: آلات الدعم المتجهة (SVM)، والغابات العشوائية (RF)، وأشجار القرار (DT)، بالإضافة إلى AdaBoost و Stochastic Gradient Descent (SGD)، لتصنيف عرج الماشية بشكل آلي استنادًا إلى الميزات المستمدة من الصور.
قمنا بإعطاء الأولوية لتحسين عملية التصنيف للتطبيقات في الوقت الحقيقي والموثوقية. تم تقييم النظام المقترح باستخدام مجموعة بيانات يناير (الجدول 11). ومن الجدير بالذكر أن AdaBoost حقق أعلى دقة متوسطة عامة.
الخاتمة
تقدم هذه الدراسة نهجًا جديدًا لاكتشاف وتتبع الماشية يستفيد من قدرات نموذج Detectron2. نقوم بتقييم أدائه مقابل نموذج YOLOv8 المتقدم. يظهر نظامنا أداءً استثنائيًا في اكتشاف مناطق الماشية، مما يعزز من خلال دمج حسابات تقاطع على الاتحاد (IoU) مع الاحتفاظ بالإطار لتتبع قوي ودقيق. ومن الجدير بالذكر أنه في مجموعة بيانات التحقق، يحقق النظام المقترح دقة تتجاوز
توفر البيانات
تتوفر مجموعات البيانات التي تم إنشاؤها و/أو تحليلها خلال الدراسة الحالية من المؤلف المراسل عند الطلب المعقول.
تاريخ الاستلام: 5 أبريل 2024؛ تاريخ القبول: 11 يونيو 2024
نُشر على الإنترنت: 14 يونيو 2024
نُشر على الإنترنت: 14 يونيو 2024
References
- Zheng, Z., Zhang, X., Qin, L., Yue, S. & Zeng, P. Cows’ legs tracking and lameness detection in dairy cattle using video analysis and Siamese neural networks. Comput Electron Agric 205, 107618. https://doi.org/10.1016/j.compag.2023.107618 (2023).
- Beggs, D. S. et al. Lame cows on Australian dairy farms: A comparison of farmer-identified lameness and formal lameness scoring, and the position of lame cows within the milking order. J. Dairy Sci. 102(2), 1522-1529 (2019).
- Thompson, A. J. et al. Lameness and lying behavior in grazing dairy cows. J. Dairy Sci. 102(7), 6373-6382 (2019).
- Grimm, K. et al. New insights into the association between lameness, behavior, and performance in Simmental cows. Journal of dairy science 102(3), 2453-2468 (2019).
- Oehm, A. W. et al. A systematic review and meta-analyses of risk factors associated with lameness in dairy cows. BMC Vet. Res. 15(1), 1-14 (2019).
- Jiang, Bo., Song, H. & He, D. Lameness detection of dairy cows based on a double normal background statistical model. Comput. Electron. Agric. 158, 140-149 (2019).
- Randall, L. V. et al. The contribution of previous lameness events and body condition score to the occurrence of lameness in dairy herds: A study of 2 herds. J. Dairy Sci. 101(2), 1311-1324 (2018).
- Horseman, S. V. et al. The use of in-depth interviews to understand the process of treating lame dairy cows from the farmers’ perspective. Anim Welf. 23(2), 157-165 (2014).
- Schlageter-Tello, A. et al. Comparison of locomotion scoring for dairy cows by experienced and inexperienced raters using live or video observation methods. Anim. Welf. 24(1), 69-79. https://doi.org/10.7120/09627286.24.1.069 (2015).
- Chapinal, N. et al. Measurement of acceleration while walking as an automated method for gait assessment in dairy cattle. J Dairy Sci. 94(6), 2895-2901. https://doi.org/10.3168/jds.2010-3882 (2011).
- Bruijnis, M., Beerda, B., Hogeveen, H. & Stassen, E. N. Assessing the welfare impact of foot disorders in dairy cattle by a modeling approach. Anim.: Int. J. Anim. Biosci. 6, 962-70. https://doi.org/10.1017/S1751731111002606 (2012).
- Ouared, K., Zidane, K., Aggad, H. & Niar, A. Impact of clinical lameness on the milk yield of dairy cows. J. Animal Vet. Adv. 14, 10-12 (2015).
- Morris, M. J. et al. Influence of lameness on follicular growth, ovulation, reproductive hormone concentrations and estrus behavior in dairy cows. Theriogenology 76, 658-668 (2011).
- Flower, F. C. & Weary, D. M. Effect of hoof pathologies on subjective assessments of dairy cow gait. J. Dairy Sci. 89, 139-146. https://doi.org/10.3168/jds.S0022-0302(06)72077-X (2006).
- Thomsen, P. T., Munksgaard, L. & Togersen, F. A. Evaluation of a lameness scoring system for dairy cows. J. Dairy Sci. 91, 119-126. https://doi.org/10.3168/jds.2007-0496 (2008).
- Berckmans, D. Image based separation of dairy cows for automatic lameness detection with a real time vision system. in American Society of Agricultural and Biological Engineers Annual International Meeting 2009, ASABE 2009,Vol. 7, pp. 4763-4773. https://doi. org/10.13031/2013.27258 (2009).
- Greenough, P. R. Bovine Laminitis and Lameness, a Hands-on Approach. In Saunders (eds Bergsten, C. et al.) (Elsevier, Amsterdam, The Netherlands, 2007).
- Pluk, A. et al. Evaluation of step overlap as an automatic measure in dairy cow locomotion. Trans. ASABE 53, 1305-1312. https:// doi.org/10.13031/2013.32580 (2010).
- Poursaberi, A., Bahr, C., Pluk, A., Van Nuffel, A. & Berckmans, D. Real-time automatic lameness detection based on back posture extraction in dairy cattle: shape analysis of cow with image processing techniques. Comput. Electron. Agric. 74, 110-119. https:// doi.org/10.1016/j.compag.2010.07.004 (2010).
- Viazzi, S. et al. Analysis of individual classification of lameness using automatic measurement of back posture in dairy cattle.
. Dairy Sci. 96, 257-266. https://doi.org/10.3168/jds.2012-5806 (2013). - Wadsworth, B. A. et al. Behavioral Comparisons Among Lame Versus Sound Cattle Using Precision Technologies. In Precision Dairy Farming Conference (Leeuwarden, The Netherlands, 2016).
- Chapinal, N., de Passillé, A., Weary, D., von Keyserlingk, M. & Rushen, J. Using gait score, walking speed, and lying behavior to detect hoof lesions in dairy cows. J. Dairy Sci. 92(9), 4365-4374. https://doi.org/10.3168/jds.2009-2115 (2009).
- Van Nuffel, A. et al. Lameness detection in dairy cows: Part 1. How to distinguish between non-lame and lame cows based on differences in locomotion or behavior. Animals 5(3), 838-860. https://doi.org/10.3390/ani5030387 (2015).
- Alsaaod, M. et al. Electronic detection of lameness in dairy cows through measuring pedometric activity and lying behavior. Appl. Anim. Behav. Sci. 142, 134-141 (2012).
- Zillner, J. C., Tücking, N., Plattes, S., Heggemann, T. & Büscher, W. Using walking speed for lameness detection in lactating dairy cows. Livestock Sci. 218, 119-123 (2018).
- Song, X. Y. et al. Automatic detection of lameness in dairy cattle-vision-based trackway analysis in cow’s locomotion. Comput. Electron. Agric. 64, 39-44. https://doi.org/10.1016/j.compag.2008.05.016 (2008).
- Wang, Z. Deep learning-based intrusion detection with adversaries. IEEE Access 6, 38367-38384 (2018).
- Zhang, B. et al. Multispectral heterogeneity detection based on frame accumulation and deep learning. IEEE Access 7, 29277-29284 (2019).
- Yang, Y. et al. Video captioning by adversarial LSTM. IEEE Trans. Image Process. 27(11), 5600-5611 (2018).
- Yao, L., Pan, Z. & Ning, H. Unlabeled short text similarity With LSTM Encoder. IEEE Access 7, 3430-3437 (2019).
- Hu, Y., Sun, X., Nie, X., Li, Y. & Liu, L. An enhanced LSTM for trend following of time series. IEEE Access 7, 34020-34030 (2019).
- Matthew, C., Chukwudi, M., Bassey, E. & Chibuzor, A. Modeling and optimization of Terminalia catappa L. kernel oil extraction using response surface methodology and artificial neural network. Artif. Intell. Agric. 4, 1-11 (2020).
- Vinayakumar, R., Alazab, M., Soman, K. P., Poornachandran, P. & Venkatraman, S. Robust intelligent malware detection using deep learning. IEEE Access 7, 46717-46738 (2019).
- Van Hertem, T. et al. Automatic lameness detection based on consecutive 3D-video recordings. Biosyst. Eng. https://doi.org/10. 1016/j.biosystemseng.2014.01.009 (2014).
- Zin, T. T., Maung, S. Z. M. & Tin, P. A deep learning method of edge-based cow region detection and multiple linear classification. ICIC Express Lett. Part B Appl. 13, 405-412 (2022).
- Cho, A. C., Thi, Z. T. & Ikuo, K. Black cow tracking by using deep learning-based algorithms. Bull. Innov. Comput., Inf. Control-B: Appl. 13(12), 1313 (2022).
- Zin, T. T. et al. Automatic cow location tracking system using ear tag visual analysis. Sensors 20(12), 3564. https://doi.org/10.3390/ s20123564 (2020).
- Zin, T. T., Sakurai, S., Sumi, K., Kobayashi, I. & Hama, H. The Identification of dairy cows using image processing techniques. ICIC Express Lett. Part B, Appl.: Int. J. Res. Surv. 7(8), 1857-1862 (2016).
- Mon, S. L. et al. Video-based automatic cattle identification system. In 2022 IEEE 11th Global Conference on Consumer Electronics (GCCE). IEEE (2022).
- Eaindrar, M. W. & Thi, Z. T. Cattle face detection with ear tags using YOLOv5 model. Innov. Comput., Inf. Control Bull.-B: Appl. 14(01), 65 (2023).
- Khin, M. P. et al. Cattle pose classification system using DeepLabCut and SVM model. in 2022 IEEE 11th Global Conference on Consumer Electronics (GCCE). IEEE (2022).
- Thi, T. Z., et al. An intelligent method for detecting lameness in modern dairy industry. in 2022 IEEE 4th Global Conference on Life Sciences and Technologies (LifeTech). IEEE (2022).
- Noe, S. M. et al. A deep learning-based solution to cattle region extraction for lameness detection. in 2022 IEEE 4th Global Conference on Life Sciences and Technologies (LifeTech). IEEE (2022).
- Werema, C. W. et al. Evaluating alternatives to locomotion scoring for detecting lameness in pasture-based dairy cattle in New Zealand: In-parlour scoring. Animals 12(6), 703 (2022).
- Piette, D. et al. Individualised automated lameness detection in dairy cows and the impact of historical window length on algorithm performance. Animal 14(2), 409-417 (2020).
- Jiang, B. et al. Dairy cow lameness detection using a back curvature feature. Comput. Electron. Agric. 194, 106729 (2022).
- Tassinari, P. et al. A computer vision approach based on deep learning for the detection of dairy cows in free stall barn. Comput. Electron. Agric. 182, 106030. https://doi.org/10.1016/j.compag.2021.106030 (2021).
- Taneja, M. et al. Machine learning based fog computing assisted data-driven approach for early lameness detection in dairy cattle. Comput. Electron. Agric. 171, 105286. https://doi.org/10.1016/j.compag. 2020.105286 (2020).
- Zhao, K. et al. Automatic lameness detection in dairy cattle based on leg swing analysis with an image processing technique. Comput. Electron. Agric. 148, 226-236 (2018).
- Thi, T. Z. et al. Artificial Intelligence topping on spectral analysis for lameness detection in dairy cattle. in Proceedings of the Annual Conference of Biomedical Fuzzy Systems Association 35. Biomedical Fuzzy Systems Association (2022).
- San, C. T. et al. Cow lameness detection using depth image analysis. in 2022 IEEE 11th Global Conference on Consumer Electronics (GCCE), Osaka, Japan, pp. 492-493, https://doi.org/10.1109/GCCE56475.2022.10014268 (2022).
- Kranepuhl, M. et al. Association of body condition with lameness in dairy cattle: A single-farm longitudinal study. J. Dairy Res. 88(2), 162-165 (2021).
- Barney, S. et al. Deep learning pose estimation for multi-cattle lameness detection. Sci. Rep. 13(1), 4499 (2023).
- Zhang, K. et al. Early lameness detection in dairy cattle based on wearable gait analysis using semi-supervised LSTM-autoencoder. Comput. Electron. Agric. 213, 108252. https://doi.org/10.1016/j.compag. 2023.108252 (2023).
- Dutta, A., & Zisserman, A. The VIA annotation software for images, audio and video. in Proceedings of the 27th ACM International Conference on Multimedia. (2019).
- Liu, W. et al. SSD: Single shot multibox detector. pp. 21-37 (2016).
- Redmon, J. et al. You only look once: Unified, real-time object detection. in Proceedings of the IEEE Conference on Computer Vision and Pattern Recognition (CVPR) pp. 779-788. (2016).
- Lin, T. Y. et al. Focal loss for dense object detection. in Proceedings of the IEEE International Conference on Computer Vision (ICCV) pp. 2980-2988. (2017).
- Ren, S. et al. Faster R-CNN: Towards real-time object detection with region proposal networks. in Advances in Neural Information Processing Systems (NIPS) pp. 91-99. (2015).
- He, K. et al. Mask R-CNN. in Proceedings of the IEEE International Conference on Computer Vision (ICCV) pp. 2980-2988. (2017).
- Cai, Z., & Vasconcelos, N. Cascade R-CNN: Delving into high-quality object detection. in Proceedings of the IEEE Conference on Computer Vision and Pattern Recognition (CVPR) pp. 6154-6162. (2018).
شكر وتقدير
نود أن نشكر الأشخاص المعنيين من مزرعة كونيبّو التجريبية على توفير كل التسهيلات للدراسة في المزرعة ونصائحهم القيمة.
مساهمات المؤلفين
تصور، ب.ب.م.، ت.ت.ز. و ب.ت.; المنهجية، ب.ب.م.، ت.ت.ز. و ب.ت.; البرمجيات، ب.ب.م; التحقيق، ب.ب.م.، ت.أ.، م.أ.، إ.ك.، ب.ت. و ت.ت.ز.; الموارد، ت.ت.ز.; تنظيم البيانات، ب.ب.م.، ت.أ. و م.أ.; كتابة – إعداد المسودة الأصلية، ب.ب.م.; كتابة – المراجعة والتحرير، ت.ت.ز. و ب.ت.; التصور، ب.ب.م.، ت.ت.ز. و ب.ت.; الإشراف، ت.ت.ز.; إدارة المشروع، ت.ت.ز. جميع المؤلفين راجعوا المخطوطة.
تمويل
تم دعم هذا المنشور من قبل JKA من خلال أموال الترويج من سباق KEIRIN. وقد تم دعم هذا العمل جزئيًا من قبل “تطوير وإظهار تحقيق الحلول المحلية 5G” من وزارة الشؤون الداخلية والاتصالات ومشروع “تجارب العرض في المزرعة للزراعة الذكية” من وزارة الزراعة والغابات ومصايد الأسماك (الوكالة الممولة: NARO).
المصالح المتنافسة
يعلن المؤلفون عدم وجود مصالح متنافسة.
معلومات إضافية
يجب توجيه المراسلات والطلبات للحصول على المواد إلى T.T.Z.
معلومات إعادة الطبع والتصاريح متاحة علىwww.nature.com/reprints.
ملاحظة الناشر: تظل شركة سبرينغر ناتشر محايدة فيما يتعلق بالمطالبات القضائية في الخرائط المنشورة والانتماءات المؤسسية.
معلومات إعادة الطبع والتصاريح متاحة علىwww.nature.com/reprints.
ملاحظة الناشر: تظل شركة سبرينغر ناتشر محايدة فيما يتعلق بالمطالبات القضائية في الخرائط المنشورة والانتماءات المؤسسية.
الوصول المفتوح هذه المقالة مرخصة بموجب رخصة المشاع الإبداعي النسب 4.0 الدولية، التي تسمح بالاستخدام والمشاركة والتكيف والتوزيع وإعادة الإنتاج بأي وسيلة أو صيغة، طالما أنك تعطي الائتمان المناسب للمؤلفين الأصليين والمصدر، وتوفر رابطًا لرخصة المشاع الإبداعي، وتوضح ما إذا تم إجراء تغييرات. الصور أو المواد الأخرى من طرف ثالث في هذه المقالة مشمولة في رخصة المشاع الإبداعي الخاصة بالمقالة، ما لم يُشار إلى خلاف ذلك في سطر الائتمان للمواد. إذا لم تكن المادة مشمولة في رخصة المشاع الإبداعي الخاصة بالمقالة وكان استخدامك المقصود غير مسموح به بموجب اللوائح القانونية أو يتجاوز الاستخدام المسموح به، فستحتاج إلى الحصول على إذن مباشرة من صاحب حقوق الطبع والنشر. لعرض نسخة من هذه الرخصة، قم بزيارةhttp://creativecommons.org/licenses/by/4.0/.
© المؤلف(ون) 2024
© المؤلف(ون) 2024
كلية الدراسات العليا للهندسة، جامعة ميازاكي، ميازاكي 889-2192، اليابان. منظمة التعلم وتطوير الطلاب، جامعة ميازاكي، ميازاكي 889-2192، اليابان. محطة سومييوشي لعلوم الثروة الحيوانية، مركز العلوم الميدانية، كلية الزراعة، جامعة ميازاكي، ميازاكي 889-0121، اليابان. البريد الإلكتروني:thithi@cc.miyazaki-u.ac.jp
Journal: Scientific Reports, Volume: 14, Issue: 1
DOI: https://doi.org/10.1038/s41598-024-64664-7
PMID: https://pubmed.ncbi.nlm.nih.gov/38877097
Publication Date: 2024-06-14
DOI: https://doi.org/10.1038/s41598-024-64664-7
PMID: https://pubmed.ncbi.nlm.nih.gov/38877097
Publication Date: 2024-06-14
Development of a real-time cattle lameness detection system using a single side-view camera
Video analysis and a Siamese attention model (Siam-AM) offer a potential solution for tracking all four legs of cattle and detecting lameness in dairy herds. The process involves feature extraction, applying attention weighting, and comparing similarities to achieve precise leg tracking
Studies investigating the intra- and inter-rater reliability of lameness assessment in cattle using locomotion scores, both live and from video, have shown that experienced raters demonstrate higher reliability when scoring
from video. This suggests video observation is an acceptable method for lameness assessment, regardless of the observer’s experience
Clinical lameness negatively affects milk yield and reproductive performance in cattle
However, this contact-based approach may initially stress cattle unaccustomed to the equipment. Implementing it on a large scale would also increase labor and equipment costs. Overcoming these limitations, some researchers propose non-contact methods using monitoring cameras on farms. By modeling time and space for cattle tracking, they achieved relatively accurate results. However, this method lacked environmental robustness, as changes in conditions could negatively impact the algorithm’s performance and lead to subpar results in longterm detection
Utilizing automatic back posture measurements in daily routines allows for individual lameness classifications. Another study proposed a method based on consecutive 3D-video recordings for automatic detection of lameness
(i) Accurate detection and instance segmentation of cattle located behind the frame or within covered areas remain critical challenges. This work seeks to address these complexities.
(ii) To assess the efficacy of our custom-trained Mask R-CNN model, we performed a comparative analysis with the state-of-the-art YOLOv8 algorithm.
(iii) For cattle tracking, we developed a light, customized algorithm that leverages IoU calculations combined with frame-holding and entrance gating mechanisms.
(iv) This work proposes a novel approach to assess cattle lameness by analyzing the variance in movement patterns. We achieve this by calculating the three key points on the back curvature of the cattle, providing a new metric for lameness evaluation.
(v) Comparing individual cattle lameness scores directly lack robustness. Instead, calculating the probabilities across all frames from each result folder (obtained from the cattle tracking phase) provides a more robust approach.
(vi) The integration of cattle detection, tracking, feature extraction, and lameness calculation enables realtime cattle lameness detection.
(vii) Early lameness detection in cattle remains a significant challenge, with most research focusing on differentiating between non-lame (level 1) and mildly lame (levels 2 and 3) animals.
Related work
In our Visual Information Focusing on animal welfare and technological advancements, the Visual Information Lab at Miyazaki University is currently engaged in the ongoing research and development of several key areas related to cattle management. Specifically, our focus lies on the following three systems such as Cattle Lameness Level Classification System, Cattle Body Condition Classification System, Cattle Mounting Detection System. For each of these systems, our research efforts encompass the development of robust detection, tracking and identification methodologies
Early and accurate detection of lameness is essential to ensure timely intervention and appropriate treatment for affected animals. In recent years, cattle lameness classification has garnered considerable attention in the field of precision livestock farming. Researchers have explored various approaches to achieve accurate and timely identification of cattle lameness using advanced technologies and innovative methods. Several research endeavors have contributed significantly to the domain of cattle lameness detection and body movement variability. In the context of detecting lameness in dairy cattle, several research studies have explored intelligent methods that leveraged advanced computer vision techniques, specifically Mask-RCNN, to extract the region of interest encompassing the dairy cattle. By utilizing features derived from head bob patterns, the authors successfully identified potential signs of lameness in the cattle movement
To detect lameness in cattle,
The
This research
Figure 1. Overall pipeline of the proposed cattle lameness classification system: (1) data collection and data preprocessing (2) cattle detection (3) cattle tracking (4) feature extraction (5) cattle lameness classification.
Figure 2. Conceptual model of farm layout and organization: key areas of interest within the cattle facility include milking parlors, designated lanes (lane A and lane B ), a waiting area, and cattle barn.
point of each lane, enabling comprehensive monitoring and analysis of cattle behavior and movement along the pathways. Figure 3a,b depict Lane A and Lane B, respectively.
Data collection
This study utilized two AXIS P 1448-LE 4K cameras (Fig. 4) strategically positioned at the starting points of the two cattle lanes connecting the cattle barn to the milking parlor (Fig. 5a,b). These cameras captured video recordings at a frame rate of 25 frames per second and an image resolution of
Data preprocessing
For data preprocessing in cattle region detection, we employed VGG Image Annotator (VIA)
To prepare the cattle detection training dataset, we manually annotated 5458 Instances across three distinct dates: July 4th, September 30th, and November 19th, and for testing dataset we collected 247,250 instances from January 3rd, 5th, 6th, 7th, 10th, 11st, 12nd, 13rd, 14th, 23rd, 24th, 25th, 26th, 27th, 28th and 29th as detailed in Table 1. The January dataset presented the most significant challenge for cattle detection due to the combined
Figure 3. Sample Image from cattle farm (a) cattle lane A (b) cattle lane B.
Figure 4. Camera configuration for monitoring lane A in the cattle Farm and camera type of 4 K camera usage in cattle farm.
Figure 5. Camera installation (a) 4 K camera on lane A (b) front-view from 4 K camera installed.
Figure 6. (a), (b) Sample annotations of cattle region by using VGG image annotator.
effects of the winter season and camera setup environment. Specifically, the presence of smoke in the environment and proximity of cattle seeking warmth during cooler temperatures hindered accurate detection. Recognizing the crucial role of data quality in model performance, we implemented a multi-step approach to optimize the dataset: (1) Duplicate Removal: We meticulously identified and eliminated duplicate images, minimizing redundancy, and alleviating unnecessary computational strain during training. (2) Blur Mitigation: Recognizing the detrimental impact of blurred images on detection accuracy, we meticulously filtered out any exhibiting noticeable blurring,
| Type of training | Date | Duration | Number of instances |
| Training | 4th July 2022 | Morning, evening | 3000 |
| 30th September 2022 | Morning, evening | 480 | |
| 19th November 2022 | Morning, evening | 1978 | |
| Testing | 3rd January 2023 | Morning, evening | 17,322 |
| 5th January 2023 | Morning, evening | 22,194 | |
| 6th January 2023 | Morning | 5059 | |
| 7th January 2023 | Morning | 5106 | |
| 10th January 2023 | Morning, evening | 20,720 | |
| 11st January 2023 | Morning, evening | 11,257 | |
| 12nd January 2023 | Morning, evening | 16,274 | |
| 13rd January 2023 | Morning, evening | 24,538 | |
| 14th January 2023 | Morning | 6074 | |
| 23rd January 2023 | Morning, evening | 18,579 | |
| 24th January 2023 | Morning, evening | 23,684 | |
| 25th January 2023 | Morning, evening | 15,596 | |
| 26th January 2023 | Morning, evening | 14,998 | |
| 27th January 2023 | Morning, evening | 12,934 | |
| 28th January 2023 | Morning | 15,619 | |
| 29th January 2023 | Morning, evening | 17,296 |
Table 1. Dataset used for training and testing of cattle detection.
thereby fostering a dataset of enhanced quality. (3) Noise Reduction: Images afflicted by excessive noise, such as pixelation or distortion, were meticulously excluded, ensuring the inclusion of noise-free images that bolster the model’s robustness. (4) Relevant Data Extraction: As our focus was on cattle detection, images devoid of cattle passing lanes or lacking pertinent cattle-related information were meticulously excluded, guaranteeing the training dataset comprised solely of high-quality, diverse, and relevant imagery, ultimately optimizing the detection model’s performance and effectiveness.
Cattle detection
In recent years, object detection has gained significant attention in the field of research, mainly due to the advancements made by machine learning and deep learning algorithms. Object detection involves precisely locating and categorizing objects of interest within images or videos. To achieve this, the positions and boundaries of the objects are identified and labeled accordingly. Presently, state-of-the-art object detection methods can be broadly classified into two main types: one-stage methods and two-stage methods. One-stage methods prioritize model speed and efficiency, making them well-suited for real-time applications. Some notable one-stage methods include the Single Shot multibox Detector (SSD)
Detectron2, developed by Facebook, is a state-of-the-art vision library designed to simplify the creation and utilization of object detection, instance segmentation, key point detection, and generalized segmentation models. Specifically, for object detection, Detectron2’s library offers a variety of models, including RCNN, Mask R-CNN, and Faster R-CNN. RCNN generates region proposals, extracts fixed-length features from each candidate region, and performs object classification. However, this process can be slow due to the independent passing of CNN over each region of interest (ROI). Faster R-CNN architecture overcomes this limitation by incorporating the Region Proposal Network (RPN) and the Fast R-CNN detector stages. It obtains class labels and bounding boxes
of objects effectively. Mask R-CNN, sharing the same two stages as Faster R-CNN, extends its capabilities by also generating class labels, bounding boxes, and masks for objects. Notably, Mask R-CNN demonstrates higher accuracy in cattle detection, as indicated by previous research. Therefore, the proposed system adopts Mask R-CNN to extract mask features specifically for cattle, as illustrated in Fig. 7. During the detection phase, the default predictor, COCO-Instance Segmentation, and Mask R-CNN with a 0.7 score threshold value (MODEL. ROI_HEADS.SCORE_THRESH_TEST) are utilized. The training process employs annotated images, while for testing, videos are fed into Detectron2 to obtain color mask, and binary mask images and detection results including bounding boxes, mask value of detected cattle region and cattle confidence score. The mask image is subsequently utilized in cattle detection calculations. Overall, by leveraging the capabilities of Mask R-CNN from Detectron2, the proposed system aims to achieve accurate and efficient cattle detection, offering valuable insights for cattle health monitoring and management.
of objects effectively. Mask R-CNN, sharing the same two stages as Faster R-CNN, extends its capabilities by also generating class labels, bounding boxes, and masks for objects. Notably, Mask R-CNN demonstrates higher accuracy in cattle detection, as indicated by previous research. Therefore, the proposed system adopts Mask R-CNN to extract mask features specifically for cattle, as illustrated in Fig. 7. During the detection phase, the default predictor, COCO-Instance Segmentation, and Mask R-CNN with a 0.7 score threshold value (MODEL. ROI_HEADS.SCORE_THRESH_TEST) are utilized. The training process employs annotated images, while for testing, videos are fed into Detectron2 to obtain color mask, and binary mask images and detection results including bounding boxes, mask value of detected cattle region and cattle confidence score. The mask image is subsequently utilized in cattle detection calculations. Overall, by leveraging the capabilities of Mask R-CNN from Detectron2, the proposed system aims to achieve accurate and efficient cattle detection, offering valuable insights for cattle health monitoring and management.
Ultralytics YOLOv8 is a powerful and versatile object detection and instance segmentation model that is designed to be fast, accurate, and easy to use. It builds upon the success of previous YOLO versions and introduces new features and improvements to further boost performance and flexibility. Is applicable to a wide range of tasks, including object detection, tracking, instance segmentation, image classification, and pose estimation. There are five pre-trained models with different sizes available for instance segmentation: yolov8n (Nano), yolov8s (Small), yolov8m (Medium), yolov81 (Large), and yolov8x (Extra Large). Instance segmentation goes a step further than object detection by identifying individual objects in an image and segmenting them from the rest of the image. Instance segmentation is useful when you need to know not only where objects are in an image, but also what their exact shape is. In this research, we employ the YOLOv8x-seg model for cattle detection and segmentation. Unlike traditional methods, we do not rely on manual annotation or custom training specific to cattle. Instead, YOLOv8x-seg is applied directly to the task of cattle detection, leveraging its advanced capabilities and pretrained features. This approach, as shown in Fig. 8, allows us to achieve accurate and efficient cattle detection without the need for labor-intensive annotation processes or specialized training. By utilizing the powerful segmentation capabilities of YOLOv8x-seg, we can effectively identify and delineate cattle regions in images or videos, contributing to the overall success of the study.
Cattle tracking
In this study, the movement of cattle through individual lanes necessitates precise individual tracking to enable accurate lameness calculation. Ensuring accurate cattle identification and storage is of paramount importance. The dataset’s simplicity involves the traversal of just one or two cattle through the lanes. The system employs a designated region of interest, demarcated by the lines in Fig. 9, aligned with the camera settings. The tracking procedure features two vertically intersecting red lines within the frame. The left line represents the left threshold, and the corresponding right line serves as the right threshold. The amalgamation of computer vision, machine learning, and deep learning in recent years has yielded remarkable strides in tracking algorithms, leading to substantial improvements in accuracy.
Figure 7. Architecture for cattle detection by using Detectron2: Custom training pipeline for our dataset.
Figure 8. Architecture for cattle detection by using YOLOv8 base model.
Figure 9. Cattle tracking logic (bounding box:
Input: Bounding Boxes of detected cattle region from Detectron2-Detection
Output: Local ID for each detected cattle region
    For each bounding box:
    Calculate the aspect ratio of bounding box ( $a_{text {bbox }}$ ) the following formula:
        $a mathrm{bbox}=frac{w}{h}$
    If $a_{mathrm{bbox}} geq$ Tha $a_{mathrm{a}}$ then,
        If $x_{1} leq T h a_{text {left }}$ then,
            Assign New ID
            Assign MAX_LIFE to Lifetime ${ }_{mathrm{ID}}$
        else then:
            If $x_{1} geq T h a_{text {left }}$ and $x_{2} leq T h a_{text {right }}$ then:
                $I o U=frac{text { Area of Overlap }}{text { Area of Union }}$
                If $I o Uleft(mathrm{f}_{mathrm{t}-1}, mathrm{f}_{mathrm{t}}right)>0.6$ then:
                    Assign $operatorname{ID}left(mathrm{f}_{mathrm{t}}right)=operatorname{ID}left(mathrm{f}_{mathrm{t}-1}right)$
                    Assign MAX_LIFE to Lifetime ${ }_{mathrm{ID}}$
                else then:
                    Move to next frame: $mathrm{f}_{mathrm{t}}=mathrm{f}_{mathrm{t}+1}$
            else then:
                If $x_{2} geq$ Tha ${ }_{text {right }}$ then:
                    Remove ID
                else then:
                    Update Lifetime $_{text {ID }}$
                    If Lifetime ${ }_{text {ID }} leq$ MIN_LIFE then:
                        Remove ID
                    else then:
                        Move to next frame: $mathrm{f}_{mathrm{t}}=mathrm{f}_{mathrm{t}+1}$
Algorithm 1 Customized tracking algorithm (CTA).
In pursuit of cost-effectiveness and time efficiency, the research leveraged Intersection over Union (IoU) calculations for tracking, supplemented by the incorporation of individual ID lifetimes. This strategy, bolstered by
In pursuit of cost-effectiveness and time efficiency, the research leveraged Intersection over Union (IoU) calculations for tracking, supplemented by the incorporation of individual ID lifetimes. This strategy, bolstered by
Figure 10. Automated cattle tracking process flow diagram.
| Symbols | Description |
|
|
Current frame |
|
|
Aspect ratio of bounding box |
| Tha
|
Aspect ratio threshold |
|
|
Left boundary threshold |
|
|
Right boundary threshold |
| ID(
|
ID of current frame |
| MAX_LIFE | Maximum lifetime of holding time of frame |
| MIN_LIFE | Minimum lifetime of holding time of frame |
| Lifetime
|
Lifetime of ID |
Table 2. Definitions of key variables for cattle tracking analysis.
Fig. 10, tackles challenges like missed detections and other detection intricacies. And Table 2 explains the variable use in tracking flowchart. This approach stands in contrast to conventional cattle tracking algorithms, offering simplicity, ease of manipulation, and minimal inference time. Tracking initiation occurs when a cattle’s position precedes the left threshold and concludes upon the right side of the cattle’s bounding box surpassing the right threshold. Within this tracking phase, the assignment of a cattle’s Local ID transpires prior to traversing the left threshold, with the resulting Local ID stored in the Temporal Database. This meticulous tracking method ensures accuracy and efficiency, thereby contributing to the study’s comprehensive monitoring and analysis objectives.
The provided Algorithm 1 outlines a comprehensive approach to assigning Local IDs to detected cattle regions based on Bounding Boxes obtained from the Detectron2-Detection process. The algorithm focuses on accurate and reliable tracking of individual cattle as they pass through lanes. Beginning with calculating the aspect ratio of each bounding box, the algorithm applies specific conditions to determine the appropriate assignment of Local IDs. It considers factors such as the position of bounding boxes relative to defined thresholds and employs techniques like Intersection over Union (IoU) calculations to ensure consistency in the tracking process. Moreover, the algorithm introduces the concept of lifespan (LifetimeID) for each assigned ID, allowing for refined management of cattle tracking.
By combining these strategies, the algorithm contributes to enhancing the accuracy and effectiveness of cattle tracking, thus enabling the monitoring of cattle behavior and health in various contexts. The local ID associated with a cattle’s tracking information is systematically managed to ensure accurate and up-to-date records. This process involves the removal of the local ID from the database under certain circumstances. Specifically, when the horizontal position (
Upon the culmination of the tracking process, the cattle are systematically organized based on their unique cattle IDs, creating distinct folders as depicted in Fig. 11. Each of these folders contains a collection of essential images and binary masks. These include binary images that accentuate the delineation of the cattle, color mask images that highlight specific features, original binary masks that capture the raw attributes, and the unaltered original images of the cattle. This meticulous organization ensures that each cattle’s data is readily accessible
Figure 11. Cattle tracking summary: local IDs and associated results.
and preserved, contributing to the efficient analysis and retrieval of pertinent information for further research and examination.
Feature extraction
A sequencies of frames
These binary masks played a pivotal role in extracting pertinent features for the subsequent lameness classification process. Figure 11 offers a visual representation of sample binary mask images, each associated with different lameness scores. The distinctive characteristic lies in the shape of the cattle’s back. While normal cattle exhibit a flat back structure, lame cattle display varying degrees of an arched back, ranging from mild to prominently arched. To extract meaningful features, the binary mask video sequence was initially subjected to a labelling process to identify the cattle regions. From these binary images, two key features were extracted
According to the paper
In this study, we carefully identified three specific points on the curvature of cattle back within the cropped binary image. These points are designated as follows: Point 1 (P1): Located at
Figure 12. Segmentation of cattle in consecutive frames for feature extraction (
Figure 13. Feature extractions: (a) feature
placement facilitates targeted analysis and accurate feature extraction within the study. This innovative approach not only considers the spatial distribution of these points, but also the gradients that characterize the transitions between these points. This holistic approach is expected to provide more nuanced insights into cattle curvature, thereby contributing to a more refined understanding of cattle anatomy.
Cattle lameness classification
In the Lameness classification phase, as the system needs correct ground truth dataset, we engaged a group of cattle experts to check all the cattle from farm manually and store the global identification and their lameness level sorted by the time frame that pass through the specific lane. The cattle experts check the cattle lameness level for the following dates as shown in Table 3.
Performance evaluation methods
| Lameness level | Lame 1 | Lame 2 | Lame 3 | Lame 4 |
| No of cattle | 84 | 24 | 7 | 1 |
Table 3. Number of cattle in each lameness level.
where
Ethics declarations
Ethical review and approval were waived for this study, due to no enforced nor uncomfortable restriction to the animals during the study period. The image data of calving process used for analysis in this study were collected by an installed camera without disturbing natural parturient behavior of animals and routine management of the farm.
Experimental results
In the area of computer vision and machine learning, Python was primarily used as the programming language; the PyTorch framework was employed to build the deep learning components, including instance-segmentation for Detectron2; Scikit-learn was used for lameness classification of various classifiers was employed to implement the data. Additionally, data preprocessing tasks were performed using OpenCV, while data analysis and visualization were performed using NumPy, Pandas, and Matplotlib. This study covers cattle detection, tracking, and lameness classification as separate processes, and their performance metrics and results are calculated as follows.
Cattle detection
During the cattle detection stage, our system leveraged an annotation dataset generated as cattle passed through the lane following the milk production process, occurring twice daily for each cattle. To facilitate the training of cattle detection, we specifically selected three different days from the dataset provided in Table 1. Out of the total dataset, we randomly extracted 3176 images (
In our evaluation process, we assess the performance of the detection model using three key types of Average Precision (AP) values, namely AP, AP50, and AP75, as outlined in Table 5. These metrics offer insights into the accuracy of both box and mask predictions. To ensure a comprehensive evaluation, we calculate the average precision over all Intersection over Union (IoU) thresholds (AP). Additionally, we focus on the AP values at IoU thresholds of 0.5 (AP50) and 0.75 (AP75), adhering to the COCO standard. These metrics provide a robust understanding of the model’s ability to accurately predict cattle instances, catering to different levels of precision and IoU thresholds. Table 6, the accuracy of the testing detection results is presented for both morning and evening data spanning from January. The aggregated testing results reveal a commendable overall accuracy of
Real-world cattle detection scenarios can present challenges, particularly in low-light environments. One such challenge arises when cattle are positioned close together, leading to overlapping instances. Standard
| #Images (100%) | #Train images (80%) | #Validation images (20%) |
| 5458 | 4366 | 1092 |
Table 4. Training and validation images for detection.
| Box
|
Box
|
Box
|
Mask
|
Mask
|
Mask
|
| 94.31 | 99.53 | 99.534 | 87.75 | 99.53 | 99.53 |
Table 5. Comparative evaluation of cattle detection performance on the validation dataset using average precision (AP) metrics for bounding boxes (BOX) and segmentation masks (Mask).
| Date | #Instances | #Correct instances (TP) | #Incorrect instances (FP) | #Miss instances (FN) | Recall (%) | Precision (%) | Accuracy (%) |
| 3rd January 2023 (M) | 9247 | 8855 | 392 | 0 | 100.00 | 95.76 | 95.76 |
| 3rd January 2023 (E) | 8075 | 8000 | 75 | 0 | 100.00 | 99.07 | 99.07 |
| 5th January 2023 (M) | 13,631 | 13,552 | 56 | 23 | 99.83 | 99.59 | 99.59 |
| 5th January 2023 (E) | 8563 | 8511 | 35 | 17 | 99.80 | 99.59 | 99.59 |
| 6th January 2023 (M) | 5059 | 4982 | 77 | 0 | 100.00 | 98.48 | 98.48 |
| 7th January 2023 (M) | 5106 | 5106 | 0 | 0 | 100.00 | 100.00 | 100.00 |
| 10th January 2023 (M) | 10,418 | 10,097 | 321 | 0 | 100.00 | 96.92 | 96.92 |
| 10th January 2023 (E) | 10,302 | 10,228 | 74 | 0 | 100.00 | 99.28 | 99.28 |
| 11st January 2023 (M) | 4476 | 4408 | 68 | 0 | 100.00 | 98.48 | 98.48 |
| 11st January 2023 (E) | 6781 | 6770 | 11 | 0 | 100.00 | 99.84 | 99.84 |
| 12nd January 2023 (M) | 5422 | 5405 | 17 | 0 | 100.00 | 99.69 | 99.69 |
| 12nd January 2023 (E) | 10,852 | 10,814 | 38 | 0 | 100.00 | 99.65 | 99.65 |
| 13rd January 2023 (M) | 9170 | 9001 | 169 | 0 | 100.00 | 98.16 | 98.16 |
| 13rd January 2023 (E) | 15,368 | 14,797 | 571 | 0 | 100.00 | 96.28 | 96.28 |
| 14th January 2023 (M) | 6074 | 6012 | 62 | 0 | 100.00 | 98.98 | 98.98 |
| 23rd January 2023 (M) | 6668 | 6611 | 57 | 0 | 100.00 | 99.15 | 99.15 |
| 23rd January 2023 (E) | 11,911 | 11,867 | 44 | 0 | 100.00 | 99.63 | 99.63 |
| 24th January 2023 (M) | 12,546 | 12,450 | 96 | 0 | 100.00 | 99.23 | 99.23 |
| 24th January 2023 (E) | 11,138 | 10,996 | 142 | 0 | 100.00 | 98.73 | 98.73 |
| 25th January 2023 (M) | 7624 | 7587 | 37 | 0 | 100.00 | 99.51 | 99.51 |
| 25th January 2023 (E) | 7972 | 7940 | 32 | 0 | 100.00 | 99.60 | 99.60 |
| 26th January 2023 (M) | 6031 | 5963 | 68 | 0 | 100.00 | 98.87 | 98.87 |
| 26th January 2023 (E) | 8967 | 8942 | 25 | 0 | 100.00 | 99.72 | 99.72 |
| 27th January 2023 (M) | 11,064 | 11,032 | 32 | 0 | 100.00 | 99.71 | 99.71 |
| 27th January 2023 (E) | 1870 | 1864 | 6 | 0 | 100.00 | 99.68 | 99.68 |
| 28th January 2023 (M) | 15,619 | 15,422 | 197 | 0 | 100.00 | 98.74 | 98.74 |
| 29th January 2023 (M) | 8168 | 8168 | 0 | 0 | 100.00 | 100.00 | 100.00 |
| 29th January 2023 (E) | 9128 | 9065 | 63 | 0 | 100.00 | 99.31 | 99.31 |
Table 6. Evaluation metrics on January dataset for cattle detection by using Detectron2 (
segmentation algorithms may struggle to differentiate between individual cattle in these scenarios, resulting in a single merged region instead of two distinct ones as illustrated in Fig. 14a,b. This merged region can lead to two potential errors such as the system might misinterpret the merged region as abnormally large cattle, leading to an incorrect lameness detection and if the merged region’s width falls below a minimum size threshold established for individual cattle, it could be excluded entirely. This would result in missed detections of individual cattle and potential lameness cases. To address the challenge of overlapping cattle and improve the accuracy of our
Figure 14. Cattle detection segmentation result (a) distinct regions (b) overlapping region.
system, we leverage the concept of minimum and maximum widths for cattle regions. We establish minimum and maximum width values based on prior analysis of cattle dimensions within our training dataset (described in Table 1). This analysis allows us to determine realistic cattle sizes within the specific breed and environment represented by the dataset. After the initial cattle region detection stage, the width of each detected region is analyzed. Cattle regions exceeding the maximum width threshold are discarded as potential errors caused by overlapping cattle. This eliminates unrealistically large, merged cattle regions that likely represent multiple cattle.
We evaluated the cattle detection component of our system using data from another farm, “Sumiyoshi.” This testing across different farms demonstrates the system’s ability to handle variations in cattle appearance and farm environment. Figure 15a showcases cattle detection results on our and Fig. 15b highlights results on dataset from “Sumiyoshi” farm, demonstrating the system’s generalizability to unseen variations. This high accuracy level underscores the effectiveness and reliability of the system’s detection capabilities across various instances and time frames. When comparing the performance evaluation of our main cattle detection algorithm with the current most popular real-time object detection and image segmentation model YOLOv8 in Table 7 using 2023 March 14 evening dataset, we found that YOLOv8 achieved a higher accuracy of
Therefore, we recommend using our main detection algorithm, detectron2, as it removes the wrongly detected human regions by calculating the area of the detected object and comparing it to a constant threshold. Some of the detection results are shown in Fig. 16. Detection by using detectron2 is described in Fig. 16a and detection by using YOLOv8x is as depicted in Fig. 16b.
Figure 15. Cattle Detection Result from multiple farms (a) dataset from Hokuren Kunneppu (b) dataset from Sumiyoshi.
| Model | #Instances | #Correct (TP) | #Wrong (FP) | (TN) | (FN) | Recall (%) | Precision (%) | Accuracy (%) |
| YOLOv8x | 15,305 | 15,224 | 12 | 0 | 69 | 99.92 | 99.55 | 99.92 |
| Detectron2 | 15,305 | 14,466 | 839 | 0 | 0 | 94.52 | 100.00 | 94.52 |
Table 7. Comparison of performance evaluation between YOLOv8x and Detectron2 (
Figure 16. Cattle detection result (a) by using Detectron2 (b) by using YOLOv8.
Cattle tracking
The process of tracking was a sophisticated technique that capitalizes on bounding boxes, which are created during the Detection phase. This phase was of paramount importance as it pertains to the segregation of the cattle based on their distinct LocalID, a process which is clearly illustrated in Fig. 10. Once this is accomplished, each frame is meticulously preserved and stored in a separate folder, a step that is crucial for future computations of lameness, as depicted in Fig. 11. Table 8 provides an in-depth analysis of the outcomes of cattle tracking for the comprehensive dataset that was compiled in the month of January. Our Customized Tracking Algorithm
| Date | #Cattle | #Correct (TP) | #Wrong (FP) | Accuracy (%) |
| 3rd January 2023 (M) | 62 | 62 | 0 | 100.00 |
| 3rd January 2023 (E) | 56 | 56 | 0 | 100.00 |
| 5th January 2023 (M) | 64 | 63 | 1 | 98.44 |
| 5th January 2023 (E) | 65 | 64 | 1 | 98.46 |
| 6th January 2023 (M) | 64 | 64 | 0 | 100.00 |
| 7th January 2023 (M) | 42 | 41 | 1 | 97.62 |
| 10th January 2023 (M) | 56 | 55 | 1 | 98.21 |
| 10th January 2023 (E) | 56 | 56 | 0 | 100.00 |
| 11st January 2023 (M) | 56 | 56 | 0 | 100.00 |
| 11st January 2023 (E) | 63 | 63 | 0 | 100.00 |
| 12nd January 2023 (M) | 56 | 56 | 0 | 100.00 |
| 12nd January 2023 (E) | 58 | 57 | 1 | 98.28 |
| 13rd January 2023 (M) | 66 | 65 | 1 | 98.48 |
| 13rd January 2023 (E) | 54 | 54 | 0 | 100.00 |
| 14th January 2023 (M) | 64 | 64 | 0 | 100.00 |
| 23rd January 2023 (M) | 63 | 63 | 0 | 100.00 |
| 23rd January 2023 (E) | 64 | 64 | 0 | 100.00 |
| 24th January 2023 (M) | 55 | 54 | 1 | 98.18 |
| 24th January 2023 (E) | 56 | 56 | 0 | 100.00 |
| 25th January 2023 (M) | 58 | 58 | 0 | 100.00 |
| 25th January 2023 (E) | 58 | 58 | 0 | 100.00 |
| 26th January 2023 (M) | 52 | 52 | 0 | 100.00 |
| 26th January 2023 (E) | 62 | 62 | 0 | 100.00 |
| 27th January 2023 (M) | 27 | 27 | 0 | 100.00 |
| 27th January 2023 (E) | 62 | 62 | 0 | 100.00 |
| 28th January 2023 (M) | 41 | 41 | 0 | 100.00 |
| 29th January 2023 (M) | 62 | 61 | 1 | 98.38 |
| 29th January 2023 (E) | 62 | 62 | 0 | 100.00 |
Table 8. Evaluation metrics on January dataset for cattle tracking by using custom tracking algorithm (
(CTA) emerges as an extremely efficient solution, providing a compelling alternative to other prevalent tracking algorithms in terms of both runtime and complexity. The detailed workings of this algorithm are outlined in Algorithm 1. We optimized the CTA to effectively address and overcome the various challenges associated with tracking. The results of these efforts are evident in its performance, as it achieved a remarkable accuracy rate of
Feature extraction
Ground truth data, collected from farm evaluations by a lameness expert, links each cow’s lameness level to its unique ear tag ID. This data serves as a benchmark for evaluating our proposed model’s performance. Table 9 details the distribution of lameness levels within the cattle population. As shown, 84 cattle are classified as level 1 (no lameness), while levels 2 and 3 represent stages of early lameness. Notably, our system identified only one cow exhibiting level 4 lameness. We have extracted four features
Selecting and evaluating informative features presents a significant challenge for our proposed system. Each feature extracted from the dataset (Table 10) is evaluated using a Support Vector Machine (SVM) classifier. The training set classification results are presented in Fig. 17a-d. As observed, each individual feature demonstrates some level of effectiveness for lameness classification. Notably, Fig. 17e demonstrates that combining all features into a feature vector yields superior performance compared to using individual features. This combined feature approach is further validated on the testing dataset using the SVM classifier, as shown in Fig. 18a-d for individual features and Fig. 18e for the combined feature vector. The results confirm that utilizing all features collectively leads to a more efficient classification process compared to relying on individual features. Building upon the
| Lameness level | Lame 1 | Lame 2 | Lame 3 | Lame 4 |
| No of cattle | 84 | 24 | 7 | 1 |
Table 9. Lameness level ground truth.
| #Total images | #Training images | #Testing images |
| 1031 | 690 | 341 |
Table 10. Training and testing images for feature extraction.
Figure 17. Training results using SVM with different feature sets (a) feature 1 (b) feature 2 (c) feature 3 (d) feature 4 (e) by combining all the four features (lame
Figure 18. Testing Results using SVM with different feature sets (a) feature 1 (b) feature 2 (c) feature 3 (d) feature 4 (e) by combining all the four features (lame
| Date | SVM | RF | DT | AdaBoost | SGD |
| 3rd January 2023 (M) | 75.81 | 67.74 | 70.97 | 80.65 | 45.16 |
| 3rd January 2023 (E) | 78.57 | 76.79 | 78.57 | 82.14 | 51.79 |
| 5th January 2023 (M) | 71.88 | 71.88 | 60.94 | 73.44 | 42.19 |
| 5th January 2023 (E) | 78.46 | 81.54 | 83.08 | 81.54 | 41.54 |
| 6th January 2023 (M) | 78.12 | 68.75 | 76.56 | 73.44 | 40.62 |
| 7th January 2023 (M) | 71.43 | 69.05 | 59.52 | 69.05 | 42.86 |
| 10th January 2023 (M) | 83.93 | 78.57 | 85.71 | 80.36 | 50.00 |
| 10th January 2023 (E) | 80.36 | 71.43 | 75.00 | 78.57 | 51.79 |
| 11st January 2023 (M) | 69.64 | 67.86 | 76.79 | 75.00 | 44.64 |
| 11st January 2023 (E) | 71.43 | 73.21 | 71.43 | 76.79 | 51.79 |
| 12nd January 2023 (M) | 71.43 | 79.37 | 79.37 | 79.37 | 46.03 |
| 12nd January 2023 (E) | 80.36 | 80.36 | 78.57 | 80.36 | 51.79 |
| 23rd January 2023 (M) | 71.43 | 76.19 | 80.95 | 80.95 | 50.79 |
| 23rd January 2023 (E) | 75.00 | 78.12 | 76.56 | 75.00 | 50.00 |
| 24th January 2023 (M) | 71.7 | 73.58 | 77.36 | 77.36 | 56.60 |
| 24th January 2023 (E) | 67.86 | 73.21 | 67.86 | 73.21 | 58.93 |
| 25th January 2023 (M) | 73.21 | 71.43 | 76.79 | 78.57 | 35.71 |
| 25th January 2023 (E) | 81.36 | 81.36 | 76.27 | 79.66 | 47.46 |
| 26th January 2023 (E) | 76.92 | 82.69 | 78.85 | 84.62 | 51.92 |
Table 11. Comparative performance analysis of machine learning classifiers for cattle lameness detection on the January dataset (
feature analysis, the subsequent section on “Cattle Lameness Classification” will employ all four features (
Cattle lameness classification
Traditional lameness assessment often relies on subjective visual inspection by experts, a process susceptible to inconsistencies and time delays. Machine learning (ML) algorithms offer a compelling alternative by leveraging extracted features from video recordings to objectively analyze cattle movement patterns. This study explores the efficacy of three established ML algorithms: Support Vector Machines (SVM), Random Forests (RF), and Decision Trees (DT), along with AdaBoost and Stochastic Gradient Descent (SGD), for automated cattle lameness classification based on image-derived features.
We prioritized optimizing the classification process for real-time application and reliability. The proposed system was evaluated using the January dataset (Table 11). Notably, AdaBoost achieved the highest overall average accuracy (
Conclusion
This study presents a novel cattle detection and tracking approach leveraging the capabilities of the Detectron2 model. We evaluate its performance against the state-of-the-art (SOTA) YOLOv8 model. Our system demonstrates exceptional performance in cattle region detection, further enhanced by incorporating Intersection over Union (IoU) calculations with frame holding for robust and accurate tracking. Notably, on the validation dataset, the proposed system achieves an accuracy exceeding
Data availability
The datasets generated during and/or analysed during the current study are available from the corresponding author on reasonable request.
Received: 5 April 2024; Accepted: 11 June 2024
Published online: 14 June 2024
Published online: 14 June 2024
References
- Zheng, Z., Zhang, X., Qin, L., Yue, S. & Zeng, P. Cows’ legs tracking and lameness detection in dairy cattle using video analysis and Siamese neural networks. Comput Electron Agric 205, 107618. https://doi.org/10.1016/j.compag.2023.107618 (2023).
- Beggs, D. S. et al. Lame cows on Australian dairy farms: A comparison of farmer-identified lameness and formal lameness scoring, and the position of lame cows within the milking order. J. Dairy Sci. 102(2), 1522-1529 (2019).
- Thompson, A. J. et al. Lameness and lying behavior in grazing dairy cows. J. Dairy Sci. 102(7), 6373-6382 (2019).
- Grimm, K. et al. New insights into the association between lameness, behavior, and performance in Simmental cows. Journal of dairy science 102(3), 2453-2468 (2019).
- Oehm, A. W. et al. A systematic review and meta-analyses of risk factors associated with lameness in dairy cows. BMC Vet. Res. 15(1), 1-14 (2019).
- Jiang, Bo., Song, H. & He, D. Lameness detection of dairy cows based on a double normal background statistical model. Comput. Electron. Agric. 158, 140-149 (2019).
- Randall, L. V. et al. The contribution of previous lameness events and body condition score to the occurrence of lameness in dairy herds: A study of 2 herds. J. Dairy Sci. 101(2), 1311-1324 (2018).
- Horseman, S. V. et al. The use of in-depth interviews to understand the process of treating lame dairy cows from the farmers’ perspective. Anim Welf. 23(2), 157-165 (2014).
- Schlageter-Tello, A. et al. Comparison of locomotion scoring for dairy cows by experienced and inexperienced raters using live or video observation methods. Anim. Welf. 24(1), 69-79. https://doi.org/10.7120/09627286.24.1.069 (2015).
- Chapinal, N. et al. Measurement of acceleration while walking as an automated method for gait assessment in dairy cattle. J Dairy Sci. 94(6), 2895-2901. https://doi.org/10.3168/jds.2010-3882 (2011).
- Bruijnis, M., Beerda, B., Hogeveen, H. & Stassen, E. N. Assessing the welfare impact of foot disorders in dairy cattle by a modeling approach. Anim.: Int. J. Anim. Biosci. 6, 962-70. https://doi.org/10.1017/S1751731111002606 (2012).
- Ouared, K., Zidane, K., Aggad, H. & Niar, A. Impact of clinical lameness on the milk yield of dairy cows. J. Animal Vet. Adv. 14, 10-12 (2015).
- Morris, M. J. et al. Influence of lameness on follicular growth, ovulation, reproductive hormone concentrations and estrus behavior in dairy cows. Theriogenology 76, 658-668 (2011).
- Flower, F. C. & Weary, D. M. Effect of hoof pathologies on subjective assessments of dairy cow gait. J. Dairy Sci. 89, 139-146. https://doi.org/10.3168/jds.S0022-0302(06)72077-X (2006).
- Thomsen, P. T., Munksgaard, L. & Togersen, F. A. Evaluation of a lameness scoring system for dairy cows. J. Dairy Sci. 91, 119-126. https://doi.org/10.3168/jds.2007-0496 (2008).
- Berckmans, D. Image based separation of dairy cows for automatic lameness detection with a real time vision system. in American Society of Agricultural and Biological Engineers Annual International Meeting 2009, ASABE 2009,Vol. 7, pp. 4763-4773. https://doi. org/10.13031/2013.27258 (2009).
- Greenough, P. R. Bovine Laminitis and Lameness, a Hands-on Approach. In Saunders (eds Bergsten, C. et al.) (Elsevier, Amsterdam, The Netherlands, 2007).
- Pluk, A. et al. Evaluation of step overlap as an automatic measure in dairy cow locomotion. Trans. ASABE 53, 1305-1312. https:// doi.org/10.13031/2013.32580 (2010).
- Poursaberi, A., Bahr, C., Pluk, A., Van Nuffel, A. & Berckmans, D. Real-time automatic lameness detection based on back posture extraction in dairy cattle: shape analysis of cow with image processing techniques. Comput. Electron. Agric. 74, 110-119. https:// doi.org/10.1016/j.compag.2010.07.004 (2010).
- Viazzi, S. et al. Analysis of individual classification of lameness using automatic measurement of back posture in dairy cattle.
. Dairy Sci. 96, 257-266. https://doi.org/10.3168/jds.2012-5806 (2013). - Wadsworth, B. A. et al. Behavioral Comparisons Among Lame Versus Sound Cattle Using Precision Technologies. In Precision Dairy Farming Conference (Leeuwarden, The Netherlands, 2016).
- Chapinal, N., de Passillé, A., Weary, D., von Keyserlingk, M. & Rushen, J. Using gait score, walking speed, and lying behavior to detect hoof lesions in dairy cows. J. Dairy Sci. 92(9), 4365-4374. https://doi.org/10.3168/jds.2009-2115 (2009).
- Van Nuffel, A. et al. Lameness detection in dairy cows: Part 1. How to distinguish between non-lame and lame cows based on differences in locomotion or behavior. Animals 5(3), 838-860. https://doi.org/10.3390/ani5030387 (2015).
- Alsaaod, M. et al. Electronic detection of lameness in dairy cows through measuring pedometric activity and lying behavior. Appl. Anim. Behav. Sci. 142, 134-141 (2012).
- Zillner, J. C., Tücking, N., Plattes, S., Heggemann, T. & Büscher, W. Using walking speed for lameness detection in lactating dairy cows. Livestock Sci. 218, 119-123 (2018).
- Song, X. Y. et al. Automatic detection of lameness in dairy cattle-vision-based trackway analysis in cow’s locomotion. Comput. Electron. Agric. 64, 39-44. https://doi.org/10.1016/j.compag.2008.05.016 (2008).
- Wang, Z. Deep learning-based intrusion detection with adversaries. IEEE Access 6, 38367-38384 (2018).
- Zhang, B. et al. Multispectral heterogeneity detection based on frame accumulation and deep learning. IEEE Access 7, 29277-29284 (2019).
- Yang, Y. et al. Video captioning by adversarial LSTM. IEEE Trans. Image Process. 27(11), 5600-5611 (2018).
- Yao, L., Pan, Z. & Ning, H. Unlabeled short text similarity With LSTM Encoder. IEEE Access 7, 3430-3437 (2019).
- Hu, Y., Sun, X., Nie, X., Li, Y. & Liu, L. An enhanced LSTM for trend following of time series. IEEE Access 7, 34020-34030 (2019).
- Matthew, C., Chukwudi, M., Bassey, E. & Chibuzor, A. Modeling and optimization of Terminalia catappa L. kernel oil extraction using response surface methodology and artificial neural network. Artif. Intell. Agric. 4, 1-11 (2020).
- Vinayakumar, R., Alazab, M., Soman, K. P., Poornachandran, P. & Venkatraman, S. Robust intelligent malware detection using deep learning. IEEE Access 7, 46717-46738 (2019).
- Van Hertem, T. et al. Automatic lameness detection based on consecutive 3D-video recordings. Biosyst. Eng. https://doi.org/10. 1016/j.biosystemseng.2014.01.009 (2014).
- Zin, T. T., Maung, S. Z. M. & Tin, P. A deep learning method of edge-based cow region detection and multiple linear classification. ICIC Express Lett. Part B Appl. 13, 405-412 (2022).
- Cho, A. C., Thi, Z. T. & Ikuo, K. Black cow tracking by using deep learning-based algorithms. Bull. Innov. Comput., Inf. Control-B: Appl. 13(12), 1313 (2022).
- Zin, T. T. et al. Automatic cow location tracking system using ear tag visual analysis. Sensors 20(12), 3564. https://doi.org/10.3390/ s20123564 (2020).
- Zin, T. T., Sakurai, S., Sumi, K., Kobayashi, I. & Hama, H. The Identification of dairy cows using image processing techniques. ICIC Express Lett. Part B, Appl.: Int. J. Res. Surv. 7(8), 1857-1862 (2016).
- Mon, S. L. et al. Video-based automatic cattle identification system. In 2022 IEEE 11th Global Conference on Consumer Electronics (GCCE). IEEE (2022).
- Eaindrar, M. W. & Thi, Z. T. Cattle face detection with ear tags using YOLOv5 model. Innov. Comput., Inf. Control Bull.-B: Appl. 14(01), 65 (2023).
- Khin, M. P. et al. Cattle pose classification system using DeepLabCut and SVM model. in 2022 IEEE 11th Global Conference on Consumer Electronics (GCCE). IEEE (2022).
- Thi, T. Z., et al. An intelligent method for detecting lameness in modern dairy industry. in 2022 IEEE 4th Global Conference on Life Sciences and Technologies (LifeTech). IEEE (2022).
- Noe, S. M. et al. A deep learning-based solution to cattle region extraction for lameness detection. in 2022 IEEE 4th Global Conference on Life Sciences and Technologies (LifeTech). IEEE (2022).
- Werema, C. W. et al. Evaluating alternatives to locomotion scoring for detecting lameness in pasture-based dairy cattle in New Zealand: In-parlour scoring. Animals 12(6), 703 (2022).
- Piette, D. et al. Individualised automated lameness detection in dairy cows and the impact of historical window length on algorithm performance. Animal 14(2), 409-417 (2020).
- Jiang, B. et al. Dairy cow lameness detection using a back curvature feature. Comput. Electron. Agric. 194, 106729 (2022).
- Tassinari, P. et al. A computer vision approach based on deep learning for the detection of dairy cows in free stall barn. Comput. Electron. Agric. 182, 106030. https://doi.org/10.1016/j.compag.2021.106030 (2021).
- Taneja, M. et al. Machine learning based fog computing assisted data-driven approach for early lameness detection in dairy cattle. Comput. Electron. Agric. 171, 105286. https://doi.org/10.1016/j.compag. 2020.105286 (2020).
- Zhao, K. et al. Automatic lameness detection in dairy cattle based on leg swing analysis with an image processing technique. Comput. Electron. Agric. 148, 226-236 (2018).
- Thi, T. Z. et al. Artificial Intelligence topping on spectral analysis for lameness detection in dairy cattle. in Proceedings of the Annual Conference of Biomedical Fuzzy Systems Association 35. Biomedical Fuzzy Systems Association (2022).
- San, C. T. et al. Cow lameness detection using depth image analysis. in 2022 IEEE 11th Global Conference on Consumer Electronics (GCCE), Osaka, Japan, pp. 492-493, https://doi.org/10.1109/GCCE56475.2022.10014268 (2022).
- Kranepuhl, M. et al. Association of body condition with lameness in dairy cattle: A single-farm longitudinal study. J. Dairy Res. 88(2), 162-165 (2021).
- Barney, S. et al. Deep learning pose estimation for multi-cattle lameness detection. Sci. Rep. 13(1), 4499 (2023).
- Zhang, K. et al. Early lameness detection in dairy cattle based on wearable gait analysis using semi-supervised LSTM-autoencoder. Comput. Electron. Agric. 213, 108252. https://doi.org/10.1016/j.compag. 2023.108252 (2023).
- Dutta, A., & Zisserman, A. The VIA annotation software for images, audio and video. in Proceedings of the 27th ACM International Conference on Multimedia. (2019).
- Liu, W. et al. SSD: Single shot multibox detector. pp. 21-37 (2016).
- Redmon, J. et al. You only look once: Unified, real-time object detection. in Proceedings of the IEEE Conference on Computer Vision and Pattern Recognition (CVPR) pp. 779-788. (2016).
- Lin, T. Y. et al. Focal loss for dense object detection. in Proceedings of the IEEE International Conference on Computer Vision (ICCV) pp. 2980-2988. (2017).
- Ren, S. et al. Faster R-CNN: Towards real-time object detection with region proposal networks. in Advances in Neural Information Processing Systems (NIPS) pp. 91-99. (2015).
- He, K. et al. Mask R-CNN. in Proceedings of the IEEE International Conference on Computer Vision (ICCV) pp. 2980-2988. (2017).
- Cai, Z., & Vasconcelos, N. Cascade R-CNN: Delving into high-quality object detection. in Proceedings of the IEEE Conference on Computer Vision and Pattern Recognition (CVPR) pp. 6154-6162. (2018).
Acknowledgements
We would like to thank the people concerned from Kunneppu Demonstration Farm for giving every convenience of studying on the farm and their valuable advice.
Author contributions
Conceptualization, B.B.M., T.T.Z. and P.T.; methodology, B.B.M., T.T.Z. and P.T.; software, B.B.M; investigation, B.B.M., T.O., M.A., I.K., P.T. and T.T.Z.; resources, T.T.Z.; data curation, B.B.M., T.O. and M.A.; writing-original draft preparation, B.B.M.; writing-review and editing, T.T.Z. and P.T.; visualization, B.B.M., T.T.Z. and P.T.; supervision, T.T.Z.; project administration, T.T.Z. All authors reviewed the manuscript.
Funding
This publication was subsidized by JKA through its promotion funds from KEIRIN RACE. This work was supported in part by “The Development and demonstration for the realization of problem-solving local 5G” from the Ministry of Internal Affairs and Communications and the Project of “the On-farm Demonstration Trials of Smart Agriculture” from the Ministry of Agriculture, Forestry and Fisheries (funding agency: NARO).
Competing interests
The authors declare no competing interests.
Additional information
Correspondence and requests for materials should be addressed to T.T.Z.
Reprints and permissions information is available at www.nature.com/reprints.
Publisher’s note Springer Nature remains neutral with regard to jurisdictional claims in published maps and institutional affiliations.
Reprints and permissions information is available at www.nature.com/reprints.
Publisher’s note Springer Nature remains neutral with regard to jurisdictional claims in published maps and institutional affiliations.
Open Access This article is licensed under a Creative Commons Attribution 4.0 International License, which permits use, sharing, adaptation, distribution and reproduction in any medium or format, as long as you give appropriate credit to the original author(s) and the source, provide a link to the Creative Commons licence, and indicate if changes were made. The images or other third party material in this article are included in the article’s Creative Commons licence, unless indicated otherwise in a credit line to the material. If material is not included in the article’s Creative Commons licence and your intended use is not permitted by statutory regulation or exceeds the permitted use, you will need to obtain permission directly from the copyright holder. To view a copy of this licence, visit http://creativecommons.org/licenses/by/4.0/.
© The Author(s) 2024
© The Author(s) 2024
Graduate School of Engineering, University of Miyazaki, Miyazaki 889-2192, Japan. Organization for Learning and Student Development, University of Miyazaki, Miyazaki 889-2192, Japan. Sumiyoshi Livestock Science Station, Field Science Center, Faculty of Agriculture, University of Miyazaki, Miyazaki 889-0121, Japan. email: thithi@cc.miyazaki-u.ac.jp