DOI: https://doi.org/10.1186/s13065-025-01486-2
PMID: https://pubmed.ncbi.nlm.nih.gov/40346688
تاريخ النشر: 2025-05-09
تقديم مؤشر تقليل البصمة الكربونية (CaFRI) كأداة مدعومة بالبرمجيات للمختبرات الأكثر خضرة في التحليل الكيميائي
الملخص
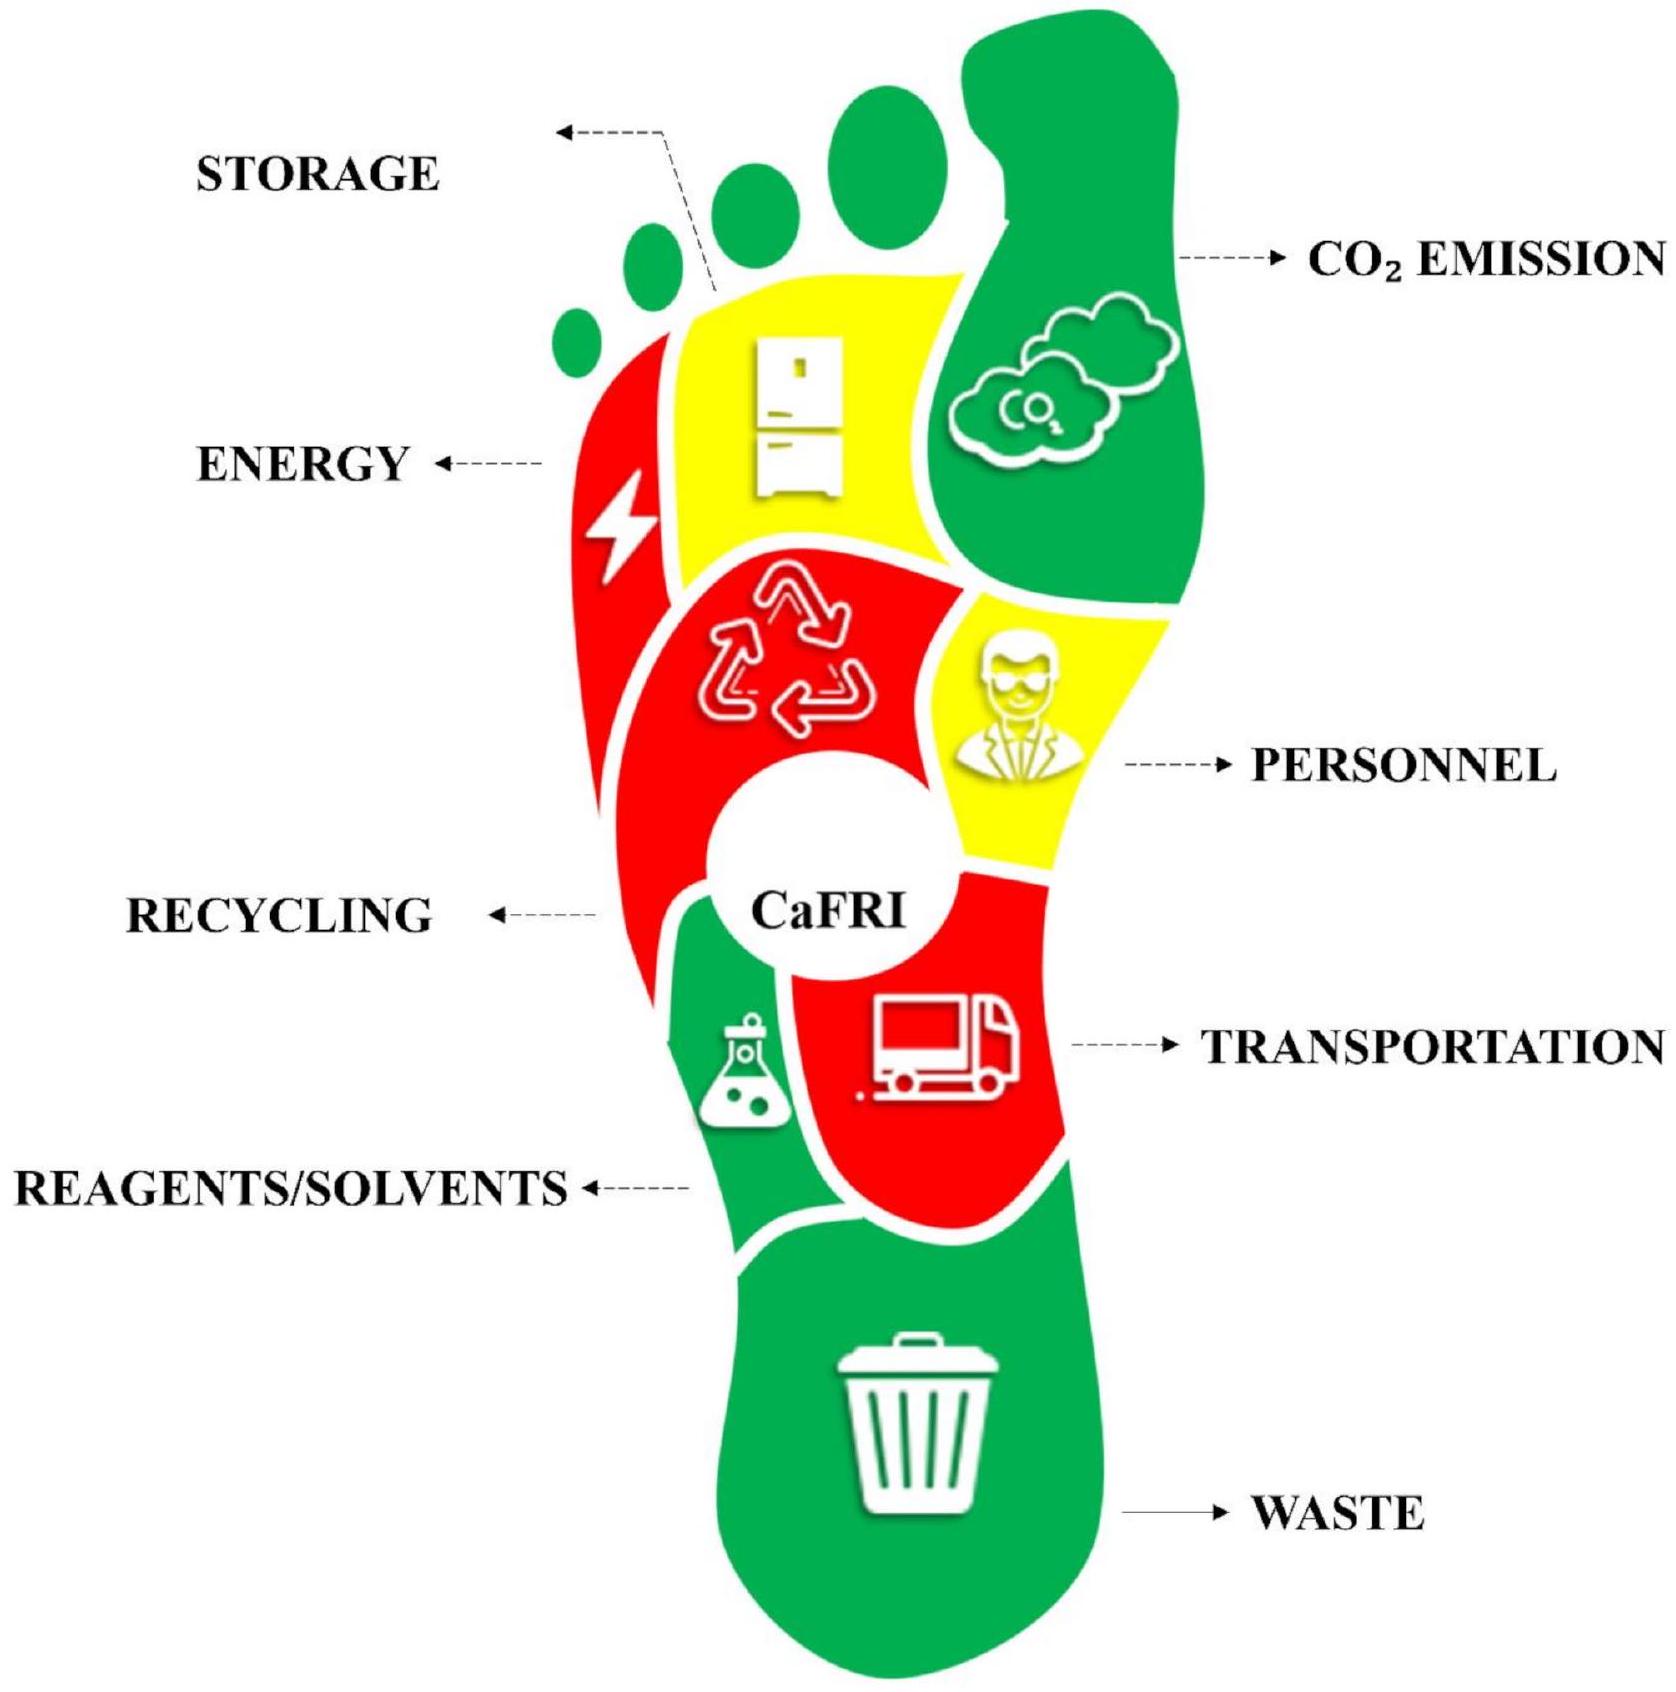
تم تقديم مؤشر تقليل البصمة الكربونية (CaFRI) كأداة ويب جديدة تم تطويرها لتقييم وتعزيز استدامة الطرق التحليلية، مع التركيز على تقدير انبعاثات غازات الدفيئة (متاحة علىbit.ly/CaFRI). بينما توجد العديد من الأدوات لتقييم الخضرة، إلا أنه لا يوجد أي منها يتناول بصراحة بصمة الكربون لإجراءات المختبر. يملأ CaFRI هذه الفجوة من خلال تقديم نهج موحد يتنبأ بفعالية استراتيجيات تقليل بصمة الكربون. ويخصص تصنيفًا رقميًا بناءً على
*المراسلة:
فتوح ر. منصور
fotouhrashed@pharm.tanta.edu.eg
مقدمة
تؤدي الأحداث المناخية المتطرفة، واضطراب النظم البيئية. تشير المستويات المرتفعة من بصمات الكربون أيضًا إلى خطر انبعاث الملوثات في الغلاف الجوي، وتحمض المحيطات، واستنزاف الغابات، مما يؤدي إلى تدمير المواطن، وانخفاض التنوع البيولوجي، وتأثيرات ضارة على النظم البيئية. علاوة على ذلك، يمكن أن تؤدي المستويات المرتفعة من انبعاثات غازات الدفيئة الناتجة عن بصمات الكربون العالية إلى ظهور أمراض تنفسية، واضطرابات قلبية وعائية، ومضاعفات صحية أخرى نتيجة تلوث الهواء وسوء جودة الهواء. لهذه الأسباب، من الضروري تقليل الآثار البيئية والانتقال نحو مستقبل أكثر استدامة لكل من النظم البيئية والمجتمعات البشرية. يمكن تحقيق ذلك من خلال تقليل بصمات الكربون من خلال ممارسات مستدامة، وكفاءة الطاقة، واعتماد الطاقة المتجددة، وتقليل النفايات، وأنشطة الحفظ.
لا توجد تهديدات مرتبطة مباشرة بالتأثير الكيميائي للمواد الكيميائية والمذيبات المستخدمة.
ظهرت بعض المبادرات والأدوات لتقييم ومراقبة بصمات الكربون، مثل GES 1.5 [15] وصندوق الكربون البريطاني [16]. GES 1.5 هو تطبيق ويب مفتوح المصدر مصمم لتقدير وتقليل بصمة الكربون لمختبرات البحث، والأقسام، والفرق من خلال تحليل مصادر الانبعاثات مثل المباني، والتنقل، والأجهزة الرقمية، والسفر المهني. في الوقت نفسه، يعمل صندوق الكربون على نطاق أوسع، حيث يتعاون مع الشركات والمنظمات العامة لدعم مبادرات تقليل الكربون وتعزيز الابتكار من أجل اقتصاد منخفض الكربون. بينما تسهم كلا الأداتين بشكل كبير في جهود الاستدامة، فإنهما تعملان على مستوى مؤسسي أو تنظيمي بدلاً من معالجة الانبعاثات على المستوى الدقيق لإجراءات التحليل المحددة.
مؤشر تقليل البصمة الكربونية (CaFRI)
| معامل | خيارات | نقاط |
| طاقة | ||
| تم تكييف برنامج تقليل الطاقة أو مصادر الطاقة النظيفة في جميع الإجراءات | نعم | ٤ |
| لا | 1 | |
| إجمالي استهلاك الطاقة الكهربائية للأجهزة التحليلية |
|
٥ |
|
|
٣ | |
|
|
1 | |
| المعدات غير التحليلية التي تستهلك الطاقة بشكل كبير ضرورية (خزانات الغازات، مكيفات الهواء) | نعم | 1 |
| لا | ٤ | |
| عدد العينات التي تم تحليلها في الساعة | > 30 عينة/ساعة | ٣ |
| 10-30 عينة/ساعة | ٢ | |
| < 10 عينات/ساعة | 1 | |
|
|
||
| البصمة الكربونية للطاقة الكهربائية للأدوات التحليلية معروفة | نعم | ٤ |
| لا | 1 | |
| عامل الانبعاث |
|
٥ |
|
|
٣ | |
|
|
1 | |
| تخزين | ||
| تخزين العينات | لم يكن هناك حاجة للتخزين | ٣ |
| التخزين في ظروف عادية (الثلاجات) | 2 | |
| التخزين تحت ظروف خاصة (مجمدات عميقة، فراغ، ضغط عال) | 1 | |
| النقل | ||
| يجب نقل العينة إلى مختبر تحليلي | لا | 2 |
| نعم | 1 | |
| المسافة بين حقل العينة والمختبر | < 1 ميل | ٣ |
| 1-10 أميال | 2 | |
| > 10 أميال | 1 | |
| عدد العينات المنقولة في شحنة واحدة | > 100 عينة لكل شحنة | ٤ |
| 11-100 عينة لكل شحنة | ٣ | |
| 2-10 عينات لكل شحنة | 2 | |
| عينة واحدة لكل شحنة | 1 | |
| يتم استخدام مركبة صديقة للبيئة في النقل | نعم | 2 |
| لا | 1 | |
| الموارد البشرية | ||
| عدد الأفراد المطلوبين لتحليل عينة واحدة | شخص واحد | ٤ |
| 2-3 أشخاص | ٣ | |
| 4-5 أشخاص | 2 | |
| > 5 أشخاص | 1 | |
| الأتمتة | تلقائي | ٣ |
| نصف آلي | ٢ | |
| دليل | 1 | |
| نفايات | ||
| كمية النفايات |
|
٣ |
|
|
٢ | |
|
|
1 | |
| التخلص من النفايات | التخلص من النفايات بواسطة موظفين/كيان متخصص | ٣ |
| التخلص من النفايات بواسطة المحلل | 2 | |
| لا يتم إجراء أي التخلص من النفايات | 1 | |
| إعادة التدوير | ||
| تستخدم الطريقة مواد كيميائية/مذيبات معاد تدويرها من نفس الطريقة | ٣ | |
| معامل | خيارات | نقاط |
| تستخدم الطريقة مواد كيميائية/مذيبات معاد تدويرها من طرق أخرى | ٢ | |
| لا يتم إجراء أي إعادة تدوير | 1 | |
| المُعَادِلات/المُذِيبَات | ||
| إجمالي عدد الرموز التصويرية |
|
٤ |
| ٤-٦ | ٣ | |
| ٧-٩ | ٢ | |
| >9 | 1 | |
| إجمالي كمية المذيبات العضوية لكل عينة |
|
٣ |
|
|
2 | |
|
|
1 | |
| إجمالي كمية المواد الكيميائية لكل عينة |
|
٣ |
|
|
2 | |
|
|
1 | |
استهلاك الطاقة
العمليات. في الخطوة الثانية، يتم أخذ معدل الإنتاج في الاعتبار، حيث أن إجمالي الطلب على الطاقة لكل عينة يعتمد على كل من الأجهزة ومدة استخدامها. قد تكون الحسابات التفصيلية التي تأخذ في الاعتبار كل جهاز ووقت تشغيله بشكل مستقل مشكلة، لذلك، للحفاظ على سهولة الاستخدام، يتم إجراء التقييم بطريقة مبسطة. لتسهيل تقدير الطاقة الكهربائية، تسرد الجدول 2 المعدات التحليلية الشائعة المختلفة. تستند هذه البيانات إلى التقييم الذاتي من قبل مهندسين كيميائيين مستقلين. يجب أيضًا ملاحظة أنه إذا لم يكن من الممكن تقدير استهلاك الطاقة للجهاز المعطى بدقة أو التحقق منه تجريبيًا (باستخدام، على سبيل المثال، مقياس الطاقة)، يجب اعتبار القيمة القصوى الممكنة للطاقة الكهربائية في الحسابات.
بالإضافة إلى ذلك، تعتبر المعدات غير التحليلية التي تستهلك الطاقة بشكل مكثف مثل هودات الدخان ومكيفات الهواء ضرورية لضمان أن خطة تقدير الطاقة المقترحة شاملة. إذا لم تتطلب الإجراءات التحليلية استخدامها، يتم منح عدد نقاط أعلى.
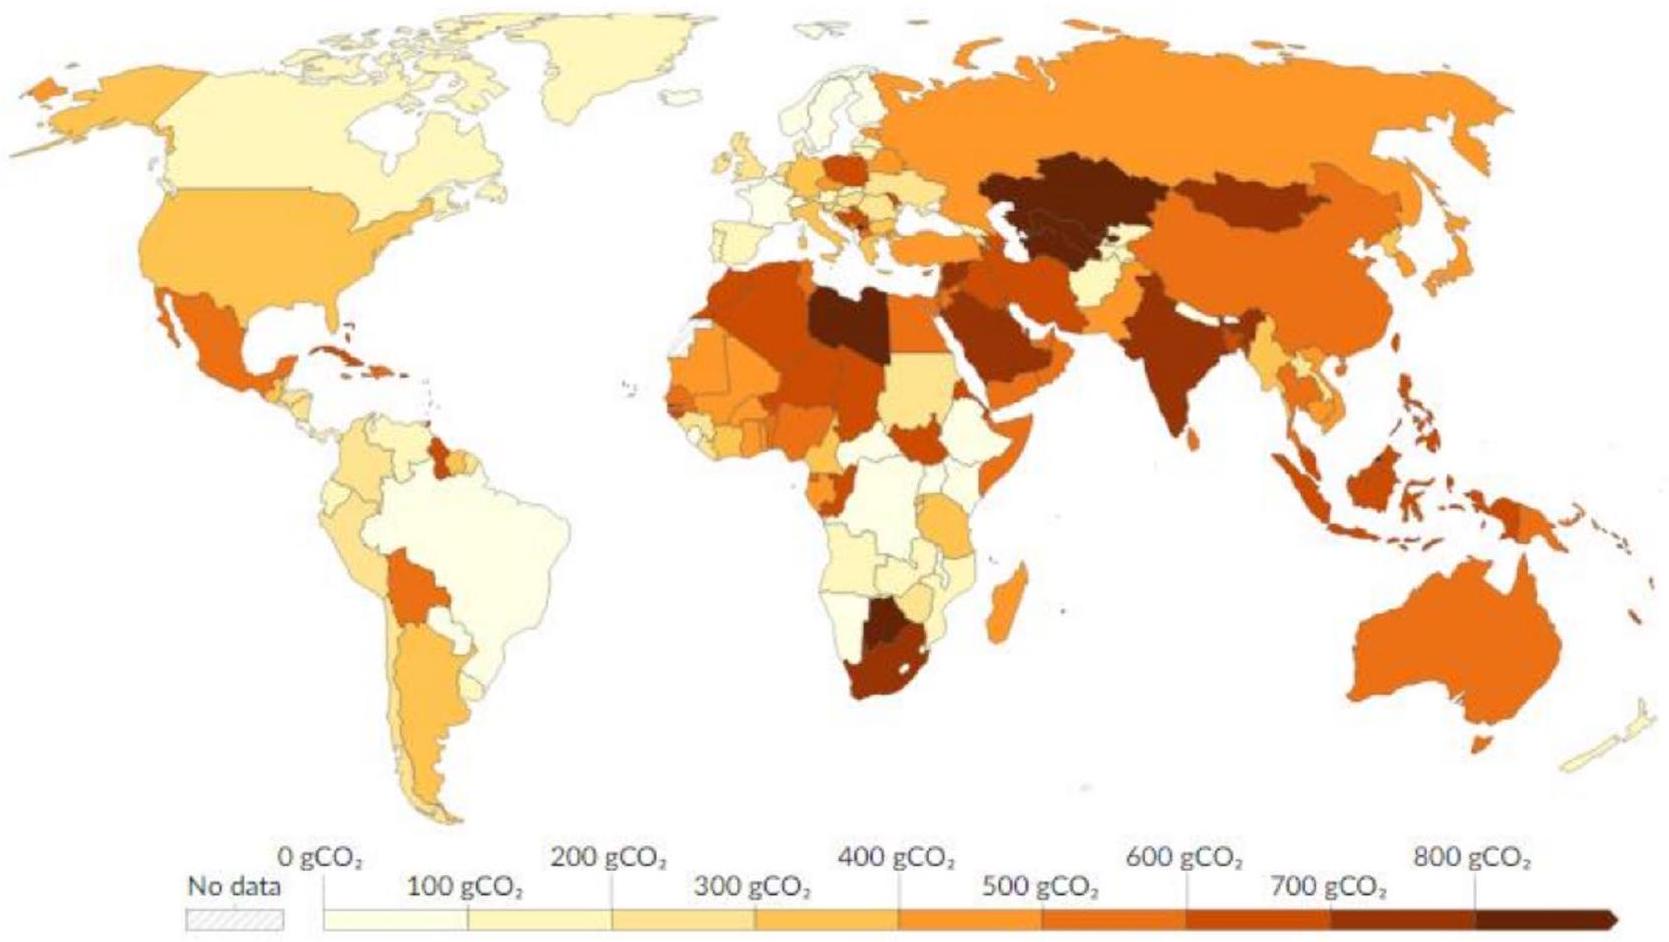
انبعاثات غازات الدفيئة لكل كيلووات ساعة من الكهرباء المنتجة في دول ومناطق مختلفة. إنه يعد موردًا قيمًا لتقييم مستويات الانبعاثات وتتبع التقدم نحو الانتقال إلى مصادر الطاقة الأكثر استدامة. الشكل 2 يوضح كثافة الكربون الخاصة بكل دولة، معبرًا عنها بالجرامات من
عينة التخزين
| الأداة | الطاقة المتوقعة (kW) |
| HPLC (الكروماتوغرافيا السائلة عالية الأداء) | 0.5-1.5 |
| UHPLC (الكروماتوغرافيا السائلة فائقة الأداء) | 0.8-2.0 |
| LC-MS (الكروماتوغرافيا السائلة-مطيافية الكتلة) | 1.0-3.0 |
| GC (الكروماتوغرافيا الغازية) | 1.0-2.5 |
| GC/MS (الكروماتوغرافيا الغازية-مطيافية الكتلة) | 1.5-3.5 |
| UV/Vis (الأشعة فوق البنفسجية-المرئية) مطياف | 0.1-0.3 |
| مطياف الفلورية | 0.2-0.5 |
| مقياس الجهد | 0.05-0.1 |
| مقياس الجهد الكهربائي | 0.05-0.1 |
| مقياس الجهد القطبي | 0.05-0.1 |
| التحليل الكهربائي الشعري | 0.2-1.5 |
| ICP/MS (مطيافية الكتلة البلازمية المقترنة بالحث) | 2.0-5.0 |
| AAS (مطيافية الامتصاص الذري) | 0.5-1.5 |
| FTIR (مطيافية الأشعة تحت الحمراء لتحويل فورييه) | 0.1-0.3 |
| مطياف رامان | 0.1-0.4 |
| NMR (الرنين المغناطيسي النووي) | 1.5-4.0 |
| محلل TOC (الكربون العضوي الكلي) | 0.1-0.5 |
كان التخزين في تجميد عميق
النقل
الأفراد
إدارة النفايات
إعادة التدوير
استهلاك الموارد وتقليل إنتاج النفايات، مما يؤدي إلى درجات أعلى في المؤشر. تنخفض التقييمات للمختبرات التي تستخدم مواد كيميائية/مذيبات معاد تدويرها من طرق أخرى. تُعطى أدنى درجة للمرافق التي لا يتم فيها إجراء أي إعادة تدوير. تشجع CaFRI المختبرات على تنفيذ طرق الحفاظ على الموارد والمساهمة في نهج أكثر خضرة واستدامة في التحليل الكيميائي من خلال منح درجات تعكس جهودهم في إعادة التدوير.
المواد الكيميائية والمذيبات
دراسات الحالة
تم استخدام دراسة الحالة الأولى الطيف الضوئي لقياس كمية البوليدوكانول، وهو مركب طبي يصعب قياسه ويفتقر إلى الخصائص الكروموفورية. كانت مبدأ الاختبار قائمًا على إنشاء معقد ثلاثي بين البوليدوكانول ومعقد كobalt(II)thiocyanate، والذي يمكن نقله إلى طبقة من ثنائي كلورو الميثان. قام الباحثون بقياس كمية البوليدوكانول بدقة من خلال قياس امتصاصه عند 320 نانومتر. كانت كمية النفايات الناتجة محدودة، أقل من 10 مل. ومع ذلك، لم يتم الإبلاغ عن أي مبادرة للتخلص من النفايات.
تم استخدام دراسة الحالة الثانية مادة هجينة تتكون من السليلوز المجهري وإطار عضوي معدني (MOF) لأداء استخراج الطور الصلب المشتت بشكل فعال للريتونافير من بلازما الإنسان. كانت المركبات تعمل كمواد ماصة فعالة، مما يسهل استرجاع الريتونافير من بلازما الإنسان للتحليل اللاحق. كانت كمية النفايات ضئيلة.
أكثر من 1.5 كيلو واط. بالنسبة للأفراد، كان مطلوبًا شخصان لكل تحليل عينة باستخدام جهاز HPLC/UV. كانت قدرة معالجة العينات 4 عينات في الساعة ولم يتم قياس البصمة الكربونية. تم تحديد عامل الانبعاثات ليتجاوز 0.3 كجم، وفقًا للبيانات المبلغ عنها. كان استخدام الكواشف والمذيبات فعالًا، حيث كان أقل من 5 مل من المذيبات العضوية وأقل من 1 جرام من الكواشف لكل عينة، وكان هناك ثلاثة رموز تصويرية للمذيبات/ الكواشف المستخدمة. كانت تخزين العينات في
في دراسة الحالة الثالثة، قدم المحللون طريقة لتحديد المولنوبيرافير عبر نقاط الكربون الكمومية، التي تم تصنيعها من قشر البيض. كانت كمية النفايات
استخدمت دراسة الحالة الرابعة المنثول كعامل فصل بين الطورين في السائلين المتجانسين.
استخراج الميكرو من الفافيبيرافير من بلازما الإنسان قبل قياسه بواسطة HPLC/UV [28]. كانت كمية النفايات
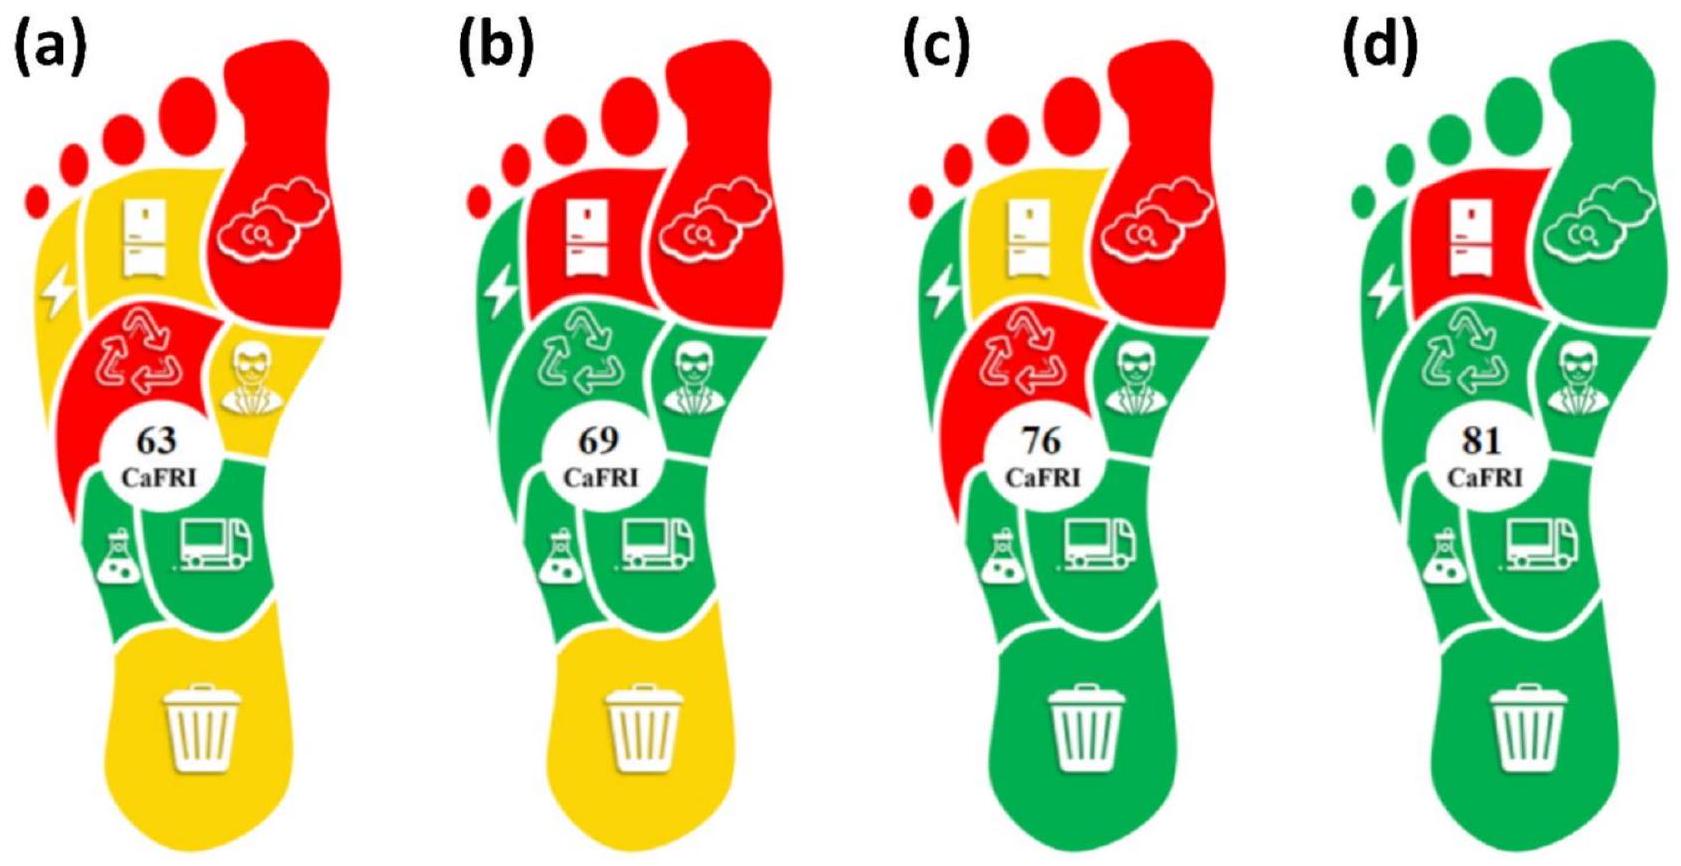
لأغراض المقارنة، تم تقييم البصمة الكربونية لطريقة بديلة لتحديد نفس المادة (فافيبيرافير) [29]، مما أسفر عن إجمالي درجة CaFRI قدرها 62 (الشكل S1). يمكن أن يُعزى هذا الدرجة المتوسطة نسبيًا إلى استخدام تقنية LC-MS/MS التي تتطلب طاقة عالية، والتي تحتاج إلى موظفين متخصصين للتشغيل. يمكن بذل المزيد من الجهود لتقليل
تشير النتائج إلى وجود اختلافات كبيرة في الاحتياطات المستخدمة لتقليل البصمة الكربونية بين الطرق. تظهر الطريقتان الأوليان تدابير مقبولة، مع درجات CaFRI المحسوبة بين 50 و74. بالمقابل، تظهر الطريقتان الثالثة والرابعة جهودًا ملحوظة في تقليل البصمة الكربونية، كما يتضح من الدرجات التي تبلغ 75 أو أعلى. أشارت هذه الدراسات الحالة إلى أن المعايير الرئيسية لدرجات CaFRI هي استهلاك الطاقة و
مقارنة مع طرق واستراتيجيات تتبع البصمة الكربونية الأخرى
الخاتمة
دراسات الحالة أيضًا تؤكد قدرة CaFRI على تسهيل التغيير الإيجابي وتشجيع الاستدامة في بيئات المختبر. مثل أي نموذج تقييم، ينطوي CaFRI على هامش معين من عدم اليقين والذاتية. لمعالجة عدم اليقين وتعزيز الموثوقية، نوصي بأن يقوم اثنان على الأقل من المقيمين المستقلين بتقييم كل طريقة بشكل منفصل. إذا كانت هناك أي تناقضات أو شكوك في عدد النقاط الممنوحة بين المقيمين، يجب التوصل إلى توافق من خلال مناقشة مفتوحة ويجب تقديم التقييم المتفق عليه في التقييم النهائي. قد تساعد هذه الطريقة في تقليل الذاتية، وضمان تقييم أكثر موثوقية وقابلية للتكرار للبصمة الكربونية، وتحسين اتساق درجات CaFRI عبر مختبرات مختلفة. من خلال اعتماد هذه المقياس، يمكن لمختبرات الكيمياء التحليلية أن تتخذ المبادرة في قيادة تطوير مستقبل أكثر استدامة للمجتمع العلمي وما بعده.
معلومات إضافية
مساهمات المؤلفين
التمويل
توفر البيانات
الإعلانات
موافقة الأخلاقيات والموافقة على المشاركة
الموافقة على النشر
إرشادات أخلاقية
المصالح المتنافسة
التوفر والمتطلبات
اسم المشروع: CaFRI.
الصفحة الرئيسية للمشروع: https://bit.ly/CaFRI.
أنظمة التشغيل: هذا المشروع هو تطبيق ويب ويمكن تشغيله على أي نظام تشغيل مع متصفح.
لغات البرمجة: HTML و CSS و JavaScript.
متطلبات أخرى: يتطلب متصفح ويب حديث (مثل Chrome أو Firefox أو Edge).
تم النشر عبر الإنترنت: 09 مايو 2025
References
- Yaman C. A review on the process of greenhouse gas inventory Preparation and proposed mitigation measures for reducing carbon footprint. Gases. 2024;4:18-40.
- Müller LJ, Kätelhön A, Bringezu S, McCoy S, Suh S, Edwards R, et al. The carbon footprint of the carbon feedstock CO 2. Energy Environ Sci. 2020;13:2979-92.
- Tolppanen S, Kang J. The effect of values on carbon footprint and attitudes towards pro-environmental behavior. J Clean Prod. 2021;282:124524.
- Sajid M, Płotka-Wasylka J. Green analytical chemistry metrics: A review. Talanta. 2022;238:123046.
- Nowak PM, Wietecha-Posłuszny R, Pawliszyn J. White analytical chemistry: an approach to reconcile the principles of green analytical chemistry and functionality. TrAC – Trends Anal Chem. 2021;138:116223.
- Pena-Pereira F, Wojnowski W, Tobiszewski M. AGREE—Analytical greenness metric approach and software. Anal Chem. 2020;92:10076-82.
- Płotka-Wasylka J. A new tool for the evaluation of the analytical procedure: green analytical procedure index. Talanta. 2018;181:204-9.
- Mansour FR, Płotka-Wasylka J, Locatelli M, Modified GAPI (MoGAPI) Tool and Software for the Assessment of Method Greenness, editors. Case Studies and Applications. Analytica. 2024;5:451-7.
- Mansour FR, Omer KM, Płotka-Wasylka J. A total scoring system and software for complex modified GAPI (ComplexMoGAPI) application in the assessment of method greenness. Green Anal Chem. 2024;10:100126.
- Gałuszka A, Migaszewski ZM, Konieczka P, Namieśnik J. Analytical Eco-Scale for assessing the greenness of analytical procedures. TrAC Trends Anal Chem. 2012;37:61-72.
- Nowak PM, Wietecha-Posłuszny R, Płotka-Wasylka J, Tobiszewski M. How to evaluate methods used in chemical laboratories in terms of the total chemical risk? – a ChlorTox scale. Green Anal Chem. 2023;5:100056.
- Sizirici B, Fseha Y, Cho C-S, Yildiz I, Byon Y-J. A review of carbon footprint reduction in construction industry, from design to operation. Mater (Basel). 2021;14:6094.
- Nowak PM, Bis A, Rusin M, Woźniakiewicz M. Carbon footprint of the analytical laboratory and the three-dimensional approach to its reduction. Green Anal Chem. 2023;4:100051.
- Nowak PM. What does it mean that something is green? The fundamentals of a unified greenness theory. Green Chem. 2023;25:4625-40.
- Mariette J, Blanchard O, Berné O, Aumont O, Carrey J, Ligozat A, et al. An open-source tool to assess the carbon footprint of research. Environ Res Infrastruct Sustain. 2022;2:035008.
- Kern F. The discursive politics of governing transitions towards sustainability: the UK carbon trust. Int J Sustain Dev. 2012;15(1/2):90.
- Zib L, Byrne DM, Marston LT, Chini CM. Operational carbon footprint of the U.S. Water and wastewater sector’s energy consumption. J Clean Prod. 2021;321:128815.
- Shaikh A, Uddin M, Elmagzoub MA, Alghamdi A. PEMC: power efficiency measurement calculator to compute power efficiency and
emissions in cloud data centers. IEEE Access. 2020;8:195216-28. - Ember and Energy Institute. Carbon intensity of electricity generation. Our World in Data. 2023. https://ourworldindata.org/grapher/carbon-intensity-el ectricity
- Ghosh A. Possibilities and challenges for the inclusion of the electric vehicle (EV) to reduce the carbon footprint in the transport sector: A review. Energies. 2020;13:2602.
- Tao Y, Yang L, Jaffe S, Amini F, Bergen P, Hecht B, et al. Climate mitigation potentials of teleworking are sensitive to changes in lifestyle and workplace rather than ICT usage. Proc Natl Acad Sci. 2023;120:e2304099120.
- Bhatia L, Jha H, Sarkar T, Sarangi PK. Food waste utilization for reducing carbon footprints towards sustainable and cleaner environment: A review. Int J Environ Res Public Health. 2023;20:2318.
- Tams L, Nehls T, Calheiros CSC. Rethinking green roofs- natural and recycled materials improve their carbon footprint. Build Environ. 2022;219:109122.
- Jatkowska N, Marć M, de la Guardia M, Gallart D, Płotka-Wasylka J. Greening procedures and analytical parameters. The polychlorinated naphthalenes analysis in complex matrices as proof of concept. TrAC Trends Anal Chem. 2023;167:117222.
- Habib A, Mabrouk MM, Hamed NA, Mansour FR. An innovative spectrophotometric method for determination of polidocanol in pharmaceutical ampoules using phase equilibrium measurements. Microchem J. 2020;158:105141.
- Mansour FR, Abdelhameed RM, Hammad SF, Abdallah IA, Bedair A, Locatelli M. A microcrystalline cellulose/metal-organic framework hybrid for enhanced Ritonavir dispersive solid phase Microextraction from human plasma. Carbohydr Polym Technol Appl. 2024;7:100453.
- Kannouma RE, Kamal AH, Hammad MA, Mansour FR. Incorporation of eggshell waste in the Preparation of carbon quantum Dot nanoprobes for
the determination of COVID-19 antiviral drug; molnupiravir. Microchem J. 2024;198:110397. - Abdallah IA, Hammad SF, Bedair A, Mansour FR. Menthol-assisted homogenous liquid-liquid Microextraction for HPLC/UV determination of favipiravir as an antiviral for COVID-19 in human plasma. J Chromatogr B. 2022;1189:123087.
- Challenger E, Penchala SD, Hale C, Fitzgerald R, Walker L, Reynolds H, et al. Development and validation of an LC-MS/MS method for quantification of favipiravir in human plasma. J Pharm Biomed Anal. 2023;233:115436.
ملاحظة الناشر
DOI: https://doi.org/10.1186/s13065-025-01486-2
PMID: https://pubmed.ncbi.nlm.nih.gov/40346688
Publication Date: 2025-05-09
Introducing the carbon footprint reduction index (CaFRI) as a software-supported tool for greener laboratories in chemical analysis
Abstract
Carbon Footprint Reduction Index (CaFRI) has been presented as a newly developed web tool designed to assess and enhance the sustainability of analytical methods, with a focus on estimating greenhouse gas emissions (available at bit.ly/CaFRI). While many tools exist for evaluating greenness, none specifically address the carbon footprint of laboratory procedures. CaFRI fills this gap by providing a standardized approach that predicts the effectiveness of carbon footprint reduction strategies. It assigns a numerical rating based on direct
*Correspondence:
Fotouh R. Mansour
fotouhrashed@pharm.tanta.edu.eg
Introduction
extreme weather events, and disturbance of ecosystems. Elevated levels of carbon footprints indicate also the risk of emission of pollutants into the atmosphere, the acidification of oceans, and the depletion of forests, resulting in the destruction of habitats, the decline of biodiversity, and detrimental impacts on ecosystems [3]. Moreover, elevated levels of greenhouse gas emissions resulting from high carbon footprints can give rise to respiratory ailments, cardiovascular disorders, and other health complications as a consequence of air pollution and inadequate air quality. For these reasons, it is crucial to reduce the environmental impacts and undertake transition towards a more sustainable future for both ecosystems and human societies. This can be achieved by reducing carbon footprints through sustainable practices, energy efficiency, renewable energy adoption, waste reduction, and conservation activities.
of threats directly related to the chemical impact of the reagents and solvents used.
A few initiatives and tools have emerged to assess and monitor carbon footprints, such as GES 1.5 [15] and the UK Carbon Trust [16]. GES 1.5 is an open-source web application designed to estimate and reduce the carbon footprint of research labs, departments, and teams by analyzing emission sources like buildings, commuting, digital devices, and professional travel. Meanwhile, the Carbon Trust operates on a broader scale, working with businesses and public organizations to support carbon reduction initiatives and foster innovation for a low-carbon economy. While both tools contribute significantly to sustainability efforts, they function at an institutional or organizational level rather than addressing emissions at the granular level of specific analytical procedures.
Carbon footprint reduction index (CaFRI)
| Parameter | Choices | Points |
| ENERGY | ||
| An energy reduction program or clean energy sources are adapted throughout the procedures | Yes | 4 |
| No | 1 | |
| Total electrical power use of analytical instruments |
|
5 |
|
|
3 | |
|
|
1 | |
| Energy-intensive non-analytical equipment is essential (fume hood, air conditioners) | Yes | 1 |
| No | 4 | |
| Number of samples analyzed per hour | > 30 samples/h | 3 |
| 10-30 samples/h | 2 | |
| < 10 samples/h | 1 | |
|
|
||
| The carbon footprint of the electrical power of analytical instruments is known | Yes | 4 |
| No | 1 | |
| Emission factor |
|
5 |
|
|
3 | |
|
|
1 | |
| STORAGE | ||
| Sample Storage | No storage was required | 3 |
| Storage under normal conditions (refrigerators) | 2 | |
| Storage under special conditions (deep freezers, vacuum, high pressure) | 1 | |
| TRANSPORTATION | ||
| The sample has to be transported to an analytical Laboratory | No | 2 |
| Yes | 1 | |
| Distance between the sample field and the laboratory | < 1 mile | 3 |
| 1-10 miles | 2 | |
| > 10 miles | 1 | |
| Number of samples transported in one shipment | > 100 samples per shipment | 4 |
| 11-100 samples per shipment | 3 | |
| 2-10 samples per shipment | 2 | |
| 1 sample per shipment | 1 | |
| An ecofriendly vehicle is used in transportation | Yes | 2 |
| No | 1 | |
| PERSONNEL | ||
| Number of personnel required for one sample analysis | 1 person | 4 |
| 2-3 persons | 3 | |
| 4-5 persons | 2 | |
| > 5 persons | 1 | |
| Automation | automatic | 3 |
| semiautomatic | 2 | |
| manual | 1 | |
| WASTE | ||
| Waste amount |
|
3 |
|
|
2 | |
|
|
1 | |
| Waste disposal | Waste disposal by a specialized personnel/entity | 3 |
| Waste disposal by the analyst | 2 | |
| No waste disposal is performed | 1 | |
| RECYCLING | ||
| The method employs recycled reagents/solvents from the same method | 3 | |
| Parameter | Choices | Points |
| The method employs recycled reagents/solvents from other methods | 2 | |
| No recycling is performed | 1 | |
| REAGENTS/SOLVENTS | ||
| Total number of pictograms |
|
4 |
| 4-6 | 3 | |
| 7-9 | 2 | |
| >9 | 1 | |
| Total amount of organic solvents per sample |
|
3 |
|
|
2 | |
|
|
1 | |
| Total amount of reagents per sample |
|
3 |
|
|
2 | |
|
|
1 | |
Energy consumption
operations. In the second step sample throughput is considered, since the total energy demand per sample depends both on instruments and on how long they are used. The detailed calculation considering independently each device and its operation time could be problematic, therefore, to maintain user-friendliness, the assessment is done in the simplified way. To facilitate estimation of electric power, Table 2 lists the various popular analytical equipment. These data are based on self-assessment by two independent chemical engineers. It should also be noted that if the energy consumption of the given instrument could not be accurately estimated or verified experimentally (using e.g. wattmeter), the maximum possible value of electric power should be considered in the calculations.
Additionally, the energy intensive non-analytical equipment such as fuming hoods and air conditioners are considered to ensure that the proposed energy estimation scheme is comprehensive. If the analytical procedure does not require them, a higher point number is awarded.
greenhouse gas emissions per kilowatt-hour of electricity produced for various countries and regions. It serves as a valuable resource for assessing emission levels and tracking the progress of transitioning to more sustainable energy sources. Figure 2 shows the country-specific carbon intensity, expressed in g of
Sample storage
| Instrument | Expected power (kW) |
| HPLC (High-Performance Liquid Chromatography) | 0.5-1.5 |
| UHPLC (Ultra-High-Performance Liquid Chromatography) | 0.8-2.0 |
| LC-MS (Liquid Chromatography-Mass Spectrometry) | 1.0-3.0 |
| GC (Gas Chromatography) | 1.0-2.5 |
| GC/MS (Gas Chromatography-Mass Spectrometry) | 1.5-3.5 |
| UV/Vis (Ultraviolet-Visible) Spectrophotometer | 0.1-0.3 |
| Spectrofluorometer | 0.2-0.5 |
| Potentiometer | 0.05-0.1 |
| Voltamograph | 0.05-0.1 |
| Polarograph | 0.05-0.1 |
| Capillary Electrophoresis | 0.2-1.5 |
| ICP/MS (Inductively Coupled Plasma Mass Spectrometry) | 2.0-5.0 |
| AAS (Atomic Absorption Spectroscopy) | 0.5-1.5 |
| FTIR (Fourier Transform Infrared Spectroscopy) | 0.1-0.3 |
| Raman Spectrometer | 0.1-0.4 |
| NMR (Nuclear Magnetic Resonance) | 1.5-4.0 |
| TOC Analyzer (Total Organic Carbon) | 0.1-0.5 |
the storage in deep freeze
Transportation
Personnel
Waste management
Recycling
resource consumption and lower trash output, resulting in higher scores of the index. The ratings decline for laboratories that employ recycled reagents/solvents from other methods. The lowest score is assigned to facilities where no recycling is performed. The CaFRI encourages laboratories to implement resource conservation methods and contribute to a greener and more sustainable approach to chemical analysis by assigning scores that reflect their recycling efforts.
Reagents and solvents
Case studies
The first case study utilized spectrophotometry to quantify polidocanol, a difficult-to-measure medicinal compound that lacks chromophoric properties [25]. The assay principle was based on the creation of a ternary complex between polidocanol and a cobalt(II)thiocyanate complex, which could be transferred into a dichloromethane layer. Researchers precisely quantified polidocanol by measuring its absorbance at 320 nm . The quantity of waste generated was limited, less than 10 mL . However, no waste disposal initiative was reported.
The second case study utilized a hybrid material consisting of microcrystalline cellulose and a metal-organic framework (MOF) to effectively perform dispersive solid phase microextraction for ritonavir from human plasma [26]. The composites functioned as efficient sorbent materials, facilitating the retrieval of ritonavir from human plasma for subsequent analysis. The waste amount was minimal (
more than 1.5 kW . For personnel, 2 individuals were required per sample analysis using an HPLC/UV instrument. The sample throughput was 4 per hour and the carbon footprint was not measured. The emission factor was set to exceed 0.3 kg , as per the reported data. The use of reagents and solvents was efficient, with less than 5 mL of organic solvents and less than 1 g of reagents per sample, and there were three pictograms for the solvents/ reagents used. Sample storage was at
In the third case study, analysts presented a method for the determination of molnupiravir via carbon quantum dots, synthesized from eggshell [27]. The waste amount was
The fourth case study employed menthol as a phase separating agent in homogenous liquid-liquid
microextraction of favipiravir from human plasma before being measured by HPLC/UV [28]. The waste amount was
For comparison purposes, the carbon footprint of an alternative method for the determination of the same substance (favipiravir) was assessed [29], yielding a total CaFRI score of 62 (Figure S1). This relatively moderate score may be attributed to the use of the energy-intensive LC-MS/MS technique, which requires specialized personnel for operation. Further efforts could be made to reduce
The results indicate significant differences in the precautions used to reduce the carbon footprint among the methods. The first two methods demonstrate acceptable measures, with calculated CaFRI scores between 50 and 74 . In contrast, the third and fourth methods show appreciable efforts in reducing the carbon footprint, as indicated by scores of 75 or higher. These case studies indicated that the two key criteria for CaFRI scores are energy consumption and
Comparison with other carbon footprint tracking methods and strategies
Conclusion
case studies also emphasize the CaFRI’s ability to facilitate positive change and encourage sustainability in laboratory environments. Like any assessment model, CaFRI involves a certain margin of uncertainty and subjectivity. To address uncertainty and enhance reliability, we recommend that at least two independent evaluators assess each method separately. If there were any discrepancies or doubts in the number of points awarded between evaluators, a consensus should be reached through open discussion and the agreed rating should be presented in the final assessment. This approach may help mitigate subjectivity, ensure a more robust and reproducible carbon footprint assessment, and improve the consistency of CaFRI scores across different laboratories. By adopting this metric, analytical chemistry laboratories can take the initiative in spearheading the development of a more sustainable future for the scientific community and beyond.
Supplementary Information
Author contributions
Funding
Data availability
Declarations
Ethics approval and consent to participate
Consent for publication
Ethical guidelines
Competing interests
Availability and requirements
Project name: CaFRI.
Project home page: https://bit.ly/CaFRI.
Operating systems: This project is a web application and can run on any operating system with a browser.
Programming languages: HTML, CSS, and JavaScript.
Other requirements: A modern web browser (e.g., Chrome, Firefox, or Edge) is required.
Published online: 09 May 2025
References
- Yaman C. A review on the process of greenhouse gas inventory Preparation and proposed mitigation measures for reducing carbon footprint. Gases. 2024;4:18-40.
- Müller LJ, Kätelhön A, Bringezu S, McCoy S, Suh S, Edwards R, et al. The carbon footprint of the carbon feedstock CO 2. Energy Environ Sci. 2020;13:2979-92.
- Tolppanen S, Kang J. The effect of values on carbon footprint and attitudes towards pro-environmental behavior. J Clean Prod. 2021;282:124524.
- Sajid M, Płotka-Wasylka J. Green analytical chemistry metrics: A review. Talanta. 2022;238:123046.
- Nowak PM, Wietecha-Posłuszny R, Pawliszyn J. White analytical chemistry: an approach to reconcile the principles of green analytical chemistry and functionality. TrAC – Trends Anal Chem. 2021;138:116223.
- Pena-Pereira F, Wojnowski W, Tobiszewski M. AGREE—Analytical greenness metric approach and software. Anal Chem. 2020;92:10076-82.
- Płotka-Wasylka J. A new tool for the evaluation of the analytical procedure: green analytical procedure index. Talanta. 2018;181:204-9.
- Mansour FR, Płotka-Wasylka J, Locatelli M, Modified GAPI (MoGAPI) Tool and Software for the Assessment of Method Greenness, editors. Case Studies and Applications. Analytica. 2024;5:451-7.
- Mansour FR, Omer KM, Płotka-Wasylka J. A total scoring system and software for complex modified GAPI (ComplexMoGAPI) application in the assessment of method greenness. Green Anal Chem. 2024;10:100126.
- Gałuszka A, Migaszewski ZM, Konieczka P, Namieśnik J. Analytical Eco-Scale for assessing the greenness of analytical procedures. TrAC Trends Anal Chem. 2012;37:61-72.
- Nowak PM, Wietecha-Posłuszny R, Płotka-Wasylka J, Tobiszewski M. How to evaluate methods used in chemical laboratories in terms of the total chemical risk? – a ChlorTox scale. Green Anal Chem. 2023;5:100056.
- Sizirici B, Fseha Y, Cho C-S, Yildiz I, Byon Y-J. A review of carbon footprint reduction in construction industry, from design to operation. Mater (Basel). 2021;14:6094.
- Nowak PM, Bis A, Rusin M, Woźniakiewicz M. Carbon footprint of the analytical laboratory and the three-dimensional approach to its reduction. Green Anal Chem. 2023;4:100051.
- Nowak PM. What does it mean that something is green? The fundamentals of a unified greenness theory. Green Chem. 2023;25:4625-40.
- Mariette J, Blanchard O, Berné O, Aumont O, Carrey J, Ligozat A, et al. An open-source tool to assess the carbon footprint of research. Environ Res Infrastruct Sustain. 2022;2:035008.
- Kern F. The discursive politics of governing transitions towards sustainability: the UK carbon trust. Int J Sustain Dev. 2012;15(1/2):90.
- Zib L, Byrne DM, Marston LT, Chini CM. Operational carbon footprint of the U.S. Water and wastewater sector’s energy consumption. J Clean Prod. 2021;321:128815.
- Shaikh A, Uddin M, Elmagzoub MA, Alghamdi A. PEMC: power efficiency measurement calculator to compute power efficiency and
emissions in cloud data centers. IEEE Access. 2020;8:195216-28. - Ember and Energy Institute. Carbon intensity of electricity generation. Our World in Data. 2023. https://ourworldindata.org/grapher/carbon-intensity-el ectricity
- Ghosh A. Possibilities and challenges for the inclusion of the electric vehicle (EV) to reduce the carbon footprint in the transport sector: A review. Energies. 2020;13:2602.
- Tao Y, Yang L, Jaffe S, Amini F, Bergen P, Hecht B, et al. Climate mitigation potentials of teleworking are sensitive to changes in lifestyle and workplace rather than ICT usage. Proc Natl Acad Sci. 2023;120:e2304099120.
- Bhatia L, Jha H, Sarkar T, Sarangi PK. Food waste utilization for reducing carbon footprints towards sustainable and cleaner environment: A review. Int J Environ Res Public Health. 2023;20:2318.
- Tams L, Nehls T, Calheiros CSC. Rethinking green roofs- natural and recycled materials improve their carbon footprint. Build Environ. 2022;219:109122.
- Jatkowska N, Marć M, de la Guardia M, Gallart D, Płotka-Wasylka J. Greening procedures and analytical parameters. The polychlorinated naphthalenes analysis in complex matrices as proof of concept. TrAC Trends Anal Chem. 2023;167:117222.
- Habib A, Mabrouk MM, Hamed NA, Mansour FR. An innovative spectrophotometric method for determination of polidocanol in pharmaceutical ampoules using phase equilibrium measurements. Microchem J. 2020;158:105141.
- Mansour FR, Abdelhameed RM, Hammad SF, Abdallah IA, Bedair A, Locatelli M. A microcrystalline cellulose/metal-organic framework hybrid for enhanced Ritonavir dispersive solid phase Microextraction from human plasma. Carbohydr Polym Technol Appl. 2024;7:100453.
- Kannouma RE, Kamal AH, Hammad MA, Mansour FR. Incorporation of eggshell waste in the Preparation of carbon quantum Dot nanoprobes for
the determination of COVID-19 antiviral drug; molnupiravir. Microchem J. 2024;198:110397. - Abdallah IA, Hammad SF, Bedair A, Mansour FR. Menthol-assisted homogenous liquid-liquid Microextraction for HPLC/UV determination of favipiravir as an antiviral for COVID-19 in human plasma. J Chromatogr B. 2022;1189:123087.
- Challenger E, Penchala SD, Hale C, Fitzgerald R, Walker L, Reynolds H, et al. Development and validation of an LC-MS/MS method for quantification of favipiravir in human plasma. J Pharm Biomed Anal. 2023;233:115436.