تقييم نماذج التنبؤ السريرية (الجزء 1): من التطوير إلى التحقق الخارجي Evaluation of clinical prediction models (part 1): from development to external validation

المجلة: BMJ
DOI: https://doi.org/10.1136/bmj-2023-074819
PMID: https://pubmed.ncbi.nlm.nih.gov/38191193
تاريخ النشر: 2024-01-08

تقييم نماذج التنبؤ السريرية (الجزء 1): من التطوير إلى التحقق الخارجي

غاري إس كولينز، باولا ذيمان جي ما، مايكل م. شلوسل لوسيندا آرتشر بن فان كالسيرت فرانك إي هاريل جونيور جلين بي مارتن كاريل جي إم مونس مارتن فان سمدن ماثيو سبيرين غاريت إس بولوك ريتشارد دي رايلي

لرؤية الانتماءات المرقمة، يرجى الرجوع إلى نهاية المقال
المراسلة إلى: جي إس كولينزgary.collins@csm.ox.ac.uk (أو @GSCollins على تويتر؛ ORCID 0000-0002-2772-2316)
المواد الإضافية تُنشر عبر الإنترنت فقط. لعرضها، يرجى زيارة المجلة على الإنترنت.
استشهد بهذا كـ: BMJ2024;384:0074819
http://dx.doi.org/10.1136/
bmj-2023-074819
تم القبول: 04 سبتمبر 2023

الملخص

تقييم أداء نموذج التنبؤ السريري أمر بالغ الأهمية لتحديد دقته التنبؤية في الفئات والسياقات المخصصة للاستخدام. في هذه المقالة، الأولى في سلسلة من ثلاثة أجزاء، يصف كولينز وزملاؤه أهمية التقييم المعنوي باستخدام التحقق الداخلي، والتحقق الداخلي-الخارجي، والتحقق الخارجي، بالإضافة إلى استكشاف التباين، والعدالة، وقابلية التعميم في أداء النموذج.

تُتخذ قرارات الرعاية الصحية للأفراد عادةً بناءً على المخاطر أو الاحتمالات. سواء كانت هذه الاحتمالية تشير إلى وجود نتيجة أو مرض معين (تشخيصي) أو أن نتيجة معينة ستحدث في المستقبل (تنبؤي)، من المهم معرفة كيفية تقدير هذه الاحتمالات وما إذا كانت دقيقة. نماذج التنبؤ السريرية تقدر مخاطر النتائج لفرد بناءً على خصائصه من عدة مؤشرات (مثل العمر، التاريخ العائلي، الأعراض، ضغط الدم). تشمل الأمثلة ISARIC (التحالف الدولي للأمراض التنفسية الحادة الشديدة والعدوى الناشئة) 4C.

نموذج لتقدير خطر التدهور السريري لدى الأفراد المصابين بكوفيد-19 الحاد، أو نموذج PREDICT لتقدير احتمال البقاء العام والبقاء الخاص بسرطان الثدي بعد خمس سنوات للنساء المصابات بسرطان الثدي المبكر. يمكن أن تستند عملية اتخاذ القرارات السريرية أيضًا إلى نماذج تقدر قيم النتائج المستمرة، مثل كتلة الدهون لدى الأطفال والمراهقين، على الرغم من أننا نركز في هذه المقالة على تقديرات المخاطر. مع تزايد توفر البيانات، والضغوط لنشر الأبحاث، وزيادة الاهتمام بالأساليب المعتمدة على الذكاء الاصطناعي وتعلم الآلة (مثل التعلم العميق والغابات العشوائية) )، يتم تطوير نماذج التنبؤ بكميات كبيرة. على سبيل المثال، تم تشخيص مرض الانسداد الرئوي المزمن نماذج، تنبؤ أمراض القلب والأوعية الدموية لديه أكثر من 300 نموذج، وكوفيد-19 لديه أكثر من 600 نموذج تنبؤي.
على الرغم من العدد المتزايد من النماذج، إلا أن القليل منها يُستخدم بشكل روتيني في الممارسة السريرية بسبب قضايا تشمل تصميم الدراسة واهتمامات التحليل (مثل حجم العينة الصغيرة، والتكيف الزائد)، والتقارير غير المكتملة (مما يؤدي إلى صعوبة في تقييم دراسات نماذج التنبؤ بشكل كامل)، وعدم وجود رابط واضح في اتخاذ القرارات السريرية. من الناحية الأساسية، غالبًا ما يكون هناك غياب أو فشل في تقييم الأداء التنبؤي لنموذج ما بشكل عادل وذو مغزى في السكان المستهدفين التمثيليين والإعدادات السريرية. إن نقص التقييم الشفاف والذو مغزى يعيق الأحكام حول الفائدة المحتملة للنموذج، وما إذا كان جاهزًا للمرحلة التالية من التقييم (مثل التدخل، أو دراسة الجدوى الاقتصادية) أو يحتاج إلى تحديث (مثل إعادة المعايرة). لإدارة هذا العجز، يوضح هذا السلسلة المكونة من ثلاثة أجزاء أهمية تقييم النماذج وكيفية القيام بذلك بشكل جيد، لمساعدة الباحثين في تقديم صورة موثوقة وعادلة عن دقة النموذج التنبؤية.
في هذه المقالة الأولى، نشرح الأسباب وراء تقييم النماذج، ونؤكد أنه يتضمن فحص أداء النموذج التنبؤي في مراحل متعددة، بما في ذلك أثناء تطوير النموذج (التحقق الداخلي) وفي بيانات جديدة (التحقق الخارجي). تتناول الأوراق اللاحقة في هذه السلسلة تصميم الدراسة ومقاييس الأداء المستخدمة لتقييم دقة النموذج التنبؤية (الجزء ) ومتطلبات حجم العينة للتحقق الخارجي (جزء ). يوفر المربع 1 مسردًا للمصطلحات الرئيسية.

لماذا نحتاج إلى تقييم نماذج التنبؤ؟

أثناء تطوير النموذج (أو تدريبه)، ستؤثر جوانب تصميم الدراسة وتحليل البيانات على الأداء التنبؤي للنموذج في بيانات جديدة من بعض السكان المستهدفين. غالبًا ما يبدو الأداء التنبؤي للنموذج ممتازًا في
BMJ: نُشر لأول مرة كـ 10.1136/bmj-2023-074819 في 8 يناير 2024. تم التنزيل منhttps://www.bmj.com/في 28 أغسطس 2025 بواسطة ضيف. محمي بموجب حقوق الطبع والنشر، بما في ذلك الاستخدامات المتعلقة بتعدين النصوص والبيانات، وتدريب الذكاء الاصطناعي، والتقنيات المماثلة.
مجموعة بيانات التطوير ولكن تكون أقل بكثير عند تقييمها في مجموعة بيانات منفصلة، حتى من نفس السكان، مما يجعل النموذج أقل دقة بكثير. التأثير الناتج هو أن النموذج سيكون أقل فائدة وقد يكون ضارًا، بما في ذلك تفاقم الفجوات في توفير الرعاية الصحية أو النتائج الصحية اللاحقة. لذلك، بمجرد تطوير نموذج التنبؤ، من الواضح أنه من المهم إجراء تقييم ذي مغزى لمدى كفاءته.
تقييم أداء نموذج التنبؤ يُشار إليه عمومًا بالتحقق. ومع ذلك، فإن مصطلح التحقق غير محدد بشكل جيد، ويستخدم بشكل غير متسق، ويثير شعورًا بتحقيق مستوى محدد مسبقًا من الفائدة الإحصائية أو السريرية. قد يُعتبر نموذج مُعتمد حتى (وإن كان بشكل خاطئ) علامة على الموافقة لاستخدامه في الممارسة السريرية. العديد من نماذج التنبؤ التي خضعت لبعض أشكال التحقق ستظل تعاني من أداء ضعيف، إما من خلال انخفاض كبير في تمييز النموذج أو، على الأرجح، في المعايرة (انظر المربع 1 لتعريفات هذه القياسات،

الصندوق 1: مسرد المصطلحات

معايرة

الاتفاق بين النتائج الملاحظة والمخاطر المقدرة من النموذج. يجب تقييم المعايرة بصريًا من خلال رسم بياني للمخاطر المقدرة على المحور والنتيجة الملاحظة على محور مع منحنى معايرة مرن ملساء في البيانات الفردية. يمكن أيضًا قياس المعايرة عدديًا مع ميل المعايرة (القيمة المثالية 1) والمعايرة بشكل عام (القيمة المثالية 0).

المعايرة على نطاق واسع

يقيم المعايرة المتوسطة (الإجمالية) ويحدد أي مبالغة منهجية في تقدير المخاطر أو تقليلها، من خلال مقارنة العدد المتوسط للتوقعات والعدد المتوسط للنتائج الملاحظة.

ميل المعايرة

يقيس انتشار المخاطر المقدرة من النموذج بالنسبة للنتائج الملاحظة. ميل يشير إلى أن انتشار المخاطر المقدرة شديد للغاية (أي، مرتفع جدًا للأفراد ذوي المخاطر العالية، ومنخفض جدًا لأولئك ذوي المخاطر المنخفضة). الميل >1 يشير إلى أن انتشار المخاطر المقدرة ضيق جدًا.

تمييز

يقيم مدى قدرة التنبؤات من النموذج على التمييز بين الأفراد الذين لديهم النتيجة والذين ليس لديهم. يتم عادةً قياس التمييز بواسطة إحصائية c (التي يُشار إليها أحيانًا بـ AUC أو AUROC) للنتائج الثنائية، ومؤشر c لنتائج الوقت حتى الحدث. تشير قيمة 0.5 إلى أن النموذج ليس أفضل من رمي عملة، وتشير قيمة 1 إلى تمييز مثالي (أي أن جميع الأفراد الذين لديهم النتيجة لديهم مخاطر مقدرة أعلى من جميع الأفراد الذين ليس لديهم النتيجة). ما يحدد قيمة جيدة لإحصائية c هو سياق محدد.

فرط التكيف

عندما يتناسب نموذج التنبؤ مع الخصائص الفردية غير المهمة في بيانات التطوير، إلى درجة أن أداء النموذج يكون ضعيفًا في البيانات الجديدة، وعادة ما يكون ذلك مع سوء المعايرة الذي يظهر من خلال انحدارات المعايرة التي تقل عن 1.

ضبط المعلمات

البحث عن أفضل الإعدادات لاستراتيجية بناء نموذج معينة.

انكماش

مواجهة الإفراط في التكيف عن طريق تحفيز التحيز عمدًا في تأثيرات المتنبئ من خلال تقليصها نحو الصفر
المساحة تحت المنحنى؛ المساحة تحت منحنى خصائص التشغيل المستقبلية.
وجزء 2 من سلسلتنا لمزيد من الشرح التفصيلي ). ومع ذلك، فإن تحديد مستوى الأداء التنبؤي الذي يعتبر غير كافٍ (على سبيل المثال، مدى عدم توافق نموذج ما ليتم الاستنتاج بأنه أداء ضعيف) هو أمر ذاتي. العديد من دراسات التحقق من الصحة صغيرة جدًا، وهو اعتبار غالبًا ما يتم تجاهله، مما يؤدي إلى تقدير غير دقيق لأداء النموذج (انظر الجزء 3 حول الإرشادات لحجم العينة لذلك، الإشارة إلى نموذج على أنه قد تم “تحقيقه” أو أنه “صالح”، لمجرد أنه تم إجراء دراسة تُصنف على أنها تحقق، هو أمر غير مفيد ويمكن القول إنه مضلل. في الواقع، هناك تباين في الأداء عبر مجموعات مستهدفة مختلفة، أو فترات زمنية وأماكن مختلفة (مثل، مراكز أو دول مختلفة)، هو أمر متوقع لذا لا يمكن أبداً إثبات أن النموذج صالح دائماً (ولا ينبغي أن نتوقع أن يكون كذلك). ).
تظهر الشكل 1 ملخصًا لمختلف تصاميم الدراسات والنهج المتبعة في تطوير نماذج التنبؤ والتحقق من صحتها. يعتمد قرار أي نوع من التحقق يجب القيام به على السؤال البحثي المطروح وتوافر البيانات الموجودة. بغض النظر عن نهج التطوير، فإن عنصر التحقق من الصحة ضروري، لأن أي دراسة تقوم بتطوير نموذج تنبؤ جديد يجب، دون استثناء، دائمًا تقييم أداء النموذج التنبؤي للسكان المستهدفين، والإعداد، والنتيجة المعنية. الآن نوضح الخيارات المختلفة لتقييم النموذج، بدءًا من التحقق الداخلي إلى التحقق الخارجي.

التقييم في تطوير النموذج: أساليب التحقق الداخلي

في مرحلة تطوير النموذج، اعتمادًا على توفر البيانات، هيكلها (مثل، مجموعات بيانات متعددة، مراكز متعددة) وحجم البيانات المتاحة، يواجه الباحثون قرار كيفية استخدام البيانات المتاحة بشكل أفضل لتطوير نموذج توقع سريري وتقييم أدائه بطريقة غير متحيزة وعادلة ومفيدة. عندما تستخدم التقييم نفس البيانات (أو مصدر البيانات) المستخدمة في تطوير النموذج، يُشار إلى هذه العملية باسم التحقق الداخلي. على سبيل المثال، تتطلب إرشادات تقرير الشفافية لنموذج توقع متعدد المتغيرات للتشخيص أو التنبؤ الفردي (TRIPOD) من المستخدمين “تحديد نوع النموذج، وجميع إجراءات بناء النموذج (بما في ذلك أي اختيار للمؤشرات)، وطريقة التحقق الداخلي.
تستند الأساليب المستخدمة على نطاق واسع للتحقق الداخلي إلى تقسيم البيانات (باستخدام مجموعة فرعية من البيانات للتطوير والباقي للتقييم) أو إعادة أخذ العينات (مثل التحقق المتقاطع باستخدام k-fold أو إعادة التقدير؛ الجدول 1). بالنسبة لمجموعات البيانات الكبيرة جدًا، وإجراءات بناء النماذج التي تتطلب حسابات مكثفة (مثل تضمين ضبط المعلمات؛ الصندوق 1)، قد يكون القرار بشأن أي نهج يُستخدم للتحقق الداخلي قرارًا عمليًا. ومع ذلك، فإن بعض الأساليب غير فعالة وغير مفيدة، وخاصة في أحجام العينات الصغيرة، قد تؤدي حتى إلى نتائج متحيزة وغير دقيقة ومتفائلة، وفي النهاية استنتاجات مضللة. لذلك، نصف الآن
الشكل 1 | تصميم الدراسة المختلفة والنهج لتطوير وتقييم أداء نموذج التنبؤ متعدد المتغيرات تطوير؛ التحقق (التقييم)). مقتبس من كولينز جي إس، ريتسما جي بي، ألتمان دي جي، مونس كيه جي إم. التقرير الشفاف لنموذج توقع متعدد المتغيرات للتشخيص أو التنبؤ الفردي (TRIPOD): بيان TRIPOD. BMJ 2015؛350:g7594. يمكن أن تتضمن الدراسة أكثر من نوع واحد من التحليل
مزايا وعيوب عدة استراتيجيات بالتفصيل.

الأداء الظاهر

أبسط نهج هو استخدام جميع البيانات المتاحة لتطوير نموذج توقع ثم تقييم أدائه مباشرةً على نفس البيانات بالضبط (غالبًا ما يُشار إليه بالأداء الظاهر). من الواضح أن استخدام هذا النهج يمثل مشكلة، خاصة عندما تكون تعقيد النموذج وعدد المتغيرات (معلمات النموذج التي يجب تقديرها) كبيرين بالنسبة لعدد الأحداث في مجموعة البيانات (مؤشر على الإفراط في التكيف). لذلك، سيكون الأداء الظاهر للنموذج عادةً متفائلاً؛ أي أنه عندما يتم تقييم النموذج لاحقًا على بيانات جديدة، حتى في نفس المجموعة السكانية، سيكون الأداء عادةً أقل بكثير. بالنسبة لمجموعات البيانات الصغيرة، يمكن أن يكون التفاؤل وعدم اليقين في الأداء الظاهر كبيرًا. مع زيادة حجم العينة من البيانات المستخدمة لتطوير النموذج، سيقل التفاؤل وعدم اليقين في الأداء الظاهر، ولكن في معظم مجموعات بيانات أبحاث الرعاية الصحية، سيحدث بعض التفاؤل (غير القابل للتجاهل).
لتوضيح الأداء الظاهر، نعتبر نموذج الانحدار اللوجستي للتنبؤ بالوفيات داخل المستشفى خلال 28 يومًا من إصابة الصدمة لدى المرضى الذين يعانون من احتشاء عضلة القلب الحاد باستخدام بيانات من تجربة CRASH-2 السريرية. توفي خلال 28 يومًا باستخدام 14 متنبئًا بما في ذلك أربعة متنبئات سريرية (العمر، الجنس، ضغط الدم الانقباضي، ودرجة غلاسكو للغيبوبة) و10 متنبئات ضوضائية (أي غير مرتبطة حقًا بالنتيجة). مع تغيير حجم العينة بين 200 و10000، يتم ملاءمة النماذج لـ 500 مجموعة فرعية من البيانات التي تم إنشاؤها عن طريق إعادة أخذ العينات (مع الاستبدال) من بيانات CRASH-2 الكاملة ويتم حساب الأداء الظاهر لكل نموذج. من أجل البساطة، نركز بشكل أساسي على إحصائية c، وهي مقياس لتفريق نماذج التنبؤ (مدى جودة النموذج في التمييز بين من لديهم النتيجة ومن ليس لديهم، حيث تشير القيمة 0.5 إلى عدم وجود تمييز و1 تشير إلى تمييز مثالي؛ انظر المربع 1 والجزء 2 من السلسلة. تظهر الشكل 2 حجم وتغير الفرق في إحصائية c لتقدير الأداء الظاهر مقارنةً بقيمة الأداء في العينة الكبيرة التي تبلغ 0.815 (أي نموذج تم تطويره على جميع البيانات المتاحة). بالنسبة لأحجام العينات الصغيرة، هناك فرق كبير (التقديرات أكبر بكثير بشكل منهجي) وتغير كبير، حيث تتراوح إحصائية c الظاهرة من 0.7 إلى أقل بقليل من 1. يتناقص هذا التغير في الأداء الظاهر مع زيادة حجم العينة، وبالنسبة لأحجام العينات الكبيرة جدًا، فإن التفاؤل في الأداء الظاهر يكون ضئيلًا وبالتالي يعد تقديرًا جيدًا للأداء الأساسي في المجموعة الكاملة (CRASH-2).

تقسيم عشوائي

غالبًا ما يُنظر إلى تقسيم مجموعة البيانات بشكل عشوائي على أنه قوة منهجية، لكنه ليس كذلك. كما أن المؤلفين غالبًا ما يطلقون على مجموعتي البيانات (التي تم إنشاؤها عن طريق التقسيم) اسم مستقل؛ على الرغم من عدم وجود تداخل في المرضى، فإن تسمية “مستقل” هي تسمية خاطئة.
BMJ: نُشر لأول مرة كـ 10.1136/bmj-2023-074819 في 8 يناير 2024. تم التنزيل منhttps://www.bmj.com/في 28 أغسطس 2025 بواسطة ضيف. محمي بموجب حقوق الطبع والنشر، بما في ذلك الاستخدامات المتعلقة بتعدين النصوص والبيانات، وتدريب الذكاء الاصطناعي، والتقنيات المماثلة.
الجدول 1 | طرق مختلفة لتقييم أداء النموذج
نوع التحقق وصف تعليقات
الأداء الظاهر أداء النموذج عند تقييمه باستخدام نفس البيانات التي تم استخدامها لتطوير النموذج. عندما تكون العينة صغيرة إلى متوسطة الحجم (انظر الجزء 3 في هذه السلسلة سيكون الأداء الظاهر متفائلاً (متحيزاً نحو الأعلى). مع زيادة حجم العينة، ستقل نسبة التفاؤل. بالنسبة لأحجام العينات الكبيرة جداً، لن يكون هناك تفاؤل ملحوظ، وسيكون الأداء الظاهر غير متحيز.
التحقق الداخلي تقدير أداء النموذج للسكان الأساسيين الذين تم استخدامهم لتطوير النموذج. توقعات الحد الأدنى، وأحد توصيات تقرير بيان TRIPOD (البند 10b)، هو أن الدراسات التي تطور نموذج توقع يجب أن تقوم بإجراء تحقق داخلي لذلك النموذج في السكان الذين يُقصد استخدامه معهم. تشمل أساليب التحقق الداخلي الشائعة تقسيم البيانات، وطرق مختلفة من التحقق المتقاطع k-fold وbootstrapping.
تحقق من صحة العينة المقسمة عادةً ما يتم تقسيم البيانات (بشكل عشوائي) إلى قسمين: أحدهما يُستخدم لتطوير النموذج، والآخر يُستخدم لتقييم أداء النموذج. عادةً ما يُنصح بعدم استخدام التحقق من صحة العينة المقسمة. عندما تكون البيانات المتاحة صغيرة إلى متوسطة، فإن تقسيم البيانات سيؤدي إلى إنشاء مجموعة بيانات غير كافية لتطوير النموذج (مما يزيد من احتمال الإفراط في التكيف)، ومجموعة بيانات غير كافية لتقييم أداء النموذج. وعلى العكس، عندما يكون حجم العينة كبيرًا، فإن هناك خطرًا ضئيلًا من الإفراط في التكيف، وبالتالي لا يتم الحصول على معلومات جديدة في تقييم النموذج في بيانات التحقق. كما أن تقسيم مجموعة البيانات عشوائيًا يفتح أيضًا خطر النظرات المتعددة حتى يتم الحصول على نتائج مرضية.
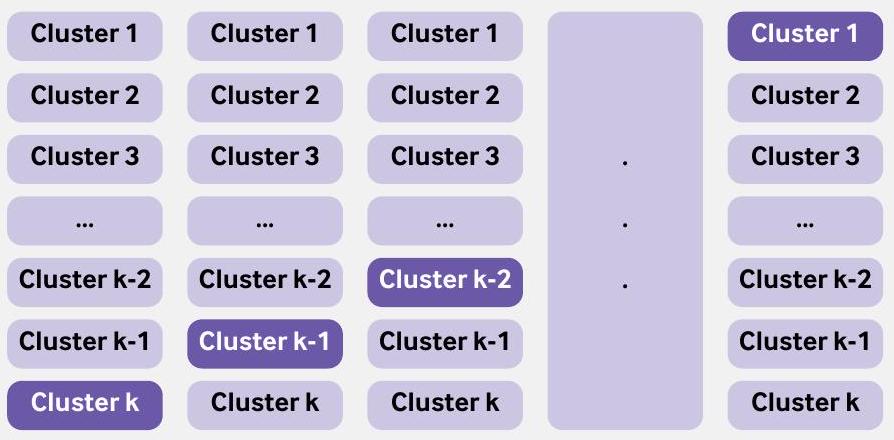
التحقق المتقاطع باستخدام k-fold يتم تقييم أداء النموذج من خلال تقسيم البيانات إلى k مجموعات، حيث تُستخدم المجموعات لتطوير نموذج (مؤقت) (مع تكرار خطوات بناء النموذج المستخدمة لتطوير النموذج على جميع البيانات) وتُستخدم المجموعة المستبعدة لتقييم أداء النموذج المؤقت. تتكرر هذه العملية k مرة، مع استبعاد مجموعة مختلفة في كل مرة، مما ينتج قيم كل مقياس أداء. يتم أخذ أداء النموذج المطور بعد ذلك كمتوسط (أو وسطي) على مقاييس الأداء.
تُستخدم جميع البيانات المتاحة لتطوير النموذج، ثم يتم تقييم أداء هذا النموذج باستخدام التحقق المتقاطع k-fold (أو التحقق المتقاطع k-fold المتكرر) وتقنية البوتستراب للحصول على تقدير غير متحيز أو الأقل تحيزًا لأداء النموذج في السكان الأساسيين الذين يُقصد بالنموذج.
تزداد تعقيد عملية تنفيذ إما التحقق المتقاطع باستخدام k-fold أو تقنية البوتستراب عندما تكون كل من البيانات المفقودة واختيار الحدود غير الخطية (مثل استخدام الأشرطة المكعبة المقيدة أو الحدود الكسرية) جزءًا من عملية بناء النموذج.
التمويل الذاتي التعزيز الذاتي هو تقنية إعادة أخذ العينات، حيث يتم إنشاء عينة تعزيز ذاتي عن طريق أخذ عينات عشوائية (مع الاستبدال) من البيانات الأصلية. في التعزيز الذاتي المحسن، يتم تطوير نموذج (تكرار خطوات بناء النموذج المستخدمة لتطوير النموذج على جميع البيانات) في كل عينة تعزيز ذاتي وتقييم أدائه في هذه العينة وكذلك في مجموعة البيانات الأصلية للحصول على تقدير للتفاؤل في أداء النموذج. تتكرر هذه العملية عدة مرات ويتم حساب متوسط التفاؤل، الذي يتم طرحه بعد ذلك من الأداء الظاهر.
التحقق المتقاطع الداخلي-الخارجي تباين في أداء النموذج عبر المجموعات. يمكن أن تكون المجموعة مجموعة بيانات (عندما تتوفر مجموعات بيانات متعددة، مثل من IPDMA) أو مركز (مثل المستشفيات، أو الممارسات العامة). مشابهة لتقنية التحقق المتقاطع k-fold، يتم استخدام جميع المجموعات مع واحدة مستبعدة لتطوير نموذج، ويتم تقييم أدائه على المجموعة المستبعدة. تتكرر هذه العملية مع استبعاد مجموعة مختلفة، بحيث يتم استبعاد كل مجموعة مرة واحدة من التطوير وتستخدم كبيانات اختبار. تُستخدم جميع البيانات المتاحة لتطوير النموذج، ويتم استخدام IECV لفحص التباين في أداء النموذج. يمكن أيضًا استخدام IECV لاستكشاف المجموعات التي يكون فيها أداء النموذج ضعيفًا (واستكشاف الأسباب)، مما قد يؤدي إلى استبعاد المجموعة من البيانات وتطوير نموذج جديد.
التحقق الخارجي
تقدير أداء النموذج في عينة بيانات مختلفة عن تلك المستخدمة لتطوير النموذج.
قد تكون البيانات من نفس (أو مشابهة لـ) السكان أو الإعداد المستخدم في تطوير النموذج (تقييم القابلية للتكرار)، أو قد تكون من سكان أو إعداد مختلف (تقييم القابلية للنقل). نوع آخر من التحقق هو حيث يقوم الباحثون بتقييم أداء النموذج عبر عدة سكان وإعدادات، حيث يكون كل منها ذا صلة بالاستخدام المقصود (تقييم القابلية للتعميم).
التحقق الخارجي في مرحلة تطوير النموذج ليس استخدامًا فعالًا للبيانات المتاحة ويجب ألا يتم فقط لتلبية متطلبات تحريرية أو مراجعة مفرطة الحماس ومضللة.
يجب استخدام التحقق الخارجي لتقييم أداء النموذج في الدراسات اللاحقة على بيانات جديدة تمثل مجموعة مستهدفة. إن استخدام البيانات الموجودة التي تتوفر بشكل مريح فقط يوفر معلومات محدودة وغالبًا ما تكون مضللة حول أداء النموذج.
يمكن أيضًا استخدام دراسات التحقق الخارجي لتقييم أداء النموذج في بيئات تختلف عمدًا (على سبيل المثال، نموذج تم تطويره للبالغين، ولكن تم تقييمه لاحقًا في دراسة مختلفة للأطفال). )، أو لاستكشاف أداء النموذج عندما تكون تعريفات المتنبئ أو النتيجة (بما في ذلك أفق الزمن) مختلفة (على سبيل المثال، نموذج للتنبؤ بنتيجة في سنة واحدة، ولكن تم تقييمه لنتيجة لمدة عامين).
التحقق الزمني تقييم أداء نموذج التنبؤ الحالي باستخدام بيانات من نفس الإعداد أو إعداد مشابه في فترة زمنية مختلفة. في تطوير النموذج، نادراً ما تكون التحقق الزمني مفيداً ويجب تجنبه. ومع ذلك، فإن فهم ما إذا كان أداء النموذج يتغير (وبشكل مهم يتدهور) خلال فترة الدراسة هو أمر مفيد لفهمه ومن الناحية المثالية تصحيحه.
التحقق الجغرافي أو المكاني تقييم أداء نموذج التنبؤ الحالي في البيانات المجمعة من مجموعة مناسبة في مراكز مختلفة (لتطوير النموذج). في تطوير النموذج، نادراً ما تكون التحقق الجغرافي مفيداً، خاصة عندما يمكن استخدام جميع البيانات لتطوير النموذج ويمكن استكشاف التباين في أداء النموذج عبر مراكز مختلفة باستخدام نهج IECV. إذا كانت البيانات كبيرة بشكل خاص، وكان التحليل مرهقاً من الناحية الحاسوبية، فإن ترك مجموعة (مثل مركز أو دولة) هو حل عملي يمكن النظر فيه.
IECV=التحقق المتقاطع الداخلي-الخارجي؛ IPDMA=تحليل البيانات الفردية للمشاركين.
لأنهما بوضوح يأتيان من نفس مجموعة البيانات (ومصدر البيانات).
تقسيم البيانات عشوائيًا ينشئ بوضوح مجموعتين بيانات أصغر. وغالبًا ما تكون مجموعة البيانات الكاملة ليست كبيرة بما يكفي في البداية. إن وجود مجموعة بيانات صغيرة جدًا لتطوير النموذج يزيد من احتمالية
التكيف الزائد وإنتاج نموذج غير موثوق به، 24 ووجود مجموعة اختبار صغيرة جدًا لن يكون قادرًا على تقدير أداء النموذج بشكل موثوق ودقيق، وهذا يعد إهدارًا واضحًا لمعلومات ثمينة. (انظر الجزء 3 في هذه السلسلة توضح الشكل 3 تأثير حجم العينة على الأداء (إحصائية c) لـ
نموذج توقع باستخدام نهج عينة مقسمة عشوائيًا. باستخدام نفس النهج كما في السابق، تم تطوير نموذج انحدار لوجستي للتنبؤ بوفاة المرضى خلال 28 يومًا في حالات احتشاء عضلة القلب الحاد باستخدام 14 متغيرًا (العمر، الجنس، ضغط الدم الانقباضي، درجة غلاسكو للغيبوبة، و10 متغيرات ضوضاء). تم ملاءمة النماذج وتقييمها في 500 مجموعة فرعية من بيانات CRASH-2، حيث من الملاحظات مخصصة لبيانات التطوير و إلى بيانات الاختبار (على سبيل المثال، لحجم العينة الكلي من 140 تُستخدم للتطوير و60 تُستخدم للتقييم). تظهر النتائج بوضوح أنه بالنسبة لمجموعات البيانات الصغيرة، فإن استخدام نهج تقسيم العينة غير فعال وغير مفيد. إن إحصائية c الظاهرة للنموذج المطور كبيرة جدًا (أي، متفائلة) مقارنةً بأداء العينة الكبيرة ومتغيرة بشكل ملحوظ، بينما يُظهر تقييم مجموعة الاختبار (التحقق) أن إحصائية c للنموذج المطور أقل بكثير ومتغيرة بشكل كبير، ومُقدرة بأقل من الأداء الفعلي للنموذج في العينة الكبيرة (مرة أخرى، تشير إلى الإفراط في التكيف أثناء تطوير النموذج بسبب قلة البيانات). أيضًا، عندما يتم تخصيص عدد أقل من المشاركين (على سبيل المثال، تقسيم 90:10) لمجموعة الاختبار، يُلاحظ المزيد من التباين في أداء النموذج الملاحظ في مجموعة الاختبار (الشكل التوضيحي 1).
مع زيادة حجم العينة، يقل الفرق بين الأداء الظاهر لعينة الانقسام وأداء مجموعة الاختبار. في أحجام العينات الكبيرة جدًا، يكون الفرق ضئيلًا. لذلك، فإن تقسيم البيانات غير ضروري وليس تحسينًا على استخدام جميع البيانات لتطوير النموذج والإبلاغ عن الأداء الظاهر عندما يكون حجم العينة كبيرًا أو استخدام طرق التحقق الداخلي (مثل إعادة التقدير، انظر أدناه) عندما يكون حجم العينة أصغر. هذه الملاحظة ليست جديدة وقد تم ذكرها في الأدبيات المنهجية منذ أكثر من 20 عامًا. لكن الرسالة لم تصل بعد إلى الأدبيات السريرية الحيوية والتعلم الآلي السائدة.
بالنسبة للنماذج ذات التعقيد العالي (مثل المتعلمين العميقين) التي تمنع إعادة أخذ عينات من مجموعة البيانات الكاملة (مثل استخدام طريقة البوتستراب)، قد يكون من الضروري استخدام نهج تقسيم العينة. وبالمثل، في بعض الأحيان قد تتوفر مجموعتان أو أكثر من البيانات (مثل من قاعدتي بيانات الصحة الإلكترونية) ولكن لا يمكن دمجهما، بسبب القيود المحلية على
مشاركة البيانات، بحيث يتم فرض عينة مقسمة. في هذه الحالات، نوصي بشدة بوجود مجموعات بيانات تطوير واختبار كبيرة جدًا، حيث أن النموذج المطور قد يكون غير مستقر وأداء الاختبار غير موثوق، مما يجعل العملية عديمة الجدوى. يمكن أن تكشف مخاوف أحجام العينات الصغيرة من خلال مخططات عدم الاستقرار وقياسات عدم اليقين.
بالإضافة إلى قضايا عدم الكفاءة وزيادة التباين (عدم الاستقرار)، فإن تقسيم مجموعة البيانات بشكل عشوائي يفتح أيضًا خطر النظرات المتعددة والتلاعب. أي أنه إذا تم ملاحظة أداء ضعيف عند تقييم النموذج في الجزء الاختباري من مجموعة البيانات المقسمة عشوائيًا، قد يُغري الباحثون بإعادة التحليل، وتقسيم البيانات مرة أخرى حتى يتم الحصول على النتائج المرغوبة، مشابهًا لما يُعرف بتلاعب P، وبالتالي تضليل القراء للاعتقاد بأن النموذج لديه أداء جيد.

طرق إعادة العينة: التمهيد والتقاطع المتعدد k

على عكس نهج العينة المنقسمة، الذي يقيم نموذجًا محددًا، يقوم أسلوب البوتستراب بتقييم عملية بناء النموذج نفسها (مثل اختيار المتنبئين، والتقدير، وتقدير معاملات الانحدار)، ويقدر مقدار التفاؤل (بسبب الإفراط في ملاءمة النموذج) المتوقع عند استخدام تلك العملية مع حجم العينة المتاح. يتم استخدام هذا التقدير للتفاؤل بعد ذلك لإنتاج تقديرات مستقرة وغير متحيزة تقريبًا لأداء النموذج المستقبلي (مثل، إحصائية c، ميل المعايرة) في السكان الممثلين بواسطة مجموعة بيانات التطوير. تبدأ العملية باستخدام مجموعة البيانات الكاملة لتطوير نموذج التنبؤ وتقدير أدائه الظاهر. ثم يتم استخدام تقنية البوتستراب لتقدير وضبط التفاؤل، سواء في تقديرات أداء النموذج أو في معاملات الانحدار (الصندوق 2).
تظهر الشكل 3 أن استخدام جميع البيانات المتاحة لتطوير نموذج واستخدام تقنية البوتستراب للحصول على تقدير لأداء النموذج المصحح للتفاؤل، هو نهج فعال للتحقق الداخلي، مما يؤدي إلى تقديرات لأداء النموذج الأقرب إلى أداء العينة الكبيرة (على سبيل المثال، مقارنة بنهج تقسيم العينة)، كما هو موضح في أماكن أخرى. (الجدول التكميلي 1). بالنسبة للأحجام الكبيرة جداً
الشكل 2 | التباين والمبالغة في تقدير الأداء الظاهر مقارنةً بأداء العينة الكبيرة، لنموذج يتنبأ بالوفيات داخل المستشفى خلال 28 يومًا من إصابة الصدمة مع زيادة حجم العينة لدراسة تطوير النموذج. تشير إلى تقدير الأداء الظاهر و يشير إلى أداء النموذج في كامل مجموعة CRASH-2 ( ). خطوط حمراء تم إضافة التذبذب للمساعدة في العرض لكل حجم عينة. لا يعني أي تقدير مفرط أو تقدير ناقص منهجي
الشكل 3 | التباين والتقدير المفرط للأداء الظاهر والداخلي (عينة مقسمة وطرق إعادة التقدير) مقارنة بأداء العينة الكبيرة، لنموذج يتنبأ بالوفيات داخل المستشفى خلال 28 يومًا من إصابة الصدمة مع زيادة حجم العينة لدراسة تطوير النموذج. تشير إلى تقدير الأداء الظاهر و يشير إلى أداء النموذج في كامل مجموعة CRASH-2 ( ). الخطوط الحمراء تشير إلى المتوسط لكل حجم عينة ولكل نهج. تم إضافة اهتزاز للمساعدة في العرض. عينة مقسمة (ظاهرة، ) تم استخدام البيانات المتاحة لتطوير النموذج، وتم تقييم أدائه (الظاهر) في نفس هذه البيانات. عينة مقسمة (التحقق، ) = أداء النموذج (المطور في من البيانات المتاحة) في المتبقي البيانات. لا يعني أي تقدير مفرط أو تقدير ناقص منهجي
يمكن أن يمنع العبء الحسابي لتنفيذ تقنية البوتستراب استخدام هذه الطريقة في مجموعات البيانات الكبيرة؛ ومع ذلك، في هذه الحالات، لا يتحقق الكثير من استخدام مجموعة البيانات الكاملة لاشتقاق وتقييم نموذج، لأن تقدير الأداء الظاهر يجب أن يكون تقريبًا جيدًا لأداء النموذج في العينة الكبيرة الأساسية.
طريقة إعادة العينة الأخرى، التحقق المتقاطع باستخدام k -fold، غالبًا ما تؤدي بشكل مشابه للتقنية المعروفة باسم البوتستراب. مثل

الصندوق 2: استخدام طريقة البوتستراب للتحقق الداخلي

الخطوات لحساب الأداء المصحح بالتفاؤل باستخدام تقنية البوتستراب هي:
  1. قم بتطوير نموذج التنبؤ باستخدام البيانات الأصلية بالكامل واحسب الأداء الظاهر.
  2. قم بإنشاء عينة بوتستراب (بنفس حجم البيانات الأصلية) عن طريق أخذ عينات من الأفراد مع الاستبدال من البيانات الأصلية.
  3. قم بتطوير نموذج Bootstrap باستخدام عينة Bootstrap (تطبيق جميع طرق النمذجة واختيار المتنبئين، كما في الخطوة 1):
    أ. تحديد الأداء الظاهر (مثل، إحصائية c، ميل المعايرة) لهذا النموذج على عينة البوتستراب (أداء البوتستراب).
    ب. تحديد أداء نموذج البوتستراب في البيانات الأصلية (أداء الاختبار).
  4. احسب التفاؤل كفرق بين أداء البوتستراب وأداء الاختبار.
  5. كرر الخطوات من 2 إلى 4 عدة مرات (مثل 500 مرة).
  6. قم بحساب متوسط تقديرات التفاؤل في الخطوة 5.
  7. اطرح متوسط التفاؤل (من الخطوة 6) من الأداء الظاهر الذي تم الحصول عليه في الخطوة 1 للحصول على تقدير مصحح للتفاؤل للأداء.
    يمكن أيضًا الإبلاغ عن التباين في التقديرات المصححة للتفاؤل، عبر عينات البوتستراب، لإظهار الاستقرار. ستختلف نماذج البوتستراب التي تم إنتاجها في الخطوة 2 (وستختلف عن نموذج التنبؤ الذي تم تطويره على البيانات الكاملة)، ولكن هذه النماذج تستخدم فقط في تقييم الأداء وليس للتنبؤ بالمخاطر الفردية. لقد أظهر ستايربرغ وزملاؤه أن التفاؤل المتوقع يمكن تقديره بدقة باستخدام 200 بوتستراب فقط مع تباين عيني طفيف؛ ومع القوة الحاسوبية الحديثة، نوصي عمومًا بما لا يقل عن 500 بوتستراب. فائدة إضافية من هذه العملية التمهيدية هي أنه يمكن استخدام قيمة ميل المعايرة المصححة بالتفاؤل لضبط النموذج من أي زيادة في التكيف عن طريق تطبيقها كعامل انكماش على معاملات الانحدار الأصلية (تأثيرات المتنبئين).
    في طريقة التمهيد، يتم استخدام جميع البيانات المتاحة لتطوير النموذج، ويتم استخدام جميع البيانات المتاحة لتقييم أداء النموذج. يمكن اعتبار التحقق المتقاطع باستخدام k -fold امتدادًا لنهج تقسيم العينة ولكن مع تقليل التحيز والتباين في تقدير أداء النموذج (الصندوق 3).

تقسيم غير عشوائي (خلال تطوير النموذج)

تشمل طرق التقسيم البديلة التقسيم حسب الوقت (المشار إليه بالتحقق الزمني) أو حسب الموقع (المشار إليه بالتحقق الجغرافي أو المكاني). ومع ذلك، فإنهم يزيلون الفرصة لاستكشاف والتقاط ميزات الوقت والموقع خلال تطوير النموذج للمساعدة في تفسير التباين في النتائج.
في التحقق الزمني، يتم استخدام بيانات من فترة زمنية واحدة لتطوير نموذج التنبؤ بينما يتم استخدام بيانات من فترة زمنية مختلفة (غير متداخلة) لتقييم أدائه. ومع ذلك، فإن القلق يكمن في اختيار الفترة الزمنية التي يجب استخدامها لتطوير النموذج، وأيها يجب استخدامها للتقييم. قد لا تعكس البيانات من الفترة الزمنية القديمة خصائص المرضى الحالية (المؤشرات والنتائج) أو الرعاية الحالية. وعلى العكس، فإن استخدام الفترة الزمنية الأكثر حداثة لتطوير النموذج يترك البيانات من فترة زمنية قديمة لتقييم الأداء، وبالتالي يوفر فقط معلومات عن دقة التنبؤ في مجموعة تاريخية من المرضى. لا يعد أي من الخيارين مرضيًا، وهذه الطريقة (في لحظة تطوير النموذج) غير موصى بها. على سبيل المثال، أدت التحسينات على مر الزمن في تقنيات الجراحة إلى زيادة عدد المرضى الذين ينجون من الجراحة. وبالتالي، ستقل احتمالية حدوث النتيجة المتوقعة مع مرور الوقت، مما سيؤثر على معايرة النموذج. لذلك، يجب النظر في طرق مثل التحديث المستمر (للنموذج) لمنع انحراف المعايرة أو نماذج التنبؤ الديناميكية. إعادة ضبط الزمن هي خيار آخر حيث يتم تقدير تأثيرات المتنبئين في مجموعة البيانات الكاملة، ولكن يتم تقدير المخاطر الأساسية في أحدث نافذة زمنية.

الصندوق 3: استخدام التحقق المتقاطع k-fold للتحقق الداخلي

عملية يتضمن التحقق المتقاطع القائم على الطيات تقسيم البيانات إلى مجموعات متساوية الحجم. يتم تطوير نموذج في k-1 مجموعة، ويتم تقييم أدائه (مثل، إحصائية c) في المجموعة المتبقية. يتم تنفيذ هذه العملية مرات، بحيث يتم استخدام مجموعة مختلفة من k-1 مجموعات في كل مرة لتطوير النموذج ومجموعة مختلفة لتقييم أداء النموذج (الشكل 4). الأداء المتوسط عبر تُعتبر التكرارات تقديرًا لأداء النموذج.
الشكل 4 | توضيح رسومي لتقنية التحقق المتقاطع باستخدام k-fold. الأجزاء غير المظللة تستخدم لتطوير النموذج؛ الجزء المظلل يستخدم للاختبار
في الممارسة العملية، قيمة يُعتبر عادةً 5 أو 10؛ اختيار الكرز يجب تجنبه. ستعمل عملية التحقق المتقاطع المتكررة (حيث يتم تكرار التحقق المتقاطع عدة مرات ومتوسط النتائج عبرها) عمومًا على تحسين التحقق المتقاطع ذو الطيات.
في التحقق الجغرافي أو المكاني، يتم استخدام بيانات من موقع جغرافي واحد (أو مستشفيات، مراكز) لتطوير النموذج، بينما يتم استخدام بيانات من موقع جغرافي منفصل لتقييم النموذج. كما هو الحال مع طرق تقسيم البيانات الأخرى التي تم مناقشتها سابقًا، في معظم (إن لم يكن جميع) الحالات، غالبًا ما يكون هناك القليل من الفائدة من التقسيم، بل إن هناك فرصة ضائعة في استخدام جميع البيانات المتاحة لتطوير نموذج بقدرة تعميم أوسع. ومع ذلك، إذا كانت البيانات من العديد من المناطق الجغرافية (أو المراكز) متاحة لتطوير نموذج، تتضمن عددًا كبيرًا جدًا من الملاحظات (والنتائج)، وكان العبء الحسابي لتطوير النموذج يمنع استخدام التحقق المتقاطع k-fold أو التمهيد، فقد لا يكون ترك منطقة أو أكثر لتقييم الأداء ضارًا جدًا. كما هو الحال مع نهج التقسيم العشوائي، قد يميل الباحثون إلى تقسيم البيانات (على سبيل المثال، إلى فترات زمنية وأطوال مختلفة، ومراكز مختلفة) بشكل متكرر حتى يتم تحقيق أداء مرضٍ – يجب تجنب هذا النهج. إذا كان من المقرر النظر في التقسيم، يجب أن يتم التقسيم مرة واحدة فقط (أي، لا تقسيم متكرر حتى يتم تحقيق نتائج جيدة)، مع ضمان أن تكون أحجام العينات للتطوير والتقييم بحجم كافٍ.

التقييم أثناء تطوير النموذج: التحقق المتقاطع الداخلي-الخارجي

تُصبح البيانات من قواعد بيانات السجلات الصحية الإلكترونية الكبيرة، والدراسات متعددة المراكز، أو بيانات المشاركين الفردية من دراسات متعددة متاحة بشكل متزايد
متاحة وتستخدم لأغراض نموذج التنبؤ. قد يُغري الباحثين القيام ببعض أشكال التقسيم (الجغرافي أو المكاني)، حيث يتم استخدام جزء فقط (مثل مجموعة من المراكز، أو مناطق من بلد، أو مجموعة من الدراسات) لتطوير النموذج، بينما تُستخدم البيانات المتبقية لتقييم أدائه. ومع ذلك، فإن التحقق المتقاطع الداخلي-الخارجي هو نهج أكثر كفاءة وإفادة. الذي يفحص التباين والعمومية في أداء النموذج (الصندوق 4).
على سبيل المثال، تم استخدام التحقق المتقاطع الداخلي-الخارجي في تطوير نموذج ISARIC 4C لتحديد الأفراد المعرضين لزيادة خطر التدهور السريري لدى البالغين المصابين بكوفيد-19 الحاد. استخدم المؤلفون جميع بياناتهم المتاحة ) من تسع مناطق في المملكة المتحدة (كل منها يتكون من 3066 إلى 15583 فردًا) لتطوير النموذج، ولكن بعد ذلك، لفحص القابلية للتعميم والتنوع، تم إجراء تحقق داخلي-خارجي عبر ثمانية مناطق في تطوير النموذج وتم الاحتفاظ بالمنطقة التاسعة للتقييم. أظهر المؤلفون أن النموذج عمل بشكل متسق عبر المناطق، مع تقديرات نقطية لإحصائية c تتراوح من 0.75 إلى 0.77، وتقدير تحليل ميتا عشوائي مجمع قدره 0.76 (فترة الثقة 95% من 0.75 إلى 0.77؛ الشكل 6).

التقييم باستخدام بيانات جديدة: التحقق الخارجي

التحقق الخارجي هو عملية تقييم أداء نموذج موجود في مجموعة بيانات جديدة، تختلف عن تلك المستخدمة (والمصدر المستخدم) لتطوير النموذج. إنه عنصر مهم في سلسلة نموذج التنبؤ، حيث يسعى لإظهار القابلية للتعميم والنقل للنموذج خارج البيانات (والسكان) المستخدمة لتطوير النموذج (على سبيل المثال، في مستشفيات مختلفة، دول مختلفة). على سبيل المثال، قام كولينز وألتمن بإجراء تحقق خارجي مستقل من QRISK2 ودرجة خطر فرامينغهام (التي كانت موصى بها في ذلك الوقت من قبل المعهد الوطني للصحة والرعاية الممتازة في المملكة المتحدة)، وأظهروا سوء المعايرة المنهجي لفرامينغهام، وعدم وجود فائدة صافية عند عتبات العلاج الحالية (في ذلك الوقت)، والحاجة إلى عتبات علاج مختلفة.
بعض المجلات ترفض نشر دراسات تطوير النماذج دون وجود تحقق خارجي. ; هذا الموقف قديم ومضلل، وقد يشجع الباحثين على إجراء تحقق خارجي غير ذي معنى ومضلل (مثل عينة ملائمة غير تمثيلية، صغيرة جدًا، أو حتى تقسيم البيانات تحت مسمى خاطئ للتحقق الخارجي). في الواقع، إذا كانت مجموعة بيانات تطوير النموذج كبيرة وتمثل السكان المستهدفين (بما في ذلك قياس النتائج والمتغيرات التنبؤية)، وتم إجراء التحقق الداخلي بشكل مناسب، فقد لا تكون هناك حاجة حتى إلى تحقق خارجي فوري. ومع ذلك، في العديد من الحالات، قد لا تعكس البيانات المستخدمة لتطوير نموذج التنبؤ السكان المستهدفين الذين يُقصد بالنموذج، وقد تؤدي التباينات أو نقص التوحيد في القياسات (بما في ذلك خطأ القياس) والأساليب الإحصائية الضعيفة،

الصندوق 4: التحقق المتقاطع الداخلي-الخارجي

التحقق الداخلي-الخارجي يستغل ميزة شائعة موجودة في العديد من مجموعات البيانات، وهي التجميع (على سبيل المثال، حسب المركز، المنطقة الجغرافية، أو الدراسة). بدلاً من تقسيم البيانات إلى مجموعات تطوير والتحقق، يتم استخدام جميع البيانات لبناء نموذج التنبؤ وتقييم أدائه بشكل تكراري. ثم يتم فحص أداء هذا النموذج (المطور على جميع البيانات) باستخدام التحقق المتقاطع حسب التجمع، حيث يتم استبعاد تجمع (على سبيل المثال، مركز، منطقة جغرافية، دراسة) وتطبيق نفس خطوات بناء النموذج (كما تم استخدامها على البيانات الكاملة) على التجمعات المتبقية. ثم يتم تقييم النموذج في التجمع المستبعد (أي، تقديرات المعايرة والتمييز جنبًا إلى جنب مع فترات الثقة). يتم تكرار هذه الخطوات، مع استبعاد تجمع مختلف في كل مرة. مما يسمح بفحص القابلية للتعميم والتنوع في الأداء عبر المجموعات (باستخدام تقنيات التحليل التلوي؛ الشكل 5).
الشكل 5 | توضيح رسومي للتحقق المتقاطع الداخلي-الخارجي. الأجزاء غير المظللة مستخدمة لتطوير النموذج؛ الجزء المظلل مستخدم للاختبار
يمكن بعد ذلك تقديم النتائج في رسم بياني غابي للمساعدة في التفسير، وحساب تقدير ملخص باستخدام تحليل الميتا (تأثيرات عشوائية). يوفر TRIPOD (التقارير الشفافة لنموذج التنبؤ متعدد المتغيرات للتشخيص أو التنبؤ الفردي) توصيات لتقارير دراسات نماذج التنبؤ التي أخذت في الاعتبار التجميع أثناء التحقق، بما في ذلك نهج التحقق المتقاطع الداخلي الخارجي.
يمكن أن تؤثر حجم العينة غير الكافي، ومعالجة البيانات المفقودة (بما في ذلك المفقودات المهمة)، والتغيرات في الرعاية الصحية على أداء النموذج عند تطبيقه على مجموعة سكانية تمثيلية مستهدفة. تظهر الشكل التوضيحي 2 والجدول التوضيحي 2 تأثير حجم العينة في النموذج
التطوير على الأداء في التحقق الخارجي. وبالتالي، تحتاج معظم نماذج التنبؤ إلى تقييم في بيانات جديدة لإظهار الأماكن التي ينبغي اعتبارها أو عدم اعتبارها للنشر أو لمزيد من تقييم الأثر السريري (على سبيل المثال، في تجربة سريرية عشوائية). ).
تعتبر التحقق الخارجي ضروريًا لأن التباينات في تقديم الرعاية الصحية، وخصائص المرضى، والخصوصيات المحلية (مثل تعريفات النتائج) ستحدد بشكل طبيعي أداء نموذج التنبؤ المعين. تم اقتراح أطر للمساعدة في تفسير النتائج في التحقق الخارجي من خلال فحص العلاقة (مثل مدى التشابه من حيث مزيج الحالات) بين بيانات التحقق الخارجي وبيانات التطوير، لاستكشاف (على مدى متصل) ما إذا كان التحقق يقيم القابلية للتكرار (البيانات مشابهة لبيانات التطوير) أو القابلية للنقل (البيانات غير مشابهة لبيانات التطوير). يمكن أن تكون البيانات المستخدمة في دراسة التحقق الخارجي من نفس السكان المستخدمين في تطوير النموذج، ولكن في فترة زمنية مختلفة (أكثر حداثة)، تم الحصول عليها بعد تطوير النموذج. إن التقييم المستمر أو الدوري في عينة السكان مهم لتحديد ومعالجة أي تدهور في النموذج (مثل انحراف المعايرة). )، وهو ما يُتوقع بسبب التغيرات السكانية أو الصحية على مر الزمن. ومع ذلك، يجب على الباحثين أيضًا أن يأخذوا في الاعتبار التحقق الخارجي في مجموعات سكانية مختلفة تمامًا (مثل، مراكز أو دول مختلفة) أو في بيئات مختلفة (مثل، الرعاية الأولية/الثانوية أو البالغين/الأطفال) حيث يُراد نشر النموذج. قد يتضمن التحقق الخارجي حتى تعريفات مختلفة للمتنبئات أو النتائج (مثل، أفق التنبؤ المختلف) عن تلك المستخدمة في مجموعة التطوير الأصلية.
غالبًا ما يتم تضمين التحقق الخارجي في الدراسات التي تطور نموذج التنبؤ. ومع ذلك، كما تم الإشارة إليه سابقًا، في لحظة تطوير النموذج، نوصي عمومًا باستخدام جميع البيانات المتاحة لبناء النموذج، مصحوبةً بالتحقق الداخلي أو التحقق الداخلي-الخارجي المعنوي. إن استخدام جميع البيانات المتاحة لتطوير نموذج يعني أنه يجب بعد ذلك (في معظم الحالات) إجراء دراسات التحقق الخارجي لاحقًا وخارج دراسة تطوير النموذج، كل منها مع هدف محدد.
الشكل 6 | التحقق المتقاطع الداخلي-الخارجي لنموذج ISARIC (الاتحاد الدولي للأمراض التنفسية الحادة والناشئة) 4C. مقتبس من غوبتا وآخرون. التقديرات وفترات الثقة مأخوذة من الورقة الأصلية حيث تم الإبلاغ عنها إلى منزلتين عشريتين.
يجب أن يكون هناك اعتبار للسكان المستهدفين (أي، يجب أن يكون لكل مجموعة مستهدفة أو إعداد معين لنموذج التنبؤ تمرين تحقق مطابق). كلما زادت الدراسات التي تحقق التحقق الخارجي وتظهر أداءً جيدًا (أو مقبولًا)، زادت احتمالية أن يكون النموذج مفيدًا أيضًا في بيئات أخرى لم يتم اختبارها – على الرغم من أنه لا يوجد ضمان واضح لذلك.
تُقدم الإرشادات حول التصميم والتحليل لدراسات التحقق الخارجي في الأجزاء 2 و 3 من هذه السلسلة. على الرغم من أهمية إجراء تحقق خارجي، إلا أن مثل هذه الدراسات نادرة نسبيًا. وانحياز النشر هو بالتأكيد مصدر قلق، حيث يتم نشر (بشكل عام) فقط الدراسات الخارجية للتحقق التي تظهر نتائج إيجابية. على الرغم من الخطاب الذي ينادي بالتكرار والتحقق، يبدو أن المجلات ليس لديها شهية كبيرة لنشر دراسات التحقق الخارجية (على الأرجح وبسخرية مع دور الاقتباسات)، مع تفضيل لدراسات تطوير النماذج. ليس من غير المعقول أن يكون الباحثون (الذين طوروا النموذج) أقل احتمالاً لنشر دراسات التحقق الخارجية التي تظهر أداءً ضعيفًا أو غير جيد. الحوافز للباحثين المستقلين لإجراء تحقق خارجي هي أيضًا عامل مساهم – ما هي الفوائد لهم، مع شهية منخفضة على ما يبدو من المجلات لنشرها، خاصة عندما تكون النتائج غير مثيرة؟ فشل المؤلفين في الإبلاغ أو جعل نموذج التنبؤ متاحًا سيكون، إما من خلال تقارير ضعيفة أو لأسباب ملكية، يمكن أن يكون أيضًا حاجزًا واضحًا للتقييم المستقل، مما قد يؤدي إلى نتائج إيجابية فقط (من قبل مطوري النموذج).

التقييم في المجموعات الفرعية: تجاوز أداء السكان للمساعدة في فحص العدالة

عادةً ما يركز تقييم أداء النموذج على مقاييس الأداء على مستوى مجموعة البيانات (مثل، إحصائية c واحدة، أو رسم بياني واحد للتوافق أو مقياس واحد) كبديل للسكان المستهدفين المقصودين. بينما يعتبر هذا الأداء ضروريًا للتquantification والتقارير، يجب بذل جهود منسقة لاستكشاف التباين المحتمل والتعمق في (قابلية تعميم) أداء النموذج. يجب على الباحثين عدم تسليط الضوء فقط على الأماكن التي يظهر فيها نموذجهم أداءً جيدًا، بل يجب عليهم أيضًا إجراء وتقرير النتائج من استجواب أعمق وتحديد الحالات والإعدادات ومجموعات الأشخاص التي يكون فيها النموذج أقل دقة في التنبؤ، لأن استخدام مثل هذا النموذج قد يؤثر سلبًا على اتخاذ القرار ورعاية المرضى، وقد يضر المرضى. على سبيل المثال، بالإضافة إلى استكشاف التباين في الأداء عبر مراكز أو مجموعات مختلفة (انظر أعلاه)، يجب تشجيع الباحثين (بل من المتوقع منهم) على تقييم أداء النموذج في مجموعات فرعية رئيسية أخرى (مثل الجنس/النوع، العرق/المجموعة العرقية)، كجزء من التحقق من العدالة الخوارزمية. خصوصًا عندما تكون أحجام العينات كبيرة بما يكفي، وعندما يتم جمع البيانات بطريقة مناسبة تمثل النطاق المتنوع من الأشخاص الذين يُفترض استخدام النموذج عليهم. على سبيل المثال، في التحقق الخارجي والمقارنة بين QRISK2 ودرجة خطر فرامينغهام، قام كولينز وألتمن
أظهرت عدم دقة في تقدير درجة خطر فريمينغهام، مع توقعات مفرطة منهجية لدى الرجال عبر جميع الأعمار، ووجود عدم دقة صغيرة في QRISK2 لدى كبار السن.
تقديم تقنية جديدة في الرعاية السريرية، مثل نموذج التنبؤ، والذي من المتوقع أن يزداد فقط مع الزيادة في الاهتمام والاستثمار في الذكاء الاصطناعي وتعلم الآلة، يجب أن يقلل بشكل مثالي ولكن بالتأكيد لا ينبغي أن يخلق أو يزيد من أي تفاوتات في تقديم الرعاية الصحية أو في النتائج الصحية اللاحقة. لذا فإن أخذ الفئات الفرعية الرئيسية بعين الاعتبار مهم خلال التصميم (وجمع البيانات) والتحليل والتقارير وتفسير النتائج.

الاستنتاجات

تقييم أداء نموذج التنبؤ أمر بالغ الأهمية، وبالتالي فإن دراسات التحقق ضرورية. هنا، وصفنا كيفية الاستفادة القصوى من البيانات المتاحة لتطوير، والأهم من ذلك، تقييم نموذج التنبؤ من التطوير إلى التحقق الخارجي. يجب تجنب تقسيم البيانات في لحظة تطوير النموذج بشكل عام لأنه يتسبب في إهمال البيانات مما يؤدي إلى نموذج أقل موثوقية. بدلاً من ذلك، يجب بذل جهود منسقة لاستغلال جميع البيانات المتاحة لبناء أفضل نموذج ممكن، مع استخدام أفضل لطرق إعادة العينة للتحقق الداخلي، والتحقق الداخلي-الخارجي لتقييم أداء النموذج وقابليته للتعميم عبر المجموعات. يجب أن تؤخذ دراسات التحقق الخارجي في الاعتبار في الأبحاث اللاحقة، ويفضل أن يقوم بها باحثون مستقلون، لتقييم أداء النموذج في مجموعات بيانات تمثل السكان المستهدفين المقصودين لتنفيذ النموذج. الورقة التالية في هذه السلسلة، الجزء 2، تشرح كيفية إجراء مثل هذه الدراسات.

الانتماءات المؤلفين

مركز الإحصاءات في الطب، قسم نوفيلد لجراحة العظام، الروماتيزم وعلوم العضلات والعظام، جامعة أكسفورد، أكسفورد OX3 7LD، المملكة المتحدة
معهد أبحاث الصحة التطبيقية، كلية العلوم الطبية وطب الأسنان، جامعة برمنغهام، برمنغهام، المملكة المتحدة
المعهد الوطني للبحوث الصحية والرعاية (NIHR) مركز بحوث الطب الحيوي في برمنغهام، المملكة المتحدة
جامعة KU Leuven، قسم التنمية والتجديد، لوفين، بلجيكا
قسم علوم البيانات الطبية الحيوية، مركز ليدن الجامعي الطبي، ليدن، هولندا
مركز EPI، جامعة KU لوفين، بلجيكا
قسم الإحصاء الحيوي، جامعة فاندربيلت، ناشفيل، تينيسي، الولايات المتحدة الأمريكية
قسم المعلوماتية والتصوير وعلوم البيانات، كلية البيولوجيا والطب والصحة، جامعة مانشستر، مركز مانشستر الأكاديمي للعلوم الصحية، مانشستر، المملكة المتحدة
مركز يوليوس لعلوم الصحة والرعاية الأولية، المركز الطبي الجامعي في أوترخت، جامعة أوترخت، أوترخت، هولندا
قسم جراحة العظام، كلية الطب بجامعة ويك فوريست، وينستون-سالم، نورث كارولينا، الولايات المتحدة الأمريكية
مركز أبحاث الرياضة والتمارين وأمراض المفاصل مقابل التهاب المفاصل، جامعة أكسفورد، أكسفورد، المملكة المتحدة
المساهمون: قام GSC و RDR بتصور الورقة وإنتاج المسودة الأولى. قدم جميع المؤلفين تعليقات واقترحوا تغييرات، والتي تم حلها بعد ذلك بواسطة GSC و RDR. GSC هو الضامن. يؤكد المؤلف المراسل أن جميع المؤلفين المدرجين يستوفون معايير التأليف وأنه لم يتم استبعاد أي شخص آخر يستوفي المعايير.
التمويل: تم دعم هذا العمل من قبل أبحاث السرطان في المملكة المتحدة (C49297/A27294، الذي يدعم GSC و JM و MMS؛ و PRCPJTNov21\100021، الذي يدعم PD). المجلس الطبي للبحوث طرق أفضل لأبحاث أفضل (منحة MR/V038168/1، التي تدعم GSC و LA و RDR)، منحة EPSRC (مجلس أبحاث الهندسة والعلوم الفيزيائية) لـ “ابتكار الذكاء الاصطناعي لتسريع أبحاث الصحة” (EP/Y018516/1، التي تدعم GSC و LA و PD و RDR). المعهد الوطني للبحوث الصحية ومركز أبحاث بيمبروك الحيوية في جامعة مستشفيات برمنغهام NHS ومؤسسة جامعة برمنغهام (الذي يدعم RDR)، مؤسسة أبحاث فلاندرز (G097322N، الذي يدعم BVC)، الأموال الداخلية KU Leuven (C24M/20/064، الذي يدعم BVC)، المركز الوطني لتقدم العلوم الانتقالية (جائزة العلوم السريرية الانتقالية 5UL1TR002243-03، الذي يدعم FEH)، المعاهد الوطنية للصحة (NHLBI 10T2HL156812-01، الذي يدعم FEH)، ومركز التنسيق الإداري لدمج العلاجات المستهدفة للفيروسات التاجية COVID-19 من المعهد الوطني للقلب والرئة والدم (الذي يدعم FEH). لم يكن للجهات الممولة أي دور في النظر في تصميم الدراسة أو في جمع البيانات أو تحليلها أو تفسيرها أو كتابة التقرير أو اتخاذ قرار نشر المقال.
المصالح المتنافسة: جميع المؤلفين قد أكملوا نموذج الإفصاح الموحد ICMJE فيhttps://www.icmje.org/disclosure-of-interest/andأعلن: الدعم من مؤسسة أبحاث السرطان في المملكة المتحدة ومجلس الأبحاث الطبية للعمل المقدم؛ لا توجد علاقات مالية مع أي منظمات قد تكون لها مصلحة في العمل المقدم خلال السنوات الثلاث الماضية؛ لا توجد علاقات أو أنشطة أخرى قد تبدو أنها أثرت على العمل المقدم. GSC و RDR هما محرران إحصائيان لمجلة BMJ.
مشاركة البيانات: بيانات CRASH-2 و CRASH-3 المستخدمة في هذه الورقة متاحة مجانًا علىhttps://freebird.lshtm.ac.ukرمز R المستخدم لإنتاج الأشكال والجداول التكميلية متاح منhttps://github.com/gscollins1973/validationCRASH.
مشاركة المرضى والجمهور: لم يشارك المرضى أو الجمهور في تصميم أو تنفيذ أو تقرير أو نشر بحثنا.
الأصل والمراجعة من قبل الأقران: لم يتم تكليفه، تمت مراجعته من قبل الأقران خارجيًا.
هذه مقالة مفتوحة الوصول موزعة وفقًا لشروط ترخيص المشاع الإبداعي (CC BY 4.0)، الذي يسمح للآخرين بتوزيع وإعادة مزج وتكييف وبناء على هذا العمل، للاستخدام التجاري، بشرط أن يتم الاستشهاد بالعمل الأصلي بشكل صحيح. انظر:http://creativecommons.org/licenses/by/4.0/.
1 فان سمدن م، ريتسما جي بي، رايلي آر دي، كولينز جي إس، مونس ك جي. نماذج التنبؤ السريرية: التشخيص مقابل التنبؤ. مجلة الوبائيات السريرية 2021؛132:142-5. doi:10.1016/j.jclinepi.2021.01.009
2 غوبتا RK، هاريسون EM، هو A، وآخرون، محققو ISARIC4C. تطوير وتقييم نموذج تدهور ISARIC 4C للبالغين الذين تم إدخالهم إلى المستشفى بسبب COVID-19: دراسة جماعية مستقبلية. لانسيت طب الجهاز التنفسي 2021؛9:349-59. doi:10.1016/S2213-2600(20)30559-2
3 ويشارت جي سي، أزاتو إي إم، غرينبرغ دي سي، وآخرون. PREDICT: نموذج تنبؤي جديد في المملكة المتحدة يتنبأ بالنجاة بعد الجراحة لسرطان الثدي الغازي. أبحاث سرطان الثدي 2010؛12:R1. doi:10.1186/bcr2464
4 هدى MT، فيوتريل MS، هارون D، وآخرون. تطوير وتقييم نموذج للتنبؤ بكتلة الدهون لدى الأطفال والمراهقين: تحليل تلوي باستخدام بيانات المشاركين الفردية. BMJ 2019؛ 366: 14293. doi:10.1136/bmj.l4293
5 كريستودولو E، ما J، كولينز GS، ستيربرغ EW، فيرباكل JY، فان كالسير B. مراجعة منهجية تظهر عدم وجود فائدة في الأداء لتعلم الآلة مقارنةً بالانحدار اللوجستي لنماذج التنبؤ السريرية. / علم الأوبئة السريرية 2019؛110:12-22. doi:10.1016/j.jclinepi.2019.02.004
6 ذيمان ب، ما ج، نافارو كا، وآخرون. يجب تحسين تقارير نماذج التنبؤ السريرية التنبؤية المستندة إلى طرق التعلم الآلي في علم الأورام. / علم الأوبئة السريرية 2021؛138:60-72. doi:10.1016/j.jclinepi.2021.06.024
7 بيللو V، بيلباسيس L، كونستانتينيديس AK، تزوولكي I، إيفانجيلو E. نماذج التنبؤ بالنتائج في المرضى الذين يعانون من مرض الانسداد الرئوي المزمن: مراجعة منهجية وتقييم نقدي. BMJ 2019؛367: I5358. doi:10.1136/bmj.I5358
8 Damen JAAG، Hooft L، Schuit E، وآخرون. نماذج التنبؤ بمخاطر الأمراض القلبية الوعائية في السكان العامين: مراجعة منهجية. BMJ 2016؛353:i2416. doi:10.1136/bmj.i2416
9 وينانتس إل، فان كالسير بي، كولينز جي إس، وآخرون. نماذج التنبؤ للتشخيص والتنبؤ بفيروس كوفيد-19: مراجعة منهجية وتقييم نقدي. BMJ 2020؛369:m1328. doi:10.1136/bmj.m1328
10 رايلي RD، آرتشر L، سنيل KIE، وآخرون. تقييم نماذج التنبؤ السريرية (الجزء 2): كيفية إجراء دراسة تحقق خارجية. BMJ 2023;383:e074820. doi:10.1136/bmj-2023-074820
11 رايلي RD، سنيل KIE، آرتشر L، وآخرون. تقييم نماذج التنبؤ السريرية (الجزء 3): حساب حجم العينة المطلوب لدراسة التحقق الخارجي. BMJ 2023;383:e074821. doi:10.1136/bmj-2023074821
12 العدالة AC، كوفينسكي KE، برلين JA. تقييم قابلية تعميم المعلومات التنبؤية. آن إنترن ميد 1999؛130:515-24. doi:10.7326/0003-4819-130-6-199903160-00016
13 كيم دي دبليو، جانغ إتش واي، كو واي، وآخرون. عدم الاتساق في استخدام مصطلح “التحقق” في الدراسات التي تقيم أداء خوارزميات التعلم العميق في تقديم التشخيص من التصوير الطبي. بلس وان 2020؛ 15: e0238908. doi:10.1371/journal.pone.0238908
14 سبيرين م، رايلي آر دي، كولينز جي إس، مارتن جي بي. التحقق المستهدف: التحقق من نماذج التنبؤ السريرية في السكان والإعداد المستهدفين. تشخيص التنبؤ والبحث 2022؛6:24. doi:10.1186/s41512-022-00136-8
15 رايلي RD، إنسور J، سنيل KIE، وآخرون. التحقق الخارجي من نماذج التنبؤ السريرية باستخدام مجموعات بيانات كبيرة من سجلات الصحة الإلكترونية أو تحليل البيانات الفردية: الفرص والتحديات. BMJ 2016؛ 353: i3140. doi:10.1136/bmj.i3140
16 فان كالسيرت بي، ستيربرغ إي دبليو، وينانتس إل، فان سمدن إم. لا يوجد شيء يسمى نموذج توقع موثق. بي إم سي ميد 2023؛ 21:70. doi:10.1186/s12916-023-02779-w
17 كولينز جي إس، ريتسما جي بي، ألتمان دي جي، مونس ك جي إم. التقرير الشفاف لنموذج توقع متعدد المتغيرات للتشخيص أو التنبؤ الفردي (TRIPOD): بيان TRIPOD. BMJ 2015؛350:g7594. doi:10.1136/bmj.g7594
18 Moons KGM، ألتمان DG، ريتسما JB، وآخرون. التقرير الشفاف لنموذج التنبؤ المتعدد المتغيرات للتشخيص أو التنبؤ الفردي (TRIPOD): الشرح والتفصيل. آن إنترن ميد 2015؛162:W1-73. doi:10.7326/M14-0698
19 تول DB، جانسن KJ، فيرغوي Y، مونس KG. التحقق من صحة وتحديث وتأثير قواعد التنبؤ السريرية: مراجعة. J Clin Epidemiol 2008؛ 61: 1085-94. doi:10.1016/j.jclinepi.2008.04.008
20 رايلي RD، إنسور J، سنيل KIE، وآخرون. حساب حجم العينة المطلوب لتطوير نموذج توقع سريري. BMJ 2020؛368:m441. doi:10.1136/bmj.m441
21 رايلي RD، سنيل KI، إنسور J، وآخرون. الحد الأدنى لحجم العينة لتطوير نموذج توقع متعدد المتغيرات: الجزء الثاني – النتائج الثنائية ونتائج الوقت للحدث. ستات ميد 2019؛ 38: 1276-96. doi:10.1002/sim.7992
22 شاكور هـ، روبرتس آي، باوتيستا ر، وآخرون، متعاونون في تجربة CRASH-2. تأثيرات حمض الترانيكساميك على الوفاة، والأحداث الوعائية الانسدادية، ونقل الدم في مرضى الصدمة الذين يعانون من نزيف كبير (CRASH-2): تجربة عشوائية محكومة بالدواء الوهمي. لانسيت 2010؛376:23-32. doi:10.1016/S0140-6736(10)60835-5
23 ستايربرغ EW. التحقق في أبحاث التنبؤ: الهدر الناتج عن تقسيم البيانات. / علم الأوبئة السريرية 2018;103:131-3. doi:10.1016/j.jclinepi.2018.07.010
24 رايلي RD، سنيل KIE، إنسور J، وآخرون. الحد الأدنى لحجم العينة لتطوير نموذج توقع متعدد المتغيرات: الجزء الأول – النتائج المستمرة. ستات ميد 2019؛ 38: 1262-75. doi:10.1002/sim.7993
25 فان سمدن م، دي غروت جا، مونس كج، وآخرون. لا يوجد مبرر لمعيار متغير واحد لكل 10 أحداث في تحليل الانحدار اللوجستي الثنائي. BMC ميد ريس ميثودول 2016؛ 16:163. doi:10.1186/s12874-016-0267-3
26 فان سمدن م، مونس ك جي، دي غروت ج أ، وآخرون. حجم العينة لنماذج التنبؤ اللوجستي الثنائي: ما وراء معايير الأحداث لكل متغير. طرق إحصائية في البحث الطبي 2019؛ 28: 2455-74. doi:10.1177/0962280218784726
27 رايلي RD، كولينز GS، إنسور J، وآخرون. حسابات الحد الأدنى لحجم العينة للتحقق الخارجي من نموذج التنبؤ السريري مع نتيجة زمنية. ستات ميد 2022؛ 41: 1280-95. doi:10.1002/sim.9275
28 سنيل كيه، آرتشر ل، إنسور ج، وآخرون. التحقق الخارجي من نماذج التنبؤ السريرية: كانت حسابات حجم العينة المعتمدة على المحاكاة أكثر موثوقية من القواعد العامة. مجلة الوبائيات السريرية 2021؛ 135: 79-89. doi:10.1016/j.jclinepi.2021.02.011
29 أرشر إل، سنيل كيه آي إي، إنسور ج، هودا إم تي، كولينز جي إس، رايلي آر دي. الحد الأدنى لحجم العينة للتحقق الخارجي من نموذج التنبؤ السريري مع نتيجة مستمرة. ستات ميد 2021؛ 40: 133-46. doi:10.1002/sim.8766
30 ستايربرغ EW، هاريل FEJr، بورس بوم GJJM، إيكيما نس MJC، فيرغوي Y، هابما JDF. التحقق الداخلي من النماذج التنبؤية: كفاءة بعض الإجراءات لتحليل الانحدار اللوجستي. J Clin Epidemiol 2001؛54:774-81. doi:10.1016/S0895-4356(01)003419
31 رايلي RD، كولينز GS. استقرار نماذج التنبؤ السريرية التي تم تطويرها باستخدام طرق إحصائية أو تعلم الآلة [إنترنت]. arXiv؛ 2022 [تم الاستشهاد به في 4 يناير 2023]. متوفر من:https://arxiv.org/abs/2211.01061
32 هاريل FEJr، لي KL، مارك DB. نماذج التنبؤ متعددة المتغيرات: قضايا في تطوير النماذج، تقييم الافتراضات والملاءمة، وقياس وتقليل الأخطاء. إحصاء الطب 1996؛ 15: 361-87. doi:10.1002/(SICI)1097-0258(19960229)15:4<361::AID-SIM168>3.0.CO;2-4
33 مارتن جي بي، رايلي آر دي، كولينز جي إس، سبيرين م. تطوير نماذج التنبؤ السريرية عند الالتزام بالحد الأدنى من العينة
BMJ: نُشر لأول مرة كـ 10.1136/bmj-2023-074819 في 8 يناير 2024. تم التنزيل منhttps://www.bmj.com/في 28 أغسطس 2025 بواسطة ضيف. محمي بموجب حقوق الطبع والنشر، بما في ذلك الاستخدامات المتعلقة بتعدين النصوص والبيانات، وتدريب الذكاء الاصطناعي، والتقنيات المماثلة.
توصيات الحجم: أهمية قياس تباين البوتستراب في ضبط المعلمات والأداء التنبؤي. طرق إحصائية في البحث الطبي 2021؛30:2545-61. doi:10.1177/09622802211046388
34 ستايربرغ EW، بليكر SE، مول HA، جروبي DE، مونس KGM. التحقق الداخلي والخارجي من النماذج التنبؤية: دراسة محاكاة للتحيز والدقة في عينات صغيرة. / علم الأوبئة السريرية 2003؛ 56: 441-7. doi:10.1016/S0895-4356(03)00047-7
35 ستايربرغ EW. نماذج التنبؤ السريرية: نهج عملي للتطوير والتحقق والتحديث. الطبعة الثانية. سبرينغر، 2019. doi:10.1007/978-3-030-16399-0.
36 هاريل FEJr. استراتيجيات نمذجة الانحدار: مع تطبيقات على النماذج الخطية، والانحدار اللوجستي والترتيبي، وتحليل البقاء. الطبعة الثانية. سبرينجر، 2015. doi:10.1007/978-3-319-194257.
37 أوستن بي سي، فان كلافرين دي، فيرغوي ي، نيبور دي، لي دي إس، ستايربرغ إي دبليو. الصلاحية الجغرافية والزمنية لنماذج التنبؤ: كانت هناك طرق مختلفة مفيدة لفحص أداء النموذج. / علم الأوبئة السريرية 2016؛79:76-85. doi:10.1016/j.jclinepi.2016.05.007
38 هيكي جي إل، غرانت إس دبليو، مورفي جي جي، وآخرون. الاتجاهات الديناميكية في جراحة القلب: لماذا لم يعد نموذج يوروسكور اللوجستي مناسبًا لجراحة القلب المعاصرة وآثار ذلك على نماذج المخاطر المستقبلية. المجلة الأوروبية لجراحة القلب والصدر 2013؛43:1146-52. doi:10.1093/ejcts/ezs584
39 جنكينز د. التحديث المستمر ومراقبة نماذج التنبؤ السريرية: هل حان الوقت لأنظمة التنبؤ الديناميكية؟ 2021؛7.
40 Booth S، Riley RD، Ensor J، Lambert PC، Rutherford MJ. إعادة ضبط الزمن لتحسين تطوير نماذج التنبؤ وتوقعات المخاطر في البيئات التي تتحسن فيها معدلات البقاء مع مرور الوقت. Int/ Epidemiol 2020؛49:1316-25. doi:10.1093/ije/dyaa030
41 هيبيسلي-كوك ج، كوبرلاند س، فينوجرادوفا ي، وآخرون. التنبؤ بمخاطر القلب والأوعية الدموية في إنجلترا وويلز: الاشتقاق والتأكيد المستقبلي لـ QRISK2. BMJ 2008؛ 336: 1475-82. doi:10.1136/bmj.39609.449676.25
42 رايلي آر، تيرني ج، ستيوارت ل، محررون. تحليل البيانات الفردية للمتعاونين: دليل لأبحاث الرعاية الصحية. وايلي، 2021. doi:10.1002/9781119333784.
43 ستايربرغ EW، هاريل FEJr. تحتاج نماذج التنبؤ إلى التحقق الداخلي المناسب، والتحقق الداخلي الخارجي، والتحقق الخارجي. J Clin Epidemiol 2016;69:245-7. doi:10.1016/j.jclinepi.2015.04.005
44 روستون بي، بارمار إم كي بي، سيلفستر آر. بناء وتحقق من نموذج تنبؤي عبر عدة دراسات، مع تطبيق في سرطان المثانة السطحي. إحصاء الطب 2004؛ 23: 907-26. doi:10.1002/sim.1691
45 تاكادا تي، نيجمان إس، دينكاساس إس، وآخرون. ساعدت عملية التحقق المتبادل الداخلي-الخارجي في تقييم قابلية تعميم نماذج التنبؤ في مجموعات البيانات الكبيرة المجمعة. / علم الأوبئة السريرية 2021؛ 137: 8391. doi:10.1016/j.jclinepi.2021.03.025
46 ديبري تي بي، مونس ك جي، أحمد آي، كوفيبرغ إتش، رايلي آر دي. إطار لتطوير وتنفيذ وتقييم نماذج التنبؤ السريرية في تحليل البيانات الفردية للمترو. إحصاء الطب 2013؛32:3158-80. doi:10.1002/sim.5732
47 ديبري TPA، كولينز GS، رايلي RD، وآخرون. التقرير الشفاف لنماذج التنبؤ متعددة المتغيرات التي تم تطويرها أو التحقق من صحتها باستخدام بيانات مجمعة: قائمة فحص TRIPOD-Cluster. BMJ 2023؛380:e071018. doi:10.1136/bmj-2022-071018
48 ديبري TPA، كولينز GS، رايلي RD، وآخرون. التقرير الشفاف لنماذج التنبؤ متعددة المتغيرات التي تم تطويرها أو التحقق من صحتها باستخدام بيانات مجمعة (TRIPOD-Cluster): الشرح والتفصيل. BMJ 2023؛380:e071058. doi:10.1136/bmj-2022-071058
49 فوتوما ج، سيمونز م، بانش ت، دوتشي-فيليز ف، سيلّي ل. أسطورة القابلية للتعميم في الأبحاث السريرية وتعلم الآلة في الرعاية الصحية. لانسيت للصحة الرقمية 2020؛2:e489-92. doi:10.1016/S2589-7500(20)30186-2
50 كولينز جي إس، ألتمن دي جي. التنبؤ بخطر الإصابة بأمراض القلب والأوعية الدموية على مدى 10 سنوات في المملكة المتحدة: التحقق المستقل والخارجي من نسخة محدثة من QRISK2. BMJ 2012؛344:e4181. doi:10.1136/bmj.e4181
51 نيفين ل، محررو مجلة PLOS للطب. تعزيز الاستخدام المفيد لتعلم الآلة في الرعاية الصحية والطب: نحو فهم مجتمعي. PLoS Med 2018؛ 15: e1002708. doi:10.1371/journal.pmed.1002708
52 كولينز جي إس، دي غروت جي إيه، داتون إس، وآخرون. التحقق الخارجي من نماذج التنبؤ متعددة المتغيرات: مراجعة منهجية للسلوك والتقارير المنهجية. BMC Med Res Methodol 2014؛ 14:40. doi:10.1186/1471-2288-14-40
53 Moons KGM، ألتمان DG، فيرغوي Y، رويستون P. التنبؤ والبحث التنبؤي: تطبيق وتأثير النماذج التنبؤية في الممارسة السريرية. BMJ 2009؛ 338: b606. doi:10.1136/bmj.b606
54 ديبري TPA، فيرغوي Y، كوفيبرج H، نيبور D، ستيربرغ EW، مونس KGM. إطار جديد لتعزيز تفسير دراسات التحقق الخارجي لنماذج التنبؤ السريرية. J Clin Epidemiol 2015؛ 68: 279-89. doi:10.1016/j.jclinepi.2014.06.018
55 كابيتزا ف، كامباجنر أ، سوارس ف، وآخرون. أهمية أن تكون خارجيًا. رؤى منهجية للتحقق الخارجي من نماذج التعلم الآلي في الطب. طرق الحوسبة والبرامج الحيوية 2021؛ 208: 106288. doi:10.1016/j.cmpb.2021.106288
56 ألتمان دي جي، فيرغوي ي، رويستون بي، مونس ك جي إم. التنبؤ والبحث التنبؤي: التحقق من نموذج تنبؤي. BMJ 2009؛ 338: b605. doi:10.1136/bmj.b605
57 ديفيس SE، لاسكو TA، تشين G، سيو ED، ماثيني ME. انحراف المعايرة في نماذج الانحدار وتعلم الآلة لإصابة الكلى الحادة. مجلة جمعية المعلومات الطبية الأمريكية 2017؛ 24: 1052-61. doi:10.1093/jamia/ocx030
58 ويسلر بي إس، نيلسون ج، بارك جي، وآخرون. التحقق الخارجي من نماذج التنبؤ السريري القلبي الوعائي: مراجعة شاملة للأدبيات. دائرة نتائج الجودة القلبية الوعائية 2021؛14:e007858. doi:10.1161/CIRCOUTCOMES.121.007858
٥٩ فان كالسـتر ب، وينانتس ل، تيمرمان د، ستايربرغ إي دبليو، كولينز جي إس. التحليلات التنبؤية في الرعاية الصحية: كيف يمكننا أن نعرف أنها تعمل؟/ جمعية المعلومات الطبية الأمريكية ٢٠١٩؛٢٦:١٦٥١-٤. doi:10.1093/jamia/ocz130
٦٠ بارك ي، هو ج، سينغ م، وآخرون. مقارنة الطرق لتقليل التحيز من نماذج التنبؤ السريرية للاكتئاب بعد الولادة. شبكة جراحة جاما ٢٠٢١؛٤:e٢١٣٩٠٩. doi:10.1001/jamanetworkopen.2021.3909
٦١ غاناباثي س، بالمر ج، ألدرمان ج إي، وآخرون. معالجة التحيز في مجموعات بيانات الذكاء الاصطناعي من خلال مبادرة STANDING Together. الطب الطبيعي ٢٠٢٢؛٢٨:٢٢٣٢-٣. doi:10.1038/s41591-022-01987-w
٦٢ فياس د أ، آيزنشتاين ل ج، جونز د س. مخفي في العلن إعادة النظر في استخدام تصحيح العرق في الخوارزميات السريرية. نيو إنجلاند جورنال أوف ميديسن ٢٠٢٠؛٣٨٣:٨٧٤-٨٢. doi:10.1056/NEJMms2004740
٦٣ جونسون-مان سي إن، لوفتس ت ج، بيهوريك أ. العدالة والذكاء الاصطناعي في الرعاية الجراحية. جراحة جاما ٢٠٢١؛١٥٦:٥٠٩-١٠. doi:10.1001/jamasurg.2020.7208
٦٤ باولس ج ك، كينت د م. غير متساوي بشكل متوقع: فهم ومعالجة المخاوف من أن التنبؤ السريري الخوارزمي قد يزيد من الفجوات الصحية. NPJ Digit Med ٢٠٢٠؛٣:٩٩. doi:10.1038/s41746-020-0304-9
ملحق ويب: مواد إضافية

  1. نقاط ملخصة
    تستخدم نماذج التنبؤ السريرية مجموعة من المتغيرات لتقدير مخاطر النتائج للأفراد
    تقييم أداء نموذج التنبؤ أمر بالغ الأهمية ودراسات التحقق ضرورية، حيث يمكن أن يكون النموذج المطور بشكل سيء ضارًا أو يزيد من الفجوات في تقديم الرعاية الصحية أو نتائج الرعاية الصحية اللاحقة
    يجب أن يتم تقييم أداء النموذج في مجموعات بيانات تمثل السكان المستهدفين المقصودين لتنفيذ النموذج
    غالبًا ما يبدو أداء النموذج التنبؤي ممتازًا في مجموعة بيانات التطوير ولكنه يكون أقل بكثير عند تقييمه في مجموعة بيانات منفصلة، حتى من نفس السكان
    يجب تجنب تقسيم البيانات في لحظة تطوير النموذج بشكل عام لأنه يتخلص من البيانات مما يؤدي إلى نموذج أقل موثوقية، بينما يترك عددًا قليلًا جدًا من البيانات لتقييم أدائه بشكل موثوق
    يجب بذل جهود منسقة لاستغلال جميع البيانات المتاحة لبناء أفضل نموذج ممكن، مع استخدام أفضل لطرق إعادة العينة للتحقق الداخلي، والتحقق الداخلي-الخارجي لتقييم أداء النموذج وقابليته للتعميم عبر المجموعات

Evaluation of clinical prediction models (part 1): from development to external validation

Gary S Collins, Paula Dhiman, Jie Ma, Michael M Schlussel, Lucinda Archer, Ben Van Calster, Frank E Harrell Jr, Glen P Martin, Karel G M Moons, Maarten van Smeden, Matthew Sperrin, Garrett S Bullock, Richard D Riley

For numbered affiliations see end of the article
Correspondence to: G S Collins gary.collins@csm.ox.ac.uk (or @GSCollins on Twitter; ORCID 0000-0002-2772-2316)
Additional material is published online only. To view please visit the journal online.
Citethis as:BMJ2024;384:0074819
http://dx.doi.org/10.1136/
bmj-2023-074819
Accepted: 04 September 2023

Abstract

Evaluating the performance of a clinical prediction model is crucial to establish its predictive accuracy in the populations and settings intended for use. In this article, the first in a three part series, Collins and colleagues describe the importance of a meaningful evaluation using internal, internal-external, and external validation, as well as exploring heterogeneity, fairness, and generalisability in model performance.

Healthcare decisions for individuals are routinely made on the basis of risk or probability. Whether this probability is that a specific outcome or disease is present (diagnostic) or that a specific outcome will occur in the future (prognostic), it is important to know how these probabilities are estimated and whether they are accurate. Clinical prediction models estimate outcome risk for an individual conditional on their characteristics of multiple predictors (eg, age, family history, symptoms, blood pressure). Examples include the ISARIC (International Severe Acute Respiratory and Emerging Infection Consortium) 4C

model for estimating the risk of clinical deterioration in individuals with acute COVID-19, or the PREDICT model for estimating the overall and breast cancer specific survival probability at five years for women with early breast cancer. Clinical decision making can also be informed by models that estimate continuous outcome values, such as fat mass in children and adolescents, although we focus on risk estimates in this article. With increasing availability of data, pressures to publish, and a surge in interest in approaches based on artificial intelligence and machine learning (such as deep learning and random forests ), prediction models are being developed at high volume. For example, diagnosis of chronic obstructive pulmonary disease has models, cardiovascular disease prediction has >300 models, and covid-19 has >600 prognostic models.
Despite the increasing number of models, very few are routinely used in clinical practice owing to issues including study design and analysis concerns (eg, small sample size, overfitting), incomplete reporting (leading to difficulty in fully appraising prediction model studies), and no clear link into clinical decision making. Fundamentally, there is often an absence or failure to fairly and meaningfully evaluate the predictive performance of a model in representative target populations and clinical settings. Lack of transparent and meaningful evaluation obfuscates judgments about the potential usefulness of the model, and whether it is ready for next stage of evaluation (eg, an intervention, or cost effectiveness study) or requires updating (eg, recalibration). To manage this deficit, this three part series outlines the importance of model evaluation and how to undertake it well, to help researchers provide a reliable and fair picture of a model’s predictive accuracy.
In this first article, we explain the rationale for model evaluation, and emphasise that it involves examining a model’s predictive performance at multiple stages, including at model development (internal validation) and in new data (external validation). Subsequent papers in this series consider the study design and performance measures used to evaluate the predictive accuracy of a model (part ) and the sample size requirements for external validation (part ). Box 1 provides a glossary of key terms.

Why do we need to evaluate prediction models?

During model development (or training), study design and data analysis aspects will have an impact on the predictive performance of the model in new data from some target population. A model’s predictive performance will often appear excellent in the
BMJ: first published as 10.1136/bmj-2023-074819 on 8 January 2024. Downloaded from https://www.bmj.com/ on 28 August 2025 by guest. Protected by copyright, including for uses related to text and data mining, Al training, and similar technologies.
development dataset butbemuch lower when evaluated in a separate dataset, even from the same population, often rendering the model much less accurate. The downstream effect is that the model will be less useful and even potentially harmful, including exacerbating inequalities in either provision of healthcare or subsequent healthcare outcomes. Therefore, once a prediction model has been developed, it is clearly important to carry out a meaningful evaluation of how well it performs.
Evaluating the performance of a prediction model is generally referred to as validation. However, the term validation is ill defined, used inconsistently, and evokes a sense of achieving some pre-defined level of statistical or clinical usefulness. A validated model might even (albeit wrongly) be considered a sign of approval for use in clinical practice. Many prediction models that have undergone some form of validation will still have poor performance, either a substantial decrease in model discrimination or, more likely, in calibration (see box 1 for definitions of these measures,

Box 1: Glossary of terms

Calibration

Agreement between the observed outcomes and estimated risks from the model. Calibration should be assessed visually with a plot of the estimated risks on the axis and the observed outcome on the axis with smoothed flexible calibration curve in the individual data. Calibration can also be quantified numerically with the calibration slope (ideal value 1) and calibration-in-the-large (ideal value 0 ).

Calibration-in-the-large

Assesses mean (overall) calibration and quantifies any systematic overestimation or underestimation of risk, by comparing the mean number of predicted outcomes and the mean number of observed outcomes.

Calibration slope

Quantifies the spread of the estimated risks from the model relative to the observed outcomes. A slope suggests that the spread of estimated risks are too extreme (ie, too high for individuals at high risk, and too low for those at low risk). Slope >1 suggests that the spread of estimated risks are too narrow.

Discrimination

Assesses how well the predictions from the model differentiate between those with and without the outcome. Discrimination is typically quantified by the c statistic (sometimes referred to as the AUC or AUROC) for binary outcomes, and the c index for time-to-event outcomes. A value of 0.5 indicates that the model is not better than a coin toss, and a value of 1 denotes perfect discrimination (ie, all individuals with the outcome have higher estimated risks than all individuals without the outcome). What defines a good c statistic value is context specific.

Overfitting

When the prediction model fits unimportant idiosyncrasies in the development data, to the point that the model performs poorly in new data, typically with miscalibration reflected by calibration slopes less than 1 .

Parameter tuning

Finding the best settings for a particular model building strategy.

Shrinkage

Counteracting against overfitting by deliberately inducing bias in the predictor effects by shrinking them towards zero
area under the curve; area under the receiver operating characteristic curve.
and part 2 of our series for more detailed explanation ). Yet determining what level of predictive performance is inadequate (eg, how miscalibrated a model needs to be to conclude poor performance) is subjective. Many validation studies are also too small, a consideration that is frequently overlooked, leading to imprecise estimation of a model’s performance (see part 3 on guidance for sample size ). Therefore, referring to a model as having been “validated” or being “valid,” just because a study labelled as validation has been conducted, is unhelpful and arguably misleading. Indeed, variation in performance over different target populations, or different time periods and places (eg, different centres or countries), is to be expected and so a model can never be proven to be always valid (nor should we expect it to be ).
Figure 1 shows a summary of the different study designs and approaches involving prediction model development and validation. The decision of which validation to carry out depends on the research question that is being asked and the availability of existing data. Regardless of the development approach, the validation component is essential, because any study developing a new prediction model should, without exception, always evaluate the model’s predictive performance for the target population, setting and outcome of interest. We now outline the various options for model evaluation, moving from internal validation to external validation.

Evaluation at model development: internal validation approaches

At the stage of model development, depending on the availability, structure (eg, multiple datasets, multicentre) and size of the available data, investigators are faced with deciding how best to use the available data to both develop a clinical prediction model and evaluate its performance in an unbiased, fair, and informative manner. When the evaluation uses the same data (or data source) as used for model development, the process is referred to as internal validation. For example, the Transparent Reporting of a multivariable prediction model for Individual Prognosis Or Diagnosis (TRIPOD) reporting guideline requires users to “specify type of model, all model-building procedures (including any predictor selection), and method for internal validation.”
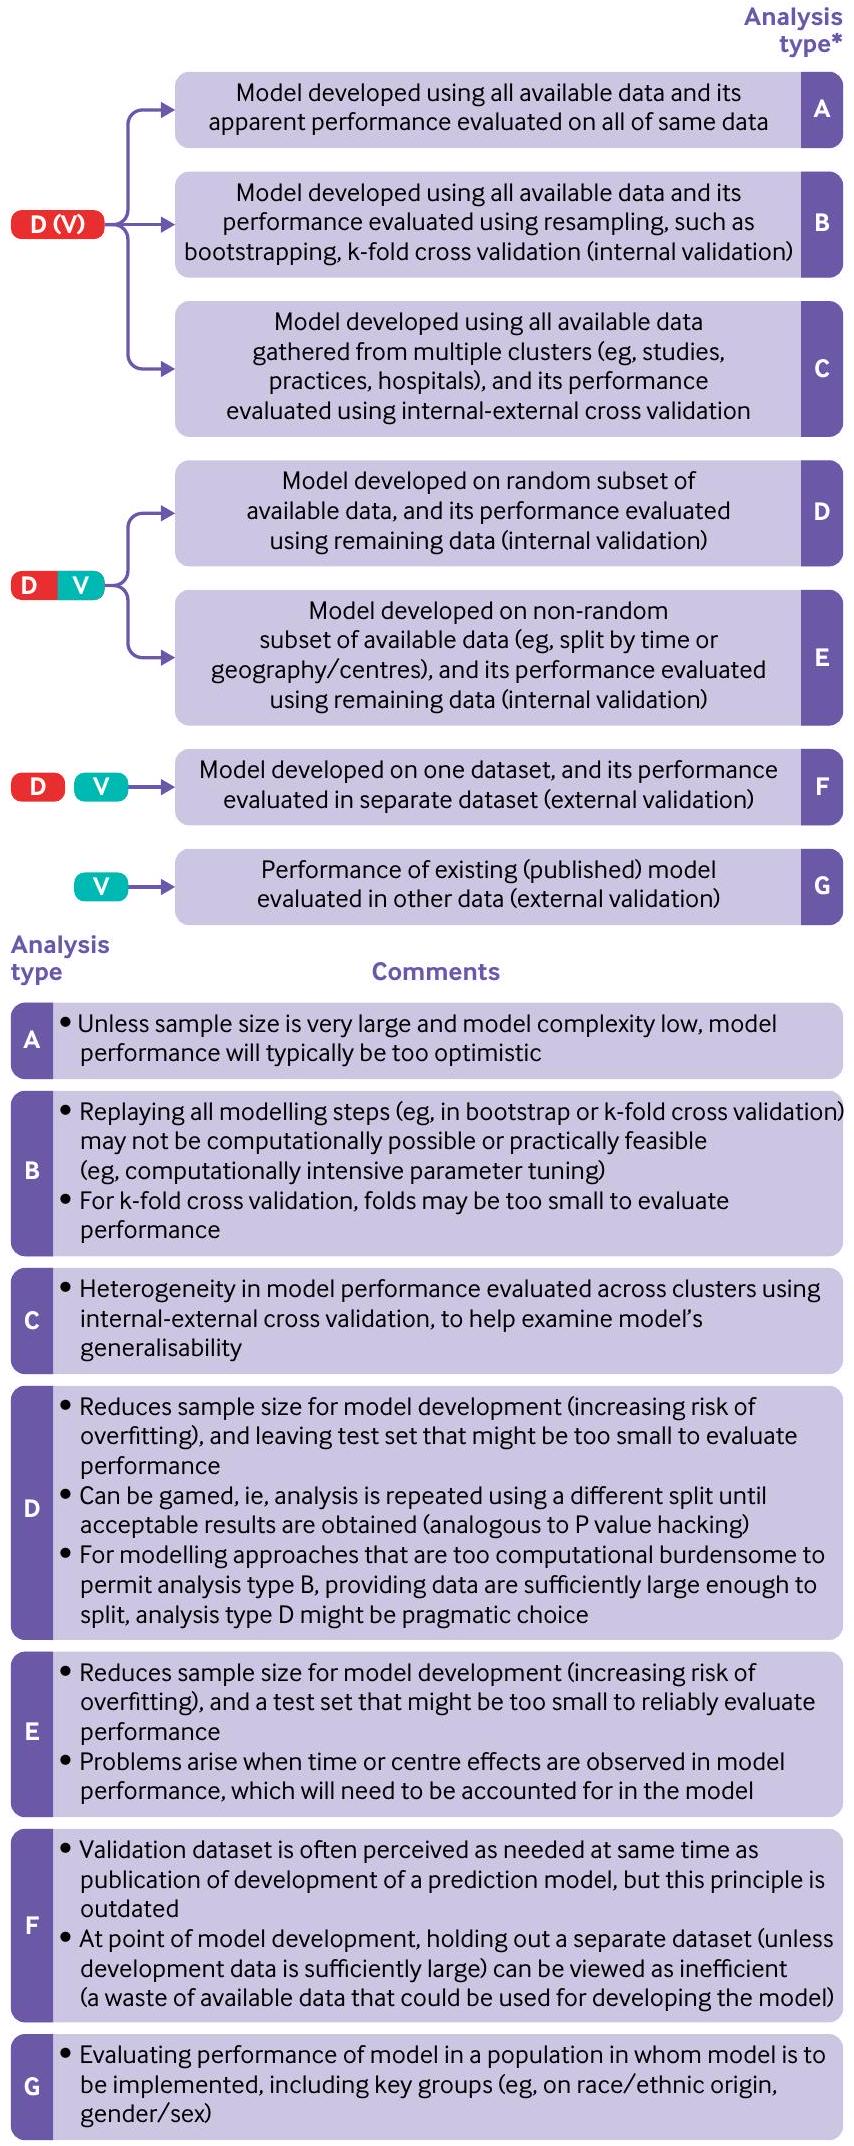
Widely used approaches for internal validation are based on data splitting (using a subset of the data for development and the remainder for evaluation) or resampling (eg, k-fold cross validation or bootstrapping; table 1). For very large datasets, and computationally intensive model building procedures (eg, including parameter tuning; box 1), the decision on which approach is used for internal validation could be a pragmatic one. Nevertheless, some approaches are inefficient and uninformative, and, especially in small sample sizes, might even lead to biased, imprecise and optimistic results and ultimately misleading conclusions. Therefore, we now describe
Fig 1 | Different study design and approaches to develop and evaluate the performance of a multivariable prediction model ( development; validation (evaluation)). Adapted from Collins GS, Reitsma JB, Altman DG, Moons KGM. Transparent reporting of a multivariable prediction model for individual prognosis or diagnosis (TRIPOD): the TRIPOD statement. BMJ 2015;350:g7594. *A study can include more than one analysis type
the advantages and disadvantages of several strategies in detail.

Apparent performance

The simplest approach is to use all the available data to develop a prediction model and then directly evaluate its performance in exactly the same data (often referred to as apparent performance). Clearly, using this approach is problematic, particularly when model complexity and the number of predictors (model parameters to be estimated) is large relative to the number of events in the dataset (indicative of overfitting). The apparent performance of the model will therefore typically be optimistic; that is, when the model is subsequently evaluated in new data, even in the same population, the performance will usually be much lower. For small datasets, the optimism and uncertainty in the apparent performance can be substantial. As the sample size of the data used to develop the model increases, the optimism and uncertainty in apparent performance will decrease, but in most healthcare research datasets some (non-negligible) optimism will occur.
To illustrate apparent performance, we consider a logistic regression model for predicting in-hospital mortality within 28 days of trauma injury in patients with an acute myocardial infarction using data from the CRASH-2 clinical trial ( died within 28 days) using 14 predictors including four clinical predictors (age, sex, systolic blood pressure, and Glasgow coma score) and 10 noise predictors (ie, truly unrelated to the outcome). Varying the sample size between 200 and 10000, models are fit to 500 subsets of the datasets that are created by resampling (with replacement) from the entire CRASH-2 data and each model’s apparent performance calculated. For simplicity, we focus primarily on the c statistic, a measure of a prediction models discrimination (how well the model differentiates between those with and without the outcome, with a value of 0.5 denoting no discrimination and 1 denoting perfect discrimination; see box 1 and part 2 of the series ). Figure 2 shows the magnitude and variability of the difference in the c statistic for the apparent performance estimate compared with the large sample performance value of 0.815 (ie, a model developed on all the available data). For small sample sizes, there is a substantial difference (estimates are systematically much larger) and large variation, with the apparent c statistic ranging anywhere from 0.7 to just under 1. This variability in apparent performance decreases as the sample size increases, and for very large sample sizes, the optimism in apparent performance is negligible and thus a good estimate of the underlying performance in the full (CRASH-2) population.

Random split

Randomly splitting a dataset is often erroneously perceived as a methodological strength-it is not. Authors also often label the two datasets (created by splitting) as independent; despite no overlap in patients, the label “independent” is a misnomer,
BMJ: first published as 10.1136/bmj-2023-074819 on 8 January 2024. Downloaded from https://www.bmj.com/ on 28 August 2025 by guest. Protected by copyright, including for uses related to text and data mining, Al training, and similar technologies.
Table 1 | Different approaches for evaluating model performance
Type of validation Description Comments
Apparent performance Performance of the model when evaluated in the same data used to develop the model. When the sample is of small to moderate size (see part 3 in this series ), the apparent performance will be optimistic (upwardly biased). As the sample size increases, the optimism will decrease. For very large sample sizes, there will be no discernible optimism, and apparent performance will be unbiased.
Internal validation Estimating model performance for the underlying population used to develop the model. A minimal expectation, and one of the TRIPOD statement reporting recommendations (item 10b), is that studies developing a prediction model should carry out an internal validation of that model in the population in whom it is intended to be used. Common internal validation approaches include data splitting, and variations of k-fold cross validation and bootstrapping.
Split sample validation Data are (usually randomly) split into two: one used to develop the model, one used to evaluate the performance of the model. Split sample validation is generally advised against. When the available data are small to moderate, splitting data will create a dataset that is insufficient for model development (increasing the likelihood of overfitting), and a dataset that is insufficient to evaluate the performance of the model. Conversely when the sample size is large, there is little risk of overfitting, and thus no new information is gained in evaluating the model in the validation data. Randomly splitting the dataset also opens up the danger of multiple looks until satisfactory results are obtained.
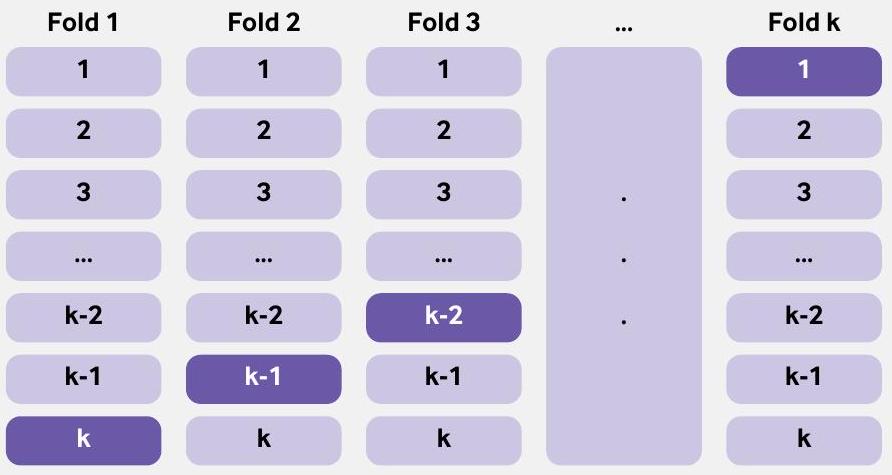
k-fold cross validation Model performance is evaluated by splitting the data into k groups, where groups are used to develop a (temporary) model (repeating the model building steps used to develop the model on all the data) and the group left out is used to evaluate the performance of the temporary model. This process is repeated k times, each time leaving out a different group, producing values of each performance measure. The performance of the developed model is then taken as the average (or median) over the performance measures.
All the available data are used to develop the model and performance of this model is then evaluated using k -fold cross validation (or repeat k -fold cross validation) and bootstrapping to get an unbiased or least unbiased estimate of model performance in the underlying population in whom the model is intended.
The complexity of implementing either k-fold cross validation or bootstrapping increases when both missing data and selection of non-linear terms (eg, using restricted cubic splines or fractional polynomials) are part of the model building process.
Bootstrapping Bootstrapping is a resampling technique, where a bootstrap sample is created by randomly sampling (with replacement) from the original data. In the enhanced bootstrap, a model is developed (repeating the model building steps used to develop the model on all the data) in each bootstrap sample and its performance evaluated in this sample as well as the original dataset to get an estimate of optimism of model performance. This process is repeated many times and the average optimism calculated, which is then subtracted from the apparent performance.
Internal-external cross validation Heterogeneity in performance of the model across clusters. A cluster could be a dataset (when multiple datasets are available, eg, from an IPDMA) or centre (eg, hospitals, general practices). Similar to k -fold cross validation, all clusters with one omitted are used to develop a model, and its performance evaluated on the omitted cluster. This process is repeated taking out a different cluster, so that each cluster is omitted once from the development and used as a test dataset. All available data are used to develop the model and IECV is used to examine heterogeneity in model performance. IECV can also be used to explore clusters where model performance is poor (and explore reasons), which could lead to dropping the cluster from the data and a new model developed.
External validation
Estimating model performance in a different sample of data to that used to develop the model.
The data might be the from same (or similar to) the population or setting used for model development (assessing reproducibility), or might be from a different population or setting (assessing transportability). Another type of validation is where researchers evaluate model performance across multiple populations and settings, where each is relevant to the intended use (assessing generalisability)
External validation at the model development stage is not an efficient use of available data and should not be carried out solely to meet over-zealous and misinformed editorial or reviewer requirements.
External validation should be used to evaluate model performance in subsequent studies in new data that are representative of a target population. Using existing data that are merely conveniently available provide limited, and often misleading, information on model performance.
External validation studies could also be used to evaluate model performance in settings that are intentionally different (eg, a model developed for adults, but subsequently in a different study evaluated in children ), or to explore the model performance when the predictor or outcome definitions (including time horizon) are different (eg, a model to predict an outcome at one year, but evaluated for a two year outcome).
Temporal validation Evaluating the performance of an existing prediction model in data from the same or similar setting in a different time period. At model development, temporal validation is rarely useful and should be avoided. However, understanding whether model performance is changing (and importantly deteriorating) over the study period is useful to understand and ideally rectify.
Geographical or spatial validation Evaluating the performance of an existing prediction model in data collected from an appropriate population in different centres (to the model development). At model development, geographical validation is rarely useful, particularly when all the data can be used to develop the model and heterogeneity in model performance across different centres can be explore using the IECV approach. If data are particularly large, and analysis computationally burdensome, then leaving out a cluster (eg, a centre or country) is a pragmatic compromise that can be considered.
IECV=internal-external cross validation; IPDMA=individual participant data meta-analysis.
because they clearly both come from the same dataset (and data source).
Randomly splitting obviously creates two smaller datasets, and often the full dataset is not even large enough to begin with. Having a dataset that is too small to develop the model increases the likelihood of
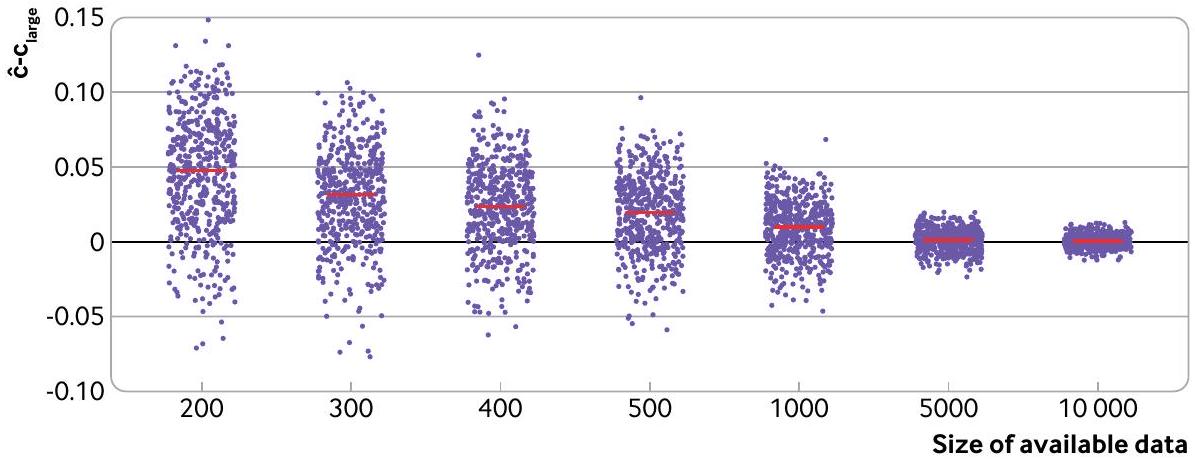
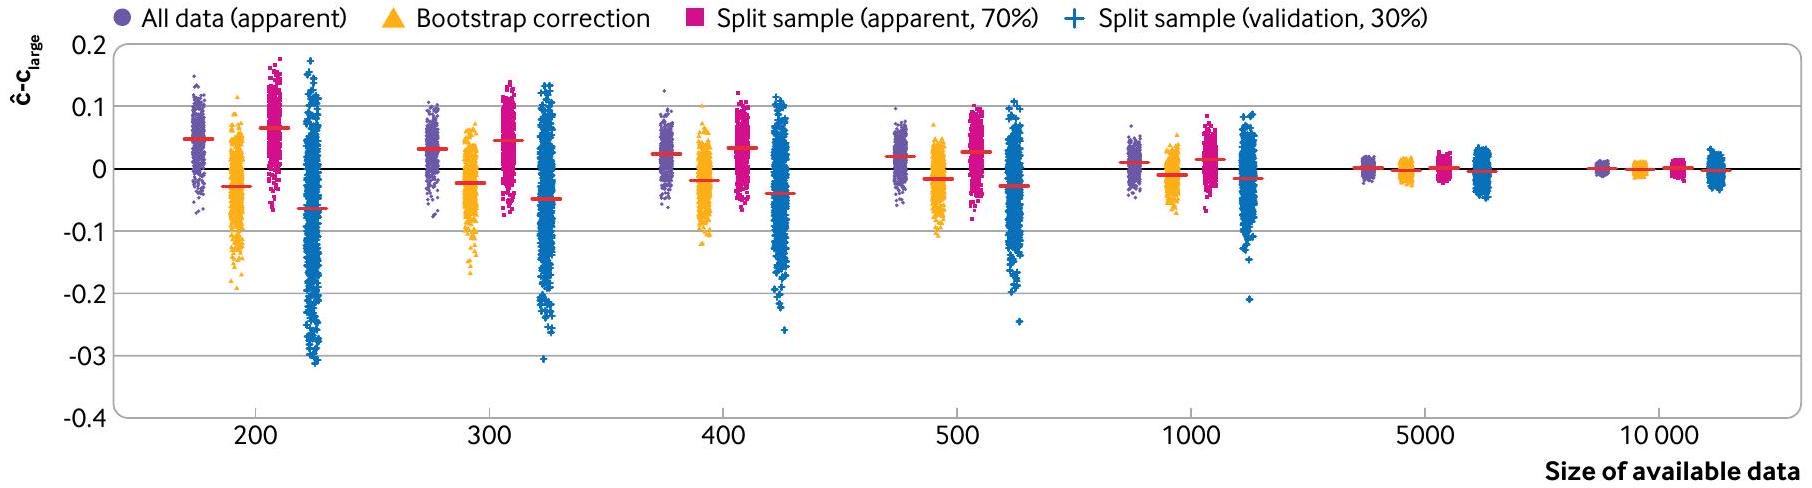
overfitting and producing an unreliable model, 24 and having a test set that is too small will not be able to reliably and precisely estimate model performancethis is a clear waste of precious information (see part 3 in this series ). Figure 3 illustrates the impact of sample size on performance (the c statistic) of
a prediction model using a random split sample approach. Using the same approach as before, a logistic regression model for predicting 28 day mortality in patients with acute myocardial infarction was developed using 14 predictors (age, sex, systolic blood pressure, Glasgow coma score, and 10 noise predictors). The models are fit and evaluated in 500 split sample subsets of the CRASH-2 data, whereby of observations are allocated to the development data and to the test data (eg, for total sample size of , 140 are used for development and 60 are used for evaluation). The results clearly show that for small datasets, using a split sample approach is inefficient and unhelpful. The apparent c statistic of the developed model is too large (ie, optimistic) compared with the large sample performance and noticeably variable, while the test set evaluation (validation) shows that the develop model’s c statistic is much lower and highly variable, and underestimated relative to the large sample performance of the model (again, indicative of overfitting during model development due to too few data). Also, when fewer participants (eg, 90:10 split) are assigned to the test set, even more variability is seen in the model’s observed test set performance (supplementary fig 1).
As sample size increases, the difference between the split sample apparent performance and the test set performance reduces. In very large sample sizes, the difference is negligible. Therefore, data splitting is unnecessary and not an improvement on using all the data for model development and reporting apparent performance when the sample size is large or using internal validation methods (eg, bootstrapping, see below) when sample size is smaller. This observation is not new and has been stated in the methodological literature over 20 years ago, but the message has still not made it to the mainstream biomedical and machine learning literature.
For models with high complexity (eg, deep learners) that prohibit resampling of the full dataset (eg, using bootstrapping), a split sample approach might still be necessary. Similarly, sometimes two or more datasets could be available (eg, from two e-health databases) but not combinable, owing to local restrictions on
data sharing, such that a split sample is enforced. In these situations, we strongly recommended having very large development and test datasets, as otherwise the developed model might be unstable and test performance unreliable, rendering the process futile. Concerns of small sample sizes can be revealed by instability plots and measures of uncertainty.
In addition to the issues of inefficiency and increased variability (instability), randomly splitting the dataset also opens up the danger of multiple looks and spin. That is, if poor performance is observed when evaluating the model in the test portion of the randomly split dataset, researchers could be tempted to repeat the analysis, splitting the data again until the desired results are obtained, similar to P hacking, and thus misleading readers into believing the model has good performance.

Resampling approaches: bootstrapping and k -fold cross validation

Unlike the split sample approach, which evaluates a specific model, bootstrapping evaluates the model building process itself (eg, predictor selection, imputation, estimation of regression coefficients), and estimates the amount of optimism (due to model overfitting) expected when using that process with the sample size available. This estimate of optimism is then used to produce stable and approximately unbiased estimates of future model performance (eg, c statistic, calibration slope) in the population represented by the development dataset. The process starts with using the entire dataset to develop the prediction model and its apparent performance estimated. Bootstrapping is then used to estimate and adjust for optimism, in both the estimates of model performance and the regression coefficients (box 2 ).
Figure 3 shows that using all the available data to develop a model and using bootstrapping to obtain an estimate of the model’s optimism corrected performance, is an efficient approach to internal validation, leading to estimates of model performance that are closest to the large sample performance (eg, compared to a split sample approach), as shown elsewhere (supplementary table 1). For very large
Fig 2 | Variability and overestimation of apparent performance compared to large sample performance, for a model to predict in-hospital mortality within 28 days of trauma injury with increasing sample size of the model development study. denotes the apparent performance estimate and denotes the performance of the model in the entire CRASH-2 population ( ). Red lines for each sample size. Jitter has been added to aid display. implies no systematic overestimation or underestimation of
Fig 3 | Variability and overestimation of the apparent and internal (split sample and bootstrap) validation performance compared with the large sample performance, for a model to predict in-hospital mortality within 28 days of trauma injury with increasing sample size of the model development study. denotes the apparent performance estimate and denotes the performance of the model in the entire CRASH-2 population ( ). The red lines denote the mean for each sample size and for each approach. Jitter has been added to aid display. Split sample (apparent, ) of the available data were used to develop the model, and its (apparent) performance evaluated in this same data. Split sample (validation, ) = the performance of the model (developed in of the available data) in the remaining of the data. implies no systematic overestimation or underestimation of
datasets, the computational burden to carry out bootstrapping can prohibit its use; in these instances, however, little is achieved over using the entire dataset to both derive and evaluate a model, because the estimate of apparent performance should be a good approximation of the underlying large sample performance of the model.
Another resampling method, k -fold cross validation, will often perform comparably to bootstrapping. Like

Box 2: Using bootstrapping for internal validation

The steps to calculate optimism corrected performance using bootstrapping are:
  1. Develop the prediction model using the entire original data and calculate the apparent performance.
  2. Generate a bootstrap sample (of the same size as the original data), by sampling individuals with replacement from the original data.
  3. Develop a bootstrap model using the bootstrap sample (applying all the same modelling and predictor selection methods, as in step 1):
    a. Determine the apparent performance (eg, c statistic, calibration slope) of this model on the bootstrap sample (bootstrap performance).
    b. Determine the performance of the bootstrap model in the original data (test performance).
  4. Calculate the optimism as the difference between the bootstrap performance and the test performance.
  5. Repeat steps 2 to 4 many times (eg, 500 times).
  6. Average the estimates of optimism in step 5.
  7. Subtract the average optimism (from step 6) from the apparent performance obtained in step 1 to obtain an optimism corrected estimate of performance.
    The variability in the optimism corrected estimates, across the bootstrap samples, can also be reported to demonstrate stability. The bootstrap models produced in step 2 will vary (and differ from the prediction model developed on the entire data), but these bootstrap models are only used in the evaluation of performance and not for individual risk prediction. Steyerberg and colleagues have shown that the expected optimism could precisely be estimated with as few as 200 bootstraps with minor sampling variability; with modern computational power, we generally recommend at least 500 bootstraps. An additional benefit of this bootstrap process is that the value of optimism corrected calibration slope can be used to adjust the model from any overfitting by applying it as shrinkage factor to the original regression coefficients (predictor effects).
    bootstrapping, all available data are used to develop the model, and all available data are used to evaluate model performance. k -fold cross validation can be seen an extension of the split sample approach but with a reduction in the bias and variability in estimation of model performance (box 3).

Non-random split (at model development)

Alternative splitting approaches include splitting by time (referred to as temporal validation) or by location (referred to as geographical or spatial validation). However, they remove the opportunity to explore and capture time and location features during model development to help explain variability in outcomes.
In a temporal validation, data from one time period are used to develop the prediction model while data from a different (non-overlapping) time period are used to evaluate its performance. The concern, though, is selecting which time period should be used to develop the model, and which to use for evaluation. Using data from the older time period for model development might not reflect current patient characteristics (predictors and outcomes) or current care. Conversely, using the more contemporary time period to develop the model leaves the data from an older time period to evaluate the performance, and so only provides information on the predictive accuracy in a historical cohort of patients. Neither option is satisfactory, and this approach (at the moment of model development) is not recommended. For example, improvements over time in surgical techniques have led to larger number of patients surviving surgery, and thus the occurrence of the outcome being predicted will decrease over time, which will have an impact on model calibration. Methods such as continual (model) updating should therefore be considered to prevent calibration drift or dynamic prediction models. Temporal recalibration is another option where the predictor effects are estimated in the whole dataset, but the baseline risk is estimated in the most recent time window.

Box 3: Use of k -fold cross validation for internal validation

The process of -fold cross validation entails splitting the data into ” ” equal sized groups. A model is developed in k-1 groups, and its performance (eg, c statistic) evaluated in the remaining group. This process is carried out times, so that each time a different set of k-1 groups is used to develop the model and a different group is used to evaluate model performance (fig 4). The average performance over the iterations is taken as an estimate of the model performance.
Fig 4 | Graphical illustration of k-fold cross validation. Non-shaded parts used for model development; shaded part used for testing
In practice, the value of is usually taken to be 5 or 10 ; cherry picking should be avoided. Repeated k -fold cross validation (where k -fold validation is repeated multiple times and results averaged across them) will generally improve on -fold cross validation.
In a geographical or spatial validation, data from one geographical location (or hospitals, centres) are used to develop the model, while data from a separate geographical location are used to evaluate the model. As with other data splitting approaches previously discussed, in most (if not all) instances, there is often little to be gained in splitting, and rather a missed opportunity in using all available data to develop a model with wider generalisability. However, if data from many geographical regions (or centres) are available to develop a model, comprising a very large number of observations (and outcomes), and computational burden of model development prohibits k -fold cross validation or bootstrapping, leaving out one or more regions or centres to evaluate performance might not be too detrimental. As with the random split approach, researchers might be tempted to split the data (eg, into different time periods and lengths, different centres) repeatedly until satisfactory performance has been achieved-this approach should be avoided. If splitting is to be considered, the splits should be done only once (ie, no repeated splitting until good results are achieved), ensuring that the sample sizes for development and evaluation are of sufficient size.

Evaluation at model development: internal-external cross validation

Data from large electronic health record databases, multicentre studies, or individual participant data from multiple studies are increasingly being made
available and used for prediction model purposes. Researchers might be tempted to perform some form of (geographical or spatial) splitting, whereby only a portion (eg, a group of centres, regions of a country, or a group of studies) is used to develop the model, and the remaining data is used to evaluate its performance. However, internal-external cross validation is a more efficient and informative approach that examines heterogeneity and generalisability in model performance (box 4).
For example, internal-external cross validation was used in the development of the ISARIC 4C model to identify individuals at increased risk of clinical deterioration in adults with acute covid-19. The authors used all their available data ( ) from nine regions of the UK (each comprising between 3066 and 15583 individuals) to develop the model but then, to examine generalisability and heterogeneity, performed an internal-external cross validation with eight regions in the model development and the ninth region held out for evaluation. The authors demonstrated that the model performed consistently across regions, with point estimates of the c statistic ranging from 0.75 to 0.77 , and a pooled random effects meta-analysis estimate of 0.76 (95% confidence interval 0.75 to 0.77 ; fig 6).

Evaluation using new data: external validation

External validation is the process of evaluating the performance of an existing model in a new dataset, differing to that used (and the source used) for model development. It is an important component in the pipeline of a prediction model, as its pursuit is to demonstrate generalisability and transportability of the model beyond the data (and population) used to develop the model (eg, in different hospitals, different countries). For example, Collins and Altman conducted an independent external validation of QRISK2 and the Framingham risk score (at the time recommended by National Institute for Health and Care Excellence in the UK), and demonstrated systematic miscalibration of Framingham, no net benefit at current (at the time) treatment thresholds, and the need for different treatment thresholds.
Some journals refuse to publish model development studies without an external validation ; this stance is outdated and misinformed, and could encourage researchers to perform a meaningless and misleading external validation (eg, non-representative convenience sample, too small, even data splitting under the misnomer of external validation). Indeed, if the model development dataset is large and representative of the target population (including outcome and predictor measurement), and internal validation was done appropriately, then an immediate external validation might not even be needed. However, in many situations, the data used to develop a prediction model might not reflect the target population in whom the model is intended, and variation or lack of standardisation in measurements (including measurement error), poor statistical methods,

Box 4: Internal-external cross validation

Internal-external validation exploits a common feature present in many datasets, namely that of clustering (eg, by centre, geographical region, or study). Instead of partitioning the data into development and validation cohorts, all the data are used to build the prediction model and iteratively evaluate its performance. The performance of this model (developed on all the data) is then examined using cross validation by cluster, where a cluster is held out (eg, a centre, geographical region, study) and the same model building steps (as used on the entire data) are applied to the remaining clusters. The model is then evaluated in the held-out cluster (ie, estimates of calibration and discrimination along with confidence intervals). These steps are repeated, each time taking out a different cluster thereby allowing the generalisability and heterogeneity of performance to be examined across clusters (using meta-analysis techniques; fig 5).
Fig 5 | Graphical illustration of internal-external cross validation. Non-shaded parts used for model development; shaded part used for testing
The results can then be presented in a forest plot to aid interpretation, and a summary estimate calculated using (random effects) meta-analysis. TRIPOD (transparent reporting of a multivariable prediction model for individual prognosis or diagnosis)-Cluster provides recommendations for reporting prediction model studies that have accounted for clustering during validation, including the approach of internal-external cross validation.
inadequate sample size, handling of missing data (including missing important predictors), and changes in health care could all affect the model performance when applied to a target representative population. Supplementary figure 2 and supplementary table 2 demonstrates the impact of sample size in model
development on performance at external validation. Thus, most prediction models need evaluation in new data to demonstrate where they should and should not be considered for deployment or further evaluation of clinical impact (eg, in a randomised clinical trial ).
External validations are needed because variations in healthcare provision, patient demographics, and local idiosyncrasies (eg, in outcome definitions) will naturally dictate the performance of a particular prediction model. Frameworks have been proposed to aid the interpretation of findings at external validation by examining the relatedness (eg, how similar in terms of case mix) of the external validation data to the development data, to explore (on a continuum) whether the validation assesses reproducibility (data are similar to the development data) or transportability (data are dissimilar to the development data). The data used in an external validation study could be from the same population as used for model development, but at a different (more contemporary) time period, obtained subsequent to the model development. Indeed, continual or periodic assessment in the sample population is important to identify and deal with any model deterioration (eg, calibration drift ), which is expected owing to population or healthcare changes over time. However, researchers should also consider external validation in entirely different populations (eg, different centres or countries) or settings (eg, primary/secondary care or adults/children) where the model is sought to be deployed. External validation might even involve different definitions of predictors or outcome (eg, different prediction horizon) than used in the original development population.
External validation is sometimes included in studies developing a prediction model. However, as noted earlier, at the moment of model development, we generally recommend that all available data should be used to build the model, accompanied by a meaningful internal or internal-external cross validation. Using all the available data to develop a model implies that external validation studies should then (in most instances) be done subsequently and outside the model development study, each with a specific
Fig 6 | Internal-external cross validation of the ISARIC (International Severe Acute Respiratory and Emerging Infection Consortium) 4C model. Adapted from Gupta et al. Estimates and confidence intervals taken from original paper where they were reported to two decimal places.
target population in mind (ie, each intended target population or setting for a given prediction model should have a corresponding validation exercise ). The more external validation studies showing good (or acceptable) performance, the more likely the model will also be useful in other untested settings-although clearly there is no guarantee.
Guidance on the design and analysis for external validation studies is provided in parts 2 and 3 of this series. Despite the importance of carrying out an external validation, such studies are relatively sparse, and publication bias is most certainly a concern, with (generally) only favourable external validation studies published. Despite the rhetoric chanting for replication and validation, journals seem to have little appetite in publishing external validation studies (presumably and cynically with citations having a role), with preference for model development studies. It is not inconceivable that researchers (who developed the model) will be less likely to publish external validation studies showing poor or weak performance. Incentives for independent researchers to carry out an external validation are also a contributing factor-what are the benefits for them, with seemingly low appetite by journals to publish them, particularly when the findings are not exciting? Failure of authors to report or make the prediction model available will, either through poor reporting or for proprietary reasons, also be a clear barrier for independent evaluation, potentially leading to only favourable findings (by the model developers).

Evaluation in subgroups: going beyond population performance to help examine fairness

Evaluating model performance typically focuses on measures of performance at the dataset level (eg, a single c statistic, or a single calibration plot or measure) as a proxy for the intended target population. While this performance is essential to quantify and report, concerted efforts should be made to explore potential heterogeneity and delve deeper into (generalisability of) model performance. Researchers should not only highlight where their model exhibits good performance, but also carry out and report findings from a deeper interrogation and identify instances, settings, and groups of people where the model has poorer predictive accuracy, because using such a model could have a downstream impact on decision making and patient care, and potentially harm patients. For example, in addition to exploring heterogeneity in performance across different centres or clusters (see above), researchers should be encouraged (indeed expected) to evaluate model performance in other key subgroups (such as sex/gender, race/ethnic group), as part of checking algorithmic fairness, especially when sample sizes are large enough, and when data have been collected in an appropriate way that represents the diverse range of people the model is intended to be used in. For example, in their external validation and comparison of QRISK2 and the Framingham risk score, Collins and Altman
demonstrated miscalibration of the Framingham risk score, with systematic overprediction in men across all ages, and a small miscalibration of QRISK2 in those of older age.
Introducing a new technology in clinical care, such as a prediction model, which is expected only to increase with the surge in interest and investment in artificial intelligence and machine learning, should ideally reduce but certainly not create or exacerbate any disparities in either provision of healthcare or indeed subsequent healthcare outcomes. Consideration of key subgroups is therefore important during the design (and data collection), analysis, reporting, and interpretation of findings.

Conclusions

Evaluating the performance of a prediction model is critically important and therefore validation studies are essential. Here, we have described how to make the most of the available data to develop and, crucially, evaluate a prediction model from development to external validation. Splitting data at the moment of model development should generally be avoided because it discards data leading to a more unreliable model. Rather, concerted efforts should be made to exploit all available data to build the best possible model, with better use of resampling methods for internal validation, and internal-external validation to evaluate model performance and generalisability across clusters. External validation studies should be considered in subsequent research, preferably by independent investigators, to evaluate model performance in datasets that are representative of the intended target populations for the model’s implementation. The next paper in this series, part 2, explains how to conduct such studies.

AUTHOR AFFILIATIONS

Centre for Statistics in Medicine, Nuffield Department of Orthopaedics, Rheumatology and Musculoskeletal Sciences, University of Oxford, Oxford OX3 7LD, UK
Institute of Applied Health Research, College of Medical and Dental Sciences, University of Birmingham, Birmingham, UK
National Institute for Health and Care Research (NIHR) Birmingham Biomedical Research Centre, UK
KU Leuven, Department of Development and Regeneration, Leuven, Belgium
Department of Biomedical Data Sciences, Leiden University Medical Centre, Leiden, Netherlands
EPI-Centre, KU Leuven, Belgium
Department of Biostatistics, Vanderbilt University, Nashville, TN, USA
Division of Informatics, Imaging and Data Science, Faculty of Biology, Medicine and Health, University of Manchester, Manchester Academic Health Science Centre, Manchester, UK
Julius Centre for Health Sciences and Primary Care, University Medical Centre Utrecht, Utrecht University, Utrecht, Netherlands
Department of Orthopaedic Surgery, Wake Forest School of Medicine, Winston-Salem, NC, USA
Centre for Sport, Exercise and Osteoarthritis Research Versus Arthritis, University of Oxford, Oxford, UK
Contributors: GSC and RDR conceived the paper and produced the first draft. All authors provided comments and suggested changes, which were then resolved by GSC and RDR. GSC is the guarantor. The corresponding author attests that all listed authors meet authorship criteria and that no others meeting the criteria have been omitted.
Funding: This work was supported by Cancer Research UK (C49297/A27294, which supports GSC, JM, and MMS; and PRCPJTNov21100021, which supports PD). The Medical Research Council Better Methods Better Research (grant MR/V038168/1, which supports GSC, LA, and RDR), the EPSRC (Engineering and Physical Sciences Research Council) grant for “Artificial intelligence innovation to accelerate health research” (EP/Y018516/1, which supports GSC, LA, PD, and RDR). National Institute for Health and Care Research Birmingham Biomedical Research Centre at the University Hospitals Birmingham NHS Foundation Trust and the University of Birmingham (which supports RDR), the Research Foundation-Flanders (G097322N, which supports BVC), Internal Funds KU Leuven (C24M/20/064, which supports BVC), National Center for Advancing Translational Sciences (Clinical Translational Science Award 5UL1TR002243-03, which supports FEH), National Institutes of Health (NHLBI 10T2HL156812-01, which supports FEH), and the ACTIV Integration of Host-targeting Therapies for COVID-19 Administrative Coordinating Center from the National Heart, Lung, and Blood Institute (which supports FEH) The funders had no role in considering the study design or in the collection, analysis, interpretation of data, writing of the report, or decision to submit the article for publication.
Competing interests: All authors have completed the ICMJE uniform disclosure form at https://www.icmje.org/disclosure-of-interest/and declare: support from Cancer Research UK and the Medical Research Council for the submitted work; no financial relationships with any organisations that might have an interest in the submitted work in the previous three years; no other relationships or activities that could appear to have influenced the submitted work. GSC and RDR are statistical editors for The BMJ.
Data sharing: The CRASH-2 and CRASH-3 data used in this paper are freely available at https://freebird.lshtm.ac.uk. The R code used to produce the figures and supplementary tables is available from https://github.com/gscollins1973/validationCRASH.
Patient and public involvement: Patients or the public were not involved in the design, or conduct, or reporting, or dissemination of our research.
Provenance and peer review: Not commissioned, externally peer reviewed.
This is an Open Access article distributed in accordance with the terms of the Creative Commons Attribution (CC BY 4.0) license, which permits others to distribute, remix, adapt and build upon this work, for commercial use, provided the original work is properly cited. See: http://creativecommons.org/licenses/by/4.0/.
1 van Smeden M, Reitsma JB, Riley RD, Collins GS, Moons KG. Clinical prediction models: diagnosis versus prognosis. J Clin Epidemiol 2021;132:142-5. doi:10.1016/j.jclinepi.2021.01.009
2 Gupta RK, Harrison EM, Ho A, et al, ISARIC4C Investigators. Development and validation of the ISARIC 4C Deterioration model for adults hospitalised with COVID-19: a prospective cohort study. Lancet Respir Med 2021;9:349-59. doi:10.1016/S2213-2600(20)30559-2
3 Wishart GC, Azzato EM, Greenberg DC, et al. PREDICT: a new UK prognostic model that predicts survival following surgery for invasive breast cancer. Breast Cancer Res 2010;12:R1. doi:10.1186/bcr2464
4 Hudda MT, Fewtrell MS, Haroun D, et al. Development and validation of a prediction model for fat mass in children and adolescents: metaanalysis using individual participant data. BMJ 2019;366:14293. doi:10.1136/bmj.l4293
5 Christodoulou E, Ma J, Collins GS, Steyerberg EW, Verbakel JY, Van Calster B. A systematic review shows no performance benefit of machine learning over logistic regression for clinical prediction models. / Clin Epidemiol 2019;110:12-22. doi:10.1016/j. jclinepi.2019.02.004
6 Dhiman P, Ma J, Navarro CA, et al. Reporting of prognostic clinical prediction models based on machine learning methods in oncology needs to be improved. / Clin Epidemiol 2021;138:60-72. doi:10.1016/j.jclinepi.2021.06.024
7 Bellou V, Belbasis L, Konstantinidis AK, Tzoulaki I, Evangelou E. Prognostic models for outcome prediction in patients with chronic obstructive pulmonary disease: systematic review and critical appraisal. BMJ 2019;367:I5358. doi:10.1136/bmj.I5358
8 Damen JAAG, Hooft L, Schuit E, et al. Prediction models for cardiovascular disease risk in the general population: systematic review. BMJ 2016;353:i2416. doi:10.1136/bmj.i2416
9 Wynants L, Van Calster B, Collins GS, et al. Prediction models for diagnosis and prognosis of covid-19: systematic review and critical appraisal. BMJ 2020;369:m1328. doi:10.1136/bmj.m1328
10 Riley RD, Archer L, Snell KIE, et al. Evaluation of clinical prediction models (part 2): how to undertake an external validation study. BMJ 2023;383:e074820. doi:10.1136/bmj-2023-074820
11 Riley RD, Snell KIE, Archer L, et al. Evaluation of clinical prediction models (part 3): calculating the sample size required for an external validation study. BMJ 2023;383:e074821. doi:10.1136/bmj-2023074821
12 Justice AC, Covinsky KE, Berlin JA. Assessing the generalizability of prognostic information. Ann Intern Med 1999;130:515-24. doi:10.7326/0003-4819-130-6-199903160-00016
13 Kim DW, Jang HY, Ko Y, et al. Inconsistency in the use of the term “validation” in studies reporting the performance of deep learning algorithms in providing diagnosis from medical imaging. PLOS One 2020;15:e0238908. doi:10.1371/journal.pone. 0238908
14 Sperrin M, Riley RD, Collins GS, Martin GP. Targeted validation: validating clinical prediction models in their intended population and setting. Diagn Progn Res 2022;6:24. doi:10.1186/s41512-022-00136-8
15 Riley RD, Ensor J, Snell KIE, et al. External validation of clinical prediction models using big datasets from e-health records or IPD meta-analysis: opportunities and challenges. BMJ 2016;353:i3140. doi:10.1136/bmj.i3140
16 Van Calster B, Steyerberg EW, Wynants L, van Smeden M. There is no such thing as a validated prediction model. BMC Med 2023;21:70. doi:10.1186/s12916-023-02779-w
17 Collins GS, Reitsma JB, Altman DG, Moons KGM. Transparent reporting of a multivariable prediction model for individual prognosis or diagnosis (TRIPOD): the TRIPOD statement. BMJ 2015;350:g7594. doi:10.1136/bmj.g7594
18 Moons KGM, Altman DG, Reitsma JB, et al. Transparent Reporting of a multivariable prediction model for Individual Prognosis or Diagnosis (TRIPOD): explanation and elaboration. Ann Intern Med 2015;162:W1-73. doi:10.7326/M14-0698
19 Toll DB, Janssen KJ, Vergouwe Y, Moons KG. Validation, updating and impact of clinical prediction rules: a review. J Clin Epidemiol 2008;61:1085-94. doi:10.1016/j.jclinepi.2008.04.008
20 Riley RD, Ensor J, Snell KIE, et al. Calculating the sample size required for developing a clinical prediction model. BMJ 2020;368:m441. doi:10.1136/bmj.m441
21 Riley RD, Snell KI, Ensor J, et al. Minimum sample size for developing a multivariable prediction model: PART II – binary and time-to-event outcomes. Stat Med 2019;38:1276-96. doi:10.1002/sim. 7992
22 Shakur H, Roberts I, Bautista R, et al, CRASH-2 trial collaborators. Effects of tranexamic acid on death, vascular occlusive events, and blood transfusion in trauma patients with significant haemorrhage (CRASH-2): a randomised, placebo-controlled trial. Lancet 2010;376:23-32. doi:10.1016/S0140-6736(10)60835-5
23 Steyerberg EW. Validation in prediction research: the waste by data splitting. / Clin Epidemiol 2018;103:131-3. doi:10.1016/j. jclinepi.2018.07.010
24 Riley RD, Snell KIE, Ensor J, et al. Minimum sample size for developing a multivariable prediction model: Part I – Continuous outcomes. Stat Med 2019;38:1262-75. doi:10.1002/sim. 7993
25 van Smeden M, de Groot JA, Moons KG, et al. No rationale for 1 variable per 10 events criterion for binary logistic regression analysis. BMC Med Res Methodol 2016;16:163. doi:10.1186/s12874-016-0267-3
26 van Smeden M, Moons KG, de Groot JA, et al. Sample size for binary logistic prediction models: Beyond events per variable criteria. Stat Methods Med Res 2019;28:2455-74. doi:10.1177/0962280218784726
27 Riley RD, Collins GS, Ensor J, et al. Minimum sample size calculations for external validation of a clinical prediction model with a time-toevent outcome. Stat Med 2022;41:1280-95. doi:10.1002/sim. 9275
28 Snell KIE, Archer L, Ensor J, et al. External validation of clinical prediction models: simulation-based sample size calculations were more reliable than rules-of-thumb. J Clin Epidemiol 2021;135:79-89. doi:10.1016/j.jclinepi.2021.02.011
29 Archer L, Snell KIE, Ensor J, Hudda MT, Collins GS, Riley RD. Minimum sample size for external validation of a clinical prediction model with a continuous outcome. Stat Med 2021;40:133-46. doi:10.1002/ sim. 8766
30 Steyerberg EW, Harrell FEJr, Borsboom GJJM, Eijkemans MJC, Vergouwe Y, Habbema JDF. Internal validation of predictive models: efficiency of some procedures for logistic regression analysis. J Clin Epidemiol 2001;54:774-81. doi:10.1016/S0895-4356(01)003419
31 Riley RD, Collins GS. Stability of clinical prediction models developed using statistical or machine learning methods [Internet]. arXiv; 2022 [cited 2023 Jan 4]. Available from: https://arxiv.org/ abs/2211.01061
32 Harrell FEJr, Lee KL, Mark DB. Multivariable prognostic models: issues in developing models, evaluating assumptions and adequacy, and measuring and reducing errors. Stat Med 1996;15:361-87. doi:10.1002/(SICI)1097-0258(19960229)15:4<361::AID-SIM168>3.0.CO;2-4
33 Martin GP, Riley RD, Collins GS, Sperrin M. Developing clinical prediction models when adhering to minimum sample
BMJ: first published as 10.1136/bmj-2023-074819 on 8 January 2024. Downloaded from https://www.bmj.com/ on 28 August 2025 by guest. Protected by copyright, including for uses related to text and data mining, Al training, and similar technologies.
size recommendations: The importance of quantifying bootstrap variability in tuning parameters and predictive performance. Stat Methods Med Res 2021;30:2545-61. doi:10.1177/09622802211046388
34 Steyerberg EW, Bleeker SE, Moll HA, Grobbee DE, Moons KGM. Internal and external validation of predictive models: a simulation study of bias and precision in small samples. / Clin Epidemiol 2003;56:441-7. doi:10.1016/S0895-4356(03)00047-7
35 Steyerberg EW. Clinical prediction models: a practical approach to development, validation, and updating. 2nd ed. Springer, 2019. doi:10.1007/978-3-030-16399-0.
36 Harrell FEJr. Regression modeling strategies: with applications to linear models, logistic and ordinal regression, and survival analysis. 2nd ed. Springer, 2015. doi:10.1007/978-3-319-194257.
37 Austin PC, van Klaveren D, Vergouwe Y, Nieboer D, Lee DS, Steyerberg EW. Geographic and temporal validity of prediction models: different approaches were useful to examine model performance. / Clin Epidemiol 2016;79:76-85. doi:10.1016/j.jclinepi.2016.05.007
38 Hickey GL, Grant SW, Murphy GJ, et al. Dynamic trends in cardiac surgery: why the logistic EuroSCORE is no longer suitable for contemporary cardiac surgery and implications for future risk models. Eur J Cardiothorac Surg 2013;43:1146-52. doi:10.1093/ejcts/ ezs584
39 Jenkins DA. Continual updating and monitoring of clinical prediction models: time for dynamic prediction systems? 2021;7.
40 Booth S, Riley RD, Ensor J, Lambert PC, Rutherford MJ. Temporal recalibration for improving prognostic model development and risk predictions in settings where survival is improving over time. Int/ Epidemiol 2020;49:1316-25. doi:10.1093/ije/dyaa030
41 Hippisley-Cox J, Coupland C, Vinogradova Y, et al. Predicting cardiovascular risk in England and Wales: prospective derivation and validation of QRISK2. BMJ 2008;336:1475-82. doi:10.1136/ bmj.39609.449676.25
42 Riley R, Tierney J, Stewart L, eds. Individual participant data meta-analysis: a handbook for healthcare research. Wiley, 2021. doi:10.1002/9781119333784.
43 Steyerberg EW, Harrell FEJr. Prediction models need appropriate internal, internal-external, and external validation. J Clin Epidemiol 2016;69:245-7. doi:10.1016/j.jclinepi.2015.04.005
44 Royston P, Parmar MKB, Sylvester R. Construction and validation of a prognostic model across several studies, with an application in superficial bladder cancer. Stat Med 2004;23:907-26. doi:10.1002/ sim. 1691
45 Takada T, Nijman S, Denaxas S, et al. Internal-external crossvalidation helped to evaluate the generalizability of prediction models in large clustered datasets. / Clin Epidemiol 2021;137:8391. doi:10.1016/j.jclinepi.2021.03.025
46 Debray TP, Moons KG, Ahmed I, Koffijberg H, Riley RD. A framework for developing, implementing, and evaluating clinical prediction models in an individual participant data meta-analysis. Stat Med 2013;32:3158-80. doi:10.1002/sim. 5732
47 Debray TPA, Collins GS, Riley RD, et al. Transparent reporting of multivariable prediction models developed or validated using clustered data: TRIPOD-Cluster checklist. BMJ 2023;380:e071018. doi:10.1136/bmj-2022-071018
48 Debray TPA, Collins GS, Riley RD, et al. Transparent reporting of multivariable prediction models developed or validated using clustered data (TRIPOD-Cluster): explanation and elaboration. BMJ 2023;380:e071058. doi:10.1136/bmj-2022-071058
49 Futoma J, Simons M, Panch T, Doshi-Velez F, Celi LA. The myth of generalisability in clinical research and machine learning in health care. Lancet Digit Health 2020;2:e489-92. doi:10.1016/S2589-7500(20)30186-2
50 Collins GS, Altman DG. Predicting the 10 year risk of cardiovascular disease in the United Kingdom: independent and external validation of an updated version of QRISK2. BMJ 2012;344:e4181. doi:10.1136/bmj.e4181
51 Nevin L, PLOS Medicine Editors. Advancing the beneficial use of machine learning in health care and medicine: Toward a community understanding. PLoS Med 2018;15:e1002708. doi:10.1371/ journal.pmed. 1002708
52 Collins GS, de Groot JA, Dutton S, et al. External validation of multivariable prediction models: a systematic review of methodological conduct and reporting. BMC Med Res Methodol 2014;14:40. doi:10.1186/1471-2288-14-40
53 Moons KGM, Altman DG, Vergouwe Y, Royston P. Prognosis and prognostic research: application and impact of prognostic models in clinical practice. BMJ 2009;338:b606. doi:10.1136/bmj.b606
54 Debray TPA, Vergouwe Y, Koffijberg H, Nieboer D, Steyerberg EW, Moons KGM. A new framework to enhance the interpretation of external validation studies of clinical prediction models. J Clin Epidemiol 2015;68:279-89. doi:10.1016/j.jclinepi.2014.06.018
55 Cabitza F, Campagner A, Soares F, et al. The importance of being external. methodological insights for the external validation of machine learning models in medicine. Comput Methods Programs Biomed 2021;208:106288. doi:10.1016/j.cmpb.2021.106288
56 Altman DG, Vergouwe Y, Royston P, Moons KGM. Prognosis and prognostic research: validating a prognostic model. BMJ 2009;338:b605. doi:10.1136/bmj.b605
57 Davis SE, Lasko TA, Chen G, Siew ED, Matheny ME. Calibration drift in regression and machine learning models for acute kidney injury. J Am Med Inform Assoc 2017;24:1052-61. doi:10.1093/jamia/ocx030
58 Wessler BS, Nelson J, Park JG, et al. External Validations of Cardiovascular Clinical Prediction Models: A Large-Scale Review of the Literature. Circ Cardiovasc Qual Outcomes 2021;14:e007858. doi:10.1161/CIRCOUTCOMES.121.007858
59 Van Calster B, Wynants L, Timmerman D, Steyerberg EW, Collins GS. Predictive analytics in health care: how can we know it works?/ Am Med Inform Assoc 2019;26:1651-4. doi:10.1093/jamia/ocz130
60 Park Y, Hu J, Singh M, et al. Comparison of Methods to Reduce Bias From Clinical Prediction Models of Postpartum Depression. JAMA Netw Open 2021;4:e213909. doi:10.1001/ jamanetworkopen.2021.3909
61 Ganapathi S, Palmer J, Alderman JE, et al. Tackling bias in Al health datasets through the STANDING Together initiative. Nat Med 2022;28:2232-3. doi:10.1038/s41591-022-01987-w
62 Vyas DA, Eisenstein LG, Jones DS. Hidden in Plain Sight Reconsidering the Use of Race Correction in Clinical Algorithms. N Engl J Med 2020;383:874-82. doi:10.1056/NEJMms2004740
63 Johnson-Mann CN, Loftus TJ, Bihorac A. Equity and Artificial Intelligence in Surgical Care. JAMA Surg 2021;156:509-10. doi:10.1001/jamasurg.2020.7208
64 Paulus JK, Kent DM. Predictably unequal: understanding and addressing concerns that algorithmic clinical prediction may increase health disparities. NPJ Digit Med 2020;3:99. doi:10.1038/s41746-020-0304-9
Web appendix: Supplementary material

  1. SUMMARY POINTS
    Clinical prediction models use a combination of variables to estimate outcome risk for individuals
    Evaluating the performance of a prediction model is critically important and validation studies are essential, as a poorly developed model could be harmful or exacerbate disparities in either provision of health care or subsequent healthcare outcomes
    Evaluating model performance should be carried out in datasets that are representative of the intended target populations for the model’s implementation
    A model’s predictive performance will often appear to be excellent in the development dataset but be much lower when evaluated in a separate dataset, even from the same population
    Splitting data at the moment of model development should generally be avoided as it discards data leading to a more unreliable model, whilst leaving too few data to reliably evaluate its performance
    Concerted efforts should be made to exploit all available data to build the best possible model, with better use of resampling methods for internal validation, and internal-external validation to evaluate model performance and generalisability across clusters