DOI: https://doi.org/10.1038/s41598-024-61106-2
PMID: https://pubmed.ncbi.nlm.nih.gov/38704434
تاريخ النشر: 2024-05-04
تنبؤ سوق الأسهم المعتمد على التعلم العميق مع دمج مشاعر ESG والمؤشرات الفنية
الملخص
هاين لي
تمثل الاستدامة اتجاهًا عالميًا حاسمًا في تشكيل تقدم المؤسسات الحديثة. نظرًا للتركيز المتزايد على الممارسات المستدامة، أصبح دمج مؤشرات البيئة والمجتمع والحوكمة (ESG) لتقييم أداء الشركة أمرًا لا غنى عنه.
الأعمال ذات الصلة
البحث السابق في توقع أسعار الأسهم مع الأخذ في الاعتبار تحليل مشاعر نص الأخبار
استكشاف تأثير معايير البيئة والمجتمع والحوكمة على أداء الأسهم
استغلال المؤشرات الفنية في توقع أسعار الأصول
| مؤشر | وصف |
| المتوسط المتحرك البسيط (SMA) | يوفر تأثيرًا ملسًا على بيانات الأسعار على مدى فترة زمنية محددة |
| المتوسط المتحرك الأسي (EMA) | يوفر منظورًا أكثر سلاسة لاتجاهات الأسعار، مع التركيز على البيانات الحديثة |
| خط تجميع/توزيع تشايكن (AD) | يقيس الضغط التراكمي للشراء والبيع للتنبؤ باتجاهات الأسعار |
| مؤشر الحركة الاتجاهية المتوسطة (ADX) | مؤشر الحركة الاتجاهية المتوسطة |
| المتوسط المتحرك التكيفي لكوفمان (KAMA) | يتكيف مع ظروف السوق المتغيرة، مما يساعد في تحديد نقاط الدخول والخروج المثلى |
| مؤشر تقارب/تباعد المتوسط المتحرك (MACD) | تقارب وتباعد المتوسطات المتحركة |
| مؤشر القوة النسبية (RSI) | يقيم حالات الشراء المفرط أو البيع المفرط للأصل، موجهًا نحو الانعكاسات المحتملة |
| التوقف العكسي البارابولي (PSAR) | يقدم مستويات وقف خسارة ديناميكية، وهي ضرورية لإدارة المخاطر |
| الزخم (MOM) | قياس معدل التغير |
| معدل التغير (ROC) | قم بقياس نسبة التغير في السعر من فترة سابقة إلى الفترة الحالية |
| إشارة | توفير تنعيم بصري جزئي للمؤشرات الفنية واكتشاف انعكاسات الاتجاه والتقاطعات |
| مؤشر القوة النسبية العشوائي | دمج مؤشر القوة النسبية ومؤشر الاستوكاستك |
| المؤشر العشوائي | الموقع النسبي للأسعار على مدى فترة معينة |
طريقة
جمع البيانات
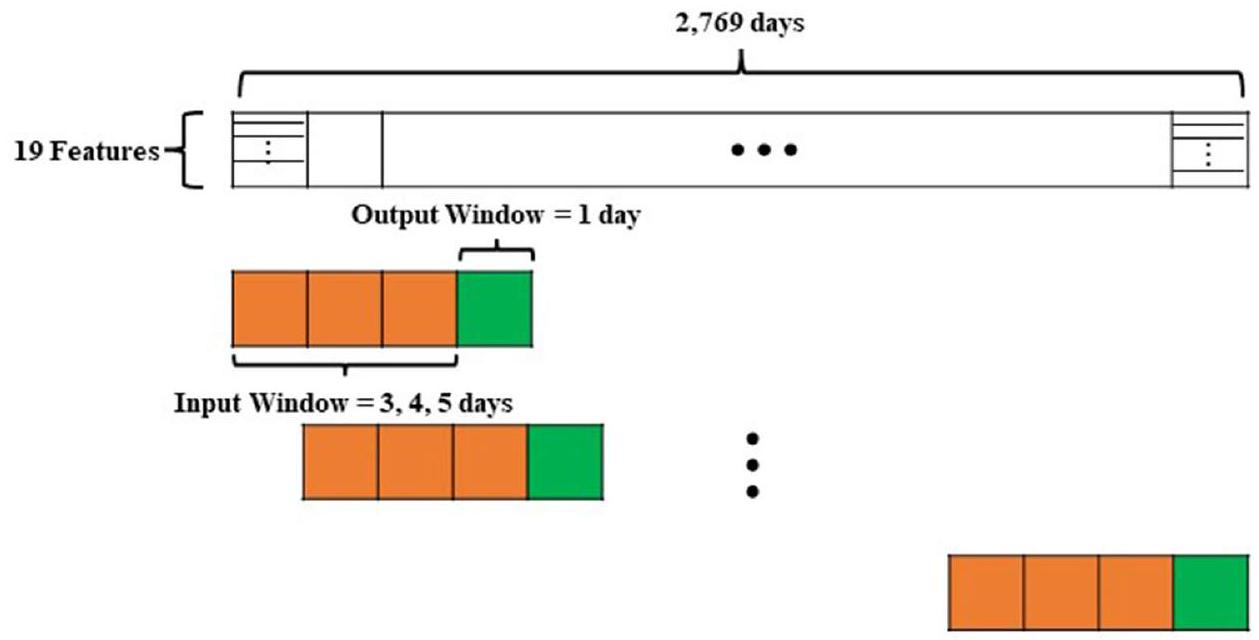
هندسة الميزات
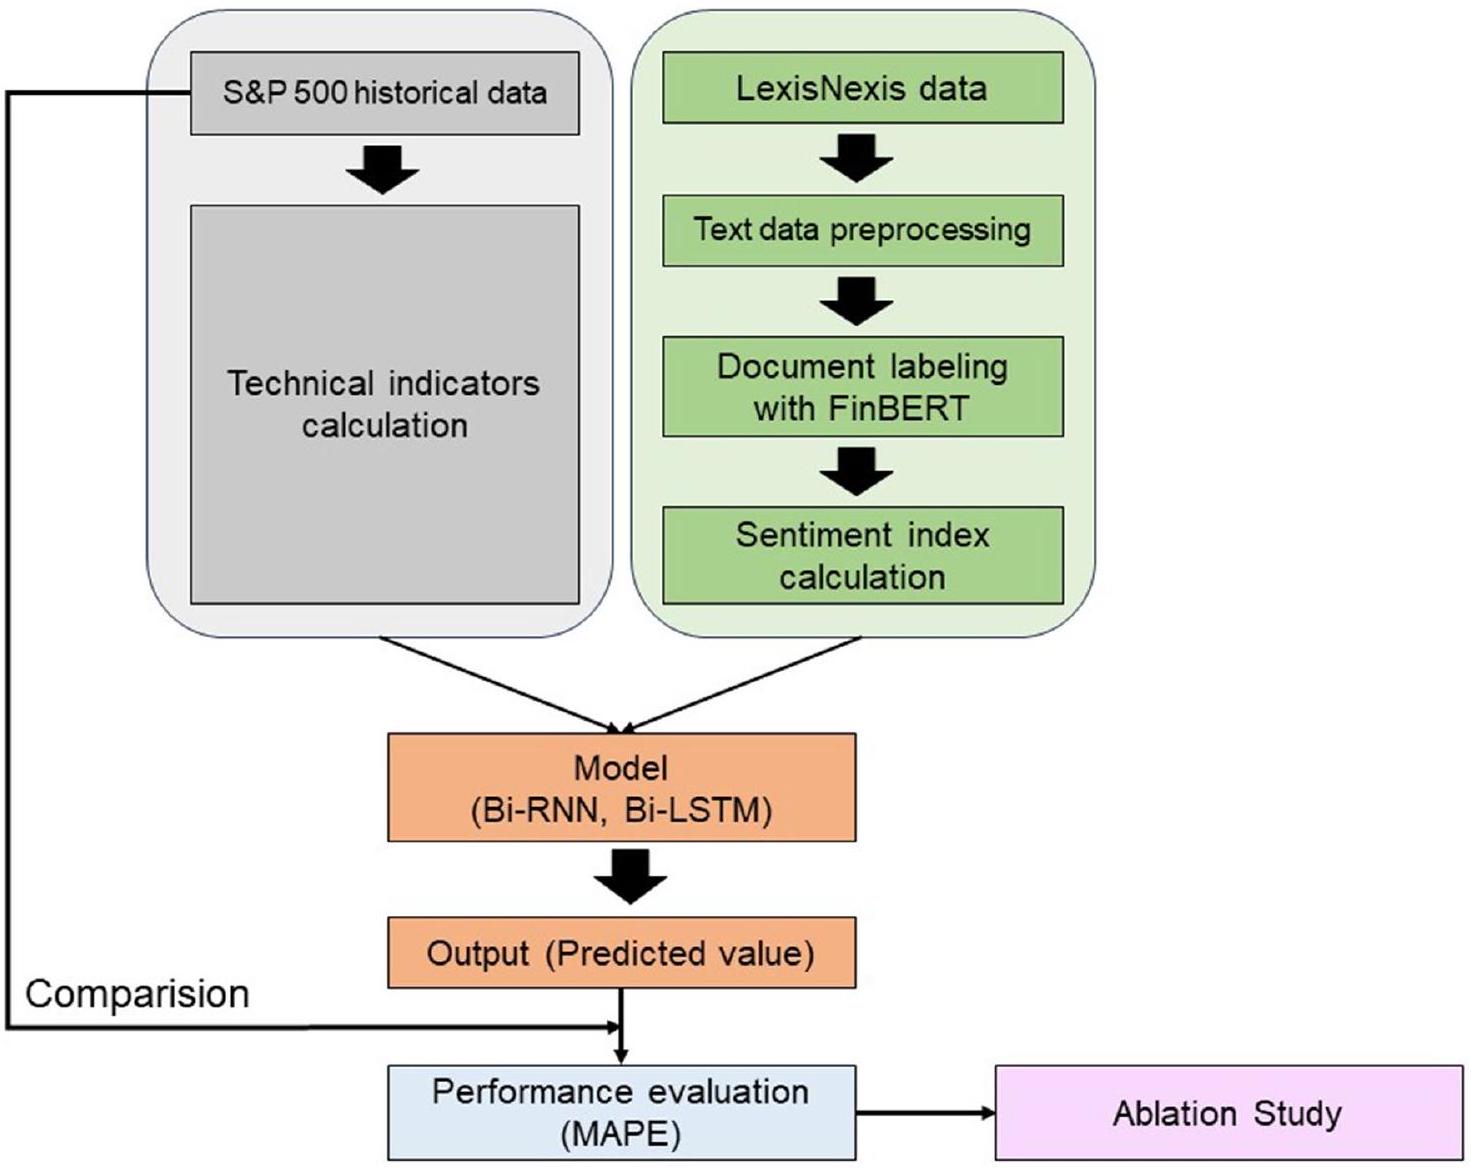
حساب مؤشر المشاعر باستخدام تمثيلات الترميز ثنائية الاتجاه المالية من المحولات (FinBERT)
حجم النافذة
نماذج التعلم العميق
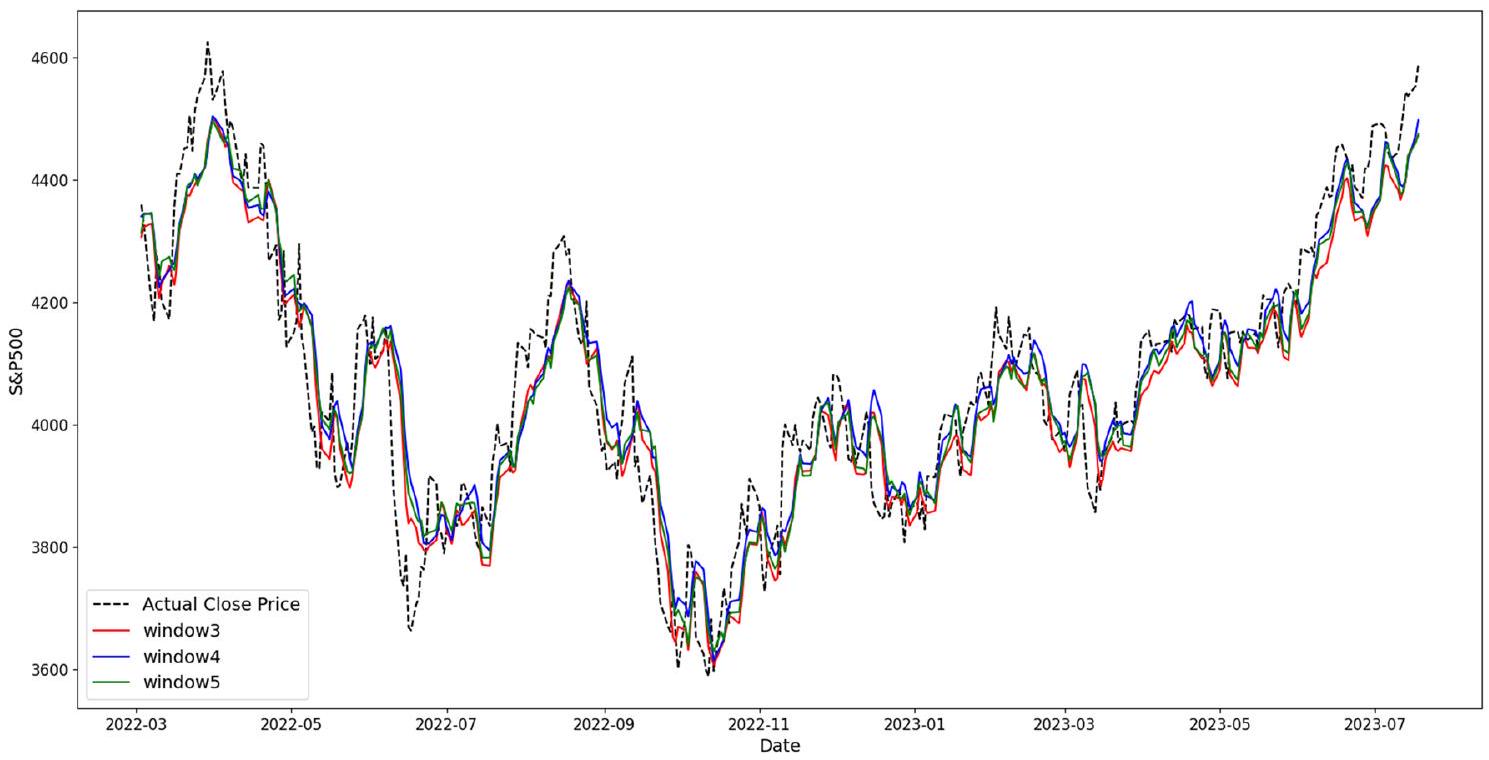
النتائج
| حجم النافذة | النموذج | |
| Bi-RNN | Bi-LSTM | |
| 3 | 4.65 | 3.05 |
| 4 | 6.85 | 3.2 |
| 5 | 5.07 | 3.55 |
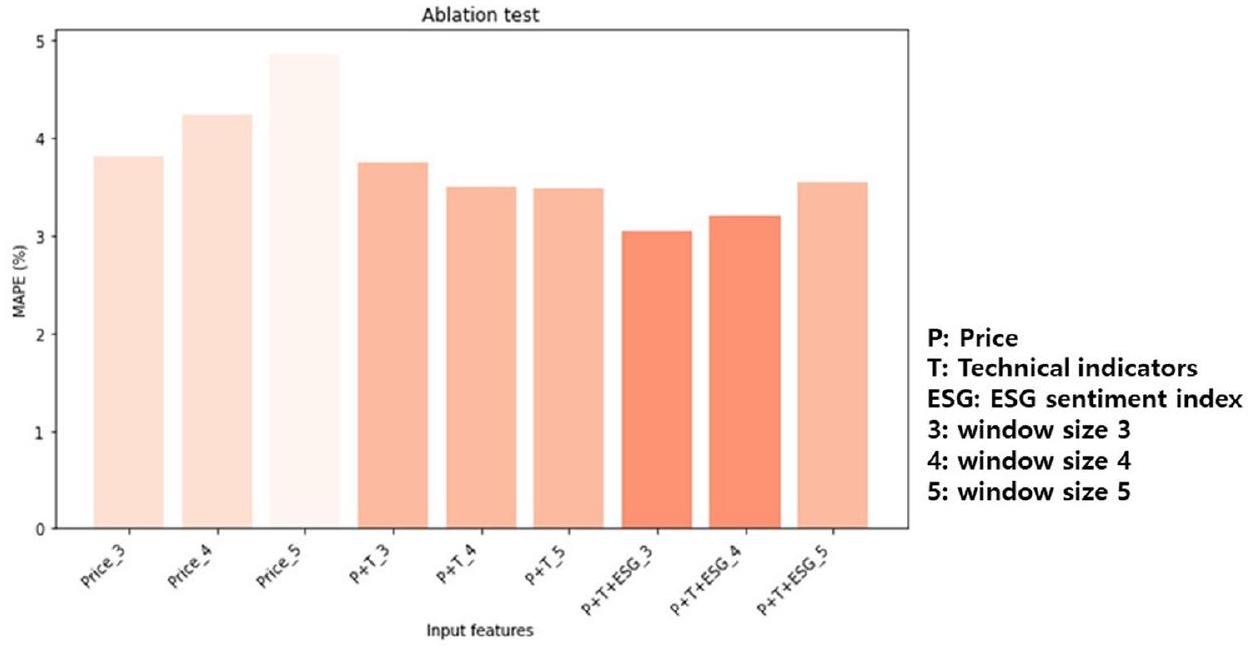
المناقشة
| ميزات المدخلات | Bi-LSTM |
| سعر فقط (حجم النافذة
|
3.81 |
| سعر فقط (حجم النافذة
|
4.24 |
| سعر فقط (حجم النافذة
|
4.87 |
| سعر ومؤشرات فنية (حجم النافذة
|
3.75 |
| سعر ومؤشرات فنية (حجم النافذة
|
3.51 |
| سعر ومؤشرات فنية (حجم النافذة
|
3.48 |
| سعر ومؤشرات فنية ومؤشر مشاعر ESG (حجم النافذة
|
3.05 |
| سعر ومؤشرات فنية ومؤشر مشاعر ESG (حجم النافذة
|
3.2 |
| سعر ومؤشرات فنية ومؤشر مشاعر ESG (حجم النافذة
|
3.55 |
قيود الدراسة
توفر البيانات
تم النشر عبر الإنترنت: 04 مايو 2024
References
- Egorova, A. A., Grishunin, S. V. & Karminsky, A. M. The impact of ESG factors on the performance of information technology companies. Procedia Comput. Sci. 199, 339-345 (2022).
- Lee, H., Lee, S. H., Lee, K. R. & Kim, J. H. ESG discourse analysis through BERTopic: Comparing news articles and academic papers. Comput., Mater. Continua 75(3), 6023-6037 (2023).
- Lee, H., Lee, S. H., Park, H., Kim, J. H. & Jung, H. S. ESG2PreEM: Automated ESG grade assessment framework using pre-trained ensemble models. Heliyon 10(4), e26404 (2024).
- Aybars, A., Ataünal, L., & Gürbüz, A. O. ESG and financial performance: impact of environmental, social, and governance issues on corporate performance. In Handbook of Research on Managerial Thinking in Global Business Economics, 520-536 (IGI Global, 2019).
- In, S. Y., Rook, D. & Monk, A. Integrating alternative data (also known as ESG data) in investment decision making. Glob. Econ. Rev. 48(3), 237-260 (2019).
- Alareeni, B. A. & Hamdan, A. ESG impact on performance of US S&P 500-listed firms. Corp. Gov.: Int. J. Bus. Soc. 20(7), 1409-1428 (2020).
- Huang, R. D. & Kracaw, W. A. Stock market returns and real activity: a note. J. Financ. 39(1), 267-273 (1984).
- Fama, E. F. Stock returns, real activity, inflation, and money. Am. Econ. Rev. 71(4), 545-565 (1981).
- Scatigna, M., Xia, F. D., Zabai, A., & Zulaica, O. Achievements and challenges in ESG markets. BIS Quarterly Review, December (2021).
- Kiesel, F. & Lücke, F. ESG in credit ratings and the impact on financial markets. Financ. Mark. Inst. Instrum. 28(3), 263-290 (2019).
- Peng, Y., Albuquerque, P. H. M., Kimura, H. & Saavedra, C. A. P. B. Feature selection and deep neural networks for stock price direction forecasting using technical analysis indicators. Mach. Learn. Appl. 5, 100060 (2021).
- Shynkevich, Y., McGinnity, T. M., Coleman, S. A., Belatreche, A. & Li, Y. Forecasting price movements using technical indicators: Investigating the impact of varying input window length. Neurocomputing 264, 71-88 (2017).
- Zubair, S., & Cios, K. J. Extracting news sentiment and establishing its relationship with the s&p 500 index. In 2015 48th Hawaii International Conference on System Sciences, 969-975 (IEEE, 2015).
- Khedr, A. E. & Yaseen, N. Predicting stock market behavior using data mining technique and news sentiment analysis. Int. J. Intell. Syst. Appl. 9(7), 22 (2017).
- Li, Y., & Pan, Y. A novel ensemble deep learning model for stock prediction based on stock prices and news. Int. J. Data Sci. Anal., 1-11 (2022).
- Bauer, R., Guenster, N. & Otten, R. Empirical evidence on corporate governance in Europe: The effect on stock returns, firm value and performance. J. Asset Manag. 5, 91-104 (2004).
- Chen, R. C., Hung, S. W. & Lee, C. H. Does corporate value affect the relationship between corporate social responsibility and stock returns?. J. Sustain. Finance Invest. 7(2), 188-196 (2017).
- Minutolo, M. C., Kristjanpoller, W. D. & Stakeley, J. Exploring environmental, social, and governance disclosure effects on the S&P 500 financial performance. Bus. Strateg. Environ. 28(6), 1083-1095 (2019).
- Gillan, S. L., Koch, A. & Starks, L. T. Firms and social responsibility: A review of ESG and CSR research in corporate finance. J. Corp. Finan. 66, 101889 (2021).
- Zheng, Y., Wang, B., Sun, X. & Li, X. ESG performance and corporate value: Analysis from the stakeholders’ perspective. Front. Environ. Sci. 10, 1084632 (2022).
- Stellner, C., Klein, C. & Zwergel, B. Corporate social responsibility and Eurozone corporate bonds: The moderating role of country sustainability. J. Bank. Finance 59, 538-549 (2015).
- Xu, Y., & Keselj, V. Stock prediction using deep learning and sentiment analysis. In 2019 IEEE international conference on big data (big data), 5573-5580 (IEEE, 2019).
- Hoseinzade, E. & Haratizadeh, S. CNNpred: CNN-based stock market prediction using a diverse set of variables. Expert Syst. Appl. 129, 273-285 (2019).
- Assis, C. A., Pereira, A. C., Carrano, E. G., Ramos, R., & Dias, W. Restricted Boltzmann machines for the prediction of trends in financial time series. In 2018 International Joint Conference on Neural Networks (IJCNN), 1-8 (IEEE, 2018).
- Jung, H. S., Lee, S. H., Lee, H. & Kim, J. H. Predicting bitcoin trends through machine learning using sentiment analysis with technical indicators. Comput. Syst. Sci. Eng. 46(2), 2231-2246 (2023).
- Ademi, B. & Klungseth, N. J. Does it pay to deliver superior ESG performance? Evidence from US S&P 500 companies. J. Glob. Responsib. 13(4), 421-449 (2022).
- Chu, Q. C., Hsieh, W. L. G. & Tse, Y. Price discovery on the S&P 500 index markets: An analysis of spot index, index futures, and SPDRs. Int. Rev. Financ. Anal. 8(1), 21-34 (1999).
- Pieterse, B. Comparing the returns of technical analysis strategies with market index returns (Master’s thesis, University of Pretoria (South Africa)) (2021).
- Hajimiri, H. Use of genetic algorithm in algorithmic trading to optimize technical analysis in the international stock market (Forex). J. Cyberspace Stud. 6(1), 21-29 (2022).
- Rosillo, R., De la Fuente, D. & Brugos, J. A. L. Technical analysis and the Spanish stock exchange: testing the RSI, MACD, momentum and stochastic rules using Spanish market companies. Appl. Econ. 45(12), 1541-1550 (2013).
- Yazdi, S. H. M. & Lashkari, Z. H. Technical analysis of Forex by MACD Indicator. Int. J. Human. Manag. Sci. (IJHMS) 1(2), 159-165 (2013).
- Vaiz, J. S. & Ramaswami, M. A study on technical indicators in stock price movement prediction using decision tree algorithms. Am. J. Eng. Res. (AJER) 5(12), 207-212 (2016).
- Zhai, Y., Hsu, A., & Halgamuge, S. K. Combining news and technical indicators in daily stock price trends prediction. In Advances in Neural Networks-ISNN 2007: 4th International Symposium on Neural Networks, 1087-1096 (Springer, 2007).
- Huang, J. Z., Huang, W. & Ni, J. Predicting bitcoin returns using high-dimensional technical indicators. J. Finance Data Sci. 5(3), 140-155 (2019).
- Araci, D. Finbert: Financial sentiment analysis with pre-trained language models. Preprint at https://doi.org/10.48550/arXiv.1908. 10063 (2019).
- Wu, S., Liu, Y., Zou, Z. & Weng, T. H. S_I_LSTM: stock price prediction based on multiple data sources and sentiment analysis. Connect. Sci. 34(1), 44-62 (2022).
- Rajabi, S., Roozkhosh, P. & Farimani, N. M. MLP-based Learnable Window Size for Bitcoin price prediction. Appl. Soft Comput. 129, 109584 (2022).
- Das, G., Lin, K. I., Mannila, H., Renganathan, G., & Smyth, P. Rule Discovery from time series. In KDD, 16-22 (1998).
- Schuster, M. & Paliwal, K. K. Bidirectional recurrent neural networks. IEEE Trans. Signal Process. 45(11), 2673-2681 (1997).
- Lee, H., Jung, H. S., Lee, S. H. & Kim, J. H. Robust sentiment classification of metaverse services using a pre-trained language model with soft voting. KSII Trans. Internet Inf. Syst. 17(9), 2334-2347 (2023).
- Hochreiter, S. & Schmidhuber, J. Long short-term memory. Neural Comput. 9(8), 1735-1780 (1997).
- De Myttenaere, A., Golden, B., Le Grand, B. & Rossi, F. Mean absolute percentage error for regression models. Neurocomputing 192, 38-48 (2016).
- Huang, S., Wang, D., Wu, X., & Tang, A. Dsanet: Dual self-attention network for multivariate time series forecasting. In Proceedings of the 28th ACM international conference on information and knowledge management, 2129-2132 (ACM, 2019).
الشكر والتقدير
مساهمات المؤلفين
المصالح المتنافسة
معلومات إضافية
معلومات إعادة الطبع والتصاريح متاحة على www.nature.com/reprints.
ملاحظة الناشر تظل Springer Nature محايدة فيما يتعلق بالمطالبات القضائية في الخرائط المنشورة والانتماءات المؤسسية.
© المؤلفون 2024
قسم الذكاء الاصطناعي التطبيقي / قسم تفاعل الإنسان والذكاء الاصطناعي، جامعة سونغكيوكوان، سيول 03063، جمهورية كوريا. قسم علوم التفاعل / قسم تفاعل الإنسان والذكاء الاصطناعي، جامعة سونغكيوكوان، سيول 03063، جمهورية كوريا. قسم الذكاء الاصطناعي التطبيقي، جامعة سونغكيوكوان، سيول 03063، جمهورية كوريا. البريد الإلكتروني: jestiriel@g.skku.edu
DOI: https://doi.org/10.1038/s41598-024-61106-2
PMID: https://pubmed.ncbi.nlm.nih.gov/38704434
Publication Date: 2024-05-04
Deep-learning-based stock market prediction incorporating ESG sentiment and technical indicators
Abstract
Haein Lee
Sustainability represents a crucial global trend in shaping the progress of modern enterprises. Given the increasing emphasis on sustainable practices, integrating environmental, social, and governance (ESG) indicators to assess a company’s performance has become indispensable
Related works
Previous research on stock price prediction considering news text sentiment analysis
Exploring the influence of ESG on the stock performance
Leveraging technical indicators in asset price prediction
| Indicator | Description |
| Simple Moving Average (SMA) | Provides a smoothing effect on price data over a designated time frame |
| Exponential Moving Average (EMA) | Provides a smoother perspective of price trends, emphasizing recent data |
| Chaikin Accumulation/Distribution Line (AD) | Measures cumulative buying and selling pressure for predicting price trends |
| Average Directional Movement Index (ADX) | Mean directional movement indicator |
| Kaufman Adaptive Moving Average (KAMA) | Adapts to changing market conditions, aiding in identifying optimal entry and exit points |
| Moving Average Convergence/Divergence (MACD) | Convergence and divergence of moving averages |
| Relative Strength Index (RSI) | Evaluates asset’s overbought or oversold conditions, guiding potential reversals |
| Parabolic Stop and Reverse (PSAR) | Offers dynamic stop-loss levels, crucial for risk management |
| Momentum (MOM) | Measure the rate of change |
| Rate of Change (ROC) | Measure the percentage change in price from a previous period to the current period |
| Signal | Provide partial visual smoothing of technical indicators and detect trend reversals and crossovers |
| Stochastic RSI | Combination of the RSI and Stochastic indicator |
| Stochastic Oscillator | Relative position of prices over a given period |
Method
Data collection
Feature engineering
Sentiment index calculation using financial bidirectional encoder representations from transformers (FinBERT)
Window size
Deep learning models
Results
| Window size | Model | |
| Bi-RNN | Bi-LSTM | |
| 3 | 4.65 | 3.05 |
| 4 | 6.85 | 3.2 |
| 5 | 5.07 | 3.55 |
Discussion
| Input features | Bi-LSTM |
| Only Price (window size
|
3.81 |
| Only Price (window size
|
4.24 |
| Only Price (window size
|
4.87 |
| Price and technical indicators (window size
|
3.75 |
| Price and technical indicators (window size
|
3.51 |
| Price and technical indicators (window size
|
3.48 |
| Price, technical indicators, and ESG sentiment index (window size
|
3.05 |
| Price, technical indicators, and ESG sentiment index (window size
|
3.2 |
| Price, technical indicators, and ESG sentiment index (window size
|
3.55 |
Limitations of the study
Data availability
Published online: 04 May 2024
References
- Egorova, A. A., Grishunin, S. V. & Karminsky, A. M. The impact of ESG factors on the performance of information technology companies. Procedia Comput. Sci. 199, 339-345 (2022).
- Lee, H., Lee, S. H., Lee, K. R. & Kim, J. H. ESG discourse analysis through BERTopic: Comparing news articles and academic papers. Comput., Mater. Continua 75(3), 6023-6037 (2023).
- Lee, H., Lee, S. H., Park, H., Kim, J. H. & Jung, H. S. ESG2PreEM: Automated ESG grade assessment framework using pre-trained ensemble models. Heliyon 10(4), e26404 (2024).
- Aybars, A., Ataünal, L., & Gürbüz, A. O. ESG and financial performance: impact of environmental, social, and governance issues on corporate performance. In Handbook of Research on Managerial Thinking in Global Business Economics, 520-536 (IGI Global, 2019).
- In, S. Y., Rook, D. & Monk, A. Integrating alternative data (also known as ESG data) in investment decision making. Glob. Econ. Rev. 48(3), 237-260 (2019).
- Alareeni, B. A. & Hamdan, A. ESG impact on performance of US S&P 500-listed firms. Corp. Gov.: Int. J. Bus. Soc. 20(7), 1409-1428 (2020).
- Huang, R. D. & Kracaw, W. A. Stock market returns and real activity: a note. J. Financ. 39(1), 267-273 (1984).
- Fama, E. F. Stock returns, real activity, inflation, and money. Am. Econ. Rev. 71(4), 545-565 (1981).
- Scatigna, M., Xia, F. D., Zabai, A., & Zulaica, O. Achievements and challenges in ESG markets. BIS Quarterly Review, December (2021).
- Kiesel, F. & Lücke, F. ESG in credit ratings and the impact on financial markets. Financ. Mark. Inst. Instrum. 28(3), 263-290 (2019).
- Peng, Y., Albuquerque, P. H. M., Kimura, H. & Saavedra, C. A. P. B. Feature selection and deep neural networks for stock price direction forecasting using technical analysis indicators. Mach. Learn. Appl. 5, 100060 (2021).
- Shynkevich, Y., McGinnity, T. M., Coleman, S. A., Belatreche, A. & Li, Y. Forecasting price movements using technical indicators: Investigating the impact of varying input window length. Neurocomputing 264, 71-88 (2017).
- Zubair, S., & Cios, K. J. Extracting news sentiment and establishing its relationship with the s&p 500 index. In 2015 48th Hawaii International Conference on System Sciences, 969-975 (IEEE, 2015).
- Khedr, A. E. & Yaseen, N. Predicting stock market behavior using data mining technique and news sentiment analysis. Int. J. Intell. Syst. Appl. 9(7), 22 (2017).
- Li, Y., & Pan, Y. A novel ensemble deep learning model for stock prediction based on stock prices and news. Int. J. Data Sci. Anal., 1-11 (2022).
- Bauer, R., Guenster, N. & Otten, R. Empirical evidence on corporate governance in Europe: The effect on stock returns, firm value and performance. J. Asset Manag. 5, 91-104 (2004).
- Chen, R. C., Hung, S. W. & Lee, C. H. Does corporate value affect the relationship between corporate social responsibility and stock returns?. J. Sustain. Finance Invest. 7(2), 188-196 (2017).
- Minutolo, M. C., Kristjanpoller, W. D. & Stakeley, J. Exploring environmental, social, and governance disclosure effects on the S&P 500 financial performance. Bus. Strateg. Environ. 28(6), 1083-1095 (2019).
- Gillan, S. L., Koch, A. & Starks, L. T. Firms and social responsibility: A review of ESG and CSR research in corporate finance. J. Corp. Finan. 66, 101889 (2021).
- Zheng, Y., Wang, B., Sun, X. & Li, X. ESG performance and corporate value: Analysis from the stakeholders’ perspective. Front. Environ. Sci. 10, 1084632 (2022).
- Stellner, C., Klein, C. & Zwergel, B. Corporate social responsibility and Eurozone corporate bonds: The moderating role of country sustainability. J. Bank. Finance 59, 538-549 (2015).
- Xu, Y., & Keselj, V. Stock prediction using deep learning and sentiment analysis. In 2019 IEEE international conference on big data (big data), 5573-5580 (IEEE, 2019).
- Hoseinzade, E. & Haratizadeh, S. CNNpred: CNN-based stock market prediction using a diverse set of variables. Expert Syst. Appl. 129, 273-285 (2019).
- Assis, C. A., Pereira, A. C., Carrano, E. G., Ramos, R., & Dias, W. Restricted Boltzmann machines for the prediction of trends in financial time series. In 2018 International Joint Conference on Neural Networks (IJCNN), 1-8 (IEEE, 2018).
- Jung, H. S., Lee, S. H., Lee, H. & Kim, J. H. Predicting bitcoin trends through machine learning using sentiment analysis with technical indicators. Comput. Syst. Sci. Eng. 46(2), 2231-2246 (2023).
- Ademi, B. & Klungseth, N. J. Does it pay to deliver superior ESG performance? Evidence from US S&P 500 companies. J. Glob. Responsib. 13(4), 421-449 (2022).
- Chu, Q. C., Hsieh, W. L. G. & Tse, Y. Price discovery on the S&P 500 index markets: An analysis of spot index, index futures, and SPDRs. Int. Rev. Financ. Anal. 8(1), 21-34 (1999).
- Pieterse, B. Comparing the returns of technical analysis strategies with market index returns (Master’s thesis, University of Pretoria (South Africa)) (2021).
- Hajimiri, H. Use of genetic algorithm in algorithmic trading to optimize technical analysis in the international stock market (Forex). J. Cyberspace Stud. 6(1), 21-29 (2022).
- Rosillo, R., De la Fuente, D. & Brugos, J. A. L. Technical analysis and the Spanish stock exchange: testing the RSI, MACD, momentum and stochastic rules using Spanish market companies. Appl. Econ. 45(12), 1541-1550 (2013).
- Yazdi, S. H. M. & Lashkari, Z. H. Technical analysis of Forex by MACD Indicator. Int. J. Human. Manag. Sci. (IJHMS) 1(2), 159-165 (2013).
- Vaiz, J. S. & Ramaswami, M. A study on technical indicators in stock price movement prediction using decision tree algorithms. Am. J. Eng. Res. (AJER) 5(12), 207-212 (2016).
- Zhai, Y., Hsu, A., & Halgamuge, S. K. Combining news and technical indicators in daily stock price trends prediction. In Advances in Neural Networks-ISNN 2007: 4th International Symposium on Neural Networks, 1087-1096 (Springer, 2007).
- Huang, J. Z., Huang, W. & Ni, J. Predicting bitcoin returns using high-dimensional technical indicators. J. Finance Data Sci. 5(3), 140-155 (2019).
- Araci, D. Finbert: Financial sentiment analysis with pre-trained language models. Preprint at https://doi.org/10.48550/arXiv.1908. 10063 (2019).
- Wu, S., Liu, Y., Zou, Z. & Weng, T. H. S_I_LSTM: stock price prediction based on multiple data sources and sentiment analysis. Connect. Sci. 34(1), 44-62 (2022).
- Rajabi, S., Roozkhosh, P. & Farimani, N. M. MLP-based Learnable Window Size for Bitcoin price prediction. Appl. Soft Comput. 129, 109584 (2022).
- Das, G., Lin, K. I., Mannila, H., Renganathan, G., & Smyth, P. Rule Discovery from time series. In KDD, 16-22 (1998).
- Schuster, M. & Paliwal, K. K. Bidirectional recurrent neural networks. IEEE Trans. Signal Process. 45(11), 2673-2681 (1997).
- Lee, H., Jung, H. S., Lee, S. H. & Kim, J. H. Robust sentiment classification of metaverse services using a pre-trained language model with soft voting. KSII Trans. Internet Inf. Syst. 17(9), 2334-2347 (2023).
- Hochreiter, S. & Schmidhuber, J. Long short-term memory. Neural Comput. 9(8), 1735-1780 (1997).
- De Myttenaere, A., Golden, B., Le Grand, B. & Rossi, F. Mean absolute percentage error for regression models. Neurocomputing 192, 38-48 (2016).
- Huang, S., Wang, D., Wu, X., & Tang, A. Dsanet: Dual self-attention network for multivariate time series forecasting. In Proceedings of the 28th ACM international conference on information and knowledge management, 2129-2132 (ACM, 2019).
Acknowledgements
Author contributions
Competing interests
Additional information
Reprints and permissions information is available at www.nature.com/reprints.
Publisher’s note Springer Nature remains neutral with regard to jurisdictional claims in published maps and institutional affiliations.
© The Author(s) 2024
Department of Applied Artificial Intelligence/Department of Human-Artificial Intelligence Interaction, Sungkyunkwan University, Seoul 03063, Republic of Korea. Department of Interaction Science/Department of Human-Artificial Intelligence Interaction, Sungkyunkwan University, Seoul 03063, Republic of Korea. Department of Applied Artificial Intelligence, Sungkyunkwan University, Seoul 03063, Republic of Korea. email: jestiriel@g.skku.edu