توسع تكرار CAG الجسدي في الدم يرتبط بعلامات حيوية للتنكس العصبي في مرض هنتنغتون قبل عقود من التشخيص السريري الحركي Somatic CAG repeat expansion in blood associates with biomarkers of neurodegeneration in Huntington’s disease decades before clinical motor diagnosis
توسع تكرار CAG الجسدي في الدم يرتبط بعلامات حيوية للتنكس العصبي في مرض هنتنغتون قبل عقود من التشخيص السريري الحركي
تاريخ الاستلام: 2 أغسطس 2024 تم القبول: 15 نوفمبر 2024 نُشر على الإنترنت: 17 يناير 2025 تحقق من التحديثات
تظهر قائمة بالمؤلفين وانتماءاتهم في نهاية الورقة.
مرض هنتنغتون (HD) هو مرض عصبي تنكسي سائد وراثيًا، حيث يتأثر العمر الذي تظهر فيه الأعراض المميزة بشكل كبير بطول تسلسل CAG الموروث في جين HTT. يحدث توسع CAG الجسدي طوال الحياة، وفهم تأثير هذا التوسع الجسدي على التنكس العصبي هو المفتاح لتطوير أهداف علاجية. في 57 فردًا مصابًا بتوسع جين HD (HDGE)،سنوات قبل تشخيصهم السريري المتوقع للحركة، لم يُلاحظ أي تدهور ملحوظ في الوظيفة السريرية أو المعرفية أو النفسية العصبية على مدى 4.5 سنوات مقارنة بـ 46 ضابطًا (معدل الاكتشاف الخاطئ (FDR) > 0.3). ومع ذلك، أظهرت علامات السائل الدماغي الشوكي (CSF) علامات مبكرة جدًا على التنكس العصبي في HDGE مع ارتفاع مستوى بروتين الألياف العصبية الخفيفة (NfL)، وهو مؤشر على تلف المحاور العصبية (FDR )، وانخفاض بروإنكيفالين (PENK)، وهو علامة بديلة لحالة الخلايا العصبية الشوكية المتوسطة في النواة المذنبة (FDR )، مصحوبًا بانكماش الدماغ، بشكل رئيسي في الرأس المدبب (FDR ) وputamen (FDRزيادة طولية في نسبة توسع تكرار CAG الجسمي (SER) في الدم كانت مؤشراً مهماً على حدوث تغيرات لاحقة في الرأس المداري (FDRضمور الرأس المداري (FDR = 0.148) والذيل. كان هناك فقدان غير نمطي لهياكل تكرار HTT، المعروفة بتنبؤها بعمر مبكر عند التشخيص السريري الحركي، مرتبطًا بانخفاض كبير في حجم الرأس المداري والذيل. نقدم أدلة في البشر الأحياء على أن تأثير طول CAG على علم الأمراض العصبية في مرض هنتنغتون يتم بواسطة توسع تكرار CAG الجسدي. ستساعد هذه الرؤى الميكانيكية الحاسمة في التغيرات العصبية التنكسية المبكرة في تصميم التجارب السريرية الوقائية التي تهدف إلى تعديل التوسع الجسدي.ClinicalTrials.govالتسجيل: NCT06391619.
مرض هنتنغتون (HD) هو حالة مدمرة تتميز بفقدان الخلايا العصبية الشوكية المتوسطة في النواة المذنبة (MSNs) والتنكس العصبي في النواة المذنبة.مما يؤدي إلى ضعف الوظائف الحركية والمعرفية والنفسية العصبية، والتي تظهر عادة في منتصف العمر، مع تشخيص سريري يتم تحديده من خلال ظهور علامات حركية واضحة مرتبطة بمرض هنتنغتون. لا توجد حاليًا علاجات تعدل مسار المرض..
مرض هنتنغتون هو اضطراب سائد جسديًا ويحدث بسبب تكرار موسع لـ CAG.في جين هنتن (HTT) الذي يشفر لـ البولي غلوتامين في بروتين هنتين المتحور (mHTT)، والذي يُعتبر الكيان السام المفترض الذي يؤدي إلى خلل وظيفي في الخلايا العصبية والموت. من المعروف جيدًا أن طول تكرار CAG الموروث له تأثير قوي على العمر عند التشخيص السريري للحركة.من الجدير بالذكر أن تكرار HTT غير مستقر جسديًاوتمت ملاحظة توسع عشرات أو حتى مئات التكرارات في أكثر الخلايا العصبية الشريطية عرضة للخطر؛ يحدث توسع جسدي أكبر مع طول CAG الأولي الأطول. هناك أدلة تشير إلى أن معدلات التوسع الجسدي الخاصة بالأفراد بشكل أسرع في الدماغ هي
مرتبط بالتشخيص السريري الحركي المبكر وتقدم المرض بشكل أسرعيوحي بقوة أن التوسع الجسدي هو آلية رئيسية تفسر تأثير CAG على تقدم المرض. في الواقع، تم اقتراح أن التوسع الجسدي مطلوب لتوليد المرض، وأن مرض هنتنغتون يتضمن عتبتين كما يلي: أولاً، طول CAG الموروث الذي يؤدي إلى مزيد من التوسع الجسدي، وثانياً، العتبة المرضية داخل الخلوية التي يحدث فوقها خلل وظيفي وموت عصبي.يتماشى مع ذلك، تشير دراسة تشريح الجثة الأخيرة إلى أن الخلايا العصبية قد تواجه عقودًا من التوسع في تكرار CAG الجسدي ‘البيولوجي الهادئ’ مع حدوث ضرر عصبي يتم تحفيزه بواسطة سلسلة من أحداث عدم تنظيم النسخ المعتمدة على طول التكرار فقط عندما يصل تكرار CAG إلى عتبة.يكررفهم الديناميات المتعلقة بتوسع السومات بشكل مباشر في الدماغ يعوقه عدم توفر مواد خزعة الدماغ من المشاركين الشباب الأحياء. على الرغم من أن توسع CAG السوماتي يعتمد بوضوح على نوع الخلية.تُرتبط أيضًا معدلات التوسع الجسدي الفردية الأسرع في الحمض النووي الدموي بالتشخيص السريري الحركي المبكر.مقترحًا أن معدلات التوسع الجسدي المحددة فرديًا في الحمض النووي في الدم يمكن أن تكون على الأقل جزئيًا تنبؤية لمعدلات التوسع الجسدي المحددة فرديًا في الدماغ. تدعم هذه الفرضية دراسات المعدلات الجينية التي تكشف عن مجموعة من متغيرات جينات إصلاح الحمض النووي كعوامل معدلة لكل من توسع HTT الجسدي والظواهر السريرية لمرض هنتنغتون..
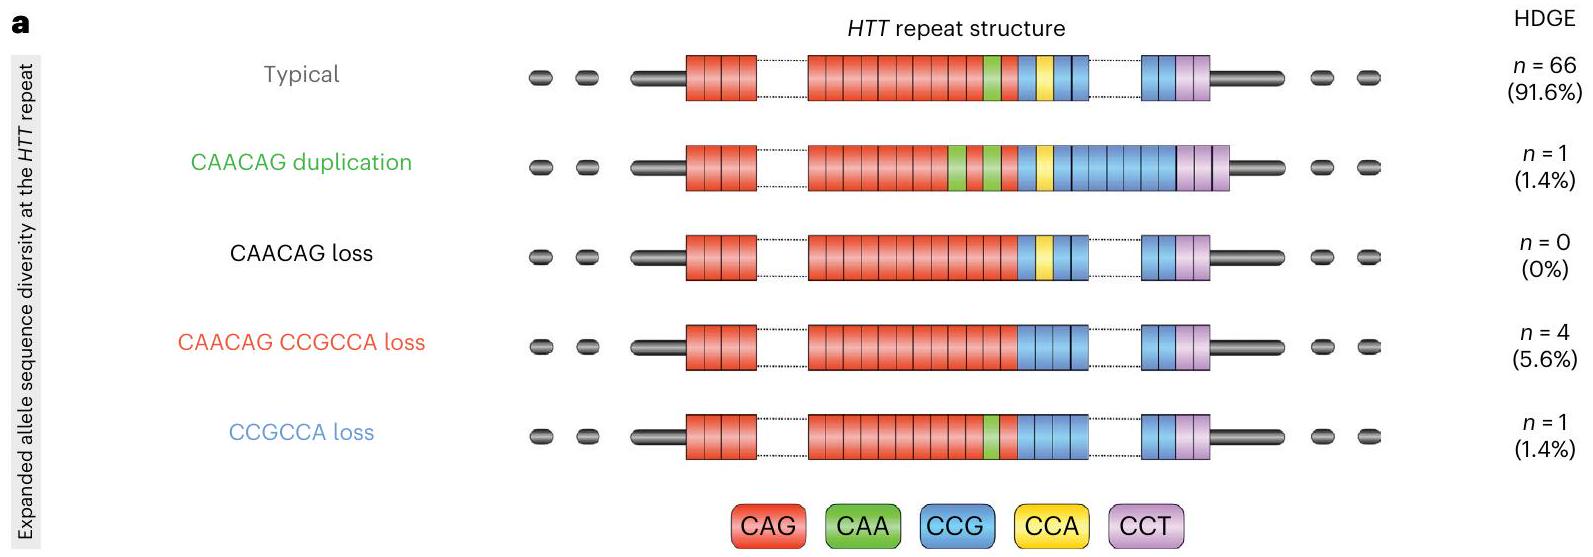
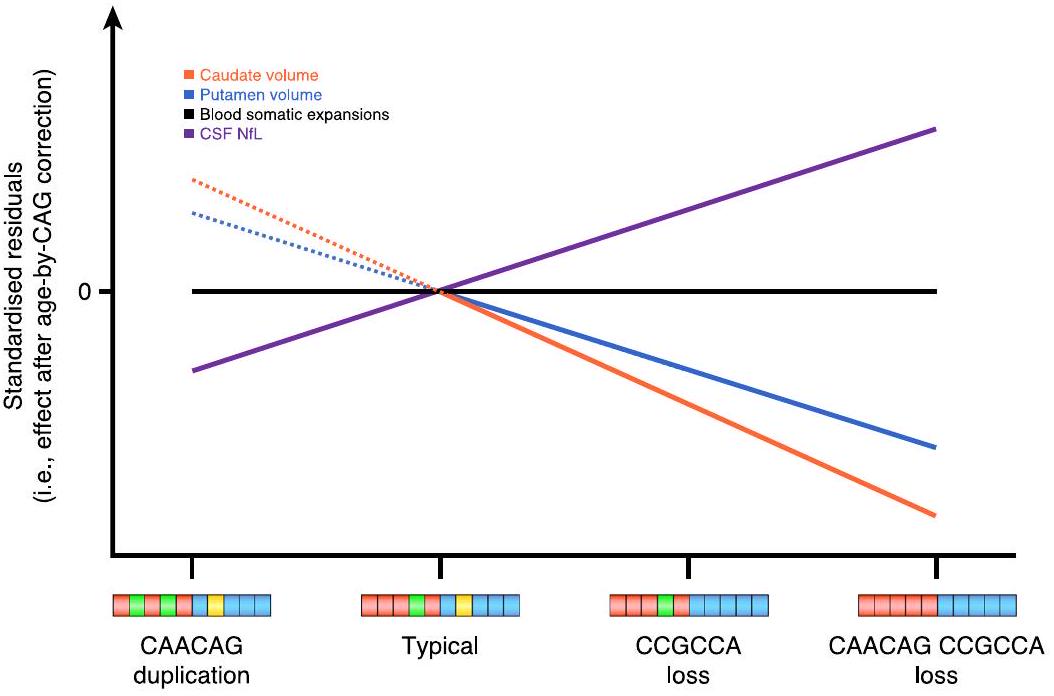
يتبع تسلسل تكرار CAG المشفر للبولي غلوتامين في HTT مباشرةً تكرار CCG المشفر للبولي بروتين. عادةً، يتكون التسلسل الفاصل بين تكرارات CAG وCCG من كاسيت CAACAG المشفر للغلوتامين وكاسيت CCGCCA المشفر للبروتين. ومع ذلك، تم تحديد عدد من الهياكل غير النمطية لتكرار HTT مع فقدان إما أو كليهما من كاسيتات CAACAG أو CCGCCA المرتبطة بسن مبكر للتشخيص السريري الحركي؛ وعلى العكس، فإن تكرار كاسيت CAACAG يؤخر هذه المرحلة.تكشف هذه البيانات أن كل من عمر مرض هنتنغتون عند التشخيص السريري الحركي وإمكانية التوسع الجسدي للتكرار يتم التنبؤ بهما بشكل أفضل من خلال طول تكرار CAG النقي، بدلاً من طول البولي غلوتامين المشفر، مما يوفر دعماً إضافياً لدور رئيسي للتوسع الجسدي في دفع بداية المرض..
الطبيعة الأحادية الجينات لمرض هنتنغتون ووجود اختبارات تشخيصية وتنبؤية لأفراد العائلة المعرضين للخطر تجعل منه مرضًا قابلًا للعلاج، وقد تم إحراز تقدم كبير نحو تطوير علاجات لتعديل المرض.المرحلة الأولىأظهرت تجربة لنوكليوتيد مضاد (ASO) يسمى تومينرسن انخفاضًا يعتمد على الجرعة في مستويات الهيمنتين المتحور.على الرغم من أن التجربة السريرية المرحلة الثالثة اللاحقة توقفت مبكرًا بسبب مخاوف تتعلق بالسلامةدراسة المرحلة الثانية لتحديد السلامة والقدرة على التحمل بشكل أفضل في وقت مبكر من تقدم المرض جاريةClinicalTrials.govالتسجيل: NCT05686551). يتم حاليًا تجربة طرق بديلة مثل خفض مستوى الهيونتين المحدد بالأليل، وتعديل انقسام البروتين، والعلاج الجيني (تمت مراجعتها في المرجع 22). بالإضافة إلى ذلك، يتم الآن السعي بنشاط لاستهداف التوسع الجسدي والبروتينات مثل MSH3 وFAN1 كأهداف علاجية في مرض هنتنغتون. سؤال رئيسي في استخدام مثل هذه العلاجات سيكون تحديد التوقيت الأمثل للعلاج. إن ظهور علامات الحركة لمرض هنتنغتون مصحوب بالفعل بتدهور عصبي كبير في النواة المذنبة، ويبدو أن العلاج المبكر من المحتمل أن ينتج عنه فائدة سريرية أكبر. ومع ذلك، اعتمدت جميع الدراسات حتى الآن على تحليلات الدماغ بعد الوفاة لنمذجة الرابط بين توسع تكرار CAG والتقدم المرضي المبكر للمرض. إن فهم المحفزات للعملية العصبية التنكسية أمر حيوي في البحث عن علاجات مستقبلية وتحديد أفضل وقت للعلاج لتوفير التدخل العلاجي.
تكمن أعظم فرصة للتأثير على تقدم المرض في العلاج المبكر، بهدف تأخير أو منع التشخيص السريري الحركي. تظهر العديد من الدراسات الرصدية الكبيرة أن التغيرات في الدماغ تحدث قبل عقود من التشخيص السريري الحركي المتوقع.وتظهر علامات معرفية وحركية دقيقة مع اقتراب الأفراد الذين يحملون جين مرض هنتنغتون (HDGE) من التشخيص السريري الحركي. الأخيرة تقديم نظام العرض المتكامل عالي الدقة (HD-ISS) يوفر إطارًا تجريبيًا جديدًا لتصنيف الأشخاص المصابين بمرض هنتنغتون على مدار الحياة.، حيث تكون المرحلة 0 هي مجموعة HDGE بحجم النوى المهادية ضمن نطاق السكان العام، والمرحلة 1 هي وجود علامة حيوية للمرض (تغير حجم الرأس والذيل)، والمرحلة 2 هي وجود علامات حركية و/أو معرفية، والمرحلة 3 تتميز بظهور ضعف وظيفي.من المحتمل أن تستفيد المجموعات في المراحل الأولى أكثر من العلاجات الوقائية.
تتمثل إحدى التحديات الرئيسية في تقديم العلاجات الوقائية في تحديد وتأكيد مقاييس قوية في مراحل HD-ISS 0 و 1، حيث إن غياب العلامات الظاهرة للإعاقة يجعل اختبارات الحركة والاختبارات المعرفية المعتمدة غير حساسة. دراسة الشباب المصابين بمرض هنتنغتون (HD-YAS) هي مجموعة فريدة.سنوات من التشخيص السريري الحركي المتوقع في البداية مع تصنيف عميق يشمل السوائل البيولوجية، التصوير، التقييمات السريرية، المعرفية والحركية. أظهرت بياناتنا الأساسية المستعرضة ارتفاعات طفيفة في مؤشرات السوائل البيولوجية، مثل خيوط الأعصاب الخفيفة في السائل الدماغي الشوكي (NfL)، مصحوبة بحجم أقل قليلاً من النواة المذنبة في مجموعة HDGE مقارنةً بالضوابط غير المتأثرة.على الرغم من ذلك، لم يكن هناك فرق في الأداء الوظيفي بين المجموعتين. لذلك، تمتد هذه المجموعة إلى نافذة مثالية للتحقيق في إمكانية التدخلات لتأخير أو منع الأعراض.
هنا نقدم بيانات المتابعة لمدة 4.5 سنوات من HD-YAS، وهي دراسة طولية ذات تصنيف عميق لمراحل الشباب 0 و1 من البالغين المصابين بمرض هنتنغتون، قبل حوالي 19 عامًا من التشخيص السريري للحركة. افترضنا أن آثار التوسع الجسدي في الدماغ قد يمكن اكتشافها قبل وقت طويل من ظهور الأعراض الحركية السريرية، واختبرنا هذه الفرضية من خلال تحليل طويل الأمد مفصل للأنماط الظاهرة قبل السريرية لمرض هنتنغتون، وعلامات بيولوجية للتدهور العصبي والتوسع الجسدي في الحمض النووي للدم. قمنا بفحص التغيرات على مر الزمن في مجموعة من التقييمات بهدف تحديد علم الأمراض العصبية المستمرة والارتباطات مع توسع CAG الجسدي في الحمض النووي للدم وهياكل تكرار HTT، قبل عقود من التشخيص السريري المتوقع للحركة، وعلامات بيولوجية لتقدم المرض، والتي قد تكون لها فائدة في تجارب الوقاية المستقبلية.
النتائج
خصائص المشاركين
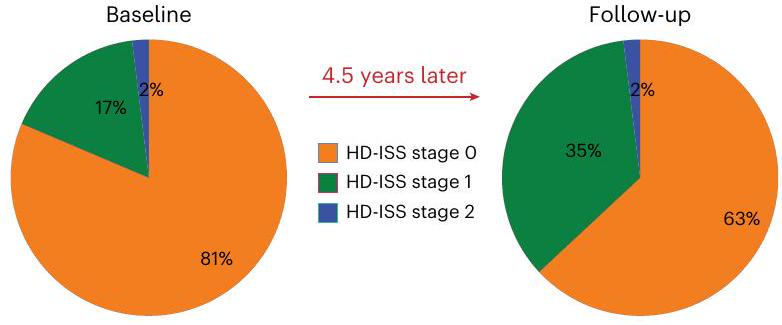
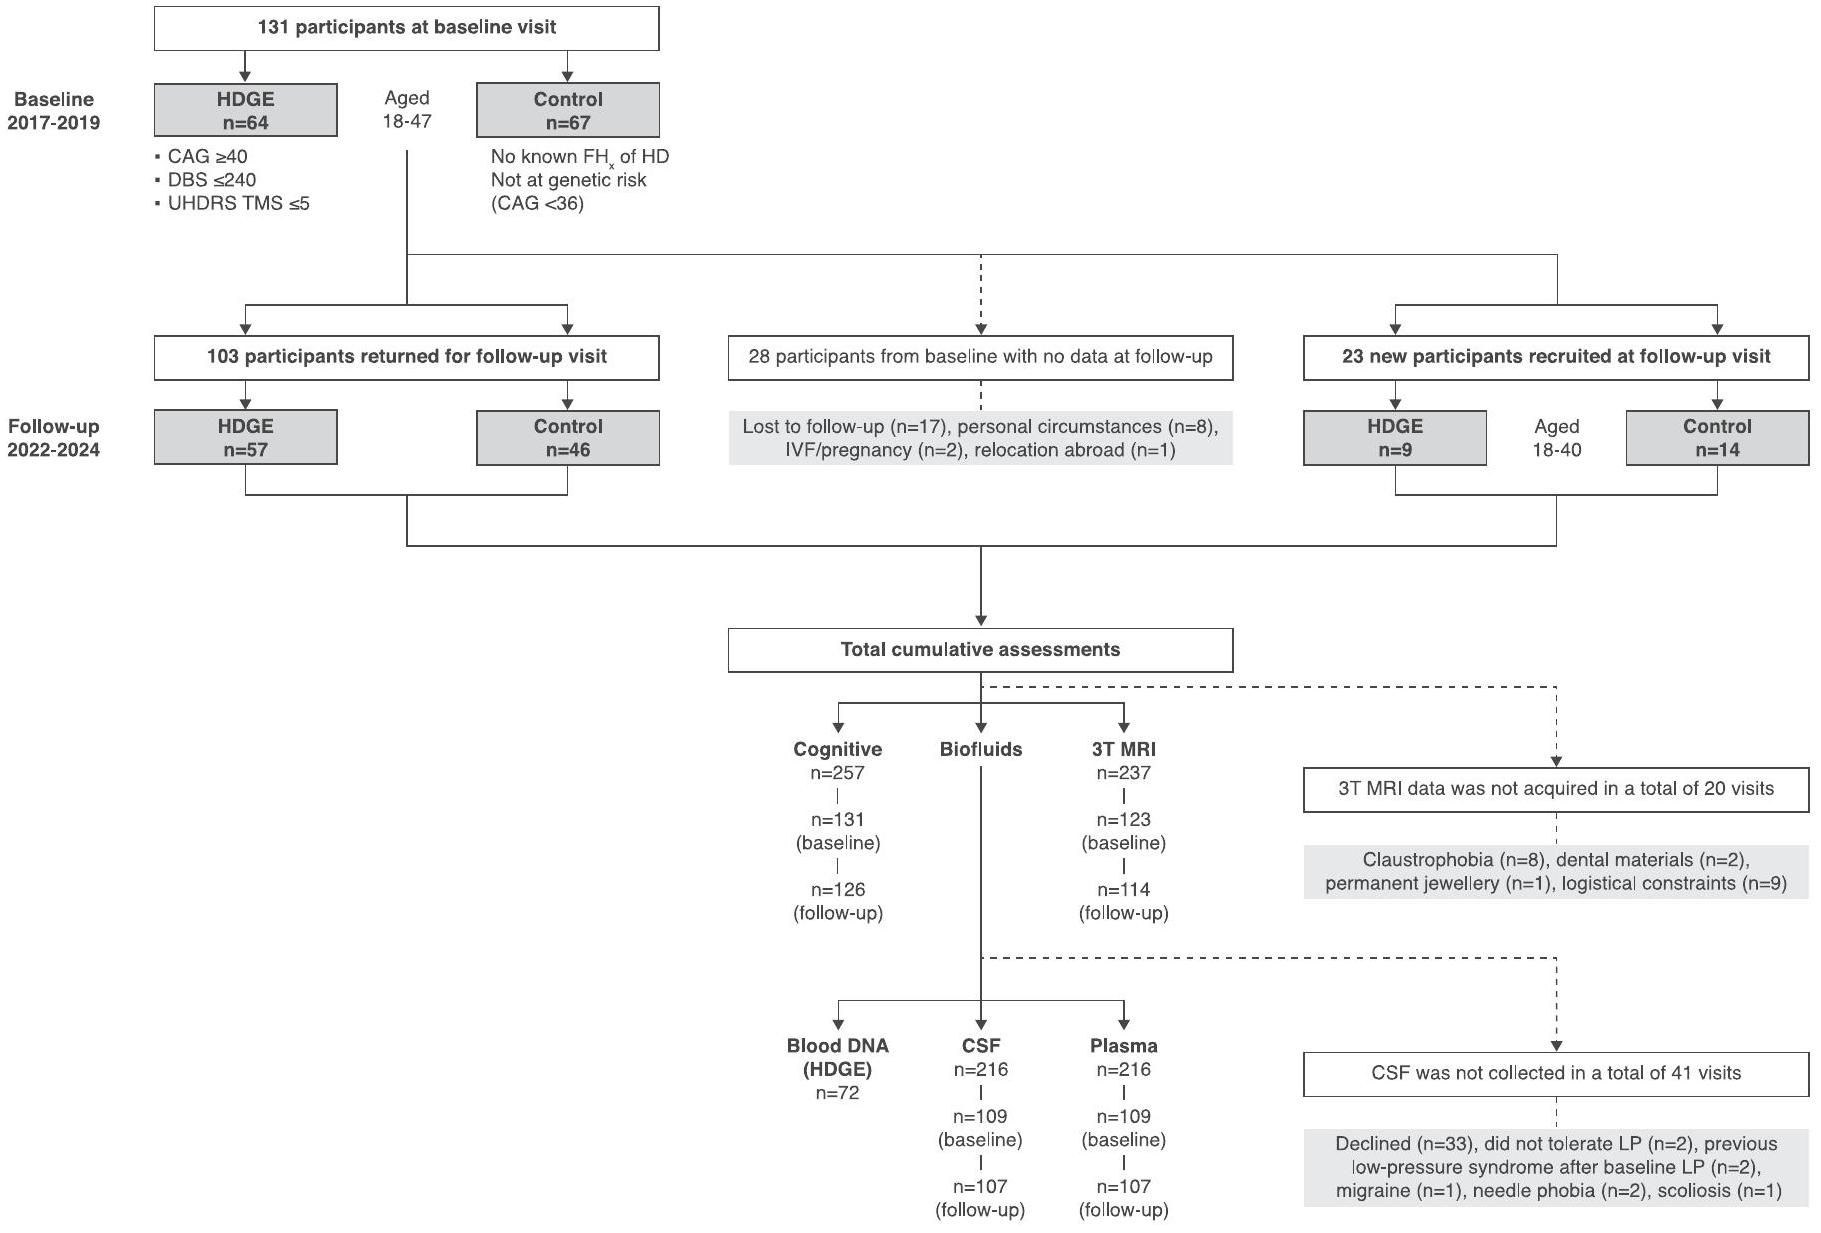
حضر 131 مشاركًا (64 من مجموعة HDGE و67 من مجموعة التحكم) في البداية وعاد 103 (57 من مجموعة HDGE و46 من مجموعة التحكم) للمتابعة بعد 4.5 سنوات (انظر الشكل 1 في البيانات الموسعة لأسباب الانسحاب). لتعويض الذين لم يعودوا، قمنا بتجنيد 23 مشاركًا جديدًا.HDGE و 14 مجموعة ضابطة) مما يعطي إجمالي 154 مشاركًا (73 HDGE و 81 مجموعة ضابطة). في البداية،كان المشاركون في المجموعة في مرحلة HD-ISS 0،في المرحلة 1 و 1 ( ) في المرحلة 2 (الشكل 1أ). على مدى 4.5 سنوات، انتقل المشاركون من المرحلة 0 إلى المرحلة 1؛ ولم يكن هناك تقدم إلى المرحلة 2. يتم تصوير الانتقال في التصنيف داخل مجموعة HD-YAS من خلال تراكب مصفوفة الاحتمالات لكل مرحلة من مراحل HD-ISS عبر أعمار مختلفة للأفراد الذين لديهم متوسط طول تكرار CAG يبلغ 42، وهو ما يعادل متوسط طول تكرار CAG لمجموعتنا (الشكل 1b). هنا نصف المزيد من النتائج الطولية من المشاركين؛ وتُقدم النتائج المقطعية، المحدثة من الدراسة الأساسية الأصلية، في النتائج والمناقشة التكميلية.
لم تكن هناك اختلافات كبيرة (معدل الاكتشاف الخاطئبين مجموعة HDGE ومجموعة التحكم من حيث العمر، الجنس، الفاصل الزمني بين الزيارات، درجة التعليم أو اختبار القراءة الوطنية للبالغين (مقياس للذكاء قبل المرض؛ الجدول البياني الممتد 1).
التقييمات المعرفية والعصبية النفسية
لم يكن هناك تراجع طويل الأمد ملحوظ مرتبط بالمرض في أي من التقييمات المعرفية الشاملة (FDR > 0.8؛ الشكل 1c) أو التقييمات النفسية العصبية (FDR > 0.3؛ الشكل 1d)، مما يدل على أن التغيير في مجموعة HDGE لم يكن مختلفًا عن الضوابط المتطابقة. تظهر النتائج المقطعية في الشكل التوضيحي التكميلي 1 وتُقدم الإحصائيات الملخصة في الجداول التكميلية 1 و2 للنتائج الطولية والجداول التكميلية 3 و4 للنتائج المقطعية.
تصوير الأعصاب
بعد مراقبة الجودة، كانت البيانات الطولية متاحة لـ 88 مشاركًا (54 HDGE و34 ضابطًا) للتصوير الحجمي، و83 (50 HDGE و33 ضابطًا) للتصوير بالوزن الانتشاري (DWI) و75 (43 HDGE و32 ضابطًا) للتخطيط متعدد المعلمات (MPM). نظرًا لاستبعاد المشاركين الذين يستخدمون اليد اليسرى، كانت هناك 70 (43 HDGE و27 ضابطًا) مشاركًا متاحين لتحليل الاتصال الهيكلي. انظر الجدول التكميلي 5 والأساليب التكميلية لمزيد من التفاصيل.
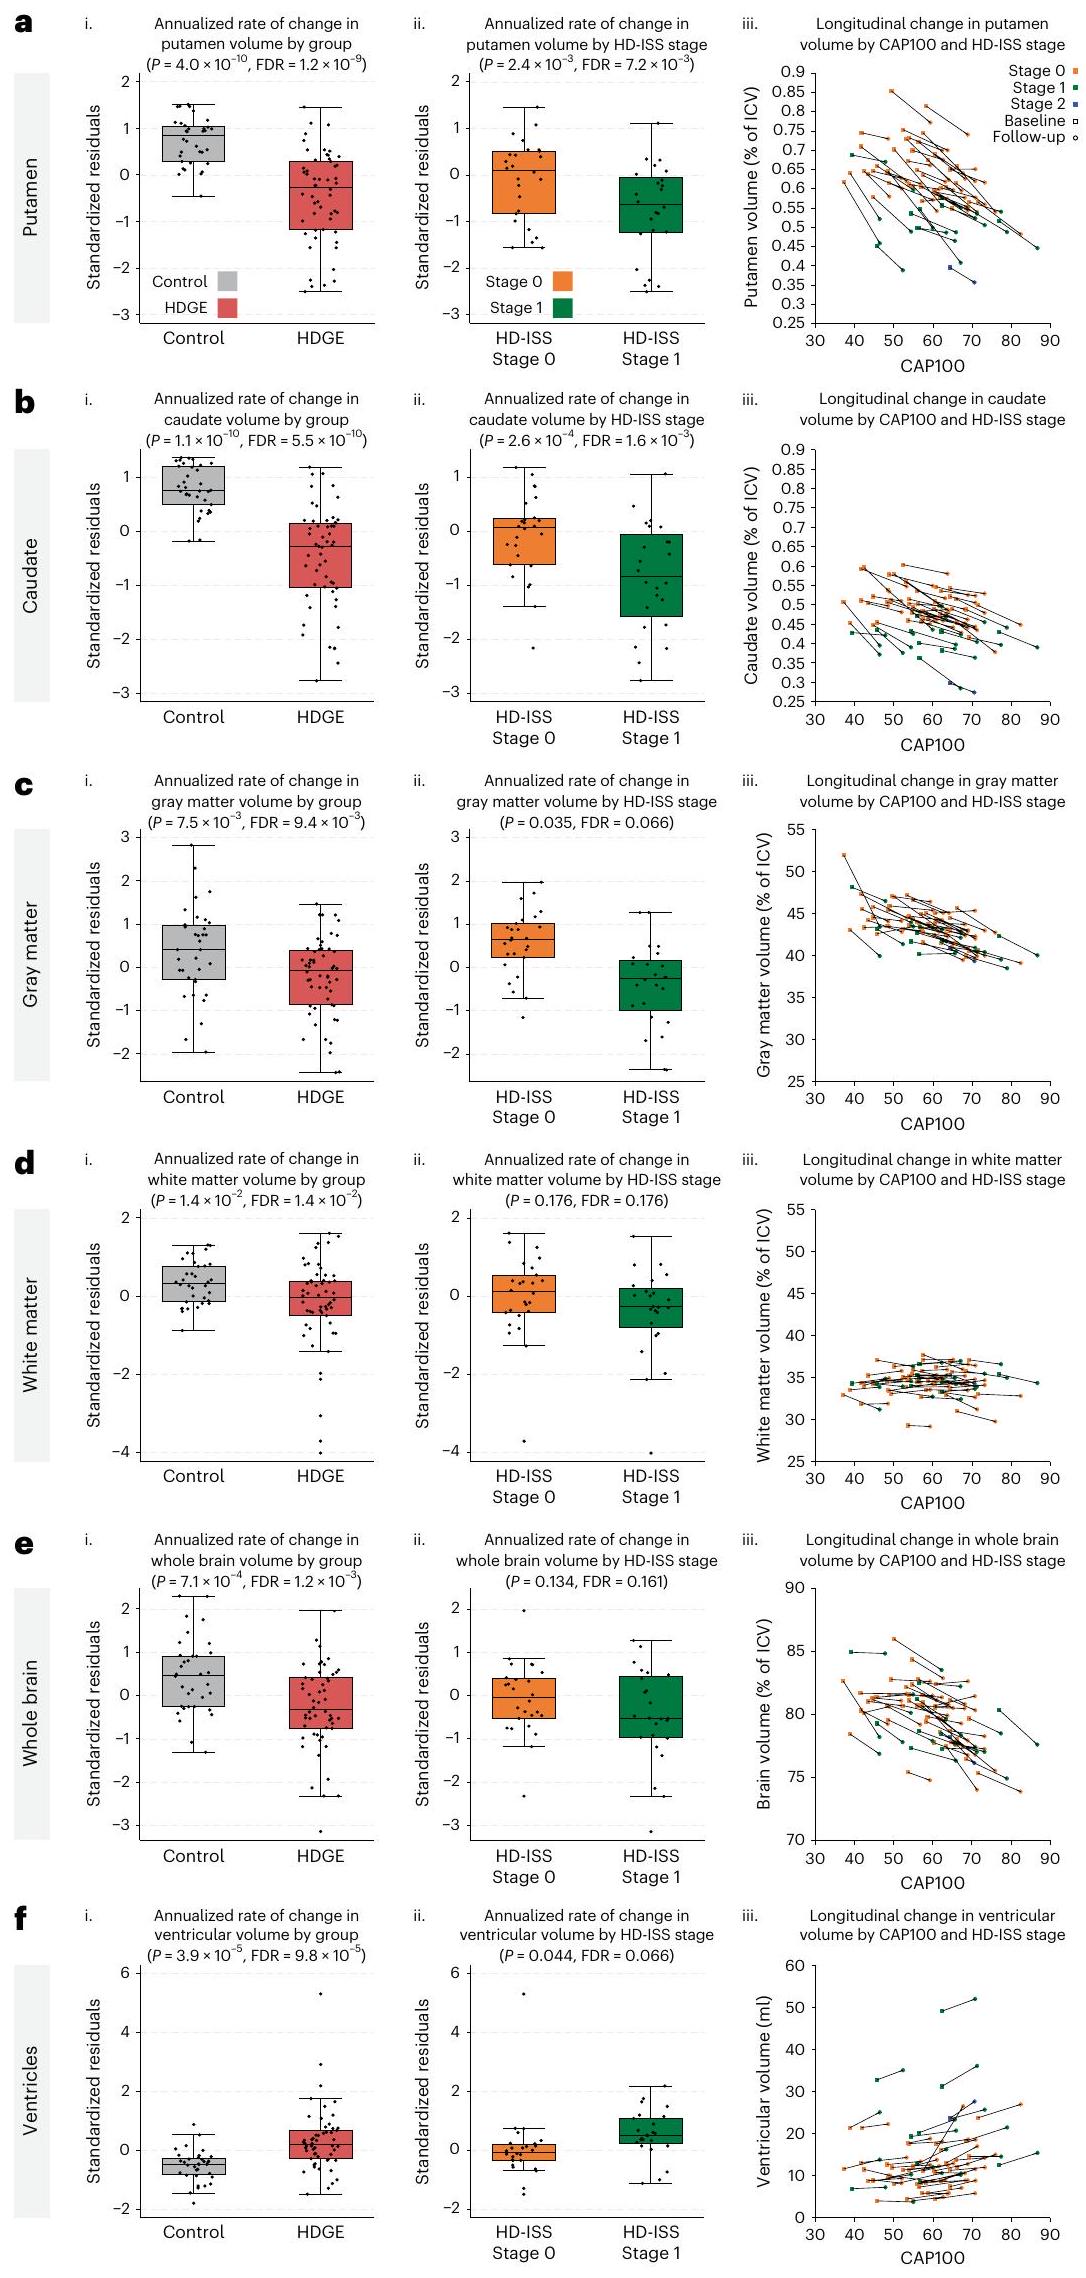
أظهرت مجموعة HDGE معدلات ضمور أكبر بشكل ملحوظ في اللوزةفرانكلين ديلانو روزفلت ) وذيل ( فرانكلين ديلانو روزفلت ). كانت هناك أيضًا اختلافات كبيرة بين المجموعات بالنسبة للمادة الرمادية ( المادة البيضاء، ) ودماغ كامل ( ) مع التوسع البطيني المرتبط ( ; الشكل 2). تم التنبؤ بفقدان الرأس، والذيل، والمادة البيضاء بشكل كبير بواسطة العمر و CAG (، ، على التوالي).
أظهرت تقنية التصوير بالرنين المغناطيسي للانتشار (DWI) معدلات مرتفعة من التغير الطولي في جميع مقاييس الانتشار وقياس اتجاه الأعصاب وكثافة التشتت عبر عدة مناطق اهتمام في مجموعة HDGE مقارنةً بالمجموعة الضابطة (FDR < 0.15). أظهرت منطقة الحُصين من الجسم الثفني، والكبسولة الأمامية، والكبسولة الخارجية ارتباطات مع العمر وCAG (FDR < 0.15). لم تكن هناك اختلافات ذات دلالة إحصائية بين المجموعتين في معدل التغير لأي من مقاييس الاتصال الهيكلي (جميعها FDR > 0.4) أو مقاييس MPM (جميعها FDR > 0.3)، ولا أي دليل على تأثير العمر وCAG (جميعها FDR > 0.15).
تشير نتائج التصوير العصبي إلى أنه عبر مراحل HD-ISS 0 و 1، هناك بالفعل معدلات مرتفعة من ضمور الدماغ مصحوبة بتغيرات دقيقة في بنية المادة البيضاء. انظر جداول البيانات الموسعة 2 و 3 للحصول على إحصائيات ملخصة لنتائج الحجم الطولي والانتشار، على التوالي. يتم تقديم إحصائيات ملخصة للقياسات الطولية المتبقية في الجداول التكميلية 6 و 7 والبيانات المقطعية في الجداول التكميلية 8-11.
الشكل 1 | التغير الطولي في القياسات السريرية والمعرفية والنفسية العصبية. أ، توزيع مراحل HD-ISS في البداية وبعد 4.5 سنوات. ب، مصفوفة احتمالية لوجود في كل مرحلة من مراحل HD-ISS عبر أعمار مختلفة للأفراد الذين لديهم متوسط طول تكرار CAG يبلغ 42، وهو ما يعادل مجموعة HD-YAS. تم اشتقاق هذه الاحتمالات من بيانات دراسات Enroll-HD و PREDICT-HD و TRACK-HD، التي تم استخدامها لتطوير HD-ISS.. يبرز المربع الأسود المتقطع مجموعة HD-YAS في البداية، بينما يشير المربع الأحمر إلى موقعهم في المتابعة بعد 4.5 سنوات. ج، رسم بياني راداري يظهر الفروق بين المجموعات في التغيرات الطولية في القياسات المعرفية. د، رسم بياني راداري يظهر الفروق بين المجموعات في التغيرات الطولية للقياسات النفسية العصبية والوظيفية. تمثل الخط الأسود الفرق المتوسط المعياري بين مجموعتي HDGE والمجموعة الضابطة، مع الأساليب التقليدية للإحصاء التكراري.تم تظليل CI باللون الرمادي. الدائرة الحمراء تشير إلى عدم وجود فرق بين المتوسطات؛ القيم داخل هذه الدائرة تشير إلى تغير أكبر بمرور الوقت في مجموعة HDGE. بعد تصحيح FDR للمقارنات المتعددة، لم تكن هناك اختلافات جماعية طولية ذات دلالة إحصائية في أي من القياسات المعرفية أو النفسية العصبية. يمكن العثور على مزيد من التفاصيل حول التغيرات الطولية في القياسات المعرفية في الجدول التكميلي 1 والقياسات النفسية العصبية في الجدول التكميلي 2. التغيرات العرضية في القياسات المعرفية موضحة في الجدول التكميلي 3 والتغيرات النفسية العصبية في الجدول التكميلي 4. النتائج العرضية مرئية في الشكل التكميلي 1. AMI، مؤشر الدافع لللامبالاة؛ BIS، مقياس الاندفاعية من بارات؛ CI، فترة الثقة؛ ED، الأبعاد الإضافية؛ FSBS، مقياس السلوكيات النظامية الجبهية؛ IED، التحول بين المجموعات الداخلية والخارجية؛ OCI، استبيان الوسواس القهري؛ OTS، الجوارب ذات اللمسة الواحدة؛ PAL، تعلم الأزواج المرتبطة؛ PSQI، مؤشر جودة النوم في بيتسبرغ؛ RVP، المعالجة البصرية السريعة؛ RVP A’، مقياس نظرية اكتشاف الإشارة لحساسية الهدف ومتوسط زمن الاستجابة؛ SDMT، اختبار رموز الأرقام؛ SF-36، استبيان ذاتي من 36 عنصرًا؛ SSRT، زمن رد الفعل لإشارة التوقف؛ SSTAI، استبيان القلق للحالة والصفة من سبيلبرغر؛ SWM، الذاكرة العاملة المكانية؛ ZSDS، درجة الاكتئاب الذاتية من زونغ.
السوائل الحيوية
تم جمع ما مجموعه 216 عينة من السوائل الحيوية خلال الزيارات الأساسية والمتابعة على مدى فترة 4.5 سنوات. تم الحصول على عينات من السائل الدماغي الشوكي والبلازما الصائمة المزدوجة في 86 (53 من مجموعة HDGE و33 من الضوابط) منالمشاركين الطوليين.
أ
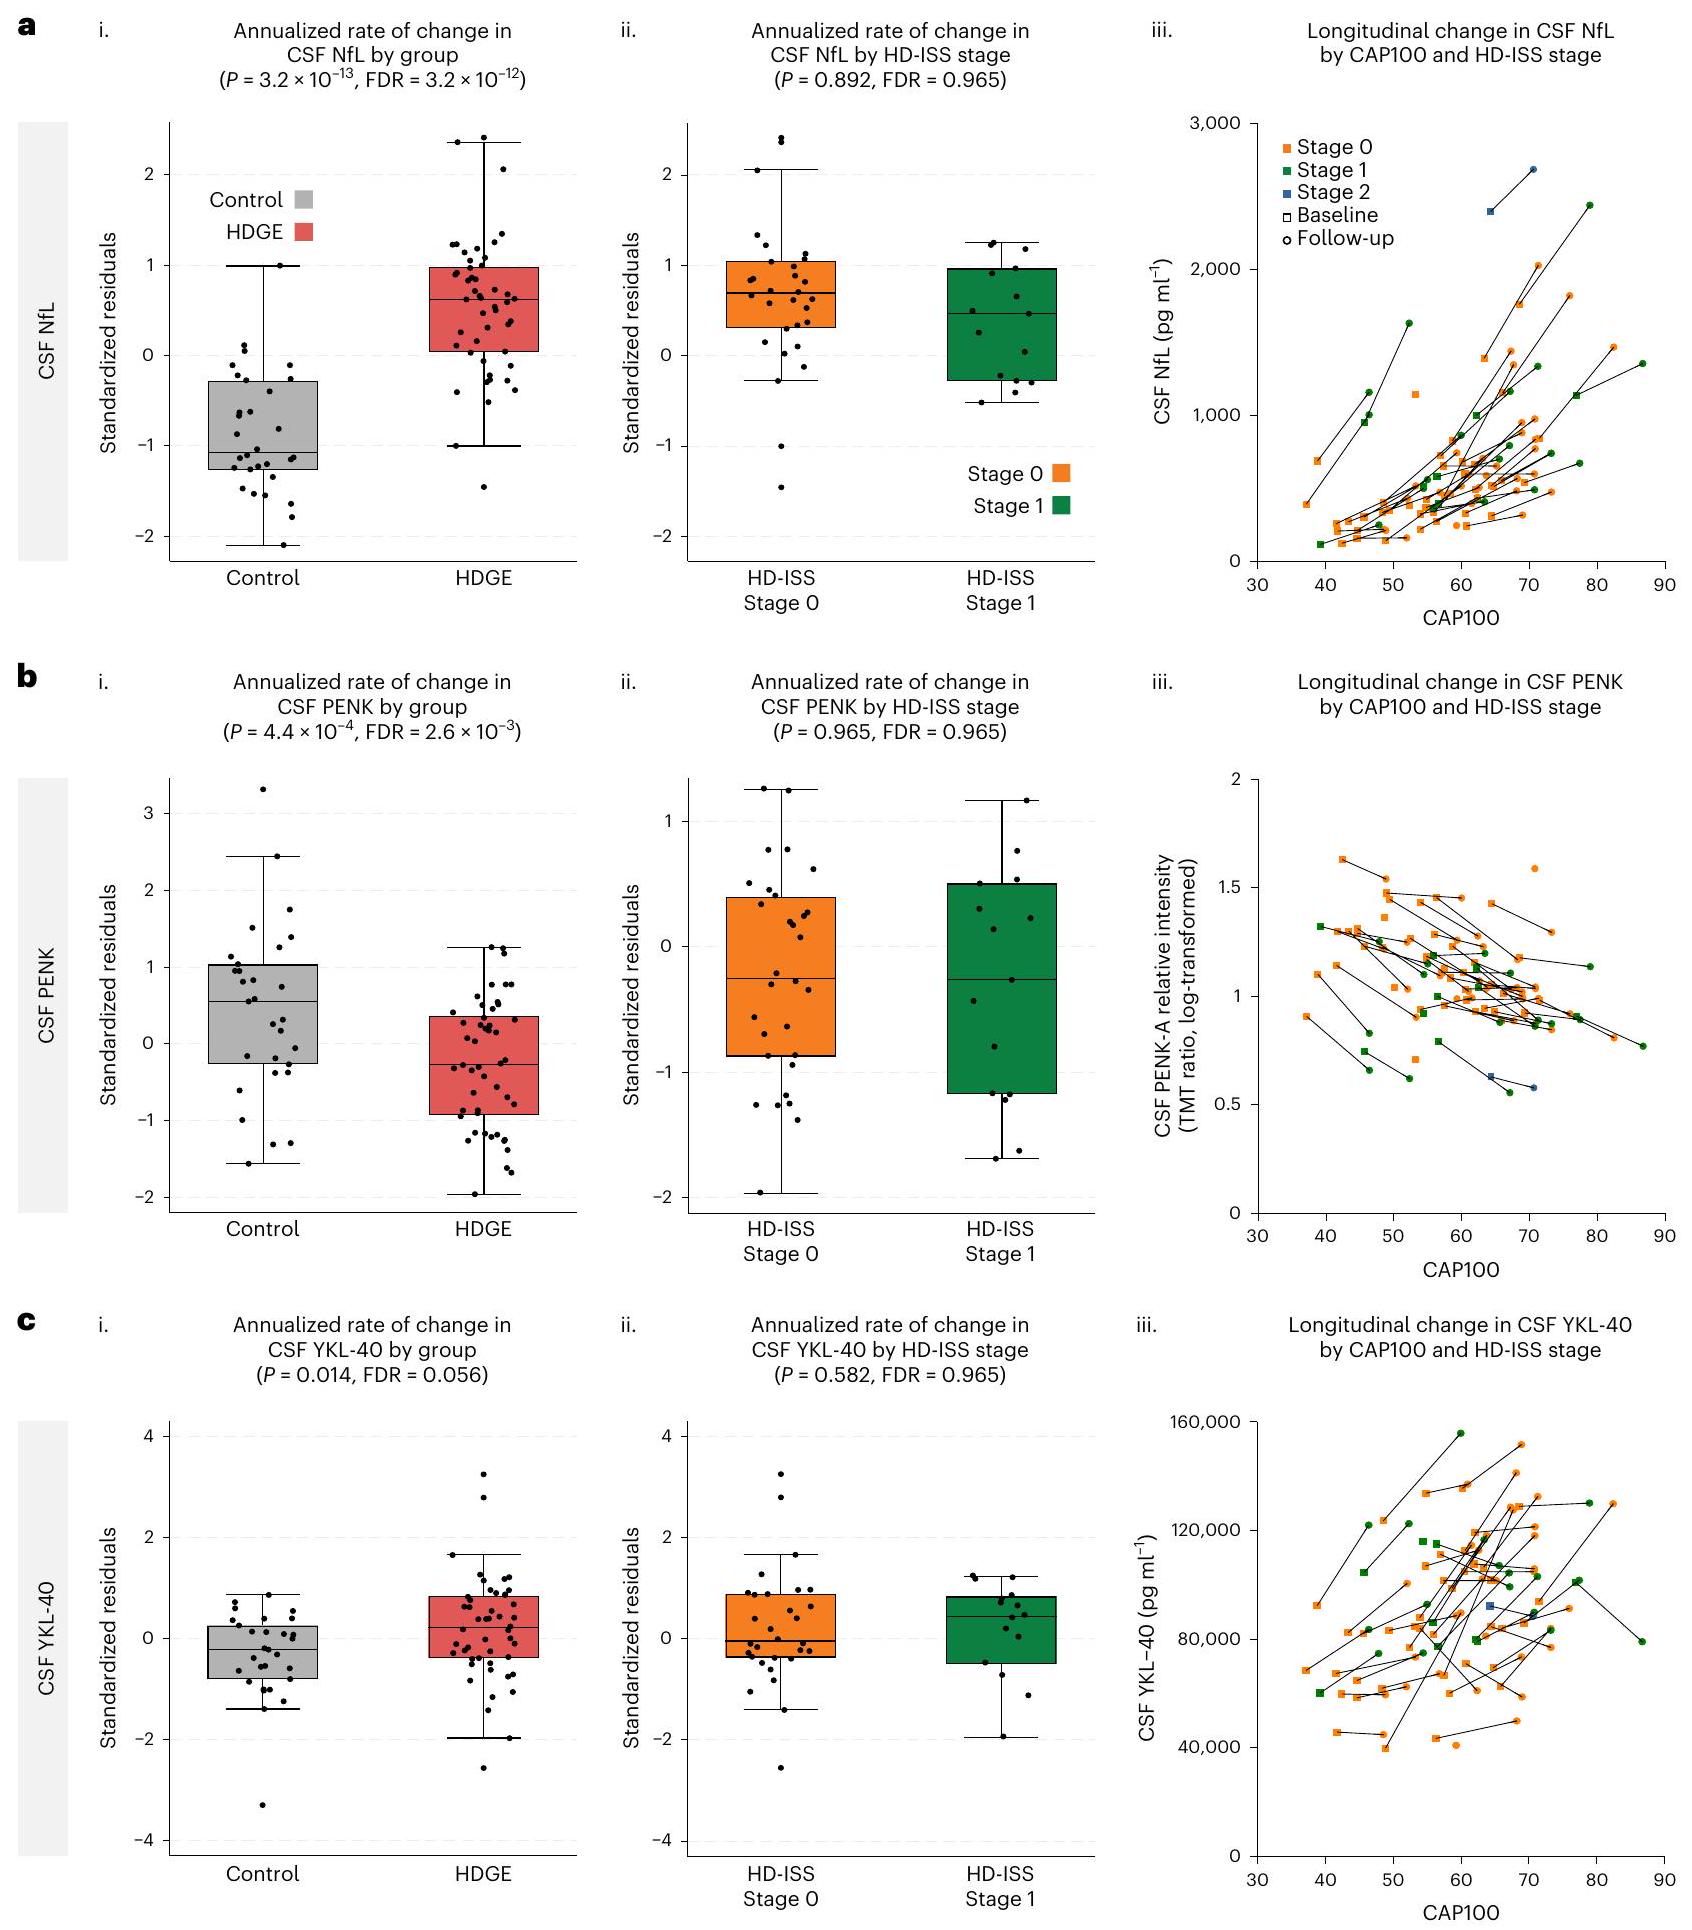
من خط الأساس الذي زاد بشكل ملحوظ، ارتفعت مستويات NfL في السائل الدماغي الشوكي (الشكل 3أ) و YKL-40 في السائل الدماغي الشوكي (المعروف أيضًا باسم بروتين شيتيناز-3 مثل-1 (CHI3L1)) (الشكل 3ج) بشكل أسرع في HDGE مقارنةً بالمجموعة الضابطة.، و على التوالي). جديد في هذه النقطة الزمنية، أظهر البروإنكيفالين (PENK)، وهو علامة بديلة لحالة خلايا MSN في النواة المذنبة، المقاسة في السائل الدماغي الشوكي، انخفاضًا طوليًا كبيرًا في الأفراد المصابين بـ HDGE مقارنةً بالضوابط.; الشكل 3ب). كان الارتفاع في مستوى NfL في البلازما غير ذي دلالة إحصائية (FDR = 0.669؛ الشكل البياني الممتد 2.
عبر المقطع العرضي، تركيزات السجل لكل من NfL في السائل الدماغي الشوكي ) و PENK ( ) كانت مرتبطة بشكل كبير بالعمر وطول CAG وتفاعلهما. كان هناك أيضًا دليل على تأثير على التغير الطولي في NfL في السائل الدماغي الشوكي ( ) و كان لمستوى NfL في البلازما ارتباط عرضي مشابهإف دي آرلكن لا توجد علاقة طولية كبيرة مع العمر وCAG. يتم الإبلاغ عن معاملات الانحدار في الجداول التكميلية 12-14.
تمت ملاحظة معدلات تغيير سنوية أعلى قليلاً في NfL في السائل الدماغي الشوكي والبلازما في مجموعة HDGE في المرحلة 0 مقارنة بالمرحلة 1 خلال المتابعة، لكنها لم تصل إلى عتبة الدلالة (FDR). ). كانت مستويات NfL في السائل الدماغي الشوكي (خلال الزيارتين) أعلى في المتقدمين في HD-ISS (المراحل 0 إلىيعني، المقياس) مقارنةً بالذين لا يتقدمون (المرحلة 0 إلىيعنيمقياس لوغاريتمي؛ المرحلة 1 إلىيعنيمقياس لوغاريتمي؛ الجدول التكميلي 15). بعد التعديل حسب العمر والجنس وتفاعلهما، كانت الفروق بين المتقدمين من المرحلة 0 إلى 1 وغير المتقدمين من المرحلة 0 ذات دلالة إحصائية.“. وبالمثل، كان الفرق بين المتقدمين من المرحلة 0 إلى 1 وغير المتقدمين في المرحلة 1 كبيرًا (عند التحكم في العمر والجنس، ولكن لم تكن هناك دلالات ذات أهمية بدون هذه التعديلات. لم تُلاحظ أي اختلافات ذات دلالة إحصائية في مستويات NfL في البلازما (الجدول التكميلي 16).
كانت مستويات المHTT في السائل الدماغي الشوكي منخفضة بشكل ملحوظ مقارنة بمراحل المرض اللاحقة.فقطمن العينات التي تتجاوز الحد الأدنى للتقدير وتظهر معامل تباين مقبول أقل من (الشكل التوضيحي 2).
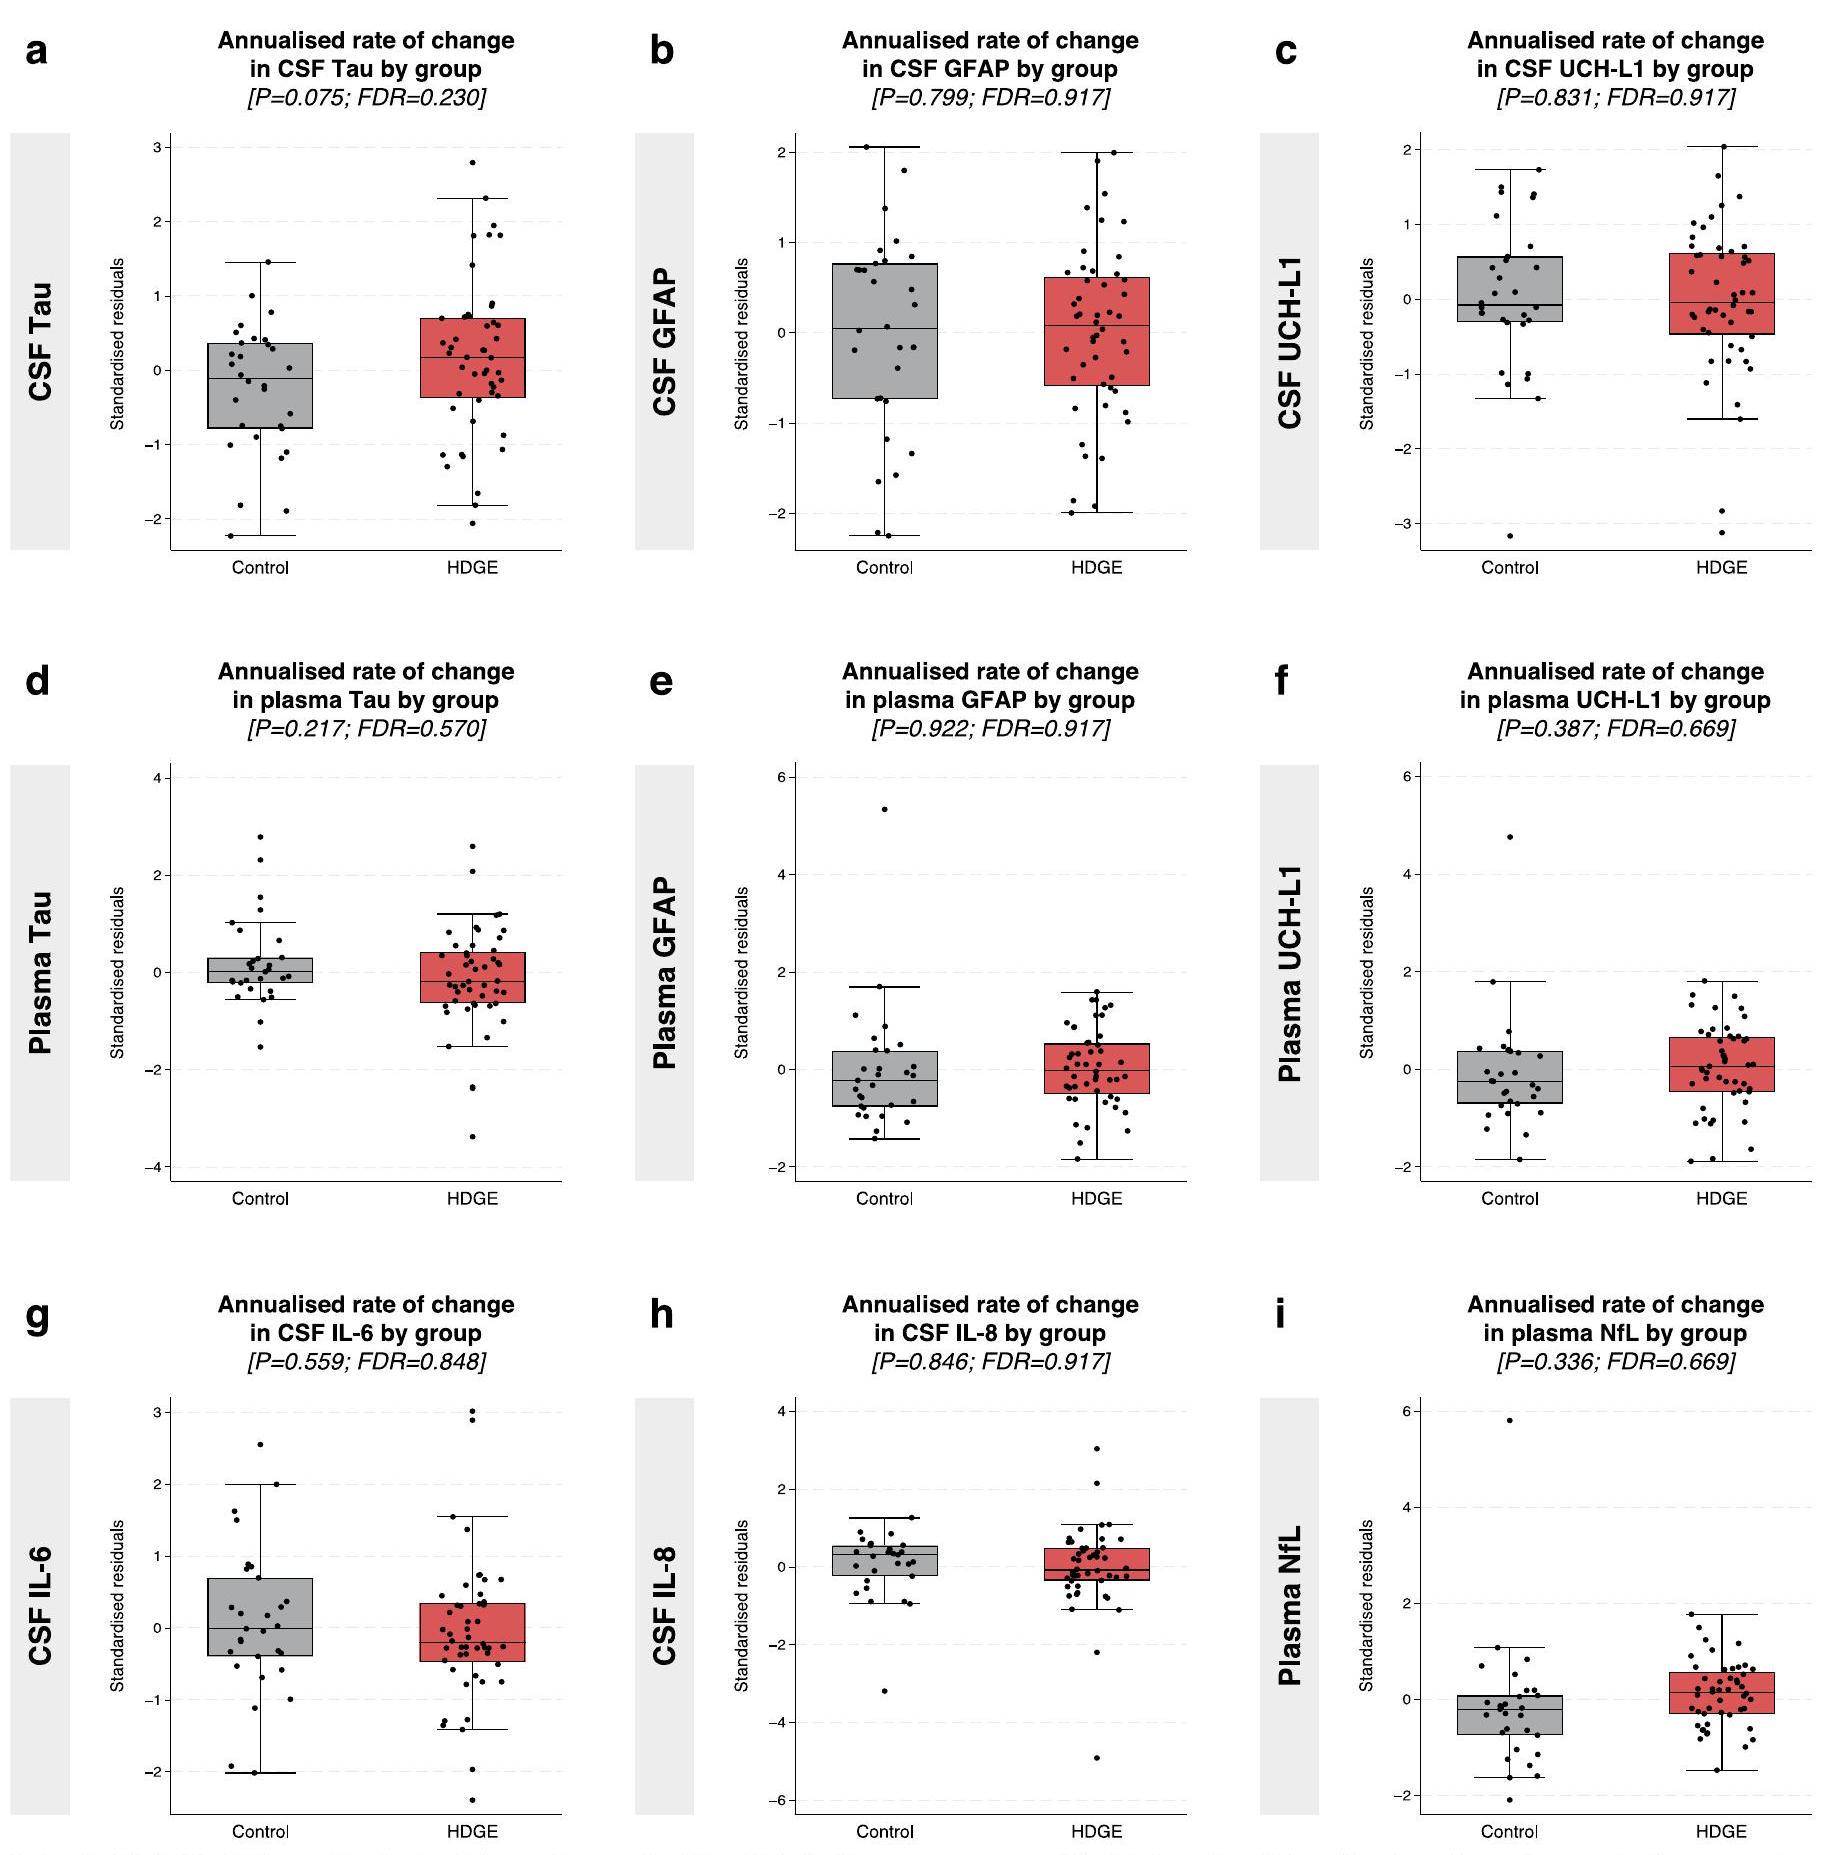
لم تظهر معدلات التغير في مؤشرات السوائل الحيوية الأخرى، بما في ذلك NfL في البلازما، وtau في السائل الدماغي الشوكي والبلازما، وبروتين الألياف الدبقية الحمضية (GFAP) في السائل الدماغي الشوكي والبلازما، وإنزيم يوبكويتين كربوكسيلي-نهاية الهيدراز (UCH-L1) في السائل الدماغي الشوكي والبلازما، وإنترلوكين-6 (IL-6) وIL-8 في السائل الدماغي الشوكي، أي اختلافات ذات دلالة إحصائية بين المجموعات (الشكل البياني الممتد 2). بالإضافة إلى ذلك، لم يكن لأي من مؤشرات السوائل الحيوية، بما في ذلك NfL، ارتباط مع العمر، أو CAG، أو تفاعل العمر مع CAG (FDR > 0.15). انظر الجدول التكميلي 17 للإحصائيات الطولية والجدول التكميلي 18 للإحصائيات المقطعية.
نسب التوسع الجسدي في الدم
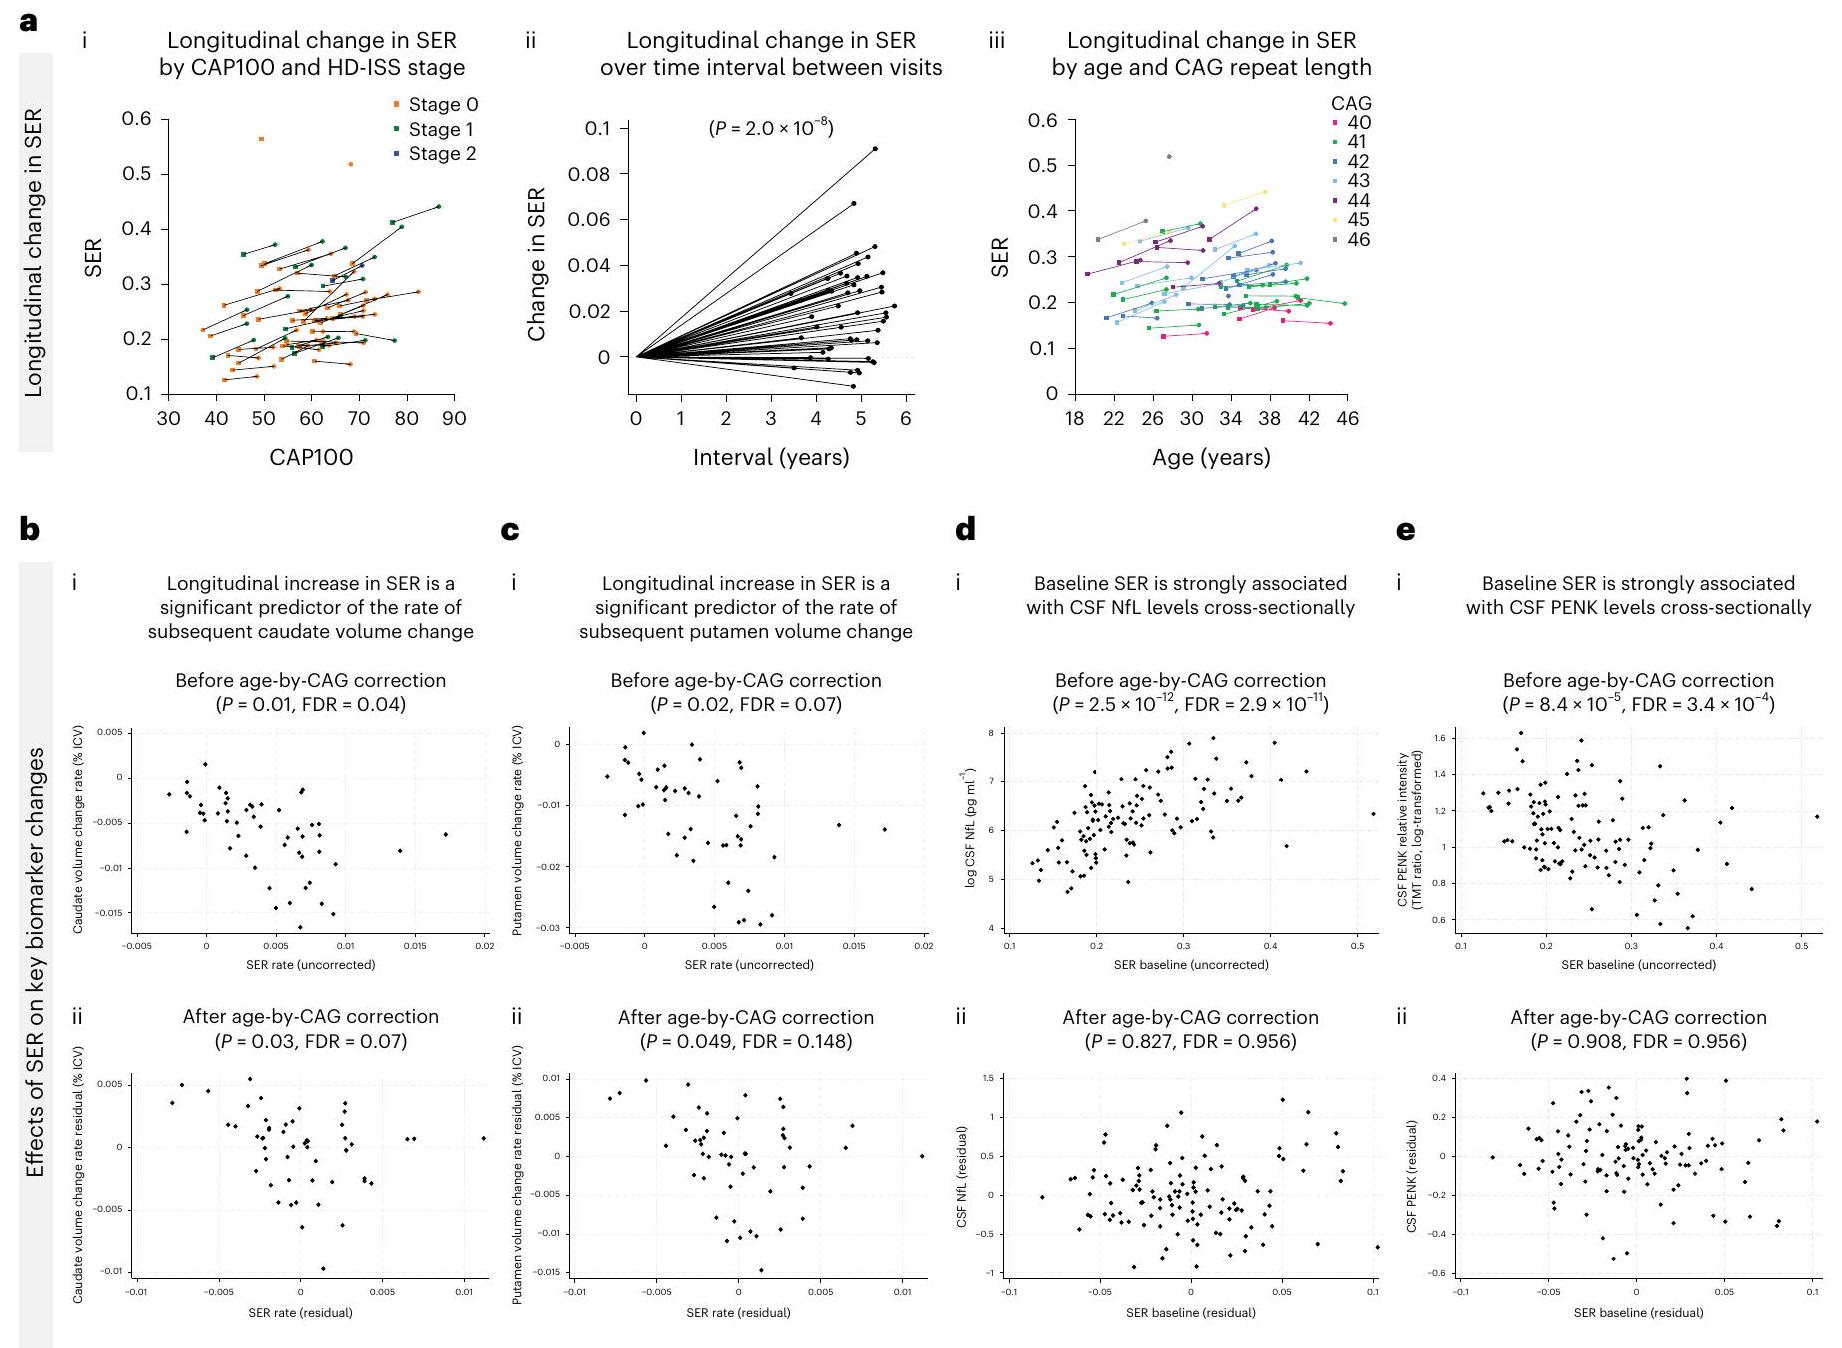
تم الكشف عن زيادات طولية ملحوظة في نسبة التوسع الجسمي (SER) في الحمض النووي في الدم في مجموعة HDGE على مدى 4.5 سنوات. )، مع زيادة SER بوضوح منذ مرحلة HD-ISS 0 (الشكل 4a). كانت معدلات تغيير SER متأثرة بشدة بتأثير تسارع طول تكرار CAG ( ).
هياكل أليلات HTT
أظهر غالبية مجموعة HDGE الهيكل النموذجي لتكرار HTT على الأليل المتوسع )، بينما مجموعة صغيرة ( ) أظهرت تباينات أليلية غير نمطية (الشكل 5أ). على وجه التحديد، تم ملاحظة تكرار CAACAG في المشارك، تم العثور على فقدان مزدوج CAACAGCCGCCA في و كان فقدان CCGCCA.
مؤشرات التقدم
كانت مستويات NfL الأساسية، سواء في البلازما أو السائل الدماغي الشوكي، وPENK في السائل الدماغي الشوكي، مؤشرات على الضمور مع مرور الوقت في جميع مناطق الدماغ (جميع FDR < 0.04)، حتى بعد التحكم في تأثير العمر وCAG (جميع FDR < 0.12؛ الجدول 4 في البيانات الموسعة). كانت نسبة التغير في الرأس المداري والبطين الأكثر ارتباطًا بالتغير في و ، على التوالي) و NfL في البلازما (, و على التوالي) وظلت العلاقة قائمة بعد التحكم في تأثيرات العمر و CAG (جميع FDRكانت معدلات التغير في الرأس المدور والذيل المرتبط أيضًا مرتبطة بالتغير الطولي في سائل الدماغ والنخاع PENK قبل (فرانكلين ديلانو روزفلت و ، على التوالي) وبعد (فرانكلين ديلانو روزفلت و فرانكلين ديلانو روزفلتتصحيح العمر حسب CAG، على التوالي.
الزيادة الطولية في SER كانت مؤشراً مهماً لمعدل تغيير حجم الرأس الذيل لاحقاً قبل ) وبعد تصحيح العمر بواسطة CAG ( ; الشكل 4ب). كان الزيادة الطولية في SER أيضًا مؤشرًا مهمًا لمعدل تغيير حجم اللوزة اللاحق قبل ( ) وبعد ( فرانكلين ديلانو روزفلتتصحيح العمر حسب CAG (الشكل 4c). كان مستوى SER الأساسي مرتبطًا بشكل قوي بمستويات NfL في السائل الدماغي الشوكي عبر المقطع العرضي.فرانكلين ديلانو روزفلت; الشكل 4د) و CSF PENK (فرانكلين ديلانو روزفلت; الشكل 4e) قبل تصحيح العمر بواسطة CAG. ومع ذلك، لم تظل هذه الارتباطات ذات دلالة إحصائية بعد التصحيح (CSF NfL; سائل الدماغ الشوكي PENK ).
بعد التحكم في CAG، والعمر، والعمر حسب CAG، والجنس وتأثيرات SER، مقارنةً بالهيكل الجيني النموذجي، كان لفقدان الأليل غير النمطي CAACAG CCGCCA تأثيرات كبيرة على معدلات الرأس المداري (“; الشكل 5ب.ط) و المِكْرَة (; الشكل 5ب.ii) ضمور بالإضافة إلى مستوى NfL في السائل الدماغي الشوكي العرضي (;الشكل 5ب.iii) و CSF PENK (؛ الشكل 5ب.رابعًا) المستويات، مع فقدان الـ CAACAG CCGCCA المتداخلة المرتبطة بدورة عصبية تنكسية متسارعة (بيانات موسعة الشكل 3). ومن الجدير بالذكر أنه بعد تصحيح طول CAG النقي، لم يكن هناك ارتباط قابل للاكتشاف بين هيكل الأليل غير النمطي و SER (FDR > 0.15).
حسابات حجم العينة
يوضح الجدول البياني الموسع 5 حسابات حجم العينة الافتراضية لتلك المتغيرات التي لها تأثيرات طولية كبيرة في مجموعة HDGE. بالنسبة لـأثر العلاج على مدى عامين في المراحل 0 و 1، سيكون حجم العينة الإجمالي 232 و 282 و 326 لمعدلات التغير في مستويات NfL في السائل الدماغي الشوكي، وحجم الرأس الذيل، وحجم الجسم المخطط، على التوالي. بالنسبة لتجربة مدتها 3 سنوات، ستنخفض هذه الأرقام إلى 104 و 126 و 146، على التوالي.
الشكل 2 | التغيرات السنوية في القياسات الحجمية على مدى الزمن. أ-و، يتم عرض اللوزة (أ)، الرأس المدبب (ب)، المادة الرمادية (ج)، المادة البيضاء (د)، الدماغ بالكامل (هـ) والبطينات (و). لكل هيكل، نقدم (ط) مقارنة بين المتبقيات المعيارية (المعدلة حسب العمر والجنس) لمعدل التغير السنوي في HDGE (; أحمر) والتحكم ( ؛ المجموعات (الرمادي)، (ii) مقارنة البقايا المعيارية لمعدل التغير السنوي ضمن HDGE حسب مرحلة HD-ISS المتابعة 0 (البرتقالي) ومرحلة 1 (الأخضر) و (iii) مخططات التشتت للحجم حسب درجة CAP100، ملونة حسب مرحلة HD-ISS ضمن HDGE. يتم ربط الزيارات المتكررة لكل مشارك بخطوط سوداء، مع عرض الخط الأساسي كمربعات والمتابعة كدوائر. تمثل مراحل HD-ISS كما يلي: المرحلة 0 (البرتقالي)، المرحلة 1 (الأخضر) والمرحلة 2 (الأزرق). تشير البقايا المعيارية السلبية إلى معدل تغيير أقل من المتوسط المعدل عبر المجموعات. يعرض كل مخطط صندوقي الوسيط (خط أفقي)، ونطاق الربع (صندوق) والشعيرات الممتدة إلى IQR. أحجام العينات ( ) تعكس النسخ البيولوجية لكل مجموعة، مع لـ HDGE وللمجموعة الضابطة؛ تمثل البيانات قياسات طولية لكل مشارك، دون تكرارات تقنية. استخدمت تحليلات التغير الحجمي للهياكل الدماغية، باستثناء اللويحة، مقياسًا واحدًا لتغير الحدود أو مقياس مورفومترية قائم على الفوكسل لزوج من المسحات لكل مشارك (من الخط الأساسي إلى المتابعة) تم تحويله إلى معدلات سنوية ونمذجة بواسطة تحليل الانحدار العادي. تم حساب التغيرات في اللويحة عن طريق طرح تقسيمات MALP-EM الأساسية من تقسيمات المتابعة وقسمة النتيجة على مدة المتابعة. تعكس نتائج التحليل والتعديلات المتبقية التحكم في العمر الأساسي والجنس وتفاعلهما. تم تعديل المقارنات الجماعية الثنائية الجوانب إحصائيًا لتعدد المقارنات باستخدام FDR، معالقيم، درجات الحرية وحدود الثقة المقدمة في الجدول البياني الموسع 2. CAP، منتج عمر CAG؛ ICV، حجم الجمجمة؛ IQR، النطاق الربعي.
الشكل 3 | التغيرات السنوية في علامات السوائل الحيوية على مدى الزمن. أ-ج، يتم عرض NfL في السائل الدماغي الشوكي (أ)، و PENK في السائل الدماغي الشوكي (ب) و YKL-40 في السائل الدماغي الشوكي (ج). لكل علامة حيوية، نقدم (ط) مقارنة بين المتبقيات المعيارية (المعدلة حسب العمر والجنس) لمعدل التغير السنوي في HDGE (; أحمر) والتحكم ( ;المجموعات الرمادية) (ii) مقارنة البقايا المعيارية لمعدل التغير السنوي ضمن HDGE حسب مرحلة HD-ISS 0 (برتقالي) ومرحلة 1 (أخضر) و(iii) مخططات التشتت لمستويات علامات السوائل الحيوية حسب درجة CAP100، ملونة حسب مرحلة HD-ISS ضمن HDGE. يتم ربط الزيارات المتكررة لكل مشارك بخطوط سوداء، مع عرض الخط الأساسي كمربعات والمتابعة كدوائر. تمثل مراحل HD-ISS كما يلي: المرحلة 0 (برتقالي)، المرحلة 1 (أخضر) والمرحلة 2 (أزرق). تشير البقايا المعيارية السلبية إلى معدل تغيير أقل من المتوسط المعدل عبر المجموعات. يعرض كل مخطط صندوقي الوسيط (خط أفقي)، ونطاق الربيع (صندوق) والشعيرات الممتدة إلى IQR. تعكس أحجام العينات () النسخ البيولوجية
لكل مجموعة، مع لـ HDGE و للتحكم؛ تمثل البيانات قياسات طولية لكل مشارك. تم إجراء جميع التحليلات الإحصائية باستخدام نماذج خطية ذات تأثير مختلط مع تأثير عشوائي خاص بالمشارك، مع التحكم في العمر والجنس وتفاعلهما. كانت التركيزات المحولة إلى لوغاريتم طبيعي هي النتائج في هذه النماذج. تم تعديل المقارنات الإحصائية الثنائية الجوانب للمجموعات لمقارنات متعددة باستخدام FDR، مع تقديم قيم ودرجات الحرية وحدود الثقة في الجدول التكميلي 17. يرجى ملاحظة وجود نقطة شاذة بارزة في مجموعة التحكم مع ارتفاع ملحوظ في NfL، كما تم الإبلاغ عنه سابقًا في الخط الأساسي . لم تظهر هذه النقطة الشاذة أي سبب إضافي عند مزيد من التحقيق، مع مسح دماغي T1 MRI طبيعي وعدد خلايا CSF البيضاء والحمراء طبيعي. بالإضافة إلى ذلك، لم ينحرف هذا المشارك في مجموعة التحكم عن معلمات السوائل الحيوية أو المعرفية الأخرى، وبالتالي لم يتم استبعاده من التحليل.
الشكل 4 | آثار التوسع الجسدي. أ، التغيرات الطولية في SER-(i) مسارات SER حسب CAP100 ومرحلة HD-ISS مع تمثيل الزيارات الأساسية بالمربعات وزيارات المتابعة بالدوائر، وخطوط تربط البيانات من نفس الفرد، حيث تظهر المرحلة 0 باللون البرتقالي، والمرحلة 1 بالأخضر، والمرحلة 2 بالأزرق؛ (ii) التغيرات في SER بين الزيارات و(iii) التغيرات في SER حسب العمر وطول تكرار CAG. ب، ج، الارتباطات بين زيادة SER الطولية وتغير حجم الرأس (ب) و(ج) حجم البوتامين، (i) قبل و(ii) بعد تصحيح العمر حسب CAG.
د، هـ، الارتباطات بين SER الأساسي ومستويات CSF NfL (د) وCSF PENK (هـ)، مع (i) قبل و(ii) بعد تصحيح العمر حسب CAG. تم نمذجة الارتباطات عبر الانحدار ذو التأثيرات المختلطة باستخدام القياس على المحور العمودي كنتيجة وتم التحكم في العمر والجنس وتفاعل العمر مع الجنس. كان التغير الطولي في الرأس بناءً على قياس حدودي واحد لكل مشارك استثناءً حيث تم استخدام نموذج المربعات العادية المماثل.
المناقشة
لقد استخدمنا مقاييس متعددة الوسائط متطورة من الإدراك، والتصوير العصبي، والوراثة وعلامات السوائل الحيوية في بطارية تقييم جديدة لدراسة مجموعة فريدة من البالغين الشباب HDGE الذين كانوا في الخط الأساسي، في المتوسط، حوالي 23 عامًا قبل التشخيص السريري المتوقع للحركة، مقارنتهم مع ضوابط متطابقة بمستوى غير مسبوق من التفاصيل. حددت بياناتنا الأساسية المقطعية علامات مبكرة للتنكس العصبي على الرغم من الحفاظ على وظيفة الدماغ السليمة وهنا نقدم بيانات المتابعة لمدة 4.5 سنوات مع رؤى ميكانيكية جديدة مهمة حول ما يحرك التنكس العصبي في البشر الحاملين لطفرات HD (الشكل 6).
تسلط بياناتنا الضوء على دور طول تكرار CAG الموروث والتوسع الجسدي في التنكس العصبي، عقودًا قبل التشخيص السريري للحركة. نحدد ضمور الدماغ، وارتفاع مستويات CSF NfL، وهو علامة على تلف الخلايا العصبية، وانخفاض مستويات CSF PENK، وهو علامة على حالة MSN في العقدة، في أول مجموعة من البالغين HD التي تم دراستها حتى الآن. على الرغم من الأدلة على بدء عملية التنكس العصبي، لا يوجد أي تراجع في الوظيفة المعرفية أو الحركية أو النفسية العصبية في مراحل HD-ISS 0 و1. من الجدير بالذكر أننا نظهر أن توسع تكرار CAG الجسدي المقاس طوليًا في الدم،
قياس موثق للتوسع الجسدي في المرضى الأحياء , هو مؤشر على تأثير طول تكرار CAG على علامات العقدة للتنكس العصبي المبكر جدًا.
متسق مع المستويات المرتفعة من CSF NfL التي أبلغنا عنها في الخط الأساسي ، نظهر الآن معدلات زيادة أكبر بكثير في CSF NfL في HDGE مقارنة بالتحكم، مما يشير إلى تسارع إصابة المحاور العصبية من المراحل الأولى. والأهم من ذلك، كانت سرعة التغير في CSF NfL في مرحلة HD-ISS 0 على الأقل بنفس سرعة المرحلة 1، مما يشير إلى زيادة سريعة في إصابة المحاور العصبية حتى قبل الوصول إلى عتبة فقدان حجم الرأس أو البوتامين للمرحلة 1. من المثير للاهتمام، كانت مستويات CSF NfL المتوسطة أعلى في المتقدمين من المرحلة 0 إلى 1 مقارنةً بالغير متقدمين في كل من المرحلة 0 والمرحلة 1. كانت معدلات الزيادة السنوية في CSF NfL عبر مجموعة HDGE بأكملها (المتوسط ) أقل قليلاً من تلك المبلغ عنها في مجموعة HD-CSF السابقة (المتوسط ، وهو ما يتماشى مع كون مجموعة HD-YAS في بداية عملية التنكس العصبي.
تؤدي إصابة المحاور العصبية إلى تسرب NfL إلى CSF وترتفع في الالتهاب النشط . NfL هو علامة غير محددة على إصابة الخلايا العصبية، وقد تم الإبلاغ عن مستويات مرتفعة في حالات أخرى من
الشكل 5 | آثار بنية CAG والمتغيرات الأليلية. أ، توضيح هيكل تكرار HTT والاختلافات الأليلية في مجموعة HDGE ()، بما في ذلك الهيكل النموذجي وأربعة متغيرات غير نمطية – تكرار CAACAG (أخضر)، فقدان CAACAG (أسود، لم يُلاحظ في المجموعة)، فقدان CAACAG CCGCCA (أحمر) وفقدان CCGCCA (أزرق). ب، توضيح للاختلافات الأليلية غير النمطية لمقاييس العلامات الحيوية الرئيسية. تم التحكم في نماذج ANOCOVA لطول CAG والجنس والعمر، بما في ذلك تفاعلات العمر مع CAG والجنس. تم تضمين تأثيرات عشوائية خاصة بالمشارك باستثناء تغير الرأس بناءً على قياس حدودي واحد
لكل مشارك. (i) التأثير على تغير حجم الرأس، مع اختلافات كبيرة بين الأليلات النمطية وفقدان CAACAG CCGCCA () واتجاه مع فقدان CCGCCA . (ii) التأثير على تغير حجم البوتامين، مع اختلافات كبيرة بين الأليلات النمطية وفقدان CAACAG CCGCCA (). (iii و iv) التأثيرات المقطعية على مستويات CSF NfL (iii) وCSF PENK (iv)، على التوالي، مع ملاحظة اختلافات كبيرة لفقدان CAACAG CCGCCA. يتم الإشارة إلى المقارنات ذات الدلالة الإحصائية () بواسطة نجوم. يرجى ملاحظة عدم وجود تصوير طولي لفقدان CAACAG، وبالتالي لا يوجد مخطط في (i) أو (ii).
حالات التنكس العصبي . الزيادات في CSF NfL ليست بالضرورة ناتجة عن موت الخلايا العصبية وقد تكون نتيجة لعمليات تنكسية أخرى مثل المحاور المتسربة. ومع ذلك، فهي علامة واضحة على علم الأمراض العصبية المحورية، وبالتالي فإن فهم ديناميات CSF NfL الزمنية والحركية يمكن أن يوفر رؤى قيمة حول الآليات في الأمراض التنكسية العصبية .
في السابق، كشفت الدراسات المقطعية عن مستويات أقل من CSF PENK في HD الظاهر مقارنةً بحالات التنكس العصبي الأخرى ، وكذلك مقارنةً بـ HDGE قبل التشخيص السريري للحركة والتحكم . تعزز نتائجنا الطولية في مجموعة أكبر، وإظهارنا لارتباط كبير بين مستويات PENK وقياسات التصوير العقدي، بشكل كبير من المبررات لاستخدام PENK كعلامة بديلة لحالة MSN العقدية.
تشارك الخلايا النجمية في عمليات المرض من خلال آليات ذاتية الخلايا وغير ذاتية الخلايا ، مع دراسة رئيسية واحدة تحدد توقيعًا أساسيًا لجينات الخلايا النجمية مع تعبير متغير بواسطة mHTT في كل من البشر ونماذج الفئران . قدمت دراسة حديثة أول دليل على التغيرات التي يسببها mHTT في إنتاج السيتوكينات الالتهابية الأساسية في الميكروغليا دون تحفيز مناعي، جنبًا إلى جنب مع انخفاض في النشاط الداخلي والبلعمي في الميكروغليا الحاملة لـ mHTT في الظروف الأساسية، مما يشير إلى دور محتمل للالتهاب والنشاط الذاتي للميكروغليا في المراحل المبكرة من . يتماشى ذلك مع نتائجنا السابقة التي أظهرت ارتفاع مستويات علامة الميكروغليا CSF YKL-40 في الخط الأساسي , نحن الآن نعرض معدلات أكبر من الزيادة في YKL-40 في السائل الدماغي الشوكي على مدى الزمن في مجموعة HDGE مقارنةً بالمجموعة الضابطة. ومع ذلك، لا نلاحظ
تغييرات طويلة الأمد ملحوظة في علامات السيتوكينات المسببة للالتهابات IL-6 و IL-8، والتي هي مكونات من جهاز المناعة الفطري، ولا في GFAP، وهو بروتين خيوط وسيطة من الخلايا النجمية مرتبط بتنشيط الخلايا النجمية . من المعروف أن mHTT يتم التعبير عنه في الميكروغليا وأن تنشيط الميكروغليا يرتبط بشدة المرض لاحقًا , حيث يرتبط خلل mHTT في خلايا المناعة في الجهاز العصبي المركزي (CNS) ارتباطًا وثيقًا بالمرض . نفترض أن الارتفاع المعزول في YKL-40 قد يكون ناتجًا عن آليات ذاتية وغير ذاتية للخلايا تلعب دورًا مع التنشيط المدفوع بواسطة خلل mHTT في الخلايا النجمية، بدلاً من التغير العام في الخلايا الدبقية، والذي قد يُشير إليه أيضًا ارتفاع مصاحب في GFAP. تشير نتائجنا إلى أن خلل الخلايا النجمية أكثر وضوحًا من أي استجابة مناعية فطرية غير طبيعية في هذه المرحلة من المرض، حيث تظل مستويات IL-6 و IL-8، التي ترتفع في HD وترتبط بتقدم المرض , دون تغيير على مدى الزمن، مما يعزز أهمية العلاج المبكر في هذه المرحلة، قبل حدوث التهاب عصبي واسع النطاق.
تدعم وجود تلف عصبي داخل مرحلة HD-ISS 0 الأدلة على ارتفاع معدلات ضمور الدماغ بشكل كبير وانخفاض مستويات CSF PENK المقابلة. كما أن المتقدمين من المرحلة 0 إلى 1 كان لديهم ارتفاعات أكبر بكثير في CSF NfL مقارنةً بالغير متقدمين في المرحلة 0. تشير المعدلات الأعلى بكثير من ضمور الرأس والذيل وقياسات الدماغ العالمية وارتباطها بعبء المرض إلى أن العمليات التنكسية العصبية تحدث بالفعل عبر مجموعتنا وفي أقرب الأعمار التي تم ملاحظتها في هذه الدراسة. كان هذا الضمور قابلًا للقياس في أولئك الذين لديهم عقد قاعدية
يوفر HD-YAS أدلة حية على أن التوسع الجسدي يقود المرضية في وقت مبكر من مرحلة HD-ISS 0
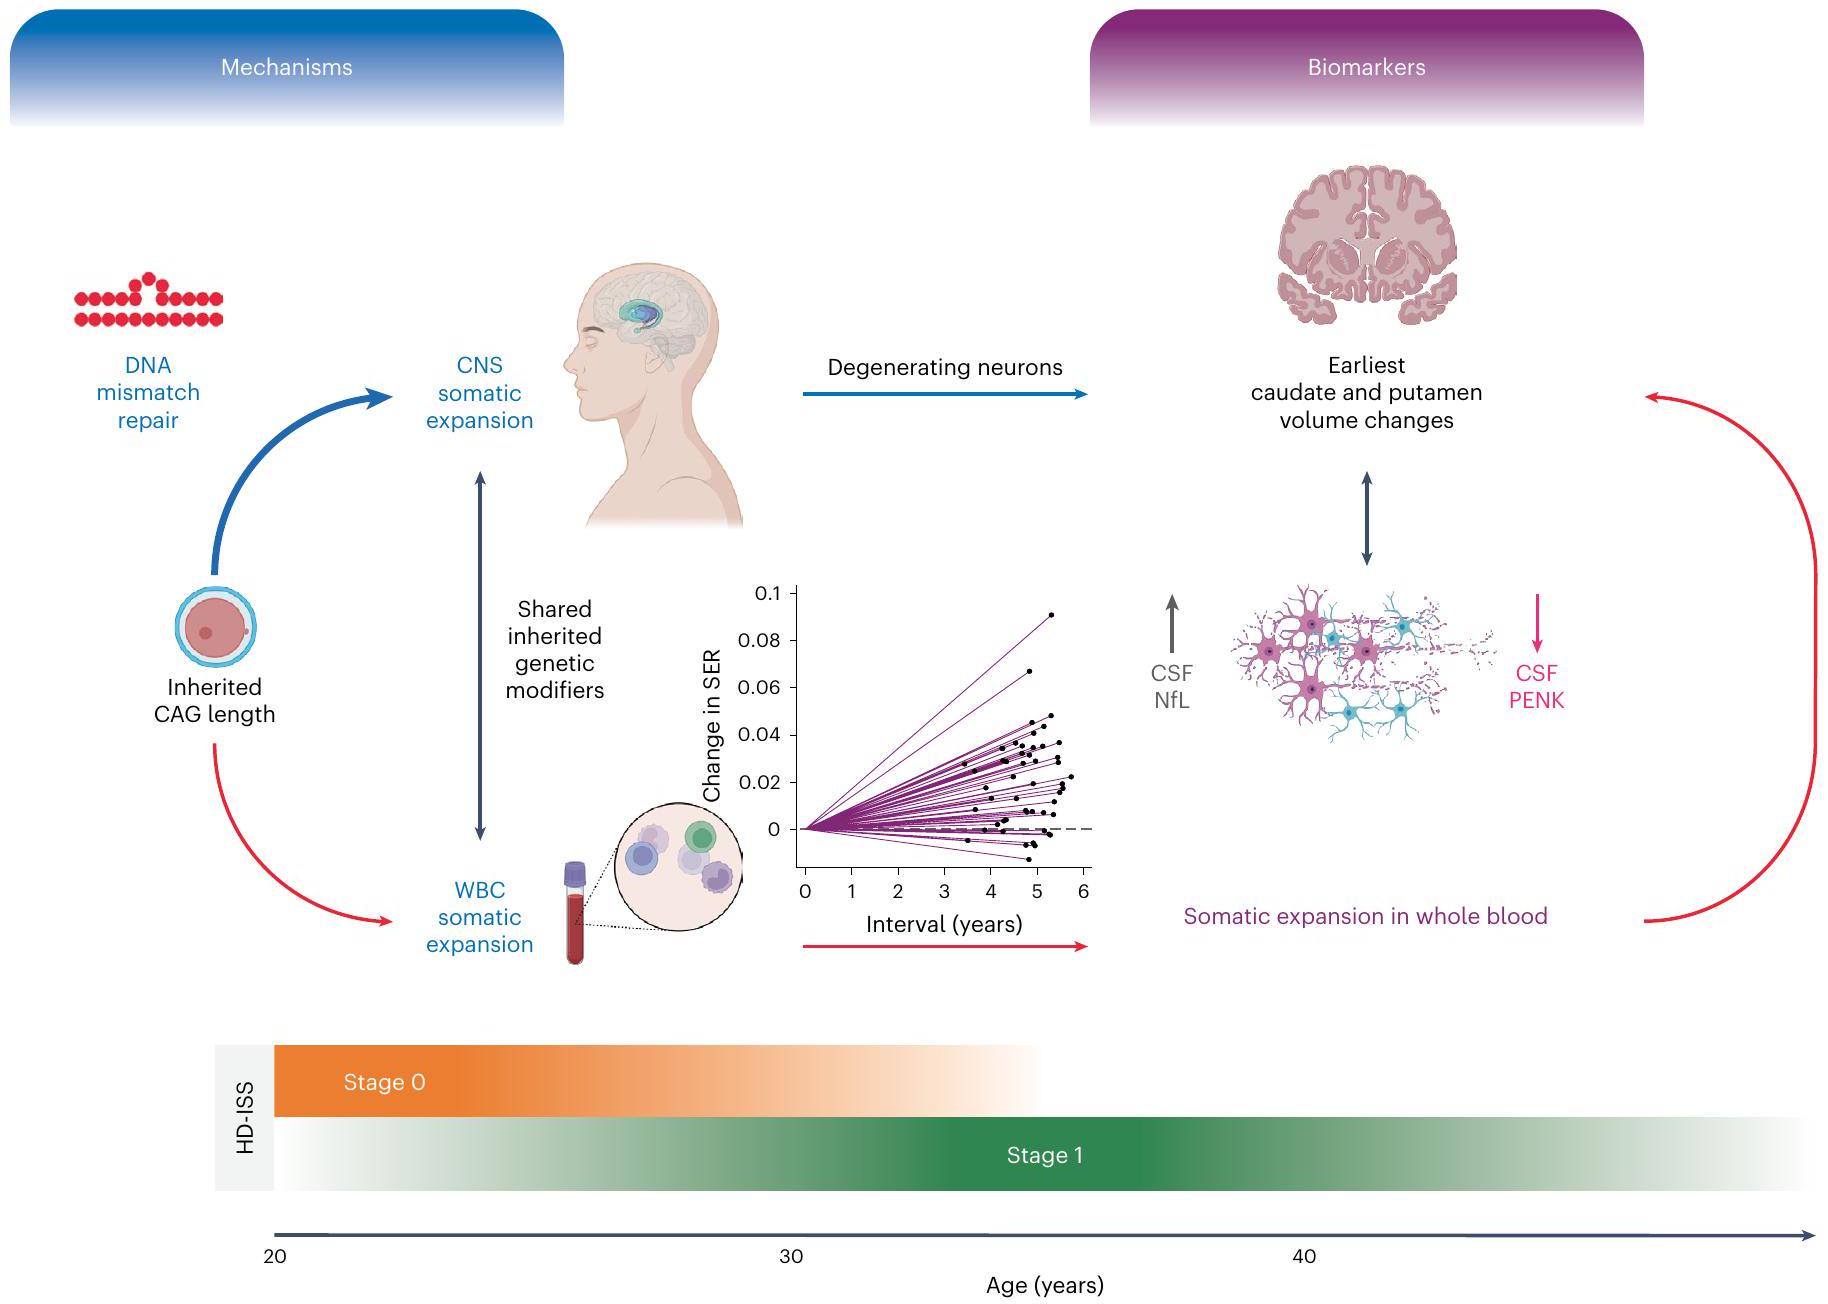
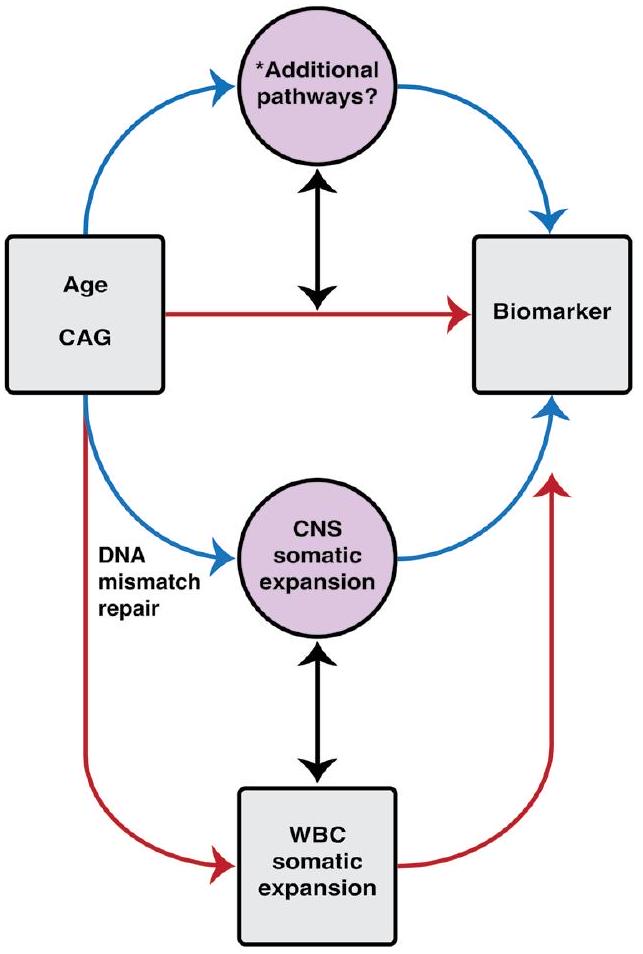
الشكل 6 | ملخص رسومي. يوضح هذا الملخص الرسومي المسارات المقترحة التي تربط التوسع الجسدي وتأثيراته على العلامات الحيوية في HD-YAS. تم تحديد طول تكرار CAG الموروث كالعامل الرئيسي في تقدم المرض في HD . تمثل الأسهم الحمراء البيانات المرتبطة الملاحظة في HD-YAS والأسهم الزرقاء تعكس العلاقات السببية المفترضة. يشير السهم الثنائي الاتجاه الأسود تحت الآليات إلى التوسع الجسدي في WBCs كبديل لتوسع CNS، بناءً على المعدلات الوراثية الموروثة المشتركة . يظهر السهم الثنائي الاتجاه الأسود تحت العلامات الحيوية الارتباطات بين ارتفاع CSF NfL (علامة تلف المحاور العصبية) وانخفاض CSF PENK (بديل لحالة MSN في العقدة) مع التغيرات الأولى في حجم الرأس والذيل. يتأثر التوسع الجسدي بطول تكرار CAG الموروث، والعمر، ومتغيرات جينات إصلاح عدم تطابق الحمض النووي . إصلاح عدم تطابق الحمض النووي، المميز في المخطط والمُظهر كأيقونة حلقة تكرار عدم التطابق، هو آلية رئيسية تربط طول تكرار CAG الموروث بالتوسع الجسدي مع زيادة نشاط الإصلاح مع
أطوال تكرار CAG الأطول . داخل CNS، يساهم التوسع الجسدي بشكل كبير في تقدم المرض، كما تدعمه الأبحاث الحديثة بعد الوفاة . بينما ستكون خزعة الدماغ هي المعيار الذهبي للتقييم المباشر لتوسع CNS الجسدي في vivo، فإن التوسع الجسدي المستمد من WBC قابل للاكتشاف بشكل محيطي، مما يظهر تغييرات مبكرة وطويلة الأمد بحلول مراحل HD-ISS 0 و 1. تُظهر قسم العلامات الحيوية الارتباطات بين التوسع الجسدي وأول تغييرات في حجم الرأس والذيل، ومستويات CSF NfL و PENK. يوضح الاستمرارية العمرية من مرحلة HD-ISS 0 إلى المرحلة 1 الكشف المبكر عن التوسع الجسدي وتغيرات العلامات الحيوية، مما يؤثر على المرضية من المرحلة 0 فصاعدًا. يوفر HD-YAS أدلة حية على أن التوسع الجسدي يقود المرضية المبكرة خلال هذه المراحل المبكرة، مما يبرز إمكانيته كهدف علاجي واعد في تجارب سريرية لإثبات المفهوم في مراحل HD-ISS 0 و 1 لإبطاء أو منع المزيد من التنكس العصبي قبل التشخيص السريري الحركي. WBC، خلايا الدم البيضاء. تم إنشاء الشكل باستخدام BioRender.com.
الأحجام موزعة عبر نطاق الحجم الملاحظ في الضوابط غير المتأثرة، مما يعني بداية التنكس العصبي القابل للاكتشاف. بالإضافة إلى هذه التغييرات التي لوحظت على المستوى الهيكلي الكلي، توفر التصوير بالانتشار أدلة على وجود تلف هيكلي دقيق في المادة البيضاء في وقت مبكر جدًا. تدعم القوة التنبؤية القوية لـ NfL الأساسي (في كل من البلازما و CSF) للضمور اللاحق في جميع مناطق الدماغ الاقتراح بأن هناك تلفًا عصبيًا مبكرًا يؤدي إلى آثار ماكروسكوبية مثل ضمور الدماغ.
على الرغم من الأدلة على التغيرات المرضية المستمرة في مجموعتنا من المراحل 0 و 1، إلا أن التنكس العصبي لم يؤثر بعد على الوظيفة القابلة للقياس حيث لم نلاحظ أي تدهور ملحوظ متعلق بالمرض في أي
من المقاييس المعرفية أو النفسية العصبية أو الوظيفية. أظهرت الأعمال السابقة أن مثل هذه التغييرات تصبح واضحة فقط من المرحلة 2 من HD-ISS (المرجع 51).
نظهر تراكم التوسع الجسدي لتكرار CAG لـ HTT في الحمض النووي في الدم مع مرور الوقت في مراحل HD-ISS 0 و 1، والأهم من ذلك، نوضح أنه مرتبط بكل من ضمور الدماغ و CSF NfL، وهو علامة على إصابة المحاور العصبية، و CSF PENK، وهو علامة بديلة لحالة MSN في العقدة. كان طول CAG الموروث الأعلى مرتبطًا بزيادة أسرع في SER مع مرور الوقت. كان SER مرتبطًا بضمور الرأس والذيل، سواء بشكل عرضي أو طولي، حتى بعد التحكم في تفاعلات العمر مع CAG. كان SER الأساسي مرتبطًا بقوة بمستويات CSF NfL و CSF PENK العرضية قبل
تصحيح العمر مع CAG؛ ومع ذلك، لم تظل هذه الارتباطات ذات دلالة بعد التصحيح. نفترض أن قياسات التحليل الحيوي تظهر تباينًا وضوضاء أعلى مقارنةً بقياسات حجم العقدة. لذلك، فإن عدم وجود دلالة في الارتباطات مع CSF NfL و PENK لا يقلل من الارتباط الكبير بين الزيادة الطولية في SER والتغيرات الحجمية في الرأس والذيل. بالإضافة إلى ذلك، تم إضعاف القوة الإحصائية لتأثير طول CAG على الضمور في النماذج التي تتحكم أيضًا في SER في الدم. بافتراض أنه، من خلال تأثيرات طول CAG الأساسي المشترك والمعدلات الوراثية المشتركة، فإن SER المقاس في الدم هو مؤشر كمي غير مباشر للتوسع الجسدي الأكبر الذي يحدث في الخلايا العصبية، يمكن اعتبار هذه النتائج كأدلة حية على الدور الرئيسي لتوسع تكرار CAG الجسدي في مرض HD المبكر جدًا في البشر (الشكل 4 من البيانات الموسعة)، مما يعزز الدور المرضي المفترض للتوسع الجسدي كعامل حاسم في تقدم المرض .
إذا كانت الاقتراحات الأخيرة من أدمغة HD بعد الوفاة تشير إلى أن التوسع الجسدي غير المتزامن يؤدي إلى عبور غير متزامن لعتبة خلل النسخ ووفاة عصبية غير متزامنة صحيحة، فإن بياناتنا ستدعم الفرضية القائلة بأن التوسع الجسدي هو بالفعل عملية نشطة في الدماغ وأن بعض الخلايا العصبية قد عبرت بالفعل عتبة طول التكرار الحرجة سنوات قبل التشخيص السريري الحركي. في الواقع، هذه الظاهرة متوقعة من النماذج العشوائية ومتسقة مع ملاحظات التشريح المبكر لفقدان الخلايا العصبية . وهذا قد يشير إلى أن قمع توسع تكرار CAG الجسدي من هذه النقطة في عملية المرض يمكن أن يمنع خلايا عصبية إضافية من عبور عتبة السمية العصبية ويقلل من التنكس العصبي قبل ظهور العجز الوظيفي. تظهر العوامل العلاجية المستهدفة بروتينات إصلاح الحمض النووي التي تعدل التوسع الجسدي إمكانيات كبيرة، مع MSH3 كهدف جذاب بشكل خاص لـ HD وغيرها من اضطرابات التوسع التكراري , وتحت التطوير حاليًا العديد من العلاجات المستهدفة لـ MSH3 . لهذا الغرض، يمكن أن يكون التوسع الجسدي لتكرارات CAG في الحمض النووي في الدم علامة حيوية مفيدة لإظهار التفاعل المستهدف للعلاجات المثبطة للتوسع الجسدي مع التعرض المحيطي.
داخل مجموعتنا، كان عدد قليل من الأفراد يحملون فقدان تسلسل غير نمطي CCGCCA أو CAACAG CCGCCAالأليلات. هذه الهياكل غير النمطية لديها قدرة عالية على التسبب في تقدير خاطئ لطول تكرار CAG، واستخدام أطوال CAG المستمدة من MiSeq غيرت متوسط سنوات الخط الأساسي للتشخيص السريري الحركي في HD-YAS من 24 إلى 23 عامًا. بعد تصحيح طول CAG النقي، تم ربط هذه الهياكل سابقًا بتشخيص حركي سريري مبكر . يتماشى مع ذلك، نجد أن المشاركين الذين لديهم فقدان هياكل التسلسل المتداخل يظهرون معدلات أعلى من ضمور الرأس والذيل، ولديهم بعض من أكبر الارتفاعات في CSF NfL وانخفاضات في CSF PENK، مما يشير معًا إلى تسريع العملية التنكسية (الشكل 5ب). إن اكتشاف هذه التأثيرات في أعداد صغيرة جدًا في وقت مبكر من مسار المرض يشير إلى أن هذه الاختلافات الهيكلية في الحمض النووي لها تأثير كبير على معدل التغيرات العصبية المرضية. من المثير للاهتمام، بعد تصحيح طول CAG النقي لم يكن هناك ارتباط متبقي بين هذه المتغيرات الهيكلية للأليلات وSER. هذا يتماشى مع الأعمال السابقة في مجموعات أخرى في الدم، والأدمغة بعد الوفاة وخطوط الخلايا التي تظهر أن فقدان CAACAG CCGCCA المتداخل لا يزيد من معدل توسع CAG فوق تأثيرات طول CAG النقي. البيانات المتاحة ذات الصلة عن الدماغ محدودة لذا لا يزال من الممكن أن يؤدي فقدان CAACAG CCGCCA إلى زيادة توسعات CAG في الدماغ ولكن ليس في الدم. فرضية بديلة هي أنه، بعد تصحيح طول CAG النقي، فإن آلية تعديل المرض المتبقية لفقدان CAACAG CCGCCA مستقلة عن التوسع الجسدي لتكرار HTT عبر تأثيرات على نسخ RNA، استقرار RNA، أو ترجمة غير ATG المرتبطة بالتكرار أو الكلاسيكية (الشكل الممتد 3). بغض النظر، فإن هذه المتغيرات لها تأثير عميق على مسار المرض.
هذا العمل لا يوفر فقط أدلة لدعم إمكانية العلاجات التي تستهدف التوسع الجسدي ولكن أيضًا يحدد علامات قوية لتقدم المرض، والتي قد تكون لها فائدة كبدائل محتملة للتجارب السريرية الوقائية المستقبلية. يمكن أن يكون لمستويات CSF NfL وPENK وقياسات ضمور الدماغ القدرة على مراقبة تقدم المرض في مراحل HD-ISS 0 و1، حيث لا تنطبق النقاط النهائية السريرية. تم استخدام تغيير مستوى CSF NfL سابقًا كمقياس للنتائج لتجربة ASO نوسينيرسن في الأطفال المصابين بالضمور العضلي الشوكي. كان بدء العلاج في وقت مبكر مرتبطًا أيضًا بانخفاض أكبر في مستويات CSF NfL، مما يبرز أهمية التدخل المبكر للحفاظ على صحة الخلايا العصبية.
في هذه المرحلة من المرض، كانت مستويات CSF mHTT منخفضة جدًا، مع وجود فقط من العينات في مجموعة HDGE تتجاوز مستوى الكشف. تؤكد هذه النتائج على قيود اختبارات CSF mHTT المتاحة وتؤكد الحاجة الملحة لاختبار موثوق قادر على اكتشاف تركيزات منخفضة جدًا من mHTT في HDGE، ويفضل أن تكون عند مستويات أتمولارية، إذا كان من المقرر متابعة العلاجات المخفضة لـ HTT في مجموعات HDGE في المرحلة 0 و1.
قد يسمح لنا التوصيف الظاهري الشامل لمراحل HD-ISS 0 و1 بتعزيز التوظيف للتجارب الوقائية المستقبلية. على سبيل المثال، نوضح أن مستويات NfL وPENK الأساسية تتنبأ بالضمور الدماغي اللاحق، وأن إمكانية تحديد الحدود لتعزيز HD-ISS المرحلة 0 بناءً على هذه السوائل الحيوية تحمل وعدًا كبيرًا. سيساعد توحيد HD-YAS مع المجموعات الموجودة عبر طيف المرض مثل HD-CSF وHDClarity (ClinicalTrials.gov: NCT02855476) في إنشاء حدود موثوقة للإدراج. اعتبار آخر مهم في تصميم التجارب السريرية هو أن الهياكل التكرارية غير النمطية، على الرغم من ندرتها، تؤثر بشكل كبير على تقدم المرض وقد تؤثر أيضًا على فعالية العلاج. سيكون تحديد هذه الحالات النادرة من خلال MiSeq مهمًا للسيطرة على هذه التأثيرات وتقييم فعالية العلاج بدقة أكبر.
إذا كانت هذه العلامات الحيوية يمكن أن تعمل كنتائج بديلة محتملة، فإن حسابات حجم العينة تشير إلى أرقام قابلة للتطبيق للتجارب السريرية في مجموعة HD-ISS المرحلة 0/1 نظرًا لتأثيرات العلاج الكبيرة بما فيه الكفاية. على سبيل المثال، في تجربة سريرية على مدى 3 سنوات مع تأثير علاجي، سيكون مطلوبًا 104 مشاركًا مع CSF NfL كمقياس للنتائج، مع 126 للضمور في الرأس و146 للضمور في الذيل. من الجدير بالذكر أن مقياس تغيير حدود الرأس الذي نستخدمه هنا قد تم التحقق منه بالفعل بشكل جيد وقد تم استخدامه سابقًا في تجربة لاكوينيمود في HDGE مع تشخيص حركي سريري.
باختصار، تدعم النتائج المقدمة بقوة الفرضيات التي تفيد بأن التوسع الجسدي المحدد فرديًا في الحمض النووي في الدم يتنبأ بالتوسع الجسدي المحدد فرديًا في الدماغ. نوضح في المشاركين الأحياء، قبل عقود من التشخيص الحركي السريري، أن التوسع الجسدي لتكرار CAG يبدو أنه محرك مهم لأوائل العمليات المرضية، كما يتضح من ارتباطه بمعدلات ضمور العقدة ومعدلات CSF NfL وPENK. من المحتمل أن يكون التوسع الجسدي للتكرارات التي تكمن وراء مسببات المرض ذا صلة بالعديد من أمراض التوسع التكراري، حيث قد تلعب آليات إصلاح الحمض النووي المماثلة دورًا. مع تطوير علاجات جديدة تستهدف بروتينات إصلاح الحمض النووي المعروفة بتأثيرها على التوسع الجسدي، فإن نتائجنا تتزامن مع إظهار ارتباطها بعلامات مرضية قابلة للقياس. من خلال التدخل بالعلاجات التي تستهدف توسع تكرار CAG الجسدي في بداية العملية التنكسية، أي، مراحل HD-ISS 0 و1 قبل عقود من التشخيص الحركي السريري، بينما تظل الوظيفة سليمة، هناك احتمال حقيقي بأن العلاجات يمكن أن تؤخر أو حتى تمنع ظهور العلامات السريرية. لهذا الغرض، حددنا مقاييس قوية للمرض المبكر مع إمكانية العمل كبدائل محتملة لعلامات تقدم المرض، وحددنا المجموعة المثالية للتدخل لتأخير أو منع التشخيص الحركي السريري.
المحتوى عبر الإنترنت
أي طرق، مراجع إضافية، ملخصات تقارير Nature Portfolio، بيانات المصدر، بيانات موسعة، معلومات إضافية،
الشكر، معلومات مراجعة الأقران؛ تفاصيل مساهمات المؤلفين والمصالح المتنافسة؛ وبيانات وتوافر الشيفرة متاحة علىhttps://doi.org/10.1038/s41591-024-03424-6.
References
Vonsattel, J. P. et al. Neuropathological classification of Huntington’s disease. J. Neuropathol. Exp. Neurol. 44, 559-577 (1985).
Tabrizi, S. J. et al. Potential disease-modifying therapies for Huntington’s disease: lessons learned and future opportunities. Lancet Neurol. 21, 645-658 (2022).
Lee, J.-M. et al. CAG repeat expansion in Huntington disease determines age at onset in a fully dominant fashion. Neurology 78, 690-695 (2012).
Monckton, D. G. The contribution of somatic expansion of the CAG repeat to symptomatic development in Huntington’s disease: a historical perspective. J. Huntingtons Dis. 10, 7-33 (2021).
Kennedy, L. et al. Dramatic tissue-specific mutation length increases are an early molecular event in Huntington disease pathogenesis. Hum. Mol. Genet. 12, 3359-3367 (2003).
Shelbourne, P. F. et al. Triplet repeat mutation length gains correlate with cell-type specific vulnerability in Huntington disease brain. Hum. Mol. Genet. 16, 1133-1142 (2007).
Mätlik, K. et al. Cell-type-specific CAG repeat expansions and toxicity of mutant Huntingtin in human striatum and cerebellum. Nat. Genet. 56, 383-394 (2024).
Handsaker, R. E. et al. Long somatic DNA-repeat expansion drives neurodegeneration in Huntington disease. Preprint at bioRxiv https://doi.org/10.1101/2024.05.17.592722 (2024).
Swami, M. et al. Somatic expansion of the Huntington’s disease CAG repeat in the brain is associated with an earlier age of disease onset. Hum. Mol. Genet. 18, 3039-3047 (2009).
Kaplan, S., Itzkovitz, S. & Shapiro, E. A universal mechanism ties genotype to phenotype in trinucleotide diseases. PLoS Comput. Biol. 3, e235 (2007).
Donaldson, J. et al. What is the pathogenic CAG expansion length in Huntington’s disease? J. Huntingtons Dis. 10, 175-202 (2021).
Hong, E. P. et al. Huntington’s disease pathogenesis: two sequential components. J. Huntingtons Dis. 10, 35-51 (2021).
Genetic Modifiers of Huntington’s Disease (GeM-HD) Consortium. CAG repeat not polyglutamine length determines timing of Huntington’s disease onset. Cell 178, 887-900.e14 (2019).
Ciosi, M. et al. A genetic association study of glutamine-encoding DNA sequence structures, somatic CAG expansion, and DNA repair gene variants, with Huntington disease clinical outcomes. EBioMedicine 48, 568-580 (2019).
Moss, D. J. H. et al. Identification of genetic variants associated with Huntington’s disease progression: a genome-wide association study. Lancet Neurol. 16, 701-711 (2017).
Rajagopal, S. et al. Genetic modifiers of repeat expansion disorders. Emerg. Top. Life Sci. 7, 325-337 (2023).
Genetic Modifiers of Huntington’s Disease (GeM-HD) Consortium & Lee, J.-M. et al. Genetic modifiers of somatic expansion and clinical phenotypes in Huntington’s disease reveal shared and tissue-specific effects. Preprint at bioRxiv https://doi. org/10.1101/2024.06.10.597797 (2024).
Wright, G. E. B. et al. Length of uninterrupted CAG, independent of polyglutamine size, results in increased somatic instability, hastening onset of Huntington disease. Am. J. Hum. Genet. 104, 1116-1126 (2019).
Dawson, J. et al. A probable cis-acting genetic modifier of Huntington disease frequent in individuals with African ancestry. HGG Adv. 3, 100130 (2022).
Tabrizi, S. J. et al. Targeting huntingtin expression in patients with Huntington’s disease. N. Engl. J. Med. 380, 2307-2316 (2019).
McColgan, P. et al. Tominersen in adults with manifest Huntington’s disease. N. Engl. J. Med. 389, 2203-2205 (2023).
Estevez-Fraga, C., Tabrizi, S. J. & Wild, E. J. Huntington’s disease clinical trials corner: March 2024. J. Huntingtons Dis. 13, 1-14 (2024).
Paulsen, J. S. et al. Detection of Huntington’s disease decades before diagnosis: the predict-HD study. J. Neurol. Neurosurg. Psychiatry 79, 874-880 (2008).
Tabrizi, S. J. et al. Potential endpoints for clinical trials in premanifest and early Huntington’s disease in the TRACK-HD study: analysis of 24 month observational data. Lancet Neurol. 11, 42-53 (2012).
Scahill, R. I. et al. Biological and clinical characteristics of gene carriers far from predicted onset in the Huntington’s disease Young Adult Study (HD-YAS): a cross-sectional analysis. Lancet Neurol. 19, 502-512 (2020).
Tabrizi, S. J. et al. A biological classification of Huntington’s disease: the Integrated Staging System. Lancet Neurol. 21, 632-644 (2022).
Rodrigues, F. B. Mutant huntingtin and neurofilament light have distinct longitudinal dynamics in Huntington’s disease. Sci. Transl. Med. 12, eabc2888 (2020).
Shaw, G. et al. Hyperphosphorylated neurofilament NF-H is a serum biomarker of axonal injury. Biochem. Biophys. Res. Commun. 336, 1268-1277 (2005).
Paterson, R. W. et al. SILK studies-capturing the turnover of proteins linked to neurodegenerative diseases. Nat. Rev. Neurol. 15, 419-427 (2019).
Khalil, M. et al. Neurofilaments as biomarkers in neurological disorders. Nat. Rev. Neurol. 14, 577-589 (2018).
Zetterberg, H. et al. Neurochemical aftermath of amateur boxing. Arch. Neurol. 63, 1277-1280 (2006).
Sjögren, M. et al. Cytoskeleton proteins in CSF distinguish frontotemporal dementia from AD. Neurology 54, 1960-1964 (2000).
Hall, S. et al. Accuracy of a panel of 5 cerebrospinal fluid biomarkers in the differential diagnosis of patients with dementia and/or parkinsonian disorders. Arch. Neurol. 69, 1445-1452 (2012).
Delaby, C. et al. Differential levels of neurofilament light protein in cerebrospinal fluid in patients with a wide range of neurodegenerative disorders. Sci. Rep. 10, 9161 (2020).
Bech, S. et al. Amyloid-related biomarkers and axonal damage proteins in parkinsonian syndromes. Parkinsonism Relat. Disord. 18, 69-72 (2012).
Feneberg, E. et al. Multicenter evaluation of neurofilaments in early symptom onset amyotrophic lateral sclerosis. Neurology 90, e22-e30 (2018).
Abdo, W. F. et al. CSF neurofilament light chain and tau differentiate multiple system atrophy from Parkinson’s disease. Neurobiol. Aging 28, 742-747 (2007).
Dhiman, K. et al. Cerebrospinal fluid neurofilament light concentration predicts brain atrophy and cognition in Alzheimer’s disease. Alzheimers Dement. 12, e12005 (2020).
Vrillon, A. et al. Comparison of CSF and plasma NfL and pNfH for Alzheimer’s disease diagnosis: a memory clinic study. J. Neurol. 271, 1297-1310 (2024).
Barschke, P. et al. Cerebrospinal fluid levels of proenkephalin and prodynorphin are differentially altered in Huntington’s and Parkinson’s disease. J. Neurol. 269, 5136-5143 (2022).
Niemela, V. et al. Proenkephalin decreases in cerebrospinal fluid with symptom progression of Huntington’s disease. Mov. Disord. 36, 481-491 (2021).
Caron, N. S. et al. Cerebrospinal fluid biomarkers for assessing Huntington disease onset and severity. Brain Commun. 4, fcac309 (2022).
Ilieva, H., Polymenidou, M. & Cleveland, D. W. Non-cell autonomous toxicity in neurodegenerative disorders: ALS and beyond. J. Cell Biol. 187, 761-772 (2009).
Diaz-Castro, B. et al. Astrocyte molecular signatures in Huntington’s disease. Sci. Transl. Med. 11, eaaw8546 (2019).
Stöberl, N. et al. Mutant huntingtin confers cell-autonomous phenotypes on Huntington’s disease iPSC-derived microglia. Sci. Rep. 13, 20477 (2023).
Von Bartheld, C. S., Bahney, J. & Herculano-Houzel, S. The search for true numbers of neurons and glial cells in the human brain: a review of 150 years of cell counting. J. Comp. Neurol. 524, 3865-3895 (2016).
Shin, J.-Y. et al. Expression of mutant huntingtin in glial cells contributes to neuronal excitotoxicity. J. Cell Biol. 171, 1001-1012 (2005).
Pavese, N. et al. Microglial activation correlates with severity in Huntington disease: a clinical and PET study. Neurology 66, 1638-1643 (2006).
Björkqvist, M. et al. A novel pathogenic pathway of immune activation detectable before clinical onset in Huntington’s disease. J. Exp. Med. 205, 1869-1877 (2008).
Wild, E., Björkqvist, M. & Tabrizi, S. J. Immune markers for Huntington’s disease? Expert Rev. Neurother. 8, 1779-1781 (2008).
Tabrizi, S. J. et al. Biological and clinical changes in premanifest and early stage Huntington’s disease in the TRACK-HD study: the 12-month longitudinal analysis. Lancet Neurol. 10, 31-42 (2011).
Flower, M. et al. MSH3 modifies somatic instability and disease severity in Huntington’s and myotonic dystrophy type 1. Brain 142, 1876-1886 (2019).
Benn, C. L., Gibson, K. R. & Reynolds, D. S. Drugging DNA damage repair pathways for trinucleotide repeat expansion diseases.
J. Huntingtons Dis. 10, 203-220 (2021).
O’Reilly, D. et al. Di-valent siRNA-mediated silencing of MSH3 blocks somatic repeat expansion in mouse models of Huntington’s disease. Mol. Ther. 31, 1661-1674 (2023).
Olsson, B. et al. NFL is a marker of treatment response in children with SMA treated with nusinersen. J. Neurol. 266, 2129-2136 (2019).
Reilmann, R. et al. Safety and efficacy of laquinimod for Huntington’s disease (LEGATO-HD): a multicentre, randomised, double-blind, placebo-controlled, phase 2 study. Lancet Neurol. 23, 243-255 (2024).
Bates, G. P. et al. Huntington disease. Nat. Rev. Dis. Primers 1, 15005 (2015).
Ferguson, R. et al. Therapeutic validation of MMR-associated genetic modifiers in a human ex vivo model of Huntington disease. Am. J. Hum. Genet. 111, 1165-1183 (2024).
Publisher’s note Springer Nature remains neutral with regard to jurisdictional claims in published maps and institutional affiliations.
Open Access This article is licensed under a Creative Commons Attribution 4.0 International License, which permits use, sharing, adaptation, distribution and reproduction in any medium or format, as long as you give appropriate credit to the original author(s) and the source, provide a link to the Creative Commons licence, and indicate if changes were made. The images or other third party material in this article are included in the article’s Creative Commons licence, unless indicated otherwise in a credit line to the material. If material is not included in the article’s Creative Commons licence and your intended use is not permitted by statutory regulation or exceeds the permitted use, you will need to obtain permission directly from the copyright holder. To view a copy of this licence, visit http://creativecommons. org/licenses/by/4.0/.
(c) The Author(s) 2025
تم تجنيد المشاركين عبر المملكة المتحدة وتم تسجيلهم في موقع دراسة واحد (جامعة كوليدج لندن (UCL)). تم تفصيل معايير الإدراج في الطرق الإضافية. حضر المشاركون (131 في المجموع، 64 HDGE و67 ضوابط) في البداية وعاد 103 (57 HDGE و46 ضوابط) للمتابعة بعد حوالي 4.5 سنوات.
تم تسجيل الدراسة علىClinicalTrials.gov (NCT06391619) حيث تم توفير بروتوكول الدراسة وخطة التحليل الإحصائي المحددة مسبقًا. خضع جميع المشاركين لتقييم شامل لوظائفهم السريرية والمعرفية والنفسية العصبية، والتصوير العصبي، وأخذ عينات الدم، وجمع CSF الاختياري بما يتماشى مع إجراء الأساس (الطرق الإضافية). انظر الجدول الممتد 6 لقائمة التقييمات والجدول الإضافي 5 للبيانات المفقودة. توفر الطرق الإضافية مزيدًا من التفاصيل لجميع التقييمات.
الأخلاقيات
حصلت الدراسة على موافقة لجنة الأخلاقيات البحثية في لندن-بلومزبري (22/LO/0058). التزمت جميع إجراءات الدراسة بالمبادئ الموضحة في إعلان هلسنكي، وقبل التسجيل، تم الحصول على موافقة خطية من جميع المشاركين.
التقييمات السريرية والمعرفية والنفسية العصبية
تم إجراء فحص سريري بما في ذلك تقييم ملاءمة البزل القطني.
تم تصنيف جميع المشاركين في HDGE الذين خضعوا للتصوير العصبي الطولي ( ) وفقًا لمراحل HD-ISS في كل زيارة. تم استخدام خط أنابيب الطول الموجي FreeSurfer الإصدار 6 (https://surfer.nmr.mgh.harvard. edu/pub/dist/freesurfer/) تم استخدامه لاشتقاق تقسيمات الرأس والذيل لتصنيف المراحل 0 و 1 ، وتم تعريف المرحلة 2 من خلال وصول المشاركين إلى الحدود المعدلة حسب العمر والتعليم لاختبار رموز الأرقام الرمزية و/أو الدرجة الإجمالية للحركة. بالإضافة إلى ذلك، تم ربط السنوات المتوقعة للتشخيص السريري الحركي بالدرجة القياسية لمنتج CAG-Age (CAP). تحدث درجة CAP بقيمة 100 عند العمر المتوقع المحدد لتشخيص الحركة وفقًا لـ CAG .
تم تكرار جميع المهام المعرفية والنفسية العصبية من الأساس في المتابعة مع استثناءين. بناءً على ملاحظات المشاركين، استبدلنا مهمة النسبة التقدمية من الأساس بمهمة تقييم الأهداف في المتابعة لتقييم المجال التحفيزي. بالإضافة إلى ذلك، تم تضمين تداخل ستروب ضمن المهام المعرفية الأساسية في المتابعة. انظر الطرق التكميلية والأشكال التكميلية 3-5 للحصول على تفاصيل عن بطارية الاختبارات المعرفية والنفسية العصبية.
تصوير الأعصاب
تم إجراء المسح على جهاز 3T Siemens Prisma (Siemens Healthineers، إيرلانغن، ألمانيا) وكانت المعلمات متسقة بين الأساس والمتابعة بعد 4.5 سنوات. شملت تقييمات تصوير الأعصاب التصوير بالرنين المغناطيسي T1 وزمن الانتشار (DWI) و MPM. قمنا بتطبيق نفس المناطق المحددة مسبقًا (ROI) التي تم فحصها في الأساس. تم استخراج الأحجام من صور T1W وتم اشتقاق القيم المتوسطة عبر ROI ذات الصلة لـ (1) قياسات DWI القياسية وقياسات كثافة توجيه الأعصاب وتشتتها (NODDI) , (2) الاتصال الهيكلي (للمشاركين ذوي اليد اليمنى فقط) و (3) MPMs.
تم اشتقاق التغيرات التصويرية الطولية عن طريق طرح القيم، باستثناء القياسات المباشرة للتغير لبعض ROIs الحجمية. يعتبر التكامل الناتج عن تغيير الحدود مقياسًا مباشرًا للتغير بين الصور المتسلسلة المتطابقة موضعيًا (المسجلة)، وهو أكثر حساسية للتغير الطولي من الطرح . تم استخدام هذه التقنية للدماغ بالكامل، والبطينات والرأس والذيل . تم اشتقاق خرائط ضغط الفوكسل داخل المشاركين وتم دمجها مع خرائط المادة الرمادية والبيضاء التي تم إنشاؤها بواسطة قياس الشكل القائم على الفوكسل لتقدير تغير الحجم داخل هذه الأنسجة.
تفاصيل معالجة الانتشار، الاتصال الهيكلي وعمليات MPM متاحة في الطرق التكميلية والشكل التكميلية 6.
السوائل الحيوية
تم جمع السوائل الحيوية في الأساس والمتابعة تحت نفس الظروف والمعايير والمعدات القياسية والمثبتة جيدًا . لإزالة التأثيرات المحتملة للدفعة، تم إعادة تحليل عينات السوائل الحيوية التي تم جمعها في الأساس بالتوازي مع عينات المتابعة، باستخدام الاختبارات المفصلة في الجدول التكميلية 19. تم إجراء قياس المواد التحليلية بشكل أعمى لحالة المجموعة.
شملت القياسات في السائل الدماغي الشوكي mHTT، بروتين NfL، التاو الكلي (التاو)، GFAP، UCH-L1، YKL-40 (المعروف أيضًا باسم بروتين شيتيناز-3 مثل-بروتين-1 (CHI3L1))، IL-6 و IL-8. في البلازما، تم قياس NfL، التاو، GFAP و UCH-L1. تم قياس Neurology 4-Plex A (GFAP، NfL، Tau و UCH-L1) في عينة واحدة، مما أسفر عن معاملات التباين بين الألواح التالية (%CV): CSF GFAP (3.7%)، CSF NfL (8.2%)، CSF Tau (11.1%)، CSF UCH-L1 ( )، البلازما GFAP ( )، البلازما NfL ( )، البلازما Tau (11.1%) و البلازما UCH-L1 (63.8%). تم حساب %CVs من قياسات مكررة للضوابط الداخلية للألواح المكونة من بلازما بشرية مجمعة. تم قياس CSF IL-6، IL-8 و YKL-40 في مكررات، مع %CVs التالية: CSF YKL-40 (10.4%)، CSF IL-6 (29.2%) و CSF IL-8 . تم قياس CSF mHTT في ثلاث مكررات وتم قياس الوفرة النسبية لـ CSF PENK في قياسات فردية.
تم إجراء تحليل البروتيوميات القائم على الكروماتوغرافيا السائلة-مطياف الكتلة (LC-MS) غير المتحيز باستخدام تقنية علامة الكتلة المزدوجة (TMT) لقياس الوفرة النسبية لـ CSF PENK. تم إعداد عينات CSF بما في ذلك خطوة إزالة متعددة الجوانب الأولية لتقليل التداخل بواسطة البروتينات المشتقة من الدم ذات الوفرة العالية (الطرق التكميلية). بعد هذه الخطوة، تم إخضاع العينات للتقليل والقلوية لمخلفات السيستين، والهضم باستخدام التربسين وإنزيم البروتينات الداخلية Lys-C ووضع علامات إيزوبارية باستخدام مواد TMTpro 18-plex (Thermo Fisher Scientific). تم تقسيم عينات الببتيد المتعددة TMT بواسطة الكروماتوغرافيا السائلة عالية الأداء ذات الطور العكسي عالية الحموضة (HPLC) , وتم تحليلها بواسطة nano-HPLC (EasyLC، Thermo Fisher Scientific) متصلة بمطياف الكتلة الهجين Orbitrap عالي الدقة (Orbitrap Lumos Tribrid، Thermo Fisher Scientific). تم إجراء تحديد البروتين ومعالجة البيانات للقياس باستخدام Proteome Discoverer 2.5 (Thermo Fisher Scientific) و R Statistics. مزيد من التفاصيل متاحة في الطرق التكميلية.
هيكل تكرار HTTCAG والتوسع الجسدي
تم استخراج الحمض النووي من الدم الكامل باستخدام جهاز chemagic 360-D (Perkin Elmer) لاستخراج الحمض النووي الآلي. تم تحديد الطول النموذجي لتكرار HTTCAG النقي، هيكل تكرار HTT وكمية التوسعات الجسدية لـ HTT في مجموعة HDGE بواسطة تسلسل MiSeq العميق للغاية . تم معالجة قراءات HTT MiSeq وتصنيفها باستخدام ScaleHD (v1 (مرجع 14)) و RGT (https://github.com/hossam26644/RGT). تم قياس SER لتكرار CAG لـ HTT من بيانات MiSeq في الأساس والمتابعة، مما يسمح بالتقييم الطولي لتغيرات التوسع الجسدي خلال الفترة بين الزيارتين. تم استخدام طول تكرار CAG المقدر باستخدام MiSeq لجميع التحليلات الإحصائية للعلاقات.
نماذج وساطة التوسع الجسدي
داخل مجموعة HDGE، قمنا بتقدير العلاقات الإحصائية بين نسب التوسع الجسدي لخلايا الدم البيضاء (WBC) مع NfL، PENK ومع قياسات الدماغ الحجمية. تم إجراء التحليلات مع وبدون تصحيح للعمر، CAG وتفاعل العمر مع CAG. كما تحكمت النماذج في العمر، الجنس وتفاعل العمر مع الجنس كمتغيرات. قمنا بنمذجة العلاقات العرضية بين SER وعلامات البيوماركر عبر الانحدار العشوائي كما تم وصفه سابقًا. قمنا بتقدير العلاقات بين SER في الأساس والتغير الطولي في SER مقابل التغير الطولي في علامات البيوماركر باستخدام الانحدار العادي كما تم وصفه أعلاه لنماذج معدلات التغير المباشر الحجمية الأخرى. بالنسبة لـ NfL وأحجام الرأس والذيل، قمنا بحساب معدلات التغير عن طريق طرح القيم من الأساس إلى المتابعة.
لتقييم الآثار السببية المحتملة لعلاقات SER-علامة البيوماركر، قمنا بمقارنة القوة الإحصائية لـ SER كمتنبئ لـ
علامة البيوماركر قبل وبعد التحكم في العمر وطول CAG (يوضح الشكل التمديدي 4 مخططًا للتفكير السببي الأساسي). ستشير علاقة SER الضعيفة بشكل كبير بعد التحكم في العمر وCAG إلى أن العلاقات قد تكون بسبب التأثير المتبادل لطول CAG بمرور الوقت دون سببية أكثر مباشرة. على العكس، قمنا بتقييم قوة علاقات العمر-CAG مقابل علامات البيوماركر مع وبدون التحكم في SER. تشير العلاقات الضعيفة بين العمر-CAG مع علامة البيوماركر في وجود تأثير SER تنبؤي كبير على علامة البيوماركر وعلاقة كبيرة بين العمر-CAG مع SER إلى دور سببي وسيط لتوسع CNS الجسدي (كما تم تقييمه بشكل غير مباشر بواسطة SER في الحمض النووي لخلايا الدم البيضاء). هذه المقارنات الإحصائية هي جوهر التقييمات الإحصائية للسببية المحتملة في النماذج السببية الرسمية. في الحالة البسيطة والعرضية، غالبًا ما يتم التعبير عن درجة الوساطة من خلال الانخفاض النسبي في معامل الارتباط أو معامل الانحدار المعدل لمتغير بعيد واحد. ومع ذلك، تتضمن التحليلات هنا الوساطة المشتركة لمصطلحين – طول CAG وتفاعله مع العمر. لم تعد الوساطة تقاس ببساطة بهذه الطريقة. لذلك، نؤكد بدلاً من ذلك على جانب اختبار الفرضيات للاختبارات الإحصائية الأساسية.
استخدمنا نفس طرق الانحدار كما في نماذج التوسع الجسدي لتقييم العلاقات بين مستويات NfL اللوغاريتمية والنتائج الحجمية. ومع ذلك، لم نحاول أي تفسير سببي لعلاقات NfL مقابل الحجمية. على الرغم من أن كلاهما يعتبر علامات بيوماركر مرتبطة بـ HD، إلا أنهما يعتبران مؤشرات متزامنة لنفس المرض ولا يوجد تصور مبرر جيد لأحد هذه التغيرات ‘يسبب’ الآخر.
تقديرات حجم العينة
تم حساب تقديرات حجم العينة التقريبية للتجارب السريرية التي تتضمن تخصيصًا متساويًا لمجموعة علاج واحدة ومجموعة دواء وهمي استنادًا إلى نماذج طولية لمجموعة HDGE مقابل مجموعة التحكم. تم تحويل الفروق بين المجموعات في المعدلات الطولية إلى مقياس كوهين.أحجام التأثير باستخدام الانحرافات المعيارية الطولية داخل المجموعة المستمدة من تقديرات تباينات التأثير العشوائي. تم تعريف تأثيرات العلاج المفترضة بعد ذلك كنسبة مئوية من تباطؤ الفرق بين المجموعات في المعدلات الطولية المعدلة لطول التجربة المفترض. يجب اعتبار هذه التقديرات متفائلة إلى حد ما من حيث الحجم. لم نتمكن من تقدير الزيادة المحتملة في التباين داخل المجموعة مع مرور الوقت (وزيادة حجم العينة الناتجة) بناءً على نقطتين زمنيتين فقط تم ملاحظتهما. لم نأخذ في الاعتبار معدلات الانسحاب من التجربة. من ناحية أخرى، لم نعتبر تقليل حجم العينة المحتمل بسبب تقديرات فعالة (ولكن ربما مثيرة للجدل) لانحراف الميل الناتج عن العلاج المستمد من قياسات متكررة على مر الزمن، بل استندت الحسابات بدلاً من ذلك إلى الفروق الصافية بين المجموعات في نهاية التجربة. انظر الطرق التكميلية لمزيد من التفاصيل.
التحليل الإحصائي
ما لم يُذكر خلاف ذلك، تم إجراء جميع التحليلات الإحصائية وفقًا لخطة تحليل إحصائي محددة مسبقًا. تم تعريف التحليلات التي تختبر العلاقة بين أحجام الرأس الذيل والبطين أو مستويات NfL مع تقدم المرض الملحوظ أو المتوقع على أنها فرضيات رئيسية، مع مستوى دلالة إحصائية منتم اعتبار تحليلات الارتباطات المحتملة للأمراض لبقية مجموعة الاختبارات الواسعة النطاق استكشافية وتم تقييمها بشكل أساسي من خلال تقدير معدل الاكتشاف الخاطئ (FDR) المحسوب باستخدام طريقة بنجاميني-هوشبرغ.تم حساب FDR بشكل منفصل لكل مجال قياس (معرفي، تصوير حجمي، اختبارات حيوية، إلخ) لفحص مجموعات مفهومة تقنيًا ومفهوميًا من الأسس.القيم. نقترح حد FDR منلتحديد النتائج الاستكشافية ذات الأهمية.
تم إجراء مقارنات بين المجموعات السكانية بواسطةاختبار للمتغير المستمر، بواسطة اختبار كاي-تربيع لاختلافات الجنس وبواسطة اختبار مان-ويتني U لمستوى التعليم. تم إجراء كل من التحليلات الطولية وتحليلات المقاطع العرضية المتكررة بواسطة نمذجة الانحدار العشوائي بأقصى احتمال مع (بالضرورة) فقط تقاطعات عشوائية لكل مشارك. الانحدار الأساسي كانت المتغيرات المثيرة للاهتمام هي حالة المجموعة (التحكم مقابل HDGE) وفي النماذج التي تختبر تأثيرات العمر وCAG، تم تضمين مصطلحات للعمر، وطول CAG المستمد من MiSeq، وتفاعلات العمر مع CAG ضمن HDGE. تم تقدير الأهمية المشتركة لتأثيرات العمر وCAG من خلال اختبار الاحتمالية القصوى للاختلافات في ملاءمة النموذج. كما احتوت النماذج على متغيرات مصاحبة للجنس، ومصطلح عمر غير متداخل وتفاعل الجنس مع العمر. تم تضمين مصطلح العمر غير المتداخل لجعل تأثيرات الشيخوخة الخاصة بمجموعة HDGE قابلة للتقدير. كما تضمنت النماذج المعرفية مستوى التعليم وفقًا للتصنيف الدولي القياسي للتعليم ومعدل الذكاء المقدر من خلال نتيجة اختبار القراءة للبالغين الوطني. نظرًا للاختلاف المستمر في توزيعات القياسات، تم استخدام التحولات اللوغاريتمية على جميع قياسات تركيزات الاختبار الحيوي.
اعتمدت التحليلات الطولية الحجمية لهياكل الدماغ بخلاف اللويحة على قياس واحد لتغير الحجم لكل مشارك مستمد من أزواج من مسحات الأساس والمتابعة. تم تحويل هذه التغيرات إلى معدلات سنوية وتم نمذجتها بواسطة تحليل المربعات الصغرى العادية مع متغيرات تنبؤية مشابهة لتلك المذكورة أعلاه. استخدمت جميع النماذج الأخرى للتغير الطولي القيم الإجمالية في الزيارتين كنتائج وتم تقدير التأثيرات الطولية للمتنبئين الأساسيين والمتغيرات المصاحبة من خلال التفاعلات مع وقت المتابعة بين الزيارتين. احتفظت تلك النماذج أيضًا بجميع التأثيرات الأساسية للمتنبئين والمتغيرات المصاحبة. للحفاظ على تقدير غير متحيز لمعلمات النموذج عندما تكون البيانات مفقودة بشكل عشوائي، تم تضمين بيانات الأساس من المشاركين الذين لم يكن لديهم متابعة في النموذج.
ملخص التقرير
معلومات إضافية حول تصميم البحث متاحة في ملخص تقارير مجموعة ناتشر المرتبط بهذه المقالة.
توفر البيانات
نحن ملتزمون بمشاركة البيانات مع الحفاظ على السرية بسبب الطبيعة الحساسة والقابلة للتعريف المحتمل لهذه البيانات. لن يتم مشاركة عينات السوائل الحيوية بسبب الكمية المحدودة من المواد المتاحة. ستحتاج العينات المتبقية إلى التكرار للزيارة التالية لـ HD-YAS. عند الطلب المعقول، ستتوفر البيانات بعد 24 شهرًا من انتهاء جمع البيانات، من خلال تقديم طلب عبر UCL إلى الباحث الرئيسي، البروفيسور سارة تابريزي. سيتعين على الباحثين تقديم اقتراح يفي بمعايير البحث ويجب أن يظهروا الامتثال الكامل للائحة العامة لحماية البيانات (GDPR). سيكون من الضروري وجود اتفاقية وصول للبيانات مع UCL.
توفر الشيفرة
جميع البرمجيات متاحة مجانًا باستثناء برنامج MIDAS الداخلي المستخدم لتوليد التكامل الخاص بتحول الحدود للذنب، والدماغ بالكامل، والبطينات. يمكن طلب ذلك من البروفيسور نيك فوكس في مركز أبحاث الخرف، جامعة لندن، المملكة المتحدة.
References
Warner, J. H. et al. Standardizing the CAP score in Huntington’s disease by predicting age-at-onset. J. Huntingtons Dis. 11, 153-171 (2022).
Zhang, H. et al. NODDI: practical in vivo neurite orientation dispersion and density imaging of the human brain. Neuroimage 61, 1000-1016 (2012).
Fox, N. C. & Freeborough, P. A. Brain atrophy progression measured from registered serial MRI: validation and application to Alzheimer’s disease. J. Magn. Reson. Imaging 7, 1069-1075 (1997).
Hobbs, N. Z. et al. Automated quantification of caudate atrophy by local registration of serial MRI: evaluation and application in Huntington’s disease. Neuroimage 47, 1659-1665 (2009).
Wild, E. J. et al. Quantification of mutant huntingtin protein in cerebrospinal fluid from Huntington’s disease patients. J. Clin. Invest. 125, 1979-1986 (2015).
Thompson, A. et al. Tandem mass tags: a novel quantification strategy for comparative analysis of complex protein mixtures by MS/MS. Anal. Chem. 75, 1895-1904 (2003).
Li, J. et al. Proteome-wide mapping of short-lived proteins in human cells. Mol. Cell 81, 4722-4735.e5 (2021).
Batth, T. S., Francavilla, C. & Olsen, J. V. Off-line high-pH reversed-phase fractionation for in-depth phosphoproteomics. J. Proteome Res. 13, 6176-6186 (2014).
UniProt Consortium. UniProt: a worldwide hub of protein knowledge. Nucleic Acids Res. 47, D506-D515 (2019).
Ciosi, M. et al. Library preparation and MiSeq sequencing for the genotyping-by-sequencing of the Huntington disease HTT exon one trinucleotide repeat and the quantification of somatic mosaicism. Protoc. Exch. https://doi.org/10.1038/protex.2018.089 (2018).
Benjamini, Y. & Hochberg, Y. Controlling the false discovery rate: a practical and powerful approach to multiple testing. J. R. Stat. Soc. B 57, 289-300 (1995).
شكر وتقدير
نحن ممتنون لجميع المشاركين في الدراسة وعائلاتهم الذين قدموا بسخاء وقتهم لدراسة الشباب المصابين بمرض هنتنغتون. كما نود أن نشكر موظفي مركز ويلكوم لتصوير الأعصاب البشرية (لندن، المملكة المتحدة) ومركز ليونارد وولفسون لعلم الأعصاب التجريبي (لندن، المملكة المتحدة). تم إجراء تحليل LC-MS في مرفق البروتيوميات الأساسي، أكاديمية ساهلغرنسكا، جامعة غوتنبرغ، بدعم مالي من SciLifeLab وBioMS. نشكر أنابيل كولمان وألكسيان توزي على مساعدتهما في جمع ومعالجة الدم، سيتى بنت محمد إيكسان على مساعدتها في جمع البيانات المعرفية والنفسية العصبية، بيتر مكولغان على المساعدة في خط أنابيب الاتصال الهيكلي، ودافينا هينسمان-موس وإميلي غانتمان على المناقشات المفيدة حول الورقة. تم تمويل هذه الدراسة من قبل ما يلي: جائزة ويلكوم التعاونية (223082/Z/21/Z إلى S.J.T.، R.I.S.، M.F.، M.J.M.، N.Z.H.، M.L.، C.L.، K.F.، T.W.R.، J.B.R.، B.J.S.، D.G.M. وD.R.L.); مؤسسة CHDI (منظمة غير ربحية مكرسة لإيجاد علاجات لمرض هنتنغتون) التي مولت جمع السائل الدماغي الشوكي؛ معهد أبحاث الخرف في المملكة المتحدة (DRI؛ لندن، المملكة المتحدة) من خلال UK DRI، الممول أساسًا من قبل المجلس الطبي في المملكة المتحدة؛ مستشفى جامعة كوليدج لندن/جامعة كوليدج لندن (لندن، المملكة المتحدة)، بدعم من المعهد الوطني للبحوث الصحية والرعاية (NIHR) مركز أبحاث الطب الحيوي لمستشفيات جامعة كوليدج لندن؛ مؤسسة ويلكوم (220258 إلى J.B.R.); المجلس الطبي للبحوث (MC_UU_00030/14 وMR/T033371/1 إلى J.B.R.) ومركز أبحاث الطب الحيوي في كامبريدج (NIHR2O3312 إلى J.B.R.). H.Z. هو باحث وولنبرغ وأستاذ متميز في المجلس السويدي للبحوث.
مساهمات المؤلفين
حصل R.I.S. وC.S. وH.Z. وE.J.W. وG.R. وB.J.S. وD.G.M. وD.R.L. على تمويل لهذه الدراسة. صمم R.I.S. وK.F. وE.J.W. وG.R. الدراسة. ساهم R.I.S. وM.F. وM.J.M. وN.Z.H. وK.F. وO.T. في التوظيف. ساهم R.I.S. وN.Z.H. وM.L. وH.K. وC.S.P. وI.B.M. في الحصول على الصور وتحليلها. ساهم M.F. وM.J.M. وM.N. وC.E.F. وY.H. في التقييمات السريرية. ساهم M.F. وM.J.M. في جمع السوائل الحيوية. ساهم M.F. وJ.G. وJ.R. وS.W. وA.H. في معالجة وتحليل السوائل الحيوية. ساهم R.I.S. وM.F. وM.J.M. وM.L. وC.L. وK.F. في التقييمات المعرفية والنفسية العصبية. ساهم C.L. وT.W.R. وB.J.S. في تصميم بطارية التقييمات المعرفية والنفسية العصبية. ساهم M.C. وN.K.P.P. في تحليل التوسع الجسدي. ساهم K.F. في المشروع. الإدارة. ساهم ك.ف. وأو.ت. في معالجة السوائل الحيوية. ساهم هـ.هـ. في عملية المراجعة الإشعاعية. قام ج.د.ل. و د.ر.ل. بإجراء التحليل الإحصائي. ساهم س.س. في تفسير البيانات. صمم هـ.ز. طرق معالجة السوائل الحيوية والتحليل. ساهم ج.ب.ر. في تصميم البطارية المعرفية. ساهم د.ج.م. في معالجة وتحليل التوسع الجسدي. كتب د.ر.ل. خطة التحليل الإحصائي. قام ر.إ.س.، م.ف.، س.ل.، م.س.، ب.ج.س.، د.ج.م.، د.ر.ل. و س.ج.ت. بصياغة الورقة. كان س.ج.ت. الباحث الرئيسي لجائزة ويلكوم تراست التعاونية وكان لديه المسؤولية العامة عن تصميم الدراسة، إدارة المشروع، الموافقة الأخلاقية، التحليل وصياغة الورقة. ساهم جميع المؤلفين في تفسير البيانات وراجعوا الورقة.
المصالح المتنافسة
يدعم J.B.R. صندوق ويلكوم (220258) ومجلس البحوث الطبية (MC_UU_00030/14؛ MR/T033371/1) ومركز كامبريدج للبحوث الطبية الحيوية التابع للNIHR (NIHR2O3312). الآراء المعبر عنها هي آراء المؤلفين وليست بالضرورة آراء NIHR أو وزارة الصحة والرعاية الاجتماعية. قام J.B.R. بتقديم استشارات مدفوعة لشركات Asceneuron وAstronautx وAstex وClinicalInk وCumulusNeuro وCurasen وInvivro وPrevail وSVHealth؛ وتلقى تمويلًا بحثيًا غير مرتبط بالعمل الحالي من AstraZeneca وLily وGSK وJanssen؛ وهو مستشار علمي رئيسي لمؤسسة أبحاث الزهايمر في المملكة المتحدة. كان D.G.M. مستشارًا علميًا و/أو تلقى مكافآت/منح من AMO Pharma وDyne وF. Hoffman-La Roche وFunction Rx وLoQus23 وMOMA Therapeutics وNovartis وOno Pharmaceuticals وPfizer Pharmaceuticals وRgenta Therapeutics وSanofi وSarepta Therapeutics. يتم دعم J.G. من قبل Alzheimerfonden (AF-980746) ومؤسسة خدم المنازل القديمة (2022-01324). ظهر J.B.R. كشاهد خبير لدى وكالة تنظيم الأدوية ومنتجات الرعاية الصحية، غير مرتبط بالعمل الحالي. D.G.M. هو عضو في المجلس الاستشاري العلمي لمؤسسة ضمور العضلات الميوتيكية وEuroDyMA (جمعية ضمور العضلات الميوتيكية الأوروبية)، وهو مستشار علمي لمجموعة دعم ضمور العضلات الميوتيكية ونائب رئيس الأبحاث في ضمور العضلات في المملكة المتحدة. G.R. هو مدير غير تنفيذي في UCL Business. D.R.L. هو عضو أكاديمي غير مدفوع في اللجنة التنسيقية لمؤسسة Critical Path Institute HD-RSC. B.J.S. هو مشارك في اختراع بطارية الاختبار العصبي النفسي الأوتوماتيكية في كامبريدج. I.B.M. هو محرر مشارك في Frontiers in Neurology. يعلن المؤلفون الآخرون عدم وجود مصالح متنافسة.
يجب توجيه المراسلات والطلبات للحصول على المواد إلى سارة ج. تابريزي.
معلومات مراجعة الأقران تشكر مجلة ناتشر ميديسين هاري أور والمراجعين الآخرين المجهولين على مساهمتهم في مراجعة هذا العمل. المحرر الرئيسي: جيروم ستال، بالتعاون مع فريق ناتشر ميديسين.
الشكل التوضيحي الممتد 1 | مخطط تدفق التوظيف والمتابعة والإجمالي
التقييمات التراكمية. مخطط انسيابي يوضح تسجيل المشاركين في البداية (2017-2019) والاحتفاظ بالمشاركين الجدد وتجنيدهم في المتابعة (2022-2024) في دراسة مرض هنتنغتون للشباب (HD-YAS).
CSF، السائل الدماغي الشوكي؛ DBS، درجة عبء المرض؛تاريخ العائلة؛ HDGE، جين HD الموسع؛ IVF، الإخصاب في المختبر؛ LP، بزل القطنية؛ TMS، الدرجة الإجمالية للحركة؛ UHDRS، مقياس تقييم مرض هنتنغتون الموحد.
أ
تقييم تأثير هياكل أليل HTT بالإضافة إلى طول CAG النقي:
طول CAG النقي المادة الأساسية لآلية عدم استقرار تكرار HTT الجسدي تحدد معدل توسع تكرار HTT الجسدي وتحدد علم الأمراض المرتبط بمرض هنتنغتون.
متغيرات التسلسل المتداخلة – لا تأثير على عدم استقرار HTT الجسدي – تأثير على شدة مرض هنتنغتون، التقدم، والبيانات البيولوجية
آثار محتملة مستقلة عن عدم الاستقرار لهذه المتغيرات المتطابقة:
قد تؤثر المتغيرات التسلسلية المتداخلة على نسخ HTT
قد تؤثر المتغيرات التسلسلية المتداخلة على طي نسخ HTT، واستقرارها، وقطعها، أو ترجمتها.
قد تؤثر المتغيرات التسلسلية المتداخلة على سمية RNA
الشكل 3 من البيانات الموسعة | تأثير هيكل الأليل غير النمطي لـ HTT على التوسعات الجسدية في الدم لا يفسر تأثيرها على ظواهر مرض هنتنغتون
المؤشرات الحيوية. (أ) تمثيل تخطيطي لعدم تأثير هيكل الأليل غير النمطي لـ HTT على التوسع الجسدي في الدم في مجموعة HD-YAS وتأثيرها النسبي على أحجام الرأس والذيل ومستويات NfL في السائل الدماغي الشوكي بعد تصحيح العمر حسب CAG. (ب) تمثيل بياني لهياكل أليلات HTT. تمت ملاحظته في مجموعة HD-YAS. على الجانب الأيسر هو مسار CAG النقي، والذي من المحتمل أن يكون الركيزة الأساسية للـتكرار عدم الاستقرار في الآلات وهو المحدد الرئيسي لمعدل توسع تكرار HTT الجسدي ومرض هنتنغتون. المركز، المتغيرات التسلسلية التي تتداخل بين مقاطع CAG وCCG، والتي تحدد هياكل الأليل غير النمطية لـ HTT الملاحظة (أي، تكرار CAACAG، فقدان CCGCCA وفقدان CAACAG CCGCCA).
الشكل 4 من البيانات الموسعة | نموذج سببي مفاهيمي. نموذج مفاهيمي يوضح العلاقات السببية بين طول تكرار CAG المرتبط بالعمر (العمر، CAG)، التوسع الجسدي في الجهاز العصبي المركزي، التوسع الجسدي في كريات الدم البيضاء وعلامات البيولوجية. المربعات باللون الرمادي تمثل البيانات المقاسة، بينما الدوائر باللون الأرجواني تمثل الكميات غير القابلة للملاحظة. السهم الأسود ثنائي الاتجاه يدل على الافتراض بأن التوسع الجسدي في كريات الدم البيضاء يعمل كبديل للتوسع الجسدي في الجهاز العصبي المركزي. الأسهم الحمراء تشير إلى الارتباطات بين البيانات القابلة للملاحظة والأساسيات. عمليات بيولوجية ذات اهتمام. يُفترض أن تعكس الأسهم الزرقاء المسارات السببية الحقيقية بشكل غير مباشر. نلاحظ أن إصلاح عدم تطابق الحمض النووي هو آلية رئيسية تربط بين طول تكرار CAG الموروث والتوسع الجسدي، حيث تزداد نشاطات إصلاح عدم التطابق مع زيادة طول تكرار CAG. *لاحظ أن مسارات إضافية قد تكون متورطة بسبب القياس غير الدقيق وغير المباشر للتوسع الفعلي في الجهاز العصبي المركزي. الاختصارات: CNS=الجهاز العصبي المركزي. WBC=خلايا الدم البيضاء.
جدول يقدم الخصائص السكانية للمشاركين على مدى فترة طويلة في HD-YAS. القيم هي المتوسطات (الانحراف المعياري)، n (%) أو الوسيط (المدى interquartile). تم إجراء مقارنات بين المجموعات ذات الاتجاهين باستخداماختبارات (الفترة، العمر، التعليم، NART) واختبارات (الجنس). CAP100، منتج العمر CAG، حيث CAP100 هو العمر المتوقع للتشخيص. HDGE، جين HD الموسع؛ IQR، النطاق الربعي؛ NA، غير قابل للتطبيق؛ NART، اختبار القراءة الوطنية للبالغين، تقدير للذكاء؛ SD، الانحراف المعياري؛ IQ، معامل الذكاء.
البيانات الموسعة الجدول 2 | بيانات حجمية طولية
النتائج (إلى ICV)
متوسط التحكم
متوسط HDGE
تقدير الفرق المتوسط
Df
الحد الأدنى من CL
الحد العلوي
قيمة
فرانكلين ديلانو روزفلت
تغيير ذي الذيل
83
تغيير في البوتامين
98
تغيير بطيني
83
تغيير الدماغ بالكامل
83
تغير المادة الرمادية
83
تغير المادة البيضاء
83
جدول يوضح النتائج الحجمية الطولية (المعدلة حسب حجم الجمجمة الداخلي) لمشاركي HDGE مقارنةً بالمجموعة الضابطة. تم تحليل التغيرات الطولية في بنية الدماغ، باستثناء الجسم المخطط، من خلال نمذجة مقياس تغيير واحد لكل مسح مشارك مزدوج (تكامل تغيير الحدود أو تحويل مورفومترية قائمة على الفوكسل) بعد تحويلها إلى معدلات تغيير سنوية. تم نمذجة هذه التغيرات بواسطة تحليل الانحدار العادي. تم اشتقاق تغييرات الجسم المخطط من طرح تقسيمات MALP-EM الأساسية والمتابعة مقسومة على طول المتابعة. تعكس نتائج التحليل والتعديلات المتبقية التحكم في العمر الأساسي والجنس وتفاعلهما. تم تعديل المقارنات الجماعية الثنائية الجوانب إحصائيًا لمراعاة المقارنات المتعددة باستخدام معدل الاكتشاف الخاطئ، مع تقديم قيم P ودرجات الحرية وحدود الثقة في الجدول. القيم المهمة عند FDR < 0.15 مميزة بالخط العريض. CL، حد الثقة؛ Df، درجات الحرية؛ FDR، معدل الاكتشاف الخاطئ؛ HDGE، جين HD الموسع؛ ICV، حجم الجمجمة الداخلي.
البيانات الموسعة الجدول 3 | بيانات الانتشار الطولي
النتائج
متوسط التحكم
متوسط HDGE
تقدير الفرق المتوسط
Df
الحد الأدنى من CL
الحد الأعلى
قيمة
فرانكلين ديلانو روزفلت
الجزء الخلفي من الجسم الثفني
89
الجسم الثفني – منطقة الطحال
90
الكبسولة الداخلية الأمامية AD
90
FA الجسم الثفني
91
الجزء الخلفي من الجسم الثفني
89
الكبسولة الداخلية الأمامية ODI
90
التوصيل العصبي في منتصف الجسم الثفني
91
الكبسولة الداخلية الأمامية FA
٨٨
الطية الجانبية للجسم الثفني FWF
93
متوسط المادة البيضاء في الجسم الثفني
90
كبسولة خارجية AD
90
0.011
NDI الجسم الثفني
92
0.012
FA في منتصف الجسم الثفني
92
0.013
كبسولة خارجية MD
90
0.025
الجسم الثفني الأوسط FWF
90
0.017
0.048
الكبسولة الداخلية الأمامية MD
90
0.024
0.063
مؤشر تشتت الجسم الثفني الأوسط
89
0.027
0.067
كبسولة خارجية RD
89
0.037
0.087
كبسولة خارجية NDI
90
0.046
0.103
NDI الجسم الثفني الجسيم
92
0.050
0.106
الكبسولة الداخلية الخلفية MD
93
0.068
0.137
الجسم الثفني AD
90
0.074
0.142
الجسم الثفني MD
91
0.083
0.148
NDI في منتصف الجسم الثفني
93
0.085
0.148
الكبسولة الداخلية الخلفية AD
91
0.105
0.171
الكبسولة الداخلية الخلفية NDI
91
0.106
0.171
جسم الثفني RD
91
0.132
0.199
التصلب المتعدد في الجسم الثفني الأوسط
89
0.133
0.199
الكبسولة الداخلية الخلفية RD
92
0.173
0.250
FA الجسم الثفني الجنوبي
90
0.208
0.291
جنو الجسم الثفني ODI
١٠٧
0.245
0.332
الكبسولة الداخلية الأمامية FWF
١٠٣
0.299
0.389
الجزء الخلفي من الجسم الثفني
95
0.306
0.389
الكبسولة الداخلية الأمامية NDI
90
0.317
0.391
الكبسولة الداخلية الخلفية FWF
١١٨
0.363
0.436
جنو الجسم الثفني FWF
١٠٨
0.504
0.588
كبسولة خارجية ODI
95
0.٦٩٩
0.793
الكبسولة الداخلية الخلفية ODI
99
0.867
0.956
الكبسولة الداخلية الخلفية FA
91
0.891
0.956
الكبسولة الداخلية الأمامية RD
89
0.911
0.956
كبسولة خارجية FA
89
0.948
0.971
كبسولة خارجية FWF
١٠٢
0.979
0.979
تم اشتقاق مقاييس الانتشار (AD، FA، MD، وRD) وNODDI (FWF، ODI، وNDI) للمناطق التالية من الاهتمام: الجسم الثفني (الجنو، المنتصف والصلبة)، الكبسولة الداخلية (الأمامية والخلفية) والكبسولة الخارجية. تم اشتقاق التغير الطولي عن طريق طرح القيمة الأساسية من قيمة المتابعة وتم تحويل التغير إلى سنوي. تعكس نتائج التحليل والتعديلات المتبقية التحكم في العمر الأساسي، الجنس وتفاعلهما. تم تعديل المقارنات الجماعية الثنائية الجوانب إحصائيًا لمراعاة المقارنات المتعددة باستخدام FDR، مع توفير قيم P، درجات الحرية، وحدود الثقة في الجدول. القيم المهمة عند FDR<0.15 مميزة بالخط العريض. AD، الانتشار المحوري؛ CL، حد الثقة؛ Df، درجات الحرية؛ FA، الأنيسوتروبية الكسرية؛ FWF، نسبة الماء الحر؛ HDGE، جين HD الموسع؛ MD، الانتشار المتوسط؛ NDI، مؤشر كثافة المحاور؛ ODI، مؤشر تشتت الاتجاه؛ RD، الانتشار الشعاعي.
البيانات الموسعة الجدول 4 | مؤشرات قياسات ضمور الدماغ
تصحيح
النتائج
ذيلالقيمة، FDR)
الكرة المخططية القيمة، FDR)
المادة الرماديةالقيمة، FDR)
المادة البيضاءالقيمة، FDR)
الدماغ بالكامل القيمة، FDR)
البطيناتالقيمة، FDR)
لا عمر و CAG
خط الأساس لنسبة NfL في السائل الدماغي الشوكي
0.020، 0.023
خط الأساس لبلازما NfL
0.014، 0.015
0.037، 0.037
خط الأساس لسائل الدماغ والنخاع PENK
0.078، 0.128
0.022، 0.056
0.003، 0.013
0.019، 0.056
مع العمر و CAG
خط الأساس لنسبة NfL في السائل الدماغي الشوكي
0.003، 0.007
0.124، 0.124
0.002، 0.008
0.012، 0.019
خط الأساس لبلازما NfL
0.025، 0.032
0.160، 0.160
0.100، 0.111
0.008، 0.018
0.026، 0.032
0.009، 0.018
خط الأساس لسائل الدماغ والنخاع PENK
0.250، 0.348
0.034، 0.112
0.010، 0.052
0.050، 0.125
لا عمر و CAG
التغيير في مستوى NfL في السائل الدماغي الشوكي
0.041، 0.103
0.493، 0.548
0.074، 0.149
0.017، 0.057
تغيير في مستوى NfL في البلازما
0.030، 0.062
0.٤٤٣، 0.٥٤٨
0.626، 0.626
0.179، 0.298
0.257، 0.367
تغيير في PENK السائل الدماغي الشوكي
0.027، 0.137
0.665، 0.831
0.295، 0.421
0.275، 0.421
مع العمر و CAG
التغير في مستوى NfL في السائل الدماغي الشوكي
0.002، 0.020
0.002، 0.027
0.084، 0.169
0.210، 0.349
0.0599، 0.1497
0.010، 0.040
تغيير في مستوى NfL في البلازما
0.012، 0.040
0.117، 0.205
0.741، 0.741
0.548، 0.609
0.264، 0.369
0.295، 0.369
تغيير في PENK السائل الدماغي الشوكي
0.002، 0.021
0.075، 0.224
0.579، 0.723
0.457، 0.653
0.361، 0.602
جدول يلخص العلاقة بين القيم الأساسية والتغير في المؤشرات الحيوية السائلة الرئيسية مع قياسات ضمور الدماغ عبر مناطق الدماغ المختلفة، مع وبدون تعديل للعمر وطول تكرار CAG. كانت المتغيرات الرئيسية في الانحدار التي تهمنا هي حالة المجموعة (ضابطة مقابل HDGE) وفي النماذج التي تختبر تأثيرات العمر وCAG، كانت هناك مصطلحات للعمر، وطول CAG المستمد من MiSeq، وتفاعلات العمر مع CAG المتداخلة ضمن HDGE. تم تقدير الأهمية المشتركة لتأثيرات العمر وCAG بواسطة اختبار الاحتمالية القصوى لاختلافات ملاءمة النموذج. احتوت النماذج أيضًا على متغيرات مصاحبة للجنس، والعمر، وتفاعل الجنس مع العمر. اعتمدت التحليلات الحجمية الطولية للهياكل الدماغية الأخرى غير البوتامين على قياس واحد لتغير الحجم (تكامل تغيير الحدود أو تحويل الشكل القائم على الفوكسل) لكل مشارك مستمد من أزواج من مسحات الأساس والمتابعة. تم تحويل هذه التغيرات إلى معدلات سنوية وتم نمذجتها بواسطة انحدار المربعات الصغرى العادية مع متغيرات تنبؤية مشابهة لتلك المذكورة أعلاه. استخدمت جميع النماذج الأخرى للتغير الطولي الفرق بين الزيارتين كنتائج وتم تقدير التأثيرات الطولية للمتنبئين الرئيسيين والمتغيرات المصاحبة من خلال التفاعلات مع وقت المتابعة بين الزيارتين. احتفظت تلك النماذج أيضًا بجميع التأثيرات الأساسية للمتنبئين والمتغيرات المصاحبة. للحفاظ على تقدير غير متحيز لمعلمات النموذج عندما تكون البيانات مفقودة بشكل عشوائي، تم تضمين بيانات الأساس من المشاركين الذين ليس لديهم متابعة في النموذج. القيم المهمة عند FDR<0.15 مميزة بالخط العريض. CSF، السائل الدماغي الشوكي؛ FDR، معدل الاكتشاف الخاطئ؛ NfL، خيوط الأعصاب الخفيفة؛ PENK، بروإنكيفالين.
البيانات الموسعة الجدول 5 | حسابات حجم العينة
النتيجة: تغيير في
تأثير العلاج بنسبة 50%
70% تأثير العلاج
سنتان
3 سنوات
سنتان
3 سنوات
CSF NfL
232
١٠٤
١٢٠
٥٤
ذيل
٢٨٢
١٢٦
١٤٤
64
المُخَطَّط
٣٢٦
146
184
١٠٤
نسبة التوسع الجسدي
614
٢٧٤
314
١٤٠
بطيني
٧٧٦
346
396
١٧٦
الدماغ الكامل
1208
538
٤٥٢
٢٠٢
المادة الرمادية
2164
962
١١٠٤
492
المادة البيضاء
٣٦١٢
1606
1844
٨٢٠
جدول يوضح تقديرات حجم العينة التقريبية للتجارب السريرية التي تتضمن تخصيصًا متساويًا لمجموعة علاج واحدة ومجموعة وهمية، والتي تم حسابها بناءً على نماذج طولية لمجموعة HDGE مقابل التحكم. تم تحويل الفروق بين المجموعات في المعدلات الطولية إلى أحجام تأثير كوهين باستخدام الانحرافات المعيارية الطولية داخل المجموعة المستمدة من تقديرات تباينات التأثير العشوائي. ثم تم تعريف تأثير العلاج على أنه النسبة المئوية لتباطؤ الفرق بين المجموعات في المعدلات الطولية مضروبة في طول التجربة المفترض. يفترض تأثير العلاج تقليص الفرق في المعدل بين مجموعتي HDGE والتحكم. يتم استخدام تكامل تغيير الحدود لقياس التغير في الرأس، والدماغ، والبطينات. يتم توليد التغيرات في المادة الرمادية والمادة البيضاء عن طريق دمج خرائط الأنسجة الرمادية أو البيضاء المستمدة من قياسات الفوكسل الأساسية مع خرائط ضغط الفوكسل للتغير داخل المشاركين. يتم قياس تغير البوتامين عن طريق طرح تقسيمات MALP-EM الأساسية والمتابعة. انظر الطرق التكميلية لمزيد من التفاصيل. السائل الدماغي الشوكي؛ HDGE، جين HD الموسع؛ NfL، خيوط عصبية خفيفة.
البيانات الموسعة الجدول 6 | مجموعة من التقييمات
الأسلوب
التقييمات
الإدراك
جوهر
تسمية ألوان ستروب
قراءة كلمات ستروب
تداخل ستروب*
اختبار طرق الرموز الرقمية (SDMT)
الطلاقة اللفظية (الفئة)
كانتاب
التحول بين الأبعاد الداخلية والخارجية (IED)
جوارب ون تاتش من كامبريدج (OTS)
الذاكرة العاملة المكانية (SWM)
تعلم الارتباط المزدوج (PAL)
معالجة المعلومات البصرية السريعة (RVP)
إشارة التوقف (SST)
إيموتيكون
تحويل وجه شدة العاطفة
الحكم الأخلاقي
الأهداف قبل التحليل*
عصبي نفسي
استبيانات التقرير الذاتي
مؤشر جودة النوم في بيتسبرغ (PSQI)
مقياس الاندفاعية بارّات (BIS-11)
استبيان التعاطف في تورونتو (TEQ)
استبيان القلق السمة – السمة (STAI-T)
جرد الوسواس القهري المنقح (OCl-R)
مقياس زونغ لتقييم الاكتئاب (SDS)
مؤشر الدافع لللامبالاة (AMI)
مقياس أليكسيثيميا في تورونتو (TAS-20)
مقياس سلوك الأنظمة الجبهية (FrsBe)
استبيان الصحة القصير (SF-36)
تصوير الأعصاب
حجمي
ذيل
المُخَطَّط
المادة الرمادية
المادة البيضاء
البطينات
الدماغ الكامل
DWI
انتشار محوري (AD)
الأنيسوتروبي الجزئي (FA)
الانتشار المتوسط (MD)
انتشار شعاعي (RD)
السوائل الحيوية
السائل الدماغي الشوكي
الهنتين المتحور
NfL
تاو
GFAP
يو سي إتش – إل 1
YKL-40
IL-6
IL-8
بينك
بلازما
NfL
تاو
GFAP
يو سي إتش – إل 1
الدم الكامل – الحمض النووي
نسبة التوسع الجسدي (SER)
جدول يقدم نظرة عامة مفصلة عن التقييمات عبر الأنماط الأربعة التالية: الإدراك، النفسية العصبية، التصوير العصبي والسوائل الحيوية. *مهام جديدة في المتابعة. CANTAB، اختبار كامبريدج النفسي العصبي الآلي؛ CSF، السائل الدماغي الشوكي؛ DWI، التصوير بالرنين المغناطيسي المدعوم بالانتشار؛ EMOTICOM، العاطفة، الدافع، الاندفاع والإدراك الاجتماعي؛ GFAP، بروتين الألياف الدبقية الحمضية؛ IL، الإنترلوكين؛ MPM، التخطيط متعدد المعلمات؛ NfL، خيوط الأعصاب الخفيفة؛ NODDI، تصوير انتشار وتوجه الأعصاب وكثافتها؛ PENK، بروإنكيفالين؛ UCH-L1، هيدراز يوبكويتين كربوكسيلي نهائي L1؛ YKL-40، المعروف أيضًا باسم بروتين شيتيناز-3 الشبيه-1 (CHI3L1).
محفظة الطبيعة
المؤلف (المؤلفون) المراسلون:
آخر تحديث بواسطة المؤلف(ين):12 نوفمبر 2024
ملخص التقرير
تسعى Nature Portfolio إلى تحسين إمكانية تكرار العمل الذي ننشره. يوفر هذا النموذج هيكلًا للاتساق والشفافية في التقرير. لمزيد من المعلومات حول سياسات Nature Portfolio، يرجى الاطلاع على سياسات التحرير وقائمة مراجعة سياسة التحرير.
يرجى عدم ملء أي حقل بـ “غير قابل للتطبيق” أوراجع نص المساعدة لمعرفة النص الذي يجب استخدامه إذا كان العنصر غير ذي صلة بدراستك. للتقديم النهائي: يرجى التحقق بعناية من إجاباتك للتأكد من دقتها؛ لن تتمكن من إجراء تغييرات لاحقًا.
الإحصائيات
لجميع التحليلات الإحصائية، تأكد من أن العناصر التالية موجودة في أسطورة الشكل، أسطورة الجدول، النص الرئيسي، أو قسم الطرق.
غير متوفر
□ □ □ □ □ □ □ □
إكس
لاختبار الفرضية الصفرية، إحصائية الاختبار (على سبيل المثال، ) مع فترات الثقة، أحجام التأثير، درجات الحرية وقيمة ملحوظة أعطِالقيم كقيم دقيقة كلما كان ذلك مناسبًا. تم التأكيد حجم العينة بالضبطلكل مجموعة/شرط تجريبي، معطاة كرقم منفصل ووحدة قياس بيان حول ما إذا كانت القياسات قد أُخذت من عينات متميزة أو ما إذا كانت نفس العينة قد تم قياسها عدة مرات اختبار(ات) الإحصاء المستخدمة وما إذا كانت أحادية الجانب أو ثنائية الجانب يجب أن تُوصف الاختبارات الشائعة فقط بالاسم؛ واصفًا التقنيات الأكثر تعقيدًا في قسم الطرق. وصف لجميع المتغيرات المشتركة التي تم اختبارها وصف لأي افتراضات أو تصحيحات، مثل اختبارات الطبيعية والتعديل للمقارنات المتعددة وصف كامل للمعلمات الإحصائية بما في ذلك الاتجاه المركزي (مثل المتوسطات) أو تقديرات أساسية أخرى (مثل معامل الانحدار) والتباين (مثل الانحراف المعياري) أو تقديرات عدم اليقين المرتبطة (مثل فترات الثقة)
لتحليل بايزي، معلومات حول اختيار القيم الأولية وإعدادات سلسلة ماركوف مونت كارلو □ لتصميمات هرمية ومعقدة، تحديد المستوى المناسب للاختبارات والتقارير الكاملة عن النتائج
تقديرات أحجام التأثير (مثل حجم تأثير كوهين)بيرسون )، مما يشير إلى كيفية حسابها
البرمجيات والشيفرة
معلومات السياسة حول توفر كود الكمبيوتر
جمع البيانات
تحليل البيانات
تم جمع البيانات بين 6 أبريل 2022 و21 مارس 2024. تم إنشاء جميع المتغيرات المشتقة وفقًا للوصف في الطرق التكميلية وتم تحليلها وفقًا لخطة التحليل الإحصائي المحددة مسبقًا المتاحة علىClinicalTrials.gov(NCT06391619). تم إدخال علامة حيوية سائلة استكشافية إضافية، وهي البروإنكيفالين (PENK) بسبب توفر اختبار جديد.
تم إجراء التحليل الإحصائي باستخدامالإصدار 4.3.3. تم تحليل الصور باستخدام برامج متاحة مجانًا كما هو موضح في الطرق التكميلية. جميع البرامج متاحة مجانًا باستثناء برنامج MIDAS الداخلي المستخدم لإنشاء تكامل تغيير الحدود للفص القاعدي، والدماغ بالكامل، والبطينات. يمكن طلب هذا من البروفيسور نيك فوكس في مركز أبحاث الخرف، جامعة لندن.
بالنسبة للمخطوطات التي تستخدم خوارزميات أو برامج مخصصة تكون مركزية في البحث ولكن لم يتم وصفها بعد في الأدبيات المنشورة، يجب أن تكون البرمجيات متاحة للمحررين والمراجعين. نحن نشجع بشدة على إيداع الشيفرة في مستودع مجتمعي (مثل GitHub). راجع إرشادات مجموعة Nature لتقديم الشيفرة والبرمجيات لمزيد من المعلومات.
معلومات السياسة حول توفر البيانات
يجب أن تتضمن جميع المخطوطات بيانًا حول توفر البيانات. يجب أن يوفر هذا البيان المعلومات التالية، حيثما ينطبق:
رموز الانضمام، معرفات فريدة، أو روابط ويب لمجموعات البيانات المتاحة للجمهور
وصف لأي قيود على توفر البيانات
بالنسبة لمجموعات البيانات السريرية أو بيانات الطرف الثالث، يرجى التأكد من أن البيان يتماشى مع سياستنا
نحن ملتزمون بمشاركة البيانات مع الحفاظ على السرية نظرًا للطبيعة الحساسة والقابلة للتعريف المحتمل لهذه البيانات. لن يتم مشاركة عينات السوائل الحيوية بسبب الكمية المحدودة من المواد المتاحة. ستظل العينات المتبقية مطلوبة للتكرار للزيارة التالية لـ HD-YAS. عند الطلب المعقول، ستتوفر البيانات بعد 24 شهرًا من انتهاء جمع البيانات، من خلال تقديم طلب عبر UCL إلى الباحث الرئيسي، البروفيسورة سارة تابريزي.س.تبريزي@ucl.ac.ukسيُطلب من الباحثين تقديم اقتراح يلبي معايير البحث ويجب أن يظهروا الامتثال الكامل للائحة العامة لحماية البيانات (GDPR). سيكون من الضروري وجود اتفاقية وصول إلى البيانات مع جامعة لندن الجامعية (UCL).
البحث الذي يتضمن مشاركين بشريين، بياناتهم، أو مواد بيولوجية
معلومات السياسة حول الدراسات التي تشمل مشاركين بشريين أو بيانات بشرية. انظر أيضًا معلومات السياسة حول الجنس، الهوية/التقديم الجنسي، والتوجه الجنسي والعرق، والعرقية والعنصرية.
التقارير عن الجنس والنوع الاجتماعي التقارير عن العرق أو الإثنية أو غيرها من المجموعات الاجتماعية ذات الصلة
خصائص السكان التوظيف
رقابة الأخلاقيات
الجنس المعين عند الولادة تم الإبلاغ عنه.
التقارير عن العرق أو الإثنية أو غيرها من المجموعات الاجتماعية ذات الصلة التي لا تتعلق بالدراسة ولم يتم الإبلاغ عنها.
تم توفيرها في الطرق عبر الإنترنت، والطرق التكميلية، والجدول البياني الموسع 1، والشكل البياني الموسع 1.
تم تجنيد المشاركين من جميع أنحاء المملكة المتحدة وتم تسجيلهم في موقع دراسة واحد (UCL). تم وصف معايير الإدراج سابقًا (Scahill et al., 2020; doi: 10.1016/S1474-4422(20)30143-5) وتم تفصيلها في الطرق التكميلية. حضر المشاركون (131 في المجموع، 64 جين موسع لمرض هنتنغتون (HDGE)؛ 67 مجموعة ضابطة) في البداية وعاد 103 (57 HDGE؛ 46 مجموعة ضابطة) للمتابعة بعد حوالي 4.5 سنوات.
حصلت الدراسة على موافقة لجنة الأخلاقيات البحثية في لندن-بلومزبري (22/LO/0058). التزمت جميع إجراءات الدراسة بالمبادئ الموضحة في إعلان هلسنكي، وقبل التسجيل، تم الحصول على موافقة خطية.
يرجى ملاحظة أنه يجب أيضًا تقديم معلومات كاملة حول الموافقة على بروتوكول الدراسة في المخطوطة.
التقارير المتخصصة في المجال
يرجى اختيار الخيار أدناه الذي يناسب بحثك بشكل أفضل. إذا لم تكن متأكدًا، اقرأ الأقسام المناسبة قبل اتخاذ قرارك. علوم الحياة العلوم السلوكية والاجتماعية العلوم البيئية والتطورية والبيئية لنسخة مرجعية من الوثيقة بجميع الأقسام، انظرnature.com/documents/nr-reporting-summary-flat.pdf
تصميم دراسة العلوم الحياتية
يجب على جميع الدراسات الإفصاح عن هذه النقاط حتى عندما يكون الإفصاح سلبياً.
حجم العينة
تم توفير حسابات حجم العينة من قبل عالم الإحصاء لدينا، البروفيسور دوغلاس لانغبين من جامعة أيوا. وكانت هذه الحسابات مبنية على الافتراضات التي تفيد بأنه مع معدل خطأ من النوع الأولعينة من 60 مشاركًا/مجموعة ستوفرقوة الكشف عن فرق متوسط مقابل الضوابط بمقدار 0.53 تم تعديلها ضمن الانحرافات المعيارية داخل المجموعة (حجم التأثير)، مع السماح لـ 5 متغيرات مصاحبة. وبالمثل، بعد السماح لـ 5 متغيرات مصاحبة، فإن عينة من 60 مشاركًا موسعًا لـ CAG تسمح بنفس القوة الإحصائية للكشف عن ارتباط بيرسون الجزئي بمقدار 0.36 بين مقاييس النتائج وبين هذه المقاييس ودرجة CAP أو غيرها من المتنبئين المحتملين لمخاطر مرض هنتنغتون.
استبعاد البيانات
تم تقديم هذه المعلومات في الجدول التكميلي 5 مع مزيد من التفاصيل حول أسباب الاستبعاد المقدمة في الطرق التكميلية.
التكرار
تم قياس جميع المحللات في بلازما الإنسان والسائل الدماغي الشوكي (CSF) بنجاح. تم قياس Neurology 4-Plex A (GFAP، NfL، Tau، UCH-L1) في عينة واحدة، مما أسفر عن معاملات تباين بين الألواح التالية (%CV): CSF GFAP , CSF NfL , CSF Tau , CSF UCH-L1 , plasma GFAP , plasma NfL , plasma Tau , و plasma UCH-L1 . تم حساب %CVs من قياسات مكررة للضوابط الداخلية للألواح المكونة من بلازما إنسانية مجمعة. تم قياس CSF IL-6 وIL-8 وYKL-40 في مكررات، مع %CVs التالية: CSF YKL-40 (10.4%)، CSF IL-6 (29.2%)، وCSF IL-8 (12.2%). تم قياس CSF mHTT في ثلاث مكررات وتم تحديد وفرة CSF PENK في قياسات فردية.
العشوائية
هذه دراسة طولية رصدية، وليست دراسة تدخلية.
التعمية
لم يكن موظفو الدراسة الذين يقدمون التقييمات السريرية معتمين عن الحالة الجينية بسبب الحاجة للحصول على موافقة مناسبة ومناقشة أي أعراض سريرية محتملة وما إلى ذلك. تم إجراء جميع مراقبة جودة البيانات، والصورة، وتحليل السوائل الحيوية بشكل معتم عن الحالة الجينية. تم تصدير البيانات وتحليلها بواسطة إحصائي مستقل، البروفيسور دوغلاس لانغبين من جامعة أيوا.
تصميم دراسة العلوم السلوكية والاجتماعية
يجب على جميع الدراسات الإفصاح عن هذه النقاط حتى عندما يكون الإفصاح سلبيًا.
وصف الدراسة
وصف موجز لنوع الدراسة بما في ذلك ما إذا كانت البيانات كمية أو نوعية أو مختلطة (مثل: نوعية مقطعية، كمية تجريبية، دراسة حالة مختلطة).
عينة البحث
حدد عينة البحث (مثل: طلاب جامعة هارفارد، القرويين في الهند الريفية) وقدم معلومات ديموغرافية ذات صلة (مثل: العمر، الجنس) وأشر إلى ما إذا كانت العينة تمثل. قدم مبررًا لاختيار عينة الدراسة. بالنسبة للدراسات التي تتضمن مجموعات بيانات موجودة، يرجى وصف مجموعة البيانات والمصدر.
استراتيجية العينة
وصف إجراء أخذ العينات (مثل: عشوائي، كرة ثلج، طبقي، ملائم). وصف الطرق الإحصائية التي تم استخدامها لتحديد حجم العينة مسبقًا أو إذا لم يتم إجراء حساب حجم العينة، وصف كيف تم اختيار أحجام العينات وقدم مبررًا لسبب كفاية هذه الأحجام. بالنسبة للبيانات النوعية، يرجى الإشارة إلى ما إذا تم النظر في تشبع البيانات، وما المعايير التي تم استخدامها لتحديد أنه لا حاجة لمزيد من أخذ العينات.
جمع البيانات
قدم تفاصيل حول إجراء جمع البيانات، بما في ذلك الأدوات أو الأجهزة المستخدمة لتسجيل البيانات (مثل: قلم وورقة، كمبيوتر، جهاز تتبع العين، معدات فيديو أو صوت) وما إذا كان أي شخص حاضرًا بخلاف المشاركين والباحث، وما إذا كان الباحث معتمًا عن الحالة التجريبية و/أو فرضية الدراسة أثناء جمع البيانات.
التوقيت
حدد تواريخ بدء وانتهاء جمع البيانات. إذا كان هناك فجوة بين فترات الجمع، حدد التواريخ لكل مجموعة عينة.
استبعاد البيانات
إذا لم يتم استبعاد أي بيانات من التحليلات، فاذكر ذلك أو إذا تم استبعاد البيانات، قدم العدد الدقيق للاستبعادات والمبرر وراءها، مشيرًا إلى ما إذا كانت معايير الاستبعاد قد تم تحديدها مسبقًا.
عدم المشاركة
حدد عدد المشاركين الذين انسحبوا/رفضوا المشاركة والأسباب المقدمة أو قدم معدل الاستجابة أو اذكر أنه لم ينسحب أي مشاركين/يرفضوا المشاركة.
العشوائية
إذا لم يتم تخصيص المشاركين في مجموعات تجريبية، فاذكر ذلك أو وصف كيف تم تخصيص المشاركين إلى المجموعات، وإذا لم يكن التخصيص عشوائيًا، فصف كيف تم التحكم في المتغيرات المصاحبة.
تصميم دراسة العلوم البيئية والتطورية والبيئية
يجب على جميع الدراسات الإفصاح عن هذه النقاط حتى عندما يكون الإفصاح سلبيًا.
وصف الدراسة
وصف موجز للدراسة. بالنسبة للبيانات الكمية، تشمل عوامل العلاج والتفاعلات، هيكل التصميم (مثل: عامل، متداخل، هرمي)، طبيعة وعدد الوحدات التجريبية والمكررات.
عينة البحث
وصف عينة البحث (مثل: مجموعة من Passer domesticus المعلّمة، جميع Stenocereus thurberi داخل نصب Organ Pipe Cactus الوطني)، وقدم مبررًا لاختيار العينة. عند الاقتضاء، وصف تصنيفات الكائنات، المصدر، الجنس، نطاق العمر وأي تعديلات. حدد ما هي السكان التي من المفترض أن تمثلها العينة عند الاقتضاء. بالنسبة للدراسات التي تتضمن مجموعات بيانات موجودة، وصف البيانات ومصدرها.
استراتيجية العينة
لاحظ إجراء أخذ العينات. وصف الطرق الإحصائية التي تم استخدامها لتحديد حجم العينة مسبقًا أو إذا لم يتم إجراء حساب حجم العينة، وصف كيف تم اختيار أحجام العينات وقدم مبررًا لسبب كفاية هذه الأحجام.
جمع البيانات
وصف إجراء جمع البيانات، بما في ذلك من سجل البيانات وكيف.
التوقيت والنطاق المكاني
حدد تواريخ بدء وانتهاء جمع البيانات، مع ملاحظة تكرار وأوقات أخذ العينات وتقديم مبرر لهذه الخيارات. إذا كان هناك فجوة بين فترات الجمع، حدد التواريخ لكل مجموعة عينة. حدد النطاق المكاني الذي تم أخذ البيانات منه.
استبعاد البيانات
إذا لم يتم استبعاد أي بيانات من التحليلات، فاذكر ذلك أو إذا تم استبعاد البيانات، وصف الاستبعادات والمبرر وراءها، مشيرًا إلى ما إذا كانت معايير الاستبعاد قد تم تحديدها مسبقًا.
إمكانية التكرار
وصف التدابير المتخذة للتحقق من إمكانية تكرار النتائج التجريبية. لكل تجربة، لاحظ ما إذا كانت أي محاولات لتكرار التجربة قد فشلت أو اذكر أن جميع المحاولات لتكرار التجربة كانت ناجحة.
العشوائية
وصف كيف تم تخصيص العينات/الكائنات/المشاركين في المجموعات. إذا لم يكن التخصيص عشوائيًا، فصف كيف تم التحكم في المتغيرات المصاحبة. إذا لم يكن هذا ذا صلة بدراستك، فاشرح لماذا.
التعمية
وصف مدى التعمية المستخدمة أثناء جمع البيانات والتحليل. إذا لم يكن التعمية ممكنة، فصف السبب أو اشرح لماذا لم يكن التعمية ذات صلة بدراستك.
هل تضمنت الدراسة عملًا ميدانيًا؟
ظروف العمل الميداني
وصف ظروف الدراسة للعمل الميداني، مع تقديم المعلمات ذات الصلة (مثل: درجة الحرارة، هطول الأمطار).
الموقع
حدد موقع أخذ العينات أو التجربة، مع تقديم المعلمات ذات الصلة (مثل: خط العرض وخط الطول، الارتفاع، عمق الماء).
الوصول والاستيراد/التصدير
وصف الجهود التي بذلتها للوصول إلى المواطن وجمع عيناتك واستيرادها/تصديرها بطريقة مسؤولة وامتثالًا للقوانين المحلية والوطنية والدولية، مع الإشارة إلى أي تصاريح تم الحصول عليها (أذكر اسم الجهة المصدرة، تاريخ الإصدار، وأي معلومات تعريفية).
الاضطراب
وصف أي اضطراب ناتج عن الدراسة وكيف تم تقليله.
التقارير عن مواد وأنظمة وطرق محددة
نحن نطلب معلومات من المؤلفين حول بعض أنواع المواد والأنظمة التجريبية والطرق المستخدمة في العديد من الدراسات. هنا، حدد ما إذا كانت كل مادة أو نظام أو طريقة مدرجة ذات صلة بدراستك. إذا لم تكن متأكدًا مما إذا كان عنصر القائمة ينطبق على بحثك، اقرأ القسم المناسب قبل اختيار رد.
المواد والأنظمة التجريبية
طرق
غير متاح
مشاركة في الدراسة
غير متاح
□
– الأجسام المضادة
X
X
□ خطوط خلايا حقيقية النواة
X
X
□ علم الحفريات وعلم الآثار
□
X
□ الحيوانات وغيرها من الكائنات
□
X البيانات السريرية
X
□
X
□
الأجسام المضادة
الأجسام المضادة المستخدمة
تفاصيل اختبار السوائل الحيوية (لتحليلات بلازما الإنسان والسائل الدماغي الشوكي) متاحة في الجدول التكميلي 19.
التحقق
وصف التحقق من كل جسم مضاد أساسي للنوع والتطبيق، مع الإشارة إلى أي بيانات تحقق على موقع الشركة المصنعة، الاقتباسات ذات الصلة، ملفات تعريف الأجسام المضادة في قواعد البيانات عبر الإنترنت، أو البيانات المقدمة في المخطوطة.
خطوط خلايا حقيقية النواة
معلومات السياسة حول خطوط الخلايا والجنس والنوع في البحث
مصدر خط الخلايا
التحقق
تلوث الميكوبلازما
خطوط تم التعرف عليها بشكل خاطئ بشكل شائع (انظر سجل ICLAC)
علم الحفريات وعلم الآثار
أصل العينة
إيداع العينة
قدم معلومات عن أصل العينات ووصف التصاريح التي تم الحصول عليها للعمل (بما في ذلك اسم السلطة المصدرة، تاريخ الإصدار، وأي معلومات تعريفية). يجب أن تشمل التصاريح جمع العينات، وعند الاقتضاء، التصدير.
حدد المكان الذي تم إيداع العينات فيه للسماح بالوصول الحر من قبل باحثين آخرين.
حدد مصدر كل خط خلايا مستخدم وجنس جميع خطوط الخلايا الأولية والخلايا المشتقة من المشاركين البشريين أو نماذج الفقاريات.
صف إجراءات التحقق لكل خط خلايا مستخدم أو أعلن أنه لم يتم التحقق من أي من خطوط الخلايا المستخدمة.
أكد أن جميع خطوط الخلايا كانت سلبية لتلوث الميكوبلازما أو صف نتائج الاختبار لتلوث الميكوبلازما أو أعلن أن خطوط الخلايا لم يتم اختبارها لتلوث الميكوبلازما.
اذكر أي خطوط خلايا تم التعرف عليها بشكل خاطئ بشكل شائع تم استخدامها في الدراسة وقدم مبررًا لاستخدامها.
طرق التأريخ
إذا تم تقديم تواريخ جديدة، صف كيف تم الحصول عليها (مثل: الجمع، التخزين، معالجة العينة والقياس)، وأين تم الحصول عليها (أي اسم المختبر)، وبرنامج المعايرة وبروتوكول ضمان الجودة أو اذكر أنه لم يتم تقديم تواريخ جديدة.
□ ضع علامة في هذا المربع لتأكيد أن التواريخ الخام والمعايرة متاحة في الورقة أو في المعلومات التكميلية.
الإشراف الأخلاقي
حدد المنظمة (أو المنظمات) التي وافقت أو قدمت إرشادات حول بروتوكول الدراسة، أو اذكر أنه لم يكن هناك حاجة لموافقة أو إرشادات أخلاقية واشرح لماذا.
لاحظ أنه يجب أيضًا تقديم معلومات كاملة عن موافقة بروتوكول الدراسة في المخطوطة.
الحيوانات وغيرها من الكائنات البحثية
معلومات السياسة حول الدراسات التي تشمل الحيوانات؛ إرشادات ARRIVE الموصى بها للإبلاغ عن أبحاث الحيوانات، والجنس والنوع في البحث
الحيوانات المخبرية
بالنسبة للحيوانات المخبرية، أبلغ عن النوع والسلالة والعمر أو اذكر أن الدراسة لم تشمل الحيوانات المخبرية.
الحيوانات البرية
قدم تفاصيل عن الحيوانات التي تم ملاحظتها أو التقاطها في الميدان؛ أبلغ عن النوع والعمر حيثما كان ذلك ممكنًا. صف كيف تم اصطياد الحيوانات ونقلها وماذا حدث للحيوانات المحتجزة بعد الدراسة (إذا تم قتلها، اشرح لماذا وصف الطريقة؛ إذا تم إطلاقها، قل أين ومتى) أو اذكر أن الدراسة لم تشمل الحيوانات البرية.
الإبلاغ عن الجنس
حدد ما إذا كانت النتائج تنطبق على جنس واحد فقط؛ صف ما إذا كان الجنس قد تم اعتباره في تصميم الدراسة، والطرق المستخدمة لتحديد الجنس. قدم بيانات مفصلة حسب الجنس حيثما تم جمع هذه المعلومات في بيانات المصدر حسب الاقتضاء؛ قدم الأرقام الإجمالية في ملخص الإبلاغ هذا. يرجى الإشارة إذا لم يتم جمع هذه المعلومات. أبلغ عن التحليلات المعتمدة على الجنس حيثما تم تنفيذها، وقدم مبررات لعدم وجود تحليل معتمد على الجنس.
عينات تم جمعها من الميدان
بالنسبة للعمل المخبرية مع العينات التي تم جمعها من الميدان، صف جميع المعلمات ذات الصلة مثل السكن، والصيانة، ودرجة الحرارة، وفترة الإضاءة وبروتوكول نهاية التجربة أو اذكر أن الدراسة لم تشمل عينات تم جمعها من الميدان.
الإشراف الأخلاقي
حدد المنظمة (أو المنظمات) التي وافقت أو قدمت إرشادات حول بروتوكول الدراسة، أو اذكر أنه لم يكن هناك حاجة لموافقة أو إرشادات أخلاقية واشرح لماذا.
لاحظ أنه يجب أيضًا تقديم معلومات كاملة عن موافقة بروتوكول الدراسة في المخطوطة.
البيانات السريرية
معلومات السياسة حول الدراسات السريرية
يجب أن تمتثل جميع المخطوطات لإرشادات ICMJE لنشر الأبحاث السريرية ويجب تضمين قائمة مراجعة CONSORT المكتملة مع جميع التقديمات.
تسجيل التجارب السريرية
NCT06391619
بروتوكول الدراسة
بروتوكول الدراسة الكامل متاح على ClinicalTrials.gov NCT06391619.
جمع البيانات
تم جمع البيانات بين 6 أبريل 2022 و21 مارس 2024. تم توليد جميع المتغيرات المشتقة وفقًا للوصف في الطرق التكميلية وتم تحليلها وفقًا لخطة التحليل المحددة مسبقًا المتاحة على ClinicalTrials.gov (NCT06391619). تم إدخال علامة حيوية سائلة استكشافية إضافية، بروإنكيفالين (PENK) بسبب توفر اختبار جديد.
النتائج
تم تحديد جميع النتائج مسبقًا في خطة التحليل المتاحة على ClinicalTrials.gov NCT06391619 وهي مدرجة في جدول البيانات الموسع 6. تم تضمين نتيجة استكشافية إضافية في تحليل السوائل الحيوية لدينا، CSF PENK، بسبب تطوير اختبار جديد.
البحث المزدوج الاستخدام المثير للقلق
معلومات السياسة حول البحث المزدوج الاستخدام المثير للقلق
المخاطر
هل يمكن أن يشكل الاستخدام العرضي أو المتعمد أو المتهور للمواد أو التقنيات الناتجة عن العمل، أو تطبيق المعلومات المقدمة في المخطوطة، تهديدًا لـ:
لا
نعم
□
□ الصحة العامة
□
□ الأمن القومي
□
□ المحاصيل و/أو الماشية
□
□ النظم البيئية
□
□ أي مجال آخر مهم
التجارب المثيرة للقلق
هل تتضمن العمل أي من هذه التجارب المثيرة للقلق:
لا
نعم
□
□ أظهر كيف تجعل اللقاح غير فعال
□
□ منح مقاومة للمضادات الحيوية أو العوامل المضادة للفيروسات المفيدة علاجياً
□
□ تعزيز ضراوة مسببات الأمراض أو جعل غير الضار ضارًا
□
□ زيادة قابلية انتقال مسببات الأمراض
□
□ تغيير نطاق المضيف لمسبب المرض
□
□ تمكين التهرب من طرق التشخيص/الكشف
□
□ تمكين تسليح عامل بيولوجي أو سم
□
□ أي مجموعة أخرى من التجارب والعوامل المحتملة الضارة
النباتات
مخزونات البذور
أبلغ عن مصدر جميع مخزونات البذور أو المواد النباتية الأخرى المستخدمة. إذا كان ذلك مناسبًا، اذكر مركز مخزون البذور ورقم الفهرس. إذا تم جمع عينات نباتية من الميدان، صف موقع الجمع، التاريخ وإجراءات أخذ العينات.
أنماط نباتية جديدة
صف الطرق التي تم بها إنتاج جميع الأنماط النباتية الجديدة. يشمل ذلك تلك التي تم إنتاجها بواسطة طرق نقل الجينات، تحرير الجينات، الطفرات الكيميائية/الإشعاعية والتهجين. بالنسبة لخطوط النقل الجيني، صف طريقة التحويل، عدد الخطوط المستقلة التي تم تحليلها والجيل الذي تم إجراء التجارب عليه. بالنسبة لخطوط تحرير الجينات، صف المحرر المستخدم، التسلسل الداخلي المستهدف للتحرير، تسلسل RNA الدليل المستهدف (إذا كان ذلك مناسبًا) وكيف تم تطبيق المحرر.
التحقق
صف أي إجراءات تحقق لكل مخزون بذور مستخدم أو نمط جديد تم إنتاجه. صف أي تجارب استخدمت لتقييم تأثير الطفرة، وعند الاقتضاء، كيف تم فحص الآثار الثانوية المحتملة (مثل: إدخالات T-DNA في الموقع الثاني، الموزايكية، تحرير الجينات خارج الهدف).
ChIP-seq
إيداع البيانات
□ أكد أن كل من البيانات الخام والبيانات النهائية المعالجة قد تم إيداعها في قاعدة بيانات عامة مثل GEO.
□ أكد أنك قد أودعت أو قدمت الوصول إلى ملفات الرسم البياني (مثل: ملفات BED) للقمم المستدعاة.
روابط الوصول إلى البيانات
يمكن أن تبقى خاصة قبل النشر.
الملفات في تقديم قاعدة البيانات
جلسة متصفح الجينوم
(مثل
UCSC)
بالنسبة لوثائق “التقديم الأولي” أو “الإصدار المنقح”، قدم روابط وصول للمراجعين. بالنسبة لوثيقة “التقديم النهائي” الخاصة بك، قدم رابطًا للبيانات المودعة.
قدم قائمة بجميع الملفات المتاحة في تقديم قاعدة البيانات.
قدم رابطًا لجلسة متصفح الجينوم مجهولة الهوية لوثائق “التقديم الأولي” و”الإصدار المنقح” فقط، لتمكين المراجعة من قبل الأقران. اكتب “لم يعد ينطبق” لوثائق “التقديم النهائي”.
المنهجية
التكرارات
صف التكرارات التجريبية، مع تحديد العدد، النوع واتفاق التكرار.
عمق التسلسل
صف عمق التسلسل لكل تجربة، مع تقديم العدد الإجمالي للقراءات، القراءات المخصصة بشكل فريد، طول القراءات وما إذا كانت مزدوجة أو مفردة النهاية.
الأجسام المضادة
صف الأجسام المضادة المستخدمة في تجارب ChIP-seq؛ حسب الاقتضاء، قدم اسم المورد، رقم الفهرس، اسم النسخة، ورقم الدفعة.
معلمات استدعاء القمة
حدد برنامج سطر الأوامر والمعلمات المستخدمة لتعيين القراءات واستدعاء القمة، بما في ذلك ملفات ChIP، التحكم والفهرس المستخدمة.
جودة البيانات
وصف الطرق المستخدمة لضمان جودة البيانات بالتفصيل الكامل، بما في ذلك عدد القمم عند مستوى FDR 5% وما فوق 5 أضعاف من الغنى.
برمجيات
وصف البرنامج المستخدم لجمع وتحليل بيانات ChIP-seq. بالنسبة للكود المخصص الذي تم إيداعه في مستودع مجتمعي، يرجى تقديم تفاصيل الوصول.
المؤامرات
أكد أن: □ توضح تسميات المحاور العلامة والفلوركروم المستخدم (مثل CD4-FITC). □ مقياس المحاور مرئي بوضوح. قم بتضمين الأرقام على المحاور فقط للرسم البياني في الأسفل الأيسر من المجموعة (المجموعة هي تحليل للعلامات المتطابقة). □ جميع الرسوم البيانية هي رسوم بيانية متساوية الارتفاع مع نقاط شاذة أو رسوم بيانية بالألوان الزائفة. □ تم تقديم قيمة عددية لعدد الخلايا أو النسبة المئوية (مع الإحصائيات).
المنهجية
تحضير العينة
وصف إعداد العينة، مع توضيح المصدر البيولوجي للخلايا وأي خطوات معالجة الأنسجة المستخدمة.
آلة
حدد الأداة المستخدمة لجمع البيانات، مع تحديد العلامة التجارية ورقم الطراز.
برمجيات
وصف البرنامج المستخدم لجمع وتحليل بيانات تدفق الخلايا. بالنسبة للكود المخصص الذي تم إيداعه في مستودع مجتمعي، يرجى تقديم تفاصيل الوصول.
وفرة تجمع الخلايا
وصف وفرة تجمعات الخلايا المعنية ضمن الفصائل بعد الفرز، مع تقديم تفاصيل حول نقاء العينات وكيف تم تحديده.
استراتيجية البوابة
وصف استراتيجية البوابات المستخدمة في جميع التجارب ذات الصلة، مع تحديد بوابات FSC/SSC الأولية لعدد الخلايا الابتدائي، مع الإشارة إلى المكان الذي يتم فيه تحديد الحدود بين مجموعات الخلايا الملونة بـ “إيجابي” و”سلبي”.
التصوير بالرنين المغناطيسي
تصميم تجريبي
نوع التصميم
دراسة رصدية لمشاركين في HDGE ومشاركين أصحاء.
مواصفات التصميم
تم تجنيد المشاركين بناءً على قدرتهم على الخضوع لتصوير الرنين المغناطيسي بقوة 3 تسلا (3T). بعد التجنيد، لم يتمكن بعض المشاركين من إكمال تقييمات الرنين المغناطيسي بسبب رهاب الأماكن المغلقة غير المتوقع وقيود أخرى.
أكثر من 80% من المجموعة خضعت للتصوير بالرنين المغناطيسي.
مقاييس الأداء السلوكي
لم يتم تضمين أي مقاييس للأداء السلوكي مع الرنين المغناطيسي.
استحواذ
شدة المجال
3-تسلا (3T).
معلمات التسلسل والتصوير
تم توفيرها في الطرق التكميلية.
مجال الاستحواذ
□
الدماغ بالكامل.
الرنين المغناطيسي الانتشاري
□ غير مستخدم
التحضير المسبق
برمجيات المعالجة المسبقة
تم استخدام FreeSurfer 7.2.0 لتحليلات الاتصال الهيكلي، وFreeSurfer 6 لتصنيف HD-ISS، كما هو محدد في Tabrizi et al.، 2022 (doi: 10.1016/S1474-4422(22)00120-X). شملت البرمجيات الإضافية FSL 5.0.11، DTITK 2.3.3، MIDAS 6.7، VBM (SPM12)، MALP-EM 1.2، وMRtrix 3.0.4. تتوفر تفاصيل ومعلومات إضافية في الطرق التكميلية.
التطبيع
DTITK 2.3.3، VBM (SPM12)، MIDAS 6.7.
قالب التطبيع
نموذج محدد للدراسة في فضاء JHU (موري وآخرون، 2008؛ doi: 10.1016/j.neuroimage.2007.12.035).
إزالة الضوضاء والعيوب
إعادة شحن، تصحيح إيدي وتصحيح حلقة FA باستخدام DTITK 2.3.3، تصحيح الانحياز باستخدام N3 (Sled وآخرون، 1998؛ doi: 10.1109/42.668698) ضمن MIDAS 6.7.
تصفية الحجم
إعادة شحن، تصحيح إيدي وإزالة حلقة FA باستخدام DTITK 2.3.3، تصحيح الانحياز باستخدام N3 (Sled وآخرون، 1998؛ doi:
النمذجة الإحصائية والاستدلال
نوع النموذج والإعدادات
□
النماذج الخطية المختلطة.
التأثيرات المختبرة
اختلافات المجموعة، الارتباطات مع العمر وCAG، السوائل الحيوية، ونسبة التوسع الجسدي.
حدد نوع التحليل:
□ قائم على العائد على الاستثمار
نوع الإحصاء للاستدلال
(انظر إكلوند وآخرون 2016)
حدد على مستوى الفوكسل أو على مستوى الكتلة وقدم جميع المعلمات ذات الصلة لطرق الكتلة.
تصحيح
المقارنات المتعددة باستخدام معدل الاكتشاف الخاطئ (FDR).
النماذج والتحليل
غير متوفر
مشارك في الدراسة
X □ الاتصال الوظيفي و/أو الفعال
تحليل الرسوم البيانية □ النمذجة متعددة المتغيرات أو التحليل التنبؤي
الاتصال الوظيفي و/أو الفعال
قم بالإبلاغ عن مقاييس الاعتماد المستخدمة وتفاصيل النموذج (مثل ارتباط بيرسون، الارتباط الجزئي، المعلومات المتبادلة).
تحليل الرسوم البيانية
قم بالإبلاغ عن المتغير التابع ومقياس الاتصال، مع تحديد ما إذا كان الرسم البياني موزونًا أو ثنائيًا، على مستوى الموضوع أو المجموعة، والملخصات العالمية و/أو العقد المستخدمة (مثل معامل التجميع، الكفاءة، إلخ).
مركز مرض هنتنغتون، قسم الأمراض التنكسية العصبية، معهد كوين سكوير لعلم الأعصاب، كلية لندن الجامعية، لندن، المملكة المتحدة.قسم الطب النفسي، جامعة كامبريدج، كامبريدج، المملكة المتحدة.مدرسة العلوم الحيوية الجزيئية، كلية الطب والبيطرة وعلوم الحياة، جامعة غلاسكو، غلاسكو، المملكة المتحدة.قسم الطب النفسي والكيمياء العصبية، معهد علوم الأعصاب والفيزيولوجيا، أكاديمية ساهلجرينسكا في جامعة غوتنبرغ، مالمو، السويد.مختبر الكيمياء العصبية السريرية، مستشفى ساهلجرينسكا الجامعي، مالمو، السويد.قسم علوم الحاسوب ومركز حوسبة الصور الطبية، كلية لندن الجامعية، لندن، المملكة المتحدة.مركز أبحاث الخرف، قسم الأمراض التنكسية العصبية، معهد كوين سكوير لعلم الأعصاب، كلية لندن الجامعية، لندن، المملكة المتحدة.قسم إصلاح الدماغ وإعادة التأهيل، معهد كوين سكوير لعلم الأعصاب، كلية لندن الجامعية، لندن، المملكة المتحدة.قسم الطب النفسي وعلم الإحصاء الحيوي، كلية كارفر للطب وكلية الصحة العامة، جامعة آيوا، آيوا سيتي، آيوا، الولايات المتحدة الأمريكية.معهد أبحاث الخرف، كلية لندن الجامعية، لندن، المملكة المتحدة.قسم الأمراض التنكسية العصبية، معهد كوين سكوير لعلم الأعصاب، جامعة كوليدج لندن، لندن، المملكة المتحدة.كلية الطب بجامعة لشبونة (FMUL)، لشبونة، البرتغال.شركة CHDI للإدارة، مستشارون لمؤسسة CHDI، برينستون، نيو جيرسي، الولايات المتحدة الأمريكية.قسم علم النفس، جامعة كامبريدج، كامبريدج، المملكة المتحدة.مركز هونغ كونغ للأمراض العصبية التنكسية، خليج المياه الصافية، هونغ كونغ، الصين.مركز أبحاث مرض الزهايمر في ويسكونسن، كلية الطب والصحة العامة بجامعة ويسكونسن، جامعة ويسكونسن-ماديسون، ماديسون، ويسكونسن، الولايات المتحدة الأمريكية.معهد العلوم العصبية المعرفية، كلية لندن الجامعية، لندن، المملكة المتحدة.قسم العلوم العصبية السريرية، جامعة كامبريدج، حرم كامبريدج الطبي الحيوي، كامبريدج، المملكة المتحدة.مؤسسة خدمات مستشفيات جامعة كامبريدج NHS، كامبريدج، المملكة المتحدة.وحدة علوم الإدراك والدماغ، مجلس البحوث الطبية، جامعة كامبريدج، كامبريدج، المملكة المتحدة.ساهم هؤلاء المؤلفون بالتساوي: راشيل آي. سكاهيل، مينا فارغ. البريد الإلكتروني:s.tabrizi@ucl.ac.uk
الشكل البياني الموسع 2 | معدل التغير السنوي في علامات السوائل البيولوجية غير المهمة. يعرض اللوح مقارنة بين المتبقيات المعيارية لمعدل التغير السنوي في مجموعات HDGE مقابل المجموعات الضابطة لـ: (أ) تاو في السائل الدماغي الشوكي، (ب) GFAP في السائل الدماغي الشوكي، (ج) UCH-L1 في السائل الدماغي الشوكي، (د) تاو في البلازما، (هـ) GFAP في البلازما، (و) UCH-L1 في البلازما، (ز) IL-6 في السائل الدماغي الشوكي، (ح) IL-8 في السائل الدماغي الشوكي و (ط) NfL في البلازما. تشير المتبقيات المعيارية السلبية إلى أن معدل التغير كان أقل من المعدل المتوسط المعدل للتغير عبر كلا المجموعتين. تمثل الخطوط الأفقية الوسائط، وتوضح الصناديق الربعين العلوي والسفلي، وتكون الشعيرات IQR. تم إجراء جميع التحليلات الإحصائية باستخدام نماذج خطية ذات تأثير مختلط مع تأثير عشوائي خاص بالمشارك، مع التحكم في العمر، الجنس وتفاعلهما. تم استخدام تركيزات محولة إلى اللوغاريتم الطبيعي كنتائج في هذه النماذج. تم إجراء مقارنات جماعية إحصائية ثنائية الجانب وارتباطات مع التحكم في تأثيرات العمر والجنس وتم تصحيحها لمقارنات متعددة باستخدام معدل الاكتشاف الكاذب. السائل الدماغي الشوكي؛ معدل الاكتشاف الكاذب؛ بروتين GFAP، بروتين الألياف الدبقية الحمضية؛ HDGE، جين HD الموسع؛ IL، إنترلوكين؛ IQR، النطاق الربعي؛ NfL، خيوط الأعصاب الخفيفة؛ UCH-L1، هيدروكسيلاز الكربوكسيل يوبكويتين L1؛ YKL-40، المعروف أيضًا باسم بروتين شيتيناز-3 الشبيه-1 (CHI3L1).
Somatic CAG repeat expansion in blood associates with biomarkers of neurodegeneration in Huntington’s disease decades before clinical motor diagnosis
Received: 2 August 2024
Accepted: 15 November 2024
Published online: 17 January 2025
Check for updates
A list of authors and their affiliations appears at the end of the paper
Huntington’s disease (HD) is an autosomal dominant neurodegenerative disease with the age at which characteristic symptoms manifest strongly influenced by inherited HTT CAG length. Somatic CAG expansion occurs throughout life and understanding the impact of somatic expansion on neurodegeneration is key to developing therapeutic targets. In 57 HD gene expanded (HDGE) individuals, years before their predicted clinical motor diagnosis, no significant decline in clinical, cognitive or neuropsychiatric function was observed over 4.5 years compared with 46 controls (false discovery rate (FDR) > 0.3). However, cerebrospinal fluid (CSF) markers showed very early signs of neurodegeneration in HDGE with elevated neurofilament light (NfL) protein, an indicator of neuroaxonal damage (FDR ), and reduced proenkephalin (PENK), a surrogate marker for the state of striatal medium spiny neurons (FDR ), accompanied by brain atrophy, predominantly in the caudate (FDR ) and putamen (FDR ). Longitudinal increase in somatic CAG repeat expansion ratio (SER) in blood was a significant predictor of subsequent caudate (FDR ) and putamen (FDR = 0.148) atrophy. Atypical loss of interruption HTT repeat structures, known to predict earlier age at clinical motor diagnosis, was associated with substantially faster caudate and putamen atrophy. We provide evidence in living humans that the influence of CAG length on HD neuropathology is mediated by somatic CAG repeat expansion. These critical mechanistic insights into the earliest neurodegenerative changes will inform the design of preventative clinical trials aimed at modulating somatic expansion. ClinicalTrials.gov registration: NCT06391619.
Huntington’s disease (HD) is a devastating condition characterized by loss of striatal medium spiny neurons (MSNs) and striatal neurodegeneration leading to impaired motor, cognitive and neuropsychiatric function which typically manifests in middle age, with clinical diagnosis defined by the appearance of unequivocal HD-related motor signs. There are currently no disease-modifying treatments .
HD is an autosomal dominant disorder and is caused by an expanded CAG repeat in the huntingtin gene (HTT) coding for
polyglutamine in the mutant huntingtin protein (mHTT), which is the presumed toxic entity leading to neuronal dysfunction and death. It is well established that inherited CAG repeat length has a strong influence on age at clinical motor diagnosis . Notably, the HTT repeat is somatically unstable and expansion of tens or even hundreds of repeats are observed in the most vulnerable striatal neurons ; greater somatic expansion occurs with longer initial CAG length. Evidence indicating that faster individual-specific rates of somatic expansion in brain are
associated with earlier clinical motor diagnosis and faster disease progression strongly suggests that somatic expansion is a key mechanism explaining the CAG effect on disease progression. Indeed, it has been suggested that somatic expansion is required to generate pathology, and that HD involves two thresholds as follows: first, the inherited CAG length that leads to further somatic expansion, and second, the intracellular pathogenic threshold above which neuronal dysfunction and death occur . Consistent with this, a recent postmortem study suggests that neurons may experience decades of ‘biologically quiet’ somatic CAG repeat expansion with neuronal damage triggered by a cascade of repeat-length dependent transcriptional dysregulation events only when the CAG reaches a threshold of repeats . Further understanding the dynamics of somatic expansion directly in the brain is hampered by the nonavailability of brain biopsy material from young living participants. Although somatic CAG expansion is clearly cell-type dependent , faster individual-specific rates of somatic expansion in blood DNA are also associated with earlier clinical motor diagnosis , suggesting that individual-specific somatic expansion rates in blood DNA are at least partially predictive of individual-specific somatic expansion rates in the brain. This hypothesis is supported by genetic modifier studies that reveal a panoply of DNA repair gene variants as modifiers of both HTT somatic expansion and HD clinical phenotypes .
The polyglutamine-encoding CAG repeat tract in HTT is followed just downstream with a polymorphic polyproline-encoding CCG repeat. Typically, the intervening sequence between the CAG and CCG repeat tracts is comprised of a glutamine-encoding CAACAG cassette and a proline-encoding CCGCCA cassette. However, a number of atypical HTT repeat structures have been identified with loss of either or both of the intervening CAACAG or CCGCCA cassettes associated with an earlier age at clinical motor diagnosis; conversely, duplication of the CAACAG cassette delays this milestone . These data reveal that both HD age at clinical motor diagnosis and the somatic expansion potential of the repeat are best predicted by pure CAG repeat length, rather than encoded polyglutamine length, providing additional support for a key role for somatic expansion in driving disease onset .
The monogenic nature of HD and the existence of diagnostic and predictive testing for at-risk family members makes it a tractable disease and much progress has been made towards developing disease modification treatments . The first phase trial of an antisense oligonucleotide (ASO), tominersen, showed dose-dependent lowering of mutant huntingtin levels . Although the subsequent phase 3 trial was halted early due to adverse safety concerns , a phase 2 study to better establish safety and tolerability earlier in disease progression is ongoing (ClinicalTrials.gov registration: NCT05686551). Alternative approaches such as allele-specific huntingtin-lowering, protein splicing modulation, and gene therapy are also currently being trialed (reviewed in ref. 22). Additionally, somatic expansion and proteins, such as MSH3 and FAN1, are now being actively pursued as therapeutic targets in HD. A key question in using such therapies will be determining the optimal timing for treatment. The appearance of HD motor signs is already accompanied by substantial striatal neurodegeneration, and earlier treatment seems likely to produce greater clinical benefit. However, all the studies to date have relied on postmortem brain analyses to model the link between CAG repeat expansion to the earliest pathological progression of the disease. Understanding the triggers of the neurodegenerative process is vital in the search for future therapies and identifying the best time to treat to provide therapeutic intervention.
The greatest opportunity to influence disease progression lies in early treatment, with the goal of delaying or preventing clinical motor diagnosis. Numerous large observational studies show that brain changes occur decades from predicted clinical motor diagnosis and that subtle cognitive and motor signs emerge as HD gene expanded (HDGE) individuals approach clinical motor diagnosis. The recent
introduction of the HD Integrated Staging System (HD-ISS) provides a new empirical framework for classifying people with HD throughout life , with stage 0 being the HDGE group with striatal volumes within the general population range, stage 1 being the presence of a biomarker of pathogenesis (caudate and/or putamen volume change), stage 2 being the presence of motor and/or cognitive signs and stage 3 being marked by the onset of functional impairment . Cohorts in the earliest stages will likely gain the most benefit from preventative therapies.
A key challenge in delivering preventative treatments is to identify and validate robust measures in HD-ISS stages 0 and 1 , where the absence of outward signs of impairment renders established motor and cognitive testing batteries insensitive. HD Young Adult Study (HD-YAS) is a unique cohort, years from predicted clinical motor diagnosis at baseline with deep phenotyping including biofluid, imaging, clinical, cognitive and motor assessments. Our cross-sectional baseline data demonstrated subtle elevations in biofluid biomarkers, such as cerebrospinal fluid (CSF) neurofilament light (NfL), accompanied by slightly smaller putamen volumes in the HDGE group compared to unaffected controls . Despite this, there was no difference in functional performance between the groups. This cohort, therefore, spans an optimum window for investigating the potential of interventions to delay or prevent symptoms.
Here we present 4.5-year follow-up data from HD-YAS, a deepphenotyped longitudinal study of young stages 0 and 1 HDGE adults, ~19 years before clinical motor diagnosis. We hypothesized that the effects of somatic expansion in the brain might be detected long before clinical motor onset and tested this hypothesis through detailed longitudinal analysis of preclinical HD phenotypes, biomarkers of neurodegeneration and somatic expansion in blood DNA. We examined change over time in a range of assessments with the aim of identifying ongoing neuropathology and associations with somatic CAG expansion in blood DNA and HTT repeat structures, decades before predicted clinical motor diagnosis, and biomarkers of disease progression, which may have utility in future prevention trials.
Results
Participant characteristics
A total of 131 (64 HDGE and 67 controls) participants attended at baseline and 103 ( 57 HDGE and 46 controls) returned for follow-up 4.5 years later (see Extended Data Fig. 1 for reasons for dropout). To account for those not returning, we recruited 23 new participants HDGE and 14 controls) giving a total of 154 participants ( 73 HDGE and 81 controls). At baseline, participants of the cohort were in HD-ISS stage 0, in stage 1 and 1 ( ) in stage 2 (Fig. 1a). Over 4.5 years, participants moved from stage 0 to stage 1; there was no progression to stage 2. The transition in staging within the HD-YAS cohort is depicted by overlaying the probability matrix for each HD-ISS stage across different ages for individuals with a mean CAG repeat length of 42 , comparable to the mean CAG repeat length of our cohort (Fig. 1b). Here we describe further longitudinal results from the participants; cross-sectional results, updated from the original baseline study, are provided in Supplementary Results and Discussion.
There were no significant differences (false discovery rate between the HDGE and control groups in age, sex, interval between visits, education score or National Adult Reading Test (a measure of premorbid intelligence; Extended Data Table1).
Cognitive and neuropsychiatric assessments
There was no significant longitudinal disease-related decline in any of the comprehensive cognitive (FDR > 0.8; Fig. 1c) or neuropsychiatric (FDR > 0.3; Fig. 1d) assessments, demonstrating that change in the HDGE group was no different from matched controls. Cross-sectional results are shown in Supplementary Fig. 1 and summary statistics are provided in Supplementary Tables 1 and 2 for longitudinal and Supplementary Tables 3 and 4 for cross-sectional results.
Neuroimaging
After quality control, longitudinal data were available for 88 ( 54 HDGE and 34 controls) participants for volumetric imaging, 83 (50 HDGE and 33 controls) for diffusion-weighted imaging (DWI) and 75 ( 43 HDGE and 32 controls) for multiparametric mapping (MPM). As left-handed participants were excluded, 70 ( 43 HDGE and 27 controls) participants were available for the structural connectivity analysis. See Supplementary Table 5 and Supplementary Methods for further details.
The HDGE group showed significantly greater rates of atrophy in putamen ( , FDR ) and caudate ( , FDR ). There were also significant group differences for gray matter ( ), white matter ( , ) and whole brain ( ) with associated ventricular expansion ( ; Fig. 2). Caudate, putamen and white matter loss were significantly predicted by age and CAG ( , , respectively).
DWI demonstrated elevated rates of longitudinal change in all diffusion and neurite orientation and dispersion density imaging metrics across multiple regions of interest in the HDGE group compared to controls (FDR < 0.15). The splenium of the corpus callosum, the anterior capsule and the external capsule showed associations with age and CAG (FDR < 0.15). There were no significant between-group differences in the rate of change for any of the structural connectivity (all FDR > 0.4) or MPM measures (all FDR > 0.3), nor any evidence of an influence of age and CAG (all FDR > 0.15).
Neuroimaging results suggest that across HD-ISS stages 0 and 1, there are already elevated rates of brain atrophy accompanied by subtle microstructural white matter changes. See Extended Data Tables 2 and 3 for summary statistics for longitudinal volumetric and diffusion results, respectively. Summary statistics for remaining longitudinal metrics are provided in Supplementary Tables 6 and 7 and cross-sectional data in Supplementary Tables 8-11.
Fig. 1 | Longitudinal change in clinical, cognitive and neuropsychiatric measures. a, The distribution of HD-ISS stages at baseline and at follow-up 4.5 years later.b, A probability matrix for being in each HD-ISS stage across different ages for individuals with a mean CAG repeat length of 42 , which is comparable to the HD-YAS cohort. These probabilities are derived from data in the Enroll-HD, PREDICT-HD and TRACK-HD studies, which were used to develop the HD-ISS . The black dashed box highlights the HD-YAS cohort at baseline, while the red box indicates their position at follow-up after 4.5 years. c, A radar plot showing group differences in longitudinal changes in cognitive measures. d, A radar plot showing group differences in longitudinal changes for neuropsychiatric and functional measures. The black line represents the standardized mean difference between the HDGE and control groups, with conventional frequentist CI shaded in gray. The red circle denotes no difference between means; values within this circle indicate greater change over time in the HDGE group. After FDR correction for multiple comparisons, there were no significant longitudinal group differences in any cognitive or neuropsychiatric measures. Further details on longitudinal changes in cognitive measures can be found in Supplementary Table 1 and neuropsychiatric measures in Supplementary Table 2. Cross-sectional changes in cognitive measures are presented in Supplementary Table 3 and neuropsychiatric changes in Supplementary Table 4. Cross-sectional findings are visualized in Supplementary Fig. 1. AMI, Apathy Motivation Index; BIS, Barratt Impulsivity Scale; CI, confidence interval; ED, extra dimensional; FSBS, Frontal Systems Behavioral Scale; IED, intra-extra-dimensional set shifting; OCI, Obsessive-Compulsive Inventory; OTS, One Touch Stockings; PAL, paired associates learning; PSQI, Pittsburgh Sleep Quality Index; RVP, rapid visual processing; RVP A’, a signal detection theory measure of target sensitivity and mean response latency; SDMT, Symbol Digit Modalities Test; SF-36, 36-item self-report survey; SSRT, stop-signal reaction time; SSTAI, Speilberger State-Trait Anxiety Inventory; SWM, spatial working memory; ZSDS, Zung Self-rating Depression Score.
Biofluids
A total of 216 biofluid samples were collected across baseline and follow-up visits over the 4.5 -year interval. Paired fasting CSF and plasma samples were acquired in 86 (53 HDGE and 33 controls) of the longitudinal participants.
a
From a significantly increased baseline, CSF NfL (Fig. 3a) and CSF YKL-40 (also known as chitinase-3 like-protein-1 (CHI3L1)) (Fig. 3c) rose more rapidly in HDGE compared to controls , and , respectively). New to this timepoint, proenkephalin (PENK), a surrogate marker for striatal MSN state, measured in CSF, showed a significant longitudinal reduction in HDGE individuals compared to controls ; Fig. 3b). An increase in plasma NfL was nonsignificant ( , FDR = 0.669; Extended Data Fig. 2).
Cross-sectionally, log concentrations of both CSF NfL ( ) and PENK ( ) were highly associated with age, CAG length and their interaction. There was also evidence for an influence on longitudinal change in CSF NfL ( ) and . Plasma NfL had a similar cross-sectional association ( ,FDR ) but no significant longitudinal association with age and CAG. Regression coefficients are reported in Supplementary Tables 12-14.
Slightly higher annualized rates of change in NfL in CSF and plasma were observed in the HDGE group at stage 0 compared to stage 1 on follow-up but did not reach the threshold of significance (FDR ). Mean CSF NfL levels (across both visits) were higher in HD-ISS progressor (stages 0 to mean , scale) compared to nonprogressors (stage 0 to mean , log scale; stage 1 to mean , log scale; Supplementary Table 15). After adjusting for age, sex and their interaction, the difference between stage 0 to 1 progressors and stage 0 nonprogressors was statistically significant . Similarly, the difference between stage 0 to 1 progressors and stage 1 nonprogressors was significant ( ) when controlling for age and sex, but nonsignificant without these adjustments. No significant differences were observed for plasma NfL levels (Supplementary Table 16).
CSF mHTT levels were notably very low than later disease stages , with only of samples exceeding the lower limit of quantification and demonstrating an acceptable coefficient of variation below (Supplementary Fig. 2).
The rate of change in other biofluid markers, including plasma NfL, CSF and plasma tau, CSF and plasma glial fibrillary acidic protein (GFAP), CSF and plasma ubiquitin carboxyl-terminal hydrolase L1 (UCH-L1), and CSF interleukin-6 (IL-6) and IL-8, showed no significant differences between groups (Extended Data Fig. 2). Additionally, none of the fluid biomarkers, including NfL, had an association with age, CAG or age-by-CAG interaction (FDR > 0.15). See Supplementary Table 17 for longitudinal and Supplementary Table 18 for cross-sectional summary statistics.
Somatic expansion ratios in blood
Significant longitudinal increases in the somatic expansion ratio (SER) were detected in blood DNA in the HDGE group over 4.5 years ( ), with SER clearly increasing as early as HD-ISS stage 0 (Fig. 4a). SER rates of change were strongly influenced by an accelerating effect of CAG repeat length ( ).
HTT allele structures
The majority of the HDGE group exhibited the typical HTT repeat structure on their expanded allele ( ), while a small subset ( ) showed atypical allelic variations (Fig. 5a). Specifically, the CAACAG duplication was observed in participant, the CAACAGCCGCCA double loss was found in and had the CCGCCA loss.
Predictors of progression
Baseline NfL, both plasma and CSF, and CSF PENK were predictors of atrophy over time in all brain regions (all FDR < 0.04), even after controlling for the effect of age and CAG (all FDR < 0.12; Extended Data Table 4). Rate of change in caudate and putamen was most strongly associated with change in and , respectively) and plasma NfL ( , and , respectively) and the association remained after controlling for age and CAG effects (all FDR ). Rates of change in caudate and putamen were also associated with longitudinal change in CSF PENK before ( , FDR and , respectively) and after ( , FDR and , FDR , respectively) age-by-CAG correction.
Longitudinal increase in SER was a significant predictor of the rate of subsequent caudate volume change before ( ) and after age-by-CAG correction ( ; Fig. 4b). Longitudinal increase in SER was also a significant predictor of the rate of subsequent putamen volume change before ( ) and after ( , FDR ) age-by-CAG correction (Fig. 4c). Baseline SER was strongly associated with cross-sectional levels of CSF NfL , FDR ; Fig. 4d) and CSF PENK ( , FDR ; Fig. 4e) before age-by-CAG correction. However, these associations did not remain significant after the correction (CSF NfL ; CSF PENK ).
After controlling for CAG, age, age-by-CAG, sex and SER effects, compared to typical allele structure, the loss of CAACAG CCGCCA atypical allele had significant effects on rates of caudate ( ; Fig. 5b.i) and putamen ( ; Fig. 5b.ii) atrophy as well as cross-sectional CSF NfL ( ;Fig. 5b.iii) and CSF PENK ( ; Fig. 5b.iv) levels, with the loss of the intervening CAACAG CCGCCA associated with an accelerated neurodegenerative course (Extended Data Fig. 3). Notably, after correction for pure CAG length, there was no detectable association between atypical allele structure and SER (FDR > 0.15).
Sample size calculations
Extended Data Table 5 shows hypothetical sample size calculations for those variables with significant longitudinal effects in the HDGE group. For a treatment effect over 2 years in stages 0 and 1 , total sample sizes would be 232,282 and 326 for rates of change in CSF NfL levels, caudate and putamen volume, respectively. For a 3-year trial, these numbers would be reduced to 104, 126 and 146, respectively.
Fig. 2 | Annualized changes in volumetric measures longitudinally. a-f, Putamen (a), caudate (b), gray matter (c), white matter (d), whole brain (e) and ventricles (f) are shown. For each structure, we present (i) comparison of standardized residuals (age- and sex-adjusted) for the annualized rate of change in HDGE ( ; red) and control ( ;gray) groups, (ii) comparison of standardized residuals for annualized rate of change within HDGE by followup HD-ISS stage 0 (orange) and stage 1 (green) and (iii) scatterplots of volume by CAP100 score, colored by HD-ISS stage within HDGE. Repeated visits per participant are connected by black lines, with baseline shown as squares and follow-up as circles. HD-ISS stages are represented as follows: stage 0 (orange), stage 1 (green) and stage 2 (blue). Negative standardized residuals denote a rate of change below the adjusted mean across groups. Each box plot displays the median (horizontal line), interquartile range (box) and whiskers extending to IQR. Sample sizes ( ) reflect biological replicates per group, with for HDGE and for controls; data represent longitudinal measures per participant, with no technical replicates. Volumetric change analyses for brain structures, excluding the putamen, used a single boundary-shift integral measure or voxel-based morphometry measure of scan pairs per participant (baseline to follow-up) converted to annual rates and modeled by ordinary least squares regression. Putamen changes were calculated by subtracting baseline MALP-EM segmentations from follow-up segmentations and dividing the result by the follow-up duration. Analysis results and residual adjustments reflect control for baseline age, sex and their interaction. Statistical two-sided group comparisons were adjusted for multiple comparisons using the FDR, with values, degrees of freedom and confidence limits provided in Extended Data Table 2. CAP, CAG-Age Product; ICV, intracranial volume;IQR, interquartile range.
Fig. 3 | Annualized changes in biofluid markers longitudinally. a-c, CSF NfL (a), CSF PENK (b) and CSF YKL-40 (c) are shown. For each biofluid biomarker, we present (i) comparison of standardized residuals (age- and sex-adjusted) for the annualized rate of change in HDGE ( ; red) and control ( ;gray) groups, (ii) comparison of standardized residuals for annualized rate of change within HDGE by HD-ISS stage 0 (orange) and stage 1 (green) and (iii) scatterplots of biofluid marker levels by CAP100 score, colored by HD-ISS stage within HDGE. Repeated visits per participant are connected by black lines, with baseline shown as squares and follow-up as circles. HD-ISS stages are represented as follows: stage 0 (orange), stage 1 (green) and stage 2 (blue). Negative standardized residuals denote a rate of change below the adjusted mean across groups. Each box plot displays the median (horizontal line), interquartile range (box) and whiskers extending to IQR. Sample sizes ( ) reflect biological replicates
per group, with for HDGE and for controls; data represent longitudinal measures per participant. All statistical analyses were conducted using mixed-effect linear models with a participant-specific random effect, controlling for age, sex and their interaction. Natural log-transformed concentrations served as the outcomes in these models. Statistical two-sided group comparisons were adjusted for multiple comparisons using the FDR, with values, degrees of freedom and confidence limits provided in Supplementary Table 17. Please note one prominent outlier in the control group with marked NfL elevation, as previously reported at baseline . This outlier showed no additional cause on further investigation, with normal T1 MRI brain scan and normal CSF white and red cell counts. Additionally, this control participant did not deviate from other biofluid or cognitive parameters and was, therefore, not excluded from the analysis.
Fig. 4 | Effects of somatic expansion. a, Longitudinal changes in SER-(i) SER trajectories by CAP100 and HD-ISS stage with baseline visits represented by squares and follow-up visits by circles, and lines connecting data from the same individual, where stage 0 is shown in orange, stage 1 in green, and stage 2 in blue; (ii) changes in SER between visits and (iii) changes in SER by age and CAG repeat length.b,c, Associations between longitudinal SER increase and caudate (b) and putamen (c) volume change, (i) before and (ii) after age-by-CAG correction.
d,e, Associations of baseline SER with cross-sectional CSF NfL (d) and CSF PENK (e) levels, with (i) before and (ii) after age-by-CAG correction. Associations were modeled via mixed effects regression using the measure on the vertical axis as the outcome and controlled for age, sex and age-by-sex interaction. Longitudinal caudate change based on a single boundary-shift integral measure per participant was an exception where an analogous ordinary least-squares model was employed.
Discussion
We have used state-of-the-art multimodal measures of cognition, neuroimaging, genetics and biofluid markers in a new assessment battery to study a unique cohort of young adult HDGE who were at baseline, on average, approximately 23 years before predicted clinical motor diagnosis, comparing them to matched controls in an unprecedented level of detail. Our baseline cross-sectional data identified early signs of neurodegeneration despite the maintenance of intact brain function and here we present 4.5-year follow-up data with important new mechanistic insights into what drives neurodegeneration in humans carrying the HD mutation (Fig. 6).
Our data highlight the role of inherited CAG repeat length and somatic expansion on neurodegeneration, decades before clinical motor diagnosis. We identify brain atrophy, elevated levels of CSF NfL, a marker of neuronal damage, and reduced levels of CSF PENK, a marker of striatal MSN state, in the earliest adult HD cohort studied to date. Despite evidence for the start of the neurodegenerative process, there is an absence of any decline in cognitive, motor or neuropsychiatric function at HD-ISS stages 0 and 1 . Notably, we show that somatic CAG repeat expansion measured longitudinally in blood,
a validated measure of somatic expansion in living patients , is a predictor of the effect of CAG repeat length on striatal markers of very early neurodegeneration.
Consistent with the elevated levels of CSF NfL we reported at baseline , we now show substantially greater rates of increase in CSF NfL in HDGE compared to controls, indicating accelerating neuroaxonal injury from the earliest stages. Most notably, the rate of change in CSF NfL in HD-ISS stage 0 was at least as fast as in stage 1, suggesting rapid neuroaxonal injury increases even before reaching the threshold of caudate or putamen volumetric loss cutoff for stage 1. Interestingly, mean CSF NfL levels were higher in HD-ISS stage 0 to 1 progressors compared to nonprogressors in both stage 0 and stage 1. The annualized rates of increase in CSF NfL across the whole HDGE group (mean ) are slightly lower than those reported in the previous HD-CSF cohort (mean , which is consistent with the HD-YAS cohort being towards the beginning of the neurodegenerative process.
Axonal damage and injury lead to leakage of NfL into the CSF and are elevated in active inflammation . NfL is a nonspecific marker of neuronal injury, and elevated levels have been reported in other
Fig. 5 |Effects of CAG architecture and allelic variants. a, Illustration of the HTT repeat structure and allelic variations in the HDGE cohort ( ), including the typical structure and four atypical variants-CAACAG duplication (green), CAACAG loss (black, not observed in cohort), CAACAG CCGCCA loss (red) and CCGCCA loss (blue). b, Illustration of atypical allele differences for key biomarker measures. The ANOCOVA models controlled for CAG length, sex and age, including age interactions with CAG and sex. Participant-specific random effects were included except for caudate change based on one boundary-shift
integral per participant. (i) The effect on caudate volume change, with significant differences between typical alleles and CAACAG CCGCCA loss ( ) and a trend with CCGCCA loss . (ii) The effect on putamen volume change, with significant differences between typical alleles and CAACAG CCGCCA loss ( ). (iii and iv) Cross-sectional effects on CSF NfL (iii) and CSF PENK (iv) levels, respectively, with significant differences noted for CAACAG CCGCCA loss. Statistically significant comparisons ( ) are indicated by asterisks. Please note no longitudinal imaging for CAACAG duplication, hence no plot in (i) or (ii).
neurodegenerative conditions . Increases in CSF NfL are not necessarily attributable to neuronal death and could result from other degenerative processes such as leaky axons. Nevertheless, it is a clear marker of neuroaxonal pathology and therefore understanding CSF NfL temporal dynamics and kinetics can provide valuable insights into mechanisms in neurodegenerative diseases .
Previously, cross-sectional studies have revealed lower levels of CSF PENK in manifest HD compared to other neurodegenerative conditions , as well as compared to HDGE before clinical motor diagnosis and controls . Our longitudinal findings in a larger cohort, and our demonstration of a significant association between PENK levels and striatal imaging measures, serve to substantially strengthen the rationale for using PENK as a surrogate marker for striatal MSN state.
Astrocytes are implicated in disease processes through both cell-autonomous and non-cell-autonomous mechanisms , with one key study identifying a core signature of astrocyte genes with expression altered by mHTT in both humans and mouse models . A recent study provided the first evidence of mHTT-induced alterations in basal pro-inflammatory cytokine production in microglia without immune stimulation, along with a reduction in endocytic and phagocytic activity in mHTT-bearing microglia under basal conditions, suggesting a possible role for microglial cell-autonomous inflammation and activity in the early stages of . Consistent with our previous findings of elevated microglial marker CSF YKL-40 levels at baseline , we now show greater rates of increase in CSF YKL-40 longitudinally in the HDGE group compared to controls. However, we do not observe
significant longitudinal changes in pro-inflammatory cytokine markers IL-6 and IL-8, which are components of the innate immune system, nor in GFAP, an intermediate filament protein of astrocytes associated with astroglial activation . It is known that mHTT is expressed in microglia and that microglial activation correlates with severity later in the disease , where mHTT-induced dysfunction of central nervous system (CNS) immune cells is closely linked to pathogenesis . We postulate that the isolated elevation of YKL-40 may be due to both cell-autonomous and non-cell-autonomous mechanisms at play with activation driven by mHTT dysregulation of astrocytes, rather than general gliosis, which would be additionally indicated by a concomitant rise in GFAP. Our findings suggest that astrocytic dysfunction is more prominent than any abnormal innate immune response at this stage of the disease, as IL-6 and IL-8 levels, which are upregulated in HD and correlate with disease progression , remained unchanged longitudinally, reinforcing the importance of treating early at this stage, before widespread neuroinflammation occurs.
The presence of neuronal damage within HD-ISS stage 0 is further supported by the evidence of substantially elevated rates of brain atrophy and a corresponding reduction in CSF PENK levels. Stages 0 to 1 progressors also had substantially higher elevations in CSF NfL than stage 0 nonprogressors. The substantially higher rates of caudate and putamen atrophy and global brain measures and their association with disease burden suggest that neurodegenerative processes are already occurring across our cohort and at the earliest ages observed in this study. This atrophy was measurable in those with basal ganglia
HD-YAS provides in vivo evidence that somatic expansion is driving pathology as early as HD-ISS stage 0
Fig. 6 | Graphical abstract. This graphical abstract illustrates the proposed pathways linking somatic expansion and its effects on biomarkers in HD-YAS. Inherited CAG repeat length is identified as the primary driver of disease progression in HD . Red arrows represent observed data associations in HD-YAS and blue arrows reflect assumed causal relationships. The black bidirectional arrow under mechanisms indicates somatic expansion in WBCs as a proxy for CNS expansion, based on shared inherited genetic modifiers . The black bidirectional arrow under biomarkers shows associations between elevated CSF NfL (marker of neuroaxonal damage) and reduced CSF PENK (surrogate of striatal MSN state) with the earliest caudate and putamen volume changes. Somatic expansion is influenced by inherited CAG repeat length, age and DNA mismatch repair gene variants . DNA mismatch repair, highlighted in the schematic and shown as a repeat loop-out mismatch icon, is a key mechanism linking inherited CAG repeat length to somatic expansion with repair activity increasing with
longer CAG repeat lengths . Within the CNS, somatic expansions substantially contribute to disease progression, as supported by recent postmortem research . While brain biopsy would be the gold standard for direct assessment of CNS somatic expansion in vivo, WBC-derived somatic expansion is detectable peripherally, showing early and longitudinal changes by HD-ISS stages 0 and 1. The biomarkers section shows associations of somatic expansion with the earliest caudate and putamen volume changes, and CSF NfL and PENK levels. The age continuum from HD-ISS stage 0 to stage 1 illustrates early detection of somatic expansion and biomarker changes, influencing pathology from stage 0 onward. HD-YAS provides in vivo evidence that somatic expansion drives early pathology during these early stages, highlighting its potential as a promising therapeutic target in proof-of-concept clinical trials at HD-ISS stages 0 and 1 to slow or prevent further neurodegeneration before clinical motor diagnosis. WBC, white blood cell. The figure is created with BioRender.com.
volumes distributed throughout the volume range observed in unaffected controls, implying the beginning of detectable neurodegeneration. In addition to these changes seen at the macrostructural level, diffusion imaging provides evidence that there is ongoing very early microstructural white matter damage. The strong predictive power of baseline NfL (in both plasma and CSF) for subsequent atrophy in all brain regions further supports the suggestion that there is early neuroaxonal damage which leads to macroscopic effects such as brain atrophy.
Despite the evidence of ongoing pathological changes in our stages 0 and 1 cohort, neurodegeneration is not yet impacting measurable function as we saw no significant disease-related decline in any
of the cognitive, neuropsychiatric or functional measures. Previous work has shown that such changes only become evident from HD-ISS stage 2 (ref. 51).
We demonstrate the accumulation of somatic expansion of the HTT CAG repeat in blood DNA over time in HD-ISS stages 0 and 1 and, critically, show that it is associated with both brain atrophy and CSF NfL, a marker of neuronal-axonal injury, and CSF PENK, a surrogate marker of striatal MSN state. A higher inherited CAG length was associated with a faster increase in SER over time. SER was associated with caudate and putamen atrophy, both cross-sectionally and longitudinally, even after controlling for age-by-CAG interactions. Baseline SER was strongly associated with cross-sectional levels of CSF NfL and CSF PENK before
age-by-CAG correction; however, these associations did not remain significant after the correction. We postulate that bioassay measurements demonstrate higher variability and noise compared to striatal volume measurements. Therefore, the lack of significance in associations with CSF NfL and PENK does not undermine the significant association between the longitudinal increase in SER and volumetric changes in the caudate and putamen. Additionally, the statistical strength of the influence of CAG length on atrophy was weakened in models also controlling for blood SER. Assuming that, via the common baseline CAG length effects and shared genetic modifiers, SER measured in blood is an indirect quantifiable indicator of the greater somatic expansion occurring in neurons, these results may be seen as providing in vivo evidence for the key role of somatic CAG repeat expansion in very early HD pathology in humans (Extended Data Fig. 4), reinforcing the putative pathological role of somatic expansion as a critical factor in disease progression .
If the recent suggestion from HD postmortem brains that asynchronous somatic expansion leads to asynchronous stochastic crossing of the transcriptional dysregulation threshold and asynchronous neuronal death is correct, then our data would support the hypothesis that somatic expansion is already an active process in the brain and that some neurons have already crossed a critical repeat length threshold years before clinical motor diagnosis. Indeed, this phenomenon is both predicted by the stochastic models and consistent with autopsy observations of early neuronal loss . This would suggest that suppressing CAG repeat somatic expansion from this point in the disease process could prevent additional neurons from passing the neuronal toxicity threshold and reduce neurodegeneration before functional deficits are manifest. Therapeutic agents targeting DNA repair proteins that modify somatic expansion show great potential, with MSH3 as a particularly attractive target for HD and other repeat expansion disorders , and various MSH3-targeting therapeutics are currently under development . To this end, somatic expansion of CAG repeats in blood DNA could be a useful biomarker to demonstrate target engagement of somatic expansion-suppressing therapies with peripheral exposure.
Within our cohort, a small number of individuals carried atypical CCGCCA or CAACAG CCGCCA loss of intervening sequence alleles. These atypical structures have a high potential to cause mid-estimation of the CAG repeat length , and using the MiSeq-derived CAG lengths changed the mean baseline years to predicted clinical motor diagnosis in HD-YAS from 24 to 23 years. After correcting for pure CAG length, these structures have previously been associated with earlier clinical motor diagnosis . Consistent with this, we find those participants with the loss of intervening sequence structures exhibit higher rates of caudate and putamen atrophy, and have some of the greatest elevations in CSF NfL and reductions in CSF PENK, which together suggest an acceleration of the degenerative process (Fig. 5b). Detecting these effects in such small numbers so early in the course of disease suggests these synonymous DNA structural differences are exerting a substantial influence on the rate of neuropathological change. Interestingly, after correcting for pure inherited CAG there was no residual association between these allele structure variants and SER. This is consistent with previous work in other cohorts in blood, postmortem brains and cell lines showing that the loss of the intervening CAACAG CCGCCA does not increase the rate of CAG expansion over and above the effects of pure CAG length. Relevant available brain data is limited so it is still possible that the CAACAG CCGCCA loss increases CAG expansions in brain but not blood. An alternative hypothesis is that, after correcting for pure CAG, the residual disease-modifying mechanism of the CAACAG CCGCCA loss is independent of somatic expansion of the HTT repeat via effects on RNA transcription, RNA stability, or canonical or repeat-associated non-ATG translation (Extended Data Fig. 3). Regardless, these variants clearly have a profound impact on the disease course.
This work not only provides evidence to support the potential of therapies targeting somatic expansion but also identifies robust markers of disease progression, which may have utility as likely surrogates for future preventative clinical trials. CSF NfL, PENK and brain atrophy measures have the potential to monitor disease progression in HD-ISS stages 0 and 1, where clinical endpoints are not applicable. Change in CSF NfL level has previously been used as an outcome measure for a trial of the ASO nusinersen in children with spinal muscular atrophy. Earlier treatment initiation was also associated with a larger decrease in CSF NfL levels, underscoring the importance of early intervention to preserve neuronal health.
At this stage of the disease, CSF mHTT levels are very low, with only of samples in the HDGE group exceeding the detection level. These findings underscore the limitations of available CSF mHTT assays and confirm there is an urgent need for a reliable assay capable of detecting very low concentrations of mHTT in HDGE, ideally at attomolar levels, if HTT-lowering therapies are to be pursued in stage 0 and 1 HDGE cohorts.
Our extensive phenotypic characterization of HD-ISS stages 0 and 1 may allow us to enrich recruitment for future preventative trials. For example, we demonstrate that baseline NfL and PENK levels predict subsequent brain atrophy, and the potential to establish cutoffs for enriching HD-ISS stage 0 based on these biofluids holds significant promise. Harmonization of HD-YAS with existing cohorts across the disease spectrum such as HD-CSF and HDClarity (ClinicalTrials.gov: NCT02855476) will help to establish reliable cutoffs for inclusion. Another important consideration in clinical trial design is that atypical repeat structures, although infrequent, substantially affect disease progression and may additionally impact therapeutic efficacy. Identification of these rare cases through MiSeq will be important to control for these effects and more accurately assess treatment efficacy.
If these biomarkers can serve as likely surrogate outcomes, sample size calculations suggest feasible numbers for clinical trials in an HD-ISS stage 0/1 cohort given sufficiently large treatment effects. For example, in a clinical trial over 3 years with a treatment effect, 104 participants would be required with CSF NfL as an outcome measure, with 126 for caudate and 146 for putamen atrophy. Notably, the caudate boundary-shift integral measure of change we use here is already well-validated and has previously been used in the laquinimod trial in HDGE with a clinical motor diagnosis .
In summary, the results presented strongly support the hypotheses that individual-specific somatic expansion in blood DNA predicts individual-specific somatic expansion in the brain. We show in living participants, decades before clinical motor diagnosis, that somatic expansion of the CAG repeat appears to be an important driver of the earliest pathological disease processes, as evidenced by its association with striatal atrophy rates and CSF NfL and PENK levels. Somatic expansion of repeats underlying disease pathogenesis is likely relevant to many repeat expansion diseases, where similar DNA repair mechanisms may play a role. With new therapies in development to target the DNA repair proteins that are known to influence somatic expansion, our results are timely in demonstrating its association with measurable disease markers. By intervening with therapies targeting somatic CAG repeat expansion at the start of the neurodegenerative process, that is, HD-ISS stages 0 and 1 decades before clinical motor diagnosis, while function remains intact, there is the very real possibility that treatments can delay or even prevent the appearance of clinical signs. To this end, we have identified robust measures of early pathology with potential to act as possible biomarker surrogates of disease progression, and identified the ideal cohort for intervention to delay or prevent clinical motor diagnosis.
Online content
Any methods, additional references, Nature Portfolio reporting summaries, source data, extended data, supplementary information,
acknowledgements, peer review information; details of author contributions and competing interests; and statements of data and code availability are available at https://doi.org/10.1038/s41591-024-03424-6.
References
Vonsattel, J. P. et al. Neuropathological classification of Huntington’s disease. J. Neuropathol. Exp. Neurol. 44, 559-577 (1985).
Tabrizi, S. J. et al. Potential disease-modifying therapies for Huntington’s disease: lessons learned and future opportunities. Lancet Neurol. 21, 645-658 (2022).
Lee, J.-M. et al. CAG repeat expansion in Huntington disease determines age at onset in a fully dominant fashion. Neurology 78, 690-695 (2012).
Monckton, D. G. The contribution of somatic expansion of the CAG repeat to symptomatic development in Huntington’s disease: a historical perspective. J. Huntingtons Dis. 10, 7-33 (2021).
Kennedy, L. et al. Dramatic tissue-specific mutation length increases are an early molecular event in Huntington disease pathogenesis. Hum. Mol. Genet. 12, 3359-3367 (2003).
Shelbourne, P. F. et al. Triplet repeat mutation length gains correlate with cell-type specific vulnerability in Huntington disease brain. Hum. Mol. Genet. 16, 1133-1142 (2007).
Mätlik, K. et al. Cell-type-specific CAG repeat expansions and toxicity of mutant Huntingtin in human striatum and cerebellum. Nat. Genet. 56, 383-394 (2024).
Handsaker, R. E. et al. Long somatic DNA-repeat expansion drives neurodegeneration in Huntington disease. Preprint at bioRxiv https://doi.org/10.1101/2024.05.17.592722 (2024).
Swami, M. et al. Somatic expansion of the Huntington’s disease CAG repeat in the brain is associated with an earlier age of disease onset. Hum. Mol. Genet. 18, 3039-3047 (2009).
Kaplan, S., Itzkovitz, S. & Shapiro, E. A universal mechanism ties genotype to phenotype in trinucleotide diseases. PLoS Comput. Biol. 3, e235 (2007).
Donaldson, J. et al. What is the pathogenic CAG expansion length in Huntington’s disease? J. Huntingtons Dis. 10, 175-202 (2021).
Hong, E. P. et al. Huntington’s disease pathogenesis: two sequential components. J. Huntingtons Dis. 10, 35-51 (2021).
Genetic Modifiers of Huntington’s Disease (GeM-HD) Consortium. CAG repeat not polyglutamine length determines timing of Huntington’s disease onset. Cell 178, 887-900.e14 (2019).
Ciosi, M. et al. A genetic association study of glutamine-encoding DNA sequence structures, somatic CAG expansion, and DNA repair gene variants, with Huntington disease clinical outcomes. EBioMedicine 48, 568-580 (2019).
Moss, D. J. H. et al. Identification of genetic variants associated with Huntington’s disease progression: a genome-wide association study. Lancet Neurol. 16, 701-711 (2017).
Rajagopal, S. et al. Genetic modifiers of repeat expansion disorders. Emerg. Top. Life Sci. 7, 325-337 (2023).
Genetic Modifiers of Huntington’s Disease (GeM-HD) Consortium & Lee, J.-M. et al. Genetic modifiers of somatic expansion and clinical phenotypes in Huntington’s disease reveal shared and tissue-specific effects. Preprint at bioRxiv https://doi. org/10.1101/2024.06.10.597797 (2024).
Wright, G. E. B. et al. Length of uninterrupted CAG, independent of polyglutamine size, results in increased somatic instability, hastening onset of Huntington disease. Am. J. Hum. Genet. 104, 1116-1126 (2019).
Dawson, J. et al. A probable cis-acting genetic modifier of Huntington disease frequent in individuals with African ancestry. HGG Adv. 3, 100130 (2022).
Tabrizi, S. J. et al. Targeting huntingtin expression in patients with Huntington’s disease. N. Engl. J. Med. 380, 2307-2316 (2019).
McColgan, P. et al. Tominersen in adults with manifest Huntington’s disease. N. Engl. J. Med. 389, 2203-2205 (2023).
Estevez-Fraga, C., Tabrizi, S. J. & Wild, E. J. Huntington’s disease clinical trials corner: March 2024. J. Huntingtons Dis. 13, 1-14 (2024).
Paulsen, J. S. et al. Detection of Huntington’s disease decades before diagnosis: the predict-HD study. J. Neurol. Neurosurg. Psychiatry 79, 874-880 (2008).
Tabrizi, S. J. et al. Potential endpoints for clinical trials in premanifest and early Huntington’s disease in the TRACK-HD study: analysis of 24 month observational data. Lancet Neurol. 11, 42-53 (2012).
Scahill, R. I. et al. Biological and clinical characteristics of gene carriers far from predicted onset in the Huntington’s disease Young Adult Study (HD-YAS): a cross-sectional analysis. Lancet Neurol. 19, 502-512 (2020).
Tabrizi, S. J. et al. A biological classification of Huntington’s disease: the Integrated Staging System. Lancet Neurol. 21, 632-644 (2022).
Rodrigues, F. B. Mutant huntingtin and neurofilament light have distinct longitudinal dynamics in Huntington’s disease. Sci. Transl. Med. 12, eabc2888 (2020).
Shaw, G. et al. Hyperphosphorylated neurofilament NF-H is a serum biomarker of axonal injury. Biochem. Biophys. Res. Commun. 336, 1268-1277 (2005).
Paterson, R. W. et al. SILK studies-capturing the turnover of proteins linked to neurodegenerative diseases. Nat. Rev. Neurol. 15, 419-427 (2019).
Khalil, M. et al. Neurofilaments as biomarkers in neurological disorders. Nat. Rev. Neurol. 14, 577-589 (2018).
Zetterberg, H. et al. Neurochemical aftermath of amateur boxing. Arch. Neurol. 63, 1277-1280 (2006).
Sjögren, M. et al. Cytoskeleton proteins in CSF distinguish frontotemporal dementia from AD. Neurology 54, 1960-1964 (2000).
Hall, S. et al. Accuracy of a panel of 5 cerebrospinal fluid biomarkers in the differential diagnosis of patients with dementia and/or parkinsonian disorders. Arch. Neurol. 69, 1445-1452 (2012).
Delaby, C. et al. Differential levels of neurofilament light protein in cerebrospinal fluid in patients with a wide range of neurodegenerative disorders. Sci. Rep. 10, 9161 (2020).
Bech, S. et al. Amyloid-related biomarkers and axonal damage proteins in parkinsonian syndromes. Parkinsonism Relat. Disord. 18, 69-72 (2012).
Feneberg, E. et al. Multicenter evaluation of neurofilaments in early symptom onset amyotrophic lateral sclerosis. Neurology 90, e22-e30 (2018).
Abdo, W. F. et al. CSF neurofilament light chain and tau differentiate multiple system atrophy from Parkinson’s disease. Neurobiol. Aging 28, 742-747 (2007).
Dhiman, K. et al. Cerebrospinal fluid neurofilament light concentration predicts brain atrophy and cognition in Alzheimer’s disease. Alzheimers Dement. 12, e12005 (2020).
Vrillon, A. et al. Comparison of CSF and plasma NfL and pNfH for Alzheimer’s disease diagnosis: a memory clinic study. J. Neurol. 271, 1297-1310 (2024).
Barschke, P. et al. Cerebrospinal fluid levels of proenkephalin and prodynorphin are differentially altered in Huntington’s and Parkinson’s disease. J. Neurol. 269, 5136-5143 (2022).
Niemela, V. et al. Proenkephalin decreases in cerebrospinal fluid with symptom progression of Huntington’s disease. Mov. Disord. 36, 481-491 (2021).
Caron, N. S. et al. Cerebrospinal fluid biomarkers for assessing Huntington disease onset and severity. Brain Commun. 4, fcac309 (2022).
Ilieva, H., Polymenidou, M. & Cleveland, D. W. Non-cell autonomous toxicity in neurodegenerative disorders: ALS and beyond. J. Cell Biol. 187, 761-772 (2009).
Diaz-Castro, B. et al. Astrocyte molecular signatures in Huntington’s disease. Sci. Transl. Med. 11, eaaw8546 (2019).
Stöberl, N. et al. Mutant huntingtin confers cell-autonomous phenotypes on Huntington’s disease iPSC-derived microglia. Sci. Rep. 13, 20477 (2023).
Von Bartheld, C. S., Bahney, J. & Herculano-Houzel, S. The search for true numbers of neurons and glial cells in the human brain: a review of 150 years of cell counting. J. Comp. Neurol. 524, 3865-3895 (2016).
Shin, J.-Y. et al. Expression of mutant huntingtin in glial cells contributes to neuronal excitotoxicity. J. Cell Biol. 171, 1001-1012 (2005).
Pavese, N. et al. Microglial activation correlates with severity in Huntington disease: a clinical and PET study. Neurology 66, 1638-1643 (2006).
Björkqvist, M. et al. A novel pathogenic pathway of immune activation detectable before clinical onset in Huntington’s disease. J. Exp. Med. 205, 1869-1877 (2008).
Wild, E., Björkqvist, M. & Tabrizi, S. J. Immune markers for Huntington’s disease? Expert Rev. Neurother. 8, 1779-1781 (2008).
Tabrizi, S. J. et al. Biological and clinical changes in premanifest and early stage Huntington’s disease in the TRACK-HD study: the 12-month longitudinal analysis. Lancet Neurol. 10, 31-42 (2011).
Flower, M. et al. MSH3 modifies somatic instability and disease severity in Huntington’s and myotonic dystrophy type 1. Brain 142, 1876-1886 (2019).
Benn, C. L., Gibson, K. R. & Reynolds, D. S. Drugging DNA damage repair pathways for trinucleotide repeat expansion diseases.
J. Huntingtons Dis. 10, 203-220 (2021).
O’Reilly, D. et al. Di-valent siRNA-mediated silencing of MSH3 blocks somatic repeat expansion in mouse models of Huntington’s disease. Mol. Ther. 31, 1661-1674 (2023).
Olsson, B. et al. NFL is a marker of treatment response in children with SMA treated with nusinersen. J. Neurol. 266, 2129-2136 (2019).
Reilmann, R. et al. Safety and efficacy of laquinimod for Huntington’s disease (LEGATO-HD): a multicentre, randomised, double-blind, placebo-controlled, phase 2 study. Lancet Neurol. 23, 243-255 (2024).
Bates, G. P. et al. Huntington disease. Nat. Rev. Dis. Primers 1, 15005 (2015).
Ferguson, R. et al. Therapeutic validation of MMR-associated genetic modifiers in a human ex vivo model of Huntington disease. Am. J. Hum. Genet. 111, 1165-1183 (2024).
Publisher’s note Springer Nature remains neutral with regard to jurisdictional claims in published maps and institutional affiliations.
Open Access This article is licensed under a Creative Commons Attribution 4.0 International License, which permits use, sharing, adaptation, distribution and reproduction in any medium or format, as long as you give appropriate credit to the original author(s) and the source, provide a link to the Creative Commons licence, and indicate if changes were made. The images or other third party material in this article are included in the article’s Creative Commons licence, unless indicated otherwise in a credit line to the material. If material is not included in the article’s Creative Commons licence and your intended use is not permitted by statutory regulation or exceeds the permitted use, you will need to obtain permission directly from the copyright holder. To view a copy of this licence, visit http://creativecommons. org/licenses/by/4.0/.
(c) The Author(s) 2025
Participants were recruited across the UK and enrolled at one study site (University College London (UCL)). The inclusion criteria are detailed in the Supplementary Methods. Participants ( 131 in total, 64 HDGE and 67 controls) attended at baseline and 103 (57 HDGE and 46 controls) returned for follow-up approximately 4.5 years later.
The study was registered on ClinicalTrials.gov (NCT06391619) where the study protocol and the predefined statistical analysis plan are provided. All participants underwent comprehensive assessment of clinical, cognitive and neuropsychiatric function, neuroimaging, blood sampling, and optional CSF collection consistent with the baseline procedure (Supplementary Methods) . See Extended Data Table 6 for a list of assessments and Supplementary Table 5 for missing data. Supplementary Methods provides further details for all assessments.
Ethics
The study received approval by the London-Bloomsbury Research Ethics Committee (22/LO/0058). All study procedures adhered to principles outlined in the Declaration of Helsinki, and before enrollment, written consent was obtained from all participants.
Clinical, cognitive and neuropsychiatric assessments
A clinical examination was performed including assessment for lumbar puncture suitability.
All the HDGE participants with longitudinal neuroimaging ( ) were staged according to the HD-ISS at each visit. The longitudinal pipeline of FreeSurfer version 6 (https://surfer.nmr.mgh.harvard. edu/pub/dist/freesurfer/) was used to derive caudate and putamen segmentations to classify stages 0 and 1 , and stage 2 was defined by participants reaching the age- and education-adjusted cutoffs for the Symbol Digit Modalities Test and/or Total Motor Score. Additionally, predicted years to clinical motor diagnosis were linked to the standardized CAG-Age-Product (CAP) score. A CAP score of 100 occurs at the CAG-specific expected age of motor diagnosis .
All cognitive and neuropsychiatric tasks from baseline were repeated at follow-up with two exceptions. Due to participant feedback, we replaced the Progressive Ratio Task from baseline with the Goals Prior Assay task at follow-up to assess the motivational domain. Additionally, Stroop interference was included within the core cognitive tasks in follow-up. See Supplementary Methods and Supplementary Figs. 3-5 for details of the cognitive and neuropsychiatric testing battery.
Neuroimaging
Scanning was performed on a 3T Siemens Prisma (Siemens Healthineers, Erlangen, Germany) and parameters were consistent between baseline and 4.5-year follow-up. Neuroimaging assessments included volumetric T1-weighted imaging (T1W), DWI and MPM. We applied the same predefined regions of interest (ROI) that were examined at baseline. Volumes were extracted from T1W images and mean values across the relevant ROI were derived for (1) standard DWI and neurite orientation and dispersion density imaging (NODDI) metrics , (2) structural connectivity (right-hand dominant participants only) and (3) MPMs.
Longitudinal imaging changes were derived by subtraction of values, except for direct measures of change for some volumetric ROIs. The boundary-shift integral is a direct measure of change between positionally matched (registered) serial images, which is more sensitive to longitudinal change than subtraction . This technique was used for whole brain, ventricles and caudate . Within-participant voxel-compression maps were derived and convolved with gray and white matter maps generated by voxel-based morphometry to estimate volume change within these tissues.
Details of diffusion, structural connectivity and MPM processing pipelines are provided in Supplementary Methods and Supplementary Fig. 6.
Biofluids
Biofluids were collected at baseline and follow-up under the same standardized, well-validated conditions, methods and equipment .To remove potential batch effects, biofluid samples collected at baseline were reanalyzed in parallel with the follow-up samples, employing the assays detailed in Supplementary Table 19. Quantification of analytes was performed blinded to group status.
Measurements in CSF included mHTT, NfL protein, total tau (tau), GFAP, UCH-L1, YKL-40 (also known as chitinase-3 like-protein-1 (CHI3L1)), IL-6 and IL-8. In plasma, NfL, tau, GFAP and UCH-L1 were quantified. The Neurology 4-Plex A (GFAP, NfL, Tau and UCH-L1) was measured in singlicate, yielding the following inter-plate coefficients of variation (%CV): CSF GFAP (3.7%), CSF NfL (8.2%), CSF Tau (11.1%), CSF UCH-L1 ( ), plasma GFAP ( ), plasma NfL ( ), plasma Tau (11.1%) and plasma UCH-L1 (63.8%). The %CVs were calculated from duplicate measurements of internal plate controls made of pooled human plasma. CSF IL-6, IL-8 and YKL-40 were measured in duplicate, with the following %CVs: CSF YKL-40 (10.4%), CSF IL-6 (29.2%) and CSF IL-8 . CSF mHTT was measured in triplicate and the relative abundance of CSF PENK was quantified in single measurements.
Unbiased liquid chromatography-mass spectrometry (LC-MS)based proteomics analysis was performed using the tandem mass tag (TMT) technique to measure relative abundance of CSF PENK. CSF samples were prepared including an initial multi-affinity depletion step to reduce interference by high-abundant blood-derived proteins (Supplementary Methods). Following this step, samples were subjected to reduction and alkylation of cysteine residues, digestion with trypsin and endoproteinase Lys-C and isobaric labeling using TMTpro 18-plex reagents (Thermo Fisher Scientific). TMT multiplex peptide samples were fractionated by high-pH reversed-phase high-performance LC (HPLC) , and analyzed by nano-HPLC (EasyLC, Thermo Fisher Scientific) coupled to a high-resolution Orbitrap hybrid mass spectrometer (Orbitrap Lumos Tribrid, Thermo Fisher Scientific). Protein identification and data processing for quantification was performed using Proteome Discoverer 2.5 (Thermo Fisher Scientific), and R Statistics. More details are provided in Supplementary Methods.
HTTCAG repeat structure and somatic expansion
DNA was extracted from whole blood using the chemagic 360-D instrument (Perkin Elmer) for automated DNA extraction. The modal length of the pure HTTCAG repeat, the HTT repeat structure and quantity of blood HTT somatic expansions in the HDGE group were determined by ultra-deep amplicon MiSeq sequencing . The HTT MiSeq reads were processed and genotyped using ScaleHD (v1 (ref. 14)) and RGT (https://github.com/hossam26644/RGT). The SER of the HTT CAG repeat was quantified from MiSeq data at baseline and follow-up, allowing for longitudinal assessment of somatic expansion changes during the interval between the two visits. CAG repeat length estimated using MiSeq was used for all statistical analyses of associations.
Somatic expansion mediation models
Within the HDGE group, we estimated statistical associations between white blood cell (WBC) somatic expansion ratios with NfL, PENK and with volumetric brain measures. The analyses were performed with and without correction for age, CAG and age-by-CAG interaction. The models also controlled age, sex and age-by-sex interaction as covariates. We modeled cross-sectional SER versus biomarker relationships via random effects regression as described earlier. We estimated relationships between baseline SER and longitudinal change in SER versus longitudinal change in biomarkers using ordinary least square regression as described above for other models of volumetric direct-change rates. For NfL and putamen volumes, we calculated change rates by subtraction of baseline from follow-up values.
To assess the potential causal implications of SER-biomarker associations, we compared the statistical strength of SER as a predictor of
the biomarker before and after controlling for age and CAG length (Extended Data Fig. 4 illustrates a schematic of the underlying causal reasoning). A substantially weakened SER relationship after age and CAG control would suggest that the associations may be due to mutual influence of CAG length over time without more direct causality. Conversely, we assessed the strength of the age-CAG versus biomarker relationships with and without SER control. Weakened age-CAG associations with a biomarker in the presence of both a significant predictive SER effect on the biomarker and a significant age-CAG association with SER are consistent with an intermediate causal role for CNS somatic expansion (as indirectly assessed by SER in WBC DNA). These statistical comparisons are the essence of statistical assessments of plausible causality in formal causal models. In the simple, cross-sectional case, the degree of mediation is often expressed by the relative reduction in the adjusted correlation or regression coefficient of a single distal variable. However, the analyses here involve the joint mediation of two terms-CAG length and its interaction with age. Mediation is no longer simply quantified by this approach. Hence, we instead emphasize the hypothesis testing aspect of the underlying statistical tests.
We used the same regression methods as for the somatic expansion models to assess associations between log NfL levels and volumetric outcomes. However, we attempted no causal interpretation of NfL versus volumetric relationships. Although these are both HD-related biomarkers, they are considered concurrent indicators of the same pathology and there is no well-justified conception of one of these changes ‘causing’ the other.
Sample size estimates
Approximate sample size estimates for clinical trials involving equal allocation to one treatment group and a placebo group were calculated based on observed HDGE group versus control longitudinal models. The group differences in longitudinal rates were converted to Cohen’s effect sizes using within-group longitudinal standard deviations derived from estimated random effect variances. Assumed treatment effects were then defined as a percent slowing of the group difference in longitudinal rates adjusted for the assumed trial length. These should be considered somewhat optimistic order-of-magnitude estimates. We could not estimate potential increased within-group variance over time (and resultant sample size increase) based on only two observed time points. We did not factor in trial dropout rates. On the other hand, we did not consider potential sample size reduction due to efficient (but perhaps controversial) estimates of treatment-induced slope deviation derived from repeated measures over time, but instead based calculations on net group differences at the end of a trial. See Supplementary Methods for further details.
Statistical analysis
Unless otherwise noted, all statistical analyses were performed in accordance with a prespecified statistical analysis plan. Analyses testing the relationship between caudate and putamen volumes or NfL levels to observed or predicted disease progression were defined as primary hypotheses, with a statistical significance level of . Analyses of potential disease associations for the rest of the wide-ranging test battery were considered exploratory and primarily assessed by estimated FDR calculated using the Benjamini-Hochberg method . FDR was calculated separately per measurement domain (cognitive, volumetric imaging, bioassays, etc.) to examine conceptually and technically sensible sets of underlying values. We suggest an FDR threshold of for identifying exploratory results of interest.
Demographic group comparisons were conducted by test for continuous variable, by chi-square test for sex differences and by Mann-Whitney U test for education level. Both the longitudinal and repeated-measure cross-sectional analyses were performed by maximum likelihood random effect regression modeling with (necessarily) only random intercepts per participant. The primary regression
predictors of interest were group status (control versus HDGE) and in models testing age and CAG effects, terms for age, MiSeq-derived CAG length and age-by-CAG interactions nested within the HDGE. The joint significance of age and CAG effects were estimated by the maximum likelihood test for differences in model fit. The models also contained covariates for sex, a non-nested age term and sex-by-age interaction. The non-nested age term was included to make HDGE group-specific aging effects estimable. Cognitive models also included International Standard Classification of Education education level and estimated intelligence quotient via the National Adult Reading Test score. Due to the consistent skewness of measured distributions, logarithmic transformations were used on all bioassay concentration measures.
Longitudinal volumetric analyses of brain structures other than putamen relied on a single measure of volume change per participant derived from pairs of baseline and follow-up scans. These changes were converted to annual rates and modeled by ordinary least squares regression with predictor variables analogous to those listed above. All other models of longitudinal change used total values at the two visits as outcomes and longitudinal effects of primary predictors and covariates were estimated by interactions with follow-up time between the visits. Those models also retained all baseline effects for predictors and covariates. To preserve the unbiased estimation of model parameters when data is missing at random, baseline data from participants with no follow-up were included in the model.
Reporting summary
Further information on research design is available in the Nature Portfolio Reporting Summary linked to this article.
Data availability
We are committed to data sharing while maintaining confidentiality due to the sensitive and potentially identifiable nature of these data. Biofluid samples will not be shared due to the limited amount of material available. The remaining samples will be required for replication for the next HD-YAS visit. Upon reasonable request, data will be made available 24 months after the end of data collection, through application via UCL to the Principal Investigator, Professor Sarah Tabrizi. Researchers will be required to submit a proposal meeting the research criteria and must demonstrate full GDPR compliance. A data access agreement with UCL will be required.
Code availability
All software is freely available with the exception of the in-house MIDAS software used to generate the boundary-shift integral for caudate, whole brain and ventricles. This can be requested from Professor Nick Fox at the Dementia Research Centre, UCL, UK.
References
Warner, J. H. et al. Standardizing the CAP score in Huntington’s disease by predicting age-at-onset. J. Huntingtons Dis. 11, 153-171 (2022).
Zhang, H. et al. NODDI: practical in vivo neurite orientation dispersion and density imaging of the human brain. Neuroimage 61, 1000-1016 (2012).
Fox, N. C. & Freeborough, P. A. Brain atrophy progression measured from registered serial MRI: validation and application to Alzheimer’s disease. J. Magn. Reson. Imaging 7, 1069-1075 (1997).
Hobbs, N. Z. et al. Automated quantification of caudate atrophy by local registration of serial MRI: evaluation and application in Huntington’s disease. Neuroimage 47, 1659-1665 (2009).
Wild, E. J. et al. Quantification of mutant huntingtin protein in cerebrospinal fluid from Huntington’s disease patients. J. Clin. Invest. 125, 1979-1986 (2015).
Thompson, A. et al. Tandem mass tags: a novel quantification strategy for comparative analysis of complex protein mixtures by MS/MS. Anal. Chem. 75, 1895-1904 (2003).
Li, J. et al. Proteome-wide mapping of short-lived proteins in human cells. Mol. Cell 81, 4722-4735.e5 (2021).
Batth, T. S., Francavilla, C. & Olsen, J. V. Off-line high-pH reversed-phase fractionation for in-depth phosphoproteomics. J. Proteome Res. 13, 6176-6186 (2014).
UniProt Consortium. UniProt: a worldwide hub of protein knowledge. Nucleic Acids Res. 47, D506-D515 (2019).
Ciosi, M. et al. Library preparation and MiSeq sequencing for the genotyping-by-sequencing of the Huntington disease HTT exon one trinucleotide repeat and the quantification of somatic mosaicism. Protoc. Exch. https://doi.org/10.1038/protex.2018.089 (2018).
Benjamini, Y. & Hochberg, Y. Controlling the false discovery rate: a practical and powerful approach to multiple testing. J. R. Stat. Soc. B 57, 289-300 (1995).
Acknowledgements
We are grateful to all the study participants and their families who have so generously given their time to the HD Young Adult Study. We would also like to thank the staff at the Wellcome Centre for Human Neuroimaging (London, UK) and the Leonard Wolfson Experimental Neurology Centre (London, UK). LC-MS analysis was performed at the Proteomics Core Facility, Sahlgrenska Academy, Gothenburg University, with financial support from SciLifeLab and BioMS. We thank Annabelle Coleman and Alexiane Touzé for their help with blood collection and processing, Siti Binte Mohd Ikhsan for help with collecting cognitive and neuropsychiatric data, Peter McColgan for assistance with the structural connectivity pipeline and Davina Hensman-Moss and Emily Gantman for helpful discussions on the paper. Funding for this study was provided by the following: Wellcome Collaborative Award (223082/Z/21/Z to S.J.T., R.I.S., M.F., M.J.M., N.Z.H., M.L., C.L., K.F., T.W.R., J.B.R., B.J.S., D.G.M. and D.R.L.); the CHDI Foundation (a not-for-profit organization dedicated to finding treatments for Huntington’s disease) funded CSF collection; the UK Dementia Research Institute (DRI; London, UK) through UK DRI, principally funded by the UK Medical Research Council; University College London Hospital/University College London (London, UK), supported by the National Institute for Health and Care Research (NIHR) University College London Hospitals Biomedical Research Centre; Wellcome Trust (220258 to J.B.R.); Medical Research Council (MC_UU_00030/14 and MR/T033371/1 to J.B.R.) and NIHR Cambridge Biomedical Research Centre (NIHR2O3312 to J.B.R.). H.Z. is a Wallenberg Scholar and a Distinguished Professor at the Swedish Research Council.
Author contributions
R.I.S., C.S., H.Z., E.J.W., G.R., B.J.S., D.G.M. and D.R.L. gained funding for this study. R.I.S., K.F., E.J.W. and G.R. designed the study. R.I.S., M.F., M.J.M., N.Z.H., K.F. and O.T. contributed to recruitment. R.I.S., N.Z.H., M.L., H.K., C.S.P. and I.B.M. contributed to image acquisition and analysis. M.F., M.J.M., M.N., C.E.F. and Y.H. contributed to clinical assessments. M.F. and M.J.M. contributed to biofluid collection. M.F., J.G., J.R., S.W. and A.H. contributed to biofluid processing and analysis. R.I.S., M.F., M.J.M., M.L., C.L. and K.F. contributed to cognitive and neuropsychiatric assessments. C.L., T.W.R. and B.J.S. contributed to cognitive and neuropsychiatric battery design. M.C. and N.K.P.P. contributed to somatic expansion analysis. K.F. contributed to project
management. K.F. and O.T. contributed to biofluid processing. H.H. contributed to the radiological review process. J.D.L. and D.R.L. performed statistical analysis. C.S. contributed to data interpretation. H.Z. designed biofluid processing methods and analysis. J.B.R. contributed to cognitive battery design. D.G.M. contributed to the somatic expansion processing and analysis. D.R.L. wrote the Statistical Analysis Plan. R.I.S., M.F., C.L., M.C., B.J.S., D.G.M., D.R.L. and S.J.T. drafted the paper. S.J.T. was PI of the Wellcome Trust Collaborative Award and had overall responsibility for study design, project management, ethics approval, analysis and drafting the paper. All authors contributed to the interpretation of the data and reviewed the paper.
Competing interests
J.B.R. is supported by the Wellcome Trust (220258), the Medical Research Council (MC_UU_00030/14; MR/T033371/1) and the NIHR Cambridge Biomedical Research Centre (NIHR2O3312). The views expressed are those of the authors and not necessarily those of the NIHR or the Department of Health and Social Care. J.B.R. has undertaken paid consultancy for Asceneuron, Astronautx, Astex, ClinicalInk, CumulusNeuro, Curasen, Invivro, Prevail and SVHealth; received research funding unrelated to the current work from AstraZeneca, Lily, GSK and Janssen; and is Chief Scientific Advisor to Alzheimer’s Research UK. D.G.M. has been a scientific consultant and/ or received honoraria/grants from AMO Pharma, Dyne, F. Hoffman-La Roche, Function Rx, LoQus23, MOMA Therapeutics, Novartis, Ono Pharmaceuticals, Pfizer Pharmaceuticals, Rgenta Therapeutics, Sanofi and Sarepta Therapeutics. J.G. is supported by Alzheimerfonden (AF-980746) and Stiftelsen för Gamla tjänarinnor (2022-01324). J.B.R. has appeared as an expert witness to the Medicines and Healthcare products Regulatory Agency, unrelated to the current work. D.G.M. is on the Scientific Advisory Board of the Myotonic Dystrophy Foundation and EuroDyMA (European Dystrophia Myotonica Association), is a scientific advisor to the Myotonic Dystrophy Support Group and is a vice president for research of Muscular Dystrophy UK. G.R. is a nonexecutive director of UCL Business. D.R.L. is an unpaid academic member of the Critical Path Institute HD-RSC Consortium Coordinating Committee. B.J.S. is a co-inventor of the Cambridge Neuropsychological Test Automated Battery. I.B.M. is an associate editor for Frontiers in Neurology. The other authors declare no competing interests.
Correspondence and requests for materials should be addressed to Sarah J. Tabrizi.
Peer review information Nature Medicine thanks Harry Orr and the other, anonymous, reviewer(s) for their contribution to the peer review of this work. Primary Handling Editor: Jerome Staal, in collaboration with the Nature Medicine team.
Extended Data Fig. 1 | Flowchart of recruitment, follow-up and total
cumulative assessments. Flowchart detailing participant enrollment at baseline (2017-2019) and the retention and recruitment of new participants at follow-up (2022-2024) in the Huntington’s Disease Young Adult Study (HD-YAS).
CSF, cerebrospinal fluid; DBS, disease burden score; , family history; HDGE, HD gene expanded; IVF, in vitro fertilization; LP, lumbar puncture; TMS, Total Motor Score; UHDRS, Unified Huntington’s Disease Rating Scale.
a
b Evaluation of the effect of HTT allele structures over and above the length of pure CAG:
Pure CAG length
primary substrate of the somatic HTT repeat instability machinery determines the rate of somatic HTT repeat expansion determines HD pathology
Intervening sequence variants
– no effect on HTT somatic instability
– effect on HD severity, progression, and biomarkers
Potential repeat instability-independent effects of these synonymous variants:
intervening sequence variants may affect HTT transcription
intervening sequence variants may affect the HTT transcript folding, stability, splicing, or translation
intervening sequence variants may affect RNA toxicity
Extended Data Fig. 3 | The effect of atypical HTT allele structure on blood somatic expansions does not explain their effect on HD phenotypes and
biomarkers. (a) Schematic representation of the absence of effect of the atypical HTT allele structure on blood somatic expansion in the HD-YAS cohort and of their relative effect on caudate and putamen volumes and on CSF NfL levels after age-by-CAG correction. (b) Graphical representation of the HTT allele structures
observed in the HD-YAS cohort. On the left-hand side is the pure CAG tract, which is likely the primary substrate of the somatic repeat instability machinery and is the primary determinant of the rate of somatic HTT repeat expansion and HD pathology. Center, the sequence variants intervening between the CAG and CCG tracts, which define the atypical HTT allele structures observed (that is, CAACAG duplication, CCGCCA loss and CAACAG CCGCCA loss).
Extended Data Fig. 4 | Conceptual causal model. Conceptual model illustrating the causal relationships among age-related CAG repeat length (age, CAG), CNS somatic expansion, WBC somatic expansion and biomarkers. The squares in gray depict measured data, while the circles in purple represent unobservable quantities. The black, bidirectional arrow signifies the assumption that somatic expansion in WBCs serves as a proxy for somatic expansion in the CNS. Red arrows indicate correlations between observable data and the underlying
biological processes of interest. Blue arrows are presumed to reflect true causal pathways indirectly. We note that DNA mismatch repair is a key mechanism linking inherited CAG repeat length to somatic expansion, with mismatch repair activity increasing with longer CAG repeat lengths. *Note additional pathways could be involved due to the imprecise and indirect measurement of actual CNS expansion. Abbreviations: CNS=Central Nervous System. WBC=White Blood Cell.
Extended Data Table 1 | Participant demographic characteristics
Characteristic
HDGE
Controls
HDGE vs Controls Baseline, Follow-up
Longitudinal ( )
Longitudinal ( )
Interval (years)
4.7 (0.6)
4.7 (0.6)
0.5
Baseline ( )
Follow-up ( )
Baseline ( )
Follow-up ( )
Age (years)
29.0 (5.6)
33.8 (5.7)
29.1 (5.7)
33.6 (6.2)
0.9, 0.9
Male:Female (% male)
30:34 (47%)
32:34 (48%)
28:39 (42%)
28:32 (47%)
0.6, 0.8
Education (years)
16.2 (2.1)
17.0 (2.6)
16.3 (2.2)
17.2 (2.7)
0.9, 0.7
NART
102.4 (7.5)
103.7 (7.7)
103.5 (8.3)
106.5(8.7)
0.4, 0.1
CAG repeat length
42.3 (1.6)
42.2 (1.5)
N/A
N/A
N/A
CAP100 score
55.4 (8.2)
62.8 (9.0)
N/A
N/A
N/A
Estimated years to clinical motor diagnosis
23.2 (5.3)
19.2 (5.2)
N/A
N/A
N/A
Table presenting longitudinal participant demographics in HD-YAS. Values are means (SD), n (%) or median (IQR). Two-tailed group comparisons were made using tests (interval, age, education, NART) and tests (sex). CAP100, CAG-age product, whereby CAP100 is the expected age of diagnosis. HDGE, HD gene expanded; IQR, interquartile range; NA, not applicable; NART, National Adult Reading Test, an estimate for IQ; SD, standard deviation; IQ, intelligence quotient.
Extended Data Table 2 | Longitudinal volumetric data
Outcomes (to ICV)
Control Mean
HDGE Mean
Estimate of Mean Difference
Df
Lower CL
Upper CL
value
FDR
Caudate Change
83
Putamen Change
98
Ventricular Change
83
Whole Brain Change
83
Grey Matter Change
83
White Matter Change
83
Table showing longitudinal volumetric outcomes (normalized to ICV) for HDGE participants compared to controls. Volumetric analyses for brain structure longitudinal changes, excluding the putamen, modeled a single change measure per paired participant scans (boundary-shift integral or voxel-based morphometry convolution) after conversion to annual change rates. These changes were modeled by ordinary least squares regression. Putamen changes were derived from subtraction of baseline and follow-up MALP-EM segmentations divided by follow-up length. Analysis results and residual adjustments reflect control for baseline age, sex, and their interaction. Statistical two-sided group comparisons were adjusted for multiple comparisons using the FDR, with P values, degrees of freedom, and confidence limits provided in the table. Significant values at FDR< 0.15 are highlighted in bold. CL, confidence limit; Df, degrees of freedom; FDR, false discovery rate; HDGE, HD gene expanded; ICV, intracranial volume.
Extended Data Table 3 | Longitudinal diffusion data
Outcomes
Control Mean
HDGE Mean
Estimate of Mean Difference
Df
Lower CL
Upper CL
value
FDR
Splenium Corpus Callosum MD
89
Splenium Corpus Callosum RD
90
Anterior Internal Capsule AD
90
Splenium Corpus Callosum FA
91
Splenium Corpus Callosum AD
89
Anterior Internal Capsule ODI
90
Mid Corpus Callosum RD
91
Anterior Internal Capsule FA
88
Splenium Corpus Callosum FWF
93
Mid Corpus Callosum MD
90
External Capsule AD
90
0.011
Splenium Corpus Callosum NDI
92
0.012
Mid Corpus Callosum FA
92
0.013
External Capsule MD
90
0.025
Mid Corpus Callosum FWF
90
0.017
0.048
Anterior Internal Capsule MD
90
0.024
0.063
Mid Corpus Callosum ODI
89
0.027
0.067
External Capsule RD
89
0.037
0.087
External Capsule NDI
90
0.046
0.103
Genu Corpus Callosum NDI
92
0.050
0.106
Posterior Internal Capsule MD
93
0.068
0.137
Genu Corpus Callosum AD
90
0.074
0.142
Genu Corpus Callosum MD
91
0.083
0.148
Mid Corpus Callosum NDI
93
0.085
0.148
Posterior Internal Capsule AD
91
0.105
0.171
Posterior Internal Capsule NDI
91
0.106
0.171
Genu Corpus Callosum RD
91
0.132
0.199
Mid Corpus Callosum AD
89
0.133
0.199
Posterior Internal Capsule RD
92
0.173
0.250
Genu Corpus Callosum FA
90
0.208
0.291
Genu Corpus Callosum ODI
107
0.245
0.332
Anterior Internal Capsule FWF
103
0.299
0.389
Splenium Corpus Callosum ODI
95
0.306
0.389
Anterior Internal Capsule NDI
90
0.317
0.391
Posterior Internal Capsule FWF
118
0.363
0.436
Genu Corpus Callosum FWF
108
0.504
0.588
External Capsule ODI
95
0.699
0.793
Posterior Internal Capsule ODI
99
0.867
0.956
Posterior Internal Capsule FA
91
0.891
0.956
Anterior Internal Capsule RD
89
0.911
0.956
External Capsule FA
89
0.948
0.971
External Capsule FWF
102
0.979
0.979
Diffusion (AD, FA, MD, and RD) and NODDI (FWF, ODI, and NDI) metrics were derived for the following regions of interest: corpus callosum (genu, mid and splenium), internal capsule (anterior and posterior) and external capsule. Longitudinal change was derived by subtraction of baseline from follow-up value and change was annualized. Analysis results and residual adjustments reflect control for baseline age, sex and their interaction. Statistical two-sided group comparisons were adjusted for multiple comparisons using the FDR, with P values, degrees of freedom, and confidence limits provided in the table. Significant values at FDR<0.15 are highlighted in bold. AD, axial diffusivity; CL, confidence limit; Df, degrees of freedom; FA, fractional anisotropy; FWF, free water fraction; HDGE, HD gene expanded; MD, mean diffusivity; NDI, neurite density index; ODI, orientation dispersion index; RD, radial diffusivity.
Extended Data Table 4 | Predictors of brain atrophy measures
Correction
Outcomes
Caudate ( value, FDR)
Putamen ( value, FDR)
Grey matter ( value, FDR)
White matter ( value, FDR)
Whole brain ( value, FDR)
Ventricles ( value, FDR)
No Age and CAG
Baseline CSF NfL
0.020, 0.023
Baseline plasma NfL
0.014, 0.015
0.037, 0.037
Baseline CSF PENK
0.078, 0.128
0.022, 0.056
0.003, 0.013
0.019, 0.056
With Age and CAG
Baseline CSF NfL
0.003, 0.007
0.124, 0.124
0.002, 0.008
0.012, 0.019
Baseline plasma NfL
0.025, 0.032
0.160, 0.160
0.100, 0.111
0.008, 0.018
0.026, 0.032
0.009, 0.018
Baseline CSF PENK
0.250, 0.348
0.034, 0.112
0.010, 0.052
0.050, 0.125
No Age and CAG
Change in CSF NfL
0.041, 0.103
0.493, 0.548
0.074, 0.149
0.017, 0.057
Change in plasma NfL
0.030, 0.062
0.443, 0.548
0.626, 0.626
0.179, 0.298
0.257, 0.367
Change in CSF PENK
0.027, 0.137
0.665, 0.831
0.295, 0.421
0.275, 0.421
With Age and CAG
Change in CSF NfL
0.002, 0.020
0.002, 0.027
0.084, 0.169
0.210, 0.349
0.0599, 0.1497
0.010, 0.040
Change in plasma NfL
0.012, 0.040
0.117, 0.205
0.741, 0.741
0.548, 0.609
0.264, 0.369
0.295, 0.369
Change in CSF PENK
0.002, 0.021
0.075, 0.224
0.579, 0.723
0.457, 0.653
0.361, 0.602
Table summarizing the association between baseline and change in key fluid biomarkers with brain atrophy measures across different brain regions, both with and without adjustment for age and CAG repeat length. The primary regression predictors of interest were group status (control vs. HDGE) and in models testing age and CAG effects, terms for age, MiSeq-derived CAG length, and age-by-CAG interactions nested within the HDGE. The joint significance of age and CAG effects were estimated by the maximum likelihood test for differences in model fit. The models also contained covariates for sex, age and sex-by-age interaction. Longitudinal volumetric analyses of brain structures other than putamen relied on a single measure of volume change (boundary-shift integral or voxel-based morphometry convolution) per participant derived from pairs of baseline and follow-up scans. These changes were converted to annual rates and modeled by ordinary least squares regression with predictor variables analogous to those listed above. All other models of longitudinal change used the difference between the two visits as outcomes and longitudinal effects of primary predictors and covariates were estimated by interactions with follow-up time between the visits. Those models also retained all baseline effects for predictors and covariates. To preserve the unbiased estimation of model parameters when data is missing at random, baseline data from participants with no follow-up were included in the model. Significant values at FDR<0.15 are highlighted in bold. CSF, cerebrospinal fluid; FDR, false discovery rate; NfL, neurofilament light, PENK, proenkephalin.
Extended Data Table 5 | Sample size calculations
Outcome: Change in
50% Treatment Effect
70% Treatment Effect
2 years
3 years
2 years
3 years
CSF NfL
232
104
120
54
Caudate
282
126
144
64
Putamen
326
146
184
104
Somatic Expansion Ratio
614
274
314
140
Ventricular
776
346
396
176
Whole Brain
1208
538
452
202
Grey Matter
2164
962
1104
492
White Matter
3612
1606
1844
820
Table showing approximate sample size estimates for clinical trials involving equal allocation to one treatment group and a placebo group, which were calculated based on observed HDGE group versus control longitudinal models. The group differences in longitudinal rates were converted to Cohen’s d effect sizes using within-group longitudinal standard deviations derived from estimated random effect variances. Assumed treatment effects were then defined as the percent slowing of the group difference in longitudinal rates multiplied by the assumed trial length. Treatment effect assumes a reduction in the difference in rate between the HDGE and control groups. Boundary-shift integral is used to measure the change in the caudate, brain and ventricles. Gray matter and white matter changes are generated by convolving baseline voxel-based morphometry-derived gray or white tissue maps with voxel-compression maps of within-participant change. Putamen change is measured by subtraction of baseline and follow-up MALP-EM segmentations. See Supplementary Methods for further details. CSF, cerebrospinal fluid; HDGE, HD gene expanded; NfL, neurofilament light.
Extended Data Table 6 | Panel of assessments
Modality
Assessments
Cognition
Core
Stroop Colour Naming
Stroop Word Reading
Stroop Interference*
Symbol Digit Modalities Test (SDMT)
Verbal Fluency (Category)
CANTAB
Intra-Extra Dimensional Shift (IED)
One Touch Stockings of Cambridge (OTS)
Spatial Working Memory (SWM)
Paired Associate Learning (PAL)
Rapid Visual Information Processing (RVP)
Stop Signal (SST)
EMOTICOM
Emotion Intensity Face Morphing
Moral Judgement
Goals Prior Assay*
Neuropsychiatric
Self-Report Questionnaires
Pittsburgh Sleep Quality Index (PSQI)
Barratt Impulsiveness Scale (BIS-11)
Toronto Empathy Questionnaire (TEQ)
State-Trait Anxiety Inventory – Trait (STAI-T)
Obsessive-Compulsive Inventory-Revised (OCl-R)
Zung Self-Rating Depression Scale (SDS)
Apathy Motivation Index (AMI)
Toronto Alexithymia Scale (TAS-20)
Frontal Systems Behaviour Scale (FrsBe)
Short Form Health Survey (SF-36)
Neuroimaging
Volumetric
Caudate
Putamen
Grey Matter
White Matter
Ventricles
Whole Brain
DWI
Axial Diffusivity (AD)
Fractional Anisotropy (FA)
Mean Diffusivity (MD)
Radial Diffusivity (RD)
Biofluids
CSF
Mutant huntingtin
NfL
Tau
GFAP
UCH-L1
YKL-40
IL-6
IL-8
PENK
Plasma
NfL
Tau
GFAP
UCH-L1
Whole Blood – DNA
Somatic Expansion Ratio (SER)
Table providing a detailed overview of assessments across the following four modalities: cognition, neuropsychiatric, neuroimaging and biofluids. *New tasks at follow-up. CANTAB, Cambridge Neuropsychological Test Automated Battery; CSF, cerebrospinal fluid; DWI, diffusion-weighted imaging; EMOTICOM, emotion, motivation, impulsivity and social cognition; GFAP, glial fibrillary acidic protein; IL, interleukin; MPM, multiparametric mapping; NfL, neurofilament light; NODDI, neurite orientation dispersion and density imaging; PENK, proenkephalin; UCH-L1, ubiquitin carboxyl-terminal hydrolase L1; YKL-40, also known as chitinase-3 like-protein-1 (CHI3L1).
natureportfolio
Corresponding author(s):
Last updated by author(s): Nov 12, 2024
Reporting Summary
Nature Portfolio wishes to improve the reproducibility of the work that we publish. This form provides structure for consistency and transparency in reporting. For further information on Nature Portfolio policies, see our Editorial Policies and the Editorial Policy Checklist.
Please do not complete any field with “not applicable” or . Refer to the help text for what text to use if an item is not relevant to your study.
For final submission: please carefully check your responses for accuracy; you will not be able to make changes later.
Statistics
For all statistical analyses, confirm that the following items are present in the figure legend, table legend, main text, or Methods section.
n/a
□
□
□
□
□
□
□
□
X
For null hypothesis testing, the test statistic (e.g. ) with confidence intervals, effect sizes, degrees of freedom and value noted Give values as exact values whenever suitable.
Confirmed
The exact sample size for each experimental group/condition, given as a discrete number and unit of measurement
A statement on whether measurements were taken from distinct samples or whether the same sample was measured repeatedly
The statistical test(s) used AND whether they are one- or two-sided
Only common tests should be described solely by name; describe more complex techniques in the Methods section.
A description of all covariates tested
A description of any assumptions or corrections, such as tests of normality and adjustment for multiple comparisons
A full description of the statistical parameters including central tendency (e.g. means) or other basic estimates (e.g. regression coefficient) AND variation (e.g. standard deviation) or associated estimates of uncertainty (e.g. confidence intervals)
For Bayesian analysis, information on the choice of priors and Markov chain Monte Carlo settings
□ For hierarchical and complex designs, identification of the appropriate level for tests and full reporting of outcomes
Estimates of effect sizes (e.g. Cohen’s , Pearson’s ), indicating how they were calculated
Software and code
Policy information about availability of computer code
Data collection
Data analysis
Data was collected between April 6, 2022, and March 21, 2024. All derived variables were generated as per descriptions in Supplementary Methods and analysed according to the pre-specified Statistical Analysis Plan (SAP) available on ClinicalTrials.gov (NCT06391619). An additional exploratory fluid biomarker, proenkephalin (PENK) was introduced due to the availability of a novel assay.
Statistical analysis was performed using version 4.3.3. Imaging was analysed using freely available software as described in the Supplementary Methods. All software is freely available with the exception of the in-house MIDAS software used to generate the boundary shift integral for caudate, whole brain, and ventricles. This can be requested from Professor Nick Fox at the Dementia Research Centre, UCL.
For manuscripts utilizing custom algorithms or software that are central to the research but not yet described in published literature, software must be made available to editors and reviewers. We strongly encourage code deposition in a community repository (e.g. GitHub). See the Nature Portfolio guidelines for submitting code & software for further information.
Policy information about availability of data
All manuscripts must include a data availability statement. This statement should provide the following information, where applicable:
Accession codes, unique identifiers, or web links for publicly available datasets
A description of any restrictions on data availability
For clinical datasets or third party data, please ensure that the statement adheres to our policy
We are committed to data sharing whilst maintaining confidentiality due to the sensitive and potentially identifiable nature of this data. Biofluid samples will not be shared due to the limited amount of material available. Remaining samples will be required for replication for the next HD-YAS visit. Upon reasonable request, data will be made available 24 months after the end of data collection, through application via UCL to the PI, Professor Sarah Tabrizi (s.tabrizi@ucl.ac.uk). Researchers will be required to submit a proposal meeting the research criteria and must demonstrate full GDPR compliance. A data access agreement with UCL will be required.
Research involving human participants, their data, or biological material
Policy information about studies with human participants or human data. See also policy information about sex, gender (identity/presentation), and sexual orientation and race, ethnicity and racism.
Reporting on sex and gender
Reporting on race, ethnicity, or other socially relevant groupings
Population characteristics
Recruitment
Ethics oversight
Sex assigned at birth reported.
Reporting on race, ethnicity, or other socially relevant groupings not relevant to study and not reported.
These are provided in Online Methods, Supplementary Methods, Extended Data Table 1, and Extended Data Figure 1.
Participants were recruited across the UK and enrolled at one study site (UCL). The inclusion criteria have been described previously (Scahill et al., 2020; doi: 10.1016/S1474-4422(20)30143-5) and are detailed in the Supplementary Methods. Participants ( 131 in total, 64 HD gene expanded (HDGE); 67 controls) attended at baseline and 103 ( 57 HDGE; 46 controls) returned for follow-up approximately 4.5 years later.
The study received approval by the London-Bloomsbury Research Ethics Committee (22/LO/0058). All study procedures adhered to principles outlined in the Declaration of Helsinki, and prior to enrolment, written consent was obtained.
Note that full information on the approval of the study protocol must also be provided in the manuscript.
Field-specific reporting
Please select the one below that is the best fit for your research. If you are not sure, read the appropriate sections before making your selection.
Life sciences
Behavioural & social sciences
Ecological, evolutionary & environmental sciences
For a reference copy of the document with all sections, see nature.com/documents/nr-reporting-summary-flat.pdf
Life sciences study design
All studies must disclose on these points even when the disclosure is negative.
Sample size
Sample size calculations were provided by our statistician, Professor Douglas Langbehn of the University of lowa. These were based on the assumptions that with a type 1 error rate of , a sample of 60 participants/group will provide power to detect a mean difference versus controls of 0.53 adjusted within group standard deviations (effect size), allowing for 5 covariates. Similarly, after allowing for 5 covariates, the sample of 60 CAG-expanded participants allows the same statistical power for detecting a partial Pearson correlation of 0.36 among outcome measures and between these measures and the CAP score or other potential predictors of Huntington’s disease risk.
Data exclusions
These are provided in Supplementary Table 5 with further details of reasons for exclusions provided in Supplementary Methods.
Replication
All human plasma and cerebrospinal fluid (CSF) analytes were successfully measured. The Neurology 4-Plex A (GFAP, NfL, Tau, UCH-L1) was measured in singlicate, yielding the following inter-plate coefficients of variation (%CV): CSF GFAP , CSF NfL , CSF Tau , CSF UCH-L1 , plasma GFAP , plasma NfL , plasma Tau , and plasma UCH-L1 . The %CVs were calculated from duplicate measurements of internal plate controls made of pooled human plasma. CSF IL-6, IL-8, and YKL-40 were measured in duplicate, with the following %CVs: CSF YKL-40 (10.4%), CSF IL-6 (29.2%), and CSF IL-8 (12.2%). CSF mHTT was measured in triplicate and the relative abundance of CSF PENK was quantified in single measurements.
Randomization
This is a longitudinal observational study, not an interventional study.
Blinding
Study staff providing clinical assessments were not blinded to genetic status due to the need to obtain appropriate consent and discuss any potential clinical symptoms etc. All quality control of data, image, and biofluid analysis was performed blinded to genetic status. Data was exported and analysed by an independent statistician, Professor Douglas Langbehn of the University of Iowa.
Behavioural & social sciences study design
All studies must disclose on these points even when the disclosure is negative.
Study description
Briefly describe the study type including whether data are quantitative, qualitative, or mixed-methods (e.g. qualitative cross-sectional, quantitative experimental, mixed-methods case study).
Research sample
State the research sample (e.g. Harvard university undergraduates, villagers in rural India) and provide relevant demographic information (e.g. age, sex) and indicate whether the sample is representative. Provide a rationale for the study sample chosen. For studies involving existing datasets, please describe the dataset and source.
Sampling strategy
Describe the sampling procedure (e.g. random, snowball, stratified, convenience). Describe the statistical methods that were used to predetermine sample size OR if no sample-size calculation was performed, describe how sample sizes were chosen and provide a rationale for why these sample sizes are sufficient. For qualitative data, please indicate whether data saturation was considered, and what criteria were used to decide that no further sampling was needed.
Data collection
Provide details about the data collection procedure, including the instruments or devices used to record the data (e.g. pen and paper, computer, eye tracker, video or audio equipment) whether anyone was present besides the participant(s) and the researcher, and whether the researcher was blind to experimental condition and/or the study hypothesis during data collection.
Timing
Indicate the start and stop dates of data collection. If there is a gap between collection periods, state the dates for each sample cohort.
Data exclusions
If no data were excluded from the analyses, state so OR if data were excluded, provide the exact number of exclusions and the rationale behind them, indicating whether exclusion criteria were pre-established.
Non-participation
State how many participants dropped out/declined participation and the reason(s) given OR provide response rate OR state that no participants dropped out/declined participation.
Randomization
If participants were not allocated into experimental groups, state so OR describe how participants were allocated to groups, and if allocation was not random, describe how covariates were controlled.
Ecological, evolutionary & environmental sciences study design
All studies must disclose on these points even when the disclosure is negative.
Study description
Briefly describe the study. For quantitative data include treatment factors and interactions, design structure (e.g. factorial, nested, hierarchical), nature and number of experimental units and replicates.
Research sample
Describe the research sample (e.g. a group of tagged Passer domesticus, all Stenocereus thurberi within Organ Pipe Cactus National Monument), and provide a rationale for the sample choice. When relevant, describe the organism taxa, source, sex, age range and any manipulations. State what population the sample is meant to represent when applicable. For studies involving existing datasets, describe the data and its source.
Sampling strategy
Note the sampling procedure. Describe the statistical methods that were used to predetermine sample size OR if no sample-size calculation was performed, describe how sample sizes were chosen and provide a rationale for why these sample sizes are sufficient.
Data collection
Describe the data collection procedure, including who recorded the data and how.
Timing and spatial scale
Indicate the start and stop dates of data collection, noting the frequency and periodicity of sampling and providing a rationale for these choices. If there is a gap between collection periods, state the dates for each sample cohort. Specify the spatial scale from which the data are taken
Data exclusions
If no data were excluded from the analyses, state so OR if data were excluded, describe the exclusions and the rationale behind them, indicating whether exclusion criteria were pre-established.
Reproducibility
Describe the measures taken to verify the reproducibility of experimental findings. For each experiment, note whether any attempts to repeat the experiment failed OR state that all attempts to repeat the experiment were successful.
Randomization
Describe how samples/organisms/participants were allocated into groups. If allocation was not random, describe how covariates were controlled. If this is not relevant to your study, explain why.
Blinding
Describe the extent of blinding used during data acquisition and analysis. If blinding was not possible, describe why OR explain why blinding was not relevant to your study.
Did the study involve field work?
Field conditions
Describe the study conditions for field work, providing relevant parameters (e.g. temperature, rainfall).
Location
State the location of the sampling or experiment, providing relevant parameters (e.g. latitude and longitude, elevation, water depth).
Access & import/export
Describe the efforts you have made to access habitats and to collect and import/export your samples in a responsible manner and in compliance with local, national and international laws, noting any permits that were obtained (give the name of the issuing authority, the date of issue, and any identifying information).
Disturbance
Describe any disturbance caused by the study and how it was minimized.
Reporting for specific materials, systems and methods
We require information from authors about some types of materials, experimental systems and methods used in many studies. Here, indicate whether each material, system or method listed is relevant to your study. If you are not sure if a list item applies to your research, read the appropriate section before selecting a response.
Materials & experimental systems
Methods
n/a
Involved in the study
n/a
□
– Antibodies
X
X
□ Eukaryotic cell lines
X
X
□ Palaeontology and archaeology
□
X
□ Animals and other organisms
□
X Clinical data
X
□
X
□
Antibodies
Antibodies used
Biofluid assay details (for human plasma and cerebrospinal fluid analyses) available in Supplementary Table 19.
Validation
Describe the validation of each primary antibody for the species and application, noting any validation statements on the manufacturer’s website, relevant citations, antibody profiles in online databases, or data provided in the manuscript.
Eukaryotic cell lines
Policy information about cell lines and Sex and Gender in Research
Cell line source(s)
Authentication
Mycoplasma contamination
Commonly misidentified lines (See ICLAC register)
Palaeontology and Archaeology
Specimen provenance
Specimen deposition
Provide provenance information for specimens and describe permits that were obtained for the work (including the name of the issuing authority, the date of issue, and any identifying information). Permits should encompass collection and, where applicable, export.
Indicate where the specimens have been deposited to permit free access by other researchers.
State the source of each cell line used and the sex of all primary cell lines and cells derived from human participants or vertebrate models.
Describe the authentication procedures for each cell line used OR declare that none of the cell lines used were authenticated.
Confirm that all cell lines tested negative for mycoplasma contamination OR describe the results of the testing for mycoplasma contamination OR declare that the cell lines were not tested for mycoplasma contamination.
Name any commonly misidentified cell lines used in the study and provide a rationale for their use.
Dating methods
If new dates are provided, describe how they were obtained (e.g. collection, storage, sample pretreatment and measurement), where they were obtained (i.e. lab name), the calibration program and the protocol for quality assurance OR state that no new dates are provided.
□ Tick this box to confirm that the raw and calibrated dates are available in the paper or in Supplementary Information.
Ethics oversight
Identify the organization(s) that approved or provided guidance on the study protocol, OR state that no ethical approval or guidance was required and explain why not.
Note that full information on the approval of the study protocol must also be provided in the manuscript.
Animals and other research organisms
Policy information about studies involving animals; ARRIVE guidelines recommended for reporting animal research, and Sex and Gender in Research
Laboratory animals
For laboratory animals, report species, strain and age OR state that the study did not involve laboratory animals.
Wild animals
Provide details on animals observed in or captured in the field; report species and age where possible. Describe how animals were caught and transported and what happened to captive animals after the study (if killed, explain why and describe method; if released, say where and when) OR state that the study did not involve wild animals.
Reporting on sex
Indicate if findings apply to only one sex; describe whether sex was considered in study design, methods used for assigning sex. Provide data disaggregated for sex where this information has been collected in the source data as appropriate; provide overall numbers in this Reporting Summary. Please state if this information has not been collected. Report sex-based analyses where performed, justify reasons for lack of sex-based analysis.
Field-collected samples
For laboratory work with field-collected samples, describe all relevant parameters such as housing, maintenance, temperature, photoperiod and end-of-experiment protocol OR state that the study did not involve samples collected from the field.
Ethics oversight
Identify the organization(s) that approved or provided guidance on the study protocol, OR state that no ethical approval or guidance was required and explain why not.
Note that full information on the approval of the study protocol must also be provided in the manuscript.
Clinical data
Policy information about clinical studies
All manuscripts should comply with the ICMJE guidelines for publication of clinical research and a completed CONSORT checklist must be included with all submissions.
Clinical trial registration
NCT06391619
Study protocol
The full study protocol is available on ClinicalTrials.gov NCT06391619.
Data collection
Data was collected between April 6, 2022, and March 21, 2024. All derived variables were generated as per descriptions in Supplementary Methods and analysed according to the pre-specified SAP available on ClinicalTrials.gov (NCT06391619). An additional exploratory fluid biomarker, proenkephalin (PENK) was introduced due to the availability of a novel assay.
Outcomes
All outcomes were pre-specified in the SAP available on ClinicalTrials.gov NCT06391619 and are listed in Extended Data Table 6. An additional exploratory outcome was included in our biofluid analysis, CSF PENK, due to the development of a novel assay.
Dual use research of concern
Policy information about dual use research of concern
Hazards
Could the accidental, deliberate or reckless misuse of agents or technologies generated in the work, or the application of information presented in the manuscript, pose a threat to:
No
Yes
□
□ Public health
□
□ National security
□
□ Crops and/or livestock
□
□ Ecosystems
□
□ Any other significant area
Experiments of concern
Does the work involve any of these experiments of concern:
No
Yes
□
□ Demonstrate how to render a vaccine ineffective
□
□ Confer resistance to therapeutically useful antibiotics or antiviral agents
□
□ Enhance the virulence of a pathogen or render a nonpathogen virulent
□
□ Increase transmissibility of a pathogen
□
□ Alter the host range of a pathogen
□
□ Enable evasion of diagnostic/detection modalities
□
□ Enable the weaponization of a biological agent or toxin
□
□ Any other potentially harmful combination of experiments and agents
Plants
Seed stocks
Report on the source of all seed stocks or other plant material used. If applicable, state the seed stock centre and catalogue number. If plant specimens were collected from the field, describe the collection location, date and sampling procedures.
Novel plant genotypes
Describe the methods by which all novel plant genotypes were produced. This includes those generated by transgenic approaches, gene editing, chemical/radiation-based mutagenesis and hybridization. For transgenic lines, describe the transformation method, the number of independent lines analyzed and the generation upon which experiments were performed. For gene-edited lines, describe the editor used, the endogenous sequence targeted for editing, the targeting guide RNA sequence (if applicable) and how the editor was applied.
Authentication
Describe any authentication procedures for each seed stock used or novel genotype generated. Describe any experiments used to assess the effect of a mutation and, where applicable, how potential secondary effects (e.g. second site T-DNA insertions, mosiacism, off-target gene editing) were examined.
ChIP-seq
Data deposition
□ Confirm that both raw and final processed data have been deposited in a public database such as GEO.
□ Confirm that you have deposited or provided access to graph files (e.g. BED files) for the called peaks.
Data access links
May remain private before publication.
Files in database submission
Genome browser session
(e.g.
UCSC)
For “Initial submission” or “Revised version” documents, provide reviewer access links. For your “Final submission” document, provide a link to the deposited data.
Provide a list of all files available in the database submission.
Provide a link to an anonymized genome browser session for “Initial submission” and “Revised version” documents only, to enable peer review. Write “no longer applicable” for “Final submission” documents.
Methodology
Replicates
Describe the experimental replicates, specifying number, type and replicate agreement.
Sequencing depth
Describe the sequencing depth for each experiment, providing the total number of reads, uniquely mapped reads, length of reads and whether they were paired- or single-end.
Antibodies
Describe the antibodies used for the ChIP-seq experiments; as applicable, provide supplier name, catalog number, clone name, and lot number.
Peak calling parameters
Specify the command line program and parameters used for read mapping and peak calling, including the ChIP, control and index files used.
Data quality
Describe the methods used to ensure data quality in full detail, including how many peaks are at FDR 5% and above 5-fold enrichment.
Software
Describe the software used to collect and analyze the ChIP-seq data. For custom code that has been deposited into a community repository, provide accession details.
Plots
Confirm that:
□ The axis labels state the marker and fluorochrome used (e.g. CD4-FITC).
□ The axis scales are clearly visible. Include numbers along axes only for bottom left plot of group (a ‘group’ is an analysis of identical markers).
□ All plots are contour plots with outliers or pseudocolor plots.
□ A numerical value for number of cells or percentage (with statistics) is provided.
Methodology
Sample preparation
Describe the sample preparation, detailing the biological source of the cells and any tissue processing steps used.
Instrument
Identify the instrument used for data collection, specifying make and model number.
Software
Describe the software used to collect and analyze the flow cytometry data. For custom code that has been deposited into a community repository, provide accession details.
Cell population abundance
Describe the abundance of the relevant cell populations within post-sort fractions, providing details on the purity of the samples and how it was determined.
Gating strategy
Describe the gating strategy used for all relevant experiments, specifying the preliminary FSC/SSC gates of the starting cell population, indicating where boundaries between “positive” and “negative” staining cell populations are defined.
Magnetic resonance imaging
Experimental design
Design type
Observational study of HDGE and healthy control participants.
Design specifications
Participants were recruited on the basis of being able to undergo 3-Tesla (3T) MRI. After recruitment some participants were not able to complete MRI assessments due to unexpected claustrophobia and other contraindications.
>80% of the cohort underwent MRI.
Behavioral performance measures
There were no behavioural performance measures included with the MRI.
Acquisition
Field strength
3-Tesla (3T).
Sequence & imaging parameters
These are provided in the Supplementary Methods.
Area of acquisition
□
Whole brain.
Diffusion MRI
□ Not used
Preprocessing
Preprocessing software
FreeSurfer 7.2.0 was used for structural connectivity analyses, and FreeSurfer 6 for HD-ISS staging, as specified in Tabrizi et al., 2022 (doi: 10.1016/S1474-4422(22)00120-X). Additional software included FSL 5.0.11, DTITK 2.3.3, MIDAS 6.7, VBM (SPM12), MALP-EM 1.2, and MRtrix 3.0.4. Further details and information are available in the Supplementary Methods.
Normalization
DTITK 2.3.3, VBM (SPM12), MIDAS 6.7.
Normalization template
Study-specific template in JHU space (Mori et al., 2008; doi: 10.1016/j.neuroimage.2007.12.035).
Noise and artifact removal
Topup, eddy correct and FA ring removal using DTITK 2.3.3, bias correction using N3 (Sled et al., 1998; doi: 10.1109/42.668698) within MIDAS 6.7.
Volume censoring
Topup, eddy correct and FA ring removal using DTITK 2.3.3, bias correction using N3 (Sled et al., 1998; doi:
Statistical modeling & inference
Model type and settings
□
Linear mixed models.
Effect(s) tested
Group differences, associations with age and CAG, biofluids, and somatic expansion ratio.
Specify type of analysis:
□ ROI-based
Statistic type for inference
(See Eklund et al. 2016)
Specify voxel-wise or cluster-wise and report all relevant parameters for cluster-wise methods.
Correction
Multiple comparisons using the False Discovery Rate (FDR).
Models & analysis
n/a
Involved in the study
X □ Functional and/or effective connectivity
X □ Graph analysis □ Multivariate modeling or predictive analysis
Functional and/or effective connectivity
Report the measures of dependence used and the model details (e.g. Pearson correlation, partial correlation, mutual information).
Graph analysis
Report the dependent variable and connectivity measure, specifying weighted graph or binarized graph, subject-or group-level, and the global and/or node summaries used (e.g. clustering coefficient, efficiency, etc.).
Multivariate modeling and predictive analysis
Specify independent variables, features extraction and dimension reduction, model, training and evaluation metrics.
Huntington’s Disease Centre, Department of Neurodegenerative Disease, UCL Queen Square Institute of Neurology, University College London, London, UK. Department of Psychiatry, University of Cambridge, Cambridge, UK. School of Molecular Biosciences, College of Medical, Veterinary and Life Sciences, University of Glasgow, Glasgow, UK. Department of Psychiatry and Neurochemistry, Institute of Neuroscience and Physiology, Sahlgrenska Academy at University of Gothenburg, Mölndal, Sweden. Clinical Neurochemistry Laboratory, Sahlgrenska University Hospital, Mölndal, Sweden. Department of Computer Science and Centre for Medical Image Computing, University College London, London, UK. Dementia Research Centre, Department of Neurodegenerative Disease, UCL Queen Square Institute of Neurology, University College London, London, UK. Department of Brain Repair and Rehabilitation, UCL Queen Square Institute of Neurology, University College London, London, UK. Department of Psychiatry and Biostatistics, Carver College of Medicine and College of Public Health, University of Iowa, Iowa City, Iowa, USA. Dementia Research Institute, University College London, London, UK. Department of Neurodegenerative Disease, UCL Queen Square Institute of Neurology, University College London, London, UK. Faculdade Medicina da Universidade de Lisboa (FMUL), Lisbon, Portugal. CHDI Management, Inc. Advisors to CHDI Foundation, Princeton, NJ, USA. Department of Psychology, University of Cambridge, Cambridge, UK. Hong Kong Center for Neurodegeneassociated with substantially fasterrative Diseases, Clear Water Bay, Hong Kong, China. Wisconsin Alzheimer’s Disease Research Center, University of Wisconsin School of Medicine and Public Health, University of Wisconsin-Madison, Madison, WI, USA. UCL Institute of Cognitive Neuroscience, University College London, London, UK. Department of Clinical Neurosciences, University of Cambridge, Cambridge Biomedical Campus, Cambridge, UK. Cambridge University Hospitals NHS Foundation Trust, Cambridge, UK. Medical Research Council Cognition and Brain Sciences Unit, University of Cambridge, Cambridge, UK. These authors contributed equally: Rachael I. Scahill, Mena Farag. e-mail: s.tabrizi@ucl.ac.uk
Extended Data Fig. 2 | Annualized rate of change in non-significant biofluid markers. Panel shows comparison of standardized residuals for annualized rate of change in the HDGE vs. control groups for: (a) CSF Tau, (b) CSF GFAP, (c) CSF UCH-L1, (d) plasma Tau, (e) plasma GFAP, (f) plasma UCH-L1, (g) CSF IL-6, (h) CSF IL-8 and (i) plasma NfL. Negative standardized residuals indicate that the rate of change was less than the adjusted mean rate of change across both groups. The horizontal lines represent medians, boxes indicate the upper and lower quartiles, and whiskers are IQR. All statistical analyses were conducted using mixedeffect linear models with a participant-specific random effect, controlling for
age, sex and their interaction. Natural log-transformed concentrations served as the outcomes in these models. Statistical two-sided group comparisons and correlations controlled for the effects of age and sex and were corrected for multiple comparisons using the FDR. CSF, cerebrospinal fluid; FDR, false discovery rate; GFAP, glial fibrillary acidic protein; HDGE, HD gene expanded; IL, interleukin; IQR, interquartile range; NfL, neurofilament light; UCH-L1, ubiquitin carboxyl-terminal hydrolase L1; YKL-40, also known as chitinase-3 like-protein-1 (CHI3L1).