DOI: https://doi.org/10.1186/s12879-023-08858-w
PMID: https://pubmed.ncbi.nlm.nih.gov/38212685
تاريخ النشر: 2024-01-11
ديناميات الزمان والمكان وعوامل التحديث المؤثرة على داء البروسيلات البشري في البر الرئيسي للصين من 2005-2021
الملخص
خلفية: يشكل داء البروسيلات قلقًا كبيرًا للصحة العامة. تستكشف هذه الدراسة التطور الديناميكي المكاني والزماني لداء البروسيلات البشري في الصين وتحلل التباين المكاني لعوامل التأثير المتعلقة بحدوث داء البروسيلات البشري على المستوى الإقليمي. الطرق: تم استخدام نموذج نقطة الانضمام، ونموذج هجرة مركز الثقل، وتحليل الارتباط الذاتي المكاني لتقييم التغيرات المحتملة في التوزيع المكاني والزماني لداء البروسيلات البشري في البر الرئيسي للصين من 2005 إلى 2021. تم بناء نماذج المربعات الصغرى العادية (OLS)، والانحدار الجغرافي الموزون (GWR)، والانحدار الجغرافي الموزون متعدد المقاييس (MGWR) لتحليل الارتباط المكاني والزماني بين معدل حدوث داء البروسيلات البشري والعوامل المناخية والاجتماعية. النتائج: من 2005 إلى 2021، أظهر داء البروسيلات البشري في الصين اتجاهًا تصاعديًا مستمرًا. ارتفع معدل الحدوث بشكل أسرع في جنوب ووسط وجنوب غرب الصين، مما أدى إلى تحول في مركز الثقل من الشمال إلى الجنوب الغربي، كما هو موضح في مخطط مسار الهجرة. لوحظ تجميع مكاني قوي. تفوق نموذج MGWR على النماذج الأخرى. أشارت الرسوم البيانية الزمانية والمكانية إلى أن انخفاض متوسط درجات الحرارة السنوية وزيادة إنتاج اللحم البقري والضأن والحليب ارتبطت بشكل كبير بزيادة معدل حدوث داء البروسيلات. كانت مدن مثل قوانغشي وقوانغدونغ أكثر تأثرًا بالدرجات المنخفضة، بينما تأثرت شينجيانغ والتبت أكثر بإنتاج اللحم البقري والحليب. كانت منغوليا الداخلية وهيلونغجيانغ أكثر تأثرًا بإنتاج لحم الضأن. من المهم أن زيادة الناتج المحلي الإجمالي الإقليمي ونفقات الصحة كان لهما تأثير وقائي ملحوظ ضد حدوث داء البروسيلات البشري. الاستنتاجات: لا يزال داء البروسيلات البشري يمثل تحديًا واسع الانتشار. تؤثر العوامل المناخية والاجتماعية بشكل كبير على حدوثه بطريقة محددة زمانيًا ومكانيًا. يجب أن تكون استراتيجيات الوقاية مصممة خصيصًا لكل منطقة، مما يوفر رؤى قيمة لتدابير فعالة للسيطرة على داء البروسيلات.
*المراسلة:
دان دينغ
100079@cqmu.edu.cn
الخلفية
خطيرًا في العالم اليوم. يوجد وباء داء البروسيلات في أكثر من 170 دولة ومنطقة، مما يتسبب في خسائر اقتصادية بمليارات الدولارات على مستوى العالم. في عام 1905، حدث داء البروسيلات لأول مرة في شنغهاي، الصين. بعد ذلك، من الثمانينيات إلى أوائل التسعينيات، بدأت البر الرئيسي للصين تدريجيًا في تنفيذ أنشطة الوقاية والسيطرة على داء البروسيلات. أصبح المرض مشكلة صحية عامة رئيسية على مستوى العالم حيث إنه لا يهدد رفاهية الإنسان فحسب، بل يقلل أيضًا من إنتاجية الماشية، ويزيد من العبء الطبي، ويشكل أيضًا خطرًا على سلامة الغذاء.
تشير الأدلة المتزايدة إلى أن داء البروسيلات يظهر خصائص زمانية ومكانية قوية. مع إطلاق المراقبة النشطة لداء البروسيلات في عام 2005، تم تعميق الوقاية والسيطرة على داء البروسيلات في جميع مناطق الصين تحت التوجيه الموحد للدولة، ولكن هناك اختلافات في تاريخ التنمية، والبيئة الطبيعية، والمستوى الاقتصادي، وخصائص النظام الغذائي في المناطق المختلفة، مما يستدعي استكشاف التطور المكاني والزماني لداء البروسيلات، فضلاً عن تباين عوامل المرض على المستوى بين المقاطعات. ومع ذلك، غالبًا ما تركز الدراسات الحالية على تحليلات الانحدار الزمني أو المكاني المستقلة، والتي لها قيود. يتم تقييم الاتجاه الزمني لداء البروسيلات باستخدام تحليل الانحدار التقليدي، والذي يعكس بشكل أساسي الاتجاه العام للبيانات العالمية وقد لا يكشف عن الاتجاهات المحددة في البيانات المحلية. في التحليل المكاني، تُستخدم نماذج الانحدار الخطي أو الانحدار اللوجستي بشكل شائع، مع افتراض ثبات معاملات الانحدار عبر منطقة الدراسة بأكملها وتجاهل عدم الاستقرار المكاني. وبالتالي، قد لا تلتقط نتائج البحث الخصائص المكانية الحقيقية والتباين المكاني لعوامل التأثير بشكل كامل.
كلما كانت المسافة أقرب، كان الارتباط أقوى (قانون توبلر الأول)، وإذا كان من غير المناسب تقسيم المنطقة مباشرة لتحليلات الانحدار الخطي التقليدية، فمن الضروري أخذ عينات ضمن نطاق مكاني معين حول كل عينة. يمكن أن يكشف الانحدار الجغرافي الموزون (GWR)، الذي قدمه العلماء لدراسة العلاقات والارتباطات المكانية، عن عدم سلاسة الفضاء بشكل فعال. لقد وجد تطبيقات واسعة في مجالات متعددة التخصصات. ومع ذلك، يفترض GWR نفس عرض النطاق الترددي الأمثل لجميع المتغيرات التفسيرية، مما قد يؤدي إلى تقديرات معلمات متحيزة. يمكن أن تنتج جميع المتغيرات التفسيرية في نموذج GWR الكلاسيكي فقط مقياس عمل موحد، ولكن العوامل الواقعية التي تؤثر على داء البروسيلات لها مقاييس عمل مختلفة على المستوى الزماني والمكاني. في عام 2017، اقترح فوترينغهام وآخرون نموذج الانحدار الجغرافي الموزون متعدد المقاييس (MGWR)، وهو امتداد لـ GWR يأخذ في الاعتبار عرض النطاق الترددي المكاني المختلف للمتغيرات المستقلة. أصبح MGWR أداة فعالة لكشف تأثير ونطاق العوامل البيئية.
الطرق
مصدر البيانات
التحليل الإحصائي
الاتجاهات الزمنية
أبعاد مختلفة مثل تاريخ التنمية، والبيئة الطبيعية، والمستوى الاقتصادي، وخصائص النظام الغذائي، والعرق، وتم تطوير المنهجية من قبل الدولة. وفقًا للمناطق الجغرافية الطبيعية السبع في الصين، تم تحليل الخصائص الزمنية لانتشار داء البروسيلات البشري في كل منطقة من خلال بناء نماذج Join-point. تتيح هذه الطريقة تحليل نقاط التحول، وتحديد مواقعها، وتحديد اتجاه التغيير، حيث يتم اختيار نقاط التحول بواسطة طريقة البحث الشبكي (GSM)، التي تقسم الفضاء الذي توجد فيه المعلمات إلى شبكة، وكل نقطة تقاطع تتوافق مع خطة تخطيط، ثم يتم حساب مؤشر الأداء للخطة المقابلة نقطة بنقطة بخطوة ثابتة في فترة محددة لتحديد المعلمات المثلى. بالنسبة لتحليل نموذج Joinpoint، يقوم GSM بإنشاء شبكة لجميع المواقع الممكنة لـ “نقاط التحول”، ويحسب مجموع الأخطاء المربعة (SSE) ومتوسط الأخطاء المربعة (MSE) لكل حالة، ويختار الشبكة ذات أقل MSE كنقطة تحول مثلى. يتم اختيار الشبكة ذات أقل MSE كنقطة تحول مثلى، وحساب نسبة التغيير السنوي (APC) ومتوسط نسبة التغيير السنوي (AAPC) لتوضيح اتجاه وسرعة التغيير للمناطق الكلية والمحلية على التوالي. إذا كانت APC أكبر من 0، فإن معدل الإصابة في تزايد من عام إلى عام، والعكس صحيح. الصيغ لـ APC و AAPC هي كما يلي:
التوزيع المكاني
مسافة التحول المكاني، تمثل التحول في إحداثيات مركز الثقل لعامل الدراسة من السنة
بناء النموذج
نموذج GWR هو نموذج محسّن يعتمد على نموذج الانحدار الخطي التقليدي. تتمثل ميزته الرئيسية في القدرة على تطبيق مصفوفة الوزن المكاني على نموذج الانحدار الخطي، مما سيظهر بشكل أفضل التباين الهيكلي المكاني للنتائج. يمكن التعبير عن النموذج كما يلي.
النتائج
الاتجاهات الزمنية في وباء البروسيلا الوطني من 2005 إلى 2021
التغيرات المكانية في حدوث حمى المالطية على المستوى الوطني من 2005 إلى 2021
| منطقة | مقاطعة | سنة | APC(\٪) | نسبة AAPC (\٪) |
| شمال شرق الصين | لياونينغ، هيلونغجيانغ، جيلين | 2005-2012 | 14.5* | ٤.٤ |
| 2012-2021 | -2.8 | |||
| شمال الصين | بكين، تيانجين، خبي، شانشي، منغوليا الداخلية | 2005-2009 | 17.7* | 5.2 |
| 2009-2014 | -1.2 | |||
| 2014-2017 | -19.0 | |||
| 2017-2021 | 23.8* | |||
| شرق الصين | شنغهاي، تشجيانغ، آنهوي، فوجيان، جيانغشي، شاندونغ، جيانغسو | 2005-2009 | 2.8 | 20.0* |
| 2009-2015 | 67.6* | |||
| 2015-2021 | -4.8 | |||
| جنوب الصين | قوانغدونغ، قوانغشي، هاينان | 2005-2016 | 52.1* | 33.3* |
| 2016-2021 | -0.3 | |||
| وسط الصين | هينان، هوبي، هونان | 2005-2015 | 46.1* | 24.3* |
| 2015-2018 | -32.6 | |||
| 2018-2021 | 33.4* | |||
| شمال غرب الصين | شانشي، تشينغهاي، نينغشيا، شينجيانغ، قانسو | 2005-2011 | 21.3* | 20.2* |
| 2011-2015 | 64.9* | |||
| 2015-2018 | -25.2 | |||
| 2018-2021 | ٢٤.٤ | |||
| جنوب غرب الصين | تشونغتشينغ، سيتشوان، قويتشو، يوننان، التبت | 2005-2007 | -62.0 | 23.7* |
| 2007-2015 | 74.5* | |||
| 2015-2021 | 16.0 |
أظهر تحليل الارتباط الذاتي العالمي أن الارتباط الذاتي المكاني لموران
| سنة | 2005 | 2007 | 2009 |
| موران / | 0.145 | 0.200 | 0.180 |
| قيمة Z | ٣.٠٩٢ | ٣.٦١٨ | 3.831 |
|
|
0.002 | <0.001 | < 0.001 |
| سنة | 2011 | 2013 | 2015 |
| موران / | 0.166 | 0.398 | 0.263 |
| قيمة Z | ٣.٦٤١ | ٤.٣٩١ | ٢.٩٣١ |
|
|
< 0.001 | < 0.001 | 0.003 |
| سنة | 2017 | 2019 | 2021 |
| موران / | 0.291 | 0.295 | 0.329 |
| قيمة Z | ٣.٢١٢ | ٣.٨٦٧ | ٤.٠٧١ |
|
|
0.001 | < 0.001 | < 0.001 |
نتائج مقارنة ملاءمة النموذج
| نماذج | AICc |
|
معدل
|
| OLS | ٣٤٩٣.٨٩٩ | 0.642 | 0.633 |
| جي دبليو آر | ٩٧٤.٧٣٢ | 0.636 | 0.629 |
| MGWR | 639.626 | 0.838 | 0.822 |
| متوسط
|
من | طب | ماكس |
|
|
| أيه إيه تي (
|
|
-0.485 | -0.473 | -0.467 | < 0.001 |
| ARH(%) |
|
-0.177 | -0.040 | -0.006 | 0.744 |
| AP(mm) |
|
-0.199 | -0.028 | 0.020 | 0.067 |
| ASH(ساعات) |
|
0.090 | 0.137 | 0.154 | 0.105 |
| نظام التشغيل الوطني (مليون) |
|
0.095 | 0.103 | 0.108 | 0.964 |
| نوس (مليون) |
|
-0.747 | -0.523 | 0.377 | 0.007 |
| بي بي (مليون طن) |
|
-1.020 | -0.408 | 0.425 | < 0.001 |
| مليون طن |
|
0.294 | 0.896 | 1.025 | < 0.001 |
| دي بي (مليون طن) |
|
-0.095 | 0.143 | ٣.٥٥٨ | < 0.001 |
| الناتج المحلي الإجمالي (مليار يوان) |
|
-0.022 | -0.013 | -0.007 | 0.009 |
| الناتج المحلي الإجمالي (مليار يوان) |
|
0.030 | 0.031 | 0.051 | 0.658 |
| HE (مليار يوان) |
|
-0.465 | -0.029 | 0.170 | 0.015 |
التوزيع المكاني والزماني لمعاملات الانحدار في MGWR
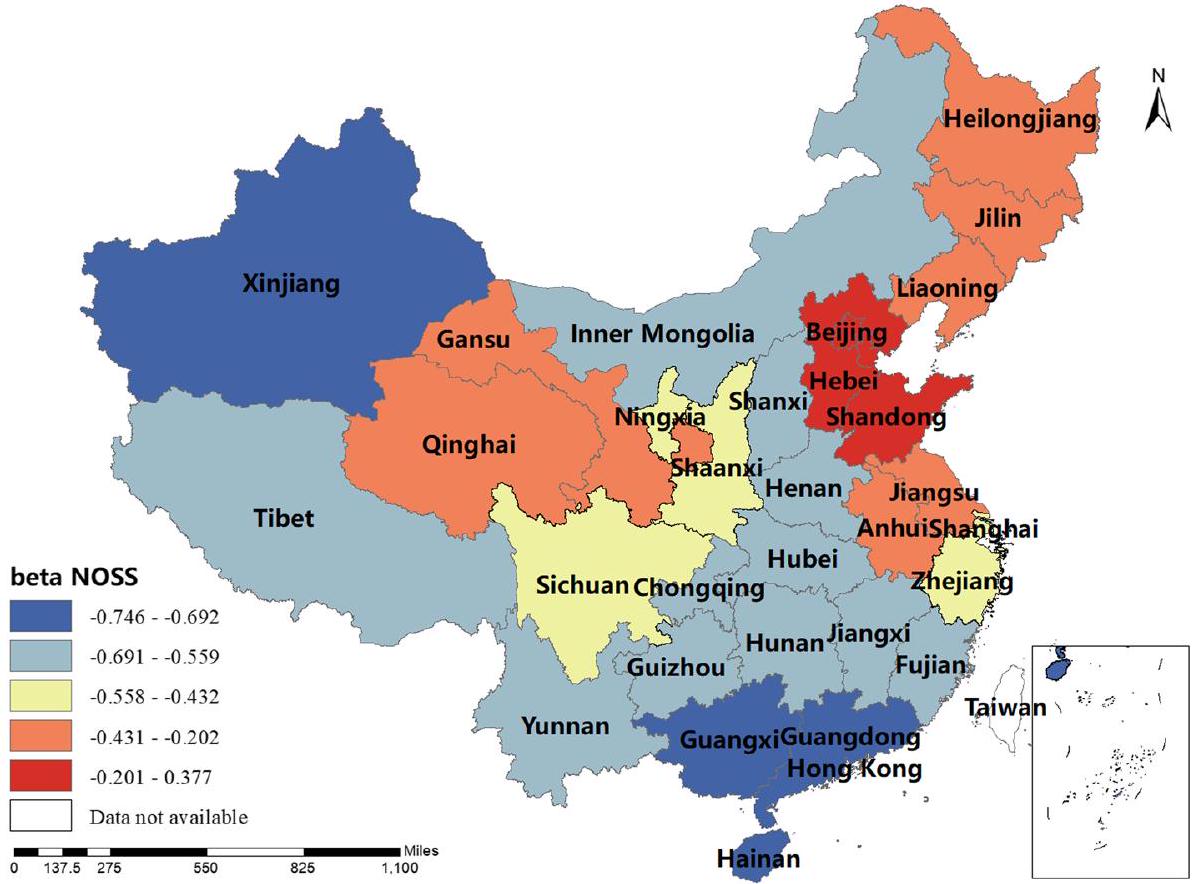
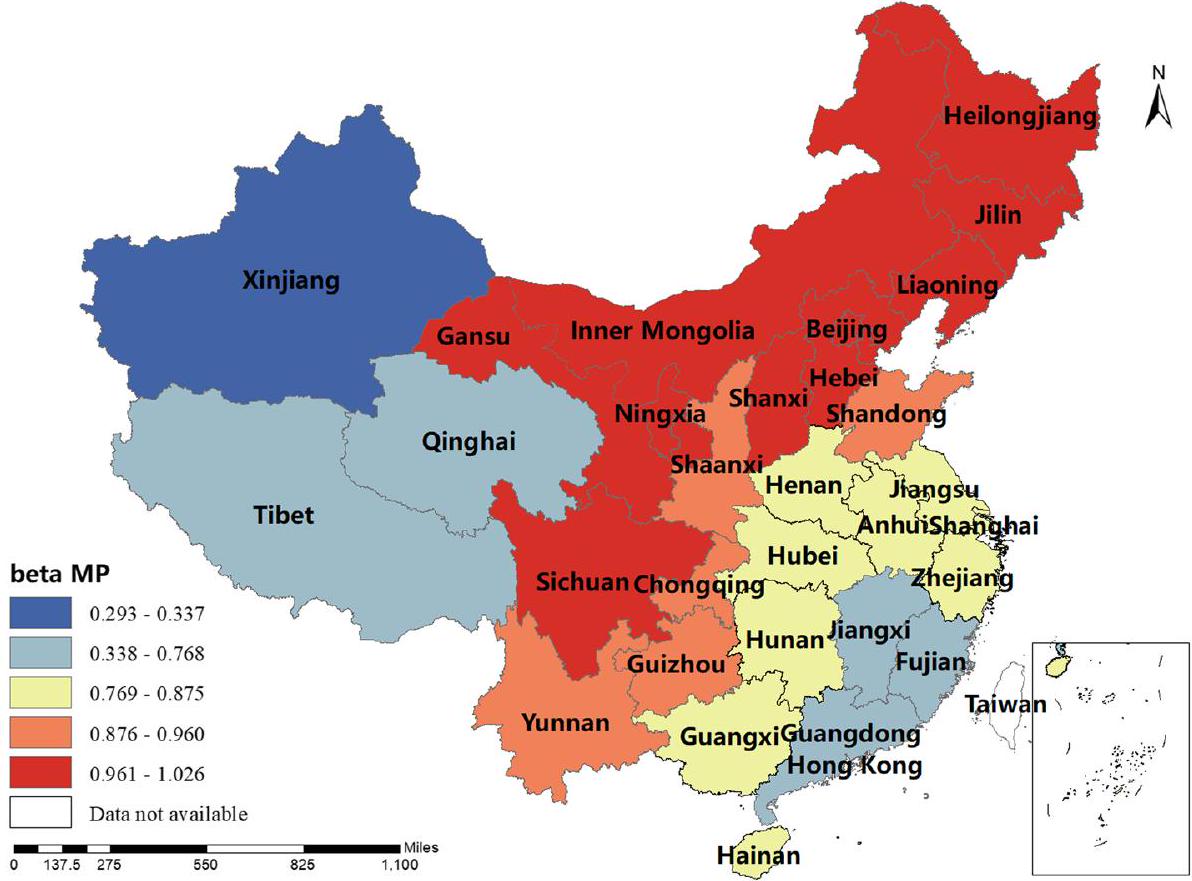
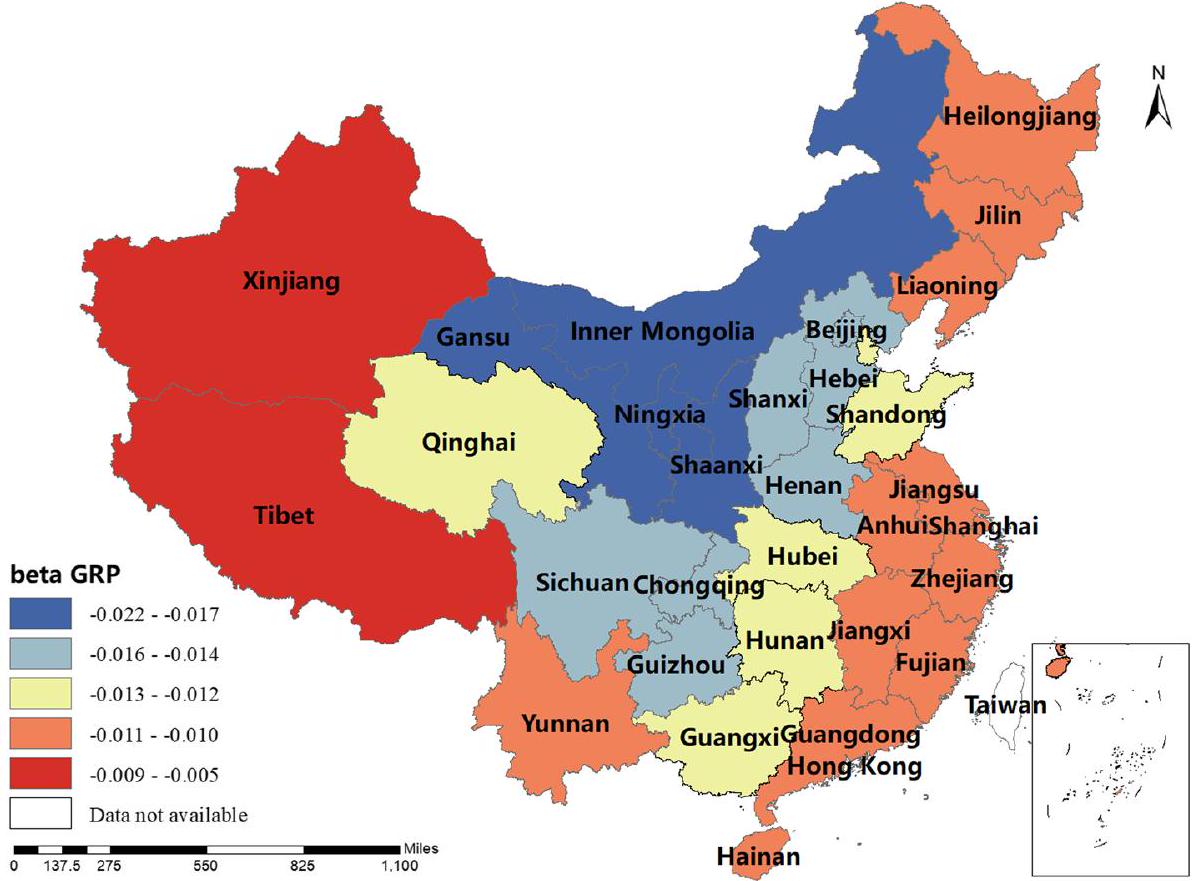
كان معامل BP إيجابيًا في شينشيانغ، هونان، التبت، تشينغهاي وسينكيانغ، أي أنه كلما زادت إنتاجية لحم البقر، زادت نسبة الإصابة بالبروسيلا البشرية. كانت تقديرات معامل MP جميعها إيجابية، مما يدل على أن إنتاج لحم الضأن كان مرتبطًا إيجابيًا مع نسبة الإصابة بالبروسيلا البشرية. يلعب هذا العامل دورًا مهمًا في منغوليا الداخلية، هيلونغجيانغ، جيلين، لياونينغ، قانسو، نينغشيا وسيتشوان. كانت تقديرات معامل DP إيجابية في معظم المناطق، أي أنه كلما زادت إنتاجية الألبان، زادت نسبة الإصابة بالبروسيلا البشرية. كانت شمال غرب الصين والتبت أكثر تأثرًا بهذا العامل. كانت تقديرات معامل GRP جميعها سلبية، مما يدل على أنه كلما زاد الناتج المحلي الإجمالي الإقليمي، انخفضت نسبة الإصابة بالبروسيلا البشرية. كان هذا العامل أكثر وضوحًا في شينجيانغ والتبت. كانت تقديرات معامل HE جميعها سلبية، أي أن الإنفاق الصحي كان مرتبطًا سلبًا مع نسبة الإصابة بالبروسيلا البشرية. كانت الصين الوسطى والجنوبية أكثر تأثرًا بهذا العامل. تم عرض النتائج في الأشكال 3، 4، 5، 6، 7، 8، 9، 10.
نقاش

في الصين. لذلك، يصبح من الضروري أكثر استغلال الظروف المحلية المواتية واستكشاف استراتيجيات دقيقة للوقاية والعلاج من البروسيلا البشرية.

في الصين أظهرت اتجاهًا تصاعديًا. على الرغم من أن عدد الحالات بدأ في الانخفاض بعد عام 2015، إلا أن النسبة ظلت مرتفعة. العوامل المساهمة في

المصادر، وحركة المصادر المعدية، وأولويات إقليمية متباينة في معالجة البروسيلا البشرية.
في هذه الدراسة، ارتفعت الحصة الوطنية للبروسيلا في شمال غرب الصين من
تم العثور على تحول طفيف لمركز ثقل الإصابة نحو الشمال في 2016-2018 على خريطة الهجرة. اعتبارات الأسباب المحتملة لزيادة الإصابة في منغوليا الداخلية والانتعاش اللاحق في المقاطعات المجاورة. أولاً، كانت أسعار السوق للحوم البقر ولحم الضأن في ارتفاع منذ عام 2016، مما جذب المزيد من الأفراد المشاركين في الزراعة والشراء والبيع والتجارة. ثانيًا، زادت حركة الماشية بالتزامن مع الطلب، مما أدى إلى انتشار البروسيلا من خلال الحيوانات المريضة بسبب نقص الحجر الصحي والتفتيش المناسب. على سبيل المثال، أشارت الدراسات الجينية إلى أن سلالات البروسيلا في منغوليا الداخلية مرتبطة بسلالات من المقاطعات المجاورة [25]. ثالثًا، قد تكون الموارد المستثمرة في السيطرة على البروسيلا قد انخفضت، مع تراجع الأنشطة المستندة إلى مبدأ الصحة الواحدة بعد سنوات متتالية من الانخفاض – انطباع تم الحصول عليه من الزيارات الميدانية إلى المناطق الموبوءة.
كما لاحظنا ارتباطًا مكانيًا إيجابيًا كبيرًا في نسبة الإصابة بالبروسيلا البشرية عبر
جميع مناطق الصين من 2005 إلى 2021. تشير هذه النتيجة إلى ظاهرة تجمع مكاني في توزيع مرضى البروسيلا البشرية، مما يشير إلى وجود عدم استقرار مكاني. يمكن أن يُعزى هذا عدم الاستقرار المكاني، إلى حد ما، إلى التباين المكاني في تأثير العوامل ذات الصلة عبر المناطق المختلفة. لذلك، قمنا ببناء نموذج MGWR لنسبة الإصابة بالبروسيلا البشرية والعوامل ذات الصلة لتحديد التباين المكاني في تأثير هذه العوامل على نسبة الإصابة بالبروسيلا البشرية.
في المناطق الشمالية والشمالية الغربية ذات الكثافة السكانية الأكبر من الأغنام. نوصي بشدة بتنفيذ تدابير السيطرة في هذه المناطق التي لديها تاريخ من التعرض للأغنام أو الماعز. يدعو البرنامج الوطني إلى استراتيجية تطعيم جماعي للحيوانات في المناطق ذات الانتشار العالي وتنفيذ سياسة “الحجر الصحي-التطعيم-الذبح” (أي تطعيم الأفراد السلبيين بناءً على نتائج الحجر الصحي وذبح الحيوانات التي تختبر إيجابية بأمان) في المناطق الأقل تأثرًا. تم تحقيق نجاح في بعض المناطق، حيث كانت شينجيانغ مثالًا بارزًا. كواحدة من المناطق المتوطنة في الصين، قامت شينجيانغ بتنفيذ حملة تطعيم واسعة النطاق ضد حمى البروسيلات منذ عام 2016 [30]، مما أدى إلى انخفاض كبير في حدوث حمى البروسيلات البشرية. أظهرت دراسة في منطقة هامي بشينجيانغ انخفاضًا ملحوظًا في معدلات العدوى المحلية بالبروسيلات في الماشية والأغنام من 2017 إلى 2019. أخيرًا، أظهرت المناطق ذات التنمية الإقليمية الإجمالية الأعلى ونفقات الصحة انخفاضًا في حدوث حمى البروسيلات البشرية، مما يبرز أهمية الدعم الاقتصادي لتنفيذ استراتيجيات وتدابير فعالة للسيطرة على حمى البروسيلات والقضاء عليها [31-33].
في معالجة حمى البروسيلات البشرية في الصين، يجب أن تتماشى تدابير الوقاية والسيطرة المخصصة مع الظروف المحلية. يمكن أن تتعاون المناطق الجنوبية مثل قوانغدونغ وقوانغشي مع الإدارات الجوية لمراقبة درجات الحرارة في الوقت الحقيقي، وتوقع فترات الوقاية الرئيسية من الأمراض. في بكين وخبي، سيكون الإشراف على صحة الماشية والممارسين أمرًا حاسمًا، إلى جانب البحث في فعالية التحصين المحلي. يجب على المناطق الشمالية الغربية مثل التبت وهونان تعزيز إدارة سلامة الغذاء للحم البقر ومنتجات الألبان، وتوسيع الحجر الصحي لأسواق المنتجات الحيوانية. في الوقت نفسه، في المناطق ذات التنوع الاقتصادي مثل هوبي وجيانغشي، سيساعد زيادة الميزانيات الصحية في دعم جهود الوقاية والسيطرة على حمى البروسيلات المحلية.
كشفت خريطة التوزيع المكاني لتقديرات المعلمات عن اختلافات مكانية كبيرة في تقديرات المعامل للعوامل ذات الاهتمام عبر كل منطقة. تؤكد هذه النتيجة على الحاجة إلى تطوير خطط واستراتيجيات إقليمية للوقاية والسيطرة على حمى البروسيلات، مع الأخذ في الاعتبار الخصائص المكانية لهذه العوامل وعلاقاتها المحلية مع حدوث حمى البروسيلات.
علاوة على ذلك، لاحظت دراستنا وجود علامات إيجابية وسلبية في تقديرات المعامل لنموذج MGWR، مما يشير إلى أن طريقة MGWR تعكس عدم الاستقرار المكاني بشكل أفضل مقارنة بطريقة OLS. كما أشارت نتائج تقييم النموذج إلى أن MGWR يتفوق على النموذج التقليدي GWR، مما يوفر نتائج تقدير معلمات أكثر موثوقية. تؤكد هذه النتائج
على أهمية مراعاة مقاييس العمل المختلفة والتباين المكاني لتعزيز دقة النموذج.
الخاتمة
الاختصارات
| OLS | المربعات الصغرى العادية |
| GWR | الانحدار الجغرافي الموزون |
| MGWR | الانحدار الجغرافي الموزون متعدد المقاييس |
| APC | التغير السنوي المئوي |
| AAPC | التغير السنوي المتوسط المئوي |
شكر وتقدير
مساهمات المؤلفين
التمويل
توفر البيانات والمواد
الإعلانات
موافقة الأخلاقيات والموافقة على المشاركة
الموافقة على النشر
المصالح المتنافسة
تم النشر على الإنترنت: 11 يناير 2024
References
- Ran X, Chen X, Wang M, Cheng J, Ni H, Zhang XX, Wen X. Brucellosis seroprevalence in ovine and caprine flocks in China during 2000-2018: a systematic review and meta-analysis. BMC Vet Res. 2018;14(1):393.
- Khurana SK, Sehrawat A, Tiwari R, Prasad M, Gulati B, Shabbir MZ, Chhabra R, Karthik K, Patel SK, Pathak M, Yatoo MI, Gupta VK, Dhama K, Sah R, Chaicumpa W. Bovine brucellosis – a comprehensive review. Veterinary Quarterly. 2021;41(1):61-88.
- Sibhat B, Tessema TS, Nile E, Asmare K. Brucellosis in Ethiopia: A comprehensive review of literature from the year 2000-2020 and the way forward. Transbound Emerg Dis. 2022;69(5):e1231-52.
- Lai S, Chen Q, Li Z. Human Brucellosis: An Ongoing Global Health Challenge. China CDC Wkly. 2021;3(6):120-3.
- Cardenas L, Awada L, Tizzani P, Caceres P, Casal J. Characterization and evolution of countries affected by bovine brucellosis (1996-2014). Transbound Emerg Dis. 2019;66(3):1280-90.
- Jamil T, Akar K, Erdenlig S, Murugaiyan J, Sandalakis V, Boukouvala E, et al. Spatio-temporal distribution of brucellosis in European terrestrial and marine wildlife species and its regional implications. Microorganisms. 2022;10(10):1970.
- Zhou L, Fan M, Hou Q, Jin Z, Sun X. Transmission dynamics and optimal control of brucellosis in Inner Mongolia of China. Math Biosci Eng. 2018;15(2):543-67.
- Enkelmann J, Stark K, Faber M. Epidemiological trends of notified human brucellosis in Germany, 2006-2018. Int J Infect Dis. 2020;93:353-8.
- Yu X, Fang M, Li Y, Yu J, Cheng L, Ding S, Kou Z. Epidemiological characteristics and spatio-temporal analysis of brucellosis in Shandong province, 2015-2021. BMC Infect Dis. 2023;23(1):669.
- Kim HJ, Chen HS, Midthune D, Wheeler B, Buckman DW, Green D, et al. Data-driven choice of a model selection method in joinpoint regression. J Appl Stat. 2022;50(9):1992-2013.
- Manzoor W, Safdar N, Mahmood HZ. A gravity model analysis of international migration from BRIC to OECD countries using Poisson Pseudomaximum likelihood Approach. Heliyon. 2021;7(6):e7357.
- Brunsdon C, Charlton M, Fotheringham AS. Geographically weighted regression :the analysis of spatially varying relationships. Chichester, England: Wiley; 2002.
- Wang H, Zang F, Zhao C, Liu C. A GWR downscaling method to reconstruct high-resolution precipitation dataset based on GSMaP-Gauge data: A case study in the Qilian Mountains. Northwest China Sci Total Environ. 2022;810:152066.
- Isazade V, Qasimi AB, Dong P, Kaplan G, Isazade E. Integration of Moran’s I, geographically weighted regression (GWR), and ordinary least square
(OLS) models in spatiotemporal modeling of COVID-19 outbreak in Qom and Mazandaran Provinces, Iran. Model Earth Syst Environ. 2023:1-15. https://doi.org/10.1007/s40808-023-01729-y. Epub ahead of print. - Wei W, Zhang X, Liu C, Xie B, Zhou J, Zhang H. A new drought index and its application based on geographically weighted regression (GWR) model and multi-source remote sensing data. Environ Sci Pollut Res Int. 2023;30(7):17865-87.
- Shi D, Chen Y, Chen M, Zhou T, Xu F, Zhang C, Wang C, Li Z. Bioinformatics analysis of Omp19 and Omp25 proteins for designing multi-epitope vaccines against Brucella. Medicine (Baltimore). 2023;102(11):e33182.
- Deng Y, Liu X, Duan K, Peng Q. Research Progress on Brucellosis. Curr Med Chem. 2019;26(30):5598-608.
- Kong W. Brucellosis infection increasing in Southern China. Eur J Intern Med. 2018;51:e16-8.
- Yang H, Zhang S, Wang T, Zhao C, Zhang X, Hu J, et al. Epidemiological characteristics and spatiotemporal trend analysis of human brucellosis in China, 1950-2018. Int J Environ Res Public Health. 2020;17(7):2382.
- Singh BB, Kostoulas P, Gill JPS, Dhand NK. Cost-benefit analysis of intervention policies for prevention and control of brucellosis in India. PLoS Negl Trop Dis. 2018;12(5):e0006488.
- Guzman-Bracho C, Salgado-Jimenez B, Beltran-Parra LG, HernandezMonroy I, Vargas-Pino F, Rodriguez D, Lopez-Martinez I, Pasten-Sanchez S, Gonzalez-Roldan JF, Membrillo-Hernandez J, Diaz-Quinonez JA. Evaluation of serological diagnostic tests of human brucellosis for prevention and control in Mexico. Eur J Clin Microbiol Infect Dis. 2020;39(3):575-81.
- Baron-Epel O, Obeid S, Kababya D, Bord S, Myers V. A health promotion perspective for the control and prevention of Brucellosis (Brucella melitensis); Israel as a case study. PLoS Negl Trop Dis. 2022;16(9):e0010816.
- Zeng H, Wang Y, Sun X, Liu P, Xu Q, Huang D, Gao L, You S, Huang B. Status and influencing factors of farmers’ private investment in the prevention and control of sheep brucellosis in China: A cross-sectional study. PLoS Negl Trop Dis. 2019;13(3):e0007285.
- Tao Z, Chen Q, Chen Y, Li Y, Mu D, Yang H, Yin W. Epidemiological Characteristics of human Brucellosis – China, 2016-2019. China CDC Wkly. 2021;3(6):114-9.
- Ma SY, Liu ZG, Zhu X, Zhao ZZ, Guo ZW, Wang M, Cui BY, Li JY, Li ZJ. Molecular epidemiology of Brucella abortus strains from cattle in Inner Mongolia. China PREVVET MED. 2020;183:105080.
- Dadar M, Shahali Y, Fakhri Y. A primary investigation of the relation between the incidence of brucellosis and climatic factors in Iran. Microb Pathog. 2020;139:103858.
- Cao LT, Liu HH, Li J, Yin XD, Duan Y, Wang J. Relationship of meteorological factors and human brucellosis in Hebei province. China SCI TOTAL ENVIRON. 2020;703:135491.
- Perez A, Berhe M. Brucella, a bacterium with multiple ways of causing infection. Proc (Bayl Univ Med Cent). 2020;34(1):99-101.
- Mengele IJ, Shirima GM, Bwatota SF, Motto SK, Bronsvoort B, Komwihangilo DM, et al. The status and risk factors of brucellosis in smallholder dairy cattle in selected regions of Tanzania. Vet Sci. 2023;10(2):155.
- Zai X, Yin Y, Guo F, Yang Q, Li R, Li Y, Zhang J, Xu J, Chen W. Screening of potential vaccine candidates against pathogenic Brucella spp using compositive reverse vaccinology. Vet Res. 2021;52(1):75.
- Davis A, Sharp J. Rethinking One Health: Emergent human, animal and environmental assemblages. Soc Sci Med. 2020;258:113093.
- Kiiza D, Denagamage T, Serra R, Maunsell F, Kiker G, Benavides B, Hernandez JA. A systematic review of economic assessments for brucellosis control interventions in livestock populations. Prev Vet Med. 2023;213:105878.
- Lokamar PN, Kutwah MA, Atieli H, Gumo S, Ouma C. Socio-economic impacts of brucellosis on livestock production and reproduction performance in Koibatek and Marigat regions, Baringo County, Kenya. BMC Vet Res. 2020;16(1):61.
ملاحظة الناشر
- *
DOI: https://doi.org/10.1186/s12879-023-08858-w
PMID: https://pubmed.ncbi.nlm.nih.gov/38212685
Publication Date: 2024-01-11
Spatiotemporal dynamics and influencing updates factors of human brucellosis in Mainland China from 2005-2021
Abstract
Background Brucellosis poses a significant public health concern. This study explores the spatial and temporal dynamic evolution of human brucellosis in China and analyses the spatial heterogeneity of the influencing factors related to the incidence of human brucellosis at the provincial level. Methods The Join-point model, centre of gravity migration model and spatial autocorrelation analysis were employed to evaluate potential changes in the spatial and temporal distribution of human brucellosis in mainland China from 2005 to 2021. Ordinary Least Squares (OLS), Geographically Weighted Regression (GWR), and Multi-scale Geographically Weighted Regression (MGWR) models were constructed to analyze the spatial and temporal correlation between the incidence rate of human brucellosis and meteorological and social factors. Results From 2005 to 2021, human brucellosis in China showed a consistent upward trend. The incidence rate rose more rapidly in South, Central, and Southwest China, leading to a shift in the center of gravity from the North to the Southwest, as illustrated in the migration trajectory diagram. Strong spatial aggregation was observed. The MGWR model outperformed others. Spatio-temporal plots indicated that lower mean annual temperatures and increased beef, mutton, and milk production significantly correlated with higher brucellosis incidence. Cities like Guangxi and Guangdong were more affected by low temperatures, while Xinjiang and Tibet were influenced more by beef and milk production. Inner Mongolia and Heilongjiang were more affected by mutton production. Importantly, an increase in regional GDP and health expenditure exerted a notable protective effect against human brucellosis incidence. Conclusions Human brucellosis remains a pervasive challenge. Meteorological and social factors significantly influence its incidence in a spatiotemporally specific manner. Tailored prevention strategies should be region-specific, providing valuable insights for effective brucellosis control measures.
*Correspondence:
Dan Deng
100079@cqmu.edu.cn
Background
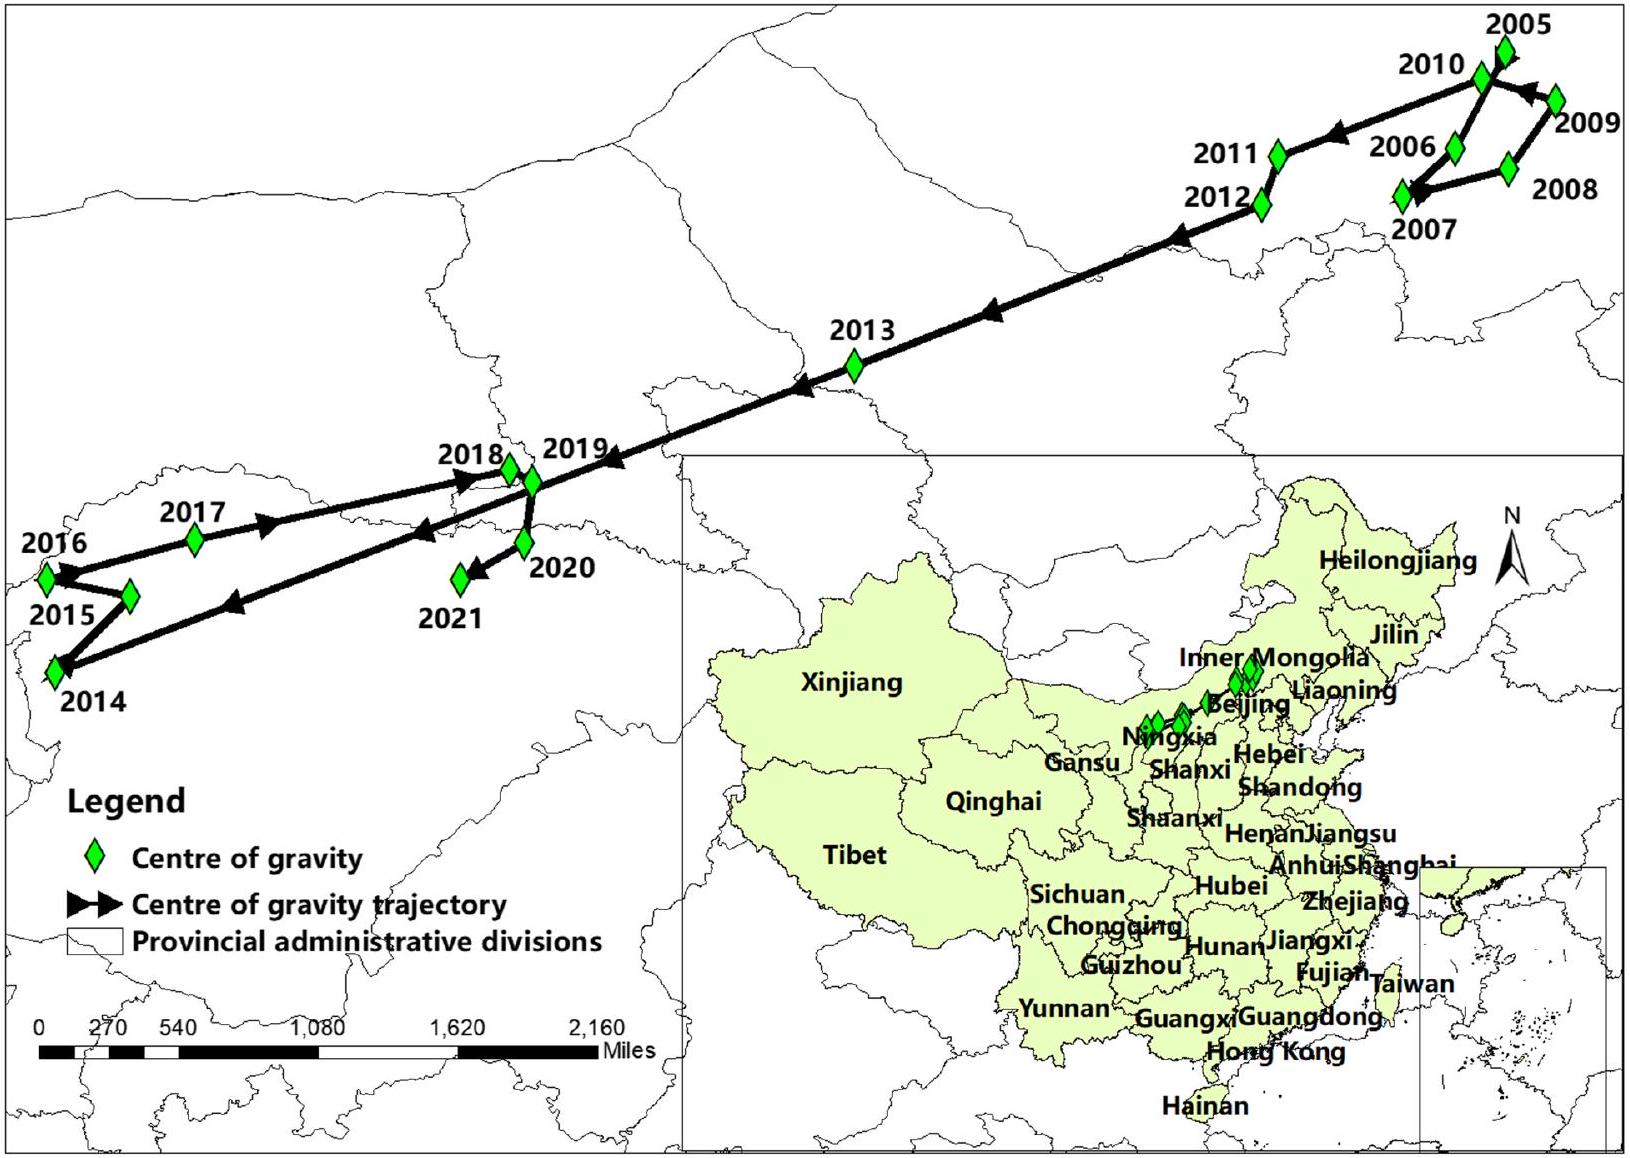
dangerous zoonotic diseases in the world today. The brucellosis epidemic exists in over 170 countries and regions, causing billions of dollars in economic losses worldwide [2, 3]. In 1905, brucellosis first occurred in Shanghai, China. Subsequently, from the 1980s to the early 1990s, mainland China gradually initiated prevention and control activities for brucellosis [4]. The disease has become a major global public health problem as it not only threatens human wellbeing, reduces livestock productivity, and increases the medical burden but also poses a food safety risk.
Growing evidence indicates that brucellosis exhibits strong temporal and spatial characteristics [5-7]. With the launch of active surveillance for brucellosis in 2005, the prevention and control of brucellosis in all regions of China have been deepening under the unified guidance of the State, but there are differences in the history of development, natural environment, economic level, and dietary characteristics of the various regions, so that the spatial and temporal evolution of brucellosis, as well as the heterogeneity of morbidity factors at the interprovincial level, need to be further explored.However, existing studies often focus on independent temporal or spatial regression analyses, which have limitations. The time trend of brucellosis is assessed using traditional regression analysis, which primarily reflects the overall trend of global data and may not reveal specific trends in local data [8].In spatial analysis, linear regression or logistic regression models are commonly employed, assuming consistent regression coefficients across the entire study area and overlooking spatial non-stationarity. Consequently, the research outcomes may not fully capture the true spatial characteristics and spatial heterogeneity of influencing factors [9].
closer the distance, the stronger the correlation (Tobler’s first law), and if it is inappropriate to divide the area directly for traditional linear regression analyses, it is necessary to take into account the samples within a certain spatial range around each sample. Geographically Weighted Regression (GWR), introduced by scholars to study spatial relationships and correlations, can effectively detect spatial non-smoothness [12]. It has found wide applications in multidisciplinary fields [13-15]. However, GWR assumes the same optimal bandwidth for all explanatory variables, potentially leading to biased parameter estimates. All explanatory variables in a classical GWR model can only produce a uniform scale of action, but realistic factors affecting brucellosis have different scales of action at the spatio-temporal level. In 2017, Fotheringham et al. proposed a Multiscale Geographically Weighted Regression (MGWR) model, an extension of GWR that considers differential spatial bandwidths for independent variables. MGWR has become an effective tool for revealing the influence and scope of environmental factors.
Methods
Data source
Statistical analysis
Temporal trends
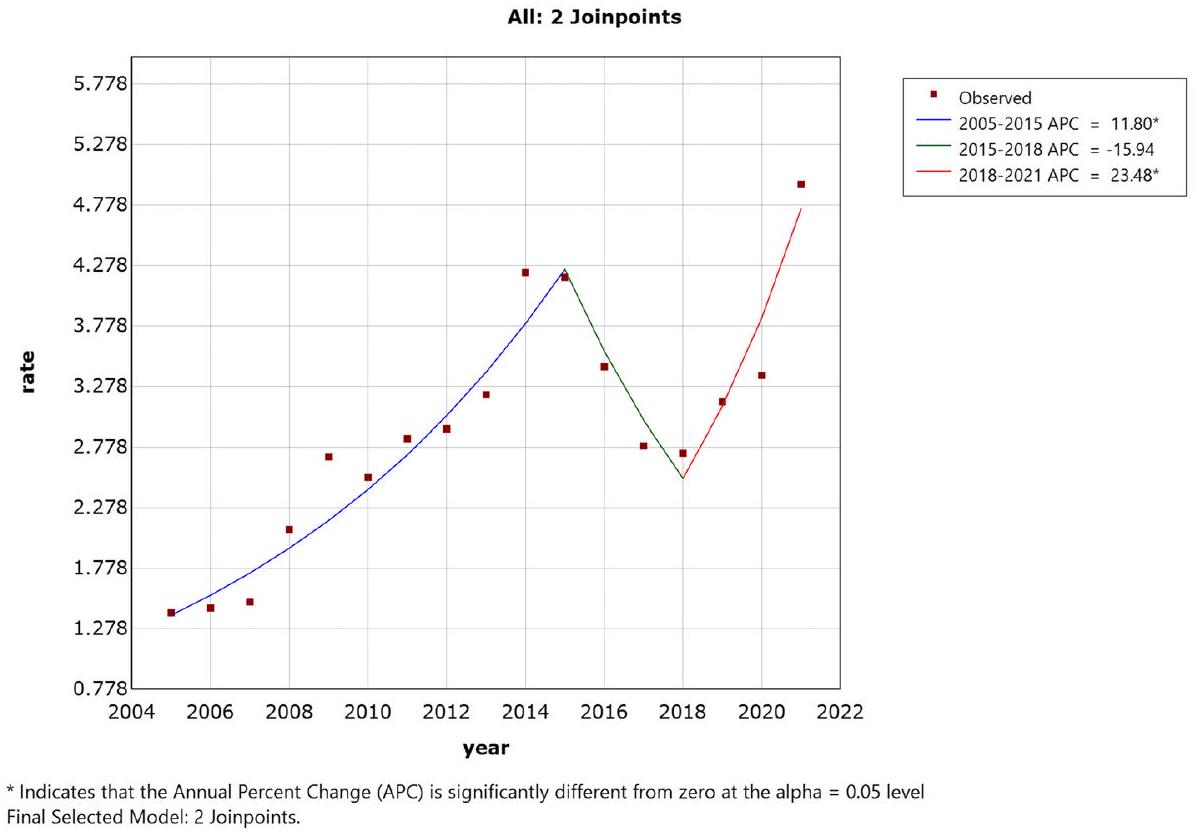
different dimensions such as development history, natural environment, economic level, dietary characteristics and ethnicity, and the methodology was developed by the state. In accordance with the seven natural geographic regions of China, the temporal characteristics of human brucellosis prevalence in each region were regressed in segments by building Join-point models. This method allows for analyzing turning points, determining their locations, specifying the direction of change, the turning points are selected by grid search method (GSM), which divides the space where the parameters are located into a grid, and each intersection point corresponds to a planning scheme, and then the performance index of the corresponding scheme is calculated point by point with a fixed step in a set interval to determine the optimal parameters. For the analysis of the Joinpoint model, the GSM creates a grid of all the possible locations of the “turning points”, calculates the sum of squared errors (SSE) and mean squared errors (MSE) for each case, and selects the grid with the smallest MSE as the optimal turning point. The grid with the smallest MSE is selected as the optimal turning point, and calculating the annual percent change (APC) and average annual percent change (AAPC) to clarify the direction and speed of change for the whole and local areas, respectively. If the APC is greater than 0 , the incidence rate is increasing from year to year, and vice versa. The formulas for APC and AAPC are as follows:
Spatial distribution
spatial shift distance, represents the shift in the center of gravity coordinates of a study factor from year
Model construction
The GWR model is an improved model based on the traditional linear regression model. Its main advantage is the ability to apply the spatial weight matrix to the linear regression model, which will better demonstrate the spatial structural variation of the results. The model can be expressed as.
Results
Temporal trends in the national brucellosis epidemic from 2005 to 2021
Spatial changes in the national incidence of brucellosis from 2005 to 2021

| Region | Province | Year | APC(%) | AAPC(%) |
| Northeast China | Liaoning、Heilongjiang、Jilin | 2005-2012 | 14.5* | 4.4 |
| 2012-2021 | -2.8 | |||
| North China | Beijing、Tianjin、Hebei、Shanxi、Inner Mongolia | 2005-2009 | 17.7* | 5.2 |
| 2009-2014 | -1.2 | |||
| 2014-2017 | -19.0 | |||
| 2017-2021 | 23.8* | |||
| Eastern China | Shanghai、Zhejiang、Anhui、Fujian、Jiangxi、Shando ng、Jiangsu | 2005-2009 | 2.8 | 20.0* |
| 2009-2015 | 67.6* | |||
| 2015-2021 | -4.8 | |||
| South China | Guangdong、Guangxi 、 Hainan | 2005-2016 | 52.1* | 33.3* |
| 2016-2021 | -0.3 | |||
| Central China | Henan 、 Hubei 、 Hunan | 2005-2015 | 46.1* | 24.3* |
| 2015-2018 | -32.6 | |||
| 2018-2021 | 33.4* | |||
| Northwest China | Shaanxi 、 Qinghai 、 Ningxia 、 Xinjiang 、 Gansu | 2005-2011 | 21.3* | 20.2* |
| 2011-2015 | 64.9* | |||
| 2015-2018 | -25.2 | |||
| 2018-2021 | 24.4 | |||
| Southwest China | Chongqing、Sichuan、Guizhou、Yunnan、Tibet | 2005-2007 | -62.0 | 23.7* |
| 2007-2015 | 74.5* | |||
| 2015-2021 | 16.0 |

The global autocorrelation analysis showed that the spatial autocorrelation Moran’s
| Year | 2005 | 2007 | 2009 |
| Moran’s / | 0.145 | 0.200 | 0.180 |
| Z-value | 3.092 | 3.618 | 3.831 |
|
|
0.002 | <0.001 | < 0.001 |
| Year | 2011 | 2013 | 2015 |
| Moran’s / | 0.166 | 0.398 | 0.263 |
| Z-value | 3.641 | 4.391 | 2.931 |
|
|
< 0.001 | < 0.001 | 0.003 |
| Year | 2017 | 2019 | 2021 |
| Moran’s / | 0.291 | 0.295 | 0.329 |
| Z-value | 3.212 | 3.867 | 4.071 |
|
|
0.001 | < 0.001 | < 0.001 |
Results of model fit comparison
| Models | AICc |
|
Adjusted
|
| OLS | 3493.899 | 0.642 | 0.633 |
| GWR | 974.732 | 0.636 | 0.629 |
| MGWR | 639.626 | 0.838 | 0.822 |
| Mean
|
Min | Med | Max |
|
|
| AAT (
|
|
-0.485 | -0.473 | -0.467 | < 0.001 |
| ARH(%) |
|
-0.177 | -0.040 | -0.006 | 0.744 |
| AP(mm) |
|
-0.199 | -0.028 | 0.020 | 0.067 |
| ASH(hours) |
|
0.090 | 0.137 | 0.154 | 0.105 |
| NOCS(million) |
|
0.095 | 0.103 | 0.108 | 0.964 |
| NOSS(million) |
|
-0.747 | -0.523 | 0.377 | 0.007 |
| BP (million tons) |
|
-1.020 | -0.408 | 0.425 | < 0.001 |
| MP (million tons) |
|
0.294 | 0.896 | 1.025 | < 0.001 |
| DP (million tons) |
|
-0.095 | 0.143 | 3.558 | < 0.001 |
| GRP(billion yuan) |
|
-0.022 | -0.013 | -0.007 | 0.009 |
| GPP(billion yuan) |
|
0.030 | 0.031 | 0.051 | 0.658 |
| HE(billion yuan) |
|
-0.465 | -0.029 | 0.170 | 0.015 |

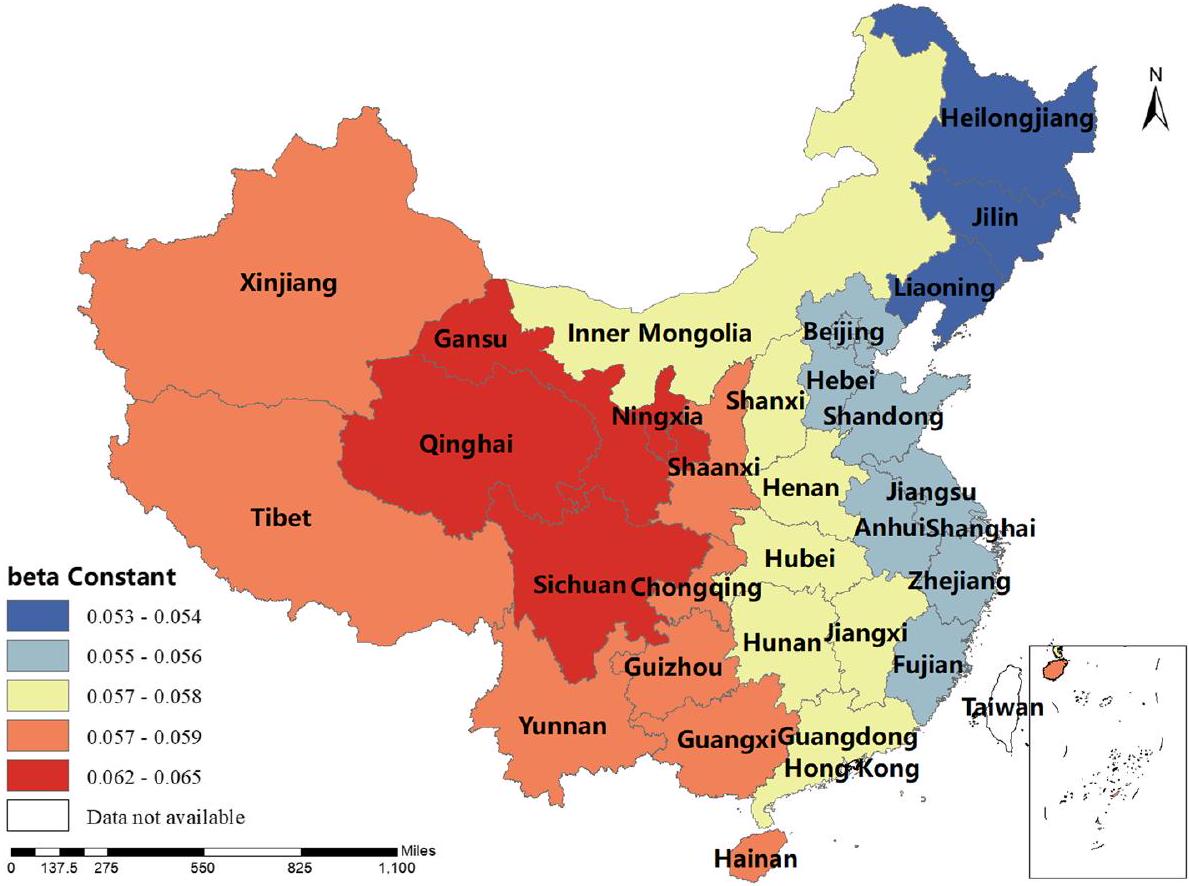
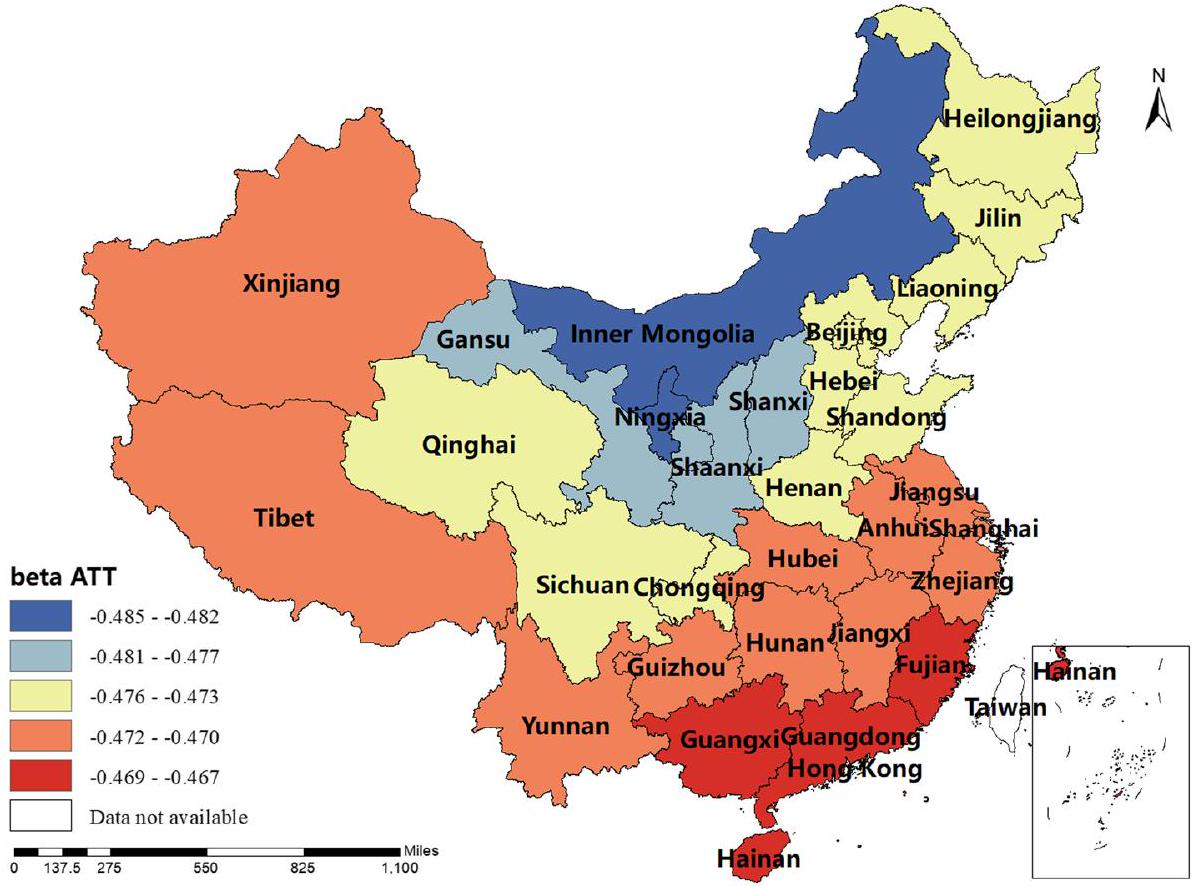
Spatial and temporal distribution of regression coefficients in the MGWR
of the coefficient of BP was positive in Shaanxi, Hunan, Tibet, Qinghai and Xinjiang, i.e. the higher the beef production, the higher the incidence of human brucellosis. The coefficient estimates of MP were all positive, indicating that mutton production was positively correlated with the incidence of human brucellosis. This factor plays a significant role in Inner Mongolia, Heilongjiang, Jilin, Liaoning, Gansu, Ningxia and Sichuan. The coefficient estimates for DP were positive in most regions, i.e. the higher the dairy production, the higher the incidence of human brucellosis. The Northwest China and Tibet were more affected by this factor. The coefficient estimates for GRP were all negative, indicating that the higher the regional GDP, the lower the incidence of human brucellosis. This factor was more obvious in Xinjiang and Tibet.The coefficient estimates of HE were all negative, i.e. health expenditure was negatively correlated with the incidence of human brucellosis. Central and Southern China were more strongly influenced by this factor. The results were shown in Figs. 3, 4, 5, 6, 7, 8, 9, 10.
Discussion


in China. Therefore, it becomes even more critical to leverage local favorable conditions and explore precise strategies for the prevention and treatment of human brucellosis.


in China exhibited an upward trend. Although the number of cases began to decline after 2015, the incidence remained high. The factors contributing to the


hotspots, the movement of infectious sources, and varying regional priorities in addressing human brucellosis.
In this study, the national share of brucellosis in Northwest China surged from
A brief shift of the centre of gravity of morbidity back towards the north in 2016-2018 was found on the migration map.Consideration of possible reasons for the increase in incidence in Inner Mongolia and subsequent rebound in neighbouring provinces. Firstly, market prices for beef and lamb have been on the rise since 2016, attracting more individuals involved in farming, buying, selling, and trading. Secondly, the movement of livestock has increased in tandem with demand, leading to the spread of brucellosis through diseased animals due to a lack of proper quarantine and inspection. For instance, genotypic studies have indicated that brucellosis strains in Inner Mongolia are related to strains from neighbouring provinces [25]. Thirdly, resources invested in brucellosis control may have decreased, with activities based on the One Health principle declining after successive years of decline-an impression gleaned from field visits to endemic areas.
We also observed a significant positive spatial correlation in the incidence of human brucellosis across
all regions of China from 2005 to 2021. This finding indicates a spatial clustering phenomenon in the distribution of human brucellosis patients, suggesting the presence of spatial non-stationarity. This spatial nonstationarity can be attributed, to some extent, to spatial heterogeneity in the influence of related factors across different regions. Therefore, we further constructed the MGWR model for human brucellosis incidence and related factors to quantify the spatial variability in the influence of these factors on human brucellosis incidence.
to occur in northern and northwestern regions with larger sheep populations. We strongly recommend implementing control measures in these areas with a history of sheep or goat exposure. The national program advocates for a mass animal vaccination strategy in high-endemic areas and the implementation of a “quarantine-vaccination-slaughter” policy (i.e., vaccinating negative individuals based on quarantine results and safely slaughtering animals that test positive) in less-affected areas. Success has been achieved in some areas, with Xinjiang being a notable example. As one of the endemic regions in China, Xinjiang has conducted a large-scale animal brucellosis vaccination campaign since 2016 [30], resulting in a significant decline in the incidence of human brucellosis. A study in the Hami region of Xinjiang demonstrated a noteworthy decrease in local brucellosis infection rates in cattle and sheep from 2017 to 2019.Lastly, areas with higher gross regional development and health expenditure exhibited lower human brucellosis incidence, underscoring the importance of economic support for the effective implementation of strategies and measures to control and eradicate brucellosis [31-33].
In addressing human brucellosis in China, tailored prevention and control measures should align with local conditions. Southern regions like Guangdong and Guangxi can collaborate with meteorological departments for real-time temperature monitoring, predicting key disease prevention periods. In Beijing and Hebei, overseeing livestock health and practitioners will be crucial, along with researching local immunization effectiveness. Northwestern areas such as Tibet and Hunan should enhance food safety management for beef and dairy, expanding animal product market quarantine. Meanwhile, in economically diverse regions like Hubei and Jiangxi, increasing health budgets will support local brucellosis prevention and control efforts.
The spatial distribution map of the parameter estimates revealed significant spatial differences in the coefficient estimates of the factors of interest across each region. This finding underscores the need to develop regionalized plans and strategies for the prevention and control of brucellosis, taking into account the spatial characteristics of these factors and their local relationships with brucellosis incidence.
Additionally, our study observed both positive and negative signs in the coefficient estimates of the MGWR model, indicating that the MGWR method better reflects spatial non-stationarity compared to the OLS method. Model evaluation results also indicated that MGWR outperforms the traditional GWR model, providing more reliable parameter estimation results. These findings emphasize
the importance of considering differential scales of action and spatial heterogeneity to enhance model accuracy.
Conclusion
Abbreviations
| OLS | Ordinary least squares |
| GWR | Geographically weighted regression |
| MGWR | Multiscale geographically weighted regression |
| APC | Annual percent change |
| AAPC | Average annual percent change |
Acknowledgements
Authors’ contributions
Funding
Availability of data and materials
Declarations
Ethics approval and consent to participate
Consent for publication
Competing interests
Published online: 11 January 2024
References
- Ran X, Chen X, Wang M, Cheng J, Ni H, Zhang XX, Wen X. Brucellosis seroprevalence in ovine and caprine flocks in China during 2000-2018: a systematic review and meta-analysis. BMC Vet Res. 2018;14(1):393.
- Khurana SK, Sehrawat A, Tiwari R, Prasad M, Gulati B, Shabbir MZ, Chhabra R, Karthik K, Patel SK, Pathak M, Yatoo MI, Gupta VK, Dhama K, Sah R, Chaicumpa W. Bovine brucellosis – a comprehensive review. Veterinary Quarterly. 2021;41(1):61-88.
- Sibhat B, Tessema TS, Nile E, Asmare K. Brucellosis in Ethiopia: A comprehensive review of literature from the year 2000-2020 and the way forward. Transbound Emerg Dis. 2022;69(5):e1231-52.
- Lai S, Chen Q, Li Z. Human Brucellosis: An Ongoing Global Health Challenge. China CDC Wkly. 2021;3(6):120-3.
- Cardenas L, Awada L, Tizzani P, Caceres P, Casal J. Characterization and evolution of countries affected by bovine brucellosis (1996-2014). Transbound Emerg Dis. 2019;66(3):1280-90.
- Jamil T, Akar K, Erdenlig S, Murugaiyan J, Sandalakis V, Boukouvala E, et al. Spatio-temporal distribution of brucellosis in European terrestrial and marine wildlife species and its regional implications. Microorganisms. 2022;10(10):1970.
- Zhou L, Fan M, Hou Q, Jin Z, Sun X. Transmission dynamics and optimal control of brucellosis in Inner Mongolia of China. Math Biosci Eng. 2018;15(2):543-67.
- Enkelmann J, Stark K, Faber M. Epidemiological trends of notified human brucellosis in Germany, 2006-2018. Int J Infect Dis. 2020;93:353-8.
- Yu X, Fang M, Li Y, Yu J, Cheng L, Ding S, Kou Z. Epidemiological characteristics and spatio-temporal analysis of brucellosis in Shandong province, 2015-2021. BMC Infect Dis. 2023;23(1):669.
- Kim HJ, Chen HS, Midthune D, Wheeler B, Buckman DW, Green D, et al. Data-driven choice of a model selection method in joinpoint regression. J Appl Stat. 2022;50(9):1992-2013.
- Manzoor W, Safdar N, Mahmood HZ. A gravity model analysis of international migration from BRIC to OECD countries using Poisson Pseudomaximum likelihood Approach. Heliyon. 2021;7(6):e7357.
- Brunsdon C, Charlton M, Fotheringham AS. Geographically weighted regression :the analysis of spatially varying relationships. Chichester, England: Wiley; 2002.
- Wang H, Zang F, Zhao C, Liu C. A GWR downscaling method to reconstruct high-resolution precipitation dataset based on GSMaP-Gauge data: A case study in the Qilian Mountains. Northwest China Sci Total Environ. 2022;810:152066.
- Isazade V, Qasimi AB, Dong P, Kaplan G, Isazade E. Integration of Moran’s I, geographically weighted regression (GWR), and ordinary least square
(OLS) models in spatiotemporal modeling of COVID-19 outbreak in Qom and Mazandaran Provinces, Iran. Model Earth Syst Environ. 2023:1-15. https://doi.org/10.1007/s40808-023-01729-y. Epub ahead of print. - Wei W, Zhang X, Liu C, Xie B, Zhou J, Zhang H. A new drought index and its application based on geographically weighted regression (GWR) model and multi-source remote sensing data. Environ Sci Pollut Res Int. 2023;30(7):17865-87.
- Shi D, Chen Y, Chen M, Zhou T, Xu F, Zhang C, Wang C, Li Z. Bioinformatics analysis of Omp19 and Omp25 proteins for designing multi-epitope vaccines against Brucella. Medicine (Baltimore). 2023;102(11):e33182.
- Deng Y, Liu X, Duan K, Peng Q. Research Progress on Brucellosis. Curr Med Chem. 2019;26(30):5598-608.
- Kong W. Brucellosis infection increasing in Southern China. Eur J Intern Med. 2018;51:e16-8.
- Yang H, Zhang S, Wang T, Zhao C, Zhang X, Hu J, et al. Epidemiological characteristics and spatiotemporal trend analysis of human brucellosis in China, 1950-2018. Int J Environ Res Public Health. 2020;17(7):2382.
- Singh BB, Kostoulas P, Gill JPS, Dhand NK. Cost-benefit analysis of intervention policies for prevention and control of brucellosis in India. PLoS Negl Trop Dis. 2018;12(5):e0006488.
- Guzman-Bracho C, Salgado-Jimenez B, Beltran-Parra LG, HernandezMonroy I, Vargas-Pino F, Rodriguez D, Lopez-Martinez I, Pasten-Sanchez S, Gonzalez-Roldan JF, Membrillo-Hernandez J, Diaz-Quinonez JA. Evaluation of serological diagnostic tests of human brucellosis for prevention and control in Mexico. Eur J Clin Microbiol Infect Dis. 2020;39(3):575-81.
- Baron-Epel O, Obeid S, Kababya D, Bord S, Myers V. A health promotion perspective for the control and prevention of Brucellosis (Brucella melitensis); Israel as a case study. PLoS Negl Trop Dis. 2022;16(9):e0010816.
- Zeng H, Wang Y, Sun X, Liu P, Xu Q, Huang D, Gao L, You S, Huang B. Status and influencing factors of farmers’ private investment in the prevention and control of sheep brucellosis in China: A cross-sectional study. PLoS Negl Trop Dis. 2019;13(3):e0007285.
- Tao Z, Chen Q, Chen Y, Li Y, Mu D, Yang H, Yin W. Epidemiological Characteristics of human Brucellosis – China, 2016-2019. China CDC Wkly. 2021;3(6):114-9.
- Ma SY, Liu ZG, Zhu X, Zhao ZZ, Guo ZW, Wang M, Cui BY, Li JY, Li ZJ. Molecular epidemiology of Brucella abortus strains from cattle in Inner Mongolia. China PREVVET MED. 2020;183:105080.
- Dadar M, Shahali Y, Fakhri Y. A primary investigation of the relation between the incidence of brucellosis and climatic factors in Iran. Microb Pathog. 2020;139:103858.
- Cao LT, Liu HH, Li J, Yin XD, Duan Y, Wang J. Relationship of meteorological factors and human brucellosis in Hebei province. China SCI TOTAL ENVIRON. 2020;703:135491.
- Perez A, Berhe M. Brucella, a bacterium with multiple ways of causing infection. Proc (Bayl Univ Med Cent). 2020;34(1):99-101.
- Mengele IJ, Shirima GM, Bwatota SF, Motto SK, Bronsvoort B, Komwihangilo DM, et al. The status and risk factors of brucellosis in smallholder dairy cattle in selected regions of Tanzania. Vet Sci. 2023;10(2):155.
- Zai X, Yin Y, Guo F, Yang Q, Li R, Li Y, Zhang J, Xu J, Chen W. Screening of potential vaccine candidates against pathogenic Brucella spp using compositive reverse vaccinology. Vet Res. 2021;52(1):75.
- Davis A, Sharp J. Rethinking One Health: Emergent human, animal and environmental assemblages. Soc Sci Med. 2020;258:113093.
- Kiiza D, Denagamage T, Serra R, Maunsell F, Kiker G, Benavides B, Hernandez JA. A systematic review of economic assessments for brucellosis control interventions in livestock populations. Prev Vet Med. 2023;213:105878.
- Lokamar PN, Kutwah MA, Atieli H, Gumo S, Ouma C. Socio-economic impacts of brucellosis on livestock production and reproduction performance in Koibatek and Marigat regions, Baringo County, Kenya. BMC Vet Res. 2020;16(1):61.
Publisher’s Note
- *
