DOI: https://doi.org/10.1186/s12889-025-22566-x
PMID: https://pubmed.ncbi.nlm.nih.gov/40200262
تاريخ النشر: 2025-04-08
عبء الأمراض اللثوية العالمي بين السكان في سن العمل من 1990 إلى 2021: نتائج دراسة العبء العالمي للأمراض 2021
الملخص
خلفية تمثل الأمراض اللثوية بين الأفراد في سن العمل (
الملخص
وتوكلاو تخفيضات تتجاوز 70%. حدد تحليل التحلل نمو السكان (74.56%) والشيخوخة (23.00%) كعوامل رئيسية لزيادة عبء المرض. التفسير. تكشف تحليلاتنا عن تفاوتات عالمية كبيرة في عبء الأمراض اللثوية بين السكان في سن العمل، مع زيادات مقلقة في العديد من المناطق من 1990 إلى 2021. يبرز العبء غير المتناسب في مناطق SDI المنخفضة والمتوسطة وجنوب آسيا، جنبًا إلى جنب مع التأثير الكبير لنمو السكان والشيخوخة، الحاجة الملحة للتدخلات المستهدفة. بينما حققت بعض الدول تخفيضات ملحوظة في عبء المرض، فإن الزيادات الدرامية في دول أخرى تؤكد أهمية تعزيز أنظمة الرعاية الصحية الوقائية للفم ومعالجة المحددات الاجتماعية والاقتصادية. تؤكد هذه النتائج على الحاجة لاستراتيجيات محددة لكل دولة، خاصة في المناطق التي تشهد زيادة في العبء، ويمكن أن تُعلم صنع السياسات القائمة على الأدلة لتقليل تأثير الأمراض اللثوية على القوى العاملة العالمية.
المقدمة
قدمت الدراسات السابقة للعبء العالمي للأمراض (GBD) رؤى قيمة حول العبء العام للأمراض اللثوية عبر جميع الفئات العمرية. ومع ذلك، فإن فهم الأنماط والاتجاهات المحددة بين السكان في سن العمل أمر بالغ الأهمية، حيث تمثل هذه الفئة السكانية القوة العاملة الرئيسية ومحركات الاقتصاد في المجتمع. يمكن أن يكون لتأثير الأمراض اللثوية في هذه الفئة العمرية عواقب بعيدة المدى، بما في ذلك انخفاض إنتاجية العمل، وزيادة تكاليف الرعاية الصحية، وانخفاض جودة الحياة. علاوة على ذلك، يظهر عبء الأمراض اللثوية اختلافات كبيرة عبر مناطق ومجموعات اجتماعية واقتصادية مختلفة، مما يعكس التفاوتات في الوصول إلى الرعاية الصحية، والخدمات الوقائية، وتوافر العلاج [1]. يعد فهم هذه الأنماط أمرًا أساسيًا لتطوير تدخلات مستهدفة وسياسات صحية [2].
تهدف هذه الدراسة إلى تقديم تحليل شامل للعبء العالمي للأمراض اللثوية بين السكان في سن العمل من 1990 إلى 2021، باستخدام
بيانات من GBD 2021. سيساعد هذا التحليل في تحديد الاتجاهات، والأنماط، والتفاوتات في عبء المرض عبر مناطق وسياقات اجتماعية واقتصادية مختلفة، مما قد يُعلم السياسات الصحية والتدخلات المستقبلية.
المواد والطرق
تصميم الدراسة وجمع البيانات
تم تصنيف الأمراض اللثوية في هذه الدراسة وفقًا لتعريفات GBD 2021. تم تمييز الأمراض اللثوية بأعراض تشمل رائحة الفم الكريهة، وتغير إحساس التذوق، ونزيف اللثة العرضي الذي لا يؤثر على الأنشطة اليومية. اتبعت تصنيفات الأمراض رموز تشخيصية موحدة، تحديدًا ICD-10 (K05.0-K05.6) وICD-9 (523.0-523.9). تم وصف طرق تقدير عبء الأمراض اللثوية سابقًا [6]. تم استخراج بيانات العبء العالمي لالتهاب اللثة من أداة الاستعلام عبر الإنترنت GHDx (https://ghdx.healthdata.org/gbd-results-tool). جمعنا مقاييس شاملة تشمل الانتشار السنوي، والحوادث، وسنوات الحياة المعدلة حسب الإعاقة (DALYs)، سواء بالأرقام المطلقة أو المعدلات المعدلة حسب العمر (ASR)، تمتد من 1990 إلى 2021 عبر 25 منطقة و204 دول/أقاليم. يتم الإبلاغ عن معدلات الانتشار المعدلة حسب العمر (ASPR) لكل 100,000 نسمة، محسوبة باستخدام معيار GBD 2021.
وصف العبء
تحليل الانحدار بنقاط الانضمام
تحليل التحلل
تم تحليل التغيرات في سنوات الحياة المعدلة حسب الإعاقة المرتبطة بأمراض اللثة إلى ثلاثة مكونات أساسية: نمو السكان، شيخوخة السكان، والتغيرات الوبائية، مما يتيح قياس مساهماتها في الاتجاهات العامة لسنوات الحياة المعدلة حسب الإعاقة. لحساب مساهمة نمو السكان، قمنا بتقدير ما ستكون عليه إجمالي سنوات الحياة المعدلة حسب الإعاقة في عام 2021 إذا تغير إجمالي السكان فقط عن مستويات عام 1990 بينما ظلت هيكلية الأعمار ومعدلات الأعمار ثابتة عند قيمها لعام 1990. الفرق بين هذا السيناريو الافتراضي والقاعدة الأساسية لعام 1990، المعبر عنه كنسبة مئوية من التغير الكلي في سنوات الحياة المعدلة حسب الإعاقة، يمثل المساهمة المنسوبة فقط إلى نمو السكان. تم تطبيق إجراءات مماثلة لتحديد مساهمات شيخوخة السكان والتغيرات الوبائية (التغيرات في معدلات الأعمار). تم الحصول على بيانات السكان لهذا التحليل من مراجعة آفاق السكان العالمية لعام 2022 التابعة لقسم السكان في الأمم المتحدة، مع الحفاظ على التناسق مع تحليلات أخرى لمشروع العبء العالمي للأمراض لعام 2021. تتيح هذه المنهجية القياسية للتحليل المقارن إجراء مقارنات ذات مغزى بين المحركات الديموغرافية والوبائية عبر مناطق وفترات زمنية مختلفة.
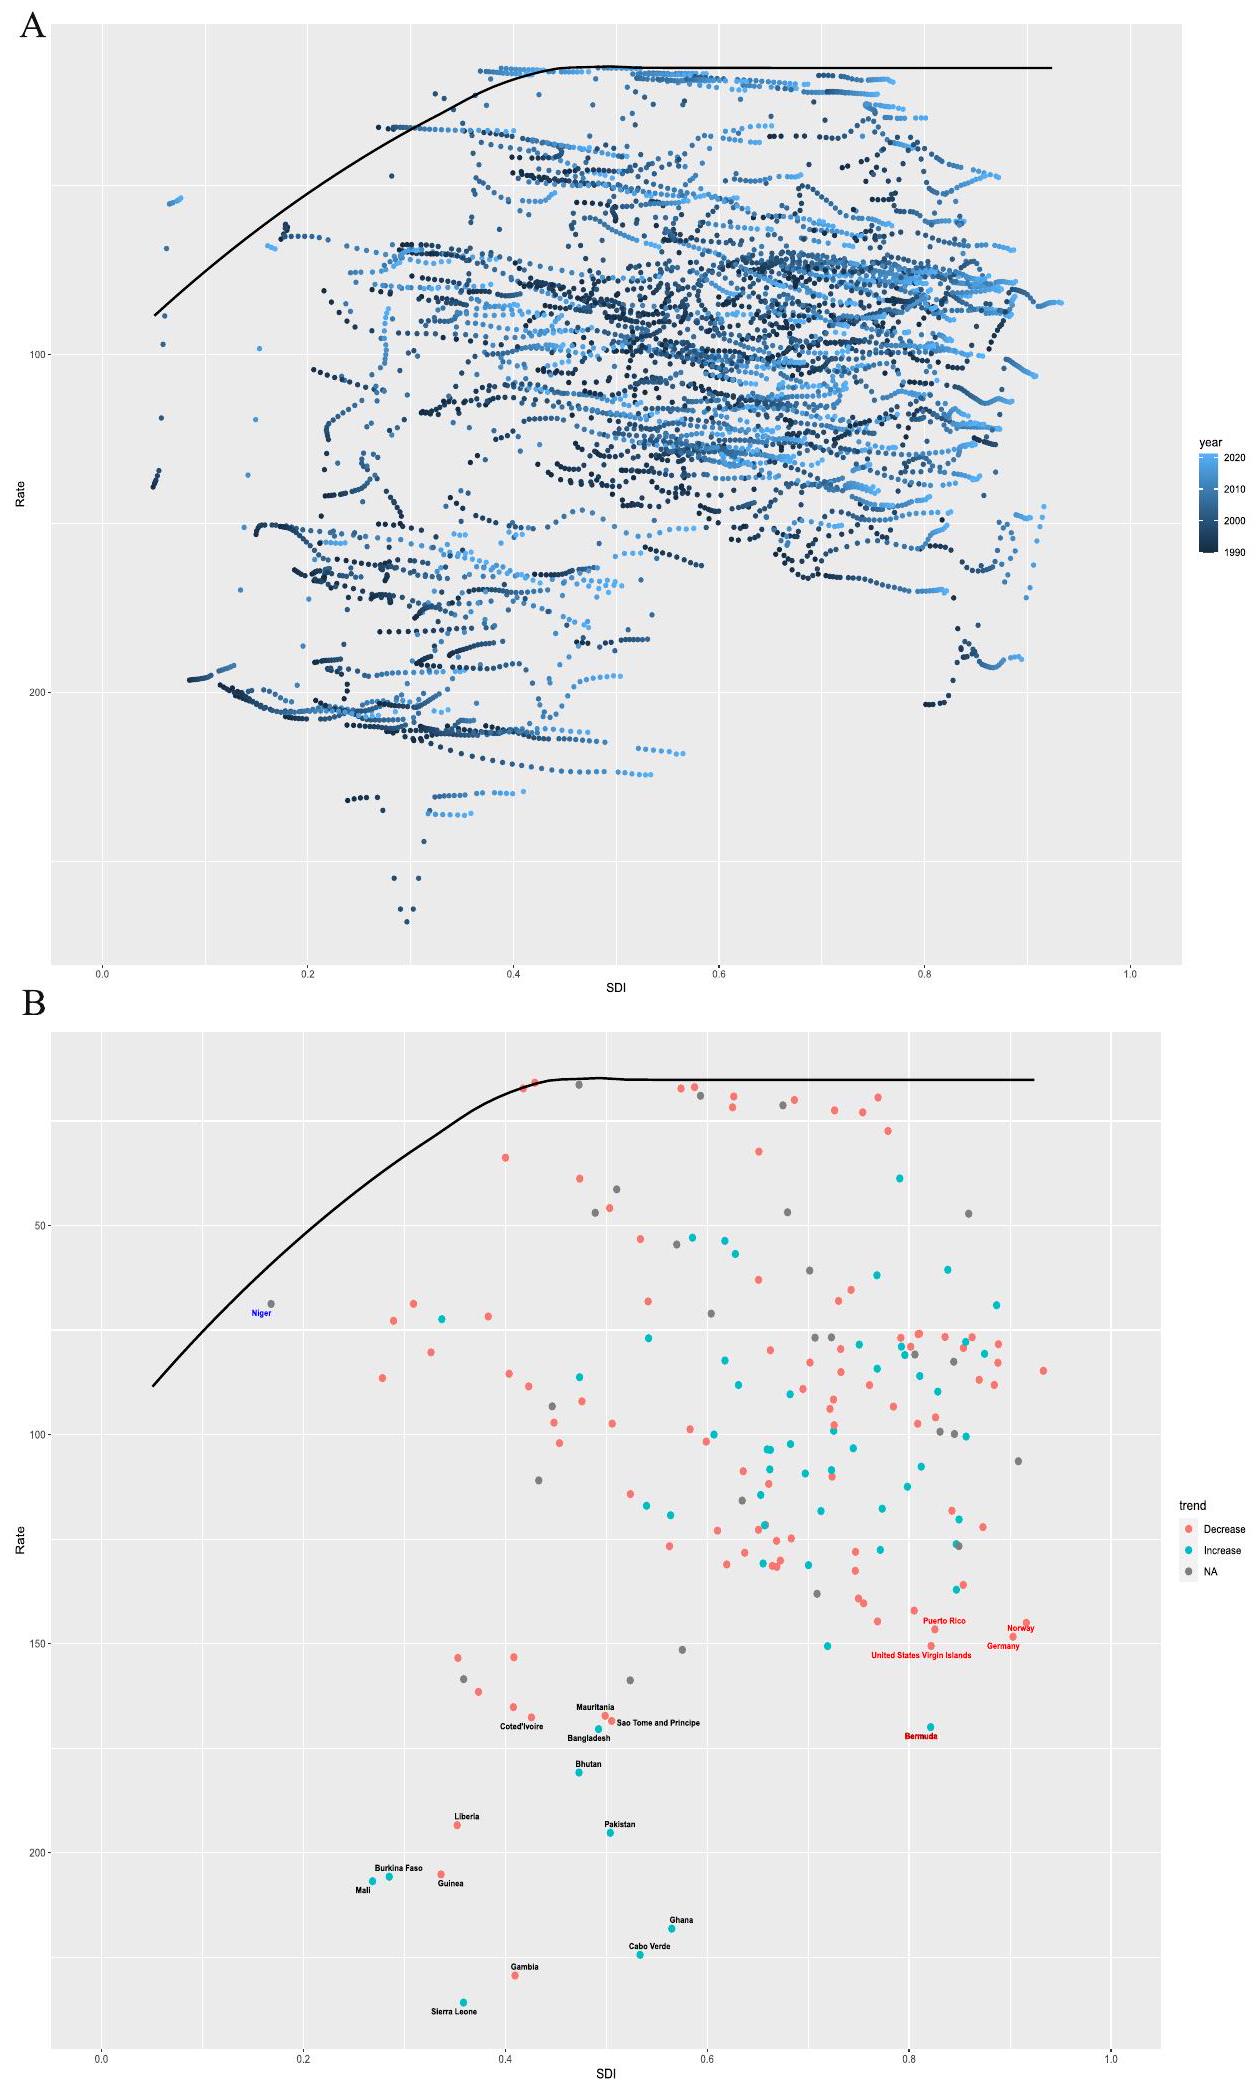
تحليل الحدود
توقع نموذج BAPC
البيانات المعقدة وعالية الأبعاد والندرة التي تتميز بها الدراسات الوبائية واسعة النطاق مثل GBD 2021. نموذج BAPC يوسع إطار النموذج الخطي العام التقليدي ضمن سياق بايزي، مما يتيح التكامل الديناميكي لتأثيرات العمر والفترة والجيل. يتم نمذجة هذه التأثيرات لتتطور بشكل مستمر مع مرور الوقت ويتم تنعيمها باستخدام عملية عشوائية من الدرجة الثانية، مما يؤدي إلى توقعات أكثر دقة لاحتمالات ما بعد. ميزة رئيسية لنموذج BAPC هي استخدامه لطريقة تقريب لابلاس المتداخلة (INLA) لتقريب التوزيعات الهامشية الاحتمالية. هذه الطريقة تتجنب بفعالية التحديات الشائعة مثل مشاكل الخلط والتقارب المرتبطة عادة بتقنيات سلسلة ماركوف مونت كارلو، مع الحفاظ على الكفاءة الحسابية. تجعل مرونة النموذج وقوته في التعامل مع بيانات السلاسل الزمنية مناسبة بشكل خاص لتوقعات عبء المرض على المدى الطويل. نظرًا لنطاقه الشامل وقدرته على التقاط الاتجاهات الزمنية، تم التحقق من صحة نموذج BAPC بشكل موسع وتطبيقه في الأبحاث الوبائية، خاصة في الدراسات التي تتضمن بيانات سكانية مرتبة حسب العمر وتأثيرات الجيل المعقدة. في هذه الدراسة، استخدمنا حزمة “BAPC” في R للتنبؤ بالعبء العالمي لمرض اللثة، مستفيدين من بيانات GBD 2021 وتوقعات ديموغرافية من IHME. تتيح هذه المنهجية توقعات متطورة لعبء المرض في المستقبل مع الأخذ في الاعتبار التفاعل المعقد لتأثيرات العمر والفترة والجيل.
التحليل الإحصائي
تم التنفيذ باستخدام أداة تقييم العدالة الصحية التابعة لمنظمة الصحة العالمية وبرنامج الحوسبة الإحصائية R (الإصدار 3.5.2).
النتائج
المستوى العالمي والقاري
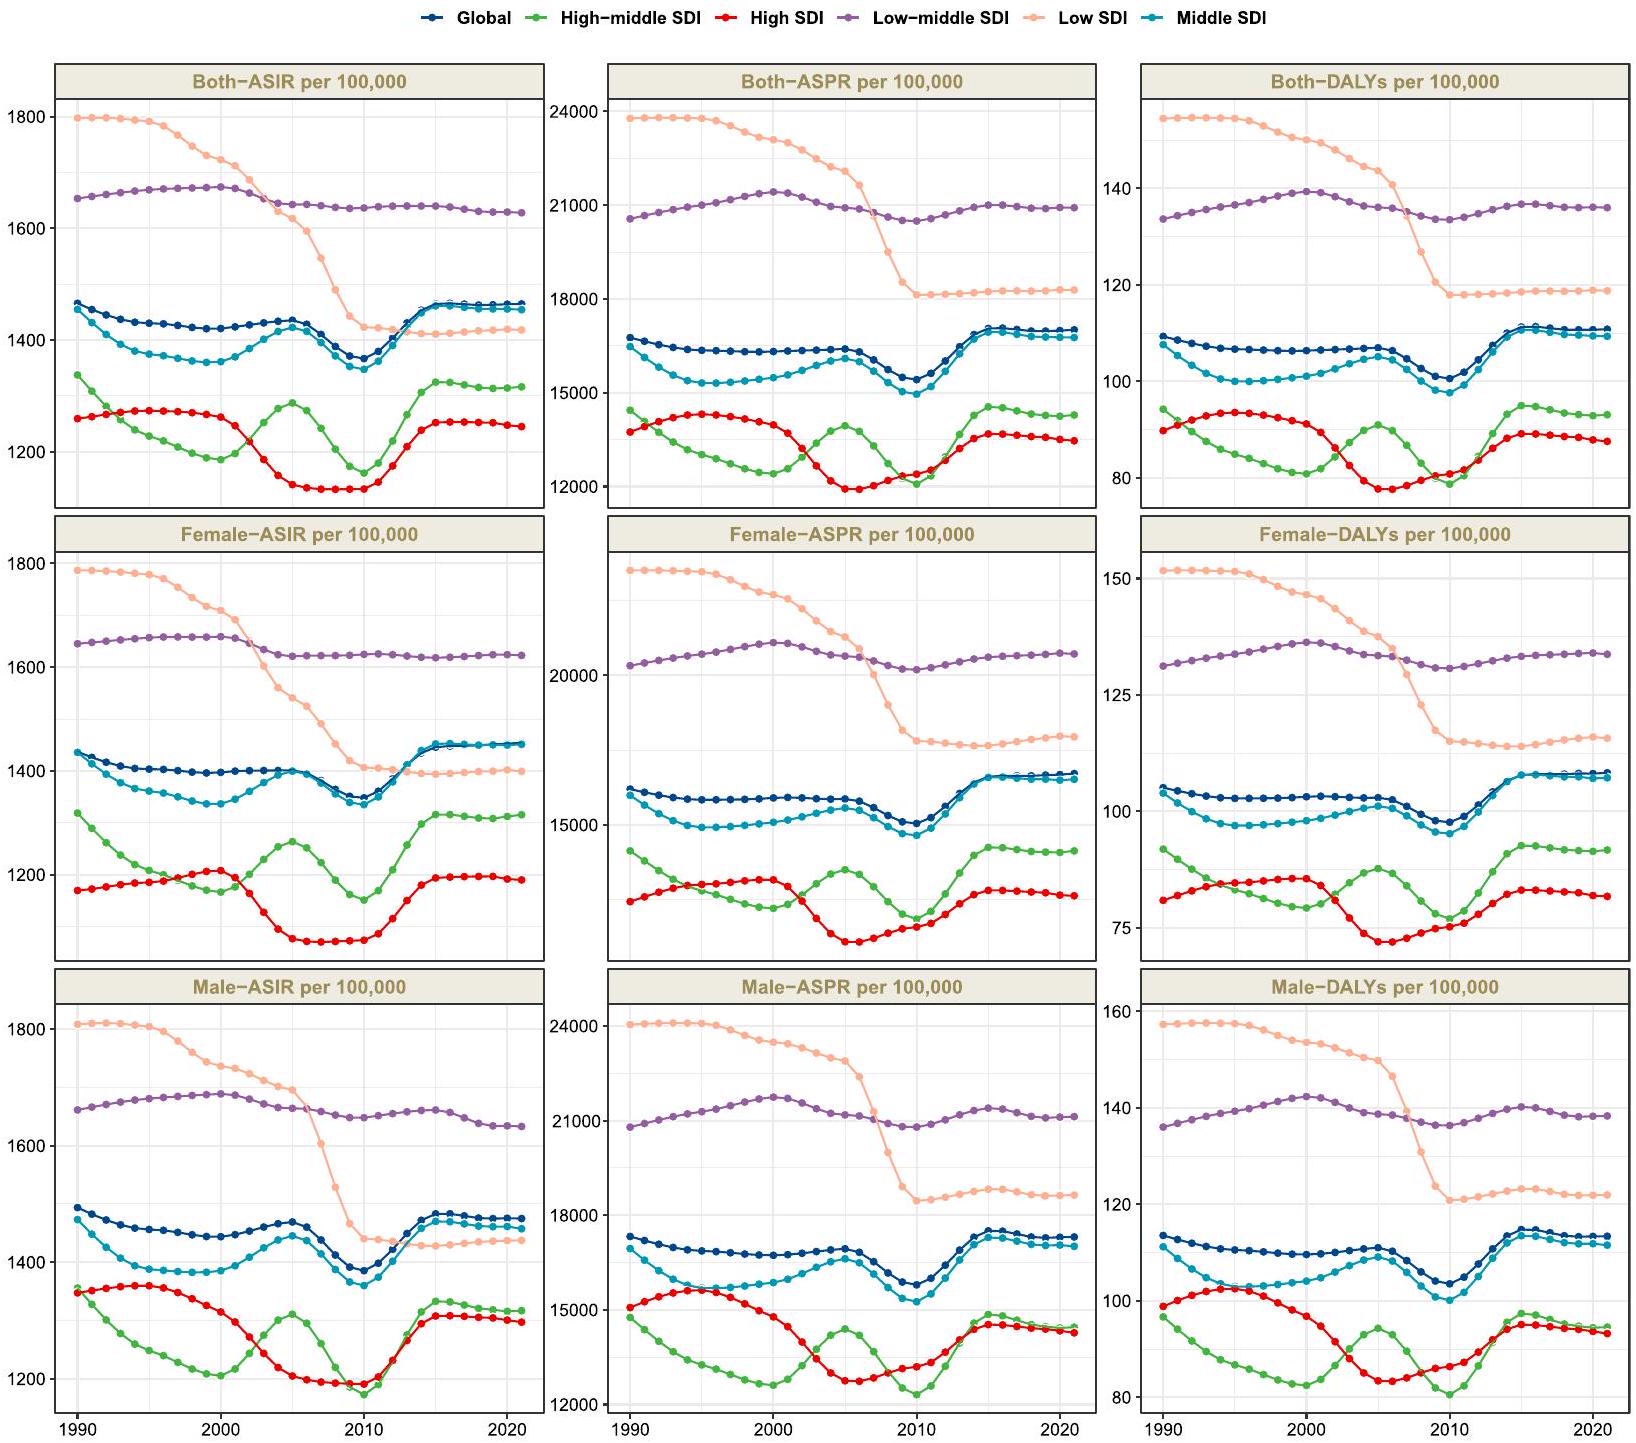
كشفت التحليلات القارية عن أنماط جغرافية مميزة واتجاهات زمنية من 1990 إلى 2021. في عام 2021، أظهرت آسيا أعلى معدلات موحدة حسب العمر عبر جميع المقاييس – الانتشار، الحدوث، وDALYs لأمراض اللثة، مما يعكس عبئًا غير متناسب في هذه المنطقة. أظهرت التغيرات الزمنية في معدلات الإصابة الموحدة حسب العمر اتجاهات متباينة واضحة عبر القارات: حيث أظهرت آسيا وأمريكا زيادات تدريجية مقارنة بمستوياتها في عام 1990، مما قد يعكس التحولات السكانية وتغيرات في ملفات عوامل الخطر في هذه المناطق. في المقابل، شهدت أفريقيا وأوروبا انخفاضات ملحوظة خلال نفس الفترة، مما قد يشير إلى تنفيذ ناجح لمبادرات صحة الفم أو تغييرات في عوامل الخطر البيئية.
لقد تم عكس هذا التباين القاري بشكل مشابه في أنماط معدل الإصابة القياسي. فقط آسيا وأمريكا أظهرت اتجاهات إيجابية في حدوث الأمراض: زاد معدل الإصابة القياسي في آسيا من 1,460 (نطاق عدم اليقين 95%: 779.4-2,161.2) في عام 1990 إلى 1,517.9 (
المستوى الإقليمي
| الموقع | 1990 | 2021 | ||
| رقم | ASR | رقم | ASR | |
| عالمي | 511,273,721.9 (348,066,669.6681,372,362.6) | 16,763.3 (11,516.1-22,153) | ٩٥١,٢٥٦,٢٣٢.٨ (٧٢٩,٠٣٥,١٩٠.٨١,١٨٣,٣٢١,٤٥٩.٩) | 17,011.6 (12,996.8-21,229.2) |
| أفريقيا | ٦٣,٢٠٢,٨٦٣.٥ (٤٤,٤٧٥,٥٥٢.٥٨٢,٠٨٦,٩٨١.٨) | 22,464.1 (16,156.4-28,670.1) | ١٠٨,٠٩١,٠٩٤.٥ (٧٩,٩٥٠,١٤٤.٥١٤٠,٧٢٦,٨٣١.٤) | 15,962.4 (11,912.6-20,534.2) |
| أمريكا | 66,585,898 (44,694,130.989,621,499.2) | 15,832.4 (10,736.8-21,117.4) | ١٢٦,٣٧٦,٣٦٦.١ (٩٦,٠٢٧,٩٩٢.٤١٥٩,١٤٤,١١٦.٧) | 16,405.6 (12,384.3-20,791.8) |
| أوروبا | 86,818,068.9 (61,009,471.1114,247,019.4) | 14,393.3 (10,039.3-19,027.3) | 100,823,255.5 (68,802,122137210478) | 13,908.9 (9298.7-19,372.6) |
| آسيا | ٢٩٣,٥٨٨,٠٢٣.٨ (١٩٦,٢٢٠,٠٨٨.٥٣٩٥,٣٠٣,٩٦٦.٤) | 16,851.9 (11,422.1-22,413.8) | 614,676,733.5 (476,510,903.8755,271,722.4) | 17,880.7 (13,810.7-22,044.5) |
| مؤشر التنمية البشرية العالي | 89,612,454.2 (62,181,808.6119,083,548.8) | 13,743.5 (9510.1-18,296.3) | 126,843,491.6 (92,931,314.8165,324,976) | 13,463.7 (9704.2-17,889.5) |
| مؤشر التنمية البشرية العالي المتوسط | ١٠١,٤٤٠,٣٢٠ (٦٦,٦٨٤,٢٩٧.٨١٣٨,٠٧٣,٥٧٦.٢) | 14,440.2 (9497.8-19,583) | 165,170,486.4 (122,978,911.9213,817,271.5) | 14,288.2 (10,493-18,812.5) |
| مؤشر التنمية المستدامة المتوسط | 150,035,720.7 (100,646,529.5202,066,204.2) | 16,476.1 (11,244.5-21,861.4) | 313,921,462 (243,587,402.5385,827,907.9) | 16,767 (12,950.9-20,693.9) |
| مؤشر التنمية البشرية المنخفضة والمتوسطة | 116,744,061.6 (80,440,610.8154,287,969.6) | 20,564.1 (14,409.4-26,782.5) | ٢٤٨,٧٤٣,٨٥٥.٩ (١٨٩,٦٦٤,٢٨٥.٧٣٠٧,٥٧١,٩٨٩.٣) | 20,920.5 (16,055-25,711) |
| مؤشر التنمية البشرية المنخفض | 52,976,349 (36,945,623.569,275,404.9) | 23,778.5 (16,918.9-30,561.1) | 95,923,866.8 (72,989,707.7120,107,289.2) | 18,289 (14,088.5-22,600.1) |
| أمريكا اللاتينية الأنديزية | 3,023,916.5 (2,236,7563,868,293.7) | 16,505.3 (12,415.8-20,810.4) | 7,225,713.6 (4,762,953.610,097,958.1) | 16,554.2 (10,976.5-23,001.8) |
| أسترالاسيا | 1,615,132.5 (987,961.62,320,562.6) | 11,252.8 (6875.2-16,167) | 3,339,317.1 (2,132,344.14,840,026.6) | 13,654 (8606.3-20,120.1) |
| الكاريبي | 4,155,532.9 (2,866,049.15,522,078.2) | 21,146.1 (14,826.9-27,700.2) | 6,373,235.7 (4,377,728.48,601,141.2) | 18,857.7 (12,884.6-25,582.6) |
| آسيا الوسطى | 4,832,210 (3,111,346.56,684,239.2) | 13,540.9 (8764.1-18,557.5) | 8,432,943.4 (5,336,718.412,351,201.1) | 12,742.7 (8079.9-18,604.2) |
| أوروبا الوسطى | 11,715,457.2 (7,694,823.816,084,220.8) | 12,353.6 (8041.4-17,062.8) | 13,915,095.8 (9,198,270.519,396,692.5) | 13,605.6 (8803.8-19,449.1) |
| أمريكا اللاتينية الوسطى | 15,591,451.9 (10,535,502.621,068,168.5) | ٢٠٠٧٥.٦ (١٣٩٤٩.٦-٢٦٤٩٧.٨) | ٣٤,٨٦٦,٢٦٨.٥ (٢٥,٧٩١,٨٤٠.٦٤٤,٤٨٦,٠١٧.٤) | 19,761.8 (14,613.7-25,224.7) |
| وسط أفريقيا جنوب الصحراء | 5,625,458.2 (3,835,120.17,488,908.6) | ٢٣,٧٠٤.٢ (١٦,٦٠٤.١-٣٠,٧٦٤.٨) | 7,553,853.9 (4,548,21811,691,758.5) | 12,549.5 (7704-18933.2) |
| شرق آسيا | ١٠٤,٣٩١,٧٩٥.٥ (٦٨,١٢٥,٧٣٣.٥١٤٢,٨٤٦,٠٦٦.٤) | 14,655.5 (9678.7-19,818.5) | 195,893,145.5 (147,616,998.2-245,292,159) | 14,212.7 (10,553.5-18,061.5) |
| أوروبا الشرقية | 28,014,948 (19,173,423.337,291,849.9) | 16,031.7 (10,840.1-21,493.5) | 27,392,361.4 (18,475,561.937,895,424.1) | 14,698.9 (9714.9-20,813) |
| شرق أفريقيا جنوب الصحراء | 19,659,000.2 (13,551,253.926,010,889.7) | 25,247.3 (17,980.3-32,504.4) | 31,837,615.9 (23,299,412.341,861,466.8) | 16,900.1 (12,558.1-21,831) |
| آسيا والمحيط الهادئ ذات الدخل المرتفع | 15,673,158.7 (9,866,399.921,919,046.5) | 11,505.3 (7219.9-16,152) | 19,889,733.8 (12,888,538.527,984,201.4) | 11,564.8 (7326.3-16,830.4) |
| أمريكا الشمالية ذات الدخل المرتفع | 27,038,189.7 (17,836,680.436,772,309.7) | 13,523.7 (8915.9-18,365.7) | ٣٩,٣٣٦,٨٢٨.٥ (٢٩,٦٤١,٤٤٦٥٠,٠١٩,٧٩٧) | 12,605 (9352.4-16,308.9) |
| شمال أفريقيا والشرق الأوسط | 19,982,083.1 (12,734,808.728,271,233.4) | 12,972 (8409.9-18,040.7) | 64,902,272.1 (46,075,358.487,750,846.2) | 15,879.6 (11,376.7-21,253.1) |
| أوقيانوسيا | 381,098.8 (236,524.1542,110.2) | 13,292.4 (8427.9-18,567.7) | 207,199.3 (121,353.5344,656.1) | 2847.3 (1680.5-4681.5) |
| جنوب آسيا | ١٢٥,٠١٠,٩٨٩.٥ (٨٦,٢٥٠,٣٢٣.٨١٦٥,٠٩٧,٧٦١.٧) | 22,553.3 (15,844.6-29,320.8) | ٢٩١,٣٤٥,٦١٠.٣ (٢٢٤,٤٠٤,٥٨٠.٨٣٥٦,٤٠٨,٦٠٢.٧) | 24,235.8 (18,781.4-29,490.3) |
| الموقع | 1990 | ٢٠٢١ | ||
| رقم | ASR | رقم | ASR | |
| جنوب شرق آسيا | 34,372,108.5 (22,682,947.847,211,272.7) | 14,813.6 (9953.8-20,031) | 67,596,721.1 (50,640,660.284,924,395.2) | 13,222.9 (9897.2-16,629.3) |
| أمريكا اللاتينية الجنوبية | 5,207,902.9 (3,420,620.97,113,362.8) | 16,834.7 (11,069.3-22,948.7) | 8,953,183.8 (5,913,850.512,441,455) | 17,841.5 (11,719.8-24,949.2) |
| جنوب الصحراء الكبرى الأفريقية | 2,138,598.1 (1,267,048.33,204,387.9) | 9218.8 (5534.8-13,626.8) | 3,485,853 (2,383,363.44,964,504.5) | 7133.1 (4894.4-10,092.7) |
| أمريكا اللاتينية الاستوائية | 12,306,220.8 (8,100,847.216,918,219.8) | 15,301.2 (10,248.6-20,730.4) | 30,467,127.4 (22,646,256.838,368,319.1) | 17,612.2 (13,053.3-22,254.7) |
| أوروبا الغربية | ٤٣,٧٨٦,٨٨٧.٢ (٣٢,٠٥٣,٤٤٤.٢٥٦,٧٤٠,٦٠٥.٤) | 14,738 (10,728.1-19,176.9) | ٤٧٠٤٨٣٩٠.٥ (٣٢٦٥١٨٩٦.٣٦٣٤٩٥١٥٨.١) | 12,726.5 (8650.2-17,577.4) |
| غرب أفريقيا جنوب الصحراء | ٢٦,٧٥١,٥٨١.٧ (١٩,٦٨٧,٢٦٩٣٣,٧٠٠,٥٦١.٥) | 30,342.3 (22,809.3-37,593.1) | 41,193,762.2 (32,216,310.650,918,502.9) | 18,231.9 (14,405.1-22,294.6) |
عبء غير متناسب في المناطق ذات مستويات التنمية المتوسطة.
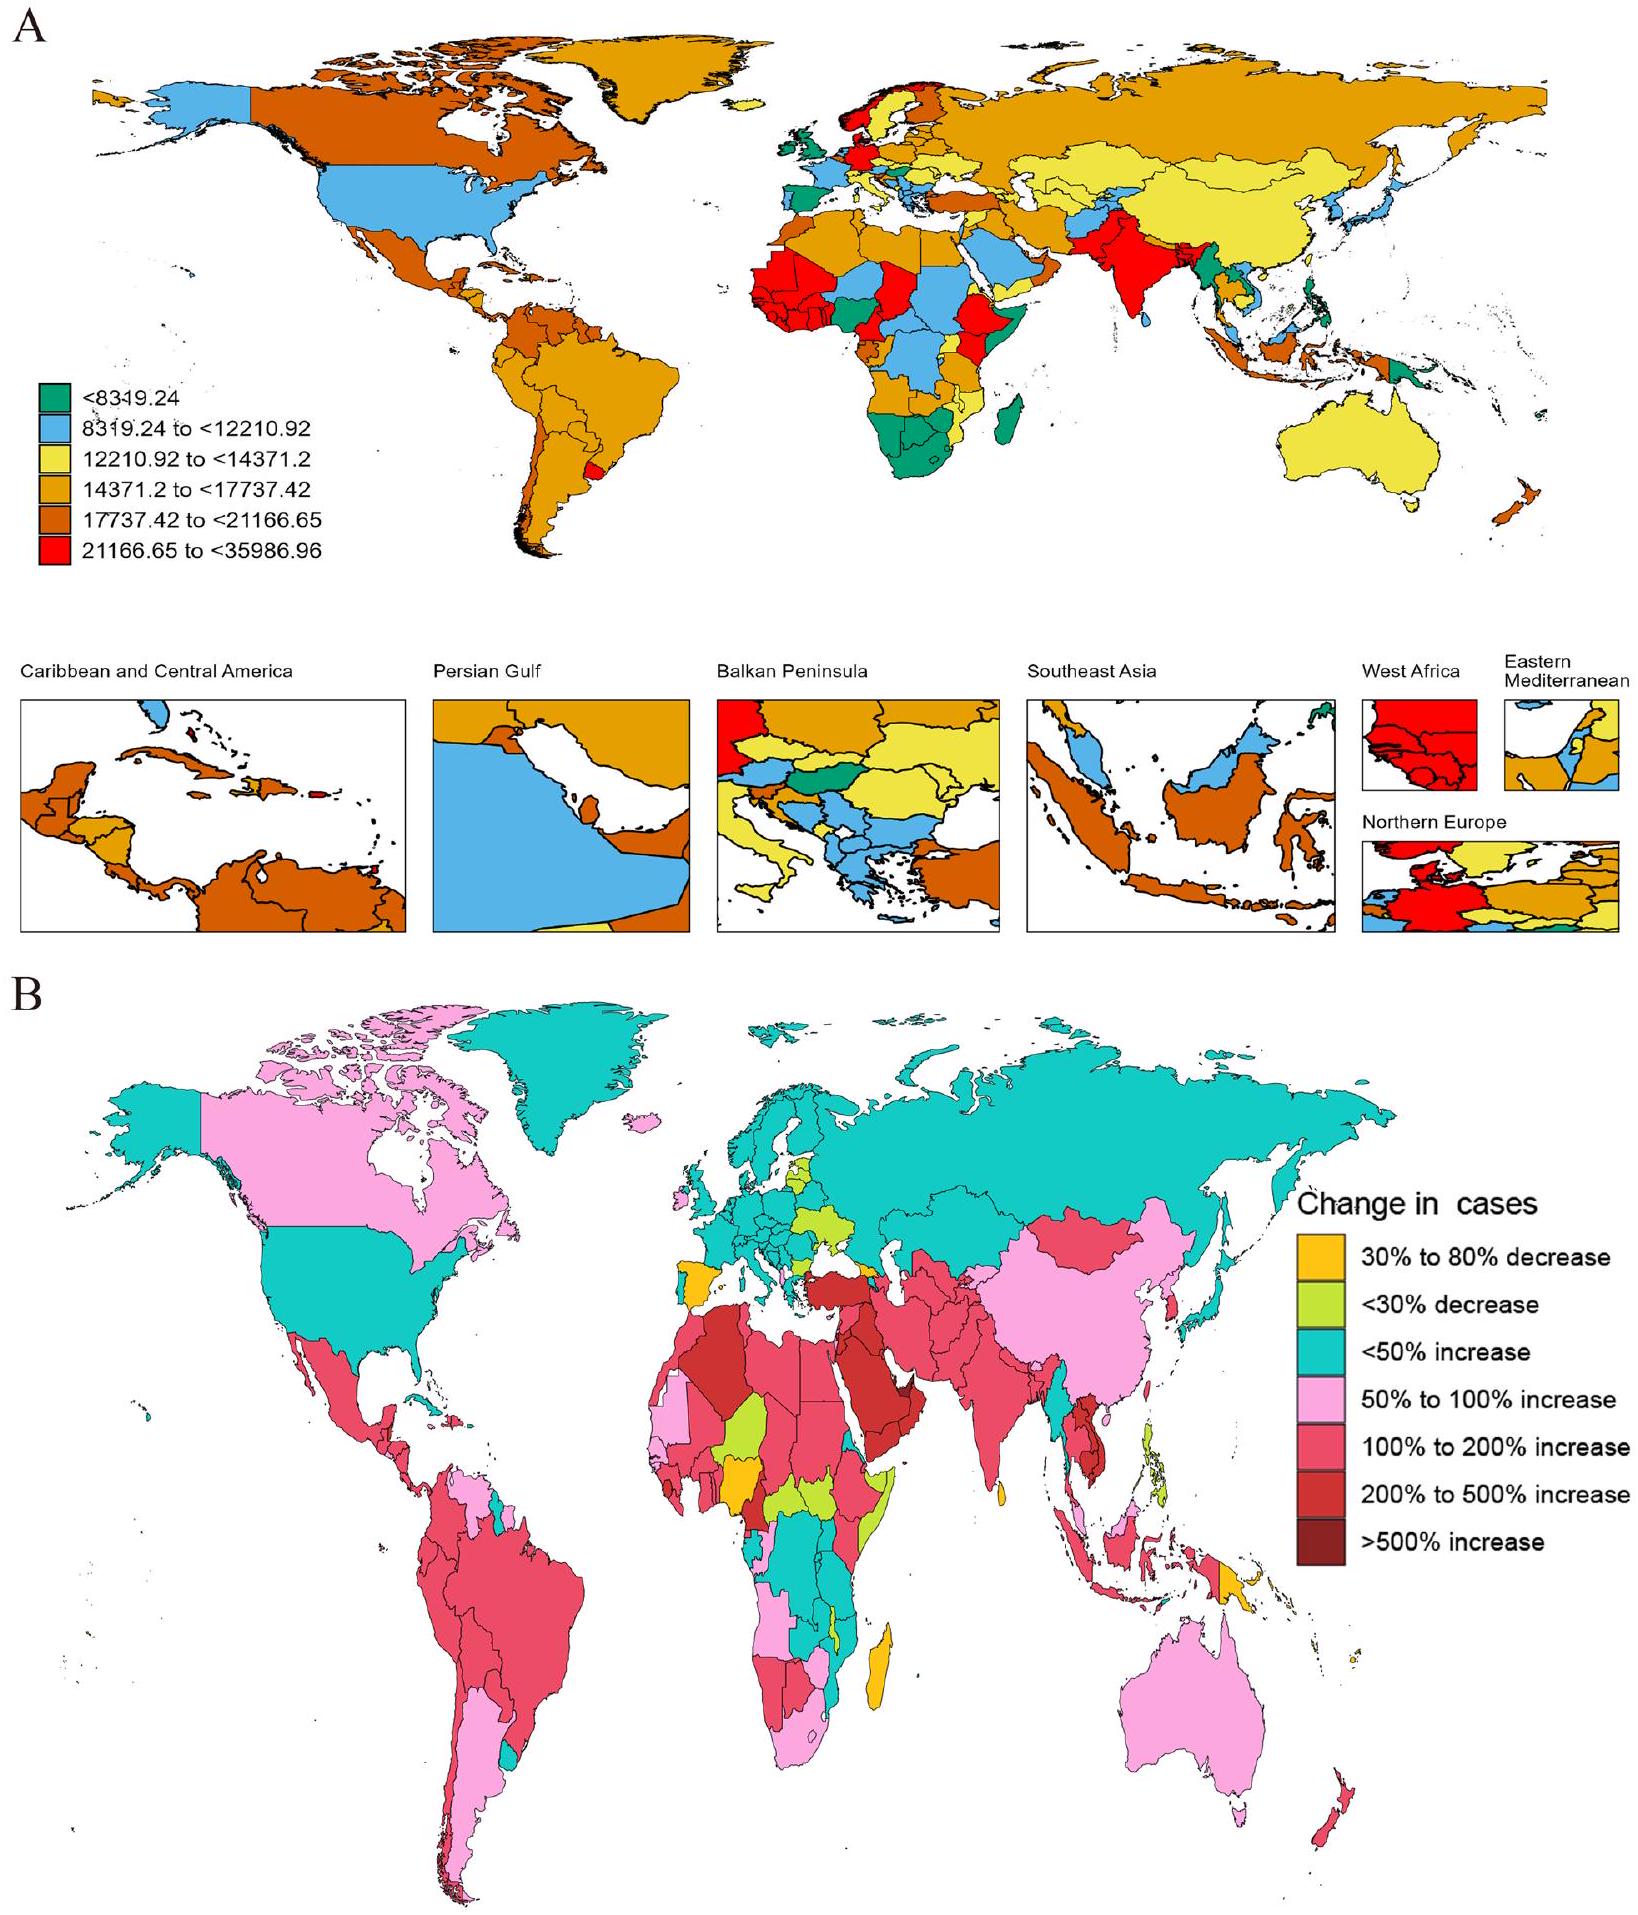
جغرافياً، أظهر العبء تبايناً ملحوظاً، حيث أظهرت جنوب آسيا أعلى معدل إقليمي
كانت أنماط الحدوث متوازية مع توزيع الانتشار في عام 2021، حيث حافظت مناطق الدخل المنخفض والمتوسط على أعلى معدل حدوث قياسي بين مناطق الدخل.
أظهر عبء الإعاقة، المقاس بمعدلات DALY المعدلة حسب العمر، تدرجات اجتماعية واقتصادية مماثلة ولكن مع تغييرات زمنية ملحوظة. في عام 2021، تم ملاحظة أعلى عبء في مناطق الدخل المنخفض والمتوسط عند 136 لكل 100,000 شخص.
أظهر مقارنة بيانات عامي 1990 و2021 تحسنًا كبيرًا في بعض المناطق. أظهرت المناطق ذات مؤشر التنمية الاجتماعية المنخفض تقدمًا ملحوظًا، حيث انخفضت معدلات سنوات الحياة المعدلة حسب العمر (DALY) من 154.5 لكل 100,000 شخص (95% UI: 59.7-326) في عام 1990 إلى 118.8 لكل 100,000 شخص (
المستوى الوطني
كابو فيردي (
تراوحت نسبة الإصابة السنوية للأمراض اللثوية بين 261.2 و 2235.9 لكل 100,000 نسمة. في عام 2021، كانت سيراليون (2235.9 لكل 100,000 شخص؛ 95% فاصل الثقة: 1447.9-2870.1)، غامبيا (2170.2 لكل 100,000 شخص؛ 95% فاصل الثقة: 1346.1-2854)، غانا (2120.2 لكل 100,000 شخص؛
أنماط العمر والجنس
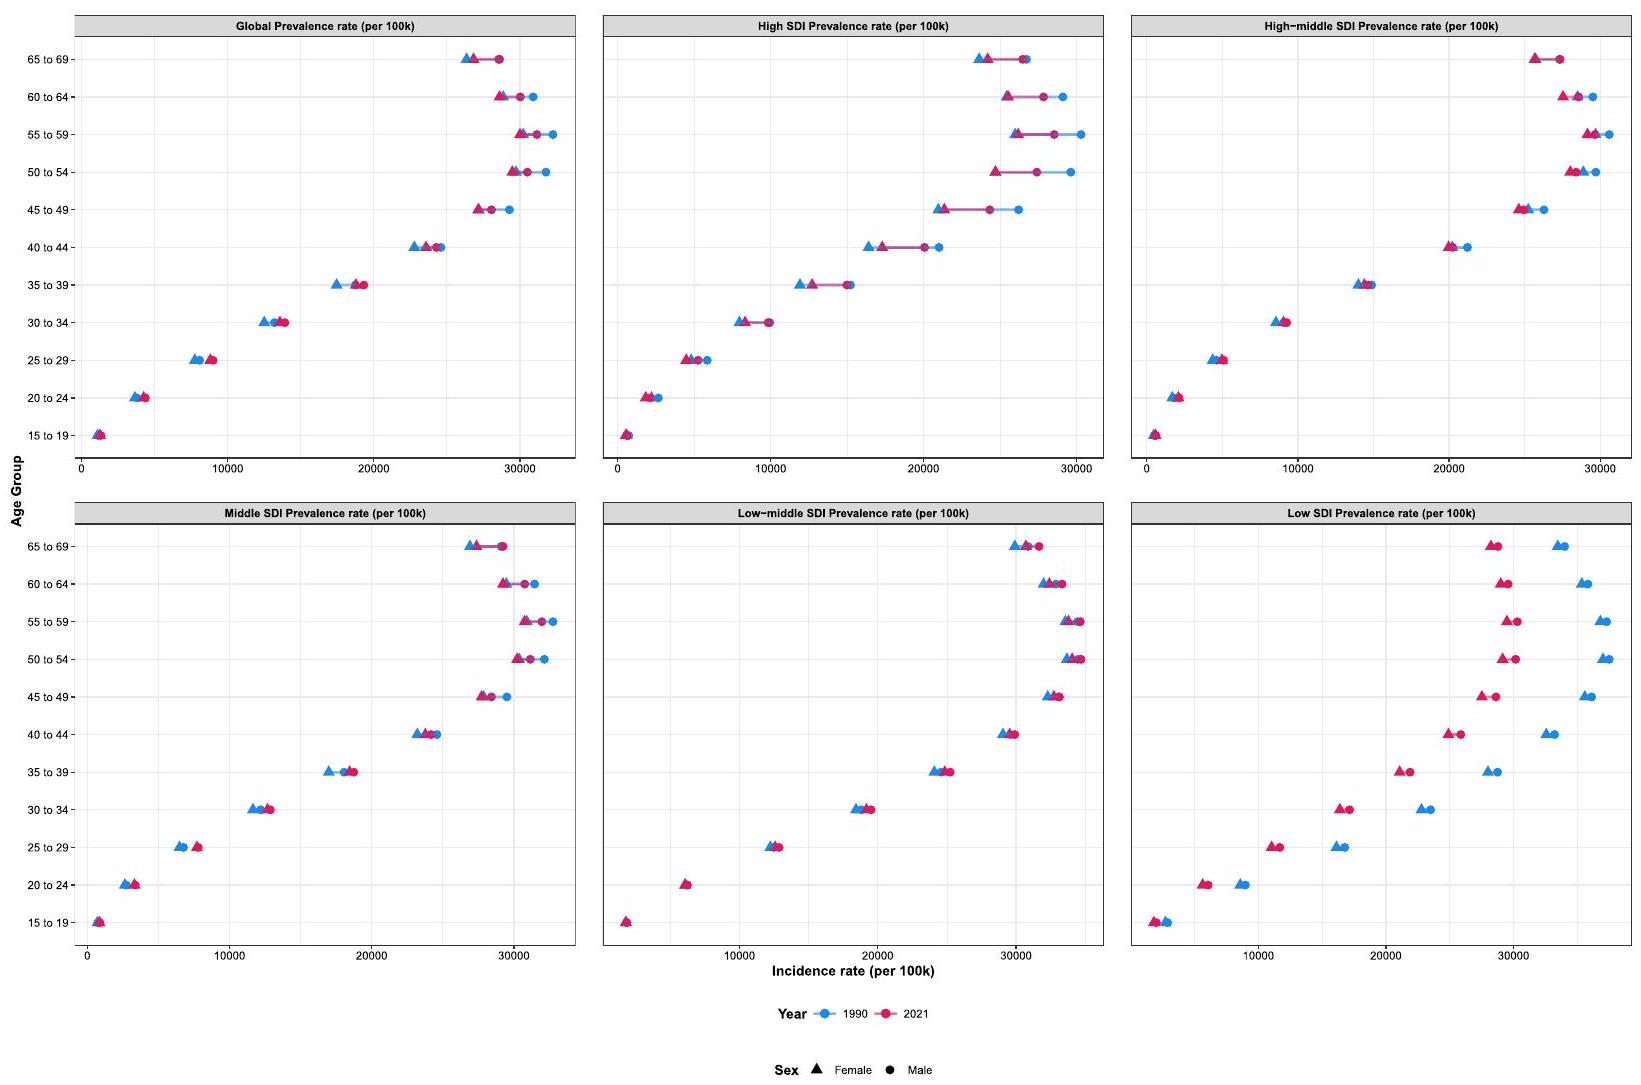
فقط فئة SDI المنخفضة أظهرت انخفاضًا ملحوظًا في ASPR مقارنة بمستويات عام 1990، بينما حافظت المناطق الأخرى من SDI على معدلات مستقرة نسبيًا خلال هذه الفترة (الشكل 3). أظهرت أنماط DALYs اتجاهات مشابهة لتلك التي لوحظت في الانتشار (الشكل S4). فيما يتعلق بأنماط الحدوث، كانت الفئة العمرية الذروة هي
تحليل الانحدار بنقطة الانضمام
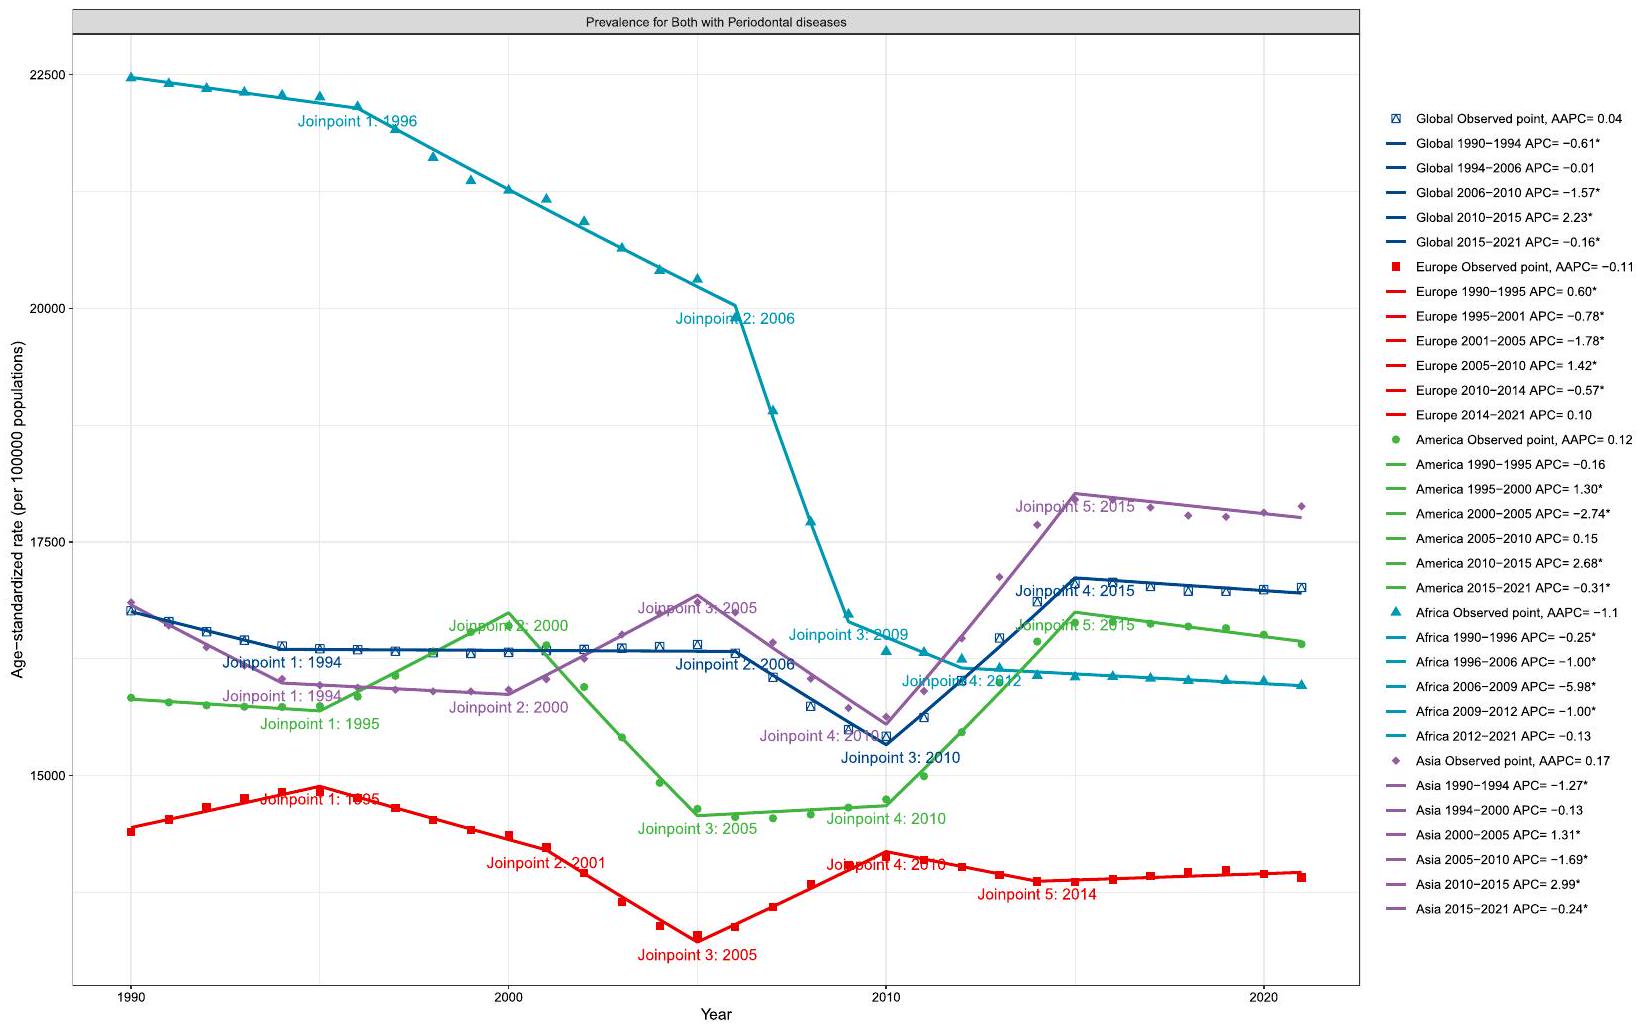
يمكن تقسيم هذا الاتجاه العام إلى أربع مراحل متميزة، كل منها لها معدل تغيير خاص بها يشير إلى معدل التغير خلال تلك الفترة المحددة. في البداية، من 1990 إلى 1994، كان هناك انخفاض كبير بمعدل تغيير قدره -0.61 (95% UI: – 1.04 إلى – 0.37)، والذي قد يتوافق
إلى التنفيذ المبكر لتدابير صحة الفم الوقائية في العديد من المناطق. أظهر الفترة من 1994 إلى 2006 استقرارًا نسبيًا. بعد ذلك، من 2006 إلى 2010، كان هناك تراجع أكثر وضوحًا مع معدل تغيير سنوي قدره -1.57 (
لقد شهدت فترة 2010-2015 انحرافًا كبيرًا عن الاتجاهات التنازلية السابقة، حيث أظهرت زيادة كبيرة بمعدل نمو سنوي مركب قدره 2.23 (95% UI: 2.1 إلى 2.36). وقد تزامن هذا التحول الملحوظ مع عدة تطورات هامة في علم الأوبئة اللثوية وأنظمة الرعاية الصحية. أولاً، جاءت هذه الفترة بعد الركود الاقتصادي العالمي في 2009-2010، والذي من المحتمل أنه قلل من الوصول إلى الرعاية الوقائية للأسنان في العديد من المناطق. ثانيًا، شهدت هذه الفترة تنفيذ تعريفات حالات CDCAAP لعام 2012 للمراقبة القائمة على السكان.
عند تحليلها حسب مستوى التنمية الاجتماعية والديموغرافية، ظهرت أنماط متباينة. أظهرت المناطق ذات مؤشر التنمية الاجتماعية المنخفض والمتوسط ومؤشر التنمية الاجتماعية المتوسط اتجاهات زيادة عامة من 1990 إلى 2021، مع معدلات النمو السنوي المركب البالغة 0.05 (فترة الثقة 95%: 0.04 إلى 0.06) و0.05 (
انخفاض طفيف مع معدل النمو السنوي المركب – 0.05 (
تحليل التحلل
كعامل رئيسي، يمثل
أظهرت المناطق ذات المؤشر التنموي العالي مساهمات كبيرة من كل من نمو السكان (
تحليل الحدود
توقع نموذج BAPC
نقاش
يمثل العبء العالمي الكبير للأمراض اللثوية، الذي يؤثر على 951.3 مليون فرد في عام 2021، تحديًا كبيرًا للصحة العامة لا يمكن تجاهله. تشير نسبة انتشار الأمراض اللثوية البالغة 17,011.6 لكل 100,000 شخص إلى أن هذه الأمراض لا تزال شائعة جدًا بين السكان في سن العمل، مما يتماشى مع الدراسات السابقة التي تسلط الضوء على الطبيعة الواسعة الانتشار لهذه الحالات على مستوى العالم. إن حجم هذا العبء مقلق بشكل خاص نظرًا لتأثيره المحتمل على إنتاجية القوى العاملة وجودة الحياة.
تحليل الاتجاهات الزمنية يكشف عن زيادة متواضعة ولكن ثابتة في عبء المرض من 1990 إلى 2021، مع معدل سنوي متوسط للنمو يبلغ 0.04. تشير هذه الاتجاهات الصاعدة المستمرة إلى أنه على الرغم من التقدم في رعاية الأسنان واستراتيجيات الوقاية، لم تنجح المجتمع العالمي في تقليل عبء الأمراض اللثوية. وقد أشار تونتي وآخرون سابقًا إلى مخاوف مماثلة بشأن الطبيعة التحديّة للسيطرة على تقدم الأمراض اللثوية على مستوى السكان. قد يُعزى الاتجاه المتزايد إلى تحسين الكشف والتشخيص، وشيخوخة السكان، وتغيرات في عوامل الخطر.
تحليلنا للتفكيك يكشف أن النمو السكاني (
تشير الزيادة الأكبر في عبء المرض في مناطق الدخل المنخفض والمتوسط إلى أن التنمية الاقتصادية وحدها قد لا تضمن تحسين نتائج صحة الفم دون تدخلات مستهدفة وتدابير سياسية [25]. تدعم هذه الملاحظة النتائج السابقة المتعلقة بالحاجة إلى نهج شامل لتحسين صحة الفم يعالج كل من الوصول إلى الرعاية الصحية والعوامل الاجتماعية المحددة للصحة [26].
يجب الاعتراف بعدة قيود في هذه الدراسة. أولاً، مثل الدراسات الأخرى التي تستخدم قاعدة بيانات GBD، كانت تحليلاتنا مقيدة بالقيود المتأصلة في منهجية دراسة GBD. تعتمد تقديرات GBD بشكل كبير على النمذجة في المناطق التي تفتقر إلى بيانات أولية أو لا تحتوي عليها، مما قد يؤثر على دقة التقديرات في هذه المناطق. ثانيًا، الطبيعة المقطعية للعديد من الدراسات المضمنة تحد من قدرتنا على إقامة علاقات سببية بين الاتجاهات الملاحظة ومحركاتها المحتملة. أخيرًا، لم تأخذ دراستنا في الاعتبار التباينات المحتملة في شدة المرض ضمن
فئة التهاب اللثة الشديد، مما قد يخفي أنماطًا سريرية وبائية مهمة. يمكن أن توفر الأبحاث المستقبلية التي تتضمن تصنيفات شدة أكثر تفصيلًا رؤى أفضل للممارسة السريرية وتخطيط الصحة العامة.
الاستنتاجات
| AAPC | متوسط التغير السنوي النسبة المئوية |
| ASIR | معدل الإصابة الموحد للعمر |
| ASPR | معدل الانتشار الموحد للعمر |
| BAPC | نموذج بايزي للفترة العمرية |
| DALY | سنة الحياة المعدلة بالإعاقة |
| GBD | عبء المرض العالمي |
| GHDx | تبادل بيانات الصحة العالمية |
| ICD | التصنيف الدولي للأمراض |
| INLA | تقريب لابلاس المتداخل المتكامل |
| LOESS | الانحدار الموزون محليًا |
| SDI | مؤشر السوسيوديموغرافي |
| UI | فترة عدم اليقين |
المعلومات التكميلية
المادة التكميلية 4: الجدول S4: تحليل الحدود.
المادة التكميلية 5: الجدول S5: توقع نموذج BAPC.
المادة التكميلية 6: الشكل S1: العبء العالمي لمرض التهاب اللثة معدل حدوثه لكلا الجنسين في 204 دول وأقاليم.
المادة التكميلية 14: الشكل S9: التوقعات المستقبلية لعبء سنوات الحياة المعدلة بالإعاقة لأمراض اللثة العالمية عبر فئات العمر.
الشكر والتقدير
مساهمات المؤلفين
التمويل
توفر البيانات
الإعلانات
موافقة الأخلاقيات والموافقة على المشاركة
الموافقة على النشر
المصالح المتنافسة
تفاصيل المؤلف
تم النشر على الإنترنت: 08 أبريل 2025
References
- Chen MX, Zhong YJ, Dong QQ, Wong HM, Wen YF. Global, regional, and national burden of severe periodontitis, 1990-2019: An analysis of the Global Burden of Disease Study 2019. J Clin Periodontol. 2021;48:116588. https://doi.org/10.1111/jcpe.13506.
- Wu L, Zhang S, Zhao L, Ren Z, Hu C. Global, regional, and national burden of periodontitis from 1990 to 2019: Results from the Global Burden of Disease study 2019. J Periodontol. 2022;93:1445-54. https://doi.org/10. 1002/JPER.21-0469.
- Reynolds I, Duane B. Periodontal disease has an impact on patients’ quality of life. Evid Based Dent. 2018;19:14-5. https://doi.org/10.1038/sj.ebd. 6401287.
- GBD. Diseases and Injuries Collaborators (2024). Global incidence, prevalence, years lived with disability (YLDs), disability-adjusted lifeyears (DALYs), and healthy life expectancy (HALE) for 371 diseases and injuries in 204 countries and territories and 811 subnational locations, 1990-2021: a systematic analysis for the Global Burden of Disease Study 2021. Lancet (London, England). 2021;403:2133-61. https://doi.org/10. 1016/S0140-6736(24)00757-8.
- Li X, Kong X, Yang C, Cheng Z, Lv J, Guo H, et al. Global, regional, and national burden of ischemic stroke, 1990-2021: an analysis of data from the global burden of disease study 2021. Eclinicalmedicine. 2024;75: 102758. https://doi.org/10.1016/j.eclinm.2024.102758.
- GBD. Diseases and Injuries Collaborators (2020). Global burden of 369 diseases and injuries in 204 countries and territories, 1990-2019: a systematic analysis for the Global Burden of Disease Study 2019. Lancet (London, England). 2019;396:1204-22. https://doi.org/10.1016/S0140-6736(20)30925-9.
- GBD. Demographics Collaborators (2020) . Global age-sex-specific fertility, mortality, healthy life expectancy (HALE), and population estimates in 204 countries and territories, 1950-2019: a comprehensive demographic analysis for the Global Burden of Disease Study 2019. Lancet (London, England). 2019;396:1160-203. https://doi.org/10.1016/S0140-6736(20) 30977-6.
- Kim HJ, Fay MP, Feuer EJ, Midthune DN. Permutation tests for joinpoint regression with applications to cancer rates. Stat Med. 2000;19:335-51.
- GBD. Causes of Death Collaborators (2024). Global burden of 288 causes of death and life expectancy decomposition in 204 countries and territories and 811 subnational locations, 1990-2021: a systematic analysis for the Global Burden of Disease Study 2021. Lancet (London, England). 2021;403:2100-32. https://doi.org/10.1016/S0140-6736(24)00367-2.
- Hu J, Ke R, Teixeira W, Dong Y, Ding R, Yang J, et al. Global, Regional, and National Burden of CKD due to Glomerulonephritis from 1990 to 2019: A Systematic Analysis from the Global Burden of Disease Study 2019. Clinical Journal of the American Society of Nephrology : Cjasn. 2023;18:60-71. https://doi.org/10.2215/CJN.0000000000000017.
- Das Gupta P. A general method of decomposing a difference between two rates into several components. Demography. 1978;15:99-112.
- GBD. Neck Pain Collaborators (2024). Global, regional, and national burden of neck pain, 1990-2020, and projections to 2050: a systematic analysis of the Global Burden of Disease Study 2021. The Lancet Rheumatology. 2021;6:e142-55. https://doi.org/10.1016/S2665-9913(23)00321-1.
- Xie Y, Bowe B, Mokdad AH, Xian H, Yan Y, Li T, et al. Analysis of the Global Burden of Disease study highlights the global, regional, and national
trends of chronic kidney disease epidemiology from 1990 to 2016. Kidney Int. 2018;94:567-81. https://doi.org/10.1016/j.kint.2018.04.011. - Knoll M, Furkel J, Debus J, Abdollahi A, Karch A, Stock C. An R package for an integrated evaluation of statistical approaches to cancer incidence projection. BMC Med Res Methodol. 2020;20:257. https://doi.org/10. 1186/s12874-020-01133-5.
- GBD. Risk Factors Collaborators (2020). Global burden of 87 risk factors in 204 countries and territories, 1990-2019: a systematic analysis for the Global Burden of Disease Study 2019. Lancet (London, England). 2019;396:1223-49. https://doi.org/10.1016/S0140-6736(20)30752-2.
- Kassebaum NJ, Bernabé E, Dahiya M, Bhandari B, Murray CJL, Marcenes W. Global burden of severe periodontitis in 1990-2010: a systematic review and meta-regression. J Dent Res. 2014;93:1045-53. https://doi.org/10. 1177/0022034514552491.
- Dai X, Tao Y, Zhou J, Zhou Y, Liang S, Ma X. Global burden and trends of severe periodontitis among women of childbearing age, 1990-2021. J Periodontol. 2025. https://doi.org/10.1002/JPER.24-0615.
- Jin LJ, Lamster IB, Greenspan JS, Pitts NB, Scully C, Warnakulasuriya S. Global burden of oral diseases: emerging concepts, management and interplay with systemic health. Oral Dis. 2016;22:609-19. https://doi.org/ 10.1111/odi. 12428.
- Tonetti MS, Jepsen S, Jin L, Otomo-Corgel J. Impact of the global burden of periodontal diseases on health, nutrition and wellbeing of mankind:
call for global action. J Clin Periodontol. 2017;44:456-62. https://doi.org/ 10.1111/jcpe.12732. - Nazir M, Al-Ansari A, Al-Khalifa K, Alhareky M, Gaffar B, Almas K. Global Prevalence of Periodontal Disease and Lack of Its Surveillance. TheScientificWorldJOURNAL. 2020;2020:2146160. https://doi.org/10.1155/2020/ 2146160.
- Peres MA, Macpherson LMD, Weyant RJ, Daly B, Venturelli R, Mathur MR, et al. Oral diseases: a global public health challenge. Lancet (London, England). 2019;394:249-60. https://doi.org/10.1016/S0140-6736(19) 31146-8.
- Kassebaum NJ, Bertozzi-Villa A, Coggeshall MS, Shackelford KA, Steiner C, Heuton KR, et al. Global, regional, and national levels and causes of maternal mortality during 1990-2013: a systematic analysis for the Global Burden of Disease Study 2013. Lancet (London, England). 2014;384:9801004. https://doi.org/10.1016/S0140-6736(14)60696-6.
- Elani HW, Harper S, Thomson WM, Espinoza IL, Mejia GC, Ju X, et al. Social inequalities in tooth loss: A multinational comparison. Commun Dent Oral Epidemiol. 2017;45:266-74. https://doi.org/10.1111/cdoe.12285.
- Thomson WM. Social inequality in oral health. Commun Dent Oral Epidemiol. 2012;40(Suppl 2):28-32. https://doi.org/10.1111/j.1600-0528.2012. 00716.x.
- Frencken JE, Sharma P, Stenhouse L, Green D, Laverty D, Dietrich T. Global epidemiology of dental caries and severe periodontitis – a comprehensive review. J Clin Periodontol. 2017;44(Suppl 18):S94-105. https://doi. org/10.1111/jcpe.12677.
- Watt RG, Daly B, Allison P, Macpherson LMD, Venturelli R, Listl S, et al. Ending the neglect of global oral health: time for radical action. Lancet (London, England). 2019;394:261-72. https://doi.org/10.1016/S0140-6736(19)31133-X.
ملاحظة الناشر
هاوجي فو وشينيو لي مؤلفان مشاركان.
*المراسلة:
روهونغ تشانغ
zhangruhong@163.com
جياكسيو زو
zhuxile521@163.com
شودونغ وانغ
xudongwang70@hotmail.com
DOI: https://doi.org/10.1186/s12889-025-22566-x
PMID: https://pubmed.ncbi.nlm.nih.gov/40200262
Publication Date: 2025-04-08
Global burden of periodontal diseases
Check for updates among the working-age population from 19902021: results from the Global Burden of Disease Study 2021
Abstract
Background Periodontal diseases among working-age individuals (
Abstract
and Tokelau achieved reductions exceeding 70%. Decomposition analysis identified population growth (74.56%) and aging (23.00%) as primary drivers of increased disease burden. Interpretation. Our analysis reveals significant global disparities in periodontal disease burden among the working-age population, with concerning increases in many regions from 1990 to 2021. The disproportionate burden in Low-middle SDI regions and South Asia, coupled with the substantial impact of population growth and aging, highlights the urgent need for targeted interventions. While some countries have achieved remarkable reductions in disease burden, the dramatic increases in others underscore the importance of strengthening preventive oral healthcare systems and addressing socioeconomic determinants. These findings emphasize the need for country-specific strategies, particularly in regions with rising burden, and can inform evidence-based policy making to reduce the impact of periodontal diseases on the global workforce.
Introduction
Previous Global Burden of Disease (GBD) studies have provided valuable insights into the overall burden of periodontal diseases across all age groups. However, understanding the specific patterns and trends among the working-age population is crucial, as this demographic represents the primary workforce and economic drivers of society. The impact of periodontal diseases in this age group can have far-reaching consequences, including decreased work productivity, increased healthcare costs, and reduced quality of life. Furthermore, the burden of periodontal diseases shows significant variations across different regions and socioeconomic groups, reflecting disparities in healthcare access, preventive services, and treatment availability [1]. Understanding these patterns is essential for developing targeted interventions and health policies [2].
This study aims to provide a comprehensive analysis of the global burden of periodontal diseases among the working-age population from 1990 to 2021, utilizing
data from the GBD 2021. This analysis will help identify trends, patterns, and disparities in disease burden across different regions and socioeconomic contexts, potentially informing future healthcare policies and interventions.
Materials and methods
Study design and data collection
Periodontal diseases in this study were classified according to the 2021 GBD definitions. Periodontal disease was characterized by symptoms including halitosis, altered taste sensation, and occasional gingival bleeding that does not impair daily activities. The disease classification followed standardized diagnostic codes, specifically ICD-10 (K05.0-K05.6) and ICD-9 (523.0-523.9). A description of the methods for the estimation of the burden of periodontal diseases have been described previously [6]. Data on the global burden of periodontitis were extracted from the GHDx online query tool (https:// ghdx.healthdata.org/gbd-results-tool). We collected comprehensive metrics including annual prevalence, incidence, and disability-adjusted life years (DALYs), both in absolute numbers and age-standardized rates (ASR), spanning from 1990 to 2021 across 25 regions and 204 countries/territories. Age-standardized prevalence rates (ASPR) are reported per 100,000 population, calculated using the GBD 2021 reference standard.
Burden description
Joinpoint regression analysis
Decomposition analysis
decomposed changes in periodontal disease-associated DALYs into three fundamental components: population growth, population aging, and epidemiological changes, enabling quantification of their respective contributions to overall DALY trends [9-11]. For calculating the population growth contribution, we estimated what the total DALYs would be in 2021 if only the total population had changed from 1990 levels while age structure and agespecific rates remained constant at their 1990 values. The difference between this counterfactual and the 1990 baseline, expressed as a percentage of the total change in DALYs, represents the contribution attributable to population growth alone. Analogous procedures were applied to determine the contributions of population aging and epidemiological changes (changes in age-specific rates). Population data for this analysis were derived from the UN Population Division’s World Population Prospects 2022 revision, maintaining consistency with other GBD 2021 analyses [12]. This standardized decomposition methodology enables meaningful comparisons of demographic and epidemiological drivers across different regions and time periods.
Frontier analysis
BAPC model projection
complex, high-dimensional, and sparse data characteristic of large-scale epidemiological studies like GBD 2021 [14]. The BAPC model extends the traditional generalized linear model (GLM) framework within a Bayesian context, enabling dynamic integration of age, period, and cohort effects. These effects are modeled to evolve continuously over time and are smoothed using a second-order random walk, yielding more precise posterior probability predictions. A key advantage of the BAPC model is its utilization of the Integrated Nested Laplace Approximation (INLA) method for approximating marginal posterior distributions. This approach effectively circumvents common challenges such as mixing and convergence issues typically associated with Markov Chain Monte Carlo techniques, while maintaining computational efficiency. The model’s adaptability and robustness in handling time series data make it particularly appropriate for long-term disease burden projections. Given its comprehensive scope and ability to capture temporal trends, the BAPC model has been extensively validated and applied in epidemiological research, especially in studies involving age-structured population data and complex cohort effects. In this study, we utilized the”BAPC”R package to forecast the global burden of periodontal disease, leveraging GBD 2021 data and demographic projections from the IHME. This methodology enables sophisticated predictions of future disease burden while accounting for the complex interplay of age, period, and cohort effects.
Statistical analysis
performed utilizing the World Health Organization’s Health Equity Assessment Toolkit and the statistical computing software, R (Version 3.5.2).
Results
Global and continental level
Continental analysis revealed distinct geographical patterns and temporal trends from 1990 to 2021. In 2021, Asia exhibited the highest age-standardized rates across all metrics-prevalence, incidence, and DALYs of periodontal diseases, reflecting a disproportionate burden in this region. The temporal changes in ASPR demonstrated clear divergent trends across continents: Asia and America showed progressive increases compared to their 1990 levels, potentially reflecting demographic transitions and changing risk factor profiles in these regions. In contrast, Africa and Europe experienced notable decreases over the same period, which may indicate successful implementation of oral health initiatives or changes in environmental risk factors.
This continental divergence was similarly reflected in ASIR patterns. Only Asia and America demonstrated positive trends in disease incidence: Asia’s ASIR increased from 1,460 (95% UI: 779.4-2,161.2) in 1990 to 1,517.9 (
Regional level
| Location | 1990 | 2021 | ||
| Number | ASR | Number | ASR | |
| Global | 511,273,721.9 (348,066,669.6681,372,362.6) | 16,763.3 (11,516.1-22,153) | 951,256,232.8 (729,035,190.81,183,321,459.9) | 17,011.6 (12,996.8-21,229.2) |
| Africa | 63,202,863.5 (44,475,552.582,086,981.8) | 22,464.1 (16,156.4-28,670.1) | 108,091,094.5 (79,950,144.5140,726,831.4) | 15,962.4 (11,912.6-20,534.2) |
| America | 66,585,898 (44,694,130.989,621,499.2) | 15,832.4 (10,736.8-21,117.4) | 126,376,366.1 (96,027,992.4159,144,116.7) | 16,405.6 (12,384.3-20,791.8) |
| Europe | 86,818,068.9 (61,009,471.1114,247,019.4) | 14,393.3 (10,039.3-19,027.3) | 100,823,255.5 (68,802,122137210478) | 13,908.9 (9298.7-19,372.6) |
| Asia | 293,588,023.8 (196,220,088.5395,303,966.4) | 16,851.9 (11,422.1-22,413.8) | 614,676,733.5 (476,510,903.8755,271,722.4) | 17,880.7 (13,810.7-22,044.5) |
| High SDI | 89,612,454.2 (62,181,808.6119,083,548.8) | 13,743.5 (9510.1-18,296.3) | 126,843,491.6 (92,931,314.8165,324,976) | 13,463.7 (9704.2-17,889.5) |
| High-middle SDI | 101,440,320 (66,684,297.8138,073,576.2) | 14,440.2 (9497.8-19,583) | 165,170,486.4 (122,978,911.9213,817,271.5) | 14,288.2 (10,493-18812.5) |
| Middle SDI | 150,035,720.7 (100,646,529.5202,066,204.2) | 16,476.1 (11,244.5-21,861.4) | 313,921,462 (243,587,402.5385,827,907.9) | 16,767 (12,950.9-20,693.9) |
| Low-middle SDI | 116,744,061.6 (80,440,610.8154,287,969.6) | 20,564.1 (14,409.4-26,782.5) | 248,743,855.9 (189,664,285.7307,571,989.3) | 20,920.5 (16,055-25711) |
| Low SDI | 52,976,349 (36,945,623.569,275,404.9) | 23,778.5 (16,918.9-30,561.1) | 95,923,866.8 (72,989,707.7120,107,289.2) | 18,289 (14,088.5-22,600.1) |
| Andean Latin America | 3,023,916.5 (2,236,7563,868,293.7) | 16,505.3 (12,415.8-20,810.4) | 7,225,713.6 (4,762,953.610,097,958.1) | 16,554.2 (10,976.5-23,001.8) |
| Australasia | 1,615,132.5 (987,961.62,320,562.6) | 11,252.8 (6875.2-16,167) | 3,339,317.1 (2,132,344.14,840,026.6) | 13,654 (8606.3-20,120.1) |
| Caribbean | 4,155,532.9 (2,866,049.15,522,078.2) | 21,146.1 (14,826.9-27,700.2) | 6,373,235.7 (4,377,728.48,601,141.2) | 18,857.7 (12,884.6-25,582.6) |
| Central Asia | 4,832,210 (3,111,346.56,684,239.2) | 13,540.9 (8764.1-18,557.5) | 8,432,943.4 (5,336,718.412,351,201.1) | 12,742.7 (8079.9-18,604.2) |
| Central Europe | 11,715,457.2 (7,694,823.816,084,220.8) | 12,353.6 (8041.4-17,062.8) | 13,915,095.8 (9,198,270.519,396,692.5) | 13,605.6 (8803.8-19,449.1) |
| Central Latin America | 15,591,451.9 (10,535,502.621,068,168.5) | 20,075.6 (13,949.6-26,497.8) | 34,866,268.5 (25,791,840.644,486,017.4) | 19,761.8 (14,613.7-25,224.7) |
| Central Sub-Saharan Africa | 5,625,458.2 (3,835,120.17,488,908.6) | 23,704.2 (16,604.1-30,764.8) | 7,553,853.9 (4,548,21811,691,758.5) | 12,549.5 (7704-18933.2) |
| East Asia | 104,391,795.5 (68,125,733.5142,846,066.4) | 14,655.5 (9678.7-19,818.5) | 195,893,145.5 (147,616,998.2-245,292,159) | 14,212.7 (10,553.5-18,061.5) |
| Eastern Europe | 28,014,948 (19,173,423.337,291,849.9) | 16,031.7 (10,840.1-21,493.5) | 27,392,361.4 (18,475,561.937,895,424.1) | 14,698.9 (9714.9-20,813) |
| Eastern Sub-Saharan Africa | 19,659,000.2 (13,551,253.926,010,889.7) | 25,247.3 (17,980.3-32,504.4) | 31,837,615.9 (23,299,412.341,861,466.8) | 16,900.1 (12,558.1-21,831) |
| High-income Asia Pacific | 15,673,158.7 (9,866,399.921,919,046.5) | 11,505.3 (7219.9-16,152) | 19,889,733.8 (12,888,538.527,984,201.4) | 11,564.8 (7326.3-16,830.4) |
| High-income North America | 27,038,189.7 (17,836,680.436,772,309.7) | 13,523.7 (8915.9-18,365.7) | 39,336,828.5 (29,641,44650,019,797) | 12,605 (9352.4-16,308.9) |
| North Africa and Middle East | 19,982,083.1 (12,734,808.728,271,233.4) | 12,972 (8409.9-18,040.7) | 64,902,272.1 (46,075,358.487,750,846.2) | 15,879.6 (11,376.7-21,253.1) |
| Oceania | 381,098.8 (236,524.1542,110.2) | 13,292.4 (8427.9-18,567.7) | 207,199.3 (121,353.5344,656.1) | 2847.3 (1680.5-4681.5) |
| South Asia | 125,010,989.5 (86,250,323.8165,097,761.7) | 22,553.3 (15,844.6-29,320.8) | 291,345,610.3 (224,404,580.8356,408,602.7) | 24,235.8 (18,781.4-29,490.3) |
| Location | 1990 | 2021 | ||
| Number | ASR | Number | ASR | |
| Southeast Asia | 34,372,108.5 (22,682,947.847,211,272.7) | 14,813.6 (9953.8-20,031) | 67,596,721.1 (50,640,660.284,924,395.2) | 13,222.9 (9897.2-16,629.3) |
| Southern Latin America | 5,207,902.9 (3,420,620.97,113,362.8) | 16,834.7 (11,069.3-22,948.7) | 8,953,183.8 (5,913,850.512,441,455) | 17,841.5 (11,719.8-24,949.2) |
| Southern Sub-Saharan Africa | 2,138,598.1 (1,267,048.33,204,387.9) | 9218.8 (5534.8-13,626.8) | 3,485,853 (2,383,363.44,964,504.5) | 7133.1 (4894.4-10,092.7) |
| Tropical Latin America | 12,306,220.8 (8,100,847.216,918,219.8) | 15,301.2 (10,248.6-20,730.4) | 30,467,127.4 (22,646,256.838,368,319.1) | 17,612.2 (13,053.3-22,254.7) |
| Western Europe | 43,786,887.2 (32,053,444.256,740,605.4) | 14,738 (10,728.1-19,176.9) | 47,048,390.5 (32,651,896.363,495,158.1) | 12,726.5 (8650.2-17,577.4) |
| Western Sub-Saharan Africa | 26,751,581.7 (19,687,26933,700,561.5) | 30,342.3 (22,809.3-37,593.1) | 41,193,762.2 (32,216,310.650,918,502.9) | 18,231.9 (14,405.1-22,294.6) |
disproportionate burden in regions with intermediate development levels.
Geographically, the burden showed marked variation, with South Asia demonstrating the highest regional
The incidence patterns paralleled prevalence distribution in 2021, with Low-middle SDI regions maintaining the highest ASIR among SDI regions at
The disability burden, measured by age-standardized DALY rates, showed similar socioeconomic gradients but with notable temporal changes. In 2021, the highest burden was observed in Low-middle SDI regions at 136 per 100,000 persons (
Comparing 1990 and 2021 data revealed significant improvements in some regions. Low SDI regions demonstrated substantial progress, with age-standardized DALY rates declining from 154.5 per 100,000 persons (95% UI: 59.7-326) in 1990 to 118.8 per 100,000 persons (
National level
Cabo Verde (
The ASIR for periodontal diseases ranged from 261.2 to 2235.9 per 100,000 population. In 2021, Sierra Leone (2235.9 per 100,000 persons; 95% UI: 1447.9-2870.1), Gambia (2170.2 per 100,000 persons; 95% UI: 1346.12854), Ghana ( 2120.2 per 100,000 persons;
Age and sex patterns
only the Low SDI category showed a notable decline in ASPR compared to 1990 levels, while the remaining SDI regions maintained relatively stable rates over this period (Fig. 3). The DALYs patterns showed similar trends to those observed in prevalence (Fig S4). In terms of incidence patterns, the peak age group was
Joinpoint regression analysis
This overall trend can be divided into four distinct phases, each with its own APC indicating the rate of change during that specific period. Initially, from 1990 to 1994, there was a significant decline with an APC of -0.61 (95% UI: – 1.04 to – 0.37), which may correspond
to early implementation of preventive oral health measures in many regions. The period from 1994 to 2006 showed relative stability. Subsequently, from 2006 to 2010, there was a more pronounced decline with an APC of -1.57 (
The 2010-2015 period marked a significant deviation from the previous declining trends, showing a substantial increase with an APC of 2.23 (95% UI: 2.1 to 2.36). This notable reversal coincided with several important developments in periodontal epidemiology and healthcare systems. First, this period followed the 2009-2010 global economic recession, which likely reduced access to preventive dental care in many regions. Second, this timeframe saw the implementation of the 2012 CDCAAP case definitions for population-based surveillance
When analyzed by sociodemographic development level, contrasting patterns emerged. Low-middle SDI and middle SDI regions both exhibited overall increasing trends from 1990 to 2021, with AAPCs of 0.05 (95% UI: 0.04 to 0.06 ) and 0.05 (
slight decline with an AAPC of – 0.05 (
Decomposition analysis
as the predominant driver, accounting for
High-SDI regions showed substantial contributions from both population growth (
Frontier analysis
BAPC model projection
Discussion
The substantial global burden of periodontal diseases, affecting 951.3 million individuals in 2021, represents a significant public health challenge that cannot be ignored. The observed ASPR of 17,011.6 per 100,000 persons indicates that periodontal diseases remain highly prevalent among the working-age population, aligning with previous studies highlighting the pervasive nature of these conditions globally [18]. This burden’s magnitude is particularly concerning given its potential impact on workforce productivity and quality of life [19].
The analysis of temporal trends reveals a modest but steady increase in disease burden from 1990 to 2021, with an AAPC of 0.04 . This persistent upward trend suggests that despite advances in dental care and prevention strategies, the global community has not successfully reduced the burden of periodontal diseases [19]. Tonetti et al. [19] previously highlighted similar concerns regarding the challenging nature of controlling periodontal disease progression at a population level. The increasing trend might be attributed to improved detection and diagnosis, aging populations, and changes in risk factors
Our decomposition analysis reveals that population growth (
The higher burden in Low-middle SDI regions indicates that economic development alone may not guarantee improved oral health outcomes without targeted interventions and policy measure [25]. This observation supports previous findings regarding the need for comprehensive approaches to oral health improvement that address both healthcare access and social determinants of health [26].
Several limitations of this study should be acknowledged. First, like other studies using the GBD database, our analysis was constrained by the limitations inherent to the GBD study methodology. The GBD estimates rely heavily on modeling in regions with limited or no primary data, which may affect the accuracy of estimates in these areas. Second, the cross-sectional nature of many included studies limits our ability to establish causal relationships between observed trends and their potential drivers. Finally, our study did not account for potential variations in disease severity within the
category of severe periodontitis, which could mask important clinical and epidemiological patterns. Future research incorporating more detailed severity classifications could provide better insights for clinical practice and public health planning.
Conclusions
| AAPC | Average Annual Percentage Change |
| ASIR | Age-Standardized Incidence Rate |
| ASPR | Age-Standardized Prevalence Rate |
| BAPC | Bayesian Age-Period-Cohort |
| DALY | Disability-Adjusted Life Year |
| GBD | Global Burden of Disease |
| GHDx | Global Health Data Exchange |
| ICD | International Classification of Diseases |
| INLA | Integrated Nested Laplace Approximation |
| LOESS | Locally Weighted Regression |
| SDI | Socio-Demographic Index |
| UI | Uncertainty Interval |
Supplementary Information
Supplementary Material 4: TableS4: Frontier analysis.
Supplementary Material 5: TableS5: BAPC model projection.
Supplementary Material 6: Fig.S1: The global disease burden of periodontal diseases incidence rate for both sexes in 204 countries and territories.
Supplementary Material 14: Fig.S9: Future forecasts of global DALYs burden of periodontal diseases across age groups.
Acknowledgements
Authors’ contributions
Funding
Data availability
Declarations
Ethics approval and consent to participate
Consent for publication
Competing interests
Author details
Published online: 08 April 2025
References
- Chen MX, Zhong YJ, Dong QQ, Wong HM, Wen YF. Global, regional, and national burden of severe periodontitis, 1990-2019: An analysis of the Global Burden of Disease Study 2019. J Clin Periodontol. 2021;48:116588. https://doi.org/10.1111/jcpe.13506.
- Wu L, Zhang S, Zhao L, Ren Z, Hu C. Global, regional, and national burden of periodontitis from 1990 to 2019: Results from the Global Burden of Disease study 2019. J Periodontol. 2022;93:1445-54. https://doi.org/10. 1002/JPER.21-0469.
- Reynolds I, Duane B. Periodontal disease has an impact on patients’ quality of life. Evid Based Dent. 2018;19:14-5. https://doi.org/10.1038/sj.ebd. 6401287.
- GBD. Diseases and Injuries Collaborators (2024). Global incidence, prevalence, years lived with disability (YLDs), disability-adjusted lifeyears (DALYs), and healthy life expectancy (HALE) for 371 diseases and injuries in 204 countries and territories and 811 subnational locations, 1990-2021: a systematic analysis for the Global Burden of Disease Study 2021. Lancet (London, England). 2021;403:2133-61. https://doi.org/10. 1016/S0140-6736(24)00757-8.
- Li X, Kong X, Yang C, Cheng Z, Lv J, Guo H, et al. Global, regional, and national burden of ischemic stroke, 1990-2021: an analysis of data from the global burden of disease study 2021. Eclinicalmedicine. 2024;75: 102758. https://doi.org/10.1016/j.eclinm.2024.102758.
- GBD. Diseases and Injuries Collaborators (2020). Global burden of 369 diseases and injuries in 204 countries and territories, 1990-2019: a systematic analysis for the Global Burden of Disease Study 2019. Lancet (London, England). 2019;396:1204-22. https://doi.org/10.1016/S0140-6736(20)30925-9.
- GBD. Demographics Collaborators (2020) . Global age-sex-specific fertility, mortality, healthy life expectancy (HALE), and population estimates in 204 countries and territories, 1950-2019: a comprehensive demographic analysis for the Global Burden of Disease Study 2019. Lancet (London, England). 2019;396:1160-203. https://doi.org/10.1016/S0140-6736(20) 30977-6.
- Kim HJ, Fay MP, Feuer EJ, Midthune DN. Permutation tests for joinpoint regression with applications to cancer rates. Stat Med. 2000;19:335-51.
- GBD. Causes of Death Collaborators (2024). Global burden of 288 causes of death and life expectancy decomposition in 204 countries and territories and 811 subnational locations, 1990-2021: a systematic analysis for the Global Burden of Disease Study 2021. Lancet (London, England). 2021;403:2100-32. https://doi.org/10.1016/S0140-6736(24)00367-2.
- Hu J, Ke R, Teixeira W, Dong Y, Ding R, Yang J, et al. Global, Regional, and National Burden of CKD due to Glomerulonephritis from 1990 to 2019: A Systematic Analysis from the Global Burden of Disease Study 2019. Clinical Journal of the American Society of Nephrology : Cjasn. 2023;18:60-71. https://doi.org/10.2215/CJN.0000000000000017.
- Das Gupta P. A general method of decomposing a difference between two rates into several components. Demography. 1978;15:99-112.
- GBD. Neck Pain Collaborators (2024). Global, regional, and national burden of neck pain, 1990-2020, and projections to 2050: a systematic analysis of the Global Burden of Disease Study 2021. The Lancet Rheumatology. 2021;6:e142-55. https://doi.org/10.1016/S2665-9913(23)00321-1.
- Xie Y, Bowe B, Mokdad AH, Xian H, Yan Y, Li T, et al. Analysis of the Global Burden of Disease study highlights the global, regional, and national
trends of chronic kidney disease epidemiology from 1990 to 2016. Kidney Int. 2018;94:567-81. https://doi.org/10.1016/j.kint.2018.04.011. - Knoll M, Furkel J, Debus J, Abdollahi A, Karch A, Stock C. An R package for an integrated evaluation of statistical approaches to cancer incidence projection. BMC Med Res Methodol. 2020;20:257. https://doi.org/10. 1186/s12874-020-01133-5.
- GBD. Risk Factors Collaborators (2020). Global burden of 87 risk factors in 204 countries and territories, 1990-2019: a systematic analysis for the Global Burden of Disease Study 2019. Lancet (London, England). 2019;396:1223-49. https://doi.org/10.1016/S0140-6736(20)30752-2.
- Kassebaum NJ, Bernabé E, Dahiya M, Bhandari B, Murray CJL, Marcenes W. Global burden of severe periodontitis in 1990-2010: a systematic review and meta-regression. J Dent Res. 2014;93:1045-53. https://doi.org/10. 1177/0022034514552491.
- Dai X, Tao Y, Zhou J, Zhou Y, Liang S, Ma X. Global burden and trends of severe periodontitis among women of childbearing age, 1990-2021. J Periodontol. 2025. https://doi.org/10.1002/JPER.24-0615.
- Jin LJ, Lamster IB, Greenspan JS, Pitts NB, Scully C, Warnakulasuriya S. Global burden of oral diseases: emerging concepts, management and interplay with systemic health. Oral Dis. 2016;22:609-19. https://doi.org/ 10.1111/odi. 12428.
- Tonetti MS, Jepsen S, Jin L, Otomo-Corgel J. Impact of the global burden of periodontal diseases on health, nutrition and wellbeing of mankind:
call for global action. J Clin Periodontol. 2017;44:456-62. https://doi.org/ 10.1111/jcpe.12732. - Nazir M, Al-Ansari A, Al-Khalifa K, Alhareky M, Gaffar B, Almas K. Global Prevalence of Periodontal Disease and Lack of Its Surveillance. TheScientificWorldJOURNAL. 2020;2020:2146160. https://doi.org/10.1155/2020/ 2146160.
- Peres MA, Macpherson LMD, Weyant RJ, Daly B, Venturelli R, Mathur MR, et al. Oral diseases: a global public health challenge. Lancet (London, England). 2019;394:249-60. https://doi.org/10.1016/S0140-6736(19) 31146-8.
- Kassebaum NJ, Bertozzi-Villa A, Coggeshall MS, Shackelford KA, Steiner C, Heuton KR, et al. Global, regional, and national levels and causes of maternal mortality during 1990-2013: a systematic analysis for the Global Burden of Disease Study 2013. Lancet (London, England). 2014;384:9801004. https://doi.org/10.1016/S0140-6736(14)60696-6.
- Elani HW, Harper S, Thomson WM, Espinoza IL, Mejia GC, Ju X, et al. Social inequalities in tooth loss: A multinational comparison. Commun Dent Oral Epidemiol. 2017;45:266-74. https://doi.org/10.1111/cdoe.12285.
- Thomson WM. Social inequality in oral health. Commun Dent Oral Epidemiol. 2012;40(Suppl 2):28-32. https://doi.org/10.1111/j.1600-0528.2012. 00716.x.
- Frencken JE, Sharma P, Stenhouse L, Green D, Laverty D, Dietrich T. Global epidemiology of dental caries and severe periodontitis – a comprehensive review. J Clin Periodontol. 2017;44(Suppl 18):S94-105. https://doi. org/10.1111/jcpe.12677.
- Watt RG, Daly B, Allison P, Macpherson LMD, Venturelli R, Listl S, et al. Ending the neglect of global oral health: time for radical action. Lancet (London, England). 2019;394:261-72. https://doi.org/10.1016/S0140-6736(19)31133-X.
Publisher’s Note
Haojie Fu and Xinyu Li co-first author.
*Correspondence:
Ruhong Zhang
zhangruhong@163.com
Jiaxue Zhu
zhuxile521@163.com
Xudong Wang
xudongwang70@hotmail.com