DOI: https://doi.org/10.1186/s12888-025-06932-y
PMID: https://pubmed.ncbi.nlm.nih.gov/40375174
تاريخ النشر: 2025-05-15
عبء الاضطرابات النفسية العالمي في 204 دول وأقاليم، 1990–2021: نتائج دراسة العبء العالمي للأمراض 2021
الملخص
خلفية: تعتبر الاضطرابات النفسية واحدة من الأسباب الرئيسية للعبء الصحي العالمي، وقد تفاقمت بسبب ظهور جائحة كوفيد-19 (2019-2021). في هذه الدراسة، نهدف إلى تقديم تقديرات عالمية وإقليمية ووطنية لعبء الاضطرابات النفسية من 1990 إلى 2021، بما في ذلك خلال كوفيد-19. الطرق: جمعنا بيانات من دراسة العبء العالمي للأمراض 2021 (GBD 2021) حول الحدوث، سنوات الحياة المعدلة حسب الإعاقة (DALYs)، معدل الحدوث الموحد حسب العمر (ASIR)، ومعدل DALY الموحد حسب العمر (ASR) لـ 12 اضطراب نفسي من 204 دول ومناطق. تم استخدام مؤشر السوسيوديموغرافي (SDI) لتقييم العلاقة بين عبء الاضطرابات النفسية والمناطق المختلفة. استخدمنا تحليل الانحدار المشترك لتقدير متوسط النسبة المئوية السنوية للتغيير (AAPC). النتائج: في عام 2021، كان هناك 444,397,716 حالة جديدة و155,418,119 DALYs على مستوى العالم من الاضطرابات النفسية. من 1990 إلى 2021، كان هناك اتجاه تصاعدي في كل من ASIR [15.23% (12.97-17.60%)] وASR [17.28% (15.06-19.44%)]. في عام 2021، تم ملاحظة أعلى ASIR في وسط أفريقيا جنوب الصحراء (8706.11)، بينما كان الأدنى في شرق آسيا (3340.99). كانت أستراليا (2787.87) لديها أعلى ASR. على المستوى الوطني، كانت غرينلاند واليونان والولايات المتحدة وأستراليا لديها أعلى ASRs. خلال جائحة كوفيد-19، باستثناء شرق آسيا، أظهر كل من ASIR اتجاهًا تصاعديًا في خمس مناطق SDI ومناطق GBD الأخرى. في عام 2021، كان ASR للإناث أعلى من ذلك للذكور. من بين 12 نوعًا فرعيًا، كان اضطراب الاكتئاب الشديد (557.87) واضطرابات القلق (524.33) لهما أعلى ASR. احتل اضطراب الاكتئاب الشديد المرتبة الأولى في ASR في 13 من 21 منطقة حول العالم. على الرغم من الاتجاه التصاعدي العام في DALYs للاضطرابات النفسية [AAPC:
رقم التجربة السريرية غير قابل للتطبيق.
مقدمة
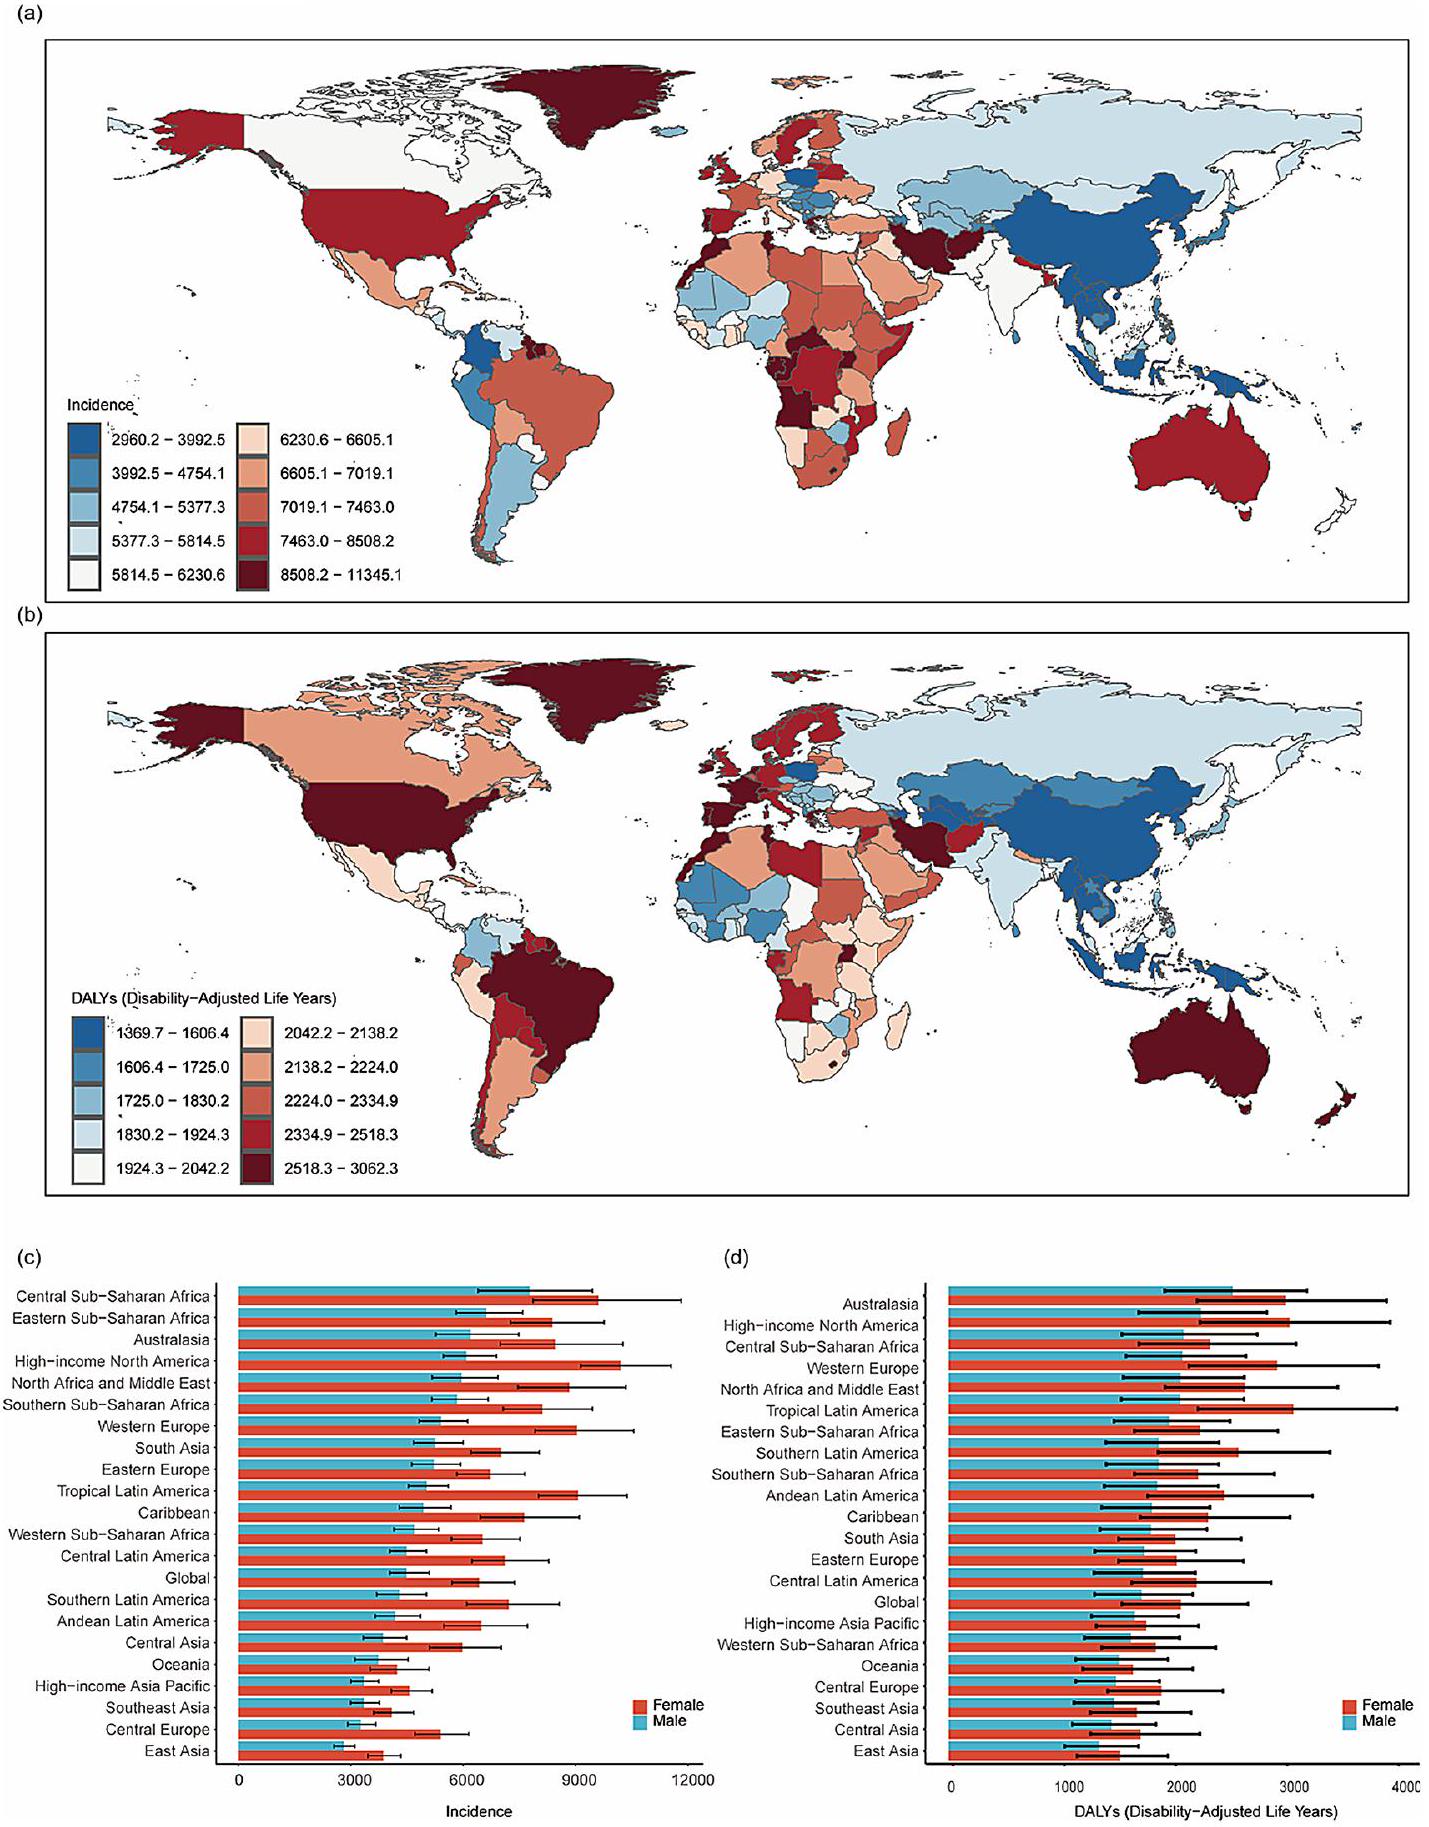
كانت هناك تفاوتات إقليمية كبيرة في حدوث وانتشار الاضطرابات النفسية. في عام 2019، أظهرت أسترالاسيا وأمريكا اللاتينية الاستوائية وأمريكا الشمالية ذات الدخل المرتفع أعلى معدلات انتشار [7]. وفقًا لـ “تقرير الصحة النفسية العالمي” الذي أصدرته منظمة الصحة العالمية (WHO) في عام 2022، عانى 970 مليون شخص حول العالم من الاضطرابات النفسية، مع
على الرغم من أن الدراسات السابقة قد أبلغت عن تقديرات عبء الاضطرابات النفسية، إلا أنها ركزت أكثر على تحليل الأنواع الفرعية من الاضطرابات النفسية، مثل الاكتئاب والقلق، بدلاً من تحليل شامل لعبء 12 اضطرابًا نفسيًا. لقد أدى ظهور جائحة COVID-19 في عام 2019 إلى تدهور في حالة الصحة النفسية. وقد أشارت الدراسات الوبائية إلى أن التأثير النفسي المباشر للجائحة، بالإضافة إلى آثارها طويلة الأمد على الظروف الاقتصادية والاجتماعية للسكان، قد يزيد من انتشار الأمراض النفسية الشائعة. لم تقم الدراسات السابقة بتحليل منهجي لتأثير COVID-19 على الاضطرابات النفسية. تهدف هذه الدراسة إلى تلخيص حدوث الاضطرابات النفسية، وسنوات الحياة المعدلة بالإعاقة، والاتجاهات طويلة الأمد للاضطرابات النفسية في دول مختلفة و
المناطق من 1990 إلى 2021 ومن 2019 إلى 2021، مقسمة حسب الجنس، استنادًا إلى دراسة GBD لعام 2021. سيساعد فهم أنماط العبء الأخيرة في زيادة الوعي العالمي بالاضطرابات النفسية وإبلاغ تصميم استراتيجيات الوقاية والتدخل المستهدفة التي تتناسب مع خصائص المناطق المختلفة.
طرق
نظرة عامة
تقدير سنوات العيش المعدلة حسب الإعاقة (DALYs)
مصدر البيانات
تم استخدامه لتحليل العلاقة المتبادلة بين التنمية الاجتماعية ونتائج صحة السكان [11]. إنه المتوسط الهندسي لمعدل الخصوبة الإجمالي للأشخاص دون سن 25، ومتوسط التحصيل التعليمي للسكان الذين تتراوح أعمارهم بين 15 وما فوق، ومؤشر من 0 إلى 1 لمؤشر الدخل الفردي المتخلف [14]. يتراوح مؤشر التنمية الاجتماعية بين 0 و 1، حيث يشير ارتفاع مؤشر التنمية الاجتماعية إلى تحسين التنمية الاجتماعية والاقتصادية. بناءً على مؤشر التنمية الاجتماعية، يتم تصنيف المناطق إلى خمسة مستويات، بما في ذلك المنخفضة (
تعريف الحالة
التحليل الإحصائي
تم استخدام تحليل الانحدار النقاطية، وهو طريقة إحصائية تُستخدم على نطاق واسع في الدراسات الوبائية، لتحليل التغيرات في الاتجاهات في بيانات السلاسل الزمنية. تحدد هذه الطريقة “نقاط الانضمام” التي تقسم البيانات إلى عدة مقاطع، حيث يظهر كل مقطع تغييرًا سنويًا مئويًا خاصًا به. في هذه الدراسة، قمنا بحساب النسبة المئوية السنوية للتغيير (APC) ومتوسط النسبة المئوية السنوية للتغيير (AAPC) لسنوات الحياة المعدلة حسب الإعاقة (DALYs) للاضطرابات النفسية من 1990 إلى 2021 باستخدام تحليل الانحدار النقاطية، بهدف تحديد الاتجاهات الزمنية في العبء العالمي للاضطرابات النفسية.
الاضطرابات. استخدمنا نموذجًا خطيًا لوغاريتميًا لتحليل معدل التغير السنوي (APC) ومعدل التغير السنوي المعدل (AAPC) في معدل الإصابة (ASR) للاضطرابات النفسية، جنبًا إلى جنب مع فترات الثقة (CI) المقابلة لها بنسبة 95%. تم استخدام طريقة البحث الشبكي لتناسب دالة الانحدار وتحديد عدد وموقع نقاط الانضمام، مع السماح بحد أقصى من 5 نقاط انضمام [19]. يحدد هذا النموذج بشكل احترافي ويصف كميًا نقاط التحول الهامة في بيانات السلاسل الزمنية المتعلقة بتقديرات الاضطرابات النفسية. تقدير APC أو AAPC و
النتائج
العبء العالمي للاضطرابات النفسية
| منطقة العالم | 1990 | 2019 | 2021 | نسبة التغير في ASIR | ||||
| عدد الحالات | ASIR لكل 100,000 | عدد الحالات | ASIR لكل 100,000 | عدد الحالات | ASIR لكل 100,000 | 1990-2021 | 2019-2021 | |
| عالمي | ٢٤١,٣٦٠,٨٩٤ | 4737.97(4278.42,5368.46) | ٣٧٤,٣٤٨,٢٠٥ | 4703.23(4247.84,5334.32) | ٤٤٤,٣٩٧,٧١٦ | 5459.77(4873.72,6241.42) | 15.23(12.97,17.60) | 16.08(14.22,18.00) |
| مؤشر التنمية البشرية المنخفض | ٢٣٧٠٩٠٠٩ | 6143.20(5397.31,7113.59) | ٥٠٦٠٥٠٢٥ | 5861.74(5164.94,6762.84) | ٦٠٣١١٤٠١ | 6514.44(5697.32,7557.96) | 6.04(1.97,9.92) | 11.13(6.80,15.31) |
| مؤشر التنمية البشرية المنخفضة والمتوسطة | ٥٥٣١٠١٨١ | 5665.99(5054.42,6486.09) | ٩٥٢٣٨٨٦٩ | ٥٣٣٠.٢٠(٤٧٥٩.٩٧، ٦٠٨٠.٠٨) | ١١٦,٠٨٦,٩٤٧ | 6216.11(5495.21,7144.06) | 9.71(5.38,14.25) | 16.62(12.05,20.87) |
| مؤشر التنمية البشرية المتوسط | 68,734,614 | 4227.59(3825.97,4770.91) | ١٠٧,٤٢٣,٠٧٤ | 4260.84(3870.13,4789.73) | ١٢٦,٨٣١,٨٣٢ | 4920.13(4442.47,5540.26) | 16.38(14.01,18.91) | 15.47(12.91,18.23) |
| مؤشر التنمية البشرية العالي المتوسط | ٤٨٩٩٥٩٠٢ | 4539.15(4134.81,5057.42) | ٦١٩٦٨٧٨٧ | 4326.48(3937.12,4843.04) | ٧٠١٦٣٠٠٥ | 4917.24(4414.74,5538.76) | 8.32(4.1,12.48) | 13.65(10.03,17.57) |
| مؤشر التنمية البشرية العالي | 44,390,980 | ٤٨٣٥.٣٨(٤٤١٥.٩٣، ٥٣٦٧.٠٤) | 58,825,036 | 5270.11(4760.83,5950.82) | ٧٠٦٥٩٧٦٨ | 6423.82(5760.36,7244.81) | ٣٢.٨٥(٢٨.٣٩، ٣٧.٩٨) | 21.89(18.63,25.34) |
| أمريكا اللاتينية الأنديزية | 1,464,494 | 4243.82(3782.93,4830.68) | ٢,٦٠٤,٦٧٧ | 4070.36(3639.89,4687.07) | ٣,٥٨٣,٢٨٠ | 5347.37(4595.75,6241.11) | ٢٦.٠٠(١٣.٩٦، ٤٠.٢٠) | 31.37(18.58,45.39) |
| أسترالاسيا | 1,418,295 | 6766.65(6089.73,7556.67) | ٢,٠١٩,٣٤٢ | 6827.27(6066.05,7815.30) | ٢,٢٣١,٨٨٧ | 7325.01(6147.35,8863.53) | 8.25(-7.22,26.30) | 7.29(-7.81,24.20) |
| الكاريبي | 1,948,481 | 5803.64(5154.29,6668.33) | ٢,٥٨٤,٧٦٦ | 5297.02(4665.54,6132.14) | ٣,١٢٢,٩٢٩ | 6307.79(5409.94,7386.54) | 8.68(0.29,18.08) | 19.08(10.54,29.18) |
| آسيا الوسطى | ٢,٧٤١,٨٤٢ | 4448.91(3934.43,5055.71) | 3,873,032 | 4278.75(3794.93,4893.24) | ٤،٦٨٤،٨٦١ | 4994.54(4299.53,5811.01) | 12.26(3.84,22.01) | 16.72(7.27,26.71) |
| أوروبا الوسطى | ٥٠٤٥٨٨ | ٣٨٠٢.٦٧(٣٤٣٧.١٣،٤٢٧٧.٩٦) | ٤٧٢٨٤٩٤ | ٣٤٧٨.٣٥(٣١٤٢.٧٤، ٣٩١٣.٢٣) | ٥٧١٢٤٧٠ | 4364.02(3862.89,4955.29) | 14.76(8.98,20.94) | 25.46(19.97,32.21) |
| أمريكا اللاتينية الوسطى | ٦,٤٣٧,٦٧٥ | 4458.02(4017.97,5047.77) | 12,460,247 | ٤٨٥٤.٣٧(٤٣٧٥.٣٨، ٥٤٧٨.٦٤) | 15,343,630 | 5849.19(5223.78,6692.60) | 31.21(25.97,36.95) | 20.49(15.88,25.13) |
| وسط أفريقيا جنوب الصحراء | 3,527,046 | 8271.15(7096.42,9844.93) | ٨,٣٧٤,٦١٤ | 8023.19(6936.78,9482.64) | 9,791,079 | 8706.11(7166.05,10620.38) | 5.25(-6.92,20.21) | 8.51(-4.18,22.48) |
| شرق آسيا | 42,832,652 | 3537.32(3214.57,3939.56) | ٥٥٢٢٤٨٣٦ | ٣٣٤٢.٢٢(٣٠٥٨.٣٨، ٣٦٨٦.٢٥) | ٥٦٣٤٠٥٤٥ | ٣٣٤٠.٩٩(٣٠٢٥.٥٢,٣٧١٢.٣٣) | -5.55(-9.83,-0.99) | -0.04(-3.38,3.83) |
| أوروبا الشرقية | 12,459,215 | 5103.58(4537.33,5713.92) | 11,408,784 | 4720.44(4200.09,5309.38) | ١٤,٠٢٣,٧٩٤ | 6014.06(5286.17,6838.01) | 17.84(12.25,24.82) | 27.40(21.45,34.99) |
| شرق أفريقيا جنوب الصحراء | ٩,٦٥٥,٧٢١ | 7014.94(6190.74,8082.61) | ٢٠٧٥٩١٥٣ | 6673.86(5917.56,7655.79) | ٢٥,٣٧٢,٩٣٣ | 7528.26(6567.61,8690.75) | 7.31(1.96,13.44) | 12.80(6.73,18.94) |
| آسيا والمحيط الهادئ ذات الدخل المرتفع | ٥,٩٢٤,٠٢٧ | 3276.75(2999.91,3622.88) | ٦٤٦٥٤٢٠ | ٣٣٧٧.٠٩(٣٠٩٥.٧٦، ٣٧٤٥.٧٦) | ٧,٣٥٠,٠٠٥ | 3950.35(3551.76,4462.44) | 20.55(14.32,27.21) | 16.97(11.27,23.02) |
| أمريكا الشمالية ذات الدخل المرتفع | 15,096,975 | 5205.05(4701.26,5826.75) | ٢٣٤٥١٤٥٤ | 6417.86(5818.29,7228.01) | ٢٩,٥٢٨,٩٧٣ | 8145.60(7295.06,9182.34) | ٥٦.٤٩(٥٠.٠٤، ٦٣.٠٧) | ٢٦.٩٢(٢٢.٣٤، ٣٢.٢٨) |
| شمال أفريقيا والشرق الأوسط | 19,331,360 | 6334.31(5557.62,7364.13) | ٣٨٧١٧٧٦٨ | 6400.93(5545.95,7463.87) | ٤٦٢٤٢٨١٠ | 7336.22(6303.06,8574.72) | 15.81(10.24,21.48) | 14.61(9.56,20.12) |
| أوقيانوسيا | ٢٢٨,٣٢٢ | ٣٧٧٤.٨٩(٣٣١٨.٠٠، ٤٣٧٨.٠٠) | ٤٦٤,٤٥٠ | 3692.82(3252.82,4283.07) | ٥٢٧,٨٦٤ | 3981.68(3330.94,4801.24) | 5.47(-7.42,20.21) | 7.82(-5.91,23.24) |
| جنوب آسيا | 52,393,027 | 5730.80(5137.66,6540.88) | 91,516,789 | 5207.73(4654.64,5906.19) | ١١٢,٨٩٣,١٨٤ | 6134.14(5462.68,7015.18) | 7.03(3.11,11.72) | 17.78(13.41,22.41) |
| جنوب شرق آسيا | 14,009,335 | 3167.44(2844.43,3579.11) | 21,721,272 | 3104.21(2785.32,3485.37) | ٢٦٧٦٤٦٢٢ | ٣٧٢٠.٣٠(٣٣١١.٠٨، ٤٢١٦.٦٥) | 17.45(13.45,22.26) | 19.84(15.48,24.81) |
| أمريكا اللاتينية الجنوبية | ٢٤٦٣٤٠٧ | 4980.19(4497.42,5639.55) | ٣,٢٠٧,٧٢٦ | ٤٦٦٢.٧٤(٤٢٢٩.٦٣، ٥٢٣٩.٨٨) | ٤٠١٨٢٣٧ | 5775.16(4900.07,6788.32) | 15.96(2.41,29.82) | 23.85(10.52,37.83) |
| جنوب الصحراء الكبرى الأفريقية | ٢,٥٢٤,٥٦٣ | 5700.30(5128.44,6492.29) | ٤,٢٧٣,٣٤١ | 5686.72(5105.84,6454.32) | ٥,٥٣١,٢٤٥ | 7052.85(6182.21,8128.01) | ٢٣.٧٢(١٦.٥٢، ٣٢.٠١) | ٢٤.٠٢(١٦.٦٩، ٣٢.١١) |
| أمريكا اللاتينية الاستوائية | 8,655,965 | 6083.62(5503.83,6856.24) | 13,484,023 | 5692.05(5193.08,6297.35) | 17,191,337 | 7097.75(6342.27,8053.77) | 16.67(10.49,23.24) | ٢٤.٦٩(١٧.٦٤، ٣٢.٠٢) |
| أوروبا الغربية | ٢٤,٩٤١,٤٧٤ | 6120.52(5603.73,6762.26) | 27,848,760 | 5984.89(5352.55,6812.56) | ٣٢,٦٤٩,٤٩٠ | 7218.40(6356.58,8319.83) | 17.94(11.02,25.75) | 20.61(14.83,26.97) |
| غرب أفريقيا جنوب الصحراء | 8,261,430 | 5614.08(4983.27,6430.13) | 19,159,258 | 5405.37(4793.92,6170.41) | ٢١٤٩٢٥٤٢ | 5657.36(4960.75,6496.80) | 0.77(-3.21,4.65) | 4.66(0.46,8.60) |
العبء العالمي لـ
2021. كما هو موضح، فإن اضطراب الاكتئاب الشديد (75.72%) شكل أعلى نسبة من معدل الإصابة القياسي العالمي، يليه اضطرابات القلق.
اتجاهات عبء الأمراض النفسية في المناطق ذات مستويات SDI المختلفة من 1990 إلى 2021
حدوث الاضطرابات النفسية وDALYs بالنسبة لمؤشر التنمية الاجتماعية
| منطقة العالم | 1990 | 2019 | ٢٠٢١ | نسبة التغير في ASR | ||||
| عدد سنوات الحياة المعدلة حسب الإعاقة (DALYs) | نسبة ASR لكل 100,000 | عدد سنوات العيش المعدلة حسب الإعاقة (DALYs) | نسبة ASR لكل 100,000 | عدد سنوات العمر المعدلة حسب الإعاقة (DALYs) | نسبة ASR لكل 100,000 | 1990-2021 | 2019-2021 | |
| عالمي | 89,567,099 | 1745.15(1314.32,2214.47) | ١٣٨,٤٥٣,٢١١ | 1738.12(1308.29,2210.63) | ١٥٥,٤١٨,١١٩ | 1909.14(1440.15,2437.87) | 17.28(15.06,19.44) | 10.18(8.83,11.46) |
| مؤشر التنمية البشرية المنخفض | 7,645,112 | 1861.88(1395.11,2401.28) | 16,805,739 | ١٨٣٦.٨٨(١٣٧٣.٠٣، ٢٣٥٩.٩٥) | 19,117,472 | 1964.32(1463.82,2530.28) | 12.19(9.67,14.70) | 8.61(6.22,10.99) |
| مؤشر التنمية البشرية المنخفضة والمتوسطة | 18,719,851 | 1838.15(1375.03,2356.10) | ٣٢٧٤٨٧٩٥ | 1791.40(1342.03,2288.04) | ٣٧,٣٥٢,٨٤٦ | 1968.25(1480.56,2533.15) | ٢٠.٦٣(١٦.٦٩، ٢٤.٣٨) | 11.45(9.02,13.92) |
| مؤشر التنمية المستدامة المتوسط | ٢٦٧٠٠٠٠٥٢ | 1627.38(1225.92,2063.50) | 41,930,138 | 1650.13(1242.47,2095.44) | ٤٧٠٦٧٨٥٧ | 1816.49(1369.70,2310.33) | ٢٤.٠٤(٢٠.٥١،٢٧.١٤) | 10.52(8.82,12.12) |
| مؤشر التنمية البشرية العالي المتوسط | 18,211,389 | 1671.33(1260.67,2122.96) | ٢٣,٥٢١,٩٢٦ | 1648.84(1243.62,2094.28) | ٢٥٧٦٤٠٩٥ | 1806.88(1364.02,2290.90) | 15.38(12.41,18.88) | 8.95(6.72,11.22) |
| مؤشر التنمية البشرية العالي | 18,207,905 | 1956.55(1480.64,2473.36) | ٢٣٣٣٦٨٦٥ | 2027.55(1534.76,2566.03) | 18,207,905 | 2276.02(1710.69,2886.64) | 14.76(12.12,17.47) | 10.68(8.72,12.74) |
| أمريكا اللاتينية الأنديزية | 630,276 | 1828.65(1375.57,2339.06) | 1,181,926 | 1825.23(1364.44,2329.47) | 1,470,468 | 2175.32(1597.74,2830.02) | ٣٤.٠٣(٢٤.٥٦، ٤٤.٩٩) | 20.22(12.18,29.89) |
| أسترالاسيا | ٥٥٤,٩٩٤ | 2609.71(1950.75,3349.12) | ٨٢١,٤٢٩ | 2681.89(2016.93,3442.45) | ٨٨٠,٨٤٦ | 2787.87(2088.14,3552.40) | 3.94(-3.77,12.67) | 3.66(-4.17,12.36) |
| الكاريبي | ٦٥٦,٣٠٦ | 1934.62(1436.83,2484.77) | ٩١٠,٣١٢ | 1866.16(1394.07,2396.41) | 1,029,437 | ٢٠٨٢.١٢(١٥٤٨.٠٢، ٢٧١٥.٦٢) | 16.64(11.02,22.65) | 11.73(6.77,17.25) |
| آسيا الوسطى | 944,337 | 1484.65(1119.71,1902.71) | 1,364,944 | ١٤٦٦.٣٠(١١٠٤.٣٤، ١٨٧١.٧٣) | 1,535,702 | 1603.18(1206.41,2060.86) | 17.65(12.36,23.52) | 9.53(4.69,14.12) |
| أوروبا الوسطى | 2,017,814 | 1528.92(1169.19,1927.43) | 1,960,653 | 1498.25(1142.11,1886.92) | 2,182,318 | 1712.83(1297.62,2176.20) | 17.37(13.86,21.27) | 12.38(9.10,15.68) |
| أمريكا الوسطى | ٢٤٨٠٠٥٤ | 1673.34(1263.96,2140.13) | ٤,٥٨٦,٢٨٨ | 1774.05(1330.82,2273.49) | ٥٢٤٧٧١١ | 1993.08(1480.80,2558.59) | ٣٧.٥٠(٣٢.١٠، ٤٣.٣٦) | ١٣.٤٧(١٠.٣١، ١٦.٩٩) |
| وسط أفريقيا جنوب الصحراء | 942,596 | 2118.47(1564.97,2752.91) | ٢,٣٠٨,٨٩٩ | 2110.82(1586.14,2739.58) | ٢,٦١٦,٨٠١ | ٢٢٣٣.٦٣(١٦٤٧.٦٩، ٢٩٥٠.٠٣) | 11.43(4.03,20.17) | 7.74(0.84,15.78) |
| شرق آسيا | 17,695,222 | 1450.67(1095.61,1834.85) | ٢٢,٩٠٩,٨٧٣ | ١٣٩٨.١٣(١٠٥٨.٦٨، ١٧٧٠.٢١) | ٢٤٠٢٩١٢٨ | ١٤٤٧٫٢٨(١١٠٣٫٨٣، ١٨٢٥٫٠١) | 12.25(7.75,17.14) | 4.28(2.17,6.68) |
| أوروبا الشرقية | ٤٠١٩٨١١ | 1668.96(1248.15,2119.26) | 3,814,348 | 1635.43(1221.57,2074.01) | ٤٣٤٠٥٩٣ | 1910.06(1423.91,2436.16) | 18.28(14.90,22.57) | 14.99(11.59,18.97) |
| شرق أفريقيا جنوب الصحراء | ٢,٩٦٢,٩٥٧ | 1990.29(1482.98,2575.21) | ٦,٦١٢,٠٩٦ | 1960.51(1459.54,2525.98) | 7,679,754 | 2126.41(1586.72,2744.99) | 16.08(12.69,19.63) | 10.92(7.74,14.03) |
| آسيا والمحيط الهادئ ذات الدخل المرتفع | ٢,٨٦٣,٦١٩ | 1554.80(1179.04,1932.41) | ٣,٠٦٨,٩٦٦ | 1577.35(1195.17,1960.64) | 3,286,395 | 1721.55(1305.43,2154.41) | 7.30(4.40,10.75) | 7.62(5.07,10.94) |
| أمريكا الشمالية ذات الدخل المرتفع | ٦,٣٨٧,٨١٢ | 2152.02(1621.42,2726.69) | 8,831,876 | 2319.04(1737.27,2926.87) | 10,106,541 | 2662.06(1977.68,3399.24) | 20.28(16.69,24.24) | ١٣.٤١(١٠.٩٠، ١٦.٢٩) |
| شمال أفريقيا والشرق الأوسط | 6,564,776 | 2131.18(1595.27,2757.58) | 13,138,710 | 2151.24(1610.31,2784.08) | ١٤,٩٦٠,٢٢٩ | 2359.65(1745.61,3049.99) | ٢٤.٠٧(١٩.٥٦، ٢٨.٧٢) | 10.78(7.56,14.15) |
| أوقيانوسيا | 89,588 | 1522.16(1149.14,1956.12) | 188,766 | 1517.06(1141.30,1932.53) | ٢٠٨,٦٤٨ | ١٥٩١.٩١(١١٧٥.٧١، ٢٠٨٥.٥٥) | 9.53(0.85,18.28) | 5.44(-2.78,13.80) |
| جنوب آسيا | 17,712,064 | 1834.57(1375.65,2335.07) | 31,453,177 | 1749.41(1311.92,2219.26) | ٣٥٩٤٨٥١٤ | 1925.51(1447.69,2471.47) | 20.18(15.72,24.74) | 11.87(9.28,14.47) |
| جنوب شرق آسيا | ٦,٢٤٣,٨٨٦ | 1438.95(1090.28,1812.42) | 10,204,059 | 1434.00(1091.84,1816.59) | ٦,٢٤٣,٨٨٦ | 1588.29(1206.9402022.22) | 23.82(19.67,28.23) | 11.44(8.91,14.39) |
| أمريكا اللاتينية الجنوبية | 993,418 | 2018.97(1526.97,2568.90) | 1,372,829 | 1968.57(1490.93,2510.91) | 1,591,301 | 2249.71(1653.51,2928.35) | 17.22(8.34,26.84) | ١٤.٤٦(٥.٧٥، ٢٥.١٠) |
| جنوب الصحراء الكبرى الأفريقية | ٨٣٣,٠٠٢ | ١٨٠٥.٤٣(١٣٥٣.٣١، ٢٣٠٩.١٤) | 1,394,613 | 1800.76(1349.52,2297.27) | 1,659,944 | ٢٠٧٣.٧٢(١٥٤٨.٨٩، ٢٦٨٦.٣٣) | 30.07(25.12,35.51) | 16.92(12.66,21.36) |
| أمريكا اللاتينية الاستوائية | ٣,٠٨٨,٧٠٤ | 2145.85(1602.80,2762.53) | ٥,٣٩٩,٤٢٨ | ٢٢٥٦.٨٥(١٦٦٥.٩٥، ٢٨٩٥.٩٧) | ٦,٣٣٦,٣٠٣ | 2601.75(1916.60,3349.09) | ٣٧.٥٥(٣١.٣٤،٤٣.٩٢) | 15.41(11.45,19.58) |
| أوروبا الغربية | 9,197,289 | 2243.61(1676.13,2871.42) | 10,401,819 | 2240.86(1676.53,2874.71) | 11,520,860 | 2522.52(1872.21,3250.66) | 10.09(6.27,13.95) | 10.46(7.02,13.94) |
| غرب أفريقيا جنوب الصحراء | ٢,٦٨٨,٥٧٤ | 1709.71(1277.72,2177.53) | ٦,٥٢٨,٢٠٠ | 1703.06(1275.72,2175.80) | 7,189,409 | 1755.29(1304.72,2236.64) | 5.45(3.34,7.40) | ٤.١٦(٢.١٢، ٦.١٤) |
| ٢٠٢١ | 1990-2021 | 2019-2021 | ||||
| عدد سنوات العمر المعدلة حسب الإعاقة (DALYs) | نسبة ASR لكل 100,000 | نسبة التغير في ASR | جمعية المحترفين الأمريكيين في ASR | نسبة التغير في ASR | APC في ASR | |
| الاضطرابات النفسية | ||||||
| إجمالي | ١٥٥,٤١٨,١١٩ | 1909.14(1440.15,2437.87) | 17.28(15.06,19.44) | 5.96(4.99,6.92) | 10.18(8.83,11.46) | 4.80(3.94,5.68) |
| ذكر | ٧٠٣٨١٣٦٥ | 1732.39(1312.80,2189.59) | 15.55(13.18,17.78) | 4.72(4.15,5.29) | 8.37(7.11,9.58) | 3.89(3.17,4.62) |
| أنثى | ٨٥,٠٣٦,٧٥٤ | ٢٠٨٤.١٢(١٥٥٦.٦٧، ٢٦٨٧.٢٩) | 18.68(16.47,20.81) | 7.07(6.18,7.97) | 11.71(10.31,13.17) | 5.61(4.60,6.62) |
| اضطرابات القلق | ||||||
| إجمالي | 42,509,645 | 524.33(363.05,716.25) | 18.16(15.57,20.95) | 2.85(2.53,3.16) | 19.11(16.59,21.48) | 9.30(6.07,12.63) |
| ذكر | ١٦,١١٣,٦٥٧ | 396.91(272.28,547.66) | 18.17(15.38,20.95) | 2.17(1.96,2.37) | 17.82(15.18,20.39) | 8.55(7.20,9.90) |
| أنثى | ٢٦,٣٩٥,٩٨٨ | 652.16(453.44,887.15) | 18.42(15.76,21.32) | 3.58(3.19,3.97) | 19.98(17.45,22.47) | 9.54(8.10,11.00) |
| اضطراب الاكتئاب الشديد | ||||||
| إجمالي | ٤٦,٠١٨,٨٤٤ | ٥٥٧.٨٧(٣٨١.١٩، ٧٦٠.٧٠) | 16.07(13.19,18.96) | 2.60(2.11,3.10) | 18.08(15.86,20.45) | 11.50(5.50,17.85) |
| ذكر | 17,895,583 | 436.59(297.51,595.74) | 19.16(16.46,22.27) | 2.28(1.91,2.66) | 17.82(15.39,20.42) | 6.78(4.89,8.70) |
| أنثى | ٢٨,١٢٣,٢٦١ | 678.54(464.94,923.36) | 14.32(11.21,17.39) | 3.29(2.34,4.23) | 18.36(15.98,20.75) | 8.80(6.515,11.13) |
| الفصام | ||||||
| إجمالي | 14,816,611 | ١٧٧.٧٥(١٣١.٥١، ٢٢٨.٧٩) | 0.64(-0.48,1.71) | 0.04(0.03,0.05) | -0.14(-0.86,0.60) | -0.03(-0.04,-0.01) |
| ذكر | ٧,٨٧٠,٧٨٦ | 188.96(139.92,243.73) | 0.89(-0.43,2.20) | 0.06(0.05,0.07) | -0.10(-1.12,0.89) | -0.03(-0.05,-0.02) |
| أنثى | ٦,٩٤٥,٨٢٥ | ١٦٦.٤٠(١٢٢.٨٠، ٢١٣.٩٢) | 0.46(-0.89,1.81) | 0.03(0.02,0.03) | -0.19(-1.25,0.84) | -0.04(-0.06,-0.03) |
| اضطراب ثنائي القطب | ||||||
| إجمالي | ٨٠٠٧٧٨٣ | ١٦٦.٤٠(١٢٢.٨٠، ٢١٣.٩٢) | 0.29(-1.14,1.65) | 0.00(0.00,0.01) | -0.16(-0.73,0.39) | -0.06(-0.10,-0.02) |
| ذكر | 3,869,179 | 94.16(60.91,135.74) | 2.07(0.43,3.66) | 0.06(0.05,0.07) | -0.02(-0.79,0.77) | 0.02(-0.08,0.11) |
| أنثى | ٤,١٣٨,٦٠٤ | 100.48(65.15,143.98) | -1.29(-2.74,0.10) | -0.04(-0.04,-0.03) | -0.29(-1.12,0.45) | -0.13(-0.20,-0.05) |
| الاكتئاب المزمن | ||||||
| إجمالي | 10,311,517 | 123.27(79.24,174.71) | 2.82(1.16,4.58) | 0.11(0.09,0.12) | 1.81(0.56,2.98) | 0.90(0.64,1.17) |
| ذكر | ٤٣١٥٣٥٦ | ١٠٣.٩١(٦٦.٦٧، ١٤٧.٤٢) | 2.18(-0.10,4.21) | 0.07(0.06,0.08) | 1.77(0.19,3.36) | 0.88(0.59,1.18) |
| أنثى | ٥٩٩٦١٦١ | 142.62(91.89,202.72) | 3.22(1.05,5.45) | 0.14(0.11,0.16) | 1.84(0.10,3.71) | 0.92(0.61,1.23) |
| فقدان الشهية العصبي | ||||||
| إجمالي | 798,443 | 10.31(6.42,16.25) | 5.18(3.05,7.45) | 0.02(0.02,0.02) | -0.85(-2.28,0.80) | -0.43(-0.55,-0.30) |
| ذكر | ٢١٩,٩٧٣ | 5.59(3.35,9.02) | 9.03(5.73,12.45) | 0.02(0.02,0.02) | -0.24(-3.02,2.76) | -0.12(-0.25,0.01) |
| أنثى | 578,470 | 15.18(9.53,23.90) | ٤.١٠(١.٤٧، ٦.٨٥) | 0.02(0.01,0.02) | -1.02(-2.63,0.71) | -0.51(-0.67,-0.35) |
| النهام العصبي | ||||||
| إجمالي | ٢,٦٠٤,٧٠٢ | 33.05(18.64,55.29) | 20.06(18.37,21.94) | 0.18(0.17,0.19) | 0.18(-0.85,1.22) | 0.64(0.60,0.69) |
| ذكر | 1,040,190 | ٢٦.٠١(١٤.٦٨، ٤٣.٢٥) | ٢٤.٦٢(٢١.٩٣٠، ٢٧.٤٨) | 0.17(0.17,0.17) | 0.917(-0.504,2.41) | 0.68(0.63,0.72) |
| أنثى | 1,564,512 | 40.297(22.67,66.23) | 17.32(15.07,19.47) | 0.19(0.18,0.20) | -0.26(-1.53,1.04) | -0.30(-0.82,0.23) |
| اضطرابات طيف التوحد | ||||||
| إجمالي | 11,544,038 | ١٤٧.٥٥(١٠٠.٢١، ٢٠٨.١٥) | 2.11(0.55,3.41) | 0.10(0.09,0.11) | -0.02(-0.75,0.69) | -0.01(-0.06,0.04) |
| ذكر | ٧,٨٩٦,٨٣٨ | 199.80(136.29,281.96) | 1.97(0.08,3.54) | 0.13(0.12,0.14) | -0.09(-1.02,0.81) | -0.03(-0.07,0.00) |
| أنثى | ٣,٦٤٧,٢٠٠ | ٩٤.٤٥(٦٤.٥٥، ١٣٣.٠١٧) | 2.23(0.96,3.69) | 0.07(0.06,0.07) | 0.13(-0.73,1.09) | 0.07(0.04,0.11) |
| اضطراب نقص الانتباه مع فرط النشاط | ||||||
| إجمالي | 1,030,941 | 13.49(7.41,21.89) | -9.68(-11.90,-7.29) | -0.04(-0.05,-0.04) | -0.07(-1.96,1.99) | -0.24(-0.35,-0.13) |
| ذكر | ٧٤٢,٢٦٤ | 19.04(10.44,30.75) | -9.81(-12.51,-6.80) | -0.07(-0.07,-0.06) | 0.06(-2.55,2.68) | -0.19(-0.28,-0.09) |
| أنثى | ٢٨٨,٦٧٨ | 7.69(4.18,12.69) | -9.93(-12.83,-6.63) | -0.03(-0.03,-0.02) | -0.44(-2.87,2.11) | -0.48(-0.51,-0.46) |
| اضطراب السلوك | ||||||
| إجمالي | ٥٠٠٢٦١٤ | 67.68(36.75,105.51) | 3.03(1.42,4.86) | 0.06(0.06,0.07) | -0.11(-0.75,0.54) | 0.00(-0.03,0.03) |
| ذكر | 3,257,831 | ٨٥.٦٠(٤٧.١٦، ١٣٢.٧٧) | 1.79(0.13,3.94) | 0.05(0.04,0.06) | -0.08(-0.92,0.73) | 0.01(-0.01,0.03) |
| أنثى | 1,744,783 | ٤٨.٦٧(٢٦.٠٨، ٧٦.٣١) | 4.74(2.21,6.96) | 0.07(0.07,0.08) | -0.14(-1.19,1.03) | -0.01(-0.04,0.03) |
| الإعاقة الذهنية التنموية مجهولة السبب | ||||||
| إجمالي | 3,810,635 | 49.92(23.17,85.33) | -13.67(-17.95,-8.41) | -0.24(-0.25,-0.23) | 0.12(-0.79,1.14) | 0.06(-0.27,0.39) |
| 2021 | 1990-2021 | 2019-2021 | ||||
| عدد سنوات الحياة المعدلة حسب الإعاقة (DALYs) | نسبة ASR لكل 100,000 | نسبة التغير في ASR | جمعية المحترفين الأمريكيين في ASR | نسبة التغير في ASR | APC في ASR | |
| ذكر | 1,872,569 | ٤٨.٣٢(٢٠.٧٧،٨٤.٥٨) | -16.91(-21.73,-12.51) | -0.31(-0.32,-0.30) | -0.05(-1.27,1.29) | -0.03(-0.45,0.41) |
| أنثى | 1,938,066 | 51.52(25.49,85.54) | -10.35(-14.58,-4.28) | -0.19(-0.20,-0.18) | 0.28(-0.97,1.37) | -0.78(-0.82,-0.72) |
| اضطرابات نفسية أخرى | ||||||
| إجمالي | 8,962,344 | 106.59(68.18,160.68) | -0.34(-1.06,0.33) | -0.01(-0.01,-0.01) | -0.22(-0.72,0.24) | -0.11 (-0.13,-0.10) |
| ذكر | ٥,٢٨٧,١٣٧ | 127.47(81.99,191.81) | -0.52(-1.37,0.23) | -0.02(-0.03,-0.02) | -0.19(-0.81,0.39) | -0.10(-0.11,-0.09) |
| أنثى | 3,675,207 | ٨٦.٠٨(٥٥.٨٦، ١٢٧.٩٠) | -0.16(-0.99,0.72) | -0.01(-0.01,-0.01) | -0.28(-1.04,0.38) | -0.14(-0.17,-0.11) |
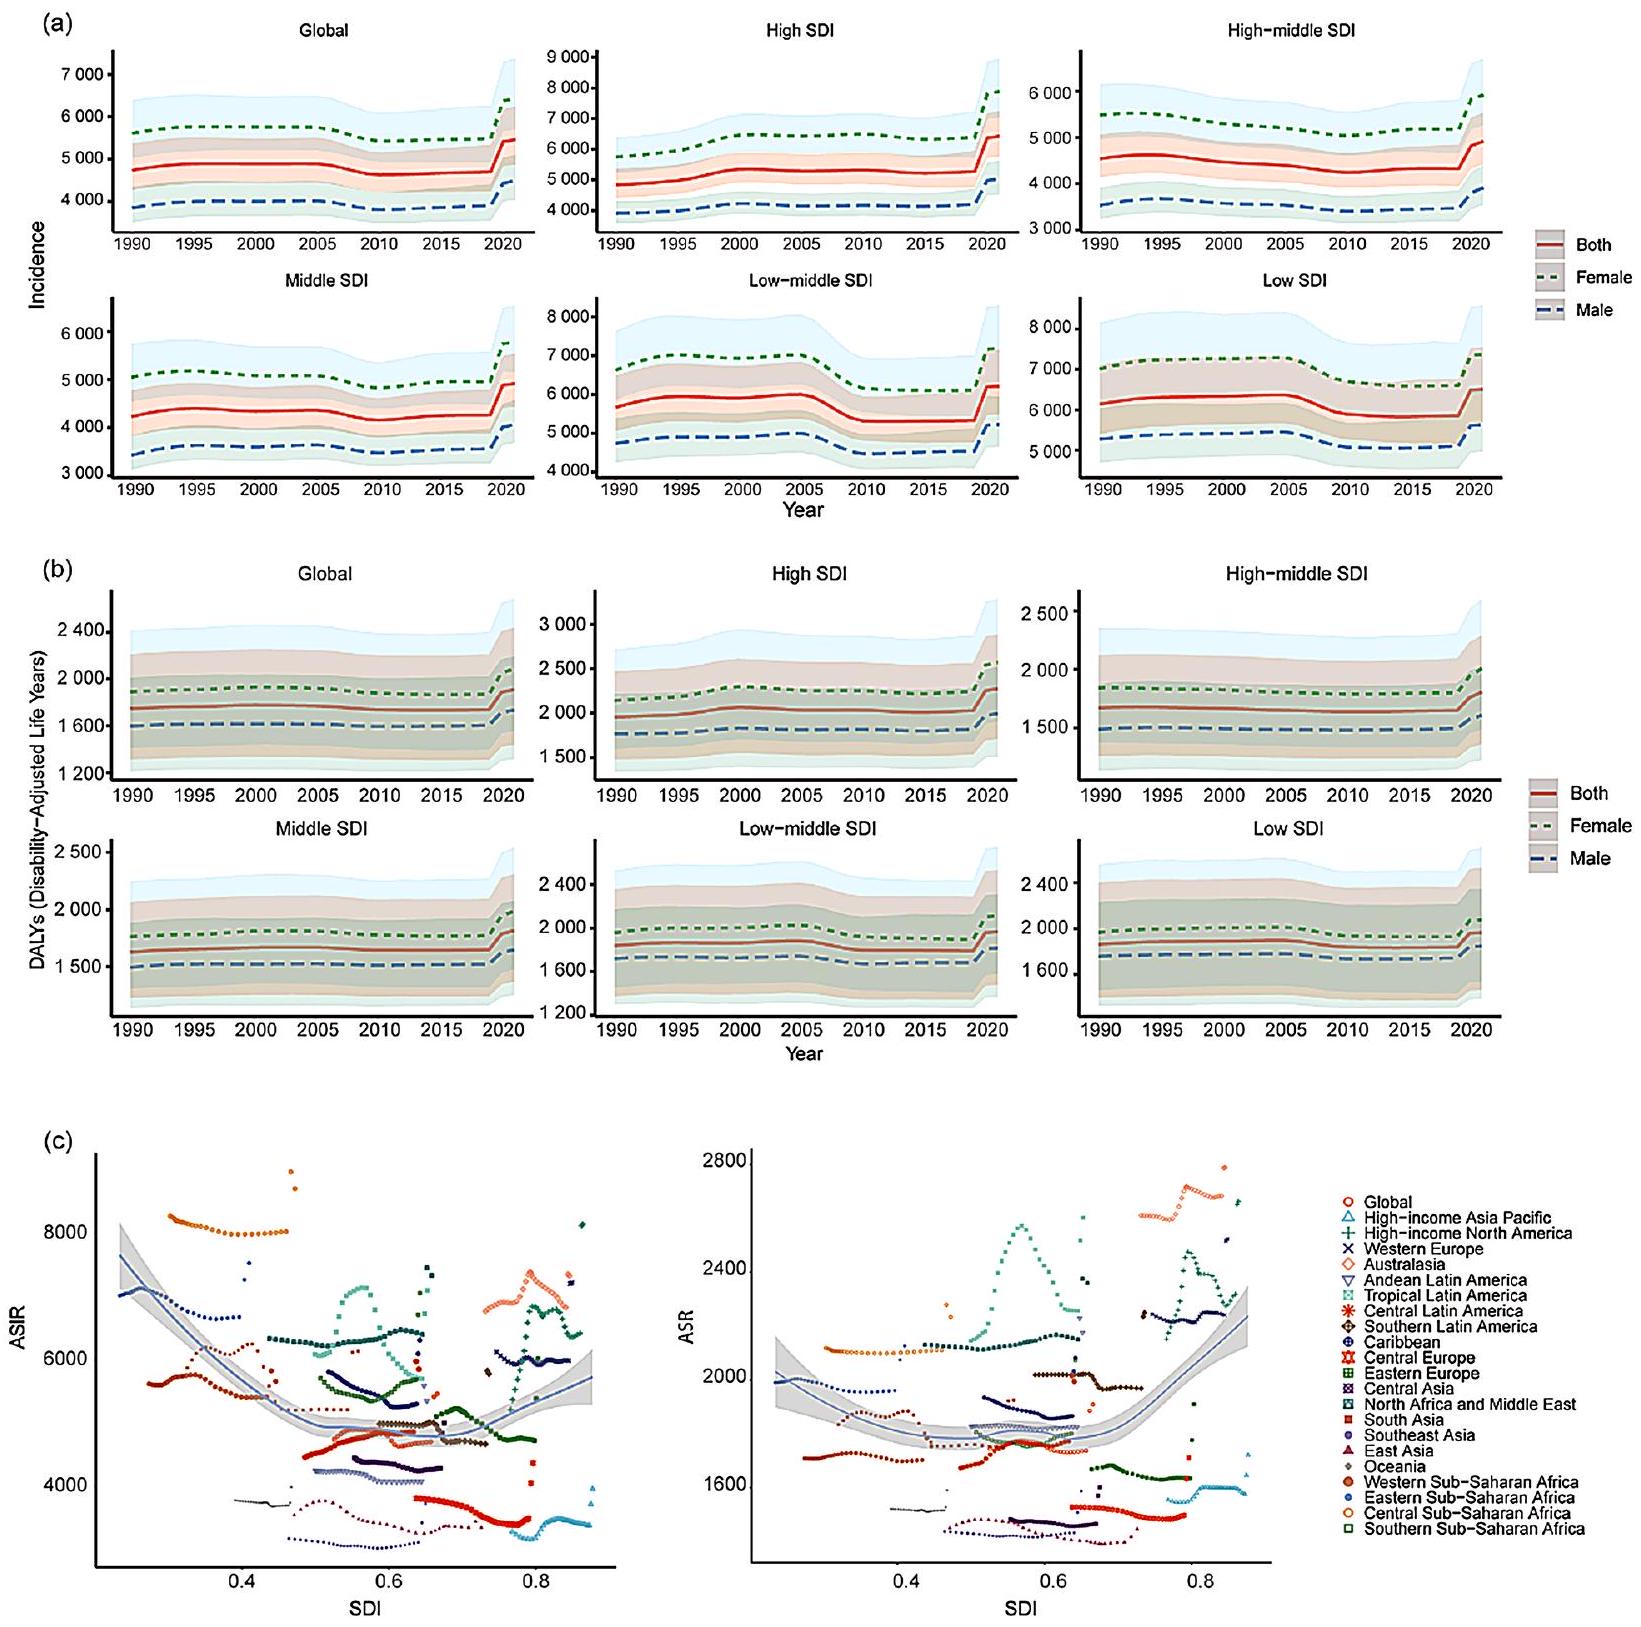
معدلات، بينما كانت أخرى أعلى بكثير من المستويات المتوقعة ولكن مع معدلات موحدة العمر متقلبة أو متناقصة. على الرغم من أن أوروبا الشرقية، وشمال أمريكا ذات الدخل المرتفع، وأستراليا أظهرت اتجاهًا هبوطيًا في المعدل الموحد للعمر، إلا أنها لا تزال أعلى من المتوقع. ومن الجدير بالذكر أن كل من معدل الإصابة الموحد للعمر والمعدل الموحد للعمر أظهرا زيادة حادة في جميع المناطق من 2019 إلى 2021 (الشكل 3ج).
نقاش
كان عبء المرض ثقيلًا بشكل ملحوظ في معظم المناطق. أشارت نتائج بحثنا إلى أن المعدل الموحد للعمر للاضطرابات النفسية كان الأعلى في البلدان ذات مؤشر التنمية البشرية المرتفع والأدنى في أجزاء من أفريقيا جنوب الصحراء وآسيا، بما يتماشى مع
الدراسات السابقة [26]. يُعزى العبء المتزايد للصحة النفسية بشكل أساسي إلى النمو السكاني والشيخوخة، بدلاً من زيادة انتشار المرض [27]. بالإضافة إلى ذلك، كانت أفريقيا جنوب الصحراء وأجزاء من آسيا لديها أقل تغطية للبيانات الوبائية، وبالتالي هناك مزيد من عدم اليقين حول التقديرات [7]. على الرغم من أن معدل الإصابة الموحد للعمر للاضطرابات النفسية كان في ارتفاع في معظم المناطق، إلا أن معدل الإصابة بالاضطرابات النفسية في شرق آسيا استمر في الانخفاض.
على الصعيد الوطني، وجدت دراستنا أن الدول التي لديها أعلى معدلات DALYs للاضطرابات النفسية كانت غرينلاند، واليونان، والولايات المتحدة، وأستراليا؛ وهو ما يتماشى مع نتائج الأبحاث السابقة [7]. واحدة من الدول ذات أدنى معدل إصابة كانت الصين. قد تكمن الأسباب المحتملة في الجوانب التالية: (1) تأتي بيانات معدل الإصابة بالاضطرابات النفسية في الصين بشكل أساسي من مسوحات خدمات الصحة الوطنية، ورصد الأمراض، والأدبيات المنشورة. ومع ذلك، قد توجد أخطاء منهجية في طرق جمع البيانات. على سبيل المثال، بينما تعتبر طريقة أخذ العينات العنقودية متعددة المراحل المستخدمة في المسوحات الوبائية واسعة النطاق في الصين، مثل مسح الصحة النفسية في الصين 2019، تمثيلية، قد تؤدي طريقة المسح المنزلي إلى تغطية غير كافية للسكان من العمال المهاجرين ذوي الحركة العالية والسكان الريفيين النائيين [28، 29]. (2) على الرغم من زيادة الوعي بقضايا الصحة النفسية بين الجمهور الصيني في السنوات الأخيرة، لا يزال القبول غير كافٍ مقارنة بالدول الأخرى. تشير الأبحاث الحالية إلى أن هذه الفجوة قد تنبع من عوامل ثقافية متجذرة [30، 31]. باعتبارها جوهر الثقافة الصينية التقليدية، تعطي الكونفوشيوسية أهمية أكبر للتناغم الاجتماعي بدلاً من الحالات النفسية الفردية. وقد أدى تركيزها القوي على ضبط النفس من خلال الالتزام بالمعايير الاجتماعية إلى جعل العديد من الصينيين يدمجون مشكلاتهم النفسية بدلاً من السعي للحصول على المساعدة المهنية [32]. علاوة على ذلك، غالبًا ما تُعتبر الأمراض النفسية “عيوبًا في الشخصية” بدلاً من مشاكل طبية، وفي العديد من الحالات، تُعتبر حتى غير مقبولة أخلاقيًا. تعقد هذه النظرة التشخيص الدقيق والعلاج الفوري للأمراض النفسية [33].
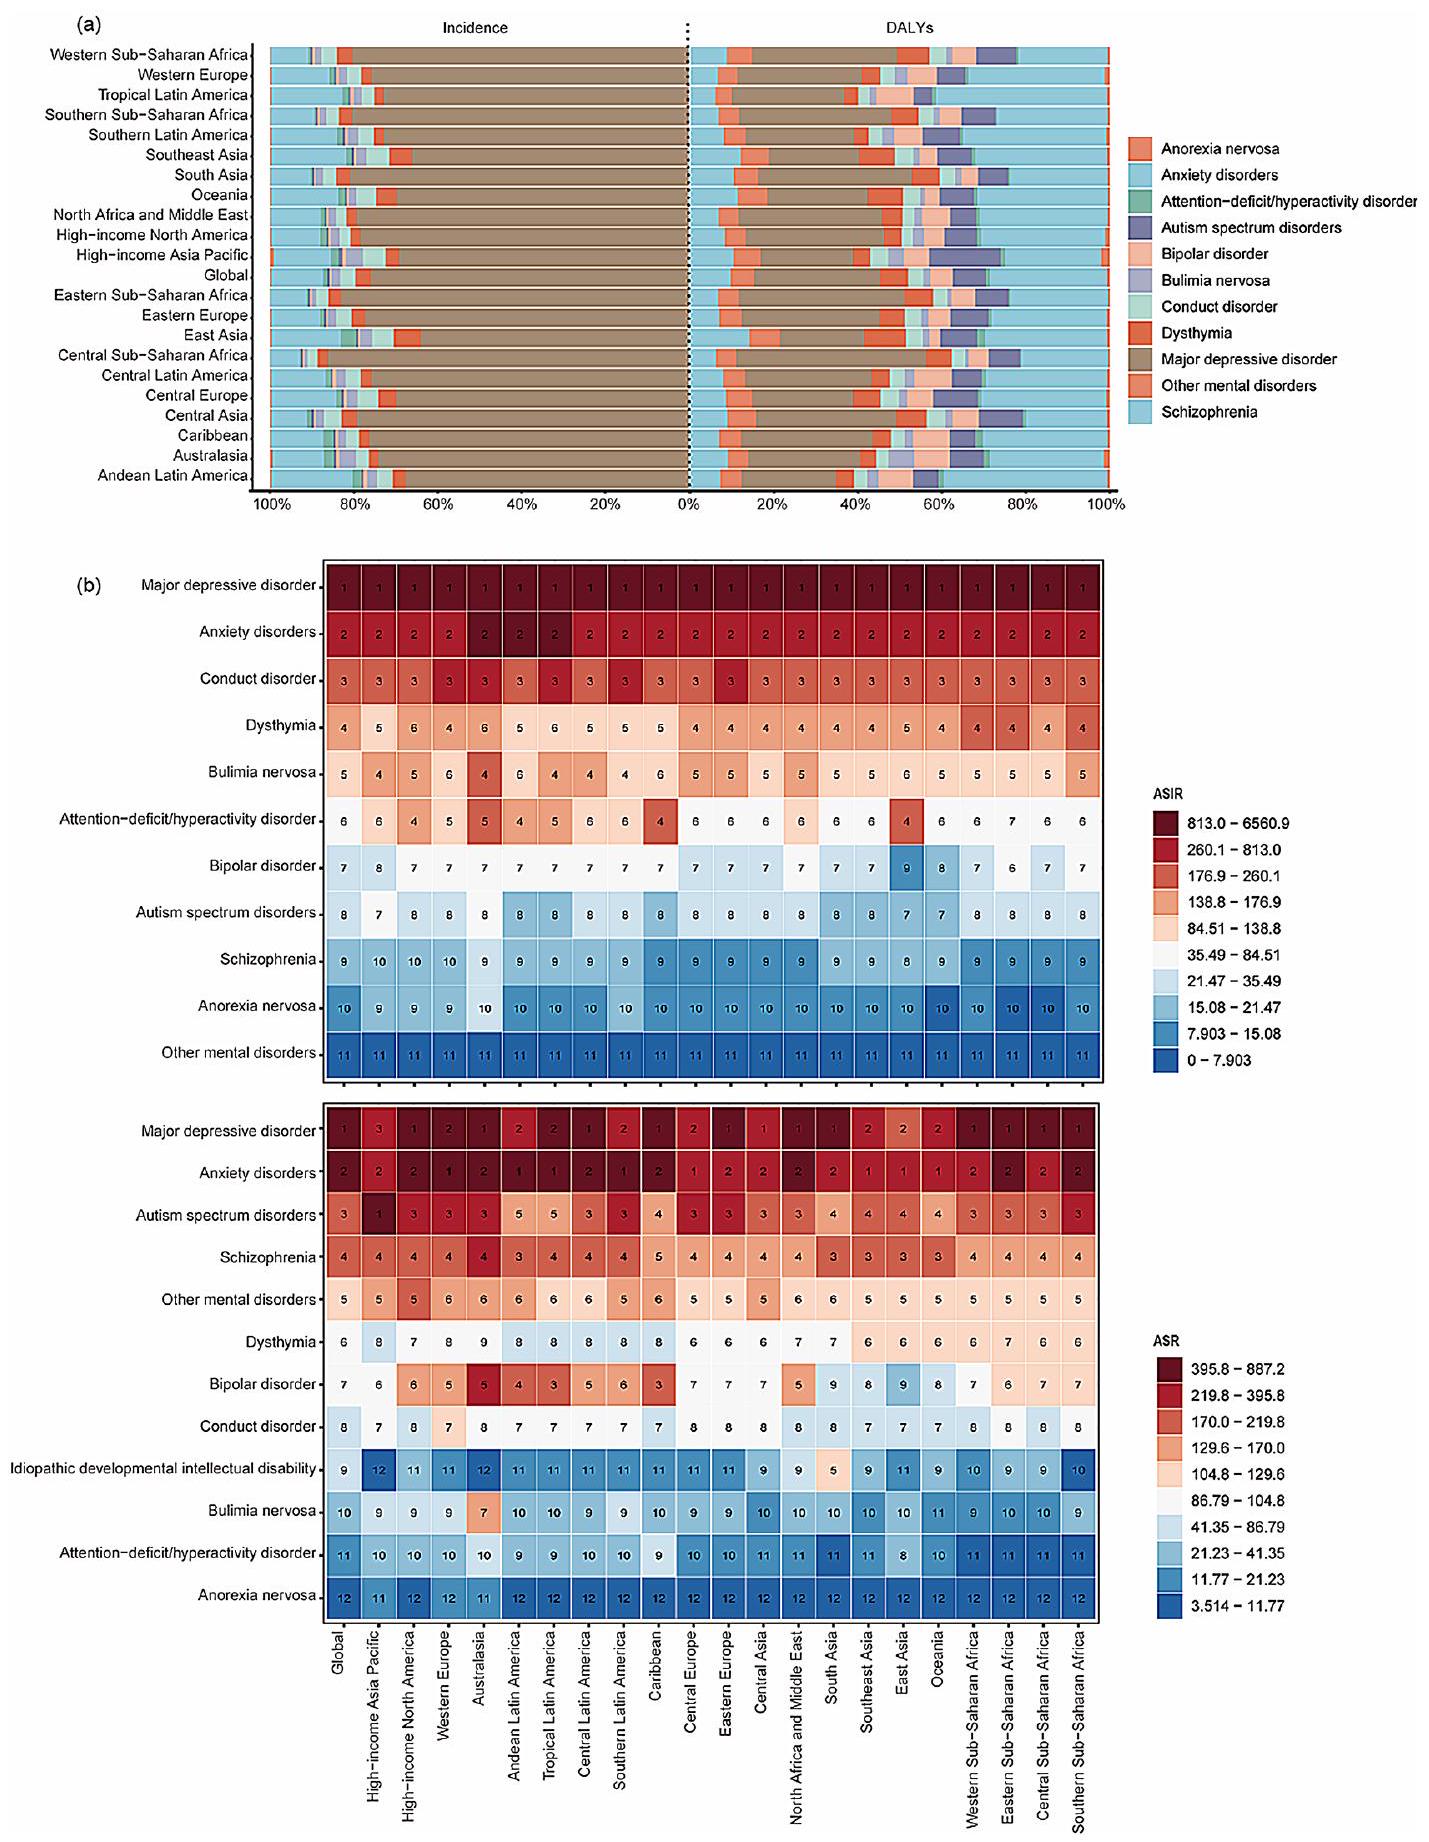
مع دراسات أخرى [6، 34]. كانت الإناث لديهن DALYs أعلى لاضطرابات القلق، والاضطراب الاكتئابي الكبير، والاضطراب ثنائي القطب، والديسثيميا، وفقدان الشهية العصبي، والشره المرضي العصبي، والإعاقة الذهنية التنموية مجهولة السبب مقارنة بالذكور. على الرغم من العبء الأعلى للاضطرابات النفسية بين الإناث، إلا أن معدل DALYs للعديد من
مما يؤدي في بعض الحالات إلى الطلاق واستبعاد الأسرة [36]. يمكن أن يكون الأشخاص الذين يعيشون مع فيروس نقص المناعة البشرية مكتئبين لأسباب عديدة، مثل الانزعاج الجسدي، وتقدم المرض، والخوف من الموت. من ناحية أخرى، تعاني شمال أمريكا ذات الدخل المرتفع من مستويات أعلى من الضغط الاجتماعي. وقد وجدت الدراسات أن الضغط الاجتماعي هو عامل خطر معترف به للاكتئاب [37].
في هذه الدراسة، قدرنا زيادة مستمرة كبيرة في عبء الاضطراب الاكتئابي الكبير واضطرابات القلق بعد جائحة COVID-19،
والتي قد تكون مرتبطة بزيادة معدلات الإصابة بفيروس SARS-CoV-2 وانخفاض حركة البشر [5]. أظهرت الأبحاث أن الإصابة بفيروس SARS-CoV-2 يمكن أن تؤدي إلى تطوير اضطرابات نفسية وسلوكيات انتحارية [38، 39]. خلال الجائحة، قد يتعرض الناس لمجموعة واسعة من الأحداث المجهدة أو الصادمة، مثل العزلة الاجتماعية، أو الحجر الصحي، أو الإصابة، مما يمكن أن يزيد من القلق المدرك، والاكتئاب، واضطراب النوم، وجودة الحياة [40]. كما وجدت دراستنا أنه بينما كان DALYs للفصام مرتفعًا، لم يتغير المعدل الموحد للعمر للفصام عالميًا بشكل كبير، حيث انخفض المعدل الموحد للعمر قليلاً بين 2019 و2021.
لقد أصبح العبء الثقيل للاضطرابات النفسية تحديًا صحيًا عامًا واسع الانتشار تواجهه الدول في جميع أنحاء العالم. على الرغم من عدم وجود علاقة كبيرة بين عبء الاضطرابات النفسية ومستوى التنمية الاجتماعية، فإن نقص موارد الصحة النفسية في البلدان ذات الدخل المنخفض والمتوسط يؤدي بلا شك إلى تفاوت في إمكانية الوصول إلى الخدمات [41]. وفقًا لخرائط الصحة النفسية لمنظمة الصحة العالمية لعام 2020، فإن المناطق ذات الدخل المرتفع مثل أوروبا لديها متوسط 9.7 طبيب نفسي لكل 100,000 شخص، بينما البلدان ذات الدخل المنخفض والمتوسط عمومًا لديها أقل من 1 طبيب نفسي لكل 100,000 شخص. على وجه الخصوص، في أفريقيا، يوجد فقط 0.1 طبيب نفسي لكل 100,000 شخص. لذلك، يحتاج صانعو السياسات إلى دمج الصحة النفسية في الرعاية الصحية الأولية، مع إعطاء الأولوية لتدريب وتوظيف المتخصصين في الصحة النفسية لسد فجوة الموارد. لقد زادت جائحة COVID-19 من الاتجاه التصاعدي في الاضطرابات النفسية، مما يتطلب استجابة سريعة من أنظمة الصحة العامة. يجب أن تتضمن هذه الاستجابة تعزيز دعم الصحة النفسية ودمج المساعدة النفسية في آلية الإغاثة من الكوارث وآلية الإنذار المبكر لحالات الطوارئ الصحية العامة الكبرى. يجب على المحترفين التدخل بشكل استباقي مع الأفراد المتأثرين، وتوفير الوصول إلى خدمات مثل خطوط التدخل في الأزمات النفسية. سيزيد ذلك من فرصهم في الحصول على خدمات الصحة النفسية، مما يساعدهم على التكيف مع الضغوط النفسية المتعلقة بـ COVID-19 وبالتالي تقليل الأضرار النفسية المحتملة الناجمة عن الجائحة [24].
القيود
عوامل الخطر القابلة للتعزيز بشكل أكبر. ثالثًا، لقد تسببت جائحة COVID-19 في تعطيل كبير لنظام الرعاية الصحية العالمي، وقد تأثرت بشكل كبير تشخيص وعلاج ورعاية المرضى الذين يعانون من الاضطرابات النفسية. من المحتمل أن تؤدي هذه الحالة إلى زيادة ملحوظة في عبء الاضطرابات النفسية بعد الجائحة. ومع ذلك، تصنف GBD 2021 COVID-19 كمرض منفصل له تأثير محدود على الاضطرابات النفسية. قد لا تعكس الفترة الزمنية القصيرة منذ اندلاع الجائحة هذه الاتجاه بشكل كامل.
الاستنتاجات
الاختصارات
| GBD | عبء المرض العالمي |
| DALYs | سنوات الحياة المعدلة حسب الإعاقة |
| ASIR | معدل الحدوث الموحد حسب العمر |
| ASR | معدل DALY الموحد حسب العمر |
| SDI | المؤشر الاجتماعي الديموغرافي |
| APC | نسبة التغيير السنوي |
| AAPC | متوسط نسبة التغيير السنوي |
| WHO | منظمة الصحة العالمية |
المعلومات التكميلية
المادة التكميلية 2
الشكر والتقدير
مساهمات المؤلفين
التمويل
توفر البيانات
الإعلانات
موافقة الأخلاقيات والموافقة على المشاركة
الموافقة على النشر
المصالح المتنافسة
تفاصيل المؤلف
نُشر عبر الإنترنت: 15 مايو 2025
References
- Schuch FB, Vancampfort D. Physical activity, exercise, and mental disorders: it is time to move on. Trends Psychiatry Psychother. 2021;43(3):177-84.
- Rehm J, Shield KD. Global burden of disease and the impact of mental and addictive disorders. Curr Psychiatry Rep. 2019;21(2):10.
- Charlson F, van Ommeren M, Flaxman A, Cornett J, Whiteford H, Saxena S. New WHO prevalence estimates of mental disorders in conflict settings: a systematic review and meta-analysis. Lancet. 2019;394(10194):240-8.
- Collaborators GDI. Global burden of 369 diseases and injuries in 204 countries and territories, 1990-2019: a systematic analysis for the global burden of disease study 2019. Lancet. 2020;396(10258):1204-22.
- Collaborators C-MD. Global prevalence and burden of depressive and anxiety disorders in 204 countries and territories in 2020 due to the COVID-19 pandemic. Lancet. 2021;398(10312):1700-12.
- Yang X, Fang Y, Chen H, Zhang T, Yin X, Man J, Yang L, Lu M. Global, regional and National burden of anxiety disorders from 1990 to 2019: results from the global burden of disease study 2019. Epidemiol Psychiatr Sci. 2021;30:e36.
- Collaborators GMD. Global, regional, and National burden of 12 mental disorders in 204 countries and territories, 1990-2019: a systematic analysis for the global burden of disease study 2019. Lancet Psychiatry. 2022;9(2):137-50.
- Freeman M. The world mental health report: transforming mental health for all. World Psychiatry. 2022;21(3):391-2.
- Daly M, Sutin AR, Robinson E. Longitudinal changes in mental health and the COVID-19 pandemic: evidence from the UK household longitudinal study. Psychol Med. 2022;52(13):2549-58.
- Wu Y, Deng Y, Wei B, Xiang D, Hu J, Zhao P, Lin S, Zheng Y, Yao J, Zhai Z, et al. Global, regional, and National childhood cancer burden, 1990-2019: an analysis based on the global burden of disease study 2019. J Adv Res. 2022;40:233-47.
- Collaborators GDI. Global incidence, prevalence, years lived with disability (YLDs), disability-adjusted life-years (DALYs), and healthy life expectancy (HALE) for 371 diseases and injuries in 204 countries and territories and 811 subnational locations, 1990-2021: a systematic analysis for the global burden of disease study 2021. Lancet. 2024;403(10440):2133-61.
- Li T, Zhang H, Lian M, He Q, Lv M, Zhai L, Zhou J, Wu K, Yi M. Global status and attributable risk factors of breast, cervical, ovarian, and uterine cancers from 1990 to 2021. J Hematol Oncol. 2025;18(1):5.
- Charlson FJ, Ferrari AJ, Santomauro DF, Diminic S, Stockings E, Scott JG, McGrath JJ, Whiteford HA. Global epidemiology and burden of schizophrenia: findings from the global burden of disease study 2016. Schizophr Bull. 2018;44(6):1195-203.
- Collaboration GCKD. Global, regional, and National burden of chronic kidney disease, 1990-2017: a systematic analysis for the global burden of disease study 2017. Lancet. 2020;395(10225):709-33.
- Jiang Q, Shu Y, Jiang Z, Zhang Y, Pan S, Jiang W, Liang J, Cheng X, Xu Z. Burdens of stomach and esophageal cancer from 1990 to 2019 and projection to 2030 in China: findings from the 2019 global burden of disease study. J Glob Health. 2024;14:04025.
- Mo ZY, Qin ZZ, Ye JJ, Hu XX, Wang R, Zhao YY, Zheng P, Lu QS, Li Q, Tang XY. The long-term spatio-temporal trends in burden and attributable risk factors of major depressive disorder at global, regional and National levels during 1990-2019: a systematic analysis for GBD 2019. Epidemiol Psychiatr Sci. 2024;33:e28.
- Yang X, Chen H, Sang S, Chen H, Li L, Yang X. Burden of all cancers along with attributable risk factors in China from 1990 to 2019: comparison with Japan, European union, and USA. Front Public Health. 2022;10:862165.
- Chen X, Zhang L, Chen W. Global, regional, and National burdens of type 1 and type 2 diabetes mellitus in adolescents from 1990 to 2021, with forecasts to 2030: a systematic analysis of the global burden of disease study 2021. BMC Med. 2025;23(1):48.
- Li J, Gao Z, Bai H, Wang W, Li Y, Lian J, Li Y, Feng Y, Wang S. Global, regional, and National total burden related to hepatitis B in children and adolescents from 1990 to 2021. BMC Public Health. 2024;24(1):2936.
- Li C, Zhang L, Zhang J, Jiao J, Hua G, Wang Y, He X, Cheng C, Yu H, Yang X, et al. Global, regional and National burden due to retinoblastoma in children aged younger than 10 years from 1990 to 2021. BMC Med. 2024;22(1):604.
- Li Y, Song W, Gao P, Guan X, Wang B, Zhang L, Yao Y, Guo Y, Wang Y, Jiang S, et al. Global, regional, and National burden of breast, cervical, uterine, and ovarian cancer and their risk factors among women from 1990 to 2021, and projections to 2050: findings from the global burden of disease study 2021. BMC Cancer. 2025;25(1):330.
- Kuang Z, Wang J, Liu K, Wu J, Ge Y, Zhu G, Cao L, Ma X, Li J. Global, regional, and national burden of tracheal, bronchus, and lung cancer and its risk factors from 1990 to 2021: findings from the global burden of disease study 2021. EClinicalMedicine 2024, 75:102804.
- Zhang X, Wu L, Li Y, Tao Z, Li N, Zhang H, Ren M, Wang K. The global burden of vascular intestinal diseases: results from the 2021 global burden of disease study and projections using bayesian age-period-cohort analysis. Environ Health Prev Med. 2024;29:71.
- Wu Y, Wang L, Tao M, Cao H, Yuan H, Ye M, Chen X, Wang K, Zhu C. Changing trends in the global burden of mental disorders from 1990 to 2019 and predicted levels in 25 years. Epidemiol Psychiatr Sci. 2023;32:e63.
- Collaborators IS-LDBIMD. The burden of mental disorders across the States of India: the global burden of disease study 1990-2017. Lancet Psychiatry. 2020;7(2):148-61.
- Collaborators GMM. Global, regional, and National levels of maternal mortality, 1990-2015: a systematic analysis for the global burden of disease study 2015. Lancet. 2016;388(10053):1775-812.
- Mokdad AH, Charara, Raghid E, Bcheraoui NJ, Collison M, Chew KKJ, Adrienne et al. The burden of mental disorders in the Eastern Mediterranean region, 1990-2015: findings from the global burden of disease 2015 study. Int J Public Health 2018, 63(Suppl 1):25-37.
- Huang Y, Liu Z, Wang H, Guan X, Chen H, Ma C, Li Q, Yan J, Yu Y, Kou C, et al. The China mental health survey (CMHS): I. background, aims and measures. Soc Psychiatry Psychiatr Epidemiol. 2016;51(11):1559-69.
- Huang Y, Wang Y, Wang H, Liu Z, Yu X, Yan J, Yu Y, Kou C, Xu X, Lu J, et al. Prevalence of mental disorders in China: a cross-sectional epidemiological study. Lancet Psychiatry. 2019;6(3):211-24.
- Shi-Jie F, Hong-Mei G, Li W, Bin-Hong W, Yi-Ru F, Gang W, Tian-Mei S. Perceptions of stigma and its correlates among patients with major depressive disorder: A multicenter survey from China. Asia Pac Psychiatry 2017, 9(3).
- Wong DF, Tsui HK, Pearson V, Chen EY, Chiu SN. Family burdens, Chinese health beliefs, and the mental health of Chinese caregivers in Hong Kong. Transcult Psychiatry. 2004;41(4):497-513.
- Ran MS, Hall BJ, Su TT, Prawira B, Breth-Petersen M, Li XH, Zhang TM. Stigma of mental illness and cultural factors in Pacific rim region: a systematic review. BMC Psychiatry. 2021;21(1):8.
- Yang LH, Chen FP, Sia KJ, Lam J, Lam K, Ngo H, Lee S, Kleinman A, Good B. What matters most: a cultural mechanism moderating structural vulnerability and moral experience of mental illness stigma. Soc Sci Med. 2014;103:84-93.
- Cheng Y, Fang Y, Zheng J, Guan S, Wang M, Hong W. The burden of depression, anxiety and schizophrenia among the older population in ageing and aged countries: an analysis of the global burden of disease study 2019. Gen Psychiatr. 2024;37(1):e101078.
- Maki PM, Kornstein SG, Joffe H, Bromberger JT, Freeman EW, Athappilly G, Bobo WV, Rubin LH, Koleva HK, Cohen LS, et al. Guidelines for the evaluation and treatment of perimenopausal depression: summary and recommendations. J Womens Health (Larchmt). 2019;28(2):117-34.
- Ironson G, Henry SM, Gonzalez BD. Impact of stressful death or divorce in people with HIV: A prospective examination and the buffering effects of religious coping and social support. J Health Psychol. 2020;25(5):606-16.
- Smith K. Mental health: a world of depression. Nature. 2014;515(7526):181.
- Lu S, Wei N, Jiang J, Wu L, Sheng J, Zhou J, Fang Q, Chen Y, Zheng S, Chen F, et al. First report of manic-like symptoms in a COVID-19 patient with no previous history of a psychiatric disorder. J Affect Disord. 2020;277:337-40.
- Noone R, Cabassa JA, Gardner L, Schwartz B, Alpert JE, Gabbay V. Letter to the editor: new onset psychosis and mania following COVID-19 infection. J Psychiatr Res. 2020;130:177-9.
- Holmes EA, O’Connor RC, Perry VH, Tracey I, Wessely S, Arseneault L, Ballard C, Christensen H, Cohen Silver R, Everall I, et al. Multidisciplinary research priorities for the COVID-19 pandemic: a call for action for mental health science. Lancet Psychiatry. 2020;7(6):547-60.
- Edwards N, Walker S, Paddick SM, Prina AM, Chinnasamy M, Reddy N, Mboya IB, Mtei M, Varghese M, Nakkasuja N, et al. Prevalence of depression and anxiety in older people in low- and middle- income countries in Africa, Asia and South America: A systematic review and meta-analysis. J Affect Disord. 2023;325:656-74.
- Jadambaa A, Thomas HJ, Scott JG, Graves N, Brain D, Pacella R. The contribution of bullying victimisation to the burden of anxiety and depressive disorders in Australia. Epidemiol Psychiatr Sci. 2019;29:e54.
ملاحظة الناشر
ساهم يانغ يان فانو وآهوي فانو بالتساوي في هذا العمل.
*المراسلة:
زهيبينغ يانغ
zpyang@fmmu.edu.cn
دايمينغ فانو
fandaim@fmmu.edu.cn
القائمة الكاملة لمعلومات المؤلف متاحة في نهاية المقال
DOI: https://doi.org/10.1186/s12888-025-06932-y
PMID: https://pubmed.ncbi.nlm.nih.gov/40375174
Publication Date: 2025-05-15
Global burden of mental disorders in 204 countries and territories, 1990-2021: results from the global burden of disease study 2021
Abstract
Background Mental disorders, one of the leading causes of the global health-related burden, which has been exacerbated by the emergence of the COVID-19 pandemic (2019-2021). In this study, we aim to provide global, regional, and national estimates of the mental disorders burden from 1990 to 2021, including during the COVID-19. Methods We collected data from the Global Burden of Disease Study 2021 (GBD 2021) on the incidence, disabilityadjusted life years (DALYs), age-standardized incidence rate (ASIR), and age-standardized DALY rate (ASR) of 12 mental disorders from 204 countries and regions. The socio-demographic index (SDI) was used to evaluate the correlation between mental disorders burden and different regions. We utilized joinpoint regression analysis to estimate the average annual percentage change (AAPC). Results In 2021, there were 444,397,716 incident cases and 155,418,119 DALYs globally from mental disorders. From 1990 to 2021, there was an upward trend in both ASIR [15.23% (12.97-17.60%)] and ASR [17.28% (15.06-19.44%)]. In 2021, the highest ASIR was observed in Central Sub-Saharan Africa (8706.11), while the lowest was in East Asia (3340.99). Australia (2787.87) had the highest ASR. Nationally, Greenland, Greece, the United States, and Australia had the highest ASRs. During the COVID-19 pandemic, aside from East Asia, both the ASIR showed an upward trend in the five SDI and other GBD regions. In 2021, the ASR for females was higher than that for males. Among the 12 subtypes, major depressive disorder (557.87) and anxiety disorders (524.33) had the highest ASR. Major depressive disorder ranked first in ASR in 13 of the 21 regions worldwide. Despite the overall upward trend in DALYs for mental disorders [AAPC:
Clinical trial number Not applicable.
Introduction
There were significant regional disparities in the incidence and prevalence of mental disorders. In 2019, Australasia, Tropical Latin America, and High-income North America exhibited the highest prevalence rates [7]. According to the “World Mental Health Report” released by the World Health Organization (WHO) in 2022, 970 million people worldwide suffered from mental disorders, with
Although previous studies have reported estimates of the burden of mental disorders, they have focused more on analyzing subtypes of mental disorders, such as depression and anxiety, rather than comprehensively analyzing the burden of 12 mental disorders. The emergence of the COVID-19 pandemic in 2019 has led to a deterioration in mental health status. Epidemiological studies have indicated that the direct psychological impact of the pandemic, as well as its long-term effects on the economic and social conditions of the population, may increase the prevalence of common mental illnesses [9]. Previous studies have not systematically analyzed the impact of COVID-19 on mental disorders. This study aims to summarize the incidence, DALYs, and long-term trends of mental disorders in different countries and
regions from 1990 to 2021 and from 2019 to 2021, stratified by gender, based on the 2021 GBD study. Understanding the latest burden patterns will help raise global awareness of mental disorders and inform the design of targeted prevention and intervention strategies tailored to the characteristics of different regions.
Methods
Overview
Estimation of DALYs
Data source
was used to analyze the interrelationship between social development and population health outcomes [11]. It is the geometric mean of the total fertility rate of people under 25, the average educational attainment of the population aged 15 and over, and the 0 to 1 index of the lagging index of per capita income distribution [14]. SDI varies between 0 and 1, with higher SDI implying better socioeconomic development. Based on the SDI, regions are classified into five levels, including low (
Case definition
Statistical analysis
Joinpoint regression, a statistical method widely used in epidemiological studies, was employed to analyze trend changes in time series data. This method identifies “joinpoints” that split the data into multiple segments, with each segment exhibiting its own annual percentage change. In this study, we calculated the annual percent change (APC) and average annual percent change (AAPC) of DALYs for mental disorders from 1990 to 2021 using joinpoint regression analysis, aiming to determine the temporal trends in the global burden of mental
disorders. We employed a log-linear model to analyze the APC and AAPC in ASR for mental disorders, along with their corresponding 95% confidence intervals (CI). A grid search method was used to fit the regression function and determine the number and position of joinpoints, with a maximum of 5 joinpoints allowed [19]. This model professionally identifies and quantitatively describes significant turning points in the time series data related to mental disorder estimates. An APC or AAPC estimate and its
Results
Global burden of mental disorders
| World region | 1990 | 2019 | 2021 | Percentage change of ASIR | ||||
| Number of cases | ASIR per 100,000 | Number of cases | ASIR per 100,000 | Number of cases | ASIR per 100,000 | 1990-2021 | 2019-2021 | |
| Global | 241,360,894 | 4737.97(4278.42,5368.46) | 374,348,205 | 4703.23(4247.84,5334.32) | 444,397,716 | 5459.77(4873.72,6241.42) | 15.23(12.97,17.60) | 16.08(14.22,18.00) |
| Low SDI | 23,709,009 | 6143.20(5397.31,7113.59) | 50,605,025 | 5861.74(5164.94,6762.84) | 60,311,401 | 6514.44(5697.32,7557.96) | 6.04(1.97,9.92) | 11.13(6.80,15.31) |
| Low-middle SDI | 55,310,181 | 5665.99(5054.42,6486.09) | 95,238,869 | 5330.20(4759.97,6080.08) | 116,086,947 | 6216.11(5495.21,7144.06) | 9.71(5.38,14.25) | 16.62(12.05,20.87) |
| Middle SDI | 68,734,614 | 4227.59(3825.97,4770.91) | 107,423,074 | 4260.84(3870.13,4789.73) | 126,831,832 | 4920.13(4442.47,5540.26) | 16.38(14.01,18.91) | 15.47(12.91,18.23) |
| High-middle SDI | 48,995,902 | 4539.15(4134.81,5057.42) | 61,968,787 | 4326.48(3937.12,4843.04) | 70,163,005 | 4917.24(4414.74,5538.76) | 8.32(4.1,12.48) | 13.65(10.03,17.57) |
| High SDI | 44,390,980 | 4835.38(4415.93,5367.04) | 58,825,036 | 5270.11(4760.83,5950.82) | 70,659,768 | 6423.82(5760.36,7244.81) | 32.85(28.39,37.98) | 21.89(18.63,25.34) |
| Andean Latin America | 1,464,494 | 4243.82(3782.93,4830.68) | 2,604,677 | 4070.36(3639.89,4687.07) | 3,583,280 | 5347.37(4595.75,6241.11) | 26.00(13.96,40.20) | 31.37(18.58,45.39) |
| Australasia | 1,418,295 | 6766.65(6089.73,7556.67) | 2,019,342 | 6827.27(6066.05,7815.30) | 2,231,887 | 7325.01(6147.35,8863.53) | 8.25(-7.22,26.30) | 7.29(-7.81,24.20) |
| Caribbean | 1,948,481 | 5803.64(5154.29,6668.33) | 2,584,766 | 5297.02(4665.54,6132.14) | 3,122,929 | 6307.79(5409.94,7386.54) | 8.68(0.29,18.08) | 19.08(10.54,29.18) |
| Central Asia | 2,741,842 | 4448.91(3934.43,5055.71) | 3,873,032 | 4278.75(3794.93,4893.24) | 4,684,861 | 4994.54(4299.53,5811.01) | 12.26(3.84,22.01) | 16.72(7.27,26.71) |
| Central Europe | 5,045,588 | 3802.67(3437.13,4277.96) | 4,728,494 | 3478.35(3142.74,3913.23) | 5,712,470 | 4364.02(3862.89,4955.29) | 14.76(8.98,20.94) | 25.46(19.97,32.21) |
| Central Latin America | 6,437,675 | 4458.02(4017.97,5047.77) | 12,460,247 | 4854.37(4375.38,5478.64) | 15,343,630 | 5849.19(5223.78,6692.60) | 31.21(25.97,36.95) | 20.49(15.88,25.13) |
| Central Sub-Saharan Africa | 3,527,046 | 8271.15(7096.42,9844.93) | 8,374,614 | 8023.19(6936.78,9482.64) | 9,791,079 | 8706.11(7166.05,10620.38) | 5.25(-6.92,20.21) | 8.51(-4.18,22.48) |
| East Asia | 42,832,652 | 3537.32(3214.57,3939.56) | 55,224,836 | 3342.22(3058.38,3686.25) | 56,340,545 | 3340.99(3025.52,3712.33) | -5.55(-9.83,-0.99) | -0.04(-3.38,3.83) |
| Eastern Europe | 12,459,215 | 5103.58(4537.33,5713.92) | 11,408,784 | 4720.44(4200.09,5309.38) | 14,023,794 | 6014.06(5286.17,6838.01) | 17.84(12.25,24.82) | 27.40(21.45,34.99) |
| Eastern Sub-Saharan Africa | 9,655,721 | 7014.94(6190.74,8082.61) | 20,759,153 | 6673.86(5917.56,7655.79) | 25,372,933 | 7528.26(6567.61,8690.75) | 7.31(1.96,13.44) | 12.80(6.73,18.94) |
| High-income Asia Pacific | 5,924,027 | 3276.75(2999.91,3622.88) | 6,465,420 | 3377.09(3095.76,3745.76) | 7,350,005 | 3950.35(3551.76,4462.44) | 20.55(14.32,27.21) | 16.97(11.27,23.02) |
| High-income North America | 15,096,975 | 5205.05(4701.26,5826.75) | 23,451,454 | 6417.86(5818.29,7228.01) | 29,528,973 | 8145.60(7295.06,9182.34) | 56.49(50.04,63.07) | 26.92(22.34,32.28) |
| North Africa and Middle East | 19,331,360 | 6334.31(5557.62,7364.13) | 38,717,768 | 6400.93(5545.95,7463.87) | 46,242,810 | 7336.22(6303.06,8574.72) | 15.81(10.24,21.48) | 14.61(9.56,20.12) |
| Oceania | 228,322 | 3774.89(3318.00,4378.00) | 464,450 | 3692.82(3252.82,4283.07) | 527,864 | 3981.68(3330.94,4801.24) | 5.47(-7.42,20.21) | 7.82(-5.91,23.24) |
| South Asia | 52,393,027 | 5730.80(5137.66,6540.88) | 91,516,789 | 5207.73(4654.64,5906.19) | 112,893,184 | 6134.14(5462.68,7015.18) | 7.03(3.11,11.72) | 17.78(13.41,22.41) |
| Southeast Asia | 14,009,335 | 3167.44(2844.43,3579.11) | 21,721,272 | 3104.21(2785.32,3485.37) | 26,764,622 | 3720.30(3311.08,4216.65) | 17.45(13.45,22.26) | 19.84(15.48,24.81) |
| Southern Latin America | 2,463,407 | 4980.19(4497.42,5639.55) | 3,207,726 | 4662.74(4229.63,5239.88) | 4,018,237 | 5775.16(4900.07,6788.32) | 15.96(2.41,29.82) | 23.85(10.52,37.83) |
| Southern Sub-Saharan Africa | 2,524,563 | 5700.30(5128.44,6492.29) | 4,273,341 | 5686.72(5105.84,6454.32) | 5,531,245 | 7052.85(6182.21,8128.01) | 23.72(16.52,32.01) | 24.02(16.69,32.11) |
| Tropical Latin America | 8,655,965 | 6083.62(5503.83,6856.24) | 13,484,023 | 5692.05(5193.08,6297.35) | 17,191,337 | 7097.75(6342.27,8053.77) | 16.67(10.49,23.24) | 24.69(17.64,32.02) |
| Western Europe | 24,941,474 | 6120.52(5603.73,6762.26) | 27,848,760 | 5984.89(5352.55,6812.56) | 32,649,490 | 7218.40(6356.58,8319.83) | 17.94(11.02,25.75) | 20.61(14.83,26.97) |
| Western Sub-Saharan Africa | 8,261,430 | 5614.08(4983.27,6430.13) | 19,159,258 | 5405.37(4793.92,6170.41) | 21,492,542 | 5657.36(4960.75,6496.80) | 0.77(-3.21,4.65) | 4.66(0.46,8.60) |
Global burden of
2021. As shown, the major depressive disorder (75.72%) accounted for the highest ASIR proportion globally, followed by anxiety disorders
The trends of mental disorders disease burden in regions with different SDI levels from 1990 to 2021
Mental disorders incidence and DALYs in relation to SDI
| World region | 1990 | 2019 | 2021 | Percentage change of ASR | ||||
| Number of DALYs | ASR per 100,000 | Number of DALYS | ASR per 100,000 | Number of DALYS | ASR per 100,000 | 1990-2021 | 2019-2021 | |
| Global | 89,567,099 | 1745.15(1314.32,2214.47) | 138,453,211 | 1738.12(1308.29,2210.63) | 155,418,119 | 1909.14(1440.15,2437.87) | 17.28(15.06,19.44) | 10.18(8.83,11.46) |
| Low SDI | 7,645,112 | 1861.88(1395.11,2401.28) | 16,805,739 | 1836.88(1373.03,2359.95) | 19,117,472 | 1964.32(1463.82,2530.28) | 12.19(9.67,14.70) | 8.61(6.22,10.99) |
| Low-middle SDI | 18,719,851 | 1838.15(1375.03,2356.10) | 32,748,795 | 1791.40(1342.03,2288.04) | 37,352,846 | 1968.25(1480.56,2533.15) | 20.63(16.69,24.38) | 11.45(9.02,13.92) |
| Middle SDI | 26,700,052 | 1627.38(1225.92,2063.50) | 41,930,138 | 1650.13(1242.47,2095.44) | 47,067,857 | 1816.49(1369.70,2310.33) | 24.04(20.51,27.14) | 10.52(8.82,12.12) |
| High-middle SDI | 18,211,389 | 1671.33(1260.67,2122.96) | 23,521,926 | 1648.84(1243.62,2094.28) | 25,764,095 | 1806.88(1364.02,2290.90) | 15.38(12.41,18.88) | 8.95(6.72,11.22) |
| High SDI | 18,207,905 | 1956.55(1480.64,2473.36) | 23,336,865 | 2027.55(1534.76,2566.03) | 18,207,905 | 2276.02(1710.69,2886.64) | 14.76(12.12,17.47) | 10.68(8.72,12.74) |
| Andean Latin America | 630,276 | 1828.65(1375.57,2339.06) | 1,181,926 | 1825.23(1364.44,2329.47) | 1,470,468 | 2175.32(1597.74,2830.02) | 34.03(24.56,44.99) | 20.22(12.18,29.89) |
| Australasia | 554,994 | 2609.71(1950.75,3349.12) | 821,429 | 2681.89(2016.93,3442.45) | 880,846 | 2787.87(2088.14,3552.40) | 3.94(-3.77,12.67) | 3.66(-4.17,12.36) |
| Caribbean | 656,306 | 1934.62(1436.83,2484.77) | 910,312 | 1866.16(1394.07,2396.41) | 1,029,437 | 2082.12(1548.02,2715.62) | 16.64(11.02,22.65) | 11.73(6.77,17.25) |
| Central Asia | 944,337 | 1484.65(1119.71,1902.71) | 1,364,944 | 1466.30(1104.34,1871.73) | 1,535,702 | 1603.18(1206.41,2060.86) | 17.65(12.36,23.52) | 9.53(4.69,14.12) |
| Central Europe | 2,017,814 | 1528.92(1169.19,1927.43) | 1,960,653 | 1498.25(1142.11,1886.92) | 2,182,318 | 1712.83(1297.62,2176.20) | 17.37(13.86,21.27) | 12.38(9.10,15.68) |
| Central Latin America | 2,480,054 | 1673.34(1263.96,2140.13) | 4,586,288 | 1774.05(1330.82,2273.49) | 5,247,771 | 1993.08(1480.80,2558.59) | 37.50(32.10,43.36) | 13.47(10.31,16.99) |
| Central Sub-Saharan Africa | 942,596 | 2118.47(1564.97,2752.91) | 2,308,899 | 2110.82(1586.14,2739.58) | 2,616,801 | 2233.63(1647.69,2950.03) | 11.43(4.03,20.17) | 7.74(0.84,15.78) |
| East Asia | 17,695,222 | 1450.67(1095.61,1834.85) | 22,909,873 | 1398.13(1058.68,1770.21) | 24,029,128 | 1447.28(1103.83,1825.01) | 12.25(7.75,17.14) | 4.28(2.17,6.68) |
| Eastern Europe | 4,019,811 | 1668.96(1248.15,2119.26) | 3,814,348 | 1635.43(1221.57,2074.01) | 4,340,593 | 1910.06(1423.91,2436.16) | 18.28(14.90,22.57) | 14.99(11.59,18.97) |
| Eastern Sub-Saharan Africa | 2,962,957 | 1990.29(1482.98,2575.21) | 6,612,096 | 1960.51(1459.54,2525.98) | 7,679,754 | 2126.41(1586.72,2744.99) | 16.08(12.69,19.63) | 10.92(7.74,14.03) |
| High-income Asia Pacific | 2,863,619 | 1554.80(1179.04,1932.41) | 3,068,966 | 1577.35(1195.17,1960.64) | 3,286,395 | 1721.55(1305.43,2154.41) | 7.30(4.40,10.75) | 7.62(5.07,10.94) |
| High-income North America | 6,387,812 | 2152.02(1621.42,2726.69) | 8,831,876 | 2319.04(1737.27,2926.87) | 10,106,541 | 2662.06(1977.68,3399.24) | 20.28(16.69,24.24) | 13.41(10.90,16.29) |
| North Africa and Middle East | 6,564,776 | 2131.18(1595.27,2757.58) | 13,138,710 | 2151.24(1610.31,2784.08) | 14,960,229 | 2359.65(1745.61,3049.99) | 24.07(19.56,28.72) | 10.78(7.56,14.15) |
| Oceania | 89,588 | 1522.16(1149.14,1956.12) | 188,766 | 1517.06(1141.30,1932.53) | 208,648 | 1591.91(1175.71,2085.55) | 9.53(0.85,18.28) | 5.44(-2.78,13.80) |
| South Asia | 17,712,064 | 1834.57(1375.65,2335.07) | 31,453,177 | 1749.41(1311.92,2219.26) | 35,948,514 | 1925.51(1447.69,2471.47) | 20.18(15.72,24.74) | 11.87(9.28,14.47) |
| Southeast Asia | 6,243,886 | 1438.95(1090.28,1812.42) | 10,204,059 | 1434.00(1091.84,1816.59) | 6,243,886 | 1588.29(1206.9402022.22) | 23.82(19.67,28.23) | 11.44(8.91,14.39) |
| Southern Latin America | 993,418 | 2018.97(1526.97,2568.90) | 1,372,829 | 1968.57(1490.93,2510.91) | 1,591,301 | 2249.71(1653.51,2928.35) | 17.22(8.34,26.84) | 14.46(5.75,25.10) |
| Southern Sub-Saharan Africa | 833,002 | 1805.43(1353.31,2309.14) | 1,394,613 | 1800.76(1349.52,2297.27) | 1,659,944 | 2073.72(1548.89,2686.33) | 30.07(25.12,35.51) | 16.92(12.66,21.36) |
| Tropical Latin America | 3,088,704 | 2145.85(1602.80,2762.53) | 5,399,428 | 2256.85(1665.95,2895.97) | 6,336,303 | 2601.75(1916.60,3349.09) | 37.55(31.34,43.92) | 15.41(11.45,19.58) |
| Western Europe | 9,197,289 | 2243.61(1676.13,2871.42) | 10,401,819 | 2240.86(1676.53,2874.71) | 11,520,860 | 2522.52(1872.21,3250.66) | 10.09(6.27,13.95) | 10.46(7.02,13.94) |
| Western Sub-Saharan Africa | 2,688,574 | 1709.71(1277.72,2177.53) | 6,528,200 | 1703.06(1275.72,2175.80) | 7,189,409 | 1755.29(1304.72,2236.64) | 5.45(3.34,7.40) | 4.16(2.12,6.14) |
| 2021 | 1990-2021 | 2019-2021 | ||||
| Number of DALYs | ASR per 100,000 | Percentage change of ASR | AAPC in ASR | Percentage change of ASR | APC in ASR | |
| Mental disorders | ||||||
| Total | 155,418,119 | 1909.14(1440.15,2437.87) | 17.28(15.06,19.44) | 5.96(4.99,6.92) | 10.18(8.83,11.46) | 4.80(3.94,5.68) |
| Male | 70,381,365 | 1732.39(1312.80,2189.59) | 15.55(13.18,17.78) | 4.72(4.15,5.29) | 8.37(7.11,9.58) | 3.89(3.17,4.62) |
| Female | 85,036,754 | 2084.12(1556.67,2687.29) | 18.68(16.47,20.81) | 7.07(6.18,7.97) | 11.71(10.31,13.17) | 5.61(4.60,6.62) |
| Anxiety disorders | ||||||
| Total | 42,509,645 | 524.33(363.05,716.25) | 18.16(15.57,20.95) | 2.85(2.53,3.16) | 19.11(16.59,21.48) | 9.30(6.07,12.63) |
| Male | 16,113,657 | 396.91(272.28,547.66) | 18.17(15.38,20.95) | 2.17(1.96,2.37) | 17.82(15.18,20.39) | 8.55(7.20,9.90) |
| Female | 26,395,988 | 652.16(453.44,887.15) | 18.42(15.76,21.32) | 3.58(3.19,3.97) | 19.98(17.45,22.47) | 9.54(8.10,11.00) |
| Major depressive disorder | ||||||
| Total | 46,018,844 | 557.87(381.19,760.70) | 16.07(13.19,18.96) | 2.60(2.11,3.10) | 18.08(15.86,20.45) | 11.50(5.50,17.85) |
| Male | 17,895,583 | 436.59(297.51,595.74) | 19.16(16.46,22.27) | 2.28(1.91,2.66) | 17.82(15.39,20.42) | 6.78(4.89,8.70) |
| Female | 28,123,261 | 678.54(464.94,923.36) | 14.32(11.21,17.39) | 3.29(2.34,4.23) | 18.36(15.98,20.75) | 8.80(6.515,11.13) |
| Schizophrenia | ||||||
| Total | 14,816,611 | 177.75(131.51,228.79) | 0.64(-0.48,1.71) | 0.04(0.03,0.05) | -0.14(-0.86,0.60) | -0.03(-0.04,-0.01) |
| Male | 7,870,786 | 188.96(139.92,243.73) | 0.89(-0.43,2.20) | 0.06(0.05,0.07) | -0.10(-1.12,0.89) | -0.03(-0.05,-0.02) |
| Female | 6,945,825 | 166.40(122.80,213.92) | 0.46(-0.89,1.81) | 0.03(0.02,0.03) | -0.19(-1.25,0.84) | -0.04(-0.06,-0.03) |
| Bipolar disorder | ||||||
| Total | 8,007,783 | 166.40(122.80,213.92) | 0.29(-1.14,1.65) | 0.00(0.00,0.01) | -0.16(-0.73,0.39) | -0.06(-0.10,-0.02) |
| Male | 3,869,179 | 94.16(60.91,135.74) | 2.07(0.43,3.66) | 0.06(0.05,0.07) | -0.02(-0.79,0.77) | 0.02(-0.08,0.11) |
| Female | 4,138,604 | 100.48(65.15,143.98) | -1.29(-2.74,0.10) | -0.04(-0.04,-0.03) | -0.29(-1.12,0.45) | -0.13(-0.20,-0.05) |
| Dysthymia | ||||||
| Total | 10,311,517 | 123.27(79.24,174.71) | 2.82(1.16,4.58) | 0.11(0.09,0.12) | 1.81(0.56,2.98) | 0.90(0.64,1.17) |
| Male | 4,315,356 | 103.91(66.67,147.42) | 2.18(-0.10,4.21) | 0.07(0.06,0.08) | 1.77(0.19,3.36) | 0.88(0.59,1.18) |
| Female | 5,996,161 | 142.62(91.89,202.72) | 3.22(1.05,5.45) | 0.14(0.11,0.16) | 1.84(0.10,3.71) | 0.92(0.61,1.23) |
| Anorexia nervosa | ||||||
| Total | 798,443 | 10.31(6.42,16.25) | 5.18(3.05,7.45) | 0.02(0.02,0.02) | -0.85(-2.28,0.80) | -0.43(-0.55,-0.30) |
| Male | 219,973 | 5.59(3.35,9.02) | 9.03(5.73,12.45) | 0.02(0.02,0.02) | -0.24(-3.02,2.76) | -0.12(-0.25,0.01) |
| Female | 578,470 | 15.18(9.53,23.90) | 4.10(1.47,6.85) | 0.02(0.01,0.02) | -1.02(-2.63,0.71) | -0.51(-0.67,-0.35) |
| Bulimia nervosa | ||||||
| Total | 2,604,702 | 33.05(18.64,55.29) | 20.06(18.37,21.94) | 0.18(0.17,0.19) | 0.18(-0.85,1.22) | 0.64(0.60,0.69) |
| Male | 1,040,190 | 26.01(14.68,43.25) | 24.62(21.930,27.48) | 0.17(0.17,0.17) | 0.917(-0.504,2.41) | 0.68(0.63,0.72) |
| Female | 1,564,512 | 40.297(22.67,66.23) | 17.32(15.07,19.47) | 0.19(0.18,0.20) | -0.26(-1.53,1.04) | -0.30(-0.82,0.23) |
| Autism spectrum disorders | ||||||
| Total | 11,544,038 | 147.55(100.21,208.15) | 2.11(0.55,3.41) | 0.10(0.09,0.11) | -0.02(-0.75,0.69) | -0.01(-0.06,0.04) |
| Male | 7,896,838 | 199.80(136.29,281.96) | 1.97(0.08,3.54) | 0.13(0.12,0.14) | -0.09(-1.02,0.81) | -0.03(-0.07,0.00) |
| Female | 3,647,200 | 94.45(64.55,133.017) | 2.23(0.96,3.69) | 0.07(0.06,0.07) | 0.13(-0.73,1.09) | 0.07(0.04,0.11) |
| Attention-deficit/hyperactivity disorder | ||||||
| Total | 1,030,941 | 13.49(7.41,21.89) | -9.68(-11.90,-7.29) | -0.04(-0.05,-0.04) | -0.07(-1.96,1.99) | -0.24(-0.35,-0.13) |
| Male | 742,264 | 19.04(10.44,30.75) | -9.81(-12.51,-6.80) | -0.07(-0.07,-0.06) | 0.06(-2.55,2.68) | -0.19(-0.28,-0.09) |
| Female | 288,678 | 7.69(4.18,12.69) | -9.93(-12.83,-6.63) | -0.03(-0.03,-0.02) | -0.44(-2.87,2.11) | -0.48(-0.51,-0.46) |
| Conduct disorder | ||||||
| Total | 5,002,614 | 67.68(36.75,105.51) | 3.03(1.42,4.86) | 0.06(0.06,0.07) | -0.11(-0.75,0.54) | 0.00(-0.03,0.03) |
| Male | 3,257,831 | 85.60(47.16,132.77) | 1.79(0.13,3.94) | 0.05(0.04,0.06) | -0.08(-0.92,0.73) | 0.01(-0.01,0.03) |
| Female | 1,744,783 | 48.67(26.08,76.31) | 4.74(2.21,6.96) | 0.07(0.07,0.08) | -0.14(-1.19,1.03) | -0.01(-0.04,0.03) |
| Idiopathic developmental intellectual disability | ||||||
| Total | 3,810,635 | 49.92(23.17,85.33) | -13.67(-17.95,-8.41) | -0.24(-0.25,-0.23) | 0.12(-0.79,1.14) | 0.06(-0.27,0.39) |
| 2021 | 1990-2021 | 2019-2021 | ||||
| Number of DALYs | ASR per 100,000 | Percentage change of ASR | AAPC in ASR | Percentage change of ASR | APC in ASR | |
| Male | 1,872,569 | 48.32(20.77,84.58) | -16.91(-21.73,-12.51) | -0.31(-0.32,-0.30) | -0.05(-1.27,1.29) | -0.03(-0.45,0.41) |
| Female | 1,938,066 | 51.52(25.49,85.54) | -10.35(-14.58,-4.28) | -0.19(-0.20,-0.18) | 0.28(-0.97,1.37) | -0.78(-0.82,-0.72) |
| Other mental disorders | ||||||
| Total | 8,962,344 | 106.59(68.18,160.68) | -0.34(-1.06,0.33) | -0.01(-0.01,-0.01) | -0.22(-0.72,0.24) | -0.11 (-0.13,-0.10) |
| Male | 5,287,137 | 127.47(81.99,191.81) | -0.52(-1.37,0.23) | -0.02(-0.03,-0.02) | -0.19(-0.81,0.39) | -0.10(-0.11,-0.09) |
| Female | 3,675,207 | 86.08(55.86,127.90) | -0.16(-0.99,0.72) | -0.01(-0.01,-0.01) | -0.28(-1.04,0.38) | -0.14(-0.17,-0.11) |
rates, while others were well above expected levels but with fluctuating or decreasing age-standardized rates. Although Eastern Europe, High-income North America, and Australasia showed a downward trend in ASR, they still remain higher than expected. Notably, both the ASIR and ASR showed a sharp increase in all regions from 2019 to 2021 (Fig. 3c).
Discussion
The disease burden was considerably heavy in most regions. Our research findings indicated that the ASR for mental disorders was highest in high SDI and lowest in parts of Sub-Saharan Africa and Asia, consistent with
previous studies [26]. The escalating burden of mental health is primarily attributed to population growth and aging, rather than an increase in disease prevalence [27]. In addition, Sub-Saharan Africa and parts of Asia had the lowest coverage of epidemiological data, and therefore there is more uncertainty surrounding estimates [7]. Although the ASIR for mental disorders was on the rise in most regions, the incidence of mental disorders in East Asia continued to decline.
Nationally, our study found that the countries with the highest DALYs for mental disorders were Greenland, Greece, the United States, and Australia; which is consistent with previous research results [7]. One of the countries with the lowest incidence rate was China. The possible reasons may lie in the following aspects: (1) Data on the incidence of mental disorders in China primarily originate from national health service surveys, disease monitoring, and published literature. However, there may exist systematic errors in data collection methods. For instance, while the multi-stage stratified cluster sampling approach used in large-scale epidemiological surveys in China, such as the 2019 China Mental Health Survey, is representative, its household survey mode may lead to inadequate coverage of highly mobile migrant worker populations and remote rural residents [28, 29]. (2) Despite the increased awareness of mental health issues among the Chinese public in recent years, acceptance remains insufficient compared to other countries. Existing research suggests that this discrepancy may stem from deep-seated cultural factors [30, 31]. As the core of traditional Chinese culture, Confucianism places greater emphasis on social harmony rather than individual psychological states. Its strong focus on self-restraint through adherence to social norms has led many Chinese people to internalize their psychological issues rather than seek professional help [32]. Furthermore, mental illnesses are often perceived as “character flaws” rather than medical problems, and in many cases, they are even considered morally unacceptable. This perception complicates the accurate diagnosis and timely treatment of mental illnesses [33].
with other studies [6, 34]. Females had a higher DALYs for anxiety disorders, major depressive disorder, bipolar disorder, dysthymia, anorexia nervosa, bulimia nervosa and idiopathic developmental intellectual disability compared to males. Despite the higher burden of mental disorders among females, the rate of DALYs for multiple
which in some cases leads to divorce and family exclusion [36]. People living with HIV can be depressed for many reasons, such as physical discomfort, disease progression, and the fear of mortality. On the other hand, High-income North America experiences higher levels of social stress. Studies have found that social stress is a recognized risk factor for depression [37].
In this study, we estimated a continuous significant increase in the burden of major depressive disorder and anxiety disorders following the COVID-19 pandemic,
which may be associated with increasing SARS-CoV-2 infection rates and decreasing human mobility [5]. Research demonstrated that the SARS-CoV-2 infection could lead to the development of mental disorder and suicide behaviors [38, 39]. During the pandemic, people may be exposed to a wide sort of stressful or traumatic events, such as social isolation, being quarantined or infected, which can increase perceived anxiety, depression, disturbing sleep, and quality of life [40]. Our study also found that while the DALYs of schizophrenia was high, the ASR of schizophrenia globally had not changed significantly, with the ASR even slightly decreasing between 2019 and 2021.
The heavy burden of mental disorders has become a widespread public health challenge faced by countries worldwide. Although there is no significant correlation between the burden of mental disorders and the level of social development, the shortage of mental health resources in low- and middle-income countries inexorably leads to disparities in service accessibility [41]. According to the WHO 2020 Mental Health Atlas, highincome regions such as Europe have an average of 9.7 psychiatrists per 100,000 people, whereas low- and mid-dle-income countries generally have less than 1 psychiatrist per 100,000 people. Specifically, in Africa, there is only 0.1 psychiatrist per 100,000 people. Therefore, policymakers need to integrate mental health into primary health care, prioritizing the training and recruitment of mental health professionals to bridge the resource gap. The COVID-19 pandemic has exacerbated the upward trend in mental health disorders, necessitating a swift response from public health systems. This response should entail strengthening mental health support and integrating psychological assistance into the disaster relief and early warning mechanism for major public health emergencies. Professionals should proactively intervene with affected individuals, providing access to services such as psychological crisis intervention hotlines. This will increase their opportunities to obtain mental health services, helping them cope with COVID-19-related psychological distress and thereby reducing the potential psychological harm caused by the pandemic [24].
Limitation
could further analyze attributable risk factors. Third, the COVID-19 pandemic has severely disrupted the global healthcare system, and the diagnosis, treatment, and care of patients with mental disorders have been greatly affected. This situation is likely to result in a notable increase in the burden of mental disorders post-pandemic. However, GBD 2021 categorizes COVID-19 as a separate disease with limited impact on mental disorders. The short time interval since the outbreak of the pandemic may not fully reflect this trend.
Conclusions
Abbreviations
| GBD | Global Burden of Disease |
| DALYs | Disability-adjusted life-years |
| ASIR | Age-standardized incidence rate |
| ASR | Age-standardized DALY rate |
| SDI | Socio-demographic index |
| APC | Annual percent change |
| AAPC | Average annual percentage change |
| WHO | World Health Organization |
Supplementary Information
Supplementary Material 2
Acknowledgements
Author contributions
Funding
Data availability
Declarations
Ethics approval and consent to participate
Consent for publication
Competing interests
Author details
Published online: 15 May 2025
References
- Schuch FB, Vancampfort D. Physical activity, exercise, and mental disorders: it is time to move on. Trends Psychiatry Psychother. 2021;43(3):177-84.
- Rehm J, Shield KD. Global burden of disease and the impact of mental and addictive disorders. Curr Psychiatry Rep. 2019;21(2):10.
- Charlson F, van Ommeren M, Flaxman A, Cornett J, Whiteford H, Saxena S. New WHO prevalence estimates of mental disorders in conflict settings: a systematic review and meta-analysis. Lancet. 2019;394(10194):240-8.
- Collaborators GDI. Global burden of 369 diseases and injuries in 204 countries and territories, 1990-2019: a systematic analysis for the global burden of disease study 2019. Lancet. 2020;396(10258):1204-22.
- Collaborators C-MD. Global prevalence and burden of depressive and anxiety disorders in 204 countries and territories in 2020 due to the COVID-19 pandemic. Lancet. 2021;398(10312):1700-12.
- Yang X, Fang Y, Chen H, Zhang T, Yin X, Man J, Yang L, Lu M. Global, regional and National burden of anxiety disorders from 1990 to 2019: results from the global burden of disease study 2019. Epidemiol Psychiatr Sci. 2021;30:e36.
- Collaborators GMD. Global, regional, and National burden of 12 mental disorders in 204 countries and territories, 1990-2019: a systematic analysis for the global burden of disease study 2019. Lancet Psychiatry. 2022;9(2):137-50.
- Freeman M. The world mental health report: transforming mental health for all. World Psychiatry. 2022;21(3):391-2.
- Daly M, Sutin AR, Robinson E. Longitudinal changes in mental health and the COVID-19 pandemic: evidence from the UK household longitudinal study. Psychol Med. 2022;52(13):2549-58.
- Wu Y, Deng Y, Wei B, Xiang D, Hu J, Zhao P, Lin S, Zheng Y, Yao J, Zhai Z, et al. Global, regional, and National childhood cancer burden, 1990-2019: an analysis based on the global burden of disease study 2019. J Adv Res. 2022;40:233-47.
- Collaborators GDI. Global incidence, prevalence, years lived with disability (YLDs), disability-adjusted life-years (DALYs), and healthy life expectancy (HALE) for 371 diseases and injuries in 204 countries and territories and 811 subnational locations, 1990-2021: a systematic analysis for the global burden of disease study 2021. Lancet. 2024;403(10440):2133-61.
- Li T, Zhang H, Lian M, He Q, Lv M, Zhai L, Zhou J, Wu K, Yi M. Global status and attributable risk factors of breast, cervical, ovarian, and uterine cancers from 1990 to 2021. J Hematol Oncol. 2025;18(1):5.
- Charlson FJ, Ferrari AJ, Santomauro DF, Diminic S, Stockings E, Scott JG, McGrath JJ, Whiteford HA. Global epidemiology and burden of schizophrenia: findings from the global burden of disease study 2016. Schizophr Bull. 2018;44(6):1195-203.
- Collaboration GCKD. Global, regional, and National burden of chronic kidney disease, 1990-2017: a systematic analysis for the global burden of disease study 2017. Lancet. 2020;395(10225):709-33.
- Jiang Q, Shu Y, Jiang Z, Zhang Y, Pan S, Jiang W, Liang J, Cheng X, Xu Z. Burdens of stomach and esophageal cancer from 1990 to 2019 and projection to 2030 in China: findings from the 2019 global burden of disease study. J Glob Health. 2024;14:04025.
- Mo ZY, Qin ZZ, Ye JJ, Hu XX, Wang R, Zhao YY, Zheng P, Lu QS, Li Q, Tang XY. The long-term spatio-temporal trends in burden and attributable risk factors of major depressive disorder at global, regional and National levels during 1990-2019: a systematic analysis for GBD 2019. Epidemiol Psychiatr Sci. 2024;33:e28.
- Yang X, Chen H, Sang S, Chen H, Li L, Yang X. Burden of all cancers along with attributable risk factors in China from 1990 to 2019: comparison with Japan, European union, and USA. Front Public Health. 2022;10:862165.
- Chen X, Zhang L, Chen W. Global, regional, and National burdens of type 1 and type 2 diabetes mellitus in adolescents from 1990 to 2021, with forecasts to 2030: a systematic analysis of the global burden of disease study 2021. BMC Med. 2025;23(1):48.
- Li J, Gao Z, Bai H, Wang W, Li Y, Lian J, Li Y, Feng Y, Wang S. Global, regional, and National total burden related to hepatitis B in children and adolescents from 1990 to 2021. BMC Public Health. 2024;24(1):2936.
- Li C, Zhang L, Zhang J, Jiao J, Hua G, Wang Y, He X, Cheng C, Yu H, Yang X, et al. Global, regional and National burden due to retinoblastoma in children aged younger than 10 years from 1990 to 2021. BMC Med. 2024;22(1):604.
- Li Y, Song W, Gao P, Guan X, Wang B, Zhang L, Yao Y, Guo Y, Wang Y, Jiang S, et al. Global, regional, and National burden of breast, cervical, uterine, and ovarian cancer and their risk factors among women from 1990 to 2021, and projections to 2050: findings from the global burden of disease study 2021. BMC Cancer. 2025;25(1):330.
- Kuang Z, Wang J, Liu K, Wu J, Ge Y, Zhu G, Cao L, Ma X, Li J. Global, regional, and national burden of tracheal, bronchus, and lung cancer and its risk factors from 1990 to 2021: findings from the global burden of disease study 2021. EClinicalMedicine 2024, 75:102804.
- Zhang X, Wu L, Li Y, Tao Z, Li N, Zhang H, Ren M, Wang K. The global burden of vascular intestinal diseases: results from the 2021 global burden of disease study and projections using bayesian age-period-cohort analysis. Environ Health Prev Med. 2024;29:71.
- Wu Y, Wang L, Tao M, Cao H, Yuan H, Ye M, Chen X, Wang K, Zhu C. Changing trends in the global burden of mental disorders from 1990 to 2019 and predicted levels in 25 years. Epidemiol Psychiatr Sci. 2023;32:e63.
- Collaborators IS-LDBIMD. The burden of mental disorders across the States of India: the global burden of disease study 1990-2017. Lancet Psychiatry. 2020;7(2):148-61.
- Collaborators GMM. Global, regional, and National levels of maternal mortality, 1990-2015: a systematic analysis for the global burden of disease study 2015. Lancet. 2016;388(10053):1775-812.
- Mokdad AH, Charara, Raghid E, Bcheraoui NJ, Collison M, Chew KKJ, Adrienne et al. The burden of mental disorders in the Eastern Mediterranean region, 1990-2015: findings from the global burden of disease 2015 study. Int J Public Health 2018, 63(Suppl 1):25-37.
- Huang Y, Liu Z, Wang H, Guan X, Chen H, Ma C, Li Q, Yan J, Yu Y, Kou C, et al. The China mental health survey (CMHS): I. background, aims and measures. Soc Psychiatry Psychiatr Epidemiol. 2016;51(11):1559-69.
- Huang Y, Wang Y, Wang H, Liu Z, Yu X, Yan J, Yu Y, Kou C, Xu X, Lu J, et al. Prevalence of mental disorders in China: a cross-sectional epidemiological study. Lancet Psychiatry. 2019;6(3):211-24.
- Shi-Jie F, Hong-Mei G, Li W, Bin-Hong W, Yi-Ru F, Gang W, Tian-Mei S. Perceptions of stigma and its correlates among patients with major depressive disorder: A multicenter survey from China. Asia Pac Psychiatry 2017, 9(3).
- Wong DF, Tsui HK, Pearson V, Chen EY, Chiu SN. Family burdens, Chinese health beliefs, and the mental health of Chinese caregivers in Hong Kong. Transcult Psychiatry. 2004;41(4):497-513.
- Ran MS, Hall BJ, Su TT, Prawira B, Breth-Petersen M, Li XH, Zhang TM. Stigma of mental illness and cultural factors in Pacific rim region: a systematic review. BMC Psychiatry. 2021;21(1):8.
- Yang LH, Chen FP, Sia KJ, Lam J, Lam K, Ngo H, Lee S, Kleinman A, Good B. What matters most: a cultural mechanism moderating structural vulnerability and moral experience of mental illness stigma. Soc Sci Med. 2014;103:84-93.
- Cheng Y, Fang Y, Zheng J, Guan S, Wang M, Hong W. The burden of depression, anxiety and schizophrenia among the older population in ageing and aged countries: an analysis of the global burden of disease study 2019. Gen Psychiatr. 2024;37(1):e101078.
- Maki PM, Kornstein SG, Joffe H, Bromberger JT, Freeman EW, Athappilly G, Bobo WV, Rubin LH, Koleva HK, Cohen LS, et al. Guidelines for the evaluation and treatment of perimenopausal depression: summary and recommendations. J Womens Health (Larchmt). 2019;28(2):117-34.
- Ironson G, Henry SM, Gonzalez BD. Impact of stressful death or divorce in people with HIV: A prospective examination and the buffering effects of religious coping and social support. J Health Psychol. 2020;25(5):606-16.
- Smith K. Mental health: a world of depression. Nature. 2014;515(7526):181.
- Lu S, Wei N, Jiang J, Wu L, Sheng J, Zhou J, Fang Q, Chen Y, Zheng S, Chen F, et al. First report of manic-like symptoms in a COVID-19 patient with no previous history of a psychiatric disorder. J Affect Disord. 2020;277:337-40.
- Noone R, Cabassa JA, Gardner L, Schwartz B, Alpert JE, Gabbay V. Letter to the editor: new onset psychosis and mania following COVID-19 infection. J Psychiatr Res. 2020;130:177-9.
- Holmes EA, O’Connor RC, Perry VH, Tracey I, Wessely S, Arseneault L, Ballard C, Christensen H, Cohen Silver R, Everall I, et al. Multidisciplinary research priorities for the COVID-19 pandemic: a call for action for mental health science. Lancet Psychiatry. 2020;7(6):547-60.
- Edwards N, Walker S, Paddick SM, Prina AM, Chinnasamy M, Reddy N, Mboya IB, Mtei M, Varghese M, Nakkasuja N, et al. Prevalence of depression and anxiety in older people in low- and middle- income countries in Africa, Asia and South America: A systematic review and meta-analysis. J Affect Disord. 2023;325:656-74.
- Jadambaa A, Thomas HJ, Scott JG, Graves N, Brain D, Pacella R. The contribution of bullying victimisation to the burden of anxiety and depressive disorders in Australia. Epidemiol Psychiatr Sci. 2019;29:e54.
Publisher’s note
Yangyan Fan and Ahui Fan contributed equally to this work.
*Correspondence:
Zhiping Yang
zpyang@fmmu.edu.cn
Daiming Fan
fandaim@fmmu.edu.cn
Full list of author information is available at the end of the article