DOI: https://doi.org/10.1186/s12903-023-03808-z
PMID: https://pubmed.ncbi.nlm.nih.gov/38243206
تاريخ النشر: 2024-01-20
عبء وجودة رعاية الاضطرابات الفموية على المستويات العالمية والإقليمية والوطنية: تحليل منهجي لدراسة العبء العالمي للمرض 1990-2017
الملخص
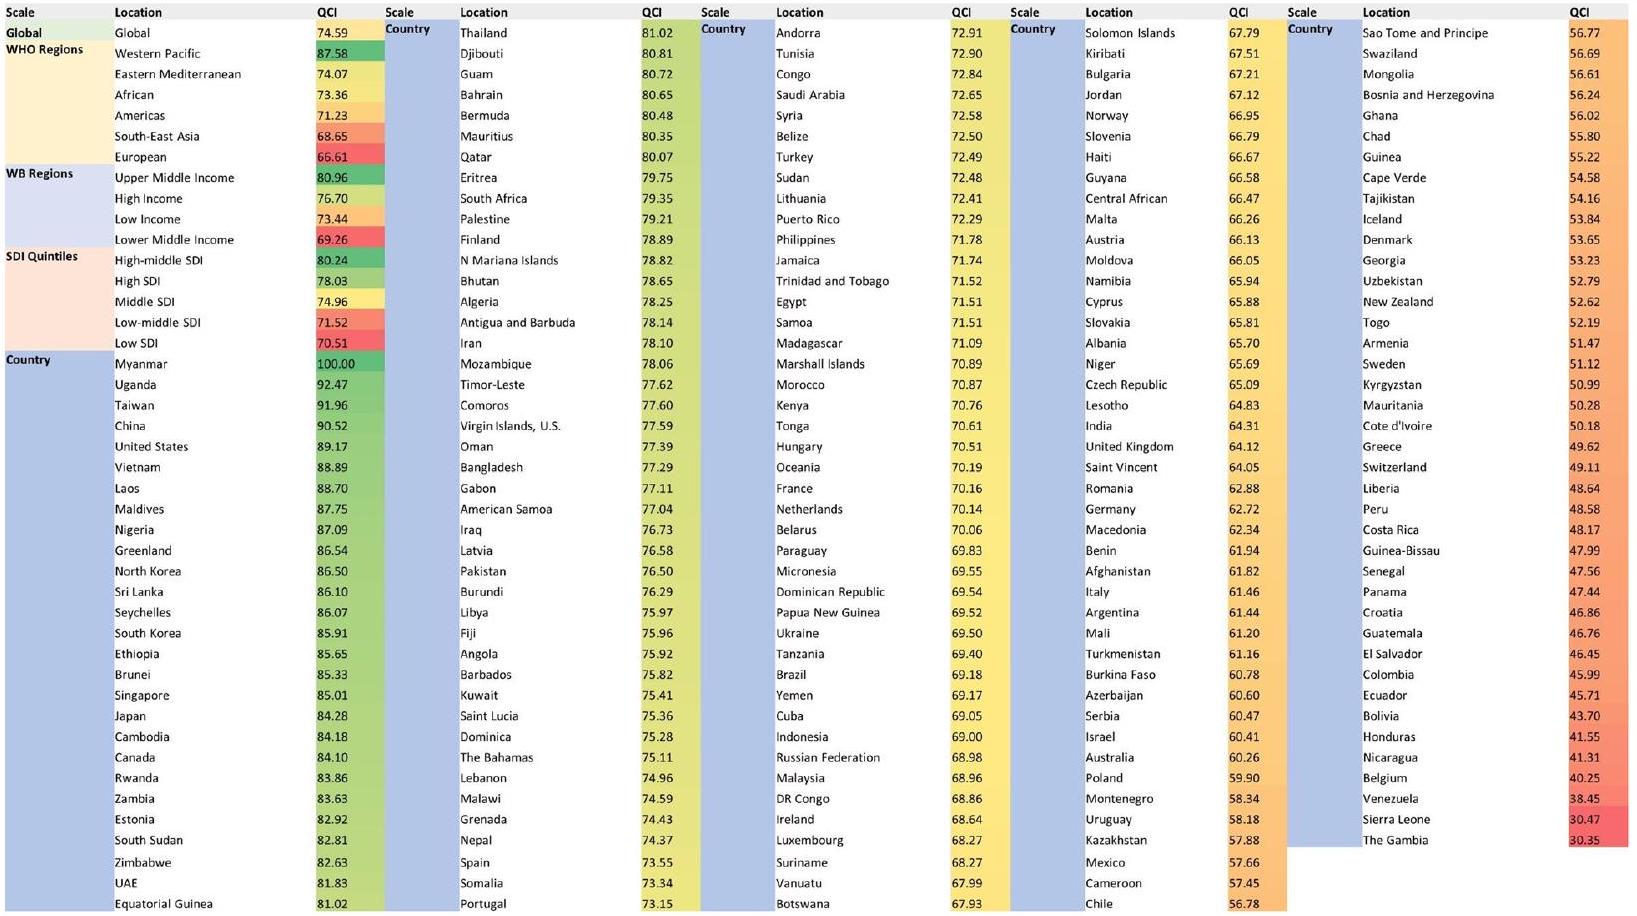
الخلفية: لا تزال الاضطرابات الفموية تمثل تحديًا كبيرًا للصحة العامة العالمية، نظرًا لطبيعتها المستمرة والمزمنة. حاليًا، لا يوجد مؤشر مباشر لقياس جودة الرعاية على نطاق السكان. لذلك، نهدف إلى اقتراح مؤشر جديد لقياس جودة الرعاية للاضطرابات الفموية على مستوى العالم. الطرق: قمنا بإنشاء قاعدة بياناتنا باستخدام بيانات دراسة العبء العالمي للأمراض (GBD) لعام 2017. من بين المتغيرات المختلفة مثل الانتشار، الحدوث، السنوات التي تم العيش فيها مع الإعاقة، وسنوات الحياة المعدلة حسب الإعاقة، استخدمنا تحليل المكونات الرئيسية (PCA) لتحديد المكون الذي يحمل أكبر نسبة من المعلومات لإنشاء مؤشر جودة الرعاية الجديد (QCI) للاضطرابات الفموية. النتائج: زاد مؤشر جودة الرعاية العالمي للاضطرابات الفموية تدريجيًا من 1990 إلى 2017 (من 70.5 إلى 74.6). لم يتم ملاحظة أي تفاوت كبير بين الجنسين خلال هذه الفترة، وكان نسبة التفاوت بين الجنسين (GDR) تعتبر مثالية في عامي 1990 و2017. بين عامي 1990 و2017، زاد مؤشر جودة الرعاية المعدل حسب العمر لجميع الاضطرابات الفموية في جميع مناطق SDI. كان أعلى مؤشر جودة للرعاية لجميع الاضطرابات الفموية في عام 2017 ينتمي إلى دول SDI المتوسطة العليا (=80.24)، وكانت أقل معدلات سنوات الحياة مع الإعاقة (YLDs) تُرى في الربع المنخفض من SDI. في عام 1990، كانت جودة الرعاية في الدول الأوروبية وآسيا الوسطى ودول أمريكا الوسطى والجنوبية في أدنى الأرباع، بينما كانت دول أمريكا الشمالية وآسيا الشرقية والشرق الأوسط وبعض الدول الأفريقية تتمتع بأعلى جودة لرعاية الأسنان. كانت ميانمار (=100)، أوغندا (=92.5)، تايوان (=92.0)، الصين (=92.5)، والولايات المتحدة (=89.2) هي الدول الخمس التي تمتلك أعلى مؤشر جودة للرعاية المعدل حسب العمر. وكانت نيكاراغوا (=41.3)، بلجيكا (=40.2)، فنزويلا (=38.4)، سيراليون (=30.5)، وغامبيا (=30.3) هي الدول الخمس التي تمتلك أقل قيم لمؤشر جودة الرعاية المعدل حسب العمر.
الكلمات المفتاحية: اضطرابات الفم، تسوس الأسنان، التهاب اللثة، فقدان الأسنان، عبء المرض، جودة الرعاية
مقدمة
كنموذج مثير للجدل جزئيًا، كان قياس جودة الرعاية موضوع اهتمام لفترة طويلة.
إن وجود مؤشر لمقارنة المناطق المختلفة من حيث جودة رعاية صحة الفم يمكن أن يساعد بشكل كبير في تحسين السياسات والنهج المستقبلية، حيث يمكن أن يمثل جودة الرعاية استنادًا إلى المؤشرات الوبائية المتاحة. نظرًا لأن دراسة العبء العالمي للأمراض 2017 تقدم بيانات شاملة لـ 354 مرضًا في 195 دولة حول العالم وتقيّم فقط عبء الأمراض الفموية دون التعمق في تقييمات الجودة، فقد هدفنا إلى قياس جودة الرعاية للاضطرابات الفموية باستخدام مؤشر قمنا بتطويره. الاضطرابات الفموية التي تهم دراستنا هي تسوس الأسنان (مؤقت أو دائم)، التهاب اللثة، فقدان الأسنان الكامل أو الشديد، وغيرها من الاضطرابات الفموية استنادًا إلى تصنيف GBD للاضطرابات الفموية.
طرق
1)
في الحالات، التي يتم توضيحها بشكل أكبر على أنها رعاية أفضل و/أو وقاية أفضل. نسبة الانتشار إلى الحدوث تظهر فعالية برامج الوقاية (إن وجدت) حيث تشير القيم المنخفضة إلى حالة صحة فموية أفضل. من بين هذه المؤشرات، يمكن تحديد اتجاه كل منها بسهولة. على سبيل المثال، قد تعني القيم الأعلى لنسبة الانتشار إلى الحدوث رعاية أفضل و/أو وقاية أفضل بين المرضى. تشير نسبة الانتشار إلى الحدوث الأعلى إلى انتشار أعلى في معدل حدوث ثابت، مما يدل على تشخيص أكثر دقة، وزيادة في العمر الافتراضي، وجودة رعاية أفضل. تكون نسبة سنوات الحياة المعدلة حسب الإعاقة إلى الانتشار مرتفعة عندما يكون هناك عبء مرتفع من المرض (بسبب إما الوفيات أو المراضة) في البلاد. تشير القيم الأعلى لنسبة سنوات الحياة المعدلة حسب الإعاقة إلى الانتشار إلى عبء وإعاقة أكبر في معدل انتشار محدد.
بخلاف مؤشر جودة الرعاية الشاملة للاضطرابات الفموية، تم حسابه بشكل منفصل لتسوس الأسنان اللبنية، وتسوس الأسنان الدائمة، وأمراض اللثة، وفقدان الأسنان. أثناء تقييم توزيع مؤشرات الجودة، قمنا بتصنيف المناطق بناءً على نهجين: تصنيف المؤشر الاجتماعي الديموغرافي. يمكن أن يمثل هذا التصنيف حالة التنمية في منطقة ما بناءً على عوامل مختلفة (مثل متوسط الدخل الاقتصادي للفرد، ومتوسط التحصيل التعليمي، ومعدلات الخصوبة). لتقييم عدم المساواة بين الجنسين في كل بلد، استخدمنا نسبة التفاوت بين الجنسين، وهي نسبة الذكور إلى الإناث لمؤشرات الجودة. فيما يتعلق بقيم نسبة التفاوت بين الجنسين، تم تحديد خمسة خُمس.
الأعمار تحت 20 عامًا تُعتبر “طفولة ومراهقة”، من 20 إلى 65 تُعتبر “بلوغ”، وما فوق 65 تُعتبر “كبار السن”.
التحقق
التحليل الإحصائي
النتائج
عبء الاضطرابات الفموية
| معدل سنوات الحياة المعدلة حسب الإعاقة في عام 2017 (لكل 100,000) | تغير سنوات الحياة المعدلة حسب الإعاقة من 1990 إلى 2017 (%) | QCI في 2017 (%) | تغيير QCI من 1990 إلى 2017 (%) | |
| عالمي | ||||
| جميع الاضطرابات الفموية | ٢٢٨.٨ (١٣٧.٥، ٣٥٣.٧) | -4.0 (-5.7، -2.4) | ٧٤.٦ | ٤.١ |
| تسوس الأسنان اللبنية | 2.0 (0.9, 4.1) | -9.0 (-11.0، -7.3) | 81.89 | 2.69 |
| تسوس الأسنان الدائمة | 20.7 (8.9, 39.2) | -11.9 (-13.4, -10.3) | 77.2 | ٧.٧ |
| مرض اللثة | ٦٣.٥ (٢٥.٠، ١٣٠.٣) | 6.0 (5.2، 6.8) | 71.1 | -2.2 |
| فقدان الأسنان | 91.7 (61.3, 129.9) | -10.1 (-10.9، -9.3) | 61.2 | -5.0 |
| اضطرابات فموية أخرى | 50.9 (31.8, 74.7) | 0.2 (-0.1, 0.6) | غير متوفر | غير متوفر |
| كوانتيلز إس دي آي | ||||
| خمس أعلى من مؤشر التنمية الاجتماعية | ||||
| جميع الاضطرابات الفموية | ٢١٩.٤ (١٣٦.٠، ٣٣٢.٨) | -16.2 (-17.7, -14.9) | 78.03 | ١٣.٧٧ |
| تسوس الأسنان اللبنية | 2.2 (1.0, 4.5) | -7.7 (-12.2, -3.7) | 84.15 | 3.43 |
| تسوس الأسنان الدائمة | ٢٧.٦ (١٢.٠، ٥٣.٦) | -10.9 (-12.2, -9.5) | 69.46 | 12.15 |
| مرض اللثة | 42.1 (16.6, 86.7) | -15.3 (-17.3, -13.2) | 73.26 | -1.02 |
| فقدان الأسنان | ٩٦.٧ (٦٤.٣، ١٣٨.١) | -24.3 (-25.5, -23.0) | ٧٥.٧٠ | -0.38 |
| اضطرابات فموية أخرى | 50.8 (31.7, 75.3) | -0.1 (-0.6, 0.5) | غير متوفر | غير متوفر |
| الخمسة العليا – الوسطى لمؤشر التنمية البشرية | ||||
| جميع الاضطرابات الفموية | 238.4 (146.8, 364.1) | -4.7 (-6.2, -3.3) | 80.24 | ٥.٨١ |
| تسوس الأسنان اللبنية | 2.5 (1.1, 4.9) | -4.1 (-7.5، -1.6) | 80.88 | 2.65 |
| تسوس الأسنان الدائمة | 20.9 (9.1, 39.9) | -12.6 (-13.8، -11.0) | ٨٣.٢٤ | 8.27 |
| مرض اللثة | ٥٦.٩ (٢٢.٤، ١١٦.٥) | 5.2 (3.8، 6.5) | 78.92 | -4.04 |
| فقدان الأسنان | 107.1 (71.6, 151.6) | -9.7 (-10.4، -9.1) | 78.86 | 1.84 |
| اضطرابات فموية أخرى | 51.0 (31.8, 75.3) | 0.0 (-0.6, 0.6) | غير متوفر | غير متوفر |
| الخمسة الوسطى لمؤشر التنمية المستدامة | ||||
| جميع الاضطرابات الفموية | ٢٣٧.٢ (١٤١.٣، ٣٦٩.٠) | ٤.٤ (٣.٨، ٥.١) | ٧٤.٩٦ | 1.47 |
| تسوس الأسنان اللبنية | 2.4 (1.0, 4.7) | -2.1 (-5.0, 0.4) | 79.93 | 1.97 |
| تسوس الأسنان الدائمة | ٢٠.٣ (٨.٨، ٣٨.٠) | -5.3 (-6.7, -3.8) | 80.06 | 5.09 |
| مرض اللثة | 69.6 (27.5, 142.0) | 5.7 (4.8, 6.6) | ٧٠.٠٠ | -0.85 |
| فقدان الأسنان | 93.8 (62.5, 133.0) | 8.5 (7.7, 9.2) | 81.45 | -0.48 |
| اضطرابات فموية أخرى | ٥١.١ (٣١.٩، ٧٥.٥) | 0.3 (-0.2, 0.8) | غير متوفر | غير متوفر |
| خمسية SDI المنخفضة-المتوسطة | ||||
| جميع الاضطرابات الفموية | ٢٢٨.٣ (١٣٤.٧، ٣٥٨.٠) | 6.0 (4.9, 7.2) | 71.52 | -0.37 |
| تسوس الأسنان اللبنية | 1.7 (0.7, 3.5) | -11.5 (-13.9، -8.9) | ٨٤.٩٠ | 1.88 |
| تسوس الأسنان الدائمة | 16.7 (7.3, 31.6) | -10.3 (-11.5، -8.9) | 80.27 | ٦.٩٠ |
| مرض اللثة | ٧٦.٧ (٣٠.٣، ١٥٥.٥) | 7.0 (5.6, 8.5) | 61.76 | -1.92 |
| فقدان الأسنان | 82.4 (54.8, 115.9) | 13.4 (12.4، 14.4) | 81.11 | -1.53 |
| اضطرابات فموية أخرى | 50.7 (31.7, 74.4) | 0.6 (-0.2, 1.4) | غير متوفر | غير متوفر |
| خمسية مؤشر التنمية البشرية المنخفضة والمتوسطة | ||||
| جميع الاضطرابات الفموية | 201.5 (115.0, 324.1) | 5.7 (4.6, 6.6) | 70.51 | 0.53 |
| تسوس الأسنان اللبنية | 1.8 (0.8, 3.6) | -4.9 (-8.0, -1.9) | ٨٣.٨٩ | 1.44 |
| تسوس الأسنان الدائمة | 19.3 (8.4, 36.1) | -5.7 (-7.2، -4.5) | 69.55 | 5.78 |
| مرض اللثة | 75.6 (29.8, 154.7) | 10.1 (8.0, 11.6) | ٥٧.٨٣ | -3.48 |
| فقدان الأسنان | ٥٤.٢ (٣٥.٩، ٧٦.٧) | 9.6 (7.9, 11.1) | ٨٣.٥٦ | -1.34 |
| اضطرابات فموية أخرى | 50.6 (31.7, 74.2) | 0.8 (-0.1, 1.7) | غير متوفر | غير متوفر |
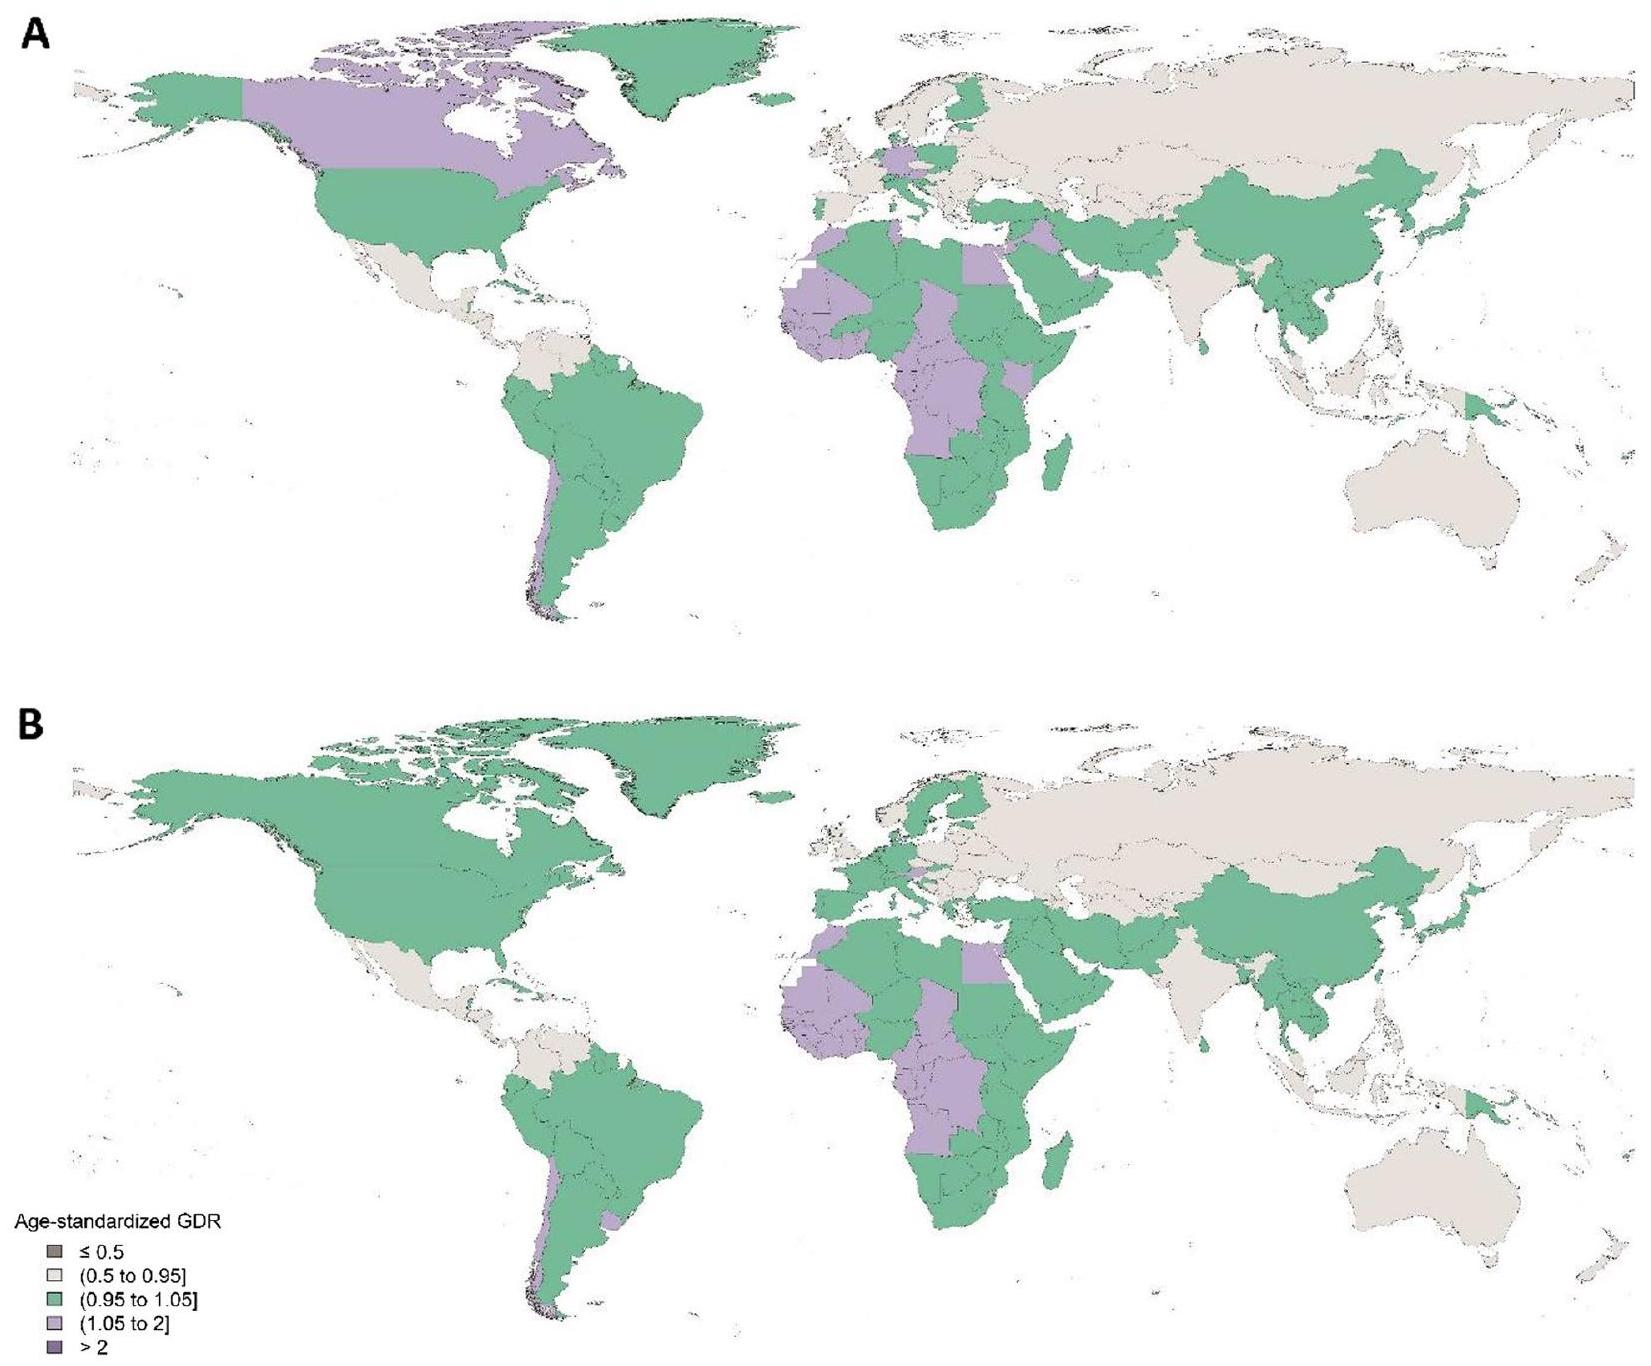
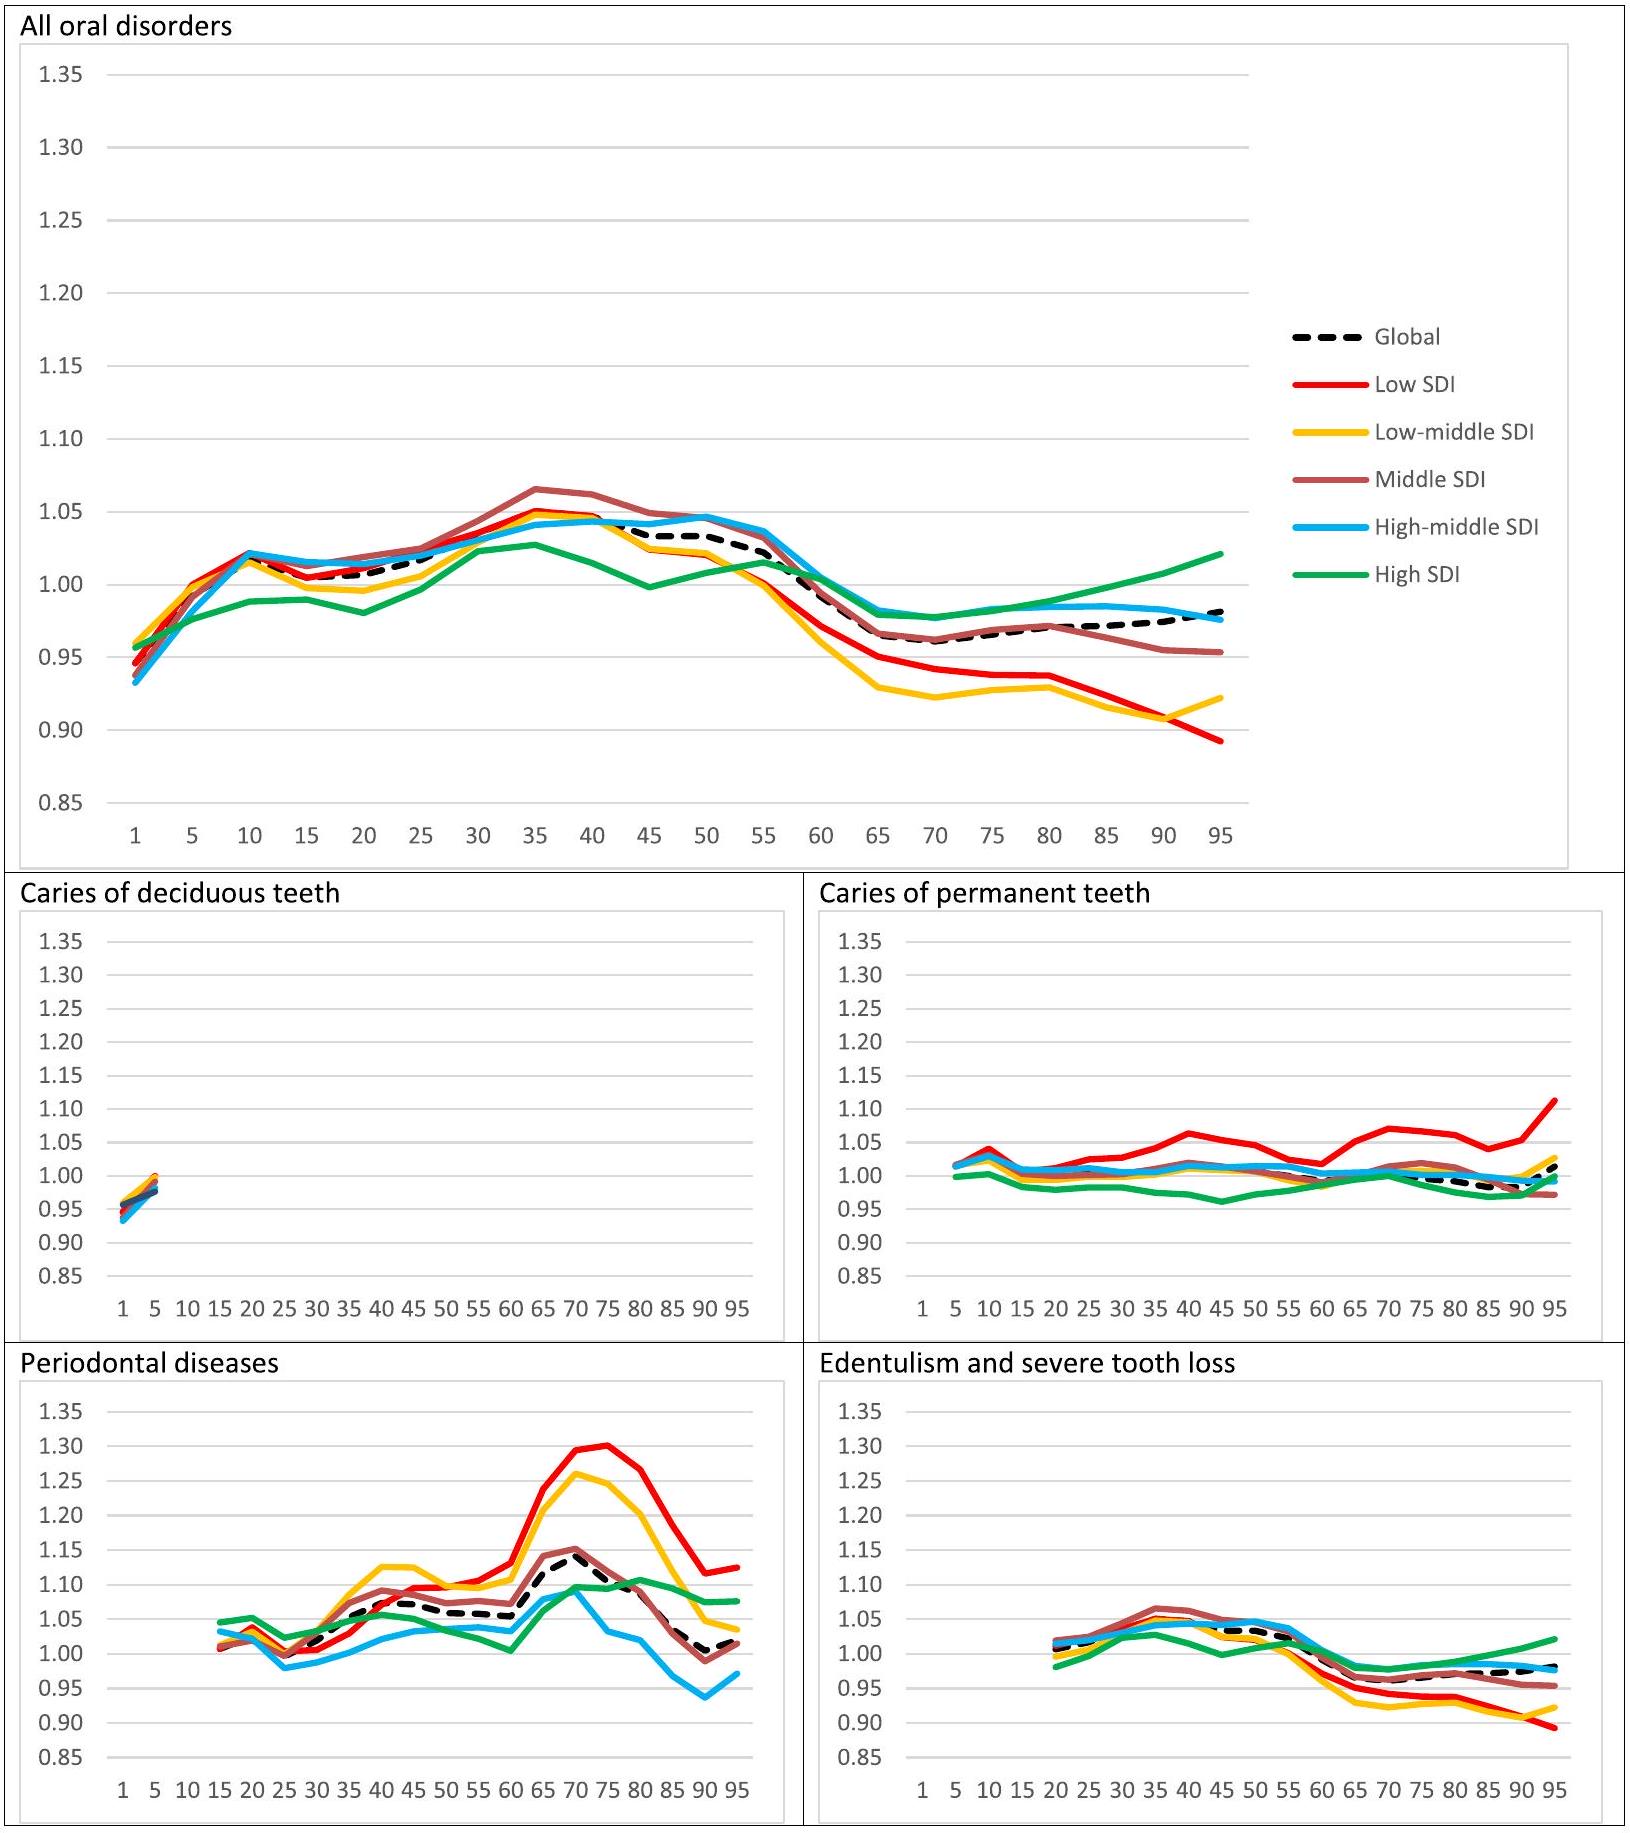
مؤشر جودة الرعاية وعدم المساواة بين الجنسين
مقارنة بـ 76.0) (الشكل 2). كانت نسبة الفجوة بين الجنسين 1.05 في كل من عامي 1990 و 2017.
أ
ب
مؤشر جودة الرعاية بين الدول
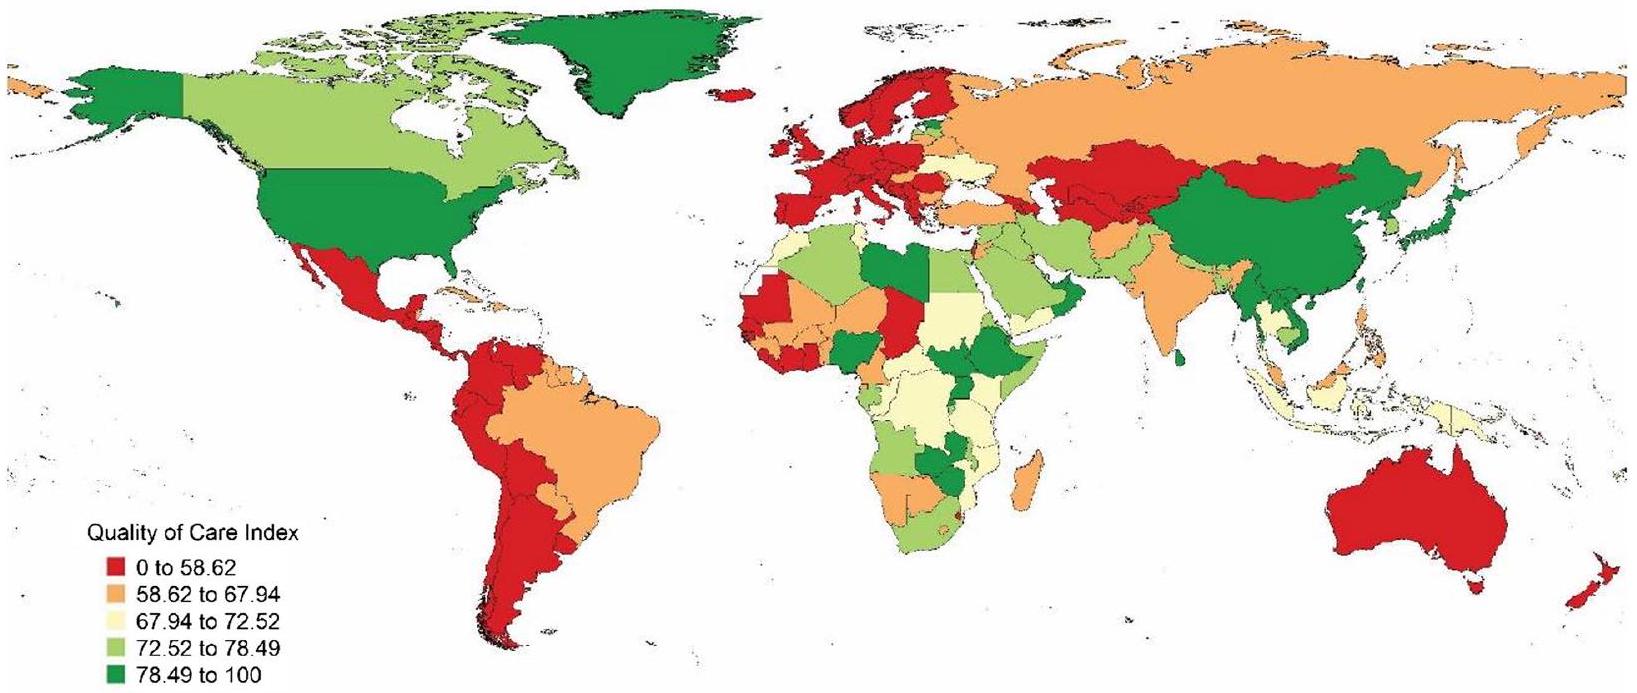
في الدول الأوروبية وجنوب أفريقيا خلال هذه السنوات الـ28، كان مؤشر بلجيكا أقل بثلاثة سيغما من المتوسط من 1990 إلى 2005. يظهر الشكل 5 مؤشر جودة الرعاية العالمي والإقليمي والدولة حسب الدولة في عام 2017.
نقاش
عرفنا الاضطرابات الفموية على أنها جميع الحالات المرضية التي تحدث في تجويف الفم باستثناء سرطانات الشفاه وتجويف الفم. لا تؤدي أي من هذه الحالات – بما في ذلك تسوس الأسنان، والأمراض اللثوية، وفقدان الأسنان، والاضطرابات الأخرى – مباشرة إلى الوفاة. بالإضافة إلى ذلك، فإن الاضطرابات الفموية هي حالات طويلة الأمد، وقد أثبتت إدارتها مرارًا أنها تحدٍ لأنظمة الرعاية الصحية في جميع أنحاء العالم [1،21،22].
تم اقتراح العديد من السياسات واسعة النطاق للتخفيف من عبء الاضطرابات الفموية على أنظمة الرعاية الصحية، بما في ذلك إضافة الرعاية السنية إلى التغطية الصحية الشاملة بمساعدة طب الأسنان التدخلي الأدنى، واتباع نهج وقائي لاعتراض الاضطرابات الفموية في مرحلة البدء، والسيطرة على عوامل الخطر المشتركة (مع الأمراض النظامية الأخرى)، وإدارة المحددات الاجتماعية والتجارية للاضطرابات الفموية [1،
مقترحة كعوامل خطر شائعة تؤثر بشكل رئيسي على حالة صحة الفم [1،24،25]، يجب أن تركز السياسات المقترحة لتحسين صحة الفم أيضًا على هذه العوامل [25-29].
حقيقة أن الدول ذات الدخل المنخفض كانت لديها أقل عبء من تسوس الأسنان غير المعالج في عام 2017 – حيث أن النظام الغذائي التقليدي منخفض في الكربوهيدرات [31، 32] – مع خيار فعال من حيث التكلفة لتخفيف الأعراض لدى المرضى (استخراج الأسنان) [33]. من المحتمل أن تكون الظروف الاقتصادية قد قيدت وصولهم إلى علاجات فعالة للأمراض اللثوية أو فقدان الأسنان الكامل (عبر إعادة التأهيل اللثوي أو الخيارات التعويضية) [34-36].
بالنسبة لجميع الاضطرابات الفموية، كانت بلجيكا هي الدولة الوحيدة بين الدول الأوروبية التي كانت قيمة مؤشر جودة الرعاية لديها أقل بثلاثة سيغما من المتوسط من 1990 إلى 2005. كما كانت لديها رابع أدنى مؤشر جودة للرعاية في عام 2017 لجميع الاضطرابات الفموية. عند الفحص المتعمق، وجدنا أن ما يقرب من
في عام 2017، بينما كانت الدول ذات الدخل المتوسط العالي والعالي لديها أقل معدل لسنوات العجز بسبب تسوس الأسنان وأمراض اللثة، أظهرت عمومًا قيم جودة الرعاية الصحية لأمراض اللثة أعلى من تلك التي تتمتع بحالة منخفضة أو متوسطة منخفضة. يمكن تفسير هذه الحقيقة بمعرفة أن هذه الدول قد خفضت بالفعل استهلاكها للسكر ولديها بشكل طبيعي وصول أفضل إلى علاجات اللثة الأكثر تعقيدًا.
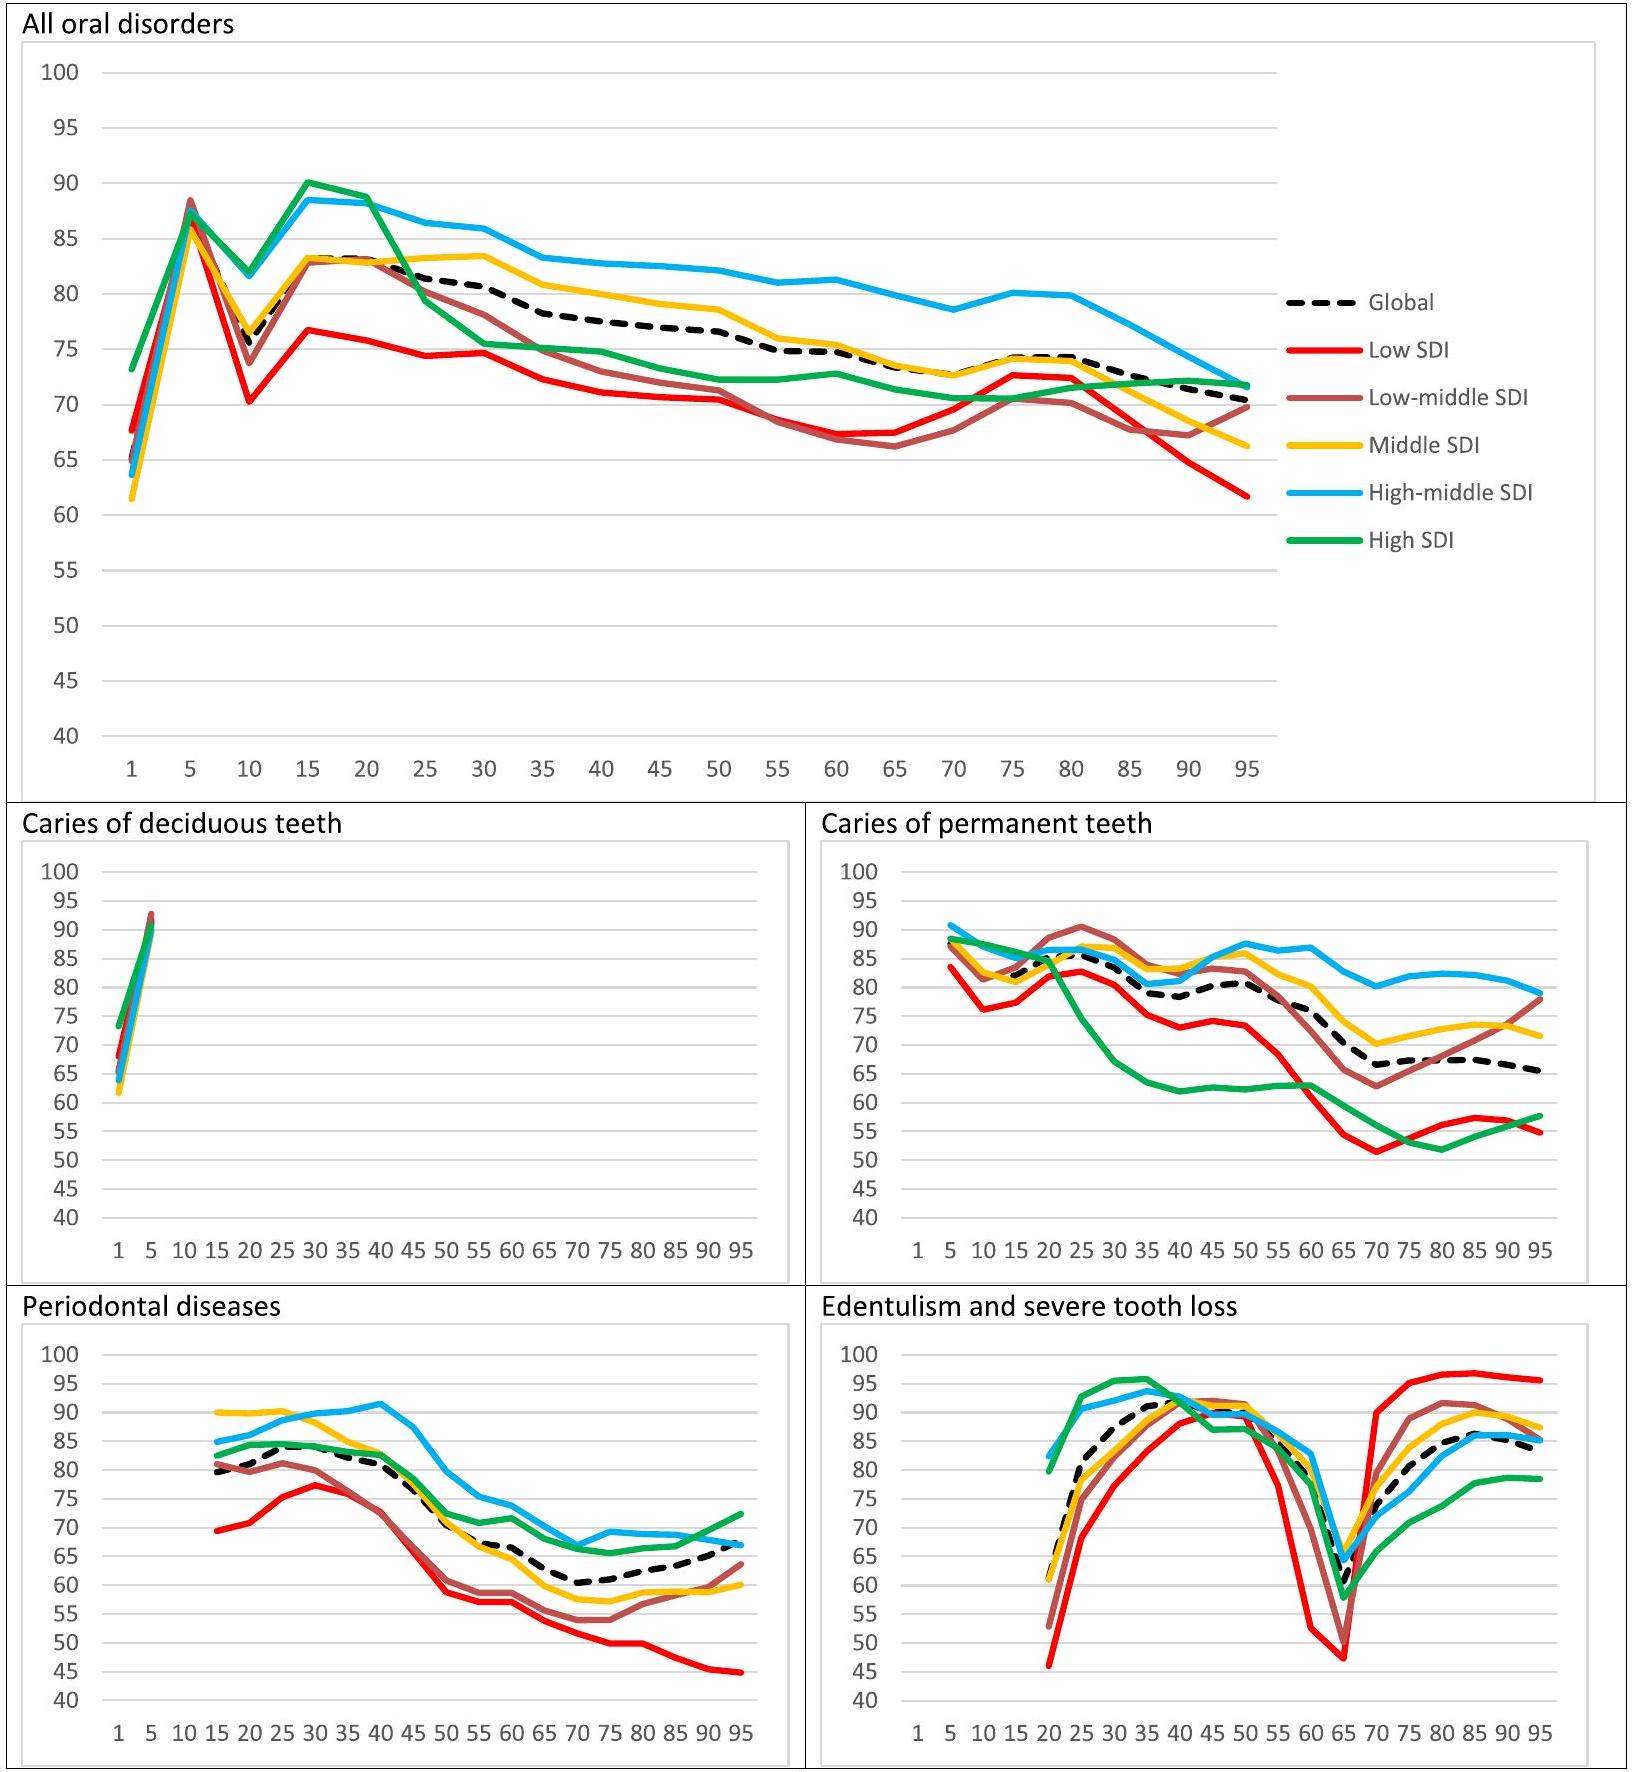
عند النظر إلى أنماط العمر العالمية لمؤشر جودة الرعاية (QCI)، من المثير للاهتمام أن هناك ذروتين حدثتا في جودة الرعاية، وكلاهما في فئة الأطفال والمراهقين. وهذا يعكس نجاح الأساليب الوقائية في الفئات العمرية دون العشرين عامًا في تقليل انتشار وأعباء الاضطرابات الفموية على مستوى العالم. ومن الجدير بالذكر أن الدول ذات الدخل المنخفض والمتوسط المنخفض أظهرت ذروات أقل من نظرائها. على الصعيد العالمي، تقلبت جودة الرعاية لجميع الاضطرابات الفموية في اتجاه تنازلي مع تقدم العمر. وهذا يدعم المخاوف المتزايدة لتوفير رعاية أسنان عالية الجودة لفئات البالغين وكبار السن وتلبية احتياجاتهم في جميع أنحاء العالم. أظهرت تسوس الأسنان الدائمة نمطًا مشابهًا جدًا لمؤشر جودة الرعاية بين الفئات العمرية، مما يشير إلى الحاجة إلى الانتباه إلى الأسنان الدائمة ومشاكلها المستمرة لدى الأفراد الأكبر سنًا. ومع ذلك، انخفض مؤشر جودة الرعاية بشكل حاد.
في الفئة العمرية من 65 إلى 70 عامًا، لوحظت أمراض اللثة وفقدان الأسنان، ثم ارتفعت الأرقام نحو مستويات أعلى. كانت الانخفاضات والتعافي أكثر حدة بالنسبة لفقدان الأسنان. يمكن تفسير هذه النتائج بحقيقة أن عدد الأسنان المتبقية قد انخفض على الأرجح إلى أدنى مستوى له قبل بدء فئة “كبار السن”. وهذا يعني أساسًا تخفيفًا طبيعيًا لمشاكل اللثة (حيث تم فقدان الأسنان ذات التوقعات غير المواتية بالفعل). بعد هذه المرحلة، من المحتمل أن يسعى المرضى المسنون إلى حلول تعويضية وعلاجات تأهيلية بشكل أكثر نشاطًا، ومن ثم الزيادة الحادة في مؤشر فقدان الأسنان في أولئك الذين تزيد أعمارهم عن 70 عامًا.
القيود
الخاتمة
يوصى بالاهتمام بفقدان الأسنان الكلي في البلدان ذات الدخل المرتفع وإعطاء الأولوية لتوفير الرعاية الصحية الأولية في البلدان ذات الدخل المنخفض.
الاختصارات
| جي بي دي | عبء المرض العالمي |
| YLLs | سنوات الحياة المفقودة |
| عائدات السندات | سنوات العيش مع الإعاقة |
| سنوات الحياة المعدلة بالإعاقة | سنوات الحياة المعدلة حسب الإعاقة |
| تحليل المكونات الرئيسية | تحليل المكونات الرئيسية |
| SDI | مؤشر السوسيوديموغرافي |
| ج.د.ر | نسبة الفجوة بين الجنسين |
| QCI | مؤشر جودة الرعاية |
| حقي | مؤشر الوصول إلى الرعاية الصحية وجودتها |
معلومات إضافية
ملف إضافي 1.
شكر وتقدير
مساهمات المؤلفين
تمويل
توفر البيانات والمواد
الإعلانات
موافقة الأخلاقيات والموافقة على المشاركة
موافقة على النشر
المصالح المتنافسة
تفاصيل المؤلف
نُشر على الإنترنت: 20 يناير 2024
References
- Peres MA, Macpherson LM, Weyant RJ, Daly B, Venturelli R, Mathur MR, et al. Oral diseases: a global public health challenge. Lancet. 2019;394(10194):249-60.
- Shoaee S, Saeedi Moghaddam S, Masinaei M, Sofi-Mahmudi A, Hessari H, Heydari M-H, et al. Trends in dental caries of deciduous teeth in Iran: a systematic analysis of the national and sub-national data from 1990 to 2017. BMC Oral Health. 2022;22(1):634.
- Kassebaum N, Smith A, Bernabé E, Fleming T, Reynolds A, Vos T, et al. Global, regional, and national prevalence, incidence, and disabilityadjusted life years for oral conditions for 195 countries, 1990-2015: a systematic analysis for the global burden of diseases, injuries, and risk factors. J Dent Res. 2017;96(4):380-7.
- Righolt A, Jevdjevic M, Marcenes W, Listl S. Global-, regional-, and country-level economic impacts of dental diseases in 2015. J Dent Res. 2018;97(5):501-7.
- Guay AH . The differences between dental and medical care: implications for dental benefit plan design. J Am Dent Assoc. 2006;137(6):801-6.
- Shoaee S, Heydari M-H, Hessari H, Mehrdad N, Khalilazar L, Hatami B, et al. Development and initial validation of the comprehensive geriatric Oral health assessment tool. Clin Exp Dent Res. 2023;9(5):879-86.
- Shoaee S, Masinaei M, Moghaddam SS, Sofi-Mahmudi A, Hessari H, Shamsoddin E, Heydari MH, Larijani B, Fakhrzadeh H, Farzadfar F. National and subnational trend of dental caries of permanent teeth in Iran, 1990-2017. Int Dent J. 2024;74(1):129-37.
- Watt RG, Daly B, Allison P, Macpherson LM, Venturelli R, Listl S, et al. Ending the neglect of global oral health: time for radical action. Lancet. 2019;394(10194):261-72.
- Quentin W, Partanen V-M, Brownwood I, Klazinga N. Measuring healthcare quality. In: Improving healthcare quality in Europe; 2019. p. 31.
- Hanefeld J, Powell-Jackson T, Balabanova D. Understanding and measuring quality of care: dealing with complexity. Bull World Health Organ. 2017;95(5):368-74.
- Campbell S, Tickle M. What is quality primary dental care? Br Dent J. 2013;215(3):135.
- Chen A , Jacobsen KH , Deshmukh AA , Cantor SB . The evolution of the disability-adjusted life year (DALY). Socio Econ Plan Sci. 2015;49:10-5.
- GBD 2017. Disease and Injury Incidence and Prevalence Collaborators. Global, regional, and national incidence, prevalence, and years lived with disability for 354 diseases and injuries for 195 countries and territories, 1990-2017: a systematic analysis for the Global Burden of Disease Study 2017. Lancet (London, England). 2018;392(10159):1789-858.
- Sofi-Mahmudi A, Masinaei M, Shamsoddin E, Tovani-Palone MR, Heydari M-H, Shoaee S, et al. Global, regional, and national burden and quality of care index (QCI) of lip and oral cavity cancer: a systematic analysis of the global burden of disease study 1990-2017. BMC Oral Health. 2021;21(1):558.
- Rencher AC, Schimek M. Methods of multivariate analysis. Comput Stat. 1997;12(4):422.
- Mohammadi E, Ghasemi E, Saeedi Moghaddam S, Yoosefi M, Ghanbari A, Ahmadi N, Masinaei M, Roshani Sh, Ebrahimi N, Rouhifard Khalilabad M, Nasserinejad M, Azadnajafabad S, Mohajer B, Mohebi F, Rezaei N, Mokdad A, Larijani B, Farzadfar F. Quality of care index (QCI). protocolsio. 2020;2021(24 Jan 2021).
- Global Burden of Disease Collaborative Network. Global Burden of Disease Study 2017 (GBD 2017) Socio-Demographic Index (SDI) 1950-2017. Seattle, United States of America: Institute for Health Metrics and Evaluation (IHME); 2018.
- Pande PS, Holpp L. What is six sigma?. McGraw-Hill Professional; 2001.
- GBD 2016. Healthcare Access and Quality Collaborators. Measuring performance on the Healthcare Access and Quality Index for 195 countries and territories and selected subnational locations: a systematic analysis from the Global Burden of Disease Study 2016. Lancet (London, England). 2018;391(10136):2236-71.
- Aminorroaya A, Yoosefi M, Rezaei N, Shabani M, Mohammadi E, Fattahi N , et al. Global, regional, and national quality of care of ischaemic heart disease from 1990 to 2017: a systematic analysis for the global burden of disease study 2017. Eur J Prev Cardiol. 2021;29(2):371-9.
- Bernabe E, Marcenes W, Hernandez CR, Bailey J, Abreu LG, Alipour V, et al. Global, regional, and National Levels and trends in burden of Oral conditions from 1990 to 2017: a systematic analysis for the global burden of disease 2017 study. J Dent Res. 2020;99(4):362-73.
- Lindroos EK, Saarela RKT, Suominen MH, Muurinen S, Soini H, Kautiainen H, et al. Burden of Oral symptoms and its associations with nutrition, wellbeing, and survival among nursing home residents. J Am Med Dir Assoc. 2019;20(5):537-43.
- Jin LJ, Lamster IB, Greenspan JS, Pitts NB, Scully C, Warnakulasuriya S. Global burden of oral diseases: emerging concepts, management and interplay with systemic health. Oral Dis. 2016;22(7):609-19.
- Sheiham A, Watt RG. The common risk factor approach: a rational basis for promoting oral health. Community Dent Oral Epidemiol. 2000;28(6):399-406.
- Watt RG, Sheiham A. Integrating the common risk factor approach into a social determinants framework. Community Dent Oral Epidemiol. 2012;40(4):289-96.
- Sheiham A, Williams DM. Reducing inequalities in Oral health in the Africa and Middle East region. Adv Dent Res. 2015;27(1):4-9.
- Petersen PE. The World Oral Health Report 2003: continuous improvement of oral health in the 21st century–the approach of the WHO Global Oral Health Programme. Community Dent Oral Epidemiol. 2003;31(Suppl 1):3-23.
- Watt RG, Petersen PE. Periodontal health through public health–the case for oral health promotion. Periodontology 2000. 2012;60(1):147-55.
- Mortazavi H, Sadeghian A, Hazrati P, Heydari M-H, Madihi S. Oral hemorrhagic blister and its possible related factors: analyzes of reported cases in the literature. J Oral Maxillofac Surg Med Pathol. 2023;35(4):358-67.
- Baiju RM, Peter E, Varghese NO, Sivaram R. Oral health and quality of life: current concepts. J Clin Diagnostic Res: JCDR. 2017;11(6):Ze21-ze6.
- Weeratunga P, Jayasinghe S, Perera Y, Jayasena G, Jayasinghe S. Per capita sugar consumption and prevalence of diabetes mellitus–global and regional associations. BMC Public Health. 2014;14:186.
- Singh GM, Micha R, Khatibzadeh S, Shi P, Lim S, Andrews KG, et al. Global, regional, and National Consumption of sugar-sweetened beverages, fruit juices, and Milk: a systematic assessment of beverage intake in 187 countries. PLoS One. 2015;10(8):e0124845.
- Elujoba AA, Odeleye O, Ogunyemi C. Traditional medicine development for medical and dental primary health care delivery system in Africa. Afr J Tradit Complement Altern Med. 2005;2(1):46-61.
- Diop M, Kanouté A, Diouf M, Ndiaye AD, Lo CMM, Faye D, et al. The role of health insurance in the coverage of oral health care in Senegal. J Public Health Africa. 2018;9(3):772.
- Roucka TM. Access to dental care in two long-term refugee camps in western Tanzania; programme development and assessment. Int Dent J. 2011;61(2):109-15.
- Moscowchi A, Moradian-Lotfi S, Koohi H, Sarrafan Sadeghi T. Levels of smoking and outcome measures of root coverage procedures: a systematic review and meta-analysis. Oral Maxillofac Surg. Published online August 2, 2023.
- Taylor Nelson Sofres PLC (TNS) and Social Survey Team. Oral health report – European Commission – Eurobarometer -Belgium. Belgium: Directorate General Health and Consumers; 2010.
- Elderton RJ. Clinical studies concerning re-restoration of teeth. Adv Dent Res. 1990;4:4-9.
- Sheiham A. Minimal intervention in dental care. Med Princ Pract. 2002;11(Suppl 1):2-6.
- Qvist V. Longevity of restorations – “the death spiral”. In Dental caries – The disease and its clinical management. 2nd ed. UK. 2008. p. 443-455.
- Opal S, Garg S, Jain J, Walia I. Genetic factors affecting dental caries risk. Aust Dent J. 2015;60(1):2-11.
- Werneck RI, Mira MT, Trevilatto PC. A critical review: an overview of genetic influence on dental caries. Oral Dis. 2010;16(7):613-23.
- Wittekind A, Walton J. Worldwide trends in dietary sugars intake. Nutr Res Rev. 2014;27(2):330-45.
- König J, Holtfreter B, Kocher T. Periodontal health in Europe: future trends based on treatment needs and the provision of periodontal services–position paper 1. Eur J Dent Educ. 2010;14(Suppl 1):4-24.
- Chae S, Lee Y, Kim J, Chun KH, Lee JK. Factors associated with perceived unmet dental care needs of older adults. Geriatr Gerontol Int. 2017;17(11):1936-42.
- López R, Smith PC, Göstemeyer G, Schwendicke F. Ageing, dental caries and periodontal diseases. J Clin Periodontol. 2017;44(Suppl 18):S145-s52.
- Stevens GA, Alkema L, Black RE, Boerma JT, Collins GS, Ezzati M, et al. Guidelines for accurate and transparent health estimates reporting: the GATHER statement. PLoS Med. 2016;13(6):e1002056.
ملاحظة الناشر
شيرفان شوايي وإرفان قاسمي هما المؤلفان الأولان بالتساوي.
يؤكد مؤلفو هذه الدراسة صراحةً أنه لم يكن هناك أي تضارب في المصالح في إجراء هذا العمل.
*المراسلة:
فرشاد فرزادفر
f-farzadfar@tums.ac.ir
القائمة الكاملة لمعلومات المؤلفين متاحة في نهاية المقال
DOI: https://doi.org/10.1186/s12903-023-03808-z
PMID: https://pubmed.ncbi.nlm.nih.gov/38243206
Publication Date: 2024-01-20
Check for updates
Global, regional, and national burden and quality of care index (QCI) of oral disorders: a systematic analysis of the global burden of disease study 1990-2017
Abstract
Background Oral disorders are still a major global public health challenge, considering their perpetuating and chronic nature. Currently, there is no direct index to measure the quality of care on a population scale. Hence, we aim to propose a new index to measure the quality of care for oral disorders worldwide. Methods We generated our database using the data from the Global Burden of Disease (GBD) study 2017. Among different variables such as prevalence, incidence, years lived with disability, and disability-adjusted life years, we utilised principal component analysis (PCA) to determine the component that bears the greatest proportion of information to generate the novel quality of care index (QCI) for oral disorders. Results Global QCI for oral disorders gradually increased from 1990 to 2017 (from 70.5 to 74.6). No significant gender disparity was observed during this period, and the gender disparity ratio (GDR) was considered optimal in 1990 and 2017. Between 1990 and 2017, the age-standardised QCI for all oral disorders increased in all the SDI regions. The highest QCI for all oral disorders in 2017 belonged to high-middle SDI countries (=80.24), and the lowest YLDs rate was seen in the low SDI quintile. In 1990, the quality of care in European, Central Asian, and Central and South American countries was in the lowest quintiles, whereas the North American, East Asian, Middle Eastern, and some African countries had the highest quality of dental care. Maynmar (=100), Uganda (=92.5), Taiwan (=92.0), China (=92.5), and the United States (=89.2) were the five countries with the highest age-standardised QCI. Nicaragua (=41.3), Belgium (=40.2), Venezuela (=38.4), Sierra Leone (=30.5), and the Gambia (=30.3) were the five countries with the least age-standardised QCI values.
Keywords Oral disorders, Tooth caries, Periodontitis, Edentulism, Burden of disease, Quality of care
Introduction
As a partially controversial concept, quantifying the quality of care has been of interest for quite a long time
Having an index to compare various regions regarding their quality of oral health care can immensely help optimise future policies and approaches, as it can represent the quality of care based on available epidemiological indices. Given that the GBD Study 2017 provides comprehensive data for 354 diseases in 195 countries worldwide and only assesses the burden of oral diseases without further diving into quality assessments [13], we aimed to measure the quality of care for oral disorders using an index we developed [3]. The oral disorders of interest in our study are dental caries (deciduous or permanent), periodontitis, edentulism or severe tooth loss, and other oral disorders based on GBD classification of oral disorders.
Methods
1)
of the cases, which is further expounded as better care and/or better prevention. Prevalence to incidence ratio shows the effectiveness of prevention programs (if any) in which lower values imply a better oral health status [14]. Among these indices, the trend of each one can easily be determined. For instance, higher values of prevalence to incidence ratio could mean better care and/or better prevention among patients. Higher prevalence to incidence ratio suggests higher prevalence in a fixed incidence rate, which is indicative of more accurate diagnosis, prolonged life span, and better care quality. DALYs to prevalence ratio is high when a high burden of the disease (due to either mortality or morbidity) is present in the country. Higher values of the DALYs to prevalence ratio suggest a greater burden and disability in a specific prevalence rate.
Other than the overall QCI for oral disorders, it was separately calculated for caries of deciduous teeth, caries of permanent teeth, periodontal diseases, and edentulism. While assessing the distribution of QCIs, we categorized the regions based on two approaches: Sociodemographic Index (SDI) classification [17]. This classification can represent the development status of a region based on various factors (i.e., economic average incomes per capita, average educational attainment and fertility rates). To assess gender inequality in each country, we used gender disparity ratio (GDR), which is the male to female ratio of QCIs. Concerning the GDR values, five quintiles were defined: 0 to
ages under 20 years as “childhood and adolescence”, 20-65 as “adulthood”, and above 65 as “the elderly”.
Validation
Statistical analysis
Results
Burden of oral disorders
| DALYs rate in 2017 (per 100,000) | DALYs change 1990 to 2017 (%) | QCI in 2017 (%) | QCI change 1990 to 2017 (%) | |
| Global | ||||
| All Oral Disorders | 228.8 (137.5, 353.7) | -4.0 (-5.7, -2.4) | 74.6 | 4.1 |
| Caries of Deciduous Teeth | 2.0 (0.9, 4.1) | -9.0 (-11.0, -7.3) | 81.89 | 2.69 |
| Caries of Permanent Teeth | 20.7 (8.9, 39.2) | -11.9 (-13.4, -10.3) | 77.2 | 7.7 |
| Periodontal Disease | 63.5 (25.0, 130.3) | 6.0 (5.2, 6.8) | 71.1 | -2.2 |
| Edentulism | 91.7 (61.3, 129.9) | -10.1 (-10.9, -9.3) | 61.2 | -5.0 |
| Other Oral Disorders | 50.9 (31.8, 74.7) | 0.2 (-0.1, 0.6) | NA | NA |
| SDI Quintiles | ||||
| High SDI Quintile | ||||
| All Oral Disorders | 219.4 (136.0, 332.8) | -16.2 (-17.7, – 14.9) | 78.03 | 13.77 |
| Caries of Deciduous Teeth | 2.2 (1.0, 4.5) | -7.7 (-12.2, -3.7) | 84.15 | 3.43 |
| Caries of Permanent Teeth | 27.6 (12.0, 53.6) | -10.9 (-12.2, -9.5) | 69.46 | 12.15 |
| Periodontal Disease | 42.1 (16.6, 86.7) | -15.3 (-17.3, -13.2) | 73.26 | -1.02 |
| Edentulism | 96.7 (64.3, 138.1) | -24.3 (-25.5, -23.0) | 75.70 | -0.38 |
| Other Oral Disorders | 50.8 (31.7, 75.3) | -0.1 (-0.6, 0.5) | NA | NA |
| High-Middle SDI Quintile | ||||
| All Oral Disorders | 238.4 (146.8, 364.1) | -4.7 (-6.2, -3.3) | 80.24 | 5.81 |
| Caries of Deciduous Teeth | 2.5 (1.1, 4.9) | -4.1 (-7.5, -1.6) | 80.88 | 2.65 |
| Caries of Permanent Teeth | 20.9 (9.1, 39.9) | -12.6 (-13.8, -11.0) | 83.24 | 8.27 |
| Periodontal Disease | 56.9 (22.4, 116.5) | 5.2 (3.8, 6.5) | 78.92 | -4.04 |
| Edentulism | 107.1 (71.6, 151.6) | -9.7 (-10.4, -9.1) | 78.86 | 1.84 |
| Other Oral Disorders | 51.0 (31.8, 75.3) | 0.0 (-0.6, 0.6) | NA | NA |
| Middle SDI Quintile | ||||
| All Oral Disorders | 237.2 (141.3, 369.0) | 4.4 (3.8, 5.1) | 74.96 | 1.47 |
| Caries of Deciduous Teeth | 2.4 (1.0, 4.7) | -2.1 (-5.0, 0.4) | 79.93 | 1.97 |
| Caries of Permanent Teeth | 20.3 (8.8, 38.0) | -5.3 (-6.7, -3.8) | 80.06 | 5.09 |
| Periodontal Disease | 69.6 (27.5, 142.0) | 5.7 (4.8, 6.6) | 70.00 | -0.85 |
| Edentulism | 93.8 (62.5, 133.0) | 8.5 (7.7, 9.2) | 81.45 | -0.48 |
| Other Oral Disorders | 51.1 (31.9, 75.5) | 0.3 (-0.2, 0.8) | NA | NA |
| Low-Middle SDI Quintile | ||||
| All Oral Disorders | 228.3 (134.7, 358.0) | 6.0 (4.9, 7.2) | 71.52 | -0.37 |
| Caries of Deciduous Teeth | 1.7 (0.7, 3.5) | -11.5 (-13.9, -8.9) | 84.90 | 1.88 |
| Caries of Permanent Teeth | 16.7 (7.3, 31.6) | -10.3 (-11.5, -8.9) | 80.27 | 6.90 |
| Periodontal Disease | 76.7 (30.3, 155.5) | 7.0 (5.6, 8.5) | 61.76 | -1.92 |
| Edentulism | 82.4 (54.8, 115.9) | 13.4 (12.4, 14.4) | 81.11 | -1.53 |
| Other Oral Disorders | 50.7 (31.7, 74.4) | 0.6 (-0.2, 1.4) | NA | NA |
| Low-Middle SDI Quintile | ||||
| All Oral Disorders | 201.5 (115.0, 324.1) | 5.7 (4.6, 6.6) | 70.51 | 0.53 |
| Caries of Deciduous Teeth | 1.8 (0.8, 3.6) | -4.9 (-8.0, -1.9) | 83.89 | 1.44 |
| Caries of Permanent Teeth | 19.3 (8.4, 36.1) | -5.7 (-7.2, -4.5) | 69.55 | 5.78 |
| Periodontal Disease | 75.6 (29.8, 154.7) | 10.1 (8.0, 11.6) | 57.83 | -3.48 |
| Edentulism | 54.2 (35.9, 76.7) | 9.6 (7.9, 11.1) | 83.56 | -1.34 |
| Other Oral Disorders | 50.6 (31.7, 74.2) | 0.8 (-0.1, 1.7) | NA | NA |
Quality of care index and gender inequity
compared with 76.0) (Fig. 2). The gender disparity ratio was 1.05 in both 1990 and 2017.
A
B
Quality of care index among the countries
increased in the European and South African countries during these 28 years, Belgium’s index was three sigmas lower than the average from 1990 to 2005. Figure 5 shows the global, regional, and country by country QCI in 2017.
Discussion
We defined oral disorders as all the pathologic conditions occurring in the oral cavity except for the lip and oral cavity cancers. None of these conditions -including teeth caries, periodontal diseases, edentulism, and other disorders – directly leads to mortality. Additionally, oral disorders are long-lasting conditions, and their management has repeatedly proven to be a challenge for health care systems around the world [1,21,22].
Several wide-scale policies have been proposed to mitigate the burden of oral disorders on the healthcare systems, including adding dental care to universal health coverage with the help of minimal intervention dentistry, pursuing preventive approaches to intercept oral disorders at the initiation phase, controlling shared risk factors (with other systemic diseases), and managing the social and commercial determinants of oral disorders [1,
suggested as common risk factors mainly affecting the oral health status [1,24,25], the proposed policies to improve oral health should also focus on these risk factors [25-29].
fact that low-income countries had the least burden of untreated caries in 2017 – as the traditional diet is low in carbohydrates [31, 32] – with a cost-efficient choice of symptom relief in patients (tooth extraction) [33]. Economic conditions likely restricted their access to effective treatments for periodontal diseases or complete dental loss (via periodontal rehabilitation or prosthetic options) [34-36].
For all oral disorders, among the European countries, Belgium was the only one with a QCI value three sigmas lower than the average from 1990 to 2005. It had the fourth-lowest QCI in 2017 for all oral disorders as well. Upon more in-depth inspection, we found that nearly
In 2017, while having the least YLDs rate for tooth caries and periodontal diseases, middle-high and high SDI countries generally showed higher QCI values for periodontal diseases than those with low or low-middle status. This fact can be expounded by knowing that these countries have already reduced their sugar consumption [43] and naturally have better access to more complex periodontal treatments [44].
Looking at the QCI’s global age patterns, interestingly, two peaks occurred in the quality of care, both happening in the children and adolescents age group. This reflects the success of preventive approaches in below-20-year populations to reduce the prevalence and burden of oral disorders worldwide. Notably, low- and low-middle SDI countries showed lower peaks than their counterparts. Globally, the quality of care for all oral disorders fluctuated on a downward trend with advancing age. This supports the growing concerns to provide higher quality dental care for the adulthood and elderly demographics and meet their needs around the world [45]. Caries of permanent teeth showed quite a similar QCI pattern among the age groups, implying a need to heed the permanent teeth and their perpetuating issues in older individuals [46]. However, the QCI plummeted
at 65-70-year-olds for periodontal diseases and edentulism, then rising toward higher figures. The plunging and recovery were sharper for edentulism. These results can be explained by the fact that, most likely, the number of remaining teeth had already decreased to its lowest before the initiation of “the elderly” age group. This essentially means a natural alleviation for periodontal problems (as the teeth with unfavourable prognosis had already been lost). After this stage, the elderly patients will probably seek prosthetic solutions and rehabilitative treatments more actively, hence the sharp increase in the QCI of edentulism in those older than 70.
Limitations
Conclusion
attention to total tooth loss in high-income countries and prioritising primary healthcare provision in low-income countries are recommended.
Abbreviations
| GBD | Global Burden of Disease |
| YLLs | years of life lost |
| YLDs | years lived with disability |
| DALYs | disability-adjusted life years |
| PCA | principal component analysis |
| SDI | Socio-demographic Index |
| GDR | gender disparity ratio |
| QCI | quality-of-care Index |
| HAQI | Healthcare Access and Quality Index |
Supplementary Information
Additional file 1.
Acknowledgements
Authors’ contributions
Funding
Availability of data and materials
Declarations
Ethics approval and consent to participate
Consent for publication
Competing interests
Author details
Published online: 20 January 2024
References
- Peres MA, Macpherson LM, Weyant RJ, Daly B, Venturelli R, Mathur MR, et al. Oral diseases: a global public health challenge. Lancet. 2019;394(10194):249-60.
- Shoaee S, Saeedi Moghaddam S, Masinaei M, Sofi-Mahmudi A, Hessari H, Heydari M-H, et al. Trends in dental caries of deciduous teeth in Iran: a systematic analysis of the national and sub-national data from 1990 to 2017. BMC Oral Health. 2022;22(1):634.
- Kassebaum N, Smith A, Bernabé E, Fleming T, Reynolds A, Vos T, et al. Global, regional, and national prevalence, incidence, and disabilityadjusted life years for oral conditions for 195 countries, 1990-2015: a systematic analysis for the global burden of diseases, injuries, and risk factors. J Dent Res. 2017;96(4):380-7.
- Righolt A, Jevdjevic M, Marcenes W, Listl S. Global-, regional-, and country-level economic impacts of dental diseases in 2015. J Dent Res. 2018;97(5):501-7.
- Guay AH . The differences between dental and medical care: implications for dental benefit plan design. J Am Dent Assoc. 2006;137(6):801-6.
- Shoaee S, Heydari M-H, Hessari H, Mehrdad N, Khalilazar L, Hatami B, et al. Development and initial validation of the comprehensive geriatric Oral health assessment tool. Clin Exp Dent Res. 2023;9(5):879-86.
- Shoaee S, Masinaei M, Moghaddam SS, Sofi-Mahmudi A, Hessari H, Shamsoddin E, Heydari MH, Larijani B, Fakhrzadeh H, Farzadfar F. National and subnational trend of dental caries of permanent teeth in Iran, 1990-2017. Int Dent J. 2024;74(1):129-37.
- Watt RG, Daly B, Allison P, Macpherson LM, Venturelli R, Listl S, et al. Ending the neglect of global oral health: time for radical action. Lancet. 2019;394(10194):261-72.
- Quentin W, Partanen V-M, Brownwood I, Klazinga N. Measuring healthcare quality. In: Improving healthcare quality in Europe; 2019. p. 31.
- Hanefeld J, Powell-Jackson T, Balabanova D. Understanding and measuring quality of care: dealing with complexity. Bull World Health Organ. 2017;95(5):368-74.
- Campbell S, Tickle M. What is quality primary dental care? Br Dent J. 2013;215(3):135.
- Chen A , Jacobsen KH , Deshmukh AA , Cantor SB . The evolution of the disability-adjusted life year (DALY). Socio Econ Plan Sci. 2015;49:10-5.
- GBD 2017. Disease and Injury Incidence and Prevalence Collaborators. Global, regional, and national incidence, prevalence, and years lived with disability for 354 diseases and injuries for 195 countries and territories, 1990-2017: a systematic analysis for the Global Burden of Disease Study 2017. Lancet (London, England). 2018;392(10159):1789-858.
- Sofi-Mahmudi A, Masinaei M, Shamsoddin E, Tovani-Palone MR, Heydari M-H, Shoaee S, et al. Global, regional, and national burden and quality of care index (QCI) of lip and oral cavity cancer: a systematic analysis of the global burden of disease study 1990-2017. BMC Oral Health. 2021;21(1):558.
- Rencher AC, Schimek M. Methods of multivariate analysis. Comput Stat. 1997;12(4):422.
- Mohammadi E, Ghasemi E, Saeedi Moghaddam S, Yoosefi M, Ghanbari A, Ahmadi N, Masinaei M, Roshani Sh, Ebrahimi N, Rouhifard Khalilabad M, Nasserinejad M, Azadnajafabad S, Mohajer B, Mohebi F, Rezaei N, Mokdad A, Larijani B, Farzadfar F. Quality of care index (QCI). protocolsio. 2020;2021(24 Jan 2021).
- Global Burden of Disease Collaborative Network. Global Burden of Disease Study 2017 (GBD 2017) Socio-Demographic Index (SDI) 1950-2017. Seattle, United States of America: Institute for Health Metrics and Evaluation (IHME); 2018.
- Pande PS, Holpp L. What is six sigma?. McGraw-Hill Professional; 2001.
- GBD 2016. Healthcare Access and Quality Collaborators. Measuring performance on the Healthcare Access and Quality Index for 195 countries and territories and selected subnational locations: a systematic analysis from the Global Burden of Disease Study 2016. Lancet (London, England). 2018;391(10136):2236-71.
- Aminorroaya A, Yoosefi M, Rezaei N, Shabani M, Mohammadi E, Fattahi N , et al. Global, regional, and national quality of care of ischaemic heart disease from 1990 to 2017: a systematic analysis for the global burden of disease study 2017. Eur J Prev Cardiol. 2021;29(2):371-9.
- Bernabe E, Marcenes W, Hernandez CR, Bailey J, Abreu LG, Alipour V, et al. Global, regional, and National Levels and trends in burden of Oral conditions from 1990 to 2017: a systematic analysis for the global burden of disease 2017 study. J Dent Res. 2020;99(4):362-73.
- Lindroos EK, Saarela RKT, Suominen MH, Muurinen S, Soini H, Kautiainen H, et al. Burden of Oral symptoms and its associations with nutrition, wellbeing, and survival among nursing home residents. J Am Med Dir Assoc. 2019;20(5):537-43.
- Jin LJ, Lamster IB, Greenspan JS, Pitts NB, Scully C, Warnakulasuriya S. Global burden of oral diseases: emerging concepts, management and interplay with systemic health. Oral Dis. 2016;22(7):609-19.
- Sheiham A, Watt RG. The common risk factor approach: a rational basis for promoting oral health. Community Dent Oral Epidemiol. 2000;28(6):399-406.
- Watt RG, Sheiham A. Integrating the common risk factor approach into a social determinants framework. Community Dent Oral Epidemiol. 2012;40(4):289-96.
- Sheiham A, Williams DM. Reducing inequalities in Oral health in the Africa and Middle East region. Adv Dent Res. 2015;27(1):4-9.
- Petersen PE. The World Oral Health Report 2003: continuous improvement of oral health in the 21st century–the approach of the WHO Global Oral Health Programme. Community Dent Oral Epidemiol. 2003;31(Suppl 1):3-23.
- Watt RG, Petersen PE. Periodontal health through public health–the case for oral health promotion. Periodontology 2000. 2012;60(1):147-55.
- Mortazavi H, Sadeghian A, Hazrati P, Heydari M-H, Madihi S. Oral hemorrhagic blister and its possible related factors: analyzes of reported cases in the literature. J Oral Maxillofac Surg Med Pathol. 2023;35(4):358-67.
- Baiju RM, Peter E, Varghese NO, Sivaram R. Oral health and quality of life: current concepts. J Clin Diagnostic Res: JCDR. 2017;11(6):Ze21-ze6.
- Weeratunga P, Jayasinghe S, Perera Y, Jayasena G, Jayasinghe S. Per capita sugar consumption and prevalence of diabetes mellitus–global and regional associations. BMC Public Health. 2014;14:186.
- Singh GM, Micha R, Khatibzadeh S, Shi P, Lim S, Andrews KG, et al. Global, regional, and National Consumption of sugar-sweetened beverages, fruit juices, and Milk: a systematic assessment of beverage intake in 187 countries. PLoS One. 2015;10(8):e0124845.
- Elujoba AA, Odeleye O, Ogunyemi C. Traditional medicine development for medical and dental primary health care delivery system in Africa. Afr J Tradit Complement Altern Med. 2005;2(1):46-61.
- Diop M, Kanouté A, Diouf M, Ndiaye AD, Lo CMM, Faye D, et al. The role of health insurance in the coverage of oral health care in Senegal. J Public Health Africa. 2018;9(3):772.
- Roucka TM. Access to dental care in two long-term refugee camps in western Tanzania; programme development and assessment. Int Dent J. 2011;61(2):109-15.
- Moscowchi A, Moradian-Lotfi S, Koohi H, Sarrafan Sadeghi T. Levels of smoking and outcome measures of root coverage procedures: a systematic review and meta-analysis. Oral Maxillofac Surg. Published online August 2, 2023.
- Taylor Nelson Sofres PLC (TNS) and Social Survey Team. Oral health report – European Commission – Eurobarometer -Belgium. Belgium: Directorate General Health and Consumers; 2010.
- Elderton RJ. Clinical studies concerning re-restoration of teeth. Adv Dent Res. 1990;4:4-9.
- Sheiham A. Minimal intervention in dental care. Med Princ Pract. 2002;11(Suppl 1):2-6.
- Qvist V. Longevity of restorations – “the death spiral”. In Dental caries – The disease and its clinical management. 2nd ed. UK. 2008. p. 443-455.
- Opal S, Garg S, Jain J, Walia I. Genetic factors affecting dental caries risk. Aust Dent J. 2015;60(1):2-11.
- Werneck RI, Mira MT, Trevilatto PC. A critical review: an overview of genetic influence on dental caries. Oral Dis. 2010;16(7):613-23.
- Wittekind A, Walton J. Worldwide trends in dietary sugars intake. Nutr Res Rev. 2014;27(2):330-45.
- König J, Holtfreter B, Kocher T. Periodontal health in Europe: future trends based on treatment needs and the provision of periodontal services–position paper 1. Eur J Dent Educ. 2010;14(Suppl 1):4-24.
- Chae S, Lee Y, Kim J, Chun KH, Lee JK. Factors associated with perceived unmet dental care needs of older adults. Geriatr Gerontol Int. 2017;17(11):1936-42.
- López R, Smith PC, Göstemeyer G, Schwendicke F. Ageing, dental caries and periodontal diseases. J Clin Periodontol. 2017;44(Suppl 18):S145-s52.
- Stevens GA, Alkema L, Black RE, Boerma JT, Collins GS, Ezzati M, et al. Guidelines for accurate and transparent health estimates reporting: the GATHER statement. PLoS Med. 2016;13(6):e1002056.
Publisher’s Note
Shervan Shoaee and Erfan Ghasemi are equally first author.
The authors of this study explicitly claim that there was no conflict of interest in conducting this work.
*Correspondence:
Farshad Farzadfar
f-farzadfar@tums.ac.ir
Full list of author information is available at the end of the article