المجلة: Scientific Reports، المجلد: 15، العدد: 1
DOI: https://doi.org/10.1038/s41598-024-83963-7
PMID: https://pubmed.ncbi.nlm.nih.gov/39753692
تاريخ النشر: 2025-01-03
DOI: https://doi.org/10.1038/s41598-024-83963-7
PMID: https://pubmed.ncbi.nlm.nih.gov/39753692
تاريخ النشر: 2025-01-03
افتح
العلاقة بين ثلاثة مؤشرات للسمنة، مؤشر الوزن المثالي، مؤشر كتلة الجسم، ونسبة محيط الخصر إلى الطول، والتهاب اللثة
درس العديد من العلماء العلاقة بين السمنة والتهاب اللثة. يبدو أن العلاقة بين مؤشرات السمنة المختلفة والتهاب اللثة تختلف. في هذه الدراسة، نود استكشاف العلاقة بين ثلاثة مؤشرات شائعة الاستخدام للسمنة، وهي WWI (مؤشر الخصر المعدل حسب الوزن)، BMI (مؤشر كتلة الجسم)، WtHR (نسبة الخصر إلى الطول)، والتهاب اللثة، ومحاولة العثور على المؤشرات الأكثر قيمة سريرياً. قدمت بيانات NHANES 2009-2014 لهذه الدراسة. تم تضمين 10,289 و10,600 و10,290 مشاركاً لاستكشاف العلاقة بين WWI وBMI وWtHR والتهاب اللثة على التوالي. تم استخدام الانحدار اللوجستي المتعدد، وتناسب المنحنى السلس، وتحليل تأثيرات العتبة، وتحليل المجموعات الفرعية لاستكشاف علاقاتهم. كانت هناك علاقة إيجابية بين WWI والتهاب اللثة في النموذج الثالث.
الكلمات الرئيسية: مؤشر الوزن المعدل للخصر، مؤشر كتلة الجسم، نسبة الخصر إلى الطول، التهاب اللثة، NHANES، دراسة مقطعية
الاختصارات
| الحرب العالمية الأولى | مؤشر محيط الخصر المعدل حسب الوزن |
| مؤشر كتلة الجسم | مؤشر كتلة الجسم |
| WtHR | نسبة الخصر إلى الطول |
| NHANES | المسح الوطني للصحة والتغذية |
| مراكز السيطرة على الأمراض والوقاية منها – الأكاديمية الأمريكية لطب الأطفال | مراكز السيطرة على الأمراض والوقاية منها والأكاديمية الأمريكية لطب الأسنان اللثوي |
| ال | فقدان الارتباط |
| PD | عمق الاستكشاف |
| بي آي آر | نسبة تأثير الفقر |
| NIAAA | المعهد الوطني لسوء استخدام الكحول وإدمانه |
| اختبار تحمل الجلوكوز عن طريق الفم | اختبار تحمل الجلوكوز عن طريق الفم |
| PHQ-9 | استبيان صحة المريض-9 |
| أو | نسبة الأرجحية |
| CI | فترة الثقة |
| ROC | منحنى خصائص التشغيل المستقبلية |
| الجامعة الأمريكية في القاهرة | المساحة تحت المنحنى |
التهاب اللثة، وهو مرض التهابي مزمن يؤثر على الأنسجة الداعمة للأسنان، يمكن أن يؤدي إلى فقدان العظم السنخي، وفقدان الأسنان، وفي النهاية انخفاض جودة الحياة.
استطلاع أُجري في الصين،
أكثر من 2 مليار شخص يتأثرون حالياً بجائحة السمنة العالمية، التي لا تزال تتقدم بلا هوادة.
في الدراسات السابقة، درس العديد من العلماء العلاقة بين السمنة والتهاب اللثة. قام عالمان بالتحقيق في العلاقة بين الحرب العالمية الأولى والتهاب اللثة ووجدا ارتباطًا إيجابيًا بين الحرب العالمية الأولى والتهاب اللثة.
المواد والأساليب
مصدر البيانات
قدمت بيانات NHANES 2009-2014 البيانات لهذه الدراسة. NHANES هو مسح عينة تمثيلية وطنية للسكان الأمريكيين، ويشمل بيانات ديموغرافية، وبيانات غذائية، وبيانات فحص، وبيانات مختبرية، وبيانات استبيانات، وبيانات ذات وصول محدود، وجميعها معلومات متاحة مجانًا باستثناء البيانات ذات الوصول المحدود.
المشاركون في الدراسة
وفقًا لمعايير NHANES لفحوصات اللثة، فإن المشاركين الذين كانوا في سن 30 عامًا أو أكبر والذين احتفظوا على الأقل بسنة طبيعية واحدة فقط هم من أجروا فحوصات اللثة.
تعريف الحرب العالمية الأولى، مؤشر كتلة الجسم ونسبة محيط الخصر إلى الطول
WWI $=$ waist circumference $(c m) / sqrt{text { weight }(k g)}$
BMI $=$ weight $(k g) /$ height $^{2}left(m^{2}right)$
WtHR $=$ waist circumference (cm)/ height (cm)
تعريف التهاب اللثة
استنادًا إلى استنتاجات إيك، هناك أربع فئات من التهاب اللثة وفقًا لمراكز السيطرة على الأمراض والوقاية منها والأكاديمية الأمريكية لالتهاب اللثة: لا شيء، خفيف، معتدل، وشديد. تم تعريف التهاب اللثة الخفيف بأنه
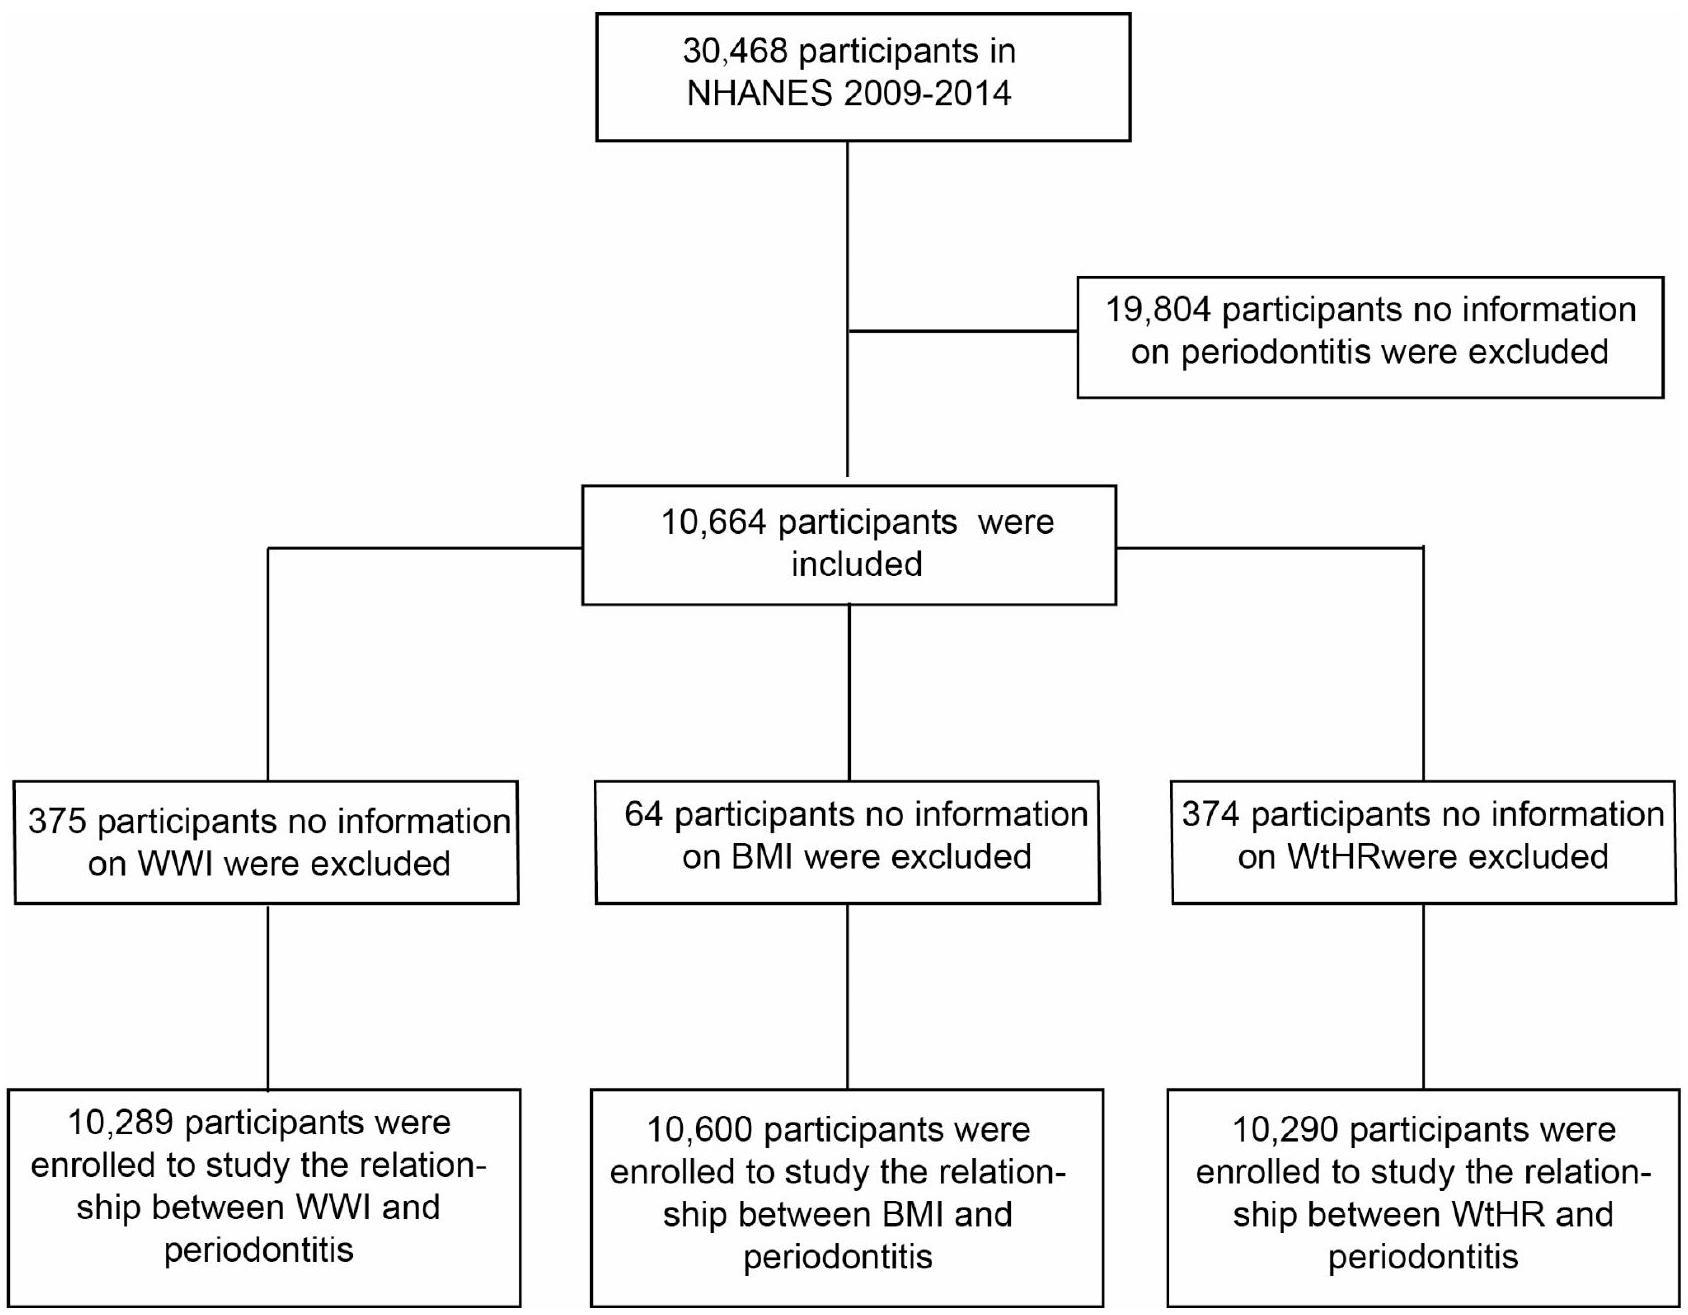
الشكل 1. مخطط تدفق اختيار المشاركين.
المواقع بين الأسنان
المتغيرات المشتركة
أخذت هذه الدراسة أيضًا في الاعتبار المتغيرات المرافقة مثل الجنس، العمر، العرق، نسبة تأثير الفقر (PIR)؛ مستوى التعليم، الحالة الاجتماعية، استخدام الكحول، التدخين، السكري، استخدام الخيط، ارتفاع ضغط الدم، النشاط البدني الكافي، اضطرابات النوم والاكتئاب، والتي قد تؤثر على العلاقة بين التهاب اللثة والتهاب دواعم الأسنان.
تم استخدام استبيان PHQ-9 لتقييم الاكتئاب. وقد أسست أول دراسة لـ PHQ-9 النقطة القطعية التقليدية التي تبلغ 10 أو أعلى كوسيلة لفحص الاكتئاب المحتمل.
التحليل الإحصائي
تم استخدام أداة البرمجيات الإحصائية EmpowerStats (الإصدار 2.0) لدمج البيانات، وتم استخدام Adobe Illustrator (الإصدار 2021) لإنشاء الصور في هذه الدراسة. يتم تقديم المتغيرات الفئوية كنسب مئوية. تم استخدام اختبارات كاي-تربيع واختبارات كروسكال-واليس لتحديد ما إذا كان هناك فرق ذو دلالة إحصائية بين مؤشرات السمنة المختلفة والتهاب اللثة. أولاً، قمنا بتقييم العلاقة المستقلة بين ثلاثة مؤشرات للسمنة والتهاب اللثة باستخدام الانحدار اللوجستي المتعدد. في هذه الدراسة، لا يأخذ النموذج الخام في الاعتبار المتغيرات؛ النموذج الأول يأخذ في الاعتبار فقط الجنس والعمر والعرق؛ النموذج الثاني، بناءً على النموذج الأول، يأخذ في الاعتبار PIR، مستوى التعليم، الحالة الاجتماعية، التدخين، استخدام الكحول، السكري، استخدام الخيط، ارتفاع ضغط الدم، النشاط البدني الكافي، اضطرابات النوم والاكتئاب. بعد ذلك، تم تقييم العلاقة بين الجرعة والاستجابة ونقطة الانعطاف بين هذه المؤشرات السمنة والتهاب اللثة باستخدام ملاءمة المنحنى السلس وتحليل تأثير العتبة. تم إجراء تحليل فرعي واختبارات تفاعل لمعرفة تأثير المتغيرات المصاحبة على العلاقة بين ثلاثة مؤشرات السمنة والتهاب اللثة. أخيرًا، قمنا بمقارنة قدرة هذه المؤشرات الثلاثة على التنبؤ بالتهاب اللثة بهدف إيجاد الأفضل للتنبؤ بالتهاب اللثة. تصحيح بونفيروني لـ
النتائج
الخصائص الأساسية للمشاركين
في العلاقة بين الحرب العالمية الأولى والتهاب اللثة، تم تسجيل ما مجموعه 10,289 مشاركًا، من بينهم
العلاقة بين ثلاثة مؤشرات للسمنة والتهاب اللثة
أظهرت الانحدار اللوجستي المتعدد أن WWI و WtHR أظهرا ارتباطات إيجابية كبيرة مع التهاب اللثة، لكن لم يبدو أن BMI مرتبط بإلتهاب اللثة (الجدول 2). كلا النموذجين الأقل تعديلًا
علاوة على ذلك، تم إجراء تحليل انطباق المنحنى السلس (الشكل 2) وتحليل تأثيرات العتبة (الجدول 3) لوصف العلاقة الخطية أو غير الخطية بين WWI و BMI و WtHR والتهاب اللثة. كانت هناك علاقة إيجابية بين WWI والتهاب اللثة مع نقطة انحناء من
تحليل الفئات الفرعية
دعمت نتائج تحليلات المجموعات الفرعية أيضًا الارتباط الإيجابي بين WWI و WtHR والتهاب اللثة، بينما لم يظهر BMI بعد ارتباطًا كبيرًا مع التهاب اللثة (الجدول 4). في الوقت نفسه، أظهرت WWI و BMI و WtHR جميعها تأثيرات تفاعلية كبيرة في تصنيف العمر.
| مؤشر محيط الخصر المعدل حسب الوزن | إجمالي | الربع الأول (8.62-10.55) | الربع الثاني (10.55-11.07) | الربع الثالث (11.07-11.60) | الربع الرابع (11.60-14.79) |
|
|
|
|
|
|
|||
| العمر، ن (%) | <0.001 | |||||
| < 60 | 7012 (68.15%) | 2224 (86.47%) | 1938 (75.35%) | 1621 (63.02%) | 1229 (47.77%) | |
|
|
3277 (31.85%) | 348 (13.53%) | 634 (24.65%) | 951 (36.98%) | 1344 (52.23%) | |
| الجنس، ن (%) | <0.001 | |||||
| ذكر | 5094 (49.51%) | 1558 (60.58%) | 1424 (55.37%) | 1227 (47.71%) | 885 (34.40%) | |
| أنثى | 5195 (50.49%) | 1014 (39.42%) | 1148 (44.63%) | 1345 (52.29%) | 1688 (65.60%) | |
| العرق، ن (%) | <0.001 | |||||
| مكسيكي أمريكي | 1483 (14.41%) | 181 (7.04%) | 356 (13.84%) | 445 (17.30%) | 501 (19.47%) | |
| هسبانيون آخرون | 1036 (10.07%) | 189 (7.35%) | 244 (9.49%) | 313 (12.17%) | 290 (11.27%) | |
| الأبيض غير اللاتيني | 4426 (43.02%) | 1147 (44.60%) | ١٠٩٦ (٤٢.٦١٪) | 1051 (40.86%) | 1132 (44.00%) | |
| أسود غير هيسباني | 2107 (20.48%) | 704 (27.37%) | ٤٩٩ (١٩.٤٠٪) | 481 (18.70%) | 423 (16.44%) | |
| آخرون | 1237 (12.02%) | ٣٥١ (١٣.٦٥٪) | 377 (14.66%) | 282 (10.96%) | 227 (8.82%) | |
| PIR، ن (%) | <0.001 | |||||
| منخفض (< 1.35) | 2948 (31.21%) | 600 (25.22%) | 665 (28.12%) | 778 (32.76%) | 905 (38.91%) | |
| الوسط (1.35-3.45) | 3163 (33.49%) | 723 (30.39%) | 814 (34.42%) | 793 (33.39%) | 833 (35.81%) | |
| مرتفع (> 3.45) | ٣٣٣٤ (٣٥.٣٠٪) | 1056 (44.39%) | 886 (37.46%) | 804 (33.85%) | ٥٨٨ (٢٥.٢٨٪) | |
| مستوى التعليم، عدد (%) | <0.001 | |||||
| الثانوية وما دون | 4590 (44.66%) | 892 (34.71%) | 1063 (41.39%) | 1249 (48.58%) | 1386 (53.95%) | |
| ما بعد المدرسة الثانوية | 5688 (55.34%) | 1678 (65.29%) | 1505 (58.61%) | 1322 (51.42%) | 1183 (46.05%) | |
| الحالة الاجتماعية، عدد (%) | <0.001 | |||||
| متزوج | 6032 (58.67%) | 1494 (58.11%) | 1577 (61.34%) | 1603 (62.40%) | 1358 (52.82%) | |
| أرملة | 697 (6.78%) | 63 (2.45%) | 124 (4.82%) | 162 (6.31%) | 348 (13.54%) | |
| مطلق | 1308 (12.72%) | 320 (12.45%) | 314 (12.21%) | 304 (11.83%) | 370 (14.39%) | |
| آخرون | 2245 (21.83%) | 694 (26.99%) | 556 (21.63%) | 500 (19.46%) | 495 (19.25%) | |
| استخدام الكحول، عدد (%) | <0.001 | |||||
| أبداً | 1289 (12.53%) | 231 (8.98%) | 256 (9.95%) | 336 (13.06%) | 466 (18.11%) | |
| معتدل | ٣٤٩٨ (٣٤.٠٠٪) | 972 (37.79%) | 949 (36.90%) | 832 (32.35%) | 745 (28.95%) | |
| شديد | 2117 (20.58%) | 576 (22.40%) | 558 (21.70%) | 543 (21.11%) | 440 (17.10%) | |
| التهام | 3385 (32.90%) | 793 (30.83%) | 809 (31.45%) | 861 (33.48%) | 922 (35.83%) | |
| التدخين، ن (%) | <0.001 | |||||
| أبداً | 5767 (56.07%) | 1473 (57.34%) | 1433 (55.72%) | 1429 (55.58%) | 1432 (55.65%) | |
| أبداً | 2573 (25.02%) | 501 (19.50%) | 642 (24.96%) | 702 (27.30%) | 728 (28.29%) | |
| الآن | 1945 (18.91%) | 595 (23.16%) | 497 (19.32%) | 440 (17.11%) | 413 (16.05%) | |
| السكري، ن (%) | <0.001 | |||||
| نعم | 1629 (15.84%) | 123 (4.78%) | 276 (10.74%) | 480 (18.66%) | 750 (29.15%) | |
| لا | 8658 (84.16%) | 2449 (95.22%) | 2294 (89.26%) | 2092 (81.34%) | 1823 (70.85%) | |
| ارتفاع ضغط الدم، ن (%) | <0.001 | |||||
| نعم | 3798 (36.96%) | 530 (20.63%) | 846 (32.93%) | 1055 (41.07%) | 1367 (53.23%) | |
| لا | 6477 (63.04%) | 2039 (79.37%) | 1723 (67.07%) | 1514 (58.93%) | 1201 (46.77%) | |
| نشاط بدني كافٍ، ن (%) | <0.001 | |||||
| نعم | 3152 (30.68%) | 874 (34.06%) | 885 (34.44%) | 772 (30.04%) | 621 (24.18%) | |
| لا | 7122 (69.32%) | 1692 (65.94%) | 1685 (65.56%) | 1798 (69.96%) | 1947 (75.82%) | |
| استخدام الخيط، ن (%) | <0.001 | |||||
| أبداً | 3227 (31.62%) | 742 (29.02%) | 766 (30.02%) | 824 (32.29%) | 895 (35.18%) | |
| نادراً | 1658 (16.25%) | ٤٨٣ (١٨.٨٩٪) | 422 (16.54%) | 398 (15.60%) | 355 (13.95%) | |
| بشكل معتدل | 1831 (17.94%) | 480 (18.77%) | 502 (19.67%) | 465 (18.22%) | 384 (15.09%) | |
| بشكل متكرر | 3489 (34.19%) | 852 (33.32%) | 862 (33.78%) | 865 (33.89%) | 910 (35.77%) | |
| اضطرابات النوم، ن (%) | <0.001 | |||||
| نعم | 2816 (27.37%) | 572 (22.24%) | 638 (24.81%) | 699 (27.18%) | 907 (35.25%) | |
| لا | 7473 (72.63%) | 2000 (77.76%) | 1934 (75.19%) | 1873 (72.82%) | 1666 (64.75%) | |
| الاكتئاب، ن (%) | <0.001 | |||||
| مستمر | ||||||
| مؤشر محيط الخصر المعدل حسب الوزن | إجمالي | الربع الأول (8.62-10.55) | الربع الثاني (10.55-11.07) | الربع الثالث (11.07-11.60) | الربع الرابع (11.60-14.79) |
|
| N = 2572 | N = 2572 | N=2572 | N = 2573 | |||
| نعم | 948 (9.87%) | 185 (7.80%) | 184 (7.62%) | 226 (9.37%) | 353 (14.64%) | |
| لا | 8660 (90.13%) | 2186 (92.20%) | ٢٢٣٠ (٩٢.٣٨٪) | 2185 (90.63%) | 2059 (85.36%) | |
| التهاب اللثة، ن (%) | <0.001 | |||||
| نعم | 4709 (45.77%) | 916 (35.61%) | 1111 (43.20%) | 1263 (49.11%) | 1419 (55.15%) | |
| لا | 5580 (54.23%) | 1656 (64.39%) | 1461 (56.80%) | 1309 (50.89%) | 1154 (44.85%) |
الجدول 1. الخصائص الأساسية للمشاركين.
| تعرض | النموذج الأول (OR، 95% CI،
|
النموذج الثاني (نسبة الأرجحية، 95% فترة الثقة،
|
النموذج الثالث (OR، 95% CI،
|
| الحرب العالمية الأولى
|
1.52 (1.44، 1.60) <0.001 | 1.54 (1.45, 1.64) <0.001 | 1.35 (1.26, 1.45) <0.001 |
| الحرب العالمية الأولى، (الربع) | |||
| الربع الأول (8.62-10.55) | 1.0 | 1.0 | 1.0 |
| الربع الثاني (10.55-11.07) | 1.37 (1.23، 1.54) <0.001 | 1.35 (1.20, 1.52) <0.001 | 1.25 (1.09, 1.44) 0.001 |
| الربع الثالث (11.07-11.60) | 1.74 (1.56, 1.95) <0.001 | 1.66 (1.47, 1.87) <0.001 | 1.50 (1.30، 1.73) <0.001 |
| الربع الرابع (11.60-14.79) | 2.22 (1.99, 2.49) <0.001 | 2.15 (1.89, 2.45) <0.001 | 1.61 (1.38, 1.88) <0.001 |
|
|
1.57 (1.48, 1.67) <0.001 | 1.54 (1.43, 1.65) <0.001 | 1.31 (1.21, 1.43) <0.001 |
| مؤشر كتلة الجسم (BMI)
|
1.00 (1.00, 1.01) 0.196 | 1.01 (1.00، 1.01) 0.079 | 1.00 (0.99، 1.01) 0.757 |
| مؤشر كتلة الجسم، (الربع) | |||
| الربع الأول (13.18-24.67) | 1.0 | 1.0 | 1.0 |
| الربع الثاني (24.67-28.17) | 1.05 (0.95, 1.18) 0.334 | 0.91 (0.81, 1.02) 0.095 | 0.94 (0.81, 1.09) 0.414 |
| الربع الثالث (28.17-32.50) | 1.09 (0.97, 1.21) 0.137 | 0.92 (0.82, 1.03) 0.150 | 1.02 (0.87, 1.19) 0.817 |
| الربع الرابع (32.50-82.95) | 1.05 (0.95, 1.17) 0.348 | 1.02 (0.91, 1.15) 0.689 | 0.96 (0.82, 1.13) 0.657 |
|
|
1.00 (1.00، 1.01) 0.366 | 1.00 (1.00, 1.01) 0.442 | 1.00 (0.99, 1.01) 0.867 |
| WtHR | 5.63 (3.70, 8.58) <0.001 | 5.42 (3.41, 8.62) <0.001 | 2.94 (1.57, 5.50) <0.001 |
| WtHR، (الربع) | |||
| الربع الأول (0.36-0.53) | 1.0 | 1.0 | 1.0 |
| الربع الثاني (0.53-0.59) | 1.29 (1.16, 1.45) <0.001 | 1.11 (0.99, 1.25) 0.072 | 1.26 (1.08، 1.46) 0.003 |
| الربع الثالث (0.59-0.65) | 1.50 (1.34, 1.68) <0.001 | 1.25 (1.11, 1.41) <0.001 | 1.33 (1.14, 1.55) <0.001 |
| الربع الرابع (0.65-1.14) |
|
1.48 (1.32، 1.68) <0.001 | 1.35 (1.15, 1.59) <0.001 |
|
|
8.33 (4.99, 13.90) < 0.001 |
|
3.74 (1.76, 7.96) <0.001 |
الجدول 2. العلاقة بين الحرب العالمية الأولى، مؤشر كتلة الجسم، نسبة محيط الخصر إلى الطول، والتهاب اللثة في نماذج مختلفة. النموذج الأول لم يكن معدلاً. النموذج الثاني تم تعديله حسب الجنس؛ العمر؛ والعرق. النموذج الثالث تم تعديله حسب الجنس؛ العمر؛ العرق؛ نسبة الدخل؛ مستوى التعليم؛ الحالة الاجتماعية؛ التدخين؛ استخدام الكحول؛ السكري؛ ارتفاع ضغط الدم؛ استخدام الخيط؛ النشاط البدني الكافي؛ اضطرابات النوم؛ الاكتئاب.
أكثر من 60 عامًا. أظهر مؤشر كتلة الجسم والتهاب اللثة اختلافًا في العمر، لكن هذا الاختلاف لم يكن ذا دلالة إحصائية.
القدرة التنبؤية لـ WWI و BMI و WthR لالتهاب اللثة
قيم AUC (المساحة تحت المنحنى) (
نقاش
أظهرت الدراسة المقطعية وجود ارتباط إيجابي بين WWI و WtHR والتهاب اللثة، لكن الارتباط بين BMI والتهاب اللثة لم يكن ذا دلالة إحصائية. في إجمالي السكان، كلما زاد WWI و WtHR، زاد خطر الإصابة بالتهاب اللثة. يكون خطر تطوير التهاب اللثة أكثر أهمية عندما يكون WWI أكثر من
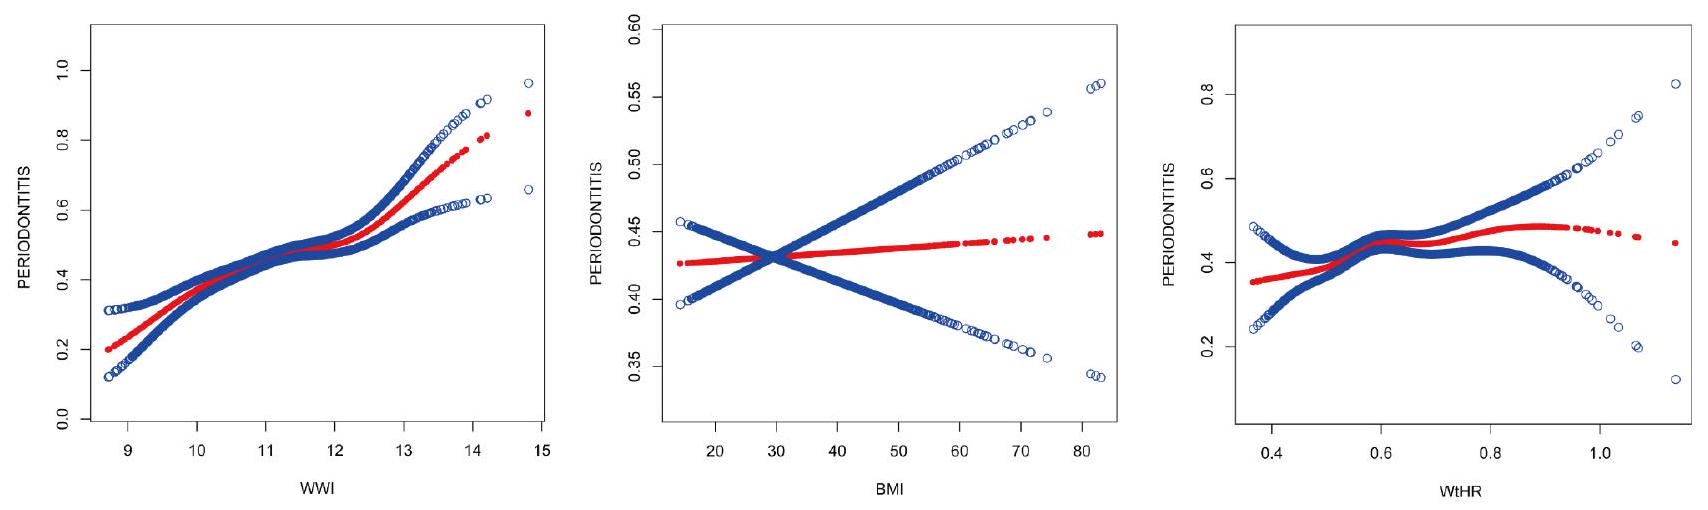
الشكل 2. العلاقة بين الجرعة والاستجابة بين WWI و BMI و WtHR والتهاب اللثة. تم العثور على علاقة غير خطية بين WWI و WtHR والتهاب اللثة في ملاءمة المنحنى السلس. تم العثور على علاقة خطية بين BMI والتهاب اللثة في ملاءمة المنحنى السلس. الخط الأحمر الصلب يمثل ملاءمة المنحنى السلس بين المتغيرات. تمثل الأشرطة الزرقاء
| تعرض | التهاب اللثة (أو، 95% فترة الثقة،
|
| الحرب العالمية الأولى | |
| التناسب بواسطة نموذج الانحدار اللوجستي | 1.35 (1.26, 1.45) <0.001 |
| التناسب بواسطة نموذج لوجستي خطي مقطعي ذو جزئين | |
| نقطة الانعطاف | 12.68 |
| < 12.68 | 1.32 (1.22, 1.42) <0.001 |
|
|
3.44 (1.43, 8.26) 0.006 |
| اختبار نسبة الاحتمال اللوغاريتمي | 0.028 |
| WtHR | |
| التناسب بواسطة نموذج الانحدار اللوجستي | 2.94 (1.57, 5.50) <0.001 |
| التناسب بواسطة نموذج لوجستي خطي مقطعي ثنائي | |
| نقطة الانعطاف | 0.59 |
| < 0.59 | 11.95 (2.92, 48.97) <0.001 |
|
|
1.29 (0.49, 3.41) 0.602 |
| اختبار نسبة الاحتمال اللوغاريتمي | 0.029 |
الجدول 3. تحليل تأثير العتبة لـ WWI و WtHR والتهاب اللثة باستخدام الانحدار اللوجستي الجزئي.
أفادت الدراسات السابقة بالعلاقة بين WWI، كمؤشر للسمنة، والعديد من الأمراض. على سبيل المثال، يوسونغ بارك
في الدراسة الحالية، أظهر مؤشر الوزن إلى الطول (WWI) ومؤشر محيط الخصر إلى الطول (WtHR) ارتباطًا كبيرًا مع التهاب اللثة. علاوة على ذلك، أظهر WWI قدرة تنبؤية أكبر لالتهاب اللثة مقارنة بـ WtHR ومؤشر كتلة الجسم (BMI). من خلال تحليل منحنى التناسب، يمكننا أن نرى أن خطر التهاب اللثة يزيد بشكل كبير بعد أن يصل مستوى WWI إلى قيمة معينة. وهذا يعني أنه عندما يتجاوز السمنة حدًا معينًا، يكون الأفراد أكثر عرضة لتطوير التهاب اللثة. قد تكون الأسباب كما يلي. أولاً، تم الإبلاغ عن أن السمنة هي اضطراب استجابة التهابية يمكن أن تسبب التهابًا مزمنًا ومنخفض الدرجة في الجسم.
| مجموعة فرعية | الحرب العالمية الأولى | مؤشر كتلة الجسم | WtHR | ||||||
|
|
التهاب اللثة [أو (95% فترة الثقة)] |
|
|
التهاب اللثة [أو (95% فترة الثقة)] |
|
|
التهاب اللثة [أو (95% فترة الثقة)] |
|
|
| جنس | 0.127 | 0.609 | 0.742 | ||||||
| ذكر | ٥٠٩٤ | 1.75 (1.62, 1.90) <0.001 | ٥٢٢٦ | 1.00 (0.99, 1.01) 0.624 | ٥٠٩٦ | 7.84 (3.98, 15.45) < 0.001 | |||
| أنثى | ٥١٩٥ | 1.78 (1.65, 1.92) <0.001 | 5374 | 1.01 (1.01، 1.02) <0.001 | ٥١٩٤ | 13.88 (7.88, 24.47) <0.001 | |||
| عمر | <0.001 | 0.011 | 0.001 | ||||||
| <60 | 7012 | 1.40 (1.31, 1.49) <0.001 | 7183 | 1.01 (1.01, 1.02) <0.001 | 7016 | 6.07 (3.66، 10.07) < 0.001 | |||
|
|
٣٢٧٧ | 1.12 (1.01, 1.24) 0.028 | ٣٤١٧ | 0.99 (0.98, 1.00) 0.018 | ٣٢٧٤ | 0.79 (0.35, 1.78) 0.565 | |||
| سباق | 0.096 | 0.348 | 0.107 | ||||||
| مكسيكي أمريكي | 1483 |
|
1509 | 1.00 (0.99، 1.02) 0.730 | 1482 | 8.34 (2.33, 29.84) 0.001 | |||
| هسبانيون آخرون | ١٠٣٦ |
|
1065 | 1.00 (0.98، 1.02) 0.687 | ١٠٣٧ | 5.87 (1.38, 24.91) 0.016 | |||
| الأبيض غير اللاتيني | ٤٤٢٦ |
|
4545 | 1.00 (0.99, 1.01) 0.752 | ٤٤٢٨ | 8.01 (4.17، 15.38) < 0.001 | |||
| أسود غير هيسباني | ٢١٠٧ | 1.18 (1.06, 1.32) 0.002 | ٢١٩١ | 0.98 (0.97، 0.99) 0.002 | ٢١٠٦ | 0.69 (0.30, 1.58) 0.377 | |||
| آخرون | 1237 | 1.64 (1.39, 1.93) < 0.001 | ١٢٩٠ | 1.02 (1.00, 1.04) 0.134 | 1237 |
|
|||
| مستوى التعليم | 0.806 | 0.514 | 0.567 | ||||||
| الثانوية وما دونها | ٤٥٩٠ | 1.27 (1.17, 1.37) < 0.001 | ٤٧٥٣ | 0.99 (0.98, 1.00) 0.022 | ٤٥٨٩ | 1.40 (0.75, 2.61) 0.298 | |||
| ما بعد المدرسة الثانوية | 5688 | 1.56 (1.45, 1.68) <0.001 | 5834 | 1.01 (1.00، 1.02) 0.036 | 5690 | 7.94 (4.38، 14.40) < 0.001 | |||
| بي آي آر | 0.964 | 0.437 | 0.464 | ||||||
| منخفض | ٢٩٤٨ | 1.24 (1.13, 1.36) <0.001 | ٣٠٥٤ | 0.99 (0.98، 0.99) 0.003 | ٢٩٤٧ | 0.95 (0.45, 1.98) 0.885 | |||
| معتدل | 3163 | 1.42 (1.29, 1.56) <0.001 | ٣٢٥٠ | 0.99 (0.98, 1.00) 0.137 | 3165 | 2.46 (1.16, 5.21) 0.019 | |||
| عالي | ٣٣٣٤ | 1.61 (1.45, 1.78) <0.001 | ٣٤١٠ | 1.02 (1.01، 1.03) 0.002 | ٣٣٣٤ |
|
|||
| الحالة الاجتماعية | 0.222 | 0.557 | 0.164 | ||||||
| متزوج | ٦٠٣٢ |
|
6187 | 1.01 (1.00، 1.02) 0.044 | 6033 |
|
|||
| أرملة | 697 | 1.15 (0.94، 1.40) 0.166 | 754 | 0.99 (0.97، 1.01) 0.192 | 695 | 0.60 (0.12, 3.06) 0.535 | |||
| مطلق | 1308 | 1.28 (1.11, 1.48) <0.001 | 1341 | 1.00 (0.98, 1.02) 0.911 | 1308 | 2.42 (0.79, 7.43) 0.123 | |||
| آخرون | 2245 |
|
2311 | 1.00 (0.99, 1.01) 0.944 | 2247 | 2.86 (1.28, 6.39) 0.011 | |||
| استخدام الكحول | 0.265 | 0.041 | 0.066 | ||||||
| أبداً | 1289 | 1.47 (1.28, 1.69) <0.001 | ١٣٣١ | 1.00 (0.99, 1.02) 0.781 | 1289 | 3.54 (1.15, 10.95) 0.028 | |||
| معتدل | ٣٤٩٨ |
|
٣٥٥٠ | 1.01 (1.00, 1.02) 0.153 | ٣٤٩٨ |
|
|||
| شديد | 2117 |
|
2138 | 1.01 (1.00, 1.03) 0.027 | 2120 | 9.76 (3.80, 25.06) < 0.001 | |||
| التهام | ٣٣٨٥ |
|
١٠٥١ | 0.98 (0.96, 1.00) 0.051 | ١٠٣٨ | 1.10 (0.30, 4.13) 0.883 | |||
| التدخين | 0.904 | 0.150 | 0.382 | ||||||
| أبداً | 5767 |
|
5960 | 1.01 (1.00، 1.02) 0.006 | 5765 |
|
|||
| أبداً | 2573 |
|
2649 | 1.01 (1.00، 1.02) 0.039 | 2575 |
|
|||
| الآن | 1945 | 1.28 (1.14, 1.44) < 0.001 | 1987 | 0.98 (0.97, 1.00) 0.017 | 1946 | 0.94 (0.37, 2.41) 0.900 | |||
| السكري | 0.859 | 0.462 | 0.825 | ||||||
| نعم | 1629 | 1.21 (1.05, 1.39) 0.009 | 1702 | 0.98 (0.97، 1.00) 0.015 | 1631 | 0.62 (0.21, 1.80) 0.377 | |||
| لا | 8658 | 1.46 (1.38, 1.55) <0.001 | 8896 | 1.00 (0.99, 1.01) 0.842 | 8657 | 4.07 (2.53, 6.55) < 0.001 | |||
| استخدام الخيط | 0.263 | 0.062 | 0.154 | ||||||
| أبداً | ٣٢٢٧ | 1.40 (1.28، 1.53) < 0.001 | 3358 | 0.98 (0.97، 0.99) <0.001 | ٣٢٢٣ | 1.49 (0.72, 3.10) 0.282 | |||
| نادراً | ١٦٥٨ | 1.58 (1.38, 1.80) <0.001 | ١٧٠٠ | 1.02 (1.00، 1.03) 0.017 | 1660 |
|
|||
| بشكل معتدل | 1831 |
|
1878 | 1.01 (1.00، 1.02) 0.110 | 1832 |
|
|||
| بشكل متكرر | ٣٤٨٩ |
|
٣٥٧٨ | 1.02 (1.00, 1.03) 0.004 | ٣٤٩١ | 11.05 (5.19، 23.53) <0.001 | |||
| ارتفاع ضغط الدم | 0.058 | 0.287 | 0.225 | ||||||
| نعم | ٣٧٩٨ | 1.30 (1.19, 1.42) <0.001 | ٣٩٥١ | 0.99 (0.98، 0.99) 0.001 | ٣٧٩٩ | 1.20 (0.60, 2.40) 0.598 | |||
| لا | ٦٤٧٧ |
|
6633 | 1.00 (1.00، 1.01) 0.428 | ٦٤٧٧ |
|
|||
| ما يكفي من النشاط البدني | 0.744 | 0.543 | 0.471 | ||||||
| نعم | 3152 |
|
٣٢١٦ | 0.99 (0.98, 1.01) 0.319 | ٣١٥٣ | 1.98 (0.89, 4.40) 0.094 | |||
| لا | 7122 |
|
7369 | 1.01 (1.00، 1.01) 0.039 | 7122 | 8.60 (5.23, 14.16) < 0.001 | |||
| اضطراب النوم | 0.184 | 0.795 | 0.602 | ||||||
| نعم | ٢٨١٦ | 1.62 (1.47, 1.80) <0.001 | ٢٨٩٥ | 1.01 (1.00، 1.02) 0.263 | 2817 | 6.36 (3.02, 13.38) < 0.001 | |||
| لا | 7473 |
|
7705 | 1.00 (1.00, 1.01) 0.262 | 7473 | 6.13 (3.65, 10.29) < 0.001 | |||
| الاكتئاب | 0.555 | 0.493 | 0.750 | ||||||
| نعم | 948 | 1.33 (1.13, 1.56) <0.001 | 856 | 0.99 (0.98, 1.01) 0.370 | 832 | 1.77 (0.52, 6.09) 0.363 | |||
| لا | ٨٦٦٠ |
|
8912 | 1.01 (1.00، 1.01) 0.089 | ٥٠٩٦ |
|
|||
الجدول 4. تحليل الفئات الفرعية للعلاقة بين WWI، BMI، WtHR، والتهاب اللثة.
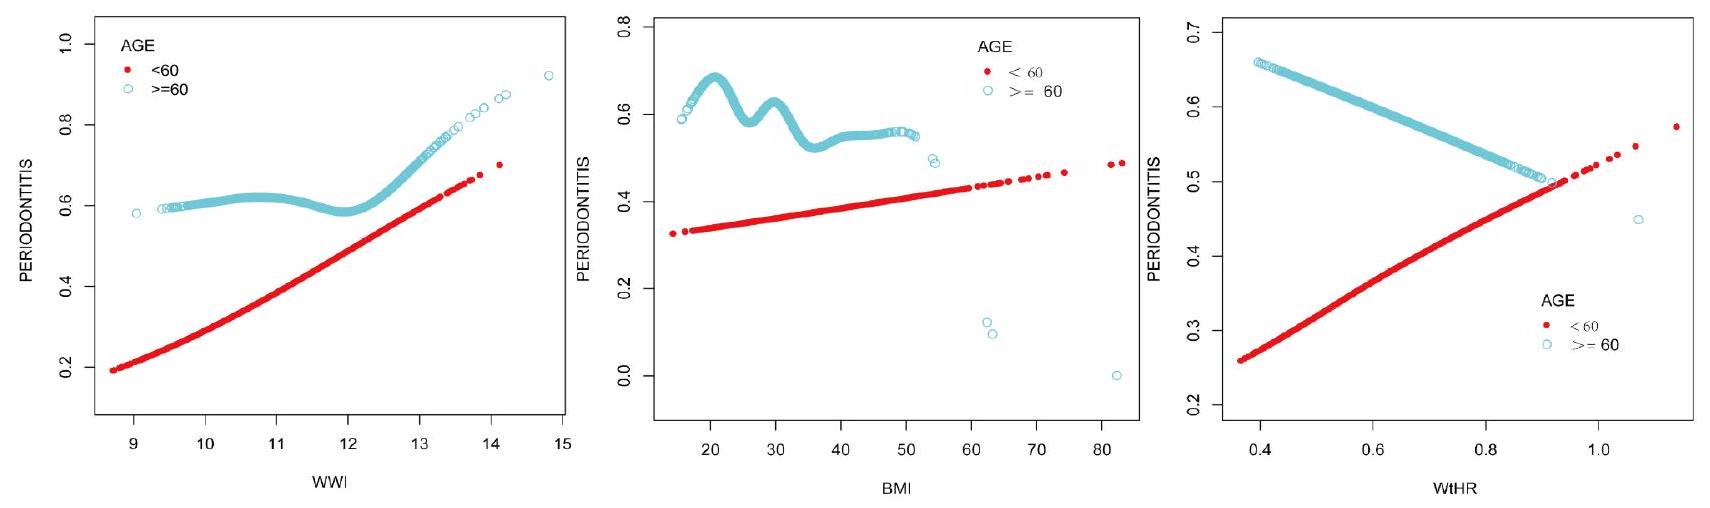
الشكل 3. العلاقة بين الجرعة والاستجابة بين WWI و BMI و WtHR والتهاب اللثة مقسمة حسب العمر.
| مؤشر محيط الخصر المعدل حسب الوزن
|
التهاب اللثة (أو، 95% فترة الثقة،
|
| عمر
|
1.08 (0.95, 1.23) 0.215 |
| توافق بواسطة نموذج لوجستي خطي مقطعي ذو جزئين نقطة الانعطاف | 12.68 |
| < 12.68 | 1.01 (0.88, 1.15) 0.913 |
|
|
7.87 (1.76, 35.20) 0.007 |
| اختبار نسبة الاحتمال اللوغاريتمي | 0.002 |
الجدول 5. تحليل تأثير العتبة للحرب العالمية الأولى والتهاب اللثة مقسماً حسب العمر.
| اختبار | الجامعة الأمريكية في القاهرة | 95% فترة الثقة المنخفضة | 95% فترة الثقة العليا | أفضل عتبة | خصوصية | حساسية |
| الحرب العالمية الأولى | 0.588 | 0.577 | 0.599 | 11.060 | 0.556 | 0.575 |
| مؤشر كتلة الجسم | 0.510 | 0.498 | 0.521 | ٢٦٫٩٩٠ | 0.424 | 0.6022 |
| WtHR | 0.548 | 0.537 | 0.560 | 0.559 | 0.406 | 0.679 |
الجدول 6. تحليل AUC لمرض التهاب اللثة، ومؤشر كتلة الجسم، ونسبة محيط الخصر إلى الطول.
الالتهاب المزمن منخفض الدرجة وتأثيره السلبي على جودة العظام هما من عوامل الخطر لالتهاب اللثة. لذلك، من الواضح أن هناك رابطًا لا يمكن فصله بين السمنة والتهاب اللثة.
فيما يتعلق بعدم ظهور ارتباط كبير بين مؤشر كتلة الجسم والتهاب اللثة، لدينا التحليل التالي. أولاً، على الرغم من أن مؤشر كتلة الجسم هو مؤشر مستخدم على نطاق واسع للسمنة، إلا أنه يعكس بشكل رئيسي نسبة الوزن الكلي للجسم إلى الطول ولا يعكس بدقة توزيع تكوين الجسم والموقع الدقيق لتراكم الدهون. ثانياً، قد يكون لدى بعض الأفراد مؤشر كتلة جسم مرتفع ولكن كمية منخفضة من الدهون البطنية، أو قد يكون لدى البعض الآخر مؤشر كتلة جسم منخفض ولكن كمية مرتفعة من الدهون البطنية. قد تؤدي هذه الاختلافات الفردية إلى تقليل دقة مؤشر كتلة الجسم في تقييم خطر التهاب اللثة. أخيراً، في هذه المقالة، مقارنة بالعديد من المقالات، قمنا بتعديل العديد من المتغيرات وأدرنا بشكل كبير تأثير العوامل المربكة على النتائج.
من المثير للاهتمام أن تأثير العمر على السمنة والتهاب اللثة لوحظ أيضًا في هذه الدراسة، حيث يمكن أن نجد قيمة عتبة للعلاقة بين WWI والتهاب اللثة في الأشخاص الذين تزيد أعمارهم عن 60 عامًا، وهو ما يعد توجيهًا سريريًا. وهذا يعني أن الأشخاص الذين تزيد أعمارهم عن 60 عامًا يجب ألا يهدفوا فقط إلى مستويات منخفضة من WWI؛ فالمستويات المنخفضة جدًا أو المرتفعة جدًا من WWI يمكن أن تزيد من خطر التهاب اللثة. على الرغم من أنه تم اقتراح أن السمنة في الشباب تزيد من خطر الوفاة، فإن عواقب السمنة على السكان المسنين أكثر تعقيدًا بكثير.
لدراستنا بعض القيود. أولاً، استنادًا إلى بيانات من فحوصات اللثة NHANES 2009-2014، لم نتمكن من دراسة حالة اللثة للمشاركين الذين كانوا فوق 30 عامًا والذين كان لديهم على الأقل سن طبيعي واحد، متجاهلين أولئك الذين كانوا أصغر من 30 عامًا أو الذين فقدوا جميع أسنانهم بسبب التهاب اللثة قبل سن 30. لذلك، نتائج الدراسة قدّرت عدد الأشخاص الذين يعانون من التهاب اللثة بشكل غير دقيق. وهذا يؤدي إلى انحراف الاستنتاجات عن الوضع الحقيقي. ثانيًا، حتى بعد التحكم في بعض المتغيرات المربكة ذات الصلة، لا يمكننا استبعاد تأثير المزيد من المتغيرات المربكة على النتائج. علاوة على ذلك، تأتي البيانات من NHANES، فهي تعكس فقط وضع الأمريكيين، وليس وضع جميع الدول في جميع أنحاء العالم. بالإضافة إلى ذلك، لا يمكن تحديد الترتيب السببي من خلال الدراسات المقطعية، لذا هناك حاجة إلى المزيد من الدراسات الطولية المستقبلية لتأكيد هذه النتائج.
منحنى ROC لالتهاب اللثة
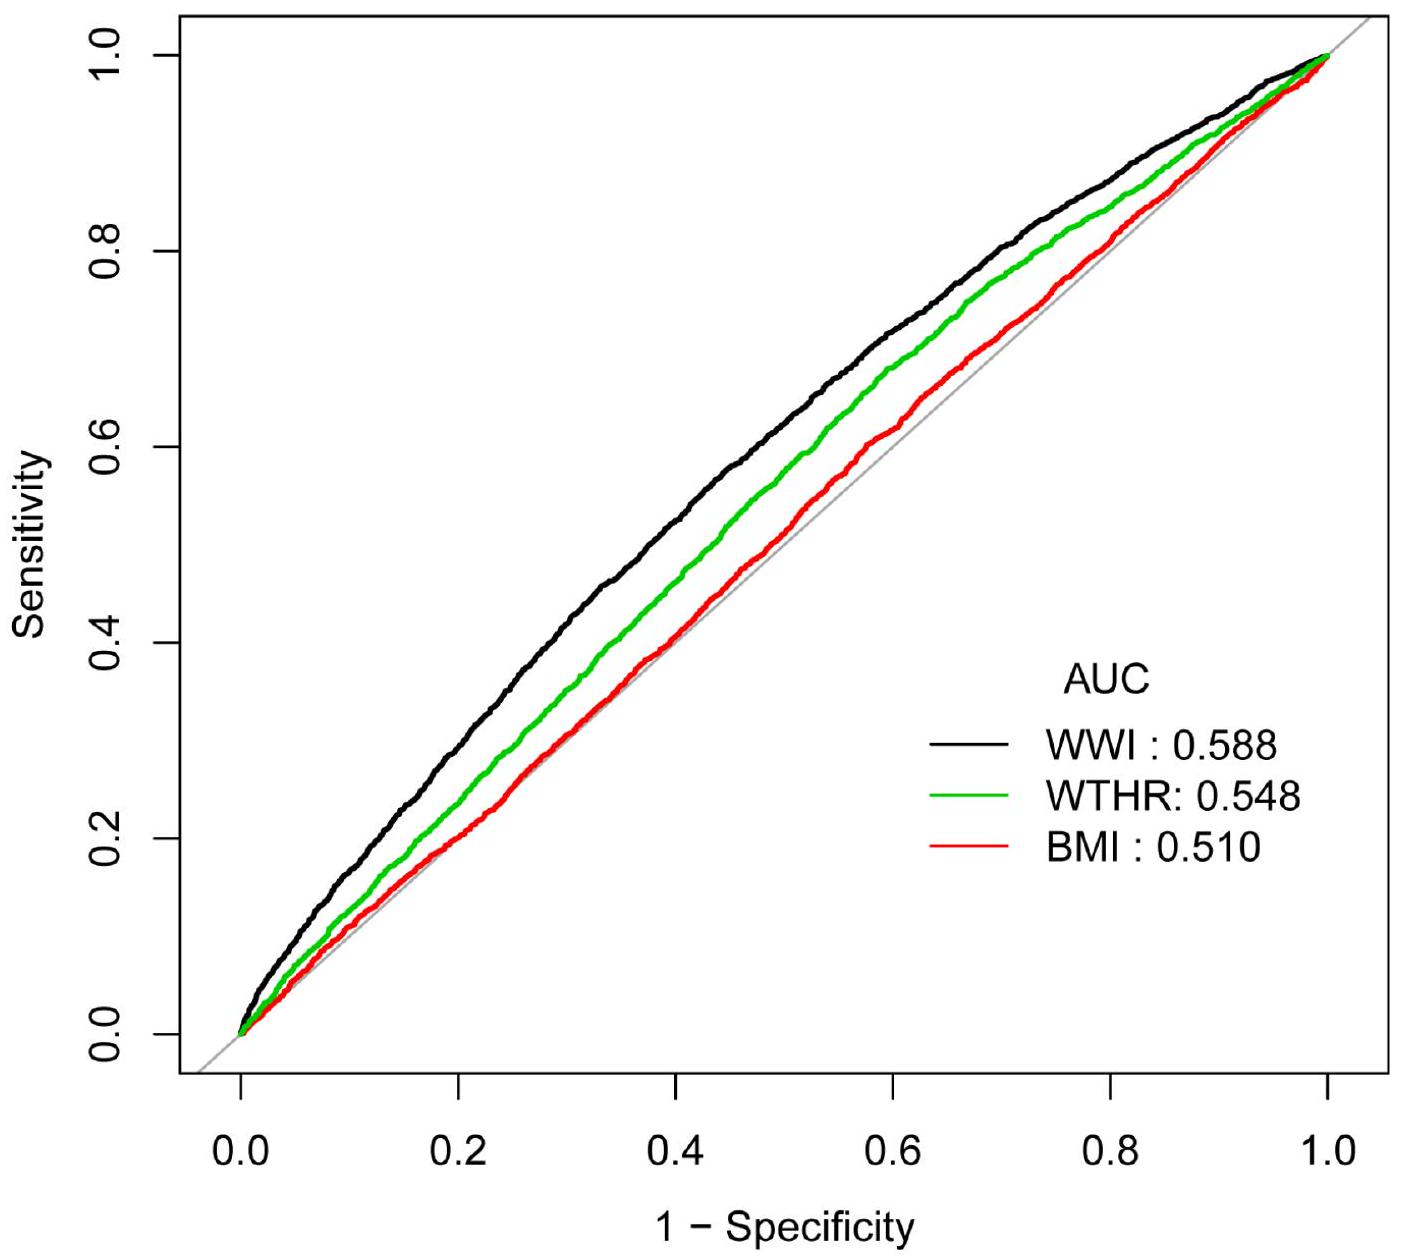
الشكل 4. منحنيات ROC لـ WWI و BMI و WtHR و التهاب اللثة.
الخاتمة
كشفت هذه الدراسة المقطعية المستندة إلى NHANES عن وجود علاقة إيجابية بين WWI و WtHR والتهاب اللثة، لكن العلاقة بين BMI والتهاب اللثة لم تكن ذات دلالة إحصائية. أظهر WWI قدرة تنبؤية أفضل لالتهاب اللثة مقارنة بـ BMI و WtHR. أظهرت العلاقة بين WWI والتهاب اللثة اختلافات عمرية. بالنسبة لأولئك الذين تزيد أعمارهم عن 60 عامًا، كان خطر التهاب اللثة أقل ما يمكن عندما يبقى WWI عند مستوى
توفر البيانات
يمكن العثور على جميع البيانات في قاعدة بيانات NHANES (www.cdc.gov/nchs/nhanes/).
تاريخ الاستلام: 3 فبراير 2024؛ تاريخ القبول: 18 ديسمبر 2024
تم النشر عبر الإنترنت: 03 يناير 2025
تاريخ الاستلام: 3 فبراير 2024؛ تاريخ القبول: 18 ديسمبر 2024
تم النشر عبر الإنترنت: 03 يناير 2025
References
- Glickman, I. Periodontal Disease. N. Engl. J. Med. 284 (19), 1071-1077 (1971).
- Kwon, T., Lamster, I. B. & Levin, L. Current concepts in the management of Periodontitis. Int. Dent. J. 71 (6), 462-476 (2021).
- Jiao, J. et al. The prevalence and severity of periodontal disease in Mainland China: data from the Fourth National oral health survey (2015-2016). J. Clin. Periodontol. 48 (2), 168-179 (2021).
- Dannewitz, B., Holtfreter, B. & Eickholz, P. [Periodontitis-therapy of a widespread disease]. Bundesgesundheitsblatt Gesundheitsforschung Gesundheitsschutz. 64 (8), 931-940 (2021).
- Kleinstein, S. E., Nelson, K. E. & Freire, M. Inflammatory networks linking oral microbiome with systemic health and disease. J. Dent. Res. 99 (10), 1131-1139 (2020).
- Fiorillo, L. Oral health: the First Step to Well-Being. Med. (Kaunas) 55(10). (2019).
- Bao, J. et al. Periodontitis may induce gut microbiota dysbiosis via salivary microbiota. Int. J. Oral Sci. 14(1). (2022).
- Qian, J. et al. Periodontitis Salivary Microbiota worsens colitis. J. Dent. Res. 101 (5), 559-568 (2022).
- Caballero, B. Humans against obesity: who Will Win? Adv. Nutr. 10 (suppl_1), S4-S9 (2019).
- Conway, B. & Rene, A. Obesity as a disease: no lightweight matter. Obes. Rev. 5 (3), 145-151 (2004).
- Piché, M. E., Tchernof, A. & Després, J. P. Obesity phenotypes, diabetes, and Cardiovascular diseases. Circ. Res. 126 (11), 14771500 (2020).
- Maggio, C. A. & Pi-Sunyer, F. X. Obesity and type 2 diabetes. Endocrinol. Metab. Clin. North. Am. 32 (4), 805-822 (2003). viii.
- Seravalle, G. & Grassi, G. Obesity and hypertension. Pharmacol. Res. 122, 1-7 (2017).
- Milaneschi, Y., Simmons, W. K., van Rossum, E. F. C. & Penninx, B. W. Depression and obesity: evidence of shared biological mechanisms. Mol. Psychiatry. 24 (1), 18-33 (2019).
- Cox, A. J., West, N. P. & Cripps, A. W. Obesity, inflammation, and the gut microbiota. Lancet Diabetes Endocrinol. 3 (3), 207-215 (2015).
- Lemamsha, H., Randhawa, G. & Papadopoulos, C. Prevalence of Overweight and Obesity among Libyan Men and Women. Biomed Res Int 2019:8531360. (2019).
- De Laet, C. et al. Body mass index as a predictor of fracture risk: a meta-analysis. Osteoporos. Int. 16 (11), 1330-1338 (2005).
- Compston, J. E. et al. Relationship of weight, height, and body mass index with fracture risk at different sites in postmenopausal women: the global longitudinal study of osteoporosis in women (GLOW). J. Bone Min. Res. 29 (2), 487-493 (2014).
- Edwards, M. H. & Buehring, B. Novel approaches to the diagnosis of Sarcopenia. J. Clin. Densitom. 18 (4), 472-477 (2015).
- Kim, K. J., Son, S., Kim, K. J., Kim, S. G. & Kim, N. H. Weight-adjusted waist as an integrated index for fat, muscle and bone health in adults. J. Cachexia Sarcopenia Muscle (2023).
- Muñoz-Hernando, J. et al. Usefulness of the waist-to-height ratio for predicting cardiometabolic risk in children and its suggested boundary values. Clin. Nutr. 41 (2), 508-516 (2022).
- Cheraghi, Z. & Wu, X. Association between weight-adjusted-waist index and periodontitis risk: a cross-sectional study. Plos One 19(5). (2024).
- Chaubal, T. et al. Association between weight-adjusted waist index and periodontitis: a population-based study. Plos One 19(6). (2024).
- Ye, J. et al. Association between the weight-adjusted waist index and stroke: a cross-sectional study. BMC Public. Health. 23 (1), 1689 (2023).
- Lin, F. X. & Xu, Z. P. WWI: a novel lens on kidney stone risk prediction. World J. Urol. 42 (1), 1 (2023).
- Li, M. et al. The association between weight-adjusted-waist index and depression: results from NHANES 2005-2018. J. Affect. Disord. 347, 299-305 (2024).
- Kangas, S. et al. Waist circumference and waist-to-height ratio are associated with periodontal pocketing-results of the Health 2000 Survey. BMC Oral Health 17(1). (2017).
- Kongstad, J., Hvidtfeldt, U. A., Grønbæk, M., Stoltze, K. & Holmstrup, P. The relationship between body Mass Index and Periodontitis in the Copenhagen City Heart Study. J. Periodontol. 80 (8), 1246-1253 (2009).
- Kumar, S., Dagli, R. J., Dhanni, C. & Duraiswamy, P. Relationship of body mass index with periodontal health status of green marble mine laborers in Kesariyaji, India. Braz Oral Res. 23 (4), 365-369 (2009).
- Eke, P. I., Page, R. C., Wei, L., Thornton-Evans, G. & Genco, R. J. Update of the Case definitions for Population-Based Surveillance of Periodontitis. J. Periodontol. 83 (12), 1449-1454 (2012).
- Li, A. et al. Serum Antioxidant Vitamins Mediate the Association between Periodontitis and metabolically unhealthy Overweight/ Obesity. Nutrients 14(22). (2022).
- Palmer, M. K. & Toth, P. P. Trends in lipids, obesity, metabolic syndrome, and diabetes Mellitus in the United States: an NHANES Analysis (2003-2004 to 2013-2014). Obes. (Silver Spring). 27 (2), 309-314 (2019).
- Hu, Q. et al. Association of weight-adjusted-waist index with non-alcoholic fatty liver disease and liver fibrosis: a cross-sectional study based on NHANES. Eur. J. Med. Res. 28 (1), 263 (2023).
- Chen, X. et al. Association between life’s essential 8 and periodontitis: a population-based study. BMC Oral Health. 24 (1), 19 (2024).
- Gunzerath, L., Faden, V., Zakhari, S. & Warren, K. National Institute on Alcohol Abuse and Alcoholism report on moderate drinking. Alcohol Clin. Exp. Res. 28 (6), 829-847 (2004).
- Bull, F. C. et al. World Health Organization 2020 guidelines on physical activity and sedentary behaviour. Br. J. Sports Med. 54 (24), 1451-1462 (2020).
- Sun, J. et al. Association between C-Reactive protein and periodontitis in an obese population from the NHANES 2009-2010. BMC Oral Health. 23 (1), 512 (2023).
- Borrell, L. N. & Crawford, N. D. Disparities in self-reported hypertension in hispanic subgroups, non-hispanic black and nonhispanic white adults: the national health interview survey. Ann. Epidemiol. 18 (10), 803-812 (2008).
- Wang, Q. et al. Association of sleep complaints with all-cause and heart disease mortality among US adults. Front. Public. Health. 11, 1043347 (2023).
- Levis, B., Benedetti, A. & Thombs, B. D. Accuracy of Patient Health Questionnaire-9 (PHQ-9) for screening to detect major depression: individual participant data meta-analysis. Bmj 365, 11476 (2019).
- Ranstam, J. Multiple P-values and Bonferroni correction. Osteoarthr. Cartil. 24 (5), 763-764 (2016).
- Park, Y., Kim, N. H., Kwon, T. Y. & Kim, S. G. A novel adiposity index as an integrated predictor of cardiometabolic disease morbidity and mortality. Sci. Rep. 8 (1), 16753 (2018).
- Qin, Z. et al. The association between weight-adjusted-waist index and increased urinary albumin excretion in adults: a populationbased study. Front. Nutr. 9, 941926 (2022).
- Zhang, D. et al. Association between weight-adjusted-waist index and heart failure: results from National Health and Nutrition Examination Survey 1999-2018. Front. Cardiovasc. Med. 9, 1069146 (2022).
- Yu, S. et al. Weight-adjusted-Waist Index predicts newly diagnosed diabetes in Chinese rural adults. J. Clin. Med. 12(4). (2023).
- Kawai, T., Autieri, M. V. & Scalia, R. Adipose tissue inflammation and metabolic dysfunction in obesity. Am. J. Physiol. Cell. Physiol. 320 (3), C375-c391 (2021).
- Hotamisligil, G. S., Shargill, N. S. & Spiegelman, B. M. Adipose expression of tumor necrosis factor-alpha: direct role in obesitylinked insulin resistance. Science 259 (5091), 87-91 (1993).
- Devlin, M. J. & Rosen, C. J. The bone-fat interface: basic and clinical implications of marrow adiposity. Lancet Diabetes Endocrinol. 3 (2), 141-147 (2015).
- Benova, A. & Tencerova, M. Obesity-Induced Changes in Bone Marrow Homeostasis. Front. Endocrinol. (Lausanne). 11, 294 (2020).
- Krakauer, N. Y. & Krakauer, J. C. Untangling Waist circumference and hip circumference from body Mass Index with a body shape index, hip index, and Anthropometric Risk Indicator. Metab. Syndr. Relat. Disord. 16 (4), 160-165 (2018).
- Mathus-Vliegen, E. M. Obesity and the elderly. J. Clin. Gastroenterol. 46 (7), 533-544 (2012).
- Bosello, O. & Vanzo, A. Obesity paradox and aging. Eat. Weight Disord. 26 (1), 27-35 (2021).
- Xie, R. et al. Association between SII and hepatic steatosis and liver fibrosis: a population-based study. Front. Immunol. 13, 925690 (2022).
- Huang, Z. Association between blood lead level with high blood pressure in US (NHANES 1999-2018). Front. Public. Health. 10, 836357 (2022).
- Ouyang, Y. et al. Saturation effect of body Mass Index on Bone Mineral density in adolescents of different ages: a Population-based study. Front. Endocrinol. (Lausanne). 13, 922903 (2022).
الشكر والتقدير
نود أن نشكر قاعدة بيانات NHANES على توفير هذه البيانات.
مساهمات المؤلفين
صمم XingJin Chen الدراسة، وساهم في جمع البيانات، ودمج البيانات، وتحليل البيانات، وصاغ المخطوطة. ساهم ChongWen Zeng و XianRun Chen في تفسير البيانات والمخطوطة. ساهم FuQian Jin في دمج البيانات. ساهم JuKun Song و Zhu Chen و JiangLing Sun في المراجعة والتحرير. قرأ جميع المؤلفين ووافقوا على المخطوطة النهائية.
التمويل
صندوق العلوم والتكنولوجيا في مقاطعة قويتشو (ZK [2024] عام 598)؛ صندوق العلوم والتكنولوجيا في قويتشو ([2022] 4)
الإعلانات
المصالح المتنافسة
يعلن المؤلفون عدم وجود مصالح متنافسة.
موافقة الأخلاقيات والموافقة على المشاركة
تم اتباع المبادئ التوجيهية لإعلان هلسنكي في إجراء هذه التحقيق. وافق مجلس مراجعة أخلاقيات البحث في المركز الوطني للإحصاءات الصحية على منهجية الدراسة.
موافقة النشر
أوافق على النشر، بما في ذلك بياناتي، والجداول، والأشكال، والمعلومات الأخرى.
معلومات إضافية
يجب توجيه المراسلات وطلبات المواد إلى Z.C. أو J.S.
معلومات إعادة الطبع والتصاريح متاحة على www.nature.com/reprints.
ملاحظة الناشر تظل Springer Nature محايدة فيما يتعلق بالمطالبات القضائية في الخرائط المنشورة والانتماءات المؤسسية.
معلومات إعادة الطبع والتصاريح متاحة على www.nature.com/reprints.
ملاحظة الناشر تظل Springer Nature محايدة فيما يتعلق بالمطالبات القضائية في الخرائط المنشورة والانتماءات المؤسسية.
الوصول المفتوح هذه المقالة مرخصة بموجب رخصة المشاع الإبداعي للاستخدام غير التجاري، والتي تسمح بأي استخدام غير تجاري، ومشاركة، وتوزيع، وإعادة إنتاج في أي وسيلة أو تنسيق، طالما أنك تعطي الائتمان المناسب للمؤلفين الأصليين والمصدر، وتوفر رابطًا لرخصة المشاع الإبداعي، وتوضح إذا قمت بتعديل المادة المرخصة. ليس لديك إذن بموجب هذه الرخصة لمشاركة المواد المعدلة المشتقة من هذه المقالة أو أجزاء منها. الصور أو المواد الأخرى من طرف ثالث في هذه المقالة مشمولة في رخصة المشاع الإبداعي للمقالة، ما لم يُذكر خلاف ذلك في سطر ائتمان المادة. إذا لم تكن المادة مشمولة في رخصة المشاع الإبداعي للمقالة واستخدامك المقصود غير مسموح به بموجب اللوائح القانونية أو يتجاوز الاستخدام المسموح به، ستحتاج إلى الحصول على إذن مباشرة من صاحب حقوق الطبع والنشر. لعرض نسخة من هذه الرخصة، قم بزيارة http://creativecommo ns.org/licenses/by-nc-nd/4.0/.
© المؤلفون 2024
© المؤلفون 2024
مستشفى قويتشو لطب الأسنان، 253 طريق جييفانغ، منطقة نانمينغ، قويتشو، الصين. كلية طب الأسنان، جامعة زونغيي الطبية، زونغيي، الصين. قسم جراحة الفم والفكين، المستشفى التابع لجامعة قويتشو الطبية، رقم 9، طريق بكين، منطقة يونيان، قويتشو 550005، الصين. البريد الإلكتروني: zhuchen@gzu.edu.cn; songjukun@163.com استطلاع الصحة والتغذية الوطني [https://www.cdc.gov/nchs/nhanes/index.htm].
موافقة مجلس مراجعة أخلاقيات NCHS (ERB) * [https://www.cdc.gov/nchs/nhanes/irba98.htm].
صحة الفم – اللثة [https://wwwn.cdc.gov/Nchs/Nhanes/2009-2010/OHXPER_F.htm].
Journal: Scientific Reports, Volume: 15, Issue: 1
DOI: https://doi.org/10.1038/s41598-024-83963-7
PMID: https://pubmed.ncbi.nlm.nih.gov/39753692
Publication Date: 2025-01-03
DOI: https://doi.org/10.1038/s41598-024-83963-7
PMID: https://pubmed.ncbi.nlm.nih.gov/39753692
Publication Date: 2025-01-03
OPEN
Relationship between three body obesity indicators, WWI, BMI, WtHR, and periodontitis
Many scholars have studied the relationship between obesity and periodontitis. The relationship between different obesity indicators and periodontitis seems to vary. In this study, we would like to explore the relationship between three commonly used obesity indicators, WWI (weight-adjustedwaist index), BMI (body mass index), WtHR (waist-to-height ratio), and periodontitis, and try to find the most clinically valuable indicators. The NHANES 2009-2014 provided the data for this study. 10,289,10,600 and 10,290 participants were included to explore the relationship between WWI, BMI, WtHR and periodontitis respectively. Multiple logistic regression, smooth curve fitting, threshold effects analysis, and subgroup analysis were used to explore their relationships. WWI and periodontitis positively correlated in model III (
Keywords Weight-adjusted-waist index, Body mass index, Waist-to-height ratio, Periodontitis, NHANES, Cross-sectional study
Abbreviations
| WWI | Weight-adjusted-waist index |
| BMI | Body mass index |
| WtHR | Waist-to-height ratio |
| NHANES | The National Health and Nutrition Examination Survey |
| CDC-AAP | The Centers for Disease Control and Prevention and the American Academy of Periodontology |
| AL | Attachment loss |
| PD | Probing depth |
| PIR | Poverty Impact Ratio |
| NIAAA | The National Institute on Alcohol Abuse and Alcoholism |
| OGTT | Oral Glucose Tolerance Test |
| PHQ-9 | Patient Health Questionnaire-9 |
| OR | Odds Ratio |
| CI | Confidence Interval |
| ROC | Receiver Operating Characteristic Curve |
| AUC | Area Under Curve |
Periodontitis, a chronic inflammatory disease of the tissues supporting the teeth, can result in alveolar bone loss, tooth loss, and eventually a lower quality of life
survey conducted in China,
More than 2 billion people are presently impacted by the worldwide obesity pandemic, which is still advancing relentlessly
In previous studies, many scholars have studied the relationship between obesity and periodontitis. Two scholars investigated the relationship between WWI and periodontitis and found a positive correlation between WWI and periodontitis
Materials and methods
Data source
The NHANES 2009-2014 provided the data for this study. The NHANES is a national representative sample survey of the American population, it including demographic data, dietary data, examination data, laboratory data, questionnaire data, and limited access data, all of which are freely available information except limited access data
Study participants
According to NHANES standards for periodontal exams, only participants who were 30 years of age or older and who retained at least one natural tooth performed periodontal exams
Definition of WWI, BMI and WtHR
WWI $=$ waist circumference $(c m) / sqrt{text { weight }(k g)}$
BMI $=$ weight $(k g) /$ height $^{2}left(m^{2}right)$
WtHR $=$ waist circumference (cm)/ height (cm)
Definition of periodontitis
Based on the conclusions of Eke, there are four categories of periodontitis according to CDC-AAP (the Centers for Disease Control and Prevention and the American Academy of Periodontology): none, mild, moderate, and severe. Mild periodontitis was defined as
Fig. 1. Flow chart of participants selection.
interproximal sites with
Covariates
This study also took into account the covariates of sex, age, race, PIR (Poverty Impact Ratio); education level, marital status, alcohol use, smoking, diabetes, floss use, hypertension, adequate physical activity, sleep disorders and depression, which may have an impact on the relationship between WWI and periodontitis
Questionnaire-9 (PHQ-9) was used to evaluate depression. The first PHQ-9 research established the traditional cutoff score of 10 or higher as a means of screening potential depression
Statistical analysis
The statistical software tool EmpowerStats (version 2.0) was used to combine the data, and Adobe Illustrator (version 2021) was used to create the pictures in this study. Categorical variables are presented as percentages. Chi-square tests and Kruskal-Wallis tests were used to determine whether there was a significant difference between different obesity indicators and periodontitis. First, we evaluated the independent relationship between the three obesity indicators and periodontitis using multiple logistic regression. In this study, the crude model does not take into account variables; model I only takes into account sex, age, and race; model II, based on model I, takes into account PIR, education level, marital status, smoking, alcohol use, diabetes, floss use, hypertension, adequate physical activity, sleep disorders and depression. Then, the dose-response relationship and the inflection point between these obesity indicators and periodontitis were assessed using the smooth curve fitting and threshold effect analysis. Subgroup analysis and interaction tests were carried out to find out the impact of covariates on the association between the three obesity indicators and periodontitis. Finally, we compared the ability of these three obesity indicators to predict periodontitis with a view to finding the best one to predict periodontitis. Bonferroni correction of the
Results
Baseline characteristics of participants
In the relationship between WWI and periodontitis, a total of 10,289 participants were enrolled, of whom
The association between three obesity indicators and periodontitis
Multiple logistic regression showed that WWI and WtHR showed significant positive associations with periodontitis, but BMI did not seem to be associated with periodontitis (Table 2). Both the least adjusted model
Furthermore, a smooth curve fitting (Fig. 2) and threshold effects analysis (Table 3) were conducted to describe the linear or nonlinear relationship between WWI, BMI, WtHR and periodontitis. A positive relationship between WWI and periodontitis with an inflection point of
Subgroup analysis
The results of the subgroup analyses similarly supported the positive association between WWI, WtHR and periodontitis, while BMI still did not show a significant correlation with periodontitis (Table 4). Meanwhile, WWI, BMI, and WtHR all showed significant interaction effects in age stratification (
| Weight-adjusted-waist index | Total | Q1 (8.62-10.55) | Q2 (10.55-11.07) | Q3 (11.07-11.60) | Q4 (11.60-14.79) |
|
|
|
|
|
|
|||
| Age, n (%) | <0.001 | |||||
| < 60 | 7012 (68.15%) | 2224 (86.47%) | 1938 (75.35%) | 1621 (63.02%) | 1229 (47.77%) | |
|
|
3277 (31.85%) | 348 (13.53%) | 634 (24.65%) | 951 (36.98%) | 1344 (52.23%) | |
| Sex, n (%) | <0.001 | |||||
| Male | 5094 (49.51%) | 1558 (60.58%) | 1424 (55.37%) | 1227 (47.71%) | 885 (34.40%) | |
| Female | 5195 (50.49%) | 1014 (39.42%) | 1148 (44.63%) | 1345 (52.29%) | 1688 (65.60%) | |
| Race, n (%) | <0.001 | |||||
| Mexican American | 1483 (14.41%) | 181 (7.04%) | 356 (13.84%) | 445 (17.30%) | 501 (19.47%) | |
| Other Hispanic | 1036 (10.07%) | 189 (7.35%) | 244 (9.49%) | 313 (12.17%) | 290 (11.27%) | |
| Non-Hispanic White | 4426 (43.02%) | 1147 (44.60%) | 1096 (42.61%) | 1051 (40.86%) | 1132 (44.00%) | |
| Non-Hispanic Black | 2107 (20.48%) | 704 (27.37%) | 499 (19.40%) | 481 (18.70%) | 423 (16.44%) | |
| Others | 1237 (12.02%) | 351 (13.65%) | 377 (14.66%) | 282 (10.96%) | 227 (8.82%) | |
| PIR, n (%) | <0.001 | |||||
| Low (< 1.35) | 2948 (31.21%) | 600 (25.22%) | 665 (28.12%) | 778 (32.76%) | 905 (38.91%) | |
| Middle (1.35-3.45) | 3163 (33.49%) | 723 (30.39%) | 814 (34.42%) | 793 (33.39%) | 833 (35.81%) | |
| High (> 3.45) | 3334 (35.30%) | 1056 (44.39%) | 886 (37.46%) | 804 (33.85%) | 588 (25.28%) | |
| Education level, n (%) | <0.001 | |||||
| High school and below | 4590 (44.66%) | 892 (34.71%) | 1063 (41.39%) | 1249 (48.58%) | 1386 (53.95%) | |
| Above high school | 5688 (55.34%) | 1678 (65.29%) | 1505 (58.61%) | 1322 (51.42%) | 1183 (46.05%) | |
| Marital status, n (%) | <0.001 | |||||
| Married | 6032 (58.67%) | 1494 (58.11%) | 1577 (61.34%) | 1603 (62.40%) | 1358 (52.82%) | |
| Widowed | 697 (6.78%) | 63 (2.45%) | 124 (4.82%) | 162 (6.31%) | 348 (13.54%) | |
| Divorced | 1308 (12.72%) | 320 (12.45%) | 314 (12.21%) | 304 (11.83%) | 370 (14.39%) | |
| Others | 2245 (21.83%) | 694 (26.99%) | 556 (21.63%) | 500 (19.46%) | 495 (19.25%) | |
| Alcohol use, n (%) | <0.001 | |||||
| Never | 1289 (12.53%) | 231 (8.98%) | 256 (9.95%) | 336 (13.06%) | 466 (18.11%) | |
| Moderate | 3498 (34.00%) | 972 (37.79%) | 949 (36.90%) | 832 (32.35%) | 745 (28.95%) | |
| Severe | 2117 (20.58%) | 576 (22.40%) | 558 (21.70%) | 543 (21.11%) | 440 (17.10%) | |
| Binge | 3385 (32.90%) | 793 (30.83%) | 809 (31.45%) | 861 (33.48%) | 922 (35.83%) | |
| Smoking, n (%) | <0.001 | |||||
| Never | 5767 (56.07%) | 1473 (57.34%) | 1433 (55.72%) | 1429 (55.58%) | 1432 (55.65%) | |
| Ever | 2573 (25.02%) | 501 (19.50%) | 642 (24.96%) | 702 (27.30%) | 728 (28.29%) | |
| Now | 1945 (18.91%) | 595 (23.16%) | 497 (19.32%) | 440 (17.11%) | 413 (16.05%) | |
| Diabetes, n (%) | <0.001 | |||||
| Yes | 1629 (15.84%) | 123 (4.78%) | 276 (10.74%) | 480 (18.66%) | 750 (29.15%) | |
| No | 8658 (84.16%) | 2449 (95.22%) | 2294 (89.26%) | 2092 (81.34%) | 1823 (70.85%) | |
| Hypertension, n (%) | <0.001 | |||||
| Yes | 3798 (36.96%) | 530 (20.63%) | 846 (32.93%) | 1055 (41.07%) | 1367 (53.23%) | |
| No | 6477 (63.04%) | 2039 (79.37%) | 1723 (67.07%) | 1514 (58.93%) | 1201 (46.77%) | |
| Adequate physical activity, n (%) | <0.001 | |||||
| Yes | 3152 (30.68%) | 874 (34.06%) | 885 (34.44%) | 772 (30.04%) | 621 (24.18%) | |
| No | 7122 (69.32%) | 1692 (65.94%) | 1685 (65.56%) | 1798 (69.96%) | 1947 (75.82%) | |
| Floss use, n (%) | <0.001 | |||||
| Never | 3227 (31.62%) | 742 (29.02%) | 766 (30.02%) | 824 (32.29%) | 895 (35.18%) | |
| Rarely | 1658 (16.25%) | 483 (18.89%) | 422 (16.54%) | 398 (15.60%) | 355 (13.95%) | |
| Moderately | 1831 (17.94%) | 480 (18.77%) | 502 (19.67%) | 465 (18.22%) | 384 (15.09%) | |
| Frequently | 3489 (34.19%) | 852 (33.32%) | 862 (33.78%) | 865 (33.89%) | 910 (35.77%) | |
| Sleep disorders, n (%) | <0.001 | |||||
| Yes | 2816 (27.37%) | 572 (22.24%) | 638 (24.81%) | 699 (27.18%) | 907 (35.25%) | |
| No | 7473 (72.63%) | 2000 (77.76%) | 1934 (75.19%) | 1873 (72.82%) | 1666 (64.75%) | |
| Depression, n (%) | <0.001 | |||||
| Continued | ||||||
| Weight-adjusted-waist index | Total | Q1 (8.62-10.55) | Q2 (10.55-11.07) | Q3 (11.07-11.60) | Q4 (11.60-14.79) |
|
| N = 2572 | N = 2572 | N=2572 | N = 2573 | |||
| Yes | 948 (9.87%) | 185 (7.80%) | 184 (7.62%) | 226 (9.37%) | 353 (14.64%) | |
| No | 8660 (90.13%) | 2186 (92.20%) | 2230 (92.38%) | 2185 (90.63%) | 2059 (85.36%) | |
| Periodontitis, n (%) | <0.001 | |||||
| Yes | 4709 (45.77%) | 916 (35.61%) | 1111 (43.20%) | 1263 (49.11%) | 1419 (55.15%) | |
| No | 5580 (54.23%) | 1656 (64.39%) | 1461 (56.80%) | 1309 (50.89%) | 1154 (44.85%) |
Table 1. Baseline characteristics of participants.
| Exposure | Model I (OR, 95% CI,
|
Model II (OR, 95% CI,
|
Model III (OR, 95% CI,
|
| WWI (
|
1.52 (1.44, 1.60) <0.001 | 1.54 (1.45, 1.64) <0.001 | 1.35 (1.26, 1.45) <0.001 |
| WWI, (quartile) | |||
| Q1 (8.62-10.55) | 1.0 | 1.0 | 1.0 |
| Q2 (10.55-11.07) | 1.37 (1.23, 1.54) <0.001 | 1.35 (1.20, 1.52) <0.001 | 1.25 (1.09, 1.44) 0.001 |
| Q3 (11.07-11.60) | 1.74 (1.56, 1.95) <0.001 | 1.66 (1.47, 1.87) <0.001 | 1.50 (1.30, 1.73) <0.001 |
| Q4 (11.60-14.79) | 2.22 (1.99, 2.49) <0.001 | 2.15 (1.89, 2.45) <0.001 | 1.61 (1.38, 1.88) <0.001 |
|
|
1.57 (1.48, 1.67) <0.001 | 1.54 (1.43, 1.65) <0.001 | 1.31 (1.21, 1.43) <0.001 |
| BMI (
|
1.00 (1.00, 1.01) 0.196 | 1.01 (1.00, 1.01) 0.079 | 1.00 (0.99, 1.01) 0.757 |
| BMI, (quartile) | |||
| Q1 (13.18-24.67) | 1.0 | 1.0 | 1.0 |
| Q2 (24.67-28.17) | 1.05 (0.95, 1.18) 0.334 | 0.91 (0.81, 1.02) 0.095 | 0.94 (0.81, 1.09) 0.414 |
| Q3 (28.17-32.50) | 1.09 (0.97, 1.21) 0.137 | 0.92 (0.82, 1.03) 0.150 | 1.02 (0.87, 1.19) 0.817 |
| Q4 (32.50-82.95) | 1.05 (0.95, 1.17) 0.348 | 1.02 (0.91, 1.15) 0.689 | 0.96 (0.82, 1.13) 0.657 |
|
|
1.00 (1.00, 1.01) 0.366 | 1.00 (1.00, 1.01) 0.442 | 1.00 (0.99, 1.01) 0.867 |
| WtHR | 5.63 (3.70, 8.58) <0.001 | 5.42 (3.41, 8.62) <0.001 | 2.94 (1.57, 5.50) <0.001 |
| WtHR, (quartile) | |||
| Q1 (0.36-0.53) | 1.0 | 1.0 | 1.0 |
| Q2 (0.53-0.59) | 1.29 (1.16, 1.45) <0.001 | 1.11 (0.99, 1.25) 0.072 | 1.26 (1.08, 1.46) 0.003 |
| Q3 (0.59-0.65) | 1.50 (1.34, 1.68) <0.001 | 1.25 (1.11, 1.41) <0.001 | 1.33 (1.14, 1.55) <0.001 |
| Q4 (0.65-1.14) |
|
1.48 (1.32, 1.68) <0.001 | 1.35 (1.15, 1.59) <0.001 |
|
|
8.33 (4.99, 13.90) < 0.001 |
|
3.74 (1.76, 7.96) <0.001 |
Table 2. Association between WWI, BMI, WtHR, and periodontitis in different models. Model I was unadjusted. Model II was adjusted for sex; age; and race. Model III adjusted for sex; age; race; PIR; education level; marital status; smoking; alcohol use; diabetes; hypertension; floss use; adequate physical activity; sleep disorders; depression.
than 60 years of age. BMI and periodontitis showed a difference in age, but this difference was not significantly informative.
Predictive ability of WWI, BMI and WthR for periodontitis
The AUC (Area Under Curve) values (
Discussion
The cross-sectional study revealed a positive association between WWI and WtHR and periodontitis, but the association between BMI and periodontitis was not significant. In the total population, the higher the WWI and WtHR, the higher the risk of periodontitis. The risk of developing periodontitis is more significant when the WWI is more than
Fig. 2. Dose-response relationship between WWI, BMI, WtHR, and periodontitis. A nonlinear relationship between WWI, WtHR, and periodontitis was found in smooth curve fitting. A linear relationship between BMI and periodontitis was found in smooth curve fitting. The solid red line represents the smooth curve fit between variables. Blue bands represent the
| Exposure | Periodontitis(OR, 95% CI,
|
| WWI | |
| Fitting by the logistic regression model | 1.35 (1.26, 1.45) <0.001 |
| Fitting by two-piecewise linear logistic mode | |
| Inflection point | 12.68 |
| < 12.68 | 1.32 (1.22, 1.42) <0.001 |
|
|
3.44 (1.43, 8.26) 0.006 |
| Log likelihood ratio test | 0.028 |
| WtHR | |
| Fitting by the logistic regression model | 2.94 (1.57, 5.50) <0.001 |
| Fitting by two-piecewise linear logistic mode | |
| Inflection point | 0.59 |
| < 0.59 | 11.95 (2.92, 48.97) <0.001 |
|
|
1.29 (0.49, 3.41) 0.602 |
| Log likelihood ratio test | 0.029 |
Table 3. Threshold effect analysis of the WWI, WtHR, and periodontitis using piece-wise logistic regression.
Previous studies have reported the relationship between WWI, as an indicator of obesity, and many diseases. For example, Yousung Park
In the present study, WWI and WtHR showed a significant correlation with periodontitis. Moreover, WWI demonstrated greater predictive ability for periodontitis compared to WtHR and BMI. From the smoothed curve fitting we can see that the risk of periodontitis increases significantly after WWI level reaches a certain value. That means that when obesity exceeds a certain limit, individuals are more likely to develop periodontitis. The reasons may as follow. First, it has been reported that obesity is an inflammatory response disorder that can cause chronic, low-grade systemic inflammation
| Subgroup | WWI | BMI | WtHR | ||||||
|
|
Periodontitis [OR (95% CI)] |
|
|
Periodontitis [OR (95% CI)] |
|
|
Periodontitis [OR (95% CI)] |
|
|
| Sex | 0.127 | 0.609 | 0.742 | ||||||
| Male | 5094 | 1.75 (1.62, 1.90) <0.001 | 5226 | 1.00 (0.99, 1.01) 0.624 | 5096 | 7.84 (3.98, 15.45) < 0.001 | |||
| Female | 5195 | 1.78 (1.65, 1.92) <0.001 | 5374 | 1.01 (1.01, 1.02) <0.001 | 5194 | 13.88 (7.88, 24.47) <0.001 | |||
| Age | <0.001 | 0.011 | 0.001 | ||||||
| <60 | 7012 | 1.40 (1.31, 1.49) <0.001 | 7183 | 1.01 (1.01, 1.02) <0.001 | 7016 | 6.07 (3.66, 10.07) < 0.001 | |||
|
|
3277 | 1.12 (1.01, 1.24) 0.028 | 3417 | 0.99 (0.98, 1.00) 0.018 | 3274 | 0.79 (0.35, 1.78) 0.565 | |||
| Race | 0.096 | 0.348 | 0.107 | ||||||
| Mexican American | 1483 |
|
1509 | 1.00 (0.99, 1.02) 0.730 | 1482 | 8.34 (2.33, 29.84) 0.001 | |||
| Other Hispanic | 1036 |
|
1065 | 1.00 (0.98, 1.02) 0.687 | 1037 | 5.87 (1.38, 24.91) 0.016 | |||
| Non-Hispanic White | 4426 |
|
4545 | 1.00 (0.99, 1.01) 0.752 | 4428 | 8.01 (4.17, 15.38) < 0.001 | |||
| Non-Hispanic Black | 2107 | 1.18 (1.06, 1.32) 0.002 | 2191 | 0.98 (0.97, 0.99) 0.002 | 2106 | 0.69 (0.30, 1.58) 0.377 | |||
| Others | 1237 | 1.64 (1.39, 1.93) < 0.001 | 1290 | 1.02 (1.00, 1.04) 0.134 | 1237 |
|
|||
| Education level | 0.806 | 0.514 | 0.567 | ||||||
| High school and below | 4590 | 1.27 (1.17, 1.37) < 0.001 | 4753 | 0.99 (0.98, 1.00) 0.022 | 4589 | 1.40 (0.75, 2.61) 0.298 | |||
| Above high school | 5688 | 1.56 (1.45, 1.68) <0.001 | 5834 | 1.01 (1.00, 1.02) 0.036 | 5690 | 7.94 (4.38, 14.40) < 0.001 | |||
| PIR | 0.964 | 0.437 | 0.464 | ||||||
| Low | 2948 | 1.24 (1.13, 1.36) <0.001 | 3054 | 0.99 (0.98, 0.99) 0.003 | 2947 | 0.95 (0.45, 1.98) 0.885 | |||
| Moderate | 3163 | 1.42 (1.29, 1.56) <0.001 | 3250 | 0.99 (0.98, 1.00) 0.137 | 3165 | 2.46 (1.16, 5.21) 0.019 | |||
| High | 3334 | 1.61 (1.45, 1.78) <0.001 | 3410 | 1.02 (1.01, 1.03) 0.002 | 3334 |
|
|||
| Marital status | 0.222 | 0.557 | 0.164 | ||||||
| Married | 6032 |
|
6187 | 1.01 (1.00, 1.02) 0.044 | 6033 |
|
|||
| Widowed | 697 | 1.15 (0.94, 1.40) 0.166 | 754 | 0.99 (0.97, 1.01) 0.192 | 695 | 0.60 (0.12, 3.06) 0.535 | |||
| Divorced | 1308 | 1.28 (1.11, 1.48) <0.001 | 1341 | 1.00 (0.98, 1.02) 0.911 | 1308 | 2.42 (0.79, 7.43) 0.123 | |||
| Others | 2245 |
|
2311 | 1.00 (0.99, 1.01) 0.944 | 2247 | 2.86 (1.28, 6.39) 0.011 | |||
| Alcohol use | 0.265 | 0.041 | 0.066 | ||||||
| Never | 1289 | 1.47 (1.28, 1.69) <0.001 | 1331 | 1.00 (0.99, 1.02) 0.781 | 1289 | 3.54 (1.15, 10.95) 0.028 | |||
| Moderate | 3498 |
|
3550 | 1.01 (1.00, 1.02) 0.153 | 3498 |
|
|||
| Severe | 2117 |
|
2138 | 1.01 (1.00, 1.03) 0.027 | 2120 | 9.76 (3.80, 25.06) < 0.001 | |||
| Binge | 3385 |
|
1051 | 0.98 (0.96, 1.00) 0.051 | 1038 | 1.10 (0.30, 4.13) 0.883 | |||
| Smoking | 0.904 | 0.150 | 0.382 | ||||||
| Never | 5767 |
|
5960 | 1.01 (1.00, 1.02) 0.006 | 5765 |
|
|||
| Ever | 2573 |
|
2649 | 1.01 (1.00, 1.02) 0.039 | 2575 |
|
|||
| Now | 1945 | 1.28 (1.14, 1.44) < 0.001 | 1987 | 0.98 (0.97, 1.00) 0.017 | 1946 | 0.94 (0.37, 2.41) 0.900 | |||
| Diabetes | 0.859 | 0.462 | 0.825 | ||||||
| Yes | 1629 | 1.21 (1.05, 1.39) 0.009 | 1702 | 0.98 (0.97, 1.00) 0.015 | 1631 | 0.62 (0.21, 1.80) 0.377 | |||
| No | 8658 | 1.46 (1.38, 1.55) <0.001 | 8896 | 1.00 (0.99, 1.01) 0.842 | 8657 | 4.07 (2.53, 6.55) < 0.001 | |||
| Floss use | 0.263 | 0.062 | 0.154 | ||||||
| Never | 3227 | 1.40 (1.28, 1.53) < 0.001 | 3358 | 0.98 (0.97, 0.99) <0.001 | 3223 | 1.49 (0.72, 3.10) 0.282 | |||
| Rarely | 1658 | 1.58 (1.38, 1.80) <0.001 | 1700 | 1.02 (1.00, 1.03) 0.017 | 1660 |
|
|||
| Moderately | 1831 |
|
1878 | 1.01 (1.00, 1.02) 0.110 | 1832 |
|
|||
| Frequently | 3489 |
|
3578 | 1.02 (1.00, 1.03) 0.004 | 3491 | 11.05 (5.19, 23.53) <0.001 | |||
| Hypertension | 0.058 | 0.287 | 0.225 | ||||||
| Yes | 3798 | 1.30 (1.19, 1.42) <0.001 | 3951 | 0.99 (0.98, 0.99) 0.001 | 3799 | 1.20 (0.60, 2.40) 0.598 | |||
| No | 6477 |
|
6633 | 1.00 (1.00, 1.01) 0.428 | 6477 |
|
|||
| Enough physical activity | 0.744 | 0.543 | 0.471 | ||||||
| Yes | 3152 |
|
3216 | 0.99 (0.98, 1.01) 0.319 | 3153 | 1.98 (0.89, 4.40) 0.094 | |||
| No | 7122 |
|
7369 | 1.01 (1.00, 1.01) 0.039 | 7122 | 8.60 (5.23, 14.16) < 0.001 | |||
| Sleep disorder | 0.184 | 0.795 | 0.602 | ||||||
| Yes | 2816 | 1.62 (1.47, 1.80) <0.001 | 2895 | 1.01 (1.00, 1.02) 0.263 | 2817 | 6.36 (3.02, 13.38) < 0.001 | |||
| No | 7473 |
|
7705 | 1.00 (1.00, 1.01) 0.262 | 7473 | 6.13 (3.65, 10.29) < 0.001 | |||
| Depression | 0.555 | 0.493 | 0.750 | ||||||
| Yes | 948 | 1.33 (1.13, 1.56) <0.001 | 856 | 0.99 (0.98, 1.01) 0.370 | 832 | 1.77 (0.52, 6.09) 0.363 | |||
| No | 8660 |
|
8912 | 1.01 (1.00, 1.01) 0.089 | 5096 |
|
|||
Table 4. Subgroup analysis for the association between WWI, BMI, WtHR, and periodontitis.
Fig. 3. Dose-response relationship between WWI, BMI, and WtHR and periodontitis stratified by age.
| Weight-adjusted-waist index (
|
Periodontitis(OR, 95% CI,
|
| Age
|
1.08 (0.95, 1.23) 0.215 |
| Fitting by two-piecewise linear logistic mode Inflection point | 12.68 |
| < 12.68 | 1.01 (0.88, 1.15) 0.913 |
|
|
7.87 (1.76, 35.20) 0.007 |
| Log likelihood ratio test | 0.002 |
Table 5. Threshold effect analysis of the WWI and Periodontitis stratified by age.
| Test | AUC | 95%CI low | 95%CI upp | Best threshold | Specificity | Sensitivity |
| WWI | 0.588 | 0.577 | 0.599 | 11.060 | 0.556 | 0.575 |
| BMI | 0.510 | 0.498 | 0.521 | 26.990 | 0.424 | 0.6022 |
| WtHR | 0.548 | 0.537 | 0.560 | 0.559 | 0.406 | 0.679 |
Table 6. AUC analysis of WWI, BMI, and WtHR in periodontitis.
Chronic, low-grade systemic inflammation and a negative impact on bone quality are all risk factors for periodontitis. Therefore, it is obvious that there is an inextricable link between obesity and periodontitis.
As to why BMI and periodontitis did not show a significant correlation, we have the following analysis. First of all, although BMI is a widely used indicator of obesity, it mainly reflects the ratio of total body weight to height and does not accurately reflect the distribution of body composition and the exact location of fat accumulation. Second, some individuals may have a high BMI but a low amount of abdominal fat, or some may have a low BMI but a high amount of abdominal fat. Such individual differences may lead to a decrease in the accuracy of BMI in assessing periodontitis risk. Finally, in this article, compared with many articles, we adjusted for numerous covariates and greatly controlled for the effect of confounders on the results
Interestingly, the influence of age on obesity and periodontitis was also observed in this study, in which the relationship between WWI and periodontitis could find a threshold value in people over 60 years of age, which is of clinical guidance. That is say people older than 60 years of age should not just aim for low WWI levels; too low or too high WWI levels can increase the risk of periodontitis. Although it has been proposed that obesity in youth increases the risk of death, the consequences of obesity on the aging population are far more complex
Our study has some limitations. First of all, based on data from NHANES 2009-2014 periodontal exams, we could only study the periodontal condition of participants who were above 30 years old and who had at least one natural tooth, ignoring those who were younger than 30 years old or who had already lost all of their teeth due to periodontitis before the age of 30 . Therefore, the results of the study underestimated the number of people with periodontitis. This leads to a deviation of the conclusions from the real situation. Secondly, even after controlling for a few pertinent confounding variables, we are unable to rule out the impact of further confounders on the outcomes. Furthermore, the data comes from NHANES, it can only reflect the situation of Americans, not the situation of all countries all over the world. Additionally, causal order cannot be determined by cross-sectional studies, so more prospective longitudinal studies are needed to confirm these findings
ROC curve for PERIODONTITIS
Fig. 4. ROC curves for WWI, BMI, WtHR, and periodontitis.
Conclusion
This cross-sectional NHANES-based study exposed a positive correlation between WWI, WtHR and periodontitis, but the relationship between BMI and periodontitis was not statistically significant. WWI showed better predictive ability for periodontitis compared to BMI and WtHR. The association between WWI and periodontitis showed age differences. For those older than 60 years, the risk of periodontitis was lowest when the WWI remained at
Data availability
All the data can be found in the NHANES database (www.cdc.gov/nchs/nhanes/).
Received: 3 February 2024; Accepted: 18 December 2024
Published online: 03 January 2025
Received: 3 February 2024; Accepted: 18 December 2024
Published online: 03 January 2025
References
- Glickman, I. Periodontal Disease. N. Engl. J. Med. 284 (19), 1071-1077 (1971).
- Kwon, T., Lamster, I. B. & Levin, L. Current concepts in the management of Periodontitis. Int. Dent. J. 71 (6), 462-476 (2021).
- Jiao, J. et al. The prevalence and severity of periodontal disease in Mainland China: data from the Fourth National oral health survey (2015-2016). J. Clin. Periodontol. 48 (2), 168-179 (2021).
- Dannewitz, B., Holtfreter, B. & Eickholz, P. [Periodontitis-therapy of a widespread disease]. Bundesgesundheitsblatt Gesundheitsforschung Gesundheitsschutz. 64 (8), 931-940 (2021).
- Kleinstein, S. E., Nelson, K. E. & Freire, M. Inflammatory networks linking oral microbiome with systemic health and disease. J. Dent. Res. 99 (10), 1131-1139 (2020).
- Fiorillo, L. Oral health: the First Step to Well-Being. Med. (Kaunas) 55(10). (2019).
- Bao, J. et al. Periodontitis may induce gut microbiota dysbiosis via salivary microbiota. Int. J. Oral Sci. 14(1). (2022).
- Qian, J. et al. Periodontitis Salivary Microbiota worsens colitis. J. Dent. Res. 101 (5), 559-568 (2022).
- Caballero, B. Humans against obesity: who Will Win? Adv. Nutr. 10 (suppl_1), S4-S9 (2019).
- Conway, B. & Rene, A. Obesity as a disease: no lightweight matter. Obes. Rev. 5 (3), 145-151 (2004).
- Piché, M. E., Tchernof, A. & Després, J. P. Obesity phenotypes, diabetes, and Cardiovascular diseases. Circ. Res. 126 (11), 14771500 (2020).
- Maggio, C. A. & Pi-Sunyer, F. X. Obesity and type 2 diabetes. Endocrinol. Metab. Clin. North. Am. 32 (4), 805-822 (2003). viii.
- Seravalle, G. & Grassi, G. Obesity and hypertension. Pharmacol. Res. 122, 1-7 (2017).
- Milaneschi, Y., Simmons, W. K., van Rossum, E. F. C. & Penninx, B. W. Depression and obesity: evidence of shared biological mechanisms. Mol. Psychiatry. 24 (1), 18-33 (2019).
- Cox, A. J., West, N. P. & Cripps, A. W. Obesity, inflammation, and the gut microbiota. Lancet Diabetes Endocrinol. 3 (3), 207-215 (2015).
- Lemamsha, H., Randhawa, G. & Papadopoulos, C. Prevalence of Overweight and Obesity among Libyan Men and Women. Biomed Res Int 2019:8531360. (2019).
- De Laet, C. et al. Body mass index as a predictor of fracture risk: a meta-analysis. Osteoporos. Int. 16 (11), 1330-1338 (2005).
- Compston, J. E. et al. Relationship of weight, height, and body mass index with fracture risk at different sites in postmenopausal women: the global longitudinal study of osteoporosis in women (GLOW). J. Bone Min. Res. 29 (2), 487-493 (2014).
- Edwards, M. H. & Buehring, B. Novel approaches to the diagnosis of Sarcopenia. J. Clin. Densitom. 18 (4), 472-477 (2015).
- Kim, K. J., Son, S., Kim, K. J., Kim, S. G. & Kim, N. H. Weight-adjusted waist as an integrated index for fat, muscle and bone health in adults. J. Cachexia Sarcopenia Muscle (2023).
- Muñoz-Hernando, J. et al. Usefulness of the waist-to-height ratio for predicting cardiometabolic risk in children and its suggested boundary values. Clin. Nutr. 41 (2), 508-516 (2022).
- Cheraghi, Z. & Wu, X. Association between weight-adjusted-waist index and periodontitis risk: a cross-sectional study. Plos One 19(5). (2024).
- Chaubal, T. et al. Association between weight-adjusted waist index and periodontitis: a population-based study. Plos One 19(6). (2024).
- Ye, J. et al. Association between the weight-adjusted waist index and stroke: a cross-sectional study. BMC Public. Health. 23 (1), 1689 (2023).
- Lin, F. X. & Xu, Z. P. WWI: a novel lens on kidney stone risk prediction. World J. Urol. 42 (1), 1 (2023).
- Li, M. et al. The association between weight-adjusted-waist index and depression: results from NHANES 2005-2018. J. Affect. Disord. 347, 299-305 (2024).
- Kangas, S. et al. Waist circumference and waist-to-height ratio are associated with periodontal pocketing-results of the Health 2000 Survey. BMC Oral Health 17(1). (2017).
- Kongstad, J., Hvidtfeldt, U. A., Grønbæk, M., Stoltze, K. & Holmstrup, P. The relationship between body Mass Index and Periodontitis in the Copenhagen City Heart Study. J. Periodontol. 80 (8), 1246-1253 (2009).
- Kumar, S., Dagli, R. J., Dhanni, C. & Duraiswamy, P. Relationship of body mass index with periodontal health status of green marble mine laborers in Kesariyaji, India. Braz Oral Res. 23 (4), 365-369 (2009).
- Eke, P. I., Page, R. C., Wei, L., Thornton-Evans, G. & Genco, R. J. Update of the Case definitions for Population-Based Surveillance of Periodontitis. J. Periodontol. 83 (12), 1449-1454 (2012).
- Li, A. et al. Serum Antioxidant Vitamins Mediate the Association between Periodontitis and metabolically unhealthy Overweight/ Obesity. Nutrients 14(22). (2022).
- Palmer, M. K. & Toth, P. P. Trends in lipids, obesity, metabolic syndrome, and diabetes Mellitus in the United States: an NHANES Analysis (2003-2004 to 2013-2014). Obes. (Silver Spring). 27 (2), 309-314 (2019).
- Hu, Q. et al. Association of weight-adjusted-waist index with non-alcoholic fatty liver disease and liver fibrosis: a cross-sectional study based on NHANES. Eur. J. Med. Res. 28 (1), 263 (2023).
- Chen, X. et al. Association between life’s essential 8 and periodontitis: a population-based study. BMC Oral Health. 24 (1), 19 (2024).
- Gunzerath, L., Faden, V., Zakhari, S. & Warren, K. National Institute on Alcohol Abuse and Alcoholism report on moderate drinking. Alcohol Clin. Exp. Res. 28 (6), 829-847 (2004).
- Bull, F. C. et al. World Health Organization 2020 guidelines on physical activity and sedentary behaviour. Br. J. Sports Med. 54 (24), 1451-1462 (2020).
- Sun, J. et al. Association between C-Reactive protein and periodontitis in an obese population from the NHANES 2009-2010. BMC Oral Health. 23 (1), 512 (2023).
- Borrell, L. N. & Crawford, N. D. Disparities in self-reported hypertension in hispanic subgroups, non-hispanic black and nonhispanic white adults: the national health interview survey. Ann. Epidemiol. 18 (10), 803-812 (2008).
- Wang, Q. et al. Association of sleep complaints with all-cause and heart disease mortality among US adults. Front. Public. Health. 11, 1043347 (2023).
- Levis, B., Benedetti, A. & Thombs, B. D. Accuracy of Patient Health Questionnaire-9 (PHQ-9) for screening to detect major depression: individual participant data meta-analysis. Bmj 365, 11476 (2019).
- Ranstam, J. Multiple P-values and Bonferroni correction. Osteoarthr. Cartil. 24 (5), 763-764 (2016).
- Park, Y., Kim, N. H., Kwon, T. Y. & Kim, S. G. A novel adiposity index as an integrated predictor of cardiometabolic disease morbidity and mortality. Sci. Rep. 8 (1), 16753 (2018).
- Qin, Z. et al. The association between weight-adjusted-waist index and increased urinary albumin excretion in adults: a populationbased study. Front. Nutr. 9, 941926 (2022).
- Zhang, D. et al. Association between weight-adjusted-waist index and heart failure: results from National Health and Nutrition Examination Survey 1999-2018. Front. Cardiovasc. Med. 9, 1069146 (2022).
- Yu, S. et al. Weight-adjusted-Waist Index predicts newly diagnosed diabetes in Chinese rural adults. J. Clin. Med. 12(4). (2023).
- Kawai, T., Autieri, M. V. & Scalia, R. Adipose tissue inflammation and metabolic dysfunction in obesity. Am. J. Physiol. Cell. Physiol. 320 (3), C375-c391 (2021).
- Hotamisligil, G. S., Shargill, N. S. & Spiegelman, B. M. Adipose expression of tumor necrosis factor-alpha: direct role in obesitylinked insulin resistance. Science 259 (5091), 87-91 (1993).
- Devlin, M. J. & Rosen, C. J. The bone-fat interface: basic and clinical implications of marrow adiposity. Lancet Diabetes Endocrinol. 3 (2), 141-147 (2015).
- Benova, A. & Tencerova, M. Obesity-Induced Changes in Bone Marrow Homeostasis. Front. Endocrinol. (Lausanne). 11, 294 (2020).
- Krakauer, N. Y. & Krakauer, J. C. Untangling Waist circumference and hip circumference from body Mass Index with a body shape index, hip index, and Anthropometric Risk Indicator. Metab. Syndr. Relat. Disord. 16 (4), 160-165 (2018).
- Mathus-Vliegen, E. M. Obesity and the elderly. J. Clin. Gastroenterol. 46 (7), 533-544 (2012).
- Bosello, O. & Vanzo, A. Obesity paradox and aging. Eat. Weight Disord. 26 (1), 27-35 (2021).
- Xie, R. et al. Association between SII and hepatic steatosis and liver fibrosis: a population-based study. Front. Immunol. 13, 925690 (2022).
- Huang, Z. Association between blood lead level with high blood pressure in US (NHANES 1999-2018). Front. Public. Health. 10, 836357 (2022).
- Ouyang, Y. et al. Saturation effect of body Mass Index on Bone Mineral density in adolescents of different ages: a Population-based study. Front. Endocrinol. (Lausanne). 13, 922903 (2022).
Acknowledgements
We want to thank the NHANES database for making this data available.
Author contributions
XingJin Chen designed the study, contributed to data collection, data merge, data analysis, and drafted the manuscript. ChongWen Zeng, XianRun Chen contributed to data interpretation and the manuscript. FuQian Jin contributed to data merge. JuKun Song, Zhu Chen, JiangLing Sun contributed to review and edit. All authors read and approved the final manuscript.
Funding
Guizhou Provincial Science and Technology Fund (ZK [2024] General 598); Guiyang Science and Technology Fund ([2022] 4)
Declarations
Competing interests
The authors declare no competing interests.
Ethics approval and consent to participate
The Declaration of Helsinki’s guiding principles were followed in the conduct of this investigation. The National Center for Health Statistics Research Ethics Review Board approved the study’s methodology.
Consent for publication
I agree to the publication, including my data, tables, figures and other information.
Additional information
Correspondence and requests for materials should be addressed to Z.C. or J.S.
Reprints and permissions information is available at www.nature.com/reprints.
Publisher’s note Springer Nature remains neutral with regard to jurisdictional claims in published maps and institutional affiliations.
Reprints and permissions information is available at www.nature.com/reprints.
Publisher’s note Springer Nature remains neutral with regard to jurisdictional claims in published maps and institutional affiliations.
Open Access This article is licensed under a Creative Commons Attribution-NonCommercial-NoDerivatives 4.0 International License, which permits any non-commercial use, sharing, distribution and reproduction in any medium or format, as long as you give appropriate credit to the original author(s) and the source, provide a link to the Creative Commons licence, and indicate if you modified the licensed material. You do not have permission under this licence to share adapted material derived from this article or parts of it. The images or other third party material in this article are included in the article’s Creative Commons licence, unless indicated otherwise in a credit line to the material. If material is not included in the article’s Creative Commons licence and your intended use is not permitted by statutory regulation or exceeds the permitted use, you will need to obtain permission directly from the copyright holder. To view a copy of this licence, visit http://creativecommo ns.org/licenses/by-nc-nd/4.0/.
© The Author(s) 2024
© The Author(s) 2024
Guiyang Stomatological Hospital, 253 Jiefang Road, Nanming District, Guiyang, Guizhou, China. School of Stomatology, Zunyi Medical University, Zunyi, China. Department of Oral and Maxillofacial Surgery, The Affiliated Stomatological Hospital of Guizhou Medical University, No. 9, Beijing Road, Yunyan District, Guiyang 550005, Guizhou, China. email: zhuchen@gzu.edu.cn; songjukun@163.com National Health and Nutrition Examination Survey [https://www.cdc.gov/nchs/nhanes/index.htm].
NCHS Ethics Review Board (ERB) Approval* [https://www.cdc.gov/nchs/nhanes/irba98.htm].
Oral Health – Periodontal [https://wwwn.cdc.gov/Nchs/Nhanes/2009-2010/OHXPER_F.htm].