المجلة: Scientific Reports، المجلد: 14، العدد: 1
DOI: https://doi.org/10.1038/s41598-024-56316-7
PMID: https://pubmed.ncbi.nlm.nih.gov/38486063
تاريخ النشر: 2024-03-15
DOI: https://doi.org/10.1038/s41598-024-56316-7
PMID: https://pubmed.ncbi.nlm.nih.gov/38486063
تاريخ النشر: 2024-03-15
علاقة على شكل حرف U مقلوب بين مدة النوم والعمر الظاهري لدى البالغين في الولايات المتحدة: دراسة قائمة على السكان
النوم هو سلوك قابل للتعديل يمكن استهدافه في التدخلات التي تهدف إلى تعزيز الشيخوخة الصحية. تهدف هذه الدراسة إلى (1) تحديد اتجاه مدة النوم لدى البالغين في الولايات المتحدة؛ (2) التحقيق في العلاقة بين مدة النوم والعمر الظاهري؛ و(3) استكشاف دور التمارين الرياضية في هذه العلاقة. تم حساب العمر الظاهري كمؤشر جديد وفقًا للعلامات الحيوية التي تم جمعها من البالغين في الولايات المتحدة بناءً على المسح الوطني للصحة والتغذية (NHANES). تم الإبلاغ عن معلومات النوم من قبل المشاركين وتم تمييزها من خلال المقابلات الفردية. كانت الطريقة التحليلية الرئيسية المستخدمة هي نمذجة الانحدار الخطي المتعدد الموزون، والتي استوعبت تصميم العينة المعقدة متعددة المراحل. تم استكشاف العلاقة غير الخطية المحتملة باستخدام نموذج مكعب مقيد (RCS). علاوة على ذلك، قامت تحليلات المجموعات الفرعية بتقييم التأثيرات المحتملة للعوامل الاجتماعية والديموغرافية ونمط الحياة على النتائج الرئيسية للدراسة. تم تضمين ما مجموعه 13,569 مشاركًا في الدراسة، مما أسفر عن عدد سكاني موزون قدره 78,880,615. أظهر فحص الاتجاهات الزمنية في مدة النوم انخفاضًا في نسبة الأفراد الذين يعانون من نقص كافٍ ووقت نوم ناقص بشكل ملحوظ منذ دورة 2015-2016. اعتبارًا من مجموعة النوم الطبيعي كمرجع، كان المشاركون الذين يعانون من نوم قصير للغاية [
الكلمات الرئيسية: النوم، العمر الظاهري، التمارين، السكان في الولايات المتحدة، دراسة مقطعية
في مجتمع اليوم السريع الوتيرة، هناك اتجاه متزايد بين الناس للحصول على كميات غير كافية من النوم بشكل منتظم.
في مجتمع اليوم السريع الوتيرة، هناك اتجاه متزايد بين الناس للحصول على كميات غير كافية من النوم بشكل منتظم.
بينما قد تختلف الاتجاهات في مدة النوم عبر دول ومناطق مختلفة، هناك قلق متزايد بشأن النتائج الصحية السلبية المرتبطة بمشاكل الصحة النوم المزمنة.
في مجال الطب والصحة، هناك اهتمام متزايد باستخدام “العمر الظاهري” كمتنبئ لمختلف الأمراض وكعلامة حيوية لتقييم الشيخوخة. يشير العمر الظاهري إلى العمر البيولوجي للفرد، والذي يتم تحديده من خلال خصائصه الجسدية ووظائفه بدلاً من عمره الزمني.
في الوقت نفسه، تأثير النوم على الشيخوخة هو موضوع ناشئ
استنادًا إلى الأدبيات المذكورة أعلاه، فإن المشاكل الصحية المتزايدة المرتبطة بنقص النوم تتطلب زيادة الانتباه العام والموارد الصحية. بالإضافة إلى ذلك، لا يُعرف الكثير عن العلاقة المحددة بين مدة النوم والعمر الظاهري. لذلك، هناك حاجة ملحة لأدلة قوية لإيقاظ الوعي العام حول الآثار الضارة لمدة النوم وتأثيرها على المؤشرات الحيوية المرتبطة بالشيخوخة. يوضح الشكل 1 الهدف وتصميم الدراسة. من خلال استخدام عينة وطنية من سكان الولايات المتحدة، تهدف هذه الدراسة إلى (1) التحقيق في الاتجاهات في أنماط النوم لدى البالغين في الولايات المتحدة من المسح الوطني لفحص الصحة والتغذية (NHANES)؛ (2) تقييم العلاقة بين النوم والعمر الظاهري القائم على المؤشرات الحيوية المتعددة؛ (3) إجراء تحليل فرعي، واستكشاف ما إذا كانت سلوكيات نمط الحياة مثل المشاركة في التمارين قد تؤثر على هذه العلاقة.
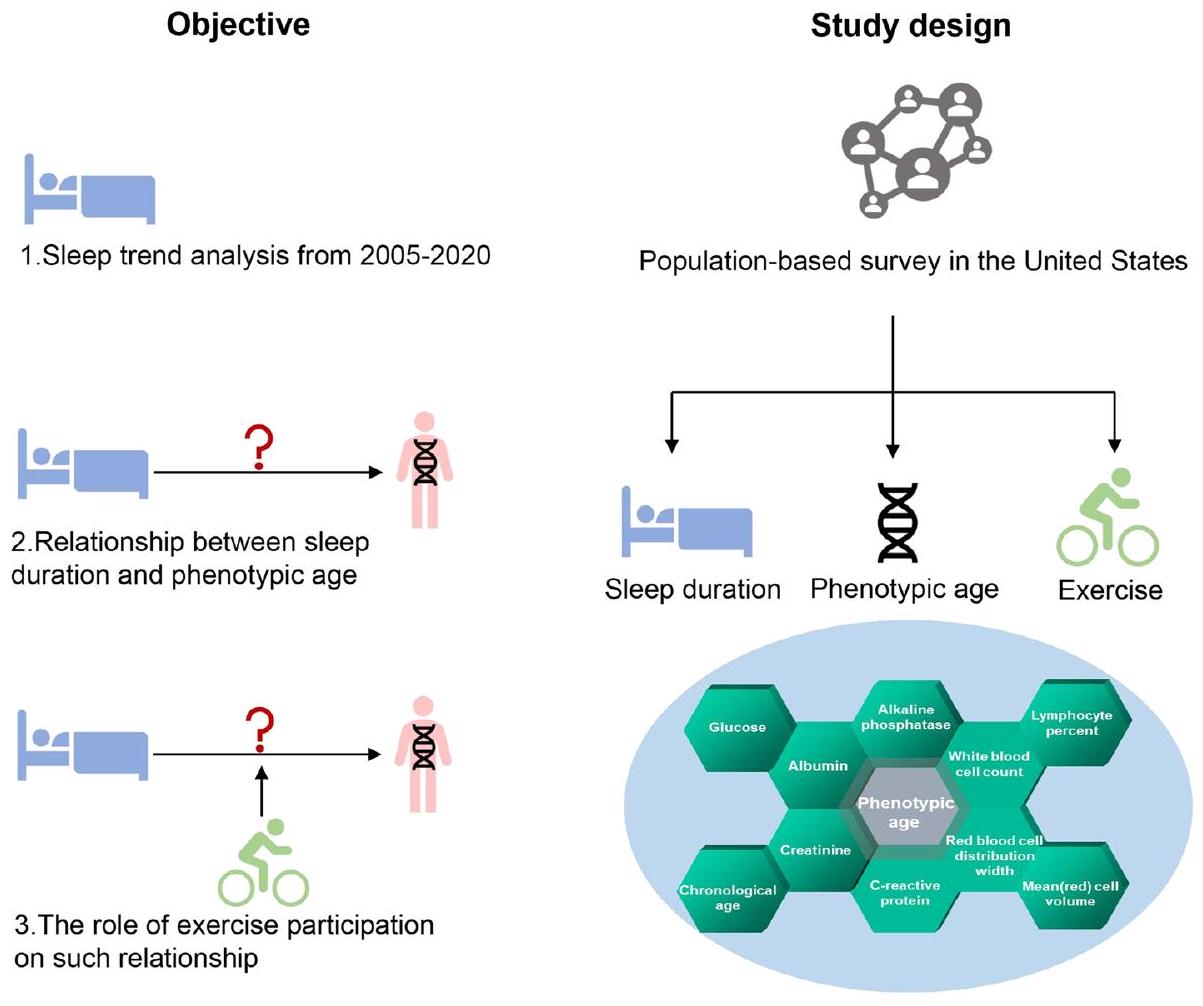
الشكل 1. الهدف وتصميم هذه الدراسة.
النتائج
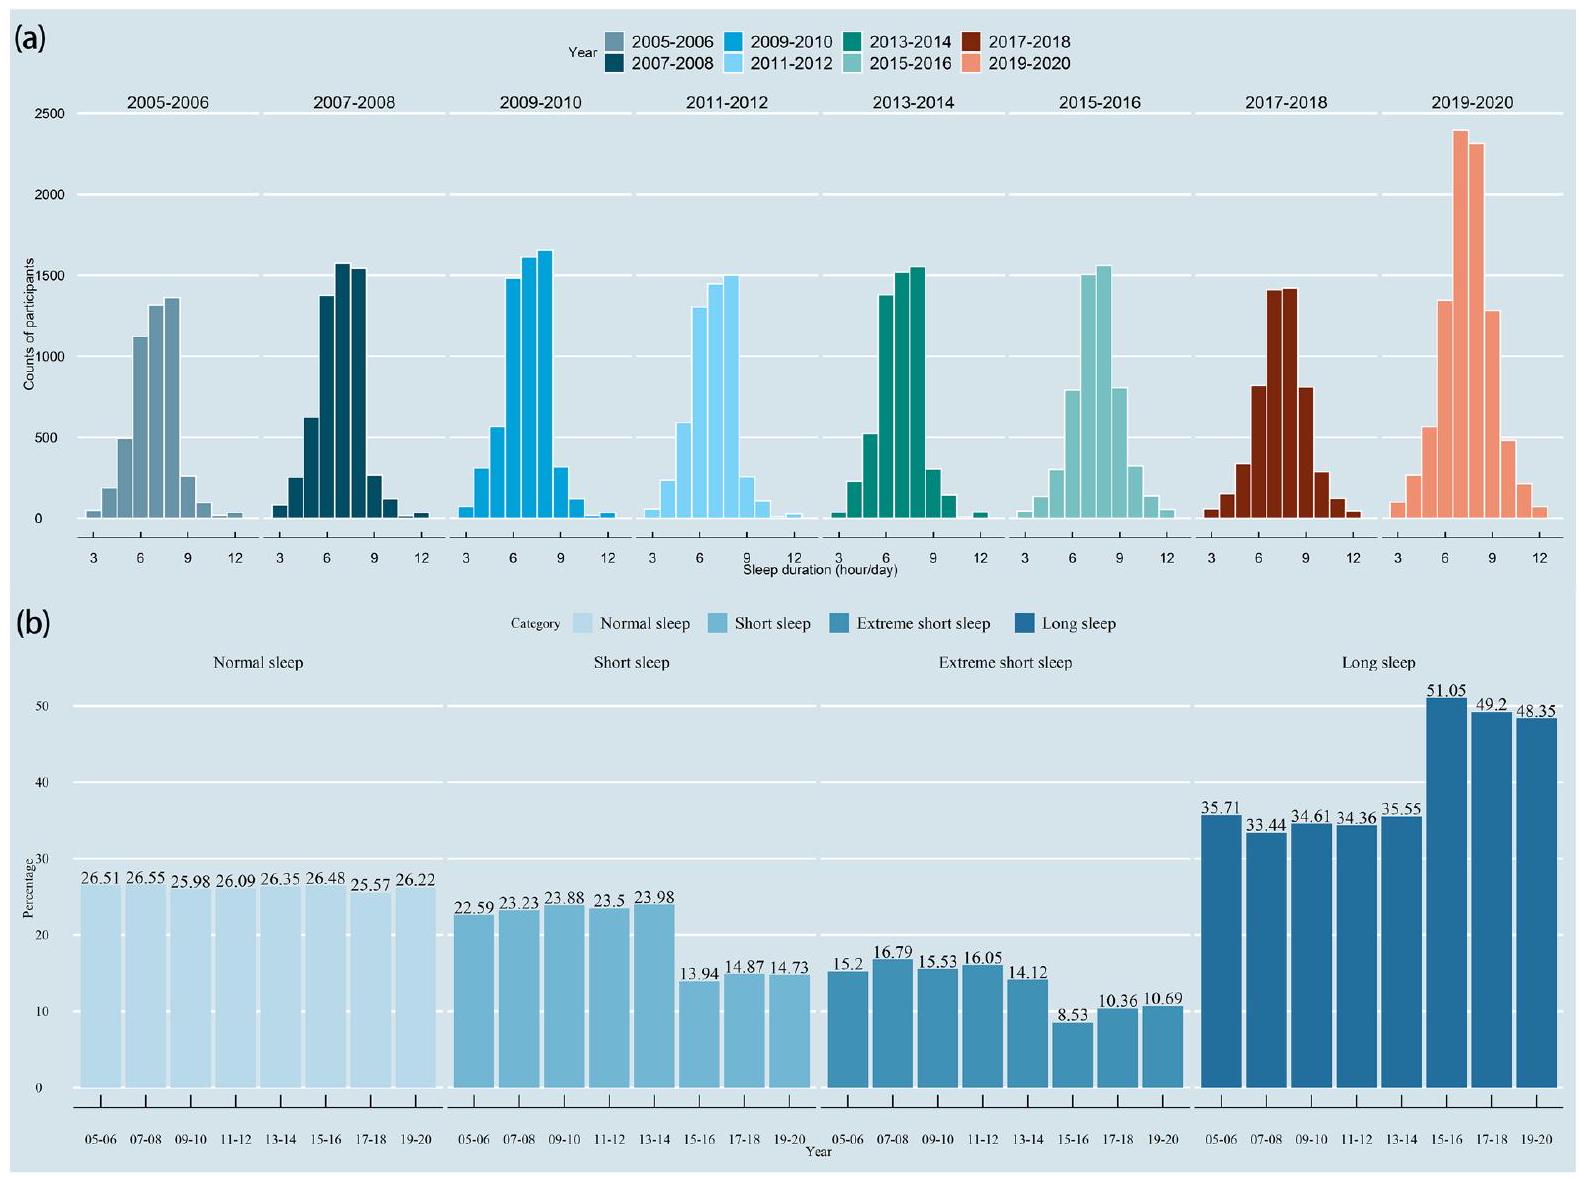
تم تضمين ما مجموعه 48,762 مشاركًا من NHANES 2005-2020 في التحليل الحالي للكشف عن اتجاه النوم. من الشكل 2، يمكن ملاحظة أن معظم الناس ينامون لمدة
في النموذج الخام والنموذج 1، وُجد أن مدة النوم ليست مرتبطة بشكل كبير بالعمر الظاهري عند تقييمها كمتغير مستمر، وفقًا للجدول 2 [النموذج الخام،
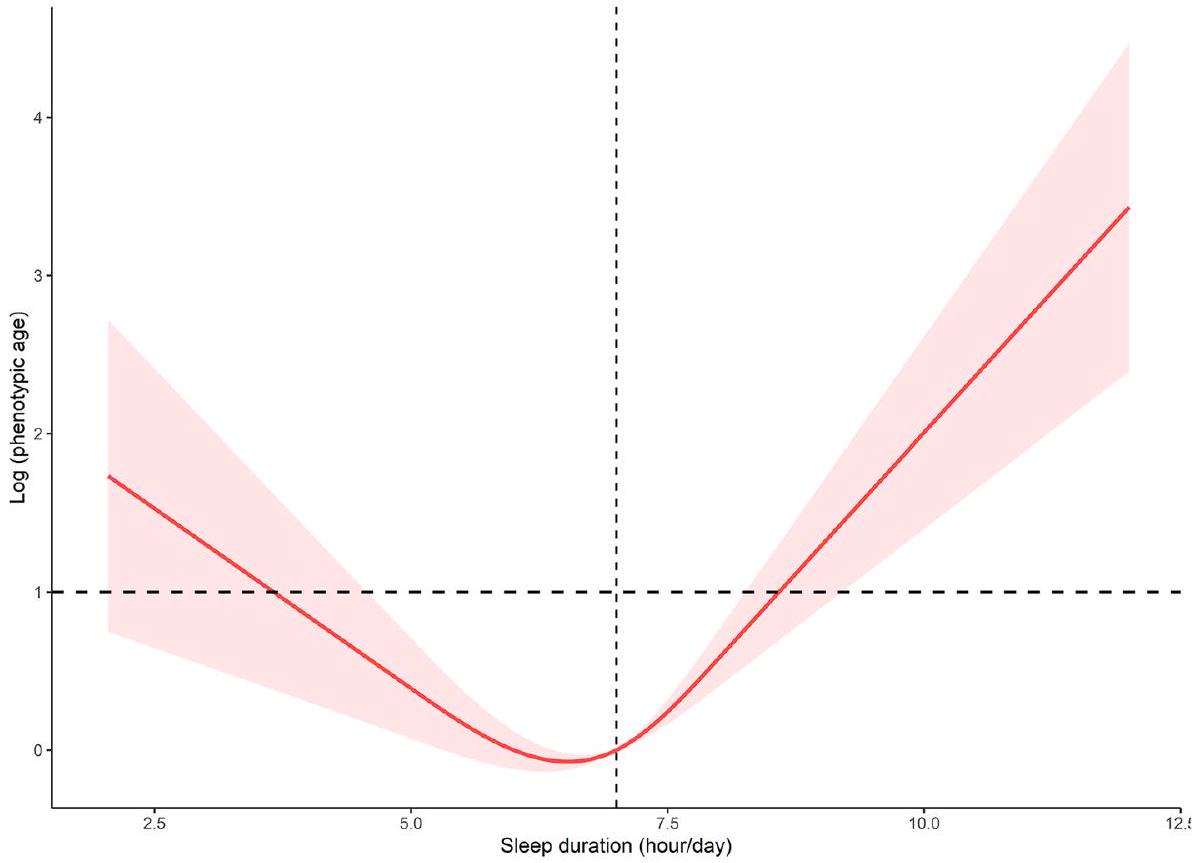
قمنا بحساب نقطة الانعطاف في العلاقة بين مدة النوم والعمر الظاهري القائم على اللوغاريتم لتكون 7 ساعات باستخدام نموذج الانحدار الخطي ذو الجزئين (الجدول 3). على الجانب الأيسر من نقطة الانعطاف،
الشكل 2. (أ) هيستوغرام لتوزيعات مدة النوم في دورات السنوات المختلفة من NHANES؛ (ب) هيستوغرام لتوزيعات دورات السنوات بين فئات النوم المختلفة.
| متغير | (%/المتوسط)* | نوم طبيعي | نوم قصير | نوم قصير للغاية | نوم طويل |
|
| العمر الزمني (بالسنوات) | <0.001 | |||||
| < 40 | ٣٦.٥١ | ٣٦.٣٤ | ٣٦.٥٢ | ٣٦.٢ | ٣٦.٧٨ | |
|
|
٤٠.٠١ | 42.54 | 42.75 | ٤٣.٨١ | ٣٤.١٩ | |
|
|
٢٣.٤٩ | 21.12 | ٢٠.٧٣ | 19.99 | ٢٩.٠٣ | |
| جنس | <0.001 | |||||
| ذكر | ٤٨.٨٨ | 50.35 | 52.44 | ٤٩.٢٤ | 44.88 | |
| أنثى | 51.12 | ٤٩.٦٥ | ٤٧.٥٦ | 50.76 | ٥٥.١٢ | |
| العرق/الاثنية | <0.001 | |||||
| الأبيض غير اللاتيني | 71.64 | ٧٦.٨٨ | 68.3 | ٥٩.٩ | 73.97 | |
| أسود غير هيسباني | 10.43 | 6.44 | 12.52 | ٢٠.٦٥ | 8.44 | |
| مكسيكي أمريكي | 7.91 | 7.34 | 7.98 | 6.93 | ٨.٨ | |
| عرق/إثنية أخرى | 10.02 | 9.34 | 11.2 | 12.52 | 8.79 | |
| الحالة الاجتماعية | <0.001 | |||||
| لم يتزوج أبداً | 16.29 | 14.3 | 16.33 | ١٦.٥٤ | ١٨ | |
| متزوج/يعيش مع شريك | ٦٥.٠٥ | 70.15 | 64.59 | ٥٩.٤ | 62.99 | |
| أرمل/مطلق | 18.66 | 15.54 | 19.07 | ٢٤.٠٦ | 19.02 | |
| نسبة دخل الفقر | <0.001 | |||||
| <1 | 12.89 | 9.36 | 12.55 | 19.38 | 13.7 | |
|
|
٣٥.٦٢ | ٣٢.٣٣ | ٣٥.٨٦ | ٤١.١٧ | ٣٦.٢١ | |
|
|
٥١.٤٩ | ٥٨.٣١ | ٥١.٥٩ | ٣٩.٤٥ | 50.09 | |
| التعليم | <0.001 | |||||
| دون المرحلة الثانوية | 6.14 | ٤.٥٧ | 5.25 | ٧.٤٦ | 7.67 | |
| المدرسة الثانوية | ٣٦.٣٤ | ٣٢.٠٣ | ٣٨.٠٦ | ٤٤.٤٤ | ٣٥.٧٨ | |
| الكلية أو أعلى | ٥٧.٥٢ | 63.41 | ٥٦.٧ | ٤٨.١ | ٥٦.٥٦ | |
| مؤشر كتلة الجسم (
|
<0.001 | |||||
| <25 | 31.8 | ٣٢.٨٨ | ٢٨.٩٧ | ٢٦.٩ | ٣٤.٨ | |
|
|
٣٣.٥ | ٣٤.٠٦ | ٣٣.٧٣ | ٣٢.١٦ | ٣٣.٣٧ | |
|
|
٣٤.٧ | ٣٣.٠٥ | ٣٧.٣ | ٤٠.٩٤ | 31.83 | |
| المدخنون | <0.001 | |||||
| مدخن سابق | ٥٢.٧٢ | ٥٥.٦٧ | ٥١.٦٤ | ٤٥.٢٨ | 53.82 | |
| مدخن سابق | ٢٤.٨٦ | ٢٦.٠٦ | ٢٣.٧ | 21.92 | ٢٥.٧٨ | |
| مدخن حالي | ٢٢.٤٢ | 18.27 | ٢٤.٦٦ | ٣٢.٨ | ٢٠.٤١ | |
| شاربي الكحول | <0.001 | |||||
| غير شارب | ٣٢.٠٧ | ٢٨.٧٨ | 31.23 | ٣٩.٥٧ | ٣٢.٦ | |
| استخدام الكحول المعتدل | ٤٧.٧ | 51.84 | ٤٧.٥ | ٣٩.٠٦ | ٤٧.٥٧ | |
| استخدام الكحول بكميات كبيرة | ٢٠.٢٣ | 19.38 | ٢١.٢٧ | 21.37 | 19.83 | |
| نشاط التمارين (دقيقة/أسبوع) | <0.001 | |||||
| لا شيء | ٦٤.٨٥ | 61.02 | ٦٤.٨٨ | 70.35 | 66.1 | |
|
|
11.02 | 12.61 | 11.05 | 8.9 | 10.41 | |
|
|
٢٤.١٣ | ٢٦.٣٧ | ٢٤.٠٧ | ٢٠.٧٥ | ٢٣.٤٩ | |
| ارتفاع ضغط الدم | <0.001 | |||||
| لا | 63.9 | 67.58 | 63.11 | ٥٧.٨٦ | 63.55 | |
| نعم | ٣٦.١ | ٣٢.٤٢ | ٣٦.٨٩ | 42.14 | ٣٦.٤٥ | |
| داء السكري | <0.001 | |||||
| لا | ٨٧.٣٥ | ٨٩.٧٨ | ٨٦.٧٣ | ٨٣.٣٢ | ٨٧.٢١ | |
| نعم | 12.65 | 10.22 | ١٣.٢٧ | 16.68 | 12.79 | |
| أمراض القلب والأوعية الدموية | <0.001 | |||||
| لا | 91.56 | 94.26 | 92.22 | ٨٧.٥٩ | 90.25 | |
| نعم | 8.44 | ٥.٧٤ | 7.78 | 12.41 | 9.75 | |
| العمر الظاهري (سنة) |
|
|
|
|
|
<0.001 |
| عرض توزيع كريات الدم الحمراء (%) |
|
|
|
|
|
<0.001 |
| حجم الخلايا الحمراء المتوسط (فيمول) |
|
|
|
|
|
0.003 |
| نسبة اللمفاويات (%) |
|
|
|
|
|
0.035 |
| عدد كريات الدم البيضاء (1000 خلية/ميكرولتر) |
|
|
|
|
|
<0.001 |
| الفوسفاتاز القلوي (وحدة/لتر) |
|
|
|
|
|
<0.001 |
| بروتين سي التفاعلي (ملغ/دل) |
|
|
|
|
|
<0.001 |
| مستمر | ||||||
| متغير | (%/متوسط)* | نوم طبيعي | نوم قصير | نوم قصير للغاية | نوم طويل |
|
| الألبومين (غ/ل) |
|
|
|
|
|
<0.001 |
| الجلوكوز (ملليمول/لتر) |
|
|
|
|
|
0.087 |
| الكرياتينين (ميكرومول/لتر) |
|
|
|
|
|
0.624 |
الجدول 1. الخصائص الديموغرافية للمشاركين النهائيين.
| نموذج بدائي
|
نموذج
|
نموذج
|
||||
|
|
|
|
|
|
|
|
| مدة النوم (ساعات/يوم) | 0.329 (-0.012, 0.669) | 0.058 | -0.155 (-0.317, 0.006) | 0.059 | 0.153 (0.015, 0.291) | 0.031 |
| مدة النوم (كفئة) | ||||||
| نوم طبيعي | مرجع | مرجع | مرجع | |||
| نوم قصير | 0.867 (0.000, 1.733) | 0.050 | 0.837 (0.358, 1.316) | <0.001 | 0.142 (-0.367, 0.650) | 0.570 |
| نوم قصير للغاية | 2.434 (1.240, 3.628) | <0.001 | 2.356 (1.843, 2.869) | <0.001 | 0.582 (0.018, 1.146) | 0.044 |
| نوم طويل | 2.696 (1.720, 3.672) | <0.001 | 1.000 (0.479, 1.521) | <0.001 | 0.694 (0.186, 1.203) | 0.010 |
الجدول 2. نتائج الانحدار الخطي الموزون للعلاقة بين مدة النوم والعمر الظاهري.
|
|
|
|
| نموذج الانحدار الخطي ذو الخط الواحد | -0.001 (-0.003, 0.003) | 0.934 |
| نموذج الانحدار الخطي ذو الجزئين | ||
| مدة النوم < 7 (ساعات/يوم) | -0.010 (-0.014, -0.005) | <0.001 |
| مدة النوم
|
0.013 (0.007, 0.018) | <0.001 |
| اختبار نسبة لوغاريتم الاحتمالية | <0.001 | |
الجدول 3. تحليل تأثير العتبة للعلاقة بين مدة النوم والعمر الظاهري المسجل. تم تعديل العمر، الجنس، العرق، الحالة الاجتماعية، التعليم، حالة الفقر، مؤشر كتلة الجسم، المدخنين، شاربين الكحول، النشاط البدني، ارتفاع ضغط الدم، داء السكري، وأمراض القلب والأوعية الدموية.
سعت الدراسة الحالية إلى التحقيق في العلاقة بين مدة النوم والعمر الظاهري من خلال فحص التأثير المحتمل للعوامل الديموغرافية ونمط الحياة والعوامل الصحية. يمكن العثور على تحليلات مفصلة مصنفة في الجدول التكميلي 1. من بين هذه العوامل المؤثرة، كان مستوى التمارين متغيرًا ملحوظًا ينظم أيضًا بشكل كبير العلاقة المذكورة أعلاه. كشفت تحليل المجموعات الفرعية عن العلاقة بين مدة النوم والعمر الظاهري تحت مستويات مختلفة من مجموعات التمارين (الشكل 4أ). أشارت نتائجنا إلى أنه في مجموعة عادات عدم ممارسة التمارين، كانت فترات النوم القصيرة جدًا والطويلة مرتبطة إيجابيًا بالعمر الظاهري [النوم القصير،
المناقشات
استنادًا إلى بيانات NHANES، قمنا بالتحقيق في اتجاه مدة النوم والعلاقة بين مدة النوم والعمر الظاهري، مع فحص التأثيرات المحتملة للعوامل المربكة على هذه العلاقات. بالإضافة إلى تحديد العلاقة، يمكن أن توفر تحليلات الجرعة والاستجابة وتحليل المجموعات توصيات عملية لتعزيز عادات النوم الصحية وإبطاء عملية الشيخوخة. علاوة على ذلك، تسلط النتائج الضوء على العوامل الصحية المحتملة مثل المشاركة في التمارين الرياضية التي قد تؤثر على العلاقة بين مدة النوم والعمر الظاهري، ولها تداعيات مهمة على الممارسة السريرية وسياسات الصحة العامة.
الشكل 3. العلاقة بين الجرعة والاستجابة بين مدة النوم والعمر الظاهري المستند إلى اللوغاريتم.
الشكل 4. تحليل المجموعات الفرعية (أ) وعلاقة الجرعة بالاستجابة (ب) بين مدة النوم والعمر الظاهري تحت مستويات مختلفة من مجموعات التمارين
في الدراسة الحالية، لوحظ أن فئة الأشخاص الذين ينامون لفترات قصيرة جداً أظهرت اتجاهًا تنازليًا. قد تعكس هذه الديناميكية التغيرات في المواقف الثقافية تجاه نظافة النوم، والأولويات المجتمعية الأوسع، بالإضافة إلى التحولات الديموغرافية. توفر هذه النتائج رؤى قيمة حول المشهد المتغير لأنماط النوم والنتائج الصحية المرتبطة بها، مما يساعد في توجيه الممارسات السريرية وسياسات الصحة العامة. علاوة على ذلك، أشارت نتائجنا إلى أن النوم القصير مرتبط بتسارع العمر الظاهري. أظهرت الأبحاث أن الحصول على قسط كافٍ من النوم أمر حاسم للصحة العامة والرفاهية.
عندما يتعلق الأمر بالآليات البيولوجية حول العلاقة بين مدة النوم وعلامات الشيخوخة. يجب التأكيد على أن المنظمات الهرمونية الحرجة المتورطة في إطار توازن النوم، مثل تركيزات السيروم من التستوستيرون، قد تأثرت بمدة النوم غير الكافية والاضطراب في إيقاعات الساعة البيولوجية
إن الطبيعة متعددة العوامل للعمر الظاهري تخلق تفاعلًا معقدًا لعوامل نمط الحياة المؤثرة. تمثل النشاط البدني تدخلًا في نمط الحياة قادرًا على إحداث تأثيرات صحية على مسار الشيخوخة ومنح طول العمر لممارسيه المتحمسين
تتمتع دراستنا بعدة نقاط قوة. يجب الاعتراف بأهمية الدراسات واسعة النطاق حول النوم
على الرغم من هذه النقاط القوية، فإن دراستنا لها أيضًا بعض القيود. أولاً، استخدمنا بيانات مقطعية، مما حد من قدرتنا على إثبات السببية بين مدة النوم والعمر الظاهري. لم يكن التصميم المقطعي للدراسة قادرًا على ملاحظة التغيرات الفسيولوجية الديناميكية في العمر الظاهري. ثانيًا، كانت هناك أيضًا عوامل مؤثرة أخرى مثل العرق والجنس والعمر ومؤشر كتلة الجسم، التي قد تعدل العلاقات الملاحظة بين مدة النوم والتمارين والعمر الظاهري، والتي يمكن استكشافها بشكل أكبر. ثالثًا، اعتمدت دراستنا على مقاييس ذاتية لمدة النوم (لا يمكن قياس الوقت في السرير ومدة النوم الكلية في نفس الوقت)، والتي قد تكون عرضة لتحيز الذاكرة. علاوة على ذلك، تعاني معظم الدراسات الوبائية التي تعتمد على مدة النوم المبلغ عنها ذاتيًا (بدون تسجيلات EEG طوال الليل) من قيود أخرى، وهي أنها لا يمكن أن تحدد ما إذا كانت تجزئة النوم، مع أو بدون تغييرات في مدة النوم، يمكن أن تؤثر أيضًا على مدة الحياة. رابعًا، هناك غياب لمعلومات مفصلة حول استخدام أدوية النوم في مجموعة بيانات NHANES. وبالتالي، لم تشمل تحليلاتنا تقييم التأثير المحتمل لأدوية النوم على العلاقة بين مدة النوم والعمر الظاهري. أخيرًا، لم نستكشف دور جودة النوم وتغيرات النوم، والتي قد تكون عاملًا مهمًا في العلاقة بين مدة النوم والعمر الظاهري. يجب أن تأخذ الدراسات المستقبلية في الاعتبار استخدام مقاييس موضوعية للنوم، مثل قياس النشاط أو تخطيط النوم.
الاستنتاجات
بشكل عام، تشير نتائج دراستنا إلى أنه في الولايات المتحدة، أظهرت الفئة السكانية التي تعاني من مدة نوم قصيرة جدًا اتجاهًا متناقصًا في السنوات الأخيرة. علاوة على ذلك، كانت هناك علاقة على شكل حرف U مقلوب بين مدة النوم والعمر الظاهري. كانت هذه الدراسة مهمة لأنها ساهمت في مجموعة الأبحاث المتزايدة التي أكدت على أهمية النوم فيما يتعلق بالشيخوخة البيولوجية. بالإضافة إلى ذلك، في الأفراد الذين لديهم مدة نوم ممتدة، يرتبط الانخراط المستمر في التمارين المنتظمة بالفوائد، بينما أولئك الذين لديهم مدة نوم أقصر وزيادة في التمارين يظهرون ميلًا نحو ارتفاع العمر الظاهري. هذه النتائج لها تداعيات مهمة على الصحة العامة، مما يبرز الحاجة إلى تدخلات تهدف إلى تعزيز عادات النوم الصحية لتعزيز الشيخوخة الصحية. هناك حاجة إلى مزيد من الأبحاث لإثبات السببية واستكشاف دور جودة النوم في هذه العلاقة.
طرق
السكان المدروسون
المشاركون في الدراسة هم من NHANES، وهو مسح شامل قائم على السكان يهدف إلى جمع البيانات من السكان المدنيين في الولايات المتحدة. كجزء من NHANES، تم استقصاء حوالي 10,000 شخص على دورة مدتها عامين وتم استخدام نهج عينة احتمالية متعددة المراحل لاختيار عينة تمثل الأسر غير المؤسسية.
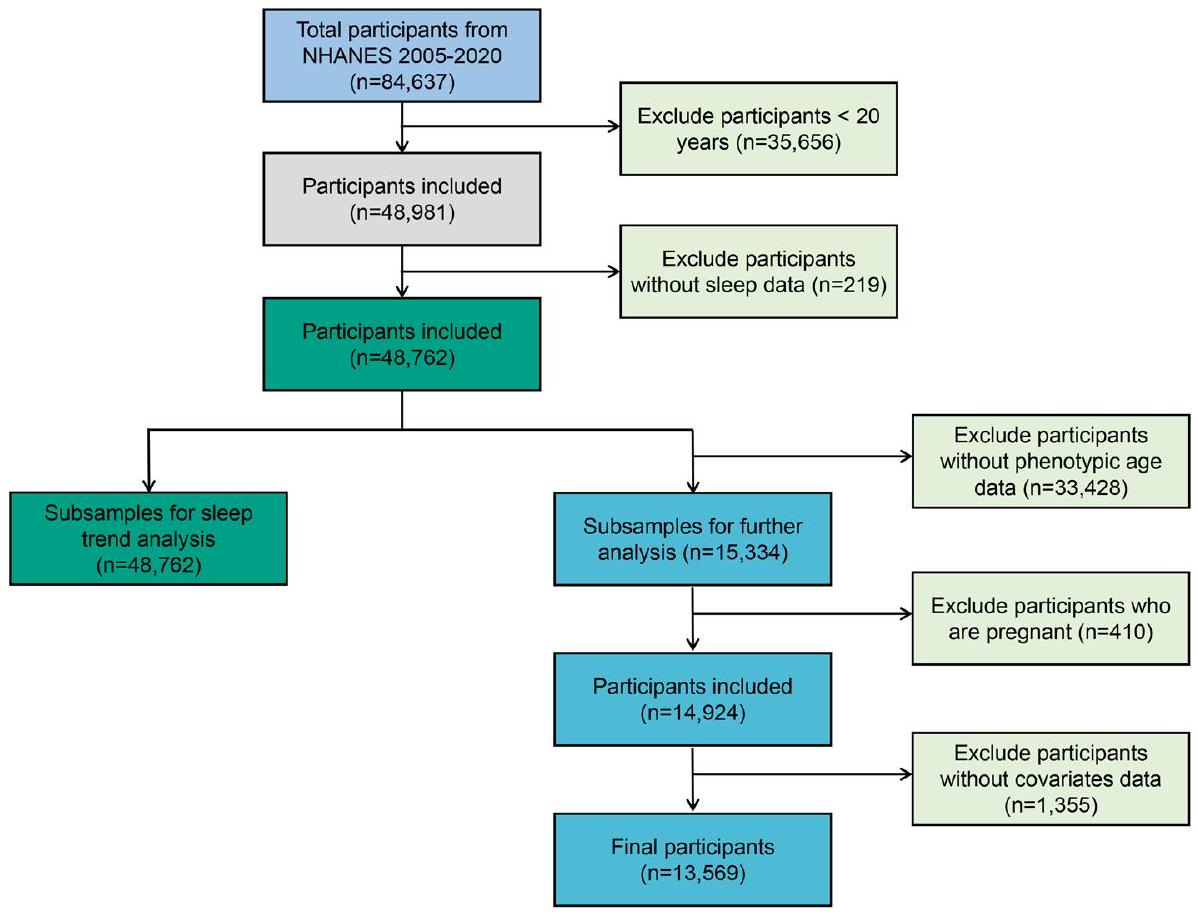
في الدراسة الحالية، لتحليل اتجاه النوم، قمنا بتحليل المشاركين من ثمانية دورات من “NHANES المستمر” (2005-2020) وشملنا 48,762 مشاركًا في التحليل. بالنظر إلى أن البيانات الخاصة بالعمر الظاهري
كان العمر متاحًا فقط في NHANES 2001-2010، وتم استخدام 13,569 مشاركًا للدراسة بين مدة النوم والعمر الظاهري. تم استبعاد المشاركين الذين ليس لديهم بيانات نوم، أو عمر ظاهري، أو متغيرات مصاحبة، وأولئك الذين كانوا حوامل من التحليل. يظهر مخطط تدفق يوضح عملية الإدراج والاستبعاد في الشكل 5.
كان العمر متاحًا فقط في NHANES 2001-2010، وتم استخدام 13,569 مشاركًا للدراسة بين مدة النوم والعمر الظاهري. تم استبعاد المشاركين الذين ليس لديهم بيانات نوم، أو عمر ظاهري، أو متغيرات مصاحبة، وأولئك الذين كانوا حوامل من التحليل. يظهر مخطط تدفق يوضح عملية الإدراج والاستبعاد في الشكل 5.
قياس متغيرات التعرض والنتيجة
كان متغير التعرض في هذه الدراسة هو مدة النوم. جمعت NHANES بيانات مدة النوم المبلغ عنها ذاتيًا من خلال استبيانها القياسي، الذي يتم إدارته للمشاركين خلال المقابلات الشخصية.
كان متغير النتيجة هو العمر الظاهري. من الواضح أن استخدام عمر ظاهري مصمم حديثًا، بدلاً من الاعتماد على العمر الزمني المستقل، يؤدي إلى نتائج تنبؤية أفضل تتعلق بالصحة. لتكون دقيقًا، بالإشارة إلى تعريف العمر الظاهري المقترح من قبل مورغان إي. ليفين وآخرين.
تقييم المتغيرات المصاحبة
كانت المتغيرات التي اعتبرت عوامل مشوشة هي مجموعات العمر
الشكل 5. مخطط تدفق تصميم الدراسة ومعايير إدراج المشاركين.
أو أقل من المشروبات في الأسبوع للرجال، أو 7 أو أقل من المشروبات في الأسبوع للنساء، مع عدم تجاوز 5 مشروبات في أي يوم واحد في العام الماضي. من ناحية أخرى، كان المشاركون في استخدام الكحول العالي هم أولئك الذين استهلكوا أكثر من 14 مشروبًا في الأسبوع للرجال، أو أكثر من 7 مشروبات في الأسبوع للنساء، بما في ذلك تناول 5 مشروبات أو أكثر في يوم واحد على الأقل في العام الماضي لكل من الرجال والنساء.
التحليلات الإحصائية
تم دمج جميع البيانات وفقًا لبروتوكول NHANES، وتم تطبيق تحليل البيانات باستخدام منهجية الوزن وفقًا للاقتراحات التحليلية الموزونة من مسح NHANES. تم إعادة وزن الأوزان من مقابلات مركز الفحص المتنقل (MEC) لأخذ غير المستجيبين، وعدم التغطية، واحتمالية الاختيار غير المتساوية في NHANES في الاعتبار. بالنسبة لخصائص المشاركين الأساسية، من أجل توضيح النتائج، تم التعبير عن المتغيرات المستمرة كمتوسطات وخطأ معياري (SE)، بينما تم التعبير عن المتغيرات الفئوية كنسب مئوية (%). باستخدام نموذج الانحدار الخطي الموزون، بحثنا في العلاقة بين مدة النوم والعمر الظاهري، مع الأخذ في الاعتبار عدة متغيرات مشوشة عبر ثلاثة نماذج متميزة. لم يسمح النموذج الخام بأي تعديل للمتغيرات المصاحبة، بينما قام النموذج 1 بتعديل العمر والجنس والعرق. بالمقابل، دمج النموذج 2 متغيرات إضافية بما في ذلك الحالة الاجتماعية، التعليم، حالة الفقر، مؤشر كتلة الجسم، نشاط التمارين، المدخنين، شاربين الكحول، ارتفاع ضغط الدم، داء السكري، وأمراض القلب والأوعية الدموية للحصول على تقدير أكثر دقة لقوة واتجاه العلاقة قيد الدراسة.
علاوة على ذلك، تم فحص العلاقة بين الجرعة والاستجابة باستخدام تحليل تأثير العتبة. في البداية، يتم استخدام تقنية ملاءمة المنحنى السلس كتحليل أولي لتحديد ما إذا كان المتغير المستقل قد تم تقسيمه إلى فترات منفصلة. ثم، يتم استخدام الانحدار المجزأ، المعروف أيضًا باسم الانحدار القطعي، حيث يتم استخدام مقاطع خطية منفصلة لتناسب كل فترة. يتم استخدام اختبار نسبة الاحتمالات اللوجاريتمي لمقارنة النموذج الخطي الواحد (غير المجزأ) مع نموذج الانحدار المجزأ لتحديد ما إذا كان هناك عتبة موجودة. بعد ذلك، يتم تحديد نقطة الانعطاف التي تربط المقاطع والتي تعظم الاحتمالية بناءً على النموذج باستخدام طريقة تكرارية من خطوتين. يمكن العثور على مزيد من التفاصيل حول حساب نقطة الانعطاف في مكان آخر.
موافقة الأخلاقيات
المؤلفون مسؤولون عن جميع جوانب العمل لضمان أن الأسئلة المتعلقة بدقة أو نزاهة أي جزء من العمل يتم التحقيق فيها وحلها بشكل مناسب. تم إجراء الدراسة وفقًا لإعلان هلسنكي. جميع المعلومات من برنامج NHANES متاحة ومجانية للجمهور، لذا لم تكن موافقة لجنة الأخلاقيات الطبية ضرورية.
موافقة المشاركة
تم الحصول على موافقة مستنيرة من جميع المشاركين الأفراد الذين تم تضمينهم في الدراسة.
توفر البيانات
البيانات التي تدعم نتائج هذه الدراسة متاحة علنًا فيhttps://www.cdc.gov/nchs/nhanes/. المعلومات من NHANES متاحة من خلال سلسلة واسعة من المنشورات والمقالات في المجلات العلمية والتقنية. تم تضمين المساهمات الأصلية المقدمة في الدراسة في المقالة، ويمكن توجيه الاستفسارات الإضافية إلى المؤلف المراسل.
تاريخ الاستلام: 12 يونيو 2023؛ تاريخ القبول: 5 مارس 2024
تم النشر عبر الإنترنت: 15 مارس 2024
تم النشر عبر الإنترنت: 15 مارس 2024
References
- Liu, Y. et al. Prevalence of healthy sleep duration among adults-United States, 2014. MMWR Morb. Mortal. Wkly. Rep. 65(6), 137-144. https://doi.org/10.15585/mmwr.mm6506a1 (2016).
- Owens, J. A. & Weiss, M. R. Insufficient sleep in adolescents: Causes and consequences. Miner. Pediatr 69(4), 326-336. https://doi. org/10.23736/S0026-4946.17.04914-3 (2017).
- Willoughby, A. R., Alikhani, I., Karsikas, M., Chua, X. Y. & Chee, M. W. L. Country differences in nocturnal sleep variability: Observations from a large-scale, long-term sleep wearable study. Sleep Med. 110, 155-165. https://doi.org/10.1016/j.sleep.2023. 08.010 (2023).
- Consensus Conference, P. et al. Joint consensus statement of the american academy of sleep medicine and sleep research society on the recommended amount of sleep for a healthy adult: Methodology and discussion. Sleep 38(8), 1161-1183. https://doi.org/ 10.5665/sleep. 4886 (2015).
- Hirshkowitz, M. et al. National sleep foundation’s sleep time duration recommendations: Methodology and results summary. Sleep Health 1(1), 40-43. https://doi.org/10.1016/j.sleh.2014.12.010 (2015).
- Centers for Disease C, Prevention. Perceived insufficient rest or sleep among adults: United States, 2008. MMWR Morb. Mortal. Wkly Rep. 58(42), 1175-1179 (2009).
- (CDC). CfDCaP. National Health and Nutrition Examination Survey. Hyattsville, Md: Us Department of Health and Human Services, Cdc, National Center for Health Statistics; 2007-2010. http://www.cdc.gov/nchs/nhanes.htm.
- You, Y. et al. The association between sedentary behavior, exercise, and sleep disturbance: A mediation analysis of inflammatory biomarkers. Front. Immunol. 13, 1080782. https://doi.org/10.3389/fimmu.2022.1080782 (2022).
- Gallicchio, L. & Kalesan, B. Sleep duration and mortality: A systematic review and meta-analysis. J. Sleep Res. 18(2), 148-158. https://doi.org/10.1111/j.1365-2869.2008.00732.x (2009).
- Broussard, J. L. & Klein, S. Insufficient sleep and obesity: Cause or consequence. Obesity (Silver Spring) 30(10), 1914-1916. https:// doi.org/10.1002/oby. 23539 (2022).
- Depner, C. M., Stothard, E. R. & Wright, K. P. Jr. Metabolic consequences of sleep and circadian disorders. Curr. Diab. Rep. 14(7), 507. https://doi.org/10.1007/s11892-014-0507-z (2014).
- You, Y. et al. Cognitive performance in short sleep young adults with different physical activity levels: A cross-sectional Fnirs study. Brain Sci. https://doi.org/10.3390/brainsci13020171 (2023).
- Dong, L., Xie, Y. & Zou, X. Association between sleep duration and depression in Us adults: A cross-sectional study. J. Affect Disord. 296, 183-188. https://doi.org/10.1016/j.jad.2021.09.075 (2022).
- (CDC). CfDCaP. Sleep duration as a correlate of smoking, alcohol use, leisure-time physical inactivity, and obesity among adults: United States, Available at 2004-2006.
- Liu, Y., Wheaton, A. G., Chapman, D. P. & Croft, J. B. Sleep duration and chronic diseases among U.S. adults age 45 years and older: Evidence from the 2010 Behavioral risk factor surveillance system. Sleep 36(10), 1421-1427. https://doi.org/10.5665/sleep. 3028 (2013).
- Levine, M. E. Modeling the rate of senescence: Can estimated biological age predict mortality more accurately than chronological age?. J. Gerontol. A Biol. Sci. Med. Sci. 68(6), 667-674. https://doi.org/10.1093/gerona/gls233 (2013).
- Levine, M. E. et al. An epigenetic biomarker of aging for lifespan and healthspan. Aging (Albany NY) 10(4), 573-591. https://doi. org/10.18632/aging. 101414 (2018).
- Lind, L., Ingelsson, E., Sundstrom, J., Siegbahn, A. & Lampa, E. Methylation-based estimated biological age and cardiovascular disease. Eur. J. Clin. Invest. https://doi.org/10.1111/eci.12872 (2018).
- Cortez, B. N., Bahour, N. & Aguayo-Mazzucato, C. Biological age in diabetes and precision medicine. Aging (Albany NY) 14(11), 4622-4623. https://doi.org/10.18632/aging. 204123 (2022).
- Knobel, P., Litke, R. & Mobbs, C. V. Biological age and environmental risk factors for dementia and stroke: Molecular mechanisms. Front. Aging Neurosci. 14, 1042488. https://doi.org/10.3389/fnagi.2022.1042488 (2022).
- Jylhava, J., Pedersen, N. L. & Hagg, S. Biological age predictors. EBioMedicine 21, 29-36. https://doi.org/10.1016/j.ebiom.2017.03. 046 (2017).
- Vaiserman, A. & Krasnienkov, D. Telomere length as a marker of biological age: State-of-the-art, open issues, and future perspectives. Front. Genet. 11, 630186. https://doi.org/10.3389/fgene.2020.630186 (2020).
- Li, J., Vitiello, M. V. & Gooneratne, N. S. Sleep in normal aging. Sleep Med. Clin. 13(1), 1-11. https://doi.org/10.1016/j.jsmc.2017. 09.001 (2018).
- Kocevska, D. et al. Sleep characteristics across the Lifespan in 1.1 million people from the Netherlands, United Kingdom and United States: A systematic review and meta-analysis. Nat. Hum. Behav. 5(1), 113-122. https://doi.org/10.1038/s41562-020-00965-x (2021).
- Dodig, S., Cepelak, I. & Pavic, I. Hallmarks of senescence and aging. Biochem. Med. (Zagreb) 29(3), 030501. https://doi.org/10. 11613/BM.2019.030501 (2019).
- Gao, X., Huang, N., Guo, X. & Huang, T. Role of sleep quality in the acceleration of biological aging and its potential for preventive interaction on air pollution insults: Findings from the Uk biobank cohort. Aging Cell 21(5), e13610. https://doi.org/10.1111/acel. 13610 (2022).
- James, S. et al. Sleep duration and telomere length in children. J. Pediatr. 187, 247-52e1. https://doi.org/10.1016/j.jpeds.2017.05. 014 (2017).
- Liang, G. et al. Associations between rotating night shifts, sleep duration, and telomere length in women. PLoS One 6(8), e23462. https://doi.org/10.1371/journal.pone. 0023462 (2011).
- Winer, J. R. et al. Association of short and long sleep duration with amyloid-beta burden and cognition in aging. JAMA Neurol. 78(10), 1187-1196. https://doi.org/10.1001/jamaneurol.2021.2876 (2021).
- Melk, A. et al. Improvement of biological age by physical activity. Int. J. Cardiol. 176(3), 1187-1189. https://doi.org/10.1016/j. ijcard.2014.07.236 (2014).
- Kecklund, G. & Axelsson, J. Health consequences of shift work and insufficient sleep. BMJ 355, i5210. https://doi.org/10.1136/bmj. i5210 (2016).
- Garbarino, S., Lanteri, P., Bragazzi, N. L., Magnavita, N. & Scoditti, E. Role of sleep deprivation in immune-related disease risk and outcomes. Commun. Biol. 4(1), 1304. https://doi.org/10.1038/s42003-021-02825-4 (2021).
- Patel, S. R., Malhotra, A., Gottlieb, D. J., White, D. P. & Hu, F. B. Correlates of long sleep duration. Sleep 29(7), 881-889. https:// doi.org/10.1093/sleep/29.7.881 (2006).
- Patel, S. R. Sleep: An affair of the heart. Sleep 32(3), 289-290. https://doi.org/10.1093/sleep/32.3.289 (2009).
- Ikehara, S. et al. Association of sleep duration with mortality from cardiovascular disease and other causes for Japanese men and women: The Jacc study. Sleep 32(3), 295-301. https://doi.org/10.1093/sleep/32.3.295 (2009).
- Sambou, M. L. et al. Associations between sleep quality and health span: A prospective cohort study based on 328,850 Uk biobank participants. Front. Genet. 12, 663449. https://doi.org/10.3389/fgene.2021.663449 (2021).
- Fjell, A. M. et al. Is short sleep bad for the brain? Brain structure and cognitive function in short sleepers. J. Neurosci. 43(28), 5241-5250. https://doi.org/10.1523/JNEUROSCI.2330-22.2023 (2023).
- You, Y. et al. Relationship between accelerometer-measured sleep duration and Stroop performance: A functional near-infrared spectroscopy study among young adults. PeerJ https://doi.org/10.7717/peerj. 17057 (2024).
- Mograss, M. et al. The effects of napping on night-time sleep in healthy young adults. J. Sleep Res. 31(5), e13578. https://doi.org/ 10.1111/jsr. 13578 (2022).
- Lokhandwala, S. & Spencer, R. M. C. Relations between sleep patterns early in life and brain development: A review. Dev. Cogn. Neurosci. 56, 101130. https://doi.org/10.1016/j.dcn.2022.101130 (2022).
- Deantoni, M. et al. Napping and circadian sleep-wake regulation during healthy aging. Sleep https://doi.org/10.1093/sleep/zsad2 87 (2023).
- Liu, P. Y. & Reddy, R. T. Sleep, testosterone and cortisol balance, and ageing men. Rev. Endocr. Metab. Disord. 23(6), 1323-1339. https://doi.org/10.1007/s11154-022-09755-4 (2022).
- Irwin, M. R. Sleep and inflammation in resilient aging. Interface Focus 4(5), 20140009. https://doi.org/10.1098/rsfs.2014.0009 (2014).
- Irwin, M. R. & Opp, M. R. Sleep health: Reciprocal regulation of sleep and innate immunity. Neuropsychopharmacology 42(1), 129-155. https://doi.org/10.1038/npp.2016.148 (2017).
- Trivedi, M. S., Holger, D., Bui, A. T., Craddock, T. J. A. & Tartar, J. L. Short-term sleep deprivation leads to decreased systemic redox metabolites and altered epigenetic status. PLoS One 12(7), e0181978. https://doi.org/10.1371/journal.pone.0181978 (2017).
- Cedernaes, J. et al. Acute sleep loss induces tissue-specific epigenetic and transcriptional alterations to circadian clock genes in men. J. Clin. Endocrinol. Metab. 100(9), E1255-E1261. https://doi.org/10.1210/JC.2015-2284 (2015).
- Tempaku, P. F., Mazzotti, D. R. & Tufik, S. Telomere length as a marker of sleep loss and sleep disturbances: a potential link between sleep and cellular senescence. Sleep Med. 16(5), 559-563. https://doi.org/10.1016/j.sleep.2015.02.519 (2015).
- Panagiotou, M., Michel, S., Meijer, J. H. & Deboer, T. The aging brain: Sleep, the circadian clock and exercise. Biochem. Pharmacol. 191, 114563. https://doi.org/10.1016/j.bcp. 2021.114563 (2021).
- Hillman, C. H., Erickson, K. I. & Kramer, A. F. Be smart, exercise your heart: Exercise effects on brain and cognition. Nat. Rev. Neurosci. 9(1), 58-65. https://doi.org/10.1038/nrn2298 (2008).
- You, Y. et al. Muscle quality index is associated with trouble sleeping: A cross-sectional population based study. BMC Public Health 23(1), 489. https://doi.org/10.1186/s12889-023-15411-6 (2023).
- Chennaoui, M., Arnal, P. J., Sauvet, F. & Leger, D. Sleep and exercise: A reciprocal issue?. Sleep Med. Rev. 20, 59-72. https://doi. org/10.1016/j.smrv.2014.06.008 (2015).
- You, Y. et al. Mitigation role of physical exercise participation in the relationship between blood cadmium and sleep disturbance: A cross-sectional study. BMC Public Health 23(1), 1465. https://doi.org/10.1186/s12889-023-16358-4 (2023).
- You, Y. et al. Neural mechanisms of long-term exercise intervention on cognitive performance among short-sleep young adults: A hemodynamic study. Sleep Med. 110, 7-16. https://doi.org/10.1016/j.sleep.2023.07.020 (2023).
- You, Y. et al. Threshold effects of the relationship between physical exercise and cognitive function in the short-sleep elder population. Front. Aging Neurosci. 15, 1214748. https://doi.org/10.3389/fnagi.2023.1214748 (2023).
- Metsios, G. S., Moe, R. H. & Kitas, G. D. Exercise and inflammation. Best Pract. Res. Clin. Rheumatol. 34(2), 101504. https://doi. org/10.1016/j.berh.2020.101504 (2020).
- Chee, M. W. L. & Willoughby, A. R. The value of large-scale studies of sleep and cognition. Trends Neurosci. 46(4), 255-256. https:// doi.org/10.1016/j.tins.2023.01.008 (2023).
- Yin, J. et al. Nonlinear relationship between sleep midpoint and depression symptoms: A cross-sectional study of Us adults. BMC Psychiatry 23(1), 671. https://doi.org/10.1186/s12888-023-05130-y (2023).
- Lee, P. H. Validation of the National health and nutritional survey (Nhanes) single-item self-reported sleep duration against wristworn accelerometer. Sleep Breath 26(4), 2069-2075. https://doi.org/10.1007/s11325-021-02542-6 (2022).
- You, Y. et al. Accelerometer-measured physical activity patterns are associated with phenotypic age: Isotemporal substitution effects. Heliyon 9(9), e19158. https://doi.org/10.1016/j.heliyon.2023.e19158 (2023).
- Liu, Z. et al. A new aging measure captures morbidity and mortality risk across diverse subpopulations from nhanes Iv: A cohort study. PLoS Med. 15(12), e1002718. https://doi.org/10.1371/journal.pmed. 1002718 (2018).
- Chen, L. et al. Biological aging mediates the associations between urinary metals and osteoarthritis among U.S. adults. BMC Med. 20(1), 207. https://doi.org/10.1186/s12916-022-02403-3 (2022).
- You, Y. et al. The role of education attainment on
movement behavior in emerging adults: evidence from a population-based study. Front. Public Health https://doi.org/10.3389/fpubh.2024.1197150 (2024). - Taylor, A. L., Denniston, M. M., Klevens, R. M., McKnight-Eily, L. R. & Jiles, R. B. Association of hepatitis C virus with alcohol use among US adults: Nhanes 2003-2010. Am. J. Prev. Med. 51(2), 206-215. https://doi.org/10.1016/j.amepre.2016.02.033 (2016).
- Huang, Y. et al. The effect of triglycerides in the associations between physical activity, sedentary behavior and depression: An interaction and mediation analysis. J. Affect Disord. 295, 1377-1385. https://doi.org/10.1016/j.jad.2021.09.005 (2021).
- Piercy, K. L. et al. The physical activity guidelines for Americans. JAMA 320(19), 2020-2028. https://doi.org/10.1001/jama.2018. 14854 (2018).
- You, Y. et al. Mediation Role of Recreational Physical Activity in the Relationship between the Dietary Intake of LiveMicrobes and the Systemic Immune-Inflammation Index: A Real-World Cross-Sectional Study. Nutrients 16, 777. https://doi.org/10.3390/ nu16060777 (2024).
- Chen, C. & Dai, J. L. Triglyceride to high-density lipoprotein cholesterol (Hdl-C) ratio and arterial stiffness in Japanese population: A secondary analysis based on a cross-sectional study. Lipids Health Dis. 17(1), 130. https://doi.org/10.1186/s12944-018-0776-7 (2018).
مساهمات المؤلفين
Y.Y.: التصور، المنهجية، البرمجيات، تنسيق البيانات، كتابة المسودة الأصلية، كتابة المراجعة والتحرير. Y.C.: المنهجية، البرمجيات، تنسيق البيانات، كتابة المسودة الأصلية. R.L.: البرمجيات، تنسيق البيانات، كتابة المراجعة والتحرير. Y.Z.: المنهجية، كتابة المراجعة والتحرير. M.W.: كتابة المراجعة والتحرير. Z.Y.: المنهجية. J.L.: التصور، الإشراف، كتابة المراجعة والتحرير. X.M.: الحصول على التمويل، التصور، الإشراف، كتابة المراجعة والتحرير. راجع جميع المؤلفين المخطوطة.
تمويل
تم دعم هذه الدراسة من قبل معهد أبحاث تطوير الرياضة بجامعة تسينغhua (بحث في أفكار وممارسات جون مو في التربية البدنية).
المصالح المتنافسة
يعلن المؤلفون عدم وجود مصالح متنافسة.
معلومات إضافية
المعلومات التكميلية النسخة الإلكترونية تحتوي على مواد تكميلية متاحة على https://doi.org/ 10.1038/s41598-024-56316-7.
يجب توجيه المراسلات وطلبات المواد إلى J.L. أو X.M.
معلومات إعادة الطبع والتصاريح متاحة على www.nature.com/reprints.
ملاحظة الناشر تظل Springer Nature محايدة فيما يتعلق بالمطالبات القضائية في الخرائط المنشورة والانتماءات المؤسسية.
معلومات إعادة الطبع والتصاريح متاحة على www.nature.com/reprints.
ملاحظة الناشر تظل Springer Nature محايدة فيما يتعلق بالمطالبات القضائية في الخرائط المنشورة والانتماءات المؤسسية.
الوصول المفتوح هذه المقالة مرخصة بموجب رخصة المشاع الإبداعي للاستخدام والمشاركة والتكيف والتوزيع وإعادة الإنتاج في أي وسيلة أو صيغة، طالما أنك تعطي الائتمان المناسب للمؤلفين الأصليين والمصدر، وتوفر رابطًا لرخصة المشاع الإبداعي، وتوضح ما إذا تم إجراء تغييرات. الصور أو المواد الأخرى من طرف ثالث في هذه المقالة مشمولة في رخصة المشاع الإبداعي للمقالة، ما لم يُشار إلى خلاف ذلك في سطر الائتمان للمادة. إذا لم تكن المادة مشمولة في رخصة المشاع الإبداعي للمقالة واستخدامك المقصود غير مسموح به بموجب اللوائح القانونية أو يتجاوز الاستخدام المسموح به، ستحتاج إلى الحصول على إذن مباشرة من صاحب حقوق الطبع والنشر. لعرض نسخة من هذه الرخصة، قم بزيارة http://creativecommons.org/licenses/by/4.0/.
© المؤلفون 2024
© المؤلفون 2024
قسم علوم الرياضة والتربية البدنية، جامعة تسينغhua، بكين 100084، الصين. كلية العلوم الاجتماعية، جامعة تسينغhua، بكين 100084، الصين. كلية الصحة العامة والطب الوقائي، كلية الطب، التمريض وعلوم الصحة، جامعة موناش، ملبورن، VIC 3004، أستراليا. كلية تدريب الرياضة، جامعة بكين للرياضة، بكين 100091، الصين. قسم علم الأوبئة والإحصاء الحيوي، كلية الصحة العامة، جامعة الطب الرأسمالي، بكين 100169، الصين. مدرسة فاندكي للصحة العامة، جامعة تسينغhua، بكين 100084، الصين. معهد IDG/McGovern لأبحاث الدماغ، جامعة تسينغhua، بكين 100084، الصين. ساهم هؤلاء المؤلفون بالتساوي: يانوي يو، يوقوان تشين ورودونغ ليو. البريد الإلكتروني: liujianxiu@mail.tsinghua.edu.cn; maxd@mail.tsinghua.edu.cn
Journal: Scientific Reports, Volume: 14, Issue: 1
DOI: https://doi.org/10.1038/s41598-024-56316-7
PMID: https://pubmed.ncbi.nlm.nih.gov/38486063
Publication Date: 2024-03-15
DOI: https://doi.org/10.1038/s41598-024-56316-7
PMID: https://pubmed.ncbi.nlm.nih.gov/38486063
Publication Date: 2024-03-15
Inverted U-shaped relationship between sleep duration and phenotypic age in US adults: a population-based study
Sleep is a modifiable behavior that can be targeted in interventions aimed at promoting healthy aging. This study aims to (i) identify the sleep duration trend in US adults; (ii) investigate the relationship between sleep duration and phenotypic age; and (iii) explore the role of exercise in this relationship. Phenotypic age as a novel index was calculated according to biomarkers collected from US adults based on the National Health and Nutrition Examination Survey (NHANES). Sleep information was self-reported by participants and discerned through individual interviews. The principal analytical method employed was weighted multivariable linear regression modeling, which accommodated for the complex multi-stage sampling design. The potential non-linear relationship was explored using a restricted cubic spline (RCS) model. Furthermore, subgroup analyses evaluated the potential effects of sociodemographic and lifestyle factors on the primary study outcomes. A total of 13,569 participants were finally included in, thereby resulting in a weighted population of 78,880,615. An examination of the temporal trends in sleep duration revealed a declining proportion of individuals with insufficient and markedly deficient sleep time since the 2015-2016 cycle. Taken normal sleep group as a reference, participants with extreme short sleep [
Keywords Sleep, Phenotypic age, Exercise, US population, Cross-sectional study
In today’s fast-paced society, there is a growing trend of people getting insufficient amounts of sleep on a regular basis
In today’s fast-paced society, there is a growing trend of people getting insufficient amounts of sleep on a regular basis
While the trends in sleep duration may vary across different countries and regions, there is growing concern about the negative health outcomes associated with chronic sleep health issues
In the field of medicine and health, a growing area of interest is the use of “phenotypic age” as a predictor for various diseases and as a biomarker for assessing aging. Phenotypic age refers to an individual’s biological age, which is determined by their physical characteristics and functioning rather than their chronological age
Meantime, the influence of sleep on aging is an emerging topic
Based on the aforementioned literature, the burgeoning health problems that are associated with sleep deficiencies demand increased public attention and healthcare resources. Additionally, less is known about the specific relationship between sleep duration and phenotypic age. Therefore, there is an exigency for compelling evidence to awaken public consciousness of the detrimental effects of sleep duration and its influence on agingbased biomarkers. Figure 1 shows the objective and design of the study. By using a nationwide sample of the United States population, this study aims to (i) investigate trends in sleep patterns of US adults from the National Health and Nutrition Examination Survey (NHANES); (ii) evaluate the relationship between sleep and multi-biomarkers-based phenotypic age; (iii) conduct subgroup analysis, and explore whether lifestyle behavior such as exercise participation may impact this relationship.
Figure 1. Objective and design of this study.
Results
A total of 48,762 participants from NHANES 2005-2020 were included in the present analysis for detecting the sleep trend. From Fig. 2, it can be found that most people sleep for
In the crude model and model 1, sleep duration was found to be not significantly associated with phenotypic age when assessed as a continuous variable, as per Table 2 [Crude Model,
We calculated the inflection point of the relationship between sleep duration and log based phenotypic age to be 7 h using a two-piecewise linear regression modelling (Table 3). On the left side of the inflection point, the
Figure 2. (a) Histogram of sleep duration distributions in different year-cycles of NHANES; (b) Histogram of year-cycles distributions among different sleep categories.
| Variable | (%/Mean)* | Normal sleep | Short sleep | Extreme short sleep | Long sleep |
|
| Chronological age (years) | <0.001 | |||||
| < 40 | 36.51 | 36.34 | 36.52 | 36.2 | 36.78 | |
|
|
40.01 | 42.54 | 42.75 | 43.81 | 34.19 | |
|
|
23.49 | 21.12 | 20.73 | 19.99 | 29.03 | |
| Sex | <0.001 | |||||
| Male | 48.88 | 50.35 | 52.44 | 49.24 | 44.88 | |
| Female | 51.12 | 49.65 | 47.56 | 50.76 | 55.12 | |
| Race/ethnicity | <0.001 | |||||
| Non-hispanic White | 71.64 | 76.88 | 68.3 | 59.9 | 73.97 | |
| Non-hispanic Black | 10.43 | 6.44 | 12.52 | 20.65 | 8.44 | |
| Mexican American | 7.91 | 7.34 | 7.98 | 6.93 | 8.8 | |
| Other race/ethnicity | 10.02 | 9.34 | 11.2 | 12.52 | 8.79 | |
| Marital status | <0.001 | |||||
| Never married | 16.29 | 14.3 | 16.33 | 16.54 | 18 | |
| Married/living with partner | 65.05 | 70.15 | 64.59 | 59.4 | 62.99 | |
| Widowed/divorced | 18.66 | 15.54 | 19.07 | 24.06 | 19.02 | |
| Poverty income ratio | <0.001 | |||||
| <1 | 12.89 | 9.36 | 12.55 | 19.38 | 13.7 | |
|
|
35.62 | 32.33 | 35.86 | 41.17 | 36.21 | |
|
|
51.49 | 58.31 | 51.59 | 39.45 | 50.09 | |
| Education | <0.001 | |||||
| Below high school | 6.14 | 4.57 | 5.25 | 7.46 | 7.67 | |
| High school | 36.34 | 32.03 | 38.06 | 44.44 | 35.78 | |
| College or above | 57.52 | 63.41 | 56.7 | 48.1 | 56.56 | |
| Body mass index (
|
<0.001 | |||||
| <25 | 31.8 | 32.88 | 28.97 | 26.9 | 34.8 | |
|
|
33.5 | 34.06 | 33.73 | 32.16 | 33.37 | |
|
|
34.7 | 33.05 | 37.3 | 40.94 | 31.83 | |
| Smokers | <0.001 | |||||
| Never smoker | 52.72 | 55.67 | 51.64 | 45.28 | 53.82 | |
| Former smoker | 24.86 | 26.06 | 23.7 | 21.92 | 25.78 | |
| Current smoker | 22.42 | 18.27 | 24.66 | 32.8 | 20.41 | |
| Alcohol drinkers | <0.001 | |||||
| Nondrinker | 32.07 | 28.78 | 31.23 | 39.57 | 32.6 | |
| Moderate alcohol use | 47.7 | 51.84 | 47.5 | 39.06 | 47.57 | |
| High alcohol use | 20.23 | 19.38 | 21.27 | 21.37 | 19.83 | |
| Exercise Activity (min/week) | <0.001 | |||||
| None | 64.85 | 61.02 | 64.88 | 70.35 | 66.1 | |
|
|
11.02 | 12.61 | 11.05 | 8.9 | 10.41 | |
|
|
24.13 | 26.37 | 24.07 | 20.75 | 23.49 | |
| Hypertension | <0.001 | |||||
| No | 63.9 | 67.58 | 63.11 | 57.86 | 63.55 | |
| Yes | 36.1 | 32.42 | 36.89 | 42.14 | 36.45 | |
| Diabetes mellitus | <0.001 | |||||
| No | 87.35 | 89.78 | 86.73 | 83.32 | 87.21 | |
| Yes | 12.65 | 10.22 | 13.27 | 16.68 | 12.79 | |
| Cardiovascular diseases | <0.001 | |||||
| No | 91.56 | 94.26 | 92.22 | 87.59 | 90.25 | |
| Yes | 8.44 | 5.74 | 7.78 | 12.41 | 9.75 | |
| Phenotypic age (year) |
|
|
|
|
|
<0.001 |
| Red blood cell distribution width (%) |
|
|
|
|
|
<0.001 |
| Mean red cell volume (fL) |
|
|
|
|
|
0.003 |
| Lymphocyte percent (%) |
|
|
|
|
|
0.035 |
| White blood cell count (1000 cells/uL) |
|
|
|
|
|
<0.001 |
| Alkaline phosphatase (U/L) |
|
|
|
|
|
<0.001 |
| C-reactive protein (mg/dL) |
|
|
|
|
|
<0.001 |
| Continued | ||||||
| Variable | (%/Mean)* | Normal sleep | Short sleep | Extreme short sleep | Long sleep |
|
| Albumin (g/L) |
|
|
|
|
|
<0.001 |
| Glucose (mmol/L) |
|
|
|
|
|
0.087 |
| Creatinine (umol/L) |
|
|
|
|
|
0.624 |
Table 1. Demographic characteristics of the final participants.
| Crude model
|
Model
|
Model
|
||||
|
|
|
|
|
|
|
|
| Sleep duration (hours/day) | 0.329 (-0.012, 0.669) | 0.058 | -0.155 (-0.317, 0.006) | 0.059 | 0.153 (0.015, 0.291) | 0.031 |
| Sleep duration (as category) | ||||||
| Normal sleep | Reference | Reference | Reference | |||
| Short sleep | 0.867 (0.000, 1.733) | 0.050 | 0.837 (0.358, 1.316) | <0.001 | 0.142 (-0.367, 0.650) | 0.570 |
| Extreme short sleep | 2.434 (1.240, 3.628) | <0.001 | 2.356 (1.843, 2.869) | <0.001 | 0.582 (0.018, 1.146) | 0.044 |
| Long sleep | 2.696 (1.720, 3.672) | <0.001 | 1.000 (0.479, 1.521) | <0.001 | 0.694 (0.186, 1.203) | 0.010 |
Table 2. Weighted linear regression results for relationship between sleep duration and phenotypic age.
|
|
|
|
| One-line linear regression model | -0.001 (-0.003, 0.003) | 0.934 |
| Two-piecewise linear regression model | ||
| Sleep duration < 7 (hours/day) | -0.010 (-0.014, -0.005) | <0.001 |
| Sleep duration
|
0.013 (0.007, 0.018) | <0.001 |
| Log-likelihood ratio test | <0.001 | |
Table 3. Threshold effect analysis of relationship between sleep duration and log phenotypic age. Age, sex, race, marital status, education, poverty status, body mass index, smokers, alcohol drinkers, exercise activity, hypertension, diabetes mellitus, and cardiovascular diseases were adjusted.
The present study sought to investigate the relationship between sleep duration and phenotypic age by examining the potential influence of demographic, lifestyle and health-related factors. Detailed stratified analyses can be found in Supplementary Table 1. Among these influencing factors, exercise level was a notable variable that also significantly regulated the association mentioned above. Subgroup analysis detected the relationship between sleep duration and phenotypic age under different level of exercise groups (Fig. 4a). Our findings indicated that in none exercise habit group, extreme short sleep and long sleep were positively associated with phenotypic age [short sleep,
Discussions
Drawing upon NHANES data, we investigated the sleep duration trend and the relationship between sleep duration and phenotypic age, while also examining the potential effects of confounding factors on such associations. In addition to identifying the relationship, the dose-response and subgroup analysis can provide practical recommendations for promoting healthy sleep habits and slowing down the aging process. Moreover, the results shed light on potential health-related factors such as exercise participation that may influence the relationship between sleep duration and phenotypic age, and have important implications for clinical practice and public health policies.
Figure 3. The dose-response relationship between sleep duration and log based phenotypic age.
Figure 4. Subgroup analysis (a) and dose-response relationship (b) between sleep duration and phenotypic age under different level of exercise groups (
In the current study, it was observed that extreme short-sleep population demonstrated a downward trend. This dynamic may reflect evolving cultural attitudes toward sleep hygiene, broader societal priorities, as well as demographic shifts. Such findings provide valuable insights into the changing landscape of sleep patterns and attendant health outcomes, thereby informing clinical practice and public health policy. Furthermore, our findings indicated that short sleep was associated with accelerated phenotypic age. Research has shown that getting enough sleep is critical for overall health and wellbeing
When it comes to the biological mechanisms about the relationship between sleep duration and hallmarks of aging. It ought to be underscored that critical hormonal modulators implicated in the sleep homeostasis framework, such as serum concentrations of testosterone, were shown to be influenced by inadequate sleep duration and disturbance in circadian rhythms
The multifactorial nature of phenotypic age engenders a complex interplay of influential lifestyle factors. Physical activity represents a lifestyle intervention capable of engendering salutary effects on the trajectory of aging and conferring longevity upon its ardent practitioners
Our study has several strengths. The importance of large-scale studies of sleep should be recognized
Despite these strengths, our study also has some limitations. Firstly, we used cross-sectional data, which limited our ability to establish causality between sleep duration and phenotypic age. The cross-sectional nature of the study design was unable for us to observe the dynamic physiological changes in phenotypic age. Secondly, there were also other influencing factors such as race, sex, age, and BMI, that may modify the observed relationships between sleep duration, exercise, and phenotypic age, which can be further explored. Thirdly, our study relied on self-reported measures of sleep duration (cannot measure time in bed and total sleep time simultaneously), which may be subject to recall bias. Furthermore, most epidemiological studies that rely on self-reported sleep duration (without all-night EEG sleep recordings) suffer from another limitation, namely they cannot determine whether sleep fragmentation, with or without changes in sleep duration, can also affect life span. Fourthly, there is an absence of detailed information on sleep medication usage in the NHANES dataset. Consequently, our analysis did not encompass an evaluation of the potential impact of sleep medication on the relationship between sleep duration and phenotypic age. Finally, we did not explore the role of sleep quality and sleep variability, which may be an important factor in the relationship between sleep duration and phenotypic age. Future studies should consider using objective measures of sleep, such as an actigraphy or polysomnography.
Conclusions
Overall, the findings of our study suggested that in the United States, the population with extremely short sleep duration showed a decreasing trend in recent years. Moreover, there existed an inverted U-shaped relationship between sleep duration and phenotypic age. This study was significant as it contributed to the growing body of research that emphasized the importance of sleep in relation to biological aging. Additionally, in individuals with extended sleep duration, consistent engagement in regular exercise is associated with benefits, while those with shorter sleep duration and increased exercise exhibit a tendency toward higher phenotypic age. These findings have important implications for public health, underscoring the need for interventions aimed at promoting healthy sleep habits for fostering healthy aging. Further research is needed to establish causality and explore the role of sleep quality in this relationship.
Methods
Study population
Study participants are from the NHANES, a comprehensive population-based survey with the aim of collecting data from the civilian population in the United States. As part of NHANES, approximately 10,000 people were surveyed on a 2 -year cycle and a multistage probability sampling approach was used to select a sample representative of noninstitutionalized households.
In the present study, for the sleep trend analysis, we analyzed participants from eight cycles of the “continuous NHANES” (2005-2020) and included 48,762 participants in the analysis. Considering that the data for phenotypic
age was only available in NHANES 2001-2010, a total of 13,569 participants were used for the association between sleep duration and phenotypic age. Participants without sleep data, phenotypic age, and covariates and those who were pregnant were excluded from the analysis. A flowchart showing the inclusion and exclusion process is shown in Fig. 5.
age was only available in NHANES 2001-2010, a total of 13,569 participants were used for the association between sleep duration and phenotypic age. Participants without sleep data, phenotypic age, and covariates and those who were pregnant were excluded from the analysis. A flowchart showing the inclusion and exclusion process is shown in Fig. 5.
Measurement of exposure and outcome variables
The exposure variable in this study was sleep duration. NHANES collected self-reported sleep duration data through their standardized questionnaire, which is administered to participants during in-person interviews
The outcome variable was phenotypic age. It is apparent that the utilization of a newly fashioned phenotypic age, in lieu of relying on the self-sufficient chronological age, yields superior prognostic outcomes pertaining to health. To be precise, referring to the definition of phenotypic age proposed by Morgan E. Levine et al.
Covariate assessment
The variables that were deemed confounding factors were age groups
Figure 5. Flowchart of the study design and participants’ inclusion criteria.
or fewer drinks per week for men, or 7 or fewer drinks per week for women, with no more than 5 drinks on any single day in the past year. On the other hand, high alcohol use participants were those who consumed more than 14 drinks per week for men, or more than 7 drinks per week for women, including having 5 or more drinks on at least 1 day in the past year for both men and women
Statistical analyses
All data were combined according to the NHANES protocol, and data analysis was applied using the weighting methodology by the NHANES survey-weighted analytic suggestions. Weights from the Mobile Examination Center (MEC) interviews were reweighted to account for non-responders, non-coverage, and unequal probability of selection in NHANES. For the baseline characteristics of participants, in order to explicate the findings, the continuous variables were articulated as means and standard error (SE), while the categorical variables were articulated as percentages (%). Employing a weighted linear regression model, we investigated the association between sleep duration and phenotypic age, accounting for several confounding variables across three distinct models. The Crude model allowed no adjustment for covariates, whereas Model 1 adjusted for age, sex, and race. In contrast, Model 2 integrated additional covariates including marital status, education, poverty status, body mass index, exercise activity, smokers, alcohol drinkers, hypertension, diabetes mellitus, and cardiovascular diseases to obtain a more accurate estimation of the strength and direction of the relationship under scrutiny.
Furthermore, the dose-response relationship was examined using the threshold effect analysis. Initially, the employment of a smooth curve fitting technique is implemented as a preliminary analysis to discern whether the independent variable has been partitioned into discrete intervals. Then, segmented regression, also referred to as piece-wise regression, is employed whereby separate line segments are utilized to fit each interval. A loglikelihood ratio test is employed in order to compare the one-line (non-segmented) model with the segmented regression model to determine whether a threshold exists. Subsequently, the inflection point connecting the segments that maximizes the likelihood based on the model is determined using a two-step recursive method. More details about the inflection point calculation can be found elsewhere
Ethics approval
The authors are accountable for all aspects of the work in ensuring that questions related to the accuracy or integrity of any part of the work are appropriately investigated and resolved. The study was conducted in accordance with the Declaration of Helsinki. All information from the NHANES program is available and free for public, so the agreement of the medical ethics committee board was not necessary.
Consent to participate
Informed consent was obtained from all individual participants included in the study.
Data availability
The data that support the findings of this study are openly available in https://www.cdc.gov/nchs/nhanes/. Information from NHANES is made available through an extensive series of publications and articles in scientific and technical journals. The original contributions presented in the study were included in the article, further inquiries can be directed to the corresponding author.
Received: 12 June 2023; Accepted: 5 March 2024
Published online: 15 March 2024
Published online: 15 March 2024
References
- Liu, Y. et al. Prevalence of healthy sleep duration among adults-United States, 2014. MMWR Morb. Mortal. Wkly. Rep. 65(6), 137-144. https://doi.org/10.15585/mmwr.mm6506a1 (2016).
- Owens, J. A. & Weiss, M. R. Insufficient sleep in adolescents: Causes and consequences. Miner. Pediatr 69(4), 326-336. https://doi. org/10.23736/S0026-4946.17.04914-3 (2017).
- Willoughby, A. R., Alikhani, I., Karsikas, M., Chua, X. Y. & Chee, M. W. L. Country differences in nocturnal sleep variability: Observations from a large-scale, long-term sleep wearable study. Sleep Med. 110, 155-165. https://doi.org/10.1016/j.sleep.2023. 08.010 (2023).
- Consensus Conference, P. et al. Joint consensus statement of the american academy of sleep medicine and sleep research society on the recommended amount of sleep for a healthy adult: Methodology and discussion. Sleep 38(8), 1161-1183. https://doi.org/ 10.5665/sleep. 4886 (2015).
- Hirshkowitz, M. et al. National sleep foundation’s sleep time duration recommendations: Methodology and results summary. Sleep Health 1(1), 40-43. https://doi.org/10.1016/j.sleh.2014.12.010 (2015).
- Centers for Disease C, Prevention. Perceived insufficient rest or sleep among adults: United States, 2008. MMWR Morb. Mortal. Wkly Rep. 58(42), 1175-1179 (2009).
- (CDC). CfDCaP. National Health and Nutrition Examination Survey. Hyattsville, Md: Us Department of Health and Human Services, Cdc, National Center for Health Statistics; 2007-2010. http://www.cdc.gov/nchs/nhanes.htm.
- You, Y. et al. The association between sedentary behavior, exercise, and sleep disturbance: A mediation analysis of inflammatory biomarkers. Front. Immunol. 13, 1080782. https://doi.org/10.3389/fimmu.2022.1080782 (2022).
- Gallicchio, L. & Kalesan, B. Sleep duration and mortality: A systematic review and meta-analysis. J. Sleep Res. 18(2), 148-158. https://doi.org/10.1111/j.1365-2869.2008.00732.x (2009).
- Broussard, J. L. & Klein, S. Insufficient sleep and obesity: Cause or consequence. Obesity (Silver Spring) 30(10), 1914-1916. https:// doi.org/10.1002/oby. 23539 (2022).
- Depner, C. M., Stothard, E. R. & Wright, K. P. Jr. Metabolic consequences of sleep and circadian disorders. Curr. Diab. Rep. 14(7), 507. https://doi.org/10.1007/s11892-014-0507-z (2014).
- You, Y. et al. Cognitive performance in short sleep young adults with different physical activity levels: A cross-sectional Fnirs study. Brain Sci. https://doi.org/10.3390/brainsci13020171 (2023).
- Dong, L., Xie, Y. & Zou, X. Association between sleep duration and depression in Us adults: A cross-sectional study. J. Affect Disord. 296, 183-188. https://doi.org/10.1016/j.jad.2021.09.075 (2022).
- (CDC). CfDCaP. Sleep duration as a correlate of smoking, alcohol use, leisure-time physical inactivity, and obesity among adults: United States, Available at 2004-2006.
- Liu, Y., Wheaton, A. G., Chapman, D. P. & Croft, J. B. Sleep duration and chronic diseases among U.S. adults age 45 years and older: Evidence from the 2010 Behavioral risk factor surveillance system. Sleep 36(10), 1421-1427. https://doi.org/10.5665/sleep. 3028 (2013).
- Levine, M. E. Modeling the rate of senescence: Can estimated biological age predict mortality more accurately than chronological age?. J. Gerontol. A Biol. Sci. Med. Sci. 68(6), 667-674. https://doi.org/10.1093/gerona/gls233 (2013).
- Levine, M. E. et al. An epigenetic biomarker of aging for lifespan and healthspan. Aging (Albany NY) 10(4), 573-591. https://doi. org/10.18632/aging. 101414 (2018).
- Lind, L., Ingelsson, E., Sundstrom, J., Siegbahn, A. & Lampa, E. Methylation-based estimated biological age and cardiovascular disease. Eur. J. Clin. Invest. https://doi.org/10.1111/eci.12872 (2018).
- Cortez, B. N., Bahour, N. & Aguayo-Mazzucato, C. Biological age in diabetes and precision medicine. Aging (Albany NY) 14(11), 4622-4623. https://doi.org/10.18632/aging. 204123 (2022).
- Knobel, P., Litke, R. & Mobbs, C. V. Biological age and environmental risk factors for dementia and stroke: Molecular mechanisms. Front. Aging Neurosci. 14, 1042488. https://doi.org/10.3389/fnagi.2022.1042488 (2022).
- Jylhava, J., Pedersen, N. L. & Hagg, S. Biological age predictors. EBioMedicine 21, 29-36. https://doi.org/10.1016/j.ebiom.2017.03. 046 (2017).
- Vaiserman, A. & Krasnienkov, D. Telomere length as a marker of biological age: State-of-the-art, open issues, and future perspectives. Front. Genet. 11, 630186. https://doi.org/10.3389/fgene.2020.630186 (2020).
- Li, J., Vitiello, M. V. & Gooneratne, N. S. Sleep in normal aging. Sleep Med. Clin. 13(1), 1-11. https://doi.org/10.1016/j.jsmc.2017. 09.001 (2018).
- Kocevska, D. et al. Sleep characteristics across the Lifespan in 1.1 million people from the Netherlands, United Kingdom and United States: A systematic review and meta-analysis. Nat. Hum. Behav. 5(1), 113-122. https://doi.org/10.1038/s41562-020-00965-x (2021).
- Dodig, S., Cepelak, I. & Pavic, I. Hallmarks of senescence and aging. Biochem. Med. (Zagreb) 29(3), 030501. https://doi.org/10. 11613/BM.2019.030501 (2019).
- Gao, X., Huang, N., Guo, X. & Huang, T. Role of sleep quality in the acceleration of biological aging and its potential for preventive interaction on air pollution insults: Findings from the Uk biobank cohort. Aging Cell 21(5), e13610. https://doi.org/10.1111/acel. 13610 (2022).
- James, S. et al. Sleep duration and telomere length in children. J. Pediatr. 187, 247-52e1. https://doi.org/10.1016/j.jpeds.2017.05. 014 (2017).
- Liang, G. et al. Associations between rotating night shifts, sleep duration, and telomere length in women. PLoS One 6(8), e23462. https://doi.org/10.1371/journal.pone. 0023462 (2011).
- Winer, J. R. et al. Association of short and long sleep duration with amyloid-beta burden and cognition in aging. JAMA Neurol. 78(10), 1187-1196. https://doi.org/10.1001/jamaneurol.2021.2876 (2021).
- Melk, A. et al. Improvement of biological age by physical activity. Int. J. Cardiol. 176(3), 1187-1189. https://doi.org/10.1016/j. ijcard.2014.07.236 (2014).
- Kecklund, G. & Axelsson, J. Health consequences of shift work and insufficient sleep. BMJ 355, i5210. https://doi.org/10.1136/bmj. i5210 (2016).
- Garbarino, S., Lanteri, P., Bragazzi, N. L., Magnavita, N. & Scoditti, E. Role of sleep deprivation in immune-related disease risk and outcomes. Commun. Biol. 4(1), 1304. https://doi.org/10.1038/s42003-021-02825-4 (2021).
- Patel, S. R., Malhotra, A., Gottlieb, D. J., White, D. P. & Hu, F. B. Correlates of long sleep duration. Sleep 29(7), 881-889. https:// doi.org/10.1093/sleep/29.7.881 (2006).
- Patel, S. R. Sleep: An affair of the heart. Sleep 32(3), 289-290. https://doi.org/10.1093/sleep/32.3.289 (2009).
- Ikehara, S. et al. Association of sleep duration with mortality from cardiovascular disease and other causes for Japanese men and women: The Jacc study. Sleep 32(3), 295-301. https://doi.org/10.1093/sleep/32.3.295 (2009).
- Sambou, M. L. et al. Associations between sleep quality and health span: A prospective cohort study based on 328,850 Uk biobank participants. Front. Genet. 12, 663449. https://doi.org/10.3389/fgene.2021.663449 (2021).
- Fjell, A. M. et al. Is short sleep bad for the brain? Brain structure and cognitive function in short sleepers. J. Neurosci. 43(28), 5241-5250. https://doi.org/10.1523/JNEUROSCI.2330-22.2023 (2023).
- You, Y. et al. Relationship between accelerometer-measured sleep duration and Stroop performance: A functional near-infrared spectroscopy study among young adults. PeerJ https://doi.org/10.7717/peerj. 17057 (2024).
- Mograss, M. et al. The effects of napping on night-time sleep in healthy young adults. J. Sleep Res. 31(5), e13578. https://doi.org/ 10.1111/jsr. 13578 (2022).
- Lokhandwala, S. & Spencer, R. M. C. Relations between sleep patterns early in life and brain development: A review. Dev. Cogn. Neurosci. 56, 101130. https://doi.org/10.1016/j.dcn.2022.101130 (2022).
- Deantoni, M. et al. Napping and circadian sleep-wake regulation during healthy aging. Sleep https://doi.org/10.1093/sleep/zsad2 87 (2023).
- Liu, P. Y. & Reddy, R. T. Sleep, testosterone and cortisol balance, and ageing men. Rev. Endocr. Metab. Disord. 23(6), 1323-1339. https://doi.org/10.1007/s11154-022-09755-4 (2022).
- Irwin, M. R. Sleep and inflammation in resilient aging. Interface Focus 4(5), 20140009. https://doi.org/10.1098/rsfs.2014.0009 (2014).
- Irwin, M. R. & Opp, M. R. Sleep health: Reciprocal regulation of sleep and innate immunity. Neuropsychopharmacology 42(1), 129-155. https://doi.org/10.1038/npp.2016.148 (2017).
- Trivedi, M. S., Holger, D., Bui, A. T., Craddock, T. J. A. & Tartar, J. L. Short-term sleep deprivation leads to decreased systemic redox metabolites and altered epigenetic status. PLoS One 12(7), e0181978. https://doi.org/10.1371/journal.pone.0181978 (2017).
- Cedernaes, J. et al. Acute sleep loss induces tissue-specific epigenetic and transcriptional alterations to circadian clock genes in men. J. Clin. Endocrinol. Metab. 100(9), E1255-E1261. https://doi.org/10.1210/JC.2015-2284 (2015).
- Tempaku, P. F., Mazzotti, D. R. & Tufik, S. Telomere length as a marker of sleep loss and sleep disturbances: a potential link between sleep and cellular senescence. Sleep Med. 16(5), 559-563. https://doi.org/10.1016/j.sleep.2015.02.519 (2015).
- Panagiotou, M., Michel, S., Meijer, J. H. & Deboer, T. The aging brain: Sleep, the circadian clock and exercise. Biochem. Pharmacol. 191, 114563. https://doi.org/10.1016/j.bcp. 2021.114563 (2021).
- Hillman, C. H., Erickson, K. I. & Kramer, A. F. Be smart, exercise your heart: Exercise effects on brain and cognition. Nat. Rev. Neurosci. 9(1), 58-65. https://doi.org/10.1038/nrn2298 (2008).
- You, Y. et al. Muscle quality index is associated with trouble sleeping: A cross-sectional population based study. BMC Public Health 23(1), 489. https://doi.org/10.1186/s12889-023-15411-6 (2023).
- Chennaoui, M., Arnal, P. J., Sauvet, F. & Leger, D. Sleep and exercise: A reciprocal issue?. Sleep Med. Rev. 20, 59-72. https://doi. org/10.1016/j.smrv.2014.06.008 (2015).
- You, Y. et al. Mitigation role of physical exercise participation in the relationship between blood cadmium and sleep disturbance: A cross-sectional study. BMC Public Health 23(1), 1465. https://doi.org/10.1186/s12889-023-16358-4 (2023).
- You, Y. et al. Neural mechanisms of long-term exercise intervention on cognitive performance among short-sleep young adults: A hemodynamic study. Sleep Med. 110, 7-16. https://doi.org/10.1016/j.sleep.2023.07.020 (2023).
- You, Y. et al. Threshold effects of the relationship between physical exercise and cognitive function in the short-sleep elder population. Front. Aging Neurosci. 15, 1214748. https://doi.org/10.3389/fnagi.2023.1214748 (2023).
- Metsios, G. S., Moe, R. H. & Kitas, G. D. Exercise and inflammation. Best Pract. Res. Clin. Rheumatol. 34(2), 101504. https://doi. org/10.1016/j.berh.2020.101504 (2020).
- Chee, M. W. L. & Willoughby, A. R. The value of large-scale studies of sleep and cognition. Trends Neurosci. 46(4), 255-256. https:// doi.org/10.1016/j.tins.2023.01.008 (2023).
- Yin, J. et al. Nonlinear relationship between sleep midpoint and depression symptoms: A cross-sectional study of Us adults. BMC Psychiatry 23(1), 671. https://doi.org/10.1186/s12888-023-05130-y (2023).
- Lee, P. H. Validation of the National health and nutritional survey (Nhanes) single-item self-reported sleep duration against wristworn accelerometer. Sleep Breath 26(4), 2069-2075. https://doi.org/10.1007/s11325-021-02542-6 (2022).
- You, Y. et al. Accelerometer-measured physical activity patterns are associated with phenotypic age: Isotemporal substitution effects. Heliyon 9(9), e19158. https://doi.org/10.1016/j.heliyon.2023.e19158 (2023).
- Liu, Z. et al. A new aging measure captures morbidity and mortality risk across diverse subpopulations from nhanes Iv: A cohort study. PLoS Med. 15(12), e1002718. https://doi.org/10.1371/journal.pmed. 1002718 (2018).
- Chen, L. et al. Biological aging mediates the associations between urinary metals and osteoarthritis among U.S. adults. BMC Med. 20(1), 207. https://doi.org/10.1186/s12916-022-02403-3 (2022).
- You, Y. et al. The role of education attainment on
movement behavior in emerging adults: evidence from a population-based study. Front. Public Health https://doi.org/10.3389/fpubh.2024.1197150 (2024). - Taylor, A. L., Denniston, M. M., Klevens, R. M., McKnight-Eily, L. R. & Jiles, R. B. Association of hepatitis C virus with alcohol use among US adults: Nhanes 2003-2010. Am. J. Prev. Med. 51(2), 206-215. https://doi.org/10.1016/j.amepre.2016.02.033 (2016).
- Huang, Y. et al. The effect of triglycerides in the associations between physical activity, sedentary behavior and depression: An interaction and mediation analysis. J. Affect Disord. 295, 1377-1385. https://doi.org/10.1016/j.jad.2021.09.005 (2021).
- Piercy, K. L. et al. The physical activity guidelines for Americans. JAMA 320(19), 2020-2028. https://doi.org/10.1001/jama.2018. 14854 (2018).
- You, Y. et al. Mediation Role of Recreational Physical Activity in the Relationship between the Dietary Intake of LiveMicrobes and the Systemic Immune-Inflammation Index: A Real-World Cross-Sectional Study. Nutrients 16, 777. https://doi.org/10.3390/ nu16060777 (2024).
- Chen, C. & Dai, J. L. Triglyceride to high-density lipoprotein cholesterol (Hdl-C) ratio and arterial stiffness in Japanese population: A secondary analysis based on a cross-sectional study. Lipids Health Dis. 17(1), 130. https://doi.org/10.1186/s12944-018-0776-7 (2018).
Author contributions
Y.Y.: Conceptualization, methodology, software, data curation, writing-original draft, writing-review and editing. Y.C.: Methodology, software, data curation, writing-original draft. R.L.: Software, data curation, writing-review and editing. Y.Z.: Methodology, writing-review and editing. M.W.: Writing-review and editing. Z.Y.: Methodology. J.L.: conceptualization, supervision, writing-review and editing. X.M.: funding acquisition, conceptualization, supervision, writing-review and editing. All authors reviewed the manuscript.
Funding
This study was supported by the Institute of Sports Development Research of Tsinghua University (Research on John Mo’s thought and practice of Physical Education).
Competing interests
The authors declare no competing interests.
Additional information
Supplementary Information The online version contains supplementary material available at https://doi.org/ 10.1038/s41598-024-56316-7.
Correspondence and requests for materials should be addressed to J.L. or X.M.
Reprints and permissions information is available at www.nature.com/reprints.
Publisher’s note Springer Nature remains neutral with regard to jurisdictional claims in published maps and institutional affiliations.
Reprints and permissions information is available at www.nature.com/reprints.
Publisher’s note Springer Nature remains neutral with regard to jurisdictional claims in published maps and institutional affiliations.
Open Access This article is licensed under a Creative Commons Attribution 4.0 International License, which permits use, sharing, adaptation, distribution and reproduction in any medium or format, as long as you give appropriate credit to the original author(s) and the source, provide a link to the Creative Commons licence, and indicate if changes were made. The images or other third party material in this article are included in the article’s Creative Commons licence, unless indicated otherwise in a credit line to the material. If material is not included in the article’s Creative Commons licence and your intended use is not permitted by statutory regulation or exceeds the permitted use, you will need to obtain permission directly from the copyright holder. To view a copy of this licence, visit http://creativecommons.org/licenses/by/4.0/.
© The Author(s) 2024
© The Author(s) 2024
Division of Sports Science and Physical Education, Tsinghua University, Beijing 100084, China. School of Social Sciences, Tsinghua University, Beijing 100084, China. School of Public Health and Preventive Medicine, Faculty of Medicine, Nursing & Health Sciences, Monash University, Melbourne, VIC 3004, Australia. Sports Coaching College, Beijing Sport University, Beijing 100091, China. Department of Epidemiology and Biostatistics, School of Public Health, Capital Medical University, Beijing 100169, China. Vanke School of Public Health, Tsinghua University, Beijing 100084, China. IDG/McGovern Institute for Brain Research, Tsinghua University, Beijing 100084, China. These authors contributed equally: Yanwei You, Yuquan Chen and Ruidong Liu. email: liujianxiu@mail.tsinghua.edu.cn; maxd@mail.tsinghua.edu.cn