كشف أنماط فقدان العظام اللثوي وعيوب الفركشن من الأشعة السينية البانورامية باستخدام خوارزمية التعلم العميق: دراسة استعادية Detection of periodontal bone loss patterns and furcation defects from panoramic radiographs using deep learning algorithm: a retrospective study

المجلة: BMC Oral Health، المجلد: 24، العدد: 1
DOI: https://doi.org/10.1186/s12903-024-03896-5
PMID: https://pubmed.ncbi.nlm.nih.gov/38297288
تاريخ النشر: 2024-01-31

كشف أنماط فقدان العظام اللثوي وعيوب الفركشن من الأشعة السينية البانورامية باستخدام خوارزمية التعلم العميق: دراسة استعادية

سيفدا كورت-بايرقدار (. إبراهيم شيفكي بايرقدار , محمد بوراك يافوز , نيكال سالي , أوزر تشيليك , أوجوز كوسه , بلجي كانسو أوزون سايلان , باتوهان كوللي , روهان جاجتاب و كاان أورهان

الملخص

الخلفية: تهدف هذه الدراسة الاستعادية إلى تطوير خوارزمية تعلم عميق لتفسير الأشعة السينية البانورامية وفحص أداء هذه الخوارزمية في الكشف عن فقدان العظام حول الأسنان وأنماط فقدان العظام. الطرق: تم استخدام 1121 صورة أشعة سينية بانورامية في هذه الدراسة. تم تصنيف فقدان العظام في الفك العلوي والسفلي (إجمالي فقدان العظام السنخية) ( )، وفقدان العظام بين الأسنان ( )، وعيوب الفركشن ( ) باستخدام طريقة التقسيم. بالإضافة إلى ذلك، تم تقسيم فقدان العظام بين الأسنان إلى فقدان عظام أفقي ( ) وفقدان عظام عمودي ( ) وفقًا لأنماط العيوب. تم تطوير نظام ذكاء اصطناعي (AI) قائم على شبكة عصبية تلافيفية (CNN) باستخدام بنية U-Net. تم تقييم أداء خوارزمية التعلم العميق إحصائيًا من خلال مصفوفة الارتباك وتحليل منحنى ROC. النتائج: أظهر النظام أعلى أداء تشخيصي في الكشف عن إجمالي فقدان العظام السنخية وأدنى أداء في الكشف عن فقدان العظام العمودي . تم العثور على قيم الحساسية والدقة ودرجة F1 والدقة وقيم AUC كالتالي: 1، 0.995، 0.997، 0.994، 0.951 لفقدان العظام السنخي الكلي؛ و0.947، 0.939، لفقدان العظام الأفقي؛ و لفقدان العظام العمودي و لعيوب الفركشن (على التوالي). الاستنتاجات: تقدم أنظمة الذكاء الاصطناعي نتائج واعدة في تحديد أنماط فقدان العظام حول الأسنان وعيوب الفركشن من الأشعة السينية السنية. وهذا يشير إلى أن خوارزميات CNN يمكن استخدامها أيضًا لتوفير معلومات أكثر تفصيلًا مثل التحديد التلقائي لشدة مرض اللثة وتخطيط العلاج في مختلف الأشعة السينية السنية.

الكلمات الرئيسية: الأشعة السينية البانورامية، الذكاء الاصطناعي، التهاب اللثة، طب الأسنان

الخلفية

التهاب اللثة هو مرض التهابي مزمن يتميز بتلف الأنسجة الداعمة للأسنان ويمكن أن يؤدي إلى فقدان الأسنان إذا لم يتم السيطرة عليه [1]. يرتبط هذا المرض الشائع في المجتمع بالعديد من الأمراض الجهازية في الجسم بالإضافة إلى مشاكل الأسنان مثل فقدان المضغ [2،3]. في هذا الصدد، فإن التشخيص المبكر وتخطيط العلاج مهمان جدًا في حالات التهاب اللثة [2،3].
تلعب التقييمات الشعاعية دورًا مهمًا في تشخيص التهاب اللثة بالإضافة إلى التقييمات السريرية للثة مثل عمق الجيب، وفقدان الارتباط، وتراجع اللثة [4]. تُستخدم الأشعة السينية داخل الفم مثل الأشعة السينية القمية وأشعة البايتوينغ بشكل شائع لتحديد حالة اللثة [4-6]. تعتبر الأشعة السينية البانورامية، التي هي واحدة من تقنيات الأشعة السينية السنية الخارجية، لها مزايا مثل العمل مع إشعاع منخفض الجرعة وتوفير تصوير شعاعي سريع وسهل، وأيضًا تساعد في تحديد المشاكل السنية العامة وحالات اللثة [6-8]. بالإضافة إلى ذلك، تسمح هذه الأشعة بملاحظة أنماط فقدان العظام (مثل فقدان العظام الأفقي، وفقدان العظام العمودي، وعيوب الفركشن) في حالات التهاب اللثة [9]. في حالات التهاب اللثة، من المهم جدًا تحديد أنماط فقدان العظام وشكل العظام لوضع خطة علاج مناسبة وتحقيق نتائج ناجحة [10، 11]. يحدث فقدان العظام الأفقي عندما يذوب العظام الداعمة للأسنان عند نفس المستويات على جميع الأسطح المتعلقة بالأسنان (الجانب القريب، الجانب البعيد، الجانبي/الخد، اللساني/الحنكي). في هذا النوع من العيوب العظمية، يتم إعادة امتصاص مستويات قمة السنخ حول الأسنان بالتوازي مع الخط الذي يجب أن يكون في اللثة الصحية ويتم وضعها بشكل أكثر عمقًا [12-14]. فقدان العظام العمودي هو فقدان العظام الذي يحدث بشكل مائل وزاوي في المنطقة بين الأسنان [12-14]. في الأسنان متعددة الجذور، تحدث عيوب الفركشن عندما يتأثر العظم السنخي بين جذور الأسنان أيضًا بمرض اللثة. في عيوب الفركشن، يصبح كل من التشخيص وتخطيط العلاج أكثر تعقيدًا وصعوبة بالنسبة لأطباء الأسنان [15]. يمكن أن يمكّن التقدير الصحيح لأنماط فقدان العظام من اختيار العلاج الصحيح ويسهل عمل كل من المرضى وأطباء الأسنان. على سبيل المثال، قد يُفضل إجراء جراحة الفلپ و/أو العلاج الجراحي الاستئصالي بدلاً من العلاج التجديدي في حالات فقدان العظام الأفقي، بينما قد يكون العلاج التجديدي طريقة بديلة في فقدان العظام العمودي [14]. وفقًا للتصنيف الحالي لأمراض وحالات اللثة وزرع الأسنان الذي تم تطويره في عام 2018، فإن الكشف عن أنماط فقدان العظام حول الأسنان مهم جدًا لتحديد مراحل المرض [16]. في هذا النظام التصنيفي، يرتبط التهاب اللثة من المرحلة الأولى والثانية بوجود فقدان العظام الأفقي، بينما يتم ملاحظة وجود فقدان العظام العمودي وعيوب الفركشن في التهاب اللثة من المرحلة الثالثة والرابعة [16،
17]. أشارت الدراسات الأكاديمية الحالية التي تستخدم تقنيات معالجة الصور وتعلم الآلة وتهدف إلى التصنيف التلقائي لأمراض اللثة إلى تحديد أنماط فقدان العظام حول الأسنان كواحد من المعايير الرئيسية للتصنيف [17، 18]. لذلك، فإن تحديد نمط فقدان العظام حول الأسنان له أهمية سريرية في جعل التصنيف الحالي لأمراض اللثة كاملاً ودقيقًا [17، 18].
تم إجراء العديد من الدراسات حول الذكاء الاصطناعي (AI) في طب الأسنان، بعد استخدام أنظمة الذكاء الاصطناعي في المجال الطبي لتشخيص الأمراض وتخطيط العلاج [19، 20]. في هذه الدراسات، يُرى أن أنظمة الذكاء الاصطناعي تُستخدم لتحديد العديد من الأمراض مثل تسوس الأسنان، والآفات القمية، وترقيم الأسنان، وكسور الجذور على الأشعة السينية ثنائية الأبعاد (2D) [21-24]. الهدف الرئيسي من استخدام الذكاء الاصطناعي في ممارسة طب الأسنان هو الكشف التلقائي عن الأمراض أو الهياكل التشريحية وتحديد شدة المرض. أثناء تحقيق هذه الأهداف، فإنه يوفر أيضًا فوائد إضافية مثل منع الحالات التي قد يتم تجاهلها بسبب عدم خبرة الطبيب، والضغط، والتعب، وضمان التشخيص المبكر للأمراض، وتسجيل بيانات المرضى بشكل أكثر انتظامًا في البيئة الرقمية [6، 20].
هناك عدة دراسات لتقييم فقدان العظام ومشاكل اللثة باستخدام أنظمة الذكاء الاصطناعي [3، 6، 18، 25-30]. ومع ذلك، بقدر ما نعلم، لا توجد دراسة قائمة على الذكاء الاصطناعي تهدف إلى تحديد أنماط فقدان العظام حول الأسنان باستخدام طريقة التقسيم. كانت هذه الدراسة تهدف إلى فحص أداء نظام ذكاء اصطناعي قائم على شبكة عصبية تلافيفية (CNN) في الكشف عن مشاكل اللثة مثل فقدان العظام الأفقي، وفقدان العظام العمودي، وعيوب الفركشن على الأشعة السينية البانورامية باستخدام طريقة التقسيم.

الطرق

تصميم الدراسة

تم الحصول على جميع الصور من أرشيف الأشعة في كلية طب الأسنان بجامعة إسكيشهر أوسمان غازي لهذه الدراسة الاستعادية. تم الحصول على موافقة لجنة الأخلاقيات من لجنة الأخلاقيات للأبحاث السريرية غير التدخلية بجامعة إسكيشهر أوسمان غازي قبل بدء الدراسة (رقم القرار: 2019-227). تم اتباع إرشادات إعلان هلسنكي خلال جميع مراحل الدراسة.

اختيار البيانات

تم الحصول على جميع الصور المستخدمة في الدراسة بنفس جهاز الأشعة (Planmeca Promax 2D، Planmeca، هلسنكي، فنلندا) مع المعلمات التالية: ، و 13 ثانية. تم اختيار جميع الصور من صور الأفراد الذين تزيد أعمارهم عن 18 عامًا، دون الانتباه إلى اختلافات العمر والجنس. في الأشعة السينية، 2 مم قمي من الخط الوهمي الذي يمر عبر
تم قبول منطقة التقاء المينا بالأسمنت في الأسنان كمستوى صحي للأنسجة الداعمة [31-33]. تم اعتبار الحالات التي كانت قمة العظم السنخي لديها فوق هذه الخط الوهمي كمصابة بأنسجة داعمة صحية وتم استبعادها من الدراسة. تم إعادة تقييم صور حالات التهاب اللثة من أعمار وجنسيات مختلفة وفقًا للمعايير المذكورة أدناه: ‘1. الصور التي تحتوي على تشويش كثيف، 2. الصور ذات الجودة المنخفضة بسبب خطأ في وضعية المريض أو حركة المريض أثناء التصوير، 3. صور المرضى الذين تلقوا علاجًا جراحيًا للفكين، 4. صور المرضى الذين يعانون من اضطرابات في عملية الأيض العظمي، 5. صور المرضى الذين لديهم شكل غير عادي للعظم السنخي (أمراض عظمية بسبب حالات مثل الكيسات والأورام)، 6. صور المرضى الذين يعانون من شق الشفة والحنك، 7. الصور ذات الجودة الرديئة والصور الضبابية في منطقة العظم السنخي بسبب حالات مثل ازدحام الأسنان، 8. صور المرضى الذين لديهم ترميمات معدنية تسبب تشويشًا تعقيدًا في تشخيص التهاب اللثة’. تم استبعاد الصور التي تلبي هذه المعايير، والتي قد تجعل التشخيص صعبًا وتؤثر على توحيد الدراسة.

الحقيقة الأرضية

تم تحميل جميع البيانات التي كانت متوافقة مع معايير الإدراج في وحدة تصنيف CranioCatch (CranioCatch، إسكي شهير، تركيا) بطريقة مجهولة. في البداية، تم تحليل توافق المراقب الداخلي والمراقب الخارجي لأربعة مراقبين (3 أطباء أسنان مختصين في أمراض اللثة: ، و 1 أخصائي أشعة فموية وجهية: İŞB) الذي خطط لتنفيذ التسمية لضمان توحيد التسمية. لتقييم المراقب الداخلي، قام المراقبون بتسمية جميع المعايير التي سيتم تقييمها في هذه الدراسة وفقًا للمعايير أدناه على 10 أشعة سينية باستخدام طريقة التقسيم. كرر كل مراقب هذه العملية بعد أسبوع واحد. تم استخدام برنامج كمبيوتر (نسخة بايثون 3.6.1، مؤسسة برمجيات بايثون) ومكتبة NumPy، وتم إجراء دمج الحقول المقسمة وحساب قيم تقاطع على الاتحاد (IoU). عندما تقرر أن هناك تجميعًا داخليًا وخارجيًا للمراقبين للتسمية، تم تقييم جميع البيانات من قبل نفس المراقبين وفقًا لنفس المعايير، وتم الانتهاء من تسمية المعايير ذات الصلة.
المعايير التي تم أخذها بعين الاعتبار خلال مرحلة التسمية كانت:
لفقدان العظم السنخي الكلي: كانت وحدة هذا المعامل هي الفك (الفك العلوي والسفلي). تم إجراء عمليتي تقسيم منفصلتين للفك العلوي والسفلي في جميع الأشعة السينية البانورامية. أثناء إجراء عملية التقسيم، تم تضمين أجزاء جذور الأسنان التي لا تحتوي على دعم عظمي والمناطق بين الأسنان التي تلي هذه المناطق في منطقة التسمية. في البداية، تم إنشاء خط تقسيم من المينا إلى العاج.
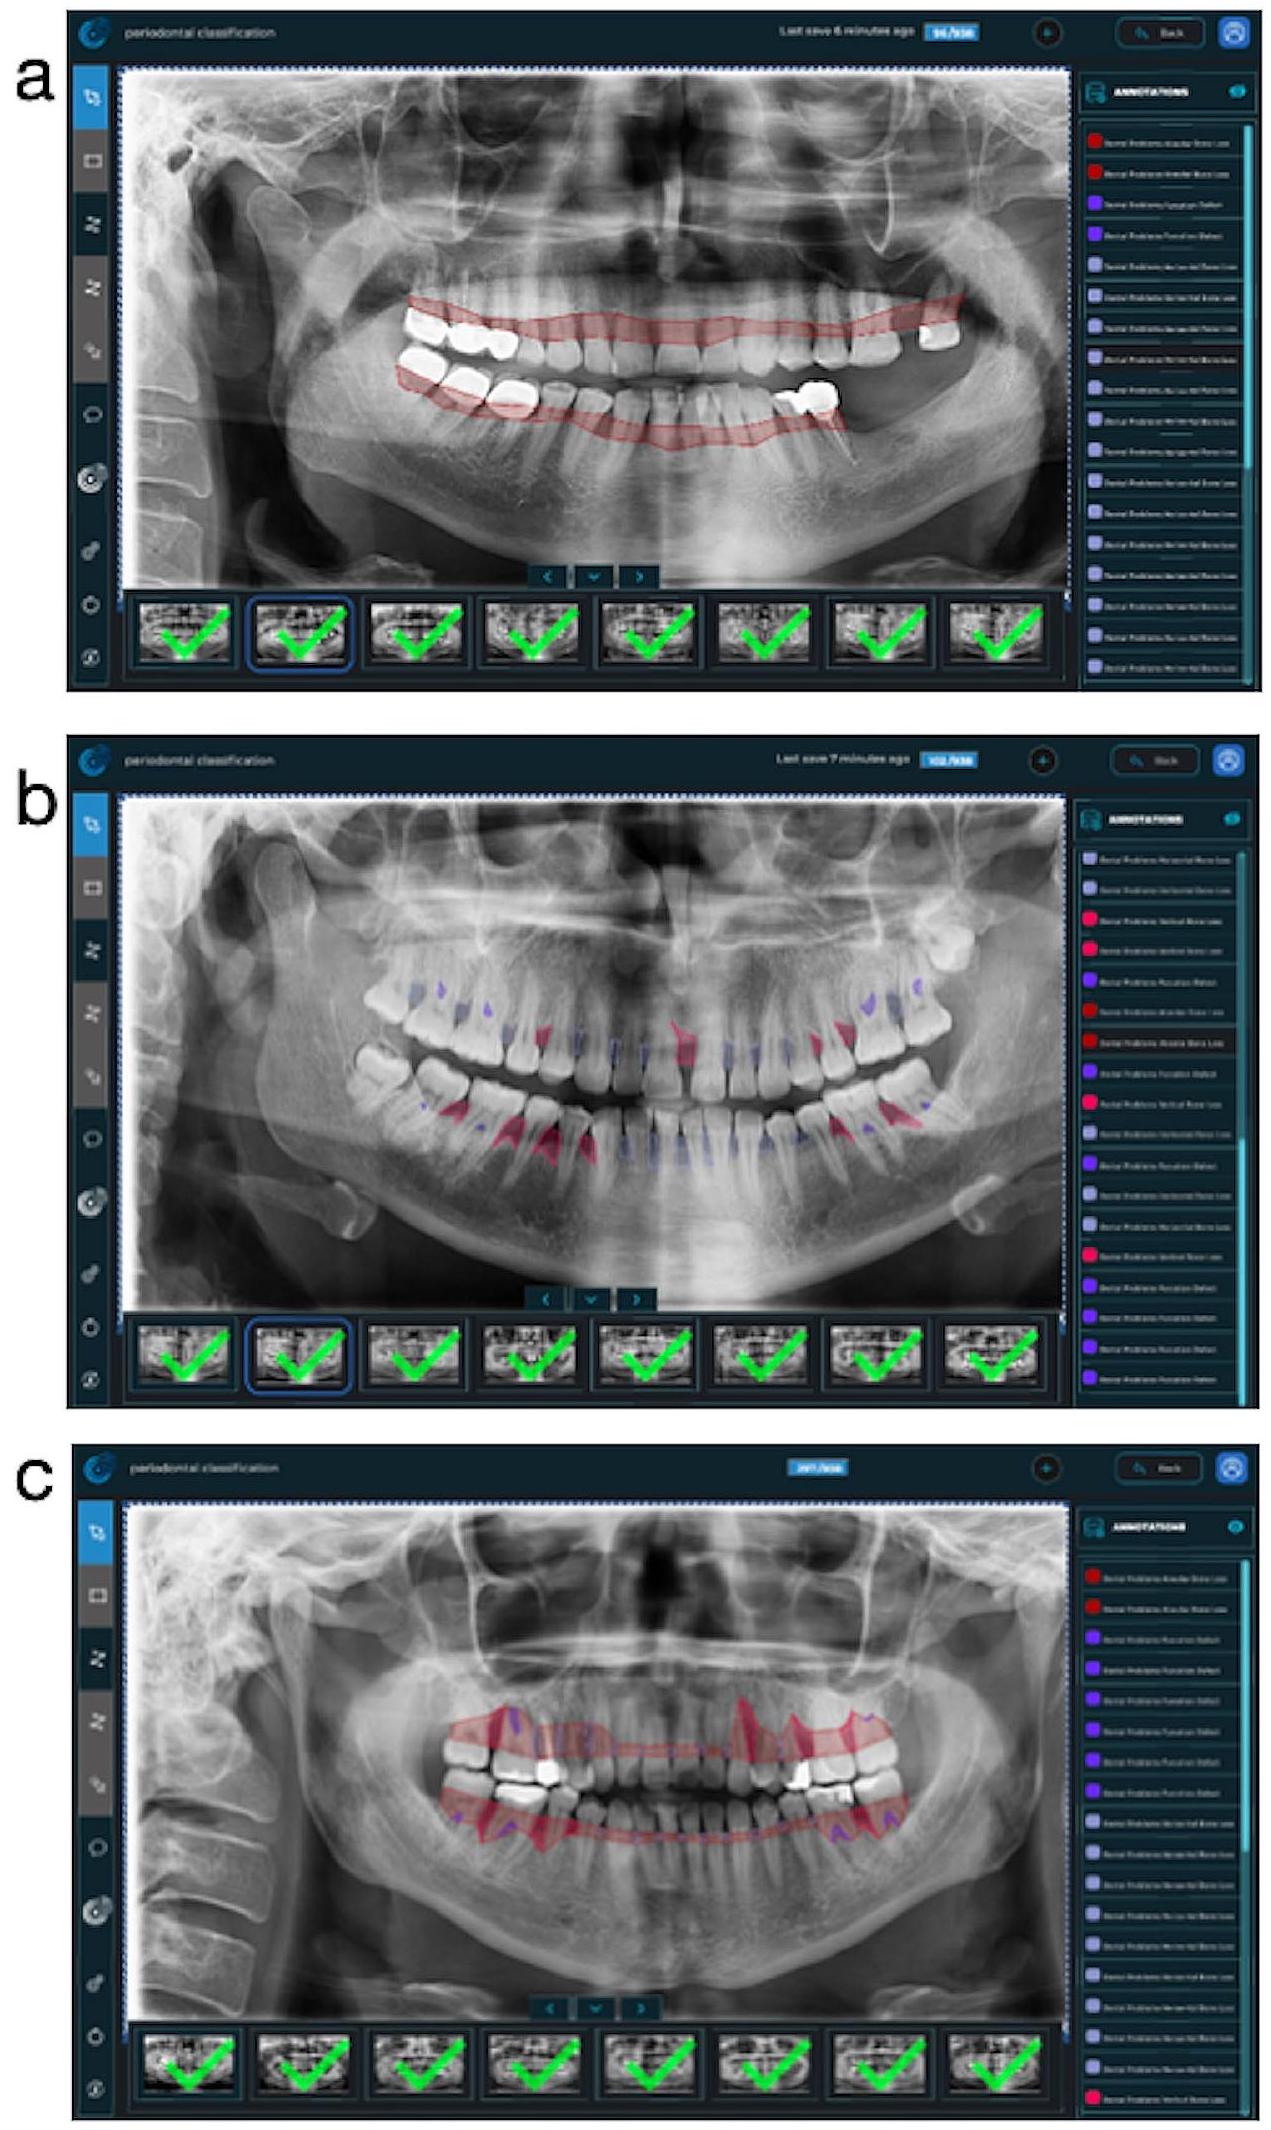
تقاطع جميع الأسنان. بعد ذلك، تم دمج خط التقسيم ليتبع الخط على الأسطح البعيدة لأبعد الأسنان وحدود قمة العظام في الفك المعني. في الشكل 1-أ، تم تقديم صورة مثال لفهم أفضل للطريق المتبع عند وضع علامة على هذه المعلمة. (الشكل 1-أ)
في المرحلة التالية، تم تقييم المناطق بين الأسنان واحدة تلو الأخرى. تم إجراء عملية تصنيف منفصلة لهذه المناطق، مع الأخذ في الاعتبار أنماط فقدان العظام (في شكل فقدان العظام الأفقي والرأسي) (الشكل 1ب). كانت وحدات هذه المعايير هي المنطقة بين الأسنان.
بالنسبة لفقدان العظام الأفقي: تم تصنيف المناطق بين الأسنان حيث كانت الخطوط الخيالية المارة عبر نقاط التقاء المينا والعاج لأسنان مجاورة وقمة العظم السنخي متوازية مع بعضها البعض، وحيث كان مستوى العظم السنخي في وضع أكثر عمقًا مما ينبغي في اللثة الصحية، بعلامة فقدان العظام الأفقي [12-14]. خلال عملية التقسيم، تم تتبع نقاط التقاء المينا والعاج لأسنان مجاورة، وأبعد حد للسن القريب، وخط قمة العظم في المنطقة بين الأسنان المعنية، وأبعد حد للسن البعيد، وتم دمج المناطق المرجعية المحددة في شكل منحنى مغلق. عند الانتهاء من العلامات المعنية، كانت جميع مناطق التقسيم تشبه الأشكال الهندسية مثل المربعات والمستطيلات والمعينات (الشكل 1-b).
لفقدان العظام العمودي: تم إنشاء خطين خياليين من نقاط التقاء المينا والجذر لأسنان مجاورة وخط قمة العظم السنخي. تم وضع علامات على المناطق بين الأسنان حيث تكون هذان الخطان في زاوية مع بعضهما البعض بعلامة تدمير العظام العمودية [12-14]. عند الانتهاء، أظهرت العلامات هندسة مثلثية. لا تشمل الزوايا الطفيفة للحدبات بسبب التغيرات في محور السن في هذه العلامة. تم اتباع المعايير المحددة لفقدان العظام الأفقي عند إنشاء حدود العلامات (الشكل 1-b).
بالنسبة لعيوب التفرع: كانت وحدة هذا المعامل هي السن. تم فحص مناطق التفرع في الأسنان متعددة الجذور وتم وضع علامة على الصور الشفافة المتوافقة مع امتصاص العظام بعلامة عيب التفرع. أثناء عملية وضع العلامات، تم تتبع حدود الجذور للسن المعني وحدود المنطقة الشفافة التي شكلها الآفة واكتمالها لتشكيل منحنى مغلق (الشكل 1-b).
بعد الانتهاء من وضع العلامات، تم إعادة فحص مجموعة البيانات من قبل المراقبين. في هذه المرحلة، بدلاً من مراجعة حدود التقسيم، تم مراجعة شكل و هندسة امتصاص العظام في المنطقة المعلّمة بسرعة لتجنب أوجه القصور في التوحيد التي قد تنشأ في قرارات فقدان العظام الأفقي-الرأسي. بالإضافة إلى ذلك، تم التوصل إلى توافق في الحالات التي كان فيها أطباء الأسنان متعارضين بشأن وضع علامات على بعض الفروع الأولية.
الشكل 1 صور وحدة التسمية. (أ) تسمية إجمالي فقدان العظم السنخي لدى المريض؛ (ب) تسمية فقدان العظم بين الأسنان لدى المريض (الأحمر: عمودي، الأزرق: أفقي، الأرجواني: تقاطع العظام)؛ (ج) النسخة المسمّاة من جميع بيانات المريض
العيوب. أيضًا، التقييم النهائي الذي أجراه 4 أطباء أسنان معًا سمح بملاحظة وإكمال الملصقات المنسية والمُهملة قبل تدريب الذكاء الاصطناعي. تم إزالة الملصقات التي لم يكن هناك توافق بشأن التشخيص ولم تُستخدم في تدريب الخوارزمية ومقاييس النتائج.

تدريب النموذج

  1. خطوات المعالجة المسبقة: تم تغيير حجم جميع الصور إلى 
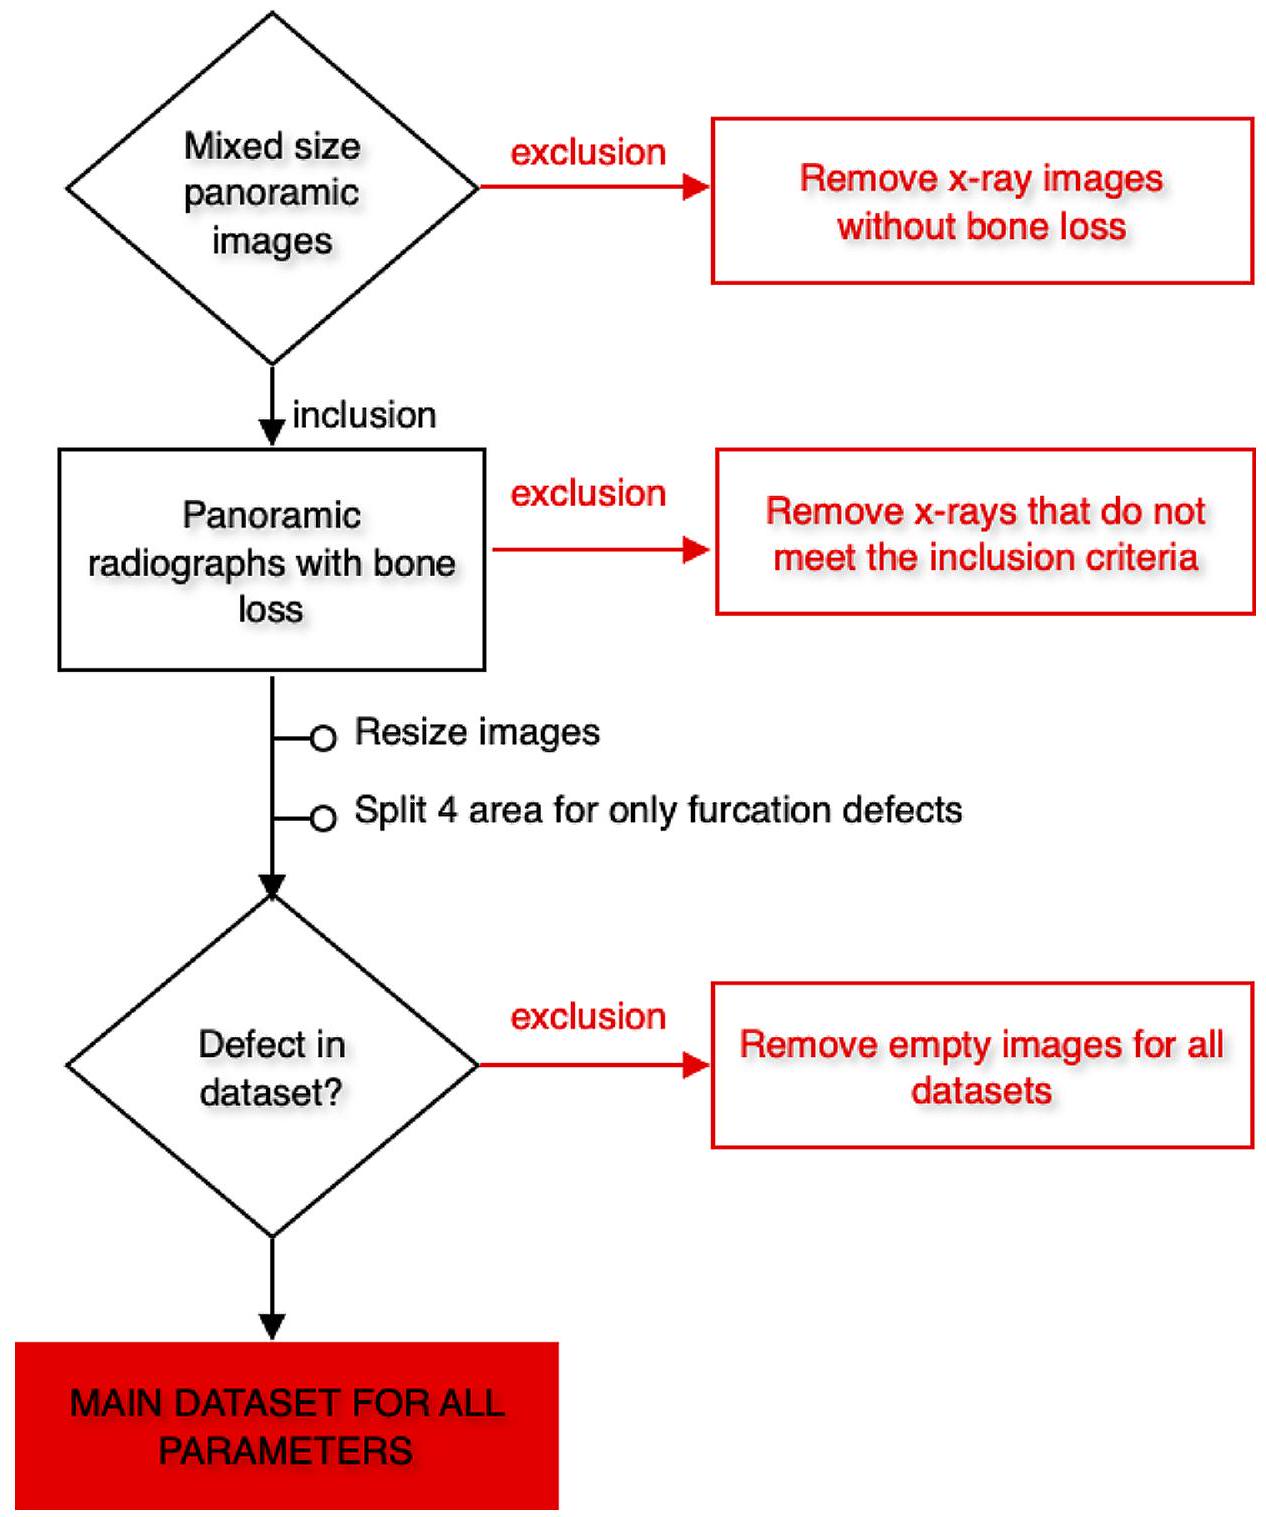
بكسلات. تم قص الأشعة السينية البانورامية التي ستستخدم في مجموعات البيانات التي تم إنشاؤها لتطوير نموذج عيب الفركشن إلى 4 (الفك السفلي الأيسر، الفك السفلي الأيمن، الفك العلوي الأيسر، والفك العلوي الأيمن). نظرًا لأن عيوب الفركشن كانت مرئية فقط في الأضراس متعددة الجذور، كان الهدف هو التركيز أكثر على المناطق ذات الصلة بهذه الطريقة. لم يتم استخدام الأشعة السينية في نماذج المعلمات الأخرى.
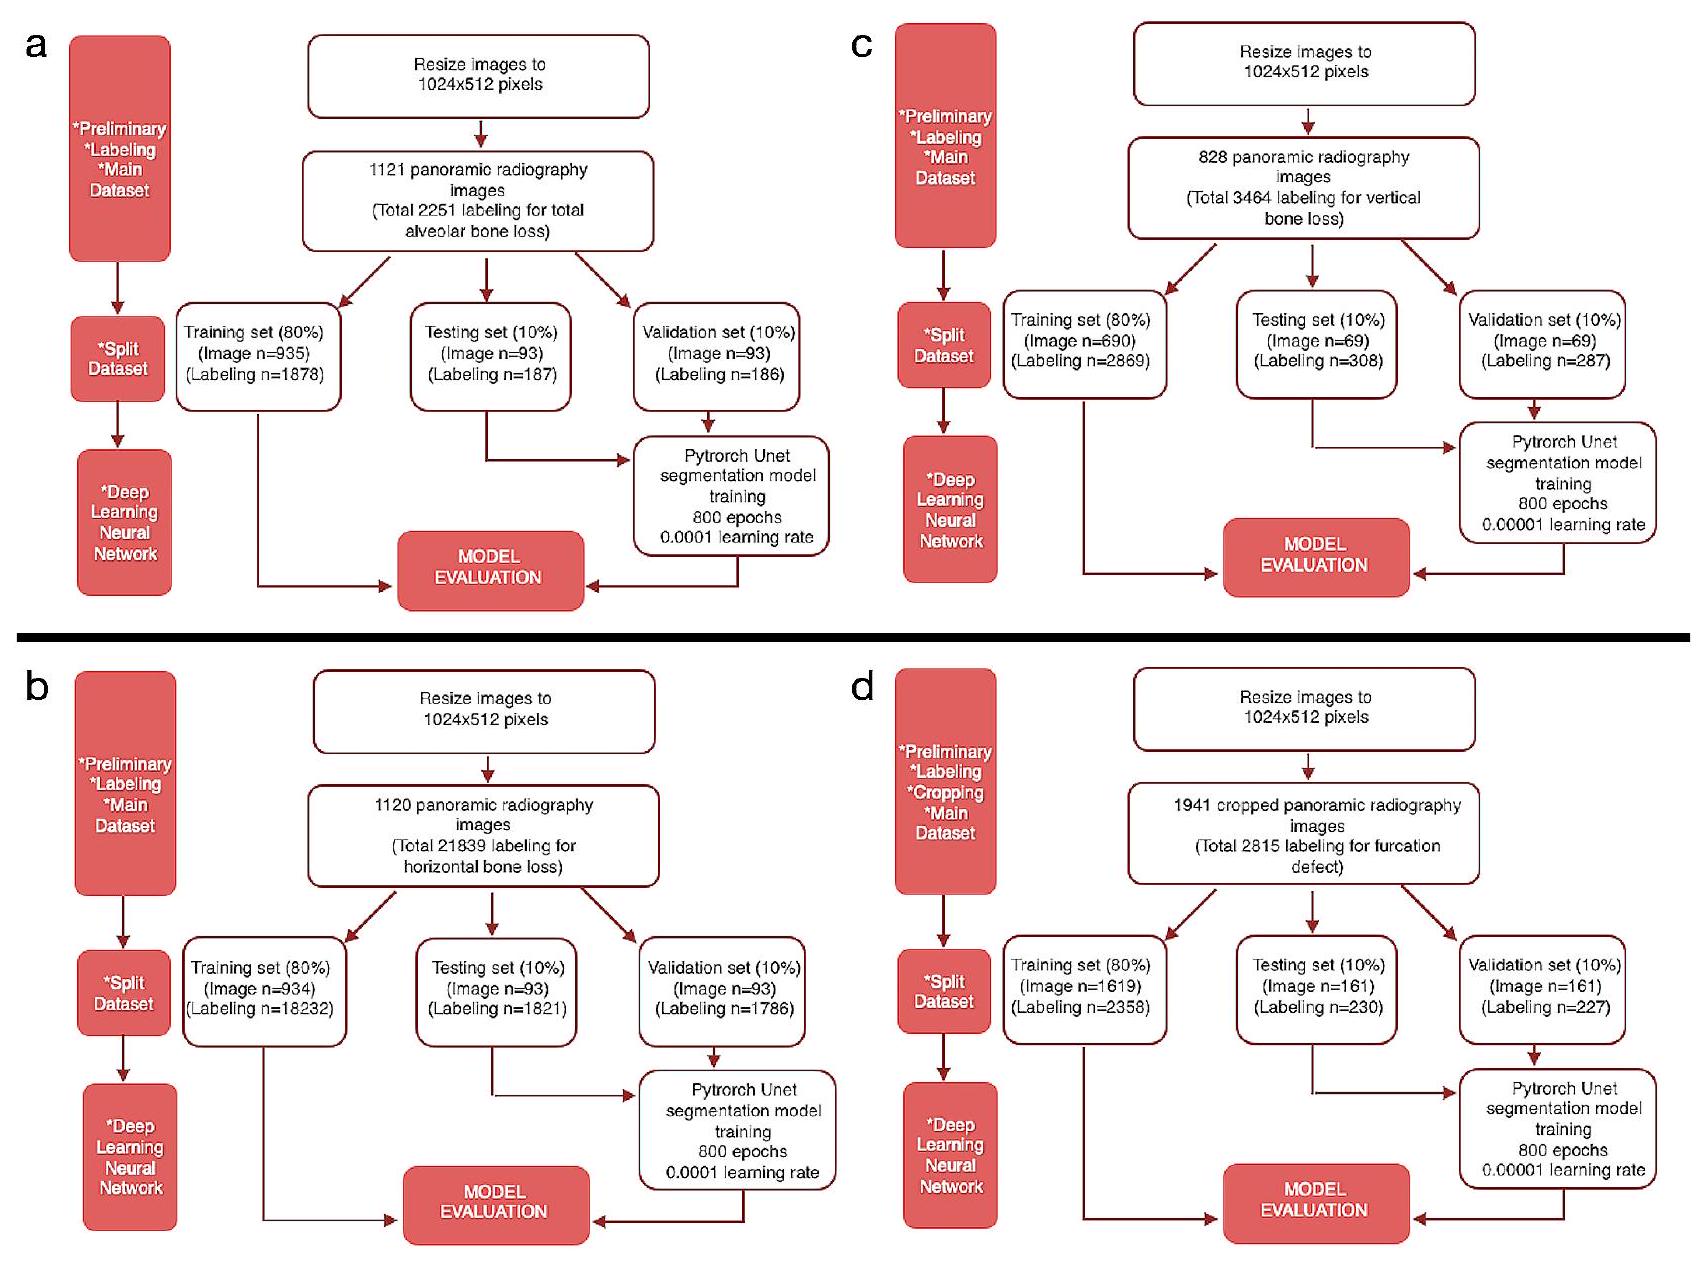
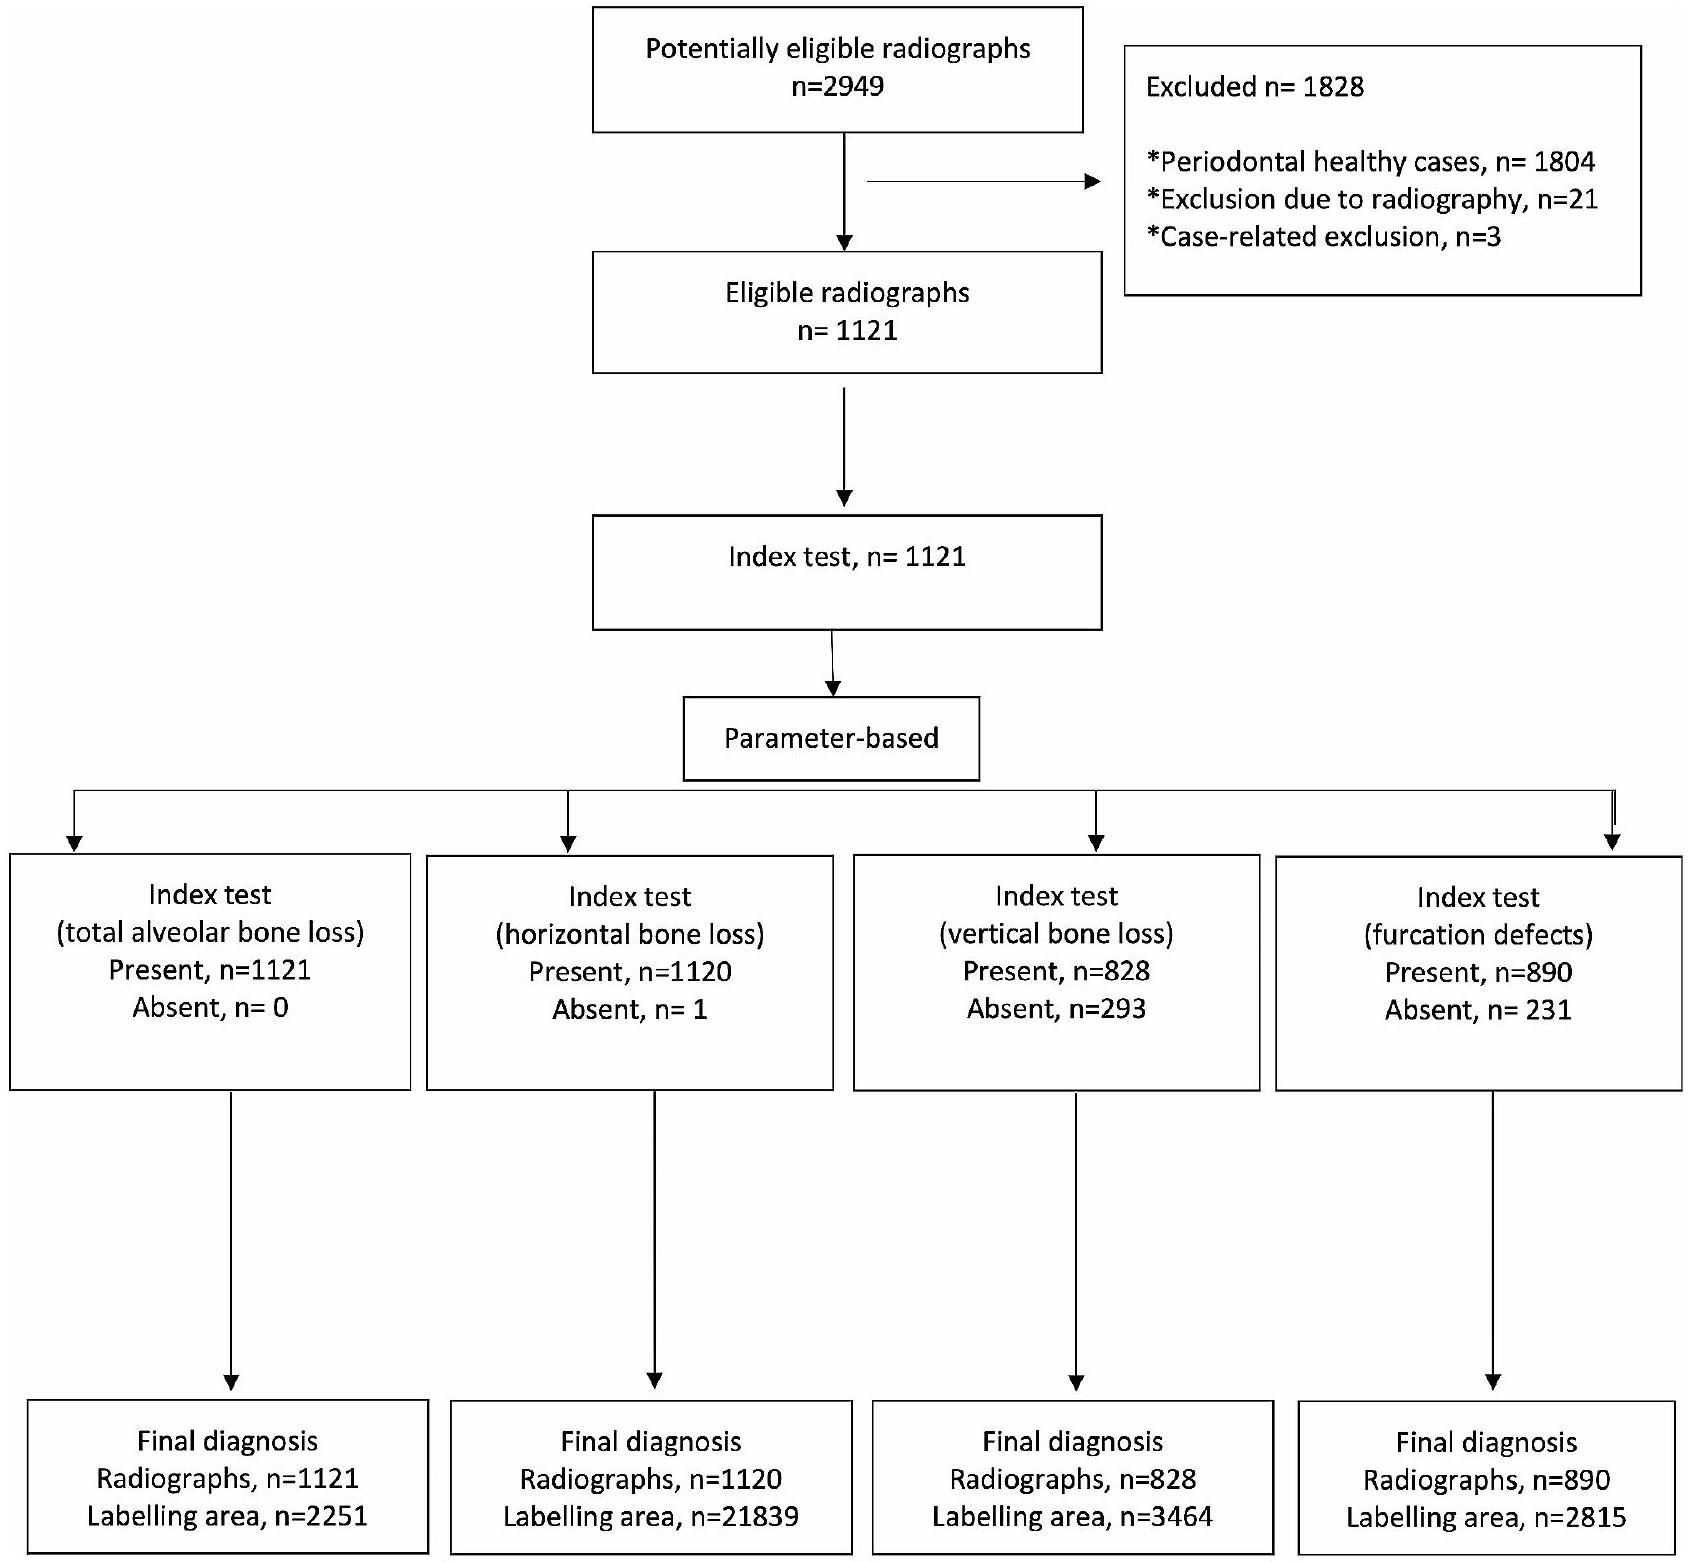
    تم اقتصاصها ولكن استخدامها ككل. تم استبعاد الصور التي لا تحتوي على تسمية المعامل ذات الصلة من مجموعات البيانات الرئيسية لذلك المعامل (الأشكال 2 و 3). وفقًا لهذه المعايير، تم تضمين 1121 صورة شعاعية بانورامية لفقدان العظام السنخية الكلي، و1120 صورة شعاعية بانورامية لفقدان العظام الأفقي، و828 صورة شعاعية بانورامية لفقدان العظام العمودي، و1941 صورة شعاعية بانورامية مقصوصة (890 صورة شعاعية بانورامية) لعيوب الفركشن في مجموعات البيانات الرئيسية (الجدول 1؛ الشكل 3).
  2. بيانات التدريب والتحقق والاختبار: تم إنشاء المجموعات الرئيسية من خلال دمج جميع الأشعة السينية البانورامية التي تحتوي على تسميات المعلمات ذات الصلة لكل معلمة. ثم تم تقسيم هذه المجموعات الرئيسية إلى مجموعة تدريب ( )، مجموعة التحقق ( ) ومجموعة الاختبار ( عشوائيًا لتطوير أنظمة الذكاء الاصطناعي (الجدول 1).
الشكل 2 سير العمل الذي يوضح تطبيق معايير الشمول والاستبعاد
الشكل 3 مراحل إنشاء مجموعات البيانات التي ستستخدم في تطوير نماذج الذكاء الاصطناعي لجميع المعايير. (أ) فقدان العظم السنخي الكلي؛ (ب) فقدان العظم الأفقي؛ (ج) فقدان العظم العمودي؛ (د) عيب الفركشن.
الجدول 1 البيانات الرقمية حول تطوير خوارزميات التعلم العميق
اسم الطراز عدد صور التدريب عدد تسميات التدريب عدد صور التحقق عدد تسميات التحقق عدد صور الاختبار عدد تسميات الاختبار عصر معدل التعلم نموذج
فقدان العظم السنخي الكلي 935 1878 93 186 93 187 ٨٠٠ 0.0001 يو-نت
فقدان العظام الأفقي 934 18,232 93 1786 93 1821 ٨٠٠ 0.0001 يو-نت
فقدان العظام العمودي ٦٩٠ 2869 69 287 69 308 800 0.00001 U-Net
عيب الفركيشن 1619 2358 161 227 161 230 800 0.00001 U-Net
مجموعة التدريب: 935 صورة (1878 تسمية) لفقدان العظم السنخي الكلي، 934 صورة (18232 تسمية) لفقدان العظم الأفقي، 690 صورة (2869 تسمية) لفقدان العظم العمودي، و1619 صورة مقصوصة (2358 تسمية) لعيب الفركيشن تم استخدامها كبيانات تدريب.
مجموعة التحقق: 93 صورة (186 تسمية) لفقدان العظم السنخي الكلي، 93 صورة (1786 تسمية) لفقدان العظم الأفقي، 69 صورة (287 تسمية) لفقدان العظم العمودي، و161 صورة مقصوصة (227 تسمية) لعيب الفركيشن تم استخدامها كبيانات تحقق.
مجموعة الاختبار: 93 صورة (187 تسمية) لفقدان العظم السنخي الكلي، 93 صورة (1821 تسمية) لفقدان العظم الأفقي، 69 صورة (308 تسمية) لفقدان العظم العمودي، و161
صورة مقصوصة (230 تسمية) لعيب الفركيشن تم استخدامها كبيانات اختبار.
تم استخدام التسميات في مجموعة التدريب لإنشاء خوارزمية نموذج الذكاء الاصطناعي. تم اختبار هذا النموذج مع البيانات في مجموعة التحقق لضبط الخوارزمية والتساؤل حول الحاجة إلى مزيد من التدريب. النسخة النهائية من الخوارزمية، التي تم تطويرها باستخدام مجموعة التدريب وتم إجراء تجارب ناجحة مع التسميات في مجموعة التحقق، تم استخدامها في اكتشاف تدمير العظم اللثوي والنمط على الأشعة السينية في مجموعة الاختبار. تم مقارنة النتائج التشخيصية للنظام في مجموعة الاختبار مع تسميات المراقب في هذه المجموعة بواسطة أمر كمبيوتر،
وتم تقديم مقاييس النجاح للنظام. باختصار، أثناء تحديد النجاح النهائي للنموذج، تم قبول تشخيصات المراقب في مجموعة اختبار البيانات كمعيار ذهبي وتم استخدام هذه التسميات كبيانات الحقيقة الأساسية. (الشكل 3). تم تنفيذ هذه الخطوات بشكل منفصل لكل معلمة.
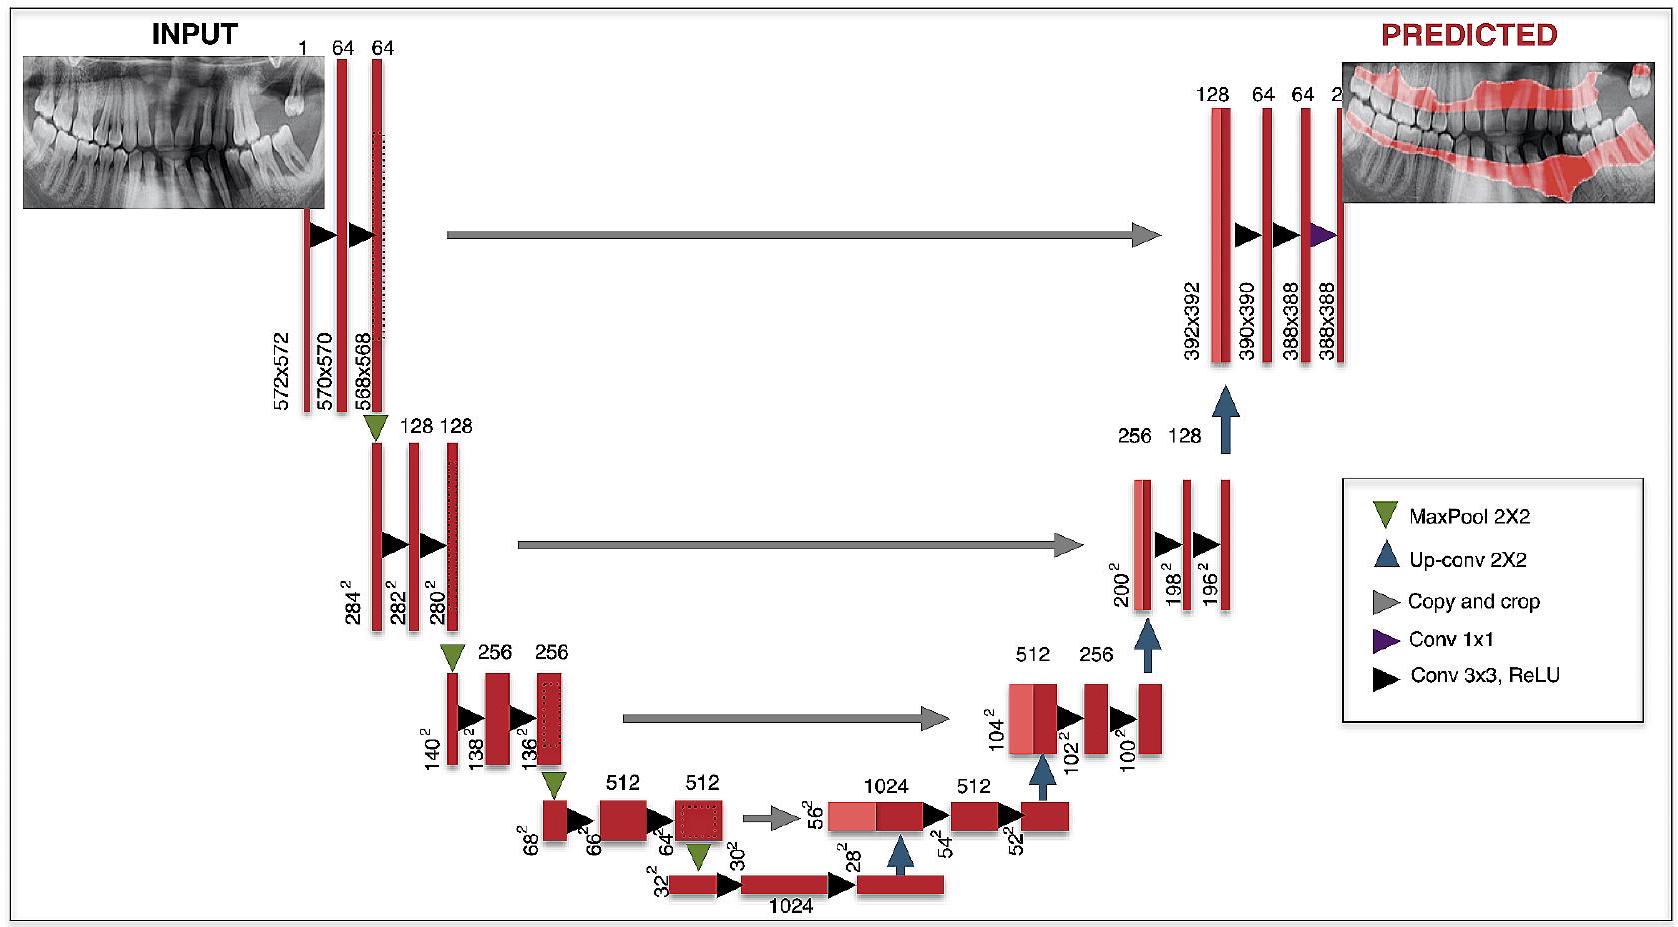
3. وصف بنية CNN: تم استخدام بنية U-Net لأداء التعلم العميق (الجدول 1) [24، 34]. U-Net هو نوع من CNN يمكنه أداء مهام تقسيم دلالي على صور مختلفة مثل صور الأشعة السينية. تحتوي U-Net على أربعة مستويات كتلة مع , و256 مرشح تلافيفي في كل كتلة. آلية عمل هذه البنية هي تحويل الصور إلى متجهات لتصنيفات البكسل ثم تحويل هذه المتجهات مرة أخرى إلى صور للتقسيم. يتم استخدام مسارات الترميز وفك الترميز بالترتيب وأداء تدريب النموذج. هناك طبقة تجمع قصوى في مسارات الترميز وطبقات تلافيفية صاعدة في مسارات فك الترميز. للدراسة الحالية، تم اتباع خطوات بنية U-Net وتم تقديم آلية العمل بالتفصيل في الشكل 4 [24، 34].
4. طريقة التدريب: تم استخدام مكتبة PyTorch (الإصدار 3.6.1؛ مؤسسة برمجيات بايثون، ويلمنجتون، ديلاوير، الولايات المتحدة الأمريكية) ومُحسِّن تقدير الزخم التكيفي (ADAM) (لتحديث معدل التعلم لكل معلمة) في مراحل تطوير النموذج. تم إجراء جميع التدريب باستخدام كمبيوتر مزود بذاكرة وصول عشوائي سعة 16 جيجابايت وبطاقة رسومات NVIDIA GeForce GTX 1660 TI. تم استخدام بنية U-Net
في تدريب جميع المعلمات وتم تدريبها جميعًا على 800 دورة. تم إجراء تدريب فقدان العظم السنخي الكلي وفقدان العظم الأفقي بمعدل تعلم قدره 0.0001، وتم إجراء تدريب فقدان العظم العمودي ومعلمات عيب الفركيشن بمعدل تعلم قدره 0.00001.

مقاييس التقييم

تم إجراء المرحلة الإحصائية من الدراسة باستخدام طريقة مصفوفة الارتباك وتحليل ROC. تم إنشاء نص برمجي لأداء هذه التقييمات تلقائيًا بمساعدة كمبيوتر. تم استخدام برنامج كمبيوتر (إصدار بايثون 3.6.1، مؤسسة برمجيات بايثون) ومكتبات OpenCV وNumPy لتطوير هذا النص البرمجي. النص البرمجي المستخدم في هذه المرحلة قبل التسميات التي قام بها أطباء الأسنان ذوو الخبرة في مجموعة الاختبار كمعيار ذهبي. قدم تلقائيًا مقياس نجاح من خلال مقارنة تشخيصات الخوارزمية في مجموعة البيانات ذات الصلة مع تشخيصات المراقبين. أثناء تشغيل النص البرمجي، قدم نتائج باستخدام بعض الحسابات أدناه.
تم حساب الحساسية والدقة ودرجات F1 باستخدام طريقة مصفوفة الارتباك [24]. في البداية، كانت هناك ثلاث حسابات مختلفة لطريقة مصفوفة الارتباك: عدد الإيجابيات الحقيقية (TP، كان هناك مشكلة لثوية وتم تقسيمها بشكل صحيح)، عدد الإيجابيات الكاذبة (FP، لم تكن هناك مشكلة لثوية ولكن تم اكتشافها بشكل خاطئ)، وعدد
الشكل 4 بنية U-Net ومراحل التعلم العميق. تم استخدام البلاط الأحمر لإظهار خريطة الميزات متعددة القنوات وتم استخدام البلاط الفاتح لخريطة الميزات المنسوخة. تمثل الأسهم الملونة المختلفة عمليات مختلفة في البنية [34]
السلبيات الكاذبة (FN، كان هناك مشكلة لثوية ولكن لم يتم اكتشافها). ثم، تم تحديد الحساسية والدقة ودرجات F1 مع الحسابات التالية:
الحساسية (الاسترجاع): TP/ (TP+FN).
الدقة: TP/ (TP+FP).
درجة F1: 2TP/ (2TP + FP + FN).
بالإضافة إلى طريقة مصفوفة الارتباك، تم أيضًا إجراء تحليل منحنى خصائص التشغيل المستقبلية (ROC) وتقييم الدقة-الاسترجاع لتوفير بيانات أكثر تفصيلًا. يتم حساب قيم المساحة تحت منحنى ROC (AUC) من خلال هذا التحليل. ROC هو منحنى احتمالي وتمثل المساحة تحته، AUC، درجة أو مقياس للفصل. مع زيادة المساحة تحت المنحنى، تزداد أداء التمييز بين الفئات. من المعروف أنه مع زيادة نجاح النظام، ينمو AUC ويقترب من القيمة 1. بناءً على هذه المعلومات، تم إجراء تفسيرات وتم تقديم النتائج. بالإضافة إلى ذلك، تمت مراجعة التسميات ونتائج النظام للأشعة السينية في مجموعة بيانات الاختبار التي تم إجراء التقييمات عليها من قبل أطباء الأسنان ذوي الخبرة لكل معلمة.

النتائج

بيانات الدراسة

تم فحص ما مجموعه 2949 صورة أشعة سينية في الدراسة. تم استبعاد 1804 منها من الدراسة لأنها لم تكن حالات التهاب دواعم الأسنان. بالإضافة إلى ذلك، تم استبعاد 24 من الصور المتبقية من الدراسة لأسباب تتعلق بالأشعة السينية ( ) وأسباب قائمة على الحالة ( ). اتفق المراقبون على تشخيص التهاب دواعم الأسنان لـ 1121 صورة أشعة بانورامية. احتوت هذه الأشعة السينية على ما مجموعه 30369 تسمية كـ 2251 فقدان عظم سنخي كلي، 25303 فقدان عظم بين الأسنان (21839 فقدان عظم أفقي، 3464 فقدان عظم عمودي)، و2815 عيب فركيشن إجمالي (الشكل 5). أشار العدد الإجمالي للتسميات المقدمة لكل معلمة إلى وجود مرض متعلق بالمعلمة ذات الصلة (فقدان العظام أو عيوب الفركيشن). إذا لم يكن المرض المعني موجودًا، لم تكن هناك تسمية متاحة في المنطقة ذات الصلة.

اتفاقيات بين المراقبين

تم العثور على أن كل محقق أظهر اتساقًا عاليًا في التشخيص والتقسيم لهذه المعلمات في أوقات مختلفة (IoU>0.91). بالإضافة إلى ذلك، تم حساب قيم كابا لتقييم اتساق قرار المراقبين لفقدان العظام الأفقي والعمودي في المناطق بين الأسنان. أظهرت قيم كابا اتفاقًا ممتازًا عند مقارنة الوقتين في قرار خصائص فقدان العظام في كل محقق ( ). أيضًا، تم فحص مناطق التسمية لمراقبين مختلفين لتقييم اتفاقية بين المراقبين باستخدام مجموعة البيانات هذه. وُجدت قيم IoU التي تم الحصول عليها بين 0.8126 و0.8737. بينما كانت
النتائج 0.85 وما فوق لفقدان العظام الأفقي، وفقدان العظام السنخي الكلي، وعيب الفركيشن، كانت أقل لفقدان العظام العمودي (>0.81).

النتائج

بينما تقوم مصفوفة الارتباك بتقييم مصنف معين بحدود ثابتة، فإن AUC يقيم ذلك المصنف عبر جميع الحدود الممكنة. لذلك، تم اعتبار AUC كالناتج الأساسي. كانت قيم AUC 0.951 لفقدان العظام السنخي الكلي، 0.910 لفقدان العظام الأفقي، 0.733 لفقدان العظام العمودي، و0.868 لعيوب الفركيشن (الجدول 2). أظهر النموذج المطور أفضل النتائج عند تحديد فقدان العظام السنخي الكلي (AUC ). كانت أدنى نسبة نجاح للنموذج عند اكتشاف فقدان العظام العمودي (AUC=0.733).
تم حساب النتائج باستخدام طريقة مصفوفة الالتباس، التي توضح نجاح نموذج الذكاء الاصطناعي المطور، وتم تقديمها في الجدول 2. عند تقييم مقاييس الأداء التشخيصي، كانت قيم الحساسية، والدقة، ودرجة F1، والدقة، على التوالي، 1، 0.995، 0.997، 0.994 لفقدان العظم السنخي الكلي؛ 0.947، 0.939، 0.943، 0.892 لفقدان العظم الأفقي؛ 0.558، 0.846، 0.673، 0.506 لفقدان العظم العمودي و لعيوب الفركشن عند IoU. في الشكل 6، تم عرض صور الإدخال والإخراج للأشعة السينية لبعض المرضى في نظام الذكاء الاصطناعي كمثال.
أيضًا، تم تقديم تحليل منحنى ROC ونتائج الدقة والاسترجاع لجميع المعلمات اللثوية في الشكل 7.

الملاحظات

بالإضافة إلى ذلك، تمت مراجعة صور الإدخال والإخراج لكل حالة في مجموعة الاختبار من قبل المراقبين الذين قاموا بتصنيفها، وتم تحليل الحالات التي ارتكب فيها النظام المزيد من الأخطاء. عند فحص صور الإخراج لفقدان العظم السنخي الكلي، لوحظ أن نجاح النظام كان جيدًا جدًا، وكانت هناك أخطاء قليلة في اكتشاف بعض مناطق فقدان العظم الزاوي العميق، ومناطق الفركشن. عند فحص صور الإخراج لفقدان العظم الأفقي، تم تحليل أن النظام لم يتمكن من التشخيص في بعض الأشعة السينية في مناطق بين الأسنان الكبيرة الناتجة عن نقص الأسنان. لوحظ أن بعض فقدان العظم العمودي تم تحديده كفقدان عظم أفقي في مناطق ذات تداخل جزئي للهياكل التشريحية. كان الخطأ الأكثر شيوعًا الذي ارتكبه النظام في اكتشاف فقدان العظم العمودي هو إدراك زوايا العظم الضئيلة جدًا كفقدان عظم عمودي. حدد النظام بعض فقدان العظم في المناطق بين الأسنان للجذور القريبة من بعضها كعيوب فركشن. كان هناك خطأ آخر هو أن نموذج الذكاء الاصطناعي تجاهل وفشل في اكتشاف بعض عيوب الفركشن في المستوى الأول.
الشكل 5 معايير الإبلاغ عن دقة التشخيص (STARD) مخطط التدفق
الجدول 2 النتائج التي تم الحصول عليها باستخدام طريقة مصفوفة الالتباس وتحليل ROC
اسم النموذج تم العثور على صحيح لعتبة loU: 50% تم العثور على خطأ لعتبة loU: 50% لم يتم العثور عليه لعتبة loU: 50% الحساسية الدقة درجة F1 الدقة AUC
فقدان العظم السنخي الكلي 185 1 0 1 0.995 0.997 0.994 0.951
فقدان العظم الأفقي 108 7 6 0.947 0.939 0.943 0.892 0.910
فقدان العظم العمودي 115 21 91 0.558 0.846 0.673 0.506 0.733
عيب الفركشن 181 13 22 0.892 0.933 0.912 0.837 0.868

المناقشة

في السنوات الأخيرة، جذب استخدام أنظمة الذكاء الاصطناعي في الطب وطب الأسنان في تفسير الصور اهتمامًا كبيرًا وتغيرت أنظمة CNN هذه المجالات بسرعة [24]. ومع ذلك، لا يزال عدد الدراسات التي أجريت في مجال أمراض اللثة محدودًا. تهدف الدراسة الحالية
إلى تقييم الأشعة السينية البانورامية تلقائيًا بواسطة نظام ذكاء اصطناعي وتحديد نجاح النظام المعني في اكتشاف نتائج أمراض اللثة على الأشعة السينية. أظهرت نتائج هذه الدراسة أن أنظمة الذكاء الاصطناعي يمكن أن تكون آلية دعم قرار لأطباء الأسنان
الشكل 6 بيانات الإدخال والإخراج لبعض الأشعة السينية للمرضى. أ-ب. فقدان العظم السنخي الكلي؛ ج-د. فقدان العظم الأفقي؛ هـ. فقدان العظم العمودي، و: عيب الفركشن
الشكل 7 تحليل منحنى ROC ونتائج الدقة والاسترجاع لجميع المعلمات. (أ) فقدان العظم السنخي الكلي؛ (ب) فقدان العظم الأفقي؛ (ج) فقدان العظم العمودي؛ (د) عيب الفركشن
في تشخيص أمراض اللثة، واحدة من أكثر الأمراض شيوعًا في العالم.
يمكن استخدام هياكل مختلفة في الدراسات المعتمدة على الذكاء الاصطناعي. تعتبر بنية U-Net، وهي بنية ذكاء اصطناعي تعتمد على CNN، واحدة من تقنيات تقسيم الصور التي تمكن من تقييم الصور في المجال الطبي باستخدام أنظمة الذكاء الاصطناعي وتوفر تقييمًا أكثر دقة ونجاحًا مع مجموعات تدريب أقل [35، 36]. لذلك، في الدراسة الحالية، تم إجراء معالجة الصور باستخدام بنية U-Net.
في الأدبيات، كانت هناك العديد من الدراسات التي استخدمت خوارزميات الذكاء الاصطناعي في معالجة وتفسير بيانات المرضى، والتي لعبت دورًا في التشخيص وتخطيط العلاج، مثل الأشعة السينية للأسنان [20، 37-39]، وصور الفم الداخلية [40-43] وصور الأمراض [44]. بالإضافة إلى ذلك، تم استخدام هذه الأنظمة أيضًا في حالات مثل تقييم ما قبل الفحص وتقدير المخاطر [45]. كما لوحظ أن بعض الدراسات التي تهدف إلى تحديد أمراض اللثة من الأشعة السينية السنية ثنائية الأبعاد باستخدام أنظمة الذكاء الاصطناعي تم إجراؤها على الأشعة السينية البيرابيكالية [21، 28، 46] وبعضها على الأشعة السينية البانورامية [3، 6، 25، 29، 30].
في إحدى الدراسات في الأدبيات، استخدم لي وآخرون (2018) 1740 أشعة سينية بيرابيكالية وقاموا بتقييم نجاح التنبؤ لخوارزمية CNN التي طوروها. في نتائج هذه الدراسة، أفادوا أن دقة تحديد الأسنان الضاحكة المتضررة من أمراض اللثة كانت و لأسنان الطواحن [27]. مشابهة لهذه الدراسة، قام لي وآخرون (2021) بإجراء دراسة أخرى على 693 أشعة سينية بيرابيكالية [18]. في هذه الدراسة، كان الهدف هو العثور على فقدان العظم الشعاعي من خلال تصنيفه وفقًا لشدة التدمير (المراحل I-II-III) [18] تم العثور على معدلات نجاح عالية في اكتشاف أمراض اللثة في نتائج هاتين الدراستين.
من ناحية أخرى، حاول خان وآخرون (2021) العثور على مشاكل الأسنان مثل التسوس، وفقدان العظم، وعيوب الفركشن على 206 صور بيرابيكالية باستخدام هياكل ذكاء اصطناعي مختلفة (U-Net، X Net، وSeg Net) في دراستهم [28]. على الرغم من أن هذه الدراسة كانت مشابهة لدراستنا من حيث استخدام طريقة التقسيم في اكتشاف فقدان العظم اللثوي، لم يتم إجراء تقييم من حيث خصائص تدمير العظم (أفقي، عمودي) [28]. كان هناك اختلاف آخر هو أن خان وآخرون (2021) أجروا دراساتهم على الأشعة السينية البيرابيكالية ومع بيانات أقل [28]. على الرغم من أن التقييمات تمت على أنواع مختلفة من الأشعة السينية، يمكن القول إن معدلات النجاح لدراستنا كانت أعلى. نعتقد أن سبب معدلات النجاح الأعلى لنظام الذكاء الاصطناعي المطور في دراستنا قد يكون بسبب استخدام مجموعة بيانات أكبر. لأنه كلما زاد عدد البيانات المستخدمة للتدريب في دراسات الذكاء الاصطناعي، تزداد معدلات نجاح النموذج أيضًا [47].
في دراسة أخرى، استخدم كورت بايرقدار وآخرون (2021) بنية Google Net Inception v3 على مجموعة بيانات كبيرة
(2276 أشعة سينية بانورامية). قاموا بتقييم نجاح أنظمة الذكاء الاصطناعي التي طوروها في تحديد الأشعة السينية لحالات التهاب اللثة [6]. في هذه الدراسة، تم استخدام 1137 أشعة سينية لمرضى يعانون من فقدان العظم وأشعة سينية بانورامية لـ 1139 فردًا صحيًا لأسنان اللثة لتطوير نموذج الذكاء الاصطناعي. تم العثور على درجة F1 والدقة مرتفعة كما كانت في هذه الدراسة [6]. ومع ذلك، لم يتم إجراء أي تصنيف، وتم استخدام طريقة التصنيف فقط لتدريب الأشعة السينية في شكل مريض/صحي والعثور عليها بواسطة النظام. من هذه الناحية، تختلف كثيرًا عن دراستنا من حيث تخطيط هذه الدراسة. بناءً على هذه المعلومات، يمكن القول إن تقنية التقسيم التي استخدمناها في دراستنا هي الطريقة الأكثر فائدة وتوفر للطبيب معلومات أكثر تفصيلًا للتشخيص وتخطيط العلاج.
كانت هناك أيضًا دراسات في الأدبيات تقارن تشخيص أطباء الأسنان ذوي الخبرات المختلفة وتوقعات نموذج الذكاء الاصطناعي. النتائج التي تم الحصول عليها بهذه الطريقة لا شك أنها أكثر قابلية للتفسير وتظهر نجاح النظام بشكل أكثر وضوحًا. على سبيل المثال، قارن كرويس وآخرون (2019) تقييم 6 أطباء أسنان ونتائج الذكاء الاصطناعي في دراسة أشعة سينية بانورامية باستخدام تقنية CNN. أفادوا بمعدلات الدقة، والخصوصية، والحساسية للنظام كـ في نتائج دراستهم [25]. نظرًا لأن هذه الدراسة تتعامل مع تقييم العديد من أطباء الأسنان، كانت دراسة أكثر شمولاً وتفوقًا من حيث التخطيط. ومع ذلك، في دراسة كرويس وآخرون (2019)، لم يتم تصنيف أنماط فقدان العظم اللثوي كأفقي أو عمودي.
في دراسة مخططة بشكل مشابه، قام كيم وآخرون (2020) بمقارنة تقييمات 5 أطباء مختلفين مع أداء الذكاء الاصطناعي في دراستهم لتحديد مواقع امتصاص العظام باستخدام 12179 صورة شعاعية بانورامية [29]. وقد أفادوا أنه بينما كانت متوسط درجات F1 لنتائج الأطباء في تحديد فقدان العظام كانت ، أظهرت الذكاء الاصطناعي نجاحًا أعلى وكان معدل F1 تكشف هذه الدراسة عن نجاح أنظمة الذكاء الاصطناعي في تفسير الأشعة السينية وتظهر وعدًا للاستخدام المستقبلي لهذه الأنظمة [29]. أيضًا، حاول تشانغ وآخرون (2020) إجراء تحديد لفقدان العظام من الأشعة السينية البانورامية دون أي تقييم لزاوية تدمير العظام ونوع العيب [3]. في هذه الدراسة، تم محاولة تصنيف المراحل وفقًا لتصنيف التهاب اللثة لعام 2017 من خلال حساب كمية تدمير العظام وتدميرها [3].
أخيرًا، حاول جيانغ وآخرون (2022) الكشف عن تدمير العظام اللثوية في دراستهم باستخدام نموذج الشبكة العصبية التلافيفية (CNN) باستخدام 640 صورة شعاعية بانورامية. هذه الدراسة هي الأكثر تشابهًا مع دراستنا في الأدبيات [30] لأن جيانغ وآخرون (2022) حددوا أيضًا أنماط فقدان العظام الناتجة عن مرض اللثة في شكل عيوب عمودية/أفقية/تفريغ في دراستهم [30]. على الرغم من أنها كانت مشابهة لدراستنا في هذا الصدد، إلا أن طريقة الكشف عن الأجسام
تم استخدامه في هذه الدراسة للتصنيف. طريقة التقسيم التي نستخدمها هي طريقة أكثر فائدة بكثير لأنها تحدد المنطقة المعيبة مع حدودها. لأنها توفر معلومات أكثر تفصيلاً لطبيب الأسنان لتحديد شدة المرض ولتخطيط العلاج في العملية التالية. بالإضافة إلى ذلك، في هذه الطريقة، تتم معالجة منطقة العيب مثل خريطة مفصلة وتوفر دعمًا تشخيصيًا أكثر تقدمًا بصريًا. من ناحية أخرى، عند مقارنة دراستين بالتفصيل، لوحظ أنهما استخدمتا عدة مراقبين، واثنين من الهياكل المعمارية المختلفة للذكاء الاصطناعي (U-Net و Yolo-v4)، وشملتا شدة المرض في تقييمهما.
أحد قيود الدراسة كان أن قرار المراقبين المتعددين لم يُقارن بشكل منفصل مع توقعات الذكاء الاصطناعي. قيد آخر هو أنه لم يتم إجراء أي قياسات لتحديد شدة المرض في الدراسة، وكانت تهدف فقط إلى اكتشاف فقدان العظام. كان من الممكن إجراء أبحاث أكثر شمولاً باستخدام الأشعة السينية البانورامية المعايرة، بناءً على القياس المباشر، أو لتحديد نسبة الجذر المتأثر. ومع ذلك، يجب ملاحظة أنه في جميع تقنيات التصوير الشعاعي ثنائي الأبعاد، فإن تقييم الفجوات العظمية، واللامينا دورا، ومستوى العظام اللثوية محدود بجغرافيا الإسقاط وتراكب الهياكل التشريحية المجاورة. بعبارة أخرى، لا توفر هذه الأشعة السينية معلومات واضحة وموثوقة للقياس وتخطيط العلاج. لهذا السبب، فإن إجراء دراسات تعتمد على الذكاء الاصطناعي باستخدام تقنيات التصوير الشعاعي ثلاثي الأبعاد مثل أنظمة التصوير المقطعي المحوسب باستخدام شعاع المخروط (CBCT) سيتجنب هذا القيد. بلا شك، مع زيادة عدد الدراسات في هذا المجال، سيتم تطوير خوارزميات الذكاء الاصطناعي ذات القدرة الأقوى على دعم القرار وتوفير معلومات أكثر تفصيلاً. على الرغم من القيود، فإن دراستنا واعدة لمثل هذه الدراسات التي ستجرى في المستقبل. بالإضافة إلى ذلك، كانت أداء نموذج الذكاء الاصطناعي في تحديد فقدان العظام العمودي في دراستنا أقل من معايير اللثة الأخرى. من المعروف أن فقدان العظام العمودي أقل شيوعًا من فقدان العظام الأفقي، وبالتالي، كان عدد التسميات لفقدان العظام العمودي أكثر محدودية في دراستنا. نعتقد أن عدد التسميات المستخدمة في اكتشاف فقدان العظام العمودي باستخدام الذكاء الاصطناعي في دراستنا كان أقل، وهذه الحالة تسببت في انخفاض أداء النموذج. لأن الشيء الأكثر أهمية في نجاح دراسات الذكاء الاصطناعي هو العمل مع مجموعات بيانات كبيرة. يمكن التغلب على هذا القيد، وإن كان إلى حد محدود، من خلال استخدام هياكل ذكاء اصطناعي مختلفة وإجراء خطط تقنية مختلفة. على سبيل المثال، في دراستنا، يمكن استخدام تقنيات التحقق المتبادل أثناء تطوير النموذج ويمكن إجراء تدريب متعدد الفئات. من ناحية أخرى، قد يكون السبب الأكثر أهمية لارتفاع معدلات النجاح المنخفضة لمعيار فقدان العظام العمودي هو الفهم غير المكتمل لـ
مخطط قمة العظم السنخي في العيوب ذات الجدران 1 و2 و3. نعتقد أن اتفاقيات المراقبين كانت أيضًا أقل بالنسبة لهذا المعامل بسبب هذه القيود، والتي قد تكون ناتجة عن الرؤية المحدودة للأشعة السينية البانورامية. يمكن القضاء على هذه الصعوبة التشخيصية من خلال استخدام بعض تقنيات الأشعة السينية التي توفر صورًا أكثر تفصيلًا في الدراسات المستقبلية.

الاستنتاجات

عند فحص الأدبيات، لوحظ أن استخدام أنظمة الذكاء الاصطناعي في الأشعة السينية السنية لتحديد حالة اللثة قد حقق نتائج ناجحة وواعدة للغاية. إلى أفضل معرفتنا، فإن الدراسة الحالية هي الدراسة الأولى التي تهدف إلى اكتشاف امتصاص العظام وأنماطه باستخدام خوارزميات التعلم العميق وطرق التقسيم. تلعب هذه الأنماط لفقدان العظام دورًا مهمًا في تخطيط علاج اللثة وتوقعات الأسنان. من هذا المنظور، تعتبر هذه الأنظمة مرشحة لتكون آلية دعم قرار لأطباء الأسنان في تفسير الأشعة السينية. سيساهم تطوير هذه الأنظمة مع المزيد من مجموعات البيانات في زيادة معدلات النجاح. هناك حاجة إلى مزيد من الدراسات الشاملة حول الأشعة السينية ثنائية وثلاثية الأبعاد في هذا الصدد.

الاختصارات

شبكة الأعصاب التلافيفية CNN
الذكاء الاصطناعي
2D ثنائي الأبعاد
تقاطع الاتحاد
تقدير اللحظة التكيفية ADAM
TP أعداد الإيجابيات الحقيقية
أرقام الإيجابيات الكاذبة
أرقام FN للنتائج السلبية الكاذبة
ROC منحنى خصائص التشغيل المستقبلية
مساحة تحت منحنى ROC
ثلاثي الأبعاد
أنظمة التصوير المقطعي المحوسب باستخدام شعاع مخروط
معايير ستارد للإبلاغ عن التشخيص

شكر وتقدير

تم دعم هذه الدراسة من قبل وحدة تنسيق مشاريع البحث العلمي بجامعة إسكي شهير عثمان غازي تحت رقم المشروع 202045E06.

مساهمات المؤلفين

لقد قدم جميع المؤلفين مساهمات كبيرة في تصور وتصميم الدراسة. شارك SKB وISB وMBY وNS في جمع البيانات، بينما شارك ÖÇ في تحليل البيانات. شارك SKB وISB وMBY وNS وOK وBCUS وRJ في تفسير البيانات وصياغة المخطوطة. شارك SKB وISB وBK وKO في مراجعتها بشكل نقدي ومنحوا الموافقة النهائية على النسخة التي ستُنشر. *قدّم جميع المشاركين في هذه الدراسة موافقة مستنيرة (شفوية وكتابية).

تمويل

لا يوجد تمويل.

توفر البيانات

البيانات التي تم إنشاؤها و/أو تحليلها خلال الدراسة الحالية غير متاحة للجمهور بسبب الشروط المحددة عند الحصول على الموافقة من لجنة الأخلاقيات، ولكن يمكن الحصول عليها من المؤلف المراسل عند الطلب المعقول.

الإعلانات

تمت الموافقة على بروتوكول البحث من قبل لجنة الأخلاقيات بجامعة إسكي شهير عثمان غازي (رقم القرار: 2019-227). قدم جميع المشاركين موافقة مستنيرة. أكدنا أن الدراسة أجريت وفقًا للإرشادات واللوائح ذات الصلة بإعلان هلسنكي.
تم الحصول على موافقة مستنيرة إضافية من جميع المشاركين الأفراد الذين تم تضمينهم في الدراسة.

المصالح المتنافسة

يعلن المؤلفون أنه لا يوجد تضارب في المصالح.

تفاصيل المؤلف

كلية طب الأسنان، قسم أمراض اللثة، جامعة إسكي شهير عثمان غازي، إسكي شهير 26240، تركيا
قسم الأشعة الفموية والوجهية، إدارة تخطيط الرعاية وعلوم الترميم، مركز جامعة ميسيسيبي الطبي كلية طب الأسنان، جاكسون، ميسيسيبي، الولايات المتحدة الأمريكية
كلية طب الأسنان، قسم الأشعة الفموية والوجهية، جامعة إسكي شهير عثمان غازي، إسكي شهير، تركيا
كلية العلوم، قسم الرياضيات وعلوم الحاسوب، جامعة إسكي شهير عثمان غازي، إسكي شهير، تركيا
كلية طب الأسنان، قسم أمراض اللثة، جامعة رجب طيب أردوغان، ريزه، تركيا
كلية طب الأسنان، قسم أمراض اللثة، جامعة دوكوز إيلول، إزمير، تركيا
كلية طب الأسنان، قسم تقويم الأسنان، جامعة إسكي شهير أوسمان غازي، إسكي شهير، تركيا
قسم الأشعة الفموية والوجهية، قسم تخطيط الرعاية وعلوم الترميم، مركز جامعة ميسيسيبي الطبي لطب الأسنان، جاكسون، ميسيسيبي، الولايات المتحدة الأمريكية
كلية طب الأسنان، قسم الأشعة الفموية والوجهية، جامعة أنقرة، أنقرة، تركيا

تم الاستلام: 9 نوفمبر 2023 / تم القبول: 15 يناير 2024

نُشر على الإنترنت: 31 يناير 2024

References

  1. Dentino A, Lee S, Mailhot J, Hefti AF. Principles of periodontology. Periodontol 2000. 2013;61:16-53.
  2. Bourgeois D, Inquimbert C, Ottolenghi L, Carrouel F. Periodontal pathogens as Risk factors of Cardiovascular diseases, Diabetes, Rheumatoid Arthritis, Cancer, and Chronic Obstructive Pulmonary Disease-Is there cause for Consideration? Microorganisms 2019;7.
  3. Chang H-J, Lee S-J, Yong T-H, Shin N-Y, Jang B-G, Kim J-E, et al. Deep learning hybrid method to automatically diagnose periodontal bone loss and stage periodontitis. Sci Rep. 2020;10:1-8.
  4. Mol A. Imaging methods in periodontology. Periodontol 2000. 2004;34:34-48.
  5. Scarfe WC, Azevedo B, Pinheiro LR, Priaminiarti M, Sales MAO. The emerging role of maxillofacial radiology in the diagnosis and management of patients with complex periodontitis. Periodontol 2000. 2017;74:116-39.
  6. Kurt Bayrakdar S, Özer Ç, Bayrakdar IS, Orhan K, Bilgir E, Odabaş A, et al. Success of artificial intelligence system in determining alveolar bone loss from dental panoramic radiography images. Cumhuriyet Dent J. 2020;23:318-24.
  7. Rushton VE, Horner K. The use of panoramic radiology in dental practice. J Dent. 1996;24:185-201.
  8. Clerehugh V, Tugnait A. Diagnosis and management of periodontal diseases in children and adolescents. Periodontol 2000. 2001;26:146-68.
  9. Ivanauskaite D, Lindh C, Rangne K, Rohlin M. Comparison between Scanora panoramic radiography and bitewing radiography in the assessment of marginal bone tissue. Stomatologija. 2006;8(1):9-15. PMID: 16687909.
  10. de Faria Vasconcelos K, Evangelista KM, Rodrigues CD, Estrela C, de Sousa TO, Silva MA. Detection of periodontal bone loss using cone beam CT and intraoral radiography. Dentomaxillofac Radiol. 2012;41:64-9.
  11. Haas LF, Zimmermann GS, De Luca Canto G, Flores-Mir C, Corrêa M. Precision of cone beam CT to assess periodontal bone defects: a systematic review and meta-analysis. Dentomaxillofac Radiol. 2018;47:20170084.
  12. Persson RE, Hollender LG, Laurell L, Persson GR. Horizontal alveolar bone loss and vertical bone defects in an adult patient population. J Periodontol. 1998;69:348-56.
  13. Gomes-Filho IS, Sarmento VA, de Castro MS, da Costa NP, da Cruz SS, Trindade SC, et al. Radiographic features of periodontal bone defects: evaluation of digitized images. Dentomaxillofac Radiol. 2007;36:256-62.
  14. Jayakumar A, Rohini S, Naveen A, Haritha A, Reddy K. Horizontal alveolar bone loss: a periodontal orphan. J Indian Soc Periodontol. 2010;14:181-5.
  15. Braun , Ritter , Jervøe-Storm PM, Frentzen M. Diagnostic accuracy of CBCT for periodontal lesions. Clin Oral Investig. 2014;18:1229-36.
  16. Papapanou PN, Sanz M, Buduneli N, Dietrich T, Feres M, Fine DH, et al. Periodontitis: Consensus report of workgroup 2 of the 2017 World workshop on the classification of Periodontal and Peri-implant diseases and conditions. J Periodontol. 2018;89(Suppl 1):173-s82.
  17. Ertaş K, Pence I, Cesmeli MS, Ay ZY. Determination of the stage and grade of periodontitis according to the current classification of periodontal and peri-implant diseases and conditions (2018) using machine learning algorithms. J Periodontal Implant Sci. 2023;53(1):38-53. https://doi.org/10.5051/ jpis. 2201060053.
  18. Lee CT, Kabir T, Nelson J, Sheng S, Meng HW, Van Dyke TE, et al. Use of the deep learning approach to measure alveolar bone level. J Clin Periodontol. 2022;49:260-9.
  19. Sen D, Chakrabarti R, Chatterjee S, Grewal DS, Manrai K. Artificial intelligence and the radiologist: the future in the Armed Forces Medical Services. BMJ Mil Health. 2020;166:254-6.
  20. Kurt Bayrakdar S, Orhan K, Bayrakdar IS, Bilgir E, Ezhov M, Gusarev M, et al. A deep learning approach for dental implant planning in cone-beam computed tomography images. BMC Med Imaging. 2021;21:86.
  21. Lee JH, Kim DH, Jeong SN, Choi SH. Detection and diagnosis of dental caries using a deep learning-based convolutional neural network algorithm. J Dent. 2018;77:106-11.
  22. Fukuda M, Inamoto K, Shibata N, Ariji Y, Yanashita Y, Kutsuna S, et al. Evaluation of an artificial intelligence system for detecting vertical root fracture on panoramic radiography. Oral Radiol. 2020;36:337-43.
  23. Bilgir E, Bayrakdar İ, Çelik Ö, Orhan K, Akkoca F, Sağlam H, et al. An artifıcial intelligence approach to automatic tooth detection and numbering in panoramic radiographs. BMC Med Imaging. 2021;21:124.
  24. Bayrakdar IS, Orhan K, Çelik Ö, Bilgir E, Sağlam H, Kaplan FA, et al. A U-Net Approach to apical lesion segmentation on panoramic radiographs. Biomed Res Int. 2022;2022:7035367.
  25. Krois J, Ekert T, Meinhold L, Golla T, Kharbot B, Wittemeier A, et al. Deep learning for the Radiographic detection of Periodontal Bone loss. Sci Rep. 2019;9:8495.
  26. Thanathornwong B, Suebnukarn S. Automatic detection of periodontal compromised teeth in digital panoramic radiographs using faster regional convolutional neural networks. Imaging Sci Dent. 2020;50:169-74.
  27. Lee JH, Kim DH, Jeong SN, Choi SH. Diagnosis and prediction of periodontally compromised teeth using a deep learning-based convolutional neural network algorithm. J Periodontal Implant Sci. 2018;48:114-23.
  28. Khan HA, Haider MA, Ansari HA, Ishaq H, Kiyani A, Sohail K, et al. Automated feature detection in dental periapical radiographs by using deep learning. Oral Surg Oral Med Oral Pathol Oral Radiol. 2021;131:711-20.
  29. Kim J, Lee HS, Song IS, Jung KH. DeNTNet: deep neural transfer network for the detection of periodontal bone loss using panoramic dental radiographs. Sci Rep. 2019;9:17615.
  30. Jiang L, Chen D, Cao Z, Wu F, Zhu H, Zhu F. A two-stage deep learning architecture for radiographic staging of periodontal bone loss. BMC Oral Health. 2022;22:106.
  31. Helmi MF, Huang H, Goodson JM, Hasturk H, Tavares M, Natto ZS. Prevalence of periodontitis and alveolar bone loss in a patient population at Harvard School of Dental Medicine. BMC Oral Health. 2019;19:254. https://doi. org/10.1186/s12903-019-0925-z.
  32. Wylleman A, Van Der Veken D, Teughels W, Quirynen M, Laleman I. Alveolar bone level at deciduous molars in flemish children: a retrospective, radiographic study. J Clin Periodontol. 2020;47:660-7. https://doi.org/10.1111/ jcpe. 13280.
  33. Castro LO, Castro IO, de Alencar AHG, Valladares-Neto J, Estrela C. Cone beam computed tomography evaluation of distance from cementoenamel
    junction to alveolar crest before and after nonextraction orthodontic treatment. Angle Orthod. 2015;86:543-9. https://doi.org/10.2319/040815-235.1.
  34. Ronneberger O, Fischer P, Brox T. U-net: Convolutional networks for biomedical image segmentation. International Conference on Medical image computing and computer-assisted intervention: Springer; 2015. p. 234-41.
  35. Zhou Z, Siddiquee MMR, Tajbakhsh N, Liang J. UNet++: A nested U-Net Architecture for Medical Image Segmentation. Deep Learn Med Image Anal Multimodal Learn Clin Decis Support (2018). 2018;11045:3-11.
  36. Du G, Cao X, Liang J, Chen X, Zhan Y. Medical image segmentation based on u-net: a review. J Imaging Sci Technol. 2020;64:1-12.
  37. Lee S, Kim D, Jeong HG. Detecting 17 fine-grained dental anomalies from panoramic dental radiography using artificial intelligence. Sci Rep. 2022;12:5172.
  38. Kılıc MC, Bayrakdar IS, Çelik Ö, Bilgir E, Orhan K, Aydın OB, et al. Artificial intelligence system for automatic deciduous tooth detection and numbering in panoramic radiographs. Dentomaxillofac Radiol. 2021;50:20200172.
  39. Pauwels R, Brasil DM, Yamasaki MC, Jacobs R, Bosmans H, Freitas DQ, et al. Artificial intelligence for detection of periapical lesions on intraoral radiographs: comparison between convolutional neural networks and human observers. Oral Surg Oral Med Oral Pathol Oral Radiol. 2021;131:610-6.
  40. Zhang X, Liang Y, Li W, Liu C, Gu D, Sun W, et al. Development and evaluation of deep learning for screening dental caries from oral photographs. Oral Dis. 2022;28:173-81.
  41. Takahashi T, Nozaki K, Gonda T, Mameno T, Ikebe K. Deep learning-based detection of dental prostheses and restorations. Sci Rep. 2021;11:1960
  42. Fu Q, Chen Y, Li Z, Jing Q, Hu C, Liu H, et al. A deep learning algorithm for detection of oral cavity squamous cell carcinoma from photographic images: a retrospective study. EClinicalMedicine. 2020;27:100558.
  43. Li W, Liang Y, Zhang X, Liu C, He L, Miao L, et al. A deep learning approach to automatic gingivitis screening based on classification and localization in RGB photos. Sci Rep. 2021;11:16831.
  44. Zehra T, Shaikh A, Shams M. Dawn of artificial intelligence – enable digital Pathology in Pakistan: a paradigm shift. J Pak Med Assoc. 2021;71:2683-4.
  45. Alhazmi A, Alhazmi Y, Makrami A, Masmali A, Salawi N, Masmali K, et al. Application of artificial intelligence and machine learning for prediction of oral cancer risk. J Oral Pathol Med. 2021;50:444-50.
  46. Alotaibi G, Awawdeh M, Farook FF, Aljohani M, Aldhafiri RM, Aldhoayan M. Artificial intelligence (AI) diagnostic tools: utilizing a convolutional neural network (CNN) to assess periodontal bone level radiographically-a retrospective study. BMC Oral Health. 2022;22:399.
  47. Surya L. An exploratory study of AI and Big Data, and it’s future in the United States. Int J Creative Res Thoughts (IJCRT), ISSN 2015;2320-882.
  48. Acar B, Kamburoğlu K. Use of cone beam computed tomography in periodontology. World J Radiol. 2014;28(5):6.

ملاحظة الناشر

تظل شركة سبرينغر ناتشر محايدة فيما يتعلق بالمطالبات القضائية في الخرائط المنشورة والانتماءات المؤسسية.

  1. *المراسلة:
    سيفدا كورت-بايرقدار
    dt.sevdakurt@hotmail.com
    القائمة الكاملة لمعلومات المؤلف متاحة في نهاية المقال

Journal: BMC Oral Health, Volume: 24, Issue: 1
DOI: https://doi.org/10.1186/s12903-024-03896-5
PMID: https://pubmed.ncbi.nlm.nih.gov/38297288
Publication Date: 2024-01-31

Detection of periodontal bone loss patterns and furcation defects from panoramic radiographs using deep learning algorithm: a retrospective study

Sevda Kurt-Bayrakdar (. İbrahim Şevki Bayrakdar , Muhammet Burak Yavuz , Nichal Sali , Özer Çelik , Oğuz Köse , Bilge Cansu Uzun Saylan , Batuhan Kuleli , Rohan Jagtap and Kaan Orhan

Abstract

Background This retrospective study aimed to develop a deep learning algorithm for the interpretation of panoramic radiographs and to examine the performance of this algorithm in the detection of periodontal bone losses and bone loss patterns. Methods A total of 1121 panoramic radiographs were used in this study. Bone losses in the maxilla and mandibula (total alveolar bone loss) ( ), interdental bone losses ( ), and furcation defects ( ) were labeled using the segmentation method. In addition, interdental bone losses were divided into horizontal ( ) and vertical ( ) bone losses according to the defect patterns. A Convolutional Neural Network (CNN)-based artificial intelligence (AI) system was developed using U-Net architecture. The performance of the deep learning algorithm was statistically evaluated by the confusion matrix and ROC curve analysis. Results The system showed the highest diagnostic performance in the detection of total alveolar bone losses and the lowest in the detection of vertical bone losses . The sensitivity, precision, F1 score, accuracy, and AUC values were found as 1, 0.995, 0.997, 0.994, 0.951 for total alveolar bone loss; found as 0.947, 0.939, for horizontal bone losses; found as for vertical bone losses and found as for furcation defects (respectively). Conclusions AI systems offer promising results in determining periodontal bone loss patterns and furcation defects from dental radiographs. This suggests that CNN algorithms can also be used to provide more detailed information such as automatic determination of periodontal disease severity and treatment planning in various dental radiographs.

Keywords Panoramic radiography, Artificial intelligence, Periodontitis, Dentistry

Background

Periodontitis is a chronic inflammatory disease that is characterized by damage to the supporting tissues of the teeth and can result in tooth loss if not controlled [1]. This common disease in society is associated with many systemic diseases in the body as well as dental problems such as chewing loss [2,3]. In this respect, early diagnosis and treatment planning are very important in periodontitis cases [2,3].
Radiographic evaluations play an important role in the diagnosis of periodontitis in addition to clinical periodontal evaluations such as probing pocket depth, attachment loss, and gingival recession [4]. Intraoral radiographs such as periapical radiography and bitewing radiography are commonly used to determine periodontal status [4-6]. Panoramic radiographs, which is one of the extraoral dental radiographic techniques, have advantages such as working with low-dose radiation providing quick and easy radiological imaging, and also helping in determining general dental problems and periodontal conditions [6-8]. In addition, these radiographs allow the observation of bone loss patterns (such as horizontal bone loss, vertical bone loss, and furcation defects) in periodontitis cases [9]. In periodontitis cases, it is very important to determine the bone loss patterns and bone morphology to make an appropriate treatment plan and achieve successful results [10, 11]. Horizontal bone loss occurs when the bone supporting the tooth melts at the same levels on all tooth-related surfaces (mesial, distal, vestibular/buccal, lingual/palatal). In this type of bone defect, the alveolar crest levels around the teeth are resorbed parallel to the line that should be in the healthy periodontium and are positioned more apically [12-14]. Vertical bone losses are bone losses that occur obliquely and angularly in the interdental region [12-14]. In multi-rooted teeth, furcation defects occur when the alveolar bone between the tooth roots is also affected by periodontal disease. In furcation defects, both diagnosis and treatment planning become much more complex and difficult for dentists [15]. The correct estimation of bone loss patterns enables the correct treatment selection and facilitates the work of both patients and dentists. For example, flap surgery and/or resective surgical periodontal therapy may be preferred rather than regenerative treatment in horizontal bone losses, while regenerative treatment may be an alternative method in vertical bone losses [14]. According to the current classification of periodontal and peri-implant diseases and conditions developed in 2018, the detection of periodontal bone loss patterns is very important for determining disease stages [16]. In this classification system, Stage I and II periodontitis are associated with the presence of horizontal bone loss, while the presence of vertical bone losses and furcation defects in Stage III and IV periodontitis is noted [16,
17]. Current academic studies using image processing and machine learning technologies and aiming at automatic periodontal disease classification have pointed out the determination of periodontal bone loss patterns as one of the main classification criteria [17, 18]. Therefore, the determination of periodontal bone loss pattern is of clinical importance in making the current periodontal disease classification complete and accurate [17, 18].
Various studies about artificial intelligence (AI) have been carried out in dentistry, following the use of AI systems in the medical field for disease diagnosis and treatment planning [19, 20]. In these studies, it is seen that AI systems are used for the determination of many pathologies such as dental caries, apical lesions, tooth numbering, and root fractures on two-dimensional (2D) radiographs [21-24]. The main purpose of using AI in dentistry practice is to automatically detect pathologies, diseases, or anatomical structures and determine disease severity. While achieving these goals, it also provides additional benefits such as preventing situations that may be overlooked due to the physician’s inexperience, intensity, and fatigue, ensuring early diagnosis of diseases, and recording patient data more regularly in the digital environment [6, 20].
There are several studies for evaluating bone losses and periodontal problems using AI systems [3, 6, 18, 25-30]. However, as far as we know, there is no AI-based study aiming to determine the periodontal bone loss patterns using the segmentation method. This study aimed to examine the performance of a convolutional neural network (CNN)-based AI system in the detection of periodontal problems such as horizontal bone losses, vertical bone losses, and furcation defects on panoramic radiographs by segmentation method.

Methods

Study design

All of the images were obtained from the radiology archive of the Eskișehir Osmangazi University Faculty of Dentistry for this retrospective study. Ethics board approval was obtained from the Non-interventional Clinical Research Ethics Committee of Eskişehir Osmangazi University before starting the study (decision number: 2019-227). The guidelines of the Declaration of Helsinki were followed throughout all phases of the study.

Data selection

All images used in the study were obtained with the same radiography device (Planmeca Promax 2D, Planmeca, Helsinki, Finland) with the following parameters: , and 13 s . All images were selected from images of individuals over the age of 18, without paying attention to age and gender differences. In radiographs, 2 mm apical of the imaginary line passing through the
cemento-enamel junction of the teeth was accepted as the healthy periodontium level [31-33]. Cases whose alveolar bone crest was coronal to this imaginary line were considered to have healthy periodontium and were excluded from the study. Images of periodontitis cases of different ages and genders were re-evaluated in terms of the criteria stated below: ‘1. The images with dense artifacts, 2 . The images with low quality due to patient positioning error or patient movement during acquisition, 3. The images of patients who received orthognathic treatment, 4 . The images of patients with bone metabolism disorders, 5 . The images of patients with unusual alveolar bone morphology (bone pathologies due to conditions such as cysts and tumors), 6. The images of patients with cleft lip and palate, 7. The images of poor quality and blurred images in the alveolar bone region due to conditions such as dental crowding, 8. The images of patients with metal restorations that cause artifacts to complicate periodontal diagnosis’. Images that meet these criteria, which would make diagnosis difficult and disrupt the standardization of the study, were also excluded from the study.

Ground truth

All data that were compatible with the inclusion criteria were uploaded into the CranioCatch labeling module (CranioCatch, Eskisehir, Turkey) in an anonymized manner. Initially, intra-observer and inter-observer compatibility were analyzed for the 4 observers ( 3 periodontists: , and 1 oral maxillofacial radiologist: İŞB) who planned to carry out the labeling to ensure labeling standardization. For intra-observer evaluation, the observers labeled all the parameters to be evaluated in this study in line with the criteria below on 10 radiographs with the segmentation method. Each observer repeated this procedure 1 week later. A computer program (Python version 3.6.1, Python Software Foundation) and NumPy library were used and the splicing of the segmented fields was done and Intersection over Union (IoU) values were calculated. When it was decided that there was intra-observer and inter-observer aggregation for labeling, all data were evaluated by the same observers according to the same criteria, and the labeling of the relevant parameters was completed.
The criteria taken into consideration during the labeling phase were:
For total alveolar bone loss: The unit of this parameter was the jaw (maxilla and mandible). Two separate segmentation processes were performed for the maxilla and mandible in all panoramic radiographs. While performing the segmentation, the root parts of the teeth without bone support and the interdental regions following these areas were included in the label area. Initially, a segmentation line was created from the cemento-enamel
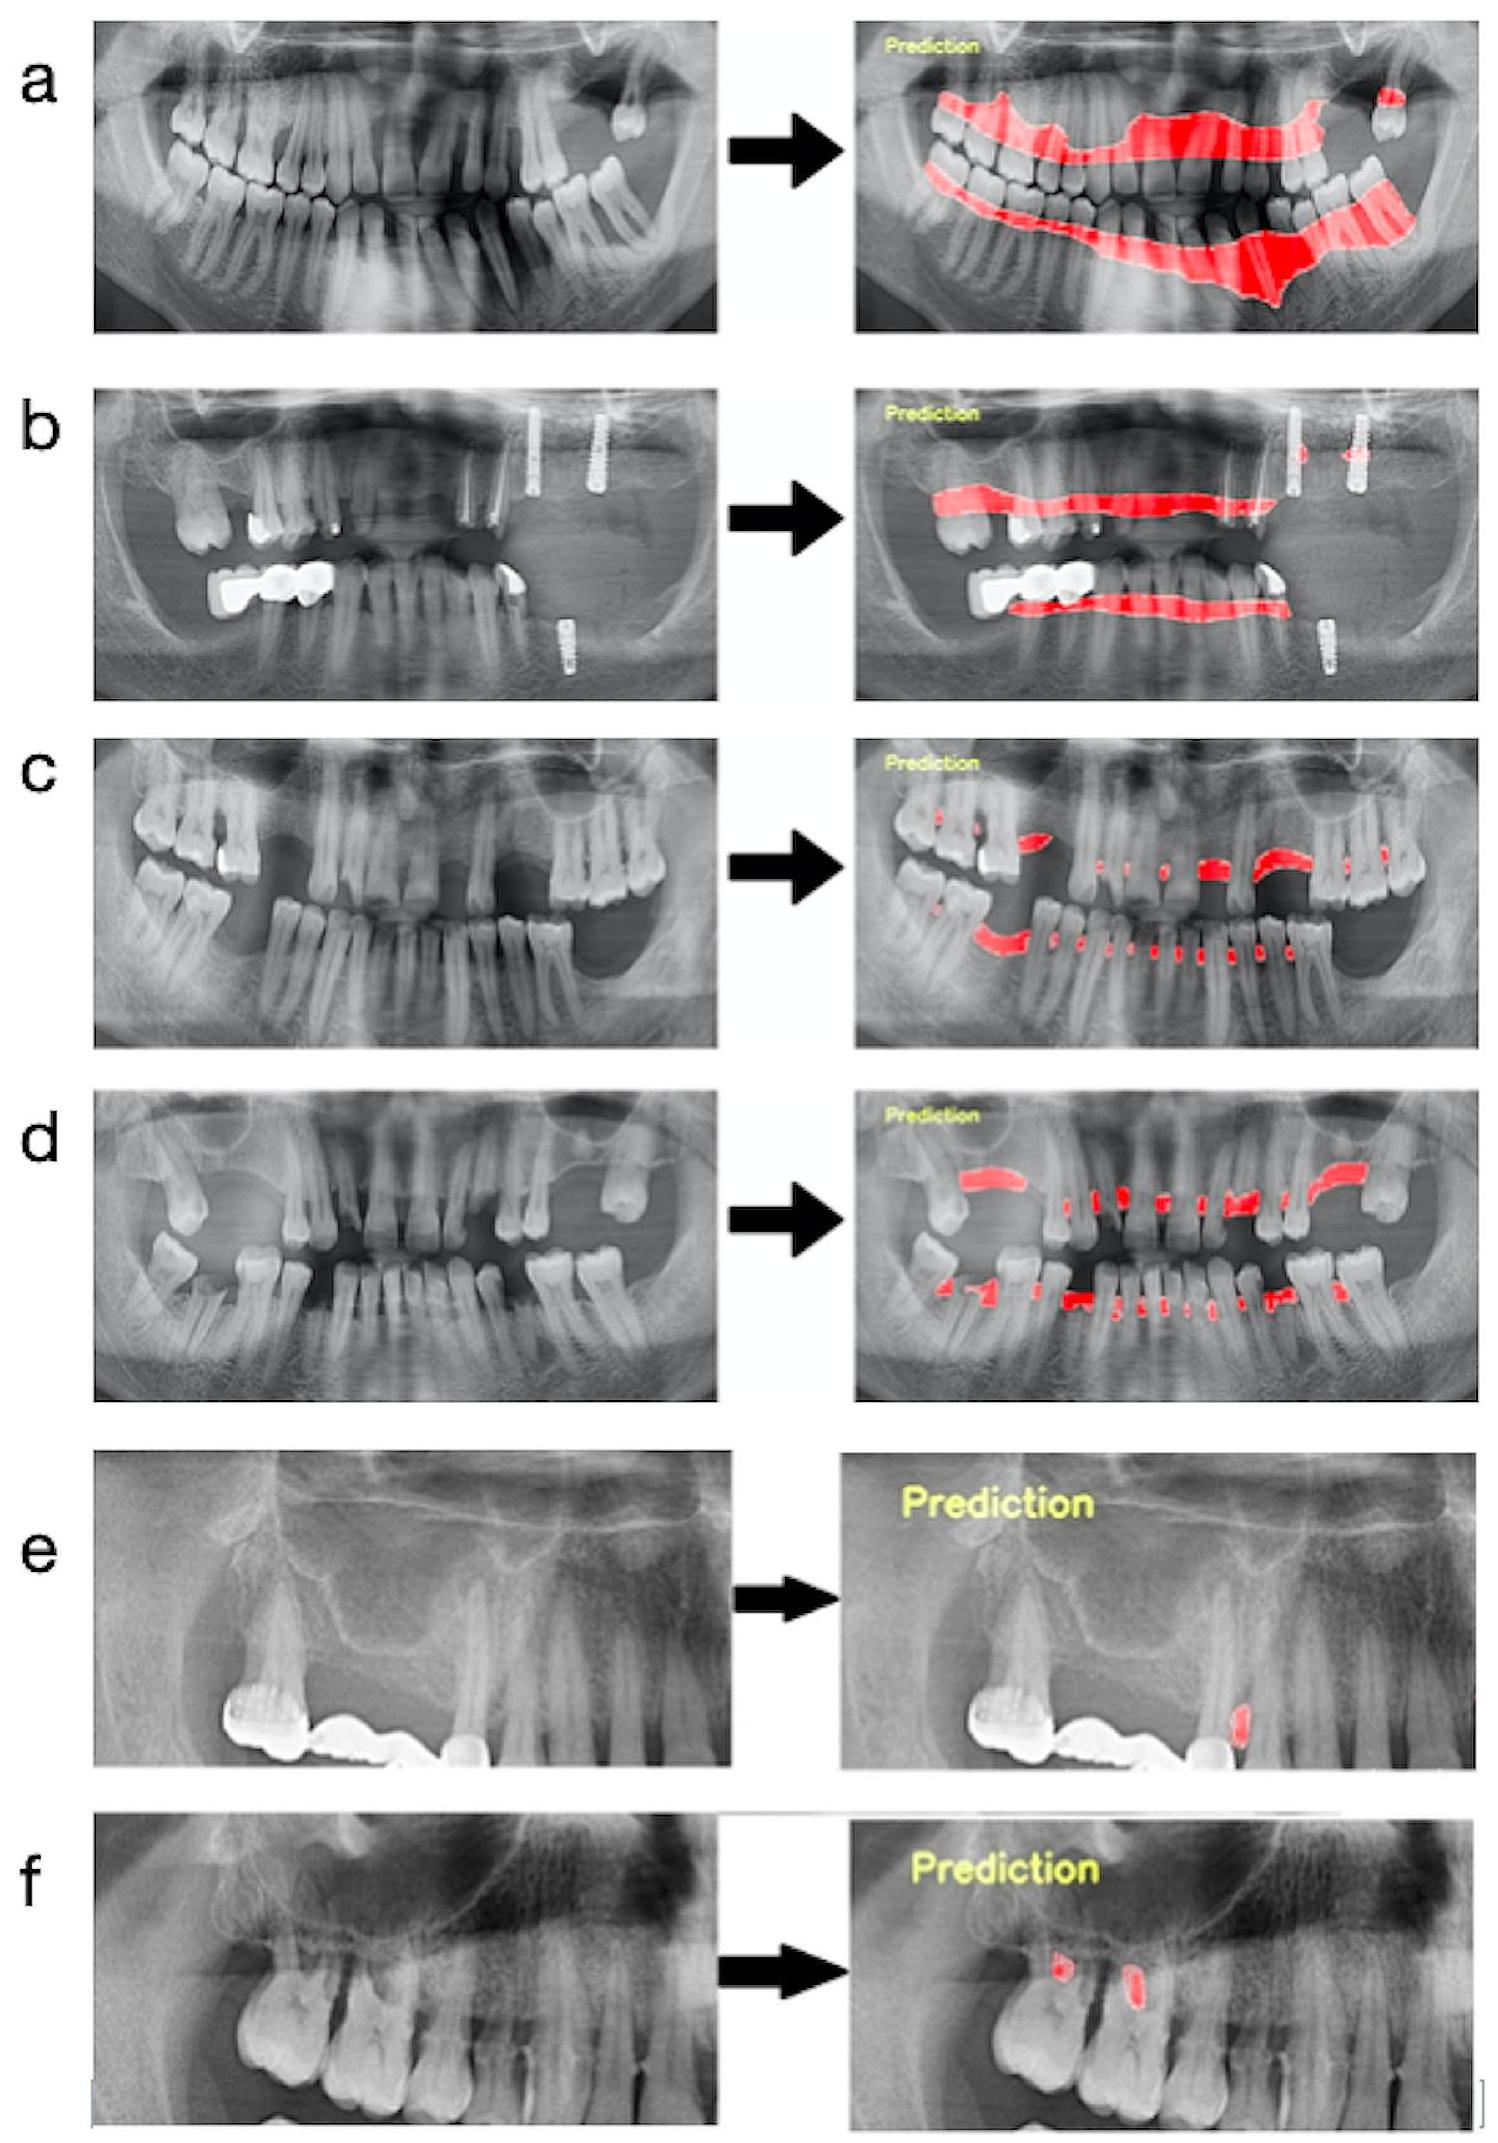
junction of all teeth. After that, the segmentation line was combined to follow the line on the distal surfaces of the most distal teeth and the border of the bone crests in the relevant jaw. In Fig. 1-a, an example image was presented to better understand the path followed when labeling this parameter. (Fig. 1-a)
In the next stage, the interdental regions were evaluated one by one. A separate labeling process was made for these areas, taking into account the bone loss patterns (in the form of horizontal and vertical bone loss) (Fig. 1b). The units of these parameters were the interdental region.
For horizontal bone losses: Interdental regions where the imaginary lines passing through the cemento-enamel junctions of two adjacent teeth and the alveolar bone crest were parallel to each other and where the alveolar bone level was in a more apical position than it should be in the healthy periodontium were labeled with the horizontal bone loss label [12-14]. During the segmentation process, the cemento-enamel junctions of two adjacent teeth, the most distal border of the mesial tooth, the alveolar crest line in the relevant interdental region, and the most mesial border of the distal tooth were followed, and the specified reference areas were combined in the form of a closed curve. When the relevant labels were completed, all of the segmentation areas resembled geometric shapes such as squares, rectangles, and trapezoids (Fig. 1-b).
For vertical bone losses: Two imaginary lines were created from the cemento-enamel junctions of two adjacent teeth and the alveolar bone crest line. The interdental regions where these two lines are at an angle to each other were labeled with the vertical bone destruction label [12-14]. When completed, the labels showed a triangular geometry. Minimal ridge angles due to changes in the tooth axis are not included in this label. The criteria specified for horizontal bone loss were followed when creating labeling boundaries (Fig. 1-b).
For furcation defects: The unit of this parameter was the tooth. Furcation areas of multi-rooted teeth were examined and radiolucent images compatible with bone resorption were labeled with the furcation defect label. While labeling was carried out, the root boundaries of the relevant tooth and the boundaries of the radiolucent region formed by the lesion were followed and completed to form a closed curve (Fig. 1-b).
After labeling was completed, the data set was rechecked by the observers. At this stage, instead of reviewing the boundaries of segmentation, the bone resorption form and geometry of the labeled region were quickly reviewed to avoid standardization deficiencies that may arise in horizontal-vertical bone loss decisions. In addition, consensus was reached in cases where dentists were conflicted about labeling some initial furcation
Fig. 1 Images of the labeling module. (a) Labeling of a patient’s total alveolar bone loss; (b) Labeling of a patient’s interdental bone loss (red: vertical, blue: horizontal, purple: furcation); (c) Labeled version of all data of a patient
defects. Also, the final evaluation made by 4 dentists together allowed the forgotten and overlooked labels to be noticed and completed before AI training. Labels with no consensus on diagnosis were removed and not used in algorithm training and result metrics.

Model training

  1. Pre-processing steps: All images were resized as pixels. Panoramic radiographs to be used in the data sets created for developing the furcation defect model were cropped to 4 (left mandible, right mandible, left maxilla, and right maxilla). Since furcation defects were only seen in multi-rooted molars, it was aimed to focus more on the relevant areas in this way. The radiographs to be used in other parameter models were not
    cropped but used as a whole. Images that do not have the related parameter label were excluded from the main data sets of that parameter (Figs. 2 and 3). In line with these criteria, 1121 panoramic radiographs for total alveolar bone losses, 1120 panoramic radiographs for horizontal bone losses, 828 panoramic radiographs for vertical bone losses, and 1941 cropped panoramic radiographs ( 890 panoramic radiographs) for furcation defects were included in the main datasets (Table 1; Fig. 3).
  2. Training, Validation, and Testing Data: The main datasets were created by combining all panoramic radiographs containing the relevant parameter labels for each parameter. Then these main datasets were split as a training set ( ), validation set ( ), and testing set ( ) randomly for the development of AI systems (Table 1).
Fig. 2 Workflow demonstrating the application of inclusion and exclusion criteria
Fig. 3 The stages of creating the datasets to be used in the development of AI models for all parameters. (a) Total alveolar bone loss; (b) Horizontal bone loss; (c) Vertical bone loss; (d) Furcation defect
Table 1 Numerical data on the development of deep learning algorithms
Model Name Number of Training Images Number of Training Labels Number of Validation Images Number of Validation Labels Number of Test Images Number of Test Labels Epoch Learning Rate Model
Total Alveolar Bone Loss 935 1878 93 186 93 187 800 0.0001 U-Net
Horizontal Bone Loss 934 18,232 93 1786 93 1821 800 0.0001 U-Net
Vertical Bone Loss 690 2869 69 287 69 308 800 0.00001 U-Net
Furcation Defect 1619 2358 161 227 161 230 800 0.00001 U-Net
Training set: 935 images (1878 labels) for total alveolar bone loss, 934 images ( 18232 labels) for horizontal bone loss, 690 images ( 2869 labels) for vertical bone loss, and 1619 cropped images ( 2358 labels) for furcation defect were used as training data-set.
The validation set: 93 images ( 186 labels) for total alveolar bone loss, 93 images (1786 labels) for horizontal bone loss, 69 images ( 287 labels) for vertical bone loss, and 161 cropped images (227 labels) for furcation defect were used as validation data-set.
Test set: 93 images (187 labels) for total alveolar bone loss, 93 images ( 1821 labels) for horizontal bone loss, 69 images ( 308 labels) for vertical bone loss, and 161
cropped images (230 labels) for furcation defect were used as testing data-set.
The labels in the training set were used to create the algorithm of the AI model. This model was tested with the data in the validation set for adjusting the algorithm and questioning the need for further training. The final version of the algorithm, which was developed using the training set and successful trials were carried out with the labels in the validation set, was used in the detection of periodontal bone destruction and pattern on the radiographs in the testing set. The diagnostic results of the system in the testing set were compared with the observer labels in this dataset by a computer command,
and the success metrics of the system were presented. In short, while determining the final success of the model, the observer diagnoses in the test dataset were accepted as the gold standard and these labels were used as the ground truth dataset. (Fig. 3). These steps were performed separately for each parameter.
3. Description of CNN architecture: The U-Net architecture was used to perform deep learning (Table 1) [24, 34]. U-Net is a type of CNN that can perform semantic segmentation assignments on various images such as radiography images. U-Net contains four block levels with , and 256 convolution filters in each block. The working mechanism of this architecture is to convert images to vectors for pixel classifications and then convert these vectors back to images for segmentation. The encoder and decoder paths are used in order and perform model training. There is a maximum pool layer in the paths of encoders and up-convolution layers in the paths of decoders. For the current study, the U-Net architecture steps were followed and the working mechanism was presented in Fig. 4 in detail [24, 34].
4. Method for training: PyTorch library (v. 3.6.1; Python Software Foundation, Wilmington, DE, USA) and Adaptive Moment Estimation (ADAM) optimizer (for updating the learning rate for each parameter) were used in the model development stages. All training was made with a computer equipped with 16 GB RAM and NVIDIA GeForce GTX 1660 TI graphics card. U-Net architecture
was used in the training of all parameters and all of them were trained with 800 epochs. Training of total alveolar bone loss and horizontal bone loss parameters was carried out with a learning rate of 0.0001 , and training of vertical bone loss and furcation defect parameters was carried out with a learning rate of 0.00001 .

Assessment metrics

The statistical phase of the study was carried out with the confusion matrix method and ROC analysis. A script was created to perform these evaluations automatically with the help of a computer. A computer program (Python version 3.6.1, Python Software Foundation) and OpenCV and NumPy libraries were used to develop this script. The script used at this stage accepted the labels made by experienced dentists in the testing set as the gold standard. It automatically presented a success metric by comparing the diagnostics of the algorithm in the relevant dataset with the observers’ diagnoses. While the script was running, it presented results using some calculations below.
Sensitivity, precision, and F1 scores were calculated using the confusion matrix method [24]. Initially, three different calculations were for the confusion matrix method: numbers of true positives (TP, there was a periodontal problem and it was segmented correctly), numbers of false positives (FP, there wasn’t a periodontal problem but it was detected wrongly), and numbers of
Fig. 4 U-Net architecture and deep learning stages. Red tiles were used to show the multichannel feature map and light tiles were used for the copied feature map. Different colored arrows represented different processes in the architecture [34]
false negatives (FN, there was a periodontal problem but it wasn’t detected). Then, sensitivity, precision, and F1 scores were determined with the following calculations:
Sensitivity (recall): TP/ (TP+FN).
Precision: TP/ (TP+FP).
F1 score: 2TP/ (2TP + FP + FN).
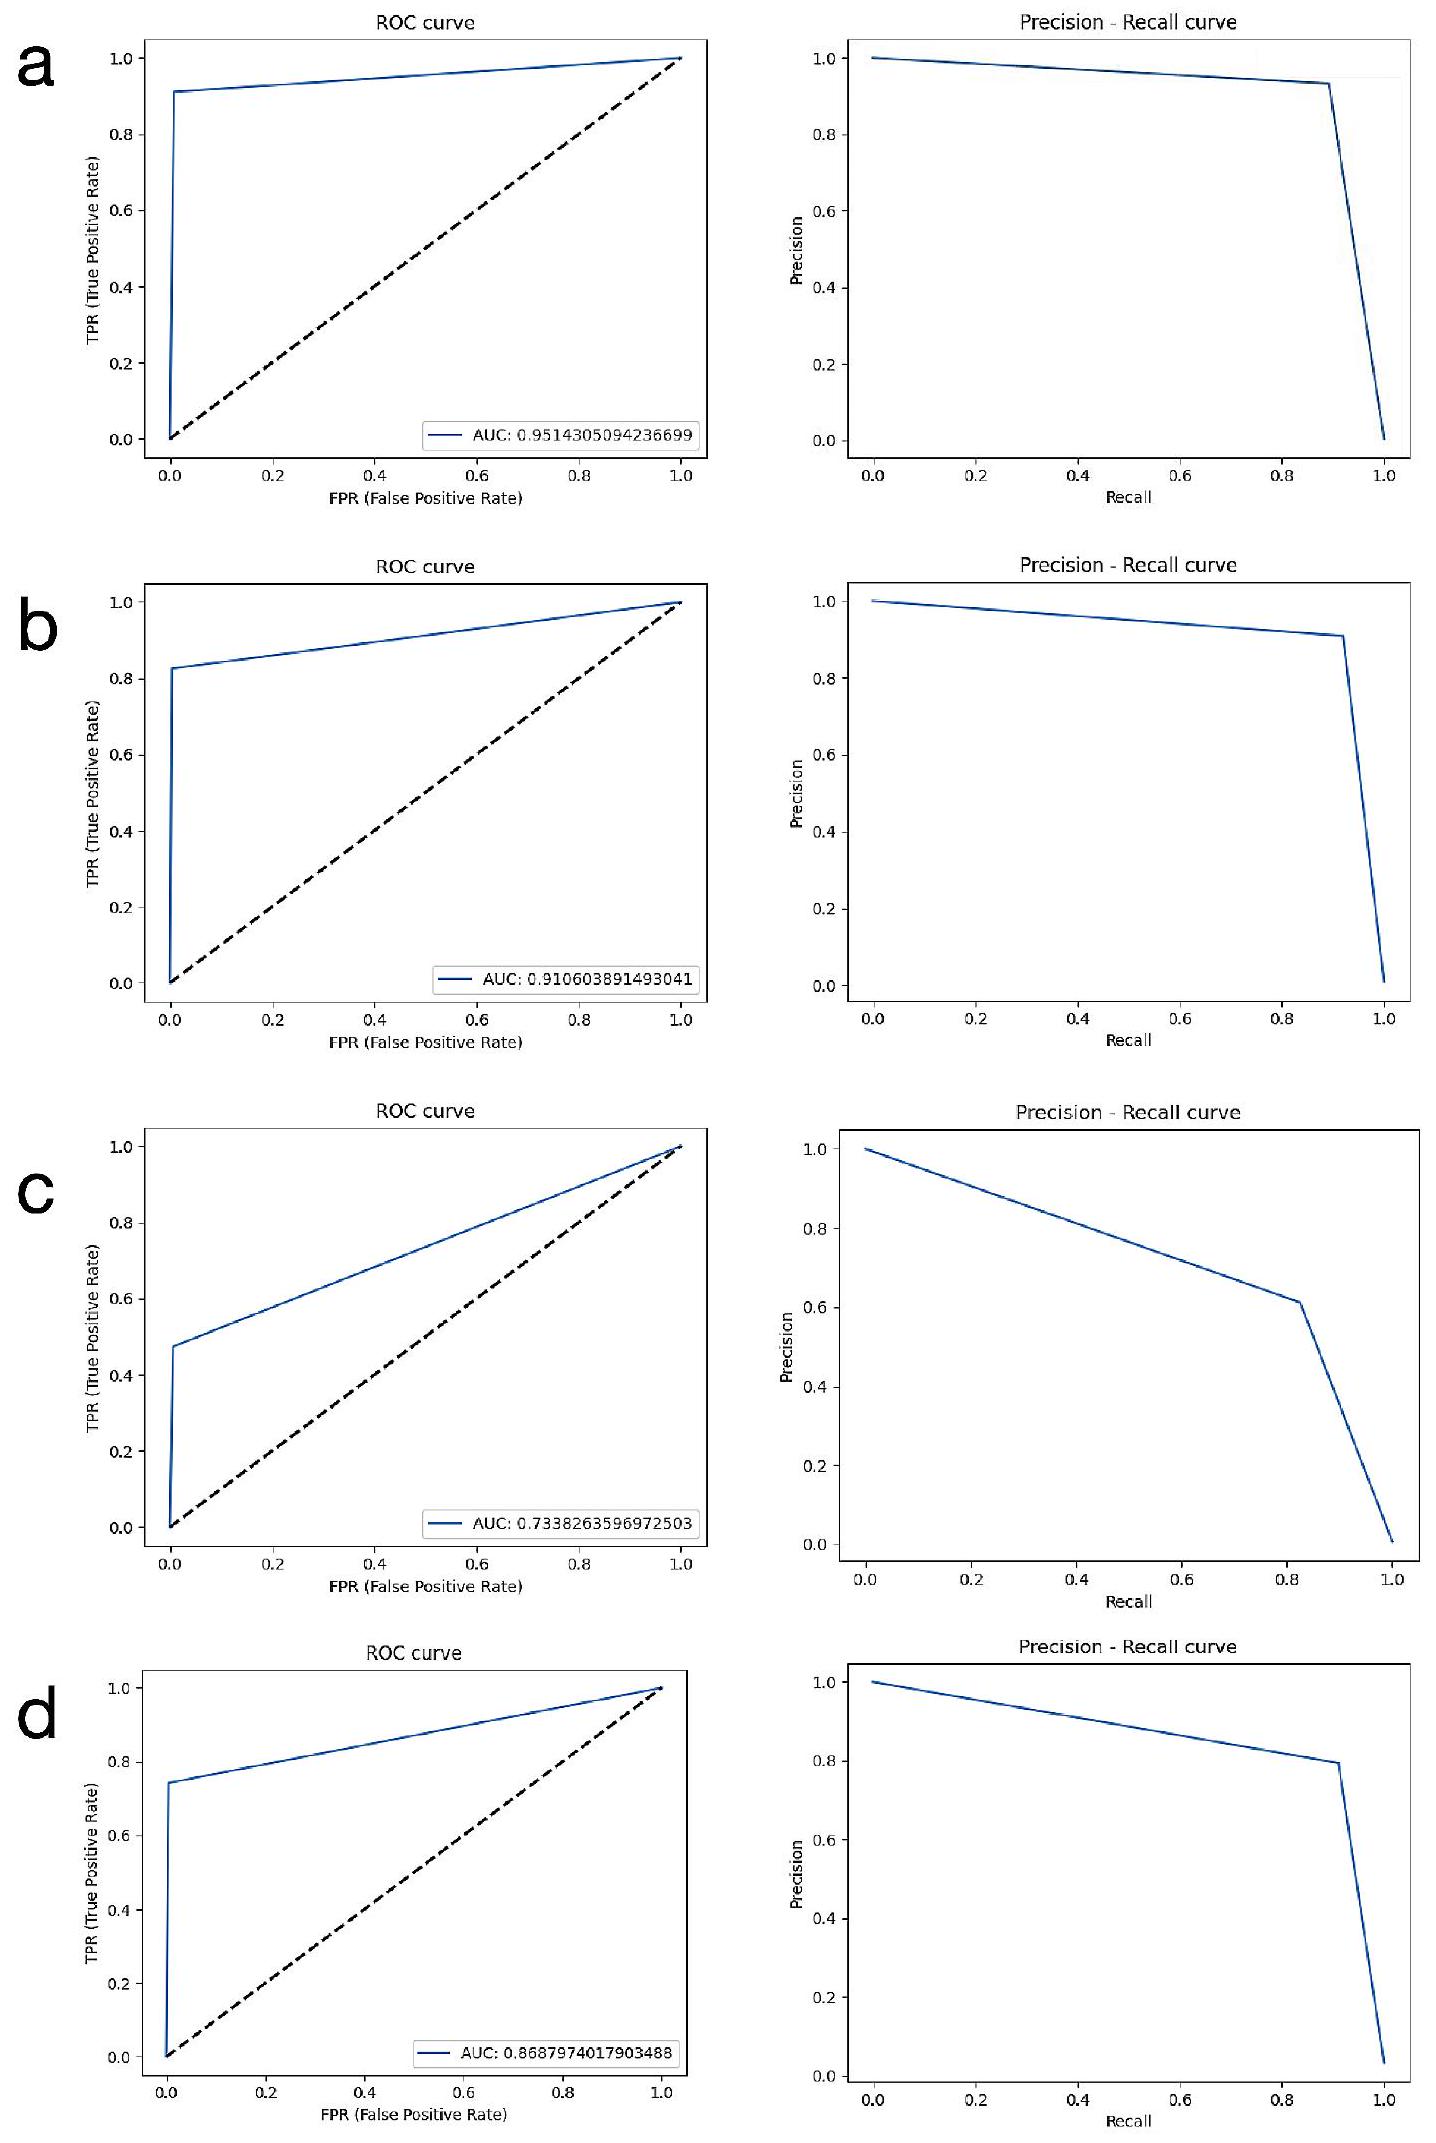
In addition to the confusion matrix method, receiver operating characteristic (ROC) curve analysis and pre-cision-recall evaluation were also performed to provide more detailed data. The area under the ROC curve (AUC) values are calculated by this analysis. ROC is a probability curve and the area under it, AUC, represents the degree or measure of separability. As the area under the curve increases, the discrimination performance between classes increases. It is known that as the success of the system increases, the AUC grows and approaches the value of 1 . In line with this information, interpretations were made and the results were presented. In addition, the labels and system results of the radiographs in the test data set in which the evaluations were carried out were reviewed by experienced dentists for each parameter.

Results

Study data

A total of 2949 radiographs were examined in the study. 1804 of them were excluded from the study because they were not periodontitis cases. In addition, 24 of the remaining images were excluded from the study due to radiography ( ) and case-based reasons ( ). Observers agreed on the periodontitis diagnosis of 1121 panoramic radiographs. These radiographs contained a total of 30369 labels as 2251 total alveolar bone loss, 25303 interdental bone losses ( 21839 horizontal bone losses, 3464 vertical bone losses), and 2815 furcation defects in total (Fig. 5). The total number of labels presented for each parameter indicated the presence of pathology related to the relevant parameter (bone losses or furcation defects). If the relevant pathology was not present, a label was not available in the relevant area.

Intra-observer and inter-observer agreements

It was found that each investigator showed high consistency in the diagnosis and segmentation of these parameters at different times (IoU>0.91). In addition, kappa values were calculated to evaluate the consistency of the observers’ decision for horizontal and vertical bone losses in the interdental regions. Kappa values showed excellent agreement when the two times were compared in the decision of bone loss characteristics in each investigator ( ). Also, the labeling areas of different observers were examined for evaluation of inter-observer agreement using this data set. The IoU values obtained were found to be between 0.8126 and 0.8737 . While the
results were 0.85 and above for horizontal bone loss, total alveolar bone loss, and furcation defect, they were lower for vertical bone loss (>0.81).

Outcomes

While the confusion matrix evaluates a given classifier with a fixed threshold, the AUC evaluates that classifier over all possible thresholds. Therefore, AUC was considered as the primary outcome. AUC values were 0.951 for total alveolar bone loss, 0.910 for horizontal bone losses, 0.733 for vertical bone losses, and 0.868 for furcation defects (Table 2). The developed model showed the most successful results when determining total alveolar bone loss (AUC ). The model’s lowest success rate was seen when detecting vertical bone loss (AUC=0.733).
The results were calculated with the confusion matrix method, which demonstrates the success of the developed AI model, were presented in Table 2. When the diagnostic performance metrics were evaluated, sensitivity, precision, F1 score, and accuracy values, respectively, were 1, 0.995, 0.997, 0.994 for total alveolar bone loss; 0.947, 0.939, 0.943, 0.892 for horizontal bone losses; 0.558, 0.846, 0.673, 0.506 for vertical bone losses and for furcation defects at IoU. In Fig. 6, The input and output images of the radiographs of some patients in the AI system were shown as an example.
Also, ROC curve analysis and precision-recall results for all periodontal parameters were presented in Fig. 7.

Observations

In addition, the input and output images of each case in the testing set were reviewed by the observers who labeled them, and it was analyzed in which situations the system made more mistakes. When the output images of total alveolar bone loss were examined, it was observed that the success of the system was quite good, and there were few errors in the detection of only some deep angular bone loss areas, and furcation areas. When the output images of horizontal bone loss were examined, it was analyzed that the system could not diagnose in some radiographs in large interdental regions caused by tooth deficiency. It was observed that some vertical bone losses were determined as horizontal bone loss in regions with partial superimposition of anatomical structures. The most common error made by the system in detecting vertical bone losses was to perceive very minimal bone angulations as vertical bone losses. The system identified some of the bone losses in the interdental regions of roots close to each other as furcation defects. Another mistake was that the AI model overlooked and failed to detect some of the initial level furcation defects.
Fig. 5 Standards for Reporting Diagnostic Accuracy (STARD) flow diagram
Table 2 The results obtained with the confusion matrix method and ROC analysis
Model Name Found Correct for loU Threshold: 50% Found Wrong for loU Threshold: 50% Not Found for loU Threshold: 50% Sensitivity Precision F1 Score Accuracy AUC
Total Alveolar Bone Loss 185 1 0 1 0.995 0.997 0.994 0.951
Horizontal Bone Loss 108 7 6 0.947 0.939 0.943 0.892 0.910
Vertical Bone Loss 115 21 91 0.558 0.846 0.673 0.506 0.733
Furcation Defect 181 13 22 0.892 0.933 0.912 0.837 0.868

Discussion

In recent years, the use of AI systems in medicine and dentistry in image interpretation has attracted great interest and CNN systems change these areas rapidly [24]. However, the number of studies conducted in the field of periodontology is still limited. The current study
aims to automatically evaluate panoramic radiographs by an AI system and to determine the success of the related system in detecting periodontal disease findings on radiographs. The results of this study showed that AI systems can be a decision-support mechanism for dentists
Fig. 6 Input and output data of some radiographs of patients. a-b. Total alveolar bone loss; c-d. Horizontal bone loss; e. Vertical bone loss, f: Furcation defect
Fig. 7 ROC curve analysis and precision-recall results of all parameters. (a) Total alveolar bone loss; (b) Horizontal bone loss; (c) Vertical bone loss; (d) Furcation defect
in the diagnosis of periodontal disease, one of the most common diseases in the world.
Different architectures can be used in AI-based studies. U-Net architecture, a CNN-based AI architecture, is one of the image segmentation techniques that enable the evaluation of images in the medical field with AI systems and provides a more precise and successful evaluation with fewer training sets [35, 36]. Therefore, in the current study, image processing was performed using the U-Net architecture.
In the literature, there were many studies in which AI algorithms were used in the processing and interpretation of patient data, which played a role in diagnosis and treatment planning, such as dental radiographs [20, 37-39], intraoral photographs [40-43] and pathology images [44]. In addition, these systems were also used in situations such as pre-examination evaluation and risk estimation [45]. Also, it was seen that some of the studies aiming to determine periodontal disease from 2D dental radiographs using AI systems were performed on periapical radiographs [21,28,46] and some on panoramic radiographs [3, 6, 25, 29, 30].
In one of the studies in the literature, Lee et al. (2018) used 1740 periapical radiographs and evaluated the prediction success of the CNN algorithm they developed. In the results of this study, they reported that the accuracy of determining premolar teeth with periodontal damage was and for molars [27]. Similar to this study, Lee et al. (2021) performed another study on 693 periapical radiographs [18]. In this study, it was aimed to find the radiographic bone loss by grouping it according to the severity of destruction (stages I-II-III) [18] High success rates were found in the detection of periodontal disease in the results of these two studies.
On the other hand, Khan et al. (2021) tried to find dental problems such as caries, bone losses, and furcation defects on 206 periapical images using different AI architectures (U-Net, X Net, and Seg Net) in their study [28]. Although this study was similar to our study in terms of using the segmentation method in the detection of periodontal bone loss, no evaluation was made in terms of bone destruction characteristics (horizontal, vertical) [28]. Another difference was Khan et al. (2021) performed their studies on periapical radiographs and with fewer data [28]. Although the evaluations were made on different types of radiographs, it could be said that the success rates of our study were higher. We think that the reason for the higher success rates of the AI system developed in our study may be due to the use of a larger data set. Because as the number of data used for training in AI studies increases, the success rates of the model also increase [47].
In another study, Kurt Bayrakdar et al. (2021) used Google Net Inception v3 architecture on a large data set
(2276 panoramic radiographs). They evaluated the success of the AI systems they developed in the determination of radiographs of periodontitis cases [6]. In this study, 1137 radiographs of patients with bone loss and panoramic radiographs of 1139 periodontal healthy individuals were used for the development of the AI model. F1 score and accuracy were found as high as in this study [6]. However, no labeling was made, only the classification method was used to train the radiographs in the form of patient/healthy and to find them by the system. In this respect, they are quite different from our study in terms of this study planning. Based on this information, it can be said that the segmentation technique we used in our study is the most advantageous method and provides the physician with more detailed information for diagnosis and treatment planning.
There were also studies in the literature comparing the diagnosis of dentists with different experiences and AI model predictions. The results obtained in this way are undoubtedly more interpretable and reveal the success of the system more clearly. For example, Krois et al. (2019) compared the evaluation of 6 dentists and the results of AI in a panoramic radiography study with the CNN technique. They reported the accuracy, specificity, and sensitivity rates for the system as in the results of their study [25]. Since this study deals with the evaluation of many dentists, it was a more comprehensive and superior study in terms of planning. However, in the study of Krois et al. (2019), periodontal bone loss patterns were not classified as horizontal or vertical.
In another similarly planned study, Kim et al. (2020) compared the evaluations of 5 different clinicians with the performance of AI in their study for the determination of bone resorption sites using 12179 panoramic radiography [29]. They reported that while the average F1 scores of the clinicians’ results in determining bone loss were , AI showed higher success and the F1 score was . This study reveals the success of AI systems in radiography interpretation and shows promise for the future use of these systems [29]. Also, Chang et al. (2020) tried to perform the determination of bone loss from panoramic radiographs without any evaluation of bone destruction angulation and defect type [3]. In this study, the staging was tried to be made according to the 2017 periodontitis classification by calculating the amount of bone destruction and destruction [3].
Finally, Jiang et al. (2022) tried to detect periodontal bone destruction in their study using the CNN model using 640 panoramic radiographs. This study is the most similar to our study in the literature [30] because Jiang et al. (2022) also determined the bone loss patterns of periodontal disease in the form of vertical/horizontal/furcation defects in their study [30]. Although it was similar to our study in this respect, the object detection method
was used in this study for labeling. The segmentation method we use is a much more advantageous method since it determines the defective area with its borders. Because it provides more detailed information to the dentist to determine the severity of the disease and to plan the treatment in the next process. In addition, in this method, the defect area is processed like a detailed map and provides more advanced diagnostic support visually. On the other hand, when two studies were compared in detail, it was seen that they used multiple observers, and two different AI architectures (U-Net and Yolo-v4), and included the severity of the disease in their assessment.
One of the limitations of the study was that the decision of multiple observers was not separately compared with the predictions of AI. Another limitation was that no measurements were made to determine disease severity in the study and it was aimed to detect only bone losses. More extensive research could have been done using calibrated panoramic radiographs, based on direct measurement, or to determine the percentage of root affected. However, It should be noted that in all 2D radiographic imaging techniques, the evaluation of bone craters, lamina dura, and periodontal bone level is limited to the projection geometry and superposition of adjacent anatomical structures [48]. In other words, these radiographs do not provide clear and reliable information for measurement and treatment planning. For this reason, performing AI-based studies with threedimensional (3D) radiographic imaging techniques such as cone-beam computed tomography systems (CBCT) will prevent this limitation. Undoubtedly, as the number of studies in this field increases, AI algorithms with stronger decision-support capability and providing much more detailed information will be developed. Despite the limitations, our study is promising for such studies to be carried out in the future. In addition, the performance of the AI model in determining vertical bone losses in our study was lower than other periodontal parameters. It is a known fact that vertical bone losses are less common than horizontal bone loss, and therefore, the number of labels for vertical bone losses was more limited in our study [14]. We think that the number of labels used in the detection of vertical bone losses with AI in our study was therefore less, and this situation caused the performance of the model to be found to be lower. Because the most important thing in the success of AI studies is to work with large data sets. This limitation could be overcome, albeit to a limited extent, by using different AI architectures and making different technical plans. For example, in our study, cross-validation techniques could be used during model development and multi-class training could be done. On the other hand, the more important reason for the low success rates for the vertical bone loss parameter also may be the incomplete understanding of
the outline of the alveolar bone crest in 1,2 , and 3 -walled defects. We think that interobserver agreements were also lower for this parameter due to this limitation, which may be due to the limited view of panoramic radiography. This diagnostic difficulty can be eliminated by using some radiography techniques that provide more detailed images in future studies.

Conclusions

When the literature was examined, it was seen that the use of AI systems in dental radiographs for periodontal status determination has very successful and promising results. To the best of our knowledge, the present study is the first study aimed at detecting bone resorption and its patterns using deep learning algorithms and segmentation methods. These bone loss patterns play an important role in periodontal treatment planning and the prognosis of teeth. With this aspect, these systems are candidates to be a decision-support mechanism for dentists in radiographic interpretation. The development of these systems with more data sets will increase success rates. There is a need for more comprehensive studies on 2D and 3D radiographs in this regard.

Abbreviations

CNN Convolutional Neural Network
AI Artificial intelligence
2D Two-dimensional
loU Intersection over Union
ADAM Adaptive Moment Estimation
TP Numbers of true positives
FP Numbers of false positives
FN Numbers of false negatives
ROC Receiver operating characteristic
AUC Area under the ROC curve
3D Three-dimensional
CBCT Cone-beam computed tomography systems
STARD Standards for Reporting Diagnostic

Acknowledgements

This study has been supported by Eskisehir Osmangazi University Scientific Research Projects Coordination Unit under project number 202045E06.

Author contributions

All authors have made substantial contributions to the conception and design of the study. SKB, ISB, MBY, and NS have been involved in data collection and ÖÇ has been involved in data analysis. SKB, ISB, MBY, NS, OK, BCUS, and RJ have been involved in the data interpretation and drafting of the manuscript. SKB, ISB, BK, and KO have been involved in revising it critically and have given final approval for the version to be published. *The all participants in this study gave informed consent (both oral and written).

Funding

There is no funding.

Data availability

The datasets generated and/or analyzed during the current study are not publicly available due to the conditions specified when receiving approval from the ethics committee but are available from the corresponding author upon reasonable request.

Declarations

The research protocol was approved by the Eskisehir Osmangazi University Ethics Committee (decision number: 2019-227). All participants gave informed consent. We confirmed that the study was carried out according to the relevant guidelines and regulations of the Helsinki Declaration.
Additional informed consent was obtained from all individual participants included in the study.

Competing interests

The authors declare that there is no conflict of interest.

Author details

Faculty of Dentistry, Department of Periodontology, Eskisehir Osmangazi University, Eskisehir 26240, Turkey
Division of Oral and Maxillofacial Radiology, Department of Care Planning and Restorative Sciences, University of Mississippi Medical Center School of Dentistry, Jackson, MS, USA
Faculty of Dentistry, Department of Oral and Maxillofacial Radiology, Eskisehir Osmangazi University, Eskisehir, Turkey
Faculty of Science, Department of Mathematics and Computer Science, Eskisehir Osmangazi University, Eskisehir, Turkey
Faculty of Dentistry, Department of Periodontology, Recep Tayyip Erdogan University, Rize, Turkey
Faculty of Dentistry, Department of Periodontology, Dokuz Eylül University, İzmir, Turkey
Faculty of Dentistry, Department of Orthodontics, Eskisehir Osmangazi University, Eskisehir, Turkey
Division of Oral and Maxillofacial Radiology, Department of Care Planning and Restorative Sciences, University of Mississippi Medical Center School of Dentistry, Jackson, MS, USA
Faculty of Dentistry, Department of Oral and Maxillofacial Radiology, Ankara University, Ankara, Turkey

Received: 9 November 2023 / Accepted: 15 January 2024

Published online: 31 January 2024

References

  1. Dentino A, Lee S, Mailhot J, Hefti AF. Principles of periodontology. Periodontol 2000. 2013;61:16-53.
  2. Bourgeois D, Inquimbert C, Ottolenghi L, Carrouel F. Periodontal pathogens as Risk factors of Cardiovascular diseases, Diabetes, Rheumatoid Arthritis, Cancer, and Chronic Obstructive Pulmonary Disease-Is there cause for Consideration? Microorganisms 2019;7.
  3. Chang H-J, Lee S-J, Yong T-H, Shin N-Y, Jang B-G, Kim J-E, et al. Deep learning hybrid method to automatically diagnose periodontal bone loss and stage periodontitis. Sci Rep. 2020;10:1-8.
  4. Mol A. Imaging methods in periodontology. Periodontol 2000. 2004;34:34-48.
  5. Scarfe WC, Azevedo B, Pinheiro LR, Priaminiarti M, Sales MAO. The emerging role of maxillofacial radiology in the diagnosis and management of patients with complex periodontitis. Periodontol 2000. 2017;74:116-39.
  6. Kurt Bayrakdar S, Özer Ç, Bayrakdar IS, Orhan K, Bilgir E, Odabaş A, et al. Success of artificial intelligence system in determining alveolar bone loss from dental panoramic radiography images. Cumhuriyet Dent J. 2020;23:318-24.
  7. Rushton VE, Horner K. The use of panoramic radiology in dental practice. J Dent. 1996;24:185-201.
  8. Clerehugh V, Tugnait A. Diagnosis and management of periodontal diseases in children and adolescents. Periodontol 2000. 2001;26:146-68.
  9. Ivanauskaite D, Lindh C, Rangne K, Rohlin M. Comparison between Scanora panoramic radiography and bitewing radiography in the assessment of marginal bone tissue. Stomatologija. 2006;8(1):9-15. PMID: 16687909.
  10. de Faria Vasconcelos K, Evangelista KM, Rodrigues CD, Estrela C, de Sousa TO, Silva MA. Detection of periodontal bone loss using cone beam CT and intraoral radiography. Dentomaxillofac Radiol. 2012;41:64-9.
  11. Haas LF, Zimmermann GS, De Luca Canto G, Flores-Mir C, Corrêa M. Precision of cone beam CT to assess periodontal bone defects: a systematic review and meta-analysis. Dentomaxillofac Radiol. 2018;47:20170084.
  12. Persson RE, Hollender LG, Laurell L, Persson GR. Horizontal alveolar bone loss and vertical bone defects in an adult patient population. J Periodontol. 1998;69:348-56.
  13. Gomes-Filho IS, Sarmento VA, de Castro MS, da Costa NP, da Cruz SS, Trindade SC, et al. Radiographic features of periodontal bone defects: evaluation of digitized images. Dentomaxillofac Radiol. 2007;36:256-62.
  14. Jayakumar A, Rohini S, Naveen A, Haritha A, Reddy K. Horizontal alveolar bone loss: a periodontal orphan. J Indian Soc Periodontol. 2010;14:181-5.
  15. Braun , Ritter , Jervøe-Storm PM, Frentzen M. Diagnostic accuracy of CBCT for periodontal lesions. Clin Oral Investig. 2014;18:1229-36.
  16. Papapanou PN, Sanz M, Buduneli N, Dietrich T, Feres M, Fine DH, et al. Periodontitis: Consensus report of workgroup 2 of the 2017 World workshop on the classification of Periodontal and Peri-implant diseases and conditions. J Periodontol. 2018;89(Suppl 1):173-s82.
  17. Ertaş K, Pence I, Cesmeli MS, Ay ZY. Determination of the stage and grade of periodontitis according to the current classification of periodontal and peri-implant diseases and conditions (2018) using machine learning algorithms. J Periodontal Implant Sci. 2023;53(1):38-53. https://doi.org/10.5051/ jpis. 2201060053.
  18. Lee CT, Kabir T, Nelson J, Sheng S, Meng HW, Van Dyke TE, et al. Use of the deep learning approach to measure alveolar bone level. J Clin Periodontol. 2022;49:260-9.
  19. Sen D, Chakrabarti R, Chatterjee S, Grewal DS, Manrai K. Artificial intelligence and the radiologist: the future in the Armed Forces Medical Services. BMJ Mil Health. 2020;166:254-6.
  20. Kurt Bayrakdar S, Orhan K, Bayrakdar IS, Bilgir E, Ezhov M, Gusarev M, et al. A deep learning approach for dental implant planning in cone-beam computed tomography images. BMC Med Imaging. 2021;21:86.
  21. Lee JH, Kim DH, Jeong SN, Choi SH. Detection and diagnosis of dental caries using a deep learning-based convolutional neural network algorithm. J Dent. 2018;77:106-11.
  22. Fukuda M, Inamoto K, Shibata N, Ariji Y, Yanashita Y, Kutsuna S, et al. Evaluation of an artificial intelligence system for detecting vertical root fracture on panoramic radiography. Oral Radiol. 2020;36:337-43.
  23. Bilgir E, Bayrakdar İ, Çelik Ö, Orhan K, Akkoca F, Sağlam H, et al. An artifıcial intelligence approach to automatic tooth detection and numbering in panoramic radiographs. BMC Med Imaging. 2021;21:124.
  24. Bayrakdar IS, Orhan K, Çelik Ö, Bilgir E, Sağlam H, Kaplan FA, et al. A U-Net Approach to apical lesion segmentation on panoramic radiographs. Biomed Res Int. 2022;2022:7035367.
  25. Krois J, Ekert T, Meinhold L, Golla T, Kharbot B, Wittemeier A, et al. Deep learning for the Radiographic detection of Periodontal Bone loss. Sci Rep. 2019;9:8495.
  26. Thanathornwong B, Suebnukarn S. Automatic detection of periodontal compromised teeth in digital panoramic radiographs using faster regional convolutional neural networks. Imaging Sci Dent. 2020;50:169-74.
  27. Lee JH, Kim DH, Jeong SN, Choi SH. Diagnosis and prediction of periodontally compromised teeth using a deep learning-based convolutional neural network algorithm. J Periodontal Implant Sci. 2018;48:114-23.
  28. Khan HA, Haider MA, Ansari HA, Ishaq H, Kiyani A, Sohail K, et al. Automated feature detection in dental periapical radiographs by using deep learning. Oral Surg Oral Med Oral Pathol Oral Radiol. 2021;131:711-20.
  29. Kim J, Lee HS, Song IS, Jung KH. DeNTNet: deep neural transfer network for the detection of periodontal bone loss using panoramic dental radiographs. Sci Rep. 2019;9:17615.
  30. Jiang L, Chen D, Cao Z, Wu F, Zhu H, Zhu F. A two-stage deep learning architecture for radiographic staging of periodontal bone loss. BMC Oral Health. 2022;22:106.
  31. Helmi MF, Huang H, Goodson JM, Hasturk H, Tavares M, Natto ZS. Prevalence of periodontitis and alveolar bone loss in a patient population at Harvard School of Dental Medicine. BMC Oral Health. 2019;19:254. https://doi. org/10.1186/s12903-019-0925-z.
  32. Wylleman A, Van Der Veken D, Teughels W, Quirynen M, Laleman I. Alveolar bone level at deciduous molars in flemish children: a retrospective, radiographic study. J Clin Periodontol. 2020;47:660-7. https://doi.org/10.1111/ jcpe. 13280.
  33. Castro LO, Castro IO, de Alencar AHG, Valladares-Neto J, Estrela C. Cone beam computed tomography evaluation of distance from cementoenamel
    junction to alveolar crest before and after nonextraction orthodontic treatment. Angle Orthod. 2015;86:543-9. https://doi.org/10.2319/040815-235.1.
  34. Ronneberger O, Fischer P, Brox T. U-net: Convolutional networks for biomedical image segmentation. International Conference on Medical image computing and computer-assisted intervention: Springer; 2015. p. 234-41.
  35. Zhou Z, Siddiquee MMR, Tajbakhsh N, Liang J. UNet++: A nested U-Net Architecture for Medical Image Segmentation. Deep Learn Med Image Anal Multimodal Learn Clin Decis Support (2018). 2018;11045:3-11.
  36. Du G, Cao X, Liang J, Chen X, Zhan Y. Medical image segmentation based on u-net: a review. J Imaging Sci Technol. 2020;64:1-12.
  37. Lee S, Kim D, Jeong HG. Detecting 17 fine-grained dental anomalies from panoramic dental radiography using artificial intelligence. Sci Rep. 2022;12:5172.
  38. Kılıc MC, Bayrakdar IS, Çelik Ö, Bilgir E, Orhan K, Aydın OB, et al. Artificial intelligence system for automatic deciduous tooth detection and numbering in panoramic radiographs. Dentomaxillofac Radiol. 2021;50:20200172.
  39. Pauwels R, Brasil DM, Yamasaki MC, Jacobs R, Bosmans H, Freitas DQ, et al. Artificial intelligence for detection of periapical lesions on intraoral radiographs: comparison between convolutional neural networks and human observers. Oral Surg Oral Med Oral Pathol Oral Radiol. 2021;131:610-6.
  40. Zhang X, Liang Y, Li W, Liu C, Gu D, Sun W, et al. Development and evaluation of deep learning for screening dental caries from oral photographs. Oral Dis. 2022;28:173-81.
  41. Takahashi T, Nozaki K, Gonda T, Mameno T, Ikebe K. Deep learning-based detection of dental prostheses and restorations. Sci Rep. 2021;11:1960
  42. Fu Q, Chen Y, Li Z, Jing Q, Hu C, Liu H, et al. A deep learning algorithm for detection of oral cavity squamous cell carcinoma from photographic images: a retrospective study. EClinicalMedicine. 2020;27:100558.
  43. Li W, Liang Y, Zhang X, Liu C, He L, Miao L, et al. A deep learning approach to automatic gingivitis screening based on classification and localization in RGB photos. Sci Rep. 2021;11:16831.
  44. Zehra T, Shaikh A, Shams M. Dawn of artificial intelligence – enable digital Pathology in Pakistan: a paradigm shift. J Pak Med Assoc. 2021;71:2683-4.
  45. Alhazmi A, Alhazmi Y, Makrami A, Masmali A, Salawi N, Masmali K, et al. Application of artificial intelligence and machine learning for prediction of oral cancer risk. J Oral Pathol Med. 2021;50:444-50.
  46. Alotaibi G, Awawdeh M, Farook FF, Aljohani M, Aldhafiri RM, Aldhoayan M. Artificial intelligence (AI) diagnostic tools: utilizing a convolutional neural network (CNN) to assess periodontal bone level radiographically-a retrospective study. BMC Oral Health. 2022;22:399.
  47. Surya L. An exploratory study of AI and Big Data, and it’s future in the United States. Int J Creative Res Thoughts (IJCRT), ISSN 2015;2320-882.
  48. Acar B, Kamburoğlu K. Use of cone beam computed tomography in periodontology. World J Radiol. 2014;28(5):6.

Publisher’s Note

Springer Nature remains neutral with regard to jurisdictional claims in published maps and institutional affiliations.

  1. *Correspondence:
    Sevda Kurt-Bayrakdar
    dt.sevdakurt@hotmail.com
    Full list of author information is available at the end of the article