المجلة: Scientific Reports، المجلد: 14، العدد: 1
DOI: https://doi.org/10.1038/s41598-024-52823-9
PMID: https://pubmed.ncbi.nlm.nih.gov/38302604
تاريخ النشر: 2024-02-01
DOI: https://doi.org/10.1038/s41598-024-52823-9
PMID: https://pubmed.ncbi.nlm.nih.gov/38302604
تاريخ النشر: 2024-02-01
كشف أورام الدماغ من الصور والمقارنة مع طرق التعلم بالنقل وشبكة الأعصاب التلافيفية ذات الثلاث طبقات
الصحة مهمة جداً لحياة الإنسان. وبشكل خاص، صحة الدماغ، الذي يعد التنفيذي للموارد الحيوية، مهمة جداً. يتم توفير التشخيص لصحة الإنسان بواسطة أجهزة التصوير بالرنين المغناطيسي (MRI)، التي تساعد صانعي القرار الصحيين في الأعضاء الحيوية مثل صحة الدماغ. الصور من هذه الأجهزة هي مصدر للبيانات الضخمة للذكاء الاصطناعي. هذه البيانات الضخمة تمكن من أداء عالي في مشاكل تصنيف معالجة الصور، وهو فرع فرعي من الذكاء الاصطناعي. في هذه الدراسة، نهدف إلى تصنيف أورام الدماغ مثل الورم الدبقي، ورم السحايا، ورم الغدة النخامية من صور الرنين المغناطيسي للدماغ. تم استخدام الشبكة العصبية التلافيفية (CNN) وأساليب التعلم المنقول المعتمدة على CNN مثل Inception-V3 وEfficientNetB4 وVGG19 للتصنيف. تم استخدام قيمة F-score، والاسترجاع، والطباعة، والدقة لتقييم هذه النماذج. تم الحصول على أفضل نتيجة دقة مع VGG16 بنسبة 98%، بينما كانت قيمة F-score لنفس نموذج التعلم المنقول هي
لقد تم تحويل صناعة الرعاية الصحية بسرعة بواسطة التقدم التكنولوجي في السنوات الأخيرة، وأحد المكونات المهمة لهذا التحول هو تكنولوجيا الذكاء الاصطناعي (AI). الذكاء الاصطناعي هو نظام حاسوبي يحاكي الذكاء البشري وله العديد من التطبيقات في الطب. أحد هذه المجالات هو مكافحة أورام الدماغ. تعتبر أورام الدماغ مشكلة صحية عامة رئيسية في قطاع الرعاية الصحية، وتعتبر عمليات التشخيص والعلاج والمتابعة الدقيقة أمرًا حاسمًا. أصبح الذكاء الاصطناعي أداة مهمة لتحسين هذه العمليات وله إمكانات كبيرة للتشخيص المبكر وعلاج أورام الدماغ.
تؤثر أورام الدماغ على صحة الإنسان بسبب موقعها
يمكن أيضًا استخدام الذكاء الاصطناعي لتتبع تقدم المريض خلال العلاج. يمكن استخدام تحليلات الذكاء الاصطناعي لتقييم استجابة العلاج والتنبؤ بإمكانية تكرار الورم. بهذه الطريقة، يمكن تنظيم خطط علاج المرضى بشكل أكثر فعالية ويمكن تطوير أساليب علاج فردية.
في هذه الدراسة، تم إجراء كشف عن الفروق على صور الدماغ. تم إجراء التصنيف باستخدام CNN متعددة الطبقات وأساليب التعلم المنقول المعتمدة على CNN على 4 فئات تم تصنيفها بواسطة الأطباء.
مساهمة الدراسة هي كما يلي.
- نحقق في أسلوب التعلم المنقول الذي يحقق أعلى أداء في عملية التصنيف لأساليب التعلم المنقول على صور الدماغ.
- نحقق في أداء CNN والتعلم المنقول على صور الدماغ باستخدام CNN كطبقة متعددة دون استخدام التعلم المنقول.
- نحقق فيما إذا كان من الممكن تحقيق نتائج جيدة مع مجموعة بيانات مشوهة ومنخفضة الجودة.
يظهر مخطط تدفق الدراسة في الشكل 1.
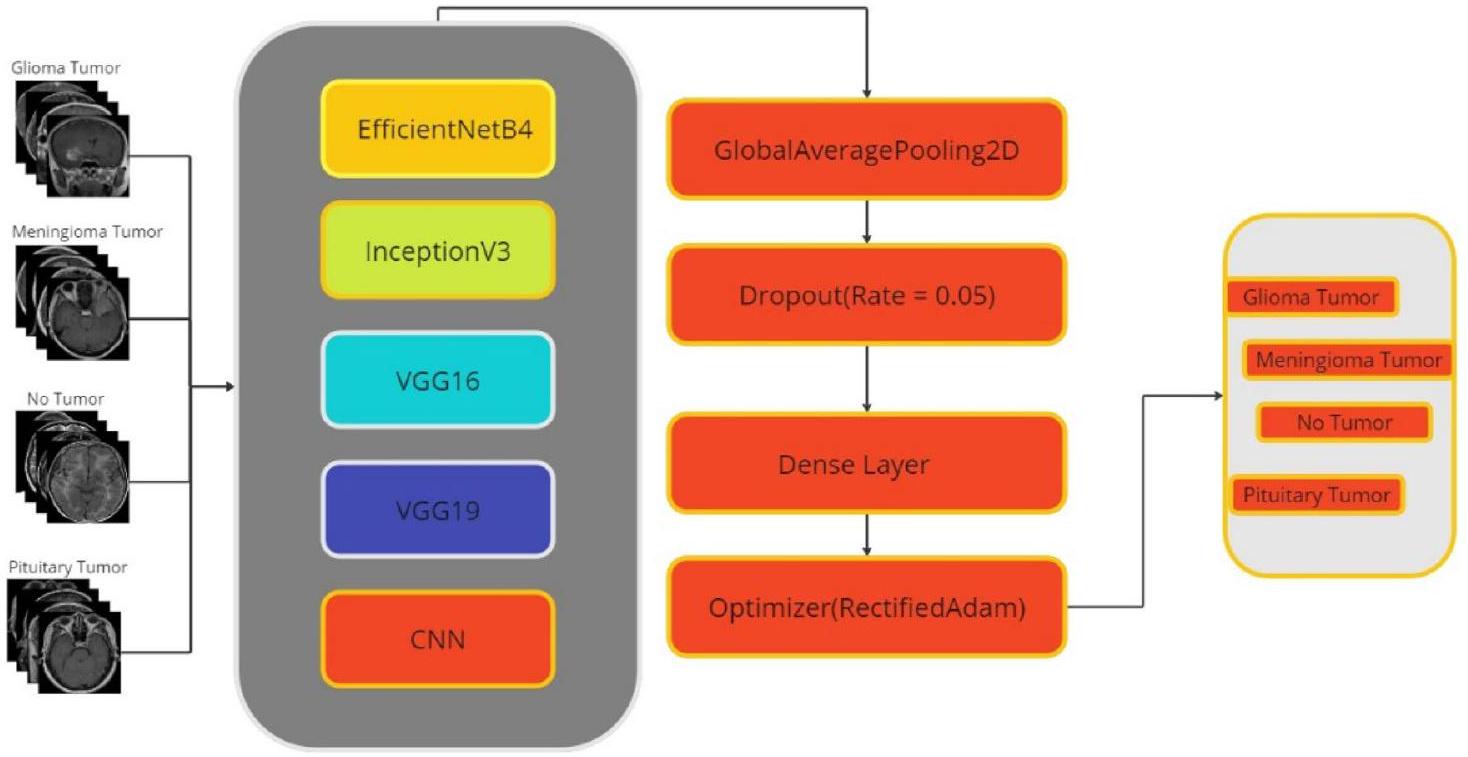
الشكل 1. مخطط تدفق العمل.
سيتم مسح الدراسات حول أورام الدماغ في السنوات الخمس الماضية من فهارس مثل WOS وIEEE وسيتم شرح تفاصيل الدراسات ذات الصلة في هذا القسم.
في دراسة شملت 3064 صورة MRI من 233 مريضًا تنتمي إلى 4 فئات ورمية مختلفة (ورم سحائي، ورم دبقي، ورم الغدة النخامية) باستخدام آلة الدعم الناقل (SVM) على مجموعات بيانات تم إنشاؤها بعد معالجة مسبقة متنوعة، تم الحصول على قيمة دقة بين
طريقة المادة
يصف هذا القسم مجموعة البيانات، وخوارزمية التصنيف (CNN) المستخدمة في الدراسة، وهياكل التعلم المنقول VGG19 وVGG16 وInceptionV3 وEfficientNetB4 التي تم تطويرها بناءً على هذه الخوارزمية.
مصدر البيانات
تتكون مجموعة البيانات من إجمالي 2870 صورة MRI للدماغ البشري مصنفة بشكل منهجي إلى أربع فئات مختلفة: ورم دبقي، ورم سحائي، لا يوجد ورم، وغدة نخامية. يتم عرض توزيع الصور المسمى في هذه الفئات الأربع في الجدول 1 للرجوع إليه
| البيانات | ورم دبقي | ورم سحائي | لا يوجد ورم | غدة نخامية | الإجمالي |
| بيانات التدريب | 696 | 704 | 316 | 676 | 2452 |
| بيانات الاختبار | 92 | 93 | 49 | 90 | 324 |
| بيانات التحقق | 138 | 140 | 75 | 135 | 488 |
الجدول 1. توزيع مجموعة بيانات أورام الدماغ المعالجة مسبقًا.
يعتبر الورم الدبقي أكثر أنواع أورام الدماغ الخبيثة شيوعًا وعادة ما يحدث في الخلايا الدبقية في الدماغ والحبل الشوكي. ورم السحايا هو نوع حميد من أورام الدماغ، ولكنه يمكن أن يصبح خبيثًا دون تدخل مناسب. يتم تصنيف هذه الفئات بواسطة الأطباء. حجم الصور المدخلة هو
التعلم العميق
التعلم العميق هو فرع من فروع تعلم الآلة يركز على تدريب الشبكات العصبية الاصطناعية لأداء مهام معقدة من خلال تعلم الأنماط والتمثيلات مباشرة من البيانات. على عكس أساليب تعلم الآلة التقليدية التي تتطلب هندسة ميزات يدوية، تقوم خوارزميات التعلم العميق باستخراج الميزات الهرمية من البيانات بشكل مستقل، مما يؤدي إلى إنشاء نماذج قوية ودقيقة للغاية.
شبكة عصبية تلافيفية
تمثل الشبكات العصبية التلافيفية تقدمًا كبيرًا في التعلم العميق ورؤية الكمبيوتر. تم تصميم هذه الهياكل خصيصًا لاستخراج ميزات ذات مغزى من البيانات البصرية المعقدة، مثل الصور والفيديو. الهيكل الأساسي لشبكة CNN، الذي يتكون من طبقات تلافيفية وطبقات تجميع وطبقات متصلة بالكامل، يحاكي قدرة النظام البصري البشري على التعرف على الأنماط والميزات الهرمية. تستخدم الطبقات التلافيفية عمليات تلافيفية لاكتشاف الميزات المحلية، والتي يتم تجريدها تدريجيًا بواسطة طبقات التجميع التي تضغط المعلومات. يتم بعد ذلك تغذية التمثيلات الهرمية الناتجة إلى طبقات متصلة بالكامل لمهام التصنيف أو الانحدار. لقد أعادت CNN تعريف مشهد التعرف على الصور، محققة نجاحًا ملحوظًا في مجالات متنوعة تتراوح بين تصنيف الصور واكتشاف الكائنات إلى التعرف على الوجوه وتحليل الصور الطبية.
تعلم النقل
يعتبر التعلم بالنقل مفهومًا أساسيًا في كل من تعلم الآلة والتعلم العميق، حيث يتضمن استخدام المعرفة المكتسبة من تدريب نموذج على مهمة معينة ثم تطبيق تلك المعرفة على مهمة أخرى ذات صلة. في مجال الشبكات العصبية، يظهر التعلم بالنقل قوة كبيرة. ويشمل عملية استخدام نموذج مدرب مسبقًا، عادةً ما يكون مدربًا على مجموعة بيانات شاملة ومتنوعة، ثم ضبطه على مجموعة بيانات أو مهمة جديدة.
في هذه الدراسة، تم استخدام نماذج التعلم الانتقالي InceptionV3 و VGG16 و VGG19 و EfficientNetB4 في عملية التصنيف.
في جي جي
تعتبر هذه العمارة نموذج CNN بارز تم تقديمه بواسطة
إيفيشنت نت
EfficientNet هي عائلة من نماذج الشبكات العصبية التلافيفية القابلة للتوسع والفعالة. الهدف الرئيسي من هذه السلسلة هو تحقيق أداء أفضل مع عدد أقل من المعلمات. مصطلح “EfficientNet” هو مزيج من كلمتي “الكفاءة” و”الشبكة”. تُستخدم سلسلة النماذج بشكل أساسي في مهام المعالجة البصرية مثل تصنيف الصور.
EfficientNet هي عائلة من النماذج التي تقدم نتائج تنافسية من حيث الأداء وتكلفة الحوسبة. تقدم تنوعات بأحجام وتعقيدات مختلفة على مقاييس مختلفة. النماذج ذات الأرقام الأعلى عادة ما تكون أكبر وأكثر تعقيدًا، لكنها تتطلب المزيد من قوة الحوسبة. كانت النموذج الأعلى أداءً في مسابقة ImageNet.
البداية
معمارية Inception هي معمارية تستخدم في مجال التعلم العميق والشبكات العصبية التلافيفية. تم تصميمها لأداء مهام استخراج الميزات والتصنيف بشكل أكثر كفاءة. تم تقديمها لأول مرة في ورقة بعنوان “الذهاب أعمق مع التلافيف”، وتهدف معمارية Inception إلى تقديم أداء أفضل عند معالجة مجموعات البيانات البصرية المعقدة.
مقياس الأداء
تُستخدم طرق تقييم الأداء مثل الدقة، والتميز، والاسترجاع، ودرجة F لتقييم النماذج التي تم إنشاؤها لمشاكل التصنيف مثل معالجة الصور. تُستخرج هذه الطرق من مصفوفة الالتباس. تُعطى مصفوفة الالتباس في الجدول
في الجدول 2، الرموز
منحنى خصائص التشغيل المستقبلية (ROC)
منحنى ROC هو أداة رسومية تُستخدم لتقييم أداء نموذج التصنيف، خاصة في سيناريوهات التصنيف الثنائي. يوفر تصورًا لحساسية النموذج وخصوصيته، موضحًا تباينهما مع تغيير العتبات.
بالإضافة إلى ذلك، فإن المساحة تحت منحنى خصائص التشغيل المستقبلية (ROC)، والتي تُعرف عادةً بـ “المساحة تحت المنحنى”، تلخص بشكل موجز أداء النموذج العام في مقياس واحد. تتراوح قيمة AUC من 0 إلى 1، حيث تشير القيم الأقرب إلى 1 إلى زيادة القدرة التمييزية للنموذج.
الموافقة على المشاركة
نظرًا لأن البيانات مفتوحة المصدر، لم يتم إجراء تجارب على البشر من قبل المؤلفين. لقد تم دراسة المصدر المفتوح على صور الرنين المغناطيسي.
إعدادات التجربة والنتائج
تتناول هذه الدراسة مشكلة تصنيف الصور باستخدام طرق التعلم العميق. المشكلة الأكثر أهمية والأكثر دراسة من بين هذه المشكلات هي تلك المتعلقة بالصور الصحية. في هذا السياق، تم اختيار خمسة نماذج مختلفة (InceptionV3، EfficientNetB4، VGG16، VGG19، Multi-Layer CNN) لتصنيف أورام الدماغ وتمت مقارنة أدائها على نفس مجموعة البيانات.
شبكة عصبية تلافيفية متعددة الطبقات
أولاً، نحتاج إلى تحديد بنية نموذجنا. الشكل المدخلي لبياناتنا هو
| القيمة الفعلية | |||
| إيجابي | سلبي | إجمالي | |
| تقدير القيمة | |||
| إيجابي |
|
|
تي بوس |
| سلبي |
|
|
تي نيج |
| إجمالي | إيجابي | نيغ | M |
الجدول 2. مصفوفة الالتباس.
يتم تحويل خريطة الميزات الناتجة إلى متجه مسطح باستخدام طبقة تسطيح. ثم يتم إضافة طبقة مخفية (كثيفة) تحتوي على 128 خلية عصبية. تعمق هذه الطبقة الميزات المتعلمة وتزيد من التعميم. أخيرًا، تحتوي طبقة الإخراج على 4 خلايا عصبية وتحسب الاحتمالات بين الفئات باستخدام دالة تفعيل سوفتماكس. لتدريب نموذجنا، نحتاج إلى تحديد الدالة والمعايير المثلى. في هذه الورقة، نستخدم خوارزمية تحسين ريكتي فايد آدم. تقوم هذه الخوارزمية بضبط معدل التعلم ديناميكيًا وتساعد على استخدام التدرجات بشكل أكثر كفاءة. أيضًا، يتم استخدام خسارة الانتروبيا المتقاطعة الفئوية كدالة خسارة أثناء التدريب، حيث إنها مستخدمة على نطاق واسع في مهام التصنيف متعددة الفئات.
المقاييس التي تم تتبعها خلال التدريب هي الدقة، بالإضافة إلى الدقة والاسترجاع. هذه المقاييس مهمة لتقييم أداء التصنيف للنموذج. بالإضافة إلى ذلك، يتم استخدام استرجاع معدل التعلم المنخفض (ReduceLROnPlateau) لضبط معدل التعلم بشكل ديناميكي. هذا الاسترجاع يقلل من معدل التعلم عندما يصبح دالة الخسارة مسطحة خلال عملية التدريب، مما يؤدي إلى تدريب أكثر استقرارًا. تم تعيين عدد الدورات إلى 14 وحجم الدفعة إلى 10.
التعلم بالنقل القائم على الشبكات العصبية التلافيفية
في هياكل التعلم بالنقل، تكون جميع المعلمات والطبقات خارج النموذج هي نفسها، ولكن بعد إزالة آخر 3 طبقات من نماذج التعلم بالنقل، تتم إضافة طبقات فريدة من نوعها لمجموعة البيانات بدلاً من ذلك: تحتوي طبقة GlobalAveragePooling2D على عدد أقل من المعلمات مقارنةً بطبقة Flatten، مما يقلل من خطر الإفراط في التكيف ويساعد في بناء نموذج أكثر كفاءة. أيضًا، بينما تُستخدم طبقة Flatten لتنظيم البيانات، تُستخدم طبقة GlobalAveragePooling2D لاستخراج الميزات، مما يجعل عملية تعلم الشبكة أكثر كفاءة.
نظرًا لأن بيانات التدريب تميل إلى التعلم بسرعة كبيرة مقارنة ببيانات التحقق، قمنا بتعديل نسبة طبقات الإسقاط في الهياكل الأصلية. بالنسبة لجميع النماذج، تم تعيين معدل التخفيف إلى 0.05. خلال عملية تدريب النموذج، كان المحسن المحدد هو “RectifiedAdam”، مع تكوين معلمات المحسن على النحو التالي: معدل التعلم
خلال عملية تدريب النموذج، تم استخدام دالة “ReduceLROnPlateau” من مكتبة Keras كخوارزمية لتراجع الأخطاء. تقوم هذه الدالة تلقائيًا بتقليل معدل التعلم عندما يقترب النموذج من حد محلي أو عندما لا تنخفض قيمة الخسارة. معلمات دالة “ReduceLROnPlateau” هي كما يلي: المراقبة: المقياس الذي يتم مراقبته عادة هو “val_loss” (خسارة التحقق). هذا هو المقياس المستخدم لتحديد ما إذا كان يجب تقليل معدل التعلم:
- الصبر: الوقت المتوقع للصبر لتقليل معدل التعلم، أي المدة التي يجب أن لا يتحسن فيها المقياس.
- العامل: العامل المستخدم لتقليل معدل التعلم. على سبيل المثال، قيمة 0.3 تقلل معدل التعلم بـ
. - min_lr: يحدد الحد الأدنى لمعدل التعلم القابل للتحقيق. هذا يحدد معدل التعلم دون جعله ضئيلاً.
استخدام هذه الميزة يسمح بتدريب نموذج أكثر استقرارًا وكفاءة، مما يسهل عملية ضبط معلمات التدريب دون الحاجة إلى تعديل معدل التعلم يدويًا. تم تشغيل برنامج التدريب على مدى 14 دورة مع دفعات بحجم 10. تفاصيل نموذج الشبكة العصبية التلافيفية متعددة الطبقات المستخدمة في الدراسة موضحة في الشكل 2، الذي يوضح ميزاته المعمارية.
تظهر رسومات فقدان دقة التدريب والتحقق للنماذج التي تم إنشاؤها باستخدام VGG19 و EfficientNetB4 و InceptionV3 للتعلم الانتقالي و CNN في الشكل 3.
يوضح الجدول 3 دقة النتائج، ودرجة F، والاسترجاع، والدقة، ونتائج AUC للنماذج التي تم إنشاؤها في الدراسة.
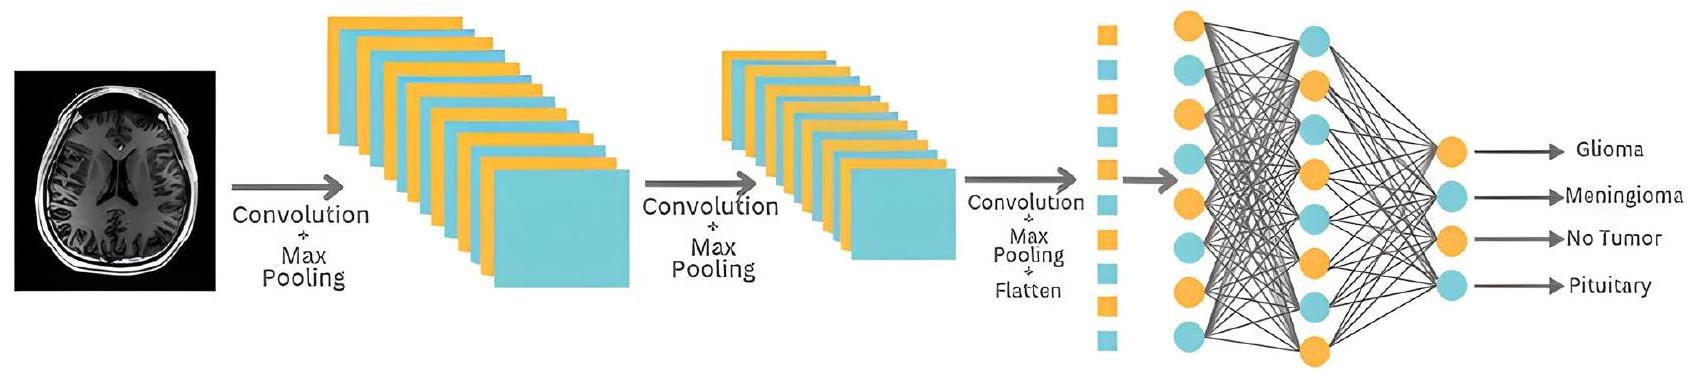
الشكل 2. هيكل نموذج الشبكة العصبية التلافيفية متعددة الطبقات.
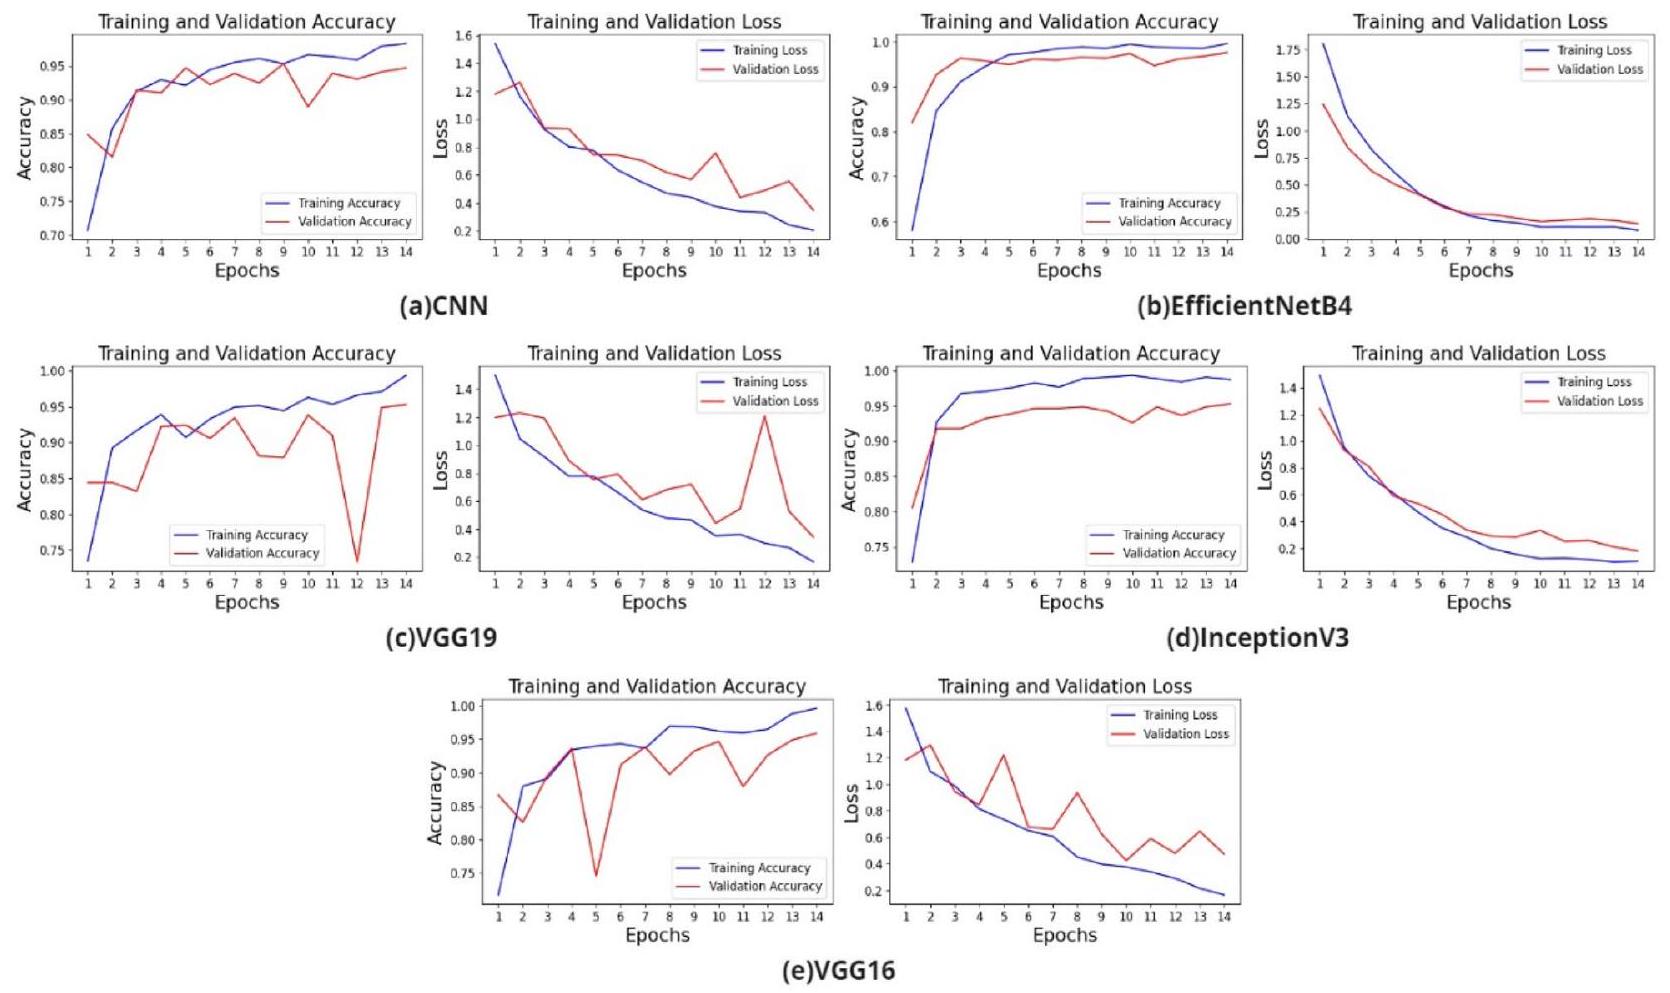
الشكل 3. منحنيات التعلم للخسائر والدقة لـ (أ) نموذج CNN، (ب) نموذج EfficientNetB4، (ج) نموذج VGG19، (د) نموذج InceptionV3، (هـ) نموذج VGG16.
| نماذج | دقة | درجة F | استدعاء | دقة | الجامعة الأمريكية في القاهرة |
| VGG19 | 96 | 96 | 96 | 96 | 99 |
| EfficientNETB4 | 97 | 96 | 97 | 97 | 99 |
| إنسيبشن V3 | 96 | 96 | 96 | 96 | 99 |
| نموذج 3 CNN | 91 | 90 | 91 | 91 | ٩٨ |
| VGG16 | 98 | 97 | 98 | 98 | 99 |
الجدول 3. أداء النماذج (%) التي تم إنشاؤها في الدراسة.
وفقًا للجدول 3، تم الحصول على أفضل نتيجة دقة بواسطة VGG16 مع
وفقًا لقيم AUC في الشكل 4، تتمتع نماذج التعلم الانتقالي VGG وInceptionV3 وEfficientNetB4 والنماذج المبنية باستخدام CNN بميزات مميزة. يتم عرض مصفوفة الارتباك للدراسة حول تصنيف الورم الدبقي، والورم السحائي، والمرضى العاديين غير المصابين بالأورام، ومرضى الأورام النخامية في مجموعة البيانات حسب نوع الورم في الشكل 5.
كما هو موضح في مصفوفة الارتباك في الشكل 5، فإن أداء التصنيف مرتفع لجميع النماذج الأربعة (نماذج VGG16 و VGG19، نموذج CNN، نموذج EfficientNetB4، نموذج InceptionV3).
النتائج والمناقشة
كجزء من الدراسة، تم تدريب نماذج CNN ونماذج التعلم الانتقالي المستندة إلى CNN مثل InceptionV3 و EfficientNetB4 و VGG19 على بيانات مفتوحة المصدر لمرضى أورام الدماغ. تم الحصول على أفضل نتيجة دقة مع EfficientNetB4 مع
كما هو موضح في الجدول 4، فإن نماذج التعلم العميق المعتمدة على الشبكات العصبية التلافيفية المستخدمة في الدراسة أدت أداءً أفضل. تلعب الذكاء الاصطناعي في الرعاية الصحية دورًا مهمًا في إدارة الأمراض المعقدة مثل أورام الدماغ. يمكّن الذكاء الاصطناعي من تحقيق تشخيص وعلاج أسرع وأكثر دقة وفعالية. ومع ذلك، فإن تقنية الذكاء الاصطناعي ليست مخصصة لاستبدال الأطباء تمامًا، بل لدعم وتعزيز عملهم. لتحقيق الإمكانات الكاملة للذكاء الاصطناعي، من المهم النظر في قضايا مثل الأخلاقيات والأمان والخصوصية. في المستقبل، ستستمر الحلول المعتمدة على الذكاء الاصطناعي في المساهمة في إدارة أفضل لأورام الدماغ وغيرها من المشاكل الصحية، وتحسين جودة الحياة.
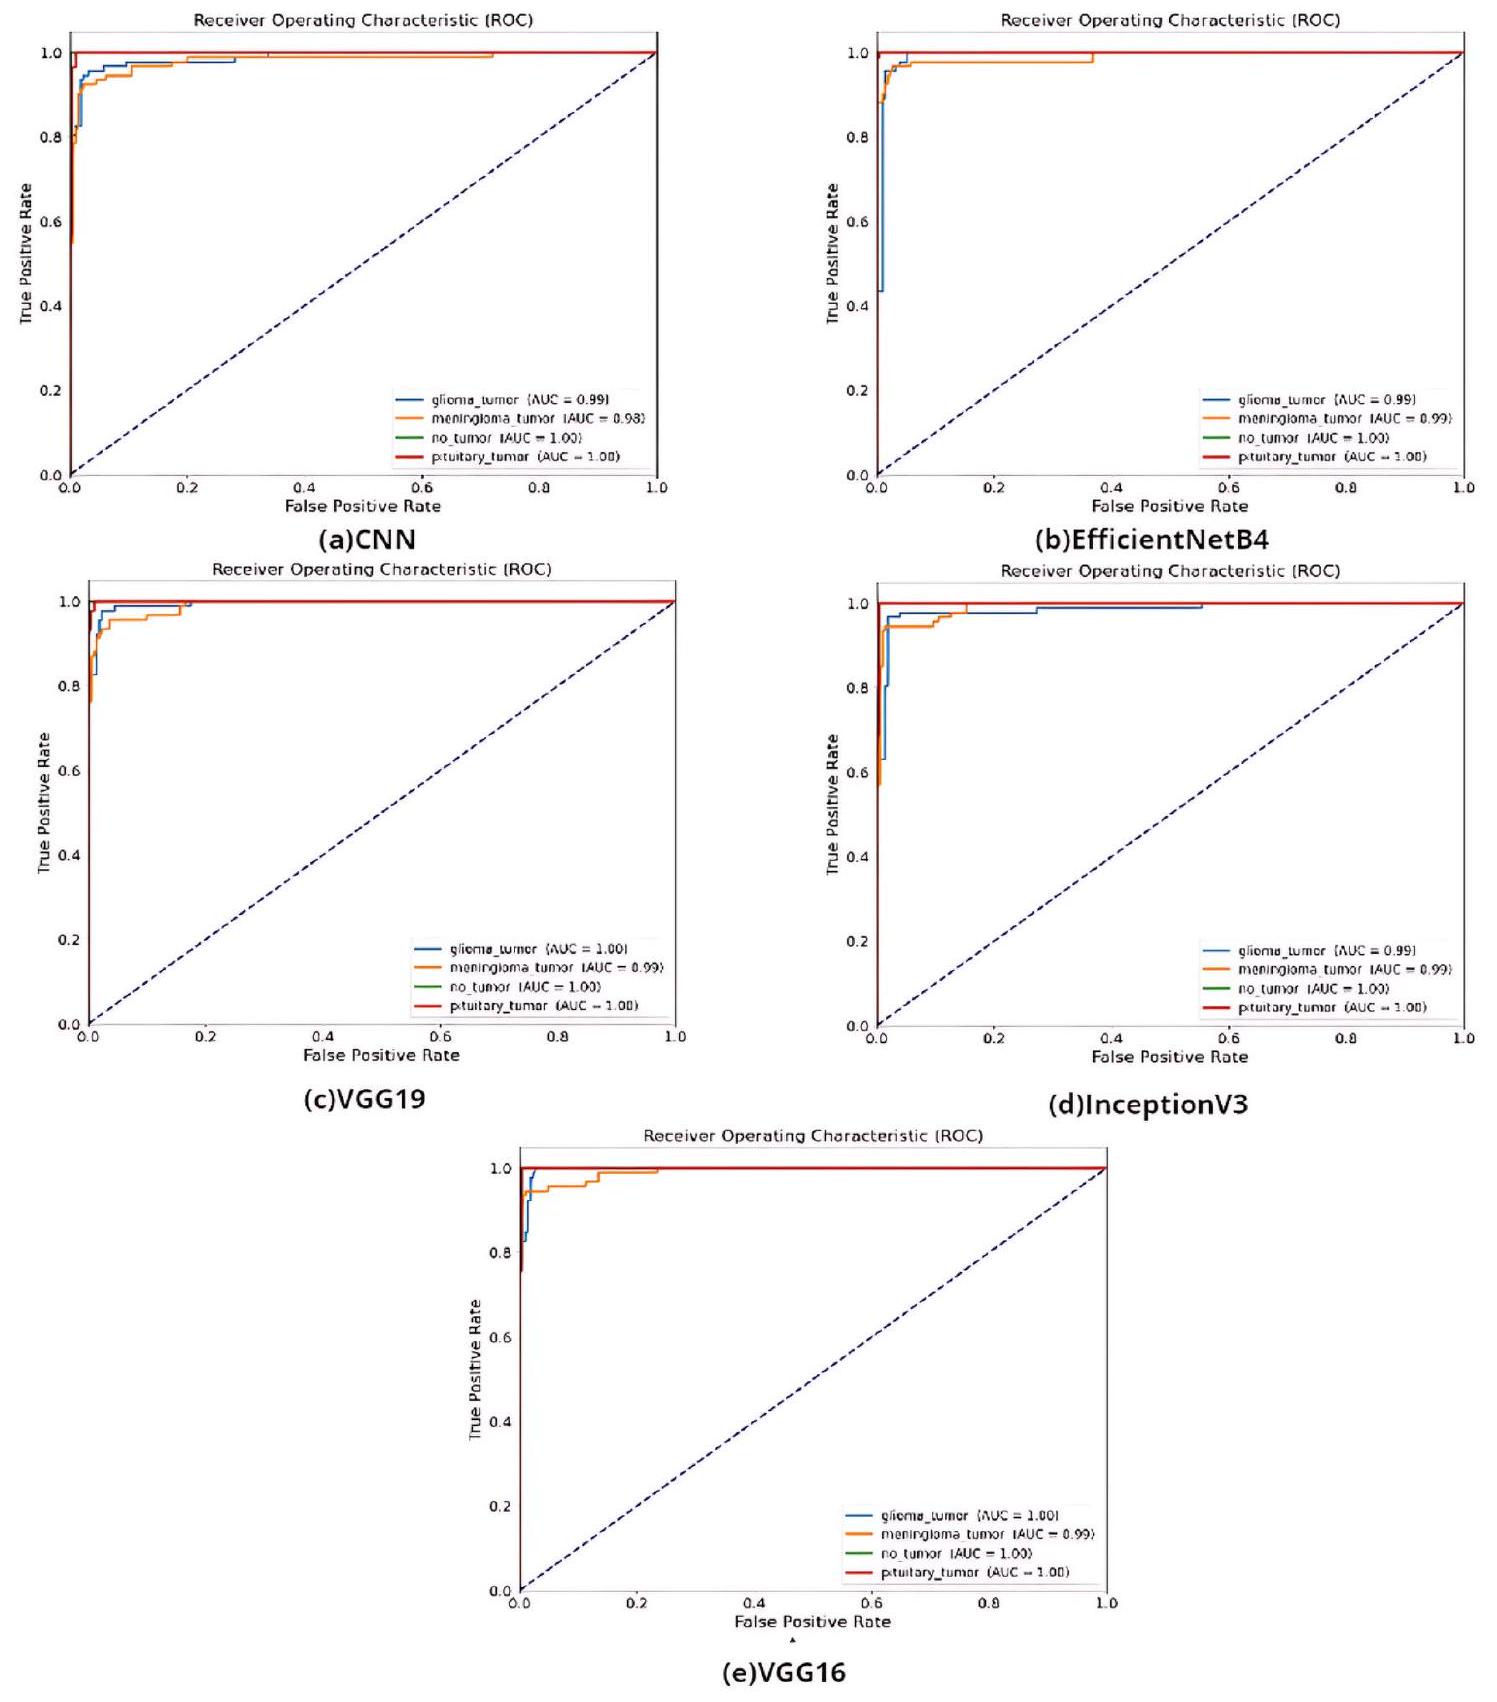
الشكل 4. منحنى ROC لنموذج (أ) CNN، (ب) نموذج EfficientNetB4، (ج) نموذج VGG19، (د) نموذج InceptionV3، (هـ) نموذج VGG16.
للمرضى. كما هو موضح في هذه الدراسة، ستزداد أهمية الدراسات المعتمدة على الذكاء الاصطناعي لصحة الإنسان، من التشخيص المبكر إلى التقدم الإيجابي في عملية العلاج.
استنادًا إلى نتائج هذه الدراسة، يجب تفضيل طرق التعلم بالنقل، خاصة في التطبيقات المعتمدة على معالجة الصور لدعم صانعي القرار في مجال الصحة. يمكن استخدام البيانات المستمدة من التصوير بالرنين المغناطيسي أو الأشعة المقطعية كنظام إنذار مبكر لمساعدة صانعي القرار في الصحة على اتخاذ قرارات سريعة ودقيقة. لذلك، بالإضافة إلى التحليل التجريبي، يجب أن تأخذ التطبيقات المعتمدة على الذكاء الاصطناعي دورًا أكثر نشاطًا في أقرب وقت ممكن. ولهذا الغرض، سيتم التحقيق في تشخيص الأمراض من صور الأشعة المقطعية أو الرنين المغناطيسي الفورية في السنوات القادمة.
تحديد
مع دافعنا للتحقيق في كيفية عمله في نماذج التعلم العميق القائم على الشبكات العصبية التلافيفية الأحادية والمتعددة الطبقات، قمنا بتصنيف مجموعة البيانات كما هي دون عمليات التدوير والقص، وهو ما يُعتبر أهم قيود دراستنا.
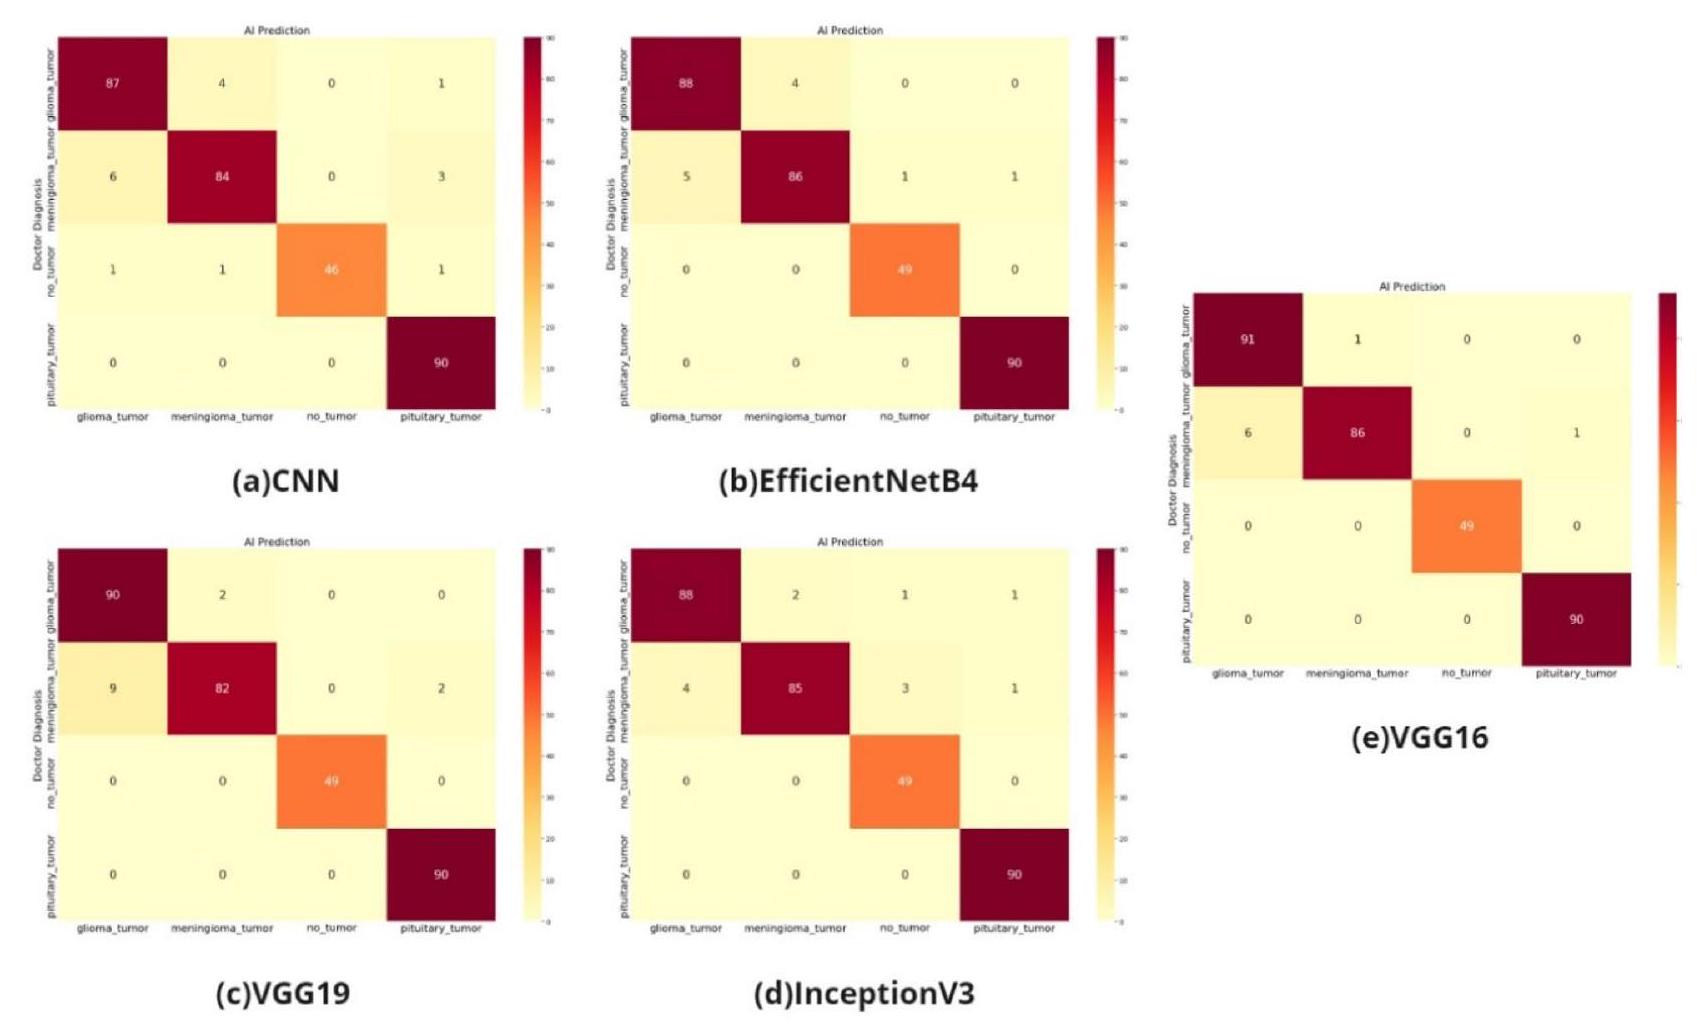
الشكل 5. مقاييس الالتباس لنموذج (أ) CNN، (ب) EfficientNetB4، (ج) VGG19، (د) InceptionV3، (هـ) VGG16.
| المؤلفون | مجموعة بيانات | نماذج | الدقة (%) | ||||||||||
| واليس وبوفا
|
مجموعة بيانات أورام الدماغ
|
SVM | 74 | ||||||||||
| سير و كاريباسابا
|
مجموعة بيانات ورم الدماغ الخاصة بهم | 85.32 | |||||||||||
| أورتيز-رامون وآخرون
|
مجموعة بيانات أورام الدماغ الخاصة بهم | 89.6 | |||||||||||
| غوبتا وساسيدار
|
قاعدة بيانات تحدي MICCAI 2012
|
87 | |||||||||||
| جومعي وآخرون
|
مجموعة بيانات أورام الدماغ
|
ريلم | 92.61 | ||||||||||
| شاهجاد وآخرون
|
مجموعة بيانات كاجل للدماغ
|
SVM | 92 | ||||||||||
| فانكدوثو وآخرون
|
مجموعة بيانات أورام الدماغ
|
|
|
||||||||||
| سيرينيفاس وآخرون
|
مجموعة بيانات أورام الدماغ
|
|
|
||||||||||
| تشودري وآخرون
|
مجموعة بيانات ورم الدماغ الخاصة بهم | سي إن إن | ٩٦.٠٨ | ||||||||||
| مارتيني وأورمان
|
مجموعة بيانات ورم الدماغ الخاصة بهم | سي إن إن | 93.09 | ||||||||||
| سركار وآخرون
|
مجموعة بيانات ورم الدماغ الخاصة بهم | 91.03 | |||||||||||
| أرونكومار وآخرون
|
لا شيء | آلات الدعم الشعاعي، الجوار الأقرب | 92.14 | ||||||||||
| زاخاراكيس وآخرون
|
مجموعة بيانات ورم الدماغ الخاصة بهم | ٨٨ | |||||||||||
| تشن وآخرون
|
مجموعة بيانات ورم الدماغ الخاصة بهم | 91.28 | |||||||||||
| بول وآخرون
|
مجموعة بيانات ورم الدماغ الخاصة بهم | سي إن إن | 91.43 | ||||||||||
| أفشار وآخرون
|
مجموعة بيانات أورام الدماغ
|
CapsNet | 90.89 | ||||||||||
| هذه الدراسة | مجموعة بيانات أورام الدماغ
|
|
|
الجدول 4. مقارنة مع الدراسات السابقة حول أورام الدماغ. أفضل النتائج التي تم الحصول عليها في الدراسة.
توفر البيانات
تم مشاركة مجموعة البيانات كمصدر مفتوح. رابط التوفر: https://doi.org/https://doi.org/10.34740/kaggle/dsv/1183165.
تم الاستلام: 15 سبتمبر 2023؛ تم القبول: 24 يناير 2024
تم النشر على الإنترنت: 01 فبراير 2024
تم الاستلام: 15 سبتمبر 2023؛ تم القبول: 24 يناير 2024
تم النشر على الإنترنت: 01 فبراير 2024
References
- Wallis, D. & Buvat, I. Clever Hans effect found in a widely used brain tumour MRI dataset. Med. Image Anal. 77, 102368. https:// doi.org/10.1016/j.media.2022.102368 (2022).
- Hatcholli Seere, S. K. & Karibasappa, K. Threshold segmentation and watershed segmentation algorithm for brain tumor detection using support vector machine. Eur. J. Eng. Technol. Res. 5(4), 516-519. https://doi.org/10.24018/ejeng.2020.5.4.1902 (2020).
- Ortiz-Ramón, R., Ruiz-España, S., Mollá-Olmos, E. & Moratal, D. Glioblastomas and brain metastases differentiation following an MRI texture analysis-based radiomics approach. Phys. Med. 76, 44-54. https://doi.org/10.1016/j.ejmp.2020.06.016 (2020).
- Gupta, M. & Sasidhar, K. Non-invasive brain tumor detection using magnetic resonance imaging based fractal texture features and shape measures. In 2020 3rd International Conference on Emerging Technologies in Computer Engineering: Machine Learning and Internet of Things (ICETCE), IEEE, 2020, 93-97. https://doi.org/10.1109/ICETCE48199.2020.9091756.
- Gumaei, A., Hassan, M. M., Hassan, M. R., Alelaiwi, A. & Fortino, G. A hybrid feature extraction method with regularized extreme learning machine for brain tumor classification. IEEE Access 7, 36266-36273. https://doi.org/10.1109/ACCESS.2019.2904145 (2019).
- Shahajad, M., Gambhir, D. & Gandhi, R. Features extraction for classification of brain tumor MRI images using support vector machine. In 2021 11th International Conference on Cloud Computing, Data Science and Engineering (Confluence), IEEE, 2021, 767-772. https://doi.org/10.1109/Confluence51648.2021.9377111.
- Vankdothu, R., Hameed, M. A. & Fatima, H. A brain tumor identification and classification using deep learning based on CNNLSTM method. Comput. Electr. Eng. 101, 107960. https://doi.org/10.1016/j.compeleceng. 2022.107960 (2022).
- Srinivas, C. et al. Deep transfer learning approaches in performance analysis of brain tumor classification using MRI images. J. Healthc. Eng. 2022, 1-17. https://doi.org/10.1155/2022/3264367 (2022).
- Choudhury, C. L., Mahanty, C., Kumar, R. & Mishra, B. K. Brain tumor detection and classification using convolutional neural network and deep neural network. In 2020 International Conference on Computer Science, Engineering and Applications (ICCSEA), IEEE, 2020, 1-4. https://doi.org/10.1109/ICCSEA49143.2020.9132874.
- Martini, M. L. & Oermann, E. K. Intraoperative brain tumour identification with deep learning. Nat. Rev. Clin. Oncol. 17(4), 200-201. https://doi.org/10.1038/s41571-020-0343-9 (2020).
- Sarkar, S., Kumar, A., Aich, S., Chakraborty, S., Sim, J.-S., & Kim, H.-C. A CNN based approach for the detection of brain tumor using MRI scans prediction of idiopathic pulmonary fibrosis (IPF) disease severity in lungs disease patients view project IoT based cyber physical system view project A CNN based approach for the detection of brain tumor using MRI scans. 2020, [Online]. https://www.researchgate.net/publication/342048436.
- Arunkumar, N. et al. Fully automatic model-based segmentation and classification approach for MRI brain tumor using artificial neural networks. Concurr. Comput. 32, 1. https://doi.org/10.1002/cpe. 4962 (2020).
- Zacharaki, E. I. et al. Classification of brain tumor type and grade using MRI texture and shape in a machine learning scheme. Magn. Reson. Med. 62(6), 1609-1618. https://doi.org/10.1002/mrm. 22147 (2009).
- Cheng, J. et al. Enhanced performance of brain tumor classification via tumor region augmentation and partition. PLoS One 10(10), e0140381. https://doi.org/10.1371/journal.pone. 0140381 (2015).
- Paul, J. S., Plassard, A. J., Landman, B. A., & Fabbri, D. Deep learning for brain tumor classification. In (Krol, A. & Gimi, B., Eds.), 2017, 1013710. https://doi.org/10.1117/12.2254195.
- Afshar, P., Plataniotis, K. N., & Mohammadi, A. Capsule networks for brain tumor classification based on MRI images and course tumor boundaries, 2018.
- Sartaj, B., Ankita, K., Prajakta, B., Sameer, D., & Swati, K. Brain tumor classification (MRI). Kaggle (2020). https://doi.org/10. 34740/kaggle/dsv/1183165.
- Basarslan, M. S. & Kayaalp, F. Sentiment analysis with machine learning methods on social media. Adv. Distrib. Comput. Artif. Intell. J. 9(3), 5-15. https://doi.org/10.14201/ADCAIJ202093515 (2020).
- LeCun, Y., Bengio, Y. & Hinton, G. Deep learning. Nature 521(7553), 436-444. https://doi.org/10.1038/nature14539 (2015).
- Sevik, A., Erdogmus, P., & Yalein, E. Font and Turkish letter recognition in images with deep learning. In 2018 International Congress on Big Data, Deep Learning and Fighting Cyber Terrorism (IBIGDELFT), IEEE, 2018, 61-64. https://doi.org/10.1109/ IBIGDELFT.2018.8625333.
- Bal, F. & Kayaalp, F. A novel deep learning-based hybrid method for the determination of productivity of agricultural products: Apple case study. IEEE Access 11, 7808-7821. https://doi.org/10.1109/ACCESS.2023.3238570 (2023).
- Kabakus, A. T. & Erdogmus, P. An experimental comparison of the widely used pre-trained deep neural networks for image classification tasks towards revealing the promise of transfer-learning. Concurr. Comput. https://doi.org/10.1002/cpe.7216 (2022).
- Bașarslan, M. S. & Kayaalp, F. MBi-GRUMCONV: A novel Multi Bi-GRU and Multi CNN-Based deep learning model for social media sentiment analysis. J. Cloud Comput. 12(1), 5. https://doi.org/10.1186/s13677-022-00386-3 (2023).
- Simonyan, K. & Zisserman, A. Very deep convolutional networks for large-scale image recognition, 2014.
- Chollet, F. Xception: Deep learning with depthwise separable convolutions, 2016.
- Kayaalp, F., Basarslan, M. S., & Polat, K. TSCBAS: A novel correlation based attribute selection method and application on telecommunications churn analysis. In 2018 International Conference on Artificial Intelligence and Data Processing (IDAP), IEEE, 2018, 1-5. https://doi.org/10.1109/IDAP.2018.8620935.
- Gulmez, S., Kakisim, A. G., & Sogukpinar, I. Analysis of the dynamic features on ransomware detection using deep learning-based methods. In 2023 11th International Symposium on Digital Forensics and Security (ISDFS), Chattanooga, TN, USA, 2023, 1-6. https://doi.org/10.1109/ISDFS58141.2023.10131862.
- Cheng, J. et al. Enhanced performance of brain tumor classification via tumor region augmentation and partition. PLoS One 10(10), e0140381 (2015).
مساهمات المؤلفين
م.ز.ك، تحليل البيانات، التجارب والتقييمات، إعداد مسودة المخطوطة م.س.ب، التصور، تحديد المنهجية، تقييم النتائج، والمراجعة الأصلية، والإشراف. يؤكد المؤلفون أنه لا يوجد أي صورة لأي مشارك في المقال.
المصالح المتنافسة
يعلن المؤلفون عدم وجود مصالح متنافسة.
معلومات إضافية
يجب توجيه المراسلات وطلبات المواد إلى م.س.ب.
معلومات إعادة الطبع والتصاريح متاحة على www.nature.com/reprints.
ملاحظة الناشر تظل Springer Nature محايدة فيما يتعلق بالمطالبات القضائية في الخرائط المنشورة والانتماءات المؤسسية.
معلومات إعادة الطبع والتصاريح متاحة على www.nature.com/reprints.
ملاحظة الناشر تظل Springer Nature محايدة فيما يتعلق بالمطالبات القضائية في الخرائط المنشورة والانتماءات المؤسسية.
الوصول المفتوح هذه المقالة مرخصة بموجب رخصة المشاع الإبداعي للاستخدام والمشاركة والتكيف والتوزيع وإعادة الإنتاج في أي وسيلة أو صيغة، طالما أنك تعطي الائتمان المناسب للمؤلفين الأصليين والمصدر، وتوفر رابطًا لرخصة المشاع الإبداعي، وتوضح ما إذا كانت هناك تغييرات قد تم إجراؤها. الصور أو المواد الأخرى من طرف ثالث في هذه المقالة مشمولة في رخصة المشاع الإبداعي للمقال، ما لم يُذكر خلاف ذلك في سطر الائتمان للمادة. إذا لم تكن المادة مشمولة في رخصة المشاع الإبداعي للمقال واستخدامك المقصود غير مسموح به بموجب اللوائح القانونية أو يتجاوز الاستخدام المسموح به، ستحتاج إلى الحصول على إذن مباشرة من صاحب حقوق الطبع والنشر. لعرض نسخة من هذه الرخصة، قم بزيارة http://creativecommons.org/licenses/by/4.0/.
© المؤلفون 2024
© المؤلفون 2024
مدرسة أتا شهير بيل الثانوية، 34720 إسطنبول، تركيا. قسم هندسة الكمبيوتر، كلية الهندسة والعلوم الطبيعية، جامعة إسطنبول ميدينيت، 34885 إسطنبول، تركيا. البريد الإلكتروني: muhammet.basarslan@medeniyet.edu.tr
Journal: Scientific Reports, Volume: 14, Issue: 1
DOI: https://doi.org/10.1038/s41598-024-52823-9
PMID: https://pubmed.ncbi.nlm.nih.gov/38302604
Publication Date: 2024-02-01
DOI: https://doi.org/10.1038/s41598-024-52823-9
PMID: https://pubmed.ncbi.nlm.nih.gov/38302604
Publication Date: 2024-02-01
Brain tumor detection from images and comparison with transfer learning methods and 3-layer CNN
Health is very important for human life. In particular, the health of the brain, which is the executive of the vital resource, is very important. Diagnosis for human health is provided by magnetic resonance imaging (MRI) devices, which help health decision makers in critical organs such as brain health. Images from these devices are a source of big data for artificial intelligence. This big data enables high performance in image processing classification problems, which is a subfield of artificial intelligence. In this study, we aim to classify brain tumors such as glioma, meningioma, and pituitary tumor from brain MR images. Convolutional Neural Network (CNN) and CNN-based inception-V3, EfficientNetB4, VGG19, transfer learning methods were used for classification. F-score, recall, imprinting and accuracy were used to evaluate these models. The best accuracy result was obtained with VGG16 with 98%, while the F-score value of the same transfer learning model was
The healthcare industry has been rapidly transformed by technological advances in recent years, and an important component of this transformation is artificial intelligence (AI) technology. AI is a computer system that simulates human-like intelligence and has many applications in medicine. One such area is the fight against brain tumors. Brain tumors are a major public health problem in the healthcare sector, and accurate diagnosis, treatment, and follow-up processes are critical. AI has become an important tool for improving these processes and has great potential for early diagnosis and treatment of brain tumors.
Brain tumors affect human health due to their location
AI can also be used to track a patient’s progress through treatment. AI-based analytics can be used to assess treatment response and predict potential tumor recurrence. In this way, patients’ treatment plans can be more effectively organized and individualized treatment approaches can be developed.
In this study, difference detection was performed on brain images. Classification was performed with multilayer CNN and CNN-based transfer learning methods on 4 classes labeled by physicians.
The contribution of the study is as follows.
- We investigate the transfer learning method with the highest performance in the classification process of transfer learning methods on brain images.
- We investigate the performance of CNN and transfer learning on brain images using CNN as a multi-layer without using transfer learning.
- We investigate whether it is possible to achieve good results with a skewed and poor quality dataset.
The flow diagram of the study is shown in Fig. 1.
Figure 1. Flow diagram of the work.
Studies on brain tumors in the last 5 years will be scanned from indexes such as WOS and IEEE and the details of the related studies will be explained in this section.
In a study of 3064 MRI images from 233 patients belonging to 4 different tumor classes (meningioma, glioma, pituitary, tumor) with support vector machine (SVM) on datasets generated after various preprocessing, an accuracy value between
Material method
This section describes the dataset, the classification algorithm (CNN) used in the study, and the transfer learning architectures VGG19, VGG16, InceptionV3, EfficientNetB4 developed based on this algorithm.
Data source
The dataset consists of a total of 2870 human brain MRI images systematically classified into four different categories: glioma, meningioma, no tumor and pituitary. The distribution of labeled images into these four classes is shown in Table 1 for reference
| Data | Glioma | Meningioma | No tumor | Pituitary | Total |
| Training data | 696 | 704 | 316 | 676 | 2452 |
| Testing data | 92 | 93 | 49 | 90 | 324 |
| Validation data | 138 | 140 | 75 | 135 | 488 |
Table 1. Distribution of the preprocessed brain tumor dataset.
Glioma is the most common type of malignant brain tumor and typically occurs in glial cells in the brain and spinal cord. Meningioma is a benign type of brain tumor, but can become malignant without appropriate intervention. These classes are labeled by physicians. The size of the input images is
Deep learning
Deep learning is a subset of machine learning that focuses on training artificial neural networks to perform complex tasks by learning patterns and representations directly from data. Unlike traditional machine learning approaches that require manual feature engineering, deep learning algorithms autonomously extract hierarchical features from data, leading to the creation of powerful and highly accurate models
Convolution neural network
Convolutional neural networks represent a major breakthrough in deep learning and computer vision. These architectures are specifically designed to extract meaningful features from complex visual data, such as images and video. The inherent structure of the CNN, consisting of convolutional layers, pooling layers, and fully connected layers, mimics the ability of the human visual system to recognize patterns and hierarchical features. Convolutional layers use convolutional operations to detect local features, which are then progressively abstracted by pooling layers that condense the information. The resulting hierarchical representations are then fed into fully connected layers for classification or regression tasks. CNN have redefined the landscape of image recognition, achieving remarkable success in diverse domains ranging from image classification and object detection to face recognition and medical image analysis
Transfer learning
Transfer learning stands as a fundamental concept within both machine learning and deep learning, involving the utilization of knowledge garnered from training a model on a particular task and subsequently applying that knowledge to another related task. In the realm of neural networks, transfer learning manifests significant potency. It encompasses the process of employing a pre-trained model, typically trained on a comprehensive and varied dataset, and fine-tuning it on a fresh dataset or task
In this study, transfer learning models InceptionV3, VGG16, VGG19, and EfficientNetB4 were used in the classification process.
VGG
This architecture stands as a notable CNN model introduced by
EfficientNET
EfficientNet is a family of scalable and efficient CNN models. The main goal of this series is to achieve better performance with fewer parameters. The term “EfficientNet” is a combination of the words “efficiency” and “network”. The model series is mainly used in visual processing tasks such as image classification.
EfficientNet is a family of models that delivers competitive results in both performance and computational cost. It offers variations of different size and complexity at different scales. Higher numbered models are typically larger and more complex, but require more computing power. It was the top performing model in the ImageNet competition
Inception
The Inception architecture is an architecture used in the field of deep learning and CNN. It is designed to perform feature extraction and classification tasks more efficiently. First introduced in a paper titled “Going Deeper with Convolutions”, the Inception architecture aims to provide better performance when processing complex visual datasets
Performance metric
Performance evaluation methods such as Accuracy, Precision, Recall, and F-score are used to evaluate models created for classification problems such as image processing. These methods are obtained from the confusion matrix. The confusion matrix is given in Table
In Table 2, the symbols
Receiver operating characteristic (ROC) curve
The ROC Curve is a graphical tool used to evaluate the performance of a classification model, particularly in binary classification scenarios. It provides a visualization of the sensitivity and specificity of the model, showing their variation as thresholds are changed
In addition, the area under the receiver operating characteristic (ROC) curve, commonly referred to as the “area under the curve”, succinctly summarizes the overall model performance in a single metric. The AUC value ranges from 0 to 1 , with values closer to 1 indicating the increased discriminative ability of the model
Approval for participation
As the data is open source, there are no experiments on humans conducted by the authors. Open source has been studied on MRI images.
Experimental settings and results
This study addresses the problem of image classification using deep learning methods. The most important and widely studied of these problems is that of health images. In this context, five different models (InceptionV3, EfficientNetB4, VGG16, VGG19, Multi-Layer CNN) were selected for the classification of brain tumors and their performances were compared on the same dataset.
Multi-layer CNN
First, we need to determine the architecture of our model. The input form of our data is
| Actual value | |||
| Positive | Negative | Total | |
| Estimate value | |||
| Positive |
|
|
TPos |
| Negative |
|
|
TNeg |
| Total | Pos | Neg | M |
Table 2. Confusion matrix.
The resulting feature map is transformed into a flat vector with a flattening layer. A hidden (dense) layer of 128 neurons is then added. This layer deepens the learned features and increases generalization. Finally, the output layer has 4 neurons and calculates the probabilities between classes with the softmax activation function. To train our model, we need to determine the optimal function and metrics. In this paper, we use the Rectified Adam optimization algorithm. This algorithm dynamically adjusts the learning rate and helps to use gradients more efficiently. Also, categorical cross-entropy is used as the loss function during training, as it is widely used in multiclass classification task.
The metrics tracked during training are accuracy, as well as precision and recall. These metrics are important for evaluating the classification performance of the model. In addition, a reduced learning rate recall (ReduceLROnPlateau) is used to dynamically adjust the learning rate. This recall reduces the learning rate when the loss function flattens out during the training process, resulting in more stable training. The epoch is set to 14 and the batch size to 10 .
CNN-based transfer learning
In transfer learning architectures, all parameters and layers outside the model are the same, but after the last 3 layers of transfer learning models are removed, layers unique to the dataset are added instead: the GlobalAveragePooling2D layer contains fewer parameters than the Flatten layer, which reduces the risk of overfitting and helps build a more efficient model. Also, while the Flatten layer is used to organize the data, the GlobalAveragePooling2D layer is used for feature extraction, making the network learning process more efficient.
Due to the fact that the training data tends to learn very fast compared to the validation data, we modified the ratio of the dropout layers in the original architectures. For all models, the dilution rate was set to 0.05 . During the model training process, the designated optimizer was “RectifiedAdam”, with the optimizer parameters configured as follows: learning_rate
During the model training process, the “ReduceLROnPlateau” function of the Keras library was used as a backpropagation algorithm. This function automatically reduced the learning rate when the model approached a local optimum or when the loss value did not decrease. The parameters of the “ReduceLROnPlateau” function are as follows monitor: The metric monitored is usually “val_loss” (validation loss). This is the metric used to determine if the learning rate should be reduced:
- patience: The expected patience time for lowering the learning rate, i.e. how long the metric should not improve.
- factor: The factor used to reduce the learning rate. For example, a value of 0.3 reduces the learning rate by
. - min_lr: Specifies the minimum achievable learning rate. This limits the learning rate without making it infinitesimal.
Using this feature allows for more stable and efficient model training, streamlining the process of fine-tuning training parameters without the need to manually adjust the learning rate. The training program was run over 14 epochs with batches of size 10. Details of the multilayer CNN model used in the study are presented in Fig. 2, which outlines its architectural features.
The training and validation accuracy loss graphs of the models created with VGG19, EfficientNetB4, InceptionV3 transfer learning, and CNN are shown in Fig. 3.
Table 3 shows the accuracy, F-score, Recall, Precision and AUC results of the models created in the study.
Figure 2. Multi-layer CNN model arthitecture.
Figure 3. Learning curves of losses and accuracies of (a) CNN model, (b) EfficientNetB4 model, (c) VGG19 model, (d) InceptionV3, (e) VGG16 model.
| Models | Accuracy | F-score | Recall | Precision | AUC |
| VGG19 | 96 | 96 | 96 | 96 | 99 |
| EfficientNETB4 | 97 | 96 | 97 | 97 | 99 |
| InceptionV3 | 96 | 96 | 96 | 96 | 99 |
| 3 CNN Model | 91 | 90 | 91 | 91 | 98 |
| VGG16 | 98 | 97 | 98 | 98 | 99 |
Table 3. Performances (%) of the models created in the study.
According to Table 3, the best accuracy result was obtained by VGG16 with
According to the AUC values in Fig. 4, the transfer learning models VGG, InceptionV3, and EfficientNetB4 and the models built with CNN have distinctive features. The confusion matrix of the study on the classification of glioma, meningioma, non-tumor normal patients, pituitary tumor patients in the dataset by tumor type is shown in Fig. 5.
As shown in the confusion matrix in Fig. 5, the classification performance is high for all four models (VGG16 and VGG19 models, CNN model, EfficientNetB4 model, InceptionV3 model).
Results and discussion
As part of the study, CNN and CNN-based transfer learning models such as InceptionV3, EfficientNetB4, VGG19 were trained on open-source shared brain tumor patients. The best accuracy result was obtained with EfficientNetB4 with
As shown in Table 4, the CNN-based transfer learning models used in the study performed better. AI in healthcare plays an important role in the management of complex diseases such as brain tumors. AI enables faster, more accurate, and more effective diagnosis and treatment processes. However, AI technology is not intended to completely replace doctors, but to support and enhance their work. To realize the full potential of AI, it is important to consider issues such as ethics, security and privacy. In the future, AI-based solutions will continue to contribute to better management of brain tumors and other health problems, and improve the quality of life
Figure 4. The ROC curve of (a) CNN model, (b) EfficientNetB4 model, (c) VGG19 model (d) InceptionV3 model, (e) VGG16.
for patients. As seen in this study, AI-based studies will increase their importance to human health, from early diagnosis to positive progress in the treatment process.
Based on the results of this study, transfer learning methods should be preferred especially in image processing-based applications to support health decision makers. The data obtained from MRI or CT can be used as an early warning system to help health decision makers make quick and accurate decisions. Therefore, in addition to empirical analysis, AI-based applications should take a more active role as soon as possible. To this end, the diagnosis of diseases from instant CT or MR images will be investigated in the coming years.
Limitation
With our motivation to investigate how it will work in single CNN and multilayer CNN based transfer learning models, we subjected the dataset to classification as it is without rotation and cropping operations, which is the most important limitation of our study.
Figure 5. The confusion metrics of (a) CNN model, (b) EfficientNetB4 model, (c) VGG19 model (d) InceptionV3 model, (e) VGG16.
| Authors | Dataset | Models | Accuracy (%) | ||||||||||
| Wallis and Buvat
|
Brain Tumor Dataset
|
SVM | 74 | ||||||||||
| Seere and Karibasappa
|
Their own Brain Tumor dataset | 85.32 | |||||||||||
| Ortiz-Ramón et al.
|
Their own Brain Tumor dataset | 89.6 | |||||||||||
| Gupta and Sasidhar
|
MICCAI 2012 Challenge database
|
87 | |||||||||||
| Gumaei et al.
|
Brain Tumor Dataset
|
RELM | 92.61 | ||||||||||
| Shahajad et al.
|
Kaggle brain dataset
|
SVM | 92 | ||||||||||
| Vankdothu et al.
|
Brain Tumor Dataset
|
|
|
||||||||||
| Sirinivas et al.
|
Brain Tumor Dataset
|
|
|
||||||||||
| Choudhury et al.
|
Their own Brain Tumor dataset | CNN | 96.08 | ||||||||||
| Martini and Oermann
|
Their own Brain Tumor dataset | CNN | 93.09 | ||||||||||
| Sarkar et al.
|
Their own Brain Tumor dataset | 91.03 | |||||||||||
| Arunkumar et al.
|
None | SVM, KNN | 92.14 | ||||||||||
| Zacharaki et al.
|
Their own Brain Tumor dataset | 88 | |||||||||||
| Cheng et al.
|
Their own Brain Tumor dataset | 91.28 | |||||||||||
| Paul et al.
|
Their own Brain Tumor dataset | CNN | 91.43 | ||||||||||
| Afshar et al.
|
Brain Tumor Dataset
|
CapsNet | 90.89 | ||||||||||
| This study | Brain Tumor Dataset
|
|
|
Table 4. Comparison with previous studies on brain tumor. Best results obtained in the study.
Data availability
The dataset is shared open source. Availability Link: https://doi.org/https://doi.org/10.34740/kaggle/dsv/1183165.
Received: 15 September 2023; Accepted: 24 January 2024
Published online: 01 February 2024
Received: 15 September 2023; Accepted: 24 January 2024
Published online: 01 February 2024
References
- Wallis, D. & Buvat, I. Clever Hans effect found in a widely used brain tumour MRI dataset. Med. Image Anal. 77, 102368. https:// doi.org/10.1016/j.media.2022.102368 (2022).
- Hatcholli Seere, S. K. & Karibasappa, K. Threshold segmentation and watershed segmentation algorithm for brain tumor detection using support vector machine. Eur. J. Eng. Technol. Res. 5(4), 516-519. https://doi.org/10.24018/ejeng.2020.5.4.1902 (2020).
- Ortiz-Ramón, R., Ruiz-España, S., Mollá-Olmos, E. & Moratal, D. Glioblastomas and brain metastases differentiation following an MRI texture analysis-based radiomics approach. Phys. Med. 76, 44-54. https://doi.org/10.1016/j.ejmp.2020.06.016 (2020).
- Gupta, M. & Sasidhar, K. Non-invasive brain tumor detection using magnetic resonance imaging based fractal texture features and shape measures. In 2020 3rd International Conference on Emerging Technologies in Computer Engineering: Machine Learning and Internet of Things (ICETCE), IEEE, 2020, 93-97. https://doi.org/10.1109/ICETCE48199.2020.9091756.
- Gumaei, A., Hassan, M. M., Hassan, M. R., Alelaiwi, A. & Fortino, G. A hybrid feature extraction method with regularized extreme learning machine for brain tumor classification. IEEE Access 7, 36266-36273. https://doi.org/10.1109/ACCESS.2019.2904145 (2019).
- Shahajad, M., Gambhir, D. & Gandhi, R. Features extraction for classification of brain tumor MRI images using support vector machine. In 2021 11th International Conference on Cloud Computing, Data Science and Engineering (Confluence), IEEE, 2021, 767-772. https://doi.org/10.1109/Confluence51648.2021.9377111.
- Vankdothu, R., Hameed, M. A. & Fatima, H. A brain tumor identification and classification using deep learning based on CNNLSTM method. Comput. Electr. Eng. 101, 107960. https://doi.org/10.1016/j.compeleceng. 2022.107960 (2022).
- Srinivas, C. et al. Deep transfer learning approaches in performance analysis of brain tumor classification using MRI images. J. Healthc. Eng. 2022, 1-17. https://doi.org/10.1155/2022/3264367 (2022).
- Choudhury, C. L., Mahanty, C., Kumar, R. & Mishra, B. K. Brain tumor detection and classification using convolutional neural network and deep neural network. In 2020 International Conference on Computer Science, Engineering and Applications (ICCSEA), IEEE, 2020, 1-4. https://doi.org/10.1109/ICCSEA49143.2020.9132874.
- Martini, M. L. & Oermann, E. K. Intraoperative brain tumour identification with deep learning. Nat. Rev. Clin. Oncol. 17(4), 200-201. https://doi.org/10.1038/s41571-020-0343-9 (2020).
- Sarkar, S., Kumar, A., Aich, S., Chakraborty, S., Sim, J.-S., & Kim, H.-C. A CNN based approach for the detection of brain tumor using MRI scans prediction of idiopathic pulmonary fibrosis (IPF) disease severity in lungs disease patients view project IoT based cyber physical system view project A CNN based approach for the detection of brain tumor using MRI scans. 2020, [Online]. https://www.researchgate.net/publication/342048436.
- Arunkumar, N. et al. Fully automatic model-based segmentation and classification approach for MRI brain tumor using artificial neural networks. Concurr. Comput. 32, 1. https://doi.org/10.1002/cpe. 4962 (2020).
- Zacharaki, E. I. et al. Classification of brain tumor type and grade using MRI texture and shape in a machine learning scheme. Magn. Reson. Med. 62(6), 1609-1618. https://doi.org/10.1002/mrm. 22147 (2009).
- Cheng, J. et al. Enhanced performance of brain tumor classification via tumor region augmentation and partition. PLoS One 10(10), e0140381. https://doi.org/10.1371/journal.pone. 0140381 (2015).
- Paul, J. S., Plassard, A. J., Landman, B. A., & Fabbri, D. Deep learning for brain tumor classification. In (Krol, A. & Gimi, B., Eds.), 2017, 1013710. https://doi.org/10.1117/12.2254195.
- Afshar, P., Plataniotis, K. N., & Mohammadi, A. Capsule networks for brain tumor classification based on MRI images and course tumor boundaries, 2018.
- Sartaj, B., Ankita, K., Prajakta, B., Sameer, D., & Swati, K. Brain tumor classification (MRI). Kaggle (2020). https://doi.org/10. 34740/kaggle/dsv/1183165.
- Basarslan, M. S. & Kayaalp, F. Sentiment analysis with machine learning methods on social media. Adv. Distrib. Comput. Artif. Intell. J. 9(3), 5-15. https://doi.org/10.14201/ADCAIJ202093515 (2020).
- LeCun, Y., Bengio, Y. & Hinton, G. Deep learning. Nature 521(7553), 436-444. https://doi.org/10.1038/nature14539 (2015).
- Sevik, A., Erdogmus, P., & Yalein, E. Font and Turkish letter recognition in images with deep learning. In 2018 International Congress on Big Data, Deep Learning and Fighting Cyber Terrorism (IBIGDELFT), IEEE, 2018, 61-64. https://doi.org/10.1109/ IBIGDELFT.2018.8625333.
- Bal, F. & Kayaalp, F. A novel deep learning-based hybrid method for the determination of productivity of agricultural products: Apple case study. IEEE Access 11, 7808-7821. https://doi.org/10.1109/ACCESS.2023.3238570 (2023).
- Kabakus, A. T. & Erdogmus, P. An experimental comparison of the widely used pre-trained deep neural networks for image classification tasks towards revealing the promise of transfer-learning. Concurr. Comput. https://doi.org/10.1002/cpe.7216 (2022).
- Bașarslan, M. S. & Kayaalp, F. MBi-GRUMCONV: A novel Multi Bi-GRU and Multi CNN-Based deep learning model for social media sentiment analysis. J. Cloud Comput. 12(1), 5. https://doi.org/10.1186/s13677-022-00386-3 (2023).
- Simonyan, K. & Zisserman, A. Very deep convolutional networks for large-scale image recognition, 2014.
- Chollet, F. Xception: Deep learning with depthwise separable convolutions, 2016.
- Kayaalp, F., Basarslan, M. S., & Polat, K. TSCBAS: A novel correlation based attribute selection method and application on telecommunications churn analysis. In 2018 International Conference on Artificial Intelligence and Data Processing (IDAP), IEEE, 2018, 1-5. https://doi.org/10.1109/IDAP.2018.8620935.
- Gulmez, S., Kakisim, A. G., & Sogukpinar, I. Analysis of the dynamic features on ransomware detection using deep learning-based methods. In 2023 11th International Symposium on Digital Forensics and Security (ISDFS), Chattanooga, TN, USA, 2023, 1-6. https://doi.org/10.1109/ISDFS58141.2023.10131862.
- Cheng, J. et al. Enhanced performance of brain tumor classification via tumor region augmentation and partition. PLoS One 10(10), e0140381 (2015).
Author contributions
M.Z.K., data analysis, experiments and evaluations, manuscript draft preparation M.S.B., conceptualization, defining the methodology, evaluations of the results, and original draft and reviewing, supervision. The authors affirm there is no figure of any participant in the article.
Competing interests
The authors declare no competing interests.
Additional information
Correspondence and requests for materials should be addressed to M.S.B.
Reprints and permissions information is available at www.nature.com/reprints.
Publisher’s note Springer Nature remains neutral with regard to jurisdictional claims in published maps and institutional affiliations.
Reprints and permissions information is available at www.nature.com/reprints.
Publisher’s note Springer Nature remains neutral with regard to jurisdictional claims in published maps and institutional affiliations.
Open Access This article is licensed under a Creative Commons Attribution 4.0 International License, which permits use, sharing, adaptation, distribution and reproduction in any medium or format, as long as you give appropriate credit to the original author(s) and the source, provide a link to the Creative Commons licence, and indicate if changes were made. The images or other third party material in this article are included in the article’s Creative Commons licence, unless indicated otherwise in a credit line to the material. If material is not included in the article’s Creative Commons licence and your intended use is not permitted by statutory regulation or exceeds the permitted use, you will need to obtain permission directly from the copyright holder. To view a copy of this licence, visit http://creativecommons.org/licenses/by/4.0/.
© The Author(s) 2024
© The Author(s) 2024
Ataşehir Bil Anatolian High School, 34720 Istanbul, Turkey. Department of Computer Engineering, Faculty of Engineering and Natural Sciences, Istanbul Medeniyet University, 34885 Istanbul, Turkey. email: muhammet.basarslan@medeniyet.edu.tr