نظام تعلم عميق لتوقع وقت تقدم اعتلال الشبكية السكري A deep learning system for predicting time to progression of diabetic retinopathy

المجلة: Nature Medicine
DOI: https://doi.org/10.1038/s41591-023-02702-z
PMID: https://pubmed.ncbi.nlm.nih.gov/38177850
تاريخ النشر: 2024-01-04

نظام تعلم عميق لتوقع وقت تقدم اعتلال الشبكية السكري

تم الاستلام: 27 أبريل 2023
تم القبول: 10 نوفمبر 2023
نُشر على الإنترنت: 4 يناير 2024
(د) التحقق من التحديثات

الملخص

لينغ داي ، بين شينغ (1) ، تينغلي تشن ، تشيانغ وو ، روهان ليو (1) ، تشون كاي ، ليانغ وو ، داوي يانغ ، حسلينا حمزة ، يويكسينغ ليو ، شيانغنينغ وانغ © ، تشويو جوان (ب) ، شوجي يو ، تينغياو ، زيكي تانغ ، أنران ران (1) ، هاوكسوان تشي © ، هاو تشن (1) ، يينغفينغ تشنغ ، جيا شو ، شان هوانغ ، تشان وو ، شيقون لين ، دان ليو ، جياجيا لي ، تشييوان وانغ ، زياو مينغ ، جيه شين ، شوهونغ هوو ، تشنكسين دينغ ، لي روان ، فنغ لو ، مياولي تشي ، تن تشير كويك ، راميا سرينيفاسان ، راجيف رامان ، شياودونغ صن © ، يا شينغ وانغ (ب) ، جيا روي وو ، هاي جين ، رونغبينغ داي ، دينغغانغ شين (1) ، شياوكانغ يانغ ، منيي قوه ، كونتاي تشانغ ، كارول ي. تشيونغ ، جافين سيو وي تان ، ييه-تشونغ ثام (1) ، تشينغ-يو تشنغ ، هوانغ لي تين ين وونغ ويبينغ جيا (1)

الملخص

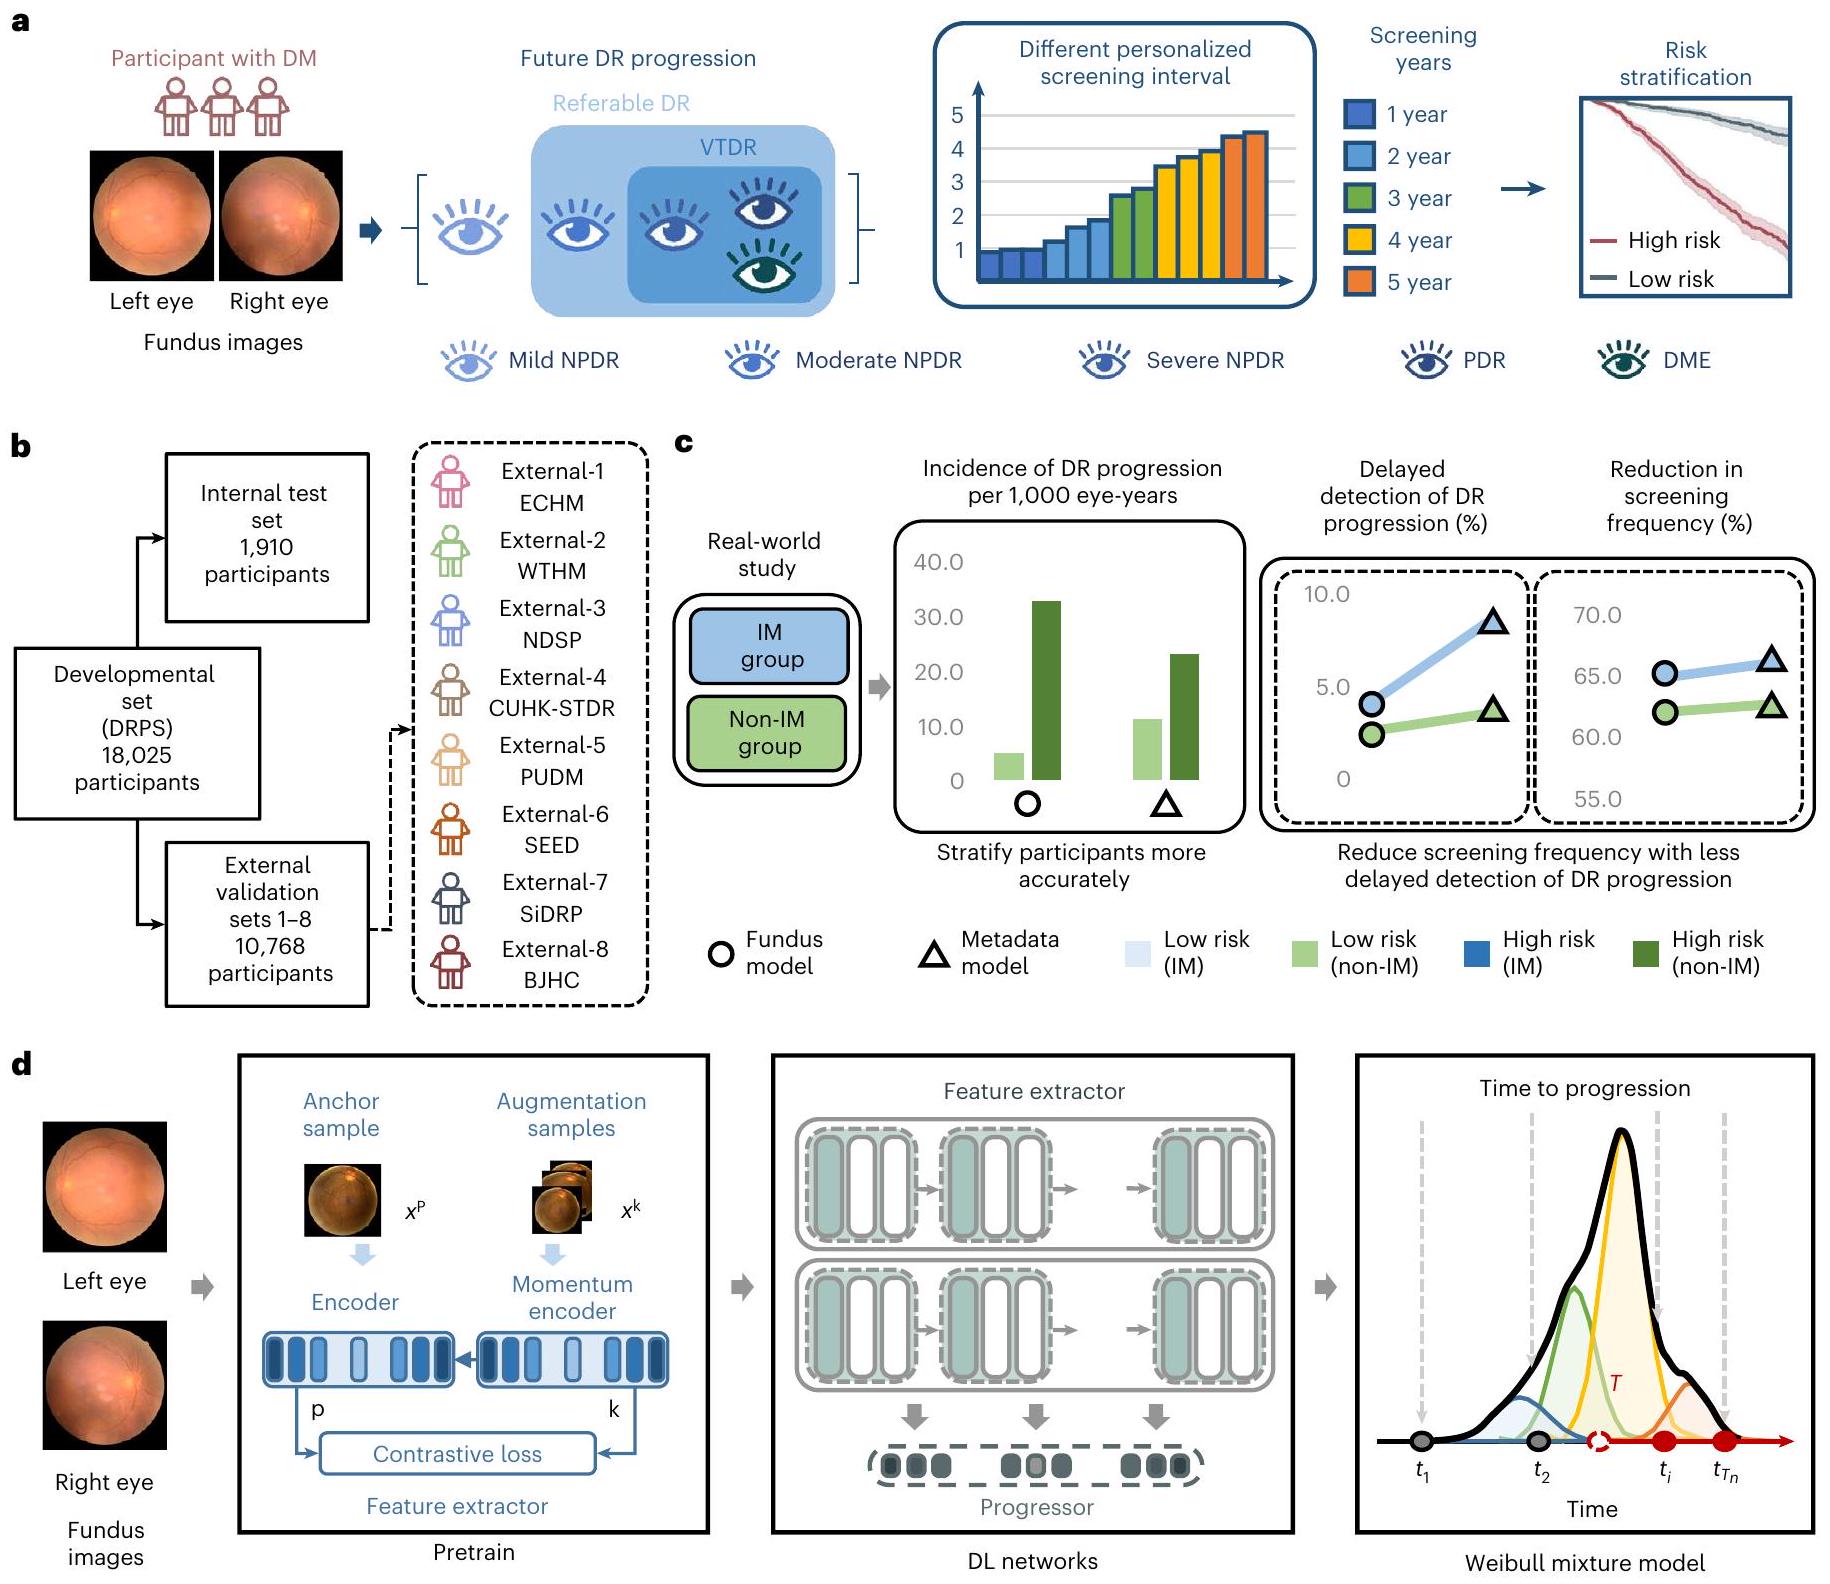
اعتلال الشبكية السكري (DR) هو السبب الرئيسي للعمى الذي يمكن الوقاية منه على مستوى العالم. يختلف خطر تقدم اعتلال الشبكية السكري بشكل كبير بين الأفراد المختلفين، مما يجعل من الصعب التنبؤ بالمخاطر وتخصيص فترات الفحص. قمنا بتطوير والتحقق من نظام تعلم عميق (DeepDR Plus) للتنبؤ بالوقت حتى تقدم اعتلال الشبكية السكري خلال 5 سنوات فقط من خلال صور قاع العين. أولاً، استخدمنا 717,308 صورة لقاع العين من 179,327 مشاركًا مصابًا بالسكري لتدريب النظام مسبقًا. بعد ذلك، قمنا بتدريب والتحقق من النظام باستخدام مجموعة بيانات متعددة الأعراق تضم 118,868 صورة من 29,868 مشاركًا مصابًا بالسكري. للتنبؤ بالوقت حتى تقدم اعتلال الشبكية السكري، حقق النظام مؤشرات توافق تتراوح بين 0.754 و0.846 ودرجات بريير المتكاملة بين 0.153 و0.241 لجميع الأوقات حتى 5 سنوات. علاوة على ذلك، تحققنا من النظام في مجموعات حقيقية من المشاركين المصابين بالسكري. يمكن أن يؤدي دمج النظام مع سير العمل السريري إلى تمديد متوسط فترة الفحص من 12 شهرًا إلى 31.97 شهرًا، وكانت نسبة المشاركين الموصى بفحصهم خلال 1-5 سنوات هي 30.62%، 20.00%، 19.63%، 11.85% و17.89% على التوالي، في حين كان تأخير اكتشاف التقدم إلى اعتلال الشبكية السكري المهدد للبصر 0.18%. مجتمعة، يمكن لنظام DeepDR Plus التنبؤ بالمخاطر الفردية والوقت حتى تقدم اعتلال الشبكية السكري خلال 5 سنوات، مما يتيح إمكانية تخصيص فترات الفحص.

اعتلال الشبكية السكري هو أكثر المضاعفات الدقيقة الوعائية شيوعًا لمرض السكري والسبب الرئيسي للعمى الذي يمكن الوقاية منه لدى البالغين الذين تتراوح أعمارهم بين 20 و74 عامًا. من الجدير بالذكر أن اعتلال الشبكية السكري يتطور ويتقدم بشكل أساسي بدون أعراض في المراحل المبكرة حتى يحدث فقدان الرؤية في المراحل المتأخرة من المرض. .
ومع ذلك، فإن خطر تطور اعتلال الشبكية السكري يختلف بشكل كبير بين الأفراد المختلفين، ويتأثر بالعديد من عوامل الخطر القابلة للتعديل وغير القابلة للتعديل. حالياً، لا يمكن تحديد أي المرضى المصابين بالسكري سيطورون اعتلال الشبكية السكري أو يتقدمون بسرعة أو ببطء.
الفحص الروتيني لاعتلال الشبكية السكري على فترات سنوية يُوصى به على نطاق واسع لجميع الأفراد المصابين بالسكري الذين لا يعانون من اعتلال الشبكية السكري أو يعانون من اعتلال شبكية خفيف، وذلك من قبل المنظمات الوطنية والدولية. بالإضافة إلى ذلك، يتم إحالة العديد من الأفراد المصابين بالسكري للمراقبة والمتابعة في عيادات أو مستشفيات العيون المتخصصة قبل أن يتطور لديهم اعتلال الشبكية السكري الحاد، وأحيانًا خلال عامين فقط من بدء برنامج الفحص. على الرغم من أن الدراسات السابقة أظهرت أن اعتلال الشبكية السكري كمجموعة هو مرض يتقدم ببطء بشكل عام ، ومن الممكن تقدير مخاطر التقدم لمجموعات فرعية من المرضى الذين لديهم عوامل خطر مماثلة ومستويات شدة اعتلال الشبكية السكري ، لقد كان من الصعب تمديد فترات الفحص من سنة واحدة إلى سنتين (أو حتى ثلاث سنوات) بسبب الصعوبة في التنبؤ بدقة بمخاطر الفرد ووقت تطور اعتلال الشبكية السكري. ونتيجة لذلك، كان العديد من الأطباء وبرامج الفحص الوطنية لاعتلال الشبكية السكري مترددين للغاية في التوصية بمثل هذا النهج، على الرغم من أنه سيكون فعالاً من حيث التكلفة بشكل كبير. .
لذا، فإن أحد التحديات الرئيسية في إدارة اعتلال الشبكية السكري هو نقص نموذج مخاطرة فردي وتنبؤ دقيق بالوقت حتى بداية وتقدم المرض. من خلال تطوير مثل هذا النموذج، يمكننا تقدير المخاطر والإطار الزمني لتطور اعتلال الشبكية السكري بشكل أفضل، مما سيعزز بشكل كبير من كفاءة برامج فحص اعتلال الشبكية السكري. علاوة على ذلك، يمكننا تخصيص استراتيجيات إدارة اعتلال الشبكية السكري المكثفة لأولئك المعرضين لمخاطر عالية، مما قد يساعد في منع تقدم اعتلال الشبكية السكري.
لقد أصبح الذكاء الاصطناعي يلعب دورًا متزايد الأهمية في الطب تم تطوير التعلم العميق (DL)، باستخدام الشبكات العصبية التلافيفية، للكشف التلقائي عن اعتلال الشبكية السكري من صور الشبكية. ومع ذلك، هناك عدد قليل جدًا من الدراسات التي تستخدم أنظمة التعلم العميق المعتمدة على صور الشبكية للتنبؤ المستقبلي بمخاطر . علاوة على ذلك، هناك فجوات حرجة في الأبحاث الحالية. أولاً، فيما يتعلق بتوقع خطر ظهور وتطور اعتلال الشبكية السكري، ركزت نماذج التعلم العميق السابقة على تصنيف المخاطر خلال عامين فقط بعد الزيارة الأساسية . هذا غير كافٍ لمرض مزمن مثل اعتلال الشبكية السكري لأن معظم المرضى لا يتطور لديهم اعتلال الشبكية السكري خلال سنتين . ثانيًا، لم يتم استكشاف التنبؤ الآلي بوقت ظهور اعتلال الشبكية السكري للفرد وتطوره في الدراسات السابقة. ثالثًا، هناك حاجة إلى دراسات لتقييم تأثير أنظمة التعلم العميق المعتمدة على صور الشبكية على نتائج المرضى عند دمجها في سير العمل السريري. يجب معالجة هذه الفجوات قبل دمج أنظمة التعلم العميق المعتمدة على صور الشبكية في برامج فحص اعتلال الشبكية السكري.
لقد طورنا سابقًا نظام تعلم عميق (DeepDR)، يمكنه الكشف عن المراحل المبكرة إلى المتأخرة من في الدراسة الحالية، قمنا بتطوير نظام تعلم عميق (DeepDR Plus)، والتحقق من صحته واختباره خارجيًا، لتوقع مسارات تطور اعتلال الشبكية السكري بشكل فردي خلال 5 سنوات. أولاً، تم استخدام 717,308 صورة لقاع العين من 179,327 مريضًا بالسكري لتدريب نظام DeepDR Plus مسبقًا. بعد ذلك، قمنا بتدريب والتحقق من صحة نظام DeepDR Plus باستخدام البيانات السريرية وصور قاع العين من مجموعات بيانات متعددة الأعراق ومتعددة البلدان، والتي تضم أكثر من 118,868 صورة تم جمعها من 29,868 مشاركًا. ولإظهار نتيجة التكامل مع سير العمل السريري والرقمي بشكل أكبر، أجرينا دراسة في العالم الحقيقي ضمن مجموعات مستقبلية من مرضى السكري.

النتائج

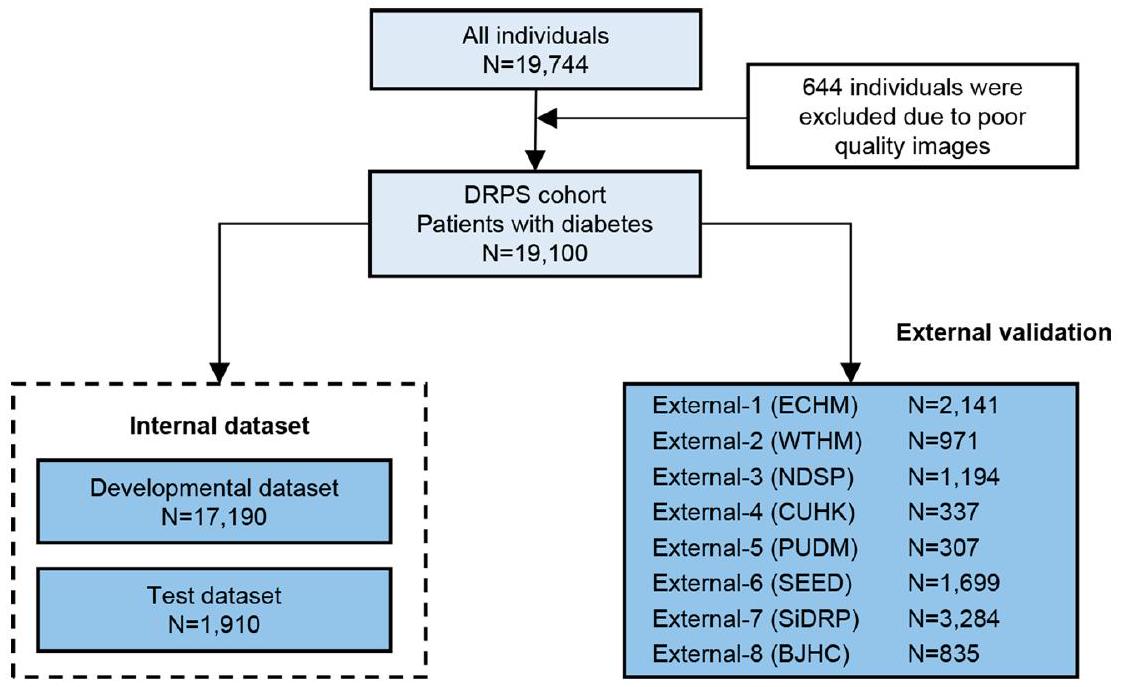
تصميم الدراسة والمشاركون

لتعلم الميزات المرتبطة بمرض اعتلال الشبكية السكري (DR)، تم تدريب نظام DeepDR Plus مسبقًا باستخدام 717,308 صورة لقاع العين من 179,327 فردًا مصابًا بالسكري من نظام شنغهاي المتكامل للوقاية من السكري ورعايته (نموذج التكامل في شنغهاي). وبرنامج شنغهاي للوقاية من السكري (SDPP). وبعد ذلك، تم تطويره والتحقق من صحته في مجموعة بيانات داخلية تتألف من 76,400 صورة لقاع العين من 19,100 فرد مصاب بالسكري تم جمعها من مجموعة دراسة تقدم اعتلال الشبكية السكري (DRPS) (الشكل 1). تم تقسيم مجموعة DRPS إلى مجموعة بيانات تطويرية ومجموعة اختبار داخلية على مستوى المرضى عند النسبة للتنبؤ بالمخاطر والوقت لتقدم اعتلال الشبكية السكري في نقاط زمنية مستقبلية محددة. للتحقق من تعميم النتائج
نظام DeepDR Plus، استخدمنا ثماني مجموعات طولية مستقلة للتحقق الخارجي (الطرق والشكل الموسع 1). تم تلخيص المعلومات الديموغرافية الأساسية، والمؤشرات الأنثروبومترية، والقياسات الكيميائية الحيوية، وصور الشبكية لجميع المجموعات في الجدول 1. يتم عرض التوزيع ذي الصلة لدرجات اعتلال الشبكية السكري في البداية وفي نهاية المتابعة في مجموعات التطوير والتحقق (الجدول الموسع 1)، استنادًا إلى المقياس الدولي لشدة مرض اعتلال الشبكية السكري السريري (ICDRDSS). .

ديب دي آر بلس يتنبأ بوقت تقدم اعتلال الشبكية السكري

تم استخدام مجموعة DRPS لتطوير نظام التعلم العميق لتقدم اعتلال الشبكية السكري. في التحقق الداخلي، لتوقع تقدم اعتلال الشبكية السكري بين مرضى السكري، حقق نموذج البيانات الوصفية مؤشر التوافق (C-index) بقيمة 0.696 (فاصل الثقة 95%، 0.668-0.725)؛ وحقق نموذج قاع العين مؤشر توافق بقيمة 0.823 ( )، الذي كان متفوقًا على نموذج البيانات الوصفية؛ وحقق النموذج المدمج مؤشر C بقيمة 0.833 ( ). أشارت النتائج المذكورة أعلاه إلى أن أداء النموذج المدمج كان مشابهًا لأداء نموذج قاع العين، مما يبرهن على دقة أداء نموذج قاع العين في التنبؤ (الجدول الموسع 2). في مجموعات البيانات الخارجية المستقلة الثمانية، حققت النماذج أداءً مشابهًا في التنبؤ بتقدم اعتلال الشبكية السكري. حقق نموذج قاع العين مؤشرات C تتراوح بين 0.786 و0.802، وهي مشابهة للنموذج المدمج. استخدم نموذج قاع العين صورًا منخفضة الدقة من لا تزال البكسلات تحقق أداءً متفوقًا مقارنة بنموذج البيانات الوصفية، مما يشير إلى أن متطلبات الدقة لهذه التقنية يمكن تلبيتها بسهولة (الشكل التوضيحي التكميلي 1).
بعد ذلك، توقعنا الوقت المحدد لتقدم اعتلال الشبكية السكري بناءً على صور قاع العين في السنوات من 1 إلى 5. تم استخدام مؤشر C ومقياس بريير المتكامل (IBS) لتقييم أداء نموذج قاع العين في مجموعات البيانات الداخلية والخارجية. كما هو موضح في الشكل 2أ، حقق نموذج قاع العين مؤشرات C تتراوح بين 0.823 و0.862 وبلغ مقياس IBS من 0.049 إلى 0.161 للسنوات تم نقل أداء نموذج قاع العين بشكل جيد إلى مجموعات البيانات الخارجية و 5، مما أدى إلى مؤشرات C بمقدار ومؤشرات IBS تتراوح بين 0.066-0.170، مما يشير إلى التوافق العالي والمعايرة القوية لنظام DeepDR Plus.
لتقييم قدرة نموذج قاع العين على التنبؤ، قمنا بتصنيف عيون الأفراد المصابين بالسكري إلى مجموعتين (مخاطر منخفضة أو عالية) لتقدم اعتلال الشبكية السكري بناءً على درجات المخاطر المتوقعة. كان العتبة للمجموعتين ذات المخاطر المنخفضة والعالية مستندة إلى الوسيط لدرجات المخاطر المتوقعة من نماذج قاع العين في مجموعة البيانات التطويرية. كما هو موضح في الشكل 2ب، يمكن لنموذج قاع العين التمييز بدقة بين المجموعات ذات المخاطر المنخفضة والعالية في كل من مجموعات البيانات الداخلية والخارجية (اختبار لوغ-رانك “). بالإضافة إلى ذلك، استخدمنا منحنيات التشغيل التشغيلي للمستقبل (ROC) المعتمدة على الزمن في السنوات من 1 إلى 5 لتقييم دقة التنبؤ بنموذج قاع العين لتقدم اعتلال الشبكية السكري. في السنوات من 1 إلى 5، تراوحت المساحات تحت منحنى ROC (AUCs) لتقدم اعتلال الشبكية السكري بين 0.826 و0.865 في مجموعة البيانات الداخلية. في المجموعات الخارجية، تراوحت قيم AUC بين 0.722 و0.863 (الشكل 2ج). على وجه الخصوص، عرضنا أداء النموذج في التنبؤ بوقت تقدم العيون المصابة باعتلال الشبكية السكري في مجموعة الاختبار الداخلية ومجموعات التحقق الخارجية 1، 2، 4 و5 (الشكل الموسع 2). تم تصوير مستوى الاتفاق بين الوقت المتوقع لتقدم اعتلال الشبكية السكري والوقت الفعلي لتقدمه باستخدام مخطط بلاند-ألتمن. أظهر نموذج قاع العين أداءً جيدًا في التنبؤ بتقدم اعتلال الشبكية السكري، محققًا معامل التحديد ( ) بمقدار 0.678 (الشكل البياني الموسع 2أ). الأداء التنبؤي لنموذج البيانات الوصفية ( ) كان أقل بشكل ملحوظ مقارنة بنموذج القاع. كما هو موضح في الشكل الموسع 2ب، أدى نموذج القاع أيضًا إلى خطأ متوسط مطلق أقل بشكل ملحوظ مقارنة بنموذج البيانات الوصفية ( ) ولم يُظهر فرقًا كبيرًا مقارنة بالنموذج المدمج ( ).
علاوة على ذلك، أجرينا تحليلًا فرعيًا لتقييم أداء نموذج قاع العين التنبؤي مع الأخذ في الاعتبار التحكم في نسبة السكر في الدم (الجدول التكميلي 1). لم يكن هناك فرق كبير
الشكل 1| تصميم نظام DeepDR Plus. أ، نظرة عامة تخطيطية على نظام DeepDR Plus. يمكن لنظام DeepDR Plus التنبؤ بالوقت حتى تقدم اعتلال الشبكية السكري وأداء تصنيف المخاطر باستخدام صور شبكية العين للأفراد المصابين بالسكري. ، تقييم وتطبيق نظام الذكاء الاصطناعي. قمنا بتدريب نظام الذكاء الاصطناعي الخاص بنا على مجموعة بيانات تطويرية واختبرنا القدرة على التعميم في ثماني مجموعات طولية مستقلة. ج، نظرة تخطيطية عامة للدراسة الواقعية. د، مخطط بصري لنظام DeepDR Plus. DM، داء السكري؛ DR، اعتلال الشبكية السكري؛ NPDR، اعتلال الشبكية السكري غير التكاثري؛ PDR، اعتلال الشبكية السكري التكاثري؛
DME، وذمة البقعة السكرية؛ DRPS، دراسة تقدم اعتلال الشبكية السكري؛ ECHM، إدارة الصحة بشرق الصين؛ WTHM، إدارة صحة ووهان تونغجي؛ NDSP، مشروع فحص السكري في نيشنغ؛ CUHK-STDR، جامعة هونغ كونغ الصينية – اعتلال الشبكية السكري المهدد للبصر؛ PUDM، إدارة السكري باتحاد بكين؛ SEED، علم أوبئة أمراض العين في سنغافورة؛ SiDRP، برنامج الفحص الوطني لاعتلال الشبكية السكري في سنغافورة؛ BJHC، دراسة مجموعة الرعاية الصحية في بكين؛ IM، الإدارة المتكاملة؛ DL، التعلم العميق.
لوحظ في أداء النموذج لتوقع تقدم اعتلال الشبكية السكري بين المرضى ذوي حالات التحكم في نسبة السكر في الدم المختلفة، بغض النظر عن إضافة مستويات الهيموغلوبين A1c (HbA1c) في المتابعة.

ديب دي آر بلس يتنبأ بوقت التقدم في ثلاث مجموعات فرعية

نظرًا لأن تحديد متى يجب على المرضى مراجعة طبيب العيون وتقييم مدى اعتلال الشبكية السكري هما من الاهتمامات الرئيسية لكل من الأطباء والمرضى، أجرينا ثلاث تحليلات فرعية لتقديم أدلة إضافية على القدرات التنبؤية لنظام DeepDR Plus. شملت المجموعات الفرعية الثلاث مرضى السكري بدون اعتلال شبكية إلى اعتلال شبكية سكري (المجموعة الفرعية 1)، اعتلال شبكية غير قابل للإحالة إلى اعتلال شبكية قابل للإحالة (المجموعة الفرعية 2)، اعتلال شبكية غير مهدد للرؤية إلى اعتلال شبكية مهدد للرؤية (المجموعة الفرعية 3).
تم تعريف اعتلال الشبكية السكري القابل للإحالة على أنه اعتلال شبكية سكري غير تكاثري متوسط الشدة (NPDR) أو أسوأ، و/أو وذمة ماكولا سكري (DME). بالإضافة إلى ذلك، عرفنا اعتلال الشبكية السكري المهدد للبصر (VTDR) على أنه اعتلال شبكية سكري غير تكاثري شديد (NPDR)، اعتلال شبكية سكري تكاثري (PDR) و/أو وذمة ماكولا سكري (DME).
في هذه المجموعات الفرعية الثلاث، قمنا بتطوير واختبار نظام DeepDR Plus باستخدام صور الشبكية الأساسية للتنبؤ بأنواع مختلفة من تدهور درجات اعتلال الشبكية السكري على مدى 5 سنوات. تم مقارنة أداء نماذج التنبؤ الثلاثة لكل مجموعة فرعية باستخدام مؤشر C و IBS. حقق نموذج البيانات الوصفية مؤشرات C تتراوح بين 0.700-0.711 و IBS تتراوح بين 0.261-0.328 في التنبؤ بالتقدم إلى أي درجة من اعتلال الشبكية السكري، واعتلال الشبكية السكري القابل للإحالة، واعتلال الشبكية السكري المتقدم في مجموعة البيانات الداخلية. بالمقارنة مع نموذج البيانات الوصفية، تحسنت مؤشرات C لنموذج قاع العين إلى 0.826 ( ،
الجدول 1 | الخصائص الأساسية للمشاركين في مجموعة البيانات الداخلية ومجموعات بيانات التحقق الخارجية
المجموعات مجموعة البيانات المدربة مسبقًا مجموعة بيانات التطوير مجموعة الاختبار الداخلية إي سي إتش إم خارجي-1 WTHM الخارجي-2 NDSP الخارجي-3 CUHK-STDR خارجي-4 PUDM خارجي-5 SEED خارجي-6 SiDRP خارجي-7 BJHC الخارجي-8
عدد الصور ٧١٧,٣٠٨ ٦٨٬٧٦٠ ٧٬٦٤٠ ٨٬٥٦٤ ٣٬٨٨٤ ٤٬٧٧٦ ١٬١٨٢ ١٬٢٢٨ ٦,٦٧٦ ١٢٬٨١٨ ٣٬٣٤٠
عدد المشاركين ١٧٩٬٣٢٧ ١٧٬١٩٠ ١٬٩١٠ ٢٬١٤١ ٩٧١ ١٬١٩٤ ٣٣٧ ٣٠٧ ١٬٦٩٩ ٣٬٢٨٤ ٨٣٥
عرق
صيني (%) ١٧٩٬٣٢٧ (١٠٠٪) 17,190 (100%) ١٬٩١٠ (١٠٠٪) ٢,١٤١ (١٠٠٪) 971 (100%) ١٬١٩٤ (١٠٠٪) 337 (100%) ٣٠٧ (١٠٠٪) 411 (24.19%) ٢٬٤٩٤ (٧٥٫٩٤٪) 835 (100%)
مالاي (%) غير متوفر غير متوفر غير متوفر غير متوفر غير متوفر غير متوفر غير متوفر غير متوفر 532 (31.31%) 518 (15.77%) غير متوفر
هندي (%) غير متوفر غير متوفر غير متوفر غير متوفر غير متوفر غير متوفر غير متوفر غير متوفر 756 (44.50%) 272 (8.28%) غير متوفر
الجنس
أنثى، (%) 96,676 (53.91%) ٢٬٦٩٢ (١٥٫٦٦٪) 337 (17.62%) 826 (38.58%) 313 (32.23%) ٧٣٩ (٦١.٨٩٪) 169 (50.15%) 131 (42.67%) 852 (50.15%) 1,661 (50.58%) ٤٠٠ (٤٧٫٩٠٪)
ذكر، (%) ٨٢٬٦٥١ (٤٦٫٠٩٪) 14,498 (84.34%) ١,٥٧٣ (٨٢.٣٨٪) 1,315 (61.42%) 658 (67.77%) 455 (38.11%) 168 (49.85%) 176 (57.33%) ٨٤٧ (٤٩.٨٥٪) 1,623 (49.42%) 435 (52.10%)
العمر (بالسنوات)
مدخن، (%) 19,249 (10.73%) ٤,٢٥٥ (٢٤.٧٥٪) 470 (24.60%) 277 (12.94%) 215 (22.14%) ٢٠٧ (١٧.٣٤٪) 83 (24.63%) 122 (39.74%) 484 (28.49%) ٦٣ (١.٩٪) غير متوفر
مؤشر كتلة الجسم ( )
ضغط الدم الانقباضي (مم زئبق)
الهيموغلوبين السكري (%) غير متوفر
الجلوكوز الصائم في البلازما ( ) غير متوفر
مستوى الجلوكوز العشوائي في الدم ( ) غير متوفر غير متوفر غير متوفر غير متوفر غير متوفر غير متوفر غير متوفر غير متوفر غير متوفر غير متوفر
الدهون الثلاثية (ممول )
كوليسترول البروتين الدهني منخفض الكثافة ( )
كوليسترول البروتين الدهني عالي الكثافة ( )
مدة الإصابة بمرض السكري (بالسنوات) غير متوفر غير متوفر
عيون مع تقدم اعتلال الشبكية السكري، (%) غير متوفر ٢,٨١٩ (٨.٢٠٪) 278 (7.28%) 321 (7.50%) 121 (6.23%) ٤٨ (٢.٠١٪) 114 (16.91%) ٢٥ (٤٫٠٧٪) 184 (5.41%) 171 (2.60%) 38 (2.28%)
الشكل 2 | التحقق الداخلي والخارجي من نموذج قاع العين في التنبؤ بتقدم اعتلال الشبكية السكري. أ، IBS (يسار) يظهر الملاءمة العامة (الأقل أفضل) ومؤشر C (يمين) يقيس تمييز المخاطر للنموذج (الأعلى أفضل) لنقاط زمنية مختلفة. تشمل بيانات التحقق الخارجي صور قاع العين من أفراد في مجموعات ECHM وWTHM وCUHK-STDR وPUDM. ب، مخططات كابلان-ماير لتنبؤ تقدم اعتلال الشبكية السكري. الـ” المحور يشير إلى الوقت بالسنوات. الـ المحور هو احتمال البقاء، يقيس احتمال عدم تقدم اعتلال الشبكية السكري خلال 5 سنوات. تم استخدام اختبار لوغ-رانك أحادي الجانب للمقارنة.
بين المجموعات منخفضة المخاطر وعالية المخاطر. الـ القيم لمجموعة الاختبار الداخلية ومجموعات بيانات التحقق الخارجية و 5 هي ، و ، على التوالي. ج، التنبؤ بتقدم اعتلال الشبكية السكري باستخدام منحنيات ROC المعتمدة على الزمن. يشير النجمة إلى وجود حالة واحدة فقط من التقدم من عدم وجود اعتلال الشبكية السكري إلى اعتلال الشبكية السكري في السنة الأولى. المناطق المظللة في و تعني فواصل الثقة. تُعرض المساحات تحت منحنيات ROC كقيم متوسطة (الحد الأدنى لـ ، الحد الأعلى لـ ).
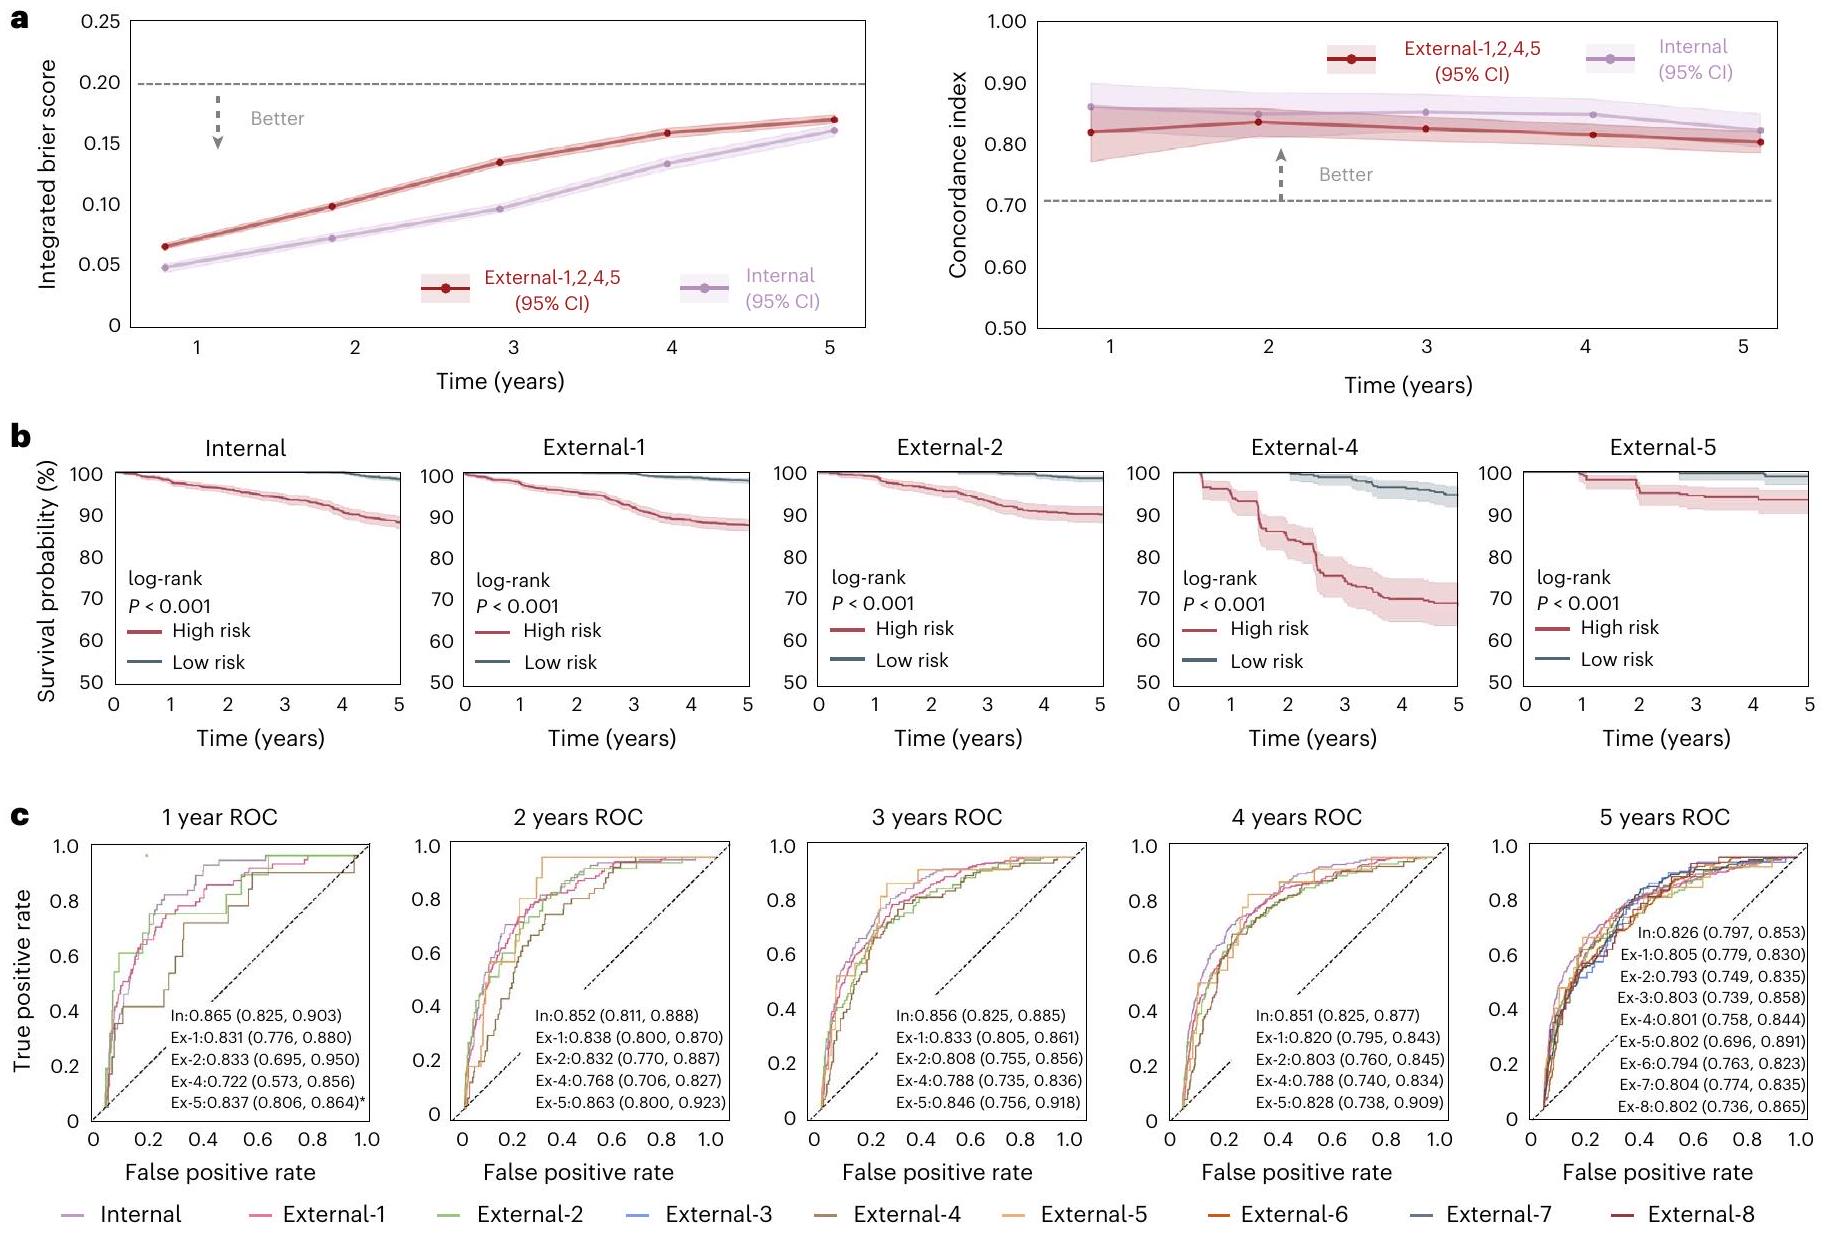
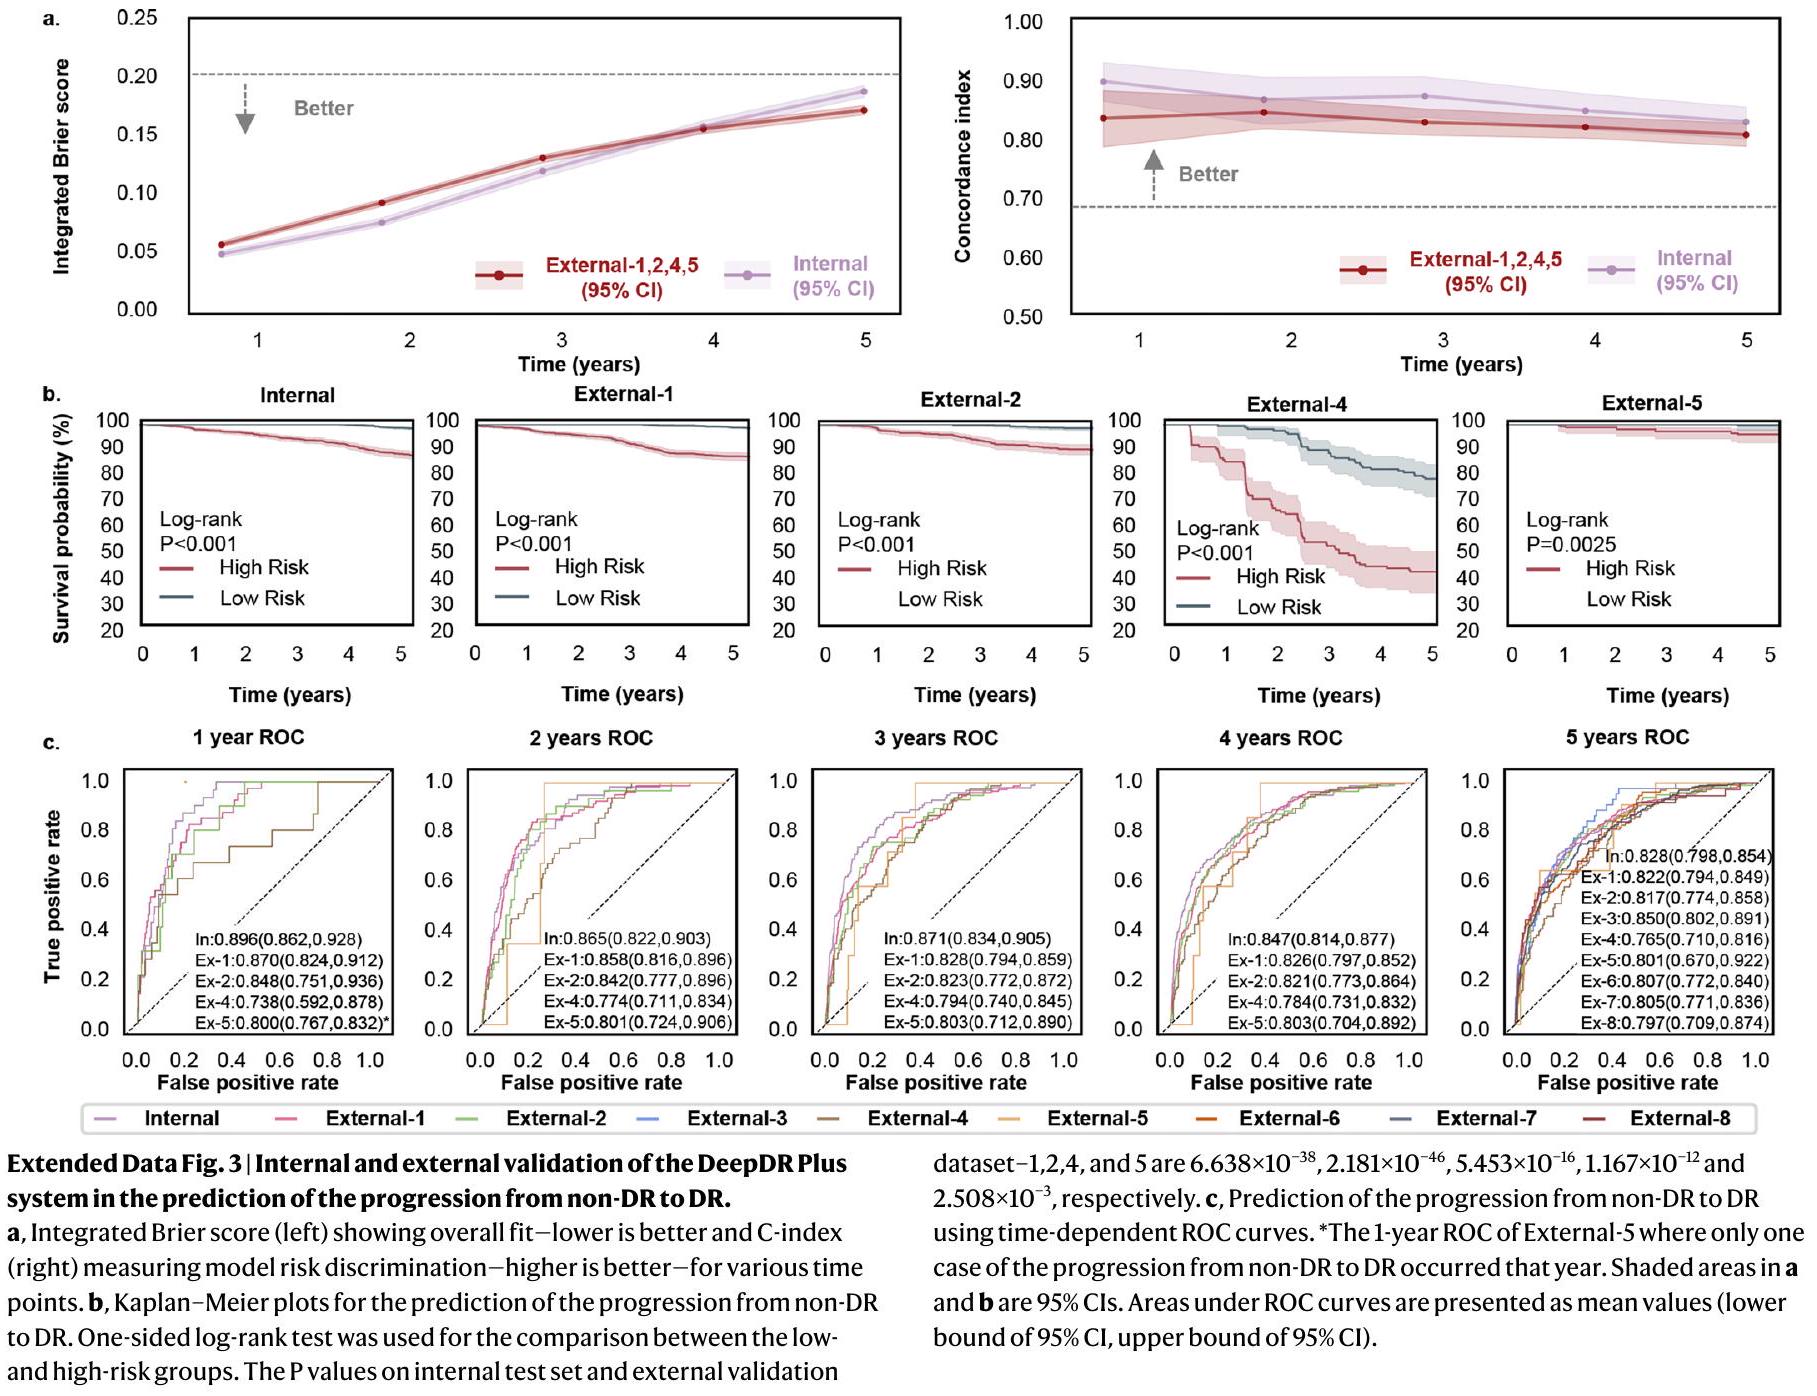
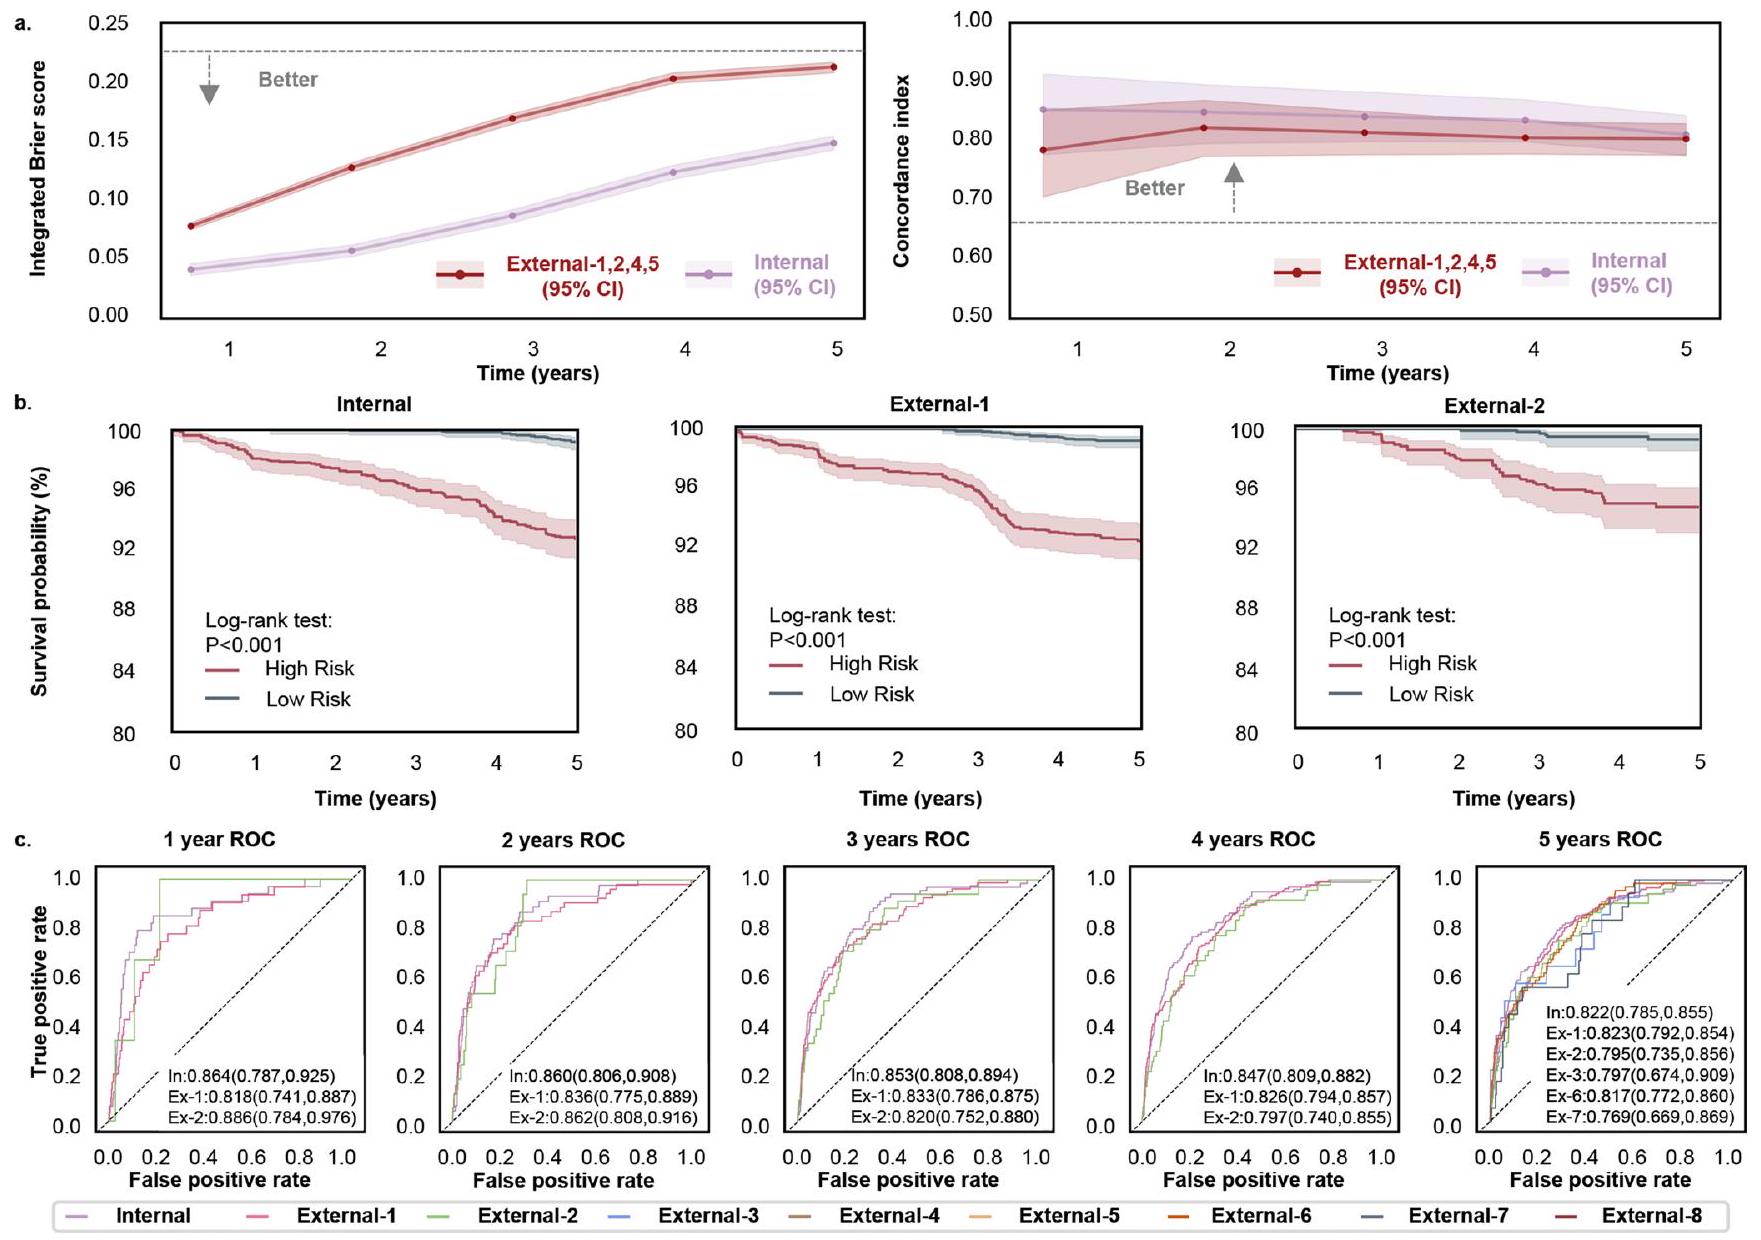
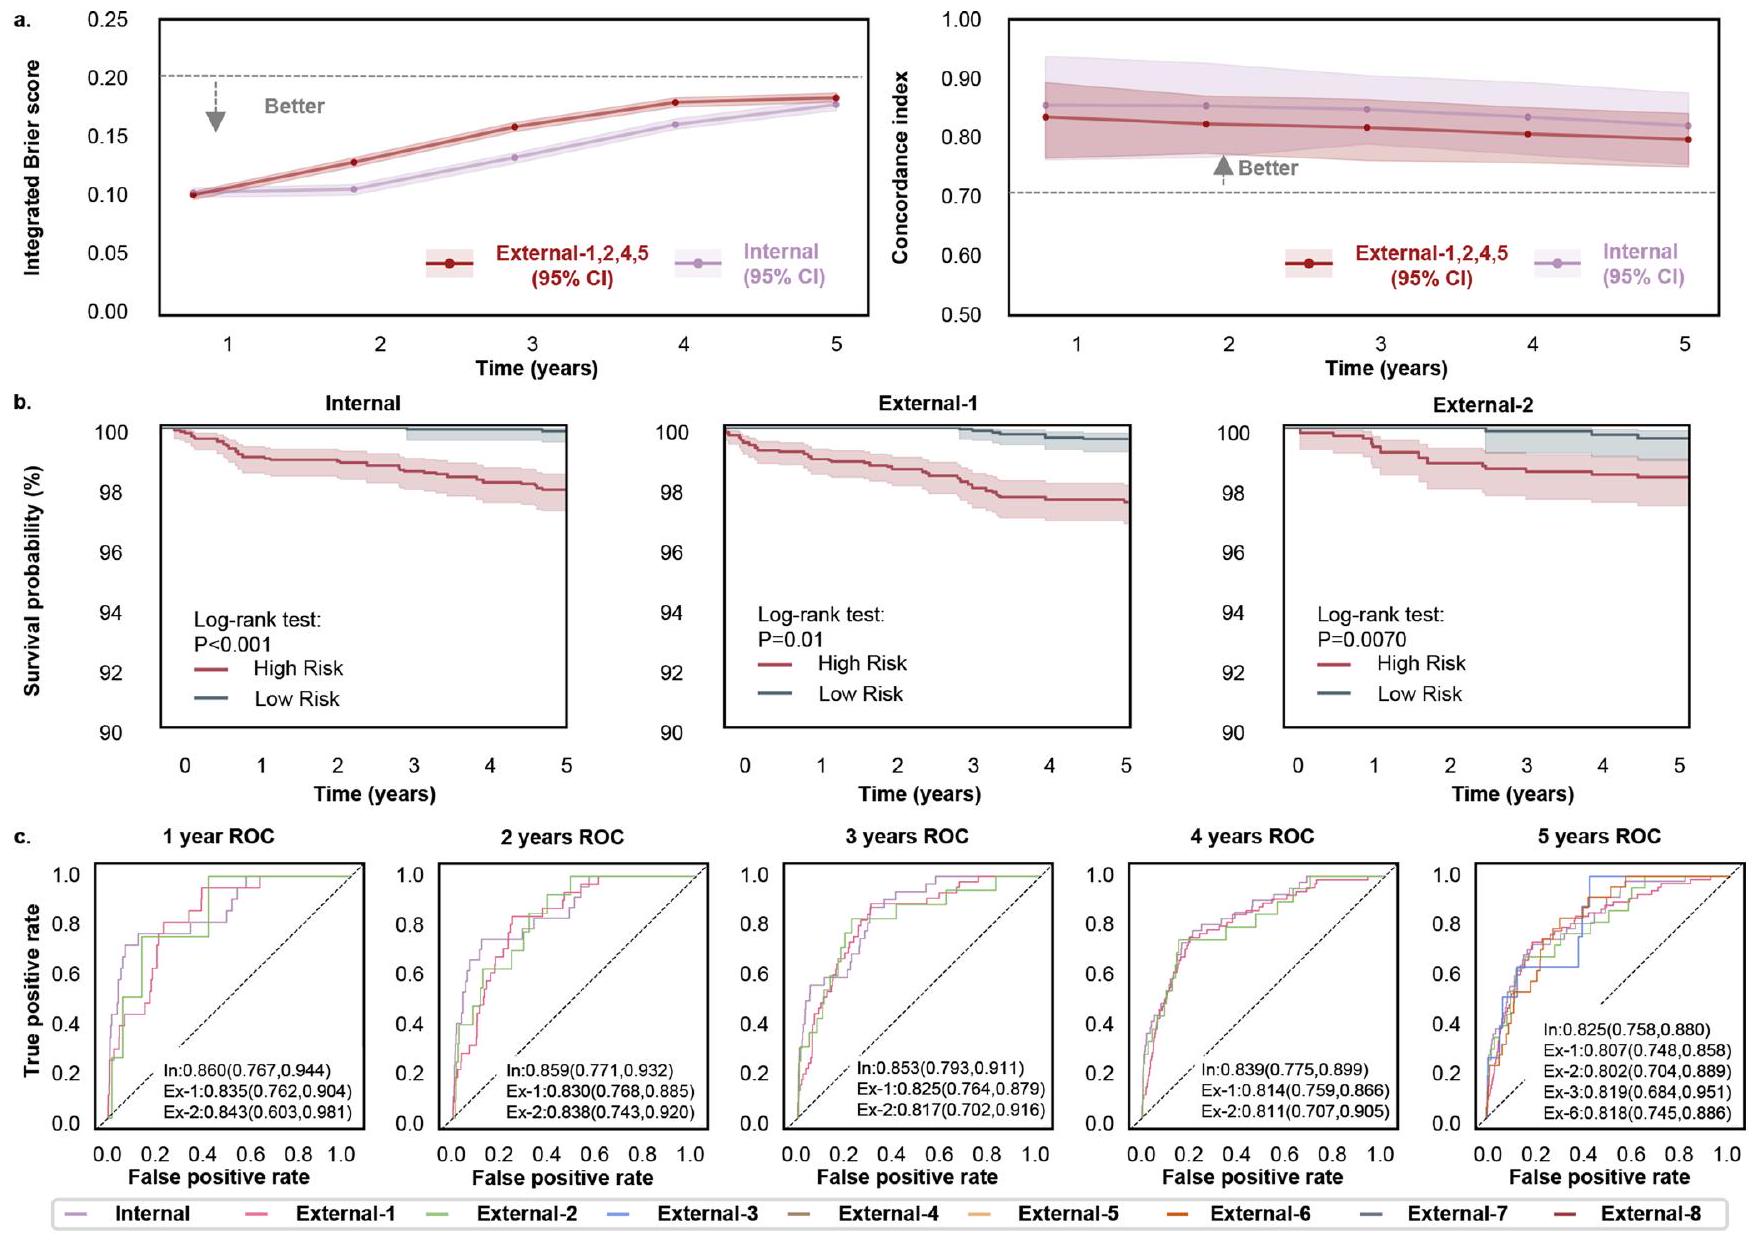
0.797-0.851) لاعتلال الشبكية السكري، 0.820 (فاصل الثقة 95%، 0.785-0.853) لاعتلال الشبكية السكري القابل للإحالة، و0.824 (فاصل الثقة 95%، 0.758-0.880) لاعتلال الشبكية السكري المتقدم، بينما انخفض مؤشر الخطأ المتكامل (IBS) إلى 0.153-0.189 للثلاث مجموعات الفرعية. عند دمج صور قاع العين مع البيانات السريرية، أعطى النموذج المدمج مؤشرات C تتراوح بين 0.835-0.852 وIBS بين 0.145-0.167 للمجموعات الفرعية 1-3 (الجدول الموسع 2). علاوة على ذلك، قمنا بتقييم أداء التنبؤ لنموذج قاع العين في مجموعات البيانات الخارجية وحققنا نتائج مماثلة لمجموعة البيانات الداخلية (الجدول الموسع 2). أشارت النتائج إلى أن صور قاع العين وحدها يمكنها التنبؤ بفعالية بتقدم المرض. وبالمثل لمهمة التنبؤ بالوقت حتى أي تقدم في اعتلال الشبكية السكري، قمنا بتقييم أداء التنبؤ في ثلاث مجموعات فرعية. كما هو موضح في الأشكال الموسعة 3-5، حقق نموذج قاع العين مؤشرات C تتراوح بين 0.820-0.895 وIBS بين 0.045-0.189 في مجموعة البيانات الداخلية للسنوات 1-5. علاوة على ذلك، حققت مجموعات التحقق الخارجية 1، 2، 4 و5 مؤشرات C تتراوح بين 0.794-0.842 وIBS بين 0.058-0.218.
تُظهر نتائج تصنيف المخاطر لنظام DeepDR Plus في التنبؤ بتقدم ثلاث مجموعات فرعية في الأشكال الموسعة 3-5. قمنا بتصنيف العيون الأساسية للأفراد المصابين بالسكري إلى مجموعتين (مخاطر منخفضة أو عالية) لتقدم المرض بناءً على درجات المخاطر المتوقعة من نموذج قاع العين. تم تحقيق فواصل معنوية في منحنيات البقاء لكل مجموعة في كل من البيانات الداخلية
ومجموعات البيانات الخارجية ( ) في ثلاث مجموعات فرعية. بالإضافة إلى ذلك، استخدمنا منحنيات ROC المعتمدة على الزمن في السنوات 1-5 لتقييم دقة التنبؤ لنموذج قاع العين في الحالات الثلاث المذكورة أعلاه. في السنوات 1-5، كانت قيم AUC تتراوح بين 0.822 و0.896 للتنبؤ بحدوث اعتلال الشبكية السكري، واعتلال الشبكية السكري القابل للإحالة، واعتلال الشبكية السكري المتقدم في مجموعة البيانات الداخلية. بالنسبة للتحقق الخارجي، حقق نموذج قاع العين أداءً مماثلاً مع قيم AUC تتراوح بين 0.738 و0.886.
تطبيق نظام DeepDR Plus يحسن النتائج السريرية
لتقييم فعالية نظام DeepDR Plus مع دمج سير العمل السريري، أجرينا دراسة في العالم الحقيقي ضمن دراسة مستقبلية مجتمعية شملت البالغين الصينيين (الطرق). تم تضمين ما مجموعه 2185 مشاركًا في التحليل، مع 538 مشاركًا في مجموعة الإدارة المتكاملة (برنامج إدارة مرض السكري المتكامل بين المستشفى والمجتمع) و1647 مشاركًا في المجموعة غير المتكاملة. تم تزويد المشاركين في مجموعة الإدارة المتكاملة بقياسات سريرية وأيضية منتظمة، بإشراف متخصصين في المستشفيات الشاملة، وتلقوا إرشادات حول نمط الحياة ودعم الأقران في مراكز خدمات الصحة المجتمعية. . تم توضيح تسجيل المشاركين في الشكل الموسع 6أ، وتُدرج الخصائص المحددة لجميع المشاركين عند البداية وعند نهاية المتابعة في
الجدول 2 | العلاقات بين نموذج تحديد المخاطر ونتائج المشاركين
معدل حدوث تقدم اعتلال الشبكية السكري لكل 1000 سنة عين (عدد الحالات/عدد العيون) ARR (فاصل الثقة 95%)
مجموعة IM ( ) ديب دي آر بلس – منخفض المخاطر (الذكاء الاصطناعي – منخفض) بيانات وصفية – منخفضة المخاطر (ميتا-منخفض) -33.05 (-67.79، 35.76)
٥.١١ (١٦/٦٢٦) ٧.٦٣ (٢٤/٦٢٩)
ديب دي آر بلس – عالي الخطورة (ذكاء اصطناعي – عالي) البيانات الوصفية – عالية المخاطر (ميتا-عالية) 14.54 (-28.26، 74.63)
26.67 (60/450) ٢٣٫٢٧ (٥٢/٤٤٧)
برنامج متكامل لإدارة داء السكري بين المستشفى والمجتمع غير IM ( ) ديب دي آر بلس – منخفض المخاطر (الذكاء الاصطناعي – منخفض) بيانات وصفية – منخفضة المخاطر (ميتا-منخفض) -91.63 (-93.91، -89.06)
٥٫٠١ (٥٠/١٬٩٩٦) 11.34 (113/1,993)
ديب دي آر بلس – عالي الخطورة (الذكاء الاصطناعي – عالي) البيانات الوصفية – عالية المخاطر (ميتا-عالية) 61.36 (25.36، 109.91)
٣٣.١٣ (٢١٥/١٬٢٩٨) 23.37 (152/1,301)
التدخلات الشاملة: [(AI-مرتفع + AI-منخفض) – (meta-مرتفع + meta-منخفض)] في مجموعة IM – [(Al-مرتفع + Al-منخفض) – (meta-مرتفع + meta-منخفض)] في المجموعة غير IM 46.80 (12.37، 94.93)
دراسة سانكارا نيثرالايا لعلم أوبئة اعتلال الشبكية السكري وعلم الوراثة الجزيئي مجموعة IM ( ) ديب دي آر بلس – منخفض المخاطر (الذكاء الاصطناعي – منخفض) بيانات وصفية – منخفضة المخاطر (ميتا-منخفض) -9.39 (-79.77، 287.41)
٤.٠٨ (٢/٩٨) ٤.٤٩ (٢/٨٩)
ديب دي آر بلس – عالي الخطورة (آل-عالي) البيانات الوصفية – عالية المخاطر (ميتا-عالية) 20.48 (-70.93، 400.0)
٢٥٫٠ (٦/٤٨) 21.05 (6/57)
المجموعة غير التابعة لـ IM ( ) ديب دي آر بلس – منخفض المخاطر (الذكاء الاصطناعي – منخفض) بيانات وصفية – منخفضة المخاطر (ميتا-منخفض) -97.32 (-98.28، -96.32)
٥.٢٤ (٢٨/١٠٦٨) 13.0 (70/1,077)
ديب دي آر بلس – عالي الخطورة (آل-عالي) البيانات الوصفية – عالية المخاطر (ميتا-عالية) 43.13 (9.1، 87.18)
٤٤.١١ (١٦١/٧٣٠) 33.01 (119/721)
التدخلات الشاملة: [(AI-مرتفع + AI-منخفض) – (meta-مرتفع + meta-منخفض)] في مجموعة IM – [(AI-مرتفع + AI-منخفض) – (meta-مرتفع + meta-منخفض)] في المجموعة غير IM 88.74 (10.83، 330.25)
يتم الإبلاغ عن ARR كـ “الوسيط ( “ ) عن طريق التمهيد. تم تضمين العيون التي تحتوي على صور قاع عين قابلة للتقييم في كل من الزيارات الأساسية والمتابعة في دراسة سانكارا نيثرالايا لعلم أوبئة وراثة اعتلال الشبكية السكري.
الجدول التكميلي 2. تم تقييم صور الشبكية الأساسية والبيانات الوصفية لجميع المشاركين بواسطة نموذجين (نموذج قاع العين ونموذج البيانات الوصفية في نظام DeepDR Plus) لتقييم خطر تطور اعتلال الشبكية السكري. قام كل نموذج بتوليد الوقت المتوقع كدرجة خطر، والتي تم مقارنتها بعتبة محددة لكل نموذج تم الحصول عليها في مجموعة البيانات التطويرية. وبناءً عليه، قام كلا النموذجين بتقسيم مجموعة IM ومجموعة غير IM إلى مجموعات ذات خطر منخفض وخطر مرتفع.
حسبنا الانخفاض النسبي المعدل (ARR) معدل تقدم اعتلال الشبكية السكري بين نموذج قاع العين ونموذج البيانات الوصفية في نظام DeepDR Plus (الجدول 2). بعد التعديل لعوامل ديموغرافية المرضى، والتاريخ الطبي، والمؤشرات الأنثروبومترية، والقياسات الكيميائية الحيوية، في مجموعة IM، لم يكن الفرق في معدل تقدم اعتلال الشبكية السكري بين نموذج قاع العين ونموذج البيانات الوصفية ذا دلالة إحصائية في كل من مجموعة المخاطر المنخفضة (ARR -33.05%; 95% فترة الثقة، -67.79-35.76%) ومجموعة المخاطر العالية (ARR 14.54%; 95% فترة الثقة، -28.26-74.63%). ومع ذلك، كان لدى المرضى من مجموعة المخاطر العالية لنموذج قاع العين في مجموعة غير IM معدل تقدم اعتلال الشبكية السكري أعلى مقارنة بمجموعة المخاطر العالية لنموذج البيانات الوصفية (33.13 مقابل 23.37 لكل 1000 سنة عين). المشاركون الذين تم تحديدهم بواسطة مجموعة المخاطر العالية لنموذج قاع العين كانوا أكثر عرضة لتطور تقدم اعتلال الشبكية السكري عندما لم يتلقوا إدارة متكاملة بين المستشفى والمجتمع (ARR 61.36%; 95% فترة الثقة، 25.36-109.91%). ومن المثير للاهتمام، في مرضى مجموعة غير IM، كان لدى مجموعة المخاطر المنخفضة لنموذج قاع العين معدل تقدم اعتلال الشبكية السكري أقل بشكل ملحوظ مقارنة بمجموعة المخاطر المنخفضة لنموذج البيانات الوصفية (ARR إلى ). تحت التدخلات الشاملة (أي التدخل المكثف للمجموعة عالية الخطورة والتدخل غير المكثف للمجموعة منخفضة الخطورة)، مقارنة بنموذج البيانات الوصفية، يمكن لنموذج قاع العين أن يمنع نسبيًا حدوث تقدم اعتلال الشبكية السكري (التقليل النسبي للمخاطر 46.80٪؛ فترة الثقة 95٪، 12.37-94.93٪).
لتقييم نتائج التكامل مع سير العمل السريري بشكل أعمق، أجرينا أيضًا دراسة في العالم الحقيقي ضمن مجموعة مستقبلية هندية (SN-DREAMS) ، من بين 992 مريضًا بالسكري خضعوا لمتابعة لمدة 4 سنوات (الجدول التكميلي 3). مقارنةً بنموذج البيانات الوصفية، كان نموذج قاع العين قادرًا نسبيًا على
الجدول 3 | أداء نظام الفحص الشخصي الموصى به من قبل نموذج البيانات الوصفية أو نموذج قاع العين في DeepDR Plus، مقارنة بالفحص السنوي الثابت
مجموعة نموذج متوسط فترة الفحص (بالأشهر) انخفاض في تكرار الفحص (%) تأخر اكتشاف أي تقدم في اعتلال الشبكية السكري (%) التأخر في اكتشاف التقدم إلى اعتلال الشبكية السكري المتقدم (%)
أنا البيانات الوصفية ٣٤٫٠٦ ٦٤٫٧٧ 1.86 0.93
قاع العين ٣١٫٥٤ ٦١٫٩٥ 0.37 0.37
غير IM البيانات الوصفية ٣٥٫٣٢ ٦٦٫٠٢ ٦٫٠١ 0.97
قاع العين ٣٢٫١١ ٦٢٫٦٣ 1.28 0.12
الرسائل الفورية وغير الرسائل الفورية البيانات الوصفية ٣٥٫٠١ ٦٥٫٧٢ ٤٫٩٩ 0.96
قاع العين ٣١٫٩٧ ٦٢٫٤٦ 1.05 0.18
تم تحديد فترة الفحص عند نقطة زمنية سنوية من الخط الأساسي، والتي كانت فقط السنة التي تلي الوقت المتوقع لتقدم اعتلال الشبكية الخاص بالمشارك وفقًا لنموذج البيانات الوصفية أو نموذج قاع العين. الانخفاض الناتج في عدد الفحوصات السنوية للسكان عند تطبيق نظام الفحص الشخصي الموصى به بواسطة نموذج البيانات الوصفية أو نموذج قاع العين في DeepDR Plus، مقارنة بالفحص السنوي الثابت. معدل تأخر اكتشاف تقدم اعتلال الشبكية السكري عند تطبيق نظام الفحص الشخصي الموصى به بواسطة نموذج البيانات الوصفية أو نموذج قاع العين في DeepDR Plus، مقارنة بالفحص السنوي الثابت.
منع معدل تقدم اعتلال الشبكية السكري تحت التدخلات الشاملة (الجدول 2)
علاوة على ذلك، قمنا بتقييم أداء نظام الفحص المخصص الذي يوصي به نموذج البيانات الوصفية أو نموذج قاع العين، مقارنة بالفحص السنوي الثابت. يوضح الجدول 3 متوسط فترة الفحص، وتقليل تكرار الفحص، ومعدل التأخر في اكتشاف تقدم اعتلال الشبكية السكري في كل من مجموعتي IM وغير IM. بالنسبة لجميع المشاركين، يمكن تمديد متوسط فترة الفحص من 12 شهرًا إلى 31.97 شهرًا إذا تم تطبيق ذلك على جميع المشاركين في كل من مجموعتي IM وغير IM

اتبعت المجموعات فترة الفحص الشخصية الموصى بها التي قدمها نموذج قاع العين. بالمقارنة مع نموذج البيانات الوصفية، يمكن لنموذج قاع العين تحقيق تقليل مماثل في تكرار الفحص ( مقابل ) مع الحفاظ على كشف أقل تأخيرًا بشكل واضح لأي تقدم في اعتلال الشبكية السكري (1.05% مقابل 4.99%). بالإضافة إلى ذلك، كان هناك
معدل أقل من الكشف المتأخر لأي تقدم في اعتلال الشبكية السكري لدى مرضى مجموعة IM مقارنة بمجموعة غير IM ( مقابل ) باستخدام فترة الفحص الموصى بها من قبل نموذج قاع العين، والذي أشار إلى أن نظام DeepDR Plus يمكنه ضمان احتمال منخفض لتأخر اكتشاف تقدم اعتلال الشبكية السكري بغض النظر عن المستقبل
التدخلات. يوضح الشكل الموسع 6ب مخطط الشلال للوقت المتوقع لتقدم اعتلال الشبكية السكري للمشاركين في الدراسة الواقعية بواسطة نموذج قاع العين. إذا اتبع جميع المشاركين في مجموعتي IM وغير IM فترة الفحص الشخصية الموصى بها من قبل نموذج قاع العين، فإن نسبة المشاركين الذين تم التوصية لهم بفحص اعتلال الشبكية السكري خلال 1-5 سنوات كانت 30.62%، 20.00%، 19.63%، 11.85% و ، على التوالي، في حين أن الكشف المتأخر عن التقدم إلى اعتلال الشبكية السكري المتقدم كان فقط لتلخيص، بالمقارنة مع نموذج البيانات الوصفية، يمكن لنموذج قاع العين تصنيف المشاركين بدقة أكبر لتمكين التدخلات الشخصية وتقليل تكرار فحوصات اعتلال الشبكية السكري مع تقليل تأخر اكتشاف تقدم اعتلال الشبكية السكري.

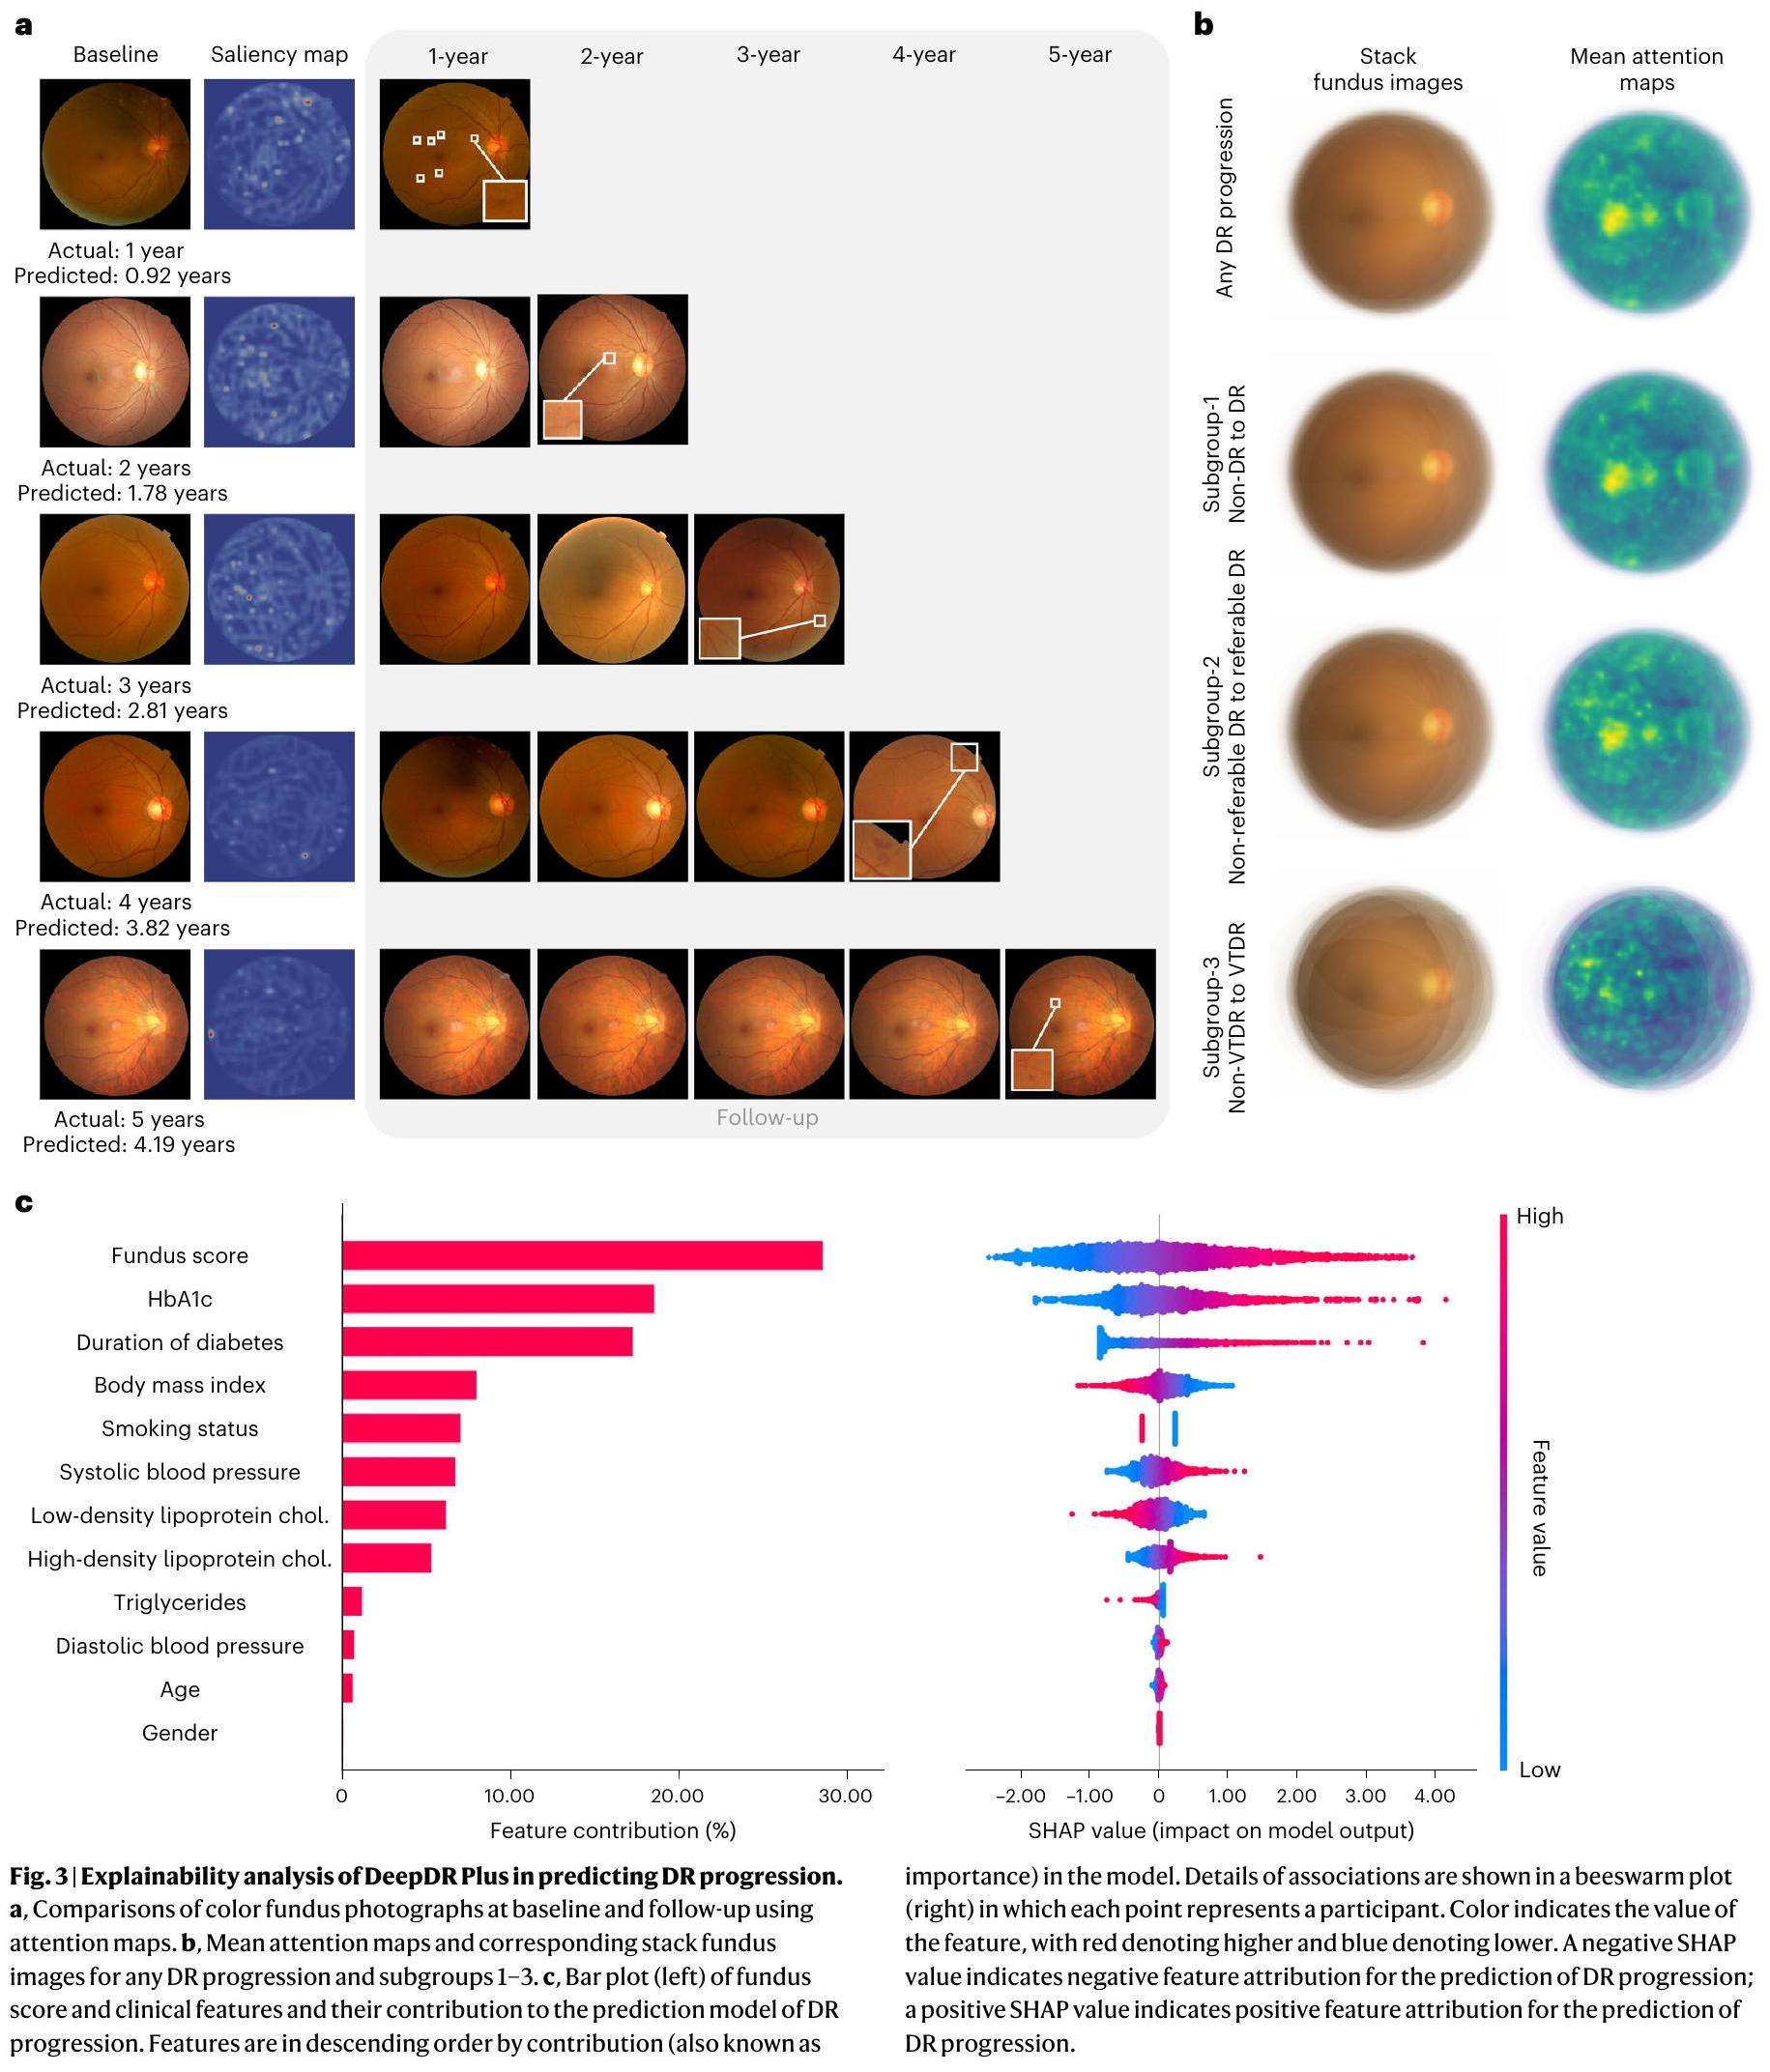
تحليل القابلية للتفسير

يمكن لتفسير نظام DeepDR Plus أن يسلط الضوء على آلية تشخيصه ويمكّن من اعتماده على نطاق واسع. لفهم أفضل لكيفية توقع نظام DeepDR Plus لتطورات اعتلال الشبكية السكري، اتخذنا ثلاث خطوات لضمان صلة ووضوح الميزات الناتجة.
أولاً، أجرينا تحليل الأهمية باستخدام طرق الانتباه (الطرق) لتوفير رؤى حول المناطق في صور قاع العين التي قد تؤثر على توقعات نموذج قاع العين. تُعرض خرائط الانتباه التمثيلية في أوقات مختلفة لتقدم اعتلال الشبكية السكري (من سنة إلى خمس سنوات، على التوالي) في الشكل 3أ. تم مقارنة خرائط الانتباه لصور قاع العين الأساسية مع صور قاع العين السنوية للمتابعة. أظهرت النتائج أن نموذج قاع العين لدينا توقع تقدم اعتلال الشبكية السكري من خلال التركيز على الأوعية الدموية الشبكية والبقعة. بالإضافة إلى ذلك، تم إنشاء خرائط انتباه متوسطة للعيون التي شهدت تقدم اعتلال الشبكية السكري من مجموعة الاختبار الداخلية، مما يعكس أن هذه الملاحظات كانت معممة عبر العديد من الصور (الشكل 3ب).
لقد تم إثبات أن كثافة الأوعية الدموية، البُعد الكسري، ومساحة المنطقة الخالية من الأوعية الدموية في البؤبؤ يمكن أن تتنبأ بتقدم اعتلال الشبكية السكري. . تدعم الدراسات السابقة أيضًا أن التغيرات الوعائية في الشبكية والمتغيرات المرتبطة بها مرتبطة بعوامل الخطر المتعلقة باعتلال الشبكية السكري لاستكشاف المزيد من أنماط الشبكية المرتبطة بحدوث اعتلال الشبكية السكري في المستقبل، تم قياس مجموعة من المتغيرات الوعائية الشبكية بشكل كمي بواسطة مقيمين بشريين كانوا غير مطلعين على خصائص المشاركين باستخدام برنامج تقييم الأوعية الدموية في سنغافورة الخاص بنا. أظهر تحليل كوكس للانحدار أن البُعد الكسري الوريدي الأعلى في المنطقة C كان مرتبطًا بشكل مستقل بأي تقدم في اعتلال الشبكية السكري، وظهور اعتلال الشبكية السكري، وظهور اعتلال الشبكية السكري القابل للإحالة بعد التعديل حسب العمر ( ) في مجموعة الاختبار الداخلية (الجداول التكميلية 4 و5). في الوقت نفسه، ما يعادل الوريد الشبكي المركزي في المنطقة و المنطقة تنبأ بشكل كبير بحدوث اعتلال الشبكية السكري واعتلال الشبكية السكري القابل للإحالة ( )، وكان ما يعادل الشريان الشبكي المركزي في المنطقة ب والمنطقة ج يتنبأ بشكل مستقل بحدوث اعتلال الشبكية القابل للإحالة ( ) بعد التعديل حسب العمر (الجدول التكميلي 5). على وجه التحديد، أدت هندسة الأوعية الدموية الشبكية إلى تحسن طفيف في قيم AUC عند إضافتها إلى نموذج البيانات الوصفية (الجدول التكميلي 6). أظهرت هذه النتائج أن هندسة الأوعية الدموية الشبكية الأساسية قد تكون أنماطًا تنبؤية لحدوث اعتلال الشبكية السكري، وقد يلتقط نموذج قاع العين إشارات تتجاوز هندسة الأوعية الدموية الشبكية لإجراء هذه التنبؤات.
علاوة على ذلك، قمنا بتطبيق تفسير النموذج المستند إلى SHAP لاكتشاف المساهمة التنبؤية للميزات السريرية المختلفة في تقدم اعتلال الشبكية السكري في مجموعة الاختبار الداخلية (الشكل 3ج). كان لدرجة قاع العين أعلى مساهمة في أداء النموذج.

مناقشة

الفحص المبكر والتدخل في الوقت المناسب أمران حاسمان للوقاية والإدارة السريرية الأفضل لاعتلال الشبكية السكري لتحقيق نتائج إيجابية. في هذه الدراسة، طورنا نظام تعلم عميق يُدعى نظام DeepDR Plus الذي استخدم صور الشبكية الأساسية للتنبؤ بدقة بالوقت الفردي لتقدم اعتلال الشبكية السكري لجميع الفترات حتى 5 سنوات. كما أظهرنا أن دمج هذا النظام في سير العمل السريري يمكن أن يمدد متوسط فترة الفحص من 12 شهرًا الحالية إلى ما يقرب من 3 سنوات، في حين أن الكشف المتأخر عن التقدم إلى اعتلال الشبكية السكري المتقدم كان
فقط 0.18%. أظهرت هذه النتائج أن نظام DeepDR Plus الخاص بنا يمكن أن يعزز تقييم المخاطر الخاص بالمريض ورعاية أكثر تخصيصًا لإدارة اعتلال الشبكية السكري، استنادًا إلى فحص شبكية العين لمرة واحدة فقط في المستقبل.
يمكن أن يحسن الفاصل الزمني المخصص لفحص اعتلال الشبكية السكري الكفاءة ويركز المزيد من الاهتمام على الأشخاص المعرضين لخطر مرتفع لتطور اعتلال الشبكية السكري. ، حيث إن الفحوصات الشخصية من قبل الخبراء غير عملية وغير مستدامة نظرًا لحجم السكان المصابين بالسكري في ظل الجائحة. في الدراسات السابقة تم إنشاء أنظمة التعلم العميق للتنبؤ بتقدم اعتلال الشبكية السكري خلال عامين، وكانت مستقلة عن عوامل الخطر المتاحة. قد تساعد أداة تصنيف المخاطر هذه في تحسين فترات الفحص لتقليل التكاليف مع تحسين النتائج المتعلقة بالرؤية. بالنظر إلى التفاوت الكبير في خطر تقدم اعتلال الشبكية السكري لدى الأفراد، توفر دراستنا أداة سريرية محتملة لتصنيف الأفراد ذوي المخاطر المنخفضة والعالية من مرضى السكري، مما يدعم نهجًا مخصصًا مدفوعًا بالذكاء الاصطناعي لتحديد فترات المتابعة في العيادة وخطط إدارة أكثر تخصيصًا.
لإظهار نتيجة دمج نظام DeepDR Plus في سير العمل السريري بشكل أكبر، أجرينا أولاً دراسة في العالم الحقيقي ضمن مجموعة مستقبلية. لا يمكن لأنظمة الذكاء الاصطناعي المتقدمة أن تحقق كامل إمكاناتها ما لم تُدمج في سير العمل السريري والرقمي. في المشاركين في مجموعة غير IM، مقارنةً بنموذج البيانات الوصفية، كان المشاركون ذوو المخاطر العالية الذين تم تحديدهم بواسطة نظام DeepDR Plus أكثر عرضة لتطور تقدم اعتلال الشبكية السكري، مما يشير إلى أن نماذج التعلم العميق الخاصة بنا يمكنها التنبؤ بمسارات المخاطر الخاصة بالمريض لتقدم اعتلال الشبكية السكري بدقة أكبر من نموذج البيانات الوصفية. يمكن اختيار هؤلاء المشاركين بشكل تفضيلي لإدارة أو استشارة أكثر كثافة. من المثير للاهتمام، كان هناك معدل أقل بشكل ملحوظ لتقدم اعتلال الشبكية السكري في مجموعة منخفضة المخاطر في قاع العين، مما كشف أنه قد يكون من الآمن نسبيًا لهؤلاء المشاركين تحقيق أهداف التحكم المتساهلة. علاوة على ذلك، يمكن أن يتيح DeepDR Plus فترات فحص فردية لاعتلال الشبكية السكري لتحقيق توازن بين الكشف المبكر وتقليل بالمقارنة مع الفحص السنوي الثابت للمشاركين الذين لا يعانون من اعتلال الشبكية السكري الخفيف أو لا يعانون منه، إذا اتبع جميع المشاركين فترة الفحص الشخصية الموصى بها التي يقدمها نموذج الشبكية، يمكن تمديد متوسط فترة الفحص من 12 شهرًا إلى 31.97 شهرًا مع تقليل التكرار بنسبة 62.46%، في حين كان التأخير في اكتشاف تقدم اعتلال الشبكية السكري ضئيلاً. في الوقت نفسه، يمكن لنظام DeepDR Plus أن يعمل بشكل جيد أيضًا مع الهنود عند دمجه في سير العمل السريري، مما يشير إلى عمومية النظام.
في دراستنا، كانت هندسة الأوعية الدموية الشبكية والبؤبؤ أنماطًا مهمة في الصور للتنبؤ بحدوث اعتلال الشبكية السكري في المستقبل بناءً على نظام DeepDR Plus، وهو ما يتوافق مع الدراسات الحديثة ودراساتنا السابقة. تم ربط مناطق تساقط الشعيرات الدموية المرتبطة بمرض اعتلال الشبكية السكري بفقدان الخلايا المستقبلة للضوء المحلية، وقد توفر البقعة المركزية معلومات عن الوظيفة البصرية وتروية البقعة المركزية. لقد تم أيضًا إثبات أن التغيرات في قطر الأوعية الدموية الشبكية، وخاصة توسع الأوردة الصغيرة، تزيد من خطر تطور الاضطرابات الوظيفية في العين وتقدمها يعكس البُعد الكسري التغيرات الهيكلية و/أو الوظيفية الأساسية الناتجة عن تأثيرات الالتهاب، والاختلالات العصبية، وآليات الأمراض الفيزيولوجية المرضية الأخرى. . بالإضافة إلى ذلك، ارتبط زيادة البُعد الكسري للأوعية الدموية باعتلال الشبكية العصبي، وهو حدث مبكر في مرضية قد تفسر الدراسات أعلاه جزئيًا لماذا تعتبر هندسة الأوعية الدموية الشبكية والبؤبؤ أنماطًا بصرية مهمة لحدوث اعتلال الشبكية السكري في المستقبل.
يمكن لتقنية الذكاء الاصطناعي أن تساعد في فحص اعتلال الشبكية السكري، وهو حاجة صحية عامة غير ملباة. أظهرت دراستنا أن فترة فحص مخصصة مدفوعة بالذكاء الاصطناعي يمكن دمجها لتحسين الكفاءة والعدالة وسهولة الوصول إلى فحص اعتلال الشبكية السكري، لا سيما في البيئات ذات الموارد المحدودة. لأن أنظمة الاستدعاء الفعالة للغاية يمكن أن تحسن الالتزام بالممارسات السريرية المستقبلية، فإن دمجها في برامج فحص اعتلال الشبكية السكري المعتمدة على الذكاء الاصطناعي سيُحسّن إدارة اعتلال الشبكية السكري بشكل أكبر. استخدام الذكاء الاصطناعي في التصنيف الجديد لاعتلال الشبكية السكري واعد. ، وهناك تفاؤل
آفاق التعديلات المستقبلية على الإرشادات المتعلقة باستخدام الذكاء الاصطناعي في إدارة اعتلال الشبكية السكري.
كان لدراستنا عدة قيود. أولاً، تم تدريب نظام DeepDR Plus لدينا على عينة من السكان الصينيين. يمكن أن يؤدي التدريب الإضافي على مجموعة أوسع من البيانات السريرية والديموغرافية إلى تحسين الأداء التنبؤي وفائدته عبر عدة مجموعات سكانية. ثانياً، لا يمكن القضاء على بعض الانحيازات الجوهرية، مثل العوامل المربكة غير المحددة (على سبيل المثال، حالة قصر النظر)، في إطار الدراسة الاستعادية الحالية. ثالثاً، قد يختلف أداء نموذج قاع العين بين المرضى الذين يتبعون أنظمة علاجية مختلفة، ولا يزال هذا الجانب يتطلب اختبارات مستقبلية لمزيد من التأكيد. وأخيراً، على الرغم من أن نظام DeepDR Plus لم يُطبق فعلياً في الممارسة السريرية، يمكن لدراستنا أن تكون دليلاً على المفهوم لتطوير نماذج ذكاء اصطناعي شخصية واسعة النطاق للتنبؤ بتقدم اعتلال الشبكية السكري وتمهيد الطريق للدراسات المستقبلية والتجارب السريرية العشوائية لتقييم فعالية الفحص والتدخل المعتمدين على الذكاء الاصطناعي في اعتلال الشبكية السكري. تم تطوير نموذج أساسي لصور الشبكية، يُدعى RETFound، لتوفير حل عام لتحسين أداء النموذج. قد يؤدي دمج نظام RETFound ونظام DeepDR Plus في المستقبل إلى تحسين الأداء التنبؤي وقد يستكشف التطبيق في الإنذار المبكر لأمراض الشبكية الأخرى.
باختصار، قمنا بتطوير نظام DeepDR Plus، وهو نظام يمكنه التنبؤ بالمخاطر الشخصية ووقت تقدم اعتلال الشبكية السكري، استنادًا فقط إلى صور قاع العين الأساسية. أظهرت الدراسة الواقعية الإضافية أن دمج هذا النظام في سير العمل السريري للمرضى يمكن أن يمدد متوسط فترة الفحص من 12 شهرًا الحالية إلى 31.97 شهرًا (ما يقرب من 3 سنوات)، مع تأخير أقل في اكتشاف تقدم اعتلال الشبكية السكري. وبالتالي، فإن نظام DeepDR Plus لدينا لديه إمكانات كبيرة للاندماج في سير العمل السريري والرقمي، على أمل تعزيز استراتيجيات التدخل الفردية لإدارة اعتلال الشبكية السكري.

المحتوى الإلكتروني

أي طرق، مراجع إضافية، ملخصات تقارير Nature Portfolio، بيانات المصدر، بيانات موسعة، معلومات تكميلية، شكر وتقدير، معلومات مراجعة الأقران؛ تفاصيل مساهمات المؤلفين والمصالح المتنافسة؛ وبيانات توافر البيانات والرمز متاحة علىhttps://doi.org/10.1038/s41591-023-02702-z.

References

  1. Cheung, N., Mitchell, P. & Wong, T. Y. Diabetic retinopathy. Lancet 376, 124-136 (2010).
  2. Tan, T. -E. & Wong, T. Y. Diabetic retinopathy: looking forward to 2030. Front Endocrinol. 13, 1077669 (2022).
  3. Wong, T. Y., Cheung, C. M. G., Larsen, M., Sharma, S. & Simó, R. Diabetic retinopathy. Nat. Rev. Dis. Prim. 2, 16012 (2016).
  4. Jenkins, A. J. et al. Biomarkers in diabetic retinopathy. Rev. Diabet. Stud. 12, 159-195 (2015).
  5. Stratton, I. M. et al. UKPDS 50: risk factors for incidence and progression of retinopathy in type II diabetes over 6 years from diagnosis. Diabetologia 44, 156-163 (2001).
  6. Solomon, S. D. et al. Diabetic Retinopathy: a position statement by the American Diabetes Association. Diabetes Care 40, 412-418 (2017).
  7. Wong, T. Y. et al. Guidelines on diabetic eye care: the international council of ophthalmology recommendations for screening, follow-up, referral, and treatment based on resource settings. Ophthalmology 125, 1608-1622 (2018).
  8. Flaxel, C. J. et al. Diabetic retinopathy preferred practice pattern. Ophthalmology 127, P66-P145 (2020).
  9. Wang, L. Z. et al. Availability and variability in guidelines on diabetic retinopathy screening in Asian countries. Br. J. Ophthalmol. 101, 1352-1360 (2017).
  10. Modjtahedi, B. S. et al. Two-year incidence of retinal intervention in patients with minimal or no diabetic retinopathy on telemedicine screening. JAMA Ophthalmol. 137, 445-448 (2019).
  11. Gunasekeran, D. V., Ting, D. S. W., Tan, G. S. W. & Wong, T. Y. Artificial intelligence for diabetic retinopathy screening, prediction and management. Curr. Opin. Ophthalmol. 31, 357-365 (2020).
  12. Fundus photographic risk factors for progression of diabetic retinopathy. ETDRS report number 12. Early Treatment Diabetic Retinopathy Study Research Group. Ophthalmology 98, 823-833 (1991).
  13. Lund, S. H. et al. Individualised risk assessment for diabetic retinopathy and optimisation of screening intervals: a scientific approach to reducing healthcare costs. Br. J. Ophthalmol. 100, 683-687 (2016).
  14. Broadbent, D. M. et al. Safety and cost-effectiveness of individualised screening for diabetic retinopathy: the ISDR open-label, equivalence RCT. Diabetologia 64, 56-69 (2021).
  15. Bora, A. et al. Predicting the risk of developing diabetic retinopathy using deep learning. Lancet Digit. Health 3, e10-e19 (2021).
  16. Guan, Z. et al. Artificial intelligence in diabetes management: advancements, opportunities, and challenges. Cell Rep. Med. 4, 101213 (2023).
  17. Ting, D. S. W. et al. Artificial intelligence and deep learning in ophthalmology. Br. J. Ophthalmol. 103, 167-175 (2019).
  18. Ting, D. S. W. et al. Development and validation of a deep learning system for diabetic retinopathy and related eye diseases using retinal images from multiethnic populations with diabetes. JAMA 318, 2211-2223 (2017).
  19. Gulshan, V. et al. Development and validation of a deep learning algorithm for detection of diabetic retinopathy in retinal fundus photographs. JAMA 316, 2402-2410 (2016).
  20. Dai, L. et al. A deep learning system for detecting diabetic retinopathy across the disease spectrum. Nat. Commun. 12, 3242 (2021).
  21. Arcadu, F. et al. Deep learning algorithm predicts diabetic retinopathy progression in individual patients. NPJ Digit. Med. 2, 92 (2019).
  22. Cai, C. et al. Effectiveness of quality of care for patients with type 2 diabetes in China: findings from the Shanghai Integration Model (SIM). Front. Med. 16, 126-138 (2022).
  23. Wilkinson, C. P. et al. Proposed international clinical diabetic retinopathy and diabetic macular edema disease severity scales. Ophthalmology 110, 1677-1682 (2003).
  24. Chen, S. et al. A seven-year study on an integrated hospital-community diabetes management program in Chinese patients with diabetes. Prim. Care Diabetes 12, 231-237 (2018).
  25. Norton, E. C., Miller, M. M. & Kleinman, L. C. Computing adjusted risk ratios and risk differences in Stata. Stata J. 13, 492-509 (2013).
  26. Das, S. K. Confidence interval is more informative than p-value in research. Int. J. Eng. Appl. Sci. Technol. 4, 278-282 (2019).
  27. Raman, R. et al. Incidence and progression of diabetic retinopathy in urban India: Sankara nethralaya-diabetic retinopathy epidemiology and molecular genetics study (SN-DREAMS II), Report 1. Ophthalmic Epidemiol. 24, 294-302 (2017).
  28. Varadarajan, A. V. et al. Deep learning for predicting refractive error from retinal fundus images. Invest. Ophthalmol. Vis. Sci. 59, 2861-2868 (2018).
  29. Yang, D. et al. Assessment of parafoveal diabetic macular ischemia on optical coherence tomography angiography images to predict diabetic retinal disease progression and visual acuity deterioration. JAMA Ophthalmol. 141, 641-649 (2023).
  30. Sun, Z. et al. OCT angiography metrics predict progression of diabetic retinopathy and development of diabetic macular edema: a prospective study. Ophthalmology 126, 1675-1684 (2019).
  31. Cheung, C. Y. et al. A deep-learning system for the assessment of cardiovascular disease risk via the measurement of retinal-vessel calibre. Nat. Biomed. Eng. 5, 498-508 (2021).
  32. CHEUNG, C. Y. L. et al. A new method to measure peripheral retinal vascular caliber over an extended area. Microcirculation 17, 495-503 (2010).
  33. Scanlon, P. H. Screening intervals for diabetic retinopathy and implications for care. Curr. Diab. Rep. 17, 96 (2017).
  34. Henry, K. E. et al. Human-machine teaming is key to AI adoption: clinicians’ experiences with a deployed machine learning system. NPJ Digit. Med. 5, 97 (2022).
  35. Dixon, R. F. et al. A virtual type 2 diabetes clinic using continuous glucose monitoring and endocrinology visits. J. Diabetes Sci. Technol. 14, 908-911 (2020).
  36. Downing, J., Bollyky, J. & Schneider, J. Use of a connected glucose meter and certified diabetes educator coaching to decrease the likelihood of abnormal blood glucose excursions: the livongo for diabetes program. J. Med Internet Res. 19, e234 (2017).
  37. Poplin, R. et al. Prediction of cardiovascular risk factors from retinal fundus photographs via deep learning. Nat. Biomed. Eng. 2, 158-164 (2018).
  38. Cheung, C. Y.-L. et al. Retinal vascular geometry and 6 year incidence and progression of diabetic retinopathy. Diabetologia 60, 1770-1781 (2017).
  39. Lu, Y. et al. Evaluation of automatically quantified foveal avascular zone metrics for diagnosis of diabetic retinopathy using optical coherence tomography angiography. Invest. Ophthalmol. Vis. Sci. 59, 2212-2221 (2018).
  40. Sawides, L. et al. Alterations to the foveal cone mosaic of diabetic patients. Invest. Ophthalmol. Vis. Sci. 58, 3395-3403 (2017).
  41. Cheung, C. Y., Ikram, M. K., Klein, R. & Wong, T. Y. The clinical implications of recent studies on the structure and function of the retinal microvasculature in diabetes. Diabetologia 58, 871-885 (2015).
  42. Klein, R. et al. Retinal vascular abnormalities in persons with type 1 diabetes: the Wisconsin Epidemiologic Study of Diabetic Retinopathy: XVIII. Ophthalmology 110, 2118-2125 (2003).
  43. Klein, R. et al. The relation of retinal vessel caliber to the incidence and progressionof diabetic retinopathy: Xix: The Wisconsin Epidemiologic Study of Diabetic Retinopathy. Arch. Ophthalmol. 122, 76-83 (2004).
  44. Oshitari, T. The pathogenesis and therapeutic approaches of diabetic neuropathy in the retina. Int. J. Mol. Sci. 22, 9050 (2021).
  45. Traversi, C. et al. Fractal analysis of fluoroangiographic patterns in anterior ischaemic optic neuropathy and optic neuritis: a pilot study. Clin. Exp. Ophthalmol. 36, 323-328 (2008).
  46. Simó, R. & Hernández, C. European Consortium for the Early Treatment of Diabetic Retinopathy (EUROCONDOR) Neurodegeneration in the diabetic eye: new insights and therapeutic perspectives. Trends Endocrinol. Metab. 25, 23-33 (2014).
  47. Zafar, S., Sachdeva, M., Frankfort, B. J. & Channa, R. Retinal neurodegeneration as an early manifestation of diabetic eye disease and potential neuroprotective therapies. Curr. Diab. Rep. 19, 17 (2019).
  48. Sohn, E. H. et al. Retinal neurodegeneration may precede microvascular changes characteristic of diabetic retinopathy in diabetes mellitus. Proc. Natl Acad. Sci. USA 113, E2655-E2664 (2016).
  49. Wong, T. Y. & Sabanayagam, C. The war on diabetic retinopathy: where are we now? Asia Pac. J. Ophthalmol. 8, 448-456 (2019).
  50. Liu, H. et al. Economic evaluation of combined population-based screening for multiple blindness-causing eye diseases in China: a cost-effectiveness analysis. Lancet Glob. Health 11, e456-e465 (2023).
  51. Yang, Z., Tan, T.-E., Shao, Y., Wong, T. Y. & Li, X. Classification of diabetic retinopathy: past, present and future. Front. Endocrinol. 13, 1079217 (2022).
  52. Zhou, Y. et al. A foundation model for generalizable disease detection from retinal images. Nature 622, 156-163 (2023).
Publisher’s note Springer Nature remains neutral with regard to jurisdictional claims in published maps and institutional affiliations.
Open Access This article is licensed under a Creative Commons Attribution 4.0 International License, which permits use, sharing, adaptation, distribution and reproduction in any medium or format, as long as you give appropriate credit to the original author(s) and the source, provide a link to the Creative Commons license, and indicate if changes were made. The images or other third party material in this article are included in the article’s Creative Commons license, unless indicated otherwise in a credit line to the material. If material is not included in the article’s Creative Commons license and your intended use is not permitted by statutory regulation or exceeds the permitted use, you will need to obtain permission directly from the copyright holder. To view a copy of this license, visit http://creativecommons. org/licenses/by/4.0/.
© The Author(s) 2024
Capital Medical University, Beijing Ophthalmology and Visual Science Key Laboratory, Beijing, China. Center for Excellence in Molecular Science, Chinese Academy of Sciences, Shanghai, China. School of Biomedical Engineering, Shanghai Tech University, Shanghai, China. Shanghai United Imaging Intelligence, Shanghai, China. Shanghai Clinical Research and Trial Center, Shanghai, China. Ophthalmology and Visual Sciences Academic Clinical Program, Duke-NUS Medical School, Singapore, Singapore. Centre for Innovation and Precision Eye Health; and Department of Ophthalmology, Yong Loo Lin School of Medicine, National University of Singapore, Singapore, Singapore. Tsinghua Medicine, Beijing Tsinghua Changgung Hospital, Tsinghua University, Beijing, China. These authors contributed equally: Ling Dai, Bin Sheng, Tingli Chen, Qiang Wu, Ruhan Liu, Huating Li. These authors jointly supervised this work: Bin Sheng, Carol Y. Cheung, Gavin Tan Siew Wei, Yih-Chung Tham, Ching-Yu Cheng, Huating Li, Tien Yin Wong, Weiping Jia.

الطرق

الموافقة الأخلاقية

تمت الموافقة على هذه الدراسة من قبل لجنة الأخلاقيات في مستشفى شنغهاي السادس للشعب وأُجريت وفقًا لإعلان هلسنكي. تم الحصول على موافقة مستنيرة من جميع المشاركين. تم تسجيل الدراسة في سجل التجارب السريرية الصيني (ChiCTR2300069400).

اكتساب البيانات

لتدريب نظام DeepDR Plus مسبقًا لجعله يتعلم ميزات اعتلال الشبكية السكري، تم استخدام 717,308 صورة لقاع العين من 179,327 فردًا مصابًا بالسكري من نموذج الدمج في شنغهاي وتم استخدام SDPP. SDPP هو مجموعة طولية مجتمعية تضم 79,284 مشاركًا خضعوا لفحوصات بدنية بين ديسمبر 2015 ونوفمبر 2022 في مصحة هوانغدونغ ومستشفى الشعب السادس في شنغهاي. عند البداية، تم تسجيل بيانات عن المعلومات الديموغرافية، والمؤشرات الأنثروبومترية، والقياسات الكيميائية الحيوية، وصور الشبكية. بعد المسح الأساسي، أكمل 25,231 مشاركًا زيارات متابعة سنوية لمدة لا تقل عن 4 سنوات.
لتطوير نظام DeepDR Plus لتوقع تقدم اعتلال الشبكية السكري، تم جمع بيانات صور قاع العين والبيانات السريرية من مجموعة DRPS. تتكون مجموعة DRPS من مجموعتين طوليتين. تم استخراج مجموعة البيانات للمجموعة الأولى من نظام معلومات المستشفى في قسم الغدد الصماء والتمثيل الغذائي في مستشفى الشعب السادس بشانغهاي، واحتوت على 15,587 مريضًا بالسكري، خضعوا لفحوصات صحية سنوية خلال فترة 5 سنوات. سجلت المجموعة الثانية 3,513 مشاركًا مصابًا بالسكري في البداية من مصحة هوانغدونغ، وأكمل المشاركون في المجموعة متابعة سنوية لمدة 5 سنوات. تم تسجيل بيانات المعلومات الديموغرافية، والمؤشرات الجسمية، والقياسات الكيميائية الحيوية، وصور الشبكية عند البداية وكل زيارة. استندت تشخيصات تصنيف اعتلال الشبكية السكري ووذمة البقعة الصفراء إلى صور قاع العين المتمركزة على البقعة والقرص البصري لكل عين عند البداية وزيارات المتابعة.
قمنا بتسجيل ثماني مجموعات مستقلة لتكون بمثابة تحقق خارجي. مجموعة ECHM (مجموعة البيانات الخارجية 1) هي دراسة استعادية مجتمعية للمشاركين الذين خضعوا لفحص بدني شامل في ووكسي بين عامي 2006 و2016. قمنا بتسجيل 2,141 مشاركًا مصابًا بالسكري خضعوا لفحوصات سنوية لمدة 5 سنوات في مجموعة ECHM. مجموعة WTHM (مجموعة البيانات الخارجية 2) هي مجموعة استعادية طولية تحتوي على 971 مشاركًا مصابًا بالسكري تلقوا فحوصات بدنية روتينية في مركز الفحص البدني بقسم الشيخوخة في مستشفى تونغجي بين عامي 2010 و2021. مجموعة NDSP (مجموعة البيانات الخارجية 3) كانت دراسة رصدية مستقبلية أجريت في نيتشنغ، وهي مجتمع كبير في شنغهاي، وهدفت الدراسة إلى فحص ومتابعة تطور الاضطرابات الأيضية وأمراض القلب والأوعية الدموية بين كبار السن في المنطقة بأكملها. تم إجراء المسح الأساسي في عام 2013، وأكمل 1,194 مشاركًا مصابًا بالسكري مسح المتابعة في عام 2018. مجموعة PUDM (مجموعة البيانات الخارجية 5) كانت مجموعة استعادية قائمة على العيادة، تحتوي على 307 مشاركين مصابين بالسكري من مستشفى كلية بكين الطبية المتحدة، الذين خضعوا لفحوصات صحية سنوية بين عامي 2010 و2016. مجموعة CUHK-STDR (مجموعة البيانات الخارجية 4) كانت دراسة رصدية مستقبلية شملت 337 مريضًا مصابًا بالسكري. تم تجنيد المشاركين من مركز عيون جامعة تشاينا في هونغ كونغ بين يوليو 2015 ونوفمبر 2016 وتمت متابعتهم بشكل متتالي لمدة لا تقل عن 5 سنوات. مجموعة SEED (مجموعة البيانات الخارجية 6) هي دراسة طولية متعددة الأعراق قائمة على السكان تشمل البالغين السنغافوريين من أصول مالاوية وهندية وصينية. تم تسجيل ما مجموعه 1699 فردًا مصابًا بالسكري من مجموعة SEED مع متابعة لمدة 5 سنوات للتحقق الخارجي. كانت مجموعة SiDRP (المجموعة الخارجية 7) عبارة عن مجموعة طولية استعادية تغطي جميع العيادات الأولية الـ18 في سنغافورة من 2010 إلى 2015. وقدمت تقييمات ‘فورية’ لصور اعتلال الشبكية السكري بواسطة فريق مركزي من المقيمين المدربين والمعتمدين بدعم من بنية تحتية لتكنولوجيا المعلومات في طب العيون عن بُعد. . المجموع
تم تسجيل 3,284 فردًا مصابًا بالسكري من المجموعة للدراسة الخارجية. دراسة BJHC (المجموعة الخارجية 8) هي دراسة مستقبلية قائمة على المجتمع. شملت هذه الدراسة إجمالي 835 مريضًا بالسكري من BJHC. أُجريت الفحوصات الأساسية في الفترة بين 2014 و2016، وأُجريت الفحوصات اللاحقة بين 2019 و2020. في جميع المجموعات الخارجية، تم التقاط صورتين لشبكية العين (مركزهما البقعة الصفراء والقرص البصري) لكل عين في زيارات الأساس والمتابعة.
في الدراسة الواقعية ضمن دراسة جماعية مستقبلية قائمة على المجتمع للبالغين الصينيين، تم فحص 5,214 مشاركًا في مارس 2017، حيث خضع المشاركون الذين لم يبلغوا عن تاريخ مرضي للسكري لاختبار تحمل الجلوكوز الفموي بجرعة 75 جرامًا في البداية. شملت تفاصيل القياسات الكيميائية الحيوية وجمع البيانات الأنثروبومترية وزن الجسم، ومحيط الخصر، وضغط الدم، وملف الدهون والعوامل المرتبطة بأمراض القلب والأيض. تم تسجيل 2,383 مشاركًا مصابًا بالسكري (بدون اعتلال الشبكية السكري أو اعتلال الشبكية السكري غير التكاثري الخفيف) في المجموعة النهائية وفقًا لمعايير منظمة الصحة العالمية لعام 2019. ، مع 603 مشاركًا في مجموعة العلاج بالتحفيز الداخلي و1,780 مشاركًا في المجموعة غير المعالجة بالتحفيز الداخلي. تم تزويد المشاركين في مجموعة العلاج بالتحفيز الداخلي بقياسات سريرية و أيضية منتظمة، بإشراف متخصصين في مستشفيات شاملة، وتلقوا إرشادات حول نمط الحياة ودعم الأقران في مراكز خدمات الصحة المجتمعية. تمت متابعة المشاركين في هذا البرنامج سنويًا لمدة 5 سنوات. في مارس 2022، أكمل 538 مشاركًا في مجموعة IM و1,647 مشاركًا في مجموعة غير IM زيارة المتابعة.

معايير التشخيص

يتم تشخيص السكري بناءً على تاريخ مرضي ذاتي للسكري، ومستوى الجلوكوز في البلازما أثناء الصيام -h جلوكوز البلازما و/أو HbA1c تم تقييم تشخيص وتصنيف اعتلال الشبكية السكري ووذمة الشبكية السكري وفقًا لنظام التصنيف الدولي لاعتلال الشبكية السكري (ICDRDSS). تم تعريف تقدم اعتلال الشبكية السكري على أنه أول تدهور في درجات اعتلال الشبكية السكري أو ظهور جديد لوذمة البقعة الصفراء السكري، استنادًا إلى نظام تصنيف اعتلال الشبكية السكري الدولي خلال فترة المتابعة.

إجراء مراقبة جودة الصورة وتصنيفها

بالنسبة لمجموعات بيانات دراسات العالم الحقيقي DRPS و ECHM و WTHM و NDSP و PUDM و BJHC والصينية، تم التقاط صور قاع العين باستخدام مجموعة متنوعة من كاميرات قاع العين القياسية، بما في ذلك Topcon TRC-NW6 (توبكون)، Canon CR1-Mark II (كانون) وكاميرا Optos (أوبتوس). تم قراءة جميع صور قاع العين بواسطة مجموعة قراءة مركزية تتألف من 12 طبيب عيون معتمد. تم رفع الصور الأصلية لشبكية العين إلى منصة إلكترونية. ، وتم تعيين صور كل عين بشكل منفصل لطبيبين عيون معتمدين. قاموا بوضع علامات على الصور باستخدام منصة القراءة عبر الإنترنت وأعطوا تشخيصًا مصنفًا لاعتلال الشبكية السكري. الطبيب العيون الثالث الذي عمل كمشرف أول أكد أو صحح عندما كانت نتائج التشخيص متناقضة. كانت النتيجة النهائية للتصنيف تعتمد على التوافق بين هؤلاء الأطباء الثلاثة. إجراءات التصنيف لمجموعة CUHK-STDR ، بذرة ، SiDRP و SN-DREAMS تم الإبلاغ عن مجموعات البيانات في المنشورات السابقة. تم استبعاد الصور غير القابلة للتقييم من جميع مجموعات البيانات من الدراسة.

تطوير النموذج والتدريب

قمنا بتطوير نظام DeepDR Plus للتنبؤ بتقدم اعتلال الشبكية السكري. يحتوي نظام DeepDR Plus على ثلاثة نماذج للتنبؤ بتقدم اعتلال الشبكية السكري: نموذج البيانات الوصفية، نموذج قاع العين، والنموذج المدمج. يتم تقدير خطر ووقت تقدم اعتلال الشبكية السكري بناءً على المدخلات الأساسية. يحتوي نموذج قاع العين على مستخرج ميزات لاستخراج الميزات من صور قاع العين (التفاصيل في “تدريب النموذج المسبق”) ومُتنبئ لتوليد درجة قاع العين من خلال تقدير وقت البقاء على قيد الحياة بناءً على البيانات المدخلة (التفاصيل في “تقييم النموذج”). يستخدم نموذج قاع العين شبكة ResNet-50 كهيكل أساسي لاستخراج الميزات من صور قاع العين، ويتم استخدام طبقة انتباه ناعمة لاختيار أكثر الميزات إفادة. يدخل نموذج البيانات الوصفية البيانات الوصفية لإنتاج توقعات البقاء على قيد الحياة. يتم استخدام ناتج نموذج قاع العين (درجة قاع العين) مع البيانات الوصفية كمدخل للنموذج المدمج. البيانات الوصفية
يشمل العمر، الجنس، حالة التدخين، مدة الإصابة بالسكري، مستوى اعتلال الشبكية القاعدي، مؤشر كتلة الجسم، الهيموغلوبين السكري HbA1c، ضغط الدم الانقباضي، ضغط الدم الانبساطي، ثلاثي الغليسريدات، كوليسترول البروتين الدهني منخفض الكثافة وكوليسترول البروتين الدهني عالي الكثافة. كما قمنا بتطوير ومقارنة نموذج البيانات الوصفية، نموذج قاع العين والنموذج المدمج لتوقع تقدم اعتلال الشبكية السكري في ثلاث مجموعات فرعية. شملت المجموعات الفرعية الثلاث السكري من غير اعتلال شبكي إلى اعتلال شبكي (المجموعة الفرعية 1)، من اعتلال شبكي غير قابل للإحالة إلى اعتلال شبكي قابل للإحالة (المجموعة الفرعية 2) ومن اعتلال شبكي غير تهديدي للبصر إلى اعتلال شبكي تهديدي للبصر (المجموعة الفرعية 3).

نموذج تقدم مرض السكري

نظرًا لأن معظم مجموعات البيانات الطولية في هذه الدراسة تحتوي على فترة متابعة ثابتة تبلغ حوالي سنة واحدة، فإن مجموعة البيانات الطولية تعاني من التقييد الأيمن والتقييد الفاصل. الهدف من نموذج تقدم اعتلال الشبكية السكري هو تقدير دالة البقاء. لتحقيق هذا الهدف، قمنا بنمذجة توزيع البقاء لكل كائن فردي كمزيج بحجم ثابت من توزيعات ويبول. تم أخذ عينات عشوائية من معلمات كل توزيع ويبول وتثبيتها. استخدمنا شبكة تعلم عميق لتقدير الأوزان لكل توزيع في نموذج المزيج (مزيج بحجم ثابت من توزيعات ويبول). خلال التدريب، تم تحسين معلمات شبكة التعلم العميق عن طريق تعديل قيمها لتعظيم الاحتمالية، التي تمثل احتمال بيانات التدريب المرصودة المقدمة من نظام DeepDR Plus. تم وصف تطوير هذه الخوارزميات بالتفصيل أدناه (الشكل الموسع 7).
تعريف المشكلة. لدينا مجموعة بيانات طولية يحتوي على عدة أشياء ، حيث كل كائن . هنا، يمثل متجه الميزات (بما في ذلك ميزات الصورة و/أو البيانات الوصفية في الخط الأساسي). يشير إلى ما إذا كان السجل محجوبًا. على وجه الخصوص، للسجلات غير المراقبة، و خلاف ذلك. تمثل الوقت حتى آخر اختبار قبل الحدث المهم. إذا تم ملاحظة الحدث، فإن يمثل الوقت حتى حدوث ذلك الحدث. ومع ذلك، إذا لم يتم ملاحظة الحدث، فإن يساوي استخدمنا مزيجًا من توزيعات ويبول لنمذجة دالة البقاء لكل مشارك. نظرًا لأن توزيع ويبول صالح فقط للأعداد الحقيقية الموجبة، فهو مناسب لتحليل البقاء. بالإضافة إلى ذلك، يحتوي توزيع ويبول على حل تحليلي لدالة التوزيع التراكمي، مما يتيح استخدام التحسين القائم على التدرج لتقدير الاحتمالية العظمى في بحثنا. .
هدفنا هو تقدير مجموعة من المعلمات والأوزان لنموذج الخليط بناءً على المدخلات. تُعرّف دالة البقاء لكل مريض كما يلي:
أين هو دالة توزيع الاحتمال لتوزيع ويبول، و و مأخوذة من التوزيع الغاوسي و هل يتم تحديد المعلمات الأولية تجريبيًا. هي مجموعة من المعلمات لتوزيع الخليط الذي يحتوي على معلمات متعددة .
دالة التوزيع التراكمي لتوزيع ويبول تُعطى بواسطة
مصفوفة ميزات الإدخال (بما في ذلك صور قاع العين والبيانات السريرية الوصفية) / تمر عبر شبكة التعلم العميق لتحديد جميع المعلمات .
استخدمنا تقدير الاحتمالية العظمى لتقدير معلمات شبكة التعلم العميق. بالنسبة للبيانات غير المراقبة، يمكن كتابة دالة اللوغاريتم الاحتمالي على النحو التالي
وبالمثل، بالنسبة للبيانات المراقبة يمكن إعطاء دالة اللوغاريتم الاحتمالي على النحو التالي
ونحن نُعرّف دالة الخسارة على أنها
أين هو معامل فائق يوازن بين وزن البيانات المراقبة والبيانات غير المراقبة.

التدريب المسبق للنموذج

استخدمنا تقنية التباين الزخم (MoCo، الإصدار 2) ، الذي يستفيد من التعلم الذاتي الإشراف لإنتاج مستخرج ميزات مدرب مسبقًا. في هذه العملية، يتم تدريب مستخرج الميزات على مجموعة بيانات كبيرة من صور قاع العين دون الحاجة إلى تعليقات يدوية. يستخدم MoCo v2 إطار تعلم تبايني قائم على الزخم، حيث يتعلم إطار التدريب المسبق في نموذج قاع العين إنشاء أزواج إيجابية وسلبية من قطع الصور من نفس الصورة. قمنا بوضع إعدادات التجربة في عملية التدريب المسبق الخاصة بنا. اتبعنا في الغالب إعدادات التجربة الخاصة بـ MoCo v2، لكننا اعتمدنا على أساليب مختلفة في تعزيز البيانات واختيار بعض المعاملات الفائقة. – مراقب الجيران الأقرب كأداة للتقييم الذاتي الموجه مرة واحدة في كل حقبة. بالنسبة لتوسيع البيانات، شملت طريقتنا في التوسيع ضغط الصور العشوائي، التمويه العشوائي، تقلب السطوع، تقلب التباين، التحويل العشوائي للجاما، الضوضاء الغاوسية العشوائية والدوران العشوائي. اثنان تم أخذ محاصيل لكل صورة قاع عين في كل تكرار. لاختيار المعاملات الفائقة، اخترنا ResNet-50 كمشفر و الانحدار العشوائي المتدرج (SGD) كمحسن. كانت دقة صورة الإدخال هي بكسلات، تم تعيين حجم الدفعة إلى 256، وتم تدريب نموذج MoCo v2 لمدة 800 حقبة. تم استخدام البحث الشبكي للحصول على أفضل معلمات الضبط مثل معدل التعلم ، تلاشي الوزن ، زخم الدولار السنغافوري ودرجة الحرارة كان معامل زخم المشفر وتم زيادتها إلى 1 باستخدام جدول جيبي. كما أجرينا تجربة إلغاء لتقييم أداء التنبؤ لنموذج قاع العين من خلال التدريب المسبق باستخدام MoCo v2. أظهرت النتائج أن دمج MoCo v2 في عملية التدريب يمكن أن يعزز أداء التنبؤ لنموذج قاع العين (الجدول التكميلي 7).

نموذج القاع

لمهام التنبؤ بتقدم اعتلال الشبكية السكري، استخدمنا نموذج ResNet-50 المدرب مسبقًا كمستخرج للميزات. طبقة الانتباه الذاتي تم استخدامه في شبكتنا لتسليط الضوء على الأجزاء المهمة في ميزات قاع العين. على وجه التحديد، أضفنا طبقة انتباه ذاتي قياسية تعتمد على حاصل الضرب النقطي لحساب وزن كل بكسل في خريطة الميزات التي ينتجها الكتلة 3 من ResNet-50. تقوم طبقة الانتباه بإخراج خريطة الميزات بنفس حجم خريطة الميزات المدخلة لضمان إمكانية إدخالها في ResNet-50 بسلاسة. في مرحلة التفسير، تم إعادة تشكيل خريطة ميزات الانتباه إلى ومن ثم تم تغيير حجمه إلى للتوضيح. بالإضافة إلى ذلك، تم استخدام شبكة بيرسيبترون متعددة الطبقات (MLP) ذات ثلاث طبقات كمُتنبئ لتقدير أوزان الخليط ذي الحجم الثابت
من توزيعات ويبول باستخدام الميزات التي تم توليدها بواسطة نموذج ResNet-50 المدرب مسبقًا.
تم تدريب نموذج القاع بعد ذلك على مجموعة بيانات التدريب باستخدام محسن SGD. في هذه الدراسة، استخدمنا البحث الشبكي لإيجاد القيم المثلى والمعلمات الفائقة الأخرى. تم تدريب نموذج القاع عن طريق التراجع العكسي للأخطاء في دفعات مكونة من 32 صورة تم تغيير حجمها إلى بكسل لمدة 50 حقبة بمعدل تعلم استراتيجيات زيادة البيانات المستخدمة هنا كانت هي نفسها المستخدمة أثناء التدريب المسبق القائم على MoCo v2 (التفاصيل في ‘التدريب المسبق للنموذج’).

نموذج البيانات الوصفية والنموذج المدمج

استخدمنا شبكة متعددة الطبقات مكونة من ثلاث طبقات في نموذج البيانات الوصفية والنموذج المدمج. يأخذ نموذج البيانات الوصفية البيانات الوصفية كمدخل ويخرج الوقت المتوقع للحدث للفرد المشارك. بالنسبة للنموذج المدمج، يتم إضافة الوقت المتوقع للحدث من نموذج قاع العين كميزة إضافية لشبكة الطبقات الثلاث. يشترك نموذج البيانات الوصفية ونموذج قاع العين والنموذج المدمج في نفس دالة الخسارة أثناء تطوير النموذج.

تقييم النموذج

لتقدير وقت الحدث المستهدف، قمنا أولاً بحساب دالة البقاء باستخدام المدخلات الأساسية، ثم أخذنا الوقت المتوقع عند النقطة القصوى لدالة الكثافة كوقت متوقع للحدث. باستخدام هذا الوقت المتوقع للحدث كنقطة خطر، قمنا بتقييم أداء النموذج في التنبؤ بما إذا كان المشارك المعني سيصاب بالمرض المستهدف خلال 1، 2، 3، 4، أو 5 سنوات، باستخدام مؤشر C و IBS. وفقًا لدرجات الزيارة الأساسية التي تم الحصول عليها من نموذج قاع العين، تم تصنيف المشاركين إلى مجموعتين: منخفضة وعالية الخطورة وفقًا للعتبة المحددة بالنصف العلوي والسفلي من الدرجات المتوقعة في مجموعات المشاركين ذات نتائج تقدم اعتلال الشبكية السكري المختلفة. تم إنشاء منحنيات كابلان-ماير لمجموعات الخطر، وتم حساب دلالة الفروق بين منحنيات المجموعات باستخدام اختبار لوغ-رانك. تم استخدام منحنيات ROC المعتمدة على الزمن لقياس أداء النموذج على مجموعات التحقق في الوقت المعني. تم إنشاء منحنيات ROC عند وقت محدد من درجات الخطر المتوقعة للمشاركين النسبيين باستخدام نظام DeepDR Plus.

تفسير توقعات الذكاء الاصطناعي

هناك حاجة إلى أداة تصور تمكن الأطباء من فهم الميزات البصرية السريرية المهمة في صور قاع العين. ولهذا الغرض، تم اتباع نهج جوجل. “، قمنا أولاً بإنتاج خرائط انتباه فردية كتفسيرات بصرية عن طريق إدخال طبقة انتباه ذاتي في بنية نموذج قاع العين (التفاصيل في ‘نموذج قاع العين’). تم تسليط الضوء على أكثر الميزات تنبؤًا التي التقطها نظام DeepDR Plus لكل صورة فردية. لتوليد خرائط انتباه متوسطة، تم محاذاة جميع صور قاع العين الفردية وخرائط الانتباه الفردية بناءً على مواقع القرص البصري الخاصة بها. أي أنه تم نقل جميع صور قاع العين وخرائط الانتباه لتشارك نفس موقع القرص البصري. بعد ذلك، تم الحصول على خرائط الانتباه المتوسطة النهائية عن طريق حساب متوسط أوزان الانتباه الفردية ‘المسجلة’ عبر عدة صور. علاوة على ذلك، استخدمنا حزمة SHAP في بايثون لتوضيح أهمية الخصائص السريرية بالإضافة إلى درجة قاع العين (أي الوقت المتوقع لحدوث الحدث وفقًا لنموذج قاع العين) المشاركة في النموذج المركب. SHAP تعني تفسيرات شابلية الإضافية تمثل قيم SHAP لكل ميزة مساهمتها في توقع النموذج. تشير قيمة SHAP الإيجابية إلى إسهام إيجابي للميزة في توقع تطور اعتلال الشبكية السكري، في حين تشير قيمة SHAP السلبية إلى إسهام سلبي للميزة في توقع تطور اعتلال الشبكية السكري. تم حساب أهمية الميزة من خلال متوسط القيم المطلقة لـ SHAP لكل ميزة.

ملخص التقرير

مزيد من المعلومات حول تصميم البحث متاحة في ملخص تقرير مجموعة نيتشر المرتبط بهذا المقال.

توفر البيانات

يمكن الوصول إلى بيانات المرضى على المستوى الفردي بموافقة لجنة إدارة البيانات من المؤسسات وليست متاحة للجمهور. يجب إرسال طلبات الاستخدام غير الربحي لصور قاع العين والمعلومات السريرية ذات الصلة إلى W.J. أو T.Y.W. ستقوم لجنة إدارة البيانات بمراجعة جميع الطلبات ومنح الموافقة (إذا تم قبولها). سيكون من الضروري توقيع اتفاقية نقل بيانات رسمية عند الموافقة. بشكل عام، سيتم الرد على جميع هذه الطلبات للوصول إلى البيانات خلال شهر واحد. جميع البيانات المشتركة ستكون مجهولة الهوية. لإعادة إنتاج رمز خوارزميتنا، قمنا أيضًا بإيداع مجموعة بيانات حد أدنى في Zenodo (“https://zenodo.org/records/10076339)، والمتاحة للجمهور للأبحاث العلمية والاستخدام غير التجاري. يتم توفير بيانات المصدر مع هذه الورقة.

توفر الشفرة البرمجية

الكود المستخدم في الدراسة الحالية لتطوير الخوارزمية متوفر علىhttps://github.com/drpredict/DeepDR_Plusتم استخدام إصدار بايثون 3.9.0 لجميع التحليلات الإحصائية في هذه الدراسة. تم استخدام حزم بايثون الخارجية التالية: تم استخدام إصدار Pytorch 2.0.1 لبناء نماذج التعلم العميق؛ تم استخدام إصدار Scikit-learn 1.3.0 لحساب مساحة تحت المنحنى (AUC). تم استخدام إصدار NumPy 1.25.2 لحساب مؤشر C ودرجة بريير. تم استخدام إصدار Lifelines 0.27.7 لتحليل البقاء.

References

  1. Majithia, S. et al. Cohort profile: The Singapore Epidemiology of Eye Diseases study (SEED). Int. J. Epidemiol. 50, 41-52 (2021).
  2. Nguyen, H. V. et al. Cost-effectiveness of a National Telemedicine Diabetic Retinopathy Screening Program in Singapore. Ophthalmology 123, 2571-2580 (2016).
  3. WHO Consultation. Definition, diagnosis and classification of diabetes mellitus and its complications (1999).
  4. ElSayed, N. A. et al. 2. Classification and diagnosis of diabetes: Standards of Care in Diabetes-2023. Diabetes Care 46, S19-S40 (2023).
  5. Kaniadakis, G. et al. The -statistics approach to epidemiology. Sci. Rep. 10, 19949 (2020).
  6. He, K., Fan, H., Wu, Y., Xie, S. & Girshick, R. Momentum contrast for unsupervised visual representation learning. in Proceedings of the IEEE/CVF conference on computer vision and pattern recognition 9729-9738 (2020).
  7. Chen, X., Fan, H., Girshick, R. & He, K. Improved baselines with momentum contrastive learning. arXiv preprint arXiv:2003.04297 (2020).
  8. Vaswani, A. et al. Attention is all you need. in Advances in neural information processing systems 5998-6008 (2017).
  9. Zhao, H., Jia, J. & Koltun, V. Exploring self-attention for image recognition. in Proceedings of the IEEE/CVF conference on computer vision and pattern recognition 10076-10085 (2020).
  10. Lundberg, S. M. et al. Explainable machine-learning predictions for the prevention of hypoxaemia during surgery. Nat. Biomed. Eng. 2, 749-760 (2018).
  11. Lundberg, S. M. & Lee, S. -I. A unified approach to interpreting model predictions. in Advances in Neural Information Processing Systems 30 (2017).

الشكر والتقدير

نشكر جميع الباحثين والمشاركين في هذه الدراسة. تم دعم هذه الدراسة من قبل البرنامج الوطني الرئيسي للبحث والتطوير في الصين (2022YFA1004804) لـ W.J. و H.L.؛ والتخصص السريري الرئيسي لبلدية شنغهاي، ومركز أبحاث شنغهاي للأمراض الصماء والتمثيل الغذائي (2022ZZO1OO2) والأكاديمية الصينية للهندسة (2022-XY-08) لـ W.J.؛ والبرنامج الوطني الرئيسي للبحث والتطوير في الصين (2022YFC2502800) وصندوق العلوم الطبيعية الوطني الصيني (8238810007) لـ T.Y.W.؛ وصندوق العلماء الشباب الممتازين لـ NSFC (82022012)، والصندوق العام لـ NSFC (81870598)،
فريق البحث الابتكاري من جامعات محلية رفيعة المستوى في شنغهاي (SHSMU-ZDCX2O2127OO) إلى H.L؛ البرنامج العام لـ NSFC (62272298)، البرنامج الوطني الرئيسي للبحث والتطوير في الصين (2022YFC2407000)، البرنامج متعدد التخصصات لجامعة شنغهاي جياو تونغ (YG2023LC11 و YG2022ZD007)، المؤسسة الوطنية للعلوم الطبيعية في الصين (62272298 و 62077037)، صندوق مشروع على مستوى الكلية في المستشفى السادس التابع لجامعة شنغهاي جياو تونغ (ynlc201909) وصندوق التعاون الطبي الصناعي لجامعة شنغهاي جياو تونغ (YG2O22QNO89) إلى B.S؛ المؤسسة الوطنية للعلوم الطبيعية في الصين (82100879) إلى L.W؛ البرنامج الخاص السريري للجنة الصحة البلدية في شنغهاي (20224044) وخطة العمل الثلاثية لتعزيز بناء نظام الصحة العامة في شنغهاي (GWVI-11.1-28) إلى T.C.

مساهمات المؤلفين

و.ج.، هـ.ل.، ب.س. وتي.و.ي. قاموا بتصميم وإشراف المشروع. ل.د. صمم خوارزمية التعلم العميق والإطار الحاسوبي. هـ.ل.، ب.س.، ت.س.، ك.و.، ر.ل. ول.د. صمموا الدراسة وساهموا في المسودة الأولية للمخطوطة. س.س.، ل.و.، د.ي.، هـ.هـ.، ي.ل.، إكس.و.، ز.ج.، س.ي.، ت.ل.، ز.ت.، أ.ر.، هـ. تشي، هـ. تشن، ي.ز.، ج.س.، س.هـ.، س.و.، س.ل.، د.ل.، ج.ل.، ز.و.، ز.م.، ج.س.، إكس.هـ.، س.د.، ل.ر.، ف.ل.، م.س.، ت.س.ك.، ر.س.، ر.ر.، إكس.س.، ي.إكس.و.، ج.و.، هـ.ج.، م.ج.، د.س.، إكس.ي.، ر.د. و س.ز. جمعوا ونظموا البيانات. ز.ج.، س.ي.، ت.ل.، ج.س.، س.هـ.، ز.و. وز.م. أجروا التحليل الإحصائي. ل.د. يتحمل مسؤولية سلامة البيانات ودقة تحليل البيانات. س. ي. تشيونغ، ج.س.و.ت.
قدم Y.C.T. و C. Y. Cheng تعليقات نقدية وراجعا المخطوطة. ناقش جميع المؤلفين النتائج ووافقوا على النسخة النهائية قبل التقديم.

المصالح المتنافسة

يعلن المؤلفون عدم وجود مصالح متضاربة.

معلومات إضافية

البيانات الموسعة متاحة لهذا البحث على
https://doi.org/10.1038/s41591-023-02702-z.
معلومات إضافية النسخة الإلكترونية تحتوي على
المواد التكميلية متاحة على
https://doi.org/10.1038/s41591-023-02702-z.
يجب توجيه المراسلات وطلبات المواد إلى بين شينغ، هوايتينغ لي، تيين يين وونغ أو ويبينغ جيا.
معلومات مراجعة الأقران تشكر مجلة نيتشر ميديسين تاي كون يو والمراجع(ين) الآخرين المجهولين على مساهمتهم في مراجعة هذا العمل من قبل الأقران. المحرر المسؤول الأساسي: لورنزو ريغيتو، بالتعاون مع فريق نيتشر ميديسين.
معلومات إعادة الطبع والأذونات متاحة علىwww.nature.com/reprints.
الشكل البياني للبيانات الموسعة 1 | مخطط تدفق مجموعات البيانات. DRPS، دراسة تقدم اعتلال الشبكية السكري؛ ECHM، إدارة الصحة بشرق الصين؛ WTHM، إدارة الصحة بجامعة ووهان تونغجي؛ NDSP، مشروع فحص السكري في نيشنغ؛ CUHK-STDR، الجامعة الصينية في هونغ كونغ – اعتلال الشبكية السكري المهدد للبصر
اعتلال الشبكية؛ PUDM: إدارة السكري في الاتحاد البكيني؛ SEED، دراسة علم الأوبئة لأمراض العين في سنغافورة؛ SiDRP، برنامج الفحص الوطني لاعتلال الشبكية السكري في سنغافورة؛ BJHC، دراسة تجمع الرعاية الصحية في بكين.


الشكل البياني الموسع 4 | التحقق الداخلي والخارجي من نظام DeepDR Plus في التنبؤ بتقدم اعتلال الشبكية السكري غير القابل للإحالة إلى
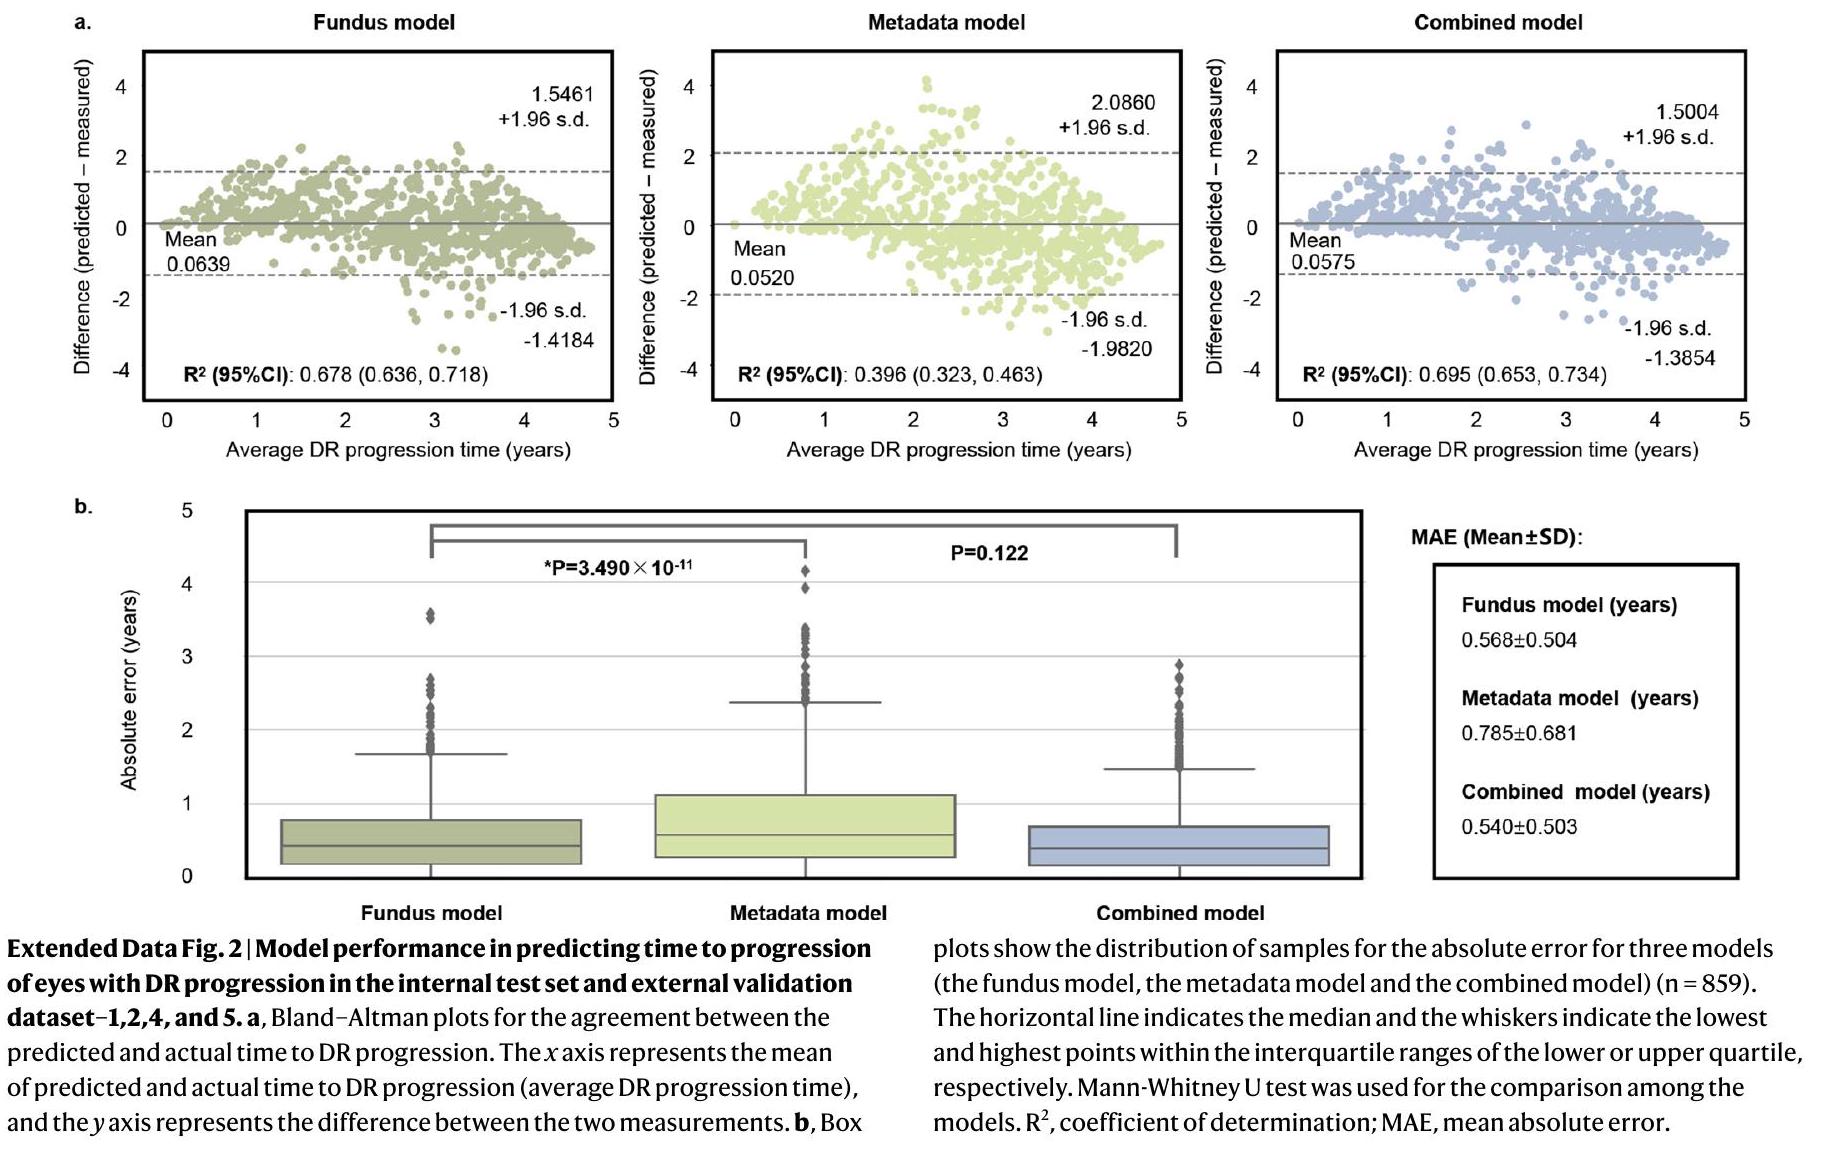
الاعتلال الشبكي القابل للإحالة د. أ، درجة بريير المتكاملة (يسار) تظهر الملاءمة العامة – كلما كانت أقل كان ذلك أفضل، ومؤشر C (يمين) يقيس تمييز مخاطر النموذج – كلما كان أعلى كان ذلك أفضل – لنقاط زمنية مختلفة. ب، مخططات كابلان-ماير لتوقع التقدم من الاعتلال الشبكي غير القابل للإحالة إلى الاعتلال الشبكي القابل للإحالة. تم استخدام اختبار لوغ-رانك أحادي الجانب لـ
المقارنة بين مجموعات المخاطر المنخفضة والعالية. قيم P في مجموعة الاختبار الداخلية ومجموعتي التحقق الخارجي 1 و 2 هي و ، على التوالي. ج، التنبؤ بتطور اعتلال الشبكية السكري غير القابل للإحالة إلى اعتلال الشبكية السكري القابل للإحالة باستخدام منحنيات ROC المعتمدة على الزمن. المناطق المظللة في و هي فواصل ثقة بنسبة 95%. تُعرض المساحات تحت منحنيات ROC كقيم متوسطة (الحد الأدنى لـ ، الحد الأعلى لـ ).
الشكل الموسع 5 | التحقق الداخلي والخارجي من نظام DeepDR Plus في التنبؤ بالتقدم من اعتلال الشبكية السكري غير المهدد للرؤية إلى اعتلال الشبكية السكري المهدد للرؤية. أ، درجة بريير المتكاملة (يسار) التي تظهر ملاءمة عامة – كلما كانت أقل كان أفضل، ومؤشر C (يمين) الذي يقيس تمييز المخاطر للنموذج – كلما كان أعلى كان أفضل – لنقاط زمنية مختلفة. ب، مخططات كابلان-ماير للتنبؤ بالتقدم من اعتلال الشبكية السكري غير المهدد للرؤية إلى اعتلال الشبكية السكري المهدد للرؤية. تم استخدام اختبار لوغ-رانك أحادي الجانب للمقارنة بين المجموعتين المنخفضة والعالية-
مجموعات الخطر. الـ القيم على مجموعة الاختبار الداخلية ومجموعة التحقق الخارجية 1 و 2 هي و ، على التوالي. ج، التنبؤ بتطور اعتلال الشبكية السكري غير المهدد للبصر إلى اعتلال الشبكية السكري المهدد للبصر باستخدام منحنيات ROC المعتمدة على الزمن. المناطق المظللة في و هم فواصل الثقة. تُعرض المساحات تحت منحنيات ROC كقيم متوسطة (الحد الأدنى لفاصل الثقة 95%، الحد الأعلى لفاصل الثقة 95%).
الشكل البياني الموسع 6 | الدراسة الواقعية لتقييم النتيجة السريرية من خلال التكامل مع نظام DeepDR Plus. أ، مخطط سير الدراسة ومعدل تقدم اعتلال الشبكية السكري الفعلي بين الفئتين عالية الخطورة ومنخفضة الخطورة التي تم تقييمها بواسطة نماذج قاع العين والبيانات الوصفية في مجموعة IM ومجموعة غير IM. ب، مخطط الشلال للوقت المتوقع لتقدم اعتلال الشبكية السكري للمشاركين في الدراسة الواقعية بواسطة نموذج قاع العين.
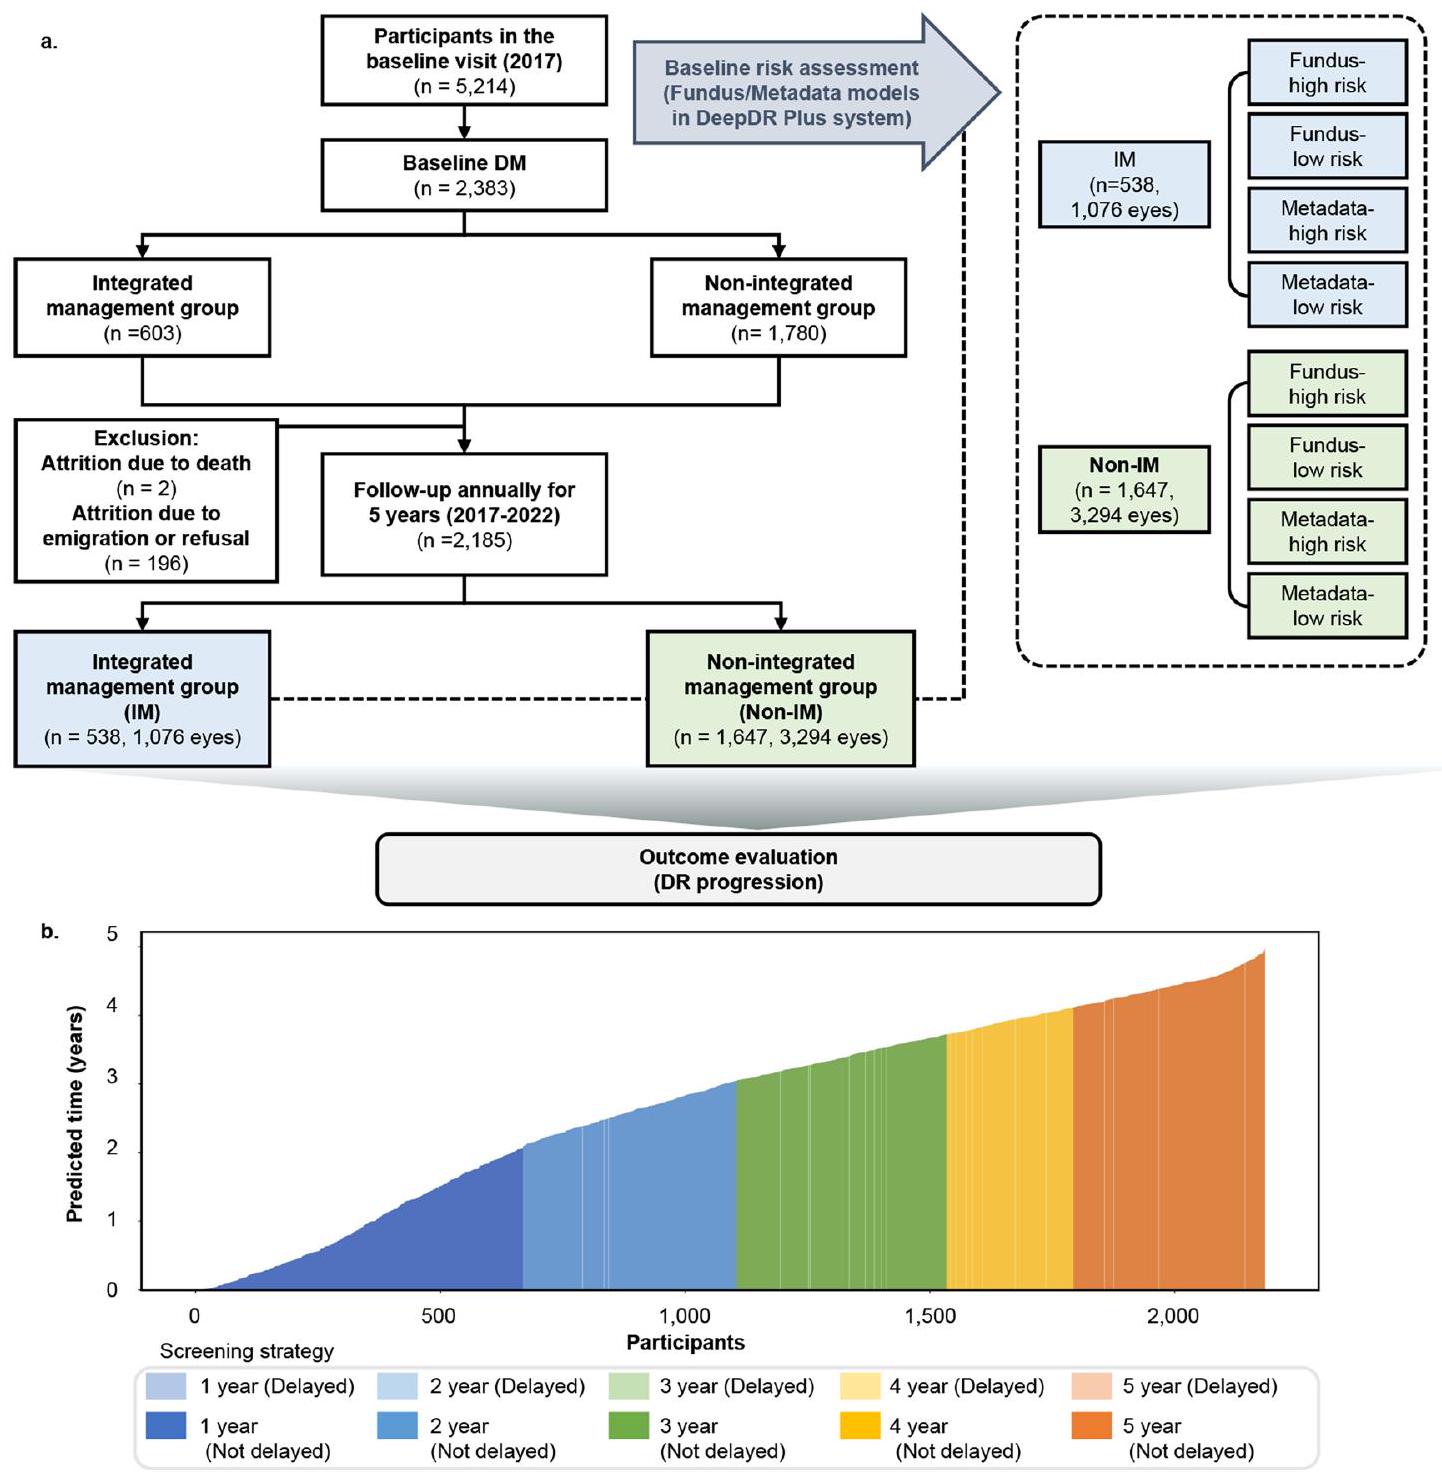
(DeepDR Plus). يعرض مخطط الشلال الوقت المتوقع لتقدم اعتلال الشبكية السكري لجميع المشاركين في الدراسة الواقعية بواسطة نموذج قاع العين. تم تحديد فترة الفحص الفردية عند نقطة زمنية سنوية من الخط الأساسي، والتي كانت فقط بعد عام من الوقت المتوقع لتقدم اعتلال الشبكية السكري الخاص بالمريض حسب نموذج قاع العين.
الشكل البياني الموسع 7 | توضيح هيكل نموذج نظام DeepDR Plus. يحتوي نظام DeepDR Plus على ثلاثة نماذج (نموذج قاع العين، نموذج البيانات الوصفية، والنموذج المدمج)، والتي يمكنها دعم أنواع مختلفة من المدخلات. يحتوي نموذج قاع العين على مستخرج ميزات قاع العين ومُتنبئ لتوليد الوقت المتوقع لتقدم اعتلال الشبكية السكري ودرجة قاع العين. تم تدريب مستخرج ميزات قاع العين مسبقًا باستخدام تقنية التباين الزمني (MoCov2) لتوليد…
متجهات الميزات عالية المستوى، بينما يقدر المتنبئ وقت البقاء في مزيج بحجم ثابت من توزيعات ويبول بناءً على متجهات ميزات قاع العين لتوليد درجة قاع العين. تشترك نماذج البيانات الوصفية والنماذج المجمعة في نفس الهيكل لكنها تختلف في مدخلاتها مقارنة بنموذج قاع العين. يأخذ نموذج البيانات الوصفية البيانات الوصفية كمدخلات، بينما يأخذ النموذج المدمج كل من البيانات الوصفية ودرجة قاع العين كمدخلات.
الجدول الموسع 1 | توزيع درجات اعتلال الشبكية السكري عند البداية وظهور أول تدهور في درجة اعتلال الشبكية السكري في مجموعات البيانات التطويرية والتحقق
المجموعات عدد المرضى المصابين بالسكري عدد العيون في البداية عند بداية التدهور من الدرجة الأولى لاعتلال الشبكية السكري*
غير مرتبط بالمرض اعتلال الشبكية السكري غير التكاثري الخفيف اعتلال الشبكية السكري غير التكاثري المعتدل اعتلال الشبكية السكري غير التكاثري الشديد الانحلال البقعي البؤري غير مرتبط بالكلى اعتلال الشبكية السكري غير التكاثري الخفيف اعتلال الشبكية السكري غير التكاثري المعتدل اعتلال الشبكية السكري غير التكاثري الشديد الانحلال البقعي البريتوني
مجموعة بيانات التطوير مجموعة بيانات التدريب ١٧٬١٩٠ ٣٤٬٣٨٠ ٣٠٬٥٥٤ 1,074 ١٬٥٩٧ ٨٥٢ ٣٠٣ ٢٨٬٥٨٢ ١٬٦٤٤ ٢٬٠٩١ ١٬٣٨٢ ٦٨١
مجموعة الاختبار الداخلية ١٬٩١٠ ٣٬٨٢٠ ٣٬٥٥٢ ٨٤ ١٢٢ ٣٨ ٢٤ ٣٬٣٢٢ ١٧٤ ٢١٦ ٥٨ ٥٠
إي سي إتش إم ٢٬١٤١ ٤٬٢٨٢ ٣٬٩٠٨ ١٢٨ ١٦٠ ٤٤ ٤٢ ٣٬٦٥٢ ٢٢٨ ٢٥٠ ٨٢ ٧٠
دبليو تي إتش إم ٩٧١ ١٬٩٤٢ ١٬٨٣٠ ٤٢ ٥٢ ١٤ ٤ ١٬٧٣٠ ٩٠ ٨٣ ٢٥ ١٤
NDSP ١٬١٩٤ ٢٬٣٨٨ ٢٬٢٢٠ ٨٨ ٧٤ ٢ ٤ ٢٬١٧٦ ١١٨ ٨٠ ١٠ ٤
مجموعات بيانات التحقق الخارجية جامعة تشونغ كونغ الصينية – قسم الدراسات العليا ٣٣٧ ٥٩١ ٢٩٧ ١٠٢ ١٧٩ ١٣ 0 ١٨٣ ٢١٦ ١٧٩ ١٣ 0
بودم ٣٠٧ ٦١٤ ٥٥٢ ١٦ ٣٠ ١٦ 0 ٥٤١ ١٩ ٣٤ ١٢ ٨
بذرة ١٬٦٩٩ ٣٬٣٩٨ ٢٬٩١٨ ٣١٠ ١٢٣ ٧ ٤٠ ٢٬٨٤٩ ٣٣٤ ١٤٨ ٩ ٥٨
SiDRP ٣٬٢٨٤ ٦,٥٦٨ ٦٬٣٤٣ ١٣٨ ٦٦ ١٣ ٨ ٦,١٧٧ ٢٨٦ ٨٣ ١٤ ٨
بي جي إتش سي ٨٣٥ ١٬٦٧٠ ١٬٦٦٦ ٤ 0 0 0 ١٬٦٢٩ ٢٤ ١٧ 0 0
*إذا لم تكن هناك تدهورات في درجة اعتلال الشبكية السكري خلال المتابعة، فإن هذه الأعمدة تشير إلى درجات اعتلال الشبكية السكري في نهاية المتابعة.
الجدول الموسع 2 | أداء نموذج التنبؤ بتقدم اعتلال الشبكية السكري بناءً على نموذج البيانات الوصفية، نموذج قاع العين، والنموذج المدمج في مجموعات بيانات التحقق الداخلية والخارجية
الفوج نموذج أي تقدم في مرض السكري المجموعة الفرعية 1 الفئة الفرعية 2 الفئة الفرعية 3
مؤشر C (فاصل الثقة 95%) متلازمة القولون العصبي (فاصل الثقة 95%) مؤشر C (فاصل الثقة 95%) متلازمة القولون العصبي (فاصل الثقة 95%) مؤشر C (فاصل الثقة 95%) متلازمة القولون العصبي (فاصل الثقة 95%) مؤشر C (فاصل الثقة 95%) متلازمة القولون العصبي (فاصل الثقة 95%)
مجموعة البيانات الداخلية البيانات الوصفية 0.696 (0.668، 0.725) 0.340 (0.334، 0.347) 0.705 (0.672، 0.736) 0.303 (0.297، 0.310) 0.700 (0.658، 0.741) 0.261 (0.255، 0.268) 0.711 (0.637، 0.778) 0.328 (0.322، 0.335)
قاع العين 0.823 (0.796، 0.850) 0.161 (0.156، 0.166) 0.826 (0.797، 0.851) 0.189 (0.184، 0.194) 0.820 (0.785، 0.853) 0.153 (0.147، 0.159) 0.824 (0.758، 0.880) 0.180 (0.175، 0.185)
مُدمج 0.833 (0.807، 0.857) 0.152 (0.147، 0.157) 0.835 (0.810، 0.859) 0.167 (0.162، 0.172) 0.838 (0.806، 0.869) 0.145 (0.141، 0.150) 0.852 (0.787، 0.909) 0.164 (0.160، 0.169)
البيانات الوصفية 0.652 (0.623، 0.680) 0.301 (0.295، 0.308) 0.664 (0.634، 0.694) 0.381 (0.375، 0.387) 0.679 (0.639، 0.720) 0.279 (0.273، 0.284) 0.734 (0.677، 0.791) 0.270 (0.265، 0.276)
إي سي إتش إم قاع العين 0.802 (0.778، 0.827) 0.158 (0.153، 0.162) 0.820 (0.793، 0.846) 0.157 (0.152، 0.162) 0.821 (0.792، 0.852) 0.207 (0.202، 0.213) 0.806 (0.748، 0.857) 0.188 (0.184، 0.193)
مُدمج 0.811 (0.787، 0.834) 0.223 (0.218، 0.228) 0.824 (0.797، 0.848) 0.212 (0.206، 0.217) 0.826 (0.794، 0.858) 0.124 (0.120، 0.128) 0.830 (0.782، 0.871) 0.203 (0.199، 0.209)
البيانات الوصفية 0.652 (0.607، 0.695) 0.381 (0.373، 0.390) 0.672 (0.617، 0.726) 0.286 (0.277، 0.293) 0.688 (0.613، 0.758) 0.341 (0.328، 0.354) 0.671 (0.572، 0.769) 0.373 (0.364، 0.383)
WTHM” تعني “ما هذا بحق الجحيم؟ قاع العين 0.791 (0.748، 0.832) 0.164 (0.157، 0.170) 0.814 (0.773، 0.854) 0.188 (0.181، 0.195) 0.794 (0.735، 0.854) 0.240 (0.232، 0.248) 0.802 (0.705، 0.888) 0.181 (0.173، 0.190)
مُدمج 0.806 (0.762، 0.844) 0.154 (0.147، 0.161) 0.809 (0.764، 0.853) 0.224 (0.216، 0.232) 0.801 (0.739، 0.857) 0.198 (0.188، 0.208) 0.819 (0.720، 0.907) 0.141 (0.134، 0.148)
البيانات الوصفية 0.698 (0.625، 0.768) 0.339 (0.330، 0.347) 0.710 (0.629، 0.790) 0.323 (0.314، 0.332) 0.748 (0.611، 0.862) 0.288 (0.280، 0.295) 0.732 (0.551، 0.897) 0.241 (0.234، 0.248)
NDSP قاع العين 0.800 (0.737، 0.855) 0.197 (0.190، 0.204) 0.846 (0.798، 0.886) 0.191 (0.185، 0.197) 0.796 (0.674، 0.909) 0.220 (0.213، 0.227) 0.818 (0.684، 0.951) 0.207 (0.200، 0.214)
مُدمج 0.814 (0.752، 0.866) 0.171 (0.166، 0.178) 0.852 (0.789، 0.904) 0.177 (0.171، 0.184) 0.802 (0.690، 0.904) 0.198 (0.191، 0.204) 0.822 (0.653، 0.956) 0.139 (0.133، 0.145)
CUHKSTDR البيانات الوصفية 0.650 (0.602، 0.699) 0.305 (0.285، 0.326) 0.621 (0.574، 0.669) 0.402 (0.366، 0.439)
قاع العين 0.789 (0.752، 0.826) 0.241 (0.227، 0.256) 0.754 (0.711، 0.793) 0.197 (0.177، 0.218)
مُدمج 0.793 (0.755، 0.827) 0.213 (0.200، 0.228) 0.759 (0.715، 0.800) 0.207 (0.188، 0.226)
البيانات الوصفية 0.680 (0.568، 0.785) 0.372 (0.355، 0.389) 0.668 (0.474، 0.826) 0.299 (0.284، 0.313)
بودم قاع العين 0.800 (0.697، 0.887) 0.211 (0.192، 0.231) 0.802 (0.672، 0.921) 0.230 (0.213، 0.248)
مُدمج 0.808 (0.708، 0.895) 0.240 (0.217، 0.263) 0.802 (0.661، 0.920) 0.262 (0.247، 0.277)
البيانات الوصفية 0.707 (0.672، 0.742) 0.277 (0.270، 0.283) 0.743 (0.702، 0.782) 0.209 (0.202، 0.215) 0.708 (0.646، 0.762) 0.259 (0.253، 0.266) 0.716 (0.612، 0.814) 0.298 (0.291، 0.305)
بذرة قاع العين 0.786 (0.756، 0.814) 0.200 (0.195، 0.206) 0.800 (0.766، 0.833) 0.210 (0.204، 0.216) 0.813 (0.769، 0.855) 0.173 (0.167، 0.178) 0.817 (0.745، 0.885) 0.223 (0.217، 0.228)
مُدمج 0.792 (0.760، 0.821) 0.198 (0.192، 0.203) 0.804 (0.770، 0.836) 0.187 (0.181، 0.192) 0.816 (0.768، 0.861) 0.208 (0.202، 0.214) 0.819 (0.737، 0.885) 0.132 (0.128، 0.138)
البيانات الوصفية 0.613 (0.572، 0.656) 0.370 (0.364، 0.376) 0.585 (0.541، 0.627) 0.383 (0.376، 0.389) 0.523 (0.404، 0.642) 0.473 (0.466، 0.480)
SiDRP قاع العين 0.800 (0.771، 0.831) 0.172 (0.168، 0.176) 0.801 (0.769، 0.833) 0.164 (0.160، 0.168) 0.769 (0.668، 0.868) 0.209 (0.205، 0.213)
مُدمج 0.804 (0.772، 0.834) 0.219 (0.215، 0.223) 0.806 (0.774، 0.837) 0.204 (0.200، 0.208) 0.783 (0.686، 0.874) 0.237 (0.233، 0.241)
البيانات الوصفية 0.704 (0.607، 0.792) 0.306 (0.296، 0.316) 0.712 (0.637، 0.779) 0.258 (0.249، 0.266)
بي جي إتش سي قاع العين 0.802 (0.736، 0.865) 0.197 (0.189، 0.205) 0.797 (0.709، 0.874) 0.220 (0.212، 0.228)
مُدمج 0.811 (0.753، 0.865) 0.203 (0.195، 0.211) 0.803 (0.720، 0.879) 0.198 (0.190، 0.205)

نيتشر بورتفوليو

بن شينغ، هوايتينغ لي، تيان ين وونغ
المؤلف المراسل: ويبينغ جيا
آخر تحديث بواسطة المؤلف(ين): 6 نوفمبر 2023

ملخص التقرير

تتمنى مجموعة نيتشر تحسين قابلية تكرار الأعمال التي ننشرها. يوفر هذا النموذج هيكلًا للاتساق والشفافية في التقرير. لمزيد من المعلومات حول سياسات مجموعة نيتشر، يرجى الاطلاع على سياسات التحرير وقائمة التحقق من سياسة التحرير.

الإحصائيات

بالنسبة لجميع التحليلات الإحصائية، تأكد من وجود العناصر التالية في شرح الشكل، شرح الجدول، النص الرئيسي، أو قسم الطرق.

تم التأكيد

حجم العينة الدقيق لكل مجموعة/حالة تجريبية، معطاة كرقم منفصل ووحدة قياس
بيان حول ما إذا كانت القياسات قد أُخذت من عينات مميزة أو ما إذا تم قياس نفس العينة مرارًا وتكرارًا
الاختبار الإحصائي المستخدم وما إذا كان أحادي الجانب أو ثنائي الجانب
يجب وصف الاختبارات الشائعة فقط بالاسم؛ وصف التقنيات الأكثر تعقيدًا في قسم الطرق.
وصف لجميع المتغيرات المشتركة التي تم اختبارها
وصف لأي افتراضات أو تصحيحات، مثل اختبارات التوزيع الطبيعي والتعديل للمقارنات المتعددة
وصف كامل للمعلمات الإحصائية بما في ذلك الاتجاه المركزي (مثل المتوسطات) أو التقديرات الأساسية الأخرى (مثل معامل الانحدار) والتباين (مثل الانحراف المعياري) أو التقديرات المرتبطة بعدم اليقين (مثل فترات الثقة)
لاختبار الفرضية الصفرية، إحصائية الاختبار (مثل F، ) مع فواصل الثقة، أحجام التأثير، درجات الحرية و القيمة المسجلة أعطِ القيم كقيم دقيقة كلما كان ذلك مناسبًا.
للتحليل البايزي، معلومات حول اختيار التوزيعات الأولية وإعدادات سلسلة ماركوف مونت كارلو
للتصاميم الهرمية والمعقدة، تحديد المستوى المناسب للاختبارات والتقارير الكاملة للنتائج
تقديرات أحجام التأثير (مثل “كوهين”) ، بيرسون “ )، موضحًا كيف تم حسابها
مجموعتنا على الويب حول الإحصاءات لعلماء الأحياء تحتوي على مقالات حول العديد من النقاط المذكورة أعلاه.

البرمجيات والرموز البرمجية

معلومات السياسة حول توفر شفرة الكمبيوتر
جمع البيانات
لم يتم استخدام أي برنامج خاص لجمع البيانات.
تحليل البيانات
تم استخدام إصدار بايثون 3.9.0 (مؤسسة برمجيات بايثون، ديلاوير، الولايات المتحدة) لجميع التحليلات الإحصائية في هذه الدراسة. تم استخدام حزم بايثون الخارجية التالية: تم استخدام إصدار Pytorch 2.0.1 (فيسبوك، ماساتشوستس، الولايات المتحدة) للحوسبة باستخدام الشبكات العصبية الالتفافية. تم استخدام إصدار Scikit-learn 1.3.0 (ديفيد كورنوبيو، كاليفورنيا، الولايات المتحدة) لحساب مساحة تحت المنحنى (AUC). تم استخدام إصدار NumPy 1.25.2 (ترافيس أوليفانت، تكساس، الولايات المتحدة) لحساب مؤشر C، ودرجة بريير. تم استخدام إصدار Lifelines 0.27.7 (كاميرون ديفيدسون-بيلون، كندا) لتحليل البقاء. تم استخدام برنامج تقييم الأوعية الدموية في سنغافورة الإصدار 4.0 (الجامعة الوطنية في سنغافورة، سنغافورة) لقياس متغيرات الأوعية الدموية في الشبكية. الكود المستخدم في الدراسة الحالية لتطوير الخوارزمية متوفر على https://github.com/drpredict/DeepDR_Plus.
بالنسبة للمخطوطات التي تستخدم خوارزميات أو برامج مخصصة تشكل جزءًا أساسيًا من البحث ولكن لم يتم وصفها بعد في الأدبيات المنشورة، يجب توفير البرنامج للمحررين والمراجعين. نحن نشجع بشدة على إيداع الشيفرة في مستودع مجتمعي (مثل GitHub). راجع إرشادات مجموعة Nature لتقديم الشيفرة والبرمجيات لمزيد من المعلومات.

معلومات السياسة حول توفر البيانات

يجب أن تتضمن جميع المخطوطات بيان توفر البيانات. يجب أن يوفر هذا البيان المعلومات التالية، حيثما كان ذلك مناسبًا:
  • رموز الوصول، المعرفات الفريدة، أو روابط الويب لمجموعات البيانات المتاحة للجمهور
  • وصف لأي قيود على توفر البيانات
  • بالنسبة لمجموعات البيانات السريرية أو بيانات الطرف الثالث، يرجى التأكد من أن البيان يتوافق مع سياستنا
يمكن الوصول إلى بيانات المرضى على المستوى الفردي بموافقة لجنة إدارة البيانات من المؤسسات ولا تتوفر علنًا. يجب إرسال طلب استخدام صور قاع العين والمعلومات السريرية ذات الصلة لأغراض غير ربحية إلى ويبينغ جيا أو تيين ين وونغ. ستقوم لجنة إدارة البيانات بمراجعة جميع الطلبات ومنح الموافقة (إذا تم قبولها). سيكون من الضروري توقيع اتفاقية نقل بيانات رسمية عند الموافقة. عمومًا، سيتم الرد على جميع هذه الطلبات للوصول إلى البيانات خلال شهر واحد. جميع البيانات المشتركة ستكون مجهولة الهوية. لإعادة إنتاج رمز خوارزميتنا، قمنا أيضًا بإيداع مجموعة بيانات حد أدنى في Zenodo (“https://zenodo.org/records/10076339)، والمتاحة للجمهور للأبحاث العلمية والاستخدام غير التجاري.

المشاركون في البحوث البشرية

معلومات السياسة حول الدراسات التي تشمل مشاركين بشريين في البحث والجنس والنوع الاجتماعي في البحث.

التقارير عن الجنس والنوع الاجتماعي

لـ 19100 مشارك في DRPS، كن إناثًا؛ من بين 2,141 مشاركًا في ECHM، كن إناثًا؛ من بين 971 مشاركًا في WTHM، كن إناثًا؛ من بين 1,194 مشاركًا في NDSP، كانوا إناثًا؛ بالنسبة لـ 337 مشاركًا في CUHK-STDR، كان 50.15% منهم إناثًا؛ بالنسبة لـ 307 مشاركًا في PUDM، كانوا إناثًا؛ من بين 1,699 مشاركًا في SEED، كان 50.15% منهم إناثًا؛ من بين 3,284 مشاركًا في SiDRP، كانوا إناثًا؛ من بين 835 مشاركًا في BJHC، كانت نسبة الإناث 47.90%.

خصائص السكان

تم تجنيد المرضى المصابين بالسكري الذين تبلغ أعمارهم 18 عامًا أو أكثر والذين لديهم صور لقاع العين وبيانات سريرية بأثر رجعي من عدة مستشفيات ومستشفيات مجتمعية.

التوظيف

تم تجنيد الأشخاص الذين خضعوا لفحص قاع العين ولديهم صور لقاع العين من عدة مستشفيات ومستشفيات مجتمعية قبل 31 ديسمبر 2022. قد لا تكون البيانات المستخدمة في تدريب النموذج، والتي جُمعت من أشخاص صينيين، ممثلة للسكان بشكل عام، مما قد يؤدي إلى إدخال تحيزات.

الإشراف على الأخلاقيات

تمت الموافقة على الدراسة من قبل لجنة الأخلاقيات في مستشفى شنغهاي السادس الشعبي.
يرجى ملاحظة أنه يجب أيضًا تقديم معلومات كاملة عن الموافقة على بروتوكول الدراسة في المخطوطة.

التقارير المتخصصة في المجال

يرجى اختيار الخيار الأنسب لأبحاثك من الخيارات أدناه. إذا لم تكن متأكدًا، فاقرأ الأقسام المناسبة قبل اتخاذ قرارك.
علوم الحياة
العلوم السلوكية والاجتماعية
العلوم البيئية والتطورية والبيئية
للحصول على نسخة مرجعية من الوثيقة مع جميع الأقسام، انظر nature.com/documents/nr-reporting-summary-flat.pdf

تصميم دراسة علوم الحياة

يجب على جميع الدراسات الكشف عن هذه النقاط حتى عندما يكون الكشف سلبيًا.
حجم العينة قمنا بتطوير نظام DeepDR Plus لتوقع تطور اعتلال الشبكية السكري باستخدام ما مجموعه 76,400 صورة لقاع العين من 19,100 مريض سكري، وقمنا بالتحقق من صحة النظام باستخدام 42,558 صورة لقاع العين من 10,768 مريض سكري. تم تحديد حجم العينة بناءً على توفر البيانات.
استثناءات البيانات تم استبعاد صور الشبكية ذات الجودة الرديئة.
التكرار لم تكن التكرار ذات صلة. استخدمنا ثماني مجموعات تحقق مستقلة لاختبار النماذج، وحققت النماذج أداءً مماثلاً في مجموعات التحقق الخارجية.
العشوائية تم تخصيص العينات عشوائيًا لمجموعات بيانات التطوير والتحقق.
مُعمٍ أثناء معالجة البيانات، تم أولاً إزالة الهوية من جميع البيانات لإزالة أي معلومات متعلقة بالمريض.

التقارير الخاصة بالمواد والأنظمة والأساليب المحددة

نحن نطلب من المؤلفين معلومات حول بعض أنواع المواد، والأنظمة التجريبية، والأساليب المستخدمة في العديد من الدراسات. هنا، يرجى الإشارة إلى ما إذا كان كل مادة أو نظام أو أسلوب مدرج ذو صلة بدراستك. إذا لم تكن متأكدًا مما إذا كان عنصر القائمة ينطبق على بحثك، فاقرأ القسم المناسب قبل اختيار الرد.
المواد والأنظمة التجريبية الطرق
غير متوفر مشارك في الدراسة غير متوفر مشارك في الدراسة
X
تدفق الخلايا
علم الحفريات والآثار
التصوير العصبي القائم على الرنين المغناطيسي

البيانات السريرية

معلومات السياسة حول الدراسات السريرية
يجب أن تتوافق جميع المخطوطات مع إرشادات ICMJE لنشر البحوث السريرية ويجب إرفاق قائمة التحقق المكتملة من CONSORT مع جميع المراسلات.
تسجيل التجارب السريرية
بروتوكول الدراسة
جمع البيانات
النتائج
تم تسجيل الدراسة في سجل التجارب السريرية الصيني (http://www.chictr.org.cn/). رقم التسجيل: ChiCTR2300069400.
يمكن العثور على بروتوكولات الدراسة فيhttp://www.chictr.org.cn/.
تم جمع صور قاع العين في مجموعة DRPS في ووكسي وشنغهاي بين عامي 2015 و2022. تم جمع صور قاع العين في مجموعة SIM في شنغهاي بين عامي 2014 و2017. تم جمع صور قاع العين في مجموعة ECHM في ووكسي بين عامي 2006 و2016. تم جمع صور قاع العين في مجموعة WTHM في ووهان بين عامي 2010 و2021. تم جمع صور قاع العين في مجموعة NDSP في مجتمع نيتشينغ في عامي 2013 و2018. تم جمع صور قاع العين في مجموعة CUHK-STDR في هونغ كونغ بين عامي 2015 و2021. تم جمع صور قاع العين في مجموعة PUDM في بكين بين عامي 2010 و2016. تم جمع صور قاع العين في مجموعة SEED في سنغافورة بين عامي 2004 و2017. تم جمع صور قاع العين في مجموعة SiDRP في سنغافورة بين عامي 2010 و2015. تم جمع صور قاع العين في مجموعة BJHC في بكين بين عامي 2014 و2020.
كانت النتيجة الأساسية هي أي تقدم في اعتلال الشبكية السكري. وكانت النتيجة الثانوية هي التقدم من عدم وجود اعتلال شبكية إلى اعتلال شبكية سكري، ومن اعتلال شبكية غير قابل للإحالة إلى اعتلال شبكية قابل للإحالة، ومن اعتلال شبكية غير مهدد للرؤية إلى اعتلال شبكية مهدد للرؤية. تم تقييم تشخيص وتصنيف اعتلال الشبكية السكري بواسطة أطباء العيون وفقًا لنظام ICDRDSS22.

  1. المختبر الدولي المشترك لطريق الحزام في شنغهاي للوقاية الذكية وعلاج اضطرابات الأيض، قسم علوم وهندسة الحاسوب، كلية الهندسة الإلكترونية والمعلومات والكهربائية، جامعة شنغهاي جياو تونغ، قسم الغدد الصماء والأيض، المستشفى السادس الشعبي في شنغهاي التابع لكلية الطب بجامعة شنغهاي جياو تونغ، معهد السكري في شنغهاي، المركز السريري لمرض السكري في شنغهاي، الصين. المختبر الرئيسي لوزارة التعليم للذكاء الاصطناعي، كلية الهندسة الإلكترونية والمعلومات والكهربائية، جامعة شنغهاي جياو تونغ، شنغهاي، الصين. قسم طب العيون، مصحة هوانغدونغ، ووكسي، الصين. قسم طب العيون، المستشفى الشعبي السادس التابع لكلية الطب بجامعة شنغهاي جياو تونغ، شنغهاي، الصين. قسم طب العيون وعلوم البصر، الجامعة الصينية في هونغ كونغ، هونغ كونغ، الصين. معهد أبحاث العين في سنغافورة، المركز الوطني للعين في سنغافورة، سنغافورة، سنغافورة. قسم علوم وهندسة الحاسوب، جامعة هونغ كونغ للعلوم والتكنولوجيا، هونغ كونغ، الصين. قسم الهندسة الكيميائية والبيولوجية، جامعة هونغ كونغ للعلوم والتكنولوجيا، هونغ كونغ، الصين. المختبر الرئيسي للدولة لطب العيون، مركز تشونغشان لطب العيون، جامعة صن يات سين، المختبر الرئيسي الإقليمي لطب العيون وعلوم البصر بمقاطعة قوانغدونغ، قوانغتشو، الصين. قسم طب العيون، مستشفى كلية بكين الطبية المتحدة، كلية بكين الطبية المتحدة، الأكاديمية الصينية للعلوم الطبية، بكين، الصين. مكتب السجلات الطبية والإحصاءات، المستشفى الشعبي السادس في شنغهاي التابع لكلية الطب بجامعة جياو تونغ في شنغهاي، الصين. قسم طب الشيخوخة، مستشفى تونغجي، كلية تونغجي الطبية، جامعة هواجونغ للعلوم والتكنولوجيا، ووهان، الصين. المركز الوطني لأبحاث الهندسة لتقنية ونظام البيانات الضخمة، مختبر تقنية ونظام حوسبة الخدمات، مختبر الحوسبة العنقودية وشبكات الحوسبة، كلية علوم الحاسوب والتكنولوجيا، جامعة هواجونغ للعلوم والتكنولوجيا، ووهان، الصين. خدمات شبكية العين لشري بهاجوان مهافير، مؤسسة البحوث الطبية، سانكارا نيثرالايا، تشيناي، الهند. قسم طب العيون، مستشفى شنغهاي العام، كلية الطب بجامعة شنغهاي جياو تونغ، شنغهاي، الصين. معهد بكين لطب العيون، مركز بكين تونغرن للعيون، مستشفى بكين تونغرن
  2. -الفهرس يشير إلى مؤشر التوافق. يشير IBS إلى درجة بريير المتكاملة.

Journal: Nature Medicine
DOI: https://doi.org/10.1038/s41591-023-02702-z
PMID: https://pubmed.ncbi.nlm.nih.gov/38177850
Publication Date: 2024-01-04

A deep learning system for predicting time to progression of diabetic retinopathy

Received: 27 April 2023
Accepted: 10 November 2023
Published online: 4 January 2024
(D) Check for updates

Abstract

Ling Dai , Bin Sheng (1) , Tingli Chen , Qiang Wu , Ruhan Liu (1) , Chun Cai , Liang Wu , Dawei Yang , Haslina Hamzah , Yuexing Liu , Xiangning Wang © , Zhouyu Guan (B) , Shujie Yu , Tingyao , Ziqi Tang , Anran Ran (1) , Haoxuan Che © , Hao Chen (1) , Yingfeng Zheng , Jia Shu , Shan Huang , Chan Wu , Shiqun Lin , Dan Liu , Jiajia Li , Zheyuan Wang , Ziyao Meng , Jie Shen , Xuhong Hou , Chenxin Deng , Lei Ruan , Feng Lu , Miaoli Chee , Ten Cheer Quek , Ramyaa Srinivasan , Rajiv Raman , Xiaodong Sun © , Ya Xing Wang (B) , Jiarui Wu , Hai Jin , Rongping Dai , Dinggang Shen (1) , Xiaokang Yang , Minyi Guo , Cuntai Zhang , Carol Y. Cheung , Gavin Siew Wei Tan , Yih-Chung Tham (1) , Ching-Yu Cheng , Huating Li Tien Yin Wong Weiping Jia (1)

Abstract

Diabetic retinopathy (DR) is the leading cause of preventable blindness worldwide. The risk of DR progression is highly variable among different individuals, making it difficult to predict risk and personalize screening intervals. We developed and validated a deep learning system (DeepDR Plus) to predict time to DR progression within 5 years solely from fundus images. First, we used 717,308 fundus images from 179,327 participants with diabetes to pretrain the system. Subsequently, we trained and validated the system with a multiethnic dataset comprising 118,868 images from 29,868 participants with diabetes. For predicting time to DR progression, the system achieved concordance indexes of 0.754-0.846 and integrated Brier scores of 0.153-0.241 for all times up to 5 years. Furthermore, we validated the system in real-world cohorts of participants with diabetes. The integration with clinical workflow could potentially extend the mean screening interval from 12 months to 31.97 months, and the percentage of participants recommended to be screened at 1-5 years was 30.62%, 20.00%,19.63%,11.85% and 17.89%, respectively, while delayed detection of progression to vision-threatening DR was 0.18%. Altogether, the DeepDR Plus system could predict individualized risk and time to DR progression over 5 years, potentially allowing personalized screening intervals.

DR is the most common microvascular complication of diabetes and the leading cause of preventable blindness in adults aged 20-74 years . Notably, DR mainly develops and progresses asymptomatically in the early stages until loss of vision occurs in the later stages of disease .
However, the risk of DR progression is highly variable among different individuals, influenced by many modifiable and non-modifiable risk factors . Currently, it is not possible to identify which patients with diabetes would develop DR or progress faster or slower. Consequently,
routine screening for DR at yearly intervals is widely recommended for all individuals with diabetes with no DR or mild DR by national and international organizations . Additionally, many individuals with diabetes are referred for monitoring and follow-up in specialist eye clinics or hospitals before they progress to severe DR, sometimes within just 2 years into a screening program . Although previous studies have shown that as a group, DR is generally a slowly progressing disease , and it is feasible to approximate progression risk for subgroups of patients with similar risk factors and DR severity levels , it has been challenging to extend screening intervals from 1 year to 2 years (or even 3 years) because of the difficulty in accurately predicting an individual’s risk of and time to development of DR. As a result, many physicians and national DR screening programs have been extremely hesitant to recommend such an approach, although it would be highly cost-effective .
Thus, one of the main challenges in managing DR is the lack of an individualized risk model and accurate prediction of the time to the onset and progression of the disease. By developing such a model, we can better estimate the risk and time frame for developing DR, which would significantly enhance the efficiency of DR screening programs . Furthermore, we can allocate more intensive DR management strategies to those at high risk, which could help prevent the progression of DR.
Artificial intelligence (AI) has been playing an increasingly important role in medicine . Deep learning (DL), with convolutional neural networks, has been developed for the automated detection of DR from retinal photographs . There are, however, very few studies with retinal image-based DL systems to prospectively predict the risk of . Moreover, there are critical gaps in existing research. First, regarding risk prediction of DR onset and progression, previous DL models focused on risk stratification within only 2 years after the baseline visit . This is insufficient for a chronic disease such as DR because most patients do not develop DR progression within 2 years . Second, an automated prediction of an individual’s time to DR onset and progression has not been explored in previous studies. Third, studies are needed to evaluate the impact of retinal image-based DL systems on patient outcomes when integrated into clinical workflow. These gaps need to be addressed before retinal image-based DL systems can be incorporated into DR screening programs.
We have previously developed a DL system (DeepDR), that can detect early-to-late stages of . In the present study, we developed, validated and externally tested a DL system (DeepDR Plus), to predict individualized patient trajectories for DR progression within 5 years. Firstly, 717,308 fundus images from 179,327 patients with diabetes were used to pretrain the DeepDR Plus system. Subsequently, we trained and validated our DeepDR Plus system using clinical metadata and retinal fundus images from diverse multiethnic multicountry datasets, which comprise more than 118,868 images collected from 29,868 participants. To further demonstrate the outcome of the integration with clinical and digital workflows, we conducted a real-world study within prospective cohorts with diabetes.

Results

Study design and participants

To learn the features associated with DR, the DeepDR Plus system was pretrained using 717,308 fundus images from 179,327 individuals with diabetes from the Shanghai Integrated Diabetes Prevention and Care System (Shanghai Integration Model) and the Shanghai Diabetes Prevention Program (SDPP). Subsequently, it was developed and validated in an internal dataset consisting of 76,400 fundus images from 19,100 individuals with diabetes collected from the Diabetic Retinopathy Progression Study (DRPS) cohort (Fig. 1). The DRPS cohort was divided into a developmental dataset and an internal test set at the patient level at a ratio to predict the risk and time to DR progression at specific future time points. To validate the generalizability of the
DeepDR Plus system, we used eight independent longitudinal cohorts for external validations (Methods and Extended Data Fig. 1). The baseline demographics information, anthropometric indices, biochemical measurements and retinal images of all the cohorts are summarized in Table 1. The relevant distribution of DR grades at baseline and at the end of follow-up in the developmental and validation datasets is shown (Extended Data Table 1), based on the International Clinical Diabetic Retinopathy Disease Severity Scale (ICDRDSS) .

DeepDR Plus predicts time to DR progression

The DRPS cohort was used to develop the DL system for DR progression. In internal validation, for the prediction of DR progression among patients with diabetes, the metadata model achieved a concordance index (C-index) of 0.696 (95% confidence interval (CI), 0.668-0.725); the fundus model achieved a C-index of 0.823 ( ), which was superior to the metadata model; and the combined model achieved a C-index of 0.833 ( ). The aforementioned results indicated that the performance of the combined model was similar to that of the fundus model, demonstrating the accurate prediction performance of the fundus model (Extended Data Table2). In the eight independent external datasets, the models achieved similar performances in predicting DR progression. The fundus model achieved C-indexes of 0.786-0.802, which were comparable with the combined model. The fundus model using low-resolution images of pixels still yielded superior performance than the metadata model, suggesting that the resolution requirements for this technique can be easily met (Supplementary Fig. 1).
Subsequently, we predicted specific time to DR progression based on fundus images at years 1-5. C-index and the integrated Brier score (IBS) were used to evaluate the performance of the fundus model in the internal and external datasets. As illustrated in Fig. 2a, the fundus model achieved C-indexes of 0.823-0.862 and IBS ranged from 0.049 to 0.161 for years . The performance of the fundus model was carried over well to the external datasets and 5 , resulting in C -indexes of and IBSs of 0.066-0.170, indicating the high concordance and strong calibration of the DeepDR Plus system.
To assess the prediction ability of the fundus model, we stratified eyes from individuals with diabetes into two groups (low or high risk) for DR progression according to the predicted risk scores. The threshold for the low-risk and high-risk groups was based on the median of the risk scores predicted from the fundus models in the developmental dataset. As shown in Fig. 2b, the fundus model can accurately discriminate low-risk and high-risk groups in both internal and external datasets (log-rank test ). Additionally, we used time-dependent receiver operating characteristic (ROC) curves at years 1-5 to assess the prognostic accuracy of the fundus model of DR progression. For years 1-5, the areas under the ROC curve (AUCs) for DR progression ranged between 0.826 and 0.865 in the internal dataset. In the external sets, the AUCs ranged between 0.722 and 0.863 (Fig. 2c). Particularly, we showed the model performance in predicting time to progression of eyes with DR progression in the internal test set and external validation datasets1,2,4 and 5 (Extended Data Fig. 2). The level of agreement between the predicted time to DR progression and the actual time to DR progression was depicted using a Bland-Altman plot. The fundus model demonstrated good performance in DR progression prediction, achieving a coefficient of determination ( ) of 0.678 (Extended Data Fig. 2a). The predictive performance of the metadata model ( ) was markedly lower compared with the fundus model. As shown in Extended Data Fig. 2b, the fundus model also resulted in a significantly lower mean absolute error compared with the metadata model ( ) and demonstrated no significant difference compared with the combined model ( ).
Furthermore, we conducted a subgroup analysis to evaluate the predictive performance of the fundus model considering the glycemic control (Supplementary Table 1). No significant difference was
Fig. 1|Design of the DeepDR Plus system. a, Schematic overview of the DeepDR Plus system. DeepDR Plus can predict the time to DR progression and perform risk stratification using retinal images of individuals with diabetes. , Evaluation and application of the AI system. We trained our AI system on a developmental dataset and tested the generalizability in eight longitudinal independent cohorts. c, Schematic overview of the real-world study. d, Visual diagram of the DeepDR Plus system. DM, diabetes mellitus; DR, diabetic retinopathy; NPDR, non-proliferative diabetic retinopathy; PDR, proliferative diabetic retinopathy;
DME, diabetic macular edema; DRPS, Diabetic Retinopathy Progression Study; ECHM, Eastern China Health Management; WTHM, Wuhan Tongji Health Management; NDSP, Nicheng Diabetes Screening Project; CUHK-STDR, Chinese University of Hong Kong-Sight-Threatening Diabetic Retinopathy; PUDM, Peking Union Diabetes Management; SEED, Singapore Epidemiology of Eye Diseases; SiDRP, Singapore National Diabetic Retinopathy Screening Program; BJHC, Beijing Healthcare Cohort Study; IM, integrated management; DL, deep learning.
observed in the model performance for predicting DR progression among patients with different glycemic control statuses, regardless of the addition of follow-up hemoglobin A1c (HbA1c) levels.

DeepDR Plus predicts time to progression in three subgroups

Because determining when patients should seek out an ophthalmologist and assessing the extent of DR are key concerns for both clinicians and patients, we conducted three subgroup analyses to provide additional evidence of the predictive capabilities of the DeepDR Plus system. The three subgroups included diabetes with no retinopathy to DR (subgroup 1), non-referable DR to referable DR (subgroup 2), non-vision-threatening DR to vision-threatening DR (subgroup 3).
Referable DR was defined as moderate non-proliferative diabetic retinopathy (NPDR) or worse, and/or diabetic macular edema (DME). Additionally, we defined VTDR as severe NPDR, proliferative diabetic retinopathy (PDR) and/or DME.
In these three subgroups, we developed and tested the DeepDR Plus system using baseline retinal images to predict different types of DR grade deteriorations over 5 years. The performance of the three prediction models for each subgroup was compared using C-index and IBS. The metadata model achieved C-indexes of 0.700-0.711 and IBSs of 0.261-0.328 in predicting progression to any grade of DR , referable DR and VTDR in the internal dataset. Compared with the metadata model, C-indexes of the fundus model improved to 0.826 ( ,
Table 1 | Baseline characteristics of the participants in the internal dataset and external validation datasets
Cohorts Pretrained dataset Developmental dataset Internal test set ECHM External-1 WTHM External-2 NDSP External-3 CUHK-STDR External-4 PUDM External-5 SEED External-6 SiDRP External-7 BJHC External-8
Number of images 717,308 68,760 7,640 8,564 3,884 4,776 1,182 1,228 6,676 12,818 3,340
Number of participants 179,327 17,190 1,910 2,141 971 1,194 337 307 1,699 3,284 835
Race
Chinese, (%) 179,327 (100%) 17,190 (100%) 1,910 (100%) 2,141 (100%) 971 (100%) 1,194 (100%) 337 (100%) 307 (100%) 411 (24.19%) 2,494 (75.94%) 835 (100%)
Malay, (%) NA NA NA NA NA NA NA NA 532 (31.31%) 518 (15.77%) NA
Indian, (%) NA NA NA NA NA NA NA NA 756 (44.50%) 272 (8.28%) NA
Gender
Female, (%) 96,676 (53.91%) 2,692 (15.66%) 337 (17.62%) 826 (38.58%) 313 (32.23%) 739 (61.89%) 169 (50.15%) 131 (42.67%) 852 (50.15%) 1,661 (50.58%) 400 (47.90%)
Male, (%) 82,651 (46.09%) 14,498 (84.34%) 1,573 (82.38%) 1,315 (61.42%) 658 (67.77%) 455 (38.11%) 168 (49.85%) 176 (57.33%) 847 (49.85%) 1,623 (49.42%) 435 (52.10%)
Age (years)
Smoker, (%) 19,249 (10.73%) 4,255 (24.75%) 470 (24.60%) 277 (12.94%) 215 (22.14%) 207 (17.34%) 83 (24.63%) 122 (39.74%) 484 (28.49%) 63 (1.9%) NA
Body mass index ( )
Systolic blood pressure (mm Hg)
HbA1c (%) NA
Fasting plasma glucose ( ) NA
Random blood glucose ( ) NA NA NA NA NA NA NA NA NA NA
Triglycerides (mmol )
Low-density lipoprotein cholesterol ( )
High-density lipoprotein cholesterol ( )
Duration of diabetes mellitus (years) NA NA
Eyes with DR progression, (%) NA 2,819 (8.20%) 278 (7.28%) 321 (7.50%) 121 (6.23%) 48 (2.01%) 114 (16.91%) 25 (4.07%) 184 (5.41%) 171 (2.60%) 38 (2.28%)
Fig. 2 | Internal and external validation of the fundus model in the prediction of the progression of DR. a, IBS (left) showing overall fit (lower is better) and C-index (right) measuring model risk discrimination (higher is better) for various time points. Data of external validation include retinal fundus images from individuals in the ECHM, WTHM, CUHK-STDR and PUDM cohorts. b, KaplanMeier plots for the prediction of DR progression. The axis indicates the time in years. The axis is the survival probability, measuring the probability of no DR progressing in 5 years. One-sided log-rank test was used for the comparison
between the low-risk and high-risk groups. The values for the internal test set and the external validation datasets and 5 are , and , respectively. c, Prediction of DR progression using time-dependent ROC curves. The asterisk indicates that there is only one case of the progression from non-DR to DR in the first year. The shaded areas in and denote CIs. Areas under the ROC curves are presented as mean values (lower bound of , upper bound of ).
0.797-0.851) for DR, 0.820 (95% CI, 0.785-0.853) for referable DR, and 0.824 (95% CI, 0.758-0.880) for VTDR, while IBS decreased to 0.153-0.189 for three subgroups. When the fundus images were combined with clinical metadata, the combined model gave C -indexes of 0.835-0.852 and IBS of 0.145-0.167 for subgroups 1-3 (Extended Data Table 2). Furthermore, we evaluated the prediction performance of the fundus model in the external datasets and achieved comparable results with the internal dataset (Extended Data Table 2). The results indicated that the fundus images alone could effectively predict the disease progression. Similarly to the task of predicting the time to any DR progression, we evaluated the prediction performance in three subgroups. As shown in Extended Data Figs. 3-5, the fundus model achieved C-indexes of 0.820-0.895 and IBSs of 0.045-0.189 in the internal dataset for years 1-5. Moreover, the external validation datasets1, 2, 4 and 5 achieved C-indexes of 0.794-0.842 and IBSs of 0.058-0.218.
The risk stratification results of the DeepDR Plus system in predicting the progression of three subgroups are shown in Extended Data Figs. 3-5. We stratified baseline eyes from individuals with diabetes into two groups (low or high risk) for disease progression based on the predicted risk scores of the fundus model. Significant separations of the survival curves of each group were achieved in both internal
and external datasets ( ) in three subgroups. Additionally, we used time-dependent ROC curves at years 1-5 to assess the prognostic accuracy of the fundus model for the above three situations. For years 1-5, the AUC values were 0.822-0.896 for predicting the onset of DR, referable DR and VTDR in the internal dataset. For external validation, the fundus model achieved comparable performance with AUC values ranging from 0.738 to 0.886 .
Applying the DeepDR Plus system improves clinical outcomes
To evaluate the effectiveness of the DeepDR Plus system with the integration of clinical workflows, we conducted a real-world study within a community-based prospective cohort study of Chinese adults (Methods). A total of 2,185 participants were included in the analysis, with 538 participants in the integrated management (IM) group (integrated hospital-community diabetes management program) and 1,647 participants in the non-IM group. Participants in the IM group were provided regular clinical and metabolic measurements, advised by specialists in comprehensive hospitals and received lifestyle guidance and peer support at community health service centers . Participant enrollment is outlined in Extended Data Fig. 6a and specific characteristics of all participants at baseline and at the end of follow-up are listed in
Table 2 | Associations between risk identification model and participant outcomes
Eyes with DR progression incidence per 1,000 eye-years (number of cases/number of eyes) ARR (95% CI)
IM group ( ) DeepDR Plus-low risk (AI-low) Metadata-low risk (meta-low) -33.05 (-67.79, 35.76)
5.11 (16/626) 7.63 (24/629)
DeepDR Plus-high risk (AI-high) Metadata-high risk (meta-high) 14.54 (-28.26, 74.63)
26.67 (60/450) 23.27 (52/447)
Integrated hospital-community diabetes management program Non-IM ( ) DeepDR Plus-low risk (AI-low) Metadata-low risk (meta-low) -91.63 (-93.91, -89.06)
5.01 (50/1,996) 11.34 (113/1,993)
DeepDR Plus-high risk (AI-high) Metadata-high risk (meta-high) 61.36 (25.36, 109.91)
33.13 (215/1,298) 23.37 (152/1,301)
Comprehensive interventions: [(AI-high+AI-low)-(meta-high+meta-low)] in IM group-[(Al-high+Al-low)-(meta-high+meta-low)] in non-IM group 46.80 (12.37, 94.93)
Sankara Nethralaya-Diabetic Retinopathy Epidemiology and Molecular Genetics Study IM group ( ) DeepDR Plus-low risk (AI-low) Metadata-low risk (meta-low) -9.39 (-79.77, 287.41)
4.08 (2/98) 4.49 (2/89)
DeepDR Plus-high risk (Al-high) Metadata-high risk (meta-high) 20.48 (-70.93, 400.0)
25.0 (6/48) 21.05 (6/57)
Non-IM group ( ) DeepDR Plus-low risk (AI-low) Metadata-low risk (meta-low) -97.32 (-98.28, -96.32)
5.24 (28/1,068) 13.0 (70/1,077)
DeepDR Plus-high risk (Al-high) Metadata-high risk (meta-high) 43.13 (9.1, 87.18)
44.11 (161/730) 33.01 (119/721)
Comprehensive interventions: [(AI-high+AI-low)-(meta-high+meta-low)] in IM group-[(AI-high+AI-low)-(meta-high+meta-low)] in non-IM group 88.74 (10.83, 330.25)
ARR is reported as ‘median ( )’ by bootstrapping. Only eyes with gradable fundus images in both baseline and follow-up visits in the Sankara Nethralaya-Diabetic Retinopathy Epidemiology and Molecular Genetics Study were included.
Supplementary Table 2. The baseline retinal images and metadata of all participants were assessed by two models (the fundus model and metadata model in DeepDR Plus system) to evaluate their risk of DR progression.Each model generated the predicted time as a risk score, which was compared to a model-specific threshold obtained in the developmental dataset. Consequently, both models divided the IM group and non-IM group into low-risk and high-risk groups.
We calculated the adjusted relative reduction (ARR) of DR progression rate between the fundus model and metadata model in the DeepDR Plus system (Table 2). After adjustment for patient demographics, medical history, anthropometric indices and biochemical measurements, in the IM group, the difference in the DR progression rate between the fundus model and metadata model was not statistically significant in both low-risk group (ARR-33.05%; 95% CI, -67.79-35.76%) and high-risk group (ARR 14.54%; 95% CI, -28.26-74.63%). However, patients from the fundus high-risk group of the non-IM group had a higher DR progression rate compared with metadata high-risk group (33.13 versus 23.37 per 1,000 eye-years). Participants identified by the fundus high-risk group were prone to develop DR progression when they did not receive integrated hospital-community management (ARR 61.36%; 95% CI, 25.36-109.91%). Interestingly, in patients of the non-IM group, the fundus low-risk group had a significantly lower rate of DR progression compared with the metadata low-risk group (ARR to ). Under comprehensive interventions (that is, intensive intervention for the high-risk group and non-intensive intervention for the low-risk group), compared with the metadata model, the fundus model can relatively prevent DR progression incidence (ARR 46.80%; 95% CI, 12.37-94.93%).
To further evaluate the outcome of the integration with clinical workflows, we additionally conducted a real-world study within an Indian prospective cohort (SN-DREAMS) , among 992 patients with diabetes who underwent 4 years of follow-up (Supplementary Table3). Compared to the metadata model, the fundus model could relatively
Table 3 | Performance of personalized screening regime recommended by the metadata model or fundus model in DeepDR Plus, compared with fixed annual screening
Group Model Average screening interval (months) Reduction in screening frequency (%) Delayed detection of any DR progression (%) Delayed detection of progression to VTDR (%)
IM Metadata 34.06 64.77 1.86 0.93
Fundus 31.54 61.95 0.37 0.37
Non-IM Metadata 35.32 66.02 6.01 0.97
Fundus 32.11 62.63 1.28 0.12
IM and non-IM Metadata 35.01 65.72 4.99 0.96
Fundus 31.97 62.46 1.05 0.18
The screening interval was set at an annual time point from baseline, which was just the year after the predicted participant-specific time to DR progression by the metadata model or fundus model. The resulting reduction in the annual number of screenings of the population when applying the personalized screening regime recommended by the metadata model or fundus model in DeepDR Plus, compared with fixed annual screening. The rate of delayed detection of DR progression when applying the personalized screening regime recommended by metadata model or fundus model in DeepDR Plus, compared with fixed annual screening.
prevent DR progression incidence under comprehensive interventions (Table 2)
Furthermore, we evaluated the performance of the personalized screening regime recommended by the metadata model or fundus model, compared with fixed annual screening. Table 3 shows the average screening interval, reduction in screening frequency and rate of delayed detection of DR progression in both IM and non-IM groups. For all participants, the mean screening interval could be extended from 12 months to 31.97 months if all participants in both IM and non-IM

groups followed the recommended personalized screening interval given by the fundus model. Compared with the metadata model, the fundus model can achieve a similar reduction in screening frequency ( versus ) while maintaining obviously less delayed detection of any DR progression (1.05% versus 4.99%). Additionally, there was
a lower rate of delayed detection of any DR progression in patients of the IM group compared with the non-IM group ( versus ) using the screening interval recommended by the fundus model, which suggested that the DeepDR Plus system could guarantee a low possibility of delayed detection of DR progression regardless of future
interventions. Extended Data Fig. 6b shows the waterfall plot of predicted time to DR progression of participants in the real-world study by the fundus model. If all participants in both IM and non-IM groups followed the recommended personalized screening interval given by the fundus model, the percentage of participants who were recommended to screen DR at 1-5 years was 30.62%, 20.00%, 19.63%, 11.85% and , respectively, while delayed detection of progression to VTDR was only . To sum up, compared with the metadata model, the fundus model could stratify participants more accurately to enable personalized interventions and reduce DR screening frequencies with less delayed detection of DR progression.

Explainability analysis

The interpretability of the DeepDR Plus system can shed insight into its diagnostic mechanism and enable broad adoption. To better understand how the DeepDR Plus system could predict DR progressions, we took three steps to ensure the relevance and interpretability of the resulting features.
First, we conducted a saliency analysis using attention methods (Methods) to provide insights into the regions in the fundus images that could influence the predictions of the fundus model. Representative example attention maps at different times to DR progression (1 to 5 years, respectively) are shown in Fig. 3a. Attention maps of baseline fundus photographs were compared with annual follow-up fundus images. The results showed that our fundus model predicted DR progression by focusing on retinal vessels and the fovea. In addition, mean attention maps were generated for eyes with DR progression from the internal test set, reflecting that these observations were also generalized across many images (Fig. 3b).
It has been demonstrated that vessel density, fractal dimension and foveal avascular zone area could predict DR progression . Previous studies also support that retinal vascular changes and related variables are associated with DR-related risk factors . To further explore the patterns of retina associated with the future occurrence of DR, a range of retinal vascular variables were quantitatively measured by human graders who were masked to participant characteristics using our Singapore I vessel assessment software . Cox regression analysis showed that higher venular fractal dimension in zone C was independently associated with any progression of DR , incident DR and incident referable DR after adjustment for age ( ) in the internal test set (Supplementary Tables 4 and 5). Meanwhile, central retinal vein equivalent in zone and zone significantly predicted the incidence of DR and referable DR ( ), and central retinal artery equivalent in zone B and zone C independently predicted incident referable DR ( ) after adjusting for age (Supplementary Table 5). Specifically, retinal vascular geometry resulted in a slight improvement in AUC values when added to the metadata model (Supplementary Table 6). These results showed that baseline retinal vascular geometry might be predictive patterns for the occurrence of DR, and the fundus model might pick up on signals beyond retinal vascular geometry to make these predictions.
Furthermore, we applied SHAP-based model interpretation to discover the predictive contribution of different clinical features for DR progression in the internal test set (Fig.3c). The fundus score had the highest contribution to model performance.

Discussion

Early screening and timely intervention are critical for the prevention and better clinical management of DR to achieve favorable outcomes. In this study, we developed a DL system called the DeepDR Plus system that utilized baseline retinal images to precisely predict individualized time to DR progression for all times up to 5 years. We also demonstrated the integration of this system into the clinical workflow could potentially extend the mean screening interval from the current 12 months to nearly 3 years, while delayed detection of progression to VTDR was
only 0.18%. These results demonstrated that our DeepDR Plus system could potentially promote patient-specific risk assessment and further personalized care for DR management, based on just one single-time retinal check in the future.
The personalized interval for DR screening could improve the efficiency and put more attention on those who are at high risk for DR progression , as in-person expert examinations are impractical and unsustainable given the pandemic size of the population with diabetes. In previous studies , DL systems were created for predicting DR progression within 2 years, and were independent of available risk factors. Such a risk stratification tool might help to optimize screening intervals to reduce costs while improving vision-related outcomes. Considering the high variability in an individual’s risk of DR progression, our study provides a potential clinical tool to stratify low-risk and high-risk individuals with diabetes, which would support a personalized AI-driven approach to determine clinic follow-up intervals and more personalized management plans.
To further demonstrate the outcome of the integration of the DeepDR Plus system into clinical workflow, we first conducted a real-world study within a prospective cohort. Cutting-edge AI systems could not realize their full potential unless they are integrated into clinical and digital workflows . In participants of the non-IM group, compared with the metadata model, participants with high risk identified by the DeepDR Plus system were prone to develop DR progression, suggesting that our DL models could predict patient-specific risk trajectories for DR progression more accurately than the metadata model. These participants could be preferentially selected for more intensive management or counseling . Intriguingly, there was a significantly lower rate of DR progression in fundus low-risk group, which revealed that it might be relatively safe for these participants to achieve lenient control targets. Further, DeepDR Plus could potentially enable individualized DR screening intervals to balance early detection and reduce . Compared with fixed annual screening for participants with no or mild NPDR, if all participants followed the recommended personalized screening interval given by the fundus model, the mean screening interval could be extended from 12 months to 31.97 months with 62.46% reduction in frequency, while the delayed detection of DR progression was minimal. Meanwhile, the DeepDR Plus system could also carry over well to Indians when integrated into clinical workflow, suggesting the generality of the system.
In our study, retinal vascular geometry and the fovea were important image patterns for future occurrence of DR based on the DeepDR Plus system, which was consistent with state-of-the-art studies and our previous studies . Regions of DR-related capillary dropout have been related to local underlying photoreceptor loss, and the fovea may provide information on visual function and foveal perfusion . It has also been demonstrated that changes in the caliber of the retinal vessel, especially widening of the venules, increase the risk of developing functional abnormalities in the eye and progression of . Fractal dimension reflects underlying structural and/or functional alterations resulting from the effects of inflammation, neuronal abnormalities and other pathophysiological mechanisms . In addition, increased vascular fractal dimension was associated with retinal neuropathy, which is an early event in the pathogenesis of . The above studies might partially explain why retinal vascular geometry and the fovea are important image patterns for future occurrence of DR.
AI-based technology can assist DR screening, which is an unmet public health need . Our study showed that an AI-driven personalized screening interval could be incorporated to improve efficiency, equity and accessibility of DR screening, particularly in low-resource settings . Because highly effective recall systems can improve adherence to future clinical practice, integrating it into AI-based DR screening programs would further improve DR management. The use of AI in new classification of DR is promising , and there are optimistic
prospects for future guideline modifications pertaining to the use of AI in DR management.
Our study had several limitations. First, our DeepDR Plus system was trained in a Chinese population. Additional training on a wider variety of clinical and demographic datasets could improve predictive performance and its usefulness across multiple populations. Second, certain intrinsic biases, such as unidentified confounders (for example, myopia status), cannot be eradicated in the current retrospective study framework. Third, the performance of the fundus model may vary among patients with different treatment regimes, and this aspect still requires future testing for further ascertainment. Lastly, although the DeepDR Plus system was not actually applied to the clinic practice, our study could serve as proof of concept for developing large-scale personalized AI models for predicting DR progression and pave the way for future studies and randomized clinical trials to further evaluate the effectiveness of AI-driven DR screening and intervention. A foundation model for retinal images, named RETFound, was developed to provide a generalizable solution to improve model performance . The integration of RETFound and DeepDR Plus system in the future may improve the predictive performance and may explore the application in early warning of other retinal diseases.
In summary, we developed DeepDR Plus, a system that could predict personalized risk and time to DR progression, solely based on baseline fundus images. The further real-world study showed that the integration of this system into the clinical workflow of patients could potentially extend the mean screening interval from the current 12 months to 31.97 months (nearly 3 years), with less delayed detection of DR progression. Thus, our DeepDR Plus system has great potential to integrate into clinical and digital workflows, in the hope of promoting individualized intervention strategies for DR management.

Online content

Any methods, additional references, Nature Portfolio reporting summaries, source data, extended data, supplementary information, acknowledgements, peer review information; details of author contributions and competing interests; and statements of data and code availability are available at https://doi.org/10.1038/s41591-023-02702-z.

References

  1. Cheung, N., Mitchell, P. & Wong, T. Y. Diabetic retinopathy. Lancet 376, 124-136 (2010).
  2. Tan, T. -E. & Wong, T. Y. Diabetic retinopathy: looking forward to 2030. Front Endocrinol. 13, 1077669 (2022).
  3. Wong, T. Y., Cheung, C. M. G., Larsen, M., Sharma, S. & Simó, R. Diabetic retinopathy. Nat. Rev. Dis. Prim. 2, 16012 (2016).
  4. Jenkins, A. J. et al. Biomarkers in diabetic retinopathy. Rev. Diabet. Stud. 12, 159-195 (2015).
  5. Stratton, I. M. et al. UKPDS 50: risk factors for incidence and progression of retinopathy in type II diabetes over 6 years from diagnosis. Diabetologia 44, 156-163 (2001).
  6. Solomon, S. D. et al. Diabetic Retinopathy: a position statement by the American Diabetes Association. Diabetes Care 40, 412-418 (2017).
  7. Wong, T. Y. et al. Guidelines on diabetic eye care: the international council of ophthalmology recommendations for screening, follow-up, referral, and treatment based on resource settings. Ophthalmology 125, 1608-1622 (2018).
  8. Flaxel, C. J. et al. Diabetic retinopathy preferred practice pattern. Ophthalmology 127, P66-P145 (2020).
  9. Wang, L. Z. et al. Availability and variability in guidelines on diabetic retinopathy screening in Asian countries. Br. J. Ophthalmol. 101, 1352-1360 (2017).
  10. Modjtahedi, B. S. et al. Two-year incidence of retinal intervention in patients with minimal or no diabetic retinopathy on telemedicine screening. JAMA Ophthalmol. 137, 445-448 (2019).
  11. Gunasekeran, D. V., Ting, D. S. W., Tan, G. S. W. & Wong, T. Y. Artificial intelligence for diabetic retinopathy screening, prediction and management. Curr. Opin. Ophthalmol. 31, 357-365 (2020).
  12. Fundus photographic risk factors for progression of diabetic retinopathy. ETDRS report number 12. Early Treatment Diabetic Retinopathy Study Research Group. Ophthalmology 98, 823-833 (1991).
  13. Lund, S. H. et al. Individualised risk assessment for diabetic retinopathy and optimisation of screening intervals: a scientific approach to reducing healthcare costs. Br. J. Ophthalmol. 100, 683-687 (2016).
  14. Broadbent, D. M. et al. Safety and cost-effectiveness of individualised screening for diabetic retinopathy: the ISDR open-label, equivalence RCT. Diabetologia 64, 56-69 (2021).
  15. Bora, A. et al. Predicting the risk of developing diabetic retinopathy using deep learning. Lancet Digit. Health 3, e10-e19 (2021).
  16. Guan, Z. et al. Artificial intelligence in diabetes management: advancements, opportunities, and challenges. Cell Rep. Med. 4, 101213 (2023).
  17. Ting, D. S. W. et al. Artificial intelligence and deep learning in ophthalmology. Br. J. Ophthalmol. 103, 167-175 (2019).
  18. Ting, D. S. W. et al. Development and validation of a deep learning system for diabetic retinopathy and related eye diseases using retinal images from multiethnic populations with diabetes. JAMA 318, 2211-2223 (2017).
  19. Gulshan, V. et al. Development and validation of a deep learning algorithm for detection of diabetic retinopathy in retinal fundus photographs. JAMA 316, 2402-2410 (2016).
  20. Dai, L. et al. A deep learning system for detecting diabetic retinopathy across the disease spectrum. Nat. Commun. 12, 3242 (2021).
  21. Arcadu, F. et al. Deep learning algorithm predicts diabetic retinopathy progression in individual patients. NPJ Digit. Med. 2, 92 (2019).
  22. Cai, C. et al. Effectiveness of quality of care for patients with type 2 diabetes in China: findings from the Shanghai Integration Model (SIM). Front. Med. 16, 126-138 (2022).
  23. Wilkinson, C. P. et al. Proposed international clinical diabetic retinopathy and diabetic macular edema disease severity scales. Ophthalmology 110, 1677-1682 (2003).
  24. Chen, S. et al. A seven-year study on an integrated hospital-community diabetes management program in Chinese patients with diabetes. Prim. Care Diabetes 12, 231-237 (2018).
  25. Norton, E. C., Miller, M. M. & Kleinman, L. C. Computing adjusted risk ratios and risk differences in Stata. Stata J. 13, 492-509 (2013).
  26. Das, S. K. Confidence interval is more informative than p-value in research. Int. J. Eng. Appl. Sci. Technol. 4, 278-282 (2019).
  27. Raman, R. et al. Incidence and progression of diabetic retinopathy in urban India: Sankara nethralaya-diabetic retinopathy epidemiology and molecular genetics study (SN-DREAMS II), Report 1. Ophthalmic Epidemiol. 24, 294-302 (2017).
  28. Varadarajan, A. V. et al. Deep learning for predicting refractive error from retinal fundus images. Invest. Ophthalmol. Vis. Sci. 59, 2861-2868 (2018).
  29. Yang, D. et al. Assessment of parafoveal diabetic macular ischemia on optical coherence tomography angiography images to predict diabetic retinal disease progression and visual acuity deterioration. JAMA Ophthalmol. 141, 641-649 (2023).
  30. Sun, Z. et al. OCT angiography metrics predict progression of diabetic retinopathy and development of diabetic macular edema: a prospective study. Ophthalmology 126, 1675-1684 (2019).
  31. Cheung, C. Y. et al. A deep-learning system for the assessment of cardiovascular disease risk via the measurement of retinal-vessel calibre. Nat. Biomed. Eng. 5, 498-508 (2021).
  32. CHEUNG, C. Y. L. et al. A new method to measure peripheral retinal vascular caliber over an extended area. Microcirculation 17, 495-503 (2010).
  33. Scanlon, P. H. Screening intervals for diabetic retinopathy and implications for care. Curr. Diab. Rep. 17, 96 (2017).
  34. Henry, K. E. et al. Human-machine teaming is key to AI adoption: clinicians’ experiences with a deployed machine learning system. NPJ Digit. Med. 5, 97 (2022).
  35. Dixon, R. F. et al. A virtual type 2 diabetes clinic using continuous glucose monitoring and endocrinology visits. J. Diabetes Sci. Technol. 14, 908-911 (2020).
  36. Downing, J., Bollyky, J. & Schneider, J. Use of a connected glucose meter and certified diabetes educator coaching to decrease the likelihood of abnormal blood glucose excursions: the livongo for diabetes program. J. Med Internet Res. 19, e234 (2017).
  37. Poplin, R. et al. Prediction of cardiovascular risk factors from retinal fundus photographs via deep learning. Nat. Biomed. Eng. 2, 158-164 (2018).
  38. Cheung, C. Y.-L. et al. Retinal vascular geometry and 6 year incidence and progression of diabetic retinopathy. Diabetologia 60, 1770-1781 (2017).
  39. Lu, Y. et al. Evaluation of automatically quantified foveal avascular zone metrics for diagnosis of diabetic retinopathy using optical coherence tomography angiography. Invest. Ophthalmol. Vis. Sci. 59, 2212-2221 (2018).
  40. Sawides, L. et al. Alterations to the foveal cone mosaic of diabetic patients. Invest. Ophthalmol. Vis. Sci. 58, 3395-3403 (2017).
  41. Cheung, C. Y., Ikram, M. K., Klein, R. & Wong, T. Y. The clinical implications of recent studies on the structure and function of the retinal microvasculature in diabetes. Diabetologia 58, 871-885 (2015).
  42. Klein, R. et al. Retinal vascular abnormalities in persons with type 1 diabetes: the Wisconsin Epidemiologic Study of Diabetic Retinopathy: XVIII. Ophthalmology 110, 2118-2125 (2003).
  43. Klein, R. et al. The relation of retinal vessel caliber to the incidence and progressionof diabetic retinopathy: Xix: The Wisconsin Epidemiologic Study of Diabetic Retinopathy. Arch. Ophthalmol. 122, 76-83 (2004).
  44. Oshitari, T. The pathogenesis and therapeutic approaches of diabetic neuropathy in the retina. Int. J. Mol. Sci. 22, 9050 (2021).
  45. Traversi, C. et al. Fractal analysis of fluoroangiographic patterns in anterior ischaemic optic neuropathy and optic neuritis: a pilot study. Clin. Exp. Ophthalmol. 36, 323-328 (2008).
  46. Simó, R. & Hernández, C. European Consortium for the Early Treatment of Diabetic Retinopathy (EUROCONDOR) Neurodegeneration in the diabetic eye: new insights and therapeutic perspectives. Trends Endocrinol. Metab. 25, 23-33 (2014).
  47. Zafar, S., Sachdeva, M., Frankfort, B. J. & Channa, R. Retinal neurodegeneration as an early manifestation of diabetic eye disease and potential neuroprotective therapies. Curr. Diab. Rep. 19, 17 (2019).
  48. Sohn, E. H. et al. Retinal neurodegeneration may precede microvascular changes characteristic of diabetic retinopathy in diabetes mellitus. Proc. Natl Acad. Sci. USA 113, E2655-E2664 (2016).
  49. Wong, T. Y. & Sabanayagam, C. The war on diabetic retinopathy: where are we now? Asia Pac. J. Ophthalmol. 8, 448-456 (2019).
  50. Liu, H. et al. Economic evaluation of combined population-based screening for multiple blindness-causing eye diseases in China: a cost-effectiveness analysis. Lancet Glob. Health 11, e456-e465 (2023).
  51. Yang, Z., Tan, T.-E., Shao, Y., Wong, T. Y. & Li, X. Classification of diabetic retinopathy: past, present and future. Front. Endocrinol. 13, 1079217 (2022).
  52. Zhou, Y. et al. A foundation model for generalizable disease detection from retinal images. Nature 622, 156-163 (2023).
Publisher’s note Springer Nature remains neutral with regard to jurisdictional claims in published maps and institutional affiliations.
Open Access This article is licensed under a Creative Commons Attribution 4.0 International License, which permits use, sharing, adaptation, distribution and reproduction in any medium or format, as long as you give appropriate credit to the original author(s) and the source, provide a link to the Creative Commons license, and indicate if changes were made. The images or other third party material in this article are included in the article’s Creative Commons license, unless indicated otherwise in a credit line to the material. If material is not included in the article’s Creative Commons license and your intended use is not permitted by statutory regulation or exceeds the permitted use, you will need to obtain permission directly from the copyright holder. To view a copy of this license, visit http://creativecommons. org/licenses/by/4.0/.
© The Author(s) 2024
Capital Medical University, Beijing Ophthalmology and Visual Science Key Laboratory, Beijing, China. Center for Excellence in Molecular Science, Chinese Academy of Sciences, Shanghai, China. School of Biomedical Engineering, Shanghai Tech University, Shanghai, China. Shanghai United Imaging Intelligence, Shanghai, China. Shanghai Clinical Research and Trial Center, Shanghai, China. Ophthalmology and Visual Sciences Academic Clinical Program, Duke-NUS Medical School, Singapore, Singapore. Centre for Innovation and Precision Eye Health; and Department of Ophthalmology, Yong Loo Lin School of Medicine, National University of Singapore, Singapore, Singapore. Tsinghua Medicine, Beijing Tsinghua Changgung Hospital, Tsinghua University, Beijing, China. These authors contributed equally: Ling Dai, Bin Sheng, Tingli Chen, Qiang Wu, Ruhan Liu, Huating Li. These authors jointly supervised this work: Bin Sheng, Carol Y. Cheung, Gavin Tan Siew Wei, Yih-Chung Tham, Ching-Yu Cheng, Huating Li, Tien Yin Wong, Weiping Jia.

Methods

Ethical approval

This study was approved by the Ethics Committee of Shanghai Sixth People’s Hospital and conducted in accordance with the Declaration of Helsinki. Informed consent was obtained from all participants. The study was registered on the Chinese Clinical Trial Registry (ChiCTR2300069400).

Data acquisition

To pretrain the DeepDR Plus system to make it learn features of DR, 717,308 fundus images of 179,327 individuals with diabetes from the Shanghai Integration Model and SDPP were used. The SDPP is a community-based, longitudinal cohort comprising 79,284 participants who underwent physical examinations between December 2015 and November 2022 in Huadong Sanatorium and Shanghai Sixth People’s Hospital. At baseline, data on demographic information, anthropometric indices, biochemical measurements and retinal images were recorded. After the baseline survey, 25,231 participants completed annual follow-up visits for at least 4 years.
To develop the DeepDR Plus system for predicting DR progression, fundus image data and clinical metadata were collected from the DRPS cohort. The DRPS cohort consists of two longitudinal cohorts. The dataset of the first cohort was extracted from the Hospital Information System of the Department of Endocrinology and Metabolism at Shanghai Sixth People’s Hospital and contained 15,587 patients with diabetes, who underwent annual health checks during a 5-year period. The second cohort enrolled 3,513 participants with diabetes at baseline from Huadong Sanatorium, and the cohort participants completed 5-year follow-up annually. Data on demographic information, anthropometric indices, biochemical measurements and retinal images were recorded at baseline and each visit. The diagnoses of DR grading and DME were based on the macular and optic disc-centered fundus images of each eye at baseline and follow-up visits.
We enrolled eight independent cohorts to serve as external validations. The ECHM (external dataset 1) is a community-based retrospective cohort study of participants who received comprehensive physical examination in Wuxi between 2006 and 2016. We enrolled 2,141 participants with diabetes who underwent annual examinations for 5 years in the ECHM. The WTHM cohort (external dataset 2) is a retrospective longitudinal cohort containing 971 participants with diabetes who received routine physical examinations at the physical examination center of the Geriatric Department of Tongji Hospital between 2010 and 2021. The NDSP cohort (external dataset 3) was a prospective observational study conducted in Nicheng, a large community in Shanghai, and the study was aimed at screening and following the progression of metabolic disorders and cardiovascular diseases among the older population of the entire area. The baseline survey was conducted in 2013, and 1,194 participants with diabetes completed the follow-up survey in 2018. The PUDM cohort (external dataset 5) was a clinic-based retrospective cohort, containing 307 participants with diabetes from the Peking Union Medical College Hospital, who received annual health checks between 2010 and 2016. The CUHK-STDR cohort (external dataset 4) was a prospective observational study involving 337 patients with diabetes . Participants were recruited from CUHK Eye Centre in Hong Kong between July 2015 and November 2016 and had been consecutively followed up for at least 5 years. The SEED cohort (external dataset 6) is a multiethnic longitudinal population-based study including Singaporean adults of Malay, Indian and Chinese descent . In total, 1,699 individuals with diabetes from the SEED cohort with 5-year follow-ups were enrolled for external validation. The SiDRP (external dataset 7) was a retrospective longitudinal cohort covering all 18 primary care clinics across Singapore from 2010 to 2015. It provided ‘real-time’ assessments of DR photographs by a centralized team of trained and accredited graders supported by a tele-ophthalmology information technology infrastructure . A total
of 3,284 individuals with diabetes from the cohort were enrolled for external validation. The BJHC (external dataset 8) is a community-based prospective study. In total, 835 patients with diabetes from the BJHC were included in this study. Baseline examinations were performed in the period between 2014 and 2016, and follow-up examinations were conducted between 2019 and 2020. In all external cohorts, two retinal photographs (macular and optic disc-centered) were captured for each eye at baseline and follow-up visits.
For the real-world study within a community-based prospective cohort study of Chinese adults, 5,214 participants were screened in March 2017, with participants without a self-reported history of diabetes undergoing a 75 g oral glucose tolerance test at baseline. Details of biochemical measurements and anthropometric data collection included body weight, waist circumference, blood pressure, lipid profile and related factors of cardiometabolic diseases. There were 2,383 participants with diabetes (non-DR or mild NPDR) enrolled in the final cohort according to World Health Organization 2019 criteria , with 603 participants in the IM group and 1,780 participants in the non-IM group. Participants in the IM group were provided regular clinical and metabolic measurements, advised by specialists in comprehensive hospitals, and received lifestyle guidance and peer support at community health service centers . Participants in this program were followed up annually for 5 years. In March 2022,538 participants in the IM group and 1,647 participants in the non-IM group completed the follow-up visit.

Diagnostic criteria

Diabetes is diagnosed by a self-reported history of diabetes, fasting plasma glucose -h plasma glucose and/ or HbA1c . The diagnosis and classification of DR and DME were evaluated according to the ICDRDSS . The progression of DR was defined as the first deterioration of DR grades or new onset of DME, based on ICDRDSS during the follow-up.

Image quality control and grading procedure

For the DRPS, ECHM, WTHM, NDSP, PUDM, BJHC and Chinese real-world study datasets, the retinal fundus images were captured using a variety of standard fundus cameras, including Topcon TRC-NW6 (Topcon), Canon CR1-Mark II (Canon) and Optos camera (Optos). All fundus images were read by a centered reading group consisting of 12 certified ophthalmologists. Original retinal images were uploaded to an online platform , and the images of each eye were assigned separately to 2 authorized ophthalmologists. They labeled the images using the online reading platform and gave the graded diagnosis of DR. The third ophthalmologist who served as the senior supervisor confirmed or corrected when the diagnostic results were contradictory. The final grading result was dependent on the consistency among these 3 ophthalmologists. The grading procedures for the CUHK-STDR , SEED , SiDRP and SN-DREAMS datasets are reported in previous publications. Ungradable images of all the datasets were excluded from the study.

Model development and training

We developed the DeepDR Plus system to predict DR progression. The DeepDR Plus system contains three models for predicting DR progression: the metadata model, the fundus model and the combined model. The risk and time to DR progression are estimated based on baseline inputs. The fundus model has a feature extractor to extract features from fundus images (details in ‘Model pretraining’) and a predictor to generate fundus score by estimating the survival time given the input data (details in ‘Model evaluation’). The fundus model utilizes the ResNet-50 as the backbone to extract features from the fundus images, and a soft-attention layer is used to select the most informative features. The metadata model inputs the metadata to produce survival predictions. The output of the fundus model (fundus score) combined with metadata is used as the input of the combined model. Metadata
includes age, gender, smoking status, duration of diabetes, baseline DR level, body mass index, glycated HbA1c, systolic blood pressure, diastolic blood pressure, triglycerides, low-density lipoprotein cholesterol and high-density lipoprotein cholesterol. We also developed and compared the metadata model, the fundus model and the combined model for predicting DR progression in three subgroups. The three subgroups included diabetes with non-DR to DR (subgroup 1), non-referable DR to referable DR (subgroup 2) and non-VTDR to VTDR (subgroup3).

DR progression model

Considering that most of the longitudinal datasets in this study have a fixed follow-up exam period of about 1 year, the longitudinal dataset suffers from right censoring and interval censoring. The aim of the DR progression model is to estimate the survival function. To achieve this goal, we modeled the survival distribution of each individual object as a fixed-size mixture of Weibull distributions. The parameters from each Weibull distribution were randomly sampled and fixed. We used a deep learning network to estimate the weights for each distribution in the mixture model (a fixed-size mixture of Weibull distributions). During training, the parameters of the deep learning network were optimized by adjusting their values to maximize the likelihood, which represents the probability of the observed training data given by the DeepDR Plus system. The development of these algorithms is described in detail below (Extended Data Fig. 7).
Problem definition. We have a longitudinal dataset containing multiple objects , where each object . Here, represents the feature vector (including image features and/or metadata at baseline). indicates whether the record is censored. In particular, for the uncensored records, and otherwise. represents the time to the last exam before the event of interest. If the event is observed, then represents the time until that event occurred. However, if the event is not observed, then is equal to . We used a mixture of Weibull distributions to model the survival function of each participant. As the Weibull distribution is only valid for positive reals, it is suitable for survival analysis. Besides, the Weibull distribution has an analytic solution for the cumulative distribution function, which enables the use of gradient-based optimization for maximum likelihood estimation in our research .
Our goal is to estimate a set of parameters and weights for the mixture model given the input. The survival function of each patient is defined as follows:
where is the probability distribution function of the Weibull distribution, and and are drawn from the Gaussian distribution and are prior parameters determined empirically. is a set of parameters for the mixture distribution containing multiple parameters .
The cumulative distribution function of the Weibull distribution is given by
The input feature matrix (including fundus images and clinical metadata) /is passed through the deep learning network to determine all the parameters .
We used a maximum likelihood estimation to estimate the parameters of the deep learning network. For uncensored data, the log-likelihood function can be written by
Similarly, for censored data the log-likelihood function can be given by
And we define the loss function as
where is a hyperparameter that balances the weight of censored data and uncensored data.

Model pretraining

We used Momentum Contrast (MoCo, v2) , which leverages self-supervised learning to produce a pretrained feature extractor. In this process, the feature extractor is trained on a large dataset of fundus images without the need for manual annotations. MoCo v2 uses a momentum-based contrastive learning framework, where the pretrain framework in the fundus model learns to create positive and negative pairs of image patches from the same image . We laid out the experimental setup in our pretrain process. We predominantly followed the experimental settings of MoCo v2, but adopted different approaches in data augmentation and certain hyperparameter selections. We used the -nearest neighbors monitor as a tool for self-supervised evaluation once per epoch. For data augmentation, our augmentation method included random image compression, random blur, brightness jitter, contrast jitter, random gamma transform, random Gaussian noise and random rotation. Two crops were taken for each fundus image in each iteration. For hyperparameter selections, we chose ResNet-50 as the encoder and stochastic gradient descent (SGD) as the optimizer. The input image resolution was pixels, the batch size was set to 256 , and the MoCo v 2 model was trained for 800 epochs. Grid search was used to obtain the optimal hyperparameters as a learning rate , weight decay , SGD momentum and temperature . The encoder momentum coefficient was and it was increased to 1 with a cosine schedule. We also conducted an ablation experiment to evaluate the predictive performance of the fundus model by pretraining with MoCo v2. The results showed that incorporating MoCo v2 into the training process could enhance the predictive performance of the fundus model (Supplementary Table 7).

Fundus model

For tasks of predicting DR progression, we used the pretrained ResNet-50 as the feature extractor. The self-attention layer was used in our network to emphasize the important parts in fundus features. Specifically, we added a standard dot-product self-attention layer to calculate the weight of each pixel in the feature map produced by the block3 of ResNet-50. The attention layer outputs the feature map with the same size as the input feature map to ensure it can be inserted into ResNet-50 seamlessly. In the interpretation stage, the attention feature map was reshaped to and subsequently resized to for illustration. In addition, a three-layer multilayer perceptron (MLP) as a predictor was used to estimate the weights of the fixed-size mixture
of Weibull distributions taking as input the features generated by the pretrained ResNet-50 model.
The fundus model was then trained on the training dataset using an SGD optimizer. In this study, we used grid search to find the optimal values and other hyperparameters. The fundus model was trained by back-propagation of errors in batches of 32 images resized to pixels for 50 epochs with a learning rate of . Data augmentation strategies used here were the same as those used during MoCo v2-based pretraining (details in ‘Model pretraining’).

Metadata model and combined model

We used a three-layer MLP in the metadata model and combined model. The metadata model takes the metadata as input and outputs the predicted time-to-event for the individual participant. For the combined model, the predicted time-to-event from the fundus model is added as an extra feature for the three-layer MLP. The metadata model, fundus model and combined model share the same loss function during the model development.

Model evaluation

To estimate the time of the target event, we first calculated the survival function using the baseline input, then we took the predicted time at the maximum point of the density function as the predicted time to event. Using this predicted time-to-event as the risk score, we evaluated the performance of the model in predicting whether the given participant would have the target disease within 1,2,3,4, or 5 years, using C -index and IBS. According to the scores of the baseline visit obtained from the fundus model, the participants were triaged into two groups: low and high risk according to the threshold defined by the upper and lower half of the predicted scores in groups of participants with different DR progression outcomes. Kaplan-Meier curves were constructed for the risk groups, and the significance of differences between group curves was computed using the log-rank test. Time-dependent ROC curves were used to quantify model performance on validation sets at the time of interest. ROC curves were constructed at a landmark time from predicted risk scores of relative participants using the DeepDR Plus system.

Interpretation of AI predictions

A visualization tool is needed that would enable clinicians to understand important clinical visual features in fundus images. To this end, following Google’s approach , we first produced individual attention maps as visual explanations by inserting a self-attention layer into the architecture of the fundus model (details in ‘Fundus model’). The most predictive features captured by the DeepDR Plus system were highlighted for each individual image. To generate mean attention maps, all individual fundus images and individual attention maps were aligned based on their optic disc positions. That is, all fundus images and attention maps were translated to share the same optic disc position. Subsequently, final mean attention maps were obtained by averaging the ‘registered’ individual attention weights across multiple images. What’s more, we used the SHAP Python package to illustrate the importance of clinical features as well as the fundus score (that is, predicted time-to-event by fundus model) involved in the combined model. SHAP stands for Shapley Additive exPlanations . The SHAP values of each feature represented their contribution to the model prediction. A positive SHAP value indicates the positive feature attribution for the prediction of DR progression, whereas a negative SHAP value indicates the negative feature attribution for the prediction of DR progression. Feature importance was calculated by averaging the absolute SHAP values of each feature.

Reporting summary

Further information on research design is available in the Nature Portfolio Reporting Summary linked to this article.

Data availability

Individual-level patient data can be accessible with the consent of the data management committee from institutions and are not publicly available. Requests for the non-profit use of the fundus images and related clinical information should be sent to W.J. or T.Y.W. The data management committee will then review all the requests and grant (if successful). A formal data transfer agreement will be required upon approval. Generally, all these requests for access to the data will be responded to within 1 month. All data shared will be de-identified. For the reproduction of our algorithm code, we have also deposited a minimum dataset at Zenodo (https://zenodo.org/records/10076339), which is publicly available for scientific research and non-commercial use. Source data are provided with this paper.

Code availability

The code used in the current study for developing the algorithm is provided at https://github.com/drpredict/DeepDR_Plus. Python version 3.9.0 was used for all statistical analvses in this study. The following third-party Python packages were used: Pytorch version 2.0.1 was used to build the DL models; Scikit-earn version 1.3.0 was used for calculating AUC. NumPy version 1.25.2 used for calculating C-index and Brier score. Lifelines version 0.27.7 was used for survival analysis.

References

  1. Majithia, S. et al. Cohort profile: The Singapore Epidemiology of Eye Diseases study (SEED). Int. J. Epidemiol. 50, 41-52 (2021).
  2. Nguyen, H. V. et al. Cost-effectiveness of a National Telemedicine Diabetic Retinopathy Screening Program in Singapore. Ophthalmology 123, 2571-2580 (2016).
  3. WHO Consultation. Definition, diagnosis and classification of diabetes mellitus and its complications (1999).
  4. ElSayed, N. A. et al. 2. Classification and diagnosis of diabetes: Standards of Care in Diabetes-2023. Diabetes Care 46, S19-S40 (2023).
  5. Kaniadakis, G. et al. The -statistics approach to epidemiology. Sci. Rep. 10, 19949 (2020).
  6. He, K., Fan, H., Wu, Y., Xie, S. & Girshick, R. Momentum contrast for unsupervised visual representation learning. in Proceedings of the IEEE/CVF conference on computer vision and pattern recognition 9729-9738 (2020).
  7. Chen, X., Fan, H., Girshick, R. & He, K. Improved baselines with momentum contrastive learning. arXiv preprint arXiv:2003.04297 (2020).
  8. Vaswani, A. et al. Attention is all you need. in Advances in neural information processing systems 5998-6008 (2017).
  9. Zhao, H., Jia, J. & Koltun, V. Exploring self-attention for image recognition. in Proceedings of the IEEE/CVF conference on computer vision and pattern recognition 10076-10085 (2020).
  10. Lundberg, S. M. et al. Explainable machine-learning predictions for the prevention of hypoxaemia during surgery. Nat. Biomed. Eng. 2, 749-760 (2018).
  11. Lundberg, S. M. & Lee, S. -I. A unified approach to interpreting model predictions. in Advances in Neural Information Processing Systems 30 (2017).

Acknowledgements

We thank all the investigators and participants in this study. This study was supported by the National Key Research and Development Program of China (2022YFA1004804) to W.J. and H.L.; the Shanghai Municipal Key Clinical Specialty, Shanghai Research Center for Endocrine and Metabolic Diseases (2022ZZO1OO2) and the Chinese Academy of Engineering (2022-XY-08) to W.J.; the National Key R & D Program of China (2022YFC2502800) and National Natural Science Fund of China (8238810007) to T.Y.W.; the Excellent Young Scientists Fund of NSFC (82022012), General Fund of NSFC (81870598),
Innovative research team of high-level local universities in Shanghai (SHSMU-ZDCX2O2127OO) to H.L.; the General Program of NSFC (62272298), the National Key Research and Development Program of China (2022YFC2407000), the Interdisciplinary Program of Shanghai Jiao Tong University (YG2023LC11 and YG2022ZD007), National Natural Science Foundation of China (62272298 and 62077037), the College-level Project Fund of Shanghai Jiao Tong University Affiliated Sixth People’s Hospital (ynlc201909) and the Medical-industrial Cross-fund of Shanghai Jiao Tong University (YG2O22QNO89) to B.S.; the National Natural Science Foundation of China (82100879) to L.W.; the Clinical Special Program of Shanghai Municipal Health Commission (20224044) and three-year action plan to strengthen the construction of public health system in Shanghai (GWVI-11.1-28) to T.C.

Author contributions

W.J., H.L., B.S. and T.Y.W. conceived and supervised the project. L.D. designed the deep learning algorithm and the computational framework. H.L., B.S., T.C., Q.W., R.L. and L.D. designed the study and contributed to the initial drafting of the manuscript. C.C., L.W., D.Y., H.H., Y.L., X.W., Z.G., S.Y., T.L., Z.T., A.R., H. Che, H. Chen, Y.Z., J.S., S.H., C.W., S.L., D.L., J.L., Z.W., Z.M., J.S., X.H., C.D., L.R., F.L., M.C., T.C.Q., R.S., R.R., X.S., Y.X.W., J.W., H.J., M.G., D.S., X.Y., R.D. and C.Z. collected and organized data. Z.G., S.Y., T.L., J.S., S.H., Z.W. and Z.M. performed the statistical analysis. L.D. takes responsibility for the integrity of the data and the accuracy of the data analysis. C. Y. Cheung, G.S.W.T.,
Y.C.T. and C. Y. Cheng provided critical comments and reviewed the manuscript. All authors discussed the results and approved the final version before submission.

Competing interests

The authors declare no competing interests.

Additional information

Extended data is available for this paper at
https://doi.org/10.1038/s41591-023-02702-z.
Supplementary information The online version contains
supplementary material available at
https://doi.org/10.1038/s41591-023-02702-z.
Correspondence and requests for materials should be addressed to Bin Sheng, Huating Li, Tien Yin Wong or Weiping Jia.
Peer review information Nature Medicine thanks Tae Keun Yoo and the other, anonymous, reviewer(s) for their contribution to the peer review of this work. Primary Handling Editor: Lorenzo Righetto, in collaboration with the Nature Medicine team.
Reprints and permissions information is available at www.nature.com/reprints.
Extended Data Fig. 1| Datasets flowchart. DRPS, Diabetic Retinopathy Progression Study; ECHM, The Eastern China Health Management; WTHM, Wuhan Tongji Health Management; NDSP, Nicheng Diabetes Screening Project; CUHK-STDR, The Chinese University of Hong Kong-Sight-Threatening Diabetic
Retinopathy; PUDM: Peking Union Diabetes Management; SEED, the Singapore Epidemiology of Eye Diseases study; SiDRP, the Singapore National Diabetic Retinopathy Screening Program; BJHC, Beijing Healthcare Cohort Study.


Extended Data Fig. 4 | Internal and external validation of the DeepDR Plus system in the prediction of the progression from non-referable DR to
referable DR. a, Integrated Brier score (left) showing overall fit-lower is better and C-index (right) measuring model risk discrimination-higher is better-for various time points. b, Kaplan-Meier plots for the prediction of the progression from non-referable DR to referable DR. One-sided log-rank test was used for the
comparison between the low- and high-risk groups. The P values on internal test set and external validation dataset -1 and 2 are and , respectively. c, Prediction of the progression from non-referable DR to referable DR using time-dependent ROC curves. Shaded areas in and are 95% CIs. Areas under ROC curves are presented as mean values (lower bound of , upper bound of ).
Extended Data Fig. 5 | Internal and external validation of the DeepDR Plus system in the prediction of the progression from non-vision-threatening DR to vision-threatening DR. a, Integrated Brier score (left) showing overall fit-lower is better and C -index (right) measuring model risk discriminationhigher is better-for various time points.b, Kaplan-Meier plots for the prediction of the progression from non-vision-threatening DR to vision-threatening DR. One-sided log-rank test was used for the comparison between the low- and high-
risk groups. The values on internal test set and external validation dataset-1 and 2 are and , respectively. c, Prediction of the progression from non-vision-threatening DR to vision-threatening DR using time-dependent ROC curves. Shaded areas in and are CIs. Areas under ROC curves are presented as mean values (lower bound of 95% CI, upper bound of 95% CI).
Extended Data Fig. 6 | The real-world study to assess the clinical outcome by integration with DeepDR Plus system. a, Flowchart of the study and actual DR progression rate among high-risk and low-risk evaluated by the Fundus and Metadata models in IM group and Non-IM group.b, Waterfall plot of predicted time to DR progression of participants in the real-world study by fundus model
(DeepDR Plus). The waterfall plot displays the predicted time to DR progression of all participants in the real-world study by the fundus model. The individualized screening interval was set at an annual time point from baseline, which was just the year after the predicted patient-specific time to DR progression by the fundus model.
Extended Data Fig. 7| Illustration of the model structure of DeepDR Plus system. There are three models (fundus model, metadata model, and combined model) in the DeepDR Plus system, which can support different types of inputs. The fundus model has a fundus feature extractor and a predictor to generate a predicted time to progression of DR and fundus score. The fundus feature extractor is pretrained using Momentum Contrast (MoCov2) to generate
high-level feature vectors, while the predictor estimates the survival time in a fixed-size mixture of Weibull distributions based on the fundus feature vectors to generate the fundus score. The metadata and combined models share the same structure but differ in their inputs compared to the fundus model. The metadata model takes metadata as inputs, while the combined model takes both metadata and fundus score as inputs.
Extended Data Table 1 | The distribution of diabetic retinopathy grades at baseline and the onset of the first DR grade deterioration in the developmental and validation datasets
Cohorts Number of patients with diabetes Number of eyes At baseline At the onset of the first DR-grade deterioration*
non-DR mild NPDR moderate NPDR severe NPDR PDR non-DR mild NPDR moderate NPDR severe NPDR PDR
Developmental dataset Training dataset 17,190 34,380 30,554 1,074 1,597 852 303 28,582 1,644 2,091 1,382 681
Internal test set 1,910 3,820 3,552 84 122 38 24 3,322 174 216 58 50
ECHM 2,141 4,282 3,908 128 160 44 42 3,652 228 250 82 70
WTHM 971 1,942 1,830 42 52 14 4 1,730 90 83 25 14
NDSP 1,194 2,388 2,220 88 74 2 4 2,176 118 80 10 4
External validation datasets CUHK-ST DR 337 591 297 102 179 13 0 183 216 179 13 0
PUDM 307 614 552 16 30 16 0 541 19 34 12 8
SEED 1,699 3,398 2,918 310 123 7 40 2,849 334 148 9 58
SiDRP 3,284 6,568 6,343 138 66 13 8 6,177 286 83 14 8
BJHC 835 1,670 1,666 4 0 0 0 1,629 24 17 0 0
*If there aren’t DR grade deteriorations during follow-up, these columns refer to DR grades at the end of follow-up.
Extended Data Table 2 | Performance of the prediction model of DR progression based on metadata model, fundus model, and combined model in internal and external validation datasets
Cohort Model Any DR progression Subgroup 1 Subgroup 2 Subgroup 3
C-index (95%CI) IBS (95%CI) C-index (95%CI) IBS (95%CI) C-index (95%CI) IBS (95%CI) C-index (95%CI) IBS (95%CI)
Internal dataset metadata 0.696 (0.668, 0.725) 0.340 (0.334, 0.347) 0.705 (0.672, 0.736) 0.303 (0.297, 0.310) 0.700 (0.658, 0.741) 0.261 (0.255, 0.268) 0.711 (0.637, 0.778) 0.328 (0.322, 0.335)
fundus 0.823 (0.796, 0.850) 0.161 (0.156, 0.166) 0.826 (0.797, 0.851) 0.189 (0.184, 0.194) 0.820 (0.785, 0.853) 0.153 (0.147, 0.159) 0.824 (0.758, 0.880) 0.180 (0.175, 0.185)
combined 0.833 (0.807, 0.857) 0.152 (0.147, 0.157) 0.835 (0.810, 0.859) 0.167 (0.162, 0.172) 0.838 (0.806, 0.869) 0.145 (0.141, 0.150) 0.852 (0.787, 0.909) 0.164 (0.160, 0.169)
metadata 0.652 (0.623, 0.680) 0.301 (0.295, 0.308) 0.664 (0.634, 0.694) 0.381 (0.375, 0.387) 0.679 (0.639, 0.720) 0.279 (0.273, 0.284) 0.734 (0.677, 0.791) 0.270 (0.265, 0.276)
ECHM fundus 0.802 (0.778, 0.827) 0.158 (0.153, 0.162) 0.820 (0.793, 0.846) 0.157 (0.152, 0.162) 0.821 (0.792, 0.852) 0.207 (0.202, 0.213) 0.806 (0.748, 0.857) 0.188 (0.184, 0.193)
combined 0.811 (0.787, 0.834) 0.223 (0.218, 0.228) 0.824 (0.797, 0.848) 0.212 (0.206, 0.217) 0.826 (0.794, 0.858) 0.124 (0.120, 0.128) 0.830 (0.782, 0.871) 0.203 (0.199, 0.209)
metadata 0.652 (0.607, 0.695) 0.381 (0.373, 0.390) 0.672 (0.617, 0.726) 0.286 (0.277, 0.293) 0.688 (0.613, 0.758) 0.341 (0.328, 0.354) 0.671 (0.572, 0.769) 0.373 (0.364, 0.383)
WTHM fundus 0.791 (0.748, 0.832) 0.164 (0.157, 0.170) 0.814 (0.773, 0.854) 0.188 (0.181, 0.195) 0.794 (0.735, 0.854) 0.240 (0.232, 0.248) 0.802 (0.705, 0.888) 0.181 (0.173, 0.190)
combined 0.806 (0.762, 0.844) 0.154 (0.147, 0.161) 0.809 (0.764, 0.853) 0.224 (0.216, 0.232) 0.801 (0.739, 0.857) 0.198 (0.188, 0.208) 0.819 (0.720, 0.907) 0.141 (0.134, 0.148)
metadata 0.698 (0.625, 0.768) 0.339 (0.330, 0.347) 0.710 (0.629, 0.790) 0.323 (0.314, 0.332) 0.748 (0.611, 0.862) 0.288 (0.280, 0.295) 0.732 (0.551, 0.897) 0.241 (0.234, 0.248)
NDSP fundus 0.800 (0.737, 0.855) 0.197 (0.190, 0.204) 0.846 (0.798, 0.886) 0.191 (0.185, 0.197) 0.796 (0.674, 0.909) 0.220 (0.213, 0.227) 0.818 (0.684, 0.951) 0.207 (0.200, 0.214)
combined 0.814 (0.752, 0.866) 0.171 (0.166, 0.178) 0.852 (0.789, 0.904) 0.177 (0.171, 0.184) 0.802 (0.690, 0.904) 0.198 (0.191, 0.204) 0.822 (0.653, 0.956) 0.139 (0.133, 0.145)
CUHKSTDR metadata 0.650 (0.602, 0.699) 0.305 (0.285, 0.326) 0.621 (0.574, 0.669) 0.402 (0.366, 0.439)
fundus 0.789 (0.752, 0.826) 0.241 (0.227, 0.256) 0.754 (0.711, 0.793) 0.197 (0.177, 0.218)
combined 0.793 (0.755, 0.827) 0.213 (0.200, 0.228) 0.759 (0.715, 0.800) 0.207 (0.188, 0.226)
metadata 0.680 (0.568, 0.785) 0.372 (0.355, 0.389) 0.668 (0.474, 0.826) 0.299 (0.284, 0.313)
PUDM fundus 0.800 (0.697, 0.887) 0.211 (0.192, 0.231) 0.802 (0.672, 0.921) 0.230 (0.213, 0.248)
combined 0.808 (0.708, 0.895) 0.240 (0.217, 0.263) 0.802 (0.661, 0.920) 0.262 (0.247, 0.277)
metadata 0.707 (0.672, 0.742) 0.277 (0.270, 0.283) 0.743 (0.702, 0.782) 0.209 (0.202, 0.215) 0.708 (0.646, 0.762) 0.259 (0.253, 0.266) 0.716 (0.612, 0.814) 0.298 (0.291, 0.305)
SEED fundus 0.786 (0.756, 0.814) 0.200 (0.195, 0.206) 0.800 (0.766, 0.833) 0.210 (0.204, 0.216) 0.813 (0.769, 0.855) 0.173 (0.167, 0.178) 0.817 (0.745, 0.885) 0.223 (0.217, 0.228)
combined 0.792 (0.760, 0.821) 0.198 (0.192, 0.203) 0.804 (0.770, 0.836) 0.187 (0.181, 0.192) 0.816 (0.768, 0.861) 0.208 (0.202, 0.214) 0.819 (0.737, 0.885) 0.132 (0.128, 0.138)
metadata 0.613 (0.572, 0.656) 0.370 (0.364, 0.376) 0.585 (0.541, 0.627) 0.383 (0.376, 0.389) 0.523 (0.404, 0.642) 0.473 (0.466, 0.480)
SiDRP fundus 0.800 (0.771, 0.831) 0.172 (0.168, 0.176) 0.801 (0.769, 0.833) 0.164 (0.160, 0.168) 0.769 (0.668, 0.868) 0.209 (0.205, 0.213)
combined 0.804 (0.772, 0.834) 0.219 (0.215, 0.223) 0.806 (0.774, 0.837) 0.204 (0.200, 0.208) 0.783 (0.686, 0.874) 0.237 (0.233, 0.241)
metadata 0.704 (0.607, 0.792) 0.306 (0.296, 0.316) 0.712 (0.637, 0.779) 0.258 (0.249, 0.266)
BJHC fundus 0.802 (0.736, 0.865) 0.197 (0.189, 0.205) 0.797 (0.709, 0.874) 0.220 (0.212, 0.228)
combined 0.811 (0.753, 0.865) 0.203 (0.195, 0.211) 0.803 (0.720, 0.879) 0.198 (0.190, 0.205)

natureportfolio

Bin Sheng, Huating Li, Tien Yin Wong,
Corresponding author(s): Weiping Jia
Last updated by author(s): Nov 6, 2023

Reporting Summary

Nature Portfolio wishes to improve the reproducibility of the work that we publish. This form provides structure for consistency and transparency in reporting. For further information on Nature Portfolio policies, see our Editorial Policies and the Editorial Policy Checklist.

Statistics

For all statistical analyses, confirm that the following items are present in the figure legend, table legend, main text, or Methods section.

Confirmed

The exact sample size for each experimental group/condition, given as a discrete number and unit of measurement
A statement on whether measurements were taken from distinct samples or whether the same sample was measured repeatedly
The statistical test(s) used AND whether they are one- or two-sided
Only common tests should be described solely by name; describe more complex techniques in the Methods section.
A description of all covariates tested
A description of any assumptions or corrections, such as tests of normality and adjustment for multiple comparisons
A full description of the statistical parameters including central tendency (e.g. means) or other basic estimates (e.g. regression coefficient) AND variation (e.g. standard deviation) or associated estimates of uncertainty (e.g. confidence intervals)
For null hypothesis testing, the test statistic (e.g. F, ) with confidence intervals, effect sizes, degrees of freedom and value noted Give values as exact values whenever suitable.
For Bayesian analysis, information on the choice of priors and Markov chain Monte Carlo settings
For hierarchical and complex designs, identification of the appropriate level for tests and full reporting of outcomes
Estimates of effect sizes (e.g. Cohen’s , Pearson’s ), indicating how they were calculated
Our web collection on statistics for biologists contains articles on many of the points above.

Software and code

Policy information about availability of computer code
Data collection
No special software was used for data collection.
Data analysis
Python version 3.9.0 (Python Software Foundation, Delaware, United States) was used for all statistical analyses in this study. The following third-party python packages were used: Pytorch version 2.0.1 (Facebook, Massachusetts, United States) was used for convolutional neural network computing. Scikit-learn version 1.3.0 (David Cournapeau, California, United States) was used for calculating AUC. NumPy version 1.25.2 (Travis Oliphant, Texas, United States) was used for calculating C-index, Brier score. Lifelines version 0.27.7 (Cameron Davidson-Pilon, Canada) was used for survival analysis. Singapore I vessel assessment software version 4.0 (National University of Singapore, Singapore) was used to quantify retinal vascular variables. The code being used in the current study for developing the algorithm is provided at https:// github.com/drpredict/DeepDR_Plus.
For manuscripts utilizing custom algorithms or software that are central to the research but not yet described in published literature, software must be made available to editors and reviewers. We strongly encourage code deposition in a community repository (e.g. GitHub). See the Nature Portfolio guidelines for submitting code & software for further information.

Policy information about availability of data

All manuscripts must include a data availability statement. This statement should provide the following information, where applicable:
  • Accession codes, unique identifiers, or web links for publicly available datasets
  • A description of any restrictions on data availability
  • For clinical datasets or third party data, please ensure that the statement adheres to our policy
Individual-level patient data can be accessible with the consent of Data Management Committee from institutions and are not publicly available. Request for the non-profit use of the fundus images and related clinical information should be sent to Weiping Jia or Tien Yin Wong. The Data Management Committee will then review all the requests and grant (if successful). A formal data transfer agreement will be required upon approval. Generally, all these requests for access to the data will be responded to within 1 month. All data shared will be de-identified. For the reproduction of our algorithm code, we have also deposited a minimum dataset at Zenodo (https://zenodo.org/records/10076339), which is publicly available for scientific research and non-commercial use.

Human research participants

Policy information about studies involving human research participants and Sex and Gender in Research.

Reporting on sex and gender

For the 19100 participants in DRPS, were females; for the 2,141 participants in ECHM, were females; for the 971 participants in WTHM, were females; for the 1,194 participants in NDSP, were females; for the 337 participants in CUHK-STDR, 50.15% were females; for the 307 participants in PUDM, were females; for the 1,699 participants in SEED, 50.15% were females; for the 3,284 participants in SiDRP, were females; for the 835 participants in BJHC, 47.90% were females.

Population characteristics

Patients with diabetes who are 18 years of age or older and have fundus images and clinical metadata were recruited retrospectively from multiple hospitals and community hospitals.

Recruitment

Subjects who have received fundus examination and have fundus images were recruited from multiple hospitals and community hospitals before 31 Dec 2022. The data for the model training collected from Chinese subjects, might not be representative for the generalized population, potentially introducing biases.

Ethics oversight

The study was approved by the Ethics Committee of Shanghai Sixth People’s Hospital.
Note that full information on the approval of the study protocol must also be provided in the manuscript.

Field-specific reporting

Please select the one below that is the best fit for your research. If you are not sure, read the appropriate sections before making your selection.
Life sciences
Behavioural & social sciences
Ecological, evolutionary & environmental sciences
For a reference copy of the document with all sections, see nature.com/documents/nr-reporting-summary-flat.pdf

Life sciences study design

All studies must disclose on these points even when the disclosure is negative.
Sample size We developed DeepDR Plus system for predicting DR progression using a total of 76,400 retinal fundus images from 19,100 diabetic patients and we validated the system by 42,558 retinal fundus images from 10,768 diabetic patients. The sample size was determined by the data availability.
Data exclusions Retinal images of poor image quality were excluded.
Replication Replication was not relevant. We used eight independent validation cohorts to test the models, and the models achieved similar performances in the external validation sets.
Randomization Samples were randomly allocated to the developing and validation datasets.
Blinding During the data processing, all data was first de-identified to remove any patient related information.

Reporting for specific materials, systems and methods

We require information from authors about some types of materials, experimental systems and methods used in many studies. Here, indicate whether each material, system or method listed is relevant to your study. If you are not sure if a list item applies to your research, read the appropriate section before selecting a response.
Materials & experimental systems Methods
n/a Involved in the study n/a Involved in the study
X
Flow cytometry
Palaeontology and archaeology
MRI-based neuroimaging

Clinical data

Policy information about clinical studies
All manuscripts should comply with the ICMJE guidelines for publication of clinical research and a completed CONSORT checklist must be included with all submissions.
Clinical trial registration
Study protocol
Data collection
Outcomes
The study was registered on Chinese Clinical Trial Registry (http://www.chictr.org.cn/). Registration number: ChiCTR2300069400.
Study protocols can be found in http://www.chictr.org.cn/.
Fundus images in the DRPS cohort were collected in Wuxi and Shanghai between 2015 and 2022. Fundus images in the SIM cohort were collected in Shanghai between 2014 and 2017. Fundus images in the ECHM cohort were collected in Wuxi between 2006 and 2016. Fundus images in the WTHM cohort were collected in Wuhan between 2010 and 2021. Fundus images in the NDSP were collected in Nicheng Community in 2013 and 2018. Fundus images in the CUHK-STDR were collected in HongKong between 2015 and 2021. Fundus images in PUDM were collected in Beijing between 2010 and 2016. Fundus images in SEED cohort were collected in Singapore between 2004 and 2017. Fundus images in SiDRP cohort were collected in Singapore between 2010 and 2015. Fundus images in the BJHC were collected in Beijing between 2014 and 2020.
The primary outcome was any DR progression. The secondary outcome was the progression from no retinopathy to DR, nonreferable DR to referable DR, and non-vision-threatening DR to vision-threatening DR. The diagnosis and classification of DR were evaluated by ophthalmologists according to the ICDRDSS22.

  1. Shanghai Belt and Road International Joint Laboratory for Intelligent Prevention and Treatment of Metabolic Disorders, Department of Computer Science and Engineering, School of Electronic, Information, and Electrical Engineering, Shanghai Jiao Tong University, Department of Endocrinology and Metabolism, Shanghai Sixth People’s Hospital Affiliated to Shanghai Jiao Tong University School of Medicine, Shanghai Diabetes Institute, Shanghai Clinical Center for Diabetes, Shanghai, China. MOE Key Laboratory of AI, School of Electronic, Information, and Electrical Engineering, Shanghai Jiao Tong University, Shanghai, China. Department of Ophthalmology, Huadong Sanatorium, Wuxi, China. Department of Ophthalmology, Shanghai Sixth People’s Hospital Affiliated to Shanghai Jiao Tong University School of Medicine, Shanghai, China. Department of Ophthalmology and Visual Sciences, The Chinese University of Hong Kong, Hong Kong, China. Singapore Eye Research Institute, Singapore National Eye Centre, Singapore, Singapore. Department of Computer Science and Engineering, The Hong Kong University of Science and Technology, Hong Kong, China. Department of Chemical and Biological Engineering, The Hong Kong University of Science and Technology, Hong Kong, China. State Key Laboratory of Ophthalmology, Zhongshan Ophthalmic Center, Sun Yat-sen University, Guangdong Provincial Key Laboratory of Ophthalmology and Visual Science, Guangzhou, China. Department of Ophthalmology, Peking Union Medical College Hospital, Peking Union Medical College, Chinese Academy of Medical Sciences, Beijing, China. Medical Records and Statistics Office, Shanghai Sixth People’s Hospital Affiliated to Shanghai Jiao Tong University School of Medicine, Shanghai, China. Department of Geriatrics, Tongji Hospital, Tongji Medical College, Huazhong University of Science and Technology, Wuhan, China. National Engineering Research Center for Big Data Technology and System, Services Computing Technology and System Lab, Cluster and Grid Computing Lab, School of Computer Science and Technology, Huazhong University of Science and Technology, Wuhan, China. Shri Bhagwan Mahavir Vitreoretinal Services, Medical Research Foundation, Sankara Nethralaya, Chennai, India. Department of Ophthalmology, Shanghai General Hospital, Shanghai Jiao Tong University School of Medicine, Shanghai, China. Beijing Institute of Ophthalmology, Beijing Tongren Eye Center, Beijing Tongren Hospital,
  2. -index refers to concordance index. IBS refers to integrated Brier score.